Attached files
| file | filename |
|---|---|
| EX-32.2 - EXHIBIT 32.2 - NanoString Technologies Inc | nstg-ex322.htm |
| EX-32.1 - EXHIBIT 32.1 - NanoString Technologies Inc | nstg-ex321.htm |
| EX-31.2 - EXHIBIT 31.2 - NanoString Technologies Inc | nstg-ex312.htm |
| EX-31.1 - EXHIBIT 31.1 - NanoString Technologies Inc | nstg-ex311.htm |
| EX-23.1 - EXHIBIT 23.1 - NanoString Technologies Inc | nstg-ex231.htm |
| EX-10.40 - EXHIBIT 10.40 - NanoString Technologies Inc | nstg-ex1040.htm |
| EX-10.25 - EXHIBIT 10.25 - NanoString Technologies Inc | nstg-ex1025.htm |
| EX-10.23 - EXHIBIT 10.23 - NanoString Technologies Inc | nstg-ex1023.htm |
| EX-10.21 - EXHIBIT 10.21 - NanoString Technologies Inc | nstg-ex1021.htm |
| EX-10.17 - EXHIBIT 10.17 - NanoString Technologies Inc | nstg-ex1017.htm |
| EX-10.14 - EXHIBIT 10.14 - NanoString Technologies Inc | nstg-ex1014.htm |
| EX-10.9 - EXHIBIT 10.9 - NanoString Technologies Inc | nstg-ex109.htm |
| EX-4.4 - EXHIBIT 4.4 - NanoString Technologies Inc | nstg-ex44.htm |
UNITED STATES
SECURITIES AND EXCHANGE COMMISSION
Washington, D.C. 20549
FORM 10-K
ý | ANNUAL REPORT PURSUANT TO SECTION 13 OR 15(d) OF THE SECURITIES EXCHANGE ACT OF 1934 |
For the fiscal year ended December 31, 2019
OR
¨ | TRANSITION REPORT PURSUANT TO SECTION 13 Or 15(d) OF THE SECURITIES EXCHANGE ACT OF 1934 |
For the transition period from ______ to______
Commission file number: 001-35980
NANOSTRING TECHNOLOGIES, INC.
(Exact name of registrant as specified in its charter)
Delaware | 20-0094687 | |
(State or other jurisdiction of incorporation or organization) | (I.R.S. Employer Identification Number) | |
530 Fairview Avenue North
Seattle, Washington 98109
(Address of principal executive offices)
(206) 378-6266
(Registrant’s telephone number, including area code)
Securities registered pursuant to Section 12(b) of the Act:
Title of Each Class | Trading Symbol(s) | Name of Exchange on Which Registered | ||
Common Stock, $0.0001 par value per share | NSTG | The NASDAQ Stock Market LLC (The NASDAQ Global Market) | ||
Securities registered pursuant to Section 12(g) of the Act:
None
Indicate by check mark if the registrant is a well-known seasoned issuer, as defined in Rule 405 of the Securities Act. Yes ý No ¨
Indicate by check mark if the registrant is not required to file reports pursuant to Section 13 or Section 15(d) of the Act Yes ¨ No ý
Indicate by check mark whether the registrant (1) has filed all reports required to be filed by Section 13 or 15(d) of the Securities Exchange Act of 1934 during the preceding 12 months (or for such shorter period that the registrant was required to file such reports), and (2) has been subject to such filing requirements for the past 90 days. Yes ý No ¨
Indicate by check mark whether the registrant has submitted electronically every Interactive Data File required to be submitted pursuant to Rule 405 of Regulation S-T during the preceding 12 months (or for such shorter period that the registrant was required to submit such files). Yes ý No ¨
Indicate by check mark whether the registrant is a large accelerated filer, an accelerated filer, a non-accelerated filer, a smaller reporting company, or emerging growth company. See the definitions of “large accelerated filer,” “accelerated filer,” “smaller reporting company,” and “emerging growth company” in Rule 12b-2 of the Exchange Act. (Check one):
Large accelerated filer | ý | Accelerated filer | ¨ |
Non-accelerated filer | ¨ | Smaller reporting company | ¨ |
Emerging growth company | ¨ | ||
If an emerging growth company, indicate by check mark if the registrant has elected not to use the extended transition period for complying with any new or revised financial accounting standards provided pursuant to Section 13(a) of the Exchange Act. ¨
Indicate by check mark whether the registrant is a shell company (as defined in Rule 12b-2 of the Act). (Check one): Yes ¨ No ý
The aggregate market value of the voting and non-voting stock held by non-affiliates of the Registrant, based on the closing sale price of the Registrant’s common stock on the last business day of its most recently completed second fiscal quarter, as reported on The NASDAQ Global Market, was approximately $1.1 billion. Shares of common stock held by each executive officer and director and by each other person who may be deemed to be an affiliate of the Registrant, have been excluded from this computation. The determination of affiliate status for this purpose is not necessarily a conclusive determination for other purposes.
There were 37,000,165 shares of the Registrant’s common stock, $0.0001 par value per share, outstanding on February 25, 2020.
DOCUMENTS INCORPORATED BY REFERENCE
Portions of the registrant’s definitive proxy statement to be filed with the Securities and Exchange Commission in connection with the registrant’s 2020 Annual Meeting of Stockholders, which will be filed subsequent to the date hereof, are incorporated by reference into Part III of this Form 10-K. Such proxy statement will be filed with the Securities and Exchange Commission not later than 120 days following the end of the registrant’s fiscal year ended December 31, 2019.
NANOSTRING TECHNOLOGIES, INC.
ANNUAL REPORT ON FORM 10-K
FOR THE FISCAL YEAR ENDED DECEMBER 31, 2019
TABLE OF CONTENTS
Page | |||
-1-
Special Note Regarding Forward-Looking Information
This Annual Report on Form 10-K, including the “Management’s Discussion and Analysis of Financial Condition and Results of Operation” section in Item 7, and other materials accompanying this Annual Report on Form 10-K contain forward-looking statements that are based on our management’s beliefs and assumptions and on information currently available. The statements contained in this Annual Report on Form 10-K that are not purely historical are forward-looking statements within the meaning of Section 27A of the Securities Act of 1933, as amended, and Section 21E of the Securities Exchange Act of 1934, as amended.
Forward-looking statements can be identified by words such as “believe,” “anticipate,” “could,” “continue,” “depends,” “expect,” “expand,” “forecast,” “intend,” “predict,” “plan,” “rely,” “should,” “will,” “may,” “seek,” or the negative of these terms and other similar expressions, although not all forward-looking statements contain these words. You should read these statements carefully because they discuss future expectations, contain projections of future results of operations or financial condition, or state other “forward-looking” information. These statements relate to our future plans, objectives, expectations, intentions and financial performance and the assumptions that underlie these statements. These forward-looking statements include, but are not limited to:
• | our expectations regarding our future operating results and capital needs, including our expectations regarding instrument, consumable and total revenue, operating expenses, sufficiency of cash on hand and operating and net loss; |
• | our ability to successfully commercialize our GeoMx DSP platform; |
• | our ability to successfully develop our Hyb & Seq platform and pursue partnerships; |
• | the success, costs and timing of implementation of our business model, strategic plans for our business and future product development plans; |
• | the regulatory regime and our ability to secure and maintain regulatory clearance or approval or reimbursement for the clinical use of our products, domestically and internationally; |
• | our ability to realize the potential payments set forth in our collaboration agreements; |
• | our strategic relationships, including with patent holders of our technologies, manufacturers and distributors of our products, collaboration partners and third parties who conduct our clinical studies; |
• | our intellectual property position; |
• | our ability to attract and retain key scientific or management personnel; |
• | our expectations regarding the competitive position, market size and growth potential for our business; and |
• | our ability to sustain and manage growth, including our ability to expand our customer base, develop new products, enter new markets and hire and retain key personnel. |
All forward-looking statements are based on information available to us on the date of this Annual Report on Form 10-K and we will not update any of the forward-looking statements after the date of this Annual Report on Form 10-K, except as required by law. Our actual results could differ materially from those discussed in this Annual Report on Form 10-K. The forward-looking statements contained in this Annual Report on Form 10-K, and other written and oral forward-looking statements made by us from time to time, are subject to certain risks and uncertainties that could cause actual results to differ materially from those anticipated in the forward-looking statements, and you should not regard these statements as a representation or warranty by us or any other person that we will achieve our objectives and plans in any specified time frame, or at all. Factors that might cause such a difference include, but are not limited to, those discussed in the following discussion and within Part I, Item 1A “Risk Factors” of this Annual Report on Form 10-K. In this report, “we,” “our,” “us,” “NanoString,” and “the Company” refer to NanoString Technologies, Inc. and its subsidiaries.
In addition, statements that “we believe” and similar statements reflect our beliefs and opinions on the relevant subject. These statements are based upon information available to us as of the date of this Annual Report on Form 10-K, and although we believe such information forms a reasonable basis for such statements, such information may be limited or incomplete, and our statements should not be read to indicate that we have conducted a thorough inquiry into, or review of, all potentially available relevant information. These statements are inherently uncertain and investors are cautioned not to unduly rely upon these statements.
-2-
PART I
Item 1. Business
Overview
We develop, manufacture and sell products that unlock scientifically valuable and clinically actionable information from minute amounts of biological material. Our core technology is a unique, proprietary optical barcoding chemistry that enables the labeling and counting of single molecules. This proprietary chemistry may reduce the number of steps required to conduct certain types of scientific experiments and allow for multiple experiments to be conducted at once. As a result, we are able to develop tools that are easier for researchers to use and that may generate faster and more consistent scientific results.
We use our technology to develop tools for scientific and clinical research, primarily in the fields of genomics and proteomics. We currently have two commercially available product platforms, our nCounter Analysis System and our GeoMx Digital Spatial Profiling, or DSP, system, both of which include instruments and related consumables.
nCounter can be used to analyze the activity of up to 800 genes in a single experiment. nCounter is also used by clinicians to analyze gene activity relevant for diagnostic applications. As of December 31, 2019, we had an installed base of approximately 855 nCounter systems, which our customers have used to publish more than 3,200 peer-reviewed scientific papers.
GeoMx DSP, which was made commercially available in 2019, is designed to enable the field of spatial genomics. While nCounter and other existing technologies analyze gene activity as a whole throughout the totality of a biological sample, GeoMx DSP is used to analyze specifically selected regions of a biological sample in order to see how gene activity might vary across those regions or in certain cell types. GeoMx DSP operates by enabling users to prepare and select certain regions of a sample in which to study gene activity, and then use our nCounter system to subsequently evaluate, or read out the activity of up to 96 genes, or targets, in each of the selected regions. As of December 31, 2019, we had received over 90 orders for GeoMx DSP. We shipped 44 GeoMx DSP systems to customer sites and had installed 35 systems as of December 31, 2019.
In advance of and subsequent to the 2019 commercial launch of GeoMx DSP, we have provided access to the system’s capabilities by offering selected customers the opportunity to send biological samples to our Seattle facility to be tested by us on prototype instruments. As of December 31, 2019, we have conducted over 200 projects for approximately 125 customers pursuant to this Technology Access Program, or TAP.
We have discovered other novel applications that utilize our proprietary chemistry, and have several new products and product platforms under development. We have new capabilities for GeoMx DSP under development that we believe will significantly expand the utility of the system. We expect these new capabilities to substantially increase the number of data points, or targets, that can be analyzed simultaneously by allowing users to read out gene activity from selected regions of a biological sample using Next Generation Sequencers, or NGS. Our Hyb & Seq molecular profiling system under development is designed to use a modified version of our proprietary chemistry to determine and analyze gene sequences within a biological sample, or to potentially profile the activity of an even greater number of genes as compared to our nCounter Analysis System. Hyb & Seq is designed to determine gene sequences using a work flow with fewer steps as compared to currently available gene sequencing technologies.
New discoveries in genetics have generated a significant amount of scientific information and medical advancement. The decoding of the human genome, and the subsequent generation of large amounts of gene sequence data, has led to the emergence of pathway-based biology whereby researchers seek to understand how networks of genes may work together to produce a biological function or condition. The desire to interpret gene sequence data and map biological pathways has led to demand for technologies that can precisely and efficiently measure the activation state of hundreds of genes simultaneously.
Demand for these new or improved technologies has been driven by researchers in disease areas such as cancer, immunology and neurology. Researchers in these fields are increasingly attempting to determine which sequences of genes or mutations are important in disease-related biological pathways so that new potential treatments might be developed. For example, in the field of cancer, researchers and clinicians have learned that cancer cell behavior is impacted by multiple genes and that analysis of these factors together may be important in determining whether or not a cancer might be responsive to a certain treatment. In addition, more cancers are being detected earlier and tumor samples are becoming smaller and smaller. Tumor samples are often stored in a format known as formalin-fixed paraffin embedded, or FFPE, which complicates subsequent analysis of genetic material. Researchers and clinicians may face similar challenges with analysis of biological samples in other therapeutic areas of interest.
Our proprietary chemistry, which has been incorporated into our nCounter and GeoMx DSP product platforms, addresses many of the fundamental challenges of genetic and molecular profiling and biological pathway research. The sensitivity and precision of our chemistry allows the measurement of subtle changes in the activity of multiple genes from
-3-
minute amounts of a biological sample. Our chemistry is particularly compatible with FFPE, increasing its popularity among cancer researchers. Our chemistry also supports product configurations that are easy to use with simple workflow as compared to many other scientific platforms used for genetic and proteomic research, including absence of library preparation and amplification steps that can be cumbersome or time consuming or that may introduce the possibility of measurement errors. The sensitivity and workflow efficiency of our product platforms also allows for testing of many different samples in a single day, enabling our products to be potentially useful in hospital or similar settings to conduct clinical diagnostic tests.
We market and sell our systems and related consumables to researchers in academic, government and biopharmaceutical laboratories for research use, both through our direct sales force and through selected distributors in certain international markets. We generated revenue of $125.6 million, $106.7 million and $114.9 million in 2019, 2018 and 2017, respectively, while incurring net losses of $40.7 million, $77.4 million and $43.6 million in 2019, 2018 and 2017, respectively.
In December 2019, we entered into a License and Asset Purchase Agreement, or LAPA, and service and supply agreements, or SSAs, with Veracyte, Inc, or Veracyte. Pursuant to the LAPA, we completed a license of intellectual property and a sale of certain assets to Veracyte relating to our nCounter FLEX system for use in clinical diagnostic applications. Veracyte also acquired certain intellectual property rights and worldwide distribution rights relating to our Prosigna Breast Cancer Assay and our LymphMark assay and certain clinical diagnostic assay software modules that operate with the nCounter FLEX system. Pursuant to the terms of the LAPA, Veracyte paid us total consideration of $50.0 million, consisting of (i) $40.0 million in cash paid in connection with the entry into the LAPA, and (ii) 376,732 shares of Veracyte common stock valued at $10.0 million, which shares were issued in conjunction with the entry into the LAPA. In addition, pursuant to the terms of the LAPA, we are eligible to receive future potential milestone payments of up to $10.0 million in the aggregate, to be paid upon the launch of additional clinical diagnostic tests by Veracyte for our nCounter FLEX platform. Pursuant to the SSAs, we agreed to supply to Veracyte nCounter FLEX systems, and to manufacture and supply Prosigna kits, LymphMark kits and any additional clinical diagnostic tests that Veracyte may develop in the future for nCounter, for a period of at least 4 years subsequent to the transaction date. Pursuant to the SSAs, Veracyte will pay the designated transfer prices for nCounter FLEX systems, Prosigna kits, LymphMark kits and any other nCounter-based diagnostic tests developed by Veracyte.
We are organized as, and operate in, one reportable segment. For additional information, see Note 2 of the Notes to Consolidated Financial Statements under Item 8 of this report. For financial information regarding our business, see Part II, Item 7 “Management’s Discussion and Analysis of Financial Condition and Results of Operations” of this report and our audited consolidated financial statements and related notes included elsewhere in this report.
We were incorporated in Delaware in June 2003. Our principal executive offices are located at 530 Fairview Avenue, North, Seattle, Washington 98109 and our telephone number is (206) 378-6266. Our common stock trades on The Nasdaq Global Market under the symbol “NSTG.”
This Annual Report on Form 10-K includes our trademarks and registered trademarks, including “NanoString,” “NanoString Technologies,” “nCounter,” “nCounter Elements,” “nCounter SPRINT,” “Vantage 3D,” “3D Biology,” “Hyb & Seq,” and “GeoMx.” Each other trademark, trade name or service mark appearing in this Annual Report on Form 10-K belongs to its holder.
Our Market Opportunity
Every living organism has a genome that contains a full set of biological instructions required to build and maintain life. A gene is a specific set of instructions embedded in the DNA of a cell. For a gene to be “turned on,” or “expressed,” the cell must first transcribe a copy of its DNA sequence into molecules of messenger RNA. Then, the cell translates the expressed information contained in the RNA into proteins that control most biological processes. In addition to the translated RNAs, there are many types of non-coding RNAs that are involved in many cellular processes and the control of gene expression, including microRNA, or miRNA.
By analyzing the variations in genomes, genes, gene activity or expression and proteins in and between organisms, researchers can determine their functions and roles in health and disease. An improved understanding of the genome and its functions allows researchers to drive advancements in scientific discovery. As they make scientific discoveries, researchers have been able to translate some of these findings into clinical applications that improve patient care.
Biological pathways are the networks of tens or hundreds of genes that work together to produce a biological function. Understanding the activation state of pathways and disruptions in individual elements provides significant insight into the fundamental basis of health and disease and facilitates data driven treatment decisions. As a result, pathway-based biology has become a widely adopted paradigm that researchers use to understand biological processes and has assisted them in the development of diagnostic tests and drugs to treat disease.
Understanding biological pathways has become particularly important in cancer research and treatment. Cancer is a disease generally caused by genetic mutations in cells. The behavior of cancer cells is extremely complex and depends on the
-4-
activity of many different genes and proteins. It is often impossible for researchers to identify a single gene or protein that adequately predicts a more or less aggressive type of cancer. In some cases, researchers have been able to identify more or less aggressive types of cancer through gene expression analysis of biological pathways, enabling oncologists to determine which specific treatments are most likely to be effective for an individual patient, monitor a patient’s response to those treatments and determine the likelihood of recurrence. Recently cancer researchers, in part based on their research of biological pathways and gene expression, have begun to demonstrate the potential of harnessing a patient’s immune system to fight cancer. A new class of therapeutics, referred to generally as immuno-oncology drugs, have begun to come to market with the promise of long-term remissions, or even cures, in certain types of cancer.
As interest in understanding biological pathways that may be relevant to medicine has increased, academic, government and biopharmaceutical company researchers have aspired to perform analyses of a larger number of genes and samples and are seeking new methods of interrogation that would allow them to:
• | increase the number of molecular targets that can be analyzed simultaneously in order to understand the complete biological pathway involving multiple genes; |
• | provide more reliable, precise and reproducible data about targeted genes and biological pathways; |
• | maximize the amount of biologic information extracted from precious tissue or other biological samples; |
• | minimize the computational intensity of complex genomic and proteomic analysis; |
• | process difficult-to-work-with specimens, such as tumor biopsies stored in FFPE format; |
• | improve the overall efficiency of their laboratories by simplifying workflow and accelerating the rate of successfully completing their research; and |
• | create more systematic and reliable ways to help transition their research discoveries into future clinical products. |
The interest in new methods of interrogation has led to the development of new research technologies. The newest technologies to experience rapid adoption have been focused primarily on determining the sequence of a person’s or organism’s DNA, in order to assess how differences among individuals might be predictive of certain aspects of health or disease. In particular, a technology known as next generation sequencing, or NGS, has become widely adopted. In recent years NGS use has accelerated, as the technology has improved and the cost to sequence DNA using NGS has declined. As of December 31, 2019, there were more than 15,000 NGS systems installed in laboratories globally.
While NGS has revolutionized researchers’ ability to generate gene sequence data rapidly and cost effectively on large numbers of biological samples, other aspects of examining biological pathways are still done using legacy techniques or new technologies that have proved less capable of providing multiplexed experimentation, ease of use and low cost. Together with determining a gene sequence via NGS, pathway-based research requires further analysis of the activity of multiple genes and sensitivity to small changes in expression, which can be challenging for traditional scientific tools.
Researchers interested in multiplex gene expression or biological pathway analysis have traditionally performed experiments using microarrays or quantitative polymerase chain reaction, or qPCR, and protein expression experiments using flow cytometry, mass spectrometry, immunohistochemistry or enzyme-linked immunosorbent assay, or ELISA, assays. These techniques have been available for decades, and while suitable for analyzing the expression of a smaller number of genes may not be cost effective or scalable enough to study biological pathways. While these types of experiments could be repeated to analyze expression of multiple genes, they are often destructive of biological samples, creating limitations given the amounts of biological sample that may be available. These types of experiments may also involve library preparation and amplification steps that can be cumbersome or time consuming or that may introduce the possibility of measurement errors.
More recently, RNA sequencing, or RNA-Seq, which is done using NGS technology, has enabled researchers to look at the entirety of the gene expression within a single sample, and enhanced researchers’ ability to discover patterns of gene expression that have biological meaning. NGS systems have a more complex and time-consuming workflow than traditional methods of analyzing gene or protein expression however, and RNA-Seq generates large amounts of data that may be expensive to store and may not have relevance to the scientific question being explored.
In both life sciences research and clinical medicine, there is a growing need for improved technologies that can precisely and rapidly measure the activation state of hundreds of genes simultaneously across a large number of precious samples. Furthermore, there is an untapped opportunity for technologies capable of simultaneously profiling the activity of genes and related proteins, which ultimately dictate biological activity.
Our Solution
We believe our proprietary chemistry and product platforms provide novel features that address the challenges and technology needs of researchers working to analyze and interpret the increasing amounts of data being generated by NGS and understand biological pathways. Our products support experiments that typically take fewer steps as compared to traditional techniques, perform multiplexed experiments in a single run and have been shown to generate consistent and accurate results from a variety of biological samples, including FFPE embedded cancer tissue.
-5-
Our technology and product platforms offer a number of compelling advantages, including:
• | Optimized for Pathway-Based Biology and Development of Multiplexed Biomarkers. Our nCounter Analysis System can profile the activity of up to 800 genes in a single experiment, which allows customers to analyze interactions among hundreds of genes or proteins that mediate biological pathways. Our GeoMx DSP system is designed to enable the multiplex profiling of protein and RNA targets in specifically selected regions of a biological sample. |
• | Digital Precision. Our molecular barcodes hybridize directly to target molecules in a sample, allowing them to be counted. This generates digital data (1 molecule = 1 count) of excellent quality over a wide, dynamic range of measurements and provides excellent reproducibility. |
• | Simple Workflow. Our systems are designed to offer minimal sample preparation and automated workflow, which enables the simultaneous analysis of hundreds of genes and proteins in approximately 24 hours between the time a sample is loaded and results are obtained. Our systems can generate data that customers can evaluate without the use of complex bioinformatics. |
• | Sample Throughput. Our nCounter system can analyze from between 24 to 96 samples per day, depending upon the system choice and configuration. GeoMx DSP allows for throughput of 10 or more biological samples per day, depending on the number of regions in the sample selected for analysis. The ability to analyze several samples in a single day facilitates the more rapid completion of scientific studies for publication, or the use of our systems for analysis of pharmaceutical clinical trial results with large numbers of patients enrolled. |
• | Flexible Sample Requirements. Our systems are designed to unlock biologic information from minute amounts of a variety of challenging tissue samples, including FFPE samples, cell lysates and single cells. |
• | Efficient Sample Requirements. Our systems also can generate scientific results using very small amounts of biological material, which may be important in settings, such as pharmaceutical product development, where multiple researchers may desire access to samples. |
Our Products and Technology
nCounter Analysis System
Our nCounter Analysis System is an automated, multi-application, digital detection and counting system which directly profiles hundreds of molecules simultaneously, using our proprietary optical barcoding chemistry that is powerful enough for use in research, yet simple enough for use in clinical laboratories. Our nCounter Analysis System is based on automated instruments that prepare and analyze tissue samples using proprietary reagents, which can only be obtained from us. Our research customers purchase instruments from us and then purchase our reagents and related consumables for the specific experiment they wish to conduct. Our clinical laboratory customers typically purchase instruments from us and also purchase our reagents and related consumables for tests that they intend to run.
Our nCounter Analysis System is capable of supporting a number of applications including:
• | Gene Expression. Researchers can use the nCounter Analysis System to measure the degree to which individual genes in pathways are turned “on” or “off” by simultaneously quantifying the amount of messenger RNA, or mRNA, associated with each of up to 800 genes. |
• | Protein Expression. Today, researchers can use the nCounter Analysis System to simultaneously measure up to 30 proteins. Ultimately, we intend to expand this capability to an increased number of protein targets, limited only by the 800 target capacity of an assay and the number of antibodies that can be sourced and combined without cross-reaction. |
• | Gene Mutations. In late 2016, we launched our first assay to detect a particular type of gene mutation, known as single nucleotide variations. Our initial panel, targeting solid tumors, gives researchers the power to measure 104 different gene mutations simultaneously, at the same time as measuring the expression of other genes and proteins. |
• | miRNA Expression. Researchers can use the nCounter Analysis System to measure the simultaneous expression levels of up to 800 different miRNAs. The nCounter Analysis System is capable of highly multiplexed, direct digital detection and counting of miRNAs in a single reaction without amplification, thereby delivering high levels of sensitivity, specificity, precision and linearity. |
• | Copy Number Variation. Researchers can use the nCounter Analysis System to probe for structural variations that result in cells having an abnormal number of copies of one or more sections of the DNA. Researchers are able to conduct large-scale, statistically-powered studies of these copy number variations by leveraging the nCounter Analysis System’s multiplexing capacity to assay up to 800 DNA regions in a single tube, with as little as 300 ng of DNA. |
-6-
• | Gene Fusions. Researchers can use the nCounter Analysis System to detect gene fusion events that occur when one gene fuses to another gene. A number of design options are available for developing assays for these complex structural variants which have been shown to be important in a number of cancers. |
• | Molecular Diagnostics. Our nCounter Analysis System has the ability to simultaneously quantify gene expression on tens or hundreds of genes from minimal amounts of FFPE tissue, which makes it well suited for profiling pathway activation in tumor samples. Identifying whether certain genes are active in a biological sample may prove useful in the diagnosis of disease or disease progression, or in determining whether a certain drug therapy may be more or less effective in a given patient. In addition, nCounter has the precision, reproducibility, and simple workflow required of technologies used in clinical laboratories. |
nCounter Instrument Platforms
We currently offer three versions of our nCounter Analysis System for commercial sale. In 2008, we began marketing a research use only version of the system, and since that time we have expanded our product line to include three instruments, each targeted at a distinct user segment. Our nCounter SPRINT is designed to appeal to individual researchers running relatively smaller experiments. Our nCounter MAX is a higher throughput instrument with features appealing to larger core laboratories serving multiple researchers. Our nCounter FLEX, which is targeted toward clinical laboratories, is a version of our MAX system that has been 510(k) cleared by the FDA and CE marked by European regulatory authorities. nCounter FLEX is enabled to run the Prosigna breast cancer assay, as well as other proprietary or laboratory developed tests, or LDTs, that may be developed. Pursuant to the terms of our LAPA with Veracyte, we granted to Veracyte an exclusive worldwide license to the our nCounter FLEX system for in vitro diagnostic use and for the development and commercialization of in vitro diagnostic tests on the nCounter FLEX system and sold to Veracyte certain assets, including our rights with respect to the Prosigna breast cancer assay. For additional information regarding our agreement with Veracyte, see “ — License Agreements — Veracyte, Inc.” below.
nCounter SPRINT | nCounter MAX | nCounter FLEX | |||
Target customer | Individual researchers | Core research labs | Clinical labs | ||
Throughput (samples per day) | 24 | 48 | 48 | ||
Expandable with additional prep station (1) | No | Yes | Yes | ||
Diagnostic menu | No | No | Yes | ||
U.S. list price | $149,000 | $235,000 | $265,000 | ||
(1) | nCounter MAX and FLEX throughput may be increased to up to 96 samples per day by adding a second prep station. |
The nCounter MAX and FLEX systems comprise a Prep Station and a Digital Analyzer. The Prep Station is the automated liquid handling component that processes samples after they are hybridized and prepares the samples for data collection on the Digital Analyzer. The Digital Analyzer collects data from samples by taking images of the immobilized fluorescent reporters in the sample cartridge and processing the data into output files, which include the target identifier and related count numbers along with a broad set of internal controls that validate the precision of each assay. The nCounter MAX and FLEX systems employ a simple three-step workflow that takes approximately 24 hours and requires approximately 15 minutes of hands-on time by the user. When run in research mode, a user can process up to 48 samples per day by installing one Prep Station with a single Digital Analyzer. One can increase the number of samples analyzed to 96 samples per day on a single Digital Analyzer if it is coupled with two Prep Stations. This throughput can be quadrupled using sample multiplexing for experiments targeting 200 genes or fewer. For Prosigna, a clinical laboratory can process up to 30 samples per day on an nCounter FLEX system. The nCounter FLEX system was designed and is manufactured under ISO 13485:2003, the current quality standard for in vitro diagnostic platforms and medical devices.
The nCounter SPRINT Profiler is a single instrument targeted to individual researchers that combines the liquid handling steps and the digital analysis through use of a special microfluidic cartridge. The nCounter SPRINT Profiler employs an even more streamlined two-step workflow that requires only 10 minutes of hands-on time by the user and can process up to 24 samples per day.
nCounter instrument platforms also include our nSolver Analysis Software, a data analysis program that offers researchers the ability to quickly and easily quality check, normalize, and analyze their data without having to use any additional software for data analysis. The FLEX system, in addition to running any of our research applications, can also be enabled with software that runs Prosigna to generate individualized patient reports.
-7-
nCounter Consumables
All three nCounter instruments are capable of running our research consumable products and provide comparable, high-quality data. The majority of our nCounter consumables sold are standardized off-the-shelf “panel” products that represent important gene signatures for certain disease areas. nCounter consumables can also be customized to a specific set of genes at a customer’s request.
Panels
We offer more than 30 gene expression and analysis panels for use with a broad range of sample types and species, including human, mouse, non-human primate and other. These pre-manufactured CodeSets include highly-curated content relevant to a particular research area. In certain cases, nCounter panels may be partially customized to address individual research interests with the purchase of an optional Panel Plus CodeSet. Our most significant current nCounter panel offerings include:
• | Pan Cancer Gene Expression Panels. A portfolio of panels designed to comprehensively analyze genes driving the growth of cancer cells, the immune system’s response, and the progression of the cancer, including: |
• | Pathways. A novel set of 770 essential genes representing the signaling pathways implicated in cancer, including key driver genes, selected using a data-driven approach to identify the genes most relevant to cancer biology. |
• | Immune Profiling. A novel set of 770 genes designed in collaboration with cancer immunologists around the globe, combining markers for 24 different immune cell types and populations, 30 common cancer antigens and genes that represent all known categories of immune response including key checkpoint blockade genes. |
• | Progression. A novel set of 770 genes addressing the key questions of what happens when cancer metastasizes, including genes for the study of angiogenesis, epithelial mesenchymal transition, extracellular matrix formation, and metastasis. |
• | 360 Gene Expression Panels. These panels include our IO 360 and Breast Cancer 360 and represent a series of next generation panels that combine clinically actionable content for evaluating the tumor microenvironment and immune response along with validated signatures such as our Tumor Inflammation Signature and PAM 50 (breast cancer subtyping) along with up to 30 additional signatures encompassing all aspects of the cancer. These panels may be combined with our 360 Data Analysis Service to provide access to propriety signature algorithms. |
• | CAR-T Characterization Panel. A new panel developed in collaboration with leaders in the CAR-T field for use throughout the CAR-T workflow (development, manufacturing and monitoring post-infusion clinical trials). The panel represents a step toward standardization by providing molecular characterization for 8 essential components of CAR-T biology using 780 genes with a customizable feature to allow for measurement of the transgene insert that creates the CAR-T cell. |
• | Neuropathology and Neuroinflammation Gene Expression Panels. Two panels built in collaboration with leading drug developers, have been designed to address the growing biomarker needs in the field of neuroscience. These panels, which analyze approximately 770 genes, profile mechanisms for neurodegenerative diseases as well as neuropsychiatric disorders. |
• | Autoimmune Disease Gene Expression Panels. Two panels created to address the specific challenges of autoimmune disease research and assist with the understanding of the underlying mechanisms of autoimmune disease and for identification of potential responders and non-responders to drug treatments. |
• | miRNA Expression Panels. A family of panels that provide a cost-effective profiling solution capable of highly multiplexed, direct digital detection and counting of up to 800 miRNAs in a single reaction without amplification. |
• | Human Organ Transplant. Developed in collaboration with the Banff Foundation for Allograft Pathology the Human Organ Transplant panel profiles 770 genes for the study of the immune response to transplanted tissue and the pathways behind organ rejection. The panel can be used to identify biomarkers for rejection and uncover the mechanisms behind toxicity and tissue damage brought on by immunosuppressive drugs. |
• | Human and Mouse Metabolic Pathways. Broad use panel designed for use with cancer metabolism, immunometabolism and metabolic disease to quantify the expression of hundreds of genes involved in core metabolic processes and signaling pathways in the context of cancer and immunity. The panel can be used to understand the underlying molecular mechanisms behind alterations in metabolic pathways, signaling pathways, and cell stress giving researchers a complementary tool to traditional metabolite assays for profiling metabolic checkpoints and discovering potential therapeutic targets. |
-8-
• | Human and Mouse Fibrosis Panel. Broad use panel designed for use with cancer, immunology and cardiovascular disease research. This panel enables researchers to uncover the mechanisms of disease pathogenesis, identify biomarkers of progression, and develop signatures for therapeutic response by combining hundreds of genes involved in the initiation, inflammation, proliferation, and modification of fibrotic diseases of the lungs, liver, kidney, heart and skin. |
Custom CodeSets
We work with our customers to design and develop custom gene expression CodeSets to enable them to evaluate specific genes that are the subject of their study. Our customers provide us a list of targets for which we subsequently build a unique CodeSet to their specifications. Our design process leverages full length sequences for the DNA or RNA molecules that our customers are interested in detecting and prevents cross hybridization to non-target molecules in the sample. The custom CodeSet design process occurs in four distinct steps: (1) the customer selects the genes of interest, (2) we design probes and provide a design report to the customer, (3) the customer reviews and approves the design report, and (4) we manufacture, test and ship the CodeSet to the customer. The manufacturing process typically takes from three to five weeks, depending on the number of genes targeted and samples to be processed by the customer.
Master Kits, Cartridges and Reagents
For our nCounter MAX or FLEX systems, the Master Kit includes all of the ancillary reagents and plasticware required for our customers to be able to setup and process samples in the nCounter Prep Station and nCounter Digital Analyzer. The components of the Master Kit include the sample cartridge, strip tubes, tips, buffers, and reagent plates. For our nCounter SPRINT Profiler, customers purchase microfluidic cartridges and separate bottles of reagents which together provide the ancillary components for processing samples with CodeSets and Panels.
Molecular Diagnostics
Our nCounter Analysis System has the ability to simultaneously quantify gene expression on tens or hundreds of genes from minimal amounts of FFPE tissue, which makes it well-suited for profiling pathway activation in tumor samples. In addition, it has the precision, reproducibility, and simple workflow required of technologies used in clinical laboratories. Clinical laboratory customers use the nCounter Analysis System and in vitro diagnostic kits to provide clinical diagnostic services. We believe that the attributes that make the nCounter Analysis System attractive to researchers also make the system attractive to hospitals and clinical laboratories that desire to conduct molecular diagnostic tests. We believe the precision, ease of use and flexibility of the nCounter Analysis System may allow medical technicians to conduct complex molecular diagnostic tests with minimal training.
Currently, the Prosigna breast cancer assay is the only in vitro diagnostic kit available for use on our nCounter Analysis System. Prosigna is based on a collection of 50 genes known as the PAM50 gene signature, which was discovered by several of our research customers. In December 2019, we entered into an exclusive license of nCounter diagnostic assets and rights to Veracyte. Under the terms of the LAPA, Veracyte obtained exclusive global rights to develop and commercialize diagnostic tests on our nCounter FLEX system, and obtained the rights to the Prosigna breast cancer assay and nCounter Dx LymphMark assay, which is currently available for research and investigational use only. Veracyte will also distribute the nCounter FLEX system for diagnostic purposes. We will continue to manufacture test kits for Prosigna and LymphMark as well as the nCounter FLEX system and diagnostic assay kits and nCounter FLEX systems will be sold to Veracyte at preset prices under the supply agreements. For additional information regarding our agreement with Veracyte, see “ — License Agreements — Veracyte, Inc.” below.
Prosigna can provide a breast cancer patient and physician with a subtype classification based on the fundamental biology of the patient’s tumor, as well as a prognostic score that indicates the probability of cancer recurrence over 10 years. Physicians use Prosigna to help guide therapeutic decisions so that patients receive a therapeutic intervention, such as chemotherapy, only if clinically warranted. Prosigna is regulated as an in vitro diagnostic test and is distributed as a kit for use on the nCounter FLEX system in clinical laboratories. In September 2013, we received 510(k) clearance from the FDA to market in the United States a version of Prosigna providing a prognostic indicator for distant recurrence-free survival at 10 years, which is indicated for postmenopausal women with Stage I/II lymph node-negative or Stage II lymph node-positive (one to three positive nodes) hormone receptor-positive breast cancer who have undergone surgery in conjunction with locoregional treatment consistent with standard of care.
-9-
GeoMx DSP
Our GeoMx DSP system, which was made commercially available in 2019, is designed to enable the field of spatial genomics.
nCounter and other existing technologies typically analyze gene activity throughout the totality of a biological sample, using “grind and bind” approaches that analyze average gene expression levels across an entire sample. GeoMx DSP is designed to allow researchers to explore and quantify how the activity of large numbers of proteins or genes vary spatially in different selected regions of interest across the landscape of a heterogeneous tissue biopsy, retaining spatial information and providing assays that target different regions in the same sample.
Many of the current technologies used to analyze gene activity in selected parts of a biological sample are many decades old. These technologies include primarily immunohistochemistry, or IHC, which is used to estimate amounts of protein, and in-situ hybridization, or ISH, which is used to estimate amounts of RNA. Both IHC and ISH typically use stains that provide the ability to identify typically less than four proteins or RNAs based on assigned colors. The colors aid researchers in identifying where certain proteins or RNA may reside in a sample and provide a visual approximation of amounts. These techniques are generally limited however in their ability to only look at four proteins or RNAs at a time, with no ability to precisely quantify the amounts present in any given region or cell type. These limitations may lead to misleading or incomplete scientific conclusions as to the most relevant biological pathways in any given sample.
GeoMx DSP is designed to allow researchers to address important questions regarding how gene expression, currently of up to 96 targets simultaneously, varies spatially in multiple specific regions of interest across the landscape of a heterogeneous tissue biopsy. Our GeoMx DSP instrument images slide-mounted tissue biopsies, allows selection of regions of interest, and automates the preparation of samples from the selected regions for subsequent molecular profiling. The post-selection profiling is currently performed using our nCounter system. Future versions of GeoMx DSP are expected to significantly expand the number of potential targets per region that can be analyzed by allowing for the subsequent profiling steps to be performed using NGS systems.
We believe GeoMx DSP offers a number of advantages compared to traditional technologies, including the ability to profile either protein or RNA, the ability to profile large numbers of different proteins or RNA simultaneously in each selected region, flexibility on the selection of regions to analyze, and processing 10 or more biological samples per day.
GeoMx DSP Instrument and Software
Our GeoMx DSP instrument uses specialized optics and software to image slide-mounted tissue biopsies that have been prepared using the IHC or ISH technology typically available in research or commercial laboratories. GeoMx DSP then allows a researcher to select regions of interest for analysis on screen, and then prepares samples from selected regions of interest for molecular profiling. The current GeoMx DSP software enables the integration of the four color images acquired and the corresponding digital counts acquired using our nCounter Analysis System.
GeoMx DSP Consumables
The initial portfolio of GeoMx DSP consumables focuses on protein and RNA analysis for immuno-oncology applications, and protein analysis for neurobiology applications. GeoMx DSP consumable products are currently designed as standardized panel products that represent important content for certain disease areas, with an initial “core” panel offered for purchase, and an option for researchers to add content to that core depending on the area of interest or desired number of targets for analysis. Our initial GeoMx DSP consumable product offering includes:
• | Immuno-Oncology Panels. An immuno-oncology-focused panel menu that comprises up to 96 protein and RNA targets for analyzing the tumor and tumor microenvironment compartments in human and mouse tissue samples. The standard, or core, panel offering is comprised of 18 targets, and researchers have the option of adding over 30 additional targets for analysis focused on specific applications such as immuno-oncology drug target proteins, or human immune activation proteins, and 23 additional targets for analyzing mouse samples for pre-clinical applications. In addition, we offer RNA panel content to allow for the analysis of up to 84 targets for human immune pathways. |
• | Neurobiology Panels. A neurobiology-focused menu that comprises up to 40 protein targets to profile neural cells in human tissue. The standard, or core, panel offering comprises 20 targets, and researchers have the option of adding up to 20 additional targets for analysis focused on specific applications such as proteins implicated in Alzheimer’s disease or Parkinson’s disease. |
-10-
GeoMx DSP Product Development
We have additional GeoMx DSP software and consumable products under development that are expected to enable profiling of a substantially larger number of RNA and protein targets in selected regions of interest, thereby expanding the utility, potential research applications and market opportunity of GeoMX DSP. This software and related consumables are designed to enable samples prepared using our GeoMx DSP system to be further analyzed using a researcher’s existing NGS system.
We expect NGS-enabling software and consumable products for GeoMx DSP, including the first GeoMx NGS-only panel, the Cancer Transcriptome Atlas, or CTA, to be available for research customers in mid-2020. The CTA is designed to allow for the simultaneous analysis, in selected regions of interest, of approximately 1,800 well characterized cancer related genes. Selected customers have commenced experiments using our CTA on an early access basis through our TAP service. In addition, a GeoMx NGS-only panel that allows for the analysis of virtually all RNA targets, or the whole transcriptome, in each selected region of interest, is currently under development. This capability is expected to allow for the simultaneous analysis of approximately 18,000 RNA targets per region of interest.
Hyb & Seq Molecular Profiler
Our Hyb & Seq molecular profiling system is a new product platform candidate currently under development. Hyb & Seq is designed to use a modified version of our proprietary chemistry to determine and analyze gene sequences within a biological sample, or to potentially profile the activity of an even greater number of genes.
While currently available NGS technology has become widely used for research, challenges relating to complex workflow and the need for a large central laboratory to batch process samples to reduce cost have limited broader NGS adoption for use in clinical diagnostic applications to date.
Hyb & Seq is designed to use a modified version of our proprietary chemistry to determine sequence data similar to NGS. As our chemistry does not require amplification, enzyme application or library preparation, Hyb & Seq may offer a faster, easier to use way of determining gene sequences as compared to existing NGS technologies. Hyb & Seq’s simple workflow and compatibility with a variety of sample types may offer the potential for a sample-to-answer solution for clinical sequencing. Hyb & Seq may also offer the ability to rapidly detect and quantify a large number of RNA or DNA targets in parallel. Potential applications of this capability could include gene expression measurement, or infectious disease testing. We are working to identify the key applications for our Hyb & Seq platform and pursuing partnerships that can support our emerging commercial strategy. Key applications that we are focused on include infectious disease testing, and the application of Hyb & Seq to specialized research applications.
License Agreements
We have relied, and expect to continue to rely, on strategic collaborations and licensing agreements with third parties. For example, our base molecular barcoding technology is in-licensed from the Institute for Systems Biology. In addition, we have licensed technology related to the diffuse large B-cell lymphoma, or DLBCL, assay from the National Institutes of Health, and we rely on other license and supply arrangements for proprietary components which require us to pay royalties on the sale of our products. Other research customers are using our nCounter Analysis System to discover gene expression signatures that we believe could form the basis of future diagnostic products. In the future, we may consider these gene signatures for in-licensing.
Veracyte, Inc.
In December 2019, we entered into a LAPA and SSAs with Veracyte.
Pursuant to the LAPA, we completed a license of intellectual property and a sale of certain assets to Veracyte relating to our nCounter FLEX system for use in clinical diagnostic applications. Veracyte, acquired certain intellectual property rights and worldwide distribution rights relating to Prosigna and our LymphMark assay, and certain clinical diagnostic assay software modules that operate with the nCounter FLEX system. Pursuant to the LAPA, we provided Veracyte a worldwide exclusive license to market and sell clinical diagnostic tests developed for our nCounter FLEX platform for in vitro diagnostic use and for the development and commercialization of in vitro diagnostic tests, including in vitro diagnostic devices or laboratory developed tests, for use on the nCounter FLEX platform. In connection with the transaction, Veracyte has agreed to assume certain liabilities associated with the assets purchased under the LAPA, including ongoing third-party royalty obligations relating to Prosigna and LymphMark. We also assigned to Veracyte our Amended and Restated Exclusive License Agreement with Bioclassifier, LLC, effective July 7, 2010, as amended, which granted rights to certain intellectual property related to Prosigna. We also entered into a sublicense agreement with Veracyte relating to the Bioclassifier Agreement wherein we obtained certain non-exclusive rights relating to our rights to provide Prosigna to Veracyte on an ongoing basis and for other research or investigational purposes.
-11-
Upon consummation of the LAPA, Veracyte paid us total consideration of $50.0 million, consisting of (i) $40.0 million in cash and (ii) 376,732 shares of Veracyte common stock valued at $10.0 million. Pursuant to the LAPA, we are eligible to receive potential milestone payments of up to $10.0 million in the aggregate, to be paid upon the launch of additional clinical diagnostic tests by Veracyte for our nCounter FLEX platform.
Pursuant to the SSAs, we agreed to supply to Veracyte nCounter FLEX systems, and to manufacture and supply Prosigna kits, LymphMark kits and any additional clinical diagnostic tests that Veracyte may develop in the future for nCounter, for a period of at least four years subsequent to the transaction date. Pursuant to the SSAs, Veracyte will pay the designated transfer prices for nCounter FLEX systems, Prosigna kits, LymphMark kits and any other nCounter-based diagnostic tests developed by Veracyte.
Institute for Systems Biology
In 2004, we entered into an agreement with the Institute for Systems Biology pursuant to which the Institute granted to us an exclusive, subject to certain government rights, worldwide license, including the right to sublicense, to the digital molecular barcoding technology on which our nCounter Analysis System is based, including 13 patents and patent applications. Pursuant to the terms of the amended license agreement, we are required to pay the Institute for Systems Biology royalties on net sales of products sold by us, or our sublicensees, at a low single digit percentage rate, which was reduced by 50% in the third quarter of 2016 for the remainder of the license term due to the achievement of a cumulative sales threshold. Through December 31, 2019, we have paid aggregate royalties of $6.5 million under the license agreement. Unless terminated earlier in accordance with the terms of the amended license agreement, the agreement will terminate upon the expiration of the last to expire patent licensed to us. The Institute for Systems Biology has the right to terminate the agreement under certain situations, including our failure to meet certain diligence requirements or our uncured material breach of the agreement.
Collaborations
Lam Research Corporation
In August 2017, we entered into a collaboration agreement with Lam Research Corporation, or Lam, to develop our Hyb & Seq sequencing platform and related assays. Under the terms of the agreement, Lam contributed an aggregate of $50.0 million towards the project. The development funding is non-refundable, unless the parties determine that completion of development of the product will not continue, in which case any funds advanced to us by Lam that have not been committed or spent will be refunded to Lam. We reimbursed Lam for the cost of up to 10 full-time Lam employees each year in accordance with the product development plan. Lam is eligible to receive certain single-digit percentage royalty payments from us on net sales of certain products and technologies developed under the agreement, if any such net sales are recorded. The maximum amount of royalties we may pay to Lam will be capped at $150.0 million (three times the amount of development funding actually provided by Lam). We retain exclusive rights to obtain regulatory approval, manufacture and commercialize any Hyb & Seq products.
All intellectual property made or conceived solely by us pursuant to the collaboration will be owned by us and licensed to Lam solely for the purposes of the collaboration. All intellectual property made or conceived solely by Lam pursuant to the collaboration will be owned by Lam and, subject to certain restrictions on use with Lam competitors, licensed to us for the purposes of the collaboration and further development and commercialization of our Hyb & Seq platform, as well as certain other products and technologies resulting from the collaboration in the field of molecular profiling. Jointly created intellectual property will be jointly owned, provided that neither we nor Lam use such jointly owned intellectual property in the other party’s competitive field.
The collaboration agreement establishes a joint steering committee to oversee, review and coordinate our and Lam’s activities under the collaboration agreement and monitor progress and expenditures against the associated development plan. The joint steering committee is comprised of three employees from each of us and Lam, and is chaired by one of our employees. We have final decision-making authority on the joint steering committee, subject to certain exceptions for decisions regarding development failure, material changes to the development plan, budget, and the Hyb & Seq product being developed under the agreement, and intellectual property ownership, which require consensus of the parties. The collaboration agreement also contains customary representations, warranties, covenants, indemnities and other obligations of the parties.
The term of the collaboration agreement is 15 years. Either we or Lam may terminate the collaboration agreement in the case of a material breach by the other party after providing notice and an opportunity to cure or in the case of bankruptcy or insolvency of the other party. The joint steering committee may also terminate the collaboration agreement if development is discontinued in the case of a development failure. Lam may also terminate the collaboration agreement on or after the first anniversary in the event we undergo a change of control.
In connection with the execution of the collaboration agreement, we issued Lam a warrant to purchase shares of our common stock with the number of underlying shares exercisable at any time proportionate to the amount of the $50.0 million
-12-
commitment that had been provided by Lam. The exercise price of the warrant is $16.75 per share, and in January 2020, we issued an aggregate of 407,247 shares of our common stock to Lam upon the exercise in full by Lam. In exchange for our waiver of certain lock-up restrictions, Lam agreed (i) to coordinate any sales of the shares with certain brokerage firms approved by us and (ii) not to sell more than 10% of the average daily trading volume of our common stock for the 30-day period immediately preceding any sale of the shares by Lam. In connection with the entry into the collaboration agreement and issuance of the warrant, we and Lam agreed, subject to certain exceptions applicable to Lam, to be bound by certain “standstill” provisions until August 2020.
Celgene Corporation
In March 2014, we entered into a collaboration agreement with Celgene to develop, seek regulatory approval for, and commercialize a companion diagnostic using the nCounter Analysis System to identify a subset of patients with DLBCL. In February 2018, we entered into an amendment with Celgene to our collaboration agreement in which Celgene agreed to provide us with additional funding for work intended to enable a subtype and prognostic indication for the test being developed under the agreement for Celgene’s drug REVLIMID. In connection with this amendment, we agreed to remove the right to receive payments from Celgene in the event commercial sales of the companion diagnostic test do not exceed certain pre-specified minimum annual revenues during the first three years following regulatory approval. In addition, the amendment allows Celgene, at its election, to use trial samples with additional technologies for companion diagnostics.
Pursuant to our agreement, as amended in February 2018, we were eligible to receive payments from Celgene totaling up to $24.8 million, of which $5.8 million was received as an upfront payment and $19.0 million was for development funding and potential success-based developmental and regulatory milestones. There were several amendments to the collaboration agreement and in return we received additional payments totaling $2.1 million.
In April 2019, Celgene announced that the trial evaluating REVLIMID for the treatment of DLBCL did not meet its primary endpoint. In May 2019, our collaboration agreement with Celgene was terminated effective July 2019, resulting in the recognition of substantially all of the remaining deferred revenue from the agreement. As a result, we do not intend to file a pre-market approval for LymphMark as a companion diagnostic for REVLIMID.
Merck & Co., Inc.
In May 2015, we entered into a clinical research collaboration agreement with Merck Sharp & Dohme Corp., a subsidiary of Merck & Co., Inc., or Merck, to develop an assay intended to optimize immune-related gene expression signatures and evaluate the potential to predict benefit from Merck’s anti-PD-1 therapy, KEYTRUDA, in multiple tumor types. In February 2016, we expanded our collaboration with Merck by entering into a new development collaboration agreement to clinically develop, seek regulatory approval for, and commercialize a companion diagnostic test to predict response to KEYTRUDA in multiple tumor types. In connection with the execution of the development collaboration agreement, we and Merck terminated our May 2015 clinical research collaboration and moved all remaining activities under such clinical research collaboration work plan to the new development collaboration agreement. In October 2017, we were notified by Merck of the decision not to pursue regulatory approval of the companion diagnostic test for KEYTRUDA. As a result, in August 2018, we and Merck agreed to mutually terminate our development collaboration agreement, effective as of September 30, 2018, following the completion of certain close-out activities. As part of the mutual termination agreement, Merck granted us a non-exclusive license to certain intellectual property that relates to Merck’s tumor inflammation signature.
Medivation, Inc. and Astellas Pharma, Inc.
In January 2016, we entered into a collaboration with Medivation, Inc., or Medivation, and Astellas Pharma Inc., or Astellas, to pursue the translation of a novel gene expression signature algorithm discovered by Medivation into a companion diagnostic assay using the nCounter Analysis System. In September 2016, Medivation was acquired by Pfizer, Inc., or Pfizer, and became a wholly owned subsidiary of Pfizer. In May 2017, we received notification from Pfizer and Astellas terminating the collaboration agreement as a result of a decision to discontinue the related clinical trial.
Intellectual Property
We must develop and maintain protection on the proprietary aspects of our technologies in order to remain competitive. We rely on a combination of patents, copyrights, trademarks, trade secret and other intellectual property laws and confidentiality, material transfer agreements, licenses, invention assignment agreements and other contracts to protect our intellectual property rights.
As of December 31, 2019, we owned or exclusively licensed 32 issued U.S. patents and approximately 27 pending U.S. patent applications, including provisional and non-provisional filings. We also owned or licensed approximately 290 pending and granted counterpart applications worldwide, including 139 country-specific validations of 16 European patents. The issued U.S. patents that we own or exclusively license are expected to expire between July 3, 2021 and February 6, 2033.
-13-
We have either sole or joint ownership positions in all of our pending U.S. patent applications. Where we jointly own cases, we typically have negotiated license or assignment provisions to obtain exclusive rights. For our material nCounter Analysis System we are the exclusive licensee. We also generally protect our newly developed intellectual property by entering into confidentiality agreements that include intellectual property assignment clauses with our employees, consultants and collaborators. Our patent applications generally relate to the following main areas:
• | our nCounter Analysis System biology, chemistry, methods and hardware; |
• | specific applications for our nCounter Analysis System technology; |
• | our gene expression markers, methods and gene signatures for recurrence and drug response in certain forms of cancer; |
• | biological and chemical compositions, methods and hardware for enzyme and amplification free sequencing; and |
• | biological and chemical compositions, methods and hardware for multiplexed detection and quantification of protein and/or nucleic acid expression in a defined region of a tissue or cell. |
We intend to file additional patent applications in the United States and abroad to strengthen our intellectual property rights; however, our patent applications may not result in issued patents, and we cannot assure investors that any patents that have issued or might issue will protect our technology. We have received notices of claims of potential infringement from third parties and may receive additional notices in the future. When appropriate, we have taken a license to the intellectual property rights from such third parties. For additional information, see the section of this report captioned “Risk Factors — Risks Related to Intellectual Property.”
We own a number of trademarks and develop names for our new products and as appropriate secure trademark protection for them, including domain name registration, in relevant jurisdictions.
Research and Development
We have committed, and expect to continue to commit, significant resources to developing new technologies and products, improving product performance and reliability and reducing costs. We are continuously seeking to improve our product platforms, including the technology, software, accessibility and overall capability. We also seek to develop additional research consumable content, and new potential molecular diagnostic tests. We have assembled experienced research and development teams at our Seattle, Washington location with the scientific, engineering, software and process talent that we believe is required to successfully grow our business.
As of December 31, 2019, we had 172 employees in research and development, of which 57 hold a Ph.D. degree.
Sales and Marketing
We began selling nCounter Analysis Systems to researchers in 2008 and began sales efforts in the clinical laboratory market in 2013. We sell our instruments and related products primarily through our own sales force in North America and through a combination of direct and distributor channels in Europe, the Middle East, Asia Pacific and South America. We have agreements with 29 distributors, each of which is specific to a certain territory. In the event a distributor does not meet minimum performance requirements, we may terminate the distribution agreement or convert from an exclusive to non-exclusive arrangement within the territory, allowing us to enter into arrangements with other distributors for the territory.
For additional information regarding geographic distribution of revenue, see Note 18 of the Notes to Consolidated Financial Statements under Item 8 of this report. Lam represented 13% and 17% of our total revenue for the years ended December 31, 2019 and 2018, respectively. For the year ended December 31, 2017, two customers/collaborators, (1) Merck, and (2) Medivation, Inc. and Astellas Pharma, Inc., represented 25% and 10%, respectively, of our total revenue.
Our sales and marketing efforts for instrumentation and in the life sciences research market are targeted at department heads, research or clinical laboratory directors, principal investigators, core facility directors, and research scientists and pathologists at leading academic institutions, biopharmaceutical companies, publicly and privately-funded research institutions and contract research organizations. We seek to increase awareness of our products among our target customers through direct sales calls, trade shows, seminars, academic conferences, web presence and other forms of internet marketing.
Our instruments require a significant capital investment or commitment to a lease or reagent rental agreement. Accordingly, our sales process involves numerous interactions with multiple people within an organization, and often includes in-depth analysis by potential customers of our products, proof-of-principle studies, preparation of extensive documentation and a lengthy review process. As a result of these factors, the large capital investment required in purchasing our instruments and the budget cycles of our customers, the time from initial contact with a customer to our receipt of a purchase order can vary significantly and be up to 12 months or longer. Given the length and uncertainty of our sales cycle, we have in the past experienced, and likely will in the future experience, fluctuations in our instrument sales on a period-to-period basis.
-14-
We have continued to invest in our commercial channel to increase our reach and productivity. For example, during 2017 and 2018, we added staff focused on sales of our consumable products to support our existing instrument-focused sales staff. In 2019, we added certain roles to focus specifically on the launch efforts associated with our GeoMx DSP system. We believe these investments helped to drive the growth of our installed instrument base, and the continued utilization of our consumables by our installed base of instrument users.
Manufacturing and Suppliers
We use third-party contract manufacturers to produce our instruments and certain raw materials for our consumables. We build our consumables, including our Panels, Custom CodeSets and reagent packages at our facilities in the greater Seattle, Washington area.
Instruments
We outsource manufacturing of our instruments. Precision System Science, Co., Ltd. of Chiba, Japan, or PSS, is our sole source supplier for the nCounter Prep Station. Korvis Automation Inc., or Korvis, is our sole source supplier for our nCounter Digital Analyzers and our GeoMx DSP instrument at its facility in Corvallis, Oregon. Paramit Corporation, or Paramit, is our sole source supplier for our nCounter SPRINT Profiler at its facility in Morgan Hill, California.
The facilities at which our instruments are built have been certified to ISO 13485:2003 standards. Our contracts with these instrument suppliers do not commit them to carry inventory or make available any particular quantities. Under the terms of our instrument supply agreements, we are required to place binding purchase orders for instruments that will be delivered to us by the supplier three to six months from the date of placement of the purchase order. Although qualifying alternative third-party manufacturers could be time consuming and expensive, our instruments’ design is similar to other instruments and we believe that alternatives would be available if necessary. However, if our instrument suppliers terminate our relationship with them or if they give other customers’ needs higher priority than ours, then we may not be able to obtain adequate supplies in a timely manner or on commercially reasonable terms.
Consumables
We manufacture our consumables in our greater Seattle, Washington area facilities, certain of which have been certified to ISO 13485:2003 standards. In the past several years, we have expanded our manufacturing capacity through additional leased space as well as by relocating certain research and development functions and converting the space to incremental manufacturing labs and offices. In the future, should additional space become necessary, we believe that there will be space available near our existing facilities that we believe we can secure; however, we cannot predict that this space will be available if and when it is needed.
We rely on a limited number of suppliers for certain components and materials used in the manufacture of our consumables. Some of these components are sourced from a single supplier. For example, Cidra Precision Services, LLC, of Wallingford, Connecticut, part of IDEX Health & Science, is the sole supplier of the microfluidic cartridge for our nCounter SPRINT Profiler. For some components, we have qualified second sources for several of our critical reagents, including oligonucleotides, adhesives and dyes. We believe that having dual sources for our components helps reduce the risk of a production delay caused by a disruption in the supply of a critical component. We continue to pursue qualifying additional suppliers, but cannot predict how expensive, time-consuming or successful these efforts will be. If we were to lose one or more of our suppliers, it may take significant time and effort to qualify alternative suppliers.
Competition
In the life sciences research market, we compete with companies such as Akoya Biosciences, Agilent Technologies, Bio-Rad, Bio-Techne, Fluidigm, Illumina, Luminex, Perkin Elmer, Qiagen, ReadCoor, Roche Applied Science, Thermo Fisher Scientific, Ultivue and 10x Genomics. These competitors and others have products for gene and protein expression analysis that compete in certain segments of the market in which we sell our products. In addition, there are a number of new market entrants in the process of developing novel technologies for the life sciences market.
We believe that we have multiple competitive advantages in the research market, including the automated nature of our systems with simple, rapid and efficient workflow that requires very limited human intervention or labor; the multiplexing capability of our technology to analyze significantly more target molecules in a single tube without amplification, representing multiple biological pathways; the ability to analyze combinations of DNA, RNA and proteins simultaneously in a single experiment; compatibility with many sample types, including difficult samples such as FFPE; and the ability to analyze small sample inputs, in some cases down to a single cell, from a wide variety of sample types.
While we believe that we compete favorably based on the factors described above, many of our competitors enjoy other competitive advantages over us, including:
-15-
• | greater name and brand recognition, financial and human resources; |
• | broader product lines; |
• | larger sales forces and more established distributor networks; |
• | substantial intellectual property portfolios; |
• | larger and more established customer bases and relationships; and |
• | better established, larger scale and lower cost manufacturing capabilities. |
For additional information, see the section of this report captioned “Risk Factors - The life sciences research market is highly competitive. If we fail to compete effectively, our business and operating results will suffer.”
Government Regulation
Medical Device Regulation
United States
In the United States, medical devices, including in vitro diagnostics, are subject to extensive regulation by the U.S. Food and Drug Administration, or FDA, under the Federal Food, Drug, and Cosmetic Act, or FDC Act, and its implementing regulations, and other federal and state statutes and regulations. The laws and regulations govern, among other things, medical device development, testing, labeling, storage, premarket clearance or approval, advertising and promotion and product sales and distribution.
A medical device is an instrument, apparatus, implement, machine, contrivance, implant, in vitro reagent, or other similar or related article, including any component part or accessory, which is (1) intended for use in the diagnosis of disease or other conditions, or in the cure, mitigation, treatment, or prevention of disease, in man or other animals, or (2) intended to affect the structure or any function of the body of man or other animals, and which does not achieve any of its primary intended purposes through chemical action within or on the body of man or other animals and which is not dependent upon being metabolized for the achievement of any of its primary intended purposes. In vitro diagnostics are a type of medical device, and are tests that can be used in the screening or diagnosis and/or detection of diseases, conditions or infections, including, without limitation, the presence of certain chemicals, genetic or other biomarkers.
Medical devices to be commercially distributed in the United States must receive from the FDA either clearance of a premarket notification, or 510(k), or premarket approval of a premarket approval application, or PMA, pursuant to the FDC Act prior to marketing, unless subject to an exemption. Devices deemed to pose relatively low risk are placed in either Class I or II. Placement of a device into Class II generally requires the manufacturer to submit to the FDA a 510(k) seeking clearance for commercial distribution; this is known as the 510(k) clearance process. Class III devices that were on the market before May 28, 1976 and for which FDA has not yet required submission of PMAs are also required to submit a 510(k) to FDA. Most Class I devices are exempted from this premarket submission requirement. Devices deemed by the FDA to pose the greatest risk, such as life-sustaining, life-supporting or implantable devices and some diagnostic tests, are placed into Class III requiring PMA approval. Devices deemed not substantially equivalent to a previously 510(k)-cleared device or novel devices for which no predicate device exists are placed into Class III, but may be reclassified by FDA into Class I or Class II upon the submission by the manufacturer of a de novo reclassification application. A clinical trial is almost always required to support a PMA application or de novo application, and in many cases is required for a 510(k) application. All clinical studies of investigational devices must be conducted in compliance with applicable FDA or Institutional Review Board, or IRB, regulations.
510(k) Clearance Pathway. To obtain 510(k) clearance, a manufacturer must submit a premarket notification demonstrating to the FDA’s satisfaction that the proposed device is substantially equivalent in intended use and in technological characteristics to a previously 510(k) cleared device or a device that was in commercial distribution before May 28, 1976, for which the FDA has not yet called for submission of PMA applications, or to a device that has received de novo authorization. The previously cleared device is known as a predicate. The FDA’s 510(k) clearance pathway usually takes from six to 12 months, but it can take significantly longer, particularly for a novel type of product. The FDA will also not begin a substantive review of the filing until it verifies the application contains all necessary information required to commence a substantive review. If the application does not contain all required information, the FDA will not file the application and return it to the submitter, highlighting the deficiencies in the application.
After a device receives 510(k) clearance, any modification that could significantly affect its safety or effectiveness, or that would constitute a major change in its intended use, requires a new 510(k) clearance or could require a PMA approval. The FDA requires each manufacturer to make this determination in the first instance, but the FDA can review any such decision. If the FDA disagrees with a manufacturer’s decision not to seek a new 510(k) clearance, the agency may require the manufacturer
-16-
to seek 510(k) clearance or PMA approval. If the modified device has been commercialized, the FDA also can require the manufacturer to cease marketing and/or recall the modified device until 510(k) clearance or PMA approval is obtained.
PMA Approval Pathway. The PMA approval pathway requires a demonstration of reasonable assurance of safety and effectiveness of the device to the FDA’s satisfaction. The PMA approval pathway is costly, lengthy and uncertain.
A PMA application must provide extensive preclinical and clinical trial data and also information about the device and its components regarding, among other things, device design, manufacturing and labeling. As part of the PMA review, the FDA will typically inspect the manufacturer’s facilities for compliance with Quality System Regulation, or QSR, requirements, which impose stringent testing, control, documentation and other quality assurance procedures.
Upon submission, the FDA determines if the PMA application is sufficiently complete to permit a substantive review, and, if so, the application is accepted for filing. The FDA then commences an in-depth review of the PMA application. The PMA approval process typically takes one to three years, but may last longer. The review time is often significantly extended as a result of the FDA asking for more information or clarification of information already provided. The FDA also may respond with a “not approvable” determination based on deficiencies in the application and require additional clinical studies that are often expensive and time consuming and can delay approval for months or even years. During the review period for a new type of device, an FDA advisory committee, a panel of external experts, may be convened to review the application and recommend to the FDA whether, or upon what conditions, the device should be approved. Although the FDA is not bound by the advisory panel decision, the panel’s recommendation is important to the FDA’s overall decision making process.
If the FDA’s evaluation of the PMA application is favorable, the FDA typically issues an “approvable letter” requiring the applicant’s agreement to specific conditions, such as changes in labeling, or specific additional information such as submission of final labeling, in order to secure final approval of the PMA application. Once the approvable letter is satisfied, the FDA will issue an approval for specific indications, which can be more limited than those originally sought by the manufacturer. The PMA can include post-approval conditions that the FDA believes necessary to ensure the safety and effectiveness of the device including, among other things, post-approval studies and restrictions on labeling, promotion, sale and distribution. Failure to comply with the conditions of approval can result in material adverse enforcement action, including the loss or withdrawal of the approval or placement of restrictions on the sale of the device until the conditions are satisfied.
Even after approval of a PMA, a new PMA or PMA supplement may be required in the event of a modification to the device, its labeling or its manufacturing process. Supplements to a PMA may require the submission of the same type of information required for an original PMA, except that the supplement is generally limited to that information needed to support the proposed change from the product covered by the original PMA.
De Novo Pathway. If no predicate can be identified, the product is automatically classified as Class III, requiring a PMA. However, the FDA can reclassify, or use “de novo classification” for, a device for which there was no predicate device if the device is low or moderate risk. A device company can also submit a de novo application at the outset, rather than submitting a 510(k) application for its particular product. When granting a de novo application the FDA will establish special controls that other applicants for the same device type must satisfy, which often includes labeling restrictions and data requirements. Subsequent applicants can rely upon the de novo product as a predicate for a 510(k) clearance. The de novo route has been used for many in vitro diagnostic products.
Postmarket. After a device is placed on the market, numerous regulatory requirements apply. These include: the quality manufacturing requirements set forth in the QSR, labeling regulations, the FDA’s general prohibition against promoting products for unapproved or “off label” uses, registration and listing, the Medical Device Reporting, or MDR, regulation (which requires that manufacturers report to the FDA if their device may have caused or contributed to a death or serious injury or malfunctioned in a way that would likely cause or contribute to a death or serious injury if the malfunction were to recur), and the Reports of Corrections and Removals regulation (which requires manufacturers to report recalls and field actions to the FDA if initiated to reduce a risk to health posed by the device or to remedy a violation of the FDC Act).
The FDA enforces these requirements by unannounced inspection, market surveillance, and other means. If the FDA finds a violation, it can institute a wide variety of enforcement actions, ranging from an untitled regulatory letter or a warning letter, to more severe sanctions such as fines, injunctions, and civil penalties; recall or seizure of products; operating restrictions, partial suspension or total shutdown of production; refusing requests for 510(k) clearance or PMA approval of new products; withdrawing 510(k) clearance or PMA approvals already granted; and criminal prosecution. For additional information, see the section of this report captioned “Risk Factors — Risks Related to Government Regulation.”
Products Labeled for Research Use Only. In essence, RUO products are not regulated as medical devices and are therefore not subject to the regulatory requirements enforced by the FDA. The products must bear the statement: “For Research Use Only. Not for Use in Diagnostic Procedures.” RUO products cannot make any claims related to safety, effectiveness or diagnostic utility, or clinical applications, and they cannot be intended for human clinical diagnostic use. In November 2013, the FDA issued a final guidance on products labeled RUO, which, among other things, reaffirmed that a company may not
-17-
make any clinical or diagnostic claims about an RUO product. The FDA will also evaluate the totality of the circumstances to determine if the product is intended for diagnostic purposes. If FDA were to determine, based on the totality of circumstances, that our products labeled and marketed for RUO are intended for diagnostic purposes, they would be considered medical devices that will require clearance or approval prior to commercialization.
Dual-Use Instruments. Dual-use instruments are subject to FDA regulation since they are intended, at least in part, for use by customers performing clinical diagnostic testing. In November 2014, FDA issued a guidance that described FDA’s approach to regulating molecular diagnostic instruments that combine in a single molecular instrument both approved/cleared device functions and device functions for which approval/clearance is not required.
Laboratory Developed Tests. Laboratory Developed Tests, or LDTs, are developed, validated and used within a single laboratory. In the past, the FDA generally exercised its enforcement discretion for LDTs and did not require clearance or approval prior to marketing. On October 3, 2014, FDA issued two draft guidances that proposed to actively regulate LDTs using a risk-based approach, and would have required 510(k)s or PMAs for certain “moderate” or “high” risk devices. However, in late November 2016, FDA announced that it would not be finalizing the 2014 draft LDT Guidances. More recently, the FDA has issued warning letters to genomics labs for illegally marketing genetic tests that claim to predict patients’ responses to specific medications, noting that the FDA has not created a legal “carve-out” for LDTs and retains discretion to take action when appropriate, such as when certain genomic tests raise significant public health concerns. As manufacturers develop more complex genetic tests and diagnostic software, the FDA may increase its regulation of LDTs.
Companion Diagnostics. In August 2014, FDA issued a companion diagnostics final guidance stating that if the device is essential to the safety or efficacy of the drug, FDA will generally require approval or clearance for the device at the time when FDA approves the drug. Most companion diagnostics will require PMA approval. FDA has also issued draft guidances on principles for co-development of an in vitro companion diagnostic device with a therapeutic product in July 2016 and on developing and labeling in vitro companion diagnostic devices for a specific group or class of oncology therapeutic products in December 2018.
International
International sales of medical devices are subject to foreign government regulations, which vary substantially from country to country. The European Commission is the legislative body responsible for directives under which manufacturers selling medical products in the European Union, or EU, and the European Economic Area, or EEA, must comply. The EU includes most of the major countries in Europe, while other countries, such as Switzerland, are part of the EEA and have voluntarily adopted laws and regulations that mirror those of the EU with respect to medical devices. The EU has adopted directives that address regulation of the design, manufacture, labeling, clinical studies and post-market vigilance for medical devices. Devices that comply with the requirements of a relevant directive will be entitled to bear the CE conformity marking, indicating that the device conforms to the essential requirements of the applicable directives and, accordingly, can be marketed throughout the EU and EEA. The European Medical Device Regulation (MDR), which will replace Europe’s Medical Device Directive (MDD), will be effective on May 25, 2020. Additionally, the In Vitro Diagnostic Regulation (IVDR 2017/746), which addresses several weaknesses of the In Vitro Diagnostic Directive (IVDD 98/79/EC), will apply starting on May 26, 2022.
In September 2012, Prosigna was CE-marked for compliance with IVDD 98/79/EC for use in conjunction with a diagnostic version of our nCounter Analysis System in the EU to assess a breast cancer patient’s risk of distant recurrence.
Outside of the EU, regulatory approval needs to be sought on a country-by-country basis in order to market medical devices. Although there is a trend towards harmonization of quality system standards, regulations in each country may vary substantially, which can affect timelines of introduction.
Reimbursement
Our nCounter FLEX Analysis Systems are purchased or leased by clinical laboratories, which use our diagnostic products as the basis for testing patients’ samples. These customers can use our products to enable commercial testing services, and generate revenue for their laboratories for this service. In order to collect payment for testing services based upon our diagnostic products, our clinical laboratory customers may bill third parties, including public and private payors. The demand for our diagnostic products will depend indirectly upon the ability for our customers to successfully bill for and receive reimbursement from third-party payors for the clinical testing services based on our products. Therefore, we intend to work with third-party payors in markets where we intend to sell our diagnostic products to ensure that testing services based on our products are covered and paid.
The decision of payors to cover and pay for a specific testing service is driven by many factors, including:
• | strong clinical and analytical validation data; |
-18-
• | acceptance into major clinical guidelines, including the National Comprehensive Cancer Network, or NCCN, the American Society of Clinical Oncologists, or ASCO, and the St. Gallen Consensus guidelines; |
• | health economic studies that may indicate that the test improves quality-adjusted survival and leads to reduced costs; and |
• | decision impact studies that show the test leads to better treatment decisions. |
We have generated dossiers for submission to payors in support of reimbursement for testing services based upon our initial diagnostic product, Prosigna. The dossiers typically contain data from studies supporting the analytical and clinical validity of Prosigna, as well as health economic analyses that examine whether the clinical information supplied by Prosigna changes medical practice in a way that leads to benefit for both the patients and the payors. In some cases, these health economic analyses may be supported by the results of clinical studies of Prosigna’s impact on adjuvant treatment decisions in early stage breast cancer called decision impact studies. We developed a clinical protocol for Prosigna decision impact studies in collaboration with two European cooperative groups, and based on this protocol we have completed three studies to date.
United States
In the United States, clinical laboratory revenue is derived from various third-party payors, including insurance companies, health maintenance organizations, or HMOs, and government healthcare programs, such as Medicare and Medicaid. Clinical laboratory testing services are paid through various methodologies when covered by third-party payors, such as prospective payment systems and fee schedules. For any new clinical test, payment for the clinical laboratory service requires a decision by the third-party payor to cover the particular test, the establishment of a reimbursement rate for the test and the identification of one or more Current Procedural Terminology, or CPT, codes that accurately describe the test.
The American Medical Association, or AMA, has issued a set of CPT codes for billing and reimbursement of complex genomic tests that are based on information from multiple analytes or genes. These new MAAA, or Multianalyte Assays with Algorithmic Analyses, codes are intended to capture tests such as Prosigna and are divided into two categories of unique codes - Category 1 or administrative. Category 1 MAAA codes are intended for tests that AMA’s CPT Editorial Panel has vetted and found to meet a certain set of criteria, such as demonstrated clinical validity and utility, as well as current national utilization thresholds. MAAA codes issued to complex genomic tests that have not met all Category 1 coding criteria are referred to as administrative MAAA codes. Assignment of either unique reimbursement code to a particular test may facilitate claims processing by payors; however, assignment of a unique reimbursement code alone does not guarantee favorable reimbursement decisions by payors. A genomic test with an assigned MAAA code must still be vetted and approved by individual payors for coverage and payment before reimbursement is achieved. Given the more stringent requirements for receipt of a Category 1 MAAA, including demonstrated clinical validity and utility and satisfaction of national utilization thresholds, we believe that certain payors may more readily render favorable reimbursement decisions for genomic tests with a Category 1 MAAA rather than an administrative MAAA.
The Centers for Medicare & Medicaid Services, or CMS, administers the Medicare and Medicaid programs, which provide health care coverage to almost one in every three Americans. For any particular geographic region, Medicare claims are processed at the local level by Medicare Administrative Contractors, or MACs. New diagnostic tests typically follow one of three routes to coverage via CMS: National Coverage Determinations, or NCDs, Local Coverage Determinations, or LCDs, or simply payment of claims by a MAC. NCDs apply to Medicare beneficiaries living throughout the United States. Due to cost and CMS bandwidth limitations there are generally few NCDs issued in any particular year. In contrast, LCDs apply to only beneficiaries in the coverage area of the issuing MAC, thus LCDs are required from every MAC to cover the testing throughout the United States. There is also a subset of NCDs known as Coverage with Evidence Development, or CED, that allow a technology (service or procedure) to be covered while evidence of clinical utility is collected through a registry or a study to answer outstanding questions on outcomes. Some MACs have developed Coverage with Data Development, or CDD, policies for the same purpose, which are administered at the local level.
For Medicare, the reimbursement rates for individual tests are established under the Clinical Laboratory Fee Schedule (local fee schedules for outpatient clinical laboratory services) or the Physician Fee Schedule, depending on the amount of physician work involved in the test. Molecular diagnostic tests are paid under the Clinical Laboratory Fee Schedule. For additional information, see the section of this report captioned “Risk Factors — Risks Related to Government Regulation.”
Outside the United States
In Europe, governments are primarily responsible for reimbursing diagnostic testing services. A relatively small portion of the market is made up of private payors and cash-pay patients. The primary barrier of adoption of a new in vitro diagnostic test is often reimbursement, and public reimbursement can take several years to achieve, depending on the country. Public reimbursement for genomic testing for breast cancer is available in Canada, Ireland, France, Greece, Switzerland, Denmark and the United Kingdom. Selected private coverage for testing is available in the United Kingdom, Germany, Spain, France, the UAE and Hungary. Reimbursement approval in some countries, such as Spain and Italy, is managed at the regional
-19-
level. Israel is a market in which genomic testing for breast cancer is widely reimbursed by all four major Sick Funds, the third-party payors that cover a substantial majority of the population. We will tailor our approaches to reimbursement and market access throughout the rest of the world as appropriate as we evaluate new product and service offerings.
Other Government Regulations
Our operations in the United States and abroad are subject to various fraud and abuse laws, including, without limitation, the federal anti-kickback statute and state and federal marketing compliance laws in the United States. These laws may impact our operations directly, or indirectly through our customers, and may impact, among other things, our proposed sales, marketing and education programs. In addition, we may be subject to patient privacy regulation by both the federal government and the states in which we conduct our business. The laws that may affect our ability to operate include the following federal laws and their counterparts at the state level:
• | the Federal Anti-kickback Statute and state anti-kickback prohibitions; |
• | the Federal physician self-referral prohibition, commonly known as the Stark Law, and state equivalents; |
• | the Federal Health Insurance Portability and Accountability Act of 1996, as amended, commonly known as HIPAA; |
• | the Medicare civil money penalty laws and exclusion requirements; |
• | the Federal False Claims Act, civil and criminal penalties and state equivalents; |
• | the Foreign Corrupt Practices Act, which applies to our international activities; |
• | the Physician Payments Sunshine Act; and |
• | the European Union’s General Data Privacy Regulations, or GDPR. |
Employees
As of December 31, 2019, we had 551 employees, of which 157 work in manufacturing, 157 in sales, marketing and business development, 172 in research and development, and 65 in general and administrative. None of our U.S. employees are represented by a labor union or are the subject of a collective bargaining agreement. As of December 31, 2019, of our 551 employees, 501 were employed in the United States and 50 were employed outside the United States.
Environmental Matters
Our operations require the use of hazardous materials (including biological materials) which subject us to a variety of federal, state and local environmental and safety laws and regulations. Some of the regulations under the current regulatory structure provide for strict liability, holding a party potentially liable without regard to fault or negligence. We could be held liable for damages and fines as a result of our, or others’, business operations should contamination of the environment or individual exposure to hazardous substances occur. We cannot predict how changes in laws or development of new regulations will affect our business operations or the cost of compliance.
Where You Can Find Additional Information
We make available free of charge through our investor relations website, www.nanostring.com, our annual reports, quarterly reports, current reports, proxy statements and all amendments to those reports as soon as reasonably practicable after such material is electronically filed or furnished with the SEC. These reports may also be obtained without charge by contacting Investor Relations, NanoString Technologies, Inc., 530 Fairview Avenue North, Seattle, Washington 98109, e-mail: investorrelations@nanostring.com. Our Internet website and the information contained therein or incorporated therein are not intended to be incorporated into this Annual Report on Form 10-K. In addition, the SEC maintains an Internet site that contains reports, proxy and information statements, and other information regarding reports that we file or furnish electronically with them at www.sec.gov.
-20-
Item 1A. Risk Factors
You should carefully consider the following risk factors, in addition to the other information contained in this report, including the section of this report captioned “Management’s Discussion and Analysis of Financial Condition and Results of Operations” and our financial statements and related notes. If any of the events described in the following risk factors and the risks described elsewhere in this report occurs, our business, operating results and financial condition could be seriously harmed. This report on Form 10-K also contains forward-looking statements that involve risks and uncertainties. Our actual results could differ materially from those anticipated in the forward-looking statements as a result of factors that are described below and elsewhere in this report.
Risks Related to Our Business and Strategy
We have incurred losses since we were formed and expect to incur losses in the future. We cannot be certain that we will achieve or sustain profitability.
We have incurred losses since we were formed and expect to incur losses in the future. We incurred net losses of $40.7 million, $77.4 million and $43.6 million for the years ended December 31, 2019, 2018 and 2017, respectively. As of December 31, 2019, we had an accumulated deficit of $432.0 million. We expect that our losses will continue for at least the next several years as we will be required to invest significant additional funds toward ongoing development and commercialization of our technology. We also expect that our operating expenses will continue to increase as we grow our business, but there can be no assurance that our revenue and gross profit will increase sufficiently such that our net losses decline, or we attain profitability, in the future. Our ability to achieve or sustain profitability is based on numerous factors, many of which are beyond our control, including the market acceptance of our products, future product development and our market penetration and margins. We may never be able to generate sufficient revenue to achieve or sustain profitability.
Our financial results may vary significantly from quarter to quarter which may adversely affect our stock price.
Investors should consider our business and prospects in light of the risks and difficulties we expect to encounter in the uncertain and rapidly evolving markets in which we compete. Because these markets are evolving, predicting their future growth and size is difficult. We expect that our visibility into future sales of our products, including volumes, prices and product mix between instruments and consumables, and the amount and timing of payments pursuant to collaboration agreements will continue to be limited and could result in unexpected fluctuations in our quarterly and annual operating results.
Numerous other factors, many of which are outside our control, may cause or contribute to significant fluctuations in our quarterly and annual operating results. These fluctuations may make financial planning and forecasting difficult. In addition, these fluctuations may result in unanticipated changes in our available cash, which could negatively affect our business and prospects. Factors that may contribute to fluctuations in our operating results include many of the risks described in this section. Also, one or more of such factors may cause our revenue or operating expenses in one period to be disproportionately higher or lower relative to the others. Furthermore, our instruments involve a significant capital commitment by our customers and accordingly involve a lengthy sales cycle. We may expend significant effort in attempting to make a particular sale, which may be deferred by the customer or never occur. Accordingly, comparing our operating results on a period-to-period basis may not be meaningful, and investors should not rely on our past results as an indication of our future performance. If such fluctuations occur or if our operating results deviate from our expectations or the expectations of securities analysts, our stock price may be adversely affected.
If we do not achieve, sustain or successfully manage our anticipated growth, our business and growth prospects will be harmed.
We have experienced significant revenue growth in recent periods and we may not achieve similar growth rates in the future. Investors should not rely on our operating results for any prior periods as an indication of our future operating performance. If we are unable to maintain adequate revenue growth, our financial results could suffer and our stock price could decline. Furthermore, growth will place significant strains on our management and our operational and financial systems and processes. For example, the recent commercial launch of our GeoMx DSP system is a key element of our growth strategy and will require us to hire and retain additional sales and marketing personnel and resources. If we do not successfully generate demand for GeoMx DSP or other new product offerings, or manage our anticipated expenses accordingly, our operating results will be harmed.
-21-
Our future success is dependent upon our ability to expand our customer base and introduce new applications and products.
Our current customer base is primarily composed of academic and government research laboratories, biopharmaceutical companies and clinical laboratories (including physician-owned laboratories) that perform analyses using our nCounter Analysis Systems. Our success will depend, in part, upon our ability to increase our market penetration among all of these customers and to expand our market by developing and marketing new research applications and new instruments. We expect that increasing the installed base of our nCounter Analysis Systems will drive demand for our relatively high margin consumable products. If we are not able to successfully increase our installed base of nCounter Analysis Systems, sales of our consumable products and our margins may not meet expectations.
We also develop and introduce new products, such as our recently launched GeoMx DSP system. Our GeoMx DSP instrument and related consumables became commercially available in 2019 and we anticipate that scaling and training our sales force to attract new customers will require substantial time and expense. Any failure to expand our existing customer base through the launch of our GeoMx DSP system or other new applications and products would adversely affect our operating results.
New market opportunities may not develop as quickly as we expect, limiting our ability to successfully market and sell our products.
The markets for our products are new and evolving. Accordingly, we expect the application of our technologies to emerging opportunities will take several years to develop and mature and we cannot be certain that these market opportunities will develop as we expect. For example, in 2017 we launched our 360 panels for use in breast cancer, immuno-oncology and hematology research. In 2018, we expanded beyond oncology and launched research panels in neuroscience and CAR-T characterization and in 2019 we introduced research panels for human organ transplantation and Alzheimer’s disease.
We also recently launched our GeoMx DSP system and related consumables. GeoMx DSP targets spatial genomics, a novel market opportunity and research application for which existing research experience and applications are limited. Prior to the launch of GeoMx DSP, we had not previously targeted this market and, as a result, we have limited marketing and selling experience. We also have GeoMx DSP related products under development that target new markets and customers that differ from our current customer base. Even if we successfully develop these products, our limited marketing and selling experience targeting these new markets and customers may hinder the successful commercialization of these products.
The future growth of the market for these new products depends on many factors beyond our control, including recognition and acceptance of our applications by the scientific community and the growth, prevalence and costs of competing research methods. If the markets for our new products do not develop as we expect, our business may be adversely affected. If we are not able to successfully market and sell our products or to achieve the revenue or margins we expect, our operating results may be harmed.
Our research business depends on levels of research and development spending by academic and governmental research institutions and biopharmaceutical companies, a reduction in which could limit demand for our products and adversely affect our business and operating results.
In the near term, we expect that a large portion of our revenue will be derived from sales of our nCounter Analysis Systems to academic and government research laboratories and biopharmaceutical companies worldwide for research and development applications. The demand for our products will depend in part upon the research and development budgets of these customers, which are impacted by factors beyond our control, such as:
• | changes in government programs (such as the National Institutes of Health) that provide funding to research institutions and companies; |
• | macroeconomic conditions and the political climate; |
• | changes in the regulatory environment; |
• | differences in budgetary cycles; |
• | competitor product offerings or pricing; |
• | market-driven pressures to consolidate operations and reduce costs; and |
• | market acceptance of relatively new technologies, such as our GeoMx DSP instrument. |
In addition, academic, governmental and other research institutions that fund research and development activities may be subject to stringent budgetary constraints that could result in spending reductions, reduced allocations or budget cutbacks, which could jeopardize the ability of these customers to purchase our products. Our operating results may fluctuate substantially due to reductions and delays in research and development expenditures by these customers. Any decrease in our customers’ budgets or expenditures, or in the size, scope or frequency of capital or operating expenditures, could materially and
-22-
adversely affect our business, operating results and financial condition.
Our sales cycle is lengthy and variable, which makes it difficult for us to forecast revenue and other operating results.
Our sales process involves numerous interactions with multiple individuals within an organization, and often includes in-depth analysis by potential customers of our products, performance of proof-of-principle studies, preparation of extensive documentation and a lengthy review process. As a result of these factors, the large capital investment required in purchasing our instruments and the budget cycles of our customers, the time from initial contact with a customer to our receipt of a purchase order can vary significantly and be up to 12 months or longer. In addition, the recent introduction of GeoMx DSP in 2019 may decrease our near-term visibility as to the timing of our total sales or the length of our overall sales cycle. Given the length and uncertainty of our sales cycle that we have in the past experienced, and likely will in the future experience, fluctuations in our instrument sales will occur on a period-to-period basis. These factors also make it difficult to forecast revenue on a quarterly basis. In addition, any failure to meet customer expectations could result in customers choosing to continue to use their existing systems or to purchase systems other than ours.
Our reliance on distributors for sales of our products outside of the United States could limit or prevent us from selling our products and impact our revenue.
We have established distribution agreements for our nCounter Analysis and GeoMx DSP systems and related consumable products in many countries where we do not sell directly. We intend to continue to grow our business internationally, and to do so we must attract additional distributors and retain existing distributors to maximize the commercial opportunity for our products. There is no guarantee that we will be successful in attracting or retaining desirable sales and distribution partners or that we will be able to enter into such arrangements on favorable terms. Distributors may not commit the necessary resources to market and sell our products to the level of our expectations or may choose to favor marketing the products of our competitors. If current or future distributors do not perform adequately, or we are unable to enter into effective arrangements with distributors in particular geographic areas, we may not realize long-term international revenue growth.
Our future capital needs are uncertain and we may need to raise additional funds in the future.
We believe that our existing cash and cash equivalents, together with funds available under our term loan agreement and revolving credit facility, will be sufficient to meet our anticipated cash requirements for at least the next 12 months. However, we may need to raise substantial additional capital to:
• | expand the commercialization of our products; |
• | fund our operations; and |
• | further our research and development. |
Our future funding requirements will depend on many factors, including:
• | market acceptance of our products; |
• | the cost and timing of establishing additional sales, marketing and distribution capabilities; |
• | revenue and cash flow derived from existing or future collaborations; |
• | the cost of our research and development activities; |
• | the cost and timing of regulatory clearances or approvals; |
• | the effect of competing technological and market developments; and |
• | the extent to which we engage in strategic transactions, such as the acquisition of, investment in or disposal of businesses, assets, products and technologies, including inbound or outbound licensing arrangements. |
We cannot assure you that we will be able to obtain additional funds on acceptable terms, or at all. If we raise additional funds by issuing equity or equity-linked securities, or convertible debt, our stockholders may experience dilution. For example, in July 2018 and August 2018, we sold an aggregate of 4,600,000 shares of common stock in an underwritten public offering for net proceeds of $53.8 million and in March 2019, we sold an aggregate of 3,175,000 shares of common stock in an underwritten public offering for net proceeds of $68.3 million. In October 2018, we entered into a new $100.0 million term loan facility with CR Group L.P. Additional debt financing, if available, may involve additional covenants restricting our operations or our ability to incur additional debt. Any debt or additional equity financing that we raise may contain terms that are not favorable to us or our stockholders. If we raise additional funds through strategic transactions with third parties, such as collaborations, asset sales and licensing arrangements, it may be necessary to relinquish some rights to our technologies or our products, or grant licenses on terms that are not favorable to us. We have in the past pursued these types of transactions, such as the License and Asset Purchase Agreement, or LAPA, with Veracyte, Inc., or Veracyte, we completed in December 2019, and may in the future pursue similar transactions or other strategic transactions, on our own or with other advisors, that may impact our business and prospects and the value of our common stock. If we do not have, or are not able to
-23-
obtain, sufficient funds, we may have to delay development or commercialization of our products or license to third parties the rights to commercialize products or technologies that we would otherwise seek to commercialize. We also may have to reduce marketing, customer support or other resources devoted to our products or cease operations. Any of these factors could harm our operating results.
Our research and development efforts will be hindered if we are not able to contract with third parties for access to archival tissue samples.
Under standard clinical practice, tumor biopsies removed from patients are preserved and stored in formalin-fixed paraffin embedded, or FFPE, format. We rely on our ability to secure access to these archived FFPE tumor biopsy samples, as well as information pertaining to the clinical outcomes of the patients from which they were derived for our clinical development activities. Others compete with us for access to these samples. Additionally, the process of negotiating access to archived samples is lengthy because it typically involves numerous parties and approval levels to resolve complex issues such as usage rights, institutional review board approval, privacy rights, publication rights, intellectual property ownership and research parameters. In January 2017, the Department of Health and Human Services finalized new rules, which became effective as of January 19, 2018, expanding the language to be included in informed consent forms related to the collection of identifiable private information or identifiable biospecimens. If this new requirement, or other factors arising in the future, impact our ability to negotiate access to archived tumor tissue samples with hospitals, clinical partners, pharmaceutical companies, or companies developing therapeutics on a timely basis or on commercially reasonable terms, or at all, or if other laboratories or our competitors secure access to these samples before us, our ability to research, develop and commercialize future products will be limited or delayed.
We may not be able to develop new products, enhance the capabilities of our systems to keep pace with rapidly changing technology and customer requirements or successfully manage the transition to new product offerings, any of which could have a material adverse effect on our business and operating results.
Our success depends on our ability to develop new products and applications for our technology in existing and new markets, while improving the performance and cost-effectiveness of our systems. New technologies, techniques or products could emerge that might offer better combinations of price and performance than our current or future products and systems. Existing markets for our products, including gene expression analysis, gene fusions and copy number variation, as well as new markets, such as protein expression and gene mutations, and potential markets for our research product candidates, are characterized by rapid technological change and innovation. Competitors may be able to respond more quickly and effectively than we can to new or changing opportunities, technologies, standards or customer requirements. We anticipate that we will face increased competition in the future as existing companies and competitors develop new or improved products and as new companies enter the market with new technologies. It is critical to our success that we anticipate changes in technology and customer requirements and successfully introduce new, enhanced and competitive technologies to meet our customers’ and prospective customers’ needs on a timely and cost-effective basis. If we do not successfully innovate and introduce new technology into our product lines, our business and operating results will be adversely impacted.
The development and manufacture of new products typically requires new scientific discoveries or advancements and complex technology and engineering, including the design of sophisticated software. Such developments may involve external suppliers and service providers, making the management of development projects complex and subject to risks and uncertainties regarding timing, timely delivery of required components, software or services and satisfactory technical performance of such software, components or assembled products. For example, since 2017, we have worked with our supplier of cartridges used in our nCounter SPRINT systems to improve the design to address leakage and other issues in the microfluidic device produced for us. If we do not achieve the required technical specifications or successfully manage new product development processes, or if development work and manufacturing is not performed according to schedule, then such new technologies or products may be adversely impacted and our business and operating results may be harmed. Any delays in bringing new products to market may lead our customers to purchase our competitors’ products or cancel outstanding purchase orders.
Additionally, we must carefully manage the introduction of new products. If customers believe that such products will offer enhanced features or be sold for a more attractive price, they may delay purchases until such products are available. If customers conclude that such new products offer better value as compared to our existing products, we may suffer from reduced sales of our existing products and our overall revenue may decline. We may also have excess or obsolete inventory of older products as we transition to new products and our experience in managing product transitions is limited. If we do not effectively manage the transitions to new product offerings, our revenue, results of operations and business will be adversely affected.
-24-
We are dependent on single source suppliers for some of the components and materials used in our products, and the loss of any of these suppliers could harm our business.
We rely on Precision System Science, Co., Ltd of Chiba, Japan, to build our nCounter Prep Station, Korvis LLC of Corvallis, Oregon, to build our nCounter Digital Analyzer and GeoMx DSP, Paramit Corporation of Morgan Hill, California, to build the nCounter SPRINT Profiler and IDEX Corporation of Lake Forest, Illinois to build the fluidics cartridge, a key component of our nCounter SPRINT Profiler. Each of these contract manufacturers are sole suppliers. Since our contracts with these instrument suppliers do not commit them to carry inventory or make available any particular quantities, they may give other customers’ needs higher priority than ours, and we may not be able to obtain adequate supplies in a timely manner or on commercially reasonable terms. We also rely on sole suppliers for various components we use to manufacture our consumable products. We periodically forecast our needs for such components and enter into standard purchase orders with them. If we were to lose such suppliers, or if the products provided by such suppliers are unable to meet our performance specifications, there can be no assurance that we will be able to identify or enter into agreements with alternative suppliers on a timely basis on acceptable terms, if at all. In addition, if as a result of global economic or political instability or health pandemics such as coronavirus, our suppliers experience shortages or delays for materials sourced or manufactured in the affected countries, their ability to supply us with instruments or product components may be affected. If we should encounter delays or difficulties in securing the quality and quantity of materials we require for our products, our supply chain would be interrupted which would adversely affect sales. If any of these events occur, our business and operating results could be harmed.
We may experience manufacturing problems or delays that could limit our growth or adversely affect our operating results.
Our consumable products are manufactured at our facilities located in the greater Seattle, Washington area using complex processes, sophisticated equipment and strict adherence to specifications and quality systems procedures. Any unforeseen manufacturing problems, such as contamination of our facilities, equipment malfunction, quality issues with components and materials sourced from third-party suppliers or failure to strictly follow procedures or meet specifications, could result in delays or shortfalls in production or require us to voluntarily recall our consumable products. Identifying and resolving the cause of any such manufacturing or supplier issues could require substantial time and resources. If we are unable to keep up with demand for our products by successfully manufacturing and shipping our products in a timely manner, our revenue could be impaired, market acceptance for our products could be adversely affected and our customers might instead purchase our competitors’ products or cancel outstanding purchase orders.
In addition, the introduction of new products may require the development of new manufacturing processes and procedures as well as new suppliers. For example, our GeoMx DSP systems require that we establish supply relationships with antibody providers. While all of our CodeSets are produced using the same basic processes, significant variations may be required to meet new product specifications. Developing new processes and negotiating supply agreements can be very time consuming, and any unexpected difficulty in doing so could delay the introduction of a product.
If our greater Seattle area facilities become unavailable or inoperable, we will be unable to continue our research and development, manufacturing our consumables or processing sales orders, and our business will be harmed.
We manufacture our consumable products in our facilities located in the greater Seattle, Washington area, which are the center for research and development, order processing, receipt of our instruments manufactured by third-party contract manufacturers and shipping products to customers. Our facilities and the equipment we use to manufacture our consumable products would be costly, and would require substantial lead time, to repair or replace. The Seattle area is situated near active earthquake fault lines. These facilities may be harmed or rendered inoperable by natural or man-made disasters, including earthquakes and power outages, which may render it difficult or impossible for us to produce our products for some period of time. The inability to manufacture consumables or to ship products to customers for even a short period of time may result in the loss of customers or harm our reputation, and we may be unable to regain those customers in the future. Although we possess insurance for damage to our property and the disruption of our business, this insurance, and in particular earthquake insurance, which is limited, may not be sufficient to cover all of our potential losses and may not continue to be available to us on acceptable terms, if at all.
We expect to generate a substantial portion of our product and service revenue internationally and are subject to various risks relating to our international activities, which could adversely affect our operating results.
For 2019, 2018 and 2017 approximately 38%, 40% and 40% respectively, of our product and service revenue was generated from sales to customers located outside of North America. We believe that a significant percentage of our future revenue will come from international sources as we expand our overseas operations and develop opportunities in additional areas. Engaging in international business involves a number of difficulties and risks, including:
• | required compliance with existing and changing foreign regulatory requirements and laws; |
-25-
• | required compliance with anti-bribery laws, such as the U.S. Foreign Corrupt Practices Act and U.K. Bribery Act, data privacy requirements, labor laws and anti-competition regulations; |
• | export or import restrictions; |
• | various reimbursement and insurance regimes; |
• | laws and business practices favoring local companies; |
• | longer payment cycles and difficulties in enforcing agreements and collecting receivables through certain foreign legal systems; |
• | political and economic instability, such as the exit of the United Kingdom from the European Union; |
• | global health pandemics, such as the coronavirus in China and its spread to other countries; |
• | potentially adverse tax consequences, tariffs, customs charges, bureaucratic requirements and other trade barriers; |
• | difficulties and costs of staffing and managing foreign operations; and |
• | difficulties protecting or procuring intellectual property rights. |
As we expand internationally, our results of operations and cash flows will become increasingly subject to fluctuations due to changes in foreign currency exchange rates. Historically, most of our revenue has been denominated in U.S. dollars, although we have sold our products and services in local currency outside of the United States, principally the Euro. Our expenses are generally denominated in the currencies of the countries in which our operations are located, which is primarily in the United States. As our operations in countries outside of the United States grow, our results of operations and cash flows will increasingly be subject to fluctuations due to changes in foreign currency exchange rates, which could harm our business in the future. For example, if the value of the U.S. dollar increases relative to foreign currencies, our product and service revenue could be adversely affected as we convert revenue from local currencies to U.S. dollars. Similarly, a strong U.S. dollar relative to the local currencies of our international customers can potentially reduce demand for our products, which may compound the adverse effect of foreign exchange translation on our revenue. If we dedicate significant resources to our international operations and are unable to manage these risks effectively, our business, operating results and prospects will suffer.
We face risks related to health epidemics and other outbreaks, which could significantly disrupt our operations and could have a material adverse impact on us.
Our business could be adversely impacted by the effects of the coronavirus, or COVID-19, outbreak originating in China, or by other epidemics. If the coronavirus worsens in China, or in other regions in which we have material operations or sales, such as the United States or the European Union, our business activities originating from affected areas, including sales, manufacturing and supply chain related activities, could be adversely affected. Disruptive activities could include the temporary closure of our manufacturing facilities and those used in our supply chain processes, restrictions on the export or shipment of our products, significant cutback of ocean container delivery from China, business closures in impacted areas, and restrictions on our employees’ and other service providers’ ability to travel, to meet with customers and install and train customers on our systems. For example, we recently rescheduled an industry conference from China to Thailand, due to the travel limitations imposed by certain governments and other organizations. The extent to which COVID-19 impacts our results will depend on future developments, which are highly uncertain and cannot be predicted, including new information which may emerge concerning the severity of the virus and the actions to contain it or treat its impact, among others.
Significant United Kingdom or European developments stemming from the United Kingdom’s withdrawal from the European Union could have a material adverse effect on us.
In June 2016, the United Kingdom held a referendum and voted in favor of leaving the European Union, and in March 2017, the government of the United Kingdom formally initiated the withdrawal process. After several delays and another referendum in 2019, the United Kingdom exited from the European Union, on January 31, 2020. There will be a transition period until December 31, 2020 (which may be extended once for up to two years) for the United Kingdom to negotiate a trade deal with the European Union. Negotiations related to Brexit have created political and economic uncertainty, particularly in the United Kingdom and the European Union, and this uncertainty may last for several more years. Our business in the United Kingdom, the European Union, and worldwide could be affected during this period of uncertainty, and perhaps longer, by the impact of the United Kingdom’s withdrawal. There are many ways in which our business could be affected, only some of which we can identify as of the date of this report.
The decision of the United Kingdom to withdraw from the European Union has caused and, along with events that could occur in the future as a consequence of the United Kingdom’s withdrawal may continue to cause significant volatility in global financial markets, including in global currency and debt markets. This volatility could cause a slowdown in economic activity in the United Kingdom, Europe or globally, which could adversely affect our operating results and growth prospects. In
-26-
addition, our business could be negatively affected by new trade agreements or data transfer agreements between the United Kingdom and other countries, including the United States, and by the possible imposition of trade or other regulatory and immigration barriers in the United Kingdom. In addition, the Europe-wide market authorization framework for our products (and for the drugs sold by our collaboration partners in the pharmaceutical industry) and access to European Union research funding by research scientists based in the United Kingdom may also change and may also result in a slowdown in spending on research tools like our systems. Furthermore, we currently operate in Europe through a subsidiary based in the United Kingdom, which provides us with certain operational, tax and other benefits, as well as through other subsidiaries in Europe. The United Kingdom’s withdrawal from the European Union could adversely affect our ability to realize those benefits and we may incur costs and suffer disruptions in our European operations as a result. These possible negative impacts, and others resulting from the United Kingdom’s actual or threatened withdrawal from the European Union, may adversely affect our operating results and growth prospects.
We could be subject to additional income tax liabilities.
We are subject to income taxes in the United States and numerous foreign jurisdictions. Significant judgment is required in evaluating our worldwide provision for income taxes. During the ordinary course of business, there are many transactions for which the ultimate tax determination is uncertain. For example, our effective tax rates could be adversely affected by earnings being lower than anticipated in countries where we have lower statutory rates and higher than anticipated in countries where we have higher statutory rates, by changes in foreign currency exchange rates, by changes in the valuation of our deferred tax assets and liabilities, or by changes in the relevant tax, accounting and other laws, regulations, principles and interpretations. We are subject to audit in various jurisdictions, and such jurisdictions may assess additional income tax against us. Although we believe our tax estimates are reasonable, the final determination of tax audits and any related litigation could be materially different from our historical income tax provisions and accruals. The results of an audit or litigation could have a material effect on our operating results or cash flows in the period or periods for which that determination is made.
Changes in tax laws or regulations that are applied adversely to us or our customers may have a material adverse effect on our business, cash flow, financial condition or results of operations.
New income, sales, use or other tax laws, statutes, rules, regulations or ordinances could be enacted at any time, which could affect the tax treatment of our domestic and foreign earnings. Any new taxes could adversely affect our domestic and international business operations, and our business and financial performance. Further, existing tax laws, statutes, rules, regulations or ordinances could be interpreted, changed, modified or applied adversely to us. For example, the legislation commonly known as the Tax Cut & Jobs Act, which was signed into law on December 22, 2017, significantly revised the Internal Revenue Code of 1986, as amended, or the Code. The federal income tax law, among other things, contains significant changes to corporate taxation, including a reduction of the federal statutory rates from a top marginal rate of 35% to a flat rate of 21%, the transition of U.S. international taxation from a worldwide tax system to a territorial system, one time taxation of offshore earnings at reduced rates regardless of whether they are repatriated, and modifying or repealing many business deductions and credits. We have accounted for such changes in accordance with our understanding of the Tax Cut & Jobs Act and guidance available as of the date of this filing as described in more detail in our financial statements. We will continue to monitor and assess the impact of the federal legislation on our business and the extent to which various states conform to the newly enacted federal tax law. Any further changes in tax laws or regulations that are applied adversely to us or our customers could have a material adverse effect on our business, cash flow, financial condition or results of operations.
Our ability to use net operating losses to offset future taxable income may be subject to certain limitations.
As of December 31, 2019, we had federal net operating loss carryforwards, or NOLs, to offset future taxable income of approximately $317.4 million. The federal NOL carryforwards generated during and after fiscal 2018 totaling $83.5 million are carried forward indefinitely, while all others, if not utilized, will expire in various years beginning in 2025. A lack of future taxable income would adversely affect our ability to utilize these NOLs. In addition, under Section 382 of the Code, a corporation that undergoes an “ownership change” is subject to limitations on its ability to utilize its NOLs to offset future taxable income. We may have already experienced one or more ownership changes. Depending on the timing of any future utilization of our carryforwards, we may be limited as to the amount that can be utilized each year as a result of such previous ownership changes. However, we do not believe such limitations will cause our NOL and credit carryforwards to expire unutilized. In addition, future changes in our stock ownership as well as other changes that may be outside of our control, could result in additional ownership changes under Section 382 of the Code. Our NOLs may also be impaired under similar provisions of state law or limited pursuant to provisions of the Tax Cut and Jobs Act amendments to the Code. We have recorded a full valuation allowance related to our NOLs and other deferred tax assets due to the uncertainty of the ultimate realization of the future benefits of those assets.
-27-
Provisions of our debt instruments may restrict our ability to pursue our business strategies.
Our term loan agreement with CR Group L.P. and revolving credit facility with Silicon Valley Bank require us, and any debt instruments we may enter into in the future may require us, to comply with various covenants that limit our ability to, among other things:
• | dispose of assets; |
• | complete mergers or acquisitions; |
• | incur indebtedness; |
• | encumber assets; |
• | pay dividends or make other distributions to holders of our capital stock; |
• | make specified investments; |
• | engage in any new line of business; and |
• | engage in certain transactions with our affiliates. |
These restrictions could inhibit our ability to pursue our business strategies. In addition, we are subject to financial covenants based on total revenue and minimum cash balances. If we default under our term loan agreement or revolving credit facility, and such event of default is not cured or waived, the lenders could terminate commitments to lend and cause all amounts outstanding with respect to the debt to be due and payable immediately, which in turn could result in cross defaults under other debt instruments. Our assets and cash flow may not be sufficient to fully repay borrowings under all of our outstanding debt instruments if some or all of these instruments are accelerated upon a default. We may incur additional indebtedness in the future. The debt instruments governing such indebtedness could contain provisions that are as, or more, restrictive than our existing debt instruments. If we are unable to repay, refinance or restructure our indebtedness when payment is due, the lenders could proceed against the collateral granted to them to secure such indebtedness or force us into bankruptcy or liquidation.
Acquisitions or joint ventures could disrupt our business, cause dilution to our stockholders and otherwise harm our business.
We may acquire other businesses, products or technologies as well as pursue strategic alliances, joint ventures, technology licenses or investments in complementary businesses. We have not made any acquisitions to date, and our ability to do so successfully is unproven. Any of these transactions could be material to our financial condition and operating results and expose us to many risks, including:
• | disruption in our relationships with customers, distributors or suppliers as a result of such a transaction; |
• | unanticipated liabilities related to acquired companies; |
• | difficulties integrating acquired personnel, technologies and operations into our existing business; |
• | diversion of management time and focus from operating our business; |
• | increases in our expenses and reductions in our cash available for operations and other uses; and |
• | possible write-offs or impairment charges relating to acquired businesses. |
Foreign acquisitions involve unique risks in addition to those mentioned above, including those related to integration of operations across different cultures and languages, currency risks and the particular economic, political and regulatory risks associated with specific countries.
Also, the anticipated benefit of any strategic transaction may not materialize. Future acquisitions could result in potentially dilutive issuances of our equity securities, the incurrence of debt, contingent liabilities or amortization expenses or write-offs of goodwill, any of which could harm our financial condition. We cannot predict the number, timing or size of future joint ventures or acquisitions, or the effect that any such transactions might have on our operating results.
If we are unable to recruit, train and retain key personnel, we may not achieve our goals.
Our future success depends on our ability to recruit, train, retain and motivate key personnel, including our senior management, research and development, manufacturing and sales and marketing personnel. Competition for qualified personnel is intense, particularly in the Seattle, Washington area. Our growth depends, in particular, on attracting, retaining and motivating highly-trained sales personnel with the necessary scientific background and ability to understand our systems at a technical level to effectively identify and sell to potential new customers. We do not maintain fixed term employment contracts or key man life insurance with any of our employees. Because of the complex and technical nature of our products and the dynamic market in which we compete, any failure to attract, train, retain and motivate qualified personnel could materially harm our operating results and growth prospects.
-28-
Undetected errors or defects in our products could harm our reputation, decrease market acceptance of our products or expose us to product liability claims.
Our products may contain undetected errors or defects when first introduced or as new versions are released. Disruptions or other performance problems with our products may damage our customers’ businesses, harm our reputation and result in reduced revenues. If that occurs, we may also incur significant costs, the attention of our key personnel could be diverted, or other significant customer relations problems may arise. We may also be subject to warranty and liability claims for damages related to errors or defects in our products. A material liability claim or other occurrence that harms our reputation or decreases market acceptance of our products could adversely impact our business and operating results.
The sale and use of products or services based on our technologies, or activities related to our research, could lead to the filing of product liability claims if someone were to allege that one of our products contained a design or manufacturing defect which resulted in the failure to adequately perform the analysis for which it was designed. A product liability claim could result in substantial damages and be costly and time consuming to defend, either of which could materially harm our business or financial condition. We cannot assure investors that our product liability insurance would adequately protect our assets from the financial impact of defending a product liability claim. Any product liability claim brought against us, with or without merit, could increase our product liability insurance rates or prevent us from securing insurance coverage in the future.
We face risks related to handling of hazardous materials and other regulations governing environmental safety.
Our operations are subject to complex and stringent environmental, health, safety and other governmental laws and regulations that both public officials and private individuals may seek to enforce. Our activities that are subject to these regulations include, among other things, our use of hazardous materials in manufacturing and in our products, and the generation, transportation and storage of waste. We could discover that we, an acquired business or our suppliers are not in material compliance with these regulations. For example, our products must be compliant with an EU regulation, Delegated Directive (EU) 2015/863, or RoHS3, which expands the list of prohibited substances from six to ten by adding four new types of phthalates. If our only products are not compliant by the deadlines as determined by RoHS3, we may be unable to ship our products into the EU market and our results of operations may suffer. Existing laws and regulations may also be revised or reinterpreted, or new laws and regulations may become applicable to us, whether retroactively or prospectively, that may have a negative effect on our business and results of operations. It is also impossible to eliminate completely the risk of accidental environmental contamination or injury to individuals. In such an event, we could be liable for any damages that result, which could adversely affect our business.
If we experience a significant disruption in our information technology systems or breaches of data security, our business could be adversely affected.
We rely on information technology systems to keep financial records, manage our manufacturing operations, fulfill customer orders, capture laboratory data, maintain corporate records, communicate with staff and external parties and operate other critical functions. Our information technology systems, and those of our vendors, are potentially vulnerable to disruption due to breakdown, malicious intrusion and computer viruses or other disruptive events including but not limited to natural disaster. If we were to experience a prolonged system disruption in our information technology systems or those of certain of our vendors, it could negatively impact our ability to serve our customers, which could adversely impact our business. Although we maintain offsite back-ups of our data, if operations at our facilities were disrupted, it may cause a material disruption in our business if we are not capable of restoring function on an acceptable timeframe. In addition, our information technology systems, and those of our vendors, are potentially vulnerable to data security breaches — whether by employees or others — which may expose sensitive data to unauthorized persons. Such data security breaches, whether resulting from hacking, social engineering, phishing, or other causes could lead to the loss of confidential information, trade secrets or other intellectual property, or could lead to unauthorized access to or acquisition of, or the public exposure of, personal information (including sensitive personal information) of our employees, customers and others, any of which could have a material adverse effect on our business, reputation, financial condition and results of operations. In addition, any such access, disclosure or other loss of information could result in legal claims, investigations or proceedings by governmental entities or private parties, adverse publicity and harm to our reputation, loss of business, and liability under laws or regulations, including state data protection regulations and the E.U. General Data Protection Regulation, or GDPR, and other regulations, the breach of which could result in significant penalties. In addition, these breaches and other inappropriate access can be difficult to detect, and any delay in identifying them may lead to increased harm of the type described above. We expect to continue to expend significant resources to protect against security breaches, and could be required to expend significant amounts to remediate and otherwise respond to security breaches, including in connection with making notifications to customers or other persons or implementing additional security measures.
Although we maintain insurance that may cover certain liabilities in connection with a security breach or other security incident, we cannot be certain our insurance coverage will be adequate for liabilities actually incurred, that insurance
-29-
will continue to be available to us on commercially reasonable terms, or at all, or that any insurer will not deny coverage as to any future claim. The successful assertion of one or more large claims against us that exceed available insurance coverage, or the occurrence of changes in our insurance policies, including premium increases or the imposition of large deductible or co-insurance requirements, could have a material adverse effect on our business, including our financial condition, results of operations and reputation.
We intend to seek strategic collaborations and partnerships and other transactions, which may result in the use of a significant amount of our management resources or significant costs, and we may not be able to fully realize the potential benefit of such transactions.
We intend to seek strategic collaborations, partnerships and other transactions to support the continued growth of our company. However, there is no assurance that we will be successful in doing so. Accordingly, we may be engaged in evaluating potential transactions including, without limitation, strategic partnerships, divestitures of existing businesses or assets, a merger or consolidation with a third party that results in a change in control, a sale or transfer of all or a significant portion of our assets or a purchase by a third party of our securities that may result in a minority or control investment by such third party. From time to time, we may engage in discussions that may result in one or more transactions. Although there would be uncertainty that any of these discussions would result in definitive agreements or the completion of any transaction, we may devote a significant amount of our management resources to such a transaction, which could negatively impact our operations. In addition, we may incur significant costs in connection with seeking strategic transactions regardless of whether the transaction is completed. In the event that we consummate a strategic collaboration, partnership or other transaction in the future, we cannot assure you that we would fully realize the potential benefit of such a transaction or that the market would not have an adverse reaction to any such transaction. The failure to fully realize the potential benefit of such a transaction, adverse market reaction to any such transaction and any other issues we may encounter in connection with the consummation of any such transaction could adversely affect our future financial results or negatively impact the value of stockholders’ investment in us.
For example, in December 2019, we entered into a LAPA, with Veracyte, pursuant to which we granted to Veracyte an exclusive worldwide license to our nCounter FLEX Analysis System, or the FLEX System, for in vitro diagnostic use and for the development and commercialization of in vitro diagnostic tests, including in vitro diagnostic devices, or IVDs, or laboratory developed tests, or LDTs, for use on the FLEX System and sold to Veracyte certain assets, including our rights with respect to the Prosigna Breast Cancer Prognostic Gene Signature Assay, the LymphMark Lymphoma Subtyping Test and the assay software modules that operate together with the FLEX System. For additional information regarding our transaction with Veracyte please see Part I, Item 1. “Business — License Agreement — Veracyte, Inc.”. We cannot be certain that we will realize the anticipated benefits from our transaction with Veracyte and the disposition of certain of our assets pursuant to the LAPA may have a detrimental impact on our business on a go-forward basis. Furthermore, transactions such as our agreement with Veracyte can be disruptive to our retained operations, divert management’s attention from day-to-day operations and potentially increase employee attrition.
Our strategy to seek to enter into strategic collaborations, licensing arrangements and other transactions with third parties to develop products may not be successful.
We have relied, and expect to continue to rely, on strategic collaborations and licensing agreements with third parties for discoveries based on products which we develop. For example, in connection with our collaboration with Merck to develop a companion diagnostic test and the subsequent termination of the collaboration agreement, Merck granted to us a non-exclusive license to certain intellectual property that relates to Merck’s tumor inflammation signature. We intend to enter into more such arrangements with our research customers and other researchers, including biopharmaceutical companies and research institutions, for development of future products. However, there is no assurance that we will be successful in doing so. Establishing collaborations and licensing arrangements is difficult and time-consuming. Discussions may not lead to collaborations or licenses on favorable terms, if at all. To the extent we agree to work exclusively with a party in a given area, our opportunities to collaborate with others could be limited. Certain parties may seek to partner with companies in addition to us in connection with a project. This, in turn, may limit the commercial potential of any products that are the subject of such collaborations. Potential collaborators or licensors may elect not to work with us based upon their assessment of our financial, regulatory, commercial or intellectual property position. In particular, our customers are not obligated to collaborate with us or license technology to us, and they may choose to develop products themselves or collaborate with our competitors.
New product development involves a lengthy and complex process, and we may be unable to commercialize on a timely basis, or at all, any of the products we develop individually or with our collaborators.
Few research and development projects result in successful commercial products. At any point, we may abandon development of a product candidate, which would adversely impact potential revenue and our expenses. In addition, any delay in product development would provide others with additional time to commercialize competing products before we do, which in turn may adversely affect our growth prospects and operating results. In addition, the success of the development programs
-30-
for any product candidates or assays developed in collaboration with others will be dependent on the continued pursuit and success of the related drug trials by our collaborators.
In August 2017, we entered into a collaboration agreement with Lam Research Corporation, or Lam, with respect to the development and commercialization of our Hyb & Seq platform and related assays. Pursuant to the terms of the collaboration agreement, Lam contributed $50.0 million for allowable development costs; however, completing development of our Hyb & Seq platform will require funding beyond Lam’s contribution. We are pursuing partnerships that can support our emerging commercial strategy for Hyb & Seq, but it is uncertain whether these efforts will be successful. Ultimately the development may not be successful, which could negatively impact our prospects for future revenue growth. Although we expect such collaborations to provide funding to cover our costs of development, the failure, discontinuation or modification of these development efforts could negatively impact our ability to attract new collaboration partners, and would reduce our prospects for introducing new products, revenue growth, and future operating results.
The life sciences research market is highly competitive. If we fail to compete effectively, our business and operating results will suffer.
We face significant competition in the life sciences research market. We currently compete with both established and early stage life sciences research companies that design, manufacture and market instruments and consumables for gene expression analysis, single-cell analysis, polymerase chain reaction, or PCR, digital PCR, other nucleic acid detection and additional applications. These companies use well-established laboratory techniques such as microarrays or quantitative PCR as well as newer technologies such as next generation sequencing such as RNA-sequencing. We believe our principal competitors in the life sciences research and diagnostic markets are Agilent Technologies, Akoya Biosciences, Becton-Dickinson, Bio-Rad, Bio-Techne, Fluidigm, HTG Molecular Diagnostics, Illumina, Luminex, Merck Millipore, O-Link, Perkin Elmer, Qiagen, Roche Applied Science, Thermo Fisher Scientific and 10x Genomics. In addition, there are a number of new market entrants in the process of developing novel technologies for the life sciences market, including those that may compete with GeoMx DSP.
Many of our current competitors are large publicly-traded companies, or are divisions of large publicly-traded companies, and may enjoy a number of competitive advantages over us, including:
• | greater name and brand recognition, financial and human resources; |
• | broader product lines; |
• | larger sales forces and more established distributor networks; |
• | substantial intellectual property portfolios; |
• | larger and more established customer bases and relationships; and |
• | better established, larger scale, and lower cost manufacturing capabilities. |
We believe that the principal competitive factors in all of our target markets include:
• | cost of capital equipment; |
• | cost of consumables and supplies; |
• | reputation among customers; |
• | innovation in product offerings; |
• | flexibility and ease-of-use; |
• | accuracy and reproducibility of results; and |
• | compatibility with existing laboratory processes, tools and methods. |
We cannot assure investors that our products will compete favorably or that we will be successful in the face of increasing competition from new products and technologies introduced by our existing competitors or new companies entering our markets. In addition, we cannot assure investors that our competitors do not have or will not develop products or technologies that currently or in the future will enable them to produce competitive products with greater capabilities or at lower costs than ours. For example, certain of our customers have shifted certain types of experiments that previously had been performed on our nCounter system to RNA-sequencing technology. Although we are pursuing several strategies to mitigate this trend, there can be no assurance we will be successful in doing so. Any failure to compete effectively could materially and adversely affect our business, financial condition and operating results.
-31-
Risks Related to Government Regulation
Our “Research Use Only” products for the research, life sciences market could become subject to more stringent regulatory surveillance as medical devices by the FDA or other regulatory agencies in the future which could increase our costs and delay our commercialization efforts, thereby materially and adversely affecting our business and results of operations.
In the United States, most of our products are currently labeled and sold for Research Use Only, or RUO, and not for the diagnosis or treatment of disease, and are sold to pharmaceutical and biotechnology companies, academic and government institutions and research laboratories. Because such products are not intended for diagnostic use, and the products do not include clinical or diagnostic claims or provide directions for use as diagnostic products, they are not subject to the same level of regulation by the Food and Drug Administration, or FDA, as medical devices. In particular, while the FDA regulations require that RUO products be appropriately labeled, “For Research Use Only. Not for Use in Diagnostic Procedures,” the regulations do not subject such products to the FDA’s pre- and post-market controls for medical devices. Pursuant to FDA guidance on RUO products, a company may not make clinical or diagnostic claims about an RUO product or provide clinical directions or clinical support services to customers for RUO products, or engage in distribution or sales practices that are not consistent with the RUO labeling. If the FDA were to modify its approach to regulating products labeled for Research Use Only, compliance with these additional regulations could reduce our revenue or increase our costs and adversely affect our business, prospects, results of operations or financial condition. If FDA determines that our sales or distribution practices are not consistent with the RUO labeling, FDA may take an adverse administrative or enforcement action against us, which could materially harm our business. In the event that the FDA requires marketing authorization of our RUO products in the future, there can be no assurance that the FDA will ultimately grant any clearance or approval requested by us in a timely manner, or at all.
In addition, we sell dual-use instruments with software that has both FDA-cleared functions, and research functions for which FDA approval or clearance is not required. Dual-use instruments are subject to FDA regulation since they are intended, at least in part, for use by customers performing clinical diagnostic testing. In November 2014, the FDA issued a guidance document that described FDA’s approach to regulating molecular diagnostic instruments that combine both approved/cleared device functions and research functions for which approval/clearance is not required. There is a risk that the requirements for dual-use instruments could change causing additional costs and delays for development of these products. For example, there could be enforcement action if the FDA determines that approval or clearance was required for those functions for which FDA approval or clearance has not been obtained, or the instruments are being promoted for off-label use. There is also a risk that the FDA could broaden its current regulatory enforcement of dual-use instruments through additional FDA oversight of such products or impose additional requirements upon such products. In July 2017, FDA adopted a new regulation exempting certain clinical multiplex test systems, like the ones used with the Prosigna assay that we supply to Veracyte, from premarket notification requirements. However, these regulations will not impact the FDA clearance requirements for our nCounter Dx Analysis System which will still require 510(k) clearance for use with specific assays, such as Prosigna.
Our nCounter reagents may be used by clinical laboratories to create Laboratory-Developed Tests (LDTs), which could, in the future, be the subject of additional FDA regulation as medical devices, which could materially and adversely affect our business and results of operations.
A clinical laboratory can use our custom-manufactured reagents to create what is called a Laboratory Developed Test, or LDT. LDTs, according to the FDA, are diagnostic tests that are developed, validated and performed by a single laboratory and include genetic tests. Historically, FDA has generally exercised enforcement discretion for LDTs. In October 2014, the FDA issued draft guidance documents proposing the use of a risk-based approach to regulating LDTs. Any restrictions on LDTs by the FDA could decrease demand for our reagents. Additionally, compliance with additional regulatory burdens could be time consuming and costly for our customers. While FDA announced in November 2016 that it did not intend to finalize the draft LDT guidance documents, FDA could alter its position or question a particular LDT that a laboratory is providing, or Congress could enact legislation that could result in FDA regulation of LDTs. To date, draft legislative proposals have been discussed, but no legislation has been formally introduced. If FDA changed its policy or position, or if legislation were enacted, it could adversely affect demand for these specialized reagents or our instruments. Further, we may be required to obtain premarket clearance or approval before we can continue to sell our products to certain customers.
Our nCounter reagents allow users to design and validate their own customized assays using standard sets of barcodes provided by us with the laboratories’ choice of oligonucleotide probes. These reagents may be used by laboratories in conjunction with analyte-specific reagents and general purpose reagents to create diagnostic tests or test systems validated within the accredited testing laboratory.
-32-
We are subject to ongoing and extensive regulatory requirements, and our failure to comply with these requirements could substantially harm our business.
Certain of our products are regulated as in vitro diagnostic medical devices, including the nCounter FLEX Analysis System. Accordingly, we and certain of our contract manufacturers are subject to ongoing International Organization for Standardization, or ISO, obligations as well as regulation by the FDA, state regulatory authorities, and other comparable national and local health authorities. These may include routine inspections by Notified Bodies, FDA, and other health authorities, of our manufacturing facilities and our records for compliance with requirements such as ISO 13485 and QSR which establish extensive requirements for quality assurance and control as well as manufacturing and change control procedures, among other things. We are also subject to other regulatory obligations, such as requirements pertaining to the registration of our manufacturing facilities and the listing of our devices with the FDA; continued adverse event and malfunction reporting; reporting certain corrections and removals; and labeling and promotional requirements. Other agencies may also issue guidelines and regulations that could impact the development of our products. The final form of the European Medical Device Regulation (MDR), which will replace Europe’s Medical Device Directive (MDD), becomes effective on May 25, 2020. On May 25, 2017, the European Union adopted the IVD Directive Regulation, which increases the regulatory requirements applicable to in vitro diagnostics in the EU and would require that we re-classify and obtain approval, registration, or clearance for our existing CE-marked IVD products, including our nCounter FLEX system, within a five-year grace period (by May 25, 2022).
We may also be subject to additional FDA or global regulatory authority post-marketing obligations or requirements by the FDA or global regulatory authority to change our current product classifications which would impose additional regulatory obligations on us. If we are not able to maintain regulatory compliance, we may not be permitted to market our medical device products and/or may be subject to enforcement by EU Competent Authorities and the FDA and other global regulatory authority such as the issuance of warning or untitled letters, fines, injunctions, and civil penalties; recall or seizure of products; operating restrictions; and criminal prosecution. In addition, we may be subject to similar regulatory regimes of foreign jurisdictions as we continue to commercialize our products in new markets outside of the United States and Europe. Adverse Notified Body, EU Competent Authority or FDA or global regulatory authority action in any of these areas could significantly increase our expenses and limit our revenue and profitability and cause reputational harm.
We may be subject, directly or indirectly, to healthcare fraud and abuse laws and other laws applicable to our marketing practices. If we are unable to comply, or have not complied, with such laws, we could face substantial penalties.
Our operations are directly, or indirectly through our customers, subject to various fraud and abuse laws, including, without limitation, the federal and state anti-kickback statutes and state, and federal and foreign marketing compliance laws. These laws may impact, among other things, our proposed sales and marketing and education programs and require us to implement additional internal systems for tracking certain marketing expenditures and reporting them to government authorities. In addition, we may be subject to laws and regulations relating to privacy and data protection by both the federal government and the states in which we conduct our business as well as by foreign governments and entities. The laws that may affect our ability to operate include, but are not limited to:
• | the federal Anti-kickback Statute and state equivalents; |
• | the federal physician self-referral prohibition, commonly known as the Stark Law, and state equivalents; |
• | the federal Health Insurance Portability and Accountability Act of 1996, as amended, commonly known as HIPAA; |
• | the Medicare civil money penalty laws and exclusion requirements; |
• | the federal False Claims Act and state equivalents; |
• | the Physician Payments Sunshine Act; |
• | state, federal and foreign marketing expenditure disclosure laws; |
• | state privacy laws, such as the California Consumer Privacy Act; |
• | the Foreign Corrupt Practices Act, which applies to our international activities; and |
• | the European Union’s General Data Protection Regulation. |
The laws, rules and regulations relating to privacy or data protection to which we may be subject, or that otherwise apply to our business, are constantly evolving, and we expect that there will continue to be new proposed laws, regulations and industry standards concerning these matters in the United States, the EU and other jurisdictions. If our operations are found to be in violation of any of the laws or regulations described above or others that apply to us, or to which we become subject in the future, we may be subject to penalties, including civil and criminal penalties, damages, fines and the curtailment or restructuring of our operations, any of which could adversely affect our ability to operate our business and our results of operations.
-33-
Healthcare policy changes, including legislation reforming the United States healthcare system, may have a material adverse effect on our financial condition and results of operations.
The Patient Protection and Affordable Care Act, as amended by the Health Care and Education Reconciliation Act, collectively, the ACA, enacted in March 2010, made changes that significantly impact the pharmaceutical and medical device industries and clinical laboratories. For example, beginning in 2013, each medical device manufacturer must pay a sales tax in an amount equal to 2.3% of the price for which such manufacturer sells its medical devices. In December 2015, Congress passed a two-year suspension of the medical device tax from January 1, 2016 to December 31, 2017. The tax applies to our listed medical device products, which include the nCounter Dx Analysis System. In December 2019, this excise tax was permanently repealed for medical device sales, effective after December 31, 2019. The Budget Control Act of 2011 contained automatic spending cuts to the federal budget known as sequestration. As a result of sequestration, Medicare payments are reduced by 2% per year. These or any future proposed or mandated reductions in payments may indirectly reduce demand for our products.
Other significant measures contained in the ACA include coordination and promotion of research on comparative clinical effectiveness of different technologies and procedures, initiatives to revise Medicare payment methodologies, such as bundling of payments across the continuum of care by providers and physicians, and initiatives to promote quality indicators in payment methodologies. The ACA also included significant new fraud and abuse measures, including required disclosures of financial arrangements with physician customers, lower thresholds for violations and increased potential penalties for such violations.
On December 18, 2019, the U.S. Court of Appeals for the 5th Circuit upheld the District Court ruling that the individual mandate was unconstitutional and remanded the case to the District Court to determine whether the remaining provisions of the ACA are invalid. We cannot predict whether future healthcare initiatives, including efforts to repeal and replace the ACA in whole or in part, will be implemented at the federal or state level or in countries outside of the United States in which we may do business, or the effect any future legislation, regulation, court decisions, subsequent appeals, and other efforts will have on us. Changes in the United States healthcare industry may result in decreased profits to us, which may adversely affect our business, financial condition and results of operations.
Risks Related to Intellectual Property
If we are unable to protect our intellectual property effectively, our business would be harmed.
We rely on patent protection as well as trademark, copyright, trade secret and other intellectual property rights protection and contractual restrictions to protect our proprietary technologies, all of which provide limited protection and may not adequately protect our rights or permit us to gain or keep any competitive advantage. As of December 31, 2019, we owned or licensed 32 issued U.S. patents and approximately 27 pending U.S. patent applications, including provisional and non-provisional filings. We also owned or licensed approximately 290 pending and granted counterpart applications worldwide, including 139 country-specific validations of 16 European patents. We continue to file new patent applications to protect the full range of our technologies. If we fail to protect our intellectual property, third parties may be able to compete more effectively against us and we may incur substantial litigation costs in our attempts to recover or restrict use of our intellectual property.
Our success depends in part on obtaining patent protection for our products and processes, preserving trade secrets, patents, copyrights and trademarks, operating without infringing the proprietary rights of third parties, and acquiring licenses for technology or products. We cannot assure investors that any of our currently pending or future patent applications will result in issued patents, and we cannot predict how long it will take for such patents to be issued. As the patent and prior art landscape for translational research products grows more crowded and becomes more complex we may find it more difficult to obtain patent protection for our products including those related to digital spatial profiling and sequencing, for example. Our existing patents and any future patents we obtain may not be sufficiently broad to prevent others from practicing our technologies or from developing competing products and may therefore fail to provide us with any competitive advantage. Additionally, we cannot assure investors that our currently pending or future patent applications have or will be filed in all of our potential markets. Further, we cannot assure investors that other parties will not challenge any patents issued to us or that courts or regulatory agencies will hold our patents to be valid or enforceable. We cannot guarantee investors that we will be successful in defending challenges made against our patents and patent applications. Any successful third-party challenge to our patents could result in the third party or the unenforceability or invalidity of such patents and could deprive us of the ability to prevent others from using the technologies claimed in such issued patents.
The patent positions of life sciences companies can be highly uncertain and involve complex legal and factual questions for which important legal principles remain unresolved. No consistent policy regarding the breadth of claims allowed in such companies’ patents has emerged to date in the United States. Furthermore, in the biotechnology field, courts frequently
-34-
render opinions that may affect the patentability of certain inventions or discoveries, including opinions that may affect the patentability of methods for analyzing or comparing biological macromolecules including nucleic acids, such as DNA and RNA, and proteins.
In particular, the patent positions of companies engaged in development and commercialization of genomic diagnostic tests, like Prosigna, are particularly uncertain. Various courts, including the U.S. Supreme Court, have rendered decisions that impact the scope of patentability of certain inventions or discoveries relating to genomic diagnostics. Specifically, these decisions stand for the proposition that patent claims that recite laws of nature (for example, the relationships between gene expression levels and the likelihood of risk of recurrence of cancer) are not themselves patentable unless those patent claims have sufficient additional features that provide practical assurance that the processes are genuine inventive applications of those laws rather than patent drafting efforts designed to monopolize the law of nature itself. What constitutes a “sufficient” additional feature is uncertain. Furthermore, in view of these decisions, in December 2014 the U.S. Patent and Trademark Office, or USPTO, published revised guidelines for patent examiners to apply when examining process claims for patent eligibility. This guidance was updated by the USPTO in July 2015 and additional illustrative examples provided in May 2016. The USPTO provided additional guidance on examination procedures pertaining to subject matter eligibility in April 2018 and June 2018. The guidance indicates that claims directed to a law of nature, a natural phenomenon, or an abstract idea that do not meet the eligibility requirements should be rejected as non‑statutory, patent ineligible subject matter; however, method of treatment claims that practically apply natural relationships should be considered patent eligible. We cannot assure you that our patent portfolio will not be negatively impacted by the current uncertain state of the law, new court rulings or changes in guidance or procedures issued by the USPTO. From time to time, the U.S. Supreme Court, other federal courts, the U.S. Congress or the USPTO may change the standards of patentability and validity of patents within the genomic diagnostic space, and any such changes could have a negative impact on our business.
The laws of some non-U.S. countries do not protect intellectual property rights to the same extent as the laws of the United States, and many companies have encountered significant problems in protecting and defending such rights in foreign jurisdictions. The legal systems of certain countries, particularly certain developing countries, do not favor the enforcement of patents and other intellectual property protection, particularly those relating to biotechnology, which could make it difficult for us to stop the infringement of our patents. Proceedings to enforce our patent rights in foreign jurisdictions could result in substantial cost and divert our efforts and attention from other aspects of our business.
Changes in either the patent laws or in interpretations of patent laws in the United States or other countries may diminish the value of our intellectual property. We cannot predict the breadth of claims that may be allowed or enforced in our patents or in third-party patents. For example:
• | We might not have been the first to make the inventions covered by each of our pending patent applications. |
• | We might not have been the first to file patent applications for these inventions. |
• | Others may independently develop similar or alternative products and technologies or duplicate any of our products and technologies. |
• | It is possible that our pending patent applications will not result in issued patents, and even if they issue as patents, they may not provide a basis for commercially viable products, may not provide us with any competitive advantages, or may be challenged and invalidated by third parties. |
• | We may not develop additional proprietary products and technologies that are patentable. |
• | The patents of others may have an adverse effect on our business. |
• | We apply for patents covering our products and technologies and uses thereof, as we deem appropriate. However, we may fail to apply for patents on important products and technologies in a timely fashion or at all. |
In addition to pursuing patents on our technology, we take steps to protect our intellectual property and proprietary technology by entering into confidentiality agreements and intellectual property assignment agreements with our employees, consultants, corporate partners and, when needed, our advisors. Such agreements may not be enforceable or may not provide meaningful protection for our trade secrets or other proprietary information in the event of unauthorized use or disclosure or other breaches of the agreements, and we may not be able to prevent such unauthorized disclosure. Monitoring unauthorized disclosure is difficult, and we do not know whether the steps we have taken to prevent such disclosure are, or will be, adequate. If we were to enforce a claim that a third party had illegally obtained and was using our trade secrets, it would be expensive and time consuming, and the outcome would be unpredictable. In addition, courts outside the United States may be less willing to protect trade secrets.
In addition, competitors could purchase our products and attempt to replicate some or all of the competitive advantages we derive from our development efforts, willfully infringe our intellectual property rights, design around our protected technology or develop their own competitive technologies that fall outside of our intellectual property rights. In
-35-
addition, competitors may develop their own versions of our technology in countries where we did not apply for patents, where our patents have not issued or where our intellectual property rights are not recognized and compete with us in those countries and markets. If our intellectual property is not adequately protected so as to protect our market against competitors’ products and methods, our competitive position could be adversely affected, as could our business.
We have not yet registered certain of our trademarks in all of our potential markets. If we apply to register these trademarks, our applications may not be allowed for registration, and our registered trademarks may not be maintained or enforced. In addition, opposition or cancellation proceedings may be filed against our trademark applications and registrations, and our trademarks may not survive such proceedings. If we do not secure registrations for our trademarks, we may encounter more difficulty in enforcing them against third parties than we otherwise would.
To the extent our intellectual property, including licensed intellectual property, offers inadequate protection, or is found to be invalid or unenforceable, we would be exposed to a greater risk of direct competition. If our intellectual property does not provide adequate protection against our competitors’ products, our competitive position could be adversely affected, as could our business. Both the patent application process and the process of managing patent disputes can be time consuming and expensive.
We depend on certain technologies that are licensed to us. We do not control these technologies and any loss of our rights to them could prevent us from selling our products.
We rely on licenses in order to be able to use various proprietary technologies including our core digital molecular barcoding technology licensed from the Institute for Systems Biology, technology relating to Prosigna licensed from Veracyte, intellectual property relating to a gene signature for lymphoma subtyping from the National Institutes of Health and intellectual property relating to the tumor inflammation signature from Merck. We do not own the patents that underlie these licenses. Our rights to use these technologies and employ the inventions claimed in the licensed patents are subject to the continuation of and compliance with the terms of those licenses.
We may need to license other technologies to commercialize future products. We may also need to negotiate licenses to patents and patent applications after launching any of our commercial products. Our business may suffer if the patents or patent applications are unavailable for license or if we are unable to enter into necessary licenses on acceptable terms.
In some cases, we do not control the prosecution, maintenance, or filing of the patents to which we hold licenses, or the enforcement of these patents against third parties. Some of our patents and patent applications were either acquired from another company who acquired those patents and patent applications from yet another company, or are licensed from a third party. Thus, these patents and patent applications are not written by us or our attorneys, and we did not have control over the drafting and prosecution. The former patent owners and our licensors might not have given the same attention to the drafting and prosecution of these patents and applications as we would have if we had been the owners of the patents and applications and had control over the drafting and prosecution. We cannot be certain that drafting or prosecution of the licensed patents and patent applications by the licensors have been or will be conducted in compliance with applicable laws and regulations or will result in valid and enforceable patents and other intellectual property rights.
Enforcement of our licensed patents or defense of any claims asserting the invalidity of these patents is often subject to the control or cooperation of our licensors. Certain of our licenses contain provisions that allow the licensor to terminate the license upon specific conditions. Therefore, our business may suffer if these licenses terminate, if the licensors fail to abide by the terms of the license or fail to prevent infringement by third parties or if the licensed patents or other rights are found to be invalid. Our rights under the licenses are subject to our continued compliance with the terms of the license, including the payment of royalties due under the license. Because of the complexity of our products and the patents we have licensed, determining the scope of the license and related royalty obligation can be difficult and can lead to disputes between us and the licensor. An unfavorable resolution of such a dispute could lead to an increase in the royalties payable pursuant to the license or termination of the license. If a licensor believed we were not paying the royalties due under the license or were otherwise not in compliance with the terms of the license, the licensor might attempt to revoke the license. If such an attempt were successful, we might be barred from producing and selling some or all of our products.
In addition, certain of the patents we have licensed relate to technology that was developed with U.S. government grants. Federal regulations impose certain domestic manufacturing requirements with respect to some of our products embodying these patents.
-36-
Involvement in lawsuits to protect or enforce our patents and proprietary rights, to determine the scope, coverage and validity of others’ proprietary rights, or to defend against third-party claims of intellectual property infringement, could be time-intensive and costly and may adversely impact our business or stock price.
We have received notices of claims of infringement and misappropriation or misuse of other parties’ proprietary rights in the past and may from time to time receive additional notices. Some of these claims have led and may lead to litigation. We cannot assure investors that we will prevail in such actions, or that other actions alleging misappropriation or misuse by us of third-party trade secrets, infringement by us of third-party patents and trademarks or other rights, or the validity of our patents, trademarks or other rights, will not be asserted or prosecuted against us.
Litigation may also be necessary for us to protect or enforce our patent and proprietary rights, defend against third-party claims or to determine the scope, coverage and validity of the proprietary rights of others. Litigation could result in substantial legal fees and could adversely affect the scope of our patent protection and reduce our ability to compete in the marketplace. The outcome of any litigation or other proceeding is inherently uncertain and might not be favorable to us. If we resort to legal proceedings to enforce our intellectual property rights or to determine the validity, scope and coverage of the intellectual property or other proprietary rights of others, the proceedings could be burdensome and expensive, even if we were to prevail. Any litigation that may be necessary in the future could result in substantial costs and diversion of resources and could have a material adverse effect on our business, operating results or financial condition.
Numerous significant intellectual property issues have been litigated, and will likely continue to be litigated, between existing and new participants in our existing and targeted markets. Our success depends in part on our non-infringement of the patents or proprietary rights of third parties. We develop complex products that integrate a wide range of technologies which may impact our ability to do so clear of third-party rights and therefore may need to license other technologies or challenge the scope, coverage and validity of the proprietary rights of others to commercialize future products. As we develop new technologies such as those related to digital spatial profiling and sequencing, for example, and move into new markets and applications for our products, we expect incumbent participants in such markets may assert their patents and other proprietary rights against us as part of a business strategy to slow our entry into such markets, impede our successful competition and/or extract substantial license and royalty payments from us. In addition, we may be unaware of pending third-party patent applications that relate to our technology and our competitors and others may have patents or may in the future obtain patents and claim that use of our products infringes these patents. Our competitors and others may now, and in the future, have significantly larger and more mature patent portfolios than we currently have. In addition, future litigation may involve patent holding companies or other adverse patent owners who have no relevant product revenue and against whom our own patents may provide little or no deterrence or protection. Therefore, our commercial success may depend in part on our non-infringement of the patents or proprietary rights of third parties. We are aware of a third party, Genomic Health, Inc., that has issued patents and pending patent applications in the United States, Europe and other jurisdictions that claim methods of using certain genes that are included in Prosigna, which we manufacture for Veracyte. We believe that our manufacture of Prosigna does not infringe any valid issued claim. We could incur substantial costs and divert the attention of our management and technical personnel in defending against any of these claims. Any adverse ruling or perception of an adverse ruling in defending ourselves against these claims could have an adverse impact on our stock price, which may be disproportionate to the actual impact of the ruling itself. Parties making claims against us may be able to obtain injunctive or other relief, which could block our ability to develop, commercialize and sell products, and could result in the award of substantial damages against us. In the event of a successful claim of infringement against us, we may be required to pay damages and obtain one or more licenses from third parties, or be prohibited from selling certain products. We may not be able to obtain these licenses at a reasonable cost, if at all. We could therefore incur substantial costs related to royalty payments for licenses obtained from third parties, which could negatively affect our gross margins. In addition, we could encounter delays in product introductions while we attempt to develop alternative methods or products to avoid infringing third-party patents or proprietary rights. Defense of any lawsuit or failure to obtain any of these licenses on favorable terms could prevent us from commercializing products, and the prohibition of sale of any of our products could materially affect our ability to grow and gain market acceptance for our products.
Furthermore, because of the substantial amount of discovery required in connection with intellectual property litigation, there is a risk that some of our confidential information could be compromised by disclosure during this type of litigation. In addition, during the course of this kind of litigation, there could be public announcements of the results of hearings, motions or other interim proceedings or developments. If securities analysts or investors perceive these results to be negative, it could have a substantial adverse effect on the price of our common stock.
In addition, our agreements with some of our suppliers, distributors, customers, collaborators and other entities with whom we do business require us to defend or indemnify these parties to the extent they become involved in infringement claims against us, including the claims described above. We could also voluntarily agree to defend or indemnify third parties in instances where we are not obligated to do so if we determine it would be important to our business relationships. If we are required or agree to defend or indemnify any of these third parties in connection with any infringement claims, we could incur
-37-
significant costs and expenses that could adversely affect our business, operating results, or financial condition.
We may be subject to damages resulting from claims that we or our employees have wrongfully used or disclosed alleged trade secrets of our employees’ former employers.
Many of our employees were previously employed at universities or other life sciences companies, including our competitors or potential competitors. Although no claims against us are currently pending, we or our employees may be subject to claims that these employees or we have inadvertently or otherwise used or disclosed trade secrets or other proprietary information of their former employers. Litigation may be necessary to defend against these claims. If we fail in defending such claims, in addition to paying monetary damages, we may lose valuable intellectual property rights. A loss of key research personnel work product could hamper or prevent our ability to commercialize certain potential products, which could severely harm our business. Even if we are successful in defending against these claims, litigation could result in substantial costs and be a distraction to management.
Our products contain third-party open source software components, and failure to comply with the terms of the underlying open source software licenses could restrict our ability to sell our products.
Our products contain software tools licensed by third-party authors under “open source” licenses. Use and distribution of open source software may entail greater risks than use of third-party commercial software, as open source licensors generally do not provide warranties or other contractual protections regarding infringement claims or the quality of the code. Some open source licenses contain requirements that we make available source code for modifications or derivative works we create based upon the type of open source software we use. If we combine our proprietary software with open source software in a certain manner, we could, under certain open source licenses, be required to release the source code of our proprietary software to the public. This would allow our competitors to create similar products with less development effort and time and ultimately could result in a loss of product sales.
Although we monitor our use of open source software to avoid subjecting our products to conditions, we do not intend, the terms of many open source licenses have not been interpreted by U.S. courts, and there is a risk that these licenses could be construed in a way that could impose unanticipated conditions or restrictions on our ability to commercialize our products. Moreover, we cannot assure investors that our processes for controlling our use of open source software in our products will be effective. If we are held to have breached the terms of an open source software license, we could be required to seek licenses from third parties to continue offering our products on terms that are not economically feasible, to re-engineer our products, to discontinue the sale of our products if re-engineering could not be accomplished on a timely basis, or to make generally available, in source code form, our proprietary code, any of which could adversely affect our business, operating results, and financial condition.
We use third-party software that may be difficult to replace or cause errors or failures of our products that could lead to lost customers or harm to our reputation.
We use software licensed from third parties in our products. In the future, this software may not be available to us on commercially reasonable terms, or at all. Any loss of the right to use any of this software could result in delays in the production of our products until equivalent technology is either developed by us, or, if available, is identified, obtained and integrated, which could harm our business. In addition, any errors or defects in third-party software, or other third-party software failures could result in errors, defects or cause our products to fail, which could harm our business and be costly to correct. Many of these providers attempt to impose limitations on their liability for such errors, defects or failures, and if enforceable, we may have additional liability to our customers or third-party providers that could harm our reputation and increase our operating costs.
We will need to maintain our relationships with third-party software providers and to obtain software from such providers that does not contain any errors or defects. Any failure to do so could adversely impact our ability to deliver reliable products to our customers and could harm our results of operations.
-38-
Risks Related to Our Common Stock
The price of our common stock may be volatile, and you could lose all or part of your investment.
The trading price of our common stock has fluctuated and may continue to fluctuate substantially. The trading price of our common stock depends on a number of factors, including those described in this “Risk Factors” section, many of which are beyond our control and may not be related to our operating performance. These fluctuations could cause stockholders to lose all or part of their investment in our common stock. Factors that could cause fluctuations in the trading price of our common stock include the following:
• | actual or anticipated quarterly variation in our results of operations or the results of our competitors; |
• | announcements by us or our competitors of new products, significant contracts or commercial relationships; |
• | adverse regulatory announcements; |
• | issuance of new or changed securities analysts’ reports or recommendations for our stock; |
• | developments or disputes concerning our intellectual property or other proprietary rights; |
• | commencement of, or our involvement in, litigation; |
• | market conditions in the research market; |
• | manufacturing disruptions; |
• | any future sales of our common stock or other securities; |
• | any change to the composition of the board of directors or key personnel; |
• | announcements by us or our competitors of significant acquisitions or divestitures, strategic partnerships, joint ventures or capital commitments; |
• | general economic conditions and slow or negative growth of our markets; and |
• | the other factors described in this “Risk Factors” section. |
The stock market in general, and market prices for the securities of life sciences companies like ours in particular, have from time to time experienced volatility that often has been unrelated to the operating performance of the underlying companies. These broad market and industry fluctuations may adversely affect the market price of our common stock, regardless of our operating performance. In several recent situations where the market price of a stock has been volatile, holders of that stock have instituted securities class action litigation against the company that issued the stock. If any of our stockholders were to bring a lawsuit against us, the defense and disposition of the lawsuit could be costly and divert the time and attention of our management and harm our operating results.
If securities or industry analysts do not publish research reports about our business, or if they issue an adverse opinion about our business, our stock price and trading volume could decline.
The trading market for our common stock will be influenced by the research and reports that industry or securities analysts publish about us or our business. If one or more of the analysts who cover us issues an adverse opinion about our company, our stock price would likely decline. If one or more of these analysts ceases coverage of us or fails to regularly publish reports on us, we could lose visibility in the financial markets, which in turn could cause our stock price or trading volume to decline.
Future sales of our common stock in the public market could cause our stock price to fall.
Our stock price could decline as a result of sales of a large number of shares of our common stock or the perception that these sales could occur, including by our officers, directors and their respective affiliates. These sales, or the possibility that these sales may occur, also might make it more difficult for us to sell equity securities in the future at a time and at a price that we deem appropriate.
We register the offer and sale of all shares of common stock that we may issue under our equity compensation plans. In addition, in the future, we may issue additional shares of common stock or other equity or debt securities convertible into common stock in connection with a financing, acquisition, litigation settlement, employee arrangements or otherwise. For example, in July and August 2018, we sold an aggregate of 4,600,000 shares of common stock in an underwritten public offering for net proceeds of $53.8 million and in March 2019, we sold an aggregate of 3,175,000 shares of common stock in an underwritten public offering for net proceeds of $68.3 million. Any such future issuance could result in substantial dilution to our existing stockholders and could cause our stock price to decline.
-39-
We have broad discretion over the use of the proceeds to us from our 2018 and 2019 underwritten public offerings and debt financings and may apply the proceeds to uses that do not improve our operating results or the value of your securities.
We have broad discretion over the use of proceeds to us from our 2018 and 2019 underwritten public offerings and debt financings and investors will be relying solely on the judgment of our board of directors and management regarding the application of these proceeds. Our use of the proceeds may not improve our operating results or increase the value of the securities offered pursuant to the foregoing fundraising transactions.
Anti-takeover provisions in our charter documents and under Delaware or Washington law could make an acquisition of us difficult, limit attempts by our stockholders to replace or remove our current management and limit our stock price.
Provisions of our certificate of incorporation and bylaws may delay or discourage transactions involving an actual or potential change in our control or change in our management, including transactions in which stockholders might otherwise receive a premium for their shares, or transactions that our stockholders might otherwise deem to be in their best interests. Therefore, these provisions could adversely affect the price of our stock. Among other things, the certificate of incorporation and bylaws:
• | permit the board of directors to issue up to 15,000,000 shares of preferred stock, with any rights, preferences and privileges as they may designate; |
• | provide that the authorized number of directors may be changed only by resolution of the board of directors; |
• | provide that all vacancies, including newly-created directorships, may, except as otherwise required by law, be filled by the affirmative vote of a majority of directors then in office, even if less than a quorum; |
• | divide the board of directors into three classes; |
• | provide that a director may only be removed from the board of directors by the stockholders for cause; |
• | require that any action to be taken by our stockholders must be effected at a duly called annual or special meeting of stockholders and may not be taken by written consent; |
• | provide that stockholders seeking to present proposals before a meeting of stockholders or to nominate candidates for election as directors at a meeting of stockholders must provide notice in writing in a timely manner, and meet specific requirements as to the form and content of a stockholder’s notice; |
• | prevent cumulative voting rights (therefore allowing the holders of a plurality of the shares of common stock entitled to vote in any election of directors to elect all of the directors standing for election, if they should so choose); |
• | provide that special meetings of our stockholders may be called only by the chairman of the board, our chief executive officer or by the board of directors; and |
• | provide that stockholders are permitted to amend the bylaws only upon receiving at least two-thirds of the total votes entitled to be cast by holders of all outstanding shares then entitled to vote generally in the election of directors, voting together as a single class. |
In addition, because we are incorporated in Delaware, we are governed by the provisions of Section 203 of the Delaware General Corporation Law, which generally prohibits a Delaware corporation from engaging in any of a broad range of business combinations with any “interested” stockholder for a period of three years following the date on which the stockholder became an “interested” stockholder. Likewise, because our principal executive offices are located in Washington, the anti-takeover provisions of the Washington Business Corporation Act may apply to us under certain circumstances now or in the future. These provisions prohibit a “target corporation” from engaging in any of a broad range of business combinations with any stockholder constituting an “acquiring person” for a period of five years following the date on which the stockholder became an “acquiring person.”
Complying with the laws and regulations affecting public companies increases our costs and the demands on management and could harm our operating results.
As a public company, we incur and will continue to incur significant legal, accounting and other expenses that we did not incur as a private company. We ceased to be an “emerging growth company” on December 31, 2018 and are no longer eligible for reduced disclosure requirements and exemptions applicable to “emerging growth companies.” We expect that our loss of “emerging growth company” status will require additional attention from management and will result in increased costs to us, which could include higher legal fees, accounting fees and fees associated with investor relations activities, among others. In addition, the Sarbanes-Oxley Act and rules subsequently implemented by the SEC and The Nasdaq Global Market impose numerous requirements on public companies, including requiring changes in corporate governance practices. Also, the Exchange Act requires, among other things, that we file annual, quarterly and current reports with respect to our business and operating results. Our management and other personnel must devote a substantial amount of time to compliance with these laws
-40-
and regulations. These burdens may increase as new legislation is passed and implemented, including any new requirements that the Dodd-Frank Wall Street Reform and Consumer Protection Act of 2010 may impose on public companies. These requirements have increased and will likely continue to increase our legal, accounting, and financial compliance costs and have made and will continue to make some activities more time consuming and costly. For example, as a public company it is more difficult and more expensive for us to obtain director and officer liability insurance, and in the future we may be required to accept reduced policy limits and coverage or to incur substantial costs to maintain the same or similar coverage. These rules and regulations could also make it more difficult for us to attract and retain qualified persons to serve on our board of directors or our board committees or as executive officers.
The Sarbanes-Oxley Act requires the SEC to implement new requirements on registrants, and these new requirements that were implemented require, among other things, that we assess the effectiveness of our internal control over financial reporting annually and SEC requirements also require us to assess the effectiveness of our disclosure controls and procedures quarterly. In particular, Section 404 of the Sarbanes-Oxley Act, or Section 404, requires us to perform system and process evaluation and testing of our internal control over financial reporting to allow management to report on, and our independent registered public accounting firm to attest to, the effectiveness of our internal control over financial reporting. As an “emerging growth company,” we availed ourselves of the exemption from the requirement that our independent registered public accounting firm attest to the effectiveness of our internal control over financial reporting under Section 404. However, we may no longer avail ourselves of this exemption since we ceased to be an “emerging growth company” on December 31, 2018. As a result, our independent registered public accounting firm is required to undertake an assessment of our internal control over financial reporting and the cost of our compliance with Section 404 will correspondingly increase. Our compliance with applicable provisions of Section 404 will require that we incur substantial accounting expense and expend significant management time on compliance-related issues as we implement additional corporate governance practices and comply with reporting requirements.
As disclosed in Part II, Item 9A, we identified a material weakness related to an ineffective control environment as we did not maintain a sufficient complement of resources with an appropriate level of controls knowledge, expertise and training commensurate with our financial reporting requirements. This contributed to additional control material weaknesses, as follows, as we did not (i) design and maintain effective information technology general controls, or ITGCs, for significant applications used in the preparation of the financial statements. Specifically, we did not design and maintain: (a) user access controls to adequately restrict user and privileged access to the financial application, programs, and data to appropriate Company personnel, (b) program change management controls for certain financial systems to ensure that information technology, or IT, program and data changes affecting financial IT applications and underlying accounting records are identified, tested, authorized and implemented appropriately; (ii) design and maintain effective controls to timely detect and independently review instances where individuals with access to post a journal entry may also have edited or created the journal entry; (iii) design and maintain effective controls relating to our accounting for product and services revenues, specifically to ensure occurrence, accuracy, and completeness of customer order entry, price, and quantity during the billing and revenue processes (this deficiency was impacted by the deficiencies related to the design and maintenance of our ITGCs); and (iv) maintain effective controls related to the existence of inventory. Specifically, we did not maintain effective controls related to periodic inventory counts, receiving of inventory, and recording adjustments to inventory quantities.
As a result, management concluded that our internal control over financial reporting was not effective as of December 31, 2019. We have taken steps to implement remediation efforts; however, there can be no assurance that our efforts to remediate the material weaknesses will be successful or will be completed by the end of 2020. Pursuing these remediation efforts will result in additional technology and other expenses.
If we are unable to remediate these material weaknesses, or are otherwise unable to maintain effective internal control over financial reporting or disclosure controls and procedures, our ability to record, process and report financial information accurately, and to prepare financial statements within required time periods, could be adversely affected, which could subject us to litigation or investigations requiring management resources and payment of legal and other expenses and negatively impact the price of our common stock. In addition, we could be subject to sanctions or investigations by the SEC or other regulatory authorities, which would require additional financial and management resources.
Furthermore, investor perceptions of our company may suffer as a result of the material weaknesses in our internal controls, and this could cause a decline in the market price of our stock. Irrespective of compliance with Section 404, any failure of our internal control over financial reporting could have a material adverse effect on our stated operating results and harm our reputation. If we are unable to remediate the material weaknesses effectively or efficiently or avoid future material weaknesses, it could harm our operations, financial reporting, or financial results and could result in an adverse opinion on our internal control over financial reporting from our independent registered public accounting firm.
Item 1B. Unresolved Staff Comments
-41-
None.
Item 2. Properties
We currently have four long-term operating lease agreements for 134,296 square feet of space used for general office, laboratory, manufacturing, operations, and research and development purposes in the greater Seattle, Washington area. The long-term operating leases in the greater Seattle, Washington area expire beginning in 2026 through 2030 and include options to renew at the then fair market rental for each of the facilities. The lease agreements contain rent abatement periods, scheduled rent increases and provide for tenant improvement allowances. In addition, we have four office leases outside of the greater Seattle, Washington area, totaling approximately 4,214 square footage, with terms between one and four years.
Our landlords hold security deposits of approximately $1.9 million. We believe that our existing facilities are adequate to meet our business requirements for the near-term and that additional space will be available on commercially reasonable terms, if required.
-42-
Item 3. Legal Proceedings
We are not engaged in any material legal proceedings. From time to time, we may become involved in litigation relating to claims arising from the ordinary course of business. We believe that there are no claims or actions pending against us currently, the ultimate disposition of which would have a material adverse effect on our consolidated results of operation, financial condition or cash flows.
Item 4. Mine Safety Disclosures
Not applicable.
-43-
PART II
Item 5. Market for Registrant’s Common Equity, Related Stockholder Matters and Issuer Purchases of Equity Securities
Market Information
Our common stock is traded on The Nasdaq Global Market under the symbol “NSTG.” Trading of our common stock commenced on June 26, 2013 in connection with our initial public offering.
Holders
As of February 25, 2020, there were approximately 23 holders of record of our common stock. The actual number of stockholders is greater than this number of record holders and includes stockholders who are beneficial owners but whose shares are held in street name by brokers and other nominees.
Performance Graph
This performance graph shall not be deemed “filed” for purposes of Section 18 of the Securities Exchange Act of 1934, as amended (the “Exchange Act”), or incorporated by reference into any filing of NanoString Technologies, Inc. under the Securities Act of 1933, as amended, or the Exchange Act, except as shall be expressly set forth by specific reference in such filing.
The following graph compares the performance of our common stock for the periods indicated with the performance of the Nasdaq Composite Index and the Nasdaq Medical Equipment Index. This graph assumes an investment of $100 on December 31, 2014 in each of our common stock, the Nasdaq Composite Index and the Nasdaq Medical Equipment Index, and assumes reinvestment of dividends, if any. The stock price performance shown on the graph below is not necessarily indicative of future stock price performance.
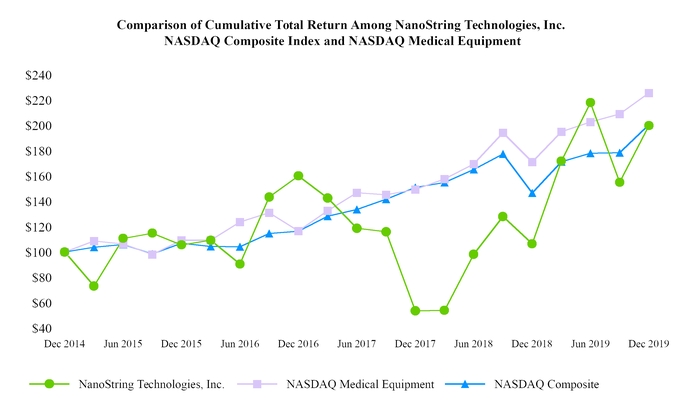
-44-
Recent Sales of Unregistered Securities
None.
Securities Authorized for Issuance under Equity Compensation Plans
The following table summarizes information about our equity compensation plans as of December 31, 2019. All outstanding awards relate to our common stock.
Plan Category | (a) Number of Securities to be Issued Upon Exercise of Outstanding Options, Warrants and Rights | (b) Weighted Average Exercise Price of Outstanding Options, Warrants and Rights | (c) Number of Securities Remaining Available for Future Issuance Under Equity Compensation Plans (Excluding Securities Reflected in Column (a)) (1) | ||||||
Equity compensation plans approved by security holders: | |||||||||
2004 Stock Option Plan | 494,100 | $ | 2.93 | — | |||||
2013 Equity Incentive Plan | 4,995,358 | $ | 11.52 | 713,716 | |||||
2013 Employee Stock Purchase Plan | — | N.A. | 344,670 | ||||||
Equity compensation plans not approved by security holders(2): | 138,438 | $ | 10.56 | 70,000 | |||||
Total | 5,627,896 | N.A. | 1,128,386 | ||||||
(1) Our 2013 Equity Incentive Plan includes provisions providing for an annual increase in the number of securities available for future issuance on the first day of each fiscal year, equal to the least of: (a) 1,406,250 shares; (b) 5% of the outstanding shares of common stock as of the last day of the immediately preceding fiscal year; and (c) such other amount as the board of directors may determine. Our 2013 Employee Stock Purchase Plan includes provisions providing for an annual increase in the number of securities available for future issuance on the first day of each fiscal year, equal to the least of: (a) 1% of the outstanding shares of common stock on the first day of such fiscal year; (b) 281,250 shares; and (c) such other amount as the board of directors, or a committee appointed by the board of directors, may determine.
(2) On January 15, 2018, our board of directors adopted the NanoString Technologies, Inc. 2018 Inducement Equity Incentive Plan, or the Inducement Plan, and, subject to the adjustment provisions of the Inducement Plan, reserved 250,000 shares of our common stock for issuance pursuant to equity awards granted under the Inducement Plan. The Inducement Plan was adopted without stockholder approval pursuant to Rule 5635(c)(4) and Rule 5635(c)(3) of the Nasdaq Listing Rules. The Inducement Plan provides for the grant of equity-based awards, including nonstatutory stock options, restricted stock units, restricted stock, stock appreciation rights, performance shares and performance units, and its terms are substantially similar to our 2013 Equity Incentive Plan, including with respect to treatment of equity awards in the event of a “merger” or “change in control” as defined under the Inducement Plan, but with such other terms and conditions intended to comply with the Nasdaq inducement award exception or to comply with the Nasdaq acquisition and merger exception. However, our 2013 Equity Incentive Plan permits certain exchange programs (including repricings) without stockholder approval, while the Inducement Plan requires stockholder approval for such exchange programs.
-45-
Item 6. Selected Financial Data
The following selected financial data is derived from our audited financial statements and should be read in conjunction with, and is qualified in its entirety by, Item 7, “Management’s Discussion and Analysis of Financial Condition and Results of Operations” and Item 8, “Financial Statements and Supplementary Data” contained elsewhere in this Annual Report on Form 10-K. The selected Consolidated Statements of Operations data for the years ended December 31, 2019, 2018 and 2017 and Consolidated Balance Sheet data as of December 31, 2019 and 2018 have been derived from our audited consolidated financial statements appearing elsewhere in this Annual Report on Form 10-K. The selected Consolidated Statements of Operations data for the years ended December 31, 2016 and 2015 and Consolidated Balance Sheet data as of December 31, 2017, 2016 and 2015 have been derived from our audited consolidated financial statements that are not included in this Annual Report on Form 10-K. Historical results are not necessarily indicative of future results.
Year Ended December 31, | |||||||||||||||||||
2019(2) | 2018 | 2017 | 2016 | 2015 | |||||||||||||||
(In thousands, except per share amounts) | |||||||||||||||||||
Consolidated Statements of Operations: | |||||||||||||||||||
Revenue(1) | $ | 125,568 | $ | 106,732 | $ | 114,905 | $ | 86,489 | $ | 62,667 | |||||||||
Costs and expenses: | |||||||||||||||||||
Cost of product and service revenue | 44,039 | 36,331 | 31,880 | 30,245 | 26,126 | ||||||||||||||
Research and development | 68,035 | 61,599 | 46,888 | 34,720 | 24,597 | ||||||||||||||
Selling, general and administrative | 96,195 | 78,195 | 74,334 | 62,700 | 53,186 | ||||||||||||||
Total costs and expenses | 208,269 | 176,125 | 153,102 | 127,665 | 103,909 | ||||||||||||||
Loss from operations | (82,701 | ) | (69,393 | ) | (38,197 | ) | (41,176 | ) | (41,242 | ) | |||||||||
Other income (expense): | |||||||||||||||||||
Gain on sale of business, net | 48,871 | — | — | — | — | ||||||||||||||
Interest income | 2,819 | 1,331 | 809 | 390 | 233 | ||||||||||||||
Interest expense | (8,487 | ) | (7,431 | ) | (6,153 | ) | (5,672 | ) | (4,017 | ) | |||||||||
Other income (expense), net | (929 | ) | (1,658 | ) | 183 | (515 | ) | (389 | ) | ||||||||||
Total other income (expense), net | 42,274 | (7,758 | ) | (5,161 | ) | (5,797 | ) | (4,173 | ) | ||||||||||
Net loss before provision for income taxes | (40,427 | ) | (77,151 | ) | (43,358 | ) | (46,973 | ) | (45,415 | ) | |||||||||
Provision for income taxes | (269 | ) | (249 | ) | (204 | ) | (116 | ) | (166 | ) | |||||||||
Net loss | $ | (40,696 | ) | $ | (77,400 | ) | $ | (43,562 | ) | $ | (47,089 | ) | $ | (45,581 | ) | ||||
Net loss per share—basic and diluted | $ | (1.18 | ) | $ | (2.78 | ) | $ | (1.84 | ) | $ | (2.34 | ) | $ | (2.40 | ) | ||||
Weighted-average shares used in computing basic and diluted net loss per share | 34,588 | 27,883 | 23,731 | 20,116 | 19,027 | ||||||||||||||
As of December 31, | |||||||||||||||||||
2019 | 2018 | 2017 | 2016 | 2015 | |||||||||||||||
Consolidated Balance Sheet Data: | |||||||||||||||||||
Cash, cash equivalents and short-term investments | $ | 156,855 | $ | 93,997 | $ | 77,555 | $ | 74,036 | $ | 49,044 | |||||||||
Working capital | 167,621 | 88,592 | 86,002 | 77,402 | 61,882 | ||||||||||||||
Total assets | 259,754 | 147,558 | 136,762 | 126,373 | 92,869 | ||||||||||||||
Long-term debt and lease financing obligations, net of discounts (includes current portion) | 83,717 | 58,396 | 48,931 | 47,424 | 41,226 | ||||||||||||||
Total stockholders’ equity | $ | 104,151 | $ | 36,869 | $ | 40,109 | $ | 12,305 | $ | 20,215 | |||||||||
(1) Amounts have not been retrospectively modified to reflect the adoption of Accounting Standard Update No. 2014-09, Revenue from Contracts with Customers, for the years ended December 31, 2015, 2016 and 2017.
(2) We sold certain assets and entered into a license of intellectual property with Veracyte in December 2019. For additional information, see Note 4 of the Notes to Consolidated Financial Statements under Item 8 of this report.
-46-
Item 7. Management’s Discussion and Analysis of Financial Condition and Results of Operations
You should read the following discussion and analysis together with the financial statements and the related notes to those statements included elsewhere in this report. This discussion contains forward-looking statements that involve risks and uncertainties. As a result of many factors, such as those set forth in the section of this report captioned “Risk Factors” and elsewhere in this report, our actual results may differ materially from those anticipated in these forward-looking statements. Throughout this discussion, unless the context specifies or implies otherwise, the terms “NanoString”, “we”, “us” and “our” refer to NanoString Technologies, Inc. and its subsidiaries.
Overview
We develop, manufacture and sell products that unlock scientifically valuable and clinically actionable information from minute amounts of biological material. Our core technology is a unique, proprietary optical barcoding chemistry that enables the labeling and counting of single molecules. This proprietary chemistry may reduce the number of steps required to conduct certain types of scientific experiments and allow for multiple experiments to be conducted at once. As a result, we are able to develop tools that are easier for researchers to use and that may generate faster and more consistent scientific results.
We use our technology to develop tools for scientific and clinical research, primarily in the fields of genomics and proteomics. We currently have two commercially available product platforms, our nCounter Analysis System and our GeoMx Digital Spatial Profiling, or DSP, system, both of which include instruments and related consumables.
nCounter can be used to analyze the activity of up to 800 genes in a single experiment. nCounter is also used by clinicians to analyze gene activity relevant for diagnostic applications. GeoMx DSP, which was made commercially available in 2019, is designed to enable the field of spatial genomics. While nCounter and other existing technologies analyze gene activity as a whole throughout the totality of a biological sample, GeoMx DSP is used to analyze specifically selected regions of a biological sample in order to see how gene activity might vary across those regions or in certain cell types. GeoMx DSP operates by enabling users to prepare and select certain regions of a sample in which to study gene activity, and then use our nCounter system to subsequently evaluate, or read out. the activity of up to 96 genes in each of the selected regions.
We market and sell our instruments and related consumables to researchers in academic, government and biopharmaceutical laboratories for research use, both through our direct sales force and through selected distributors in certain markets. As of December 31, 2019, we had an installed base of approximately 855 nCounter systems, which our customers have used to publish more than 3,200 peer-reviewed papers. As of December 31, 2019, we had received over 90 orders for GeoMx DSP systems. We shipped 44 GeoMx DSP systems to customer sites and installed 35 systems as of December 31, 2019. In addition, we continue to provide access to GeoMx DSP’s capabilities by offering selected potential customers the opportunity to send biological samples to our Seattle facility to be tested in our lab prior to purchasing a GeoMx DSP system. To date, we have conducted over 200 projects for approximately 125 customers pursuant to this Technology Access Program, or TAP.
We derive a substantial majority of our revenue from the sale of our products, which consist of our nCounter and GeoMx DSP instruments and related proprietary consumables. Our instruments are designed to work only with our consumable products. Accordingly, as the installed base of instruments grows, we expect recurring revenue from consumable sales to become an increasingly important driver of our operating results. Our consumables include our standardized nCounter and GeoMx DSP panel products and nCounter custom CodeSet products that contain a specific set of targets for scientific analysis as requested by a customer. We also derive revenue from processing fees related to proof-of-principle studies, including from our GeoMx DSP TAP, which we conduct for potential customers. For both our nCounter and GeoMx DSP systems, we offer and derive revenue from extended service contracts. Additionally, we generate revenue through product development collaborations.
We use third-party contract manufacturers to produce the instruments comprising our nCounter and GeoMx DSP systems. We manufacture consumables at our greater Seattle, Washington area facilities. We focus a substantial portion of our resources on developing new technologies, products and solutions. We invested $68.0 million, $61.6 million and $46.9 million in 2019, 2018 and 2017, respectively, in research and development and intend to continue to make significant investments in research and development to support our existing instrument platforms and related consumable offerings, as well as research and development of new technologies.
In December 2019, we entered into a License and Asset Purchase Agreement, or LAPA, and service and supply agreements, or SSAs, with Veracyte, Inc, or Veracyte. Pursuant to the LAPA, we completed a license of intellectual property and a sale of certain assets to Veracyte relating to our nCounter FLEX system for use in clinical diagnostic applications. Veracyte also acquired certain intellectual property rights and worldwide distribution rights relating to our Prosigna Breast Cancer Assay and our LymphMark assay and certain clinical diagnostic assay software modules that operate with the nCounter FLEX system. Pursuant to the terms of the LAPA, Veracyte paid us $50.0 million, consisting of $40.0 million in cash, paid in
-47-
connection with the entry into the LAPA, and 376,732 shares of Veracyte common stock valued at $10.0 million, which shares were issued in connection with the entry into the LAPA. Additionally, we may receive future potential milestone payments of up to $10.0 million in the aggregate, to be paid upon the launch of additional clinical diagnostic tests by Veracyte for our nCounter FLEX platform. Pursuant to the SSAs, we agreed to supply to Veracyte nCounter FLEX systems, and to manufacture and supply Prosigna kits, LymphMark kits and any additional clinical diagnostic tests that Veracyte may develop in the future for nCounter, for a period of at least four years subsequent to the transaction date. Pursuant to the SSAs, Veracyte will pay the designated transfer prices for nCounter FLEX systems, Prosigna kits, LymphMark kits and any other nCounter-based diagnostic tests developed by Veracyte.
Our product and service revenue increased 24.2% to $103.7 million in 2019, compared to $83.5 million in 2018. The increase was driven primarily by increased revenue from nCounter consumables associated with our growing installed base of nCounter systems, revenue recognized during the second half of 2019 related to the initial commercial shipments of GeoMx DSP systems, and increases in revenue related to our GeoMx DSP TAP. Our product and service revenue increased 16.0% to $83.5 million in 2018, compared to $72.0 million in 2017. The increase was driven primarily by increased revenue from consumables and Prosigna, and increased revenue from service contracts associated with our growing installed base of nCounter Analysis Systems and for our GeoMx DSP TAP.
Our total revenue in 2019 was $125.6 million, compared to $106.7 million in 2018 and $114.9 million in 2017. Our total revenue has varied more significantly as compared to our product and service revenue, as a result of the timing of revenue recognition associated with our collaboration agreements. Revenue recognition relating to these agreements, which is recorded as collaboration revenue, primarily consists of recognizing deferred revenue relating to cash payments received previously from our collaborators. Collaboration revenue recognized may vary significantly depending on the timing and cost of certain research and development activities relating to a collaboration, the expected time frame for completing certain collaboration activities, the outcome of research and development activities being conducted pursuant to a collaboration, the contractual terms of a particular collaboration agreement and other factors.
We have never been profitable and had net losses of $40.7 million, $77.4 million and $43.6 million in 2019, 2018 and 2017, respectively. As of December 31, 2019, our accumulated deficit was $432.0 million.
Key Financial Metrics
We are organized as, and operate in, one reportable segment: the development, manufacture and commercialization of instruments, consumables and services for efficiently profiling the activity of hundreds of genes and proteins simultaneously from a single tissue sample. Our chief operating decision maker is the chief executive officer, who manages our operations and evaluates our financial performance on a total company basis. Our principal operations and decision-making functions are located at our corporate headquarters in the United States.
Revenue
We generate revenue from the sale of our products and related services. For a description of our revenue recognition policies, see the section of this report captioned “—Critical Accounting Policies and Significant Estimates—Revenue Recognition.”
Product Revenue
Our product revenue consists of sales of our nCounter Analysis Systems and related consumables, including Prosigna in vitro diagnostic kits, and our GeoMx DSP systems and related consumables. Our nCounter MAX Analysis System typically consists of one nCounter Digital Analyzer and one nCounter Prep Station, having a U.S. list price of $235,000. The U.S. list price of the similarly configured nCounter FLEX Analysis System is $265,000, or $285,000 if fully enabled to run Prosigna. Our nCounter SPRINT Profiler has a reduced footprint and combines the function of the prep station with the digital analyzer in a single instrument. It has a U.S. list price of $149,000. Our GeoMx DSP system has a U.S. list price of $295,000.
Outside the United States, depending on the country, list prices are generally higher. In certain cases, customers may pay less than the list price for our various nCounter instruments. For example, some of our systems are sold to customers through independent distributors, and these distributors may purchase systems from us at a discount to list price. Our customer base is primarily composed of academic institutions, government laboratories, biopharmaceutical companies and clinical laboratories that perform analyses or testing using our nCounter Analysis and GeoMx DSP systems and purchase related consumables.
For our research customers, related consumables include gene and protein expression analysis panels, which are standardized and pre-manufactured, custom CodeSets, which we manufacture to the specific requirements of an individual researcher, and Master Kits, cartridges and reagents, which are ancillary reagents, cartridges, tips and reagent plates required to setup and process samples in our instruments. For our clinical laboratory customers, related consumables include Prosigna in
-48-
vitro diagnostic kits. Our average annualized consumables revenue per installed system was approximately $80,000 for the year ended December 31, 2019, which includes our consumable sales and Prosigna. Upon entering into and pursuant to the terms of the LAPA with Veracyte, in future periods Prosigna will be manufactured and sold at fixed transfer prices by us to Veracyte, which will result in the revenue we recognize for sales of Prosigna being approximately one-third of the previous per unit revenue, and Veracyte will then sell Prosigna to clinical diagnostic customers. As a result, our selling prices and gross margins for Prosigna in future periods will be lower than our historical selling prices and gross margins, and, as a result, average annualized consumables revenue per installed system may be lower in future periods.
Service Revenue
Service revenue consists of fees associated with service contracts and conducting proof-of-principle studies. We include a one-year warranty with the sale of our instruments and offer service contracts, which are purchased by a majority of our customers. We selectively provide proof-of-principle studies and/or technology access programs to prospective customers in order to help them better understand the benefits of our nCounter Analysis System, our GeoMx DSP system, or other technologies under development, for which we generate data and perform analysis services on their behalf.
Collaboration Revenue
Collaboration revenue has been derived primarily from our collaborations with Lam, and historically, our terminated collaborations with Celgene, Merck and Medivation/Astellas. As of December 31, 2019, we have received a total of $122.8 million from these collaboration agreements, of which $20.7 million, $22.8 million and $42.3 million has been recorded as collaboration revenue in 2019, 2018 and 2017, respectively. As of December 31, 2019, we have customer deposits of approximately $5.5 million related to future development costs which we expect will be substantially completed during the first half of 2020. We do not expect to receive further development funding from Lam in future periods, and the original commitment from Lam to provide up to $50.0 million in development funding has been fully satisfied. Collaboration revenue also includes revenue recognized under several smaller collaborations.
Revenue by Geography
We sell our products through our own sales forces in the United States, Canada, Singapore, Israel and certain European countries. We sell through distributors in other parts of the world. As we have expanded our European direct sales force and entered into agreements with distributors of our products in Europe, the Middle East, Asia Pacific and South America, the amount of revenue generated outside of North America has generally increased, although there have been significant quarter-to-quarter fluctuations. In the future, we intend to continue to expand our sales force and establish additional distributor relationships outside the United States to better access international markets.
The following table reflects total revenue by geography based on the geographic location of our customers, distributors and collaborators. For sales to distributors, their geographic location may be different from the geographic locations of the ultimate end customer. Americas consists of the United States, Canada, Mexico and South America; and Asia Pacific includes Japan, China, South Korea, Singapore, Malaysia, Vietnam, Thailand, India and Australia.
Year Ended December 31, | ||||||||||||||||||||
2019 | 2018 | 2017 | ||||||||||||||||||
(Dollars in thousands) | ||||||||||||||||||||
Americas | $ | 86,139 | 69 | % | $ | 74,137 | 70 | % | $ | 86,099 | 75 | % | ||||||||
Europe & Middle East | 30,289 | 24 | % | 25,715 | 24 | % | 21,791 | 19 | % | |||||||||||
Asia Pacific | 9,140 | 7 | % | 6,880 | 6 | % | 7,015 | 6 | % | |||||||||||
Total revenue | $ | 125,568 | 100 | % | $ | 106,732 | 100 | % | $ | 114,905 | 100 | % | ||||||||
Most of our revenue is denominated in U.S. dollars. Our expenses are generally denominated in the currencies in which our operations are located, which is primarily in the United States. Changes in foreign currency exchange rates have not materially affected us to date; however, they may become material to us in the future if our operations outside of the United States expand.
Cost of Product and Service Revenue
Cost of product and service revenue consists primarily of costs incurred in the production process, including costs of purchasing instruments from third-party contract manufacturers, consumable component materials and assembly labor and overhead, installation, warranty, service and packaging and delivery costs. In addition, cost of product and service revenue includes royalty costs for licensed technologies included in our products, provisions for slow-moving and obsolete inventory, and non-cash expenses including depreciation and amortization associated with various assets used in the production of our
-49-
products and stock-based compensation expense. We provide a one-year warranty on each nCounter Analysis System and GeoMx DSP system and we establish a reserve for warranty repairs based on historical warranty repair costs incurred.
Operating Expenses
Research and Development
Research and development expenses consist primarily of salaries and benefits, occupancy costs, laboratory supplies, engineering services, consulting fees, costs associated with licensing molecular diagnostics rights and clinical study expenses to support the regulatory approval or clearance of diagnostic products, and non-cash expenses including depreciation and amortization associated with various assets used in the research and development of our products and stock-based compensation expense.
We have made substantial investments in research and development since our inception. Our research and development efforts have focused primarily on the tasks required to enhance our technologies and to support development and commercialization of new and existing products and applications. We believe that our continued investment in research and development is essential to our long-term competitive position and expect to continue to make investments in research and development activities, with an expected focus on spatial genomics.
To date, we have found that it has been effective for us to manage our research and development activities on a departmental basis. Accordingly, other than pursuant to terms of certain of our collaborations, we have neither required employees to report their time by project nor allocated our research and development costs to individual projects. Research and development expense by functional area was as follows:
Year Ended December 31, | |||||||||||
2019 | 2018 | 2017 | |||||||||
(In thousands) | |||||||||||
Platform technology | $ | 32,802 | $ | 28,634 | $ | 16,645 | |||||
Manufacturing process development | 6,292 | 4,689 | 3,025 | ||||||||
Life sciences research products and applications | 11,820 | 10,107 | 7,933 | ||||||||
Diagnostic product development | 5,703 | 7,004 | 7,161 | ||||||||
Clinical, regulatory and medical affairs | 4,696 | 5,439 | 7,036 | ||||||||
Facility allocation | 6,722 | 5,726 | 5,088 | ||||||||
Total research and development expense | $ | 68,035 | $ | 61,599 | $ | 46,888 | |||||
Selling, General and Administrative
Selling, general and administrative expense consists primarily of costs for our sales and marketing, finance, human resources, information technology, business development, legal and general management functions, as well as professional fees for legal, consulting and accounting services, and non-cash expenses including primarily stock-based compensation expense.
Factors Affecting Our Performance
Instrument Installed Base
Our future financial performance will be driven in part by the successful adoption and installation of our GeoMx DSP system, for which we commenced commercial shipments in the second half of 2019. As of December 31, 2019, we had received over 90 orders for GeoMx DSP. We shipped 44 GeoMx DSP systems to customer sites and had installed 35 systems as of December 31, 2019. Future financial performance will also be driven by our ability to continue to grow the installed base of nCounter Analysis Systems. As of December 31, 2019, we had an installed base of approximately 855 nCounter Analysis Systems.
In addition to growth related to our current nCounter and GeoMx instrument platforms, future product and service revenue may be impacted by the introduction of new nCounter and GeoMx DSP instrument capabilities including the ability to use GeoMx DSP together with next Generation Sequencers, or NGS.
In addition to seeking to increase sales of our existing nCounter and GeoMx platforms and consumables and from future product introductions, we will continue to employ other growth strategies, including expanding our sales channel in both direct and distributor territories, developing new consumable content for our nCounter and GeoMx platforms and enhancing certain features of our nCounter and GeoMx platforms. As part of this strategy, we have added incremental sales territories and augmented our field sales team, and have continued to grow our base of distributors. As our installed base of instruments
-50-
grows, we solicit feedback from our customers and focus our research and development efforts on improving our systems or enabling applications, which in turn helps to drive additional sales of our instruments and consumables.
Our instrument sales process involves numerous interactions with multiple individuals within an organization, and often includes in-depth analysis by potential customers of our products, performance of proof-of-principle studies, preparation of extensive documentation and a lengthy review process. As a result of these factors, the capital investment required in purchasing our instruments and the budget cycles of our customers, the time from initial contact with a customer to our receipt of a purchase order can vary significantly, and may be up to 12 months or longer. Given the length and uncertainty of our sales cycle, we will likely experience fluctuations in our future instrument sales on a period-to-period basis.
Recurring Consumables Revenue
Our instruments are designed to be used only with our consumables. This closed system model generates recurring revenue from each instrument we sell. Management focuses on recurring consumable revenue per system as an indicator of the continuing value generated by each system. We calculate recurring consumables revenue per system (also known as pull-through) quarterly by dividing consumables and in vitro diagnostic kits revenue recognized in a particular quarter (other than consumables revenue related to proof-of-principle studies) by the total number of installed systems as of the last day in the immediately preceding quarter.
Historically, the majority of our systems and related consumables have been sold to research customers. Our average annualized consumables revenue per installed nCounter system was approximately $80,000 for the year ended December 31, 2019. We did not report average annualized consumables revenue per installed GeoMx DSP system for the year ended December 31, 2019 as the significant majority of GeoMx DSP systems installed to date were installed in the last three months of 2019.
As the installed base of our instrument platforms expands, consumables revenue is expected to increase and, over time, should continue to be an important contributor to our total revenue. Our consumables revenue per system installed may fluctuate in the future, reflecting the mix of our installed instruments, and potential shifts in the mix, or type, of consumables sold to our installed customer base. In addition, subsequent to entering into the LAPA with Veracyte in December 2019, we are no longer selling Prosigna kits directly to third parties and are now manufacturing and supplying Prosigna kits exclusively to Veracyte at designated transfer prices, which will result in a decrease in our future revenue and gross margins associated with Prosigna kits.
Other Revenue Sources
We derive service revenue from service contracts, which are purchased by a majority of our customers. Additionally, we selectively provide proof-of-principle studies and offer technology access programs in connection with prospective sales to prospective customers to demonstrate the performance of our existing product platforms, and those new technologies that are under development for which we generate data and perform analysis on behalf of our customers.
Collaboration revenue has been primarily derived from our collaboration with Lam, and historically, our collaborations with Celgene, Merck and Medivation/Astellas. We expect collaboration revenue to decrease significantly in future periods as we move away from development activities related to diagnostic products and focus our research and development activities on development of new product platforms and associated consumable products, as well as enhancement of functionality of these product platforms.
Revenue Mix and Gross Margin
Our product revenue is derived from sales of nCounter Analysis System instruments and related consumables, including Prosigna in vitro diagnostic kits, and sales of our GeoMx DSP system instruments and related consumables. Generally, our consumables have higher gross margins than our instruments. Our GeoMx DSP instruments, which commenced shipping during 2019, contribute a higher average gross margin as compared to our nCounter instrument platforms. There may be fluctuations in sales mix between instruments and consumables from period to period. During 2019 our total product and service revenue increased by 24%, which included 14% growth in revenues related to our consumables, including in vitro diagnostic kits, compared to 2018 and 45% growth in our instrument sales compared to 2018. Growth in instrument sales was driven almost entirely by shipments of GeoMx DSP systems, which commenced in the second half of 2019. During 2018 our total product and service revenues increased by 16%, which included an 18% growth in revenue related to consumables, including sales of in vitro diagnostic kits, compared to 2017 and 3% growth in our instrument sales compared to 2017. We did not have sales of GeoMx DSP in years prior to 2019. Given our limited selling and marketing experience with GeoMx DSP, our orders and sales may not meet our and analysts’ expectations. Our future results may vary period to period and as our installed base of systems grows, consumables may continue to constitute a larger percentage of total product revenue, which would tend to increase our gross margins. Such gross margin increases may be offset by the mix of consumable products sold or the
-51-
introduction of new instrument product platforms that become increasing components of our product sales, such as our GeoMx DSP system. Future instrument selling prices and gross margins may fluctuate as we grow our volume of distribution partners in geographies outside of the United States, as we introduce new products and reduce our product costs, and from variability in the timing of new product introductions.
In addition to seeking to increase sales of our existing GeoMx DSP and nCounter platforms and consumables, we will continue to employ other growth strategies, including expanding our sales channel in both direct and distributor territories, developing new consumable content for our nCounter and GeoMx platforms and enhancing certain features of our both of these platforms. As part of this strategy, in both 2018 and 2019, we added incremental sales territories and augmented our field sales team, and have continued to grow our base of distributors. As our installed base of instruments grows, we solicit feedback from our customers and focus our research and development efforts on improving our instrument platforms or enabling applications, which in turn helps to drive additional sales of our instruments and consumables on these platforms.
The following table reflects the breakdown of revenue in absolute dollars and as percentage of total revenue.
Year Ended December 31, | ||||||||||||||||||||
2019 | 2018 | 2017 | ||||||||||||||||||
(Dollars in thousands) | ||||||||||||||||||||
Product revenue: | ||||||||||||||||||||
Instruments | $ | 31,074 | 25 | % | $ | 21,441 | 20 | % | $ | 20,839 | 18 | % | ||||||||
Consumables | 51,591 | 41 | % | 43,847 | 41 | % | 38,311 | 33 | % | |||||||||||
In vitro diagnostic kits | 9,413 | 7 | % | 9,445 | 9 | % | 6,745 | 6 | % | |||||||||||
Total product revenue | 92,078 | 73 | % | 74,733 | 70 | % | 65,895 | 57 | % | |||||||||||
Service revenue | 11,636 | 10 | % | 8,790 | 8 | % | 6,115 | 5 | % | |||||||||||
Total product and service revenue | 103,714 | 83 | % | 83,523 | 78 | % | 72,010 | 62 | % | |||||||||||
Collaboration revenue | 21,854 | 17 | % | 23,209 | 22 | % | 42,895 | 38 | % | |||||||||||
Total revenue | $ | 125,568 | 100 | % | $ | 106,732 | 100 | % | $ | 114,905 | 100 | % | ||||||||
Results of Operations
Comparison of Years Ended December 31, 2019 and 2018
Revenue
Year Ended December 31, | Change | ||||||||||||
2019 | 2018 | Dollars | Percentage | ||||||||||
(Dollars in thousands) | |||||||||||||
Product revenue: | |||||||||||||
Instruments | $ | 31,074 | $ | 21,441 | $ | 9,633 | 45% | ||||||
Consumables | 51,591 | 43,847 | 7,744 | 18% | |||||||||
In vitro diagnostic kits | 9,413 | 9,445 | (32 | ) | —% | ||||||||
Total product revenue | 92,078 | 74,733 | 17,345 | 23% | |||||||||
Service revenue | 11,636 | 8,790 | 2,846 | 32% | |||||||||
Total product and service revenue | 103,714 | 83,523 | 20,191 | 24% | |||||||||
Collaboration revenue | 21,854 | 23,209 | (1,355 | ) | (6)% | ||||||||
Total revenue | $ | 125,568 | $ | 106,732 | $ | 18,836 | 18% | ||||||
Instrument revenue for the year ended December 31, 2019 increased as compared to the prior year, due primarily to the first commercial shipments of our GeoMx DSP system. In addition, we experienced an increase in the number of nCounter FLEX and nCounter MAX instruments sold, which generally have higher average selling prices, as compared to the number of nCounter SPRINT instruments sold during the year. Consumables revenue increased for the year ended December 31, 2019, primarily as a result of our growing installed base of nCounter Analysis Systems, as well as growth in sales of our standardized panel consumable products. In vitro diagnostic kit revenue represents sales of Prosigna assays, which were approximately flat for the year ended December 31, 2019 as compared to the prior year. Prosigna revenues were impacted during the fourth quarter of 2019 subsequent to entering into the LAPA and Prosigna supply agreement with Veracyte, which reduced our average selling price on Prosigna kits sold during the period. Service revenue for the year ended December 31,
-52-
2019 increased, primarily related to growth in the number of projects relating to our GeoMx DSP technology access program, and, to a lesser extent, increases in the number of installed instruments covered by service contracts. Our product and service revenue may continue to increase in future periods as a result of the growth in sales of our GeoMx DSP instruments, the growth in sales of our nCounter and GeoMx DSP consumable products as driven by our increasing installed base of these systems and the introduction of new nCounter and GeoMx DSP consumable products.
Collaboration revenue decreased for the year ended December 31, 2019 as compared to the prior year, due primarily to changes in activity levels relating to our collaboration with Lam, and historically, our terminated collaborations with Merck. These decreases were partially offset by collaboration revenue recognized following the termination of our agreement with Celgene. Our collaboration agreement with Lam represented $16.3 million of collaboration revenue for the year ended December 31, 2019. Collaboration revenue related to our agreement with Lam was $18.6 million for the year ended December 31, 2018. As of December 31, 2019, we have received the total committed collaboration development funding of $50.0 million from Lam.
Cost of Product and Service Revenue; Gross Profit; and Gross Margin
Year Ended December 31, | Change | ||||||||||||
2019 | 2018 | Dollars | Percentage | ||||||||||
(Dollars in thousands) | |||||||||||||
Cost of product and service revenue | $ | 44,039 | $ | 36,331 | $ | 7,708 | 21% | ||||||
Product and service gross profit | $ | 59,675 | $ | 47,192 | $ | 12,483 | 26% | ||||||
Product and service gross margin | 58 | % | 57 | % | |||||||||
For the year ended December 31, 2019, cost of product and service revenue increased as compared to the same periods in 2018, due to a higher volume of consumables sold, as well as increased costs associated with the first commercial shipments of GeoMx DSP. Our gross margin on product and service revenue for the year ended December 31, 2019 increased compared to the prior year primarily as a result of higher sales of consumables as a percentage of our sales mix, as well as due to our sales of GeoMx DSP instruments, which generally have a higher gross margin than our nCounter Analysis Systems. In addition, increased revenue from our GeoMx TAP service favorably impacted our overall margins for the year as compared to the prior year. These increases were partially offset by lower average selling prices realized for Prosigna pursuant to our supply agreement with Veracyte, and to a lesser extent, additional investments made in our operations to support the growth of our business.
We expect our cost of product and service revenue to increase in future periods, coincident with anticipated growth in sales of GeoMx DSP instruments, continued growth of nCounter consumable product sales and investments we expect to make in our operations to support the growth of our business. We expect our gross margin on product and service revenue may fluctuate in future periods, depending upon our mix of instrument sales from which we typically record lower gross margins, as compared to our sales of consumable products or services, and potential expenses we may incur for regulatory compliance, quality assurance or related to the expansion of our manufacturing capacity. Any costs related to collaboration revenue are included in research and development expense.
Research and Development Expense
Year Ended December 31, | Change | ||||||||||||
2019 | 2018 | Dollars | Percentage | ||||||||||
(Dollars in thousands) | |||||||||||||
Research and development expense | $ | 68,035 | $ | 61,599 | $ | 6,436 | 10% | ||||||
The increase in research and development expense for the year ended December 31, 2019 reflects higher stock-based compensation expense, which was driven by increases in our stock price as well as changes in the form of equity compensation granted to our employees and executives beginning in 2019. In addition, we experienced increases to staffing and personnel-related costs to support development activities related to the GeoMx DSP commercial launch, as well as increased facility costs. These increases were partially offset by decreases in professional fees and clinical trial costs, primarily due to fewer diagnostic product related development activities associated with our terminated collaboration agreements as compared to the prior year.
We expect research and development expense may decline in future periods, reflecting the impact of the reductions in research and development resources for the development of nCounter-based diagnostic products made in connection with the Veracyte transaction and an expected focus on spatial genomics. In addition, we expect moderating future development costs related to nCounter systems and consumables, as we transition to a sustaining level of activity. As of December 31, 2019, Lam had provided the full commitment of up to $50.0 million in development funding associated with our Hyb & Seq program and we do not expect to receive any further funding from Lam in future periods. With the completion of Lam’s development
-53-
funding, we are working to identify the key applications for our Hyb & Seq platform and pursuing partnerships that can support our emerging commercial strategy.
Selling, General and Administrative Expense
Year Ended December 31, | Change | ||||||||||||
2019 | 2018 | Dollars | Percentage | ||||||||||
(Dollars in thousands) | |||||||||||||
Selling, general and administrative expense | $ | 96,195 | $ | 78,195 | $ | 18,000 | 23% | ||||||
The increase in selling, general and administrative expense for the year ended December 31, 2019 is primarily attributable to an increase in staffing and personnel-related costs of $13.4 million to support the GeoMx DSP commercial launch, professional fees associated with the execution of our LAPA and supply agreements with Veracyte, and higher accounting and audit service fees, in particular relating to our compliance with the Sarbanes Oxley Act. Personnel-related costs also reflect higher stock-based compensation expense, which was driven by increases in our stock price as well as changes in the form of equity compensation granted to our employees and executives beginning in 2019.
We expect selling, general and administrative expense to increase in future periods as the number of sales, technical support and marketing and administrative personnel grows to support the expected growth in our existing lines of business, as well as to support the introduction of new products and product platforms. We believe selling, general and administrative expenses may increase in future periods as we invest to support the expected growth of our business, including our sales efforts to support the growth of GeoMx DSP.
Other Income (Expense), net
Year Ended December 31, | Change | ||||||||||||
2019 | 2018 | Dollars | Percentage | ||||||||||
(Dollars in thousands) | |||||||||||||
Gain on sale of business, net | $ | 48,871 | $ | — | $ | 48,871 | N/A | ||||||
Interest income | 2,819 | 1,331 | 1,488 | 112% | |||||||||
Interest expense | (8,487 | ) | (7,431 | ) | (1,056 | ) | 14% | ||||||
Other income (expense), net | (929 | ) | (1,658 | ) | 729 | (44)% | |||||||
Total other income (expense), net | $ | 42,274 | $ | (7,758 | ) | $ | 50,032 | (645)% | |||||
In December 2019, we entered into a License and Asset Purchase Agreement, or LAPA, and service and supply agreements, or SSAs, with Veracyte, Inc, or Veracyte. Pursuant to the LAPA, we completed a license of intellectual property and a sale of certain assets to Veracyte relating to our nCounter FLEX system for use in clinical diagnostic applications. Veracyte also acquired certain intellectual property rights and worldwide distribution rights relating to our Prosigna Breast Cancer Assay and our LymphMark assay and certain clinical diagnostic assay software modules that operate with the nCounter FLEX system.
Pursuant to the terms of the LAPA, Veracyte paid us total consideration of $50.0 million, consisting of $40.0 million in cash paid in connection with the entry into the LAPA, and 376,732 shares of Veracyte common stock valued at $10.0 million, which shares were issued in connection with the entry into the LAPA. Additionally, we may receive future potential milestone payments of up to $10.0 million in the aggregate, to be paid upon the launch of additional clinical diagnostic tests by Veracyte for our nCounter FLEX platform. In addition, we assigned our license agreement with Bioclassifier, LLC to Veracyte, which includes Veracyte’s assumption of the obligation to pay specified royalties under the agreement with Bioclassifier, LLC. Pursuant to the LAPA, Veracyte offered certain of our employees employment with Veracyte.
For the year ended December 31, 2019, we have included an aggregate of $48.9 million as a separate line item in our consolidated statement of operations reflecting our gain on sale of business net of transaction costs of $1.1 million related to this transaction. As of December 31, 2019, we have included the shares of Veracyte common stock received in the transaction, at their fair value of $10.5 million, within short-term investments, and the $40.0 million of cash received on the closing date has been included in cash and cash equivalents in the consolidated balance sheets.
Interest expense increased for the year ended December 31, 2019 due primarily to increased borrowings outstanding under our term loan agreement. The average balance of long-term debt outstanding during 2019 was $73.2 million as compared to $52.5 million for 2018. Interest income increased for the year ended December 31, 2019, due to higher interest rates earned on investment holdings as well as an increase in our average investment balance during the year. Other income (expense), net is comprised primarily of estimated costs for certain state and local taxes and realized and unrealized gains or losses associated with foreign currency transactions primarily denominated in the Euro and British Pounds.
-54-
Comparison of Years Ended December 31, 2018 and 2017
Revenue
Year Ended December 31, | Change | ||||||||||||
2018 | 2017 | Dollars | Percentage | ||||||||||
(Dollars in thousands) | |||||||||||||
Product revenue: | |||||||||||||
Instruments | $ | 21,441 | $ | 20,839 | $ | 602 | 3% | ||||||
Consumables | 43,847 | 38,311 | 5,536 | 14% | |||||||||
In vitro diagnostic kits | 9,445 | 6,745 | 2,700 | 40% | |||||||||
Total product revenue | 74,733 | 65,895 | 8,838 | 13% | |||||||||
Service revenue | 8,790 | 6,115 | 2,675 | 44% | |||||||||
Total product and service revenue | 83,523 | 72,010 | 11,513 | 16% | |||||||||
Collaboration revenue | 23,209 | 42,895 | (19,686 | ) | (46)% | ||||||||
Total revenue | $ | 106,732 | $ | 114,905 | $ | (8,173 | ) | (7)% | |||||
Instrument revenue for the year ended December 31, 2018 increased as compared to the prior year, due primarily to an increase in the number of instruments sold. The magnitude of the instrument revenue increase was partially offset by a shift in sales mix towards our SPRINT instruments, which generally have lower average selling prices than our MAX and FLEX instruments. Consumables revenue increased for the year ended December 31, 2018, primarily as a result of our growing installed base of nCounter Analysis Systems, as well as growth in sales of our standardized panel consumable products. In vitro diagnostic kit revenue represents sales of Prosigna assays, which increased for the year ended December 31, 2018 as more testing providers commenced providing services and testing volumes increased, most significantly in territories outside of the United States. The increase in service revenue was primarily related to an increase in the number of installed instruments covered by service contracts, and also increases in revenue generated from technology access fees, particularly fees related to services offered pursuant to our GeoMx DSP Technology Access Program. Our product and service revenue may continue to increase in future periods as a result of our increased investments in sales and marketing activities, the growth in sales of our nCounter consumable products as driven by our increasing installed base of nCounter instruments, the introduction of new nCounter consumable products, the continued sale of additional nCounter instruments and the potential commercial launch of new product platforms such as our GeoMx DSP and Hyb & Seq product candidates. As an offset to our anticipated expenses relating to the development of our Hyb & Seq platform, Lam has committed to provide up to $50.0 million in funding, of which $35.1 million has been funded as of December 31, 2018.
Collaboration revenue decreased for the year ended December 31, 2018 as compared to the prior year, due primarily to the termination of our collaboration with Medivation/Astellas in 2017. The termination resulted in the recognition of deferred collaboration revenue of $11.5 million for the year ended December 31, 2017, which represented all of the remaining deferred revenue relating to the terminated collaboration. In addition, the scope of our collaboration with Merck changed during the fourth quarter of 2017, resulting in a further reduction of collaboration revenue in 2018 as compared to the same period in 2017. These decreases were partially offset by collaboration revenue generated from our agreements with Lam and Celgene. Our collaboration agreement with Lam was entered into during the third quarter of 2017 and represented $18.6 million of collaboration revenue for the year ended December 31, 2018. Collaboration revenue related to our agreement with Lam was $3.7 million for the year ended December 31, 2017.
Cost of Product and Service Revenue; Gross Profit; and Gross Margin
Year Ended December 31, | Change | ||||||||||||
2018 | 2017 | Dollars | Percentage | ||||||||||
(Dollars in thousands) | |||||||||||||
Cost of product and service revenue | $ | 36,331 | $ | 31,880 | $ | 4,451 | 14% | ||||||
Product and service gross profit | $ | 47,192 | $ | 40,130 | $ | 7,062 | 18% | ||||||
Product and service gross margin | 57 | % | 56 | % | |||||||||
For the year ended December 31, 2018, cost of product and service revenue increased as compared to the same periods in 2017, due to higher volumes of instruments and consumables sold, including our Prosigna in vitro diagnostic kits, as well as increased volume of service contracts associated with our growing installed base of nCounter instruments. Our gross margin on product and service revenue for the year ended December 31, 2018 increased compared to the prior year primarily as a result of increased consumable revenue as a percentage of our overall sales mix, including sales of our Prosigna in vitro diagnostic kits, which generally have higher gross margins than our instrument placements, as well as increasing sales of our nCounter panel
-55-
products as a percentage of our consumables revenue. The favorable mix shift towards consumables comprising a higher percentage of our total product and service revenues was partially offset by an increase in the number of lower margin SPRINT instrument sales, and modestly lower average selling prices realized across all instrument sales, as compared to the prior year. In addition, our gross margin during the year ended December 31, 2018 was also impacted by increases in outside consulting and other costs relating to quality assurance and system requirements for diagnostic products related manufacturing.
We expect our cost of product and service revenue to increase in future periods, primarily due to our expected growth in product and service revenue. We expect our gross margin on product and service revenue may fluctuate in future periods, depending upon our mix of instrument sales, from which we typically record lower gross margins, as compared to our sales of consumable products or services, the impact of the launch, and any sales achieved, of our new product platforms such as our GeoMx or Hyb & Seq product platforms, which during any initial launch may impact our mix of instruments sold as compared to consumables, and potential expenses we may incur for regulatory compliance, quality assurance or related to the expansion of our manufacturing capacity. Any costs related to collaboration revenue are included in research and development expense.
Research and Development Expense
Year Ended December 31, | Change | ||||||||||||
2018 | 2017 | Dollars | Percentage | ||||||||||
(Dollars in thousands) | |||||||||||||
Research and development expense | $ | 61,599 | $ | 46,888 | $ | 14,711 | 31% | ||||||
The increase in research and development expense for the year ended December 31, 2018 was primarily attributable to an increase in staffing and personnel-related costs of $6.2 million, as well as increased supply costs of $4.1 million and professional fees of $3.6 million. These increased costs were incurred primarily to support the development of our GeoMx DSP and Hyb & Seq platforms. We expect that research and development costs may continue to increase in future periods to support remaining product development activities relating to our GeoMx DSP and Hyb & Seq platforms.
Selling, General and Administrative Expense
Year Ended December 31, | Change | ||||||||||||
2018 | 2017 | Dollars | Percentage | ||||||||||
(Dollars in thousands) | |||||||||||||
Selling, general and administrative expense | $ | 78,195 | $ | 74,334 | $ | 3,861 | 5% | ||||||
The increase in selling, general and administrative expense for the year ended December 31, 2018 was primarily attributable to an increase in staffing and personnel-related costs of $2.6 million to support our sales, marketing and administrative functions, as well as an increase in professional fees of $1.1 million related to legal, consulting and other costs associated with activities and implementation of certain processes relating to our compliance with the Sarbanes Oxley Act. These increases were partially offset by lower sales and marketing costs of $1.0 million related to fewer promotional events and other external activities. We expect selling, general and administrative expense to increase in future periods as the number of sales, technical support and marketing and administrative personnel grows to support the expected growth in our existing lines of business, as well as to support the introduction of new products and product platforms, including our new GeoMx DSP and Hyb & Seq product platforms.
Other Income (Expense), net
Year Ended December 31, | Change | ||||||||||||
2018 | 2017 | Dollars | Percentage | ||||||||||
(Dollars in thousands) | |||||||||||||
Interest income | $ | 1,331 | $ | 809 | $ | 522 | 65% | ||||||
Interest expense | (7,431 | ) | (6,153 | ) | (1,278 | ) | 21% | ||||||
Other income (expense), net | (1,658 | ) | 183 | (1,841 | ) | (1,006)% | |||||||
Total other income (expense), net | $ | (7,758 | ) | $ | (5,161 | ) | $ | (2,597 | ) | 50% | |||
Interest expense increased for the year ended December 31, 2018 due primarily to having a higher average balance of long-term debt outstanding during 2018 which was $52.5 million as compared to $48.6 million for 2017. In addition, as a result of the replacement of our long-term debt facility with CRG, we incurred a loss on extinguishment of the original long-term debt which totaled $0.8 million. Interest income increased for the year ending December 31, 2018, due to higher interest rates as well as an increased average investment balance during the year. Other income (expense), net is primarily related to estimated costs for certain state and local taxes and to realized and unrealized gains or losses associated with foreign currency
-56-
transactions primarily denominated in the Euro and British Pounds, both of which generally weakened relative to the U.S. Dollar for the year ending December 31, 2018, compared to the prior year.
Liquidity and Capital Resources
As of December 31, 2019, we had cash, cash equivalents and short-term investments of $156.9 million, compared to $94.0 million as of December 31, 2018. We believe our existing cash, cash equivalents and short-term investments will be sufficient to meet our working capital and capital expenditure needs for at least the next 12 months. However, we may need to raise additional capital to expand the commercialization of our products, fund our operations and further our research and development activities. Our future funding requirements will depend on many factors, including: market acceptance and the level of sales of our existing products and new product candidates; the nature and timing of any additional research, product development or other partnerships or collaborations we may establish; the cost and timing of establishing additional sales, marketing and distribution capabilities; the cost of our research and development activities; the cost and timing of regulatory clearances or approvals; the effect of competing technological and market developments; and the extent to which we acquire or invest in businesses, products and technologies, although we currently have no commitments or agreements relating to any of these types of transactions.
We may require additional funds in the future and we may not be able to obtain such funds on acceptable terms, or at all. If we raise additional funds by issuing equity or equity-linked securities, our stockholders may experience dilution. Debt financing, if available, may involve covenants restricting our operations or our ability to incur additional debt. Any debt or additional equity financing that we raise may contain terms that are not favorable to us or our stockholders. If we raise additional funds through partnership, collaboration or licensing arrangements with third parties, it may be necessary to relinquish some rights to our technologies or our products, or grant licenses on terms that are not favorable to us. If we are unable to raise adequate funds, we may have to liquidate some or all of our assets, delay or reduce the scope of or eliminate some or all of our research and development programs, delay development, launch activities or commercialization of our products or license to third parties the rights to commercialize products or technologies that we would otherwise seek to commercialize, or reduce marketing, customer support or other resources devoted to our products or cease operations.
Sources of Funds
Since inception, we have financed our operations primarily through the sale of equity securities, licensing of intellectual property and sales of certain assets and, from borrowings under term loan agreements. Our cash used in operations for the year ended December 31, 2019 was $89.4 million, including $16.4 million in cash receipts from our collaboration agreements. The timing and amount of such receipts in the future are uncertain, and therefore we may be required to secure larger amounts of cash to fund our planned operations.
Equity Financings
In March 2019, we completed an underwritten public offering of 3,175,000 shares of our common stock, including the exercise in full by the underwriters of their option to purchase 675,000 additional shares of common stock. An additional 2,000,000 shares were sold by a related party stockholder. Our total gross proceeds were $73.0 million. We did not receive any proceeds from the sale of shares of common stock by the related party stockholder. After underwriter’s commissions and other expenses of the offering, and net of proceeds received by the related party stockholder, our aggregate net proceeds were approximately $68.3 million.
In July 2018, we completed an underwritten public offering of 4,600,000 shares of common stock, including the exercise in full by the underwriters of their option to purchase 600,000 additional shares of common stock in August 2018, for total gross proceeds of $57.5 million. After underwriter’s commissions and other expenses of the offering, our aggregate net proceeds were approximately $53.8 million.
In January 2018, we entered into a sales agreement with a sales agent to sell shares of our common stock through an “at the market” equity offering program for up to $40.0 million in gross cash proceeds. In March 2019, subsequent to our most recent underwritten public offering, we terminated this agreement. No shares of our common stock were sold under this agreement.
In June 2017, we completed an underwritten public offering of 3,450,000 shares of common stock, including the exercise by the underwriter of an over-allotment option for 450,000 shares of common stock, for total gross proceeds of $57.8 million. After underwriters’ fees and commissions and other expenses of the offering, our aggregate net proceeds were approximately $56.5 million.
-57-
Debt Instruments
Term Loan Agreements
In April 2014, we entered into a term loan agreement, or the 2014 Term Loan, under which we borrowed $45.0 million. The 2014 Term Loan accrues interest at an annual rate of 12.0%, payable quarterly, of which 3.0% can be deferred during the first six years of the term at our option and paid together with the principal at maturity. The 2014 Term Loan had an interest-only period through March 2021 and a final maturity date of March 2022.
In October 2018, we entered into an amended and restated term loan agreement, or the 2018 Term Loan, under which we may borrow up to $100.0 million, with any amounts borrowed due and payable in September 2024. At closing, we received net proceeds of approximately $7.8 million, pursuant to borrowings of $60.0 million under the new facility, net of repayment of principal and interest outstanding under our prior term loan agreement of $50.4 million, including deferred interest and transaction-related fees and expenses. In June 2019, we borrowed an additional $20.0 million under the 2018 Term Loan. At our option, an additional $20.0 million of additional borrowings are available until March 2020, as we have met the required annual revenue thresholds as of December 31, 2019. As of the date of this annual report, we have not made any additional borrowings under the 2018 Term Loan
The 2018 Term Loan accrues interest at a rate of 10.5%, payable quarterly, of which 3.0% may be deferred during the six-year term at our option and repaid at maturity together with the principal. We paid an upfront fee of 0.5% of the aggregate principal amount of the initial borrowing under the 2018 Term Loan, and will pay a facility fee equal to 2.0% of the total amount borrowed including any deferred interest at the time the principal is repaid. A long-term liability of $1.9 million is being accreted using the effective interest method for the facility fee over the term of the 2018 Term Loan. Additional borrowings under the 2018 Term Loan will bear the same upfront and facility fees as the initial borrowing.
In connection with entry into the 2018 Term Loan, warrants to purchase an aggregate of 341,578 shares of common stock with an exercise price per share of $21.12 were issued to the lenders. In June 2019, in connection with the borrowing of an additional $20.0 million principal amount, warrants to purchase an aggregate of 128,932 shares of common stock with an exercise price per share of $34.20 were issued to lenders. If additional amounts are borrowed under the 2018 Term Loan, additional warrants will be issued on each subsequent draw date for 0.3% of the fully-diluted shares then outstanding. The exercise price for additional warrants will be set at a 25.0% premium to the average closing trading price for the 30-day trading period as of the date immediately before the applicable draw date. The warrants issued under the 2018 Term Loan were determined to be closely linked to our common stock and, as such, were recorded as an equity security in additional paid-in capital at their relative fair value of $1.6 million and $1.0 million, in October 2018 and June 2019, respectively, with a corresponding debt discount recorded against the 2018 Term Loan balance outstanding.
Total borrowings and deferred interest under the 2018 Term Loan were $82.6 million and $60.4 million as of December 31, 2019 and December 31, 2018, respectively. The balance of the 2018 Term Loan as of December 31, 2019 and December 31, 2018 is net of discounts related to the warrants, debt issuance costs and other upfront fees of $2.6 million and $2.0 million, respectively.
We have the option to prepay the 2018 Term Loan, in whole or part, at any time subject to payment of a redemption fee of up to 4.0% during the first year of the term, 3.0% during the second year of the term and with no redemption fee payable if prepayment occurs after the second year of the loan.
Obligations under the 2018 Term Loan are collateralized by substantially all of our assets. The 2018 Term Loan contains customary conditions to borrowings, events of default and covenants, including negative covenants that could limit our ability to, among other things, incur additional indebtedness, liens or other encumbrances; make dividends or other distributions; buy, sell or transfer assets; engage in any new line of business; and enter into certain transactions with affiliates. The 2018 Term Loan also includes a $2.0 million minimum liquidity covenant and minimum annual revenue-based financial covenants. If our actual revenue is below the minimum annual revenue requirement for any given year, we may avoid a related default by generating proceeds from an equity or subordinated debt issuance equal to the shortfall between our actual revenues and the minimum revenue requirement. We were in compliance with our financial covenants under the 2018 Term Loan agreement as of December 31, 2019.
2018 Revolving Loan Facility
In January 2018, we entered into a $15.0 million secured revolving loan facility, with availability subject to a borrowing base consisting of eligible accounts receivable. In November 2018, we entered into an amended and restated loan and security agreement to increase the borrowing capacity under the facility to $20.0 million, amend the borrowing base to include finished goods inventory, and extend the final maturity under the facility to November 2021. As of December 31, 2019 and December 31, 2018, no amounts had been drawn on the facility.
-58-
Interest on borrowings is payable monthly and accrues at a yearly rate equal to the greater of (i) the prime rate as reported in the Wall Street Journal plus 0.50%, and (ii) 4.75%. During an event of default, amounts drawn accrue interest at a yearly rate equal to 8.75%. Obligations under the agreement are secured by our cash and cash equivalents, accounts receivable and proceeds thereof, and inventory and proceeds from the sale thereof. The lender’s interest in the collateral under the loan facility is senior to the lender’s interest in such collateral under the term loan agreement. The loan facility contains various customary representations and warranties, conditions to borrowing, events of default, including cross default provisions with respect to the loan facility, and covenants, including financial covenants requiring the maintenance of minimum annual revenue and liquidity. We were in compliance with our financial covenants under the secured revolving loan facility as of December 31, 2019.
2019 Sale of Business
In December 2019, we entered into a License and Asset Purchase Agreement, or LAPA, and service and supply agreements, or SSAs, with Veracyte, Inc, or Veracyte. Pursuant to the LAPA, we completed a license of intellectual property and a sale of certain assets to Veracyte relating to our nCounter FLEX system for use in clinical diagnostic applications. Veracyte also acquired certain intellectual property rights and worldwide distribution rights relating to our Prosigna Breast Cancer Assay and our LymphMark assay and certain clinical diagnostic assay software modules that operate with the nCounter FLEX system.
Pursuant to the terms of the LAPA, Veracyte paid us total consideration of $50.0 million, consisting of $40.0 million in cash, paid in connection with the entry into the LAPA, and 376,732 shares of Veracyte common stock valued at $10.0 million, which shares were issued in connection with the entry into the LAPA. Additionally, we may receive future potential milestone payments of up to $10.0 million in the aggregate, to be paid upon the launch of additional clinical diagnostic tests by Veracyte for our nCounter FLEX platform.
As of December 31, 2019, we have included the shares of Veracyte common stock received in the transaction, at their fair value of $10.5 million, within short-term investments, and the $40.0 million of cash received on the closing date has been included in cash and cash equivalents in the consolidated balance sheets.
Use of Funds
Our principal uses of cash are funding our operations, capital expenditures, working capital requirements and satisfaction of any outstanding obligations under our revolving or term loan facilities, respectively. Over the past several years, our product and service revenue has increased significantly from year to year and, as a result, our cash flows from customer collections have increased. However, our operating expenses have also increased as we have invested in our sales and marketing activities and in research and development of new product platforms and technologies that we believe have the potential to drive the long-term growth of our business.
Our operating cash requirements may increase in the future as we invest in research and development related to existing or new product platforms, including our nCounter and GeoMx DSP product platforms, as well as in sales and marketing activities to expand the installed base of our nCounter Analysis and GeoMx DSP systems and related consumable usage. We cannot be certain our revenue will grow sufficiently to offset our operating expense increases, nor can we be certain that we will be successful in continuing to generate cash from new partnerships or collaborations to help fund our operations. As a result, we may need to raise additional funds to support our operations, and such funding may not be available to us on acceptable terms, or at all. If we are unable to raise additional funds when needed, our operations and ability to execute our business strategy could be adversely affected.
Historical Cash Flow Trends
The following table shows a summary of our cash flows for the periods indicated:
Year Ended December 31, | |||||||||||
2019 | 2018 | 2017 | |||||||||
(In thousands) | |||||||||||
Cash used in operating activities | $ | (89,421 | ) | $ | (54,065 | ) | $ | (51,657 | ) | ||
Cash used in investing activities | (15,159 | ) | (22,925 | ) | (2,490 | ) | |||||
Cash provided by financing activities | 109,266 | 75,081 | 59,668 | ||||||||
Operating Cash Flows
We derive operating cash flows from cash collected from the sale of our products and services and from collaborations. These cash flows received are currently offset by our use of cash for operating expenses to support the growth
-59-
of our business. As a result, we have historically experienced negative cash flows from operating activities, with such negative cash flows likely to continue for the foreseeable future.
Net cash used in operating activities for 2019 consisted of our net loss of $40.7 million, and net increases in our operating assets and liabilities of $28.2 million, coupled with $20.5 million of net non-cash income and expense items, such as the gain on sale of business to Veracyte, stock-based compensation, depreciation and amortization, amortization of our right-of-use assets, deferred interest converted to principal pursuant to our term loan agreement and provisions for inventory obsolescence.
Net cash used in operating activities for 2018 consisted of our net loss of $77.4 million, partially offset by $8.9 million of changes in our operating assets and liabilities and $14.4 million of net non-cash income and expense items, such as stock-based compensation, depreciation and amortization, deferred interest converted to principal pursuant to our term loan agreement and provisions for bad debt and inventory obsolescence.
Net cash used in operating activities for 2017 consisted of our net loss of $43.6 million, plus the negative impact of decreases in our deferred revenue related to collaboration agreements of $29.2 million. The decrease in deferred revenue related to collaborations was due primarily to the termination of our Medivation/Astellas collaboration agreement and the change in scope of the Merck collaboration agreement, both of which resulted in the completion percentage used in the proportional performance model used for revenue recognition to increase substantially. As a result, we accelerated the recognition of revenue recognized during 2017, relative to the original planned project time lines and estimated costs. These unfavorable “uses” of funds were partially offset by $3.3 million of changes in our operating assets and liabilities and $17.8 million of net non-cash income and expense items, such as stock-based compensation, depreciation and amortization, deferred interest converted to principal pursuant to our term loan agreement and provisions for bad debt and inventory obsolescence.
Investing Cash Flows
Our most significant investing activity for 2019 related to the proceeds received pursuant to the sale of business to Veracyte. Additionally, for the years ended December 31, 2019, 2018 and 2017, we had significant activity related to the purchase, maturity and sale of short-term investments. Because we manage our cash usage with respect to our total cash, cash equivalents and short-term investments, we do not consider cash flows related to management of our short-term investments to be important to an understanding of our liquidity and capital resources.
In the years ended December 31, 2019, 2018 and 2017, we purchased property and equipment totaling $7.9 million, $4.5 million and $4.3 million respectively, which we believe will be required to support the growth and expansion of our operations.
Financing Cash Flows
Historically, we have funded our operations through the issuance of equity securities and debt borrowings.
Net cash provided by financing activities for 2019 consisted primarily of net proceeds of $68.3 million from an underwritten public offering of our common stock, borrowings of $20.0 million under our term loan agreement and $20.3 million of net proceeds from the vesting and exercise of employee stock awards and from proceeds associated with our Employee Stock Purchase Plan.
Net cash provided by financing activities for 2018 consisted of net proceeds of $53.8 million from an underwritten public offering, $13.5 million of net proceeds from our 2018 Term Loan, $3.5 million of proceeds from the exercise of stock options and $1.5 million from proceeds associated with our Employee Stock Purchase Plan.
Net cash provided by financing activities for 2017 consisted of net proceeds of $56.5 million from an underwritten public offering, $1.8 million from proceeds associated with our Employee Stock Purchase Plan and $1.1 million of proceeds from the exercise of stock options.
-60-
Contractual Obligations
The following table reflects a summary of our contractual obligations as of December 31, 2019.
Payments due by period | |||||||||||||||||||
Contractual Obligations(1) | Total | Less than 1 Year | 1-3 Years | 3-5 Years | More than 5 Years | ||||||||||||||
(In thousands) | |||||||||||||||||||
Lease obligations(2) | $ | 42,996 | $ | 6,180 | $ | 12,633 | $ | 13,196 | $ | 10,987 | |||||||||
Long-term debt obligations(3) | 82,593 | — | — | 82,593 | — | ||||||||||||||
Purchase obligations(4) | 27,609 | 25,591 | 2,018 | — | — | ||||||||||||||
Total | $ | 153,198 | $ | 31,771 | $ | 14,651 | $ | 95,789 | $ | 10,987 | |||||||||
(1) Excludes royalty obligations based on net sales of products, including royalties payable to the Institute for Systems Biology, as any such amounts are not currently determinable.
(2) Lease costs are primarily for office, laboratory and manufacturing space.
(3) Includes principal and deferred interest on long-term debt obligations.
(4) Purchase obligations consist of contractual and legally binding commitments under outstanding purchase orders to purchase long lead time inventory and other research and development items.
Critical Accounting Policies and Significant Estimates
Our discussion and analysis of our financial condition and results of operations are based upon our financial statements which have been prepared in accordance with U.S. generally accepted accounting principles, or GAAP. The preparation of these financial statements requires us to make estimates and judgments that affect the reported amounts of assets and liabilities and related disclosure of contingent assets and liabilities, revenue and expenses at the date of the financial statements. Generally, we base our estimates on historical experience and on various other assumptions in accordance with GAAP that we believe to be reasonable under the circumstances. Actual results may differ from these estimates.
Critical accounting policies and estimates are those that we consider the most important to the portrayal of our financial condition and results of operations because they require our most difficult, subjective or complex judgments, often as a result of the need to make estimates about the effect of matters that are inherently uncertain. Our critical accounting policies and estimates include those related to:
• | revenue recognition; |
• | stock-based compensation; |
• | inventory valuation; |
• | fair value measurements; and |
• | income taxes. |
Revenue Recognition
We generate the majority of our revenue from sales of products and services. Our products consist of our nCounter Analysis System and GeoMx DSP system, and related consumables. Services consist of instrument service contracts and service fees for assay processing.
Revenue is recognized when control of the promised goods or services is transferred to our customers, in an amount that reflects the consideration expected to be received in exchange for those products and services. This process involves identifying the contract with a customer, determining the performance obligations in the contract, determining the contract price, allocating the contract price to the distinct performance obligations in the contract, and recognizing revenue when the performance obligations have been satisfied. A performance obligation is considered distinct from other obligations in a contract when it provides a benefit to the customer either on its own or together with other resources that are readily available to the customer and is separately identified in the contract. Performance obligations are considered satisfied once control of a product or service has transferred to the customer, meaning the customer has the ability to use and obtain the benefit of the product or service. Revenue is recognized for satisfied performance obligations only when there are no uncertainties regarding payment terms or transfer of control.
Revenue from instruments and consumables, including in vitro diagnostic kits, is recognized generally upon shipment to the end customer, which is when control of the product has been transferred to the customer. Performance obligations related to instrument sales are reviewed on a contract-by-contract basis, as individual contract terms may vary, and may include
-61-
installation and calibration services. Performance obligations for consumable products are generally completed upon shipment to the customer. Instrument revenue related to installation and calibration services is recognized when the customer has possession of the instrument and the services have been performed. Such services can also be provided by our distribution partners and other third parties. For instruments sold solely to run in vitro diagnostic assays, such as the Prosigna assay, training the customer is not considered a performance obligation separable from the instrument and, as such, that training must be provided by us prior to any revenue recognition related to the instrument sale.
Instrument service contracts are sold with contract terms ranging from 12-36 months and cover periods after the end of the initial 12-month warranty. These contracts include services to maintain performance within our designed specifications and a minimum of one preventative maintenance service procedure during the contract term. Revenue from services to maintain designed specifications is considered a stand-ready obligation and recognized evenly over the contract term and service revenue related to preventative maintenance of instruments is recognized when the procedure is completed. Revenue from service fees for assay processing is recognized upon the rendering of the related performance obligation.
For arrangements with multiple performance obligations, we allocate the contract price in proportion to its stand-alone selling price. We use our best estimate of stand-alone selling price for our products and services based on average selling prices over a 12-month period and review our stand-alone prices annually.
Product and service revenues from sales to customers through distributors are recognized consistent with the policies and practices for direct sales to customers, as described above.
We have historically entered into collaboration agreements that may generate upfront fees, and may enter into such agreements in the future, and in some cases subsequent milestone payments that may be earned upon completion of certain product development milestones or other designated activities. We are able to estimate the total expected cost of product development and other services under these arrangements and recognize collaboration revenue using a contingency-adjusted proportional performance model. Costs incurred to date compared to total expected costs are used to determine proportional performance, as this is considered to be representative of the delivery of outputs under the arrangements. Revenue recognized at any point in time is limited to cash received, amounts contractually due, or the amounts of any product development or other contractual milestone payments when achievement of a milestone is deemed to be probable. Changes in estimates of total expected collaboration product development or other costs are accounted for prospectively as a change in estimate. From period to period, collaboration revenue can fluctuate substantially based on the achievement or probable achievement of product development or other milestones, or as estimates of total expected collaboration product development or other costs are changed or updated. We may recognize revenue from collaboration agreements that do not include upfront or milestone-based payments. Amounts due to collaboration partners are recognized when the related activities have occurred and are classified in the statement of operations, generally as research and development expense, based on the nature of the related activities.
Stock-based Compensation
We account for stock-based compensation at fair value. Stock-based compensation costs for stock option awards are recognized based on their grant date fair value estimated using the Black-Scholes option pricing model. Stock-based compensation costs for restricted stock units, or RSUs, are recognized based on their grant date fair value estimated using the intrinsic method. Stock-based compensation expense recognized in the consolidated statements of operations is based on awards ultimately expected to vest using actual forfeitures when incurred. We use the straight-line method of allocating compensation cost over the requisite service period of the related award.
Determining the fair value of stock-based awards at the grant date under the Black-Scholes option pricing model requires judgment, including estimating the value per share of our common stock, risk-free interest rate, expected term and dividend yield and volatility. The assumptions used in calculating the fair value of stock-based awards represent our best estimates based on management judgment and subjective future expectations. These estimates involve inherent uncertainties. If any of the assumptions used in the Black-Scholes option pricing model significantly change, stock-based compensation for future awards may differ materially from the awards granted previously.
The expected term of options granted is based on historical experience of similar awards and expectations of future employee behavior. The risk-free interest rate for the expected term of the option is based on the U.S. Treasury yield curve in effect at the time of grant. We have not paid and do not anticipate paying cash dividends on our common stock; therefore, the expected dividend yield is assumed to be zero. We calculated volatility based on our share price activity throughout the year.
Inventory Valuation
Inventory consists of raw materials, certain component parts to be used in manufacturing our products and finished goods. Inventory is stated at the lower of cost or market. Cost is determined using a standard cost system, whereby the standard costs are updated periodically to reflect current costs and market represents the lower of replacement cost or estimated net realizable value. We record adjustments to inventory for potentially excess, obsolete, slow-moving or impaired items. The
-62-
business environment in which we operate is subject to rapid changes in technology and customer demand. We regularly review inventory for excess and obsolete products and components, taking into account product life cycle and development plans, product expiration and quality issues, historical experience and our current inventory levels. If actual market conditions are less favorable than anticipated, additional inventory adjustments could be required.
Fair value of financial instruments
The recorded amounts of certain financial instruments, including cash and cash equivalents, accounts receivable, prepaid expenses and other assets, accounts payable and accrued liabilities approximate fair value due to their relatively short maturities. Investments that are classified as available-for-sale are recorded at fair value. The fair value for debt securities held is determined using quoted market prices, broker or dealer quotations, or alternative pricing sources with reasonable levels of price transparency. The recorded amount of our long-term debt approximates fair value because the related interest rates approximate rates currently available to us.
Income Taxes
We account for income taxes under the liability method. Under the liability method, deferred tax assets and liabilities are determined based on the differences between the financial reporting and income tax bases of assets and liabilities and are measured using the tax rates that will be in effect when the differences are expected to reverse. A valuation allowance is recorded when it is more likely than not that some of the deferred tax assets will not be realized.
We determine whether a tax position is more likely than not to be sustained upon examination based on the technical merits of the position. For tax positions meeting the more-likely-than-not threshold, the tax amount recognized in the financial statements is reduced by the largest benefit that has a greater than 50% likelihood of being realized upon ultimate settlement with the relevant tax authority.
Recent Accounting Pronouncements
For information regarding recent accounting pronouncements, see Note 2 of the Notes to the Consolidated Financial Statements under Item 8 of this report.
Off-Balance Sheet Arrangements
We do not have any relationships with unconsolidated entities or financial partnerships, such as entities often referred to as structured finance or special purpose entities, which would have been established for the purpose of facilitating off-balance sheet arrangements or for any other contractually narrow or limited purpose.
Item 7A. Quantitative and Qualitative Disclosures About Market Risk
We are exposed to various market risks, including changes in commodity prices and interest rates. Market risk is the potential loss arising from adverse changes in market rates and prices. Prices for our products are largely denominated in U.S. dollars and, as a result, we do not face significant risk with respect to foreign currency exchange rates.
Interest Rate Risk
Generally, our exposure to market risk has been primarily limited to interest income sensitivity, which is affected by changes in the general level of U.S. interest rates, particularly because the majority of our investments are in short-term debt securities. The primary objective of our investment activities is to preserve principal while at the same time maximizing the income we receive without significantly increasing risk. To minimize risk, we maintain our portfolio of cash, cash equivalents and short-term investments in a variety of interest-bearing instruments, which have included U.S. government and agency securities, high-grade U.S. corporate bonds, asset-backed securities, and money market funds. Declines in interest rates, however, would reduce future investment income. A 10% decline in interest rates, occurring on January 1, 2020 and sustained throughout the period ending December 31, 2020, would not be material.
As of December 31, 2019, the principal and deferred interest outstanding under our term borrowings was $82.6 million. The interest rates on our term borrowings under our credit facility are fixed. If overall interest rates had increased by 10% during the periods presented, our interest expense would not have been affected.
Foreign Currency Exchange Risk
As we continue to expand internationally our results of operations and cash flows will become increasingly subject to fluctuations due to changes in foreign currency exchange rates. Historically, a majority of our revenue has been denominated in U.S. dollars, although we sell our products and services directly in certain markets outside of the United States denominated in
-63-
local currency, principally the Euro. Our expenses are generally denominated in the currencies in which our operations are located, which is primarily in the United States. The effect of a 10% adverse change in exchange rates on foreign denominated cash, receivables and payables would not have been material for the periods presented. As our operations in countries outside of the United States grow, our results of operations and cash flows will be subject to potentially greater fluctuations due to changes in foreign currency exchange rates, which could harm our business in the future. To date, we have not entered into any material foreign currency hedging contracts although we may do so in the future.
Inflation Risk
We do not believe that inflation has had a material effect on our business, financial condition or results of operations. If our costs were to become subject to significant inflationary pressures, we may not be able to fully offset such higher costs through price increases. Our inability or failure to do so could adversely affect our business, financial condition and results of operations.
-64-
Item 8. Financial Statements and Supplementary Data
INDEX TO CONSOLIDATED FINANCIAL STATEMENTS
NANOSTRING TECHNOLOGIES, INC.
Page(s) | |
Financial Statements: | |
-65-
Report of Independent Registered Public Accounting Firm
To the Board of Directors and Stockholders of NanoString Technologies, Inc.
Opinions on the Financial Statements and Internal Control over Financial Reporting
We have audited the accompanying consolidated balance sheets of NanoString Technologies, Inc. and its subsidiaries (the “Company”) as of December 31, 2019 and 2018, and the related consolidated statements of operations, comprehensive loss, changes in stockholders’ equity and cash flows for each of the three years in the period ended December 31, 2019, including the related notes (collectively referred to as the “consolidated financial statements”). We also have audited the Company’s internal control over financial reporting as of December 31, 2019, based on criteria established in Internal Control - Integrated Framework (2013) issued by the Committee of Sponsoring Organizations of the Treadway Commission (COSO).
In our opinion, the consolidated financial statements referred to above present fairly, in all material respects, the financial position of the Company as of December 31, 2019 and 2018, and the results of its operations and its cash flows for each of the three years in the period ended December 31, 2019 in conformity with accounting principles generally accepted in the United States of America. Also in our opinion, the Company did not maintain, in all material respects, effective internal control over financial reporting as of December 31, 2019, based on criteria established in Internal Control - Integrated Framework (2013) issued by the COSO because material weaknesses in internal control over financial reporting existed as of that date related to (i) an ineffective control environment as the Company had an insufficient complement of resources with an appropriate level of controls knowledge, expertise and training commensurate with the Company’s financial reporting requirements which contributed to additional material weaknesses in that the Company, (ii) did not design and maintain effective information technology general controls for the significant applications used in the preparation of the financial statements, (iii) did not design and maintain effective controls to timely detect and independently review instances where individuals with access to post a journal entry may also have edited or created the journal entry, (iv) did not design and maintain effective controls related to the completeness, accuracy and occurrence of customer order entry, price and quantity during the product and services billing and revenue processes and (v) did not maintain effective controls related to the existence of inventory.
A material weakness is a deficiency, or a combination of deficiencies, in internal control over financial reporting, such that there is a reasonable possibility that a material misstatement of the annual or interim financial statements will not be prevented or detected on a timely basis. The material weaknesses referred to above are described in Management’s Annual Report on Internal Control over Financial Reporting appearing under Item 9A. We considered these material weaknesses in determining the nature, timing, and extent of audit tests applied in our audit of the 2019 consolidated financial statements, and our opinion regarding the effectiveness of the Company’s internal control over financial reporting does not affect our opinion on those consolidated financial statements.
Change in Accounting Principle
As discussed in Note 2 to the consolidated financial statements, the Company changed the manner in which it accounts for leases in 2019.
Basis for Opinions
The Company’s management is responsible for these consolidated financial statements, for maintaining effective internal control over financial reporting, and for its assessment of the effectiveness of internal control over financial reporting included in management’s report referred to above. Our responsibility is to express opinions on the Company’s consolidated financial statements and on the Company’s internal control over financial reporting based on our audits. We are a public accounting firm registered with the Public Company Accounting Oversight Board (United States) (PCAOB) and are required to be independent with respect to the Company in accordance with the U.S. federal securities laws and the applicable rules and regulations of the Securities and Exchange Commission and the PCAOB.
We conducted our audits in accordance with the standards of the PCAOB. Those standards require that we plan and perform the audits to obtain reasonable assurance about whether the consolidated financial statements are free of material misstatement, whether due to error or fraud, and whether effective internal control over financial reporting was maintained in all material respects.
Our audits of the consolidated financial statements included performing procedures to assess the risks of material misstatement of the consolidated financial statements, whether due to error or fraud, and performing procedures that respond to those risks. Such procedures included examining, on a test basis, evidence regarding the amounts and disclosures in the consolidated
-66-
financial statements. Our audits also included evaluating the accounting principles used and significant estimates made by management, as well as evaluating the overall presentation of the consolidated financial statements. Our audit of internal control over financial reporting included obtaining an understanding of internal control over financial reporting, assessing the risk that a material weakness exists, and testing and evaluating the design and operating effectiveness of internal control based on the assessed risk. Our audits also included performing such other procedures as we considered necessary in the circumstances. We believe that our audits provide a reasonable basis for our opinions.
Definition and Limitations of Internal Control over Financial Reporting
A company’s internal control over financial reporting is a process designed to provide reasonable assurance regarding the reliability of financial reporting and the preparation of financial statements for external purposes in accordance with generally accepted accounting principles. A company’s internal control over financial reporting includes those policies and procedures that (i) pertain to the maintenance of records that, in reasonable detail, accurately and fairly reflect the transactions and dispositions of the assets of the company; (ii) provide reasonable assurance that transactions are recorded as necessary to permit preparation of financial statements in accordance with generally accepted accounting principles, and that receipts and expenditures of the company are being made only in accordance with authorizations of management and directors of the company; and (iii) provide reasonable assurance regarding prevention or timely detection of unauthorized acquisition, use, or disposition of the company’s assets that could have a material effect on the financial statements.
Because of its inherent limitations, internal control over financial reporting may not prevent or detect misstatements. Also, projections of any evaluation of effectiveness to future periods are subject to the risk that controls may become inadequate because of changes in conditions, or that the degree of compliance with the policies or procedures may deteriorate.
Critical Audit Matters
The critical audit matters communicated below are matters arising from the current period audit of the consolidated financial statements that were communicated or required to be communicated to the audit committee and that (i) relate to accounts or disclosures that are material to the consolidated financial statements and (ii) involved our especially challenging, subjective, or complex judgments. The communication of critical audit matters does not alter in any way our opinion on the consolidated financial statements, taken as a whole, and we are not, by communicating the critical audit matters below, providing separate opinions on the critical audit matters or on the accounts or disclosures to which they relate.
Consolidated Financial Statements - Impact of Control Environment, Information Technology General Controls and Journal Entry Controls
The completeness and accuracy of the consolidated financial statements, including the financial condition, results of operations and cash flows, is dependent on, in part, (i) designing and maintaining an effective control environment, including maintaining a sufficient complement of resources with an appropriate level of controls knowledge, expertise and training commensurate with financial reporting requirements, (ii) designing and maintaining effective information technology general controls for significant applications used in the preparation of the financial statements, including access and monitoring changes within the significant applications, and (iii) designing and maintaining effective controls to timely detect and independently review instances where individuals with access to post a journal may also have edited or created the journal entry.
The principal considerations for our determination that performing procedures relating to the consolidated financial statements - impact of control environment, information technology general controls and journal entry controls is a critical audit matter are there was a high degree of auditor judgment, subjectivity and effort in performing procedures and evaluating audit evidence related to the consolidated financial statements, information systems and journal entries. As described above in the “Opinions on the Financial Statements and Internal Control over Financial Reporting” section, material weaknesses related to (i) the control environment, (ii) information technology general controls and (iii) journal entry controls existed as of December 31, 2019.
Addressing the matter involved performing procedures and evaluating audit evidence in connection with forming our overall opinion on the consolidated financial statements. These procedures included, among others, evaluating the nature and extent of audit procedures performed and evidence obtained. These procedures also included manually testing the completeness and accuracy of system reports or other information generated by the Company’s information technology systems.
-67-
Revenue Recognition - Product and Services Revenue
As described in Notes 2 and 3 to the consolidated financial statements, the Company recognizes revenue when control of the promised goods or services is transferred to its customers, in an amount that reflects the consideration expected to be received in exchange for those products and services. The Company’s total product and services revenue was $103.7 million for the year ended December 31, 2019. The completeness, accuracy and occurrence of product and services revenue is dependent on customer orders being completely and accurately recorded and recognized in the Company’s customer billing and revenue processes.
The principal considerations for our determination that performing procedures relating to revenue recognition - product and services revenue is a critical audit matter are there was a high degree of auditor judgment, subjectivity and effort in performing procedures and evaluating audit evidence related to the completeness, accuracy and occurrence of product and services revenue. As described above in the “Opinions on the Financial Statements and Internal Control over Financial Reporting” section, a material weakness related to the billing and revenue controls existed as of December 31, 2019.
Addressing the matter involved performing procedures and evaluating audit evidence in connection with forming our overall opinion on the consolidated financial statements. These procedures included, among others, evaluating the nature and extent of audit procedures performed and evidence obtained. These procedures also included obtaining and inspecting source documents including cash receipts from customers, where applicable.
Inventory
As described in Notes 2 and 8 to the consolidated financial statements, inventory consists of finished goods, work in process, raw materials and certain component parts to be used in manufacturing or servicing the Company’s products. The Company’s total inventory value was $19.8 million as of December 31, 2019. The existence of inventory is dependent on the performance of periodic inventory counts, processing the receipt of inventory, and recording adjustments to inventory quantities in the Company’s inventory process.
The principal considerations for our determination that performing procedures relating to inventory is a critical audit matter are there was a high degree of auditor judgment and effort in performing procedures and evaluating audit evidence related to the existence of inventory. As described above in the “Opinions on the Financial Statements and Internal Control over Financial Reporting” section, a material weakness related to inventory controls existed as of December 31, 2019.
Addressing the matter involved performing procedures and evaluating audit evidence in connection with forming our overall opinion on the consolidated financial statements. These procedures included, among others, evaluating the nature and extent of audit procedures performed and evidence obtained. These procedures also included inventory count procedures and testing of inventory activity between the date of the inventory count procedures and December 31, 2019.
/s/ PricewaterhouseCoopers LLP
Seattle, Washington
March 2, 2020
We have served as the Company’s auditor since 2008.
-68-
NanoString Technologies, Inc.
Consolidated Balance Sheets
December 31, | |||||||
2019 | 2018 | ||||||
(In thousands, except par value amounts) | |||||||
Assets | |||||||
Current assets: | |||||||
Cash and cash equivalents | $ | 29,033 | $ | 24,356 | |||
Short-term investments | 127,822 | 69,641 | |||||
Accounts receivable, net | 27,153 | 17,279 | |||||
Inventory, net | 19,781 | 13,173 | |||||
Prepaid expenses and other current assets | 8,818 | 7,258 | |||||
Total current assets | 212,607 | 131,707 | |||||
Property and equipment, net | 20,184 | 15,171 | |||||
Operating lease right-of-use assets | 24,648 | — | |||||
Other assets | 2,315 | 680 | |||||
Total assets | $ | 259,754 | $ | 147,558 | |||
Liabilities and Stockholders’ Equity | |||||||
Current liabilities: | |||||||
Accounts payable | $ | 10,282 | $ | 8,636 | |||
Accrued liabilities | 4,973 | 3,705 | |||||
Accrued compensation and other employee benefits | 15,579 | 12,060 | |||||
Customer deposits | 6,389 | 8,167 | |||||
Deferred revenue, current portion | 3,997 | 9,890 | |||||
Deferred rent, current portion | — | 657 | |||||
Operating lease liabilities, current portion | 3,766 | — | |||||
Total current liabilities | 44,986 | 43,115 | |||||
Deferred revenue, net of current portion | 976 | 1,620 | |||||
Deferred rent and other liabilities, net of current portion | 322 | 7,558 | |||||
Long-term debt, net of discounts | 79,951 | 58,396 | |||||
Operating lease liabilities, net of current portion | 29,368 | — | |||||
Total liabilities | 155,603 | 110,689 | |||||
Commitments and contingencies (Note 16) | |||||||
Stockholders’ equity | |||||||
Preferred stock, $0.0001 par value, 15,000 shares authorized; none issued | — | — | |||||
Common stock, $0.0001 par value, 150,000 shares authorized; 36,298 and 30,913 shares issued and outstanding at December 31, 2019 and 2018, respectively | 4 | 3 | |||||
Additional paid-in-capital | 535,954 | 428,162 | |||||
Other comprehensive income (loss) | 145 | (40 | ) | ||||
Accumulated deficit | (431,952 | ) | (391,256 | ) | |||
Total stockholders’ equity | 104,151 | 36,869 | |||||
Total liabilities and stockholders’ equity | $ | 259,754 | $ | 147,558 | |||
The accompanying notes are an integral part of these consolidated financial statements.
-69-
NanoString Technologies, Inc.
Consolidated Statements of Operations
Years Ended December 31, | |||||||||||
2019 | 2018 | 2017 | |||||||||
(In thousands, except per share amounts) | |||||||||||
Revenue: | |||||||||||
Product and service | $ | 103,714 | $ | 83,523 | $ | 72,010 | |||||
Collaboration | 21,854 | 23,209 | 42,895 | ||||||||
Total revenue | 125,568 | 106,732 | 114,905 | ||||||||
Costs and expenses: | |||||||||||
Cost of product and service revenue | 44,039 | 36,331 | 31,880 | ||||||||
Research and development | 68,035 | 61,599 | 46,888 | ||||||||
Selling, general and administrative | 96,195 | 78,195 | 74,334 | ||||||||
Total costs and expenses | 208,269 | 176,125 | 153,102 | ||||||||
Loss from operations | (82,701 | ) | (69,393 | ) | (38,197 | ) | |||||
Other income (expense): | |||||||||||
Gain on sale of business, net | 48,871 | — | — | ||||||||
Interest income | 2,819 | 1,331 | 809 | ||||||||
Interest expense | (8,487 | ) | (7,431 | ) | (6,153 | ) | |||||
Other income (expense), net | (929 | ) | (1,658 | ) | 183 | ||||||
Total other income (expense), net | 42,274 | (7,758 | ) | (5,161 | ) | ||||||
Net loss before provision for income taxes | (40,427 | ) | (77,151 | ) | (43,358 | ) | |||||
Provision for income taxes | (269 | ) | (249 | ) | (204 | ) | |||||
Net loss | $ | (40,696 | ) | $ | (77,400 | ) | $ | (43,562 | ) | ||
Net loss per share—basic and diluted | $ | (1.18 | ) | $ | (2.78 | ) | $ | (1.84 | ) | ||
Weighted average shares used in computing basic and diluted net loss per share | 34,588 | 27,883 | 23,731 | ||||||||
The accompanying notes are an integral part of these consolidated financial statements.
-70-
NanoString Technologies, Inc.
Consolidated Statements of Comprehensive Loss
Years Ended December 31, | |||||||||||
2019 | 2018 | 2017 | |||||||||
(In thousands) | |||||||||||
Net loss | $ | (40,696 | ) | $ | (77,400 | ) | $ | (43,562 | ) | ||
Other comprehensive income (loss): | |||||||||||
Change in unrealized gain (loss) on short-term investments | 185 | 59 | (42 | ) | |||||||
Comprehensive loss | $ | (40,511 | ) | $ | (77,341 | ) | $ | (43,604 | ) | ||
The accompanying notes are an integral part of these consolidated financial statements.
-71-
NanoString Technologies, Inc.
Consolidated Statements of Changes in Stockholders’ Equity
Common Stock | Additional Paid-in Capital | Other Comprehensive Income (Loss) | Accumulated Deficit | Total Stockholders’ Equity | ||||||||||||||||||
Shares | Amount | |||||||||||||||||||||
(In thousands) | ||||||||||||||||||||||
Balances at January 1, 2017 | 21,529 | $ | 2 | $ | 281,900 | $ | (57 | ) | (269,540 | ) | $ | 12,305 | ||||||||||
Issuance of common stock net of issuance costs of $1.3 million | 3,450 | — | 56,486 | — | — | 56,486 | ||||||||||||||||
Issuance of common stock for employee stock purchase plan | 139 | — | 1,793 | — | — | 1,793 | ||||||||||||||||
Issuance of common stock warrants | — | — | 674 | — | — | 674 | ||||||||||||||||
Exercise of stock options | 228 | — | 1,086 | — | — | 1,086 | ||||||||||||||||
Exercise of common stock warrants, net | 29 | — | — | — | — | — | ||||||||||||||||
Vesting of restricted stock units, net | 46 | — | — | — | — | — | ||||||||||||||||
Stock-based compensation | — | — | 11,369 | — | — | 11,369 | ||||||||||||||||
Net loss | — | — | — | — | (43,562 | ) | (43,562 | ) | ||||||||||||||
Other comprehensive loss | — | — | — | (42 | ) | — | (42 | ) | ||||||||||||||
Balances at December 31, 2017 | 25,421 | 2 | 353,308 | (99 | ) | (313,102 | ) | 40,109 | ||||||||||||||
Cumulative effect of a change in accounting policy(1) | — | — | — | — | (754 | ) | (754 | ) | ||||||||||||||
Issuance of common stock net of issuance costs of $3.7 million | 4,600 | 1 | 53,828 | — | — | 53,829 | ||||||||||||||||
Issuance of common stock warrants | — | — | 4,593 | — | — | 4,593 | ||||||||||||||||
Exercise of stock options | 431 | — | 3,507 | — | — | 3,507 | ||||||||||||||||
Issuance of common stock for employee stock purchase plan | 257 | — | 1,451 | — | — | 1,451 | ||||||||||||||||
Exercise of common stock warrants, net | 118 | — | — | — | — | — | ||||||||||||||||
Vesting of restricted stock units, net | 86 | — | — | — | — | — | ||||||||||||||||
Stock-based compensation | — | — | 11,475 | — | — | 11,475 | ||||||||||||||||
Net loss | — | — | — | — | (77,400 | ) | (77,400 | ) | ||||||||||||||
Other comprehensive income | — | — | — | 59 | — | 59 | ||||||||||||||||
Balances at December 31, 2018 | 30,913 | 3 | 428,162 | (40 | ) | (391,256 | ) | 36,869 | ||||||||||||||
Issuance of common stock net of issuance costs of $4.7 million | 3,175 | — | 68,273 | — | — | 68,273 | ||||||||||||||||
Issuance of common stock warrants | — | 1 | 3,196 | — | — | 3,197 | ||||||||||||||||
Common stock issued for stock options and restricted stock units | 2,007 | — | 18,387 | — | — | 18,387 | ||||||||||||||||
Issuance of common stock for employee stock purchase plan | 203 | — | 1,952 | — | — | 1,952 | ||||||||||||||||
Tax payments from shares withheld for equity awards | — | — | (1,474 | ) | — | — | (1,474 | ) | ||||||||||||||
Stock-based compensation | — | — | 17,458 | — | — | 17,458 | ||||||||||||||||
Net loss | — | — | — | — | (40,696 | ) | (40,696 | ) | ||||||||||||||
Other comprehensive income | — | — | — | 185 | — | 185 | ||||||||||||||||
Balances at December 31, 2019 | 36,298 | $ | 4 | $ | 535,954 | $ | 145 | $ | (431,952 | ) | $ | 104,151 | ||||||||||
(1) Effective January 1, 2018, we adopted Accounting Standard Update No. 2014-09, Revenue from Contracts with Customers. See Note 2. Significant Accounting Policies and Note 3. Revenue from Contracts with Customers for more information. | |||||
The accompanying notes are an integral part of these consolidated financial statements.
-72-
NanoString Technologies, Inc.
Consolidated Statements of Cash Flows
Years Ended December 31, | |||||||||||
2019 | 2018 | 2017 | |||||||||
(In thousands) | |||||||||||
Operating activities | |||||||||||
Net loss | $ | (40,696 | ) | $ | (77,400 | ) | $ | (43,562 | ) | ||
Adjustments to reconcile net loss to net cash used in operating activities | |||||||||||
Depreciation and amortization | 4,919 | 4,070 | 3,354 | ||||||||
Stock-based compensation expense | 17,458 | 11,475 | 11,369 | ||||||||
Non-cash operating lease cost | 2,831 | — | — | ||||||||
Repayment of accrued interest of long-term debt | — | (5,446 | ) | — | |||||||
Gain on sale of business | (49,922 | ) | — | — | |||||||
Gain on equity securities | (625 | ) | — | — | |||||||
Loss on extinguishment of long-term debt | — | 842 | — | ||||||||
Amortization (accretion) of discount or premium on short-term investments | (204 | ) | 278 | 198 | |||||||
Amortization of deferred financing costs | 810 | 438 | 171 | ||||||||
Conversion of accrued interest to long-term debt | 2,193 | 1,530 | 1,472 | ||||||||
Loss on disposal of property and equipment | 1,152 | 97 | 15 | ||||||||
Provision for bad debt | (62 | ) | 467 | 361 | |||||||
Provision for inventory obsolescence | 931 | 691 | 866 | ||||||||
Changes in operating assets and liabilities | |||||||||||
Accounts receivable | (9,805 | ) | 1,807 | 2,277 | |||||||
Inventory | (8,475 | ) | 5,251 | (8,742 | ) | ||||||
Prepaid expenses and other assets | (3,350 | ) | (2,714 | ) | (1,278 | ) | |||||
Accounts payable | (599 | ) | 4,640 | (110 | ) | ||||||
Accrued liabilities | 1,276 | (494 | ) | 1,312 | |||||||
Accrued compensation and other employee benefits | 3,567 | 3,463 | 295 | ||||||||
Customer deposits | (1,778 | ) | (778 | ) | 8,335 | ||||||
Deferred revenue | (6,536 | ) | (1,779 | ) | (29,161 | ) | |||||
Operating lease liabilities | (2,506 | ) | — | — | |||||||
Deferred rent and other liabilities | — | (503 | ) | 1,171 | |||||||
Net cash used in operating activities | (89,421 | ) | (54,065 | ) | (51,657 | ) | |||||
Investing activities | |||||||||||
Purchases of property and equipment | (7,885 | ) | (4,485 | ) | (4,284 | ) | |||||
Proceeds from sale of business | 40,000 | — | — | ||||||||
Proceeds from sale of short-term investments | 2,500 | 7,910 | 3,600 | ||||||||
Proceeds from maturity of short-term investments | 97,970 | 51,300 | 79,599 | ||||||||
Purchases of short-term investments | (147,744 | ) | (77,650 | ) | (81,405 | ) | |||||
Net cash used in investing activities | (15,159 | ) | (22,925 | ) | (2,490 | ) | |||||
Financing activities | |||||||||||
Proceeds from long-term debt | 20,000 | 60,000 | — | ||||||||
Deferred costs related to long-term debt | (100 | ) | (500 | ) | — | ||||||
Repayment of long-term debt and lease financing obligations | — | (45,000 | ) | (58 | ) | ||||||
Fees paid upon extinguishment of debt | — | (1,009 | ) | — | |||||||
Proceeds from sale of common stock, net | 68,273 | 53,829 | 56,486 | ||||||||
Proceeds from issuance of common stock warrants | 2,228 | 3,010 | 674 | ||||||||
Proceeds from issuance of common stock for employee stock purchase plan | 1,952 | 1,451 | 1,793 | ||||||||
Tax withholdings related to net share settlements of restricted stock units | (1,474 | ) | (207 | ) | (313 | ) | |||||
Proceeds from exercise of stock options | 18,387 | 3,507 | 1,086 | ||||||||
Net cash provided by financing activities | 109,266 | 75,081 | 59,668 | ||||||||
Net increase (decrease) in cash and cash equivalents | 4,686 | (1,909 | ) | 5,521 | |||||||
Effect of exchange rate changes on cash and cash equivalents | (9 | ) | (14 | ) | 32 | ||||||
Cash and cash equivalents and restricted cash | |||||||||||
Beginning of year | 24,356 | 26,279 | 20,726 | ||||||||
End of year | $ | 29,033 | $ | 24,356 | $ | 26,279 | |||||
-73-
NanoString Technologies, Inc.
Consolidated Statements of Cash Flows (continued)
Years Ended December 31, | |||||||||||
2019 | 2018 | 2017 | |||||||||
(In thousands) | |||||||||||
Reconciliation of cash and cash equivalents and restricted cash at end of period: | |||||||||||
Cash and cash equivalents | $ | 29,033 | $ | 24,356 | $ | 26,136 | |||||
Restricted cash | — | — | 143 | ||||||||
Cash and cash equivalents and restricted cash at end of period | $ | 29,033 | $ | 24,356 | $ | 26,279 | |||||
Supplemental disclosures | |||||||||||
Cash paid for interest | $ | 5,683 | $ | 6,213 | $ | 4,416 | |||||
Fair value of warrants issued with long-term debt | 968 | 1,583 | — | ||||||||
Cash paid for taxes | 265 | 231 | 154 | ||||||||
Rental instruments reclassified from inventory | 605 | 585 | 1,023 | ||||||||
Operating lease right-of-use assets obtained in exchange for lease obligations | 28,060 | — | — | ||||||||
Common stock received for sale of a business | 9,893 | — | — | ||||||||
Non-cash inventory exchanged for services | — | 106 | — | ||||||||
The accompanying notes are an integral part of these consolidated financial statements.
-74-
NanoString Technologies, Inc.
Notes to Consolidated Financial Statements
1. Description of the Business
NanoString Technologies, Inc. (the “Company”) was incorporated in the state of Delaware on June 20, 2003. The Company’s headquarters is located in Seattle, Washington. The Company’s proprietary optical barcoding chemistry enables direct detection, identification and quantification of individual target molecules in a biological sample by attaching a unique color coded fluorescent reporter to each target molecule of interest. The Company currently markets and sells two platforms based on its proprietary technology, its nCounter Analysis System and its GeoMx Digital Spatial Profiler, or GeoMx DSP system, both consisting of instruments and consumables, to academic, government, biopharmaceutical and clinical laboratory customers.
The Company has incurred losses to date and expects to incur additional losses for the foreseeable future. The Company continues to invest the majority of its resources in the development and growth of its business, including significant investments in new product development and sales and marketing efforts. The Company’s activities have been financed to date primarily through the sale of equity securities and incurrence of indebtedness and cash received by the Company pursuant to certain product development collaborations.
2. Significant Accounting Policies
Accounting Principles and Principles of Consolidation
The consolidated financial statements and accompanying notes were prepared in accordance with accounting principles generally accepted in the United States of America (“U.S. GAAP”). The accompanying consolidated financial statements reflect the accounts of the Company and its wholly-owned subsidiaries. Each of the subsidiaries operates as a sales and support office. The functional currency of each subsidiary is the U.S. dollar. All significant intercompany balances and transactions have been eliminated.
Use of Estimates
The preparation of consolidated financial statements in conformity with U.S. GAAP requires management to make estimates and assumptions that affect the reported amounts of assets and liabilities and disclosure of contingent assets and liabilities at the date of the consolidated financial statements and that affect the reported amounts of revenue and expenditures during the reporting period. Actual results could differ from those estimates. Significant estimates inherent in the preparation of the accompanying consolidated financial statements include the estimation of the valuation of inventory, the fair value of debt securities, the estimates used in the valuation allowance for deferred tax assets and uncertain tax positions, the calculation of stock-based compensation and the estimated future cost of ongoing collaboration agreements, for which revenues are recognized on a proportional performance basis.
Cash and Cash Equivalents
The Company considers all highly-liquid investments with purchased maturities of three months or less to be cash equivalents. The Company’s cash equivalents consist principally of funds maintained in depository accounts. The Company invests its cash and cash equivalents with major financial institutions; at times these investments exceed federally insured limits.
Investments
The Company holds certain equity securities, which are reported at fair value. Changes in the fair value of equity securities are recorded in other income (loss) in the consolidated statements of operations. The cost of equity securities for purposes of computing gains and losses is based on the specific identification method.
The Company classifies its debt securities as available-for-sale, which are reported at estimated fair value with unrealized gains and losses included in accumulated other comprehensive loss in stockholders’ equity. Realized gains, realized losses and declines in the value of securities judged to be other-than-temporary, are included in other income (expense), net. The cost of investments for purposes of computing realized and unrealized gains and losses is based on the specific identification method. Amortization of premiums and accretion of discounts are included in other income (expense), net. Interest and dividends earned on all securities are included in other income (expense), net. Investments in securities with maturities of less than one year, or where management’s intent is to use the investments to fund current operations, or to make them available for current operations, are classified as short-term investments.
-75-
If the estimated fair value of a debt security is below its carrying value, the Company evaluates whether it is more likely than not that it will sell the security before its anticipated recovery in market value and whether evidence indicating that the cost of the investment is recoverable within a reasonable period of time outweighs evidence to the contrary. The Company also evaluates whether or not it intends to sell the investment. If the impairment is considered to be other-than-temporary, the security is written down to its estimated fair value. In addition, the Company considers whether credit losses exist for any securities. A credit loss exists if the present value of cash flows expected to be collected is less than the amortized cost basis of the security. Other-than-temporary declines in estimated fair value and credit losses are charged against other income (expense), net.
Accounts Receivable and Allowance for Doubtful Accounts
Accounts receivable are stated at the amount management expects to collect from customers based on their outstanding invoices. Management reviews accounts receivable regularly to determine if any receivable will potentially be uncollectible and to estimate the amount of allowance for doubtful accounts necessary to reduce accounts receivable to its estimated net realizable value by analyzing the status of significant past due receivables. The allowance for doubtful accounts was $0.5 million as of December 31, 2019, $0.7 million as of December 31, 2018 and $0.5 million as of December 31, 2017. Adjustments to the allowance were $(0.1) million, $0.5 million and $0.4 million for the years ended December 31, 2019, 2018 and 2017, respectively. There were write-offs of uncollectible accounts of approximately $0.1 million, $0.2 million and $1,200 during the years ended December 31, 2019, 2018 and 2017 respectively.
Concentration of Credit Risks
Financial instruments that potentially expose the Company to concentrations of credit risk consist principally of cash and cash equivalents, short-term investments and accounts receivable. Cash is invested in accordance with the Company’s investment policy, which includes guidelines intended to minimize and diversify credit risk. Most of the Company’s investments are not federally insured. The Company has credit risk related to the collectability of its accounts receivable. The Company performs initial and ongoing evaluations of its customers’ credit history or financial position and generally extends credit on account without collateral. The Company has not experienced any significant credit losses to date.
The Company had one customer/collaborator, Lam Research Corporation (“Lam”), that represented 13% and 17% of total revenue for the years ended December 31, 2019 and December 31, 2018, respectively. The Company had two customers/collaborators, (1) Merck Sharp & Dohme Corp., a subsidiary of Merck & Co., Inc. (“Merck”), and (2) Medivation, Inc. and Astellas Pharma Inc., that represented 25% and 10%, respectively, of total revenue for the year ended December 31, 2017. The Company had no customers or collaborators that represented more than 10% of total accounts receivable as of December 31, 2019 and 2018.
The Company is also subject to supply chain risks related to the outsourcing of the manufacturing and production of its instruments to sole suppliers. Although there are a limited number of manufacturers for instruments of this type, the Company believes that other suppliers could provide similar products on comparable terms. Similarly, the Company sources certain raw materials used in the manufacture of consumables from certain sole suppliers. A change in suppliers, however, could cause a delay in manufacturing and a possible loss of sales, which would adversely affect operating results.
Fair value of financial instruments
The recorded amounts of certain financial instruments, including cash and cash equivalents, accounts receivable, prepaid expenses and other assets, accounts payable and accrued liabilities approximate fair value due to their relatively short maturities. Investments that are classified as available-for-sale are recorded at fair value. The fair value for securities held is determined using quoted market prices, broker or dealer quotations, or alternative pricing sources with reasonable levels of price transparency. The recorded amount of the Company’s long-term debt approximates fair value because the related interest rates approximate rates currently available to the Company.
Inventory
Inventory consists of finished goods, work in process, raw materials and certain component parts to be used in manufacturing or servicing the Company’s products. Inventory is stated at the lower of cost or net realizable value. Cost is determined using a standard cost system, whereby the standard costs are updated periodically to reflect current costs and market represents the lower of cost or market (replacement cost or estimated net realizable value). The Company’s policy is to establish inventory reserves when conditions exist that suggest that inventory may be in excess of anticipated demand, obsolete, slow moving or impaired. In the event that the Company identifies these conditions exist in its inventory, its carrying value is reduced to its net realizable value. Inventory reserves were $4.1 million as of December 31, 2019, $3.2 million as of December 31, 2018 and $2.7 million as of December 31, 2017. Additions to the reserves were $0.9 million, $0.7 million and $0.9 million for the years ended December 31, 2019, 2018 and 2017, respectively. There were no write-offs of inventory reserves for the
-76-
year ended December 31, 2019. Write-offs of inventory reserves for the years ended December 31, 2018 and 2017 were $0.3 million and $0.4 million, respectively.
The Company outsources the manufacturing of its instruments to third-party contract manufacturers who manufacture them to certain specifications and source certain raw materials from sole source providers. Major delays in shipments, inferior quality, insufficient quantity or any combination of these or other factors may harm the Company’s business and results of operations. In addition, the inability of one or more of these suppliers to provide the Company with an adequate supply of its products or raw materials or the loss of one or more of these suppliers may cause a delay in the Company’s ability to fulfill orders while it obtains a replacement supplier and may harm the Company’s business and results of operations.
Property and Equipment
Property and equipment are recorded at cost, net of accumulated depreciation and amortization. Depreciation and amortization are computed using the straight-line method over the estimated useful lives of the assets. Manufacturing equipment is depreciated over five years, lease and loaner instruments are depreciated over one to five years, prototype systems are depreciated over two years, computer equipment is generally depreciated over three years, furniture and fixtures are depreciated over five years and leasehold improvements are amortized over the life of the related assets or the term of the lease, whichever is shorter. Expenditures for additions are capitalized and expenditures for maintenance and repairs are expensed as incurred. Gains and losses from the disposal of property and equipment are reflected in the consolidated statements of operations in the period of disposition.
Leases and Leasehold Improvements
For the years ending December 31, 2018 and 2017, rent expense for leases that provide for scheduled rent increases during the lease term is recognized on a straight-line basis over the term of the related lease. Leasehold improvements that are funded by landlord incentives or allowances are recorded in property and equipment and as a component of deferred rent and are amortized as a reduction of rent expense over the term of the related lease.
Impairment of Long-Lived Assets
The Company recognizes impairment losses on long-lived assets when indicators of impairment are present and the anticipated undiscounted cash flows to be generated by those assets are less than the asset’s carrying values. During 2019, as a result of its sale of a business to Veracyte, the Company impaired certain leased and loaner nCounter instruments with a carrying value of $1.1 million which no longer had future economic value to the Company. Other than the impairment resulting from the Veracyte transaction in 2019, the Company has not experienced material impairment losses on its long-lived assets during the periods presented.
Segments
Operating segments are defined as components of an entity for which separate financial information is available and evaluated regularly by the chief operating decision maker in deciding how to allocate resources and in assessing performance. The Company’s chief operating decision maker is the chief executive officer, who manages the operations and evaluates the financial performance on a total Company basis. The Company’s principal operations and decision-making functions are located at its corporate headquarters in the United States and the Company operates as a single operating and reporting segment.
Revenue Recognition
The Company recognizes revenue when control of the promised goods or services is transferred to its customers, in an amount that reflects the consideration expected to be received in exchange for those products and services. This process involves identifying the contract with a customer, determining the performance obligations in the contract, determining the contract price, allocating the contract price to the distinct performance obligations in the contract, and recognizing revenue when the performance obligations have been satisfied. A performance obligation is considered distinct from other obligations in a contract when it provides a benefit to the customer either on its own or together with other resources that are readily available to the customer and is separately identified in the contract. Performance obligations are considered satisfied once the Company has transferred control of a product or service to the customer, meaning the customer has the ability to use and obtain the benefit of the product or service. The Company recognizes revenue for satisfied performance obligations only when there are no uncertainties regarding payment terms or transfer of control.
The Company generates the majority of its revenue from the sale of products and services. The Company’s commercial products consist of its proprietary nCounter Analysis System and GeoMx DSP system, and related consumables. Services consist of instrument service contracts and service fees for assay processing.
-77-
Revenue from instruments and consumables is recognized generally upon shipment to the end customer, which is when control of the product has been transferred to the customer. Performance obligations related to instrument sales are reviewed on a contract-by-contract basis, as individual contract terms may vary, and may include installation and calibration services. Performance obligations for consumable products are generally completed upon shipment to the customer. Instrument revenue related to installation and calibration services is recognized when the customer has possession of the instrument and the services have been performed. Such services can also be provided by the Company’s distribution partners and other third parties. For instruments sold solely to run in vitro diagnostic assays, such as the Prosigna assay, training the customer is not considered a performance obligation separable from the instrument and, as such, that training must be provided by the Company prior to any revenue recognition related to the instrument sale.
Instrument service contracts are sold with contract terms ranging from 12-36 months and cover periods after the end of the initial 12-month warranty. These contracts include services to maintain performance within the Company’s designed specifications and a minimum of one preventative maintenance service procedure during the contract term. Revenue from services to maintain designed specifications is considered a stand-ready obligation and recognized evenly over the contract term and service revenue related to preventative maintenance of instruments is recognized when the procedure is completed. Revenue from service fees for assay processing is recognized upon the rendering of the related performance obligation.
For arrangements with multiple performance obligations, the Company allocates the contract price in proportion to its stand-alone selling price. The Company uses its best estimate of stand-alone selling price for its products and services based on average selling prices over a 12-month period and reviews its stand-alone prices annually.
Product and service revenues from sales to customers through distributors are recognized consistent with the policies and practices for direct sales to customers, as described above.
The Company at times may enter into collaboration agreements that may generate upfront fees, and in some cases subsequent milestone payments that may be earned upon completion of certain product development milestones or other designated activities. The Company estimates the expected total cost of product development and other services under these arrangements and recognizes collaboration revenue using a contingency-adjusted proportional performance model. Costs incurred to date compared to total expected costs are used to determine proportional performance, as this is considered to be representative of the delivery of outputs under the arrangements. Revenue recognized at any point in time is limited to cash received, amounts contractually due, or the amounts of any product development or other contractual milestone payments when achievement of a milestone is deemed to be probable. Changes in estimates of total expected collaboration product development or other costs are accounted for prospectively as a change in estimate. From period to period, collaboration revenue can fluctuate substantially based on the achievement or probable achievement of product development or other milestones, or as estimates of total expected collaboration product development or other costs are changed or updated. The Company may recognize revenue from collaboration agreements that do not include upfront or milestone-based payments. Amounts due to collaboration partners are recognized when the related activities have occurred and are classified in the statement of operations, generally as research and development expense, based on the nature of the related activities.
For the year ending December 31, 2017, the Company recognized revenue related to its products and services based on the applicable accounting standards for revenue recognition which were in effect for those periods. The accounting standards in effect for years prior to 2018 allowed revenue to be recognized when (1) persuasive evidence of an arrangement existed, (2) delivery occurred or services had been rendered, (3) the price to the customer was fixed or determinable and (4) collectability was reasonably assured. A delivered product or service was considered to be a separate unit of accounting when it had value to the customer on a stand-alone basis. Products or services had value on a stand-alone basis if they were sold separately by any vendor or the customer could resell the delivered product.
Instruments, consumables and in vitro diagnostic kits were considered to be separate units of accounting as they were sold separately and revenue was recognized upon transfer of ownership, which was generally upon shipment. Instrument revenue related to installation and calibration services was recognized when services were rendered by the Company.
Service revenue is recognized when earned, which is generally upon the rendering of the related services. Service agreements and service fees for assay processing are each considered separate units of accounting as they are sold separately. Service agreements are generally separately priced. Revenue from service agreements is deferred and recognized on a straight-line basis over the service period.
For arrangements with multiple performance obligations, the Company allocated the agreement consideration at the inception of the agreement to the performance obligations based upon their relative selling prices. Selling prices were established by reference to vendor specific objective evidence based on stand-alone sales transactions for each performance obligation. Vendor specific objective evidence was considered to have been established when a substantial majority of individual sales transactions within the previous 12-month period fall within a reasonably narrow range, which the Company defined to be plus or minus 15% of the median sales price of actual stand-alone sales transactions. The Company used its best estimate of selling price for individual performance obligations when vendor specific objective evidence or third-party
-78-
evidence was unavailable. Allocated revenue was only recognized for each performance obligation when the revenue recognition criteria was met.
Cost of Revenue
Cost of revenue consists primarily of costs incurred in the production process, including costs of purchasing instruments from third-party contract manufacturers, consumable component materials and assembly labor and overhead, installation, warranty, service and packaging and delivery costs. In addition, cost of revenue includes royalty costs for licensed technologies included in the Company’s products, provisions for slow-moving and obsolete inventory and stock-based compensation expense. Cost of revenue for instruments and consumables is recognized in the period the related revenue is recognized. Shipping and handling costs incurred for product shipments are included in cost of revenue in the consolidated statements of operations.
Reserve for Product Warranties
The Company generally provides a one-year warranty on both its nCounter Analysis Systems and GeoMx DSP systems, and establishes a reserve for future warranty costs based on historical product failure rates and actual warranty costs incurred. Warranty expense is recorded as a component of cost of revenue in the consolidated statements of operations.
Research and Development
Research and development expenses, consisting primarily of salaries and benefits, stock-based compensation expense, occupancy costs, laboratory supplies, clinical study costs, contracted services, consulting fees and related costs, are expensed as incurred.
Selling, General and Administrative
Selling expenses consist primarily of personnel related costs for sales and marketing, contracted services and service fees and are expensed as the related costs are incurred. Advertising costs are expensed as incurred and are included in sales and marketing expenses. Advertising costs totaled approximately $5.7 million, $4.8 million and $5.9 million during the years ended December 31, 2019, 2018 and 2017, respectively.
General and administrative expenses consist primarily of personnel related costs for the Company’s finance, human resources, business development, legal, information technology and general management, as well as professional fees for legal, accounting, and other consulting services. General and administrative expenses are expensed as they are incurred.
Income Taxes
The Company accounts for income taxes under the liability method. Under the liability method, deferred tax assets and liabilities are determined based on the differences between the financial reporting and income tax bases of assets and liabilities and are measured using the tax rates that will be in effect when the differences are expected to reverse. A valuation allowance is recorded when it is more likely than not that some of the deferred tax assets will not be realized.
The Company determines whether a tax position is more likely than not to be sustained upon examination based on the technical merits of the position. For tax positions meeting the more-likely-than-not threshold, the tax amount recognized in the financial statements is reduced by the largest benefit that has a greater than 50% likelihood of being realized upon ultimate settlement with the relevant tax authority.
Stock-Based Compensation
The Company accounts for stock-based compensation under the fair value method. Stock-based compensation costs for stock options and restricted stock units (“RSUs”) awards granted are calculated using the grant-date fair value, estimated using the Black-Scholes option pricing model for stock options and the intrinsic method for RSUs. Stock-based compensation expense recognized is based on awards ultimately expected to vest using actual forfeitures when incurred. The Company uses the straight-line attribution method over the vesting period for recognizing compensation expense.
Guarantees and Indemnifications
In the normal course of business, the Company guarantees and/or indemnifies other parties, including vendors, lessors and parties to transactions with the Company, with respect to certain matters. The Company has agreed to hold the other parties harmless against losses arising from breach of representations or covenants, or out of intellectual property infringement or other claims made against certain parties. It is not possible to determine the maximum potential amount the Company could be required to pay under these indemnification agreements, since the Company has not had any prior indemnification claims, and each claim would be based upon the unique facts and circumstances of the claim and the particular provisions of each agreement. In the opinion of management, any such claims would not be expected to have a material adverse effect on the
-79-
Company’s consolidated results of operations, financial condition or cash flows. The Company did not have any related liabilities recorded at December 31, 2019 and 2018.
Comprehensive Loss
Comprehensive loss includes certain changes in equity that are excluded from net loss. Specifically, unrealized gains and losses on short-term investments are included in comprehensive (income) loss.
Recently Adopted Accounting Pronouncements
In February 2018, the Financial Accounting Standards Board (“FASB”) issued “ASU 2018-02, Income Statement — Reporting Comprehensive Income (Topic 220): Reclassification of Certain Tax Effects from Accumulated Other Comprehensive Income.” The new guidance permits companies to reclassify the stranded tax effects of the Tax Cuts and Jobs Act (the “Act”) on items within accumulated other comprehensive income to retained earnings. The standard became effective for the Company beginning January 1, 2019, and did not have a material impact on its results of operations, financial condition, cash flows or financial statement disclosures, as the Company has not historically recorded the tax effects within accumulated other comprehensive income. The Company maintains a full valuation allowance for its net deferred tax assets.
Leases
In February 2016, FASB issued “ASU 2016-02, Leases - Recognition and Measurement of Financial Assets and Financial Liabilities.” The standard requires the recognition of lease assets and lease liabilities by lessees for those leases classified as operating leases. Leases will be classified as either finance or operating, with classification affecting the pattern of expense recognition. In August 2018, FASB issued “ASU 2018-11, Leases (Topic 842): Targeted Improvements,” which allows the cumulative-effect adjustment to the opening balance of retained earnings in the period of adoption.
On January 1, 2019, the Company adopted ASU 2016-02 and has elected the optional modified transition method. Accordingly, all periods prior to January 1, 2019 were presented in accordance with the previous ASC Topic 840, Leases, and no retrospective adjustments were made to the comparative periods presented. The adoption of the standard had a material impact on the Company’s consolidated balance sheet, but did not have a material impact on the Company’s consolidated statements of operations or consolidated statements of cash flows. Upon adoption, the Company recognized operating lease right-of-use assets, current and non-current operating lease liabilities, and derecognized current and non-current deferred rent liabilities, with no cumulative-effect adjustment to the opening balance of retained earnings.
The Company elected the package of practical expedients permitted under the transition guidance within the new standard which, among other things, allowed the carry forward of the historical lease classification and assessment of prior conclusions about lease identification. In addition, the Company elected, as an accounting policy election, to use the short-term lease recognition exemption on all classes of assets. Leases with an initial term of 12 months or less are not recorded on the balance sheet and the Company recognizes lease expense for these leases on a straight-line basis over the lease term.
The Company determines if an arrangement is a lease at inception of a contract. The Company’s leasing portfolio is comprised of operating leases primarily for general office, manufacturing, and research and development purposes. Operating lease liabilities and the corresponding right-of-use assets are recognized based on the present value of the future minimum lease payments over the lease term at commencement date. The operating lease right-of-use asset is reduced by lease incentives included in the agreement. As the existing leases do not contain an implicit interest rate, the Company estimates its incremental borrowing rate based on information available at commencement date in determining the present value of future payments. The Company includes options to extend the lease in the lease liability and right-of-use asset when it is reasonably certain that the option will be exercised. Lease expense for minimum lease payments is recognized on a straight-line basis over the lease term. For our short-term leases, we recognize lease payments as an expense on a straight-line basis over the lease term. See Note 5. Leases for additional information regarding lease agreements.
Recent Accounting Pronouncements
In June 2016, FASB issued “ASU 2016-13, Financial Instruments: Credit Losses.” The standard requires disclosure regarding expected credit losses on financial instruments at each reporting date, and changes how other than temporary impairments on investment securities are recorded. The standard will become effective for the Company beginning January 1, 2020. The Company is currently assessing the impact adoption of this standard will have on its consolidated results of operations, financial condition, cash flows, and financial statement disclosures.
In August 2018, FASB issued “ASU 2018-15, Intangibles - Goodwill and other - Internal-use software (Subtopic 350-40): Customer’s Accounting for Implementation Costs Incurred in a Cloud Computing Arrangement That Is a Service Contract.” The standard aligns the requirements for capitalizing implementation costs incurred in a hosting arrangement that is a service contract with the requirements for capitalizing implementation costs incurred to develop or obtain internal-use
-80-
software. The Company has had a practice of expensing the implementation costs related to cloud computing arrangements. Upon adoption of the standard, the Company may capitalize certain implementation costs for new cloud computing arrangements in other assets, and amortize the costs over the related service contract period for the hosted arrangement. The amortization of the implementation costs and the related service contract costs will be presented in its results of operations. The impact to the Company’s consolidated financial statements will depend on multiple factors, including the timing, scope and cost of future cloud-based implementation projects. The Company will adopt the standard, on a prospective basis, on January 1, 2020, the effective date of the standard.
In November 2018, the FASB issued “ASU 2018-18, Collaborative Arrangements (Topic 808): Clarifying the Interaction between Topic 808 and Topic 606.” The new guidance clarifies when certain transactions between collaborative arrangement participants which should be accounted for as revenue under Topic 606. The Company will adopt the standard on January 1, 2020, the effective date of the standard. The Company has assessed its collaborative arrangements and had concluded no adjustment is necessary, based on guidance in the standard.
3. Revenue from Contracts with Customers
Disaggregated Revenues
The following table provides information about disaggregated revenue by major product line and primary geographic market (in thousands):
Year Ended December 31, 2019 | |||||||||||||||
Americas | Europe and Middle East | Asia Pacific | Total | ||||||||||||
Product revenue: | |||||||||||||||
Instruments | $ | 18,578 | $ | 8,083 | $ | 4,413 | $ | 31,074 | |||||||
Consumables | 35,461 | 12,484 | 3,646 | 51,591 | |||||||||||
In vitro diagnostic kits | 2,522 | 6,601 | 290 | 9,413 | |||||||||||
Total product revenue | 56,561 | 27,168 | 8,349 | 92,078 | |||||||||||
Service revenue | 7,724 | 3,121 | 791 | 11,636 | |||||||||||
Total product and service revenue | 64,285 | 30,289 | 9,140 | 103,714 | |||||||||||
Collaboration revenue | 21,854 | — | — | 21,854 | |||||||||||
Total revenues | $ | 86,139 | $ | 30,289 | $ | 9,140 | $ | 125,568 | |||||||
Year Ended December 31, 2018 | |||||||||||||||
Americas | Europe and Middle East | Asia Pacific | Total | ||||||||||||
Product revenue: | |||||||||||||||
Instruments | $ | 12,033 | $ | 6,677 | $ | 2,731 | $ | 21,441 | |||||||
Consumables | 29,653 | 10,847 | 3,347 | 43,847 | |||||||||||
In vitro diagnostic kits | 3,014 | 6,094 | 337 | 9,445 | |||||||||||
Total product revenue | 44,700 | 23,618 | 6,415 | 74,733 | |||||||||||
Service revenue | 6,228 | 2,097 | 465 | 8,790 | |||||||||||
Total product and service revenue | 50,928 | 25,715 | 6,880 | 83,523 | |||||||||||
Collaboration revenue | 23,209 | — | — | 23,209 | |||||||||||
Total revenues | $ | 74,137 | $ | 25,715 | $ | 6,880 | $ | 106,732 | |||||||
-81-
Year Ended December 31, 2017(1) | |||||||||||||||
Americas | Europe and Middle East | Asia Pacific | Total | ||||||||||||
Product revenue: | |||||||||||||||
Instruments | $ | 10,556 | $ | 6,561 | $ | 3,722 | $ | 20,839 | |||||||
Consumables | 25,583 | 9,934 | 2,794 | 38,311 | |||||||||||
In vitro diagnostic kits | 2,473 | 3,982 | 290 | 6,745 | |||||||||||
Total product revenue | 38,612 | 20,477 | 6,806 | 65,895 | |||||||||||
Service revenue | 4,592 | 1,314 | 209 | 6,115 | |||||||||||
Total product and service revenue | 43,204 | 21,791 | 7,015 | 72,010 | |||||||||||
Collaboration revenue | 42,895 | — | — | 42,895 | |||||||||||
Total revenues | $ | 86,099 | $ | 21,791 | $ | 7,015 | $ | 114,905 | |||||||
(1) Amounts have not been retrospectively modified to reflect the adoption of Accounting Standard Update No. 2014-09, Revenue from Contracts with Customers, for the year ended December 31, 2017.
Contract balances and remaining performance obligations
Contract liabilities are comprised of the current and long-term portions of deferred revenue of $5.0 million and $11.5 million as of December 31, 2019 and December 31, 2018, respectively, and customer deposits of $6.4 million and $8.2 million as of December 31, 2019 and December 31, 2018, respectively, included within the consolidated balance sheets. Total contract liabilities decreased by $8.3 million for the year ended December 31, 2019 as a result of the recognition of previously deferred revenue and customer deposits of $29.4 million for the completion of certain performance obligations during the period, partially offset by cash payments received of $21.1 million related to our collaborations and service contracts. The Company did not record any contract assets as of December 31, 2019. The Company’s contractual payment terms for its contracts with customers are typically no more than 30 days.
As of December 31, 2019, unsatisfied or partially unsatisfied performance obligations related to the collaboration agreement with Lam Research Corporation (“Lam”) were $5.5 million and are expected to be completed by the first half of 2020. Performance obligations related to undelivered products and service contracts as of December 31, 2019 were $5.7 million and are expected to be completed over the term of the related contract, or as products are delivered.
4. Sale of Business to Veracyte
In December 2019, the Company entered into a License and Asset Purchase Agreement (“LAPA”) and Service and Supply Agreements (“SSAs”), with Veracyte, Inc. (“Veracyte”). Pursuant to the LAPA, the Company completed a license of intellectual property and a sale of certain assets relating to the Company’s nCounter FLEX platform for use in clinical diagnostic applications, including Prosigna distribution rights to Veracyte. Additionally, the Company provided Veracyte a worldwide exclusive license to market and sell clinical diagnostic tests developed for the Company’s nCounter FLEX platform, including worldwide rights to Prosigna. Veracyte also acquired certain intellectual property rights from the Company relating to Prosigna and the Company’s proprietary LymphMark assay.
Pursuant to the terms of the LAPA, Veracyte paid the Company total consideration of $50.0 million, consisting of $40.0 million in cash paid in connection with the entry into the LAPA, and 376,732 shares of Veracyte common stock valued at $10.0 million, which shares were issued in connection with the entry into the LAPA. Additionally, the Company may receive future potential milestone payments of up to $10.0 million in the aggregate, to be paid upon the launch of additional clinical diagnostic tests by Veracyte for the Company’s nCounter FLEX platform. In addition, Veracyte has agreed to assume the obligation to pay specified royalties under the Company’s existing agreement with Bioclassifier, LLC, which was assigned to Veracyte in connection with the transaction. Pursuant to the LAPA, Veracyte offered certain of the Company’s employees employment with Veracyte.
Pursuant to the SSAs, the Company agreed to supply to Veracyte nCounter FLEX systems, and one whereby the Company agreed to manufacture and supply Prosigna kits, LymphMark kits and any additional clinical diagnostic tests that Veracyte may develop in the future for nCounter, for a period of at least four years subsequent to the transaction date. Pursuant to the SSAs, Veracyte will pay the designated transfer prices for nCounter FLEX systems, Prosigna kits, LymphMark kits and any other nCounter-based diagnostic tests developed by Veracyte.
The sale of assets and license pursuant to the LAPA was considered the disposition of a business and, accordingly, the Company has included a gain on sale of business, net of $48.9 million as non-operating income in the consolidated statements
-82-
of operations as of December 31, 2019, net of transaction costs of $1.1 million. The disposition did not represent a strategic shift that will have a major effect on the Company’s operations and financial results. The cash consideration received at closing, as well as any future cash payments received pursuant to the future milestones will be recognized as an investing cash in-flow in the consolidated statements of cash flows. Substantially all of the intangible assets sold had no book value for the Company. The Company has not recognized any gain related to the future milestone payments as these are considered contingent consideration for which a gain will be recognized in the future when the milestones are achieved and the gain is realizable. The Company has accounted for the Veracyte common stock in accordance with ASC 321, Investments - Equity Securities. At December 31, 2019, the Company has included the shares of Veracyte common stock, at fair value, within short-term investments. Gains or losses related to these securities subsequent to their acquisition will be included within other income (loss) in the consolidated statements of operations. The $40.0 million of cash received on the closing date has been included in cash and cash equivalents on the consolidated balance sheets.
5. Leases
The Company is obligated to make future minimum payments under four operating leases for 134,296 square feet of space used for manufacturing, research and development and general operations primarily in the greater Seattle area. The leases have terms that expire from 2026 to 2030 and include renewal options to extend the lease term at the then current fair market rental for each of the lease agreements. None of the options to extend the rental term of existing leases were considered reasonably certain as of December 31, 2019. The Company’s leases contain rent abatement periods, scheduled rent increases, and provide for tenant improvement allowances. The Company’s lease agreements do not contain any material variable lease payments, material residual value guarantees or any material restrictive covenants.
Operating lease cost totaled approximately $6.0 million for the year ended December 31, 2019. Rent expense totaled approximately $4.9 million and $4.8 million for the years ended December 31, 2018 and 2017, respectively.
Other information related to leases for the year ended December 31 were as follows (in thousands):
2019 | |||
Cash paid for amounts included in the measurement of lease liabilities: | |||
Operating cash flows from operating leases | $ | 5,579 | |
The lease term and discount rate at December 31 was as follows:
2019 | ||
Weighted average remaining lease term (years) | 6.7 | |
Weighted average discount rate | 7.1 | % |
Future minimum lease payments under the lease agreements as of December 31, 2019 were as follows (in thousands):
2020 | $ | 6,180 | |
2021 | 6,286 | ||
2022 | 6,347 | ||
2023 | 6,506 | ||
2024 | 6,690 | ||
Thereafter | 10,987 | ||
Total future minimum lease payments | 42,996 | ||
Less: imputed interest | (9,862 | ) | |
Total | $ | 33,134 | |
-83-
6. Short-term Investments
Short-term investments consisted of available-for-sale and equity securities as follows (in thousands):
Type of securities as of December 31, 2019 | Amortized cost | Gross unrealized gains | Gross unrealized losses | Fair value | |||||||||||
Corporate debt securities | $ | 78,243 | $ | 89 | $ | (2 | ) | $ | 78,330 | ||||||
U.S. government-related debt securities | 26,966 | 37 | — | 27,003 | |||||||||||
Asset-backed securities | 11,950 | 21 | — | 11,971 | |||||||||||
Total available-for-sale debt securities | 117,159 | 147 | (2 | ) | 117,304 | ||||||||||
Corporate equity securities | 9,893 | 625 | — | 10,518 | |||||||||||
Total short-term investment securities | $ | 127,052 | $ | 772 | $ | (2 | ) | $ | 127,822 | ||||||
Type of securities as of December 31, 2018 | Amortized cost | Gross unrealized gains | Gross unrealized losses | Fair value | |||||||||||
Corporate debt securities | $ | 47,299 | $ | 1 | $ | (21 | ) | $ | 47,279 | ||||||
U.S. government-related debt securities | 14,972 | — | (11 | ) | 14,961 | ||||||||||
Asset-backed securities | 7,410 | — | (9 | ) | 7,401 | ||||||||||
Total available-for-sale debt securities | $ | 69,681 | $ | 1 | $ | (41 | ) | $ | 69,641 | ||||||
The fair values of available-for-sale debt securities by contractual maturity at December 31 were as follows (in thousands):
2019 | 2018 | ||||||
Maturing in one year or less | $ | 101,751 | $ | 69,641 | |||
Maturing in one to three years | 15,553 | — | |||||
Total available-for-sale debt securities | 117,304 | 69,641 | |||||
The Company has both the intent and ability to sell its available-for-sale debt and equity securities maturing greater than one year within 12 months from the balance sheet date and, accordingly, has classified these securities as current in the consolidated balance sheets.
The following table summarizes investments that have been in a continuous unrealized loss position as of December 31, 2019 (in thousands).
Less Than 12 Months | 12 Months or Greater | Total | |||||||||||||||||||||
Fair value | Gross unrealized losses | Fair value | Gross unrealized losses | Fair value | Gross unrealized losses | ||||||||||||||||||
Corporate debt securities | $ | 2,515 | $ | (2 | ) | $ | — | $ | — | $ | 2,515 | $ | (2 | ) | |||||||||
Total | $ | 2,515 | $ | (2 | ) | $ | — | $ | — | $ | 2,515 | $ | (2 | ) | |||||||||
The Company invests in securities that are rated investment grade or better. The unrealized losses on available-for-sale debt securities as of December 31, 2019 and December 31, 2018 were primarily caused by interest rate increases.
The Company reviews the individual securities in its portfolio to determine whether a decline in a security’s fair value below the amortized cost basis is other-than-temporary. The Company determined that as of December 31, 2019, there were no investments in its portfolio that were other-than-temporarily impaired.
-84-
7. Fair Value Measurements
The Company establishes the fair value of its assets and liabilities using the price that would be received to sell an asset or paid to transfer a financial liability in an orderly transaction between market participants at the measurement date. A fair value hierarchy is used to measure fair value. The three levels of the fair value hierarchy are as follows:
• | Level 1 — Quoted prices in active markets for identical assets and liabilities. |
• | Level 2 — Quoted prices for similar instruments in active markets; quoted prices for identical or similar instruments in markets that are not active; and model-derived valuations in which all significant inputs and significant value drivers are observable in active markets. |
• | Level 3 — Valuations derived from valuation techniques in which one or more significant inputs or significant value drivers are unobservable. |
The recorded amounts of certain financial instruments, including cash, accounts receivable, prepaid expenses and other, accounts payable and accrued liabilities, approximate fair value due to their relatively short-term maturities. The recorded amount of the Company’s long-term debt approximates fair value because the related interest rates approximate rates currently available to the Company.
The Company’s investments by level within the fair value hierarchy were as follows (in thousands):
Type of securities as of December 31, 2019 | Fair value measurement using: | ||||||||||||||
Level 1 | Level 2 | Level 3 | Total | ||||||||||||
Cash equivalents: | |||||||||||||||
Money market fund | $ | 22,152 | $ | — | $ | — | $ | 22,152 | |||||||
Short-term investments: | |||||||||||||||
Corporate debt securities | — | 78,330 | — | 78,330 | |||||||||||
U.S. government-related debt securities | — | 27,003 | — | 27,003 | |||||||||||
Asset-backed securities | — | 11,971 | — | 11,971 | |||||||||||
Corporate equity securities | 10,518 | — | — | 10,518 | |||||||||||
Total | $ | 32,670 | $ | 117,304 | $ | — | $ | 149,974 | |||||||
Type of securities as of December 31, 2018 | Fair value measurement using: | ||||||||||||||
Level 1 | Level 2 | Level 3 | Total | ||||||||||||
Cash equivalents: | |||||||||||||||
Money market fund | $ | 16,293 | $ | — | $ | — | $ | 16,293 | |||||||
Short-term investments: | |||||||||||||||
Corporate debt securities | — | 47,279 | — | 47,279 | |||||||||||
U.S. government-related debt securities | — | 14,961 | — | 14,961 | |||||||||||
Asset-backed securities | — | 7,401 | — | 7,401 | |||||||||||
Total | $ | 16,293 | $ | 69,641 | $ | — | $ | 85,934 | |||||||
8. Inventory, Net
Inventory consisted of the following at December 31 (in thousands):
2019 | 2018 | ||||||
Raw materials | $ | 4,620 | $ | 3,408 | |||
Work in process | 4,617 | 4,054 | |||||
Finished goods | 10,544 | 5,711 | |||||
Total inventory, net | $ | 19,781 | $ | 13,173 | |||
The Company transferred net $0.6 million of inventory into property, plant and equipment, net, in both 2019 and 2018, that was leased or loaned to customers, or assigned for internal use in the Company’s facilities.
-85-
9. Property and Equipment
Property and equipment consisted of the following at December 31 (in thousands):
Useful Life (Years) | 2019 | 2018 | |||||||
Manufacturing equipment | 5 | $ | 12,292 | $ | 10,625 | ||||
Prototype instruments | 2 | 2,202 | 975 | ||||||
Computer equipment | 3 | 2,779 | 2,095 | ||||||
Furniture and fixtures | 5 | 1,565 | 1,456 | ||||||
Leasehold improvements | Various | 12,005 | 11,960 | ||||||
Lease and loaner instruments | 1 - 5 | — | 4,305 | ||||||
Construction in progress | 7,592 | 685 | |||||||
Total property and equipment, gross | 38,435 | 32,101 | |||||||
Less: Accumulated depreciation and amortization | (18,251 | ) | (16,930 | ) | |||||
Total property and equipment, net | $ | 20,184 | $ | 15,171 | |||||
Prototype instruments consist of nCounter instruments used in internal testing and other development activities. During 2019, the Company disposed of leased and loaner instruments, in conjunction with the Veracyte LAPA agreement. Accumulated depreciation on leased and loaner instruments was $2.4 million at December 31, 2018.
Depreciation and amortization expense related to property and equipment for the years ended December 31, 2019, 2018 and 2017 totaled approximately $4.9 million, $4.0 million and $3.3 million, respectively.
10. Long-term Debt
Term Loan Agreements
In April 2014, the Company entered into a term loan agreement (“2014 Term Loan”), under which it borrowed $45.0 million. Interest on the 2014 Term Loan accrued at an annual rate of 12.0%, payable quarterly, of which 3.0% can be deferred during the first six years of the term at the Company’s option and paid together with the principal at maturity. The 2014 Term Loan had an interest-only period through March 2021 and a final maturity date of March 2022.
In October 2018, the Company entered into an amended and restated term loan agreement (“2018 Term Loan”), under which it may borrow up to $100.0 million, which is due and payable in September 2024. At closing, the Company received net proceeds of approximately $7.8 million, pursuant to borrowings of $60.0 million under the new facility, net of repayment of the Company’s 2014 Term Loan of $50.4 million, including deferred interest and transaction-related fees and expenses. In June 2019, the Company borrowed an additional $20.0 million under the 2018 Term Loan and as of December 31, 2019, the Company had a total $80.0 million outstanding under the 2018 Term Loan. The Company did meet the annual revenue thresholds on or prior to December 31, 2019, which at the Company’s discretion, allows for additional borrowings of up to $20.0 million which are available to the Company until March 2020. As of December 31, 2019, the Company had not borrowed the additional $20.0 million.
The term loan agreements involved multiple lenders who were considered members of a loan syndicate. In determining whether the most recent amendment was to be accounted for as a debt extinguishment or a debt modification, the Company considered whether lenders remained the same or changed. As all the lenders who were members of the loan syndicate changed as part of the amended and restated loan agreement, the 2014 Term Loan was extinguished, and the 2018 Term Loan was treated as a new borrowing. The extinguishment resulted in a loss of approximately $0.8 million for the year ended December 31, 2018, which was included in interest expense during the fourth quarter of 2018.
The 2018 Term Loan accrues interest at a rate of 10.5%, payable quarterly, of which 3.0% may be deferred during the six-year term at the Company’s option and repaid at maturity together with the principal. The Company paid an upfront fee of 0.5% of the aggregate principal amount of the initial borrowing under the 2018 Term Loan, and will pay a facility fee equal to 2.0% of the total amount borrowed including any deferred interest at the time the principal is repaid. A long-term liability of $1.9 million is being accreted using the effective interest method for the facility fee over the term of the 2018 Term Loan. Additional borrowings under the 2018 Term Loan will bear the same upfront and facility fees as the initial borrowing.
In connection with entry into the 2018 Term Loan, warrants to purchase an aggregate of 341,578 shares of common stock with an exercise price per share of $21.12 were issued to the lenders. In June 2019, in connection with the borrowing of an additional $20.0 million principal amount, warrants to purchase an aggregate of 128,932 shares of common stock with an exercise price per share of $34.20 were issued to the lenders. If additional amounts are borrowed under the 2018 Term Loan,
-86-
additional warrants will be issued on each subsequent draw date for 0.3% of the fully-diluted shares then outstanding. The exercise price for additional warrants will be set at a 25.0% premium to the average closing trading price for the 30-day trading period as of the date immediately before the applicable draw date. The warrants issued in conjunction under the 2018 Term Loan were determined to be closely linked to the Company’s stock, and as such, were recorded as an equity security in additional paid in capital at their relative fair value of $1.6 million and $1.0 million, in October 2018 and June 2019, respectively, with a corresponding debt discount recorded against the 2018 Term Loan balance outstanding.
Total borrowings and deferred interest under the 2018 Term Loan were $82.6 million and $60.4 million as of December 31, 2019 and December 31, 2018, respectively. The balance of the 2018 Term Loan as of December 31, 2019 and December 31, 2018 is net of discounts related to the warrants, debt issuance costs and other upfront fees of $2.6 million and $2.0 million, respectively.
The Company has the option to prepay the 2018 Term Loan, in whole or part, at any time subject to payment of a redemption fee of up to 4.0% during the first year of the term, 3.0% during the second year of the term and with no redemption fee payable if prepayment occurs after the second year of the loan.
Obligations under the 2018 Term Loan are collateralized by substantially all of the Company’s assets. The 2018 Term Loan contains customary conditions to borrowings, events of default and covenants, including negative covenants that could limit the Company’s ability to, among other things, incur additional indebtedness, liens or other encumbrances, make dividends or other distributions; buy, sell or transfer assets; engage in any new line of business; and enter into certain transactions with affiliates. The 2018 Term Loan also includes a $2.0 million minimum liquidity covenant and minimum annual revenue-based financial covenants. If the Company’s actual revenue is below the minimum annual revenue requirement for any given year, it may avoid a related default by generating proceeds from an equity or subordinated debt issuance equal to the shortfall between its actual revenues and the minimum revenue requirement.
The Company incurred $8.5 million, $7.4 million and $6.2 million of interest expense under the term loan agreements for the years ended December 31, 2019, 2018 and 2017, respectively. The Company was in compliance with its financial covenants under the 2018 Term Loan as of December 31, 2019.
2018 Revolving Loan Facility
In January 2018, the Company entered into a $15.0 million secured revolving loan facility, with availability subject to a borrowing base consisting of eligible accounts receivable. In November 2018, the Company entered into an amended and restated loan and security agreement to increase the borrowing capacity under the facility to $20.0 million, amend the borrowing base to include finished goods inventory, and extend the final maturity under the facility to November 2021. As of December 31, 2019 and December 31, 2018, no amounts had been drawn on the facility.
Interest on borrowings is payable monthly and accrues at a yearly rate equal to the greater of the prime rate as reported in the Wall Street Journal plus 0.50%, or 4.75%. During an event of default, amounts drawn accrue interest at a yearly rate equal to 8.75%. Obligations under the agreement are secured by the Company’s cash and cash equivalents, accounts receivable and proceeds thereof, and inventory and proceeds from the sale thereof. The lender’s interest in the collateral under the loan facility is senior to the lender’s interest in such collateral under the term loan agreement. The loan facility contains various customary representations and warranties, conditions to borrowing, events of default, including cross default provisions with respect to the loan facility, and covenants, including financial covenants requiring the maintenance of minimum annual revenue and liquidity. The Company incurred $0.1 million of interest expense under the revolving loan facility for each of the years ended December 31, 2019 and December 31, 2018. The Company was in compliance with its financial covenants under the secured revolving loan facility as of December 31, 2019.
Long-term debt consisted of the following at December 31 (in thousands):
2019 | 2018 | ||||||
Borrowings under term loan agreements | $ | 80,000 | $ | 60,000 | |||
Paid in-kind interest on term loan agreements | 2,593 | 400 | |||||
Unamortized debt discounts | (2,642 | ) | (2,004 | ) | |||
Long-term debt, net of discounts | $ | 79,951 | $ | 58,396 | |||
-87-
Scheduled future payments of principal for outstanding debt were as follows at December 31:
2020 | $ | — | |
2021 | — | ||
2022 | — | ||
2023 | — | ||
2024 | 82,593 | ||
$ | 82,593 | ||
11. Collaboration Agreements
At the time of entering into collaboration agreements, the Company evaluates the appropriate presentation and classification of payments within its consolidated financial statements based on the nature of the arrangement, the nature of its business operations and the contractual terms of the arrangement. The Company has determined that amounts to be received from collaborators in connection with its collaboration agreements entered into through December 31, 2019 are related to revenue generating activities.
The Company uses a contingency-adjusted proportional performance model to recognize revenue over the Company’s performance period for each collaboration agreement that includes up front, or milestone-based or other contractual payments. Costs incurred to date compared to total expected costs are used to determine proportional performance, as this is considered to be representative of the delivery of outputs under the arrangement. Revenue recognized at any point in time is a factor of and limited to cash received and amounts contractually due. Changes in estimates of total expected costs are accounted for prospectively in the period of change.
The Company recognizes revenue from collaboration agreements that do not include up front, milestone-based, or other contractual payments when earned, which is generally in the same period that related costs are incurred. Amounts due to collaboration partners are recognized when the related activities have occurred and are classified in the statement of operations, generally as research and development expense, based on the nature of the related activities.
Lam Research Corporation
In August 2017, the Company entered into a collaboration agreement with Lam with respect to the development of the Company’s Hyb & Seq platform and related assays. Pursuant to the terms of the collaboration agreement, Lam contributed up to an aggregate of $50.0 million towards the project. Lam is eligible to receive certain single-digit percentage royalty payments from the Company on net sales of certain products and technologies developed under the collaboration agreement, if any such net sales are ever recorded. The maximum amount of royalties payable to Lam will be capped at an amount up to three times the amount of development funding actually provided by Lam. The Company retains exclusive rights to obtain regulatory approval, manufacture and commercialize the Hyb & Seq products. Lam participates in research and product development through a joint steering committee. The Company will reimburse Lam for the cost of up to 10 full-time Lam employees each year in accordance with the product development plan.
In connection with the execution of the collaboration agreement, the Company issued Lam a warrant to purchase up to 1.0 million shares of the Company’s common stock with the number of underlying shares exercisable at any time proportionate to the amount of the $50.0 million commitment that has been provided by Lam. The exercise price of the warrant is $16.75 per share, and the warrant will expire on the seventh anniversary of the issuance date. The warrant was determined to have a fair value of $6.7 million upon issuance, and such amount will be recorded as additional paid in capital proportionately from the quarterly collaboration payments made by Lam.
The Company recognized revenue related to the Lam agreement of $16.3 million, $18.6 million and $3.7 million for the years ended December 31, 2019, 2018 and 2017, respectively. The Company received development funding of $14.9 million, $21.7 million and $13.4 million related to the Lam collaboration for the years ended December 31, 2019, 2018 and 2017, respectively. As of December 31, 2019, the Company received the maximum amount of development funding from Lam of $50.0 million and does not expect to receive further development funding from Lam.
As of December 31, 2019, the Company had recorded customer deposits of $5.5 million representing amounts received in advance. The Company incurred costs of $0.8 million for the year ended December 31, 2019 related to services provided by Lam employees under the terms of the agreement. As of December 31, 2019, Lam had not exercised any warrants. In January 2020, having received the full commitment of development funding from Lam, the remaining warrants for shares of the Company’s common stock became exercisable and Lam elected to exercise, in full, its warrant for 1.0 million shares of common stock, for which the Company issued an aggregate of 407,247 shares to Lam. In connection with Lam’s exercise of the
-88-
warrant, the Company agreed to waive certain restrictions associated with the sale of the common stock in exchange for commitments by Lam related to the method and timing of Lam’s sale of the shares.
Celgene Corporation
In March 2014, the Company entered into a collaboration agreement with Celgene Corporation (“Celgene”) to develop, seek regulatory approval for, and commercialize a companion diagnostic using the nCounter Analysis System to identify a subset of patients with Diffuse Large B-Cell Lymphoma. In February 2018, the Company and Celgene entered into an amendment to their collaboration agreement in which Celgene agreed to provide the Company additional funding for work intended to enable a subtype and prognostic indication for the test being developed under the agreement for Celgene’s drug REVLIMID. In connection with this amendment, the Company agreed to remove the right to receive payments from Celgene in the event commercial sales of the companion diagnostic test do not exceed certain pre-specified minimum annual revenues during the first three years following regulatory approval. In addition, the amendment allows Celgene, at its election, to use trial samples with additional technologies for companion diagnostics.
Pursuant to the Company’s agreement as amended in February 2018, the Company is eligible to receive payments from Celgene totaling up to $24.8 million, of which $5.8 million was received as an upfront payment upon delivery of certain information to Celgene and $19.0 million is for development funding and potential success-based development and regulatory milestones. There have been several amendments to the collaboration agreement and in return the Company has received additional payments totaling $2.1 million.
The process of successfully developing a product candidate, obtaining regulatory approval and ultimately commercializing a product candidate is highly uncertain and the attainment of any additional milestones is therefore uncertain and difficult to predict. In addition, certain milestones are outside the Company’s control and are dependent on the performance of Celgene and the outcome of a clinical trial and related regulatory processes. Pursuant to its collaboration with Celgene, the Company had been developing an in vitro diagnostic test, LymphMark, as a potential companion diagnostic to aid in identifying patients with diffuse large B-cell lymphoma (DLBCL) for treatment. In April 2019, Celgene announced that the trial evaluating REVLIMID for the treatment of DLBCL did not meet its primary endpoint. In May 2019, the Company’s collaboration agreement with Celgene was terminated effective July 2019, resulting in the recognition of substantially all of the remaining deferred revenue from the agreement.
The Company recognized revenue related to the Celgene agreement of $4.4 million, $2.6 million and $0.2 million for the years ended December 31, 2019, 2018 and 2017, respectively. The Company received development funding of $1.1 million, $0.6 million and $0.6 million for the years ended December 31, 2019, 2018 and 2017, respectively.
Merck & Co., Inc.
In May 2015, the Company entered into a clinical research collaboration agreement with Merck Sharp & Dohme Corp., a subsidiary of Merck & Co., Inc. (“Merck”), to develop an assay intended to optimize immune-related gene expression signatures and evaluate the potential to predict benefit from Merck’s anti-PD-1 therapy, KEYTRUDA. Under the terms of the collaboration agreement, the Company received $3.9 million in payments during 2015. In February 2016, the Company expanded its collaboration with Merck by entering into a new development collaboration agreement to clinically develop, seek regulatory approval for, and commercialize a companion diagnostic test to predict response to KEYTRUDA in multiple tumor types. In connection with the execution of the development collaboration agreement, the Company and Merck terminated the May 2015 clinical research collaboration and moved all remaining activities under the clinical research collaboration work plan to the new development collaboration agreement. During 2016, the Company received $12.0 million upfront as a technology access fee and $8.5 million of preclinical milestone payments. In October 2017, Merck notified the Company of its decision not to pursue regulatory approval of the companion diagnostic test for KEYTRUDA and, in August 2018, the Company and Merck agreed to mutually terminate their development collaboration agreement, effective as of September 30, 2018, following the completion of certain close-out activities. As part of the mutual termination agreement, Merck granted to the Company a non-exclusive license to certain intellectual property that relates to Merck’s tumor inflammation signature. The Company recognized revenue related to the Merck agreement of $1.6 million and $27.0 million for the years ended December 31, 2018 and 2017, respectively. The Company received development funding of $1.1 million and $6.8 million for the years ended December 31, 2018 and 2017, respectively.
-89-
Medivation, Inc. and Astellas Pharma, Inc.
In January 2016, the Company entered into a collaboration agreement with Medivation, Inc. (“Medivation”) and Astellas Pharma Inc. (“Astellas”) to pursue the translation of a novel gene expression signature algorithm discovered by Medivation into a companion diagnostic assay using the nCounter Analysis System. In September 2016, Medivation was acquired by Pfizer, Inc. (“Pfizer”) and became a wholly owned subsidiary of Pfizer. In May 2017, the Company received notification from Pfizer and Astellas terminating the collaboration agreement as a result of a decision to discontinue the related clinical trial.
The Company recognized revenue related to the Medivation/Astellas agreement of $11.5 million for the years ended December 31, 2017. The Company received development funding of $0.9 million for the year ended December 31, 2017.
12. Common Stock and Preferred Stock
Public Offerings
In June 2017, the Company completed an underwritten public offering of 3,450,000 shares of common stock, including the exercise by the underwriter of an over-allotment option for 450,000 shares of common stock, for total gross proceeds of $57.8 million. After underwriter’s fees and commissions and other expenses of the offering, the Company’s aggregate net proceeds were approximately $56.5 million.
In January 2018, the Company entered into a Sales Agreement with a sales agent to sell shares of the Company’s common stock through an “at the market” equity offering program for up to $40.0 million in gross cash proceeds. In March 2019, subsequent to the Company’s most recent public offering, the Company terminated this agreement. No shares of the Company’s common stock were sold under this agreement.
In July 2018, the Company completed an underwritten public offering of 4,600,000 shares of common stock, including the exercise in full by the underwriters of their option to purchase 600,000 additional shares of common stock in August 2018, for total gross proceeds of $57.5 million. After underwriter’s commissions and other expenses of the offering, the Company’s aggregate net proceeds were approximately $53.8 million.
In March 2019, the Company completed an underwritten public offering of 3,175,000 shares of its common stock, including the exercise in full by the underwriters of their option to purchase 675,000 additional shares of common stock. An additional 2,000,000 shares were sold by a related party stockholder. The Company’s total gross proceeds were $73.0 million. The Company did not receive any proceeds from the sale of shares of common stock by the related party stockholder. After underwriter’s commissions and other expenses of the offering, the Company’s aggregate net proceeds were approximately $68.3 million.
Common Stock
Each share of common stock is entitled to one vote. The holders of common stock are also entitled to receive dividends whenever funds are legally available and when declared by the board of directors, subject to the prior rights of holders of other classes of stock outstanding.
Preferred Stock
Pursuant to the amended and restated certificate of incorporation filed by the Company immediately prior to the completion of its initial public offering, the Company’s board of directors is authorized to issue up to 15,000,000 shares of preferred stock in one or more series and to fix the rights, preferences, privileges and restrictions thereof. These rights, preferences and privileges could include dividend rights, conversion rights, voting rights, redemption rights, liquidation preferences, sinking fund terms and the number of shares constituting any series or the designation of such series, any or all of which may be greater than the rights of common stock. The issuance of preferred stock could adversely affect the voting power of holders of common stock and the likelihood that such holders will receive dividend payments and payments upon liquidation. In addition, the issuance of preferred stock could have the effect of delaying, deferring or preventing change in the Company’s control or other corporate action. As of December 31, 2019, no shares of preferred stock were issued or outstanding, and the board of directors has not authorized or designated any rights, preferences, privileges and restrictions for any class of preferred stock.
-90-
Warrants
Prior to the Company’s initial public offering, warrants to purchase preferred stock were issued related to certain financing transactions. All preferred stock warrants were converted into warrants to purchase common stock upon the effectiveness of the initial public offering. In addition, the Company has issued common stock warrants to third parties in accordance with the provisions of certain debt and collaboration agreements. As of December 31, 2019, there were 1,368,772 common stock warrants outstanding with a weighted average exercise price of $19.47 per share and expiration dates ranging from 2022 to 2026.
13. Stock-based Compensation
2004 Stock Option Plan and 2013 Equity Incentive Plan
The Company’s 2004 Stock Option Plan, 2013 Equity Incentive Plan, and the 2018 Inducement Equity Incentive Plan (the “Plans”) authorize the grant of options, restricted stock units (“RSUs”) and other equity awards to employees, directors and consultants. As of December 31, 2019, there were 10,429,077 shares authorized under the Plans. All options granted have a ten-year term and generally vest and become exercisable over four years of continued employment or service as defined in each option agreement. The Board of Directors determines the option exercise price and may designate stock options granted as either incentive or nonstatutory stock options. The Company generally grants stock options to employees with exercise prices equal to the estimated fair value of the Company’s common stock on the date of grant.
Stock Option Activity
A summary of the Company’s stock option activity under the Plans is as follows:
Shares | Weighted- average exercise price per share | Weighted- average remaining contractual term (in years) | Aggregate intrinsic value (in thousands) | |||||||||
Outstanding at January 1, 2019 | 5,042,352 | $ | 12.46 | 6.49 | $ | 18,255 | ||||||
Granted | 835,376 | 23.98 | ||||||||||
Canceled and forfeited | (269,421 | ) | 14.90 | |||||||||
Exercised | (1,416,185 | ) | 13.82 | |||||||||
Outstanding at December 31, 2019 | 4,192,122 | $ | 14.42 | 6.47 | $ | 56,218 | ||||||
December 31, 2019: | ||||||||||||
Options vested and expected to vest | 4,192,122 | $ | 14.42 | 6.47 | $ | 56,218 | ||||||
Options exercisable | 2,792,940 | $ | 12.61 | 5.38 | $ | 42,482 | ||||||
The weighted-average grant-date fair value per share of options granted with exercise prices equal to the market price on the date of the grant were $12.99, $4.78 and $9.08 for the years ended December 31, 2019, 2018 and 2017, respectively. The aggregate intrinsic value in the table above is calculated as the difference between the exercise price of the underlying options and the quoted price of the Company’s common stock for all options that were in-the-money at December 31, 2019. The aggregate intrinsic value of options exercised was $19.9 million during 2019, $2.2 million during 2018, and $2.4 million during 2017, determined as of the option exercise date. The fair value of options vested was $6.3 million, $6.8 million and $8.9 million for the years ended December 31, 2019, 2018 and 2017, respectively.
-91-
The following table summarizes information about the Company’s stock options outstanding at December 31, 2019:
Outstanding | Exercisable | ||||||||
Exercise Price | Number of Shares | Weighted- Average Remaining Contractual Life in Years | Number of Shares | Weighted- Average Remaining Contractual Life in Years | |||||
$1.92 | 309,208 | 2.22 | 309,208 | 2.22 | |||||
$2.24 – $6.72 | 187,205 | 1.95 | 186,227 | 1.92 | |||||
$6.80 – $12.56 | 857,753 | 7.14 | 485,456 | 6.40 | |||||
$12.77 | 324,905 | 5.11 | 324,905 | 5.11 | |||||
$12.89 – $12.94 | 297,516 | 6.17 | 276,318 | 6.13 | |||||
$13.01 – $14.95 | 227,294 | 6.47 | 184,704 | 6.05 | |||||
$14.99 – $17.48 | 319,666 | 6.55 | 248,011 | 6.18 | |||||
$17.83 – $18.90 | 729,182 | 6.04 | 568,562 | 5.64 | |||||
$19.09 – $22.71 | 252,012 | 8.11 | 109,271 | 6.73 | |||||
$23.00 – $29.13 | 687,381 | 9.35 | 100,278 | 9.24 | |||||
4,192,122 | 2,792,940 | ||||||||
Restricted Stock Unit (RSU) Activity
A summary of RSU activity under the Plans is as follows:
Non-vested RSUs | Share Equivalent | Weighted-Average Grant Date Fair Value | |||||
Non-vested at January 1, 2019 | 1,141,129 | $ | 8.68 | ||||
Changes during the year: | |||||||
Granted | 1,087,691 | 23.33 | |||||
Vested | (665,007 | ) | 9.25 | ||||
Forfeited | (128,039 | ) | 18.04 | ||||
Non-vested at December 31, 2019 | 1,435,774 | $ | 18.69 | ||||
The fair value of the RSUs is determined based on the closing price of the Company’s common stock on the date of grant. The fair value of vested RSUs was $17.6 million, $1.0 million and $1.1 million for the years ended December 31, 2019, 2018 and 2017, respectively.
Stock-based compensation
The following table sets forth stock-based compensation expense related to stock-based arrangements under the Plans for the years ended December 31 as follows (in thousands):
2019 | 2018 | 2017 | |||||||||
Cost of revenue | $ | 786 | $ | 616 | $ | 719 | |||||
Research and development | 4,100 | 3,156 | 2,853 | ||||||||
Selling, general and administrative | 11,726 | 6,982 | 7,047 | ||||||||
Total stock-based compensation expense | $ | 16,612 | $ | 10,754 | $ | 10,619 | |||||
As of December 31, 2019, total unrecognized stock-based compensation cost related to non-vested options and RSUs was $32.3 million. This cost will be recognized on a straight-line basis over the weighted-average remaining service period of 2.38 years. The Company utilizes newly issued shares to satisfy option exercises. No tax benefit was recognized related to stock-based compensation cost since the Company has not reported taxable income to date and has established a full valuation allowance to offset all of the potential tax benefits associated with its deferred tax assets.
-92-
Valuation assumptions
The fair value of each employee option grant as of December 31 was estimated on the date of grant using the Black-Scholes option pricing model with the following assumptions:
2019 | 2018 | 2017 | |||
Risk-free interest rates | 1.41% - 2.56% | 2.22% - 3.01% | 1.40% - 2.26% | ||
Expected term (years) | 5.12 - 6.08 | 5.50 - 6.09 | 5.50 - 6.25 | ||
Expected dividend yield | — | — | — | ||
Expected volatility | 52.6% - 58.02% | 56.0% - 57.7% | 53.9% - 58.0% | ||
The risk-free interest rates are based on the implied yield currently available in U.S. Treasury securities at maturity with an equivalent term. For purposes of determining the expected term of the awards in the absence of sufficient historical data relating to stock-option exercises, the Company applies a simplified approach in which the expected term of an award is presumed to be the mid-point between the vesting date and the expiration date of the award. The Company has not declared or paid any dividends and does not currently expect to do so in the foreseeable future. Expected volatility is based on the historical cumulative volatility of the Company’s stock price.
Employee Stock Purchase Plan
The Company’s 2013 Employee Stock Purchase Plan (“ESPP”) provides eligible employees with an opportunity to purchase common stock from the Company and to pay for their purchases through payroll deductions. The ESPP has overlapping offering periods of approximately 12 months in length. The offering periods generally start with the first trading day on or after March 1 and September 1 of each year and end on the first trading day on or after March 1 and September 1 of the following year, approximately 12 months later. Within each offering period, shares are purchased each six months on an exercise date.
An employee electing to participate in the ESPP (a “participant”) will be granted an option at the start of the offering period to purchase shares with contributions in any whole percentage ranging from 0% to 10% (or greater or lesser percentages or dollar amounts that the administrator determines) of the participant’s eligible compensation. The participant’s contributions will be accumulated and then used to purchase the Company’s shares on each exercise date. The purchase price on the exercise date will be 85% of the fair market value of the lesser of the Company’s share price on either the first trading day of the offering period or on the exercise date.
During 2019, 2018 and 2017, shares issued under the ESPP were 203,464, 257,132 and 138,972, respectively. The Company recorded share-based compensation expense for shares issued from the ESPP of $0.8 million, $0.7 million and $0.8 million for the years ended December 31, 2019, 2018 and 2017, respectively. A total of 1,360,897 shares of common stock have been reserved for issuance under the ESPP, of which 344,670 shares were available for issuance as of December 31, 2019.
14. Defined Contribution Retirement Plan
The Company maintains a 401(k) defined contribution retirement plan covering substantially all of its employees. The plan provides for matching and discretionary contributions by the Company. Contributions were $1.5 million, $1.3 million and $1.2 million for the years ended December 31, 2019, 2018 and 2017, respectively.
-93-
15. Income Taxes
Loss before income taxes for the years ended December 31 consisted of the following (in thousands):
2019 | 2018 | 2017 | |||||||||
Domestic | $ | (41,720 | ) | $ | (78,124 | ) | $ | (44,324 | ) | ||
Foreign | 1,293 | 973 | 966 | ||||||||
Loss before income taxes | $ | (40,427 | ) | $ | (77,151 | ) | $ | (43,358 | ) | ||
Significant components of our provision for income taxes for the years ended December 31 are as follows (in thousands):
2019 | 2018 | 2017 | |||||||||
Current: | |||||||||||
Domestic | $ | — | $ | — | $ | — | |||||
Foreign | 269 | 249 | 204 | ||||||||
Total provision for income taxes | $ | 269 | $ | 249 | $ | 204 | |||||
The Tax Cuts and Jobs Act, or the Act, was enacted on December 22, 2017, which reduced the U.S. federal corporate tax rate from 35% to 21%, among other changes. The Company’s accounting for the elements of the Act is complete and resulted in a $37.7 million reduction in its net deferred tax assets as of December 31, 2017 to reflect the new statutory rate. The rate adjustment to the deferred tax assets was fully offset by a decrease in the valuation allowance, resulting in no rate impact to the Company.
A reconciliation of the federal statutory income tax rate to the effective income tax rate for the years ended December 31 are as follows (in thousands):
2019 | 2018 | 2017 | |||||||||
Income tax provision at federal statutory rate | $ | (8,490 | ) | $ | (16,202 | ) | $ | (15,076 | ) | ||
Tax on repatriated foreign earnings and other nondeductible items | 403 | 195 | 179 | ||||||||
Section 162(m) limitations | 1,438 | — | — | ||||||||
Change in tax credits | (3,738 | ) | (2,148 | ) | (2,361 | ) | |||||
Change in valuation allowance | 17,842 | 19,935 | (19,792 | ) | |||||||
Changes in federal and state tax rates | (4,058 | ) | — | 37,690 | |||||||
Stock option exercise (windfall) shortfall | (1,763 | ) | 257 | — | |||||||
Foreign tax and other | (1,365 | ) | (1,788 | ) | (436 | ) | |||||
Total provision for income taxes | $ | 269 | $ | 249 | $ | 204 | |||||
At December 31, 2019, for income tax return purposes the Company has gross federal and state NOL carryforwards totaling $375.2 million and tax credit carryforwards of $13.3 million. The gross federal NOL carryforwards generated during and after fiscal 2018 totaling $83.5 million are carried forward indefinitely, while all others, if not utilized, will expire beginning in 2025 through 2037. The research and development credit carryforwards generated prior to 2018 will expire beginning in 2028. The carryforwards may be subject to limitations under the Internal Revenue Code and applicable state tax law.
The Company does not expect to utilize any of its net operating loss and tax credit carryforwards in the near term. The Company may have already experienced one or more ownership changes. Depending on the timing of any future utilization of its carryforwards, the Company may be limited as to the amount that can be utilized each year as a result of such previous ownership changes. However, the Company does not believe such limitations will cause its carryforwards to expire unutilized.
Future changes in the Company’s stock ownership as well as other changes that may be outside the Company’s control could potentially result in further limitations on the Company’s ability to utilize its net operating loss and tax credit carryforwards.
-94-
The effect of temporary differences and carryforwards that give rise to deferred tax assets for the years ended December 31 were as follows (in thousands):
2019 | 2018 | ||||||
Net operating loss carryforwards | $ | 73,310 | $ | 63,442 | |||
Research and development tax credit carryforwards | 12,636 | 8,491 | |||||
Foreign tax credit carryforwards | 633 | 613 | |||||
Stock-based compensation | 9,680 | 7,703 | |||||
Other | 10,179 | 8,347 | |||||
Total deferred tax assets | 106,438 | 88,596 | |||||
Less: Valuation allowance | (106,438 | ) | (88,596 | ) | |||
Net deferred tax assets | $ | — | $ | — | |||
The Company has recorded a full valuation allowance related to its deferred tax assets due to the uncertainty of the ultimate realization of the future benefits from those assets.
The table below summarizes changes in the deferred tax asset valuation allowance for the years ended December 31 (in thousands):
2019 | 2018 | 2017 | |||||||||
Balance at beginning of year | $ | 88,596 | $ | 68,661 | $ | 88,453 | |||||
Charged to costs and expenses | 13,784 | 19,935 | 17,898 | ||||||||
Impact of change in tax rate | 4,058 | — | (37,690 | ) | |||||||
Balance at end of year | $ | 106,438 | $ | 88,596 | $ | 68,661 | |||||
The total balance of unrecognized gross tax benefits for the years ended December 31, resulting from research and development tax credits claimed on the Company’s annual tax return was as follows (in thousands):
2019 | 2018 | 2017 | |||||||||
Unrecognized tax benefits at beginning of year | $ | 2,830 | $ | 2,168 | $ | 1,524 | |||||
Additions based on current year tax positions | 1,382 | 662 | 644 | ||||||||
Unrecognized tax benefits at end of year | $ | 4,212 | $ | 2,830 | $ | 2,168 | |||||
The Company classifies applicable interest and penalties on amounts due to tax authorities as a component of the provision for income taxes. The amount of accrued interest and penalties recorded in 2019, 2018 or 2017 was not significant. The Company does not anticipate that the amount of its existing unrecognized tax benefits will significantly increase or decrease within the next 12 months. Due to the presence of net operating loss carryforwards in most jurisdictions, the Company’s tax years remain open for examination by U.S. taxing authorities back to 2004.
16. Commitments and Contingencies
Contingencies
From time to time, the Company may become involved in litigation relating to claims arising from the ordinary course of business. Additionally, the Company operates in various states and local jurisdictions for which sales, occupation, or franchise taxes may be payable to certain taxing authorities. Management believes that there are no claims or actions pending against the Company currently, the ultimate disposition of which would have a material adverse effect on the Company’s consolidated results of operations, financial condition or cash flows.
Purchase Commitments
At December 31, 2019 the Company has non-cancellable purchase obligations of $27.6 million related to binding commitments to purchase inventory and other research and development items.
17. Net Loss Per Share
Net loss per share is computed by dividing the net loss by the weighted average number of shares of common stock outstanding. Outstanding stock options, warrants and preferred stock have not been included in the calculation of diluted net
-95-
loss per share because to do so would be anti-dilutive. Accordingly, the numerator and the denominator used in computing both basic and diluted net loss per share for each period are the same.
The following outstanding options, restricted stock units and warrants as of December 31 were excluded from the computation of diluted net loss per share for the periods presented because their effect would have been anti-dilutive (in thousands):
2019 | 2018 | 2017 | ||||||
Options to purchase common stock | 4,610 | 5,395 | 5,335 | |||||
Restricted stock units | 1,681 | 1,147 | 313 | |||||
Common stock warrants | 1,116 | 535 | 317 | |||||
18. Information about Geographic Areas
The following table of total revenue is based on the geographic location of distributors or end users who purchase products and services and collaborators. For sales to distributors, their geographic location may be different from the geographic locations of the ultimate end user. For collaboration agreements, revenues are derived from partners located primarily in the United States. Americas consists of the United States, Canada, Mexico and South America; and Asia Pacific includes Japan, China, South Korea, Singapore, Malaysia, India, Vietnam, Thailand and Australia.
Revenue by geography as of December 31 was as follows (in thousands):
2019 | 2018 | 2017 | |||||||||
Americas | $ | 86,139 | $ | 74,137 | $ | 86,099 | |||||
Europe & Middle East | 30,289 | 25,715 | 21,791 | ||||||||
Asia Pacific | 9,140 | 6,880 | 7,015 | ||||||||
Total revenue | $ | 125,568 | $ | 106,732 | $ | 114,905 | |||||
Total revenue in the United States was $83.9 million, $71.2 million and $84.0 million for the years ended December 31, 2019, 2018 and 2017, respectively. The Company’s assets are primarily located in the United States and not allocated to any specific geographic region. Substantially all of the Company’s long-lived assets are located in the United States.
19. Condensed Quarterly Financial Data (unaudited)
The following table contains selected unaudited financial data for each quarter of 2019 and 2018. The unaudited information should be read in conjunction with the Company’s financial statements and related notes included elsewhere in this report. The Company believes that the following unaudited information reflects all normal recurring adjustments necessary for a fair statement of the information for the periods presented. The operating results for any quarter are not necessarily indicative of results for any future period.
Three months ended | |||||||||||||||
March 31, | June 30, | September 30, | December 31, | ||||||||||||
(in thousands, except per share data) | |||||||||||||||
2019 | |||||||||||||||
Total revenue | $ | 27,688 | $ | 30,345 | $ | 30,604 | $ | 36,931 | |||||||
Product and service gross profit | $ | 12,641 | $ | 12,765 | $ | 15,424 | $ | 18,845 | |||||||
Net income (loss) | $ | (21,898 | ) | $ | (20,037 | ) | $ | (22,748 | ) | $ | 23,987 | ||||
Net income (loss) per share – basic | $ | (0.69 | ) | $ | (0.57 | ) | $ | (0.64 | ) | $ | 0.67 | ||||
Net income (loss) per share – diluted | $ | (0.69 | ) | $ | (0.57 | ) | $ | (0.64 | ) | $ | 0.61 | ||||
2018 | |||||||||||||||
Total revenue | $ | 23,085 | $ | 24,999 | $ | 28,616 | $ | 30,032 | |||||||
Product and service gross profit | $ | 10,350 | $ | 11,832 | $ | 12,162 | $ | 12,848 | |||||||
Net loss | $ | (19,202 | ) | $ | (20,601 | ) | $ | (16,486 | ) | $ | (21,111 | ) | |||
Net loss per share – basic and diluted | $ | (0.75 | ) | $ | (0.80 | ) | $ | (0.56 | ) | $ | (0.68 | ) | |||
-96-
Item 9. Changes in and Disagreements with Accountants on Accounting and Financial Disclosure
None.
Item 9A. Controls and Procedures
Evaluation of Disclosure Controls and Procedures
Our management, with the participation of our Chief Executive Officer and our Chief Financial Officer, evaluated the effectiveness of our disclosure controls and procedures as of December 31, 2019. The term “disclosure controls and procedures,” as defined in Rules 13a-15(e) and 15d-15(e) under the Exchange Act, means controls and other procedures of a company that are designed to provide reasonable assurance that information required to be disclosed by a company in the reports that it files or submits under the Exchange Act is recorded, processed, summarized and reported, within the time periods specified in the U.S. Securities and Exchange Commission’s (“SEC”) rules and forms. Disclosure controls and procedures include, without limitation, controls and procedures designed to ensure that information required to be disclosed by a company in the reports that it files or submits under the Exchange Act is accumulated and communicated to the company’s management, including its Chief Executive and Chief Financial Officers, as appropriate to allow timely decisions regarding required disclosure. Management recognizes that any controls and procedures, no matter how well designed and operated, can provide only reasonable assurance of achieving their objectives and management necessarily applies its judgment in evaluating the cost-benefit relationship of possible controls and procedures. Based on the evaluation of our disclosure controls and procedures as of December 31, 2019, our Chief Executive Officer and Chief Financial Officer have concluded that, as of such date, our disclosure controls and procedures were not effective due to the material weaknesses in internal control over financial reporting, described below.
Following identification of the material weaknesses and prior to filing this Annual Report on Form 10-K, we completed substantive procedures for the year ended December 31, 2019. Based on these procedures, management concluded that our consolidated financial statements included in this Annual Report on Form 10-K have been prepared in accordance with U.S. GAAP. Our Chief Executive Officer and Chief Financial Officer have certified that, based on their knowledge, the financial statements, and other financial information included in this Annual Report on Form 10-K, present fairly in all material respects the financial condition, results of operations and cash flows of the Company as of, and for, the periods presented in this Annual Report on Form 10-K.
PricewaterhouseCoopers LLP, an independent registered public accounting firm, has issued an unqualified opinion on our consolidated financial statements, which is included in Item 8 of this Annual Report on Form 10-K.
Management’s Annual Report on Internal Control Over Financial Reporting
Our management is responsible for establishing and maintaining adequate internal control over financial reporting as defined in Rules 13a-15(f) and 15d-15(f) of the Exchange Act. Our internal control over financial reporting is a process to provide reasonable assurance regarding the reliability of financial reporting and the preparation of financial statements for external purposes in accordance with generally accepted accounting principles. Our internal control over financial reporting includes those policies and procedures that:
(i) | pertain to the maintenance of records that, in reasonable detail, accurately and fairly reflect the transactions and dispositions of our assets; |
(ii) | provide reasonable assurance that transactions are recorded as necessary to permit preparation of financial statements in accordance with generally accepted accounting principles, and that our receipts and expenditures are being made only in accordance with authorizations of our management and directors; and |
(iii) provide reasonable assurance regarding prevention or timely detection of unauthorized acquisition, use or disposition of our assets that could have a material effect on the financial statements.
Because of its inherent limitations, internal control over financial reporting may not prevent or detect misstatements. Also, projections of any evaluation of effectiveness to future periods are subject to the risk that controls may become inadequate because of changes in conditions, or that the degree of compliance with the policies or procedures may deteriorate. Our management assessed the effectiveness of our internal control over financial reporting as of December 31, 2019. In making this assessment, our management used the criteria set forth by the Committee of Sponsoring Organizations of the Treadway Commission (COSO) in Internal Control-Integrated Framework (2013). A material weakness is a deficiency, or a combination of deficiencies, in internal control over financial reporting, such that there is a reasonable possibility that a material misstatement of our annual or interim financial statements will not be prevented or detected on a timely basis. We have identified the following control deficiencies that constituted material weaknesses in our internal control over financial reporting as of December 31, 2019:
-97-
We identified a deficiency related to an ineffective control environment as we did not maintain a sufficient complement of resources with an appropriate level of controls knowledge, expertise and training commensurate with our financial reporting requirements. This deficiency contributed to additional control deficiencies, as follows, as we did not:
(i) | design and maintain effective information technology general controls (“ITGCs”) for the significant applications used in the preparation of the financial statements. Specifically, we did not design and maintain: (a) user access controls to adequately restrict user and privileged access to the financial application, programs, and data to appropriate Company personnel, (b) program change management controls for certain financial systems to ensure that information technology (“IT”) program and data changes affecting financial IT applications and underlying accounting records are identified, tested, authorized and implemented appropriately; and |
(ii) | design and maintain effective controls to timely detect and independently review instances where individuals with access to post a journal entry may also have edited or created the journal entry; and |
(iii) | design and maintain effective controls relating to our accounting for product and services revenues, specifically to ensure completeness, accuracy, and occurrence of customer order entry, price, and quantity during the product and services billing and revenue processes; and |
(iv) | maintain effective controls related to the existence of inventory. Specifically, we did not maintain effective controls related to periodic inventory counts, receiving of inventory, and recording adjustments to inventory quantities. |
The material weaknesses identified above did not result in any identified misstatements to our annual or interim financial statements, there were no changes to previously released financial results, and our management has concluded that the consolidated financial statements included elsewhere in this Annual Report on Form 10-K present fairly, in all material respects, our financial position, results of operations, and cash flows in conformity with accounting principles generally accepted in the United States of America. Additionally, these material weaknesses could result in a material misstatement to the annual or interim consolidated financial statements or disclosures that would not be prevented or detected. Based on these material weaknesses, management concluded that as of December 31, 2019, our internal control over financial reporting was not effective.
The effectiveness of our internal control over financial reporting as of December 31, 2019 has been audited by PricewaterhouseCoopers LLP, an independent registered public accounting firm, as stated in their report which appears herein.
Remediation Efforts
As of December 31, 2019, the material weaknesses have not yet been remediated, as described above; however, significant progress has been made during the year. Remediation activities for each of these previously identified material weaknesses include:
During 2019, we made significant progress in taking steps towards remediation of the material weakness related to our control environment. Specifically, management implemented enhanced training programs and documentation practices which address ITGCs and related policies, as well as general training related to documentation and evidencing requirements associated with performing our internal control testing procedures.
We have also made significant progress in taking steps toward remediation of the related material weakness relating to the design and maintenance of certain ITGCs for significant applications used in the preparation of the financial statements. Specifically:
(i) | management implemented an IT Change Management Control Board which oversees and approves changes to key IT systems which impact our financial reporting; and |
(ii) | management implemented improved processes for requesting, authorizing, and reviewing user access to key systems which impact our financial reporting, including identifying access to roles where manual business process controls may be required. This implementation included the addition of new preventative control activities associated with user access provisioning (including users’ ability to create, edit or post journal entries) within our key systems which impact our financial reporting, as well as certain detective controls which review user access and activity logs related to systems that were accessed. |
Implementation of the above steps has contributed to reducing the number of individually deficient controls within our ITGC environment. While we have implemented changes in our ITGC environment, we require additional time to complete the design and implementation of our remediation plans and demonstrate the effectiveness of our remediation efforts. The material weaknesses cannot be considered remediated until the applicable remedial controls operate for a sufficient period of time and management has concluded, through testing, that these controls are operating effectively.
-98-
We are also making progress towards the remediation of the material weakness relating to our accounting for product and services revenues, primarily through evaluation of certain design considerations associated with internal controls to ensure the completeness, occurrence and accuracy of customer order entry processes, including validation of price and quantity during our customer billing and revenue recognition procedures. Additionally, we have, and will continue to conduct training sessions for key controls owners and other key participants which perform activities that are tied to our key controls over financial reporting to ensure they are trained in a manner such that they have sufficient knowledge and understanding of our internal control environment, their impact to those controls, and the Company’s expectation around adherence to processes and procedures as it relates to performing control activities.
Changes in Internal Control over Financial Reporting
During the quarter ended December 31, 2019, we identified the material weaknesses relating to our product and services billing and revenue processes and inventory, as described above. There were no other changes to our internal control over financial reporting for the quarter ended December 31, 2019 that have materially affected, or are reasonably likely to materially affect, our internal control over financial reporting.
Item 9B. Other Information
None.
-99-
PART III
Item 10. Directors, Executive Officers and Corporate Governance
The information required by Item 10 of Form 10-K is incorporated by reference to our Proxy Statement for the 2020 Annual Meeting of Stockholders to be filed with the SEC within 120 days after the end of the fiscal year ended December 31, 2019.
Item 11. Executive Compensation
The information required by Item 11 of Form 10-K is incorporated by reference to our Proxy Statement for the 2020 Annual Meeting of Stockholders to be filed with the SEC within 120 days after the end of the fiscal year ended December 31, 2019.
Item 12. Security Ownership of Certain Beneficial Owners and Management and Related Stockholder Matters
The information required by Item 12 of Form 10-K is incorporated by reference to our Proxy Statement for the 2020 Annual Meeting of Stockholders to be filed with the SEC within 120 days after the end of the fiscal year ended December 31, 2019.
Item 13. Certain Relationships and Related Transactions, and Director Independence
The information required by Item 13 of Form 10-K is incorporated by reference to our Proxy Statement for the 2020 Annual Meeting of Stockholders to be filed with the SEC within 120 days after the end of the fiscal year ended December 31, 2019.
Item 14. Principal Accountant Fees and Services
The information required by Item 14 of Form 10-K is incorporated by reference to our Proxy Statement for the 2020 Annual Meeting of Stockholders to be filed with the SEC within 120 days after the end of the fiscal year ended December 31, 2019.
-100-
PART IV
Item 15. Exhibits, Financial Statement Schedules
(a) The following documents are filed as part of this report:
(1) Financial Statements — The financial statements filed as part of this Annual Report on Form 10-K are listed on the Index to Consolidated Financial Statements in Item 8.
(2) Financial Statement Schedules — The financial statement schedules have been omitted because the information required to be set forth therein is not applicable or is shown in the financial statements or the notes thereto.
(3) Exhibits — The exhibits required by Item 601 of Regulation S-K are listed in paragraph (b) below.
(b) Exhibits
The exhibits listed on the Exhibit Index (following the Signatures section of this report) are filed herewith or are incorporated by reference to exhibits previously filed with the SEC.
Exhibit | Incorporated by Reference | |||||||||
Number | Description | Form | Filing Date | Number | Filed Herewith | |||||
2.1*† | 8-K | December 4, 2019 | 2.1 | |||||||
3.1 | 10-Q | August 8, 2013 | 3.1 | |||||||
3.2 | 10-Q | August 8, 2013 | 3.2 | |||||||
4.1 | S-1/A | June 13, 2013 | 4.1 | |||||||
4.2 | 8-K | August 8, 2017 | 4.1 | |||||||
4.3 | 10-K | March 11, 2019 | 4.3 | |||||||
4.4 | X | |||||||||
10.1 | S-1/A | June 13, 2013 | 10.1 | |||||||
10.2+ | S-1 | May 20, 2013 | 10.2 | |||||||
10.3+ | S-1 | May 20, 2013 | 10.3 | |||||||
10.4+ | S-1 | May 20, 2013 | 10.4 | |||||||
10.5+ | S-1/A | June 13, 2013 | 10.5 | |||||||
10.6+ | S-1/A | June 13, 2013 | 10.6 | |||||||
10.7+ | S-1/A | June 13, 2013 | 10.7 | |||||||
-101-
Exhibit | Incorporated by Reference | |||||||||
Number | Description | Form | Filing Date | Exhibit | Filed Herewith | |||||
10.8+ | S-1/A | June 13, 2013 | 10.8 | |||||||
10.9+ | X | |||||||||
10.10+ | S-1/A | June 13, 2013 | 10.9 | |||||||
10.11+ | 8-K | January 16, 2018 | 10.1 | |||||||
10.12+ | S-1 | May 20, 2013 | 10.8 | |||||||
10.13+ | 10-Q | August 9, 2017 | 10.1 | |||||||
10.14+ | X | |||||||||
10.15+ | 10-K | March 11, 2016 | 10.12 | |||||||
10.16+ | 10-Q | August 9, 2017 | 10.3 | |||||||
10.17+ | X | |||||||||
10.18+ | S-1 | January 13, 2014 | 10.12 | |||||||
10.19+ | 10-K | March 7, 2018 | 10.17 | |||||||
10.20+ | 10-K | March 7, 2018 | 10.18 | |||||||
10.21+ | X | |||||||||
10.22+ | 10-K | March 7, 2018 | 10.19 | |||||||
10.23+ | X | |||||||||
10.24+ | 10-K | March 7, 2018 | 10.20 | |||||||
10.25+ | X | |||||||||
10.26+ | 10-K | March 11, 2019 | 10.20 | |||||||
10.27+ | 10-K | March 11, 2019 | 10.21 | |||||||
10.28+ | 10-K | March 11, 2019 | 10.22 | |||||||
-102-
Exhibit | Incorporated by Reference | |||||||||
Number | Description | Form | Filing Date | Exhibit | Filed Herewith | |||||
10.29 | 10-K | March 13, 2015 | 10.14 | |||||||
10.30 | 10-K | March 11, 2016 | 10.13 | |||||||
10.31 | 10-K | March 13, 2015 | 10.15 | |||||||
10.32 | 10-Q | August 4, 2016 | 10.1 | |||||||
10.33 | 10-K | March 13, 2015 | 10.16 | |||||||
10.34 | 10-Q | May 6, 2016 | 10.1 | |||||||
10.35†† | 10-K | March 11, 2019 | 10.29 | |||||||
10.36†† | S-1 | May 20, 2013 | 10.19 | |||||||
10.37†† | S-1 | May 20, 2013 | 10.20 | |||||||
10.38 | S-1 | May 20, 2013 | 10.21 | |||||||
10.39†† | 10-Q | November 8, 2017 | 10.1 | |||||||
10.40† | X | |||||||||
10.41†† | 10-K | March 11, 2019 | 10.39 | |||||||
21.1 | 10-K | March 7, 2018 | 21.1 | |||||||
23.1 | X | |||||||||
24.1 | X | |||||||||
31.1 | X | |||||||||
31.2 | X | |||||||||
-103-
Exhibit | Incorporated by Reference | |||||||||
Number | Description | Form | Filing Date | Number | Filed Herewith | |||||
32.1 | X | |||||||||
32.2 | X | |||||||||
101.INS | XBRL Instance Document. | X | ||||||||
101.SCH | XBRL Taxonomy Extension Schema Document. | X | ||||||||
101.CAL | XBRL Taxonomy Extension Calculation Linkbase Document. | X | ||||||||
101.DEF | XBRL Taxonomy Extension Definition Linkbase Document. | X | ||||||||
101.LAB | XBRL Taxonomy Extension Label Linkbase Document | X | ||||||||
101.PRE | XBRL Taxonomy Extension Presentation Linkbase Document. | X | ||||||||
+ | Indicates a management contract or compensatory plan. |
* | Certain schedules and exhibits have been omitted pursuant to Item 601(a)(5) of Regulation S-K, but a copy will be furnished supplementally to the Securities and Exchange Commission upon request. |
† | Certain portions of this exhibit have been omitted because they are not material and would likely cause competitive harm to the registrant if disclosed. |
†† | Confidential treatment has been granted with respect to certain portions of this exhibit. Omitted portions have been filed separately with the Securities and Exchange Commission. |
Item 16. Form 10-K Summary
Not applicable.
-104-
SIGNATURES
Pursuant to the requirements of Section 13 or 15(d) of the Securities Exchange Act of 1934, the registrant has duly caused this report to be signed on its behalf by the undersigned, thereunto duly authorized.
Dated: March 2, 2020
NANOSTRING TECHNOLOGIES, INC. | |
By: | /s/ R. Bradley Gray |
R. Bradley Gray | |
President and Chief Executive Officer | |
POWER OF ATTORNEY
KNOW ALL PERSONS BY THESE PRESENTS, that each person whose signature appears below constitutes and appoints R. Bradley Gray and K. Thomas Bailey, and each of them, with full power of substitution and resubstitution and full power to act without the other, as his or her true and lawful attorney-in-fact and agent to act in his or her name, place and stead and to execute in the name and on behalf of each person, individually and in each capacity stated below, and to file, any and all documents in connection therewith, with the Securities and Exchange Commission, granting unto said attorneys-in-fact and agents, and each of them, full power and authority to do and perform each and every act and thing, ratifying and confirming all that said attorneys-in-fact and agents or any of them or their and his or her substitute or substitutes, may lawfully do or cause to be done by virtue thereof.
Pursuant to the requirements of the Securities Act of 1934, this Annual Report on Form 10-K has been signed by the following persons on behalf of the registrant and in the capacities and on the dates indicated.
Signature | Title | Date | ||
/s/ R. Bradley Gray | President, Chief Executive Officer and Director (Principal Executive Officer) | March 2, 2020 | ||
R. Bradley Gray | ||||
/s/ K. Thomas Bailey | Chief Financial Officer (Principal Accounting and Financial Officer) | March 2, 2020 | ||
K. Thomas Bailey | ||||
/s/ William D. Young | Chairman of the Board of Directors | March 2, 2020 | ||
William D. Young | ||||
/s/ Elisha W. Finney | Director | March 2, 2020 | ||
Elisha W. Finney | ||||
/s/ Robert M. Hershberg | Director | March 2, 2020 | ||
Robert M. Hershberg | ||||
/s/ Don R. Kania | Director | March 2, 2020 | ||
Don R. Kania | ||||
/s/ Kirk D. Malloy | Director | March 2, 2020 | ||
Kirk D. Malloy | ||||
/s/ Gregory Norden | Director | March 2, 2020 | ||
Gregory Norden | ||||
/s/ Charles P. Waite | Director | March 2, 2020 | ||
Charles P. Waite | ||||
-105-