Attached files
SECURITIES AND EXCHANGE COMMISSION
Washington, D.C. 20549
FORM 10-K
(Mark One)
x | Annual Report pursuant to Section 13 or 15(d) of the Securities Exchange Act of 1934 for the fiscal year ended December 31, 2019 | |
or | ||
o | Transition Report Pursuant to Section 13 or 15(d) of the Securities Exchange Act of 1934 For the Period from ______ to _______. | |
Commission File Number 001-36239
CATCHMARK TIMBER TRUST, INC.
(Exact name of registrant as specified in its charter)
Maryland | 20-3536671 | |
(State or other jurisdiction of incorporation or organization) | (I.R.S. Employer Identification Number) | |
5 Concourse Parkway, Suite 2650, Atlanta, GA | 30328 | |
(Address of principal executive offices) | (Zip Code) | |
(855) 858-9794
Registrant’s telephone number, including area code
____________________________________________________________________
Securities registered pursuant to Section 12(b) of the Act:
Title of each class | Trading Symbol | Name of exchange on which registered |
Class A Common Stock, $0.01 Par Value Per Share | CTT | New York Stock Exchange |
Securities registered pursuant to Section 12(g) of the Act: NONE
Indicate by check mark if the registrant is a well-known seasoned issuer, as defined in Rule 405 of the Securities Act. Yes o No x
Indicate by check mark if the registrant is not required to file reports pursuant to Section 13 or Section 15(d) of the Exchange Act. Yes o No x
Indicate by check mark whether the registrant (1) has filed all reports required to be filed by Section 13 or 15(d) of the Securities Exchange Act of 1934 during the preceding 12 months (or for such shorter period that the registrant was required to file such reports), and (2) has been subject to such filing requirements for the past 90 days. Yes x No o
Indicate by check mark whether the registrant has submitted electronically every Interactive Data File required to be submitted pursuant to Rule 405 of Regulation S-T (§232.405 of this chapter) during the preceding 12 months (or for such shorter period that the registrant was required to submit such files).
Yes x No o
Indicate by check mark whether the registrant is a large accelerated filer, an accelerated flier, a non-accelerated filer, a smaller reporting company, or an emerging growth company. See the definitions of “large accelerated filer,” “accelerated filer,” “smaller reporting company,” and "emerging growth company" in Rule 12b-2 of the Exchange Act.
Large accelerated filer o | Accelerated filer x | Non-accelerated filer o | Smaller reporting company x |
Emerging growth company o | |||
If an emerging growth company, indicate by check mark if the registrant has elected not to use the extended transition period for complying with any new or revised financial accounting standards provided pursuant to Section 13 (a) of the Exchange Act. o
Indicate by check mark whether the registrant is a shell company (as defined in Rule 12b-2 of the Act). Yes o No x
The aggregate market value of the Class A common stock held by non-affiliates of the registrant as of June 28, 2019 (the last business day of the registrant’s most recently completed second fiscal quarter) was approximately $506.2 million, computed by using the closing price of the Class A common stock as of that date on the New York Stock Exchange of $10.45 per share.
As of February 27, 2020: 49,041,812 shares of the registrant's Class A common stock were outstanding
Documents Incorporated by Reference
Certain portions of the registrant’s definitive proxy statement filed pursuant to Regulation 14A of the Securities Exchange Act of 1934 in connection with the 2020 annual meeting of the registrant’s stockholders are incorporated by reference into Part III of this Annual Report on Form 10-K as indicated herein.
GLOSSARY
The following abbreviations or acronyms may be used in this document, including the consolidated financial statements and the notes thereto, and shall have the adjacent meanings set forth below:
AFM | American Forestry Management, Inc. | |
AgFirst | Agfirst Farm Credit Bank | |
ASC | Accounting Standards Codification | |
ASU | Accounting Standards Update | |
CoBank | CoBank, ACB | |
Common Stock | Class A common stock, $0.01 par value per share of CatchMark Timber Trust, Inc. | |
Code | Internal Revenue Code | |
EBITDA | Earnings from Continuing Operations before Interest, Taxes, Depletion, and Amortization | |
FASB | Financial Accounting Standards Board | |
FCCR | Fixed Charge Coverage Ratio | |
FRC | Forest Resource Consultants, Inc. | |
GAAP | Generally Accepted Accounting Principles in the United States | |
HBU | Higher and Better Use | |
HLBV | Hypothetical Liquidation at Book Value | |
IP | International Paper Company | |
IPO | Initial Listed Public Offering | |
IRS | Internal Revenue Service | |
LIBOR | London Interbank Offered Rate | |
LTC | Long-Term Contract | |
LTIP | Long-Term Incentive Plan | |
LTV | Loan-to-Value | |
MBF | Thousand Board Feet | |
MPERS | Missouri Department of Transportation & Patrol Retirement System | |
NCREIF | National Council of Real Estate Investment Fiduciaries | |
NYSE | New York Stock Exchange | |
Rabobank | Cooperatieve Centrale Raiffeisen-Boerenleenbank, B.A. | |
REIT | Real Estate Investment Trust | |
ROU | Right-of-use | |
RSU | Restricted Stock Unit | |
SEC | Securities and Exchange Commission | |
SFI | Sustainable Forest Initiative | |
SOFR | Secured Overnight Financing Rate | |
SRP | Share Repurchase Program | |
TRS | Taxable REIT Subsidiary | |
TSR | Total Shareholder Return | |
U.S. | United States | |
VIE | Variable Interest Entity | |
WestRock | WestRock Company | |
FORM 10-K
CATCHMARK TIMBER TRUST, INC.
TABLE OF CONTENTS
Page No. | |||
Item 1. | |||
Item 1A. | |||
Item 1B. | |||
Item 2. | |||
Item 3. | |||
Item 4. | Mine Safety Disclosures | ||
Item 5. | |||
Item 6. | |||
Item 7. | |||
Item 7A. | |||
Item 8. | |||
Item 9. | |||
Item 9A | |||
Item 9B. | |||
Item 10. | |||
Item 11. | |||
Item 12. | |||
Item 13. | |||
Item 14. | |||
Item 15. | |||
Item 16. | Form 10-K Summary | ||
CAUTIONARY NOTE REGARDING FORWARD-LOOKING STATEMENTS
Certain statements contained in this Annual Report on Form 10-K of CatchMark Timber Trust, Inc. and subsidiaries (“CatchMark,” “we,” “our,” or “us”) may be considered forward-looking statements within the meaning of Section 27A of the Securities Act of 1933, as amended (the “Securities Act”), and Section 21E of the Securities Exchange Act of 1934, as amended (the “Exchange Act”). In addition, CatchMark, or the executive officers on CatchMark’s behalf, may from time to time make forward-looking statements in other reports and documents CatchMark files with the SEC or in connection with oral statements made to the press, potential investors, or others. We intend for all such forward-looking statements to be covered by the applicable safe harbor provisions for forward-looking statements contained in the Securities Act and the Exchange Act.
Forward-looking statements can generally be identified by our use of forward-looking terminology such as “may,” “will,” “expect,” “intend,” “anticipate,” “estimate,” “believe,” “continue,” or other similar words. However, the absence of these or similar words or expressions does not mean that a statement is not forward-looking. Forward-looking statements are not guarantees of performance and are based on certain assumptions, discuss future expectations, describe plans and strategies, contain projections of results of operations or of financial condition or state other forward-looking information. Forward-looking statements in this report relate to anticipated delivery of income, value and long-term
returns through sustainable harvests, well-timed real estate sales, selective acquisitions, joint ventures, and our fee-based asset management business; property performance and anticipated growth in our portfolio; expected uses of cash generated from operations, debt financings and debt and equity offerings; expected sources and adequacy of capital resources and liquidity; distribution policy; change in depletion rates, merchantable timber book value and standing timber inventory volume; anticipated harvest volume and mix of harvest volume; possible interest rate risk
mitigation actions; anticipated non-cash GAAP losses from the unconsolidated Triple T Joint Venture (as defined herein); and other factors that may lead to fluctuations in future net income (loss). Forward-looking statements in this report also relate to the Triple T Joint Venture and include, but are not limited to, statements about the expected benefits of the joint venture, including anticipated harvest volume, financial and operating results and future returns to stockholders; and our plans, objectives, expectations, projections and intentions.
Forward-looking statements are based on a number of assumptions involving judgments and are subject to risks, uncertainties, and other factors that could cause actual results to differ materially from our historical experience and
our present expectations. Such risks and uncertainties related to us and the Triple T Joint Venture include those discussed in Item 1A herein and our subsequent reports filed with the SEC. Accordingly, readers are cautioned not to place undue reliance on our forward-looking statements, which speak only as of the date that this report is filed with the SEC. We do not intend to publicly update or revise any forward-looking statements, whether as a result of new information, future events, or otherwise, except as required by law.
PART I
ITEM 1.BUSINESS
General
CatchMark Timber Trust, Inc. ("CatchMark Timber Trust") (NYSE: CTT) owns and operates timberlands located in the United States and has elected to be taxed as a REIT for federal income tax purposes. CatchMark Timber Trust acquires, owns, operates, manages, and disposes of timberland directly, through wholly-owned subsidiaries, or through joint ventures. CatchMark Timber Trust was incorporated in Maryland in 2005 and commenced operations in 2007. CatchMark Timber Trust conducts substantially all of its business through CatchMark Timber Operating Partnership, L.P. (“CatchMark Timber OP”), a Delaware limited partnership. CatchMark Timber Trust is the general partner of CatchMark Timber OP, possesses full legal control and authority over its operations, and as of December 31, 2019, owned 99.99% of its common partnership units. CatchMark LP Holder, LLC (“CatchMark LP Holder”), a Delaware limited liability company and wholly-owned subsidiary of CatchMark Timber Trust, is the sole limited partner of CatchMark Timber OP and, as of December 31, 2019, owned the remaining 0.01% of its common partnership units. CatchMark Timber TRS, Inc. (“CatchMark TRS”), a Delaware corporation formed as a wholly owned subsidiary of CatchMark Timber OP in 2006, is our taxable REIT subsidiary. Unless otherwise noted, references to CatchMark, "we", "us", or "our" herein include CatchMark Timber Trust and all of its subsidiaries, including CatchMark Timber OP, and the subsidiaries of CatchMark Timber OP, including CatchMark TRS.
We primarily engage in the acquisition, ownership, operation, management, and disposition of timberland properties located in the United States. We seek to generate recurring income and cash flow from the harvest and sale of timber, as well as from non-harvest related revenue sources, such as asset management fees and rent from hunting and recreational leases. When and where we believe appropriate, we also seek to generate income and cash flow from timberland sales. In addition to current income, we expect to realize long-term returns from the biological growth of our standing timber inventory.
We strive to deliver consistent and predictable per-share cash flow growth from disciplined acquisitions, active management, sustainable harvests, and well-timed real estate sales. We intend to grow over time through selective acquisitions and investments in high-demand fiber markets and to efficiently integrate new acquisitions and investments into our operations. Operationally, we focus on generating cash flows from sustainable harvests and improved harvest mix on high-quality industrial timberlands, as well as opportunistic land sales and asset management fees to provide recurring dividends to our stockholders. We continue to practice intensive forest management and silvicultural techniques that improve the biological growth of our forests.
We also seek to create additional value by entering into joint ventures with long-term, institutional equity partners to opportunistically acquire, own, and manage timberland properties that fit our core investment strategy. In April 2017, we entered into our first joint venture, the Dawsonville Bluffs Joint Venture, with MPERS. In July 2018, we entered into the Triple T Joint Venture with a consortium of institutional investors. Our joint venture platform drives growth through our fee-based management business that leverages our scale and timberland management efficiencies.
For the years ended December 31, 2019, 2018 and 2017, our revenues from timber sales, timberland sales, asset management fees, and other non-harvest related sources, as a percentage of our total revenue, are set forth in the table below:
2019 | 2018 | 2017 | |||||||
Timber sales | 68 | % | 71 | % | 78 | % | |||
Timberland sales | 17 | % | 18 | % | 16 | % | |||
Asset management fees | 11 | % | 6 | % | — | % | |||
Other revenues | 4 | % | 5 | % | 6 | % | |||
Total | 100 | % | 100 | % | 100 | % | |||
1
Segment Information
We have three reportable segments: Harvest, Real Estate and Investment Management. Our Harvest segment includes wholly-owned timber assets and associated timber sales, other revenues and related expenses. Our Real Estate segment includes timberland sales, cost of timberland sales and large dispositions. Our Investment Management segment includes investments in and income (loss) from unconsolidated joint ventures and asset management fee revenues earned for the management of these joint ventures.
The following table presents operating revenues by reportable segment:
For the Years Ended December 31, | |||||||||||
(in thousands) | 2019 | 2018 | 2017 | ||||||||
Harvest | $ | 77,189 | $ | 74,734 | $ | 76,419 | |||||
Real Estate | 17,572 | 17,520 | 14,768 | ||||||||
Investment Management | 11,948 | 5,603 | 108 | ||||||||
Total | $ | 106,709 | $ | 97,857 | $ | 91,295 | |||||
Current Timberland Holdings
As of December 31, 2019, we wholly owned interests in 435,500 acres of high-quality industrial timberlands consisting of 18.6 million tons of merchantable timber inventory. Of the wholly-owned timberlands, 417,400 acres were located in six states in the U.S. South and 18,100 acres were located in Oregon. Our timberlands have been intensively managed for sustainable commercial timber production and are located within attractive and desirable fiber baskets encompassing a diverse group of pulp, paper and wood products manufacturing facilities.
In addition to our wholly-owned timber assets, as of December 31, 2019, we owned a common limited partnership interest in the Triple T Joint Venture, which owns 1.1 million acres of high-quality industrial East Texas timberlands with an estimated 44.1 million tons of merchantable timber inventory, and we owned a 50% membership interest in the Dawsonville Bluffs Joint Venture, which owns a mitigation bank with a book basis of $2.6 million as of December 31, 2019. During 2019, the Dawsonville Bluffs Joint Venture completed the disposition of its remaining 5,000 acres of high-quality commercial timberlands located in North Georgia for $10.2 million.
Please refer to Item 2 — Properties for more details on our timber and timberland properties.
Our Business and Growth Strategies
Our objective is to produce cash flow and value growth through the ongoing implementation of the following business and growth strategies:
Actively Manage Our Timberlands for Long-Term Results. We seek to maximize long-term returns by actively managing our timberlands to achieve an optimum balance among biological timber growth, current harvest cash flow, and responsible environmental stewardship. Further, we expect to continue making investments in forest technology, including improved seedlings, in order to increase the sustainable yield of our timberlands over the long-term.
Maximize Profitability on Timber Sales. We actively manage our log merchandising efforts together with delivered and stumpage sales with the goal of achieving the highest available price for our timber products. We compete with other timberland owners on the basis of the quality of our logs, the prices of our logs, our reputation as a reliable supplier, and our ability to meet customer specifications. We will continue to work diligently and proactively with our third-party contractors with a view towards optimizing our logging, hauling, sorting, and merchandising operations to extract the maximum profitability from each of our logs based on the foregoing considerations.
2
Pursue Attractive Timberland Acquisitions. We seek to identify and acquire high-quality industrial timberland properties, with our average deal size ranging from 2,500 to 25,000 acres. Critical evaluation of prospective property acquisitions is an essential component of our acquisition strategy. When evaluating acquisition opportunities, we assess a full range of matters relating to the prospective timberland property or properties, including, but not limited to:
•Local market dynamics (supply/demand balance);
• | Predominantly softwood merchantable inventory mix; |
• | Merchantable inventory/mix (tons per-acre); |
• | Sustainable productivity (on a tons per-acre, per-year basis); |
• | Quality of existing and prospective customers; and |
• | Target cash yields (near-term/long-term). |
We expect our transaction pipeline to continue to be driven by term liquidations by closed-end timber funds and overall portfolio rebalancing by other private timberland owners.
We may enter into additional fiber supply agreements with respect to acquired properties in order to ensure a steady source of demand for our incremental timber production.
Opportunistically Sell Timberland Assets. We continuously assess potential alternative uses of our timberlands, as some of our properties may be more valuable for development, conservation, recreational or other rural purposes than for growing timber. We intend to capitalize on the value of our timberland portfolio by opportunistically monetizing timberland properties. When evaluating our land sale opportunities, we assess a full range of matters relating to the timberland property or properties, including, but not limited to:
• | Inventory stocking below portfolio average; |
• | Predominantly hardwood merchantable inventory mix; and |
• | Poor productivity. |
The close proximity of our existing timberlands to several major population centers provides us with opportunities to periodically sell parcels of our land at favorable valuations. We generally expect to monetize 1% to 2% of our fee timberland acreage on an annual basis pursuant to our land sales program, although such results may vary. We may also decide to pursue various land entitlements on certain properties in order to realize higher long-term values on such properties.
From time to time, we also sell blocks of timberland properties under a capital recycling program in order to generate proceeds to fund capital allocation priorities, including, but not limited to, redeployment into more desirable timberland investments, paying down outstanding debt, or repurchasing shares of our common stock. Such large dispositions are not part of core operations, are infrequent in nature, and may or may not have a higher or better use than timber production or result in a price premium above the land’s timber production value. Timberland disposition opportunities under our capital recycling program are evaluated based in part on inventory stocking and mix profiles, productivity characteristics, geographical diversification and procurement and operating areas.
Create Value Through Joint Ventures. We seek to create additional value through institutional equity joint ventures to acquire, own, and manage timberland properties that meet our core investment strategy. The timberland properties acquired through the Triple T Joint Venture and the Dawsonville Bluffs Joint Venture fit our profile for high quality assets with excellent stocking. The Triple T Joint Venture offers potentially significant investment returns through incentive-based promotes and attractive long-term, sustainable growth from high-quality timberlands. Our investment in the Dawsonville Bluffs Joint Venture has generated significant earnings and cash flows. Additionally, we have established and expanded our investment management business by managing the day-to-day operations of both joint ventures and earning asset management fee income, which supports our dividend and growth strategy.
3
Practice Sound Environmental Stewardship. We remain committed to responsible environmental stewardship and sustainable forestry. Our wholly-owned timberlands, except those that have been recently acquired, and timberlands held by the Triple T Joint Venture, have been third-party audited and certified in accordance with the 2015-2019 SFI standards (extended through December 2021). We are currently conducting the necessary procedures to get our recently acquired timberlands third-party audited and certified in accordance with the SFI standards within the next 12 months. SFI standards promote sustainable forest management through recognized core principles, including measures to protect water quality, biodiversity, wildlife habitat and at-risk species. Our timberlands are further managed to meet or exceed all state regulations through the implementation of best management practices as well as internal policies designed to ensure compliance. We believe our continued commitment to environmental stewardship will allow us to maintain our timberlands’ productivity, grow our customer base, and enhance our reputation as a preferred timber supplier.
Financing Strategy
Our long-term financing strategy seeks to maximize balance sheet liquidity and operational flexibility for the purpose of generating current income and attractive long-term returns for our stockholders. We intend to employ prudent amounts of debt and equity financing as a means of providing additional funds for the selective acquisitions of timber assets, to refinance existing debt, or for general corporate purposes. In particular, we seek to maximize balance sheet liquidity and flexibility by:
• | Maintaining sufficient liquidity through borrowing capacity under our credit facilities and cash-on-hand; |
• | Minimizing the amount of near-term debt maturities in a single year; |
• | Maintaining low to modest leverage; |
• | Managing interest rate risk through an appropriate mix of fixed and variable rate debt instruments, either directly or using interest rate swaps, caps or other arrangements; and |
• | Maintaining access to diverse sources of capital. |
We determine the amount of debt and equity financing to be used when acquiring an asset by evaluating terms available in the credit markets (such as interest rate, repayment provisions and maturity), our cost of equity capital, and our assessment of the particular asset’s risk. Historically, a significant portion of our debt has consisted of long-term borrowings secured by our timber assets.
We anticipate that we will continue to use a number of different sources to finance our operations and selective acquisitions going forward, including cash from operations, proceeds from asset dispositions, funds available under bank credit facilities (which may or may not be secured by our assets), co-investments through partnerships or joint ventures, potential future issuances of common or preferred equity or partnership interests in our operating partnership or any combination of these sources, to the extent available to us, or other sources that may become available from time to time.
Transaction Activities
We executed the following timberland transactions during the three years ended December 31, 2019:
Acquisitions
During the years ended December 31, 2019, 2018, and 2017, we acquired 900 acres, 18,100 acres, and 19,600 acres of timberlands, respectively, totaling 38,600 acres. The properties acquired are well stocked with merchantable timber inventory, located in high-demand mill markets, and complement our existing timberland portfolio. Together, they added 2.1 million tons to our merchantable timber inventory, averaging 54 tons per acre, comprised of 83% pine plantations by acreage and 70% sawtimber by tons. Our timberland ownership expanded into the Pacific Northwest in 2018.
4
On July 6, 2018, we invested $200.0 million in the Triple T Joint Venture in exchange for a common limited partnership interest, exclusive of transaction costs. The Triple T Joint Venture acquired 1.1 million acres of East Texas industrial timberlands (the "Triple T Timberlands") for $1.39 billion. The Triple T Timberlands contained an estimated 38.0 million tons of merchantable timber inventory as of the date of acquisition. In April 2017, we entered into the Dawsonville Bluffs Joint Venture which acquired a portfolio of 11,000 acres of commercial timberlands located in North Georgia for an aggregate purchase price of $20.0 million, exclusive of transaction costs.
Land Sales
During the years ended December 31, 2019, 2018, and 2017, we sold 9,200, 8,500, and 7,700 acres of timberland, respectively, in the U.S. South. These land sales represented approximately 2.2%, 1.8%, and 1.7%, respectively, of our average fee timberland acreage (based on average quarterly fee timberland acreage) for each year. For the years ended December 31, 2019, 2018, and 2017, the disposed timberlands had an average merchantable timber stocking of 37, 26, and 27 tons per acre, respectively, as compared to 43, 42, and 41 tons per acre for our U.S. South portfolio at the beginning of each respective year.
Large Dispositions
Large dispositions are sales of blocks of timberland properties in one or several transactions with the objective to generate proceeds to fund capital allocation priorities, including, but not limited to, redeployment into more desirable timberland investments, paying down outstanding debt, or repurchasing shares of our common stock. Such large dispositions are not part of core operations, are infrequent in nature, and would cause material variances in comparative results if not reported separately. Large dispositions may or may not have a higher or better use than timber production or result in a price premium above the land’s timber production value.
During the years ended December 31, 2019 and 2018, we completed large dispositions of 14,400 and 56,100 acres of wholly-owned timberlands for $25.4 million and $79.3 million, respectively. These large dispositions represented approximately 3.4% and 11.9% of our average fee timberland acreage (based on average quarterly fee timberland acreage) for each year. For the years ended December 31, 2019 and 2018, the large dispositions had an average merchantable timber stocking of 37 and 32 tons per acre, as compared to 43 and 42 tons per acre for our U.S. South portfolio at the beginning of 2019 and 2018. We did not complete any large dispositions in 2017.
Timber Agreements
Mahrt Timber Agreements
We are party to a master stumpage agreement and a fiber supply agreement (collectively, the “Mahrt Timber Agreements”) with a wholly-owned subsidiary of WestRock. The master stumpage agreement provides that we will sell specified amounts of timber and make available certain portions of our timberlands to CatchMark TRS for harvesting. The fiber supply agreement provides that WestRock will purchase a specified tonnage of timber from CatchMark TRS at specified prices per ton, depending upon the type of timber product. The prices for the timber purchased pursuant to the fiber supply agreement are negotiated every two years but are subject to quarterly market pricing adjustments based on an index published by TimberMart-South, a quarterly trade publication that reports raw forest product prices in 11 southern states. The initial term of the Mahrt Timber Agreements is October 9, 2007 through December 31, 2032, subject to extension and early termination provisions. The Mahrt Timber Agreements ensure a long-term source of supply of wood fiber products for WestRock in order to meet its paperboard and lumber production requirements at specified mills and provide us with a reliable consumer for the wood products from its timberlands.
For the year ended December 31, 2019, WestRock purchased 410,000 tons under the Mahrt Timber Agreements, which exceeded the minimum requirement of 375,000 tons. WestRock has historically purchased tonnage that exceeded the minimum requirement under Mahrt Timber Agreements. See Note 7 — Commitments and Contingencies of our accompanying consolidated financial statements for additional information regarding the material terms of the Mahrt Timber Agreements.
5
We derived approximately 12%, 17%, and 17% of our net timber sales revenue from the Mahrt Timber Agreements in each of the years ended December 31, 2019, 2018, and 2017, respectively. For 2020, we are required to make available to WestRock for purchase, and WestRock is required to purchase, a minimum of 409,000 tons of timber under the Mahrt Timber Agreements.
Carolinas Supply Agreement
We assumed a pulpwood supply agreement with IP (the "Carolinas Supply Agreement") in connection with a timberland acquisition completed in 2016. The Carolinas Supply Agreement requires us to harvest and sell agreed-upon pulpwood volumes to IP and IP is required to purchase these volumes at defined market prices. Through its expiration on November 3, 2026, the Carolinas Supply Agreement is expected to represent between 100,000 to 150,000 tons of our annual harvest.
During the year ended December 31, 2019, we sold 117,000 tons of timber under the Carolinas Supply Agreement, which exceeded the required 99,000 tons. We derived approximately 4%, 5%, and 6% of our net timber sales revenue from the Carolinas Supply Agreement in 2019, 2018, and 2017, respectively. For 2020, IP is required to purchase a minimum of 82,000 tons of timber under the Carolinas Supply Agreement.
Credit Risk of Customers
For the year ended December 31, 2019, our largest customer, WestRock, represented 16% of our total revenues. No other customer represented more than 10% of our total revenues. The loss of WestRock as a customer would have a material adverse effect on our operating results. We sold timber to 69 customers in 2019, compared to 67 in 2018.
We are not aware of any reason why our current customers will not be able to pay their contractual amounts as they become due in all material respects.
Competition
We compete with various private and industrial timberland owners as well as governmental agencies that own or manage timberlands in the U.S. South and the Pacific Northwest. Due to transportation and delivery costs, pulp, paper and wood products manufacturing facilities typically purchase wood fiber within a 100-mile radius of their location, which thereby limits, to some degree, the number of significant competitors in any specific regional market. Factors affecting the level of competition in our industry include price, species, grade, quality, proximity to the mill customer, and our reliability and consistency as a supplier. Also, as we seek to acquire timberland assets, we are in competition for targeted timberland tracts with other similar timber investment companies, as well as investors in land for purposes other than growing timber. As a result, we may have to pay more for the timberland tracts to become the owner if another suitable tract cannot be substituted. When it becomes time to dispose of timberland tracts, we will again be in competition with sellers of similar tracts to locate suitable purchasers of timberland.
Seasonality
Our harvest operations are affected by weather conditions, where wet weather could reduce our harvest volume but boost prices due to limited supply, while dry weather could suppress prices due to increases in supply.
Environmental Matters
See Item 1A — Risk Factors, Risk Related to Our Business and Operations for discussions of environmental matters that impact our business.
Employees
As of December 31, 2019, we had 26 employees.
Access to SEC Filings and Other Information
Our website is www.catchmark.com. We make available on the Investor Relations section of our website, free of charge, our Annual Reports to Stockholders, Annual Reports on Form 10-K, Quarterly Reports on Form 10-Q, Current Reports on Form 8-K, Proxy Statements, and Forms 3, 4 and 5, and amendments to those reports, as soon as reasonably practicable after filing such documents with, or furnishing such documents to, the SEC. Our documents filed with, or furnished to, the SEC are also available for review at the SEC's website at www.sec.gov.
We include our website addresses throughout this report for reference only. The information contained on our website is not incorporated by reference into this report.
ITEM 1A. RISK FACTORS
Below are some of the risks and uncertainties that could cause our actual results to differ materially from those presented in our forward-looking statements. The risks and uncertainties described below are not the only ones we face but do represent those risks and uncertainties that we believe are material to our business, operating results, prospects and financial condition. Additional risks and uncertainties not presently known to us or that we currently deem immaterial may also harm our business.
Risks Related to Our Business and Operations
The cyclical nature of the forest products industry could impair our operating results.
Our operating results are affected by the cyclical nature of the forest products industry. Our operating results depend on timber prices that can experience significant variation and that have been historically volatile. Like other participants in the forest products industry, we have limited direct influence over the timing and extent of price changes for cellulose fiber, timber, and wood products. Although some of the supply agreements we have or expect to enter into in the future fix the price of our harvested timber for a period of time, these contracts may not protect us from the long-term effects of price declines and may restrict our ability to take advantage of price increases.
The demand for timber and wood products is affected primarily by the level of new residential construction activity, repair and remodeling activity, the supply of manufactured timber products, including imports of timber products, and to a lesser extent, other commercial and industrial uses. The demand for timber also is affected by the demand for wood chips in the pulp and paper markets and for hardwood in the furniture and other hardwood industries. The demand for cellulose fiber is related to the demand for disposable products such as diapers and feminine hygiene products. These activities are, in turn, subject to fluctuations due to, among other factors:
• | changes in domestic and international economic conditions; |
• | interest and currency rates; |
• | population growth and changing demographics; and |
• | seasonal weather cycles (for example, dry summers and wet winters). |
Decreases in the level of residential construction activity generally reduce demand for logs and wood products. This can result in lower revenues, profits, and cash flows. In addition, increases in the supply of logs and wood products at
6
both the local and national level can lead to downward pressure on prices during favorable price environments. Timber owners generally increase production volumes for logs and wood products during favorable price environments. Such increased production, however, when coupled with even modest declines in demand for these products in general, could lead to oversupply and lower prices. Oversupply can result in lower revenues, profits, and cash flows to us and could negatively impact our results of operations.
Increasing competition from a variety of substitute products could lead to declines in demand for wood products and negatively impact our business.
Wood products are subject to increasing competition from a variety of substitute products, including products made from engineered wood composites, fiber/cement composites, plastics and steel, as well as import competition from other worldwide suppliers. This could result in lower demand for wood products and impair our operating results.
Our cash distributions are not guaranteed and may fluctuate.
Our board of directors, in its sole discretion, determines the amount of the distributions (including the determination of whether to retain net capital gains income) to be provided to our stockholders. Our board will determine whether to authorize a distribution and the amount of such distribution based on its consideration of a number of factors including, but not limited to, our results of operations, cash flow and capital requirements, economic conditions, tax considerations, borrowing capacity and other factors, including debt covenant restrictions that may impose limitations on cash payments, future acquisitions and divestitures, harvest levels, changes in the price and demand for our products and general market demand for timberlands, including those timberlands that have higher-and-better uses. In addition, our board of directors may choose to retain operating cash flow for investment purposes, working capital reserves or other purposes, and these retained funds, although increasing the value of our underlying assets, may not correspondingly increase the market price of our common stock. Consequently, our distribution levels may fluctuate. Our failure to meet the market’s expectations with regard to future cash distributions likely would adversely affect the market price of our common stock.
We are substantially dependent on our business relationship with WestRock, and our continued success will depend on its economic performance.
The Mahrt Timber Agreements we entered into with WestRock provide that we will sell specified amounts of timber to WestRock, subject to market pricing adjustments and certain early termination rights of the parties. The Mahrt Timber Agreements are intended to ensure a long-term source of supply of wood fiber products for WestRock, in order to meet its paperboard and lumber production requirements at specified mills and provide us with a reliable customer for the wood products from our timberlands. Our financial performance is substantially dependent on the economic performance of WestRock as a consumer of our wood products. Approximately 12% of our net timber sales revenue for 2019 was derived from the Mahrt Timber Agreements, which exceeded the minimum amount of timber that WestRock was required to purchase pursuant to the Mahrt Timber Agreements. If WestRock does not continue to purchase significantly more than the minimum amount of timber it is required to purchase from us, or if WestRock becomes unable to purchase the required minimum amount of timber from us, there could be a material adverse effect on our business and financial condition.
In addition, in the event of a force majeure impacting WestRock, which is defined by the Mahrt Timber Agreements to include, among other things, lightning, fires, storms, floods, infestation, other acts of God or nature, power failures and labor strikes or lockouts by employees, the amount of timber that WestRock is required to purchase in the calendar year would be reduced pro rata based on the period during which the force majeure was in effect and continuing. If the force majeure is in effect and continuing for 15 days or more, WestRock would not be required to purchase the timber that was not purchased during the force majeure period. If the force majeure is in effect and continuing for fewer than 15 days, WestRock would have up to 180 days after the termination of the force majeure period to purchase the timber that was not purchased during the force majeure period. As a result, the occurrence of a force majeure under the terms of the Mahrt Timber Agreements could adversely impact our business and financial condition.
7
If we are unable to find suitable investments or pay too much for properties, we may not be able to achieve our investment objectives, and the returns on our investments will be lower than they otherwise would be.
A key component of our business and growth strategies is to pursue timberland acquisition opportunities. Our ability to identify and acquire desirable timberlands depends upon the performance of our management team in the selection of our investments. We also face significant competition in pursuing timberland investments from other REITs; real estate limited partnerships, pension funds and their advisors; bank and insurance company investment accounts; school and university endowments; individuals; and other entities. The market for high-quality timberland is highly competitive given how infrequently those assets become available for purchase. As a result, many real estate investors have built up their cash positions and face aggressive competition to purchase quality timberland assets. A significant number of entities and resources competing for high-quality timberland properties support relatively high acquisition prices for such properties, which may reduce the number of acquisition opportunities available to, or affordable for, us and could put pressure on our profitability and our ability to pay distributions to stockholders. In addition, our future acquisitions, if any, may not perform in accordance with our expectations, due to lower merchantable inventory, lower product pricing or other factors. Finally, we anticipate financing these acquisitions through proceeds from debt or equity offerings (including offerings of partnership units by our operating partnership), borrowings, cash from operations, proceeds from asset dispositions, or any combination thereof, and our inability to finance acquisitions on favorable terms or the failure of any acquisitions to conform to our expectations could adversely affect our results of operations. We cannot assure you that we will be successful in obtaining suitable investments on financially attractive terms, that we will be able to finance the purchase of such investments or that, if we make investments, our objectives will be achieved.
We depend on external sources of capital for future growth, and our ability to access the capital markets may be restricted.
Our ability to finance our growth is, to a significant degree, dependent on external sources of capital. Our ability to access such capital on favorable terms could be hampered by a number of factors, many of which are outside of our control, including, without limitation, a decline in general market conditions, decreased market liquidity, increases in interest rates, an unfavorable market perception of our growth potential, including our joint venture strategy, a decrease in our current or estimated future earnings or a decrease in the market price of our common stock. In addition, our ability to access additional capital may be limited by the terms of our bylaws, which restrict our incurrence of debt, in some circumstances, and by our existing indebtedness, which, among other things, restricts our incurrence of debt and the payment of dividends. Any of these factors, individually or in combination, could prevent us from being able to obtain the capital we require on terms that are acceptable to us or at all, and the failure to obtain necessary capital could materially adversely affect our future growth.
As a relatively small public company, our general and administrative expenses are a larger percentage of our total revenues than many other public companies, which may have a greater effect on our financial performance and may reduce cash available for distribution to our stockholders.
Our total assets as of December 31, 2019 were $663.9 million and our revenues for the year ended December 31, 2019 were $106.7 million. Because our company is smaller than many other publicly-traded REITs, our general and administrative expenses are, and will continue to be, a larger percentage of our total revenues than many other public companies. If we are unable to access external sources of capital and grow our business, our general and administrative expenses will have a greater effect on our financial performance and may reduce the amount of cash flow available to distribute to our stockholders.
We depend on FRC and AFM to manage our timberlands, and a loss of the services of one or both of them could jeopardize our ongoing operations.
We are party to timberland operating agreements with FRC and AFM (together, our "Forest Managers"), which are renewable on an annual basis. Pursuant to these agreements, we depend upon our Forest Managers to manage and operate our timberlands and related timber operations and to ensure delivery of timber to our customers. To the extent
8
we lose the services of our Forest Managers, we are unable to obtain the services of our Forest Managers at reasonable prices, or our Forest Managers do not perform the services in accordance with the timberland operating agreements, our results of operations may be adversely affected.
Our real estate investment activity is concentrated in timberlands, making us more vulnerable economically than if our investments were diversified.
We have only acquired interests in timberlands and expect to make additional timberlands acquisitions in the future. We are subject to risks inherent in concentrating investments in real estate. The risks resulting from a lack of diversification become even greater as a result of our strategy to invest primarily, if not exclusively, in timberlands. A downturn in the real estate industry generally or the timber or forest products industries specifically could reduce the value of our properties and could require us to recognize impairment losses from our properties. A downturn in the timber or forest products industries also could prevent our customers from making payments to us and, consequently, would prevent us from meeting debt service obligations or making distributions to our stockholders. The risks we face may be more pronounced than if we diversified our investments outside real estate or outside timberlands.
Our timberlands are located in the U.S. South and, to a lesser extent, in the Pacific Northwest, and adverse economic and other developments in these areas could have a material adverse effect on us.
Our timberlands are located in the U.S. South and, to a lesser extent, in the Pacific Northwest. As a result, we may be susceptible to adverse economic and other developments in these regions, including industry slowdowns, business layoffs or downsizing, relocations of businesses, changes in demographics, increases in real estate and other taxes and increased regulation, any of which could have a material adverse effect on us.
In addition, the geographic concentration of our property makes us more susceptible to adverse impacts from a single natural disaster such as fire, hurricane, earthquake, insect infestation, drought, disease, ice storms, windstorms, flooding and other factors that could negatively impact our timber production.
We depend on third parties for logging and transportation services, and increases in the costs or decreases in the availability of quality service providers could adversely affect our business.
We depend on logging and transportation services provided by truck by third parties. If any of our transportation providers were to fail to deliver timber supply or logs to our customers in a timely manner or were to damage timber supply or logs during transport, we may be unable to sell it at full value, or at all. During the global financial crisis and subsequent downturn in U.S. housing starts, timber harvest volumes declined significantly. As a result, many logging contractors, particularly cable logging operators in the U.S. West, permanently shut down their operations. As harvest levels have returned to higher levels with the recovery in U.S. housing starts, this shortage of logging contractors has resulted in sharp increases in logging costs and in the availability of logging contractors. It is expected that the supply of qualified logging contractors will be impacted by the availability of debt financing for equipment purchases as well as a sufficient supply of adequately trained loggers. As housing starts continue to recover, harvest levels are expected to increase, placing more pressure on the existing supply of logging contractors. Any significant failure or unavailability of third-party logging or transportation providers, or increases in transportation rates or fuel costs, may result in higher logging costs or the inability to capitalize on stronger log prices to the extent logging contractors cannot be secured at a competitive cost. Such events could harm our reputation, negatively affect our customer relationships and adversely affect our business.
We depend on the efforts and expertise of our key executive officers and would be adversely affected by the loss of their services.
We depend on the efforts and expertise of our Chief Executive Officer and President, our Chief Financial Officer and Senior Vice President and our Chief Resources Officer and Senior Vice President to execute our business strategy, and we cannot guarantee their continued service. The loss of their services, and our inability to find suitable replacements, would have an adverse effect on our business.
9
In addition, our asset management agreement with the Triple T Joint Venture includes a "key man" provision requiring us to find a suitable replacement for Jerry Barag, our former Chief Executive Officer, within one year of his retirement, or by January 21, 2021. If we fail to find such suitable replacement within that time period, the Preferred Investors in the Triple T Joint Venture have the right to terminate the asset management agreement, which would have a materially adverse effect on our business.
If we fail to maintain an effective system of disclosure controls and procedures and integrated internal controls, we may not be able to report our financial results accurately, which could have a material adverse effect on us.
We are required to report our operations on a consolidated basis in accordance with GAAP. If we fail to maintain proper overall business controls, our results of operations could be harmed or we could fail to meet our reporting obligations.
In addition, the existence of a material weakness or significant deficiency could result in errors in our financial statements that could require a restatement, cause us to fail to meet our reporting obligations and cause stockholders to lose confidence in our reported financial information, which could have a material adverse effect on us. In the case of any joint ventures we might enter into but do not manage, we may also be subject to additional risks and uncertainties in that we may be dependent upon, and subject to liability, losses or reputational damage relating to, overall business controls that are not under our control, which could have a material adverse effect on us. In addition, we rely on our Forest Managers and their systems to provide us with certain information related to our operations, including our timber and timberland sales. Although we review such information prior to incorporating it into our accounting systems, we cannot assure the accuracy of such information. If our Forest Managers’ systems fail to accurately report to us the information on which we rely, we may not be able to accurately report our financial results, which could have a material adverse effect on us.
The requirements of complying with the Exchange Act and the Sarbanes-Oxley Act may strain our resources and occupy the time and energies of management.
We are subject to the Exchange Act and the Sarbanes-Oxley Act of 2002, as amended (the "Sarbanes-Oxley Act"), including Section 404 of the Sarbanes-Oxley Act. The Sarbanes-Oxley Act requires that we maintain and certify that we have effective disclosure controls and procedures and internal control over financial reporting. The effort to comply with these requirements and maintain effective internal controls is costly and may divert management’s attention from other business concerns, which could adversely affect our business, financial condition or results of operations.
We have experienced net losses historically and may experience losses again in the future.
From our inception through the end of 2019, other than in 2014, we have incurred net losses. Historical net losses have generally been a result of non-cash charges, including depletion expense. If we are unable to generate net income in the future, and continue to incur net losses, our financial condition, results of operations, cash flows, and our ability to service our indebtedness and make distributions to our stockholders could be materially and adversely affected, which could adversely affect the market price of our common stock.
We are subject to the credit risk of our customers. The failure of any of our customers to make payments due to us under supply agreements could have an adverse impact on our financial performance.
Current and future customers who agree to purchase our timber under supply contracts will range in credit quality from high to low. We assume the full credit risk of these parties, as we have no payment guarantees under the contract or insurance if one of these parties fails to make payments to us. While we intend to continue acquiring timberlands in well-developed and active timber markets with access to numerous customers, we may not be successful in this endeavor. Depending upon the location of any additional timberlands we acquire and the supply agreements we enter into, our supply agreements may be concentrated among a small number of customers. Even though we may have legal recourse under our contracts, we may not have any practical recourse to recover payments from some of our customers if they default on their obligations to us. Any bankruptcy or insolvency of our customers, or failure or delay by these parties
10
to make payments to us under our agreements, would cause us to lose the revenue associated with these payments and adversely impact our cash flow, financial condition, and results of operations.
We intend to sell portions of our timberlands, either because they are HBU properties or in response to changing conditions, but if we are unable to sell these timberlands promptly or at the price that we anticipate, our land sale revenues may be reduced, which could reduce the cash available for distribution to our stockholders.
On an annual basis, we intend to sell approximately 1% to 2% of our fee timberland acreage, specifically timberlands that we have determined have become more valuable for development, recreational, conservation and other uses than for growing timber, which we refer to as HBU properties. We intend to use the proceeds from these sales to support our distributions to our stockholders. From time to time, we also sell blocks of timberland properties under a capital recycling program in order to generate proceeds to fund capital allocation priorities, including, but not limited to redeployment into more desirable timberland investments, paying down outstanding debt, or repurchasing shares of our common stock. We may also sell portions of our timberland from time to time in response to changing economic, financial or investment conditions. Because timberlands are relatively illiquid investments, our ability to promptly sell timberlands is limited. The following factors, among others, may adversely affect the timing and amount of our income generated by sales of our timberlands:
• | general economic conditions; |
• | availability of funding for governmental agencies, developers, conservation organizations, individuals and others to purchase our timberlands for recreational, conservation, residential or other purposes; |
• | local real estate market conditions, such as oversupply of, or reduced demand for, properties sharing the same or similar characteristics as our timberlands; |
• | competition from other sellers of land and real estate developers; |
• | weather conditions or natural disasters having an adverse effect on our properties; |
• | relative illiquidity of real estate investments; |
• | forestry management costs associated with maintaining and managing timberlands; |
• | changes in interest rates and in the availability, cost and terms of debt financing; |
• | impact of federal, state and local land use and environmental protection laws; |
• | changes in governmental laws and regulations, fiscal policies and zoning ordinances, and the related costs of compliance with laws and regulations, fiscal policies and ordinances; and |
• | it may be necessary to delay sales in order to minimize the risk that gains would be subject to the 100% prohibited transactions tax. |
In acquiring timberlands and in entering into long-term supply agreements, we may agree to lock-out provisions that materially restrict us from selling that property for a period of time or impose other restrictions, such as a limitation on the amount of debt that can be placed or repaid on that property. These factors and any others that would impede our ability to respond quickly to market opportunities could adversely impact our results of operations and reduce our cash available to pay distributions to our stockholders.
Large-scale increases in the supply of timber may affect timber prices and reduce our revenues.
The supply of timber available for sale in the market could increase for a number of reasons, including producers introducing new capacity or increasing harvest levels. Some governmental agencies, principally the U.S. Department of Agriculture's Forest Service (the "U.S.D.A. Forest Service") and the U.S. Department of the Interior’s Bureau of Land Management, own large amounts of timberlands. If these agencies choose to sell more timber from their holdings than they have been selling in recent years, timber prices could fall and our revenues could be reduced. Any large reduction in the revenues we expect to earn from our timberlands would reduce the returns, if any, we are able to achieve for our stockholders.
11
Uninsured losses relating to the timberlands we own and may acquire may reduce our stockholders’ returns.
The volume and value of timber that can be harvested from the timberlands we own and may acquire may be limited by natural disasters such as fire, hurricane, earthquake, insect infestation, drought, disease, ice storms, windstorms, flooding, and other weather conditions and natural disasters, as well as other causes such as theft, trespass, condemnation or other casualty. We do not maintain insurance for any loss to our standing timber from natural disasters or other causes. Any funds used for such losses would reduce cash available for distributions to our stockholders.
Harvesting our timber may be subject to limitations that could adversely affect our results of operations.
Our primary assets are our timberlands. Weather conditions, timber growth cycles, property access limitations, availability of contract loggers and haulers, and regulatory requirements associated with the protection of wildlife and water resources may restrict our ability to harvest our timberlands. Other factors that may restrict our timber harvest include damage to our standing timber by fire, hurricane, earthquake, insect infestation, drought, disease, ice storms, windstorms, flooding and other weather conditions and natural disasters. Changes in global climate conditions could intensify one or more of these factors. Although damage from such causes usually is localized and affects only a limited percentage of standing timber, there can be no assurance that any damage affecting our timberlands will in fact be so limited. Furthermore, we may choose to invest in timberlands that are intermingled with sections of federal land managed by the U.S.D.A. Forest Service or other private owners. In many cases, access might be achieved only through a road or roads built across adjacent federal or private land. In order to access these intermingled timberlands, we would need to obtain either temporary or permanent access rights to these lands from time to time. Our revenue, net income, and cash flow from our operations will be dependent to a significant extent on the continued ability to harvest timber on our timberlands at adequate levels and in a timely manner. Therefore, if we were to be restricted from harvesting on a significant portion of our timberlands for a prolonged period of time, or if material damage to a significant portion of our standing timber were to occur, then our results of operations could be adversely affected.
We face possible liability for environmental clean-up costs and wildlife protection laws related to the timberlands we acquire, which could increase our costs and reduce our profitability and cash distributions to our stockholders.
Our business is subject to laws, regulations, and related judicial decisions and administrative interpretations relating to, among other things, the protection of timberlands, endangered species, timber harvesting practices, recreation and aesthetics, and the protection of natural resources, air and water quality that are subject to change and frequently enacted. These changes may adversely affect our ability to harvest and sell timber and to remediate contaminated properties. We are subject to regulation under, among other laws, the Clean Air Act, the Clean Water Act, the Resource Conservation and Recovery Act, the Comprehensive Environmental Response Compensation and Liability Act of 1980, the National Environmental Policy Act and the Endangered Species Act, as well as comparable state laws and regulations. Violations of various statutory and regulatory programs that apply to our operations could result in civil penalties; damages, including natural resource damages; remediation expenses; potential injunctions; cease-and-desist orders; and criminal penalties.
Laws and regulations protecting the environment have generally become more stringent in recent years and could become more stringent in the future. Some environmental statutes impose strict liability, rendering a person liable for environmental damage without regard to the person’s negligence or fault. We may acquire timberlands subject to environmental liabilities, such as clean-up of hazardous substance contamination and other existing or potential liabilities of which we are not aware, even after investigations of the properties. We may not be able to recover any of these liabilities from the sellers of these properties. The cost of these clean-ups could therefore increase our operating costs and reduce our profitability and cash available to make distributions to our stockholders. The existence of contamination or liability also may materially impair our ability to use or sell affected timberlands.
The Endangered Species Act and comparable state laws protect species threatened with possible extinction. At least one species present on our timberlands has been, and in the future more may be, protected under these laws. Protection of threatened and endangered species may include restrictions on timber harvesting, road-building, and other forest
12
practices on private, federal, and state land containing the affected species. The size of the area subject to restriction varies depending on the protected species at issue, the time of year, and other factors, but can range from less than one acre to several thousand acres.
The Clean Water Act regulates the direct and indirect discharge of pollutants into the waters of the United States. Under the Clean Water Act, it is unlawful to discharge any pollutant from a “point source” into navigable waters of the United States without a permit obtained under the National Pollutant Discharge Elimination System ("NPDES") permit program of the U.S. Environmental Protection Agency (the "EPA"). Storm water from roads supporting timber operations that is conveyed through ditches, culverts and channels are exempted by EPA rule from this permit requirement and Congress amended Section 402(1) of the Clean Water Act in 2014 to prohibit the requirement of NPDES permits for discharge of runoff associated with silvicultural activities conducted in accordance with standard industry practice, leaving those sources of water discharge to state regulation. The scope of these state regulations vary by state and are subject to change, legal challenges and legislative responses. To the extent we are subject to future federal or state regulation of storm water runoff from roads supporting timber operations, our operational costs to comply with such regulations could increase and our results of operations could be adversely affected.
Our estimates of the timber growth rates on our properties may be inaccurate, which would impair our ability to realize expected revenues from those properties.
We rely upon estimates of the timber growth rates and yield when acquiring and managing timberlands. These estimates are central to forecasting our anticipated timber revenues and expected cash flows. Growth rates and yield estimates are developed by forest statisticians using measurements of trees in research plots on a property. The growth equations predict the rate of height and diameter growth of trees so that foresters can estimate the volume of timber that may be present in the tree stand at a given age. Tree growth varies by soil type, geographic area, and climate. Inappropriate application of growth equations in forest management planning may lead to inaccurate estimates of future volumes. If these estimates are inaccurate, our ability to manage our timberlands in a profitable manner will be diminished, which may cause our results of operations to be adversely affected.
Changes in assessments, property tax rates, and state property tax laws may reduce our net income and our ability to make distributions to our stockholders.
Our expenses may be increased by assessments of our timberlands and changes in property tax laws. We generally intend to hold our timberlands for a substantial amount of time. Property values tend to increase over time, and as property values increase, the related property taxes generally also increase, which would increase the amount of taxes we pay. In addition, changes to state tax laws or local initiatives could also lead to higher tax rates on our timberlands. Because each parcel of a large timberland property is independently assessed for property tax purposes, our timberlands may receive a higher assessment and be subject to higher property taxes. In some cases, the cost of the property taxes may exceed the income that could be produced from that parcel if we continue to hold it as timberland. If our timberlands become subject to higher tax rates, such costs could have a material adverse effect on our financial condition, results of operations and ability to make distributions to our stockholders.
Changes in land uses in the vicinity of our timberlands may increase the amount of the property that we classify as HBU properties, and property tax regulations may reduce our ability to realize the values of those HBU properties.
An increase in the value of other properties in the vicinity of our timberlands may prompt us to sell parcels of our land as HBU properties. Local, county and state regulations may prohibit us from, or penalize us for, selling a parcel of timberland for real estate development. Some states regulate the number of times that a large timberland property may be subdivided within a specified time period, which would also limit our ability to sell our HBU property. In addition, in some states timberland is subject to certain property tax policies that are designed to encourage the owner of the timberland to keep the land undeveloped. These policies may result in lower taxes per acre for our timberlands as long as they are used for timber purposes only. However, if we sell a parcel of timberland in such states as HBU property, we may trigger tax penalties, which could require us to repay all of the tax benefits that we have received. Our inability
13
to sell our HBU properties on terms that are favorable to us could negatively affect our financial condition and our ability to make distributions to our stockholders.
We may be unable to properly estimate non-timber revenues from any properties that we acquire, which would impair our ability to acquire attractive properties, as well as our ability to derive the anticipated revenues from those properties.
If we acquire additional properties, we likely will expect to realize revenues from timber and non-timber-related activities, such as the sale of conservation easements and recreational leases. Non-timber activities can contribute significantly to the revenues that we derive from a particular property. We will rely on estimates to forecast the amount and extent of revenues from non-timber-related activities on our timberlands. If our estimates concerning the revenue from non-timber-related activities are incorrect, we may not be able to realize the projected revenues. If we are unable to realize the level of revenues that we expect from non-timber activities, our revenues from the underlying timberland would be less than expected and our results of operations and ability to make distributions to our stockholders may be negatively impacted.
The impacts of any climate-related legislation or regulation remain uncertain at this time.
There are several international, federal and state-level proposals addressing domestic and global climate issues. Generally, such proposals in the United States could impose regulation or taxation on the production of carbon dioxide and other “greenhouse gases” in an attempt to reduce emissions to the atmosphere, and provide tax and other incentives to produce and use more “clean energy.” Any future legislative and regulatory activity in this area could, in some way, affect us, but it is unclear at this time whether any such impact would be positive, negative or significant.
We rely on information technology in our operations, and any material failure, inadequacy, interruption or security failure of that technology could harm our business.
We rely on information technology networks and systems, including the Internet, to process, transmit and store electronic information and to manage or support a variety of our business processes, including financial transactions and maintenance of records, which may include confidential information. We rely on commercially available systems, software, tools and monitoring to provide security for processing, transmitting and storing confidential information, such as personally identifiable information relating to financial accounts. Although we have taken steps to protect the security of the data maintained in our information systems, it is possible that our security measures and those of our information technology vendors will not be able to prevent the systems’ improper functioning, or the improper disclosure of personally identifiable information such as in the event of cyber-attacks. Security breaches, including physical or electronic break-ins, computer viruses, attacks by hackers and similar breaches, can create system disruptions, shutdowns or unauthorized disclosure of confidential information. Any failure to maintain proper function, security and availability of our information systems and those of our information technology vendors could interrupt our operations, damage our reputation, or subject us to liability claims or regulatory penalties, any one of which could materially and adversely affect our financial condition and results of operations.
Changes in energy and fuel costs could affect our financial condition and results of operations.
Energy costs are a significant operating expense for our logging and hauling contractors and for the contractors who support the customers of our standing timber. Energy costs can be volatile and are susceptible to rapid and substantial increases due to factors beyond our control, such as changing economic conditions, political unrest, instability in energy-producing nations, and supply and demand considerations. Increases in the price of oil could adversely affect our business, financial condition and results of operations. In addition, an increase in fuel costs, and its impact on the cost and availability of transportation for our products and the cost and availability of third-party logging and hauling contractors, could have a material adverse effect on the operating costs of our contractors and our standing timber customers as well as in defining economically accessible timber stands. Such factors could in turn have a material adverse effect on our business, financial condition and results of operations.
14
We may fail to realize some or all of the anticipated benefits of the Triple T Joint Venture or those benefits may take longer to realize than expected. We also may encounter significant difficulties in managing the business and operations of the Triple T Timberlands for the Triple T Joint Venture. The future results of our company will suffer if we do not effectively manage the Triple T Timberlands on behalf of the Triple T Joint Venture or if the results of the Triple T Joint Venture do not meet our expectations.
Our ability to realize the anticipated benefits of the Triple T Joint Venture depends, in part, on our ability to successfully manage the business and operations of the Triple T Timberlands acquired by the Triple T Joint Venture. Following the consummation of the Triple T Joint Venture, the number of acres of timberlands under our management increased significantly. The management and operation of a newly-acquired business can be a complex, costly and time-consuming process. As a result, we are required to devote significant management attention and resources to managing the business practices and operations of the Triple T Timberlands for the Triple T Joint Venture. The failure to meet the challenges involved in the management of the business and operations of the Triple T Timberlands and to realize the anticipated benefits of the Triple T Joint Venture could cause an interruption of, or a loss of momentum in, our business activities or those of the Triple T Timberlands and could adversely impact our business, financial condition and results of operations. In addition, the overall management of the business and operations of the Triple T Timberlands may result in material unanticipated problems, expenses, liabilities, loss of customers and diversion of our management’s and employees’ attention.
The challenges in our ability to realize the anticipated benefits of the Triple T Joint Venture include the factors identified elsewhere in this annual report relating to the timberlands business, and include, but are not limited to:
• | the Triple T Joint Venture’s dependency on, and obligations under, long-term third-party customer contracts; |
• | the right of the preferred investors to receive a preferred return and a return of capital before we receive our preferred return or any return of capital; |
• | our partners in the Triple T Joint Venture have significant governance rights, including major decision rights on management and operational matters, and we may arrive at an impasse with these partners relating to one or more of these matters; |
• | our asset management fees from the Triple T Joint Venture are subject to deferral if certain financial objectives are not obtained and are subject to decrease over time; |
• | our asset management agreement with the Triple T Joint Venture is subject to termination, including if we are not able to find a suitable “key man” replacement for Jerry Barag within 12 months of his retirement or upon the failure of the Triple T Joint Venture to meet certain financial and operational performance objectives; |
• | volatility in the market prices of forest products; |
• | challenges in keeping existing customers and obtaining new customers; |
• | challenges in retaining, attracting and assimilating key personnel, including personnel that are considered key to the future success of the business of the Triple T Joint Venture; |
• | obligations and restrictions imposed by the financing arrangements of the Triple T Joint Venture; and |
• | challenges in keeping key business relationships in place. |
Many of these factors are outside of our control, and any one of them could result in increased costs and liabilities, decreases in the amount of expected revenues, earnings, and cash flows, and diversion of management’s time and energy, which could have a material adverse effect on the business of the Triple T Joint Venture and/or us.
15
In addition, even if we are not able to successfully manage the business and operations of the Triple T Timberlands, the full benefits of the transaction may not be realized. These benefits may not be achieved within the anticipated time frame, or at all, and additional unanticipated costs may be incurred. Furthermore, the Triple T Timberlands may have unknown or contingent liabilities that were not discovered during the course of due diligence. These liabilities could include exposure to unexpected environmental problems, compliance and regulatory violations, key employee and client retention problems and other problems that could result in significant costs to the Triple T Joint Venture.
All of these factors could negatively impact the asset management fees we expect to earn from the Triple T Joint Venture, the value of our investment in the Triple T Joint Venture and the returns we anticipate receiving from the Triple T Joint Venture, all of which could negatively impact the price of our common stock, or have a material adverse effect on our business, financial condition and results of operations.
Actions of joint venture partners could negatively impact our performance.
We have entered into joint ventures (including the Triple T Joint Venture and the Dawsonville Bluffs Joint Venture) and may enter into additional joint ventures in the future, including, but not limited to, joint ventures involving the ownership and management of timberlands. Such joint venture investments may involve risks not otherwise present with a direct investment in timberlands, including, without limitation:
• | the risk that a joint venture may not be able to make payments under, or refinance on attractive terms or at all, its financing arrangements, including secured financings pursuant to which defaults could result in lenders foreclosing on the joint venture's assets; |
• | the risk that a joint venture partner may at any time have economic or business interests or goals which are, or which become, inconsistent with our business interests or goals; |
• | the risk that a joint venture partner may be in a position to take actions that are contrary to the agreed upon terms of the joint venture, our instructions or our policies or objectives; |
• | the risk that we may incur liabilities as a result of an action taken by a joint venture partner; |
• | the risk that disputes between us and a joint venture partner may result in litigation or arbitration that would increase our expenses and occupy the time and attention of our officers and directors; |
• | the risk that no joint venture partner may have the ability to unilaterally control the joint venture with respect to certain major decisions, and as a result an irreconcilable impasse may be reached with respect to certain decisions; |
• | the risk that we may not be able to sell our interest in a joint venture when we desire to exit the joint venture, or at an attractive price; and |
• | the risk that, if we have a contractual right or obligation to acquire a joint venture partner’s ownership interest in the joint venture, we may be unable to finance such an acquisition if it becomes exercisable or we may be required to purchase such ownership interest at a time when it would not otherwise be in our best interest to do so. |
The occurrence of any of the foregoing risks with respect to a joint venture could have an adverse effect on the financial performance of such joint venture, which could in turn have an adverse effect on our financial performance and the value of an investment in our company.
Risks Related to Our Organizational Structure
Our board of directors may change significant corporate policies without stockholder approval.
16
Our investment, financing, borrowing and distribution policies and our policies with respect to all other activities, including growth, debt, capitalization and operations, are determined by our board of directors. These policies may be amended or revised at any time and from time to time at the discretion of our board of directors without a vote of our stockholders. As a result, the ability of our stockholders to control our policies and practices is extremely limited. In addition, our board of directors may change our policies with respect to conflicts of interest provided that such changes are consistent with applicable legal and regulatory requirements, including the listing standards of the NYSE. A change in these policies could have an adverse effect on our financial condition, results of operations and cash flows, the trading price of our common stock, our ability to satisfy our debt service obligations, and our ability to make distributions to our stockholders.
Our board of directors may increase the number of authorized shares of stock and issue stock without stockholder approval, including in order to discourage a third party from acquiring our company in a manner that could result in a premium price to our stockholders.
Subject to applicable legal and regulatory requirements, our charter authorizes our board of directors, without stockholder approval, to amend our charter from time to time to increase or decrease the aggregate number of authorized shares of stock or the number of authorized shares of stock of any class or series, to authorize us to issue authorized but unissued shares of our common stock or preferred stock and to classify or reclassify any unissued shares of our common stock or preferred stock into other classes or series of stock and to set the preferences, rights and other terms of such classified or unclassified shares. As a result, we may issue series or classes of common stock or preferred stock with preferences, dividends, powers and rights, voting or otherwise, that are senior to, or otherwise conflict with, the rights of holders of our common stock. In addition, our board of directors could establish a series of preferred stock that could, depending on the terms of such series, delay, defer, or prevent a transaction or a change of control that might involve a premium price for our common stock or that our stockholders may believe is in their best interests.
In order to preserve our status as a REIT, our charter limits the number of shares a person may own, which may discourage a takeover that could otherwise result in a premium price for our common stock or otherwise benefit our stockholders.
Our charter, with certain exceptions, authorizes our directors to take such actions as are necessary and desirable to preserve our qualification as a REIT for U.S. federal income tax purposes. Unless exempted by our board of directors (prospectively or retroactively), no person may actually or constructively own more than 9.8% in value of the outstanding shares of our capital stock or more than 9.8% (by value or number of shares, whichever is more restrictive) of the outstanding shares of our common stock. This restriction may have the effect of delaying, deferring, or preventing a change in control of our company, including an extraordinary transaction (such as a merger, tender offer, or sale of all or substantially all of our assets) that might provide a premium price for our common stock or otherwise be in the best interest of our stockholders.
Certain provisions of Maryland law could inhibit changes in control of us, which could lower the value of our common stock.
Certain provisions of the Maryland General Corporation Law (the "MGCL") may have the effect of inhibiting or deterring a third party from making a proposal to acquire us or of impeding a change of control under circumstances that otherwise could provide the holders of shares of our common stock with the opportunity to realize a premium over the then-prevailing market price of such shares, including:
• | “business combination” provisions that, subject to limitations, prohibit certain business combinations between us and an “interested stockholder” (defined generally as any person who beneficially owns 10% or more of the voting power of our outstanding voting stock or an affiliate or associate of ours who, at any time within the two-year period prior to the date in question, was the beneficial owner of 10% or more of our then outstanding stock) or an affiliate of an interested stockholder for five years after the most recent date on which the stockholder becomes an interested stockholder, and thereafter may impose supermajority stockholder voting requirements unless certain minimum price conditions are satisfied; and |
17
• | “control share” provisions that provide that “control shares” of our company (defined as shares which, when aggregated with other shares controlled by the stockholder, entitle the stockholder to exercise one of three increasing ranges of voting power in electing directors) acquired in a “control share acquisition” (defined as the direct or indirect acquisition of ownership or control of outstanding “control shares”) have no voting rights except to the extent approved by our stockholders by the affirmative vote of at least two-thirds of all the votes entitled to be cast on the matter, excluding all interested shares. |
We have opted out of these provisions of the MGCL, in the case of the business combination provisions of the MGCL by resolution of our board of directors, and in the case of the control share provisions of the MGCL pursuant to a provision in our bylaws. However, in the future, our board of directors may by resolution elect to opt into the business combination provisions of the MGCL and our board of directors may, by amendment to our bylaws and without stockholder approval, opt in to the control share provisions of the MGCL.
Title 3, Subtitle 8 of the MGCL permits our board of directors, without stockholder approval and regardless of what is currently provided in our charter or bylaws, to implement certain takeover defenses, including adopting a classified board. Such takeover defenses may have the effect of inhibiting a third party from making an acquisition proposal for us or of delaying, deferring or preventing a change in control of us under the circumstances that otherwise could provide our stockholders with the opportunity to realize a premium over the then-current market price.
In addition, the advance notice provisions of our bylaws could delay, defer or prevent a transaction or a change of control of our company that might involve a premium price for holders of our common stock or that our stockholders may believe to be in their best interests. Likewise, if our board of directors were to opt in to the business combination provisions of the MGCL or the provisions of Title 3, Subtitle 8 of the MGCL, or if the provision in our bylaws opting out of the control share acquisition provisions of the MGCL were rescinded by our board of directors, these provisions of the MGCL could have similar anti-takeover effects.
Our rights and the rights of our stockholders to take action against our directors and officers are limited, which could limit our stockholders' recourse in the event of actions that the stockholders do not believe are in their best interests.
Maryland law provides that a director or officer has no liability in that capacity if he or she satisfies his or her duties to us. As permitted by the MGCL, our charter limits the liability of our directors and officers to us and our stockholders for money damages, except for liability resulting from:
• | actual receipt of an improper benefit or profit in money, property or services; or |
• | a final judgment based upon a finding of active and deliberate dishonesty by the director or officer that was material to the cause of action adjudicated. |
In addition, our charter obligates us to indemnify our directors and officers for actions taken by them in that capacity to the maximum extent permitted by Maryland law. The indemnification agreements that we entered into with our directors and certain of our officers also require us to indemnify these directors and officers for actions taken by them in those capacities to the maximum extent permitted by Maryland law. As a result, we and our stockholder may have more limited rights against our directors and officers than might otherwise exist. Accordingly, in the event that actions taken in good faith by any of our directors or officers impede the performance of our company, the stockholders' ability to recover damages from such director or officer will be limited. In addition, we are obligated to advance the defense costs incurred by our directors and our officers and may, in the discretion of our board of directors, advance the defense costs incurred by our employees and other agents in connection with legal proceedings.
Risks Related to Our Debt Financing
Our existing indebtedness and any future indebtedness we may incur could adversely affect our financial health and operating flexibility.
18
We are party to a credit agreement dated as of December 1, 2017, as amended on August 22, 2018, June 28, 2019 and February 12, 2020 (the "Amended Credit Agreement"), with a syndicate of lenders, including CoBank, that provides for a senior secured credit facility of up to $643.6 million, which includes four term loan facilities totaling $408.6 million, a $35 million revolving credit facility, and a $200 million multi-draw credit facility. We had a total of $458.6 million outstanding as of December 31, 2019, of which $408.6 million were outstanding term loans, and $49.9 million was outstanding under out multi-draw term facility.
Our existing indebtedness and any indebtedness we may incur in the future could have important consequences to us and the trading price of our common stock, including:
• | limiting our ability to borrow additional amounts for execution of our growth strategy, capital expenditures, debt service requirements, working capital or other purposes; |
• | limiting our ability to use operating cash flow in other areas of our business because we must dedicate a portion of these funds to service the debt; |
• | increasing our vulnerability to general adverse economic and industry conditions, including increases in interest rates; |
• | limiting our ability to capitalize on business opportunities, including the acquisition of additional properties, and to react to competitive pressures and adverse changes in government regulation; |
• | limiting our ability or increasing the costs to refinance indebtedness; |
• | limiting our ability to enter into marketing and hedging transactions by reducing the number of counterparties with whom we can enter into such transactions as well as the volume of those transactions; |
• | forcing us to dispose of one or more properties, possibly on disadvantageous terms; |
• | forcing us to sell additional equity securities at prices that may be dilutive to existing stockholders; |
• | causing us to default on our obligations or violate restrictive covenants, in which case the lenders or mortgagees may accelerate our debt obligations, foreclose on the properties that secure their loans and take control of our properties that secure their loans and collect net timber revenues and other property income; and |
• | in the event of a default under any of our recourse indebtedness or in certain circumstances under our mortgage indebtedness, we would be liable for any deficiency between the value of the property securing such loan and the principal and accrued interest on the loan. |
If any one of these events were to occur, our financial condition, results of operations, cash flow and our ability to satisfy our principal and interest obligations could be materially and adversely affected.
Our financial condition could be adversely affected by financial and other covenants and other provisions under the Amended Credit Agreement or other debt agreements.
Pursuant to the Amended Credit Agreement, we are required to comply with certain financial and operating covenants, including, among other things, covenants that require us to maintain certain leverage, coverage and LTV ratios and a minimum liquidity balance and covenants that prohibit or restrict our ability to incur additional indebtedness, grant liens on our real or personal property, make certain investments, dispose of our assets and enter into certain other types of transactions. The Amended Credit Agreement also prohibits us from declaring, setting aside funds for, or paying any dividend, distribution, or other payment to our stockholders other than as required to maintain our REIT qualification if our LTV ratio is greater than 50%. We may only declare and pay distributions not required to maintain our REIT status if our LTV ratio is less than 50% and we maintain a minimum fixed-charge coverage ratio of 1.05:1.00, and a minimum liquidity balance, as defined by the Amended Credit Agreement, of $25 million. Failure to comply with any of these covenants would likely result in us being prohibited from making any distributions.
Our credit agreement also subjects us to mandatory prepayment from proceeds generated from certain dispositions of timberlands or lease terminations, which may have the effect of limiting our ability to make distributions under certain
19
circumstances. Provided that no event of default has occurred and the LTV ratio, calculated after giving effect to the disposition, does not exceed 42.5%, the mandatory prepayment requirement excludes (1) net real property disposition proceeds until the aggregate amount of such proceeds received during any fiscal year exceeds 2% of the bank value of the timberlands; (2) lease termination proceeds until the amount of such proceeds exceeds 0.5% of the bank value of the timberlands in a single termination or 1.5% in aggregate over the term of the facility; and (3) net real property disposition proceeds from large property dispositions, as defined, to the extent the proceeds are used within 270 days of receipt for acquisition of additional real property that will be subject to the lien of the Amended Credit Agreement. These restrictions may prevent us from taking actions that we believe would be in the best interest of our business and may make it difficult for us to successfully execute our business strategy or effectively compete with companies that are not similarly restricted. In addition, a breach of these covenants or other event of default would allow CoBank to accelerate payment of the loan. Given the restrictions in our debt covenants on these and other activities, we may be significantly limited in our operating and financial flexibility and may be limited in our ability to respond to changes in our business or competitive activities in the future.
Our ability to comply with these covenants and other provisions may be affected by events beyond our control, and we cannot assure you that we will be able to comply with these covenants and other provisions. Upon the occurrence of an event of default, the lenders could elect to declare all amounts outstanding to be immediately due and payable and terminate all commitments to extend further credit. If we were unable to repay those amounts, the lenders could proceed against collateral granted to them, if any, to secure the indebtedness. If our current or future lenders accelerate the payment of the indebtedness owed to them, we cannot assure you that our assets would be sufficient to repay in full our outstanding indebtedness, including the loans under the Amended Credit Agreement.
We may incur additional indebtedness which could increase our business risks and may reduce the value of your investment.
We have acquired, and in the future may acquire, real properties by borrowing funds. In addition, we may incur mortgage debt and pledge some or all of our real properties as security for that debt to obtain funds to acquire additional real properties. We may also borrow funds if needed to satisfy the REIT tax qualification requirement that we distribute at least 90% of our annual REIT taxable income (determined without regard to the dividends-paid deduction and excluding net capital gain) to our stockholders. We may also borrow funds if we otherwise deem it necessary or advisable to ensure that we maintain our qualification as a REIT for federal income tax purposes. Our bylaws do not limit us from incurring debt until our aggregate debt would exceed 200% of our net assets.
Significant borrowings by us increase the risks of a stockholder’s investment. If there is a shortfall between the cash flow from our properties and the cash flow needed to service our indebtedness, then the amount available for distributions to stockholders may be reduced. In addition, incurring mortgage debt increases the risk of loss since defaults on indebtedness secured by a property may result in lenders initiating foreclosure actions. In that case, we could lose the property securing the loan that is in default, thus reducing the value of a stockholder’s investment. For tax purposes, a foreclosure of any of our properties would be treated as a sale of the property for a purchase price equal to the outstanding balance of the debt secured by the mortgage. If the outstanding balance of the debt secured by the mortgage exceeds our tax basis in the property, we would recognize taxable income on foreclosure, but we would not receive any cash proceeds. We may give full or partial guarantees to lenders of mortgage debt on behalf of the entities that own our properties. When we give a guaranty on behalf of an entity that owns one of our properties, we will be responsible to the lender for satisfaction of the debt if it is not paid by such entity. If any mortgages or other indebtedness contains cross-collateralization or cross-default provisions, a default on a single loan could affect multiple properties.
Our decision to hedge against interest rate changes may have a material adverse effect on our financial results and condition, and there is no assurance that our hedges will be effective.
We use interest rate hedging arrangements in order to manage our exposure to interest rate volatility. These hedging arrangements involve risk, including the risk that counterparties may fail to honor their obligations under these arrangements, that these arrangements may not be effective in reducing our exposure to interest rate changes, that the amount of income that we may earn from hedging transactions may be limited by federal tax provisions governing
20
REITs, and that these arrangements may result in higher interest rates than we would otherwise pay. Moreover, no amount of hedging activity can completely insulate us from the risks associated with changes in interest rates. Failure to hedge effectively against interest rate changes may materially adversely affect our results of operations and financial condition.
To service our indebtedness, we will require a significant amount of cash. Our ability to generate cash depends on many factors beyond our control. We also depend on the business of our subsidiaries to satisfy our cash needs. If we cannot generate the required cash, we may not be able to make the necessary payments on our indebtedness.
Our ability to make payments on our indebtedness, including the loans under the Amended Credit Agreement, and to fund planned capital expenditures will depend on our ability to generate cash in the future. Our ability to generate cash, to a certain extent, is subject to general economic, financial, competitive, legislative, regulatory and other factors that are beyond our control.
We conduct our operations primarily through our subsidiaries. As a result, our ability to service our debt, including our obligations under the Amended Credit Agreement and other obligations, depends largely on the earnings of our subsidiaries and the payment of those earnings to us in the form of dividends, loans or advances and through repayment of loans or advances from us. Our subsidiaries are separate and distinct legal entities. In addition, any payment of dividends, loans or advances by our subsidiaries could be subject to statutory or contractual restrictions. Payments to us by our subsidiaries will also be contingent upon our subsidiaries’ earnings and business considerations.
Additionally, our historical financial results have been, and we anticipate that our future financial results will be, subject to fluctuations. We cannot assure you that our business will generate sufficient cash flow from our operations or that future borrowings will be available to us in an amount sufficient to enable us to pay our indebtedness, including the loans under the Amended Credit Agreement, or to fund our other liquidity needs and make necessary capital expenditures.
If our cash flow and capital resources are insufficient to allow us to make scheduled payments on our debt, we may have to sell assets, seek additional capital or restructure or refinance our debt. We cannot assure you that the terms of our debt will allow for these alternative measures or that such measures would satisfy our scheduled debt service obligations.
If we cannot make scheduled payments on our debt:
• | the holders of our debt could declare all outstanding principal and interest to be due and payable; |
• | the holders of our secured debt could commence foreclosure proceedings against our assets; and |
• | we could be forced into bankruptcy or liquidation. |
An increase in interest rates would increase the cost of servicing our debt and could reduce our profitability.
A portion of our outstanding and potential future debt, including under the Amended Credit Agreement, bears or will bear interest at variable rates. As a result, an increase in interest rates, whether because of an increase in market interest rates or a decrease in our creditworthiness, would increase the cost of servicing our debt and could materially reduce our profitability and cash flows. The impact of such an increase could be more significant for us than it would be for competitors that have less variable rate debt. Increases in interest rates would increase our interest cost, which would reduce our cash flows and our ability to pay distributions to our stockholders. In addition, if we need to repay existing debt during periods of high interest rates, we could be required to sell one or more of our investments in order to repay the debt, which sale at that time might not permit realization of the maximum return on such investments.
The phase-out of LIBOR could affect interest rates for our variable rate debt and interest rate swap arrangements.
LIBOR is used as a reference rate for our variable rate debt under the Amended Credit Agreement and for our interest rate swap arrangements. On July 27, 2017, the United Kingdom’s Financial Conduct Authority announced it intends to stop compelling banks to submit rates for the calculation of LIBOR after 2021. It is unclear if LIBOR will cease to exist at that time, if a new method of calculating LIBOR will be established, or if an alternative reference rate will be
21
established. The Federal Reserve Board and the Federal Reserve Bank of New York organized the Alternative Reference Rates Committee, which identified the Secured Overnight Financing Rate (“SOFR”) as its preferred alternative to U.S. dollar LIBOR in derivatives and other financial contracts. We are not able to predict when LIBOR will cease to be available or if SOFR, or another alternative reference rate, attains market traction as a LIBOR replacement. The Amended Credit Agreement and our interest rate swap agreements, which are used to hedge the floating rate exposure of the Amended Credit Agreement, provide that if LIBOR is no longer available, we must agree upon a benchmark replacement index with CoBank for the Amended Credit Agreement and Rabobank International for the interest rate swaps, and in the case of the Amended Credit Agreement, that replacement must be posted to the lenders and, unless the required lenders provide written notice that such replacement is not acceptable, such replacement shall thereafter become effective. In such circumstances, the interest rates on our variable rate debt under the Amended Credit Agreement and in our interest rate swap arrangements may change. The new rates may not be as favorable as those in effect prior to any LIBOR phase-out. In addition, the transition process may result in delays in funding, higher interest expense, additional expenses, and increased volatility in markets for instruments that currently rely on LIBOR, all of which could negatively impact our cash flow.
High mortgage interest rates may make it difficult for us to finance or refinance properties, which could reduce the number of properties we can acquire, our net income, and the amount of cash distributions we can make.
If mortgage debt is unavailable at reasonable interest rates, we may not be able to finance the purchase of properties. If we place mortgage debt on properties, we run the risk of being unable to refinance the properties when the loans become due, or of being unable to refinance on favorable terms. If interest rates are higher when we refinance the properties, our net income could be reduced. If any of these events occur, our cash flow would be reduced. This, in turn, would reduce cash available for distribution to our stockholders and may hinder our ability to raise more capital by issuing more stock or by borrowing more money.
Economic conditions may have an impact on our business, our financial condition, and our ability to obtain debt financing in ways that we currently cannot predict.
Turmoil in the global financial system may have an impact on our business and our financial condition. Despite improved access to capital for some companies, the capital and credit markets continue to be affected by extreme volatility and have experienced disruption during the past decade. The health of the global capital markets remains a concern. We have relied on debt financing to finance our timberlands. As a result of the uncertainties in the credit market, we may not be able to refinance our existing indebtedness or to obtain additional debt financing on attractive terms. If we are not able to refinance existing indebtedness on attractive terms at its maturity, we may be forced to dispose of some of our assets. Disruptions in the financial markets could have an impact on our interest rate swap agreements if our counterparties are forced to default on their obligations to us due to bankruptcy, lack of liquidity, operational failure, or other reasons. We may be materially and adversely affected in the event of a significant default by one of our counterparties. In addition, depressed economic conditions could influence the levels of home buying and consumer spending, which could reduce the demand for homes and other goods produced from our wood, which would have a material adverse effect on our financial condition. Our ability to make future principal and interest payments on our debt depends upon our future performance, which is subject to general economic conditions; industry cycles; and financial, business, and other factors affecting our operations, many of which are beyond our control.
Federal Income Tax Risks
Failure to continue to qualify as a REIT would cause us to be taxed as a regular corporation, which would substantially reduce funds available for distributions to our stockholders and materially and adversely affect our financial condition and results of operations.
We believe that we have been organized, owned and operated in conformity with the requirements for qualification and taxation as a REIT under the Code and that our intended manner of ownership and operation will enable us to continue to meet the requirements for qualification and taxation as a REIT for U.S. federal income tax purposes. Our qualification as a REIT depends upon our ability to meet requirements regarding our organization and ownership,
22
distributions of our income, the nature and diversification of our income and assets, and other tests imposed by the Code. We cannot assure you that we will satisfy the requirements for REIT qualification in the future. Future legislative, judicial or administrative changes to the federal income tax laws could be applied retroactively, which could result in our disqualification as a REIT.
If we fail to qualify to be taxed as a REIT for any taxable year, we will be subject to federal and applicable state and local corporate income tax on our taxable income, if any, determined without a dividends-paid deduction, and, possibly, penalties. In addition, we could not re-elect to be taxed as a REIT for the four taxable years following the year during which we failed to qualify (unless we were entitled to relief under applicable statutory provisions). To the extent we have taxable income, losing our REIT status would reduce our net earnings available for investment or distribution to stockholders because of the additional tax liability. If this occurs, we might be required to borrow funds or liquidate some investments in order to pay the applicable tax. Our failure to qualify as a REIT could impair our ability to expand our business and raise capital, and it would adversely affect the value of our common stock.
The failure of Creek Pine REIT, LLC to qualify as a REIT could cause us to fail to qualify as a REIT.
On July 6, 2018, our operating partnership completed its investment in Creek Pine Holdings, LLC, which owns our interest in the Triple T Joint Venture. Because the Triple T Joint Venture's sole asset is its interest in Creek Pine REIT, LLC ("Creek Pine REIT"), we own an indirect interest in Creek Pine REIT. Creek Pine REIT elected to be taxed as a REIT beginning with its taxable year ended December 31, 2018. Equity in a REIT is a qualifying asset for purposes of the REIT asset tests, and dividends from a REIT are qualifying income for purposes of the REIT gross income tests. Creek Pine REIT is subject to the same REIT qualification requirements that apply to us. If Creek Pine REIT were to fail to qualify as a REIT, (i) Creek Pine REIT would become subject to U.S. federal and applicable state and local corporate income tax and (ii) our interest in Creek Pine REIT would cease to be a qualifying asset for purposes of our REIT asset tests, potentially causing us to fail to qualify as a REIT unless we could avail ourselves of certain relief provisions.
Legislative or regulatory tax changes could adversely affect us, our stockholders or our customers.
The federal income tax laws governing REITs and their stockholders, and administrative interpretations of those laws, may be amended at any time, possibly with retroactive effect.
The 2017 tax legislation commonly referred to as the Tax Cuts and Jobs Act (the "TCJA") made numerous large and small changes to the tax rules that may affect our stockholders and our customers and may directly or indirectly affect us. Many of the changes applicable to individuals apply only through December 31, 2025, including a deduction of up to 20% of ordinary REIT dividends for non-corporate taxpayers. The IRS has issued significant guidance under the TCJA, but guidance on additional issues, finalization of proposed guidance and possible technical corrections legislation may adversely affect us or our stockholders. In addition, further changes to the tax laws, unrelated to the TCJA, are possible.
You are urged to consult with your tax advisor with respect to the status of the TCJA and any other regulatory or administrative developments and proposals and their potential effect on an investment in our common stock.
Even if we continue to qualify to be taxed as a REIT for federal income tax purposes, we may be subject to other tax liabilities that reduce our cash flows.
Even if we continue to qualify to be taxed as a REIT for federal income tax purposes, we may be subject to some federal, state, and local taxes on our income or property. For example:
• | In order to qualify as a REIT, we must distribute annually dividends equal to at least 90% of our REIT taxable income to our stockholders (determined without regard to the dividends-paid deduction and excluding net capital gain). To the extent that we satisfy the distribution requirement but distribute less |
23
than 100% of our REIT taxable income, we will be subject to corporate income tax on the undistributed income, including undistributed net capital gains.
• | We will be subject to a 4% nondeductible excise tax on the amount, if any, by which distributions we pay in any calendar year are less than the sum of 85% of our ordinary income, 95% of our capital gain net income, and 100% of our undistributed income from prior years. |
• | If we have net income from the sale of foreclosure property that we hold primarily for sale to customers in the ordinary course of business or other non-qualifying income from foreclosure property, we must pay a tax on that income at the highest corporate income tax rate. |
• | If we sell a property, other than foreclosure property, that we hold primarily for sale to customers in the ordinary course of business, our gain may be subject to the 100% “prohibited transaction” tax. |
• | Our taxable REIT subsidiaries will be subject to tax on their taxable income. |
Certain of our business activities are potentially subject to the prohibited transaction tax, which could reduce the return on stockholders’ investments.
As a REIT, we would be subject to a 100% tax on any net income from “prohibited transactions.” In addition, gross income from prohibited transactions would be excluded from both of the gross income tests. In general, prohibited transactions are sales or other dispositions of property to customers in the ordinary course of business unless we qualify for a safe harbor exception. Delivered logs, if harvested and sold by a REIT directly, would likely constitute property held for sale to customers in the ordinary course of business and would, therefore, be subject to the prohibited transactions tax if sold at a gain. Accordingly, we sell standing timber to CatchMark TRS under pay-as-cut contracts which generate capital gain to us under Section 631(b) of the Code (to the extent the timber has been held by us for more than one year), and CatchMark TRS, in turn, harvests such timber and sells logs to its customers. However, if the IRS were to successfully disregard CatchMark TRS’ role as the harvester and seller of such logs for federal income tax purposes, our income, if any, from such sales could be subject to the 100% prohibited transaction tax. In addition, sales by us of HBU property at the REIT level could, in certain circumstances, constitute prohibited transactions. We intend to avoid the 100% prohibited transaction tax by satisfying safe harbors in the Code, structuring dispositions as non-taxable like-kind exchanges or making sales that otherwise would be prohibited transactions through one or more TRSs whose taxable income is subject to regular corporate income tax. We may not, however, always be able to identify properties that might be treated as part of a “dealer” land sales business. For example, if we sell any HBU properties at the REIT level that we incorrectly identify as property not held for sale to customers in the ordinary course of business or that subsequently become properties held for sale to customers in the ordinary course of business, we may be subject to the 100% prohibited transactions tax.
Restrictions on deduction of our interest expense could prevent us from satisfying the REIT distribution requirements and cause us to incur income or excise taxes.
Section 163(j) of the Code, as amended by the TCJA, may limit our ability (and the ability of entities that are not treated as disregarded entities for U.S. federal income tax purposes and in which we hold an interest) to deduct interest expense. The deduction for business interest expense may be limited to the amount of the taxpayer’s business interest income plus 30% of the taxpayer’s “adjusted taxable income” unless the taxpayer’s gross receipts do not exceed $25 million per year during the applicable testing period or the taxpayer qualifies to elect, and elects, to be treated as an “electing real property trade or business.” A taxpayer’s adjusted taxable income will start with its taxable income and add back items of non-business income and expense, business interest income and business interest expense, net operating losses, any deductions for “qualified business income,” and, in taxable years beginning before January 1, 2022, any deductions for depreciation, amortization or depletion. A taxpayer that is exempt from the interest expense limitations as an electing real property trade or business is ineligible for certain expensing benefits and is subject to less favorable depreciation rules for real property.
The rules for business interest expense will apply to us and at the level of each entity in which or through which we invest that is not a disregarded entity for U.S. federal income tax purposes, including Creek Pine REIT and its taxable
24
REIT subsidiary. Certain of our subsidiaries have incurred substantial indebtedness and interest expense, as has Creek Pine REIT. To the extent that interest expense is not deductible, taxable income will be increased, as will REIT distribution requirements and the amounts needed to distribute to avoid incurring income and excise taxes. Failure to be eligible for the electing real property trade or business exception or another exception could result in significant limitations on deductibility of the interest expense that we and Creek Pine REIT generate, impacting the taxable income and ability of us and Creek Pine REIT to satisfy the distribution requirements for REIT qualification and to avoid corporate income tax liability.
Final regulations for Section 163(j) of the Code have not been issued. Accordingly, it was not clear whether the exception for an electing real property trade or business applied to us, our subsidiaries or Creek Pine REIT for the tax year ended December 31, 2018 and the uncertainty remains for the 2019 tax year. We, CatchMark Timber OP, and Creek Pine REIT each made an irrevocable election under Section 163(j) to be considered a real property trade or business via a statement attached to and made part of its U.S. Return of Partnership Income for the tax year ended December 31, 2018. The IRS could assert that one or more of these entities is not eligible to elect real property trade or business status for purposes of Section 163(j).
To maintain our REIT status, we may be forced to forgo otherwise attractive opportunities, which could lower the return on stockholders’ investments.
To qualify to be taxed as a REIT, we must satisfy tests on an ongoing basis concerning, among other things, the sources of our income, nature of our assets, and the amounts we distribute to our stockholders. We may be required to make distributions to stockholders at times when it would be more advantageous to reinvest cash in our business or when we do not have funds readily available for distribution. Compliance with the REIT requirements may hinder our ability to operate solely on the basis of maximizing profits.
Even though we intend to maintain our REIT status, our cash dividends are not guaranteed and may fluctuate.
Each year, REITs are required to distribute dividends equal to at least 90% of their REIT taxable income, determined without regard to the dividends-paid deduction and excluding net capital gain. We have substantial net operating losses that, subject to possible limitations, will reduce our taxable income. In addition, capital gains may be retained by us but would be subject to income taxes. If capital gains are retained rather than distributed, our stockholders would be notified and they would be deemed to have received a taxable distribution, with a refundable credit for any federal income tax paid by us. Accordingly, we will not be required to distribute material amounts of cash if substantially all of our taxable income is income from timber-cutting contracts or sales of timberland that is treated as capital gains income. Our board of directors, in its sole discretion, determines the amount of quarterly dividends to be provided to our stockholders based on consideration of a number of factors, including but not limited to, tax considerations. Consequently, our dividend levels may fluctuate.
Generally, ordinary dividends payable by REITs do not qualify for reduced U.S. federal income tax rates applicable to “qualified dividend income.”
The maximum U.S. federal income tax rate for “qualified dividend income” for non-corporate U.S. stockholders currently is 20%. However, ordinary dividends, i.e., dividends that are not designated as capital gain dividends or qualified dividend income, payable by REITs (“qualified REIT dividends”) generally are not eligible for the reduced rates applicable to qualified dividend income and generally are taxed at ordinary income tax rates. However, non-corporate U.S. stockholders are entitled to a deduction of up to 20% of their qualified REIT dividends received in taxable years beginning before January 1, 2026, subject to certain limitations. Non-corporate investors may perceive investments in REITs to be relatively less attractive than investments in the stocks of other corporations whose dividends are taxed at the lower rates as qualified dividend income.
Our use of taxable REIT subsidiaries may affect the value of our common stock relative to the share price of other REITs.
25
We conduct a significant portion of our business activities through one or more TRSs. A TRS is a fully taxable corporation that may earn income that would not be qualifying REIT income if earned directly by us. Our use of TRSs enables us to engage in non-REIT-qualifying business activities. However, under the Code, no more than 20% of the value of the assets of a REIT may be represented by securities of one or more TRSs. This limitation may affect our ability to increase the size of our non-REIT-qualifying operations. The taxable income of TRSs, including CatchMark TRS, is subject to federal and applicable state and local income tax. While we seek to structure the pricing of our timber sales to CatchMark TRS at market rates, the IRS could assert that such pricing does not reflect arm’s-length pricing and impute additional taxable income to CatchMark TRS or impose excise taxes. Our use of TRSs may cause our common stock to be valued differently than the shares of other REITs that do not use TRSs as extensively as we use them.
We may be limited in our ability to fund distributions on our capital stock and pay our indebtedness using cash generated through our TRSs.
Our ability to receive dividends from our TRSs is limited by the rules with which we must comply to maintain our qualification as a REIT. In particular, at least 75% of our gross income for each taxable year as a REIT must be derived from passive real estate sources including sales of our standing timber and other types of qualifying real estate income, and no more than 25% of our gross income may consist of dividends from TRSs and other non-real estate income. This limitation on our ability to receive dividends from our TRSs may affect our ability to fund cash distributions to our stockholders or make payments on our borrowings using cash flows from our TRSs. The net income of our TRSs is not required to be distributed, and income that is not distributed will not be subject to the REIT income distribution requirement.
There may be tax consequences to any modifications to our variable rate debt and interest rate swap arrangements to replace references to LIBOR.
The publication of LIBOR rates may be discontinued after 2021. LIBOR is used as a reference rate for our variable rate debt under the Amended Credit Agreement and for our interest rate swap arrangements. We may have to renegotiate the Amended Credit Agreement and our interest rate swap agreements to replace references to LIBOR. Under current law, certain modifications of terms of LIBOR-based instruments may have tax consequences, including deemed taxable exchanges of the pre-modification instrument for the modified instrument. Proposed Treasury Regulations have been issued that would treat certain modifications that would be taxable events under current law as non-taxable events. The proposed Treasury Regulations do not discuss REIT-specific issues of modifications to LIBOR-based instruments. It is not clear when the proposed Treasury Regulations will be finalized or what, if any, changes will be made to the proposed Treasury Regulations in final Treasury Regulations. We will attempt to migrate to a post-LIBOR environment without jeopardizing our REIT qualification or suffering other adverse tax consequences but can give no assurances that we will succeed.
We may choose to pay dividends in our own stock, in which case our stockholders may be required to pay income taxes in excess of the cash dividends received.
26
Under IRS Revenue Procedure 2017-45, as a publicly traded REIT, we may give stockholders a choice, subject to various limits and requirements, of receiving a dividend in cash or in common stock of the REIT. As long as at least 20% of the total dividend is available in cash and certain other requirements are satisfied, the IRS will treat the stock distribution as a dividend (to the extent applicable rules treat such distribution as being made out of the REIT’s earnings and profits). Taxable stockholders receiving such dividends will be required to include the full amount of the dividend income to the extent of our current and accumulated earnings and profits for federal income tax purposes. As a result, a U.S. stockholder may be required to pay income taxes with respect to such dividends in excess of the cash dividends received. If a U.S. stockholder sells the stock it receives as a dividend in order to pay this tax, the sales proceeds may be less than the amount included in income with respect to the dividend, depending on the market price of our stock at the time of the sale. Furthermore, with respect to non-U.S. stockholders, we may be required to withhold U.S. tax with respect to such dividends, including in respect of all or a portion of such dividend that is payable in stock. In addition, if a significant number of our stockholders determine to sell shares of our common stock in order to pay taxes owed on dividends, it may put downward pressure on the trading price of our common stock.
Risks Related to Our Common Stock
The market price and trading volume of our common stock may be volatile.
The U.S. stock markets, including the NYSE, on which our common stock is listed under the symbol “CTT,” have experienced significant price and volume fluctuations. As a result, the market price of shares of our common stock is likely to be similarly volatile, and investors in shares of our common stock may experience a decrease in the value of their shares, including decreases unrelated to our operating performance or prospects. We cannot assure you that the market price of our common stock will not fluctuate or decline significantly in the future.
In addition to the risks listed in this “Risk Factors” section, a number of factors could negatively affect our share price or result in fluctuations in the price or trading volume of our common stock, including:
• | the annual yield from distributions on our common stock as compared to yields on other financial instruments; |
• | equity issuances by us, or future sales of substantial amounts of our common stock by our existing or future stockholders, or the perception that such issuances or future sales may occur; |
• | short sales or other derivative transactions with respect to our common stock; |
• | the ability of our share repurchase program to improve stockholder value over the long term; |
• | changes in market valuations of companies in the timberland, homebuilding or real estate industries; |
• | increases in market interest rates or a decrease in our distributions to stockholders that lead purchasers of our common stock to demand a higher yield; |
• | fluctuations in stock market prices and volumes; |
• | additions or departures of key management personnel; |
• | our operating performance and the performance of other similar companies; |
• | actual or anticipated differences in our quarterly operating results; |
• | changes in expectations of future financial performance or changes in estimates of securities analysts; |
• | publication of research reports about us or our industry by securities analysts or failure of our results to meet expectations of securities analysts; |
• | failure to qualify as a REIT; |
• | adverse market reaction to any indebtedness we incur in the future; |
• | strategic decisions by us or our competitors, such as acquisitions, divestments, spin-offs, joint ventures, strategic investments or changes in business strategy; |
• | the passage of legislation or other regulatory developments that adversely affect us or our industry; |
• | speculation in the press or investment community; |
• | changes in our earnings; |
• | failure to satisfy the listing requirements of the NYSE; |
• | failure to comply with the requirements of the Sarbanes-Oxley Act; |
• | actions by institutional stockholders; |
• | changes in accounting principles; and |
• | general market conditions, including factors unrelated to our performance. |
In the past, securities class action litigation has often been instituted against companies following periods of volatility in the price of their common stock. This type of litigation could result in substantial costs and divert our management’s attention and resources, which could have a material adverse effect on our cash flows, our ability to execute our business strategy and our ability to make distributions to our stockholders.
27
If securities analysts do not publish research or reports about our business or if they downgrade our common stock or our sector, the price of our common stock could decline.
The trading market for our common stock partly relies on the research and reports that industry or financial analysts publish about us or our business. We do not control analysts. Furthermore, if one or more of the analysts who do cover us downgrades our shares of common stock or our industry, or the stock of any of our competitors, the price of our shares could decline. If one or more of these analysts ceases coverage of our company, we could lose attention in the market, which in turn could cause the price of our shares of common stock to decline.
Future offerings of debt securities, which would be senior to our common stock, or equity securities, which would dilute our existing stockholders and may be senior to our common stock, may adversely affect the market price of our common stock.
In the future, we may attempt to increase our capital resources by offering debt or equity securities, including medium term notes, senior or subordinated notes and classes of preferred or common stock, including through "at-the-market" offerings of common stock. Holders of our debt securities or shares of preferred stock will generally be entitled to receive interest payments or distributions, both current and in connection with any liquidation or sale, prior to the holders of our common stock. We are not required to offer any such additional debt or equity securities to existing common stockholders on a preemptive basis. Therefore, offerings of common stock or other equity securities may dilute the holdings of our existing stockholders. Future offerings of debt or equity securities, or the perception that such offerings may occur, may reduce the market price of our common stock or the distributions that we pay with respect to our common stock. Because we may generally issue any such debt or equity securities in the future without obtaining the consent of our stockholders, you will bear the risk of our future offerings reducing the market price of our common stock and diluting your proportionate ownership.
Increases in market interest rates may result in a decrease in the value of our common stock.
One of the factors that may influence the price of our common stock is our distribution rate on the common stock (as a percentage of the share price of our common stock), relative to market interest rates. We have declared and paid cash distributions in each quarter since the first quarter of 2014 and expect to declare cash distributions in the future. If market interest rates increase, prospective purchasers of our common stock may desire a higher yield on our common stock or seek securities paying higher dividends or yields. Higher interest rates, however, would likely increase our borrowing costs and might decrease our funds available for distribution. Therefore, we may not be able, or may choose not, to pay a higher distribution rate. As a result, if interest rates rise, it is likely that the market price of our common stock will decrease because potential investors may require a higher dividend yield on our common stock as market rates on interest-bearing securities, such as bonds, rise.
ITEM 1B. | UNRESOLVED STAFF COMMENTS |
None.
ITEM 2. | PROPERTIES |
As of December 31, 2019, we wholly owned interests in 435,500 acres of high-quality industrial timberland in the U.S. South and the Pacific Northwest, consisting of 410,200 acres of fee timberlands and 25,300 acres of leased timberlands. Our wholly-owned timberlands are located within attractive fiber baskets encompassing a diverse group of pulp, paper, and wood products manufacturing facilities. Our Southern timberlands consisted of 72% pine plantations by acreage and 52% sawtimber by volume. Our Pacific Northwest timberlands consisted of 90% productive acres and 82% sawtimber by volume. Our leased timberlands of 25,300 acres were all under one long-term lease expiring in 2022, which we refer to as the LTC lease. Wholly-owned timberland acreage by state is listed below:
Acres by state as of December 31, 2019 (1) | Fee | Lease | Total | ||||||
South | |||||||||
Alabama | 70,000 | 1,800 | 71,800 | ||||||
Florida | 2,000 | — | 2,000 | ||||||
Georgia | 248,000 | 23,500 | 271,500 | ||||||
North Carolina | 100 | — | 100 | ||||||
South Carolina | 71,700 | — | 71,700 | ||||||
Tennessee | 300 | — | 300 | ||||||
392,100 | 25,300 | 417,400 | |||||||
Pacific Northwest | |||||||||
Oregon | 18,100 | — | 18,100 | ||||||
Total | 410,200 | 25,300 | 435,500 | ||||||
(1) Represents wholly-owned acreage only; excludes ownership interest in acreage held by joint ventures.
As of December 31, 2019, our wholly-owned timber inventory consisted of an estimated 18.6 million tons of merchantable inventory with the following components:
(in millions) | Tons | |||||||
Merchantable timber inventory (1) | Fee | Lease | Total | |||||
Pulpwood | 8.2 | 0.5 | 8.7 | |||||
Sawtimber (2) | 9.5 | 0.4 | 9.9 | |||||
Total | 17.7 | 0.9 | 18.6 | |||||
(1) Merchantable timber inventory includes current year growth. Pacific Northwest merchantable timber inventory is converted from MBF to tons using a factor of eight.
(2) Includes chip-n-saw and sawtimber.
In addition to our wholly-owned timberlands, we had the following investments in joint ventures as of December 31, 2019 (see Note 4 — Unconsolidated Joint Ventures to our accompanying consolidated financial statements for further details):
28
As of December 31, 2019 | |||
Dawsonville Bluffs Joint Venture | Triple T Joint Venture | ||
Ownership percentage | 50.0% | 21.6% (1) | |
Acreage owned by the joint venture | — | 1,092,000 | |
Merchantable timber inventory (million tons) | — | 44.1 (2) | |
Location | Georgia | Texas | |
(1) | Represents our share of total partner capital contributions. |
(2) | Triple T considers inventory to be merchantable at age 12. Merchantable timber inventory includes current year growth. |
Our methods of estimating timber inventory are consistent with industry practices. We must use various assumptions and judgments to determine both our current timber inventory and the timber inventory that will be available over the harvest cycle; therefore, the physical quantity of such timber may vary significantly from our estimates. Our estimated inventory is calculated for each tract by utilizing growth formulas based on representative sample tracts and tree counts for various diameter classifications. The calculation of inventory is subject to periodic adjustments based on statistical sampling of the harvestable timbered acres, known as timber sample cruises, actual volumes harvested and other timber activity, including timberland sales. In addition to growth, the inventory calculation takes into account in-growth, which is the annual transfer of the oldest pre-merchantable age class into merchantable inventory, which currently is 15 years after stand establishment in the South and 35 years after stand establishment in the Pacific Northwest. The age at which timber is considered merchantable is reviewed periodically and updated for changing harvest practices, advanced seedling genetics, future harvest age profiles and biological growth factors.
The graphs below present the number of acres of our timberland as of December 31, 2019 by age class:
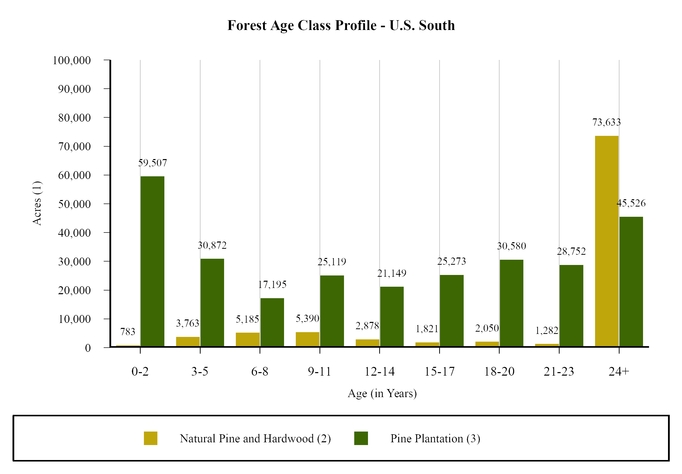
(1) | Acres presented in the graph includes fee timberland only and excludes 11,300 acres of non-forest land. |
29
(2) | Natural Pine and Hardwood represents acres that have been seeded by standing older pine trees near the site through the natural process of seeds dropping from the cones of the older trees. Natural pine sites generally include some mix of natural occurring hardwood trees as well. |
(3) | Pine Plantation represents acres planted or to be planted with pine seedlings to maximize the growth potential and inventory carrying capacity of the soils. Pine Plantation acre inventory is devoted to pine species only. |
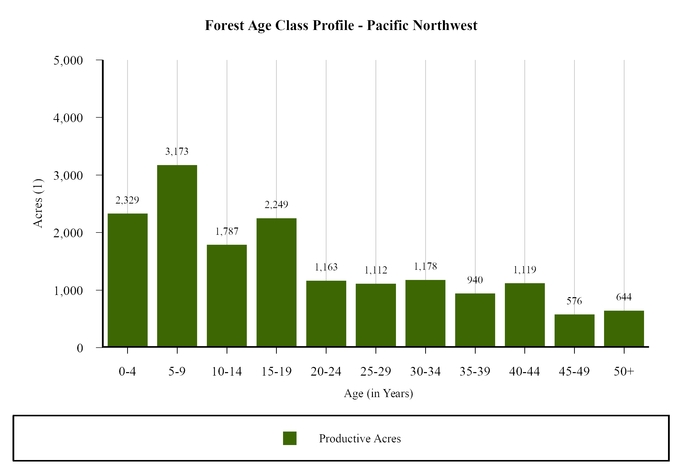
(1) | Acres presented in the graph includes fee timberland only and excludes 1,800 acres of non-productive forest land. |
Forests are subject to a number of natural hazards, including damage by fire, hurricanes, insects and disease. Changes in global climate conditions may intensify these natural hazards. Severe weather conditions and other natural disasters can also reduce the productivity of timberlands and disrupt the harvesting and delivery of forest products. Because our timberlands are concentrated in the U.S. South and the Pacific Northwest, damage from natural disasters in those regions could impact a material portion of our timberlands at one time. Our active forest management should help to minimize these risks. Consistent with the practices of other timber companies, we do not maintain insurance against loss of standing timber on our timberlands due to natural disasters or other causes.
ITEM 3. | LEGAL PROCEEDINGS |
From time to time, we are party to legal proceedings, which arise in the ordinary course of our business. We are not currently involved in any legal proceedings of which the outcome is reasonably likely to have a material adverse effect on our results of operations or financial condition, nor are we aware of any such legal proceedings contemplated by governmental authorities.
ITEM 4. | MINE SAFETY DISCLOSURES |
Not applicable.
PART II
ITEM 5. | MARKET FOR REGISTRANT’S COMMON EQUITY, RELATED STOCKHOLDER MATTERS, AND ISSUER PURCHASES OF EQUITY SECURITIES |
30
Market Information
Our common stock trades on the NYSE under the symbol “CTT”.
Holders
As of February 27, 2020, there were 1,505 stockholders of record of our common stock.
Cumulative Total Shareholder Return
The following graph compares the cumulative total shareholder return on our common stock with the Russell 3000, which is a broad-based market index of issuers with similar capitalization, and with the S&P Global Timber & Forestry Index, which is an industry specific market index of peer issuers, from December 31, 2014 to December 31, 2019. The graph assumes a $100 investment in each of the indices on December 31, 2014, and the dividends received are reinvested at month-end.
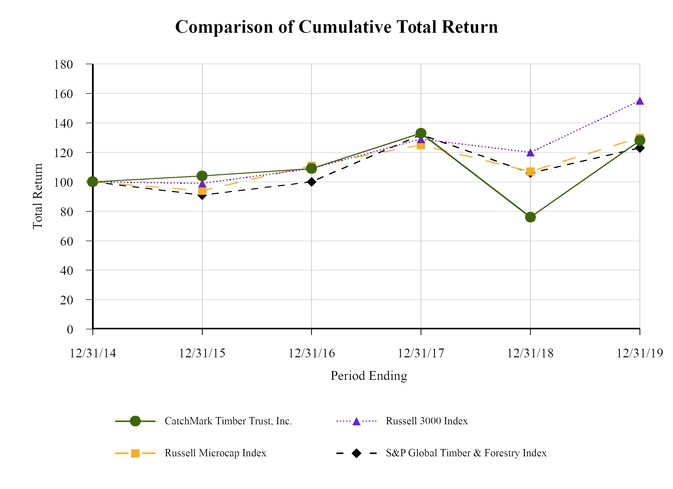
The data in the following table was used to create the above graph as of the respective dates:
12/31/2014 | 12/31/2015 | 12/31/2016 | 12/31/2017 | 12/31/2018 | 12/31/2019 | |||||||||||||
CatchMark Timber Trust, Inc. | $ | 100 | $ | 104 | $ | 109 | $ | 133 | $ | 76 | $ | 128 | ||||||
Russell 3000 Index | $ | 100 | $ | 99 | $ | 109 | $ | 129 | $ | 120 | $ | 155 | ||||||
Russell Microcap Index | $ | 100 | $ | 94 | $ | 111 | $ | 125 | $ | 107 | $ | 130 | ||||||
S&P Global Timber & Forestry Index | $ | 100 | $ | 91 | $ | 100 | $ | 132 | $ | 106 | $ | 123 | ||||||
(1) | Data points are the last trading day of each fiscal year. |
31
Issuer Purchase of Equity Securities
During the fourth quarter of 2019, we did not repurchase any shares of our common stock under our SRP (see Item 7 — Management's Discussion and Analysis of Financial Condition and Results of Operations — Liquidity and Capital Resources section for further details about our SRP).
ITEM 6. | SELECTED FINANCIAL DATA |
The following selected financial data as of and for the five years ended December 31, 2019 should be read in conjunction with the accompanying consolidated financial statements and related notes in Item 8 — Financial Statements and Supplementary Data hereof. All amounts are in thousands except for per-share, tonnage, acreage, and per-acre data.
As of December 31, | |||||||||||||||||||
2019 | 2018 | 2017 | 2016 | 2015 | |||||||||||||||
Financial Position | |||||||||||||||||||
Cash and cash equivalents | $ | 11,487 | $ | 5,614 | $ | 7,805 | $ | 9,108 | $ | 8,025 | |||||||||
Total assets | $ | 663,865 | $ | 804,772 | $ | 740,158 | $ | 709,824 | $ | 599,095 | |||||||||
Outstanding debt | $ | 458,555 | $ | 478,619 | $ | 337,619 | $ | 325,656 | $ | 185,002 | |||||||||
Total liabilities | $ | 470,662 | $ | 483,116 | $ | 337,778 | $ | 328,754 | $ | 188,057 | |||||||||
Total stockholders’ equity | $ | 192,641 | $ | 321,656 | $ | 402,380 | $ | 381,070 | $ | 411,038 | |||||||||
Total equity | $ | 193,203 | $ | 321,656 | $ | 402,380 | $ | 381,070 | $ | 411,038 | |||||||||
Period - End Acres | |||||||||||||||||||
Fee | 410,200 | 432,900 | 479,400 | 467,500 | 401,200 | ||||||||||||||
Lease | 25,300 | 30,200 | 30,900 | 32,100 | 23,800 | ||||||||||||||
Wholly-owned total | 435,500 | 463,100 | 510,300 | 499,600 | 425,000 | ||||||||||||||
Joint venture interest (1) | 1,092,000 | 1,104,800 | 10,500 | — | — | ||||||||||||||
Total acres | 1,527,500 | 1,567,900 | 520,800 | 499,600 | 425,000 | ||||||||||||||
For the Years Ended December 31, | |||||||||||||||||||
2019 | 2018 | 2017 | 2016 | 2015 | |||||||||||||||
Operating Results | |||||||||||||||||||
Total revenues | $ | 106,709 | $ | 97,857 | $ | 91,295 | $ | 81,855 | $ | 69,122 | |||||||||
Loss before unconsolidated joint ventures and income taxes | $ | (4,977 | ) | $ | (15,090 | ) | $ | (14,648 | ) | $ | (11,070 | ) | $ | (8,387 | ) | ||||
Net loss | $ | (93,321 | ) | $ | (122,007 | ) | $ | (13,510 | ) | $ | (11,070 | ) | $ | (8,387 | ) | ||||
Net loss per share available to common stockholders, basic and diluted | $ | (1.90 | ) | $ | (2.55 | ) | $ | (0.34 | ) | $ | (0.29 | ) | $ | (0.21 | ) | ||||
Weighted-average common shares outstanding | 49,038 | 47,937 | 39,751 | 38,830 | 39,348 | ||||||||||||||
Adjusted EBITDA (2) | $ | 56,906 | $ | 49,786 | $ | 41,970 | $ | 36,486 | $ | 32,168 | |||||||||
Cash Flows | |||||||||||||||||||
Cash provided by operating activities | $ | 32,942 | $ | 29,796 | $ | 27,419 | $ | 30,849 | $ | 28,494 | |||||||||
Cash provided by (used in) investing activities | $ | 22,830 | $ | (212,514 | ) | $ | (68,416 | ) | $ | (144,765 | ) | $ | (78,461 | ) | |||||
Cash provided by (used in) financing activities | $ | (49,899 | ) | $ | 180,527 | $ | 39,694 | $ | 114,999 | $ | 40,627 | ||||||||
Total cash dividends paid | $ | 26,269 | $ | 25,601 | $ | 21,349 | $ | 20,382 | $ | 19,590 | |||||||||
Cash dividends paid per share | $ | 0.54 | $ | 0.54 | $ | 0.54 | $ | 0.53 | $ | 0.50 | |||||||||
32
Investments in unconsolidated joint ventures | $ | — | $ | 200,000 | $ | 10,539 | $ | — | $ | — | |||||||||
Net proceeds from large dispositions | $ | 25,151 | $ | 79,134 | $ | — | $ | — | $ | — | |||||||||
Operating distributions from unconsolidated joint ventures | $ | 978 | $ | 3,771 | $ | — | $ | — | $ | — | |||||||||
Capital distributions from unconsolidated joint ventures | $ | 3,830 | $ | 4,744 | $ | — | $ | — | $ | — | |||||||||
Capital Expenditures | |||||||||||||||||||
Timberland acquisitions(3) and earnest money paid | $ | 1,973 | $ | 91,821 | $ | 52,260 | $ | 141,570 | $ | 75,793 | |||||||||
Capital expenditures-other | $ | 4,178 | $ | 4,571 | $ | 5,617 | $ | 3,195 | $ | 2,668 | |||||||||
For the Years Ended December 31, | |||||||||||||||||||
2019 | 2018 | 2017 | 2016 | 2015 | |||||||||||||||
Selected Operating Data | |||||||||||||||||||
Timber Sales Volume (tons) | |||||||||||||||||||
Pulpwood | 1,310,420 | 1,356,318 | 1,424,017 | 1,360,437 | 1,131,475 | ||||||||||||||
Sawtimber (4) | 932,653 | 818,606 | 927,191 | 867,055 | 708,764 | ||||||||||||||
Total | 2,243,073 | 2,174,924 | 2,351,208 | 2,227,492 | 1,840,239 | ||||||||||||||
U.S. South | |||||||||||||||||||
Timber Sales Volume (tons) | |||||||||||||||||||
Pulpwood | 1,301,931 | 1,356,128 | 1,424,017 | 1,360,437 | 1,131,475 | ||||||||||||||
Sawtimber (4) | 872,746 | 816,717 | 927,191 | 867,055 | 708,764 | ||||||||||||||
Total | 2,174,677 | 2,172,845 | 2,351,208 | 2,227,492 | 1,840,239 | ||||||||||||||
Delivered % as of total volume | 71 | % | 80 | % | 74 | % | 64 | % | 60 | % | |||||||||
Stumpage % as of total volume | 29 | % | 20 | % | 26 | % | 36 | % | 40 | % | |||||||||
Net Timber Sales Price ($ per ton) | |||||||||||||||||||
Pulpwood | $ | 14 | $ | 14 | $ | 13 | $ | 14 | $ | 13 | |||||||||
Sawtimber (4) | $ | 24 | $ | 24 | $ | 24 | $ | 24 | $ | 26 | |||||||||
Timberland Sales | |||||||||||||||||||
Gross sales | $ | 17,572 | $ | 17,520 | $ | 14,768 | $ | 12,515 | $ | 11,845 | |||||||||
Basis of timberland sold | $ | 14,053 | $ | 12,380 | $ | 9,890 | $ | 9,728 | $ | 8,886 | |||||||||
Acres sold | 9,200 | 8,500 | 7,700 | 7,300 | 6,400 | ||||||||||||||
% of fee acres | 2.2 | % | 1.8 | % | 1.7 | % | 1.7 | % | 1.7 | % | |||||||||
Price per acre (5) | $ | 1,920 | $ | 2,064 | $ | 1,924 | $ | 1,718 | $ | 1,849 | |||||||||
Large Dispositions | |||||||||||||||||||
Gross sales | $ | 25,395 | $ | 79,301 | $ | — | $ | — | $ | — | |||||||||
Basis of timberland sold | $ | 17,190 | $ | 79,524 | $ | — | $ | — | $ | — | |||||||||
Acres sold | 14,400 | 56,100 | — | — | — | ||||||||||||||
Price per acre (5) | $ | 1,758 | $ | 1,414 | $ | — | $ | — | $ | — | |||||||||
Pacific Northwest | |||||||||||||||||||
33
Timber Sales Volume (tons) | |||||||||||||||||||
Pulpwood | 8,489 | 190 | — | — | — | ||||||||||||||
Sawtimber | 59,907 | 1,889 | — | — | — | ||||||||||||||
Total | 68,396 | 2,079 | — | — | — | ||||||||||||||
Delivered % as of total volume | 88 | % | — | % | — | % | — | % | — | % | |||||||||
Stumpage % as of total volume | 12 | % | 100 | % | — | % | — | % | — | % | |||||||||
Delivered Timber Sales Price ($ per ton) | |||||||||||||||||||
Pulpwood | $ | 32 | $ | — | $ | — | $ | — | $ | — | |||||||||
Sawtimber | $ | 88 | $ | — | $ | — | $ | — | $ | — | |||||||||
Direct Timberland Acquisitions | |||||||||||||||||||
Gross acquisitions | $ | 1,925 | $ | 89,700 | $ | 71,648 | $ | 141,013 | $ | 73,305 | |||||||||
Acres acquired | 900 | 18,100 | 30,600 | 81,900 | 42,900 | ||||||||||||||
Price per acre | $ | 2,185 | $ | 4,956 | $ | 2,341 | $ | 1,721 | $ | 1,709 | |||||||||
Joint Venture Timberland Acquisitions (1) | |||||||||||||||||||
Gross acquisitions | $ | — | $ | 1,389,500 | $ | 20,000 | $ | — | $ | — | |||||||||
Acres acquired | — | 1,099,800 | 11,031 | — | — | ||||||||||||||
Price per acre ($/acre) | $ | — | $ | 1,263 | $ | 1,813 | $ | — | $ | — | |||||||||
(1) | Represents properties owned by Triple T Joint Venture in which CatchMark owns a 21.6% equity interest and Dawsonville Bluffs, LLC, a joint venture in which CatchMark owns a 50% membership interest. CatchMark serves as the manager for both of these joint ventures. |
(2) | See Item 7 — Management’s Discussion and Analysis of Financial Condition and Results of Operations — Adjusted EBITDA for the definition and information regarding why we present Adjusted EBITDA and for a reconciliation of this non-GAAP financial measure from net income (loss). |
(3) | Includes transaction costs. |
(4) | Includes chip-n-saw and sawtimber. |
(5) Excludes value of timber reservations.
ITEM 7. | MANAGEMENT’S DISCUSSION AND ANALYSIS OF FINANCIAL CONDITION AND RESULTS OF OPERATIONS |
The following discussion and analysis should be read in conjunction with the Selected Financial Data in Item 6 — Selected Financial Data above and our accompanying consolidated financial statements and notes thereto in Item 8 — Financial Statement and Supplementary Data. See also “Cautionary Note Regarding Forward-Looking Statements” preceding Part I.
Overview
During 2019, we continued to execute our business strategy built on acquisitions of prime timberland, strategic presence in high-demand mill markets and superior management. Operationally, our fiber supply agreements, delivered wood model and opportunistic stumpage sales were primary performance drivers, generating stable and predictable cash flows from sustainable harvests that, combined with revenues from opportunistic land sales and active investment management, provided recurring dividends to our stockholders funded from cash from operations. We continued to practice intensive forest management and silvicultural techniques that increase the biological growth of our forest.
We realized significant increases in timber sale revenues, driven by higher harvest volumes, increased sawtimber mix and superior pricing in the U.S. South region. Asset management fee revenue increased sharply due to managing the
34
Triple T Joint Venture for a full year and the Dawsonville Bluffs Joint Venture generated attractive returns, including incentive-based promotes for exceeding investment hurdles. We fully integrated the Bandon Property in the Pacific Northwest, and our capital recycling program, employing targeted large dispositions, continues to improve the quality of our timberland portfolio and strengthen our balance sheet through disciplined capital allocation to enable future investments in prime timberlands, furthering our growth strategy.
Joint Ventures
In 2019, the Dawsonville Bluffs Joint Venture completed the disposition of its remaining 5,000 acres of timberlands for $10.2 million. We recognized $1.0 million of income and received $4.8 million of cash distributions from the Dawsonville Bluffs Joint Venture during 2019. Life-to-date through December 31, 2019, we have recognized $4.7 million of income and received cash distributions of $13.3 million from the Dawsonville Bluffs Joint Venture, representing a return of our $10.5 million investment and cumulative preferred return of $2.8 million. In addition, we have earned $0.9 million in asset management fees from the Dawsonville Bluffs Joint Venture, including a $0.6 million incentive-based promote for exceeding investment hurdles. As of December 31, 2019, the Dawsonville Bluffs Joint Venture had a mitigation bank with a book basis of $2.6 million. See Note 4 — Unconsolidated Joint Ventures to our accompanying consolidated financial statements for further details.
During 2019, we earned $11.3 million of asset management fees from the Triple T Joint Venture, an increase of $5.8 million from the prior year due to managing the Triple T Joint Venture for a full year of operations. The Triple T Joint Venture partnership agreement provides for liquidation rights and distribution priorities that are significantly different from our stated ownership percentage based on total equity contributions. As such, we use the hypothetical-liquidation-at-book-value method, or HLBV, to determine our equity in the earnings of the Triple T Joint Venture. For the year ended December 31, 2019, we recognized $90.4 million of losses from the Triple T Joint Venture under the HLBV method of accounting. As of December 31, 2019, we have recognized cumulative HLBV losses of $200 million and do not expect to recognize additional losses from the Triple T Joint Venture. See Note 4 — Unconsolidated Joint Ventures to our accompanying financial statements for further details.
Acquisitions
In December 2019, we acquired 900 acres of high-quality timberlands in South Carolina for $1.9 million, exclusive of transaction costs. This acquisition expanded our existing timberland ownership in the Mid-Atlantic region, which is among the top timber markets in the U.S. South.
Large Dispositions
Over the last two years, we have undertaken a capital recycling program whereby we sell blocks of timberland properties to generate proceeds to fund capital allocation priorities, including, but not limited to redeployment into more desirable timberland investments, paying down outstanding debt, or repurchasing shares of our common stock.
During 2019, we continued to execute our capital recycling program. We completed large dispositions totaling 14,400 acres for $25.4 million, recognizing a gain of $8.0 million, and used a portion of the net proceeds to pay down our outstanding debt by $20.1 million. The remaining net proceeds were used to acquire high-quality timberlands and fund opportunistic repurchases of our shares of common stock. On January 31, 2020, we completed the sale of an additional 14,400 acres of wholly-owned timberlands located in Georgia for $21.3 million, exclusive of transaction costs, and used the net proceeds to repay $20.8 million of outstanding debt on the Multi-Draw Term Facility.
Capital Activities
During 2019, we paid down $20.1 million of our outstanding debt balance with proceeds received from large dispositions. As a result, our net debt to Adjusted EBITDA ratio decreased to 7.9x as of December 31, 2019 from 9.5x as of December 31, 2018. Net debt is calculated as debt outstanding less cash-on-hand as of the relevant period end, and Adjusted EBITDA is calculated for the trailing-12 month period (see Item 7 — Management Discussion and
35
Analysis — Adjusted EBITDA for further details). Our net debt to Adjusted EBITDA ratio is frequently viewed by analysts and investors as an indication of our ability to repay our debt. Subsequent to December 31, 2019, we paid down $20.8 million of outstanding debt with proceeds from the disposition of an additional 14,400 acres that closed on January 31, 2020 under our capital recycling program.
During 2019, we continued to execute our active interest rate management strategy by lowering our already favorable borrowing costs and extending the average life of our fixed-rate debt. Prior to October 2019, we had ten interest rates swaps with various terms that effectively fixed the interest rate on $350.0 million, or 76%, of our variable-rate debt at 4.26%, inclusive of applicable spread but before considering patronage dividends. In October 2019, we terminated these outstanding interest rate swaps and entered into two new interest rate swaps, one with a notional amount of $200.0 million and the other with a notional amount of $75.0 million, with a total fair value at inception equal to the net fair value of the terminated interest rate swaps on the date of termination. Both of the new interest rate swaps became effective on November 29, 2019. The $200.0 million swap has a term of ten years and bears interest at a fixed rate of 2.2067% per annum, and the $75.0 million swap has a term of seven years and bears interest at a fixed rate of 2.083% per annum. As of December 31, 2019, we effectively fixed interest rates on $275.0 million, or 60%, of our variable-rate debt balance at 3.98%, inclusive of applicable spread but before considering patronage dividends. As a result of these transactions, we also extended the weighted-average term of our effectively-fixed rate debt from four years to nine years. See Note 6 — Interest Rate Swaps to our accompanying financial statements footnotes for further details on our interest rate swaps.
During 2019, we paid $26.3 million of dividends to our stockholders and repurchased $3.0 million of shares of common stock at an average price of $9.10 per share under our SRP.
Segment Information
We have three reportable segments: Harvest, Real Estate and Investment Management. Our Harvest segment includes wholly-owned timber assets and associated timber sales, other revenues and related expenses. Our Real Estate segment includes timberland sales, cost of timberland sales and large dispositions. Our Investment Management segment includes investments in and income (loss) from unconsolidated joint ventures and asset management fee revenues earned for the management of these joint ventures. General and administrative expenses, along with other expense and income items, are not allocated among segments. For additional information, see Item 7 — Management Discussion and Analysis — Adjusted EBITDA below and Note 15 — Segment Information to our accompanying consolidated financial statements.
Timber Agreements
A significant portion of our timber sales is derived from the Mahrt Timber Agreements under which we sell specified amounts of timber to WestRock subject to market pricing adjustments. During the year ended December 31, 2019, WestRock purchased 410,000 tons under the Mahrt Timber Agreements, which exceeded the minimum requirement of 375,000 tons. For each of the years ended December 31, 2019, 2018 and 2017, approximately 12%, 17%, and 17%, respectively, of our net timber sales revenue was derived from the Mahrt Timber Agreements. See Note 7 — Commitments and Contingencies to our accompanying consolidated financial statements for additional information regarding the material terms of the Mahrt Timber Agreements.
We assumed a pulpwood supply agreement (the "Carolinas Supply Agreement") in connection with a timberland acquisition in 2016. During the year ended December 31, 2019, we sold 117,000 tons under the Carolinas Supply Agreement, which exceeded the 99,000 tons requirement. For the year ended December 31, 2019, 2018 and 2017, approximately 4%, 5%, and 6%, respectively, of our net timber sales revenue was derived from the Carolinas Supply Agreement.
General Economic Conditions and Timber Market Factors Impacting Our Business
Our operating results are influenced by a variety of factors, including timber prices; the demand for pulp and paper products, lumber, panel, and other wood-related products; the supply of timber; and competition. Timber prices can
36
experience significant variations and have been historically volatile. The demand for timber and wood products is affected primarily by the level of new residential construction activity, repair and remodeling activity, the supply of manufactured timber products including imports, and, to a lesser extent, other commercial and industrial uses. The demand for timber also is affected by the demand for wood chips in the pulp and paper markets and for hardwood in the furniture and other hardwood industries.
The U.S. economy continued to strengthen in 2019, finishing the eleventh year of expansion. According to the U.S. Bureau of Economic Analysis, the real gross domestic product increased 2.3% year-over-year in 2019. The housing market improved in 2019 with total housing starts estimated at 1.3 million units, up 3.0% from 2018. We anticipate that the housing market will continue to show modest improvement in 2020, which we believe should lead to stronger lumber demand and higher pricing for finished products and in turn provide favorable supply-demand dynamics in the timber market. We expect our 2020 timber sales volume to increase to between 2.3 million to 2.5 million tons and our realized pricing to be comparable to 2019.
Liquidity and Capital Resources
Overview
Cash flows generated from our operations are primarily used to fund recurring expenditures and distributions to our stockholders. The amount of distributions to common stockholders is determined by our board of directors and is dependent upon a number of factors, including funds deemed available for distribution based principally on our current and future projected operating cash flows, less capital requirements necessary to maintain our existing timberland portfolio. In determining the amount of distributions to common stockholders, we also consider our financial condition, our expectations of future sources of liquidity, current and future economic conditions, market demand for timber and timberlands, and tax considerations, including the annual distribution requirements necessary to maintain our status as a REIT under the Code.
In determining how to allocate cash resources in the future, we will initially consider the source of the cash. We anticipate using a portion of cash generated from operations, after payments of periodic operating expenses and interest expense, to fund certain capital expenditures required for our existing timberlands. Any remaining cash generated from operations may be used to partially fund timberland acquisitions and pay distributions to stockholders. Therefore, to the extent that cash flows from operations are lower, timberland acquisitions and stockholder distributions are anticipated to be lower as well. Capital expenditures, including new timberland acquisitions, are generally funded with cash flow from operations or existing debt availability; however, proceeds from future debt financings, and equity and debt offerings may be used to fund capital expenditures, acquire new timberland properties, invest in joint ventures, and pay down existing and future borrowings. From time to time, we also sell certain large timberland properties
in order to generate capital to fund capital allocation priorities, including but not limited to redeployment into more desirable timberland investments, pay down of outstanding debt or repurchase of shares of our common stock. Such
large dispositions are typically larger in size and more infrequent than sales under our normal land sales program.
Shelf Registration Statement and Equity Offering
On June 2, 2017, we filed a shelf registration statement on Form S-3 with the SEC, which was declared effective by the SEC on June 16, 2017 (the "Shelf Registration Statement"). The Shelf Registration Statement provides us with future flexibility to offer, from time to time and in one or more offerings, up to $600 million in an undefined combination of debt securities, common stock, preferred stock, depositary shares, or warrants. The terms of any such future offerings would be established at the time of an offering.
Credit Facilities
The table below presents the details of each credit facility under the Amended Credit Agreement as of December 31, 2019:
37
(dollars in thousands) | ||||||||||||||||||
Facility Name | Maturity Date | Interest Rate (1) | Unused Commitment Fee (1) | Total Availability | Outstanding Balance | Remaining Availability | ||||||||||||
Revolving Credit Facility | 12/1/2022 | LIBOR + 2.20% | 0.35% | $ | 35,000 | $ | — | $ | 35,000 | |||||||||
Multi-Draw Term Facility | 12/1/2024 | LIBOR + 2.20% | 0.35% | 200,000 | 49,936 | $ | 150,064 | |||||||||||
Term Loan A-1 | 12/23/2024 | LIBOR + 1.75% | N/A | 100,000 | 100,000 | — | ||||||||||||
Term Loan A-2 | 12/1/2026 | LIBOR + 1.90% | N/A | 100,000 | 100,000 | — | ||||||||||||
Term Loan A-3 | 12/1/2027 | LIBOR + 2.00% | N/A | 68,619 | 68,619 | — | ||||||||||||
Term Loan A-4 | 8/22/2025 | LIBOR + 1.70% | N/A | 140,000 | 140,000 | — | ||||||||||||
Total | $ | 643,619 | $ | 458,555 | $ | 185,064 | ||||||||||||
(1) | The applicable LIBOR margin on the Revolving Credit Facility and the Multi-Draw Term Facility ranges from a base rate plus between 0.50% and 1.20% or a LIBOR rate plus 1.50% to 2.20%, depending on the LTV ratio. The unused committee fee rates also depend on the LTV ratio. |
Borrowings under the Revolving Credit Facility may be used for general working capital, to support letters of credit, to fund cash earnest money deposits, to fund acquisitions in an amount not to exceed $5.0 million, and for other general corporate purposes. The Multi-Draw Term Facility, which is interest only until its maturity date, may be used to finance timberland acquisitions and associated expenses, to fund investment in joint ventures, and to reimburse payments of drafts under letters of credit.
Subsequent to December 31, 2019, we repaid $20.8 million of outstanding debt on the Multi-Draw Term Facility with net proceeds from the large disposition closed on January 31, 2020. As of February 28, 2020, we had $205.9 million of additional borrowing capacity under the Amended Credit Agreement.
Patronage Dividends
We are eligible to receive annual patronage dividends from our lenders (the "Patronage Banks") under the Amended Credit Agreement. The annual patronage dividend depends on the weighted-average debt balance with each participating lender, as calculated by CoBank, for the respective fiscal year under the eligible patronage loans, as well as the financial performance of the Patronage Banks. In March 2019, we received a patronage dividend of $3.3 million on our borrowings under the eligible patronage loans that were outstanding during 2018. Of the total amount received, 75% was received in cash and 25% was received in equity in Patronage Banks. The equity component of the patronage dividend is redeemable for cash only at the discretion of the Patronage Banks' board of directors. As of December 31, 2019, we have accrued $3.8 million of patronage dividends receivable for 2019, approximately 75% of which is expected to be received in cash and 25% is expected to be received in equity in Patronage Banks in March 2020.
Debt Covenants
The Amended Credit Agreement contains, among others, the following financial covenants which:
• | limit the LTV Ratio to (i) 50% at any time prior to December 31, 2021, and (ii) 45% at any time thereafter; |
• | require maintenance of a FCCR of not less than 1.05:1:00 at any time; |
• | require maintenance of a minimum liquidity balance of no less than $25.0 million at any time; and |
• | limit aggregate capital expenditures to 1% of the value of the timberlands during any fiscal year. |
We were in compliance with the financial covenants of the Amended Credit Agreement as of December 31, 2019.
Interest Rate Swaps
We enter into interest rate swaps to mitigate our exposure to changing interest rates on our variable-rate debts. Prior to October 2019, we had ten outstanding interest rate swaps with Rabobank, which effectively fixed interest rates on
38
$350.0 million of our outstanding debt at 4.26%, inclusive of applicable spread but before considering patronage dividends. In October 2019, we terminated these interest rate swaps and entered into two new interest rate swaps with Rabobank with a total notional amount of $275.0 million. As of December 31, 2019, we effectively fixed interest rates on $275.0 million of our $458.6 million outstanding debt balance at 3.98%, inclusive of applicable spread but before considering patronage dividends. See Note 6 — Interest Rate Swaps to our accompanying financial statements for further details on our interest rate swaps.
Share Repurchase Program
On August 7, 2015, our board of directors approved a share repurchase program for up to $30.0 million of our common stock at management's discretion (the "SRP"). The program has no set duration and the board may discontinue or suspend the program at any time. During the year ended December 31, 2019, we repurchased 329,150 shares of our common stock at an average price of $9.10 per share for a total of $3.0 million under the SRP. All common stock purchases under the SRP were made in open-market transactions and were funded with cash on-hand. As of December 31, 2019, we had 49.0 million shares of common stock outstanding and may repurchase up to an additional $15.7 million under the SRP. We can borrow up to $30.0 million under the Multi-Draw Term Facility to repurchase our common stock. Management believes that opportunistic repurchases of our common stock are a prudent use of capital resources.
Short-Term Liquidity and Capital Resources
For the year ended December 31, 2019, net cash provided by operating activities was $32.9 million, a $3.1 million increase from the year ended December 31, 2018. Cash provided by operating activities consisted primarily of receipts from customers for timber, timberland sales, asset management fees, and distributions from the Dawsonville Bluffs Joint Venture, reduced by payments for operating costs, general and administrative expenses, and interest expense. The increase was primarily due to a $6.3 million increase in asset management fees and a $3.4 million increase in net timber sales, offset by a $3.4 million increase in interest expense on variable-rate debt and a $2.8 million decrease in operating distributions received from the Dawsonville Bluffs Joint Venture.
For the year ended December 31, 2019, net cash provided by investing activities was $22.8 million as compared to $212.5 million used in the year ended December 31, 2018. We received $25.2 million in gross proceeds from large dispositions in 2019 compared to $79.1 million in 2018. We used $2.0 million to acquire 900 acres in South Carolina in 2019, as compared to using $91.8 million in 2018 to acquire 18,100 acres in the Pacific Northwest. We received $3.8 million of cash distributions from the Dawsonville Bluffs Joint Venture during 2019 compared to receiving $4.7 million in the prior year. We did not make any equity investments in 2019 as compared to making a $200.0 million equity investment in the Triple T Joint Venture in 2018.
Net cash used in financing activities for the year ended December 31, 2019 was $49.9 million as compared to $180.5 million net cash provided by financing activities in the year ended December 31, 2018. We paid down $20.1 million of our outstanding debt during 2019 compared to repaying $148.0 million in 2018. In 2018, we borrowed $289.0 million to fund the Triple T Joint Venture investment and the Bandon Property acquisition and received $69.0 million of net proceeds from the 2018 Equity Offering (see Note 9 — Stockholders' Equity to our accompanying financial statements for further details). We used $1.0 million less in 2019 in repurchasing vested shares from employees and independent directors related to their income tax liabilities associated with vested restricted stock and used $2.0 million more in repurchasing shares of our common stock under the SRP.
We believe that we have access to adequate liquidity and capital resources, including cash flow generated from operations, cash on-hand, and borrowing capacity, necessary to meet our current and future obligations that become due over the next 12 months. As of December 31, 2019, we had a cash balance of $11.5 million and had $185.1 million of additional borrowing capacity under the Amended Credit Agreement.
Long-Term Liquidity and Capital Resources
39
Over the long-term, we expect our primary sources of capital to include net cash flows from operations, including proceeds from timber sales, timberland sales, asset management fees, and distributions from unconsolidated joint ventures, and from other capital raising activities, including large dispositions, proceeds from secured or unsecured financings from banks and other lenders; and public offerings of equity or debt securities. Our principal demands for capital include operating expenses, interest expense on any outstanding indebtedness, repayment of debt, timberland acquisitions, certain other capital expenditures, and stockholder distributions.
Contractual Obligations and Commitments
As of December 31, 2019, our contractual obligations were as follows:
Payments Due by Period | ||||||||||||||||||||
(in thousands) | Total | 2020 | 2021-2022 | 2023-2024 | Thereafter | |||||||||||||||
Debt obligations (1) | $ | 458,555 | $ | — | $ | — | $ | 149,936 | $ | 308,619 | ||||||||||
Estimated interest on debt obligations (1) (2) | 113,871 | 17,755 | 35,509 | 35,227 | 25,380 | |||||||||||||||
Operating lease obligations (3) | 5,317 | 858 | 1,704 | 882 | 1,873 | |||||||||||||||
Total | $ | 577,743 | $ | 18,613 | $ | 37,213 | $ | 186,045 | $ | 335,872 | ||||||||||
(1) | Represents respective obligations under our Amended Credit Agreement as of December 31, 2019, of which $408.6 million was outstanding under the term loans and $49.9 million was outstanding under the Multi-Draw Term Facility. (see Item 7 — Management's Discussion and Analysis of financial Condition and Results of Operations — Liquidity and Capital Resources — Credit Agreement Amendment above). On February 3, 2020, we paid down $20.8 million of our outstanding balance on the Multi-Draw Term Facility, which matures on December 1, 2024. As a result, estimated future interest on our outstanding debt is reduced by $4.0 million. |
(2) | Amounts are before the consideration of patronage dividends and include the impact of interest rate swaps. See Note 5 — Notes Payable and Lines of Credit and Note 6 — Interest Rate Swaps to our accompanying consolidated financial statements for additional information. |
(3) | Represents future payments for office lease and timberland operating lease. See Note 2 — Summary of Significant Accounting Policies and Note 7 — Commitments and Contingencies to our accompanying consolidated financial statements for additional information. |
Distributions
Our board of directors declares cash distributions quarterly. The amount of future distributions that we may pay to our common stockholders will be determined by our board of directors (as described in the Overview section above). For the year ended December 31, 2019, our board of directors declared the following distributions:
Declaration Date | Record Date | Payment Date | Distribution Per Share | |||
February 14, 2019 | February 28, 2019 | March 15, 2019 | $0.135 | |||
May 2, 2019 | May 31, 2019 | June 14, 2019 | $0.135 | |||
August 1, 2019 | August 30, 2019 | September 13, 2019 | $0.135 | |||
October 31, 2019 | November 26, 2019 | December 13, 2019 | $0.135 | |||
For the year ended 2019, we paid total distributions to stockholders of $26.3 million, which was fully funded from net cash provided by operating activities.
On February 13, 2020, our board of directors declared a cash distribution of $0.135 per share of common stock for stockholders of record on February 28, 2020, payable on March 16, 2020.
40
Results of Operations
Overview
For the years ended December 31, 2019 and 2018, we generated total revenues of $106.7 million and $97.9 million, respectively. Our results of operations are materially impacted by the fluctuating nature of timber prices, changes in the levels and mix of our harvest volumes and associated depletion expense, changes to associated depletion rates, the level of timberland sales, management fees earned, large dispositions, varying interest expense based on the amount and cost of outstanding borrowings, and performance of our unconsolidated joint ventures.
Selected operational results for each of the years ended December 31, 2019 and 2018 are shown in the following table (in thousands, except for per-acre amounts):
Years Ended December 31, | Change | |||||||||
2019 | 2018 | % | ||||||||
Consolidated | ||||||||||
Timber sales revenue | $ | 72,557 | $ | 69,455 | 4 | % | ||||
Timberland sales revenue | $ | 17,572 | $ | 17,520 | — | % | ||||
Asset management fees revenue | $ | 11,948 | $ | 5,603 | 113 | % | ||||
Timber sales volume (tons) | ||||||||||
Pulpwood | 1,310,420 | 1,356,318 | (3 | )% | ||||||
Sawtimber (1) | 932,653 | 818,606 | 14 | % | ||||||
2,243,073 | 2,174,924 | 3 | % | |||||||
U.S. South | ||||||||||
Timber sales revenue | $ | 67,231 | $ | 69,330 | (3 | )% | ||||
Timber sales volume (tons) | ||||||||||
Pulpwood | 1,301,931 | 1,356,128 | (4 | )% | ||||||
Sawtimber (1) | 872,746 | 816,717 | 7 | % | ||||||
2,174,677 | 2,172,845 | — | % | |||||||
Harvest Mix | ||||||||||
Pulpwood | 60 | % | 62 | % | ||||||
Sawtimber (1) | 40 | % | 38 | % | ||||||
Delivered % as of total volume | 71 | % | 80 | % | ||||||
Stumpage % as of total volume (5) | 29 | % | 20 | % | ||||||
Net timber sales price (per ton) (2) | ||||||||||
Pulpwood | $ | 14 | $ | 14 | 2 | % | ||||
Sawtimber (1) | $ | 24 | $ | 24 | 1 | % | ||||
Timberland sales | ||||||||||
Gross sales | $ | 17,572 | $ | 17,520 | — | % | ||||
Acres sold | 9,200 | 8,500 | 8 | % | ||||||
% of fee acres | 2.2 | % | 1.8 | % | ||||||
Price per acre (3) | $ | 1,920 | $ | 2,064 | (7 | )% | ||||
Large Dispositions (4) | ||||||||||
Gross sales | $ | 25,395 | $ | 79,301 | (68 | )% | ||||
41
Acres sold | 14,400 | 56,100 | (74 | )% | ||||||
Price per acre (3) | $ | 1,758 | $ | 1,414 | 24 | % | ||||
Pacific Northwest | ||||||||||
Timber sales revenue | $ | 5,326 | $ | 125 | 4,161 | % | ||||
Timber sales volume (tons) | ||||||||||
Pulpwood | 8,489 | 190 | 4,368 | % | ||||||
Sawtimber | 59,907 | 1,889 | 3,071 | % | ||||||
68,396 | 2,079 | 3,190 | % | |||||||
Harvest Mix | ||||||||||
Pulpwood | 12 | % | 9 | % | ||||||
Sawtimber | 88 | % | 91 | % | ||||||
Delivered % as of total volume | 88 | % | — | % | ||||||
Stumpage % as of total volume | 12 | % | 100 | % | ||||||
Delivered timber sales price (per ton) (2) | ||||||||||
Pulpwood | $ | 32 | $ | — | — | % | ||||
Sawtimber | $ | 88 | $ | — | — | % | ||||
(1) | Includes chip-n-saw and sawtimber. |
(2) | Prices per ton are rounded to the nearest dollar and shown on a delivered basis which includes contract logging and hauling costs. The Bandon Property in the Pacific Northwest was acquired at the end of August 2018 and did not have any delivered timber sales in 2018. |
(3) | Excludes value of timber reservations. |
(4) | Large dispositions are sales of large blocks of timberland properties in one or several transactions with the objective to generate proceeds to fund capital allocation priorities. Large dispositions are typically larger transactions in acreage and gross sales price than |
recurring HBU sales and are not part of core operations, are infrequent in nature and would cause material variances in comparative
results if not reported separately. Large dispositions may or may not have a higher or better use than timber production or result in a
price premium above the land’s timber production value.
(5) | Current year percentage includes 4% from lump-sum sales. |
Our 2019 timber sales revenue was 4% higher than 2018 primarily due to contributions from the Bandon Property in the Pacific Northwest. We successfully integrated the Bandon Property into our operations during 2019 and generated $5.3 million in gross timber sales revenue from harvesting 68,396 tons in 2019, 88% of which was sold through delivered sales. U.S. South gross timber sales revenue for 2019 was 3% lower than 2018 mainly as a result of a 9% decrease in delivered sales as percentage of total volume, as we capitalized on advantageous stumpage and lump-sum sales opportunities. Harvest volume in the U.S. South in 2019 was comparable to the prior year despite persistent wet weather and extended mill outages throughout 2019. Our average U.S. South pulpwood stumpage price for 2019 was 2% higher than 2018 primarily due to better realized stumpage pricing in the Coastal Georgia and in the Carolinas markets, which are among the top pulpwood markets in the U.S. South. Our average U.S. South sawtimber stumpage price increased 1% from 2018 primarily driven by improved pricing and mix in the East Central Alabama and West Central Georgia markets. Our realized stumpage prices continue to hold a significant premium over South-wide averages as tracked by TimberMart-South as a result of operating in strong micro-markets where we selectively assembled our prime timberlands portfolio.
We earned $11.9 million in asset management fees during 2019, comprised of $11.3 million earned from the Triple T Joint Venture and $0.6 million earned from the Dawsonville Bluffs joint venture.
Comparison of the year ended December 31, 2019 versus the year ended December 31, 2018
42
Revenues. Revenues increased to $106.7 million for the year ended December 31, 2019 from $97.9 million for the year ended December 31, 2018 due to a $3.1 million increase in timber sales revenue and a $6.3 million increase increase in asset management fees revenue, offset by a $0.6 million decrease in other revenues.
Asset management fees increased to $11.9 million in 2019 from $5.6 million in 2018 primarily due to a $5.8 million increase from the Triple T Joint Venture and a $0.6 million increase from the Dawsonville Bluffs Joint Venture. Higher management fees earned from the Triple T Joint Venture was a result of managing the venture for a full year in 2019 as compared to two quarters in 2018. The majority of the asset management fees earned from the Dawsonville Bluffs Joint Venture in 2019 represented an incentive-based promote earned for exceeding investment hurdles.
Gross timber sales revenue increased by $3.1 million as a result of a $5.2 million increase in the Pacific Northwest offset by a $2.1 million decrease in the U.S. South. We acquired the Bandon Property in the Pacific Northwest at the end of August 2018 and have successfully integrated it into our operations. The Bandon Property contributed $5.3 million in gross timber sales revenue in 2019 as compared to $0.1 million in 2018. Gross timber sales revenue in the U.S. South was $2.1 million lower in 2019 due to a decrease of delivered sales as a percentage of comparable year-over-year U.S. South harvest volumes. Gross timber sales revenue from delivered sales includes logging and hauling costs that customers pay for deliveries.
Details of timber sales by product for the years ended December 31, 2019 and 2018 are shown in the following table:
For the Year Ended December 31, 2018 | Changes attributable to: | For the Year Ended December 31, 2019 | |||||||||||||
(in thousands) | Price/Mix | Volume (3) | |||||||||||||
Timber sales (1) | |||||||||||||||
Pulpwood | $ | 38,309 | $ | 896 | $ | (3,107 | ) | $ | 36,098 | ||||||
Sawtimber (2) | 31,146 | 86 | 5,227 | 36,459 | |||||||||||
$ | 69,455 | $ | 982 | $ | 2,120 | $ | 72,557 | ||||||||
(1) | Timber sales are presented on a gross basis. |
(2) | Includes chip-n-saw and sawtimber. |
(3) | Changes in timber sales revenue related to properties acquired or disposed within the last 12 months are attributed to volume changes. |
Operating expenses. Contract logging and hauling costs decreased to $31.1 million for the year ended December 31, 2019 from $31.5 million for the year ended December 31, 2018 as a result of a $3.2 million decrease in the U.S. South offset by incurring $2.8 million of logging and hauling cost in the Pacific Northwest, where there were no delivered sales in 2018. The decrease in the U.S. South was driven by a 9% decrease in delivered sales as a percentage of total volume, offset by a 2% increase in average rates.
Depletion expense increased 8% to $28.1 million for the year ended December 31, 2019 from $25.9 million for the year ended December 31, 2018 due to a $3.9 million increase in the Pacific Northwest offset by a $1.7 million decrease in the U.S. South. The increase in the Pacific Northwest was a result of growing harvest volume from 2,079 tons in 2018 to 68,396 tons in 2019. The decrease in the U.S. South was driven by lower blended depletion rates. We calculate depletion rates annually by dividing the beginning merchantable inventory book value, after the write-off of accumulated depletion, by current standing timber inventory volume. Before the impact of any future acquisitions or significant land sales, the merchantable book value is expected to decrease over time due to depletion while the standing timber inventory volume is expected to stay relatively stable due to our sustainable harvest management practice. Therefore, we generally expect the depletion rates of our current portfolio to decrease over time.
Cost of timberland sales increased to $15.1 million for the year ended December 31, 2019 from $13.5 million for the year ended December 31, 2018 as we sold more acres in 2019.
Forestry management expenses increased to $6.7 million in 2019 from $6.3 million in 2018 primarily as a result of an $0.6 million increase in allocated personnel costs for managing a growing portfolio, including our asset management business.
43
General and administrative expenses increased to $13.3 million for the year ended December 31, 2019 from $12.4 million for the year ended December 31, 2018, primarily as a result of $0.7 million of net reimbursements of transaction costs related to the Triple T Joint Venture recognized in 2018, and a $0.2 million increase in personnel costs in 2019, primarily due to vesting of stock-based compensation.
Other operating expenses increased to $6.5 million for the year ended December 31, 2019 from $6.3 million for the year ended December 31, 2018, primarily due to cost basis removed related to an expired timber lease in the first quarter of 2019.
Interest expense. Interest expense increased to $18.6 million for the year ended December 31, 2019 from $16.3 million for the year ended December 31, 2018 primarily due to a $3.4 million net increase in interest and unused commitment fees on our variable-rate debt, offset by a $1.4 million decrease in non-cash interest expense. Interest on our variable-rate debt increased primarily due to a 15% increase in our weighted-average outstanding debt balance year-over-year. See Note 5 — Notes Payable and Lines of Credit and Note 6 — Interest Rate Swaps to our accompanying consolidated financial statements for additional information.
Gain (loss) on large dispositions. We recognized a gain of $8.0 million from the disposition of 14,400 acres of our wholly-owned timberlands during the year ended December 31, 2019. For the year ended December 31, 2018, we recognized a loss of $0.4 million from the disposition of 56,100 acres of our wholly-owned timberlands.
Income (loss) from unconsolidated joint ventures. For the year ended December 31, 2019, we recognized $1.0 million of income from the Dawsonville Bluffs Joint Venture, which represents our portion of the joint venture's net income of $2.0 million, generated primarily through the sale of HBU timberland and mitigation bank credits. For the year ended December 31, 2019, we recognized a $90.4 million loss from the Triple T Joint Venture under the HLBV method of accounting. We expect the Dawsonville Bluffs Joint Venture will generate substantially lower earnings and cash flow in 2020 from the sale of its remaining mitigation bank credits as compared to 2019. As of December 31, 2019, our investment in the Triple T Joint Venture had been written down to zero by recognizing a cumulative $200 million of HLBV losses. We do not expect to recognize additional losses from the Triple T Joint Venture.
Income taxes. For the year ended December 31, 2019, we recognized a $1.1 million income tax benefit. See Note 12 — Income Taxes to our accompanying consolidated financial statements for additional information.
Net loss. Our net loss decreased to $93.3 million for the year ended December 31, 2019 from $122.0 million for the year ended December 31, 2018 primarily due to recognizing a $19.1 million decrease in losses allocated from the Triple T Joint Venture, a $8.9 million increase in total revenues, a $8.4 million increase in gain from large dispositions, and a $1.1 million income tax benefit, offset by a $4.7 million increase in total expenses, a $2.4 million increase in interest expense, and a $1.7 million decrease in income recognized from the Dawsonville Bluffs Joint Venture. Our net loss per share for the years ended December 31, 2019 and 2018 was $1.90 and $2.55, respectively. We anticipate future net income or losses to fluctuate with timber prices, harvest volumes and mix, depletion rates, timberland sales, the performance of our joint ventures, and interest expense based on our level and costs of current and future borrowings.
Comparison of the year ended December 31, 2018 versus the year ended December 31, 2017
For a comparison of our 2018 and 2017 results of operations, see Item 7 — Management's Discussions and Analysis of Financial Condition and Results of Operations in our Annual Report on Form 10-K for the year ended December 31, 2018 filed with the SEC on March 1, 2019.
Adjusted EBITDA
The discussion below is intended to enhance the reader’s understanding of our operating performance and ability to satisfy lender requirements. EBITDA is a non-GAAP financial measure of operating performance. EBITDA is defined by the SEC as earnings before interest, taxes, depreciation and amortization; however, we have excluded certain other expenses which we believe are not indicative of the ongoing operating results of our timberland portfolio, and we refer to this measure as Adjusted EBITDA (see the reconciliation table below). As such, our Adjusted EBITDA may not be comparable to similarly titled measures reported by other companies. Due to the significant amount of timber assets subject to depletion, significant income (losses) from unconsolidated joint ventures based on HLBV, and the significant amount of financing subject to interest and amortization expense, management considers Adjusted EBITDA to be an important measure of our financial performance. By providing this non-GAAP financial measure, together with the reconciliation below, we believe we are enhancing investors’ understanding of our business and our ongoing results of operations, as well as assisting investors in evaluating how well we are executing our strategic initiatives. Items excluded from Adjusted EBITDA are significant components in understanding and assessing financial performance. Adjusted EBITDA is a supplemental measure of operating performance that does not represent and should not be considered in isolation or as an alternative to, or substitute for net income, cash flow from operations, or other financial statement data presented in accordance with GAAP in our consolidated financial statements as indicators of our operating performance. Adjusted EBITDA has limitations as an analytical tool and should not be considered in isolation or as a substitute for analysis of our results as reported under GAAP. Some of the limitations are:
• | Adjusted EBITDA does not reflect our capital expenditures, or our future requirements for capital expenditures; |
• | Adjusted EBITDA does not reflect changes in, or our interest expense or the cash requirements necessary to service interest or principal payments on, our debt; |
• | Although depletion is a non-cash charge, we will incur expenses to replace the timber being depleted in the future, and Adjusted EBITDA does not reflect all cash requirements for such expenses; and |
• | Although HLBV income and losses are primarily hypothetical and non-cash in nature, Adjusted EBITDA does not reflect cash income or losses from unconsolidated joint ventures for which we use the HLBV method of accounting to determine our equity in earnings. |
Due to these limitations, Adjusted EBITDA should not be considered as a measure of discretionary cash available to us to invest in the growth of our business. Our credit agreement contains a minimum debt service coverage ratio based, in part, on Adjusted EBITDA since this measure is representative of adjusted income available for interest payments. We further believe that our presentation of this non-GAAP financial measurement provides information that is useful to analysts and investors because they are important indicators of the strength of our operations and the performance of our business.
For the year ended December 31, 2019, Adjusted EBITDA was $56.9 million, a $7.1 million increase from the year ended December 31, 2018, primarily due to a $6.3 million increase in asset management fees, a $3.4 million increase
44
in net timber sales, offset by a $2.0 million decrease in Adjusted EBITDA generated by the Dawsonville Bluffs Joint Venture and a $0.6 million decrease in other revenues.
Our reconciliation of net loss to Adjusted EBITDA for the years ended December 31, 2019 and 2018 follows:
(in thousands) | 2019 | 2018 | |||||
Net loss | $ | (93,321 | ) | $ | (122,007 | ) | |
Add: | |||||||
Depletion | 28,064 | 25,912 | |||||
Interest expense (1) | 17,058 | 13,643 | |||||
Amortization (1) | 1,786 | 2,821 | |||||
Income tax benefit | (1,127 | ) | — | ||||
Depletion, amortization, and basis of timberland and mitigation credits sold included in loss from unconsolidated joint venture (2) | 3,823 | 4,195 | |||||
Basis of timberland sold, lease terminations and other (3) | 14,964 | 13,053 | |||||
Stock-based compensation expense | 2,790 | 2,689 | |||||
(Gain) loss from large dispositions (4) | (7,961 | ) | 390 | ||||
HLBV loss from unconsolidated joint venture (5) | 90,450 | 109,550 | |||||
Other (6) | 380 | (460 | ) | ||||
Adjusted EBITDA | $ | 56,906 | $ | 49,786 | |||
(1) | For the purpose of the above reconciliation, amortization includes amortization of deferred financing costs, amortization of operating lease assets and liabilities, amortization of intangible lease assets, and amortization of mainline road costs, which are included in either interest expense, land rent expense, or other operating expenses in the accompanying consolidated statements of operations. Includes non-cash basis of timber and timberland assets written-off related to timberland sold, terminations of timberland leases and casualty losses. |
(2) | Reflects our share of depletion, amortization, and basis of timberland and mitigation credits sold of the unconsolidated Dawsonville Bluffs Joint Venture. |
(3) | Includes non-cash basis of timber and timberland assets written-off related to timberland sold, terminations of timberland leases and casualty losses. |
(4) | Large dispositions are sales of blocks of timberland properties in one or several transactions with the objective to generate proceeds to fund capital allocation priorities. Large dispositions may or may not have a higher or better use than timber production or result in a price premium above the land’s timber production value. Such dispositions are infrequent in nature, are not part of core operations, and would cause material variances in comparative results if not reported separately. |
(5) | Reflects HLBV (income) losses from the Triple T Joint Venture, which is determined based on a hypothetical liquidation of the underlying joint venture at book value as of the reporting date. |
(6) | Includes certain cash expenses paid, or reimbursement received, that management believes do not directly reflect the core business operations of our timberland portfolio on an on-going basis, including costs required to be expensed by GAAP related to acquisitions, transactions, joint ventures or new business initiatives. |
Segment EBITDA
For the year ended December 31, 2019, Harvest EBITDA was $33.7 million, a $2.5 million increase from the year ended December 31, 2018, primarily due to a $3.4 million increase in net timber sales, offset by a $0.6 million decrease in other revenues. Real Estate EBITDA and Corporate EBITDA for the year ended December 31, 2019 was comparable to the prior year. Investment Management EBITDA increased by $4.3 million to $16.7 million for the year ended December 31, 2019 due to a $6.3 million increase in asset management fees, offset by a $2.0 million decrease in Adjusted EBITDA generated by the Dawsonville Bluffs Joint Venture.
The following table presents Adjusted EBITDA by reportable segment:
45
For the Years Ended December 31, | |||||||
(in thousands) | 2019 | 2018 | |||||
Harvest | $ | 33,670 | $ | 31,191 | |||
Real Estate | 16,559 | 16,388 | |||||
Investment Management | 16,749 | 12,431 | |||||
Corporate | (10,072 | ) | (10,224 | ) | |||
Total | $ | 56,906 | $ | 49,786 | |||
Election as a REIT
We have elected to be taxed as a REIT under the Code, and have operated as such beginning with our taxable year ended December 31, 2009. To qualify to be taxed as a REIT, we must meet certain organizational and operational requirements, including a requirement to distribute at least 90% of our adjusted taxable income, as defined in the Code, to our stockholders, computed without regard to the dividends-paid deduction and by excluding our net capital gain. As a REIT, we generally will not be subject to federal income tax on taxable income that we distribute to our stockholders. If we fail to qualify to be taxed as a REIT in any taxable year, we will then be subject to federal income taxes on our taxable income at regular corporate rates and will not be permitted to qualify for treatment as a REIT for federal income tax purposes for that year and for the four years following the year during which qualification is lost, unless the IRS grants us relief under certain statutory provisions. Such an event could materially adversely affect our net income and net cash available for distribution to our stockholders. However, we believe that we are organized and operate in such a manner as to qualify for treatment as a REIT for federal income tax purposes.
Inflation
Our timber agreements provide that we will sell specified amounts of timber at prices subject to quarterly market pricing adjustments and monthly fuel pricing adjustments, which are intended to protect us from, and mitigate the risk of, the impact of inflation. The price of timber has generally increased with increases in inflation; however, we have not noticed a significant impact from inflation on our revenues, net sales, or income from continuing operations. See Item 1 — Business for additional information regarding the material terms of our timber agreements.
Critical Accounting Estimates
Our accounting policies have been established to conform to GAAP and are disclosed in Note 2 to our accompanying consolidated financial statements. The preparation of financial statements in conformity with GAAP requires management to make estimates and assumptions, using management's best judgment, in the application of accounting policies. These estimates and assumptions affect the reported amounts of assets and liabilities and disclosure of contingent assets and liabilities at the dates of the financial statements and the reported amounts of revenue and expenses during the reporting periods. If management’s estimates and assumptions or interpretation of the facts and circumstances relating to various transactions had been different, it is possible that different accounting policies would have been applied or different amounts of assets, liabilities, revenues, and expenses would have been recorded, thus resulting in a different presentation of the financial statements or different amounts reported in the financial statements. Additionally, other companies may utilize different estimates and assumptions that may impact comparability of our results of operations to those of companies in similar businesses.
The following discussion addresses our most critical accounting estimates, which are those that are both important to the portrayal of our financial condition and results of operations and that require significant judgment or use of significant assumptions or complex estimates.
Timber Assets
Timber and timberlands, including logging roads, are stated at cost less accumulated depletion for timber harvested and accumulated amortization. We capitalize timber and timberland purchases. Reforestation costs, including all costs associated with stand establishment, such as site preparation, cost of seedlings, fertilization, and herbicide application, are capitalized and tracked as premerchantable timber assets by vintage year. Annually, capitalized reforestation costs for timber that has reached a merchantable age are reclassified into merchantable timber inventory and are depleted as harvested. Timber carrying costs, such as real estate taxes, insect control, wildlife control, leases of timberlands and forestry management personnel salaries and fringe benefits, are expensed as incurred. Costs of major roads are capitalized and amortized over their estimated useful lives. Costs of roads built to access multiple logging sites over numerous years are capitalized and amortized over seven years. Costs of roads built to access a single logging site are expensed as incurred.
Depletion
We recognize depletion expense as timber is harvested using the straight-line method. Depletion rates are established at least annually by dividing the remaining merchantable inventory book value by current merchantable timber inventory volume. Management believes that the straight-line method is preferable as it is based on the actual costs recorded and actual merchantable timber volume as of the date that the depletion rates are determined.
Evaluating the Recoverability of Timber Assets
46
We continually monitor events and changes in circumstances that could indicate that the carrying amounts of our timber assets may not be recoverable. When indicators of potential impairment are present that suggest that the carrying amounts of timber assets may not be recoverable, we assess the recoverability of these assets by determining whether the carrying value will be recovered through the undiscounted future operating cash flows expected from the use of the asset and its eventual disposition. Impairment losses would be recognized for (i) long-lived assets used in our operations when the carrying value of such assets exceeds the undiscounted cash flows estimated to be generated from the future operations of those assets, and (ii) long-lived assets held for sale when the carrying value of such assets exceeds an amount equal to their fair value less selling costs. Estimated fair values are calculated based on the following information in order of preference, dependent upon availability: (i) recently quoted market prices, (ii) market prices for comparable properties, or (iii) the present value of undiscounted cash flows, including estimated salvage value. We intend to use one harvest cycle for the purpose of evaluating the recoverability of timber and timberlands used in our operations. Future cash flow estimates are based on probability-weighted projections for a range of possible outcomes and are discounted at risk-free rates of interest. We generally consider assets to be held for sale at the point at which a sale contract is executed, the buyer has made a significant non-refundable earnest money deposit against the contracted purchase price and there is a high degree of certainty a transaction will close. We have determined that there has been no impairment of our long-lived assets to date.
Allocation of Purchase Price of Acquired Assets
Upon the acquisition of timberland properties, we allocate the purchase price to tangible assets, consisting of timberland and timber, and identified intangible assets and liabilities, which may include values associated with in-place leases or supply agreements, based in each case on our estimate of their fair values. The values of tangible assets are then allocated to timberland and timber based on our determination of the relative fair value of these assets.
Investments in Unconsolidated Joint Ventures
For joint ventures that we do not control but exercise significant influence, we use the equity method of accounting. Our judgment about our level of influence or control of an entity involves consideration of various factors including the form of our ownership interest; our representation in the entity's governance; our ability to participate in policy-making decisions; and the rights of other investors to participate in the decision-making process, to replace us as manager, and/or to liquidate the venture. Under the equity method, the investment in a joint venture is recorded at cost and adjusted for equity in earnings and cash contributions and distributions. Income or loss and cash distributions from an unconsolidated joint venture are allocated according to the provisions of the respective joint venture agreement, which may be different from its stated ownership percentage. We use the hypothetical-liquidation-at-book-value method, or HLBV, to determine our equity in the earnings of joint ventures where cash distribution percentages vary at different points in time and are not directly linked to an investor's ownership percentage. For investments accounted for under the HLBV method, applying the percentage ownership interest to GAAP net income in order to determine earnings or losses would not accurately represent the income allocation and cash flow distributions that will ultimately be received by the investors. We apply HLBV using a balance sheet approach. A calculation is prepared at each balance sheet date to determine the amount that we would receive if the respective joint venture were to liquidate all of its assets (at book value in accordance with GAAP) on that date and distribute the cash to the partners based on the contractually-defined liquidation priorities. The difference between the calculated liquidation distribution amounts at the beginning and the end of the reporting period, after adjusting for capital contributions and distributions, is our income or loss from the joint venture for the period.
We evaluate the recoverability of our investments in unconsolidated joint ventures in accordance with accounting standards for equity investments by first reviewing each investment for any indicators of impairment. If indicators are present, we estimate the fair value of the investment. If the carrying value of the investment is greater than the estimated fair value, we assess whether the impairment is “temporary” or “other-than-temporary.” In making this assessment, we consider the following: (1) the length of time and the extent to which fair value has been less than cost, (2) the financial condition and near-term prospects of the entity, and (3) our intent and ability to retain our interest long enough for a recovery in market value. If we conclude that the impairment is "other than temporary," we reduce the investment to its estimated fair value.
47
For information on our unconsolidated joint ventures, which are accounted for using the equity method of accounting, see Note 4 — Unconsolidated Joint Ventures to our accompanying consolidated financial statements for additional information.
Revenue Recognition
Effective January 1, 2018, we adopted ASU 2014-09, Revenue from Contracts with Customers (Topic 606) (“ASC 606”). Under the new standard, we recognize revenues when the following criteria are met: (i) persuasive evidence of a contract with a customer exists, (ii) identifiable performance obligations under the contract exist, (iii) the transaction price is determinable for each performance obligation, (iv) the transaction price is allocated to each performance obligation, and (v) when the performance obligations are satisfied. We derive a majority of our revenues from timber sales, timberland sales, recreational leases, and asset management fees, where the original expected contract duration is one year or less. We have elected the disclosure exemption available under ASC 606 considering we generally satisfy our performance obligations within one year of entering into contracts and collect payments within a month of satisfying our performance obligation.
(a) Timber Sales Revenue
We generate timber sales revenue from delivered wood sales, stumpage sales, and lump-sum sales with retained economic interests. Revenue for timber sales is recognized when the risk of loss passes to the customer. Only one performance obligation is associated with timber sales and it is satisfied when timber is delivered to or severed by the customer in an amount that reflects the consideration expected to be received.
Contractual terms of each timber sale, including pricing and volume for the respective product, are negotiated and
entered into by the field managers. In delivered wood sales, product pricing includes amount sufficient to cover costs of contracting third-party logging crews to harvest and haul timber to the customers. Revenue is recognized when timber is delivered to the customer and the sales volume/value is known when timber crosses the customers’ scale. Stumpage sales are typically executed using pay-as-cut contracts, where a purchaser acquires the right to harvest specified timber on a designated tract for a set period of time at agreed-upon unit prices. Revenue is recognized when timber is severed under pay-as-cut contracts. In a lump-sum sales contract with retained economic interests, we receive advance payments for the standing timber specified in the contract and the customer is responsible for cutting and hauling the timber. We satisfy our performance obligation when timber is severed, at which time revenue is recognized. Contract payments are generally collected within a month from the date timber is harvested and/or delivered. The transaction price for timber sales is determined using contractual rates applied to harvest volumes.
(b) Timberland Sales Revenue
Performance obligations associated with timberland sales are met when all conditions of closing have been satisfied. Revenue for timberland sales is recognized at closing when title passes, payments are received or full collectibility is probable, and control is passed to the buyer. We generally receive the entire contract consideration in cash at closing.
(c) Recreational Lease Revenue
Recreational lease revenue is derived from the leasing of the right to use our timberland. The agreed-upon transaction price of a lease is generally paid in full at the beginning of the lease term and recorded as deferred revenue. Performance obligations associated with a recreational lease are generally met over the period of the lease term. Revenue is recognized evenly over the lease term as we have satisfied our performance obligation.
(d) Asset Management Fee Revenue
Under asset management agreements with our unconsolidated joint ventures, we earn management fees for performing asset management functions, as further described in Note 4 — Unconsolidated Joint Ventures of our accompanying consolidated financial statements. As asset management services are ongoing and provided on a recurring basis, the
48
associated performance obligations are generally met over the service period at an agreed-upon price stated in the agreements. Revenue for asset management services is recognized at the end of each service period.
New Lease Accounting Standard
In February 2016, the FASB issued ASU 2016-02, Leases ("ASC 842"). ASC 842 establishes a right-of-use ("ROU") model that requires a lessee to record a ROU asset and a lease liability on its balance sheet for all leases, subject to certain scope exceptions. Leases are required to be classified as either finance or operating, with classification affecting the pattern of expense recognition in the income statement.
Effective January 1, 2019, we adopted ASC 842 effective using the modified retrospective approach with the cumulative effect of the application recognized at the effective date. We elected the package of practical expedients, including the option to account for each separate lease component of a contract and its associated non-lease component as a single lease component, thus causing all fixed payments to be capitalized; and the practical expedient, which among other things, allows us to carry forward historical lease classification. Variable lease payment amounts that cannot be determined at the commencement of the lease such as increases in lease payments based on changes in index rates or usage, are not included in the operating lease ROU asset or liability. These are expensed as incurred and recorded as variable lease expense. We identified and evaluated all of our in-place leases, subleases, and contracts with a lease component, and determined that our office lease is the only lease within the scope of ASC 842. We elected the practical expedient to not apply the recognition requirements of ASC 842 to our short-term leases. We determined our long-term timber lease to be a lease of biological assets, a scope exception to ASC 842. Long-term timber lease expense is reported as land rent expense on our consolidated statements of operations. See Note 7 — Commitments and Contingencies, Obligations under Operating Leases for additional information on the long-term timber lease. Additionally, we determined that our hunting and recreational leases do not qualify as leases under ASC 842. See Note 2 — Summary of Significant Accounting Policies and Note 11 — Recreational Leases for additional information on our hunting and recreational leases.
Commitments and Contingencies
We are subject to certain commitments and contingencies with regard to certain transactions. Refer to Note 7 — Commitments and Contingencies to our accompanying consolidated financial statements for further explanation. Examples of such commitments and contingencies include:
• | Mahrt Timber Agreements; |
• | Timberland operating agreements; |
• | Obligations under operating leases; and |
• | Litigation. |
Off-Balance Sheet Arrangements
We have no off-balance sheet arrangements that are reasonably likely to have a current or future material effect on our financial condition or changes in financial condition, revenues or expenses, results of operations, liquidity, capital expenditures, or capital resources.
Subsequent Events
See Note 16 — Subsequent Events to our accompanying consolidated financial statements for details of events and transactions occurring after the year ended December 31, 2019.
ITEM 7A. | QUANTITATIVE AND QUALITATIVE DISCLOSURE ABOUT MARKET RISK |
49
As a result of our variable-rate debt facilities, we are exposed to interest rate changes. Our interest rate risk management objectives are to limit the impact of interest rate changes on earnings and cash flows and to lower our overall borrowing costs. To achieve these objectives, we have entered into interest rate swaps, and may enter into other interest rate swaps, caps, or other arrangements in order to mitigate our interest rate risk on a related financial instrument. We do not enter into derivative or interest rate transactions for speculative purposes; however, certain of our derivatives may not qualify for hedge accounting treatment. All of our debt was entered into for other than trading purposes. We manage our ratio of fixed-to-floating-rate debt with the objective of achieving a mix that we believe is appropriate in light of anticipated changes in interest rates. We closely monitor interest rates and will continue to consider the sources and terms of our borrowing facilities to determine whether we have appropriately guarded ourselves against the risk of increasing interest rates in future periods.
As of December 31, 2019, we had following debt balances outstanding under the Amended Credit Agreement:
(in thousands) | Maturity Date | |||||||
Credit Facility | Interest Rate | Outstanding Balance | ||||||
Term Loan A-1 | 12/23/2024 | LIBOR + 1.75% | $ | 100,000 | ||||
Term Loan A-2 | 12/01/2026 | LIBOR + 1.90% | 100,000 | |||||
Term Loan A-3 | 12/01/2027 | LIBOR + 2.00% | 68,619 | |||||
Term Loan A-4 | 08/22/2025 | LIBOR + 1.70% | 140,000 | |||||
Multi-Draw Term Facility | 12/01/2024 | LIBOR + 2.20% | 49,936 | |||||
Total Principal Balance | $ | 458,555 | ||||||
From January 1, 2019 through October 20, 2019, we had ten outstanding interest rate swaps on $350.0 million of our variable-rate debt. On October 21, 2019, we terminated all ten of our previously outstanding interest rate swaps and entered into two new interest rate swaps with an effective date of November 29, 2019 and a total notional amount of $275.0 million with Rabobank.
As of December 31, 2019, we had two outstanding interest rate swaps with terms below:
(in thousands) | ||||||||||||
Interest Rate Swap | Effective Date | Maturity Date | Pay Rate | Receive Rate | Notional Amount | |||||||
2019 Swap - 10YR | 11/29/2019 | 11/30/2029 | 2.2067% | one-month LIBOR | $ | 200,000 | ||||||
2019 Swap - 7YR | 11/29/2019 | 11/30/2026 | 2.083% | one-month LIBOR | $ | 75,000 | ||||||
Total | $ | 275,000 | ||||||||||
As of December 31, 2019, after consideration of the interest rate swaps, $183.6 million of our total debt outstanding was subject to variable interest rates while the remaining $275.0 million is subject to effectively fixed interest rates. A change in the market interest rate impacts the net financial instrument position of our effectively fixed-rate debt portfolio; however, it has no impact on interest incurred or cash flows.
Details of our variable-rate and effectively fixed-rate debt outstanding as of December 31, 2019, along with the corresponding average interest rates, are listed below:
Expected Maturity Date | ||||||||||||||||||||||||||||
(dollars in thousands) | 2020 | 2021 | 2022 | 2023 | 2024 | Thereafter | Total | |||||||||||||||||||||
Maturing debt: | ||||||||||||||||||||||||||||
Variable-rate debt | $ | — | $ | — | $ | — | $ | — | $ | 82,636 | $ | 100,919 | $ | 183,555 | ||||||||||||||
Effectively fixed-rate debt | $ | — | $ | — | $ | — | $ | — | $ | 67,300 | $ | 207,700 | $ | 275,000 | ||||||||||||||
Average interest rate (1): | ||||||||||||||||||||||||||||
Variable-rate debt | — | % | — | % | — | % | — | % | 3.79 | % | 3.63 | % | 3.70 | % | ||||||||||||||
Effectively fixed-rate debt | — | % | — | % | — | % | — | % | 3.98 | % | 3.98 | % | 3.98 | % | ||||||||||||||
50
(1) Inclusive of applicable spread but before considering patronage dividends.
As of December 31, 2019, the weighted-average interest rate of our outstanding debt, after consideration of the interest rate swaps, was 3.87%. A 1.0% change in interest rates would result in a change in interest expense of $1.8 million per year. The amount of effectively variable-rate debt outstanding in the future will be largely dependent upon the level of cash from operations and the rate at which we are able to deploy such proceeds toward repayment of outstanding debt, the acquisition of timberland properties, and investments in joint ventures.
ITEM 8. | FINANCIAL STATEMENTS AND SUPPLEMENTARY DATA |
The financial statements and supplementary data filed as part of this report are set forth beginning on page F-1 of this report.
ITEM 9. | CHANGES IN AND DISAGREEMENTS WITH ACCOUNTANTS ON ACCOUNTING AND FINANCIAL DISCLOSURE |
None.
ITEM 9A. | CONTROLS AND PROCEDURES |
Management’s Conclusions Regarding the Effectiveness of Disclosure Controls and Procedures
We carried out an evaluation, under the supervision and with the participation of management, including our Chief Executive Officer and Chief Financial Officer, of the effectiveness of our disclosure controls and procedures (as defined in Rule 13a-15(e) under the Exchange Act) as of the end of the period covered by this annual report. Based upon that evaluation, the Chief Executive Officer and Chief Financial Officer concluded that our disclosure controls and procedures were effective as of the end of the period covered by this annual report in providing a reasonable level of assurance that information we are required to disclose in reports that we file or submit under the Exchange Act is recorded, processed, summarized, and reported within the time periods in SEC rules and forms, including providing a reasonable level of assurance that information required to be disclosed by us in such reports is accumulated and communicated to our management, including our Chief Executive Officer and our Chief Financial Officer, as appropriate, to allow timely decisions regarding required disclosure.
Management's Report on Internal Control Over Financial Reporting
Our management is responsible for establishing and maintaining adequate internal control over financial reporting, as defined in Rules 13a-15(f) under the Exchange Act.
Because of the inherent limitations of internal control over financial reporting, including the possibility of human error, and the circumvention or overriding of controls, material misstatements may not be prevented or detected on a timely basis. In addition, projections of any evaluation of effectiveness to future periods are subject to the risks that controls may become inadequate because of changes and conditions or that the degree of compliance with policies or procedures may deteriorate. Accordingly, even internal controls determined to be effective can provide only reasonable assurance that the information required to be disclosed in reports filed under the Exchange Act is recorded, processed, summarized, and represented within the time periods required.
Our management has assessed the effectiveness of our internal control over financial reporting at December 31, 2019. To make this assessment, we used the criteria for effective internal control over financial reporting described in Internal Control-Integrated Framework issued by the Committee of Sponsoring Organizations of the Treadway Commission (2013). Based on this assessment, our management believes that, as of December 31, 2019, our system of internal control over financial reporting met those criteria, and therefore our management has concluded that we maintained effective internal control over financial reporting as of December 31, 2019.
Deloitte & Touche LLP, an independent registered public accounting firm and the auditor of our consolidated financial statements, has audited the effectiveness of our internal control over financial reporting as of December 31, 2019 and issued an attestation report. The report appears on page F-3 of this annual report on Form 10-K.
Changes in Internal Control Over Financial Reporting
There were no changes in our internal control over financial reporting during the quarter ended December 31, 2019 that have materially affected, or are reasonably likely to materially affect, our internal control over financial reporting.
ITEM 9B. | OTHER INFORMATION |
Not applicable.
PART III
We will file a definitive Proxy Statement for our 2020 Annual Meeting of Stockholders (the "2020 Proxy Statement") with the SEC, not later than 120 days after the end of our fiscal year. Accordingly, certain information required by Part III has been omitted under General Instruction G(3) to Form 10-K. Only those sections of the 2020 Proxy Statement that specifically address the items required to be set forth herein are incorporated by reference.
ITEM 10. | DIRECTORS, EXECUTIVE OFFICERS, AND CORPORATE GOVERNANCE |
Set forth below is information regarding our executive officers as of the date of this report.
Name | Age | Position(s) | |
Brian M. Davis | 50 | Chief Executive Officer, President and Director | |
Todd P. Reitz | 49 | Chief Resources Officer and Senior Vice President | |
Ursula Godoy-Arbelaez | 39 | Chief Financial Officer, Senior Vice President, and Treasurer | |
Lesley H. Solomon | 48 | General Counsel and Secretary | |
Brian M. Davis has served as our Chief Executive Officer and President since January 2020, having previously served as our President and Chief Financial Officer from April 2019 to January 2020, and as our Senior Vice President and Chief Financial Officer from March 2013 to April 2019. Mr. Davis served as our Treasurer from October 2013 to February 2018, as our Assistant Secretary from August 2013 to July 2018, and as our Secretary from July 2018 to October 2018. Mr. Davis also serves on the board of directors of the Triple T Joint Venture. Mr. Davis served as Senior Vice President and Chief Financial Officer of Wells Timberland Investment Management Organization, LLC (“Wells TIMO”) from March 2009 until October 2013 and as Vice President from October 2007 through March 2009. From 2000 until joining Wells Real Estate Funds, Inc. in 2007, Mr. Davis held various roles at Atlanta-based SunTrust Bank, delivering strategic advisory, capital-raising and financial risk-management solutions to large corporate and middle-market clients. Mr. Davis has more than 25 years of experience in business and financial services, and has held key roles in finance, treasury and strategy. Mr. Davis received his Bachelor of Business Administration and Master of Business Administration from Ohio University.
Todd P. Reitz has served as our Chief Resources Officer and Senior Vice President since January 2020, having previously served as our Senior Vice President, Forest Resources from March 2017 to January 2020. Mr. Reitz was designated as our principal operating officer in October 2018. Mr. Reitz also serves on the board of directors of the
51
Triple T Joint Venture. Mr. Reitz has more than 20 years of experience in the timber industry with extensive marketing, harvesting, silviculture and business development experience across the U.S. South from East Texas to Virginia. From 2016 to 2017, Mr. Reitz served as the Atlantic South Regional Marketing Manager for Weyerhaeuser Company with operational oversight for all log and pulpwood production from East Alabama to Virginia. Mr. Reitz served as the Director of Export Business from 2013 to 2016 and as Senior Resource Manager from 2005 to 2013 at Plum Creek Timber Company, Inc., which he joined in 1997. From 1994 to1997, Mr. Reitz worked for Stone Container Corporation, recruiting new landowners for future procurement and fiber sourcing. Mr. Reitz received his Bachelor of Science in Forest Management from Texas A&M University.
Ursula Godoy-Arbelaez has served as our Chief Financial Officer, Senior Vice President and Treasurer since January 2020, having previously served as our Vice President and Treasurer from May 2018 to January 2020, as our Treasurer from February 2018 to May 2018, and as our Director of Finance from October 2013 to May 2018. Ms. Godoy-Arbelaez also serves as the Secretary and Treasurer of the Triple T Joint Venture. Ms. Godoy-Arbelaez previously served as Director of Finance of Wells TIMO from December 2011 until October 2013, as Finance Consultant from January 2009 until December 2011, and as Senior Financial Analyst from February 2008 to January 2009. From 2002 until joining Wells TIMO in 2008, Ms. Godoy-Arbelaez worked at Wells Real Estate Funds, Inc. where she held various positions in finance, treasury and accounting. Ms. Godoy-Arbelaez received a Bachelor of Business Administration in Accounting and a Master of Business Administration in Finance from Georgia State University.
Lesley H. Solomon has served as our General Counsel since September 2018 and as our Secretary since October 2018. Prior to that, Ms. Solomon was an attorney with Alston & Bird LLP for 20 years, as a partner from 2006 to 2018 and as an associate from 1998 to 2006. At Alston & Bird, Ms. Solomon represented public and private companies as well as investment banks in equity and debt financings and mergers and acquisitions, specializing in working with REITs and financial institutions. Ms. Solomon received her J.D. from the Georgetown University Law Center and her Bachelor of Arts from Duke University.
The other information required by this Item is incorporated by reference from the following sections of our 2020 Proxy Statement:
• | "Your Board of Directors — Proposal No. 1: Election of Directors — Director Nominees," |
• | "Your Board of Directors — Board Committees — Audit Committee." |
• | "Stock Ownership", and |
• | "Corporate Governance — Code of Business Conduct and Ethics." |
ITEM 11. | EXECUTIVE COMPENSATION |
The information required by this Item is incorporated by reference to the following sections of our 2020 Proxy Statement:
• | "Executive Compensation — Report of the Compensation Committee," |
• | "Executive Compensation — Compensation Discussion and Analysis," and |
• | "Executive Compensation — Summary of Executive Compensation." |
ITEM 12. | SECURITY OWNERSHIP OF CERTAIN BENEFICIAL OWNERS AND MANAGEMENT AND RELATED STOCKHOLDER MATTERS |
The information required by this Item is incorporated by reference to the following sections of our 2020 Proxy Statement:
• | "Executive Compensation — Summary of Executive Compensation," and |
• | "Stock Ownership." |
ITEM 13. | CERTAIN RELATIONSHIPS AND RELATED TRANSACTION, AND DIRECTOR INDEPENDENCE |
The information required by this Item is incorporated by reference to the following sections of our 2020 Proxy Statement:
• | "Corporate Governance — Related Person Transactions Policy," and |
• | "Corporate Governance — Director Independence." |
ITEM 14 | PRINCIPAL ACCOUNTANT FEES AND SERVICES |
The information required by this Item is incorporated by reference to the following sections of our 2020 Proxy Statement:
• | "Audit Committee Matters — Principal Auditor Fees," and |
• | "Audit Committee Matters — Preapproval Policies." |
52
PART IV
ITEM 15. | EXHIBITS AND FINANCIAL STATEMENT SCHEDULES |
(a) 1. Below is a list of the financial statements filed herewith.
Financial Statements | Page | |
2. All financial statement schedules have been omitted because they are not applicable, not material, or the required information is shown in the consolidated financial statements or the notes thereto.
3. The Exhibits listed below are provided in response to Item 601 of Regulation S-K. Exhibits not filed or furnished herewith are incorporated by reference to exhibits previously filed with the SEC. Our Current, Quarterly, and Annual Reports are filed with the SEC under File No. 001-36239. Our Registration Statements have the file numbers noted wherever such registration statements are identified in the following list of exhibits. We will furnish a copy of any exhibit to stockholders without charge upon written request to Investor Relations.
Exhibit Number | Description | |
3.1 | ||
3.2 | ||
3.3 | ||
3.4 | ||
53
Exhibit Number | Description | |
3.5 | ||
3.6 | ||
3.7 | ||
4.1 | ||
10.1 | ||
10.2 | ||
10.3+ | ||
10.4+ | ||
10.5+ | ||
10.6+ | ||
10.7+ | ||
10.8+ | ||
10.9+ | ||
10.10+ | ||
10.11+* | ||
10.12+* | ||
10.13+* | ||
10.14+* | ||
10.15+ | ||
54
Exhibit Number | Description | |
10.31 | ||
10.32 | ||
10.33 | ||
10.34 | ||
55
10.53^ | ||
10.54^ | ||
21.1* | ||
23.1* | ||
23.2* | ||
31.1* | ||
56
Exhibit Number | Description | |
31.2* | ||
32.1* | ||
99.1* | ||
101.INS* | XBRL Instance Document | |
101.SCH* | XBRL Taxonomy Extension Schema Document | |
101.CAL* | XBRL Taxonomy Extension Calculation Linkbase Document | |
101.DEF* | XBRL Taxonomy Extension Definition Linkbase Document | |
101.LAB* | XBRL Taxonomy Extension Label Linkbase Document | |
101.PRE* | XBRL Taxonomy Extension Presentation Linkbase Document | |
* | Filed herewith. | |
+ | Management contract or compensatory plan or arrangement. | |
^ | Confidential treatment requested as to portions of the exhibit. Confidential materials omitted and filed separately with the SEC. | |
(b) See (a) 3 above.
(c) See (a) 2 above.
ITEM 16. | FORM 10-K SUMMARY |
None.
57
SIGNATURES
Pursuant to the requirements of Sections 13 or 15(d) of the Securities Exchange Act of 1934, the Registrant has duly caused this report to be signed on its behalf by the undersigned, thereunto duly authorized this 28th day of February 2020.
CATCHMARK TIMBER TRUST, INC. (Registrant) | ||||
Date: | February 28, 2020 | By: | /s/ BRIAN M. DAVIS | |
Brian M. Davis Chief Executive Officer and President | ||||
Signature | Title | Date | ||
/S/ BRIAN M. DAVIS | Chief Executive Officer, President and Director | February 28, 2020 | ||
Brian M. Davis | (Principal Executive Officer) | |||
/S/ URSULA GODOY-ARBELAEZ | Chief Financial Officer, Senior Vice President and Treasurer | February 28, 2020 | ||
Ursula Godoy-Arbelaez | (Principal Financial Officer and Principal Accounting Officer) | |||
/S/ WILLIS J. POTTS, JR. | Chairman of the Board | February 28, 2020 | ||
Willis J. Potts, Jr. | ||||
/S/ PAUL S. FISHER | Independent Director | February 28, 2020 | ||
Paul S. Fisher | ||||
/S/ MARY E. MCBRIDE | Independent Director | February 28, 2020 | ||
Mary E. McBride | ||||
/S/ DONALD S. MOSS | Independent Director | February 28, 2020 | ||
Donald S. Moss | ||||
/S/ DOUGLAS D. RUBENSTEIN | Independent Director | February 28, 2020 | ||
Douglas D. Rubenstein | ||||
58
INDEX TO CONSOLIDATED FINANCIAL STATEMENTS
Financial Statements | Page | |
F- 1
REPORT OF INDEPENDENT REGISTERED PUBLIC ACCOUNTING FIRM
To the stockholders and the Board of Directors of CatchMark Timber Trust, Inc.
Opinion on the Financial Statements
We have audited the accompanying consolidated balance sheets of CatchMark Timber Trust, Inc. and subsidiaries (the "Company") as of December 31, 2019 and 2018, the related consolidated statements of operations, comprehensive loss, equity, and cash flows, for each of the three years in the period ended December 31, 2019, and the related notes (collectively referred to as the "financial statements"). In our opinion, the financial statements present fairly, in all material respects, the financial position of the Company as of December 31, 2019 and 2018, and the results of its operations and its cash flows for each of the three years in the period ended December 31, 2019, in conformity with accounting principles generally accepted in the United States of America.
We have also audited, in accordance with the standards of the Public Company Accounting Oversight Board (United States) (PCAOB), the Company's internal control over financial reporting as of December 31, 2019, based on criteria established in Internal Control - Integrated Framework (2013) issued by the Committee of Sponsoring Organizations of the Treadway Commission and our report dated February 28, 2020, expressed an unqualified opinion on the Company's internal control over financial reporting.
Basis for Opinion
These financial statements are the responsibility of the Company's management. Our responsibility is to express an opinion on the Company's financial statements based on our audits. We are a public accounting firm registered with the PCAOB and are required to be independent with respect to the Company in accordance with the U.S. federal securities laws and the applicable rules and regulations of the Securities and Exchange Commission and the PCAOB.
We conducted our audits in accordance with the standards of the PCAOB. Those standards require that we plan and perform the audit to obtain reasonable assurance about whether the financial statements are free of material misstatement, whether due to error or fraud. Our audits included performing procedures to assess the risks of material misstatement of the financial statements, whether due to error or fraud, and performing procedures that respond to those risks. Such procedures included examining, on a test basis, evidence regarding the amounts and disclosures in the financial statements. Our audits also included evaluating the accounting principles used and significant estimates made by management, as well as evaluating the overall presentation of the financial statements. We believe that our audits provide a reasonable basis for our opinion.
/s/ Deloitte & Touche LLP
Atlanta, GA
February 28, 2020
We have served as the Company's auditor since 2005.
F- 2
REPORT OF INDEPENDENT REGISTERED PUBLIC ACCOUNTING FIRM
To the stockholders and the Board of Directors of CatchMark Timber Trust, Inc.
Opinion on Internal Control over Financial Reporting
We have audited the internal control over financial reporting of CatchMark Timber Trust, Inc. and subsidiaries (the “Company”) as of December 31, 2019, based on criteria established in Internal Control - Integrated Framework (2013) issued by the Committee of Sponsoring Organizations of the Treadway Commission (COSO). In our opinion, the Company maintained, in all material respects, effective internal control over financial reporting as of December 31, 2019, based on criteria established in Internal Control - Integrated Framework (2013) issued by COSO.
We have also audited, in accordance with the standards of the Public Company Accounting Oversight Board (United States) (PCAOB), the consolidated financial statements as of and for the year ended December 31, 2019, of the Company and our report dated February 28, 2020, expressed an unqualified opinion on those financial statements.
Basis for Opinion
The Company’s management is responsible for maintaining effective internal control over financial reporting and for its assessment of the effectiveness of internal control over financial reporting, included in the accompanying Management's Report on Internal Control over Financial Reporting. Our responsibility is to express an opinion on the Company’s internal control over financial reporting based on our audit. We are a public accounting firm registered with the PCAOB and are required to be independent with respect to the Company in accordance with the U.S. federal securities laws and the applicable rules and regulations of the Securities and Exchange Commission and the PCAOB.
We conducted our audit in accordance with the standards of the PCAOB. Those standards require that we plan and perform the audit to obtain reasonable assurance about whether effective internal control over financial reporting was maintained in all material respects. Our audit included obtaining an understanding of internal control over financial reporting, assessing the risk that a material weakness exists, testing and evaluating the design and operating effectiveness of internal control based on the assessed risk, and performing such other procedures as we considered necessary in the circumstances. We believe that our audit provides a reasonable basis for our opinion.
Definition and Limitations of Internal Control over Financial Reporting
A company’s internal control over financial reporting is a process designed to provide reasonable assurance regarding the reliability of financial reporting and the preparation of financial statements for external purposes in accordance with generally accepted accounting principles. A company’s internal control over financial reporting includes those policies and procedures that (1) pertain to the maintenance of records that, in reasonable detail, accurately and fairly reflect the transactions and dispositions of the assets of the company; (2) provide reasonable assurance that transactions are recorded as necessary to permit preparation of financial statements in accordance with generally accepted accounting principles, and that receipts and expenditures of the company are being made only in accordance with authorizations of management and directors of the company; and (3) provide reasonable assurance regarding prevention or timely detection of unauthorized acquisition, use, or disposition of the company’s assets that could have a material effect on the financial statements.
Because of its inherent limitations, internal control over financial reporting may not prevent or detect misstatements. Also, projections of any evaluation of effectiveness to future periods are subject to the risk that controls may become inadequate because of changes in conditions, or that the degree of compliance with the policies or procedures may deteriorate.
/s/ Deloitte & Touche LLP
Atlanta, GA
February 28, 2020
F- 3
CATCHMARK TIMBER TRUST, INC. AND SUBSIDIARIES
CONSOLIDATED BALANCE SHEETS
(in thousands, except for per-share amounts)
December 31, | |||||||
2019 | 2018 | ||||||
Assets: | |||||||
Cash and cash equivalents | $ | 11,487 | $ | 5,614 | |||
Accounts receivable | 7,998 | 7,355 | |||||
Prepaid expenses and other assets | 5,459 | 7,369 | |||||
Operating lease right-of-use asset, less accumulated amortization of $280 as of December 31, 2019 (Note 2) | 3,120 | — | |||||
Deferred financing costs | 246 | 327 | |||||
Timber assets (Note 3): | |||||||
Timber and timberlands, net | 633,581 | 687,851 | |||||
Intangible lease assets, less accumulated amortization of $948 and $945 as of December 31, 2019 and 2018, respectively | 9 | 12 | |||||
Investments in unconsolidated joint ventures (Note 4) | 1,965 | 96,244 | |||||
Total assets | $ | 663,865 | $ | 804,772 | |||
Liabilities: | |||||||
Accounts payable and accrued expenses | $ | 3,580 | $ | 4,936 | |||
Operating lease liability (Note 2) | 3,242 | — | |||||
Other liabilities | 10,853 | 5,940 | |||||
Notes payable and lines of credit, net of deferred financing costs (Note 5) | 452,987 | 472,240 | |||||
Total liabilities | 470,662 | 483,116 | |||||
Commitments and Contingencies (Note 7) | — | — | |||||
Stockholders’ Equity: | |||||||
Class A common stock, $0.01 par value; 900,000 shares authorized; 49,008 and 49,127 shares issued and outstanding as of December 31, 2019 and 2018, respectively | 490 | 492 | |||||
Additional paid-in capital | 729,274 | 730,416 | |||||
Accumulated deficit and distributions | (528,847 | ) | (409,260 | ) | |||
Accumulated other comprehensive income (loss) | (8,276 | ) | 8 | ||||
Total stockholders’ equity | 192,641 | 321,656 | |||||
Noncontrolling interests | 562 | — | |||||
Total equity | $ | 193,203 | $ | 321,656 | |||
Total liabilities and equity | $ | 663,865 | $ | 804,772 | |||
See accompanying notes.
F- 4
CATCHMARK TIMBER TRUST, INC. AND SUBSIDIARIES
CONSOLIDATED STATEMENTS OF OPERATIONS
(in thousands, except for per-share amounts)
Years Ended December 31, | |||||||||||
2019 | 2018 | 2017 | |||||||||
Revenues: | |||||||||||
Timber sales | $ | 72,557 | $ | 69,455 | $ | 71,353 | |||||
Timberland sales | 17,572 | 17,520 | 14,768 | ||||||||
Asset management fees | 11,948 | 5,603 | 108 | ||||||||
Other revenues | 4,632 | 5,279 | 5,066 | ||||||||
106,709 | 97,857 | 91,295 | |||||||||
Expenses: | |||||||||||
Contract logging and hauling costs | 31,129 | 31,469 | 31,108 | ||||||||
Depletion | 28,064 | 25,912 | 29,035 | ||||||||
Cost of timberland sales | 15,067 | 13,512 | 10,423 | ||||||||
Forestry management expenses | 6,691 | 6,283 | 6,758 | ||||||||
General and administrative expenses | 13,300 | 12,425 | 11,660 | ||||||||
Land rent expense | 524 | 660 | 621 | ||||||||
Other operating expenses | 6,460 | 6,303 | 5,264 | ||||||||
101,235 | 96,564 | 94,869 | |||||||||
Other income (expense): | |||||||||||
Interest income | 204 | 262 | 113 | ||||||||
Interest expense | (18,616 | ) | (16,255 | ) | (11,187 | ) | |||||
Gain (loss) on large dispositions | 7,961 | (390 | ) | — | |||||||
(10,451 | ) | (16,383 | ) | (11,074 | ) | ||||||
Loss before unconsolidated joint ventures and income taxes | (4,977 | ) | (15,090 | ) | (14,648 | ) | |||||
Income (loss) from unconsolidated joint ventures | (89,471 | ) | (106,917 | ) | 1,138 | ||||||
Net loss before income taxes | (94,448 | ) | (122,007 | ) | (13,510 | ) | |||||
Income tax benefit (Note 12) | 1,127 | — | — | ||||||||
Net loss | $ | (93,321 | ) | $ | (122,007 | ) | $ | (13,510 | ) | ||
Weighted-average common shares outstanding —basic and diluted | 49,038 | 47,937 | 39,751 | ||||||||
Net loss per share - basic and diluted | $ | (1.90 | ) | $ | (2.55 | ) | $ | (0.34 | ) | ||
See accompanying notes.
F- 5
CATCHMARK TIMBER TRUST, INC. AND SUBSIDIARIES
CONSOLIDATED STATEMENTS OF COMPREHENSIVE LOSS
(in thousands)
Years Ended December 31, | |||||||||||
2019 | 2018 | 2017 | |||||||||
Net loss | $ | (93,321 | ) | $ | (122,007 | ) | $ | (13,510 | ) | ||
Other comprehensive income (loss): | |||||||||||
Market value adjustment to interest rate swaps | (8,284 | ) | (2,368 | ) | 629 | ||||||
Comprehensive loss | $ | (101,605 | ) | $ | (124,375 | ) | $ | (12,881 | ) | ||
See accompanying notes.
F- 6
CATCHMARK TIMBER TRUST, INC. AND SUBSIDIARIES
CONSOLIDATED STATEMENTS OF EQUITY
(in thousands, except for per-share amounts)
Common Stock | Additional Paid-In Capital | Accumulated Deficit and Distributions | Accumulated Other Comprehensive Income (Loss) | Total Stockholders’ Equity | Noncontrolling Interests | Total Equity | ||||||||||||||||||||||||
Shares | Amount | |||||||||||||||||||||||||||||
Balance, December 31, 2016 | 38,797 | $ | 388 | $ | 605,728 | $ | (226,793 | ) | $ | 1,747 | $ | 381,070 | $ | — | $ | 381,070 | ||||||||||||||
Issuance of common stock pursuant to: | ||||||||||||||||||||||||||||||
Equity offering | 4,600 | 46 | 56,764 | — | — | 56,810 | — | 56,810 | ||||||||||||||||||||||
LTIP, net of forfeitures and amounts withheld for income taxes | 125 | 1 | 2,474 | — | $ | — | 2,475 | — | 2,475 | |||||||||||||||||||||
Stock issuance cost | — | — | (2,709 | ) | — | $ | — | (2,709 | ) | — | (2,709 | ) | ||||||||||||||||||
Dividends on common stock ($0.54 per share) | — | — | — | (21,349 | ) | $ | — | (21,349 | ) | — | (21,349 | ) | ||||||||||||||||||
Repurchase of common stock | (97 | ) | (1 | ) | (1,035 | ) | — | $ | — | (1,036 | ) | — | (1,036 | ) | ||||||||||||||||
Net loss | — | — | — | (13,510 | ) | — | (13,510 | ) | — | (13,510 | ) | |||||||||||||||||||
Other comprehensive income | — | — | — | — | 629 | 629 | — | 629 | ||||||||||||||||||||||
Balance, December 31, 2017 | 43,425 | $ | 434 | $ | 661,222 | $ | (261,652 | ) | $ | 2,376 | $ | 402,380 | $ | — | $ | 402,380 | ||||||||||||||
Issuance of common stock pursuant to: | ||||||||||||||||||||||||||||||
Equity offering | 5,750 | 58 | 72,392 | — | — | 72,450 | — | 72,450 | ||||||||||||||||||||||
LTIP, net of forfeitures and amounts withheld for income taxes | 50 | 1 | 1,341 | — | — | 1,342 | — | 1,342 | ||||||||||||||||||||||
Stock issuance cost | (3,537 | ) | (3,537 | ) | — | (3,537 | ) | |||||||||||||||||||||||
Dividends on common stock ($0.54 per share) | — | — | — | (25,601 | ) | — | (25,601 | ) | — | (25,601 | ) | |||||||||||||||||||
Repurchase of common stock | (98 | ) | (1 | ) | (1,002 | ) | — | — | (1,003 | ) | — | (1,003 | ) | |||||||||||||||||
Net loss | — | — | — | (122,007 | ) | — | (122,007 | ) | — | (122,007 | ) | |||||||||||||||||||
Other comprehensive loss | — | — | — | — | (2,368 | ) | (2,368 | ) | — | (2,368 | ) | |||||||||||||||||||
Balance, December 31, 2018 | 49,127 | $ | 492 | $ | 730,416 | $ | (409,260 | ) | $ | 8 | $ | 321,656 | $ | — | $ | 321,656 | ||||||||||||||
Issuance of common stock pursuant to: | ||||||||||||||||||||||||||||||
LTIP, net of forfeitures and amounts withheld for income taxes | 210 | 2 | 1,858 | — | — | 1,860 | 565 | 2,425 | ||||||||||||||||||||||
Dividends/distributions on common stock/limited partnership units ($0.54 per share/unit) | — | — | — | (26,266 | ) | — | (26,266 | ) | (3 | ) | (26,269 | ) | ||||||||||||||||||
Repurchase of common stock | (329 | ) | (4 | ) | (3,000 | ) | — | — | (3,004 | ) | — | (3,004 | ) | |||||||||||||||||
Net loss | — | — | — | (93,321 | ) | — | (93,321 | ) | — | (93,321 | ) | |||||||||||||||||||
Other comprehensive loss | — | — | — | — | (8,284 | ) | (8,284 | ) | — | (8,284 | ) | |||||||||||||||||||
Balance, December 31, 2019 | 49,008 | $ | 490 | $ | 729,274 | $ | (528,847 | ) | $ | (8,276 | ) | $ | 192,641 | $ | 562 | $ | 193,203 | |||||||||||||
See accompanying notes.
F- 7
CATCHMARK TIMBER TRUST, INC. AND SUBSIDIARIES
CONSOLIDATED STATEMENTS OF CASH FLOWS
(in thousands)
Years Ended December 31, | |||||||||||
2019 | 2018 | 2017 | |||||||||
Cash Flows from Operating Activities: | |||||||||||
Net loss | $ | (93,321 | ) | $ | (122,007 | ) | $ | (13,510 | ) | ||
Adjustments to reconcile net loss to net cash provided by operating activities: | |||||||||||
Depletion | 28,064 | 25,912 | 29,035 | ||||||||
Basis of timberland sold, lease terminations and other | 14,964 | 13,053 | 10,112 | ||||||||
Stock-based compensation expense | 2,790 | 2,689 | 2,786 | ||||||||
Noncash interest expense | 1,559 | 2,612 | 1,094 | ||||||||
Other amortization | 227 | 210 | 176 | ||||||||
Gain (loss) from large dispositions | (7,961 | ) | 390 | — | |||||||
Income (loss) from unconsolidated joint ventures | 89,471 | 106,917 | (1,138 | ) | |||||||
Operating distributions from unconsolidated joint ventures | 978 | 3,771 | — | ||||||||
Income tax benefit | (1,127 | ) | — | — | |||||||
Interest paid under swaps with other-than-insignificant financing element | 115 | — | — | ||||||||
Changes in assets and liabilities: | |||||||||||
Accounts receivable | (1,473 | ) | (3,449 | ) | (1,208 | ) | |||||
Prepaid expenses and other assets | 256 | (260 | ) | 160 | |||||||
Accounts payable and accrued expenses | (1,309 | ) | 122 | 279 | |||||||
Other liabilities | (291 | ) | (164 | ) | (367 | ) | |||||
Net cash provided by operating activities | 32,942 | 29,796 | 27,419 | ||||||||
Cash Flows from Investing Activities: | |||||||||||
Timberland acquisitions and earnest money paid | (1,973 | ) | (91,821 | ) | (52,260 | ) | |||||
Capital expenditures (excluding timberland acquisitions) | (4,178 | ) | (4,571 | ) | (5,617 | ) | |||||
Investment in unconsolidated joint ventures | — | (200,000 | ) | (10,539 | ) | ||||||
Distributions from unconsolidated joint ventures | 3,830 | 4,744 | — | ||||||||
Net proceeds from large dispositions | 25,151 | 79,134 | — | ||||||||
Net cash provided by (used in) investing activities | 22,830 | (212,514 | ) | (68,416 | ) | ||||||
Cash Flows from Financing Activities: | |||||||||||
Proceeds from notes payable | — | 289,000 | 304,119 | ||||||||
Repayment of notes payable | (20,064 | ) | (148,000 | ) | (292,156 | ) | |||||
Financing costs paid | (82 | ) | (1,434 | ) | (3,674 | ) | |||||
Issuance of common stock | — | 72,450 | 56,810 | ||||||||
Interest paid under swaps with other-than-insignificant financing element | (115 | ) | — | — | |||||||
Dividends / distributions paid | (26,269 | ) | (25,601 | ) | (21,349 | ) | |||||
Repurchase of common shares under the share repurchase program | (3,004 | ) | (1,003 | ) | (1,036 | ) | |||||
Repurchase of common shares for minimum tax withholdings | (365 | ) | (1,348 | ) | (311 | ) | |||||
Other offering costs paid | — | (3,537 | ) | (2,709 | ) | ||||||
Net cash provided by (used in) financing activities | (49,899 | ) | 180,527 | 39,694 | |||||||
Net change in cash and cash equivalents | 5,873 | (2,191 | ) | (1,303 | ) | ||||||
Cash and cash equivalents, beginning of period | 5,614 | 7,805 | 9,108 | ||||||||
Cash and cash equivalents, end of period | $ | 11,487 | $ | 5,614 | $ | 7,805 | |||||
See accompanying notes.
F- 8
CATCHMARK TIMBER TRUST, INC. AND SUBSIDIARIES
NOTES TO CONSOLIDATED FINANCIAL STATEMENTS
DECEMBER 31, 2019, 2018, AND 2017
1. | Organization |
CatchMark Timber Trust, Inc. ("CatchMark Timber Trust") (NYSE: CTT) owns and operates timberlands located in the United States and has elected to be taxed as a REIT for federal income tax purposes. CatchMark Timber Trust acquires, owns, operates, manages, and disposes of timberland directly, through wholly-owned subsidiaries, or through joint ventures. CatchMark Timber Trust was incorporated in Maryland in 2005 and commenced operations in 2007. CatchMark Timber Trust conducts substantially all of its business through CatchMark Timber Operating Partnership, L.P. (“CatchMark Timber OP”), a Delaware limited partnership. CatchMark Timber Trust is the general partner of CatchMark Timber OP, possesses full legal control and authority over its operations, and owns 99.99% of its common partnership units. CatchMark LP Holder, LLC (“CatchMark LP Holder”), a Delaware limited liability company and wholly-owned subsidiary of CatchMark Timber Trust, is the sole limited partner of CatchMark Timber OP and owns the remaining 0.01% of its common partnership units. In addition, CatchMark Timber TRS, Inc. (“CatchMark TRS”), a Delaware corporation formed as a wholly owned subsidiary of CatchMark Timber OP in 2006, is our taxable REIT subsidiary. Unless otherwise noted, references herein to CatchMark shall include CatchMark Timber Trust and all of its subsidiaries, including CatchMark Timber OP, and the subsidiaries of CatchMark Timber OP, including CatchMark TRS.
2. Summary of Significant Accounting Policies
Basis of Presentation and Principles of Consolidation
The consolidated financial statements of CatchMark have been prepared in accordance with GAAP and include the accounts of CatchMark and any VIE in which CatchMark is deemed the primary beneficiary. With respect to entities that are not VIEs, CatchMark’s consolidated financial statements also include the accounts of any entity in which CatchMark owns a controlling financial interest and any limited partnership in which CatchMark owns a controlling general partnership interest. In determining whether a controlling interest exists, CatchMark considers, among other factors, the ownership of voting interests, protective rights, and participatory rights of the investors. All intercompany balances and transactions have been eliminated in consolidation.
Use of Estimates
The preparation of the accompanying consolidated financial statements in conformity with GAAP requires management to make estimates and assumptions that affect the amounts reported in the consolidated financial statements and notes. Actual results could differ from those estimates.
Fair Value Measurements
CatchMark estimates the fair value of its assets and liabilities where currently required under GAAP consistent with the provisions of the accounting standard for fair value measurements and disclosures. Under this guidance, fair value is defined as the price that would be received to sell an asset or paid to transfer a liability in an orderly transaction between market participants at the measurement date. While various techniques and assumptions can be used to estimate fair value depending on the nature of the asset or liability, the accounting standard for fair value measurements and disclosures provides the following fair value technique parameters and hierarchy, depending on availability:
Level 1 — Assets or liabilities for which the identical term is traded on an active exchange, such as publicly-traded instruments or futures contracts.
Level 2 — Assets and liabilities valued based on observable market data for similar instruments.
Level 3 — Assets or liabilities for which significant valuation assumptions are not readily observable in the market. Such assets or liabilities are valued based on the best available data, some of which may
F- 9
be internally developed. Significant assumptions may include risk premiums that a market participant would require.
Cash and Cash Equivalents
CatchMark considers all highly liquid investments purchased with an original maturity of three months or less to be cash equivalents. Cash equivalents may include cash and short-term investments. Short-term investments are stated at cost, which approximates fair value and may consist of investments in money market accounts.
Accounts Receivable
Accounts receivable mainly consists of timber sales receivable, asset management fees receivable, and patronage dividends receivable. Accounts receivable are recorded at the original amount earned, net of allowances for doubtful accounts, which approximates fair value. Accounts receivable are deemed past due based on their respective payment terms. Management assesses the realizability of accounts receivable on an ongoing basis and provides for allowances as such balances, or portions thereof, become uncollectible. As of December 31, 2019, accounts receivable balance included $3.8 million of estimated patronage dividends due from our lenders, which we expect to receive in March 2020, and $2.8 million of asset management fees from the Triple T Joint Venture, which was received in January 2020. See Note 5 — Notes Payable and Lines of Credit for further information regarding the patronage dividends and Note 4 — Unconsolidated Joint Ventures for further information regarding asset management fees earned from the Triple T Joint Venture.
Prepaid Expenses and Other Assets
Prepaid expenses and other assets are generally comprised of fair value of interest rate swaps, earnest money, equity in patronage banks, prepaid insurance, prepaid rent, deferred tax asset, prepaid operating costs, fixed assets, and deferred costs associated with pending acquisitions. Prepaid expenses are expensed over the applicable usage period or reclassified to other asset accounts upon being put into service in future periods. Balances without future economic benefit are written off as they are identified.
Deferred Financing Costs
Deferred financing costs are comprised of costs incurred in connection with securing financing from third-party lenders and are capitalized and amortized on a straight-line basis (which approximates the effective interest rate method) over the terms of the related financing arrangements. Deferred financing costs relating to term loans and the multi-draw term facility are presented as a direct deduction from the carrying amount of the related debt liability on the accompanying consolidated balance sheets and costs associated with the revolving credit facility are presented as an asset on the accompanying consolidated balance sheets.
For further information regarding CatchMark's credit agreements, outstanding balance of debt and associated deferred financing costs, please refer to Note 5 — Notes Payable and Lines of Credit. CatchMark recognized amortization of deferred financing costs for the years ended December 31, 2019, 2018, and 2017 of $1.0 million, $2.6 million, and $1.0 million, respectively, which is included in interest expense in the accompanying consolidated statements of operations.
Timber Assets
Timber and timberlands, including logging roads, are stated at cost less accumulated depletion for timber harvested and accumulated road amortization. CatchMark capitalizes timber and timberland purchases. Reforestation costs, including all costs associated with stand establishment, such as site preparation, cost of seedlings, fertilization, and herbicide application, are capitalized and tracked as premerchantable timber assets by vintage year. Annually, capitalized reforestation costs for timber that has reached a merchantable age is reclassified into merchantable timber inventory and are depleted as harvested. Timber carrying costs, such as real estate taxes, insect control, wildlife control, leases of timberlands, and forestry management personnel salaries and fringe benefits, are expensed as incurred. Costs
F- 10
of major roads are capitalized and amortized over their estimated useful lives. Costs of roads built to access multiple logging sites over numerous years are capitalized and amortized over seven years. Costs of roads built to access a single logging site are expensed as incurred.
Depletion
CatchMark recognizes depletion expense as timber is harvested using the straight-line method. Depletion rates are established at least annually by dividing the remaining merchantable timber inventory book value by current merchantable timber inventory volume. Management believes that the straight-line method is preferable as it is based on the actual costs recorded and actual merchantable timber volume as of the date that the depletion rates are determined.
Evaluating the Recoverability of Timber Assets
CatchMark continually monitors events and changes in circumstances that could indicate that the carrying amounts of the timber assets in which CatchMark has an ownership interest may not be recoverable. When indicators of potential impairment are present that suggest that the carrying amounts of timber assets may not be recoverable, CatchMark assesses the recoverability of these assets by determining whether the carrying value will be recovered through the undiscounted future operating cash flows expected from the use of the asset and its eventual disposition. Impairment losses would be recognized for (i) long-lived assets used in CatchMark’s operations when the carrying value of such assets exceeds the undiscounted cash flows estimated to be generated from the future operations of those assets, and (ii) long-lived assets held for sale when the carrying value of such assets exceeds an amount equal to their fair value less selling costs. Estimated fair values are calculated based on the following information in order of preference, dependent upon availability: (i) recently quoted market prices, (ii) market prices for comparable properties, or (iii) the present value of undiscounted cash flows, including estimated salvage value. CatchMark intends to use one harvest cycle for the purpose of evaluating the recoverability of timber and timberlands used in its operations. Future cash flow estimates are based on discounted probability-weighted projections for a range of possible outcomes. CatchMark generally considers assets to be held for sale at the point at which a sale contract is executed, the buyer has made a significant non-refundable earnest money deposit against the contracted purchase price and there is a high degree of certainty a transaction will close. CatchMark has determined that there has been no impairment of its long-lived assets to date.
Allocation of Purchase Price of Acquired Assets
Upon the acquisition of timberland properties, CatchMark allocates the purchase price to tangible assets, consisting of timberland and timber, and identified intangible assets and liabilities, which may include values associated with in-place leases or supply agreements, based in each case on management’s estimate of their fair values. The values of tangible assets are then allocated to timberland and timber based on management’s determination of the relative fair value of these assets.
Intangible Lease Assets
In-place ground leases with CatchMark as the lessee have value associated with effective contractual rental rates that are below market rates. Such values are calculated based on the present value (using a discount rate that reflects the risks associated with the leases acquired) of the difference between (i) the contractual amounts to be paid pursuant to the in-place lease and (ii) management’s estimate of fair market lease rates for the corresponding in-place lease, measured over a period equal to the remaining terms of the leases. The capitalized below-market in-place lease values are recorded as intangible lease assets and are amortized as adjustments to land rent expense over the weighted-average remaining term of the respective leases.
Investments in Unconsolidated Joint Ventures
For joint ventures that it does not control but exercises significant influence, CatchMark uses the equity method of accounting. CatchMark's judgment about its level of influence or control of an entity involves consideration of various factors including the form of its ownership interest; its representation in the entity's governance; its ability to participate
F- 11
in policy-making decisions; and the rights of other investors to participate in the decision-making process, to replace CatchMark as manager, and/or to liquidate the venture. Under the equity method, the investment in a joint venture is recorded at cost and adjusted for equity in earnings and cash contributions and distributions. Income or loss and cash distributions from an unconsolidated joint venture are allocated according to the provisions of the respective joint venture agreement, which may be different from its stated ownership percentage. Any difference between the carrying amount of these investments on CatchMark’s balance sheets and the underlying equity in net assets on the joint venture’s balance sheets is adjusted as the related underlying assets are depreciated, amortized, or sold. Distributions received from unconsolidated joint ventures are classified in the accompanying consolidated statements of cash flows using the
cumulative earnings approach under which distributions received in an amount equal to cumulative equity in earnings are classified as cash inflows from operating activities and distributions received in excess of cumulative equity in earnings represent returns of investment and therefore are classified as cash inflows from investing activities.
CatchMark evaluates the recoverability of its investments in unconsolidated joint ventures in accordance with accounting standards for equity investments by first reviewing each investment for any indicators of impairment. If indicators are present, CatchMark estimates the fair value of the investment. If the carrying value of the investment is greater than the estimated fair value, management assesses whether the impairment is “temporary” or “other-than-temporary.” In making this assessment, management considers the following: (1) the length of time and the extent to which fair value has been less than cost, (2) the financial condition and near-term prospects of the entity, and (3) CatchMark’s intent and ability to retain its interest long enough for a recovery in market value. If management concludes that the impairment is "other than temporary," CatchMark reduces the investment to its estimated fair value.
For information on CatchMark’s unconsolidated joint ventures, which are accounted for using the equity method of
accounting, see Note 4 — Unconsolidated Joint Ventures.
Fair Value of Debt Instruments
CatchMark applies the provisions of the accounting standard for fair value measurements and disclosures in estimations of fair value of its debt instruments based on Level 2 assumptions. The fair value of the outstanding notes payable was estimated based on discounted cash flow analysis using the current observable market borrowing rates for similar types of borrowing arrangements as of the measurement date. The discounted cash flow method of assessing fair value results in a general approximation of book value, and such value may never actually be realized.
Interest Rate Swaps
CatchMark has entered into interest rate swaps to mitigate its exposure to changing interest rates on its variable rate debt instruments. CatchMark does not enter into derivative or interest rate transactions for speculative purposes; however, certain of its derivatives may not qualify for hedge accounting treatment. The fair values of interest rate swaps are recorded as either prepaid expenses and other assets or other liabilities in the accompanying consolidated balance sheets. Changes in the fair value of the interest rate swaps that are designated as hedges are recorded as other comprehensive income (loss). Changes in the fair value of interest rate swaps that do not qualify for hedge accounting treatment are recorded as gain (loss) on interest rate swap in the consolidated statements of operations. Amounts received or paid under interest rate swaps are recorded as interest expense for contracts that qualify for hedge accounting treatment and as gain (loss) on interest rate swaps for contracts that do not qualify for hedge accounting treatment.
CatchMark applied the provisions of the accounting standard for fair value measurements and disclosures in recording its interest rate swaps at fair value. The fair value of the interest rate swaps, classified under Level 2, was determined using a third-party proprietary model that is based on prevailing market data for contracts with matching durations, current and anticipated LIBOR information, consideration of CatchMark's credit standing, credit risk of counterparties, and reasonable estimates about relevant future market conditions.
Common Stock
The par value of CatchMark’s issued and outstanding shares of common stock is recorded as common stock. The remaining gross proceeds, net of offering costs, are recorded as additional paid-in capital.
F- 12
Revenue Recognition
Effective January 1, 2018, CatchMark adopted ASU 2014-09, Revenue from Contracts with Customers (Topic 606), a new revenue recognition model that supersedes most revenue recognition guidance under GAAP. Under this ASU and subsequently issued amendments, an entity is required to recognize revenue to depict the transfer of promised goods or services to customers in an amount that it expects to receive for the goods or services. CatchMark adopted ASU 2014-09 and its amendments using the modified retrospective method. Management performed a comprehensive evaluation of the impact of the new standard across all revenue streams and determined that the timing of revenue recognition and its classification in CatchMark’s consolidated financial statements remain substantially unchanged; however, additional disclosures are required.
Under the new standard, CatchMark recognizes revenue when the following criteria are met: (i) persuasive evidence of a contract with a customer exists, (ii) identifiable performance obligations under the contract exist, (iii) transaction price is determinable for each performance obligation, (iv) the transaction price is allocated to each performance obligation, and (v) when the performance obligations are satisfied. CatchMark derives a majority of its revenues from timber sales, timberland sales, recreational leases, and asset management fees, where the original expected contract duration is one year or less. CatchMark has elected the disclosure exemption available under ASC 606 considering it generally satisfies its performance obligations within one year of entering into contracts and collects payments within a month of satisfying its performance obligation.
(a) Timber Sales Revenue
CatchMark generates its timber sales revenue from delivered wood sales, stumpage sales, and lump-sum sales with retained economic interests. Revenue for timber sales is recognized when the risk of loss passes to the customer. Only one performance obligation is associated with timber sales and it is satisfied when timber is delivered to or severed by the customer in an amount that reflects the consideration expected to be received.
Contractual terms of each timber sale, including pricing and volume for the respective product, are negotiated and entered into by the field managers. In delivered wood sales, product pricing includes amount sufficient to cover costs of contracting third-party logging crews to harvest and haul timber to the customers. Revenue is recognized when timber is delivered to the customer and the sales volume/value is known when timber crosses the customers’ scale. Stumpage sales are typically executed using pay-as-cut contracts, where a purchaser acquires the right to harvest specified timber on a designated tract for a set period of time at agreed-upon unit prices. Revenue is recognized when timber is severed under pay-as-cut contracts. In a lump-sum sales contract with retained economic interests, CatchMark receives advance payments for the standing timber specified in the contract and the customer is responsible for cutting and hauling the timber. CatchMark satisfies its performance obligation when timber is severed, at which time revenue is recognized. Contract payments are generally collected within a month from the date timber is harvested and/or delivered. The transaction price for timber sales is determined using contractual rates applied to harvest volumes.
(b) Timberland Sales Revenue
Performance obligations associated with timberland sales are met when all conditions of closing have been satisfied. Revenue for timberland sales is recognized at closing when title passes, payments are received or full collectibility is probable, and control is passed to the buyer. CatchMark generally receives the entire contract consideration in cash at closing.
(c) Recreational Lease Revenue
Recreational lease revenue is derived from the leasing of the right to use CatchMark’s timberland. The agreed-upon transaction price of a lease is generally paid in full at the beginning of the lease term and recorded as deferred revenue. Performance obligations associated with a recreational lease are generally met over the period of the lease term. Revenue is recognized evenly over the lease term as CatchMark has satisfied its performance obligation.
F- 13
(d) Asset Management Fees Revenue
Under asset management agreements with its unconsolidated joint ventures, CatchMark earns management fees for performing asset management functions, as further described in Note 4 — Unconsolidated Joint Ventures. As asset management services are ongoing and provided on a recurring basis, the associated performance obligations are generally met over the service period at an agreed-upon price stated in the agreements. Revenue for asset management services is recognized at the end of each service period.
Large Dispositions
Large dispositions are sales of blocks of timberland properties in one or several transactions with the objective to generate proceeds to fund capital allocation priorities, including, but not limited to redeployment into more desirable timberland investments, paying down outstanding debt, or repurchasing shares of our common stock. Large dispositions may or may not have a higher or better use than timber production or result in a price premium above the land's timber production value. Such dispositions are infrequent in nature, are not part of core operations, and would cause material variances in comparative results if not reported separately. Large dispositions are accounted for in accordance with ASC 610-20, Other Income - Gains and Losses from the Derecognition of Nonfinancial Assets, which require that dispositions of long-lived assets that are not a discontinued operation be accounted for on a net basis and included in income from continuing operations before income taxes in accordance with ASC 360, Property, Plant and Equipment. Proceeds from sales designated as large dispositions are classified as cash flows from investing activities in the accompanying consolidated statements of cash flows.
Stock-based Compensation
CatchMark issues equity-based awards to its independent directors and employees pursuant to its long-term incentive plans. Stock-based compensation is measured by the fair value of the respective award on the date of grant or modification. Expense is recognized over the requisite service period of each award and reported as either forestry management expenses or as general and administrative expenses. See Note 10 — Stock-based Compensation for more information.
Earnings Per Share
Basic earnings (loss) per share is calculated as net income (loss) divided by the weighted-average number of common shares outstanding during the period. Diluted earnings (loss) per share equals basic earnings (loss) per share, adjusted to reflect the dilution that would occur if all outstanding securities convertible into common shares or contracts to issue common shares were converted or exercised and the related proceeds are then used to repurchase common shares. CatchMark excluded the impact of outstanding RSUs and LTIP Units from the weighted-average shares outstanding calculation, as their impact would be anti-dilutive. Basic and diluted earnings (loss) per share were the same for all periods presented.
Income Taxes
CatchMark Timber Trust has elected to be taxed as a REIT under the Code and has qualified to be taxed as a REIT since the year ended December 31, 2009. As a REIT, CatchMark Timber Trust is generally not subject to federal income taxes provided that it meets certain ownership, distribution, income, asset, and other REIT qualification tests.
CatchMark has elected to treat CatchMark TRS as a taxable REIT subsidiary. CatchMark conducts its delivered log business and may perform certain non-customary services, including real estate or non-real-estate related services, through CatchMark TRS. Earnings from services performed through CatchMark TRS are subject to federal and state income taxes irrespective of the dividends paid deduction available to REITs for federal income tax purposes.
Deferred tax assets and liabilities represent temporary differences between the financial reporting basis and the tax basis of assets and liabilities based on the enacted rates expected to be in effect when the temporary differences reverse. Deferred tax expense or benefit is recognized in the financial statements according to the changes in deferred tax assets
F- 14
or liabilities between years. Valuation allowances are established to reduce deferred tax assets when it becomes more likely than not that such assets, or portions thereof, will not be realized. See Note 12 — Income Taxes for more information.
CatchMark is also subject to certain state and local taxes related to the operations of timberland properties in certain locations, which have been provided for in the accompanying consolidated financial statements. When applicable, CatchMark records interest and penalties related to uncertain tax positions as general and administrative expense in the accompanying consolidated statements of operations.
Segment Information
CatchMark primarily engages in the acquisition, ownership, operation, management, and disposition of timberland properties located in the United States, either directly through wholly-owned subsidiaries or through equity method investments in affiliated joint ventures. CatchMark defines operating segments in accordance with ASC Topic 280, Segment Reporting, to reflect the manner in which its chief operating decision maker, the Chief Executive Officer, evaluates performance and allocates resources in managing the business. CatchMark has aggregated those operating segments into three reportable segments: Harvest, Real Estate and Investment Management. See Note 15 — Segment Information for additional information.
New Lease Accounting Standard
In February 2016, the FASB issued ASU 2016-02, Leases ("ASC 842"). ASC 842 establishes a right-of-use ("ROU") model that requires a lessee to record a ROU asset and a lease liability on its balance sheet for all leases, subject to certain scope exceptions. Leases are required to be classified as either finance or operating, with classification affecting the pattern of expense recognition in the statement of operations.
CatchMark adopted ASC 842 effective January 1, 2019 using the modified retrospective approach with the cumulative effect of the application recognized at the effective date. CatchMark elected the package of practical expedients, including the option to account for each separate lease component of a contract and its associated non-lease component as a single lease component, thus causing all fixed payments to be capitalized; and the practical expedient, which among other things, allows CatchMark to carry forward historical lease classification. Variable lease payment amounts that cannot be determined at the commencement of the lease such as increases in lease payments based on changes in index rates or usage, are not included in the operating lease ROU asset or liability. These are expensed as incurred and recorded as variable lease expense. Management identified and evaluated all of its in-place leases, subleases, and contracts with a lease component, and determined that its office lease is the only lease within the scope of ASC 842. CatchMark elected the practical expedient to not apply the recognition requirements of ASC 842 to its short-term leases. CatchMark determined its long-term timber lease to be a lease of biological assets, a scope exception to ASC 842. Long-term timber lease expense is reported as land rent expense on CatchMark's consolidated statements of operations. See Note 7 — Commitments and Contingencies, Obligations under Operating Leases for additional information on the long-term timber lease. Additionally, CatchMark determined that its hunting and recreational leases do not qualify as leases under ASC 842. See Note 11 — Recreational Leases for additional information on CatchMark's hunting and recreational leases.
CatchMark's office lease commenced in January 2019 and expires in November 2028 and qualifies as an operating lease under ASC 842. As of January 1, 2019, CatchMark recorded an operating lease ROU asset and an operating lease liability of $3.4 million on its balance sheet, which represents the net present value of lease payments over the lease term discounted using CatchMark's incremental borrowing rate at commencement date. CatchMark’s office lease contains renewal options; however, the options were not included in the calculation of the operating lease ROU and operating lease liability as it is not reasonably certain that CatchMark will exercise the renewal options. CatchMark recorded $122,000 of noncash lease expense related to the operating lease ROU asset and the operating lease liability for the year ended December 31, 2019, which was included in general and administrative expenses on its consolidated statement of operations. For the year ended December 31, 2019, CatchMark paid $311,600 in cash for its office lease.
F- 15
The adoption of ASC 842 did not result in a cumulative-effect adjustment to CatchMark's retained earnings, as its office lease commenced in January 2019.
CatchMark had the following future annual payments for its operating lease as of December 31, 2019 and 2018:
As of | |||||||
(in thousands) | December 31, 2019 | December 31, 2018 | |||||
Required payments | |||||||
2019 | $ | — | $ | 312 | |||
2020 | 397 | 397 | |||||
2021 | 412 | 412 | |||||
2022 | 424 | 424 | |||||
2023 | 435 | 435 | |||||
2024 | 447 | 447 | |||||
Thereafter | 1,873 | 1,873 | |||||
$ | 3,988 | $ | 4,300 | ||||
Less: imputed interest | (746 | ) | |||||
Operating lease liability | $ | 3,242 | |||||
Remaining lease term (years) | 8.9 | ||||||
Discount rate | 4.58 | % | |||||
Recent Accounting Pronouncements
In August 2017, the FASB issued ASU 2017-12, Targeted Improvements to Accounting for Hedging Activities (Topic 815), which amends the hedge accounting recognition and presentation requirements in ASC 815, "Derivatives and Hedging." In October 2018, the FASB issued ASU 2018-16, Derivatives and Hedging (Topic 815): Inclusion of the Secured Overnight Financing Rate (SOFR) Overnight Index Swap (OIS) Rate as a Benchmark Interest Rate for Hedge Accounting Purposes. ASU 2017-12 expands an entity's ability to hedge nonfinancial and financial risk components and reduces the complexity in fair value hedges of interest rate risk. It eliminates the requirement to separately measure and report hedge ineffectiveness and requires the entire change in the fair value of a hedging instrument to be presented in the same income statement line as the hedged item when the hedged item affects earnings. The amendments in ASU 2018-16 permit use of the OIS rate based on SOFR as a U.S. benchmark interest rate for hedge accounting purposes under Topic 815. CatchMark adopted ASU 2017-12 on January 1, 2018 and ASU 2018-16 on January 1, 2019. These adoptions did not have a material effect on CatchMark's consolidated financial statements.
In June 2018, the FASB issued ASU 2018-07, Compensation - Stock Compensation (Topic 718): Improvements to Nonemployee Share-Based Payment Accounting, which expands the scope of ASC 718 to include share-based payments granted to non-employees in exchange for goods or services used or consumed in an entity’s own operations. This guidance aligns the measurement and classification for share-based payments to non-employees with the guidance for share-based payments to employees, with certain exceptions. ASU 2018-07 is effective for public entities for fiscal years beginning after December 15, 2018, and interim periods therein. CatchMark adopted ASU 2018-07 on January 1, 2019 and the adoption did not have a material effect on its consolidated financial statements.
On July 16, 2018, the FASB issued ASU 2018-09, Codification Improvements. The amendments in this update represent changes to clarify the ASC, correct unintended application of guidance, or make minor improvements to the ASC that are not expected to have a significant effect on current accounting practice or create a significant administrative cost to most entities. Some of the amendments make the ASC easier to understand and easier to apply by eliminating inconsistencies, providing needed clarifications, and improving the presentation of guidance in the ASC. ASU 2018-09 is effective for public entities for fiscal years beginning after December 15, 2018, and interim periods therein. CatchMark adopted ASU 2018-09 on January 1, 2019 and the adoption did not have a material effect on its consolidated financial statements.
F- 16
In August 2018, the FASB issued ASU 2018-13, Fair Value Measurement (Topic 820): Disclosure Framework - Changes to the Disclosure Requirements for Fair Value Measurement, which added new disclosure requirements, eliminated and modified existing disclosure requirements on fair value measurement to improve the effectiveness of ASC 820. ASU 2018-13 is effective for all entities for fiscal years, and interim periods within those fiscal years, beginning after December 15, 2019. CatchMark is currently assessing the impact ASU 2018-13 will have on its consolidated financial statements.
In December 2019, the FASB issued ASU 2019-12, Income Taxes (Topic 740): Simplifying the Accounting for Income Taxes, which removed certain exceptions for intra-period tax allocation, recognition of deferred tax liabilities, and calculation of income taxes in interim periods. This ASU also added guidance to reduce complexity in certain areas, including recognizing deferred taxes for tax goodwill and allocating taxes to members of a consolidated group. ASU 2019-12 is effective for public entities for fiscal years beginning after December 15, 2020, and interim periods therein. CatchMark is currently assessing the impact ASU 2019-12 will have on its consolidated financial statements.
3. | Timber Assets |
As of December 31, 2019 and 2018, timber and timberlands consisted of the following, respectively:
As of December 31, 2019 | |||||||||||
(in thousands) | Gross | Accumulated Depletion or Amortization | Net | ||||||||
Timber | $ | 312,452 | $ | 28,064 | $ | 284,388 | |||||
Timberlands | 348,825 | — | 348,825 | ||||||||
Mainline roads | 1,106 | 738 | 368 | ||||||||
Timber and timberlands | $ | 662,383 | $ | 28,802 | $ | 633,581 | |||||
As of December 31, 2018 | |||||||||||
(in thousands) | Gross | Accumulated Depletion or Amortization | Net | ||||||||
Timber | $ | 345,972 | $ | 25,912 | $ | 320,060 | |||||
Timberlands | 367,488 | — | 367,488 | ||||||||
Mainline roads | 954 | 651 | 303 | ||||||||
Timber and timberlands | $ | 714,414 | $ | 26,563 | $ | 687,851 | |||||
Timberland Acquisitions
During the years ended December 31, 2019, 2018 and 2017, CatchMark acquired 900 acres, 18,100 acres, and 19,600 acres of timberland, respectively, for $1.9 million, $89.7 million, and $51.6 million, respectively, excluding closing costs. Acreage acquired by state is listed below:
Acres Acquired In (1): | 2019 | 2018 | 2017 | ||||||
South | |||||||||
Georgia | — | — | 15,000 | ||||||
South Carolina | 900 | — | 4,600 | ||||||
900 | — | 19,600 | |||||||
Pacific Northwest | |||||||||
Oregon | — | 18,100 | — | ||||||
Total | 900 | 18,100 | 19,600 | ||||||
F- 17
(1) Represents CatchMark's wholly-owned acreage only; excludes ownership interest in acreage acquired by joint ventures.
Timberland Sales
During the years ended December 31, 2019, 2018, and 2017, CatchMark sold 9,200 acres, 8,500 acres, and 7,700 acres of timberland, respectively, for $17.6 million, $17.5 million, and $14.8 million, respectively. CatchMark’s cost basis in the timberland sold was $14.1 million, $12.4 million, and $9.9 million respectively.
Large Dispositions
During the years ended December 31, 2019 and 2018, CatchMark completed the sale of 14,400 and 56,100 acres of its wholly-owned timberlands for $25.4 million and $79.3 million, respectively. CatchMark's cost basis was $17.2 million and $79.5 million, respectively. Of the total net proceeds received, $20.1 million and $79.0 million were used to pay down CatchMark's outstanding debt balance in 2019 and 2018, respectively. No large dispositions were completed in 2017.
Timberland sales and large disposition acreage by state is listed below:
Acres Sold In: | 2019 | 2018 | 2017 | ||||||
South | |||||||||
Timberland Sales | |||||||||
Alabama | 800 | 1,500 | 2,300 | ||||||
Georgia | 1,000 | 2,300 | 5,000 | ||||||
Louisiana | — | 200 | 400 | ||||||
North Carolina | 500 | 1,000 | — | ||||||
South Carolina | 6,900 | 3,300 | — | ||||||
Texas | — | 200 | — | ||||||
9,200 | 8,500 | 7,700 | |||||||
Large Dispositions | |||||||||
Alabama | 2,100 | — | — | ||||||
Georgia | 12,300 | — | — | ||||||
Louisiana | — | 20,700 | — | ||||||
Texas | — | 35,400 | — | ||||||
14,400 | 56,100 | — | |||||||
Total | 23,600 | 64,600 | 7,700 | ||||||
Current Timberland Portfolio
As of December 31, 2019, CatchMark directly owned interests in 435,500 acres of timberlands in the U.S. South and the Pacific Northwest, 410,200 acres of which were fee-simple interests and 25,300 acres were leasehold interests. Land acreage by state is listed below:
F- 18
Acres by state as of December 31, 2019 (1) | Fee | Lease | Total | ||||||
South | |||||||||
Alabama | 70,000 | 1,800 | 71,800 | ||||||
Florida | 2,000 | — | 2,000 | ||||||
Georgia | 248,000 | 23,500 | 271,500 | ||||||
North Carolina | 100 | — | 100 | ||||||
South Carolina | 71,700 | — | 71,700 | ||||||
Tennessee | 300 | — | 300 | ||||||
392,100 | 25,300 | 417,400 | |||||||
Pacific Northwest | |||||||||
Oregon | 18,100 | — | 18,100 | ||||||
Total: | 410,200 | 25,300 | 435,500 | ||||||
(1) Represents CatchMark wholly-owned acreage only; excludes ownership interest in acreage held by joint ventures.
4. Unconsolidated Joint Ventures
As of December 31, 2019, CatchMark owned interests in two joint ventures with unrelated parties: the Triple T Joint Venture and the Dawsonville Bluffs Joint Venture (each as defined and described below).
As of December 31, 2019 | |||||
Dawsonville Bluffs Joint Venture | Triple T Joint Venture | ||||
Ownership percentage | 50.0% | 21.6 | % | (1) | |
Acreage owned by the joint venture | — | 1,092,000 | |||
Merchantable timber inventory (million tons) | — | 44.1 | (2) | ||
Location | Georgia | Texas | |||
(1) | Represents our share of total partner capital contributions. |
(2) | The Triple T Joint Venture considers inventory to be merchantable at age 12. Merchantable timber inventory includes current year growth. |
CatchMark accounts for these investments using the equity method of accounting.
Triple T Joint Venture
During 2018, CatchMark formed a joint venture, TexMark Timber Treasury, L.P., a Delaware limited partnership (the "Triple T Joint Venture"), with a consortium of institutional investors (the "Preferred Investors") to acquire 1.1 million acres of high-quality East Texas industrial timberlands (the “Triple T Timberlands”), for $1.39 billion (the “Acquisition Price”), exclusive of transaction costs. The Triple T Joint Venture completed the acquisition of the Triple T Timberlands in July 2018. CatchMark invested $200.0 million in the Triple T Joint Venture, equal to 21.6% of the total equity contributions, in exchange for a common limited partnership interest. CatchMark, through a separate wholly-owned and consolidated subsidiary, is the sole general partner of the Triple T Joint Venture.
CatchMark uses the equity method to account for its investment in the Triple T Joint Venture since it does not possess the power to direct the activities that most significantly impact the economic performance of the Triple T Joint Venture, and accordingly, CatchMark does not possess the first characteristic of a primary beneficiary described in GAAP. CatchMark appointed three common board members of the Triple T Joint Venture, including its Chief Executive Officer, Chief Financial Officer, and Senior Vice President of Forest Resources, which provides CatchMark with significant influence over the Triple T Joint Venture. Accordingly, pursuant to the applicable accounting literature, it is appropriate for CatchMark to apply the equity method of accounting to its investment in the Triple T Joint Venture.
The Triple T Joint Venture agreement provides for liquidation rights and distribution priorities that are significantly different from CatchMark's stated ownership percentage based on total equity contributions. The Preferred Investors
F- 19
are entitled to a minimum 10.25% cumulative return on their equity contributions, plus a complete return of their equity contributions before any distributions may be made on CatchMark’s common limited partnership interest. As such, CatchMark uses the hypothetical-liquidation-at-book-value method (“HLBV”) to determine its equity in the earnings of the Triple T Joint Venture. The HLBV method is commonly applied to equity investments in real estate, where cash distribution percentages vary at different points in time and are not directly linked to an investor's ownership percentage. For investments accounted for under the HLBV method, applying the percentage ownership interest to GAAP net income in order to determine earnings or losses would not accurately represent the income allocation and cash flow distributions that will ultimately be received by the investors.
CatchMark applies HLBV using a balance sheet approach. A calculation is prepared at each balance sheet date to determine the amount that CatchMark would receive if the Triple T Joint Venture were to liquidate all of its assets (at book value in accordance with GAAP) on that date and distribute the cash to the partners based on the contractually-defined liquidation priorities. The difference between the calculated liquidation distribution amounts at the beginning and the end of the reporting period, after adjusting for capital contributions and distributions, is CatchMark's income or loss from the Triple T Joint Venture for the period.
Condensed balance sheet information for the Triple T Joint Venture is as follows:
As of December 31, | |||||||
(in thousands) | 2019 | 2018 | |||||
Triple T Joint Venture: | |||||||
Total assets | $ | 1,573,172 | $ | 1,607,413 | |||
Total liabilities | $ | 751,655 | $ | 754,610 | |||
Total equity | $ | 821,517 | $ | 852,803 | |||
CatchMark: | |||||||
Carrying value of investment | $ | — | $ | 90,450 | |||
Condensed income statement information for the Triple T Joint Venture is as follows:
Years Ended December 31, | |||||||
(in thousands) | 2019 | 2018 | |||||
Triple T Joint Venture: | |||||||
Total revenues | $ | 158,839 | $ | 56,977 | |||
Net loss | $ | (21,469 | ) | $ | (20,646 | ) | |
CatchMark: | |||||||
Equity share of net loss | $ | (90,450 | ) | $ | (109,550 | ) | |
Condensed statement of cash flow information for the Triple T Joint Venture is as follows:
Years Ended December 31, | |||||||
(in thousands) | 2019 | 2018 | |||||
Triple T Joint Venture: | |||||||
Net cash provided by (used in) operating activities | $ | 6,817 | $ | (8,982 | ) | ||
Net cash used in investing activities | $ | (6,582 | ) | $ | (1,413,082 | ) | |
Net cash provided by financing activities | $ | 79 | $ | 1,461,364 | |||
Net change in cash and cash equivalents | $ | 314 | $ | 39,300 | |||
Cash and cash equivalents, beginning of period | $ | 39,300 | $ | — | |||
Cash and cash equivalents, end of period | $ | 39,614 | $ | 39,300 | |||
F- 20
CatchMark's equity share of the Triple T Joint Venture's net loss determined using the HLBV method as of December 2019 is calculated as follows:
(in thousands) | ||||||
Triple T Joint Venture: | ||||||
Total equity as of December 31, 2019 | $ | 821,517 | ||||
Preferred Investors: | ||||||
Equity in Triple T Joint Venture as of January 1, 2019 | $ | 762,353 | ||||
Minimum preferred return as of December 31, 2019 | $ | 59,039 | ||||
Class A preferred equity as of December 31, 2019 | $ | 125 | ||||
HLBV distribution as of December 31, 2019 | $ | 821,517 | ||||
CatchMark: | ||||||
Equity in Triple T Joint Venture as of December 31, 2019 | $ | — | ||||
Equity in Triple T Joint Venture, as of January 1, 2019 | $ | 90,450 | ||||
Equity share of Triple T Joint Venture's net loss | $ | (90,450 | ) | |||
Dawsonville Bluffs Joint Venture
During 2017, CatchMark formed the Dawsonville Bluffs Joint Venture with MPERS, and each owns a 50% membership interest. CatchMark shares substantive participation rights with MPERS, including management selection and termination, and the approval of material operating and capital decisions and, as such, uses the equity method of accounting to record its investment. Income or loss and cash distributions are allocated according to the provisions of the joint venture agreement.
During 2019, the Dawsonville Bluffs Joint Venture completed the disposition of all of its remaining 5,000 acres of timberlands for $10.2 million. As of December 31, 2019, the Dawsonville Bluffs Joint Venture had a mitigation bank with a book basis of $2.6 million remaining in its portfolio. Condensed balance sheet information for the Dawsonville Bluffs Joint Venture is as follows:
Years Ended December 31, | |||||||
(in thousands) | 2019 | 2018 | |||||
Dawsonville Bluffs Joint Venture: | |||||||
Total assets | $ | 4,041 | $ | 12,164 | |||
Total liabilities | $ | 111 | $ | 575 | |||
Total equity | $ | 3,930 | $ | 11,589 | |||
CatchMark: | |||||||
Carrying value of investment | $ | 1,965 | $ | 5,795 | |||
Condensed income statement information for the Dawsonville Bluffs Joint Venture is as follows:
Years Ended December 31, | |||||||||||
(in thousands) | 2019 | 2018 | 2017 | ||||||||
Dawsonville Bluffs Joint Venture: | |||||||||||
Total Revenues | $ | 11,101 | $ | 14,852 | $ | 4,886 | |||||
Net Income | $ | 1,956 | $ | 5,267 | $ | 2,275 | |||||
CatchMark: | |||||||||||
Equity share of net income | $ | 978 | $ | 2,634 | $ | 1,138 | |||||
Condensed statement of cash flow information for the Dawsonville Joint Venture is as follows:
F- 21
Years Ended December 31, | |||||||||||
(in thousands) | 2019 | 2018 | 2017 | ||||||||
Dawsonville Joint Venture: | |||||||||||
Net cash provided by operating activities | $ | 9,325 | $ | 13,388 | $ | 4,645 | |||||
Net cash used in investing activities | $ | — | $ | — | $ | (20,348 | ) | ||||
Net cash provided by (used in) financing activities | $ | (9,615 | ) | $ | (17,032 | ) | $ | 21,078 | |||
Net change in cash and cash equivalents | $ | (290 | ) | $ | (3,644 | ) | $ | 5,375 | |||
Cash and cash equivalents, beginning of period | $ | 1,731 | $ | 5,375 | $ | — | |||||
Cash and cash equivalents, end of period | $ | 1,441 | $ | 1,731 | $ | 5,375 | |||||
For the years ended December 31, 2019 and 2018, CatchMark received cash distributions of $4.8 million and $8.5 million, respectively, from the Dawsonville Bluffs Joint Venture, $1.0 million and $3.8 million of which was classified as operating distributions, and $3.8 million and $4.7 million was classified as return of capital in the investing section of the accompanying consolidated statements of cash flows.
Asset Management Fees
CatchMark provides asset management services to the Triple T Joint Venture and the Dawsonville Bluffs Joint Venture. Under these arrangements, CatchMark oversees the day-to-day operations of these joint ventures and their properties, including accounting, reporting and other administrative services, subject to certain major decisions that require partner approval. For management of the Triple T Joint Venture, CatchMark receives a fee equal to a percentage of the Acquisition Price multiplied by 78.4%, which represents the percentage of the total equity contributions made to the Triple T Joint Venture by the Preferred Investors. The percentage is currently 1%. In the event the Preferred Investors have not received a return of their capital contributions plus their preferred return, then the percentage decreases from 1% to 0.75% at October 1, 2021, and to 0.5% at October 1, 2022. The fee is also subject to deferment in certain circumstances. In addition, the asset management agreement with the Triple T Joint Venture includes a "key man" provision requiring CatchMark to find a suitable replacement for Jerry Barag, our former Chief Executive Officer, within one year of his retirement, or by January 21, 2021 (see Note 16 — Subsequent Events for additional information). If CatchMark fails to find such suitable replacement within that time period, the Preferred Investors in the Triple T Joint Venture have the right to terminate the asset management agreement. For management of the Dawsonville Bluffs Joint Venture, CatchMark receives a percentage fee based on invested capital, as defined by the joint venture agreement. Additionally, CatchMark receives an incentive-based promote earned for exceeding investment hurdles.
For the years ended December 31, 2019 and 2018, CatchMark earned the following fees from its unconsolidated joint ventures:
(in thousands) | 2019 | 2018 | |||||
Triple T Joint Venture (1) | $ | 11,286 | $ | 5,496 | |||
Dawsonville Bluffs Joint Venture (2) | $ | 662 | $ | 107 | |||
$ | 11,948 | $ | 5,603 | ||||
(1) | Includes $0.5 million and $0.2 million of reimbursements of compensation costs for the years ended December 31, 2019 and 2018, respectively. |
(2) | Includes $0.6 million of incentive-based promote earned for exceeding investment hurdles in 2019. |
5. | Notes Payable and Lines of Credit |
As of December 31, 2019 and 2018, CatchMark had the following debt balances outstanding:
F- 22
(in thousands) | Maturity Date | Current Interest Rate(1) | Outstanding Balance as of December 31, | |||||||||||
Credit Facility | Interest Rate | 2019 | 2018 | |||||||||||
Term Loan A-1 | 12/23/2024 | LIBOR + 1.75% | 3.55% | $ | 100,000 | $ | 100,000 | |||||||
Term Loan A-2 | 12/01/2026 | LIBOR + 1.90% | 3.70% | 100,000 | 100,000 | |||||||||
Term Loan A-3 | 12/01/2027 | LIBOR + 2.00% | 3.80% | 68,619 | 68,619 | |||||||||
Term Loan A-4 | 08/22/2025 | LIBOR + 1.70% | 3.50% | 140,000 | 140,000 | |||||||||
Multi-Draw Term Facility | 12/01/2024 | LIBOR + 2.20% | 3.95% | 49,936 | 70,000 | |||||||||
Total Principal Balance | $ | 458,555 | $ | 478,619 | ||||||||||
Less: Net Unamortized Deferred Financing Costs | $ | (5,568 | ) | $ | (6,379 | ) | ||||||||
Total | $ | 452,987 | $ | 472,240 | ||||||||||
(1) | For the Multi-Draw Term Facility, the interest rate represents weighted-average interest rate as of December 31, 2019. The weighted-average interest rate excludes the impact of interest rate swaps (see Note 6 — Interest Rate Swaps), amortization of deferred financing costs, unused commitment fees, and estimated patronage dividends. |
Amended Credit Agreement
CatchMark is party to a credit agreement dated as of December 1, 2017, as amended on August 22, 2018 and June 28, 2019 (the “Amended Credit Agreement”), with a syndicate of lenders including CoBank. The Amended Credit Agreement provides for borrowing under credit facilities consisting of the following:
• | a $35.0 million five-year revolving credit facility (the “Revolving Credit Facility”); |
• | a $200.0 million seven-year multi-draw term credit facility (the “Multi-Draw Term Facility”); |
• | a $100.0 million ten-year term loan (the “Term Loan A-1”); |
• | a $100.0 million nine-year term loan (the “Term Loan A-2”); |
• | a $68.6 million ten-year term loan (the “Term Loan A-3”); and |
• | a $140.0 million seven-year term loan (the "Term Loan A-4"). |
As of December 31, 2019, $185.1 million remained available under CatchMark's credit facilities, consisting of $150.1 million under the Multi-Draw Term Facility and $35.0 million under the Revolving Credit Facility.
Borrowings under the Revolving Credit Facility may be used for general working capital, to support letters of credit, to fund cash earnest money deposits, to fund acquisitions in an amount not to exceed $5.0 million, and other general corporate purposes. The Revolving Credit Facility bears interest at an adjustable rate equal to a base rate plus between 0.50% and 1.20% or a LIBOR rate plus between 1.50% and 2.20%, in each case depending on CatchMark’s LTV Ratio, and will terminate and all amounts outstanding under the facility will be due and payable on December 1, 2022.
The Multi-Draw Term Facility may be used to finance timberland acquisitions and associated expenses, to fund investment in joint ventures, and to reimburse payments of drafts under letters of credit. The Multi-Draw Term Facility, which is interest only until its maturity date, bears interest at an adjustable rate equal to a base rate plus between 0.50% and 1.20% or a LIBOR rate plus between 1.50% and 2.20%, in each case depending on CatchMark’s LTV Ratio, and will terminate and all amounts outstanding under the facility will be due and payable on December 1, 2024.
CatchMark pays the lenders an unused commitment fee on the unused portion of the Revolving Credit Facility and the Multi-Draw Term Facility at an adjustable rate ranging from 0.15% to 0.35%, depending on the LTV Ratio.
CatchMark’s obligations under the credit agreement are collateralized by a first priority lien on the timberlands owned by CatchMark’s subsidiaries and substantially all of CatchMark’s subsidiaries’ other assets in which a security interest may lawfully be granted, including, without limitation, accounts, equipment, inventory, intellectual property, bank accounts and investment property. In addition, the obligations under the credit agreement are jointly and severally
F- 23
guaranteed by CatchMark and all of its subsidiaries pursuant to the terms of the credit agreement. CatchMark has also agreed to guarantee certain losses caused by certain willful acts of CatchMark or its subsidiaries.
Patronage Dividends
CatchMark is eligible to receive annual patronage dividends from its lenders (the "Patronage Banks") under a profit-sharing program made available to borrowers of the Farm Credit System. CatchMark has received a patronage dividend on its eligible patronage loans annually since 2015. Of the total patronage dividends received, 75% was received in cash and 25% was received in equity of the Patronage Banks. CatchMark accrues Patronage Dividends it expects to receive based on actual patronage dividends received as a percentage of its weighted-average eligible debt balance. As of December 31, 2019, 2018, and 2017, CatchMark accrued $3.8 million, $3.3 million, and $2.7 million, respectively, as patronage dividends receivable on its consolidated balance sheets and as an offset against interest expense on its consolidated statements of operations.
As of December 31, 2019 and 2018, CatchMark recorded the following balances related to patronage dividends on its balance sheets:
(in thousands) | As of December 31, | |||||||
Patronage dividends classified as: | 2019 | 2018 | ||||||
Accounts receivable | $ | 3,810 | $ | 3,323 | ||||
Prepaid expenses and other assets (1) | 2,329 | 1,499 | ||||||
Total | $ | 6,139 | $ | 4,822 | ||||
(1) Represents 25% of cumulative patronage dividends received to date as equity of the Patronage Banks.
Debt Covenants
CatchMark's credit agreement contains, among others, the following financial covenants:
• | limit the LTV Ratio to (i) 50% at any time prior to the last day of the fiscal quarter corresponding to December 1, 2021, and (ii) 45% at any time thereafter; |
• | require maintenance of a FCCR of not less than 1.05:1; and |
• | require maintenance of a minimum liquidity balance of no less than $25.0 million at any time; and |
• | limit the aggregated capital expenditures to 1% of the value of the timberlands during any fiscal year. |
The Amended Credit Agreement permits CatchMark to declare, set aside funds for, or pay dividends, distributions, or other payments to stockholders so long as it is not in default under the credit agreement and its minimum liquidity balance, after giving effect to the payment, is at least $25 million. However, if CatchMark has suffered a bankruptcy event or a change of control, the credit agreement prohibits CatchMark from declaring, setting aside, or paying any dividend, distribution, or other payment other than as required to maintain its REIT qualification. The Amended Credit Agreement also subjects CatchMark to mandatory prepayment from proceeds generated from dispositions of timberlands or lease terminations, which may have the effect of limiting its ability to make distributions to stockholders under certain circumstances.
CatchMark was in compliance with the financial covenants of its amended credit agreement as of December 31, 2019.
Interest Paid and Fair Value of Outstanding Debt
During the years ended December 31, 2019, 2018, and 2017, CatchMark made the following cash interest payments on its borrowings:
F- 24
(in thousands) | 2019 | 2018 | 2017 | |||||||||
Cash paid for interest | $ | 20,399 | $ | 15,816 | $ | 11,412 | ||||||
Included in the interest payments for the years ended December 31, 2019, 2018 and 2017 were unused commitment fees of $0.1 million, $0.2 million and $0.6 million, respectively. No interest paid was capitalized during the years ended December 31, 2019, 2018 and 2017.
As of December 31, 2019 and 2018, the weighted-average interest rate on these borrowings, after consideration of the interest rate swaps (see Note 6 — Interest Rate Swaps), was 3.87% and 4.31%, respectively. After further consideration of the expected patronage dividends, CatchMark's weighted-average interest rate as of December 31, 2019 and 2018 was 3.07% and 3.51%, respectively.
As of December 31, 2019 and 2018, the fair value of CatchMark's outstanding debt approximated its book value. The fair value was estimated based on discounted cash flow analysis using the current market borrowing rates for similar types of borrowing arrangements as of the measurement dates.
6. Interest Rate Swaps
CatchMark uses interest rate swaps to mitigate its exposure to changing interest rates on its variable rate debt instruments. CatchMark had the following interest rate swaps outstanding from 2017 through October 2019, when they were terminated:
Terminated Interest Rate Swap | Effective Date | Termination Date | Pay Rate | Receive Rate | Notional Amount | |||||||
2017 Swap - 3YR | 3/28/2017 | 10/21/2019 | 1.800% | one-month LIBOR | $ | 30,000 | ||||||
2018 Swap - 2YR | 9/6/2018 | 10/21/2019 | 2.796% | one-month LIBOR | $ | 50,000 | ||||||
2018 Swap - 3YR | 9/6/2018 | 10/21/2019 | 2.869% | one-month LIBOR | $ | 50,000 | ||||||
2017 Swap - 4YR | 3/28/2017 | 10/21/2019 | 2.045% | one-month LIBOR | $ | 20,000 | ||||||
2018 Swap - 4YR | 2/28/2018 | 10/21/2019 | 2.703% | one-month LIBOR | $ | 30,000 | ||||||
2017 Swap - 7YR | 3/23/2017 | 10/21/2019 | 2.330% | one-month LIBOR | $ | 20,000 | ||||||
2014 Swap - 10YR | 12/23/2014 | 10/21/2019 | 2.395% | one-month LIBOR | $ | 35,000 | ||||||
2016 Swap - 8YR | 8/23/2016 | 10/21/2019 | 1.280% | one-month LIBOR | $ | 45,000 | ||||||
2018 Swap - 8YR | 2/28/2018 | 10/21/2019 | 2.884% | one-month LIBOR | $ | 20,000 | ||||||
2018 Swap - 9YR | 8/28/2018 | 10/21/2019 | 3.014% | one-month LIBOR | $ | 50,000 | ||||||
Total | $ | 350,000 | ||||||||||
From January 1, 2019 through October 21, 2019, these swaps effectively fixed the interest rates on $350.0 million of CatchMark's variable-rate debt at 4.26%, inclusive of the applicable spread but before considering patronage dividends.
In October 2019, CatchMark terminated these swaps and entered into two new interest rate swaps with Rabobank. As of December 31, 2019, CatchMark had two outstanding interest rate swaps with terms below:
(in thousands) | ||||||||||||
Interest Rate Swap | Effective Date | Maturity Date | Pay Rate | Receive Rate | Notional Amount | |||||||
2019 Swap - 10YR | 11/29/2019 | 11/30/2029 | 2.2067% | one-month LIBOR | $ | 200,000 | ||||||
2019 Swap - 7YR | 11/29/2019 | 11/30/2026 | 2.083% | one-month LIBOR | $ | 75,000 | ||||||
Total | $ | 275,000 | ||||||||||
As of December 31, 2019, CatchMark's interest rate swaps effectively fixed the interest rate on $275.0 million of its $458.6 million variable rate debt at 3.98%, inclusive of the applicable spread but before considering patronage dividends. The 2019 swaps contain an other-than-insignificant financing element and, accordingly, the associated cash flows are reported as financing activities in the accompanying consolidated statement of cash flows.
F- 25
All of CatchMark's outstanding interest rate swaps during 2019, 2018 and 2017 qualified for hedge accounting treatment.
Fair Value and Cash Paid for Interest Under Interest Rate Swaps
The following table presents information about CatchMark’s interest rate swaps measured at fair value as of December 31, 2019 and 2018:
(in thousands) | Estimated Fair Value as of December 31, | |||||||||
Instrument Type | Balance Sheet Classification | 2019 | 2018 | |||||||
Derivatives designated as hedging instruments: | ||||||||||
Interest rate swaps | Prepaid expenses and other assets | $ | — | $ | 3,643 | |||||
Interest rate swaps | Other liabilities | $ | (8,769 | ) | $ | (3,635 | ) | |||
As of December 31, 2019, CatchMark estimated that $1.6 million will be reclassified from accumulated other comprehensive loss to interest expense over the next 12 months.
During the years ended December 31, 2019 and 2018, CatchMark recognized a change in fair value of its interest rate swaps of $8.3 million and $2.4 million, respectively, as other comprehensive loss. CatchMark recognized a change in fair value of its interest rate swaps of $0.6 million as other comprehensive income in 2017. During the years ended December 31, 2019, 2018, and 2017, net payments of $0.3 million, $0.5 million, and $1.0 million were made under the interest rate swaps by CatchMark and were recorded as interest expense, respectively.
7. Commitments and Contingencies
Mahrt Timber Agreements
In connection with its acquisition of timberlands from WestRock, CatchMark entered into a master stumpage agreement and a fiber supply agreement (collectively, the “Mahrt Timber Agreements”) with a wholly-owned subsidiary of WestRock. The master stumpage agreement provides that CatchMark will sell specified amounts of timber and make available certain portions of our timberlands to CatchMark TRS for harvesting. The fiber supply agreement provides that WestRock will purchase a specified tonnage of timber from CatchMark TRS at specified prices per ton, depending upon the type of timber product. The prices for the timber purchased pursuant to the fiber supply agreement are negotiated every two years but are subject to quarterly market pricing adjustments based on an index published by TimberMart-South, a quarterly trade publication that reports raw forest product prices in 11 southern states. The initial term of the Mahrt Timber Agreements is October 9, 2007 through December 31, 2032, subject to extension and early termination provisions. The Mahrt Timber Agreements ensure a long-term source of supply of wood fiber products for WestRock in order to meet its paperboard and lumber production requirements at specified mills and provide CatchMark with a reliable customer for the wood products from its timberlands. For the years ended December 31, 2019, 2018, and 2017, approximately 12%, 17%, and 17%, respectively, of CatchMark's net timber sales revenue was derived from the Mahrt Timber Agreements.
F- 26
WestRock can terminate the Mahrt Timber Agreements prior to the expiration of the initial term if CatchMark replaces FRC as the forest manager without the prior written consent of WestRock, except pursuant to an internalization of the company's forestry management functions. CatchMark can terminate the Mahrt Timber Agreements if WestRock (i) ceases to operate the Mahrt mill for a period that exceeds 12 consecutive months, (ii) fails to purchase a specified tonnage of timber for two consecutive years, subject to certain limited exceptions or (iii) fails to make payments when due (and fails to cure within 30 days).
In addition, either party can terminate the Mahrt Timber Agreements if the other party commits a material breach (and fails to cure within 60 days) or becomes insolvent. In addition, the Mahrt Timber Agreements provide for adjustments to both parties' obligations in the event of a force majeure, which is defined to include, among other things, lightning, fires, storms, floods, infestation and other acts of God or nature.
Timberland Operating Agreements
Pursuant to the terms of the timberland operating agreement between CatchMark and FRC (the "FRC Timberland Operating Agreement"), FRC manages and operates certain of CatchMark's timberlands and related timber operations, including ensuring delivery of timber to WestRock in compliance with the Mahrt Timber Agreements. In consideration for rendering the services described in the timberland operating agreement, CatchMark pays FRC (i) a monthly management fee based on the actual acreage FRC manages, which is payable monthly in advance, and (ii) an incentive fee based on timber harvest revenues generated by the timberlands, which is payable quarterly in arrears. The FRC Timberland Operating Agreement, as amended, is effective through March 31, 2021, and is automatically extended for one-year periods unless written notice is provided by CatchMark or FRC to the other party at least 120 days prior to the current expiration. The FRC Timberland Operating Agreement may be terminated by either party with mutual consent or by CatchMark with or without cause upon providing 120 days’ prior written notice.
Pursuant to the terms of the timberland operating agreement between CatchMark and AFM (the "AFM Timberland Operating Agreement"), AFM manages and operates certain of CatchMark's timberlands and related timber operations, including ensuring delivery of timber to customers. In consideration for rendering the services described in the AFM Timberland Operating Agreement, CatchMark pays AFM (i) a monthly management fee based on the actual acreage AFM manages, which is payable monthly in advance, and (ii) an incentive fee based on revenues generated by the timber operations. The incentive fee is payable quarterly in arrears. The AFM Timberland Operating Agreement is effective through November 30, 2020 for the U.S. South region and December 31, 2020 for the Pacific Northwest region, and is automatically extended for one-year periods unless written notice is provided by CatchMark or AFM to the other party at least 120 days prior to the current expiration. The AFM Timberland Operating Agreement may be terminated by either party with mutual consent or by CatchMark with or without cause upon providing 120 days’ prior written notice.
Obligations under Operating Leases
CatchMark holds leasehold interests in 25,300 acres of timberlands under a long-term lease that expires in May 2022 (the “LTC Lease”). The LTC Lease provides CatchMark access rights to harvest timber as specified in the LTC Lease, which is, therefore, a lease of biological assets, and is excluded from the scope of ASC 842.
As of December 31, 2019, CatchMark had the following future lease payments under its LTC Lease:
(in thousands) | Required Payments | ||
2020 | 461 | ||
2021 | 461 | ||
2022 | 407 | ||
$ | 1,329 | ||
See Note 2 — Summary of Significant Accounting Policies for information on CatchMark's office lease, which is within the scope of ASC 842.
F- 27
Litigation
From time to time, CatchMark may be a party to legal proceedings, claims, and administrative proceedings that arise in the ordinary course of its business. Management makes assumptions and estimates concerning the likelihood and amount of any reasonably possible loss relating to these matters using the latest information available. CatchMark records a liability for litigation if an unfavorable outcome is probable and the amount of loss or range of loss can be reasonably estimated. If an unfavorable outcome is probable and a reasonable estimate of the loss is a range, CatchMark accrues the best estimate within the range. If no amount within the range is a better estimate than any other amount, CatchMark accrues the minimum amount within the range. If an unfavorable outcome is probable but the amount of the loss cannot be reasonably estimated, CatchMark discloses the nature of the litigation and indicates that an estimate of the loss or range of loss cannot be made. If an unfavorable outcome is reasonably possible and the estimated loss is material, CatchMark discloses the nature and estimate of the possible loss of the litigation. CatchMark does not disclose information with respect to litigation where an unfavorable outcome is considered to be remote.
CatchMark is not currently involved in any legal proceedings of which the outcome is reasonably likely to have a material adverse effect on the results of operations or financial condition of CatchMark. CatchMark is not aware of any legal proceedings contemplated by governmental authorities.
8.Noncontrolling Interest
CatchMark Timber Trust is the general partner of CatchMark Timber OP and owns 99.99% of its common partnership units. CatchMark LP Holder is the sole limited partner, holding 200 common units representing approximately 0.01% of the partnership interests.
On October 31, 2018, CatchMark Timber Trust, as general partner of CatchMark Timber OP, executed the Second Amended and Restated Agreement of Limited Partnership of CatchMark Timber OP (as amended, the “Partnership Agreement”) with CatchMark LP Holder. The Partnership Agreement, as amended, added provisions authorizing CatchMark Timber OP to issue a class of limited partnership interests (the “LTIP Units"), to certain officers, directors, and employees of CatchMark. LTIP Units are a class of units structured to qualify as “profits interests” for federal income tax purposes that, subject to certain conditions, including vesting, are convertible by the holder into CatchMark Timber OP common units. The LTIP Units initially have no value and are not at parity with CatchMark Timber OP common units with respect to liquidating distributions. Upon the occurrence of specified events, the LTIP Units can over time achieve partial to full parity with CatchMark Timber OP common units. Vested LTIP Units are recognized as noncontrolling interests based on the values of their respective capital accounts relative to that of the CatchMark Timber OP common units. Vested LTIP Units that have achieved full parity with CatchMark Timber OP common units are converted into Catchmark Timber OP common units on a one-for-one basis. Vested LTIP Units that have not achieved full parity with CatchMark Timber OP common units may convert into CatchMark Timber OP common units on less than a one-for-one basis based on relative capital accounts. Regular and other non-liquidating distributions will be made by CatchMark Timber OP with respect to unvested LTIP Units as provided in the applicable award agreement for such units.
Limited partners holding CatchMark Timber OP common units, including those converted from LTIP Units, have the option to cause CatchMark Timber OP to redeem such units after the units have been held for one year. Unless CatchMark Timber Trust exercises its right to purchase common units of CatchMark Timber OP in exchange for shares of its common stock, CatchMark Timber OP would redeem such units with cash equal to the value of such shares on a one-for-one basis.
CatchMark recognizes noncontrolling interest upon the issuance of LTIP Units based on the fair value of the awards on their grant date. For the year ended December 31, 2019, CatchMark recognized $0.5 million in stock-based compensation expense related to the LTIP Units, which is presented as noncontrolling interest in the consolidated balance sheets. See Note 10 — Stock-based Compensation for more details regarding LTIP Units.
9. Stockholders' Equity
F- 28
Under CatchMark's charter, it has authority to issue a total of one billion shares of capital stock. Of the total shares authorized, 900 million shares are designated as common stock with a par value of $0.01 per share and 100 million shares are designated as preferred stock.
Share Repurchase Program
On August 7, 2015, the board of directors authorized a stock repurchase program under which CatchMark may repurchase up to $30.0 million of its outstanding common shares. The program has no set duration and the board may discontinue or suspend it at any time. During the year ended December 31, 2019, CatchMark repurchased 329,150 shares of common stock for $3.0 million. All common stock purchases through the end of December 2019 under the stock repurchase program were made in open-market transactions. As of December 31, 2019, CatchMark had 49.0 million shares of common stock outstanding and may purchase up to an additional $15.7 million under the program.
Equity Offering
On June 2, 2017, CatchMark filed a shelf registration statement on Form S-3 with the SEC (the "Shelf Registration Statement"), which was declared effective by the SEC on June 16, 2017. The Shelf Registration Statement provides CatchMark with future flexibility to offer, from time to time and in one or more offerings, debt securities, common stock, preferred stock, depositary shares, warrants, or any combination thereof. The terms of any such future offerings are established at the time of an offering. In March 2018, under the Shelf Registration Statement, CatchMark issued 5.75 million shares of its common stock at a price of $12.60 per share (the "2018 Equity Offering"). After deducting $3.5 million in underwriting commissions and fees and other issuance costs, CatchMark received net proceeds of $69.0 million from the 2018 Equity Offering which was used to pay down a portion of its outstanding debt. In October 2017, CatchMark issued 4.6 million shares of its Class A common stock and received gross proceeds of $56.8 million.
Distributions
Since December 2013, CatchMark has made and intends to continue to make quarterly distributions to holders of its common stock. The table below summarizes the distributions CatchMark made during the years ended December 31, 2019, 2018 and 2017, and the tax characterization of the distributions:
2019 | 2018 | 2017 | ||||||||||
Total Cash Distributions per Common Share | $ | 0.54 | $ | 0.54 | $ | 0.54 | ||||||
Tax Characterization | ||||||||||||
Capital Gain | — | — | — | |||||||||
Return of Capital | 100 | % | 100 | % | 100 | % | ||||||
The amount of distributions and the tax treatment thereof in prior periods are not necessarily indicative of amounts anticipated in future periods.
10. Stock-based Compensation
Long-Term Incentive Plans
CatchMark's Amended and Restated 2005 Long-term Incentive Plan (the "2005 LTIP") allowed for the issuance of options, stock appreciation rights, restricted stock, RSUs, and deferred stock units of its common stock to its employees and independent directors. The 2005 LTIP provided for issuance of up to 1.3 million shares through October 25, 2023. Prior to its replacement on June 23, 2017, 406,667 shares remained for issuance under the 2005 LTIP.
F- 29
On June 23, 2017, CatchMark's stockholders approved the 2017 Incentive Plan (the "2017 Plan"), which replaced the 2005 LTIP. The 2017 Plan allows for the award of options, stock appreciation rights, restricted stock, RSUs, deferred stock units, performance awards, other stock-based awards, or any other right or interest relating to stock or cash to the employees, directors, and consultants of CatchMark or its affiliates. The 2017 Plan provides for issuance of up to 1.8 million shares through CatchMark's 2027 annual stockholders meeting, or, in the case of an amendment approved by stockholders to increase the number of shares subject to the 2017 Plan, the 10th anniversary of such amendment date. As of December 31, 2019, 913,102 shares remained available for issuance under the 2017 Plan.
Stock-based Compensation - Independent Directors
On June 28, 2019, pursuant to the Amended and Restated Independent Directors' Compensation Plan (a sub-plan of CatchMark's LTIP), CatchMark issued the annual equity-based grants to its independent directors with an aggregate grant date fair value of $0.4 million. Each independent director received a grant with a fair value of $70,000, which will vest on the date of CatchMark's 2020 annual meeting of stockholders. At their elections, three independent directors each received 6,699 shares of CatchMark's restricted stock and the remaining three independent directors each received 6,699 LTIP Units (see Note 8 — Noncontrolling Interests for further details). CatchMark recognized $0.2 million of general and administrative expense related to these awards during the year ended December 31, 2019.
Additionally, one independent director elected to receive $30,000 of his annual cash retainer in shares of CatchMark's common stock in lieu of cash.
Below is a summary of independent directors' stock-based compensation for the years ended December 31, 2019, 2018, and 2017:
(dollars in thousands, except for per-share amounts) | 2019 | 2018 | 2017 | ||||||||
Fully-vested shares granted | 2,864 | 26,568 | 24,412 | ||||||||
Weighted-average grant date fair value per share | $ | 10.47 | $ | 12.42 | $ | 11.47 | |||||
Shares of restricted stock granted | 20,097 | — | — | ||||||||
Weighted-average grant date fair value per share | $ | 10.45 | $ | — | $ | — | |||||
Number of LTIP Units granted (1) | 20,097 | $ | — | $ | — | ||||||
Grant date fair value of fully vested stock granted | $ | 30 | $ | 330 | $ | 280 | |||||
Grant date fair value of restricted stock granted | $ | 210 | $ | — | $ | — | |||||
Grant date fair value of LTIP Units granted | $ | 210 | |||||||||
Cash used to repurchase common shares for minimum tax withholdings | $ | — | $ | 53 | $ | 59 | |||||
(1) 6,699 LTIP Units vested on July 31, 2019 upon the retirement of one of the LTIP Unit recipient.
Service-based Restricted Stock Grants to Employees
On February 13, 2019, CatchMark issued 131,500 shares of service-based restricted stock to its non-executive employees, vesting in four equal installments in February of 2020, 2021, 2022, and 2023.
On July 12, 2019, CatchMark granted 99,385 shares of service-based restricted stock to its eligible executive officers pursuant to the 2019 executive compensation plan previously approved by the compensation committee of the board of directors (the "Compensation Committee"). These service-based awards will vest in four equal installments in July of 2020, 2021, 2022, and 2023.
The fair value of serviced-based restricted stock grants was determined by the closing price of CatchMark's common stock on the respective grant date.
Below is a summary of service-based restricted stock grants to the employees during the years ended December 31, 2019, 2018, and 2017:
F- 30
2019 | 2018 | 2017 | |||||||||
Shares granted | 230,885 | 175,729 | 133,591 | ||||||||
Weighted-average grant date fair value per share | $ | 9.66 | $ | 10.60 | $ | 11.19 | |||||
Grant date fair value of restricted stock vested ('000) | $ | 953 | $ | 1,756 | $ | 1,294 | |||||
Cash used to repurchase common shares for minimum tax withholdings ('000) | $ | 278 | $ | 445 | $ | 252 | |||||
A rollforward of CatchMark's unvested service-based restricted stock awards to employees for the year ended December 31, 2019 is as follows:
Number of Underlying Shares | Weighted-Average Grant Date Fair Value | |||||
Unvested at December 31, 2018 | 300,395 | $ | 10.60 | |||
Granted | 230,885 | $ | 9.66 | |||
Vested | (83,817 | ) | $ | 11.37 | ||
Forfeited | (5,062 | ) | $ | 10.85 | ||
Unvested at December 31, 2019 | 442,401 | $ | 9.96 | |||
Performance-based RSUs
On January 22, 2019, the Compensation Committee determined that, based on a set of pre-determined performance metrics between January 1, 2016 and December 31, 2018, the 80,366 RSUs issued to the executive officers in May 2016 (the "2016 Performance Awards") were forfeited. No RSUs remained outstanding as of December 31, 2019.
Outperformance Awards
On May 2, 2017, the board of directors approved a special, one-time stock-settled outperfomance award (the "OPP") to eligible executive officers of CatchMark, pursuant to the provisions of the 2005 LTIP. Under the OPP, an outperformance pool with a maximum award dollar amount of $5.0 million was created and executive officers were
granted a certain participation percentage of the outperformance pool. The dollar amount of the awards earned will be determined based on the total returns of CatchMark common stock during a performance period from April 1, 2017 to March 31, 2020. Earned awards will be settled in shares of CatchMark common stock after the amount of earned award is determined at the end of the performance period. The grant-date fair value of the OPP was $1.0 million as calculated using Monte-Carlo simulations and is amortized over the performance period.
Performance-based LTIP Units Grants
On July 12, 2019, CatchMark granted 184,944 LTIP Units to its eligible executive officers, which represents the maximum number of LTIP Units that could be earned based on the relative performance of CatchMark's TSR as compared to pre-established peer groups’ TSRs and to the Russell 3000 Index over a three-year performance period from January 1, 2019 to December 31, 2021. The Compensation Committee will determine the earned awards after the end of the performance period, and the earned awards will vest in two equal installments in the first quarter of 2022 and 2023. The fair value of the 2019 performance-based LTIP Units awards was calculated using the Monte-Carlo simulation with the following:
Grant date market price (July 12, 2019) | $ | 10.08 | |
Weighted-average fair value per granted share | $ | 8.13 | |
Assumptions: | |||
Volatility | 22.88 | % | |
Expected term (years) | 3.0 | ||
Risk-free interest rate | 1.85 | % | |
F- 31
On November 29, 2018, CatchMark granted 116,439 LTIP Units (the "2017 Performance LTIP Units") and 102,847 LTIP Units (the "2018 Performance LTIP Units") to two of its executive officers, which represent the maximum number of LTIP Units that could be earned based on the relative performance of CatchMark's TSR as compared to a pre-established peer group's TSR, to the Russell 3000 Index, and to the NCREIF Timberland Index. The performance/measurement period is a three-year period from January 1, 2017 to December 31, 2019 for the 2017 Performance LTIP Units and from January 1, 2018 to December 31, 2020 for the 2018 Performance LTIP Units. The Compensation Committee will determine the earned awards for each award following the end of the respective performance period, and the earned awards will vest in two equal installments on the respective determination date and the one-year anniversary of the respective determination date.
The fair value of the 2017 Performance LTIP Awards was calculated using a Monte-Carlo simulation with the following assumptions:
Grant date market price (November 29, 2018) | $ | 8.47 | |
Weighted-average fair value per granted share | $ | 1.31 | |
Assumptions: | |||
Volatility | 25.30 | % | |
Expected term (years) | 3.0 | ||
Risk-free interest rate | 2.89 | % | |
The fair value of the 2018 Performance LTIP Awards was calculated using a Monte-Carlo simulation with the following assumptions:
Grant date market price (November 29, 2018) | $ | 8.47 | |
Weighted-average fair value per granted share | $ | 1.82 | |
Assumptions: | |||
Volatility | 25.30 | % | |
Expected term (years) | 3.0 | ||
Risk-free interest rate | 2.89 | % | |
A rollforward of CatchMark's unvested, performance-based LTIP units grants for the year ended December 31, 2019 is as follows:
Number of Underlying Shares | Weighted-Average Grant Date Fair Value | |||||
Unvested at December 31, 2018 | 219,286 | $ | 1.55 | |||
Granted | 184,944 | $ | 8.13 | |||
Vested | — | $ | — | |||
Forfeited | — | $ | — | |||
Unvested at December 31, 2019 | 404,230 | $ | 4.56 | |||
Stock-based Compensation Expense
A summary of CatchMark's stock-based compensation expense is presented below:
(in thousands) | 2019 | 2018 | 2017 | ||||||||
General and administrative expenses | $ | 2,527 | $ | 2,356 | $ | 1,956 | |||||
Forestry management expenses | 263 | 333 | 830 | ||||||||
Total | $ | 2,790 | $ | 2,689 | $ | 2,786 | |||||
F- 32
As of December 31, 2019, $4.6 million of unrecognized compensation expense remained and will be recognized over a weighted-average period of 2.5 years.
11. Recreational Leases
CatchMark leases certain access rights to individuals and companies for recreational purposes. These operating leases generally have terms of one year with certain provisions to extend the lease agreements for another one-year term. CatchMark retains substantially all of the risks and benefits of ownership of the timberland properties leased to tenants. As of December 31, 2019, 404,600 acres, or 99.8% of CatchMark’s timberland available for recreational uses, had been leased to tenants under operating leases that expire between May and July 2020. Under the terms of the recreational leases, tenants are required to pay the entire rent upon execution of the lease agreement. Such rental receipts are recorded as deferred revenues until earned over the terms of the respective lease terms and recognized as other revenue. As of December 31, 2019 and 2018, $1.9 million and $1.9 million, respectively, of such rental receipts are included in other liabilities in the accompanying consolidated balance sheets. For the three years ended December 31, 2019, 2018 and 2017, CatchMark recognized other revenues related to recreational leases of $4.1 million, $4.7 million, $4.5 million, respectively.
12. Income Taxes
CatchMark TRS is generally the only subsidiary of CatchMark subject to U.S. federal and state income taxes. CatchMark TRS records deferred income taxes using enacted tax laws and rates for the years in which the taxes are expected to be paid. Deferred income tax assets and liabilities are recorded based on the differences between the financial reporting and income tax bases of assets and liabilities. A valuation allowance is provided when it is more likely than not that some portion or all of a deferred tax asset will not be realized. For the years ended December 31, 2018 and 2017, CatchMark TRS has recorded a full valuation allowance on its net deferred tax assets. As of December 31, 2019, CatchMark TRS is no longer in a three-year cumulative loss position, and, based on projected future income, it is more likely than not that a portion of its deferred income tax asset will be realized. Therefore, for the year ended December 31, 2019, CatchMark TRS reported a net deferred tax asset and a corresponding income tax benefit in the amount of $1.1 million.
The Tax Cuts and Jobs Act ("TCJA") was signed into law on December 22, 2017 and became effective on January 1, 2018. TCJA made many significant changes to the U.S. tax law, including a reduction in the corporate tax rates, changes to net operating loss carryforwards and carrybacks, and a repeal of the corporate alternative minimum tax, among other changes. TCJA reduced the U.S. corporate tax rate to 21% from 35%, and accordingly, CatchMark TRS revalued its cumulative deferred tax assets and liability as of December 31, 2017 at the newly-enacted rate. As a result, CatchMark TRS' deferred tax liability was reduced by $8,800, deferred tax assets were reduced by $4.8 million, and the valuation allowance was reduced by $4.8 million.
As of December 31, 2019, CatchMark Timber Trust and CatchMark TRS had the following federal and state net operating loss ("NOL") carryforwards:
(in millions) | Federal | State | Total | ||||||||
CatchMark Timber Trust | $ | 121.4 | (1) | $ | 102.6 | $ | 224.0 | ||||
CatchMark TRS | $ | 27.6 | (2) | $ | 20.3 | $ | 47.9 | ||||
Total | $ | 149.0 | $ | 122.9 | $ | 271.9 | |||||
(1) Includes $108.3 million of NOL generated prior to January 1, 2018.
(2) Entire $27.6 million of NOL generated prior to January 1, 2018.
Such NOL carryforwards may be utilized, subject to certain limitations, to offset future taxable income. The federal NOL generated prior to January 1, 2018 would begin to expire in 2027 and the state NOL generated prior to January 1, 2018 would begin to expire in 2022. TCJA allows CatchMark Timber Trust and CatchMark TRS to carry forward its federal NOL generated beginning January 1, 2018 indefinitely, however, the use of the NOL in any given tax year will be limited to 80% of the annual taxable income.
The other provisions of TCJA did not have a material impact on the accompanying consolidated financial statements of CatchMark for the years ended December 31, 2019, 2018 and 2017.
F- 33
Components of the deferred tax asset as of December 31, 2019 and 2018 were attributable to the operations of CatchMark TRS only and were as follows:
As of December 31, | |||||||
(in thousands) | 2019 | 2018 | |||||
Deferred tax assets: | |||||||
Net operating loss carryforward | $ | 6,711 | $ | 8,612 | |||
Gain on timberland sales | 34 | 8 | |||||
Other | 648 | 418 | |||||
Total gross deferred tax asset | 7,393 | 9,038 | |||||
Valuation allowance | (6,185 | ) | (8,949 | ) | |||
Total net deferred tax asset | $ | 1,208 | $ | 89 | |||
Deferred tax liability: | |||||||
Timber depletion | 81 | 89 | |||||
Total gross deferred tax liability | $ | 81 | $ | 89 | |||
Deferred tax asset, net | $ | 1,127 | $ | — | |||
Income taxes for financial reporting purposes differ from the amount computed by applying the statutory federal rate primarily due to the effect of state income taxes and valuation allowances (net of federal benefit). A reconciliation of the federal statutory income tax rate to CatchMark TRS’ effective tax rate for the years ended December 31, 2019, 2018, and 2017 is as follows:
2019 | 2018 | 2017 | ||||||
Federal statutory income tax rate | 21.0 | % | 21.0 | % | 34.0 | % | ||
State income taxes, net of federal benefit | — | % | — | % | — | % | ||
Other temporary differences | 5.1 | % | (0.2 | )% | (0.4 | )% | ||
Other permanent differences | 6.3 | % | 5.4 | % | (0.1 | )% | ||
Effects of federal rate change | — | % | — | % | (83.8 | )% | ||
Valuation allowance | (53.9 | )% | (1) | (26.2 | )% | 50.3 | % | |
Effective tax rate | (21.5 | )% | — | % | — | % | ||
(1) Represents a partial valuation allowance against federal net operating losses for the year ended December 31, 2019, as CatchMark does not believe those losses will be fully utilized in the future. CatchMark recorded a full valuation allowance against federal net operating losses for the years ended December 31, 2018 and 2017.
As of December 31, 2019 and 2018, the tax basis carrying value of CatchMark’s total timber assets was $626.7 million and $679.5 million, respectively.
13. Quarterly Results (unaudited)
Presented below is a summary of the unaudited quarterly financial information for the years ended December 31, 2019 and 2018:
F- 34
2019 | |||||||||||||||
(in thousands, except for per-share amounts) | First Quarter | Second Quarter | Third Quarter | Fourth Quarter | |||||||||||
Revenues | $ | 22,573 | $ | 28,660 | $ | 26,380 | $ | 29,096 | |||||||
Income (loss) before unconsolidated joint ventures and income taxes | $ | (3,086 | ) | $ | (1,914 | ) | $ | 4,494 | $ | (4,471 | ) | ||||
Net loss | $ | (30,395 | ) | $ | (30,565 | ) | $ | (20,557 | ) | $ | (11,804 | ) | |||
Basic and diluted net loss per share | $ | (0.62 | ) | $ | (0.62 | ) | $ | (0.42 | ) | $ | (0.24 | ) | |||
2018 | |||||||||||||||
(in thousands, except for per-share amounts) | First Quarter | Second Quarter | Third Quarter | Fourth Quarter | |||||||||||
Revenues | $ | 24,104 | $ | 26,249 | $ | 24,577 | $ | 22,927 | |||||||
Loss before unconsolidated joint ventures and income taxes | $ | (5,206 | ) | $ | (2,214 | ) | $ | (2,134 | ) | $ | (5,536 | ) | |||
Net loss (2) | $ | (3,385 | ) | $ | (1,505 | ) | $ | (78,899 | ) | $ | (38,218 | ) | |||
Basic and diluted net loss per share (1) | $ | (0.08 | ) | $ | (0.03 | ) | $ | (1.61 | ) | $ | (0.78 | ) | |||
(1) The sum of the quarterly amounts does not equal net loss per share for the year due to changes in weighted-average shares outstanding over the year.
(2) The increase in net loss in the third quarter of 2018 was primarily a result of recognizing $81.8 million of losses from the Triple T Joint Venture under the HLBV method of accounting.
14. Customer Concentration
For the years ended December 31, 2019, 2018, and 2017, WestRock represented 16%, 20%, and 21% of CatchMark's total revenues, respectively. No other customer represented more than 10% of CatchMark's total revenues during 2019. For the years ended December 31, 2018 and 2017, IP represented 12% and 10% of CatchMark's total revenues, respectively.
15. | Segment Information |
As of December 31, 2019, CatchMark had the following reportable segments: Harvest, Real Estate and Investment Management. Harvest includes wholly-owned timber assets and associated timber sales, other revenues and related expenses. Real Estate includes timberland sales, cost of timberland sales and large dispositions. Investment Management includes investment in and income (loss) from unconsolidated joint ventures and asset management fee revenues earned for the management of these joint ventures. General and administrative expenses, along with other expense and income items, are not allocated among segments. Asset information and capital expenditures by segment are not reported because CatchMark does not use these measures to assess performance. CatchMark’s investments in unconsolidated joint ventures are reported separately on the accompanying consolidated balance sheets. During the periods presented, there have been no material intersegment transactions.
The following table presents operating revenues by reportable segment:
For the Years Ended December 31, | |||||||||||
(in thousands) | 2019 | 2018 | 2017 | ||||||||
Harvest | $ | 77,189 | $ | 74,734 | $ | 76,419 | |||||
Real Estate | 17,572 | 17,520 | 14,768 | ||||||||
Investment Management | 11,948 | 5,603 | 108 | ||||||||
Total | $ | 106,709 | $ | 97,857 | $ | 91,295 | |||||
F- 35
Adjusted EBITDA is the primary performance measure reviewed by management to assess operating performance. The following table presents Adjusted EBITDA by reportable segment:
For the Years Ended December 31, | |||||||||||
(in thousands) | 2019 | 2018 | 2017 | ||||||||
Harvest | $ | 33,670 | $ | 31,191 | $ | 33,855 | |||||
Real Estate | 16,559 | 16,388 | 14,235 | ||||||||
Investment Management | 16,749 | 12,431 | 2,111 | ||||||||
Corporate | (10,072 | ) | (10,224 | ) | (8,231 | ) | |||||
Total | $ | 56,906 | $ | 49,786 | $ | 41,970 | |||||
A reconciliation of Adjusted EBITDA to GAAP net loss is presented below:
(in thousands) | 2019 | 2018 | 2017 | ||||||||
Adjusted EBITDA | $ | 56,906 | $ | 49,786 | $ | 41,970 | |||||
Subtract: | |||||||||||
Depletion | 28,064 | 25,912 | 29,035 | ||||||||
Interest expense (1) | 17,058 | 13,643 | 10,093 | ||||||||
Amortization (1) | 1,786 | 2,821 | 1,270 | ||||||||
Income tax benefit | (1,127 | ) | — | — | |||||||
Depletion, amortization, and basis of timberland and mitigation credits sold included in loss from unconsolidated joint venture (2) | 3,823 | 4,195 | 865 | ||||||||
Basis of timberland sold, lease terminations and other (3) | 14,964 | 13,053 | 10,112 | ||||||||
Stock-based compensation expense | 2,790 | 2,689 | 2,786 | ||||||||
(Gain) loss from large dispositions (4) | (7,961 | ) | 390 | — | |||||||
HLBV loss from unconsolidated joint venture (5) | 90,450 | 109,550 | — | ||||||||
Other (6) | 380 | (460 | ) | 1,319 | |||||||
Net loss | $ | (93,321 | ) | $ | (122,007 | ) | $ | (13,510 | ) | ||
(1) | For the purpose of the above reconciliation, amortization includes amortization of deferred financing costs, amortization of operating lease assets and liabilities, amortization of intangible lease assets, and amortization of mainline road costs, which are included in either interest expense, land rent expense, or other operating expenses in the accompanying consolidated statements of operations.Includes non-cash basis of timber and timberland assets written-off related to timberland sold, terminations of timberland leases and casualty losses. |
(2) | Reflects our share of depletion, amortization, and basis of timberland and mitigation credits sold of the unconsolidated Dawsonville Bluffs Joint Venture. |
(3) | Includes non-cash basis of timber and timberland assets written-off related to timberland sold, terminations of timberland leases and casualty losses. |
(4) | Large dispositions are sales of blocks of timberland properties in one or several transactions with the objective to generate proceeds to fund capital allocation priorities. Large dispositions may or may not have a higher or better use than timber production or result in a price premium above the land’s timber production value. Such dispositions are infrequent in nature, are not part of core operations, and would cause material variances in comparative results if not reported separately. |
(5) | Reflects HLBV (income) losses from the Triple T Joint Venture, which is determined based on a hypothetical liquidation of the underlying joint venture at book value as of the reporting date. |
(6) | Includes certain cash expenses paid, or reimbursement received, that management believes do not directly reflect the core business operations of our timberland portfolio on an on-going basis, including costs required to be expensed by GAAP related to acquisitions, transactions, joint ventures or new business initiatives. |
16. | Subsequent Events |
Large Disposition
F- 36
On January 31, 2020, CatchMark completed the sale of 14,400 acres of its wholly-owned timberlands located in Georgia for $21.3 million, exclusive of transaction costs. CatchMark's total cost basis was $19.5 million. Of the total net proceeds, $20.8 million was used to pay down CatchMark's outstanding debt balance on the Multi-Draw Term Facility on February 3, 2020.
Chief Executive Officer Retirement
On January 21, 2020, CatchMark announced the retirement of Jerrold Barag as its Chief Executive Officer and a director. CatchMark expects to incur a one-time expense of approximately $3.0 million during the first quarter of 2020 related to this retirement. This expense includes cash payments made upon retirement and the financial impact of vesting equity grants previously awarded.
Dividend Declaration
On February 13, 2020, CatchMark declared a cash dividend of $0.135 per share for its common stockholders of record on February 28, 2020, payable on March 16, 2020.
F- 37