Attached files
| file | filename |
|---|---|
| EX-99.3 - EXHIBIT 99.3 - GAIN Capital Holdings, Inc. | ex993agreementandplanofmer.htm |
| EX-99.1 - EXHIBIT 99.1 - GAIN Capital Holdings, Inc. | ex99112-31x19earningsrelea.htm |
| 8-K - 8-K - GAIN Capital Holdings, Inc. | form8-kq42019earnings.htm |
Q4and Full Year2019 Results February 2020 1
SAFE HARBOR STATEMENT Forward Looking Statements In addition to historical information, this earnings presentation contains "forward-looking" statements that reflect management's expectations for the future. A variety of important factors could cause results to differ materially from such statements. These factors are noted throughout GAIN Capital's annual report on Form 10-K for the year ended December 31, 2018, as filed with the Securities and Exchange Commission on March 11, 2019, and include, but are not limited to, the actions of both current and potential new competitors, fluctuations in market trading volumes, financial market volatility, evolving industry regulations, errors or malfunctions in GAIN Capital’s systems or technology, rapid changes in technology, effects of inflation, customer trading patterns, the success of our products and service offerings, our ability to continue to innovate and meet the demands of our customers for new or enhanced products, our ability to successfully integrate assets and companies we have acquired, our ability to effectively compete, changes in tax policy or accounting rules, fluctuations in foreign exchange rates and commodity prices, adverse changes or volatility in interest rates, as well as general economic, business, credit and financial market conditions, internationally or nationally, and our ability to continue paying a quarterly dividend in light of future financial performance and financing needs. The forward-looking statements included herein represent GAIN Capital’s views as of the date of this release. GAIN Capital undertakes no obligation to revise or update publicly any forward-looking statement for any reason unless required by law. Non-GAAP Financial Measures This presentation contains various non-GAAP financial measures, including adjusted EBITDA, adjusted net income, and adjusted EPS. These non-GAAP financial measures have certain limitations, including that they do not have a standardized meaning and, therefore, our definitions may be different from similar non-GAAP financial measures used by other companies and/or analysts. Thus, it may be more difficult to compare our financial performance to that of other companies. We believe our reporting of these non-GAAP financial measures assists investors in evaluating our historical and expected operating performance. However, because these are not measures of financial performance calculated in accordance with GAAP, such measures should be considered in addition to, but not as a substitute for, other measures of our financial performance reported in accordance with GAAP, such as net income. See the Appendix for a reconciliation of the non-GAAP financial measures used herein to the most directly comparable GAAP measure. 2
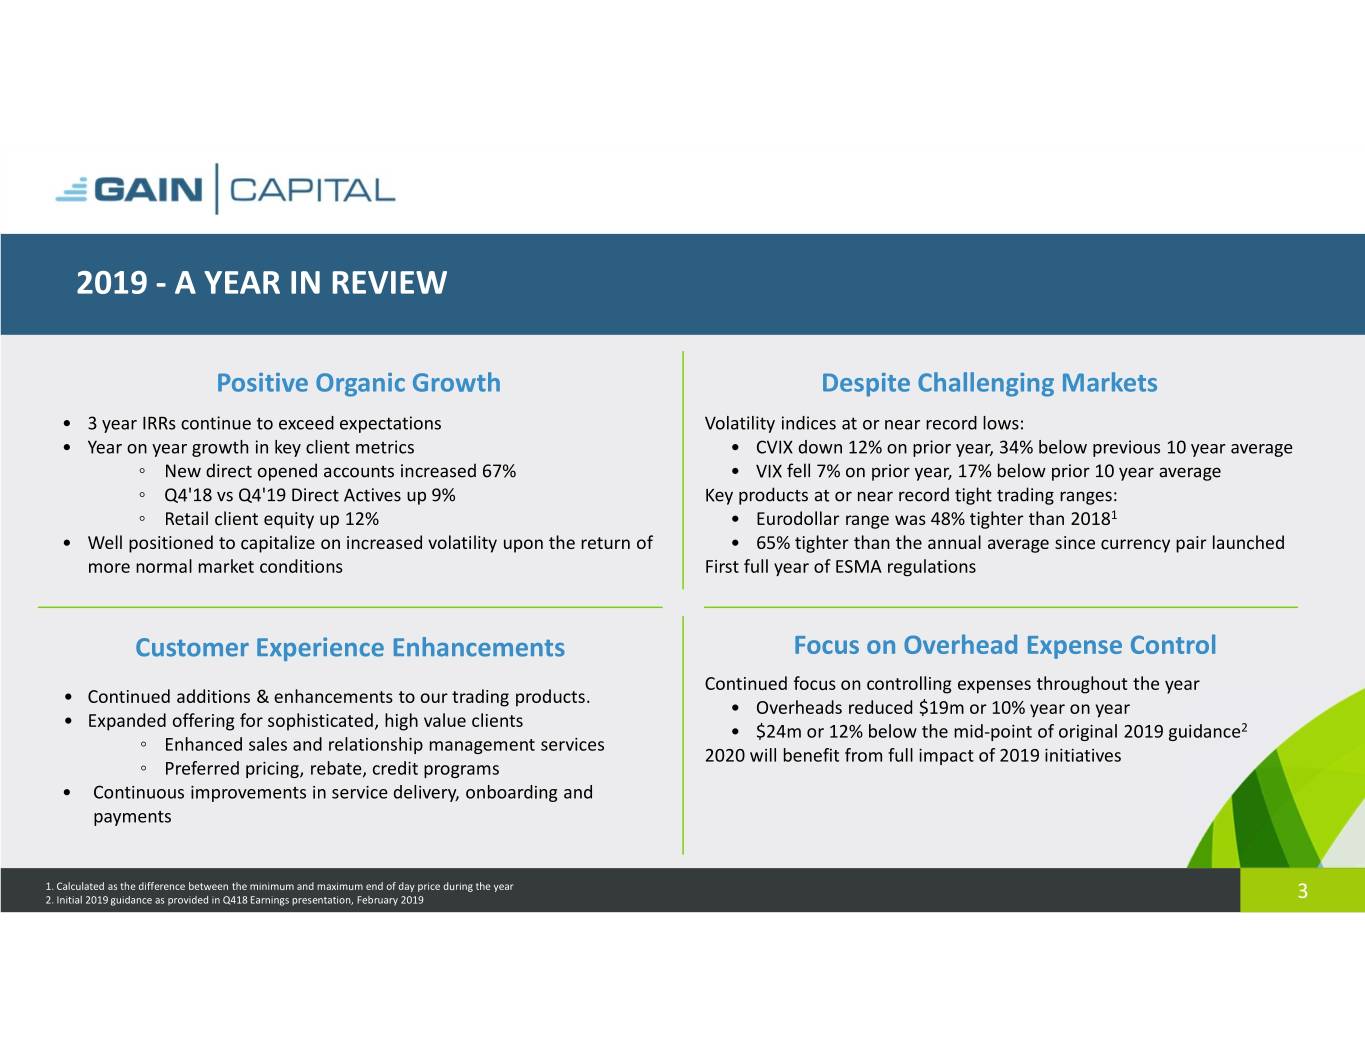
2019 - A YEAR IN REVIEW Positive Organic Growth Despite Challenging Markets • 3 year IRRs continue to exceed expectations Volatility indices at or near record lows: • Year on year growth in key client metrics • CVIX down 12% on prior year, 34% below previous 10 year average ◦ New direct opened accounts increased 67% • VIX fell 7% on prior year, 17% below prior 10 year average ◦ Q4'18 vs Q4'19 Direct Actives up 9% Key products at or near record tight trading ranges: ◦ Retail client equity up 12% • Eurodollar range was 48% tighter than 20181 • Well positioned to capitalize on increased volatility upon the return of • 65% tighter than the annual average since currency pair launched more normal market conditions First full year of ESMA regulations Customer Experience Enhancements Focus on Overhead Expense Control Continued focus on controlling expenses throughout the year • Continued additions & enhancements to our trading products. • Overheads reduced $19m or 10% year on year • Expanded offering for sophisticated, high value clients • $24m or 12% below the mid-point of original 2019 guidance2 ◦ Enhanced sales and relationship management services 2020 will benefit from full impact of 2019 initiatives ◦ Preferred pricing, rebate, credit programs • Continuous improvements in service delivery, onboarding and payments 1. Calculated as the difference between the minimum and maximum end of day price during the year 2. Initial 2019 guidance as provided in Q418 Earnings presentation, February 2019 3
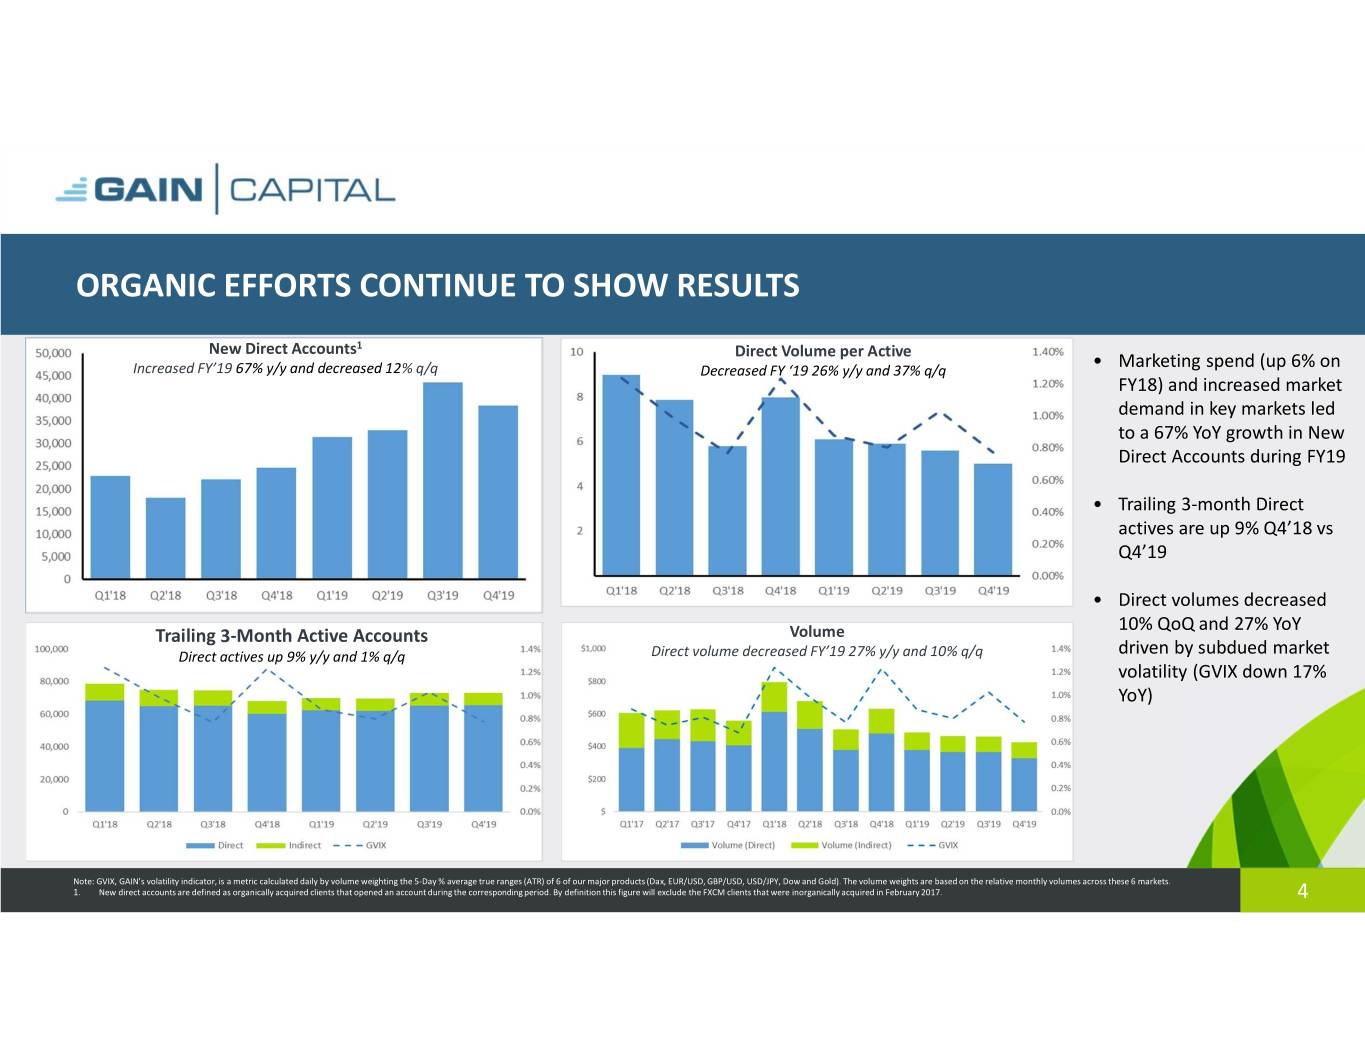
ORGANIC EFFORTS CONTINUE TO SHOW RESULTS New Direct Accounts1 Direct Volume per Active Increased FY’19 67% y/y and decreased 12% q/q Decreased FY ‘19 26% y/y and 37% q/q • Marketing spend (up 6% on FY18) and increased market demand in key markets led to a 67% YoY growth in New Direct Accounts during FY19 • Trailing 3-month Direct actives are up 9% Q4’18 vs Q4’19 • Direct volumes decreased 10% QoQ and 27% YoY Trailing 3-Month Active Accounts Volume Direct actives up 9% y/y and 1% q/q Direct volume decreased FY’19 27% y/y and 10% q/q driven by subdued market volatility (GVIX down 17% YoY) Note: GVIX, GAIN’s volatility indicator, is a metric calculated daily by volume weighting the 5-Day % average true ranges (ATR) of 6 of our major products (Dax, EUR/USD, GBP/USD, USD/JPY, Dow and Gold). The volume weights are based on the relative monthly volumes across these 6 markets. 1. New direct accounts are defined as organically acquired clients that opened an account during the corresponding period. By definition this figure will exclude the FXCM clients that were inorganically acquired in February 2017. 4
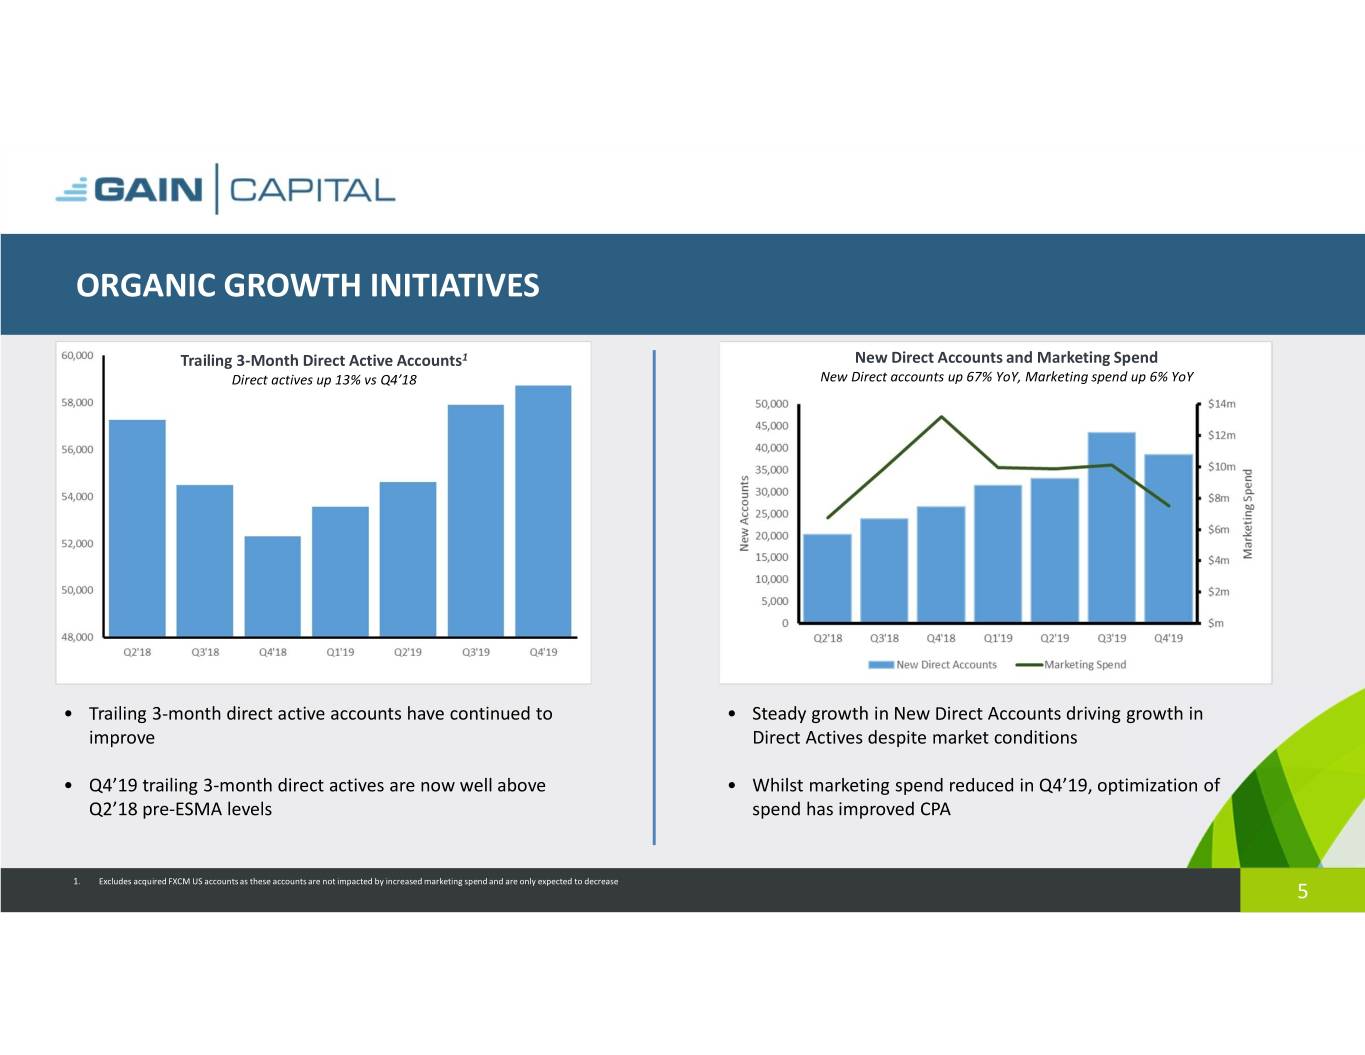
ORGANIC GROWTH INITIATIVES Trailing 3-Month Direct Active Accounts1 New Direct Accounts and Marketing Spend Direct actives up 13% vs Q4’18 New Direct accounts up 67% YoY, Marketing spend up 6% YoY • Trailing 3-month direct active accounts have continued to • Steady growth in New Direct Accounts driving growth in improve Direct Actives despite market conditions • Q4’19 trailing 3-month direct actives are now well above • Whilst marketing spend reduced in Q4’19, optimization of Q2’18 pre-ESMA levels spend has improved CPA 1. Excludes acquired FXCM US accounts as these accounts are not impacted by increased marketing spend and are only expected to decrease 5
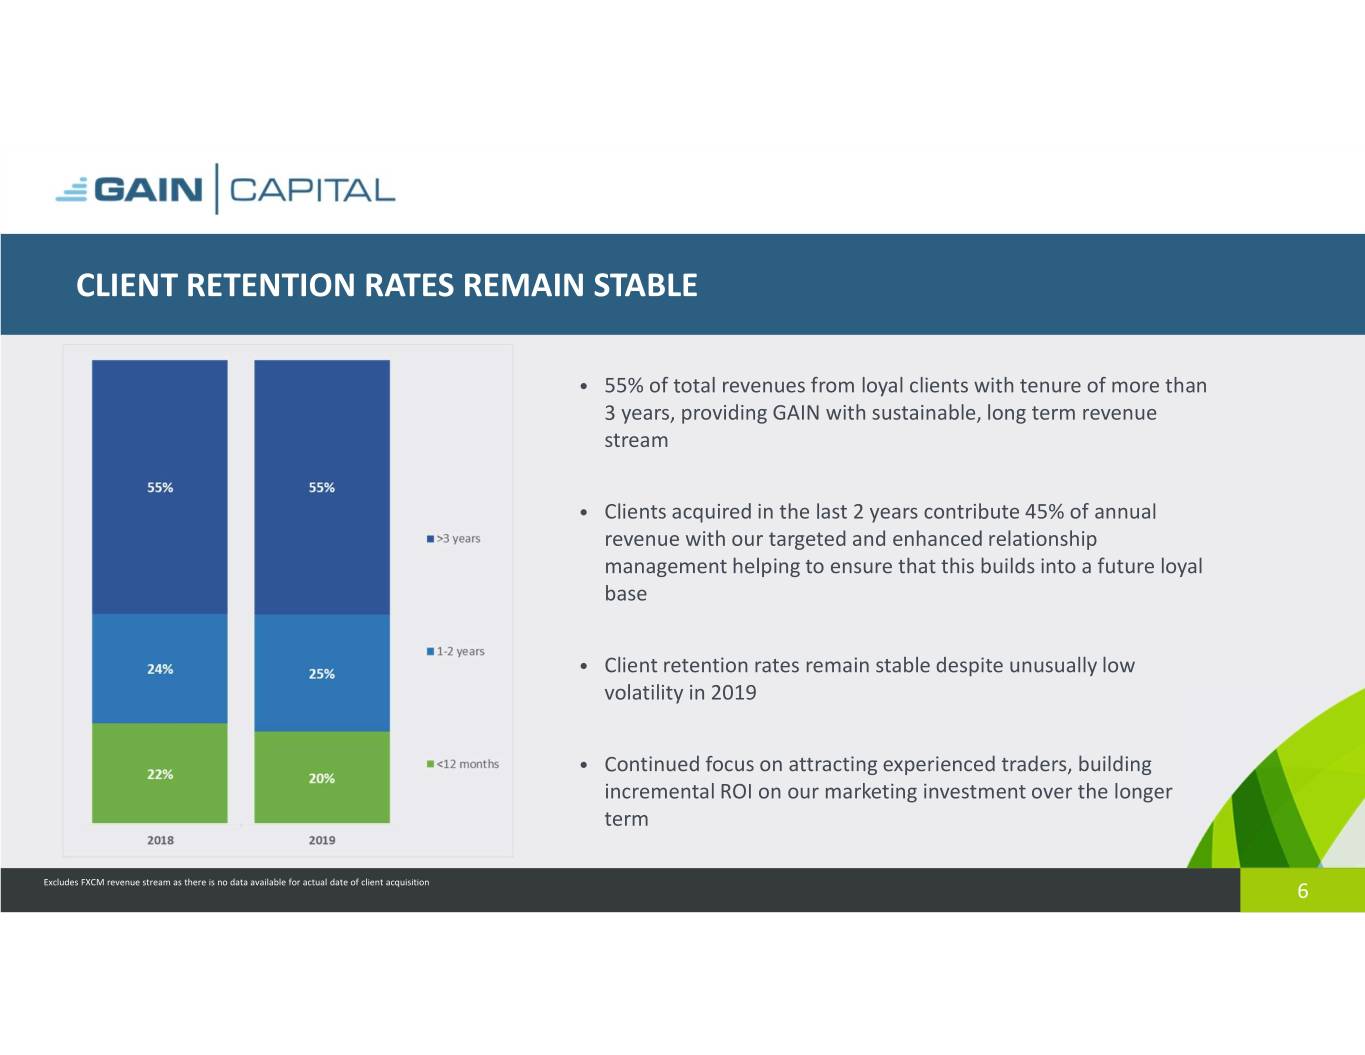
CLIENT RETENTION RATES REMAIN STABLE • 55% of total revenues from loyal clients with tenure of more than 3 years, providing GAIN with sustainable, long term revenue stream • Clients acquired in the last 2 years contribute 45% of annual revenue with our targeted and enhanced relationship management helping to ensure that this builds into a future loyal base • Client retention rates remain stable despite unusually low volatility in 2019 • Continued focus on attracting experienced traders, building incremental ROI on our marketing investment over the longer term Excludes FXCM revenue stream as there is no data available for actual date of client acquisition 6
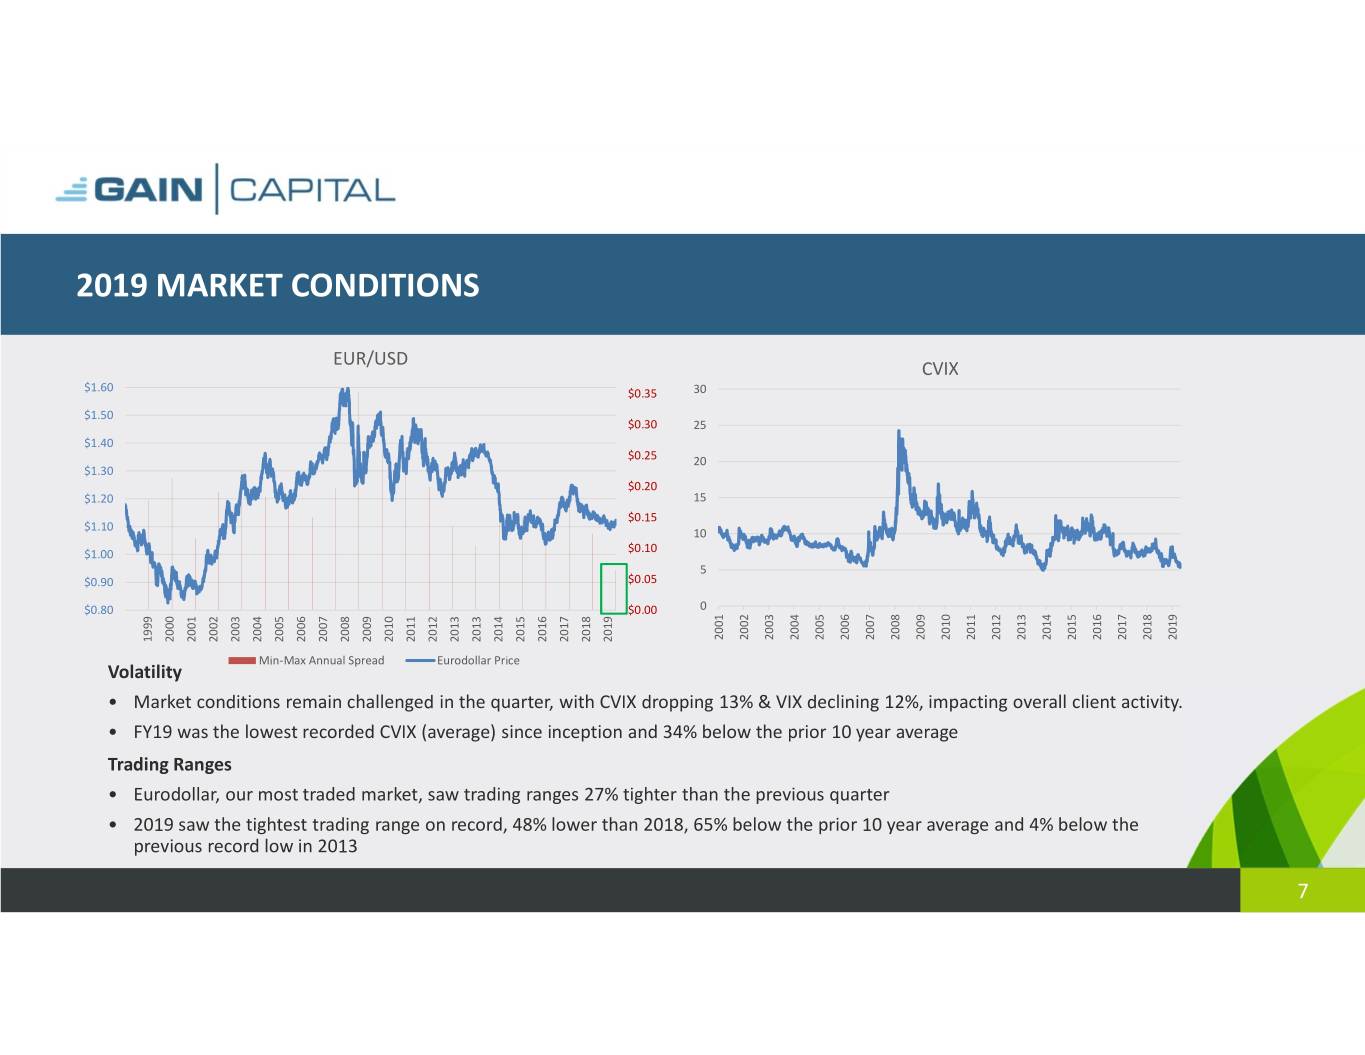
2019 MARKET CONDITIONS EUR/USD CVIX $1.60 $0.35 30 $1.50 $0.30 25 $1.40 $0.25 20 $1.30 $0.20 $1.20 15 $0.15 $1.10 10 $1.00 $0.10 5 $0.90 $0.05 $0.80 $0.00 0 2001 2002 2003 2004 2005 2006 2007 2008 2009 2010 2011 2012 2013 2014 2015 2016 2017 2018 2019 1999 1999 2000 2001 2002 2003 2004 2005 2006 2007 2008 2009 2010 2011 2012 2013 2013 2014 2015 2016 2017 2018 2019 Min-Max Annual Spread Eurodollar Price Volatility • Market conditions remain challenged in the quarter, with CVIX dropping 13% & VIX declining 12%, impacting overall client activity. • FY19 was the lowest recorded CVIX (average) since inception and 34% below the prior 10 year average Trading Ranges • Eurodollar, our most traded market, saw trading ranges 27% tighter than the previous quarter • 2019 saw the tightest trading range on record, 48% lower than 2018, 65% below the prior 10 year average and 4% below the previous record low in 2013 7
Financial Review 8
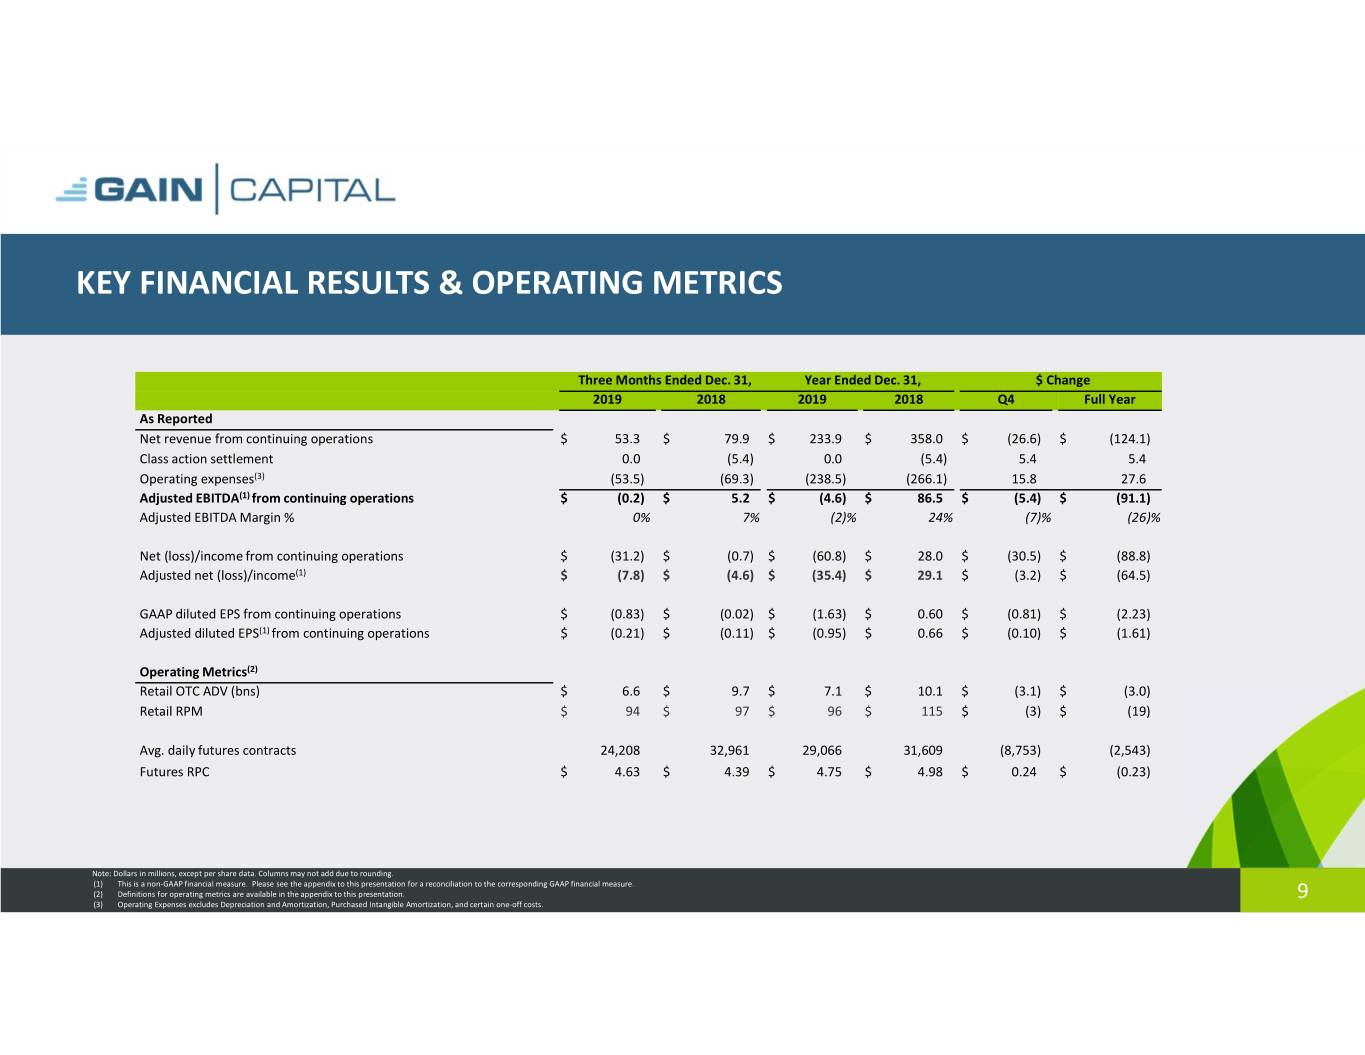
KEY FINANCIAL RESULTS & OPERATING METRICS Three Months Ended Dec. 31, Year Ended Dec. 31, $ Change 2019 2018 2019 2018 Q4 Full Year As Reported Net revenue from continuing operations $ 53.3 $ 79.9 $ 233.9 $ 358.0 $ (26.6) $ (124.1) Class action settlement 0.0 (5.4) 0.0 (5.4) 5.4 5.4 Operating expenses(3) (53.5) (69.3) (238.5) (266.1) 15.8 27.6 Adjusted EBITDA(1) from continuing operations $ (0.2) $ 5.2 $ (4.6) $ 86.5 $ (5.4) $ (91.1) Adjusted EBITDA Margin % 0% 7% (2)% 24% (7)% (26)% Net (loss)/income from continuing operations $ (31.2) $ (0.7) $ (60.8) $ 28.0 $ (30.5) $ (88.8) Adjusted net (loss)/income(1) $ (7.8) $ (4.6) $ (35.4) $ 29.1 $ (3.2) $ (64.5) GAAP diluted EPS from continuing operations $ (0.83) $ (0.02) $ (1.63) $ 0.60 $ (0.81) $ (2.23) Adjusted diluted EPS(1) from continuing operations $ (0.21) $ (0.11) $ (0.95) $ 0.66 $ (0.10) $ (1.61) Operating Metrics(2) Retail OTC ADV (bns) $ 6.6 $ 9.7 $ 7.1 $ 10.1 $ (3.1) $ (3.0) Retail RPM $ 94$ 97$ 96$ 115 $ (3)$ (19) Avg. daily futures contracts 24,208 32,961 29,066 31,609 (8,753) (2,543) Futures RPC $ 4.63 $ 4.39$ 4.75 $ 4.98$ 0.24 $ (0.23) Note: Dollars in millions, except per share data. Columns may not add due to rounding. (1) This is a non-GAAP financial measure. Please see the appendix to this presentation for a reconciliation to the corresponding GAAP financial measure. (2) Definitions for operating metrics are available in the appendix to this presentation. 9 (3) Operating Expenses excludes Depreciation and Amortization, Purchased Intangible Amortization, and certain one-off costs.
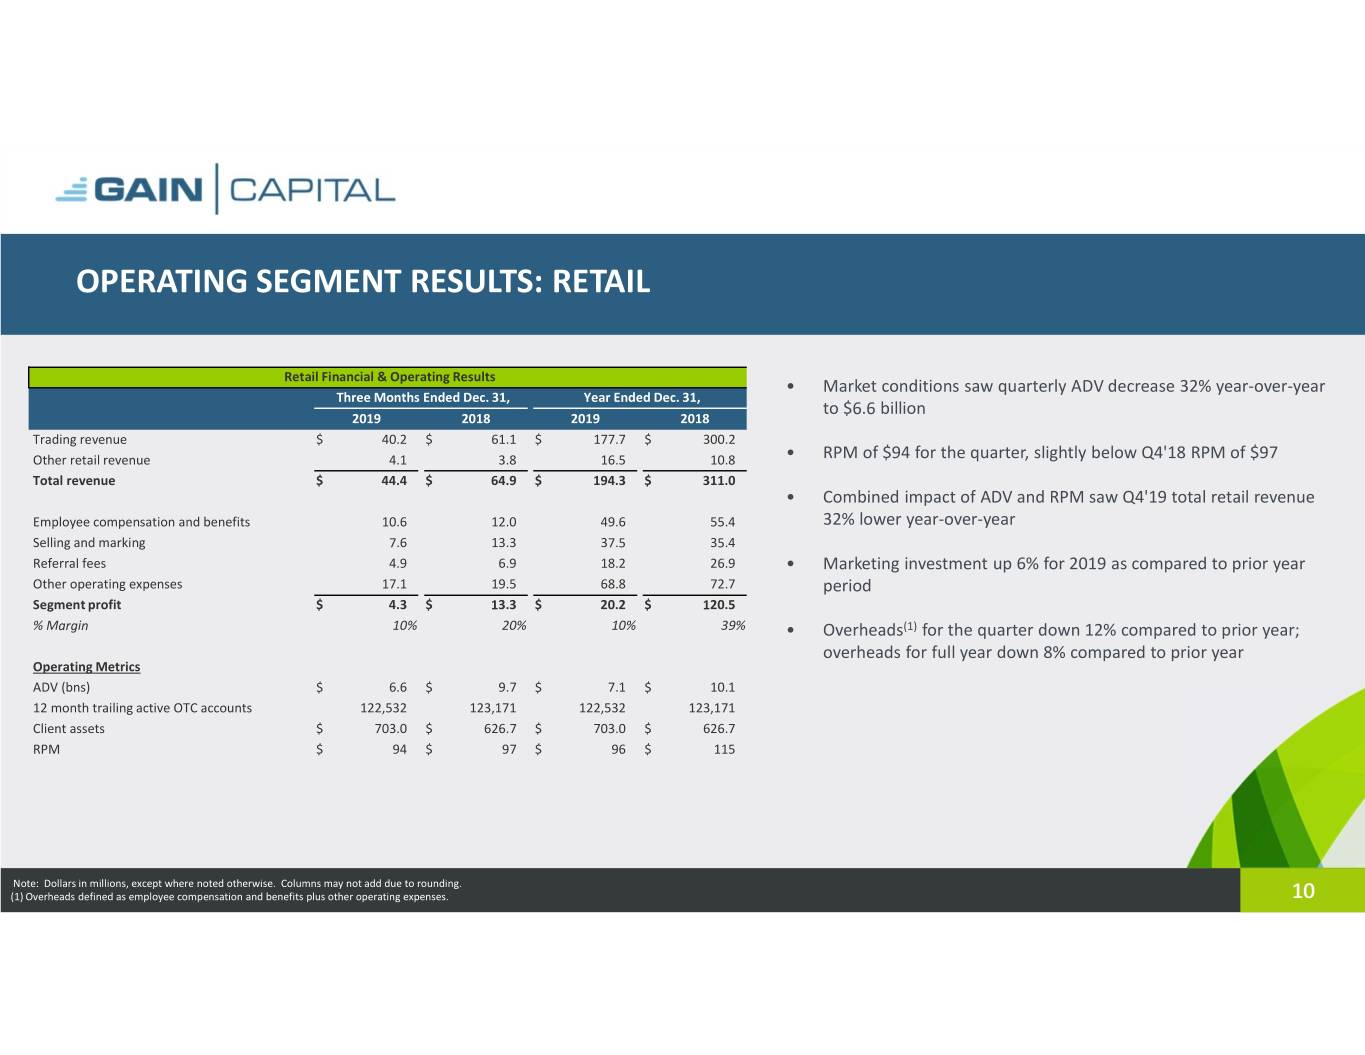
OPERATING SEGMENT RESULTS: RETAIL Retail Financial & Operating Results • Market conditions saw quarterly ADV decrease 32% year-over-year Three Months Ended Dec. 31, Year Ended Dec. 31, to $6.6 billion 2019 2018 2019 2018 Trading revenue $ 40.2 $ 61.1 $ 177.7 $ 300.2 Other retail revenue 4.1 3.8 16.5 10.8 • RPM of $94 for the quarter, slightly below Q4'18 RPM of $97 Total revenue $ 44.4 $ 64.9 $ 194.3 $ 311.0 • Combined impact of ADV and RPM saw Q4'19 total retail revenue Employee compensation and benefits 10.6 12.0 49.6 55.4 32% lower year-over-year Selling and marking 7.6 13.3 37.5 35.4 Referral fees 4.9 6.9 18.2 26.9 • Marketing investment up 6% for 2019 as compared to prior year Other operating expenses 17.1 19.5 68.8 72.7 period Segment profit $ 4.3 $ 13.3 $ 20.2 $ 120.5 % Margin 10% 20% 10% 39% • Overheads(1) for the quarter down 12% compared to prior year; overheads for full year down 8% compared to prior year Operating Metrics ADV (bns) $ 6.6 $ 9.7 $ 7.1 $ 10.1 12 month trailing active OTC accounts 122,532 123,171 122,532 123,171 Client assets $ 703.0 $ 626.7 $ 703.0 $ 626.7 RPM $ 94$ 97$ 96$ 115 Note: Dollars in millions, except where noted otherwise. Columns may not add due to rounding. (1) Overheads defined as employee compensation and benefits plus other operating expenses. 10
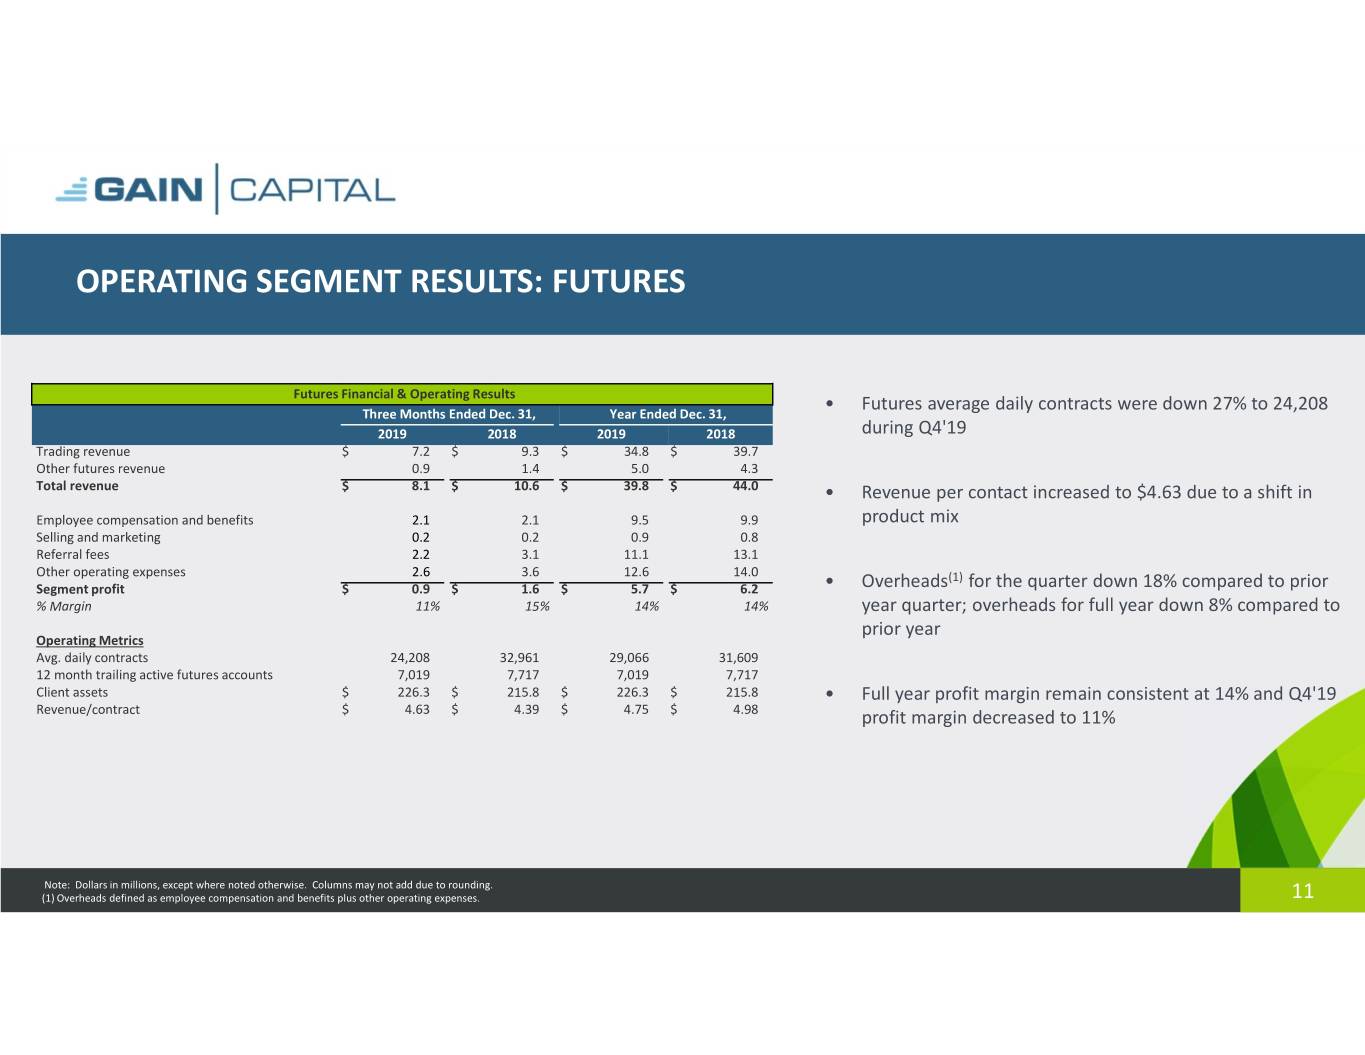
OPERATING SEGMENT RESULTS: FUTURES Futures Financial & Operating Results • Futures average daily contracts were down 27% to 24,208 Three Months Ended Dec. 31, Year Ended Dec. 31, 2019 2018 2019 2018 during Q4'19 Trading revenue $ 7.2 $ 9.3 $ 34.8 $ 39.7 Other futures revenue 0.9 1.4 5.0 4.3 Total revenue $ 8.1 $ 10.6 $ 39.8 $ 44.0 • Revenue per contact increased to $4.63 due to a shift in Employee compensation and benefits 2.1 2.1 9.5 9.9 product mix Selling and marketing 0.2 0.2 0.9 0.8 Referral fees 2.2 3.1 11.1 13.1 Other operating expenses 2.6 3.6 12.6 14.0 (1) Segment profit $ 0.9 $ 1.6 $ 5.7 $ 6.2 • Overheads for the quarter down 18% compared to prior % Margin 11% 15% 14% 14% year quarter; overheads for full year down 8% compared to prior year Operating Metrics Avg. daily contracts 24,208 32,961 29,066 31,609 12 month trailing active futures accounts 7,019 7,717 7,019 7,717 Client assets $ 226.3 $ 215.8 $ 226.3 $ 215.8 • Full year profit margin remain consistent at 14% and Q4'19 Revenue/contract $ 4.63 $ 4.39 $ 4.75 $ 4.98 profit margin decreased to 11% Note: Dollars in millions, except where noted otherwise. Columns may not add due to rounding. (1) Overheads defined as employee compensation and benefits plus other operating expenses. 11
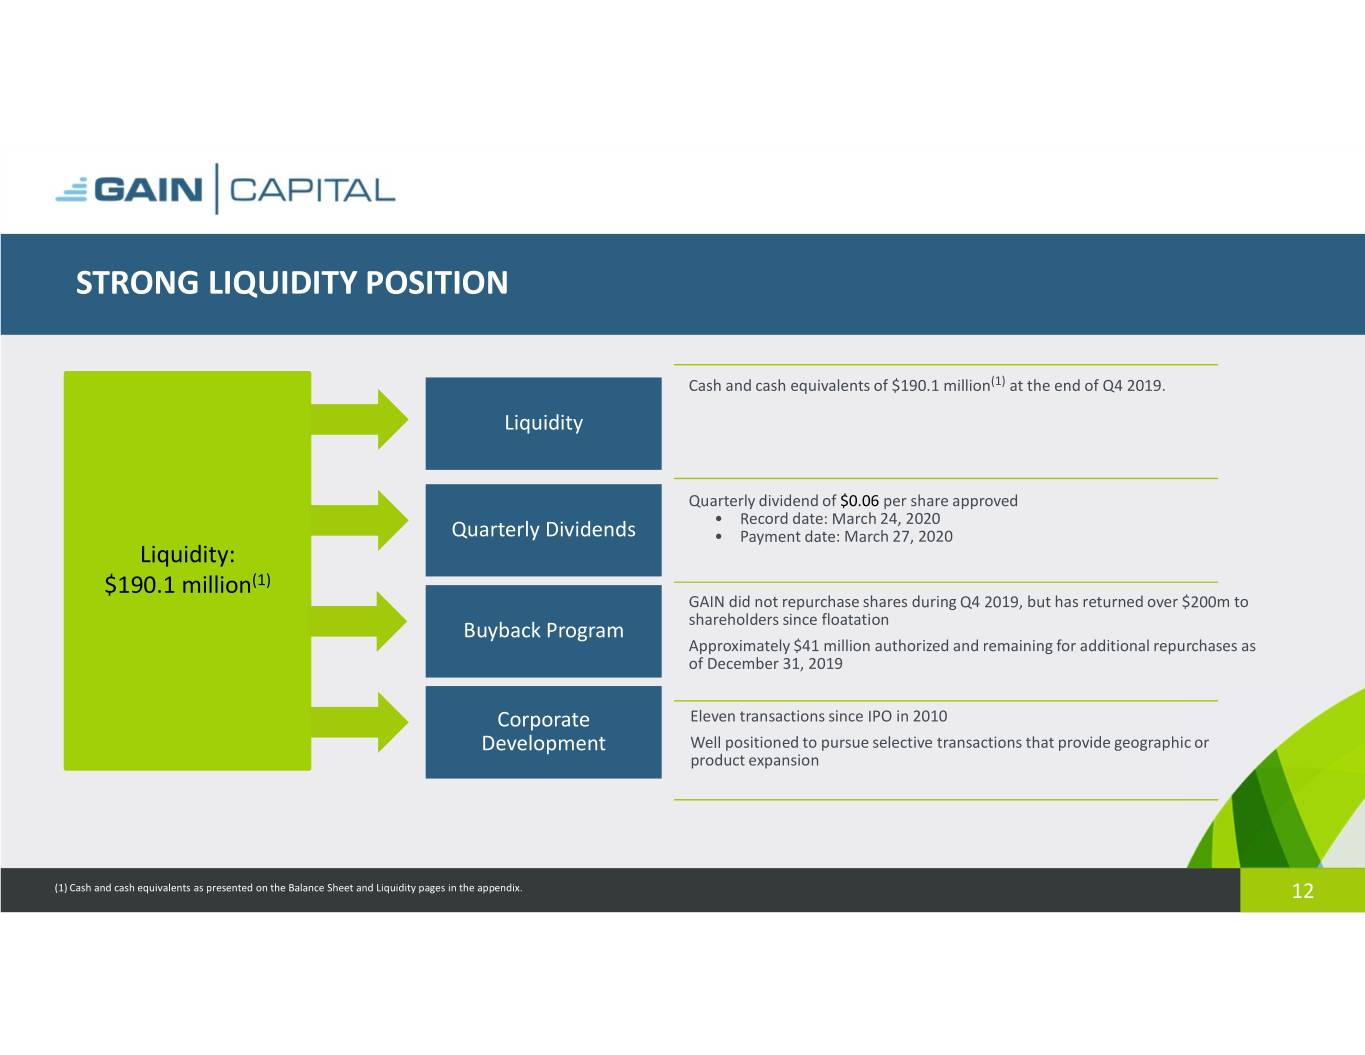
STRONG LIQUIDITY POSITION Cash and cash equivalents of $190.1 million(1) at the end of Q4 2019. Liquidity Quarterly dividend of $0.06 per share approved • Record date: March 24, 2020 Quarterly Dividends • Payment date: March 27, 2020 Liquidity: $190.1 million(1) GAIN did not repurchase shares during Q4 2019, but has returned over $200m to Buyback Program shareholders since floatation Approximately $41 million authorized and remaining for additional repurchases as of December 31, 2019 Corporate Eleven transactions since IPO in 2010 Development Well positioned to pursue selective transactions that provide geographic or product expansion (1) Cash and cash equivalents as presented on the Balance Sheet and Liquidity pages in the appendix. 12
Appendix 13
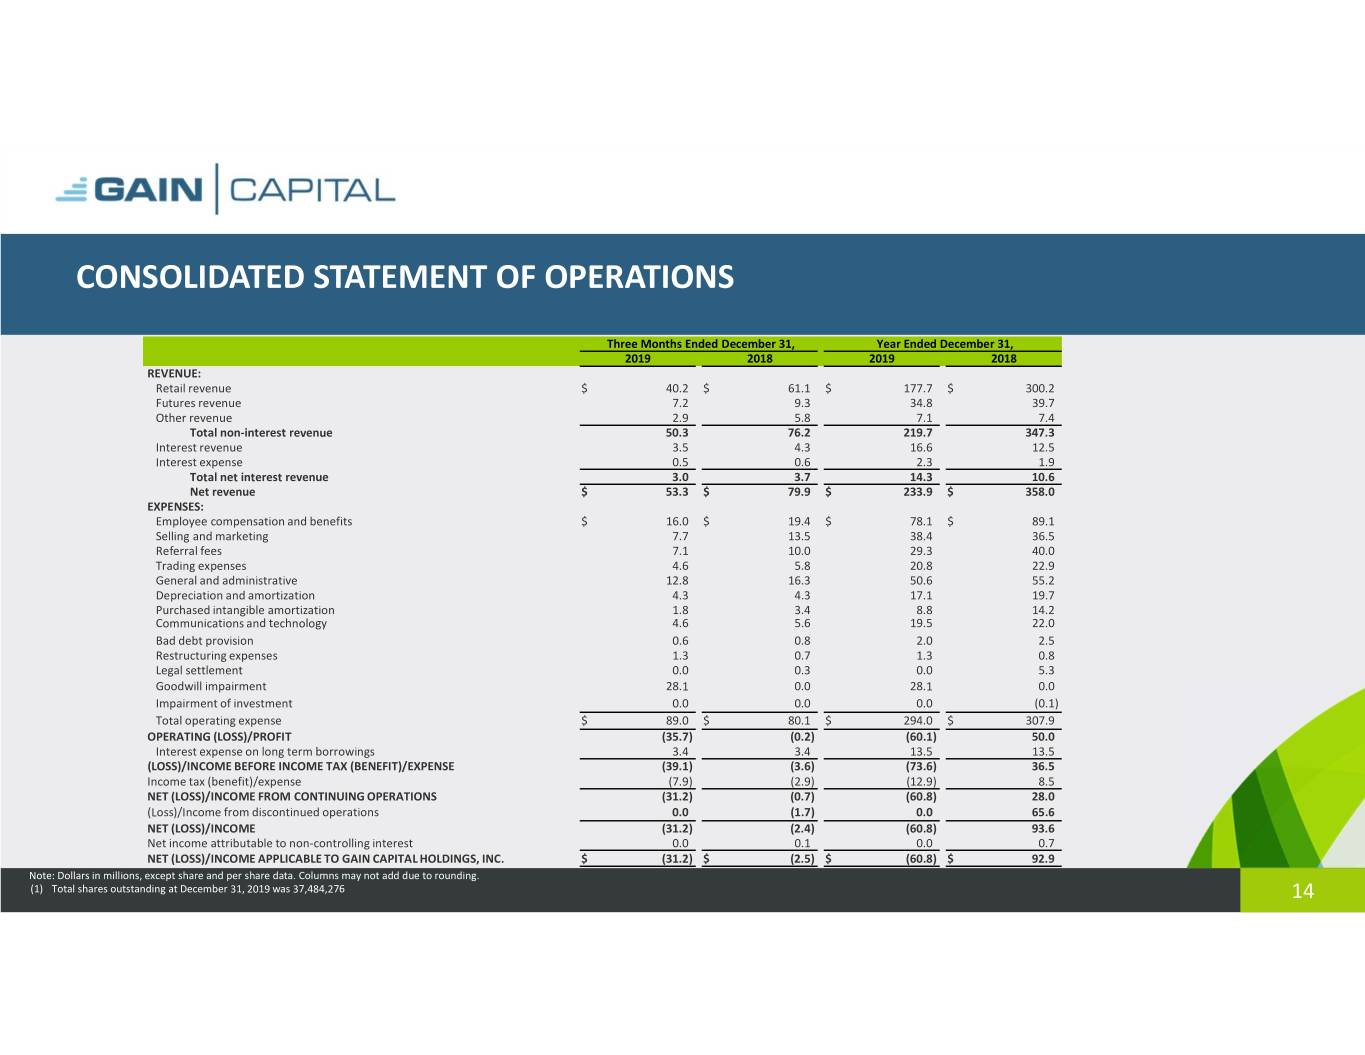
CONSOLIDATED STATEMENT OF OPERATIONS Three Months Ended December 31, Year Ended December 31, 2019 2018 2019 2018 REVENUE: Retail revenue $ 40.2 $ 61.1 $ 177.7 $ 300.2 Futures revenue 7.2 9.3 34.8 39.7 Other revenue 2.9 5.8 7.1 7.4 Total non-interest revenue 50.3 76.2 219.7 347.3 Interest revenue 3.5 4.3 16.6 12.5 Interest expense 0.5 0.6 2.3 1.9 Total net interest revenue 3.0 3.7 14.3 10.6 Net revenue $ 53.3 $ 79.9 $ 233.9 $ 358.0 EXPENSES: Employee compensation and benefits $ 16.0 $ 19.4 $ 78.1 $ 89.1 Selling and marketing 7.7 13.5 38.4 36.5 Referral fees 7.1 10.0 29.3 40.0 Trading expenses 4.6 5.8 20.8 22.9 General and administrative 12.8 16.3 50.6 55.2 Depreciation and amortization 4.3 4.3 17.1 19.7 Purchased intangible amortization 1.8 3.4 8.8 14.2 Communications and technology 4.6 5.6 19.5 22.0 Bad debt provision 0.6 0.8 2.0 2.5 Restructuring expenses 1.3 0.7 1.3 0.8 Legal settlement 0.0 0.3 0.0 5.3 Goodwill impairment 28.1 0.0 28.1 0.0 Impairment of investment 0.0 0.0 0.0 (0.1) Total operating expense $ 89.0 $ 80.1 $ 294.0 $ 307.9 OPERATING (LOSS)/PROFIT (35.7) (0.2) (60.1) 50.0 Interest expense on long term borrowings 3.4 3.4 13.5 13.5 (LOSS)/INCOME BEFORE INCOME TAX (BENEFIT)/EXPENSE (39.1) (3.6) (73.6) 36.5 Income tax (benefit)/expense (7.9) (2.9) (12.9) 8.5 NET (LOSS)/INCOME FROM CONTINUING OPERATIONS (31.2) (0.7) (60.8) 28.0 (Loss)/Income from discontinued operations 0.0 (1.7) 0.0 65.6 NET (LOSS)/INCOME (31.2) (2.4) (60.8) 93.6 Net income attributable to non-controlling interest 0.0 0.1 0.0 0.7 NET (LOSS)/INCOME APPLICABLE TO GAIN CAPITAL HOLDINGS, INC. $ (31.2) $ (2.5) $ (60.8) $ 92.9 Note: Dollars in millions, except share and per share data. Columns may not add due to rounding. (1) Total shares outstanding at December 31, 2019 was 37,484,276 14
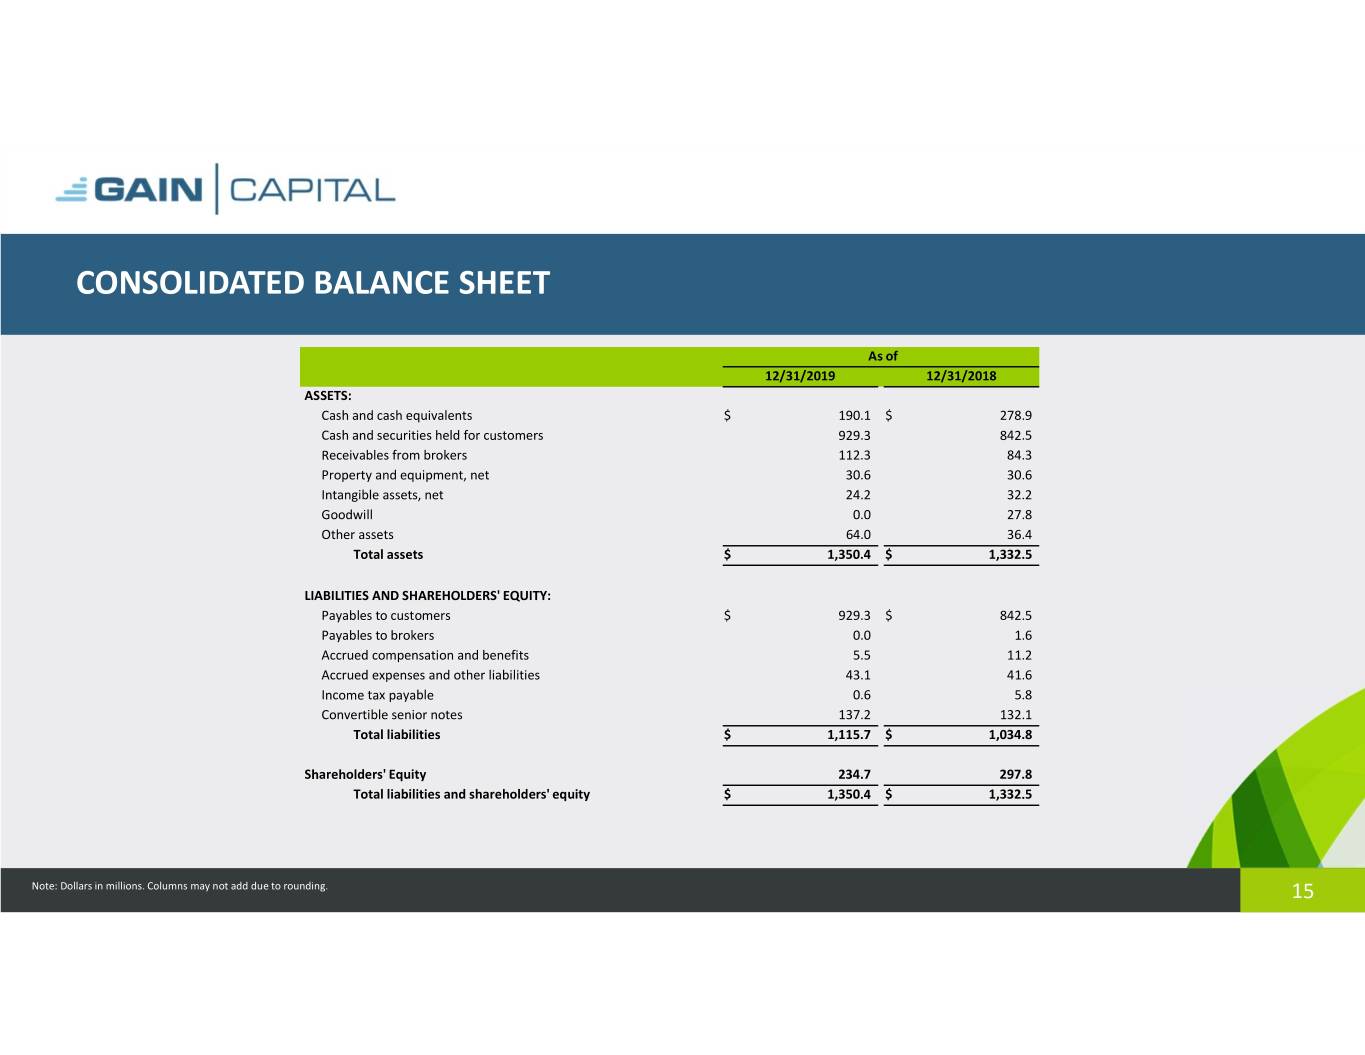
CONSOLIDATED BALANCE SHEET As of 12/31/2019 12/31/2018 ASSETS: Cash and cash equivalents $ 190.1 $ 278.9 Cash and securities held for customers 929.3 842.5 Receivables from brokers 112.3 84.3 Property and equipment, net 30.6 30.6 Intangible assets, net 24.2 32.2 Goodwill 0.0 27.8 Other assets 64.0 36.4 Totalassets $ 1,350.4$ 1,332.5 LIABILITIES AND SHAREHOLDERS' EQUITY: Payables to customers $ 929.3 $ 842.5 Payables to brokers 0.0 1.6 Accrued compensation and benefits 5.5 11.2 Accrued expenses and other liabilities 43.1 41.6 Income tax payable 0.6 5.8 Convertible senior notes 137.2 132.1 Totalliabilities $ 1,115.7$ 1,034.8 Shareholders' Equity 234.7 297.8 Totalliabilitiesandshareholders'equity $ 1,350.4 $ 1,332.5 Note: Dollars in millions. Columns may not add due to rounding. 15
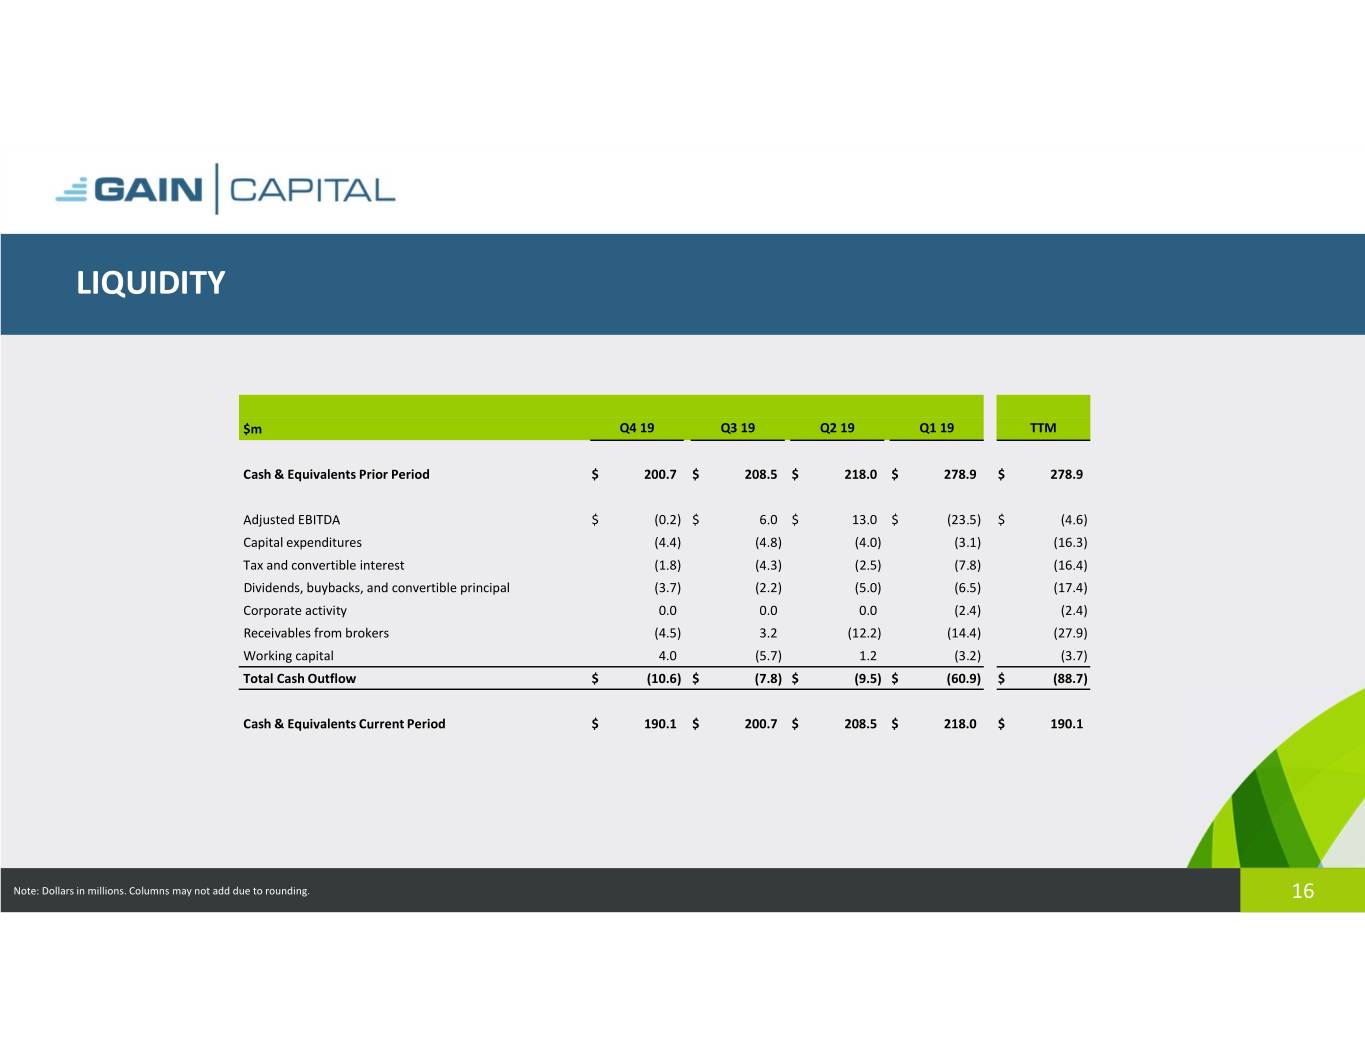
LIQUIDITY $m Q4 19 Q3 19 Q2 19 Q1 19 TTM Cash & Equivalents Prior Period $ 200.7 $ 208.5 $ 218.0 $ 278.9 $ 278.9 Adjusted EBITDA $ (0.2) $ 6.0 $ 13.0 $ (23.5) $ (4.6) Capital expenditures (4.4) (4.8) (4.0) (3.1) (16.3) Tax and convertible interest (1.8) (4.3) (2.5) (7.8) (16.4) Dividends, buybacks, and convertible principal (3.7) (2.2) (5.0) (6.5) (17.4) Corporate activity 0.0 0.0 0.0 (2.4) (2.4) Receivables from brokers (4.5) 3.2 (12.2) (14.4) (27.9) Working capital 4.0 (5.7) 1.2 (3.2) (3.7) Total Cash Outflow $ (10.6)$ (7.8)$ (9.5)$ (60.9) $ (88.7) Cash & Equivalents Current Period $ 190.1 $ 200.7 $ 208.5 $ 218.0 $ 190.1 Note: Dollars in millions. Columns may not add due to rounding. 16
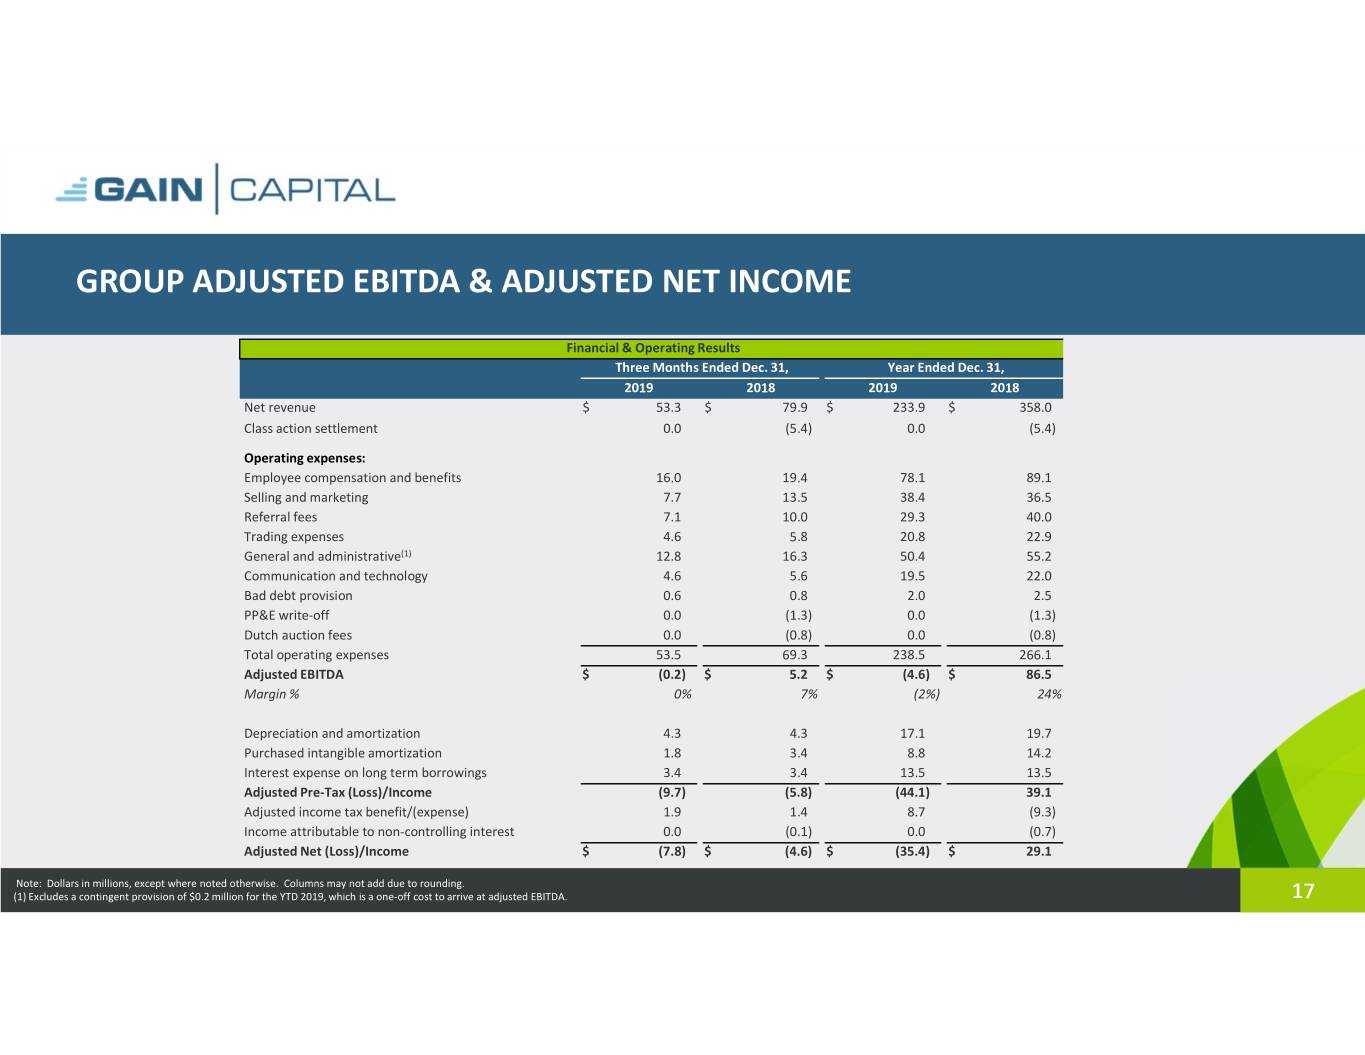
GROUP ADJUSTED EBITDA & ADJUSTED NET INCOME Financial & Operating Results Three Months Ended Dec. 31, Year Ended Dec. 31, 2019 2018 2019 2018 Net revenue $ 53.3 $ 79.9 $ 233.9 $ 358.0 Class action settlement 0.0 (5.4) 0.0 (5.4) Operating expenses: Employee compensation and benefits 16.0 19.4 78.1 89.1 Selling and marketing 7.7 13.5 38.4 36.5 Referral fees 7.1 10.0 29.3 40.0 Trading expenses 4.6 5.8 20.8 22.9 General and administrative(1) 12.8 16.3 50.4 55.2 Communication and technology 4.6 5.6 19.5 22.0 Bad debt provision 0.6 0.8 2.0 2.5 PP&E write-off 0.0 (1.3) 0.0 (1.3) Dutch auction fees 0.0 (0.8) 0.0 (0.8) Total operating expenses 53.5 69.3 238.5 266.1 Adjusted EBITDA $ (0.2)$ 5.2$ (4.6)$ 86.5 Margin % 0% 7% (2%) 24% Depreciation and amortization 4.3 4.3 17.1 19.7 Purchased intangible amortization 1.8 3.4 8.8 14.2 Interest expense on long term borrowings 3.4 3.4 13.5 13.5 Adjusted Pre-Tax (Loss)/Income (9.7) (5.8) (44.1) 39.1 Adjusted income tax benefit/(expense) 1.9 1.4 8.7 (9.3) Income attributable to non-controlling interest 0.0 (0.1) 0.0 (0.7) Adjusted Net (Loss)/Income $ (7.8) $ (4.6) $ (35.4) $ 29.1 Note: Dollars in millions, except where noted otherwise. Columns may not add due to rounding. (1) Excludes a contingent provision of $0.2 million for the YTD 2019, which is a one-off cost to arrive at adjusted EBITDA. 17
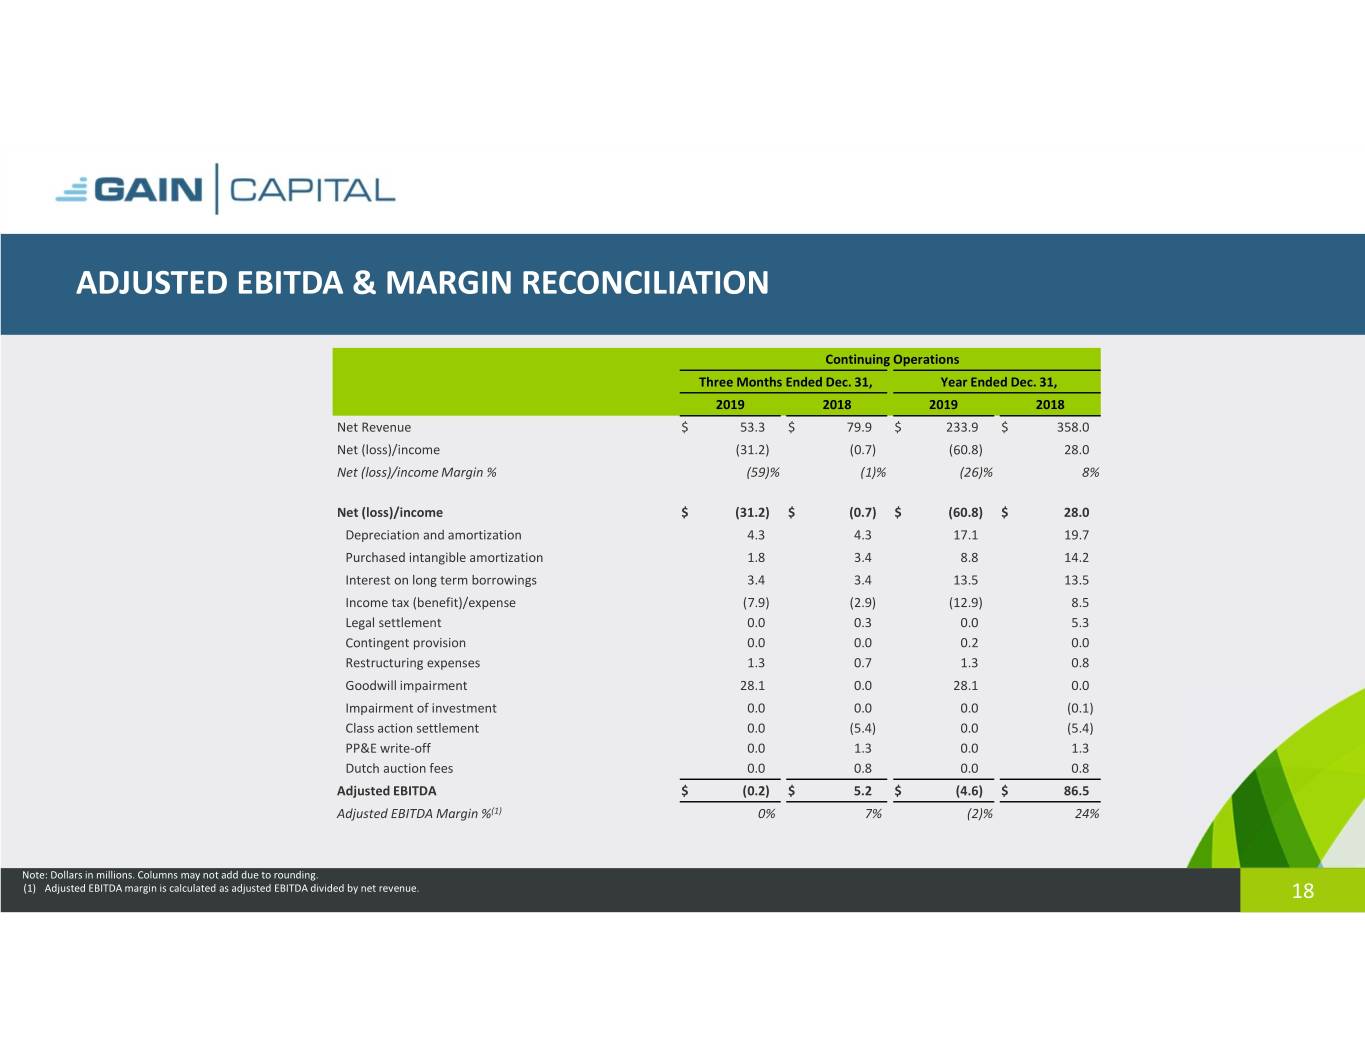
ADJUSTED EBITDA & MARGIN RECONCILIATION Continuing Operations Three Months Ended Dec. 31, Year Ended Dec. 31, 2019 2018 2019 2018 Net Revenue $ 53.3 $ 79.9 $ 233.9 $ 358.0 Net (loss)/income (31.2) (0.7) (60.8) 28.0 Net (loss)/income Margin % (59)% (1)% (26)% 8% Net (loss)/income $ (31.2) $ (0.7) $ (60.8) $ 28.0 Depreciation and amortization 4.3 4.3 17.1 19.7 Purchased intangible amortization 1.8 3.4 8.8 14.2 Interest on long term borrowings 3.4 3.4 13.5 13.5 Income tax (benefit)/expense (7.9) (2.9) (12.9) 8.5 Legal settlement 0.0 0.3 0.0 5.3 Contingent provision 0.0 0.0 0.2 0.0 Restructuring expenses 1.3 0.7 1.3 0.8 Goodwill impairment 28.1 0.0 28.1 0.0 Impairment of investment 0.0 0.0 0.0 (0.1) Class action settlement 0.0 (5.4) 0.0 (5.4) PP&E write-off 0.0 1.3 0.0 1.3 Dutch auction fees 0.0 0.8 0.0 0.8 Adjusted EBITDA $ (0.2)$ 5.2 $ (4.6)$ 86.5 Adjusted EBITDA Margin %(1) 0% 7% (2)% 24% Note: Dollars in millions. Columns may not add due to rounding. (1) Adjusted EBITDA margin is calculated as adjusted EBITDA divided by net revenue. 18
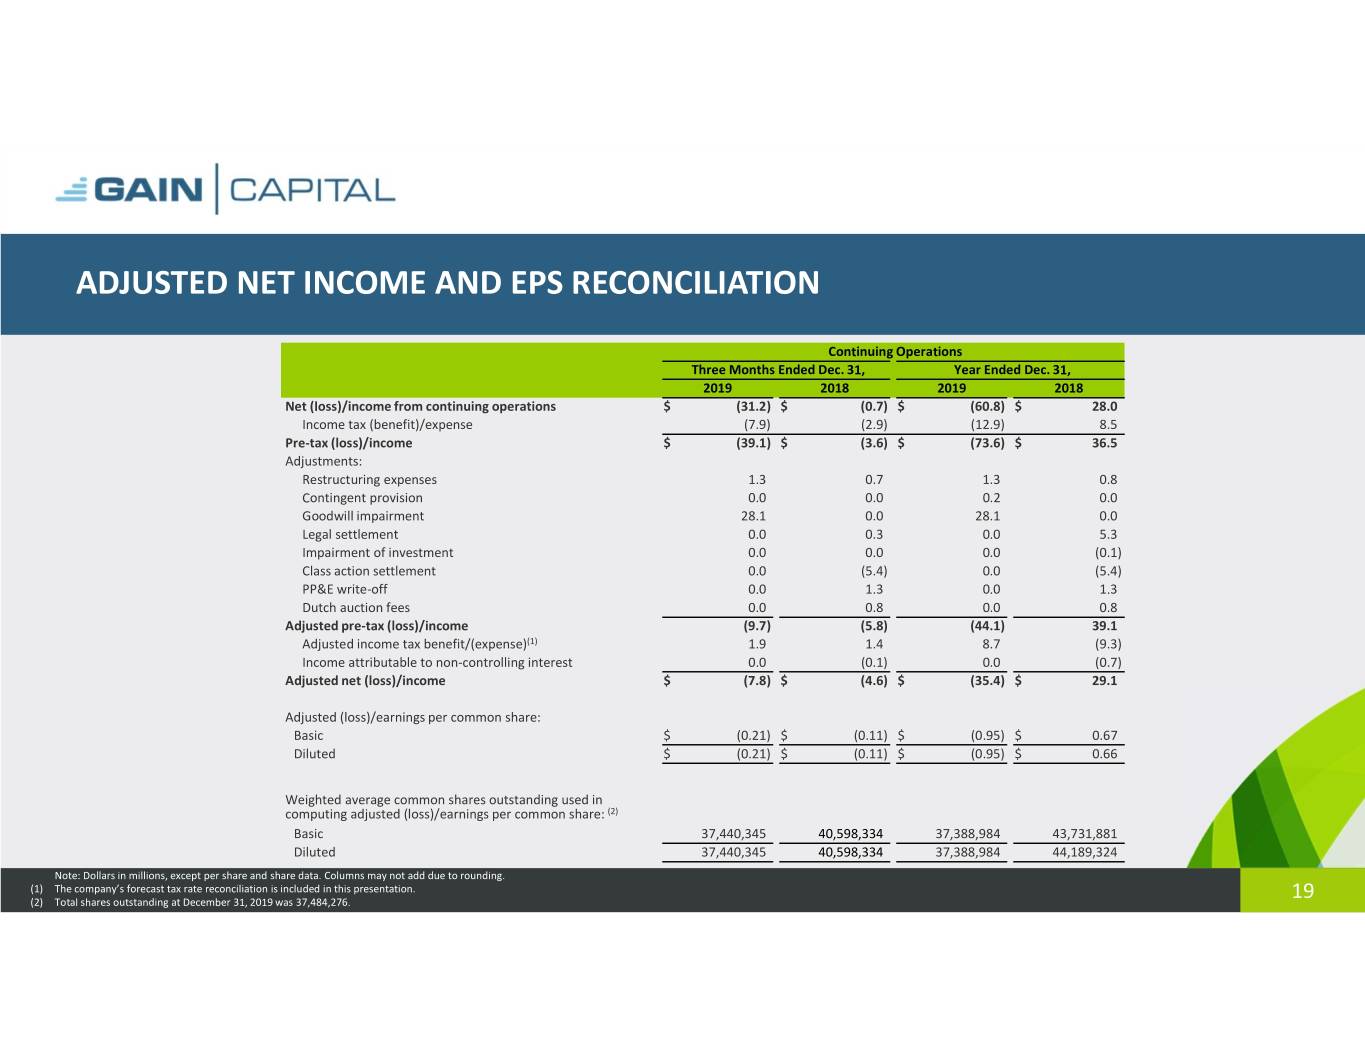
ADJUSTED NET INCOME AND EPS RECONCILIATION Continuing Operations Three Months Ended Dec. 31, Year Ended Dec. 31, 2019 2018 2019 2018 Net (loss)/income from continuing operations $ (31.2) $ (0.7) $ (60.8) $ 28.0 Income tax (benefit)/expense (7.9) (2.9) (12.9) 8.5 Pre-tax (loss)/income $ (39.1)$ (3.6)$ (73.6)$ 36.5 Adjustments: Restructuring expenses 1.3 0.7 1.3 0.8 Contingent provision 0.0 0.0 0.2 0.0 Goodwill impairment 28.1 0.0 28.1 0.0 Legal settlement 0.0 0.3 0.0 5.3 Impairment of investment 0.0 0.0 0.0 (0.1) Class action settlement 0.0 (5.4) 0.0 (5.4) PP&E write-off 0.0 1.3 0.0 1.3 Dutch auction fees 0.0 0.8 0.0 0.8 Adjusted pre-tax (loss)/income (9.7) (5.8) (44.1) 39.1 Adjusted income tax benefit/(expense)(1) 1.9 1.4 8.7 (9.3) Income attributable to non-controlling interest 0.0 (0.1) 0.0 (0.7) Adjusted net (loss)/income $ (7.8)$ (4.6)$ (35.4)$ 29.1 Adjusted (loss)/earnings per common share: Basic $ (0.21)$ (0.11)$ (0.95)$ 0.67 Diluted $ (0.21) $ (0.11) $ (0.95) $ 0.66 Weighted average common shares outstanding used in computing adjusted (loss)/earnings per common share: (2) Basic 37,440,345 40,598,334 37,388,984 43,731,881 Diluted 37,440,345 40,598,334 37,388,984 44,189,324 Note: Dollars in millions, except per share and share data. Columns may not add due to rounding. (1) The company’s forecast tax rate reconciliation is included in this presentation. (2) Total shares outstanding at December 31, 2019 was 37,484,276. 19
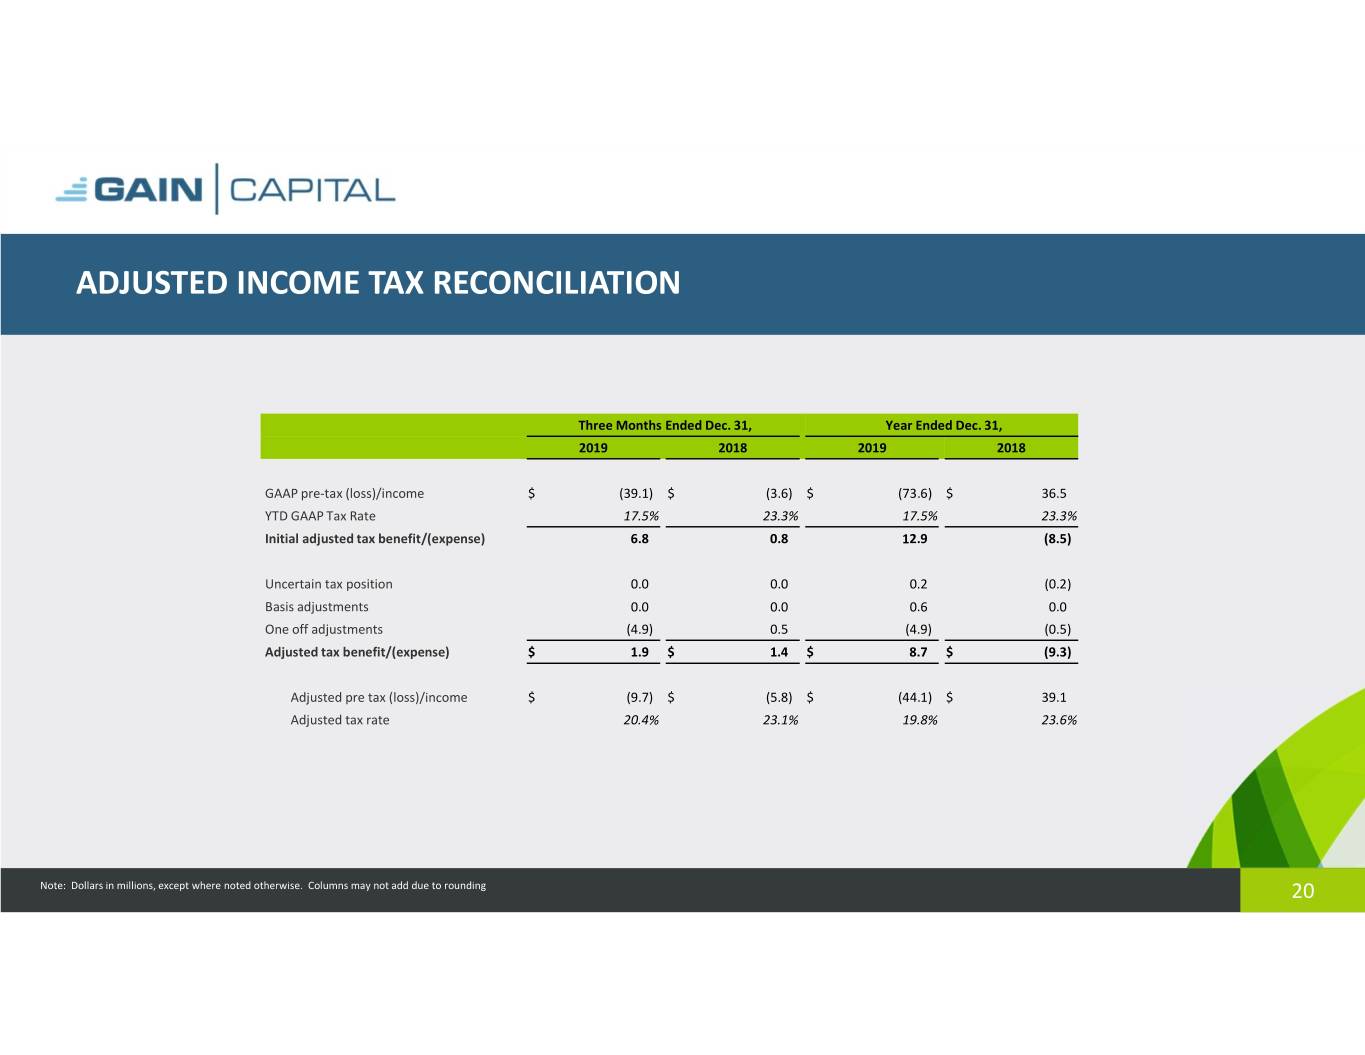
ADJUSTED INCOME TAX RECONCILIATION Three Months Ended Dec. 31, Year Ended Dec. 31, 2019 2018 2019 2018 GAAP pre-tax (loss)/income $ (39.1) $ (3.6) $ (73.6) $ 36.5 YTD GAAP Tax Rate 17.5% 23.3% 17.5% 23.3% Initial adjusted tax benefit/(expense) 6.8 0.8 12.9 (8.5) Uncertain tax position 0.0 0.0 0.2 (0.2) Basis adjustments 0.0 0.0 0.6 0.0 One off adjustments (4.9) 0.5 (4.9) (0.5) Adjusted tax benefit/(expense) $ 1.9$ 1.4$ 8.7$ (9.3) Adjusted pre tax (loss)/income $ (9.7) $ (5.8) $ (44.1) $ 39.1 Adjusted tax rate 20.4% 23.1% 19.8% 23.6% Note: Dollars in millions, except where noted otherwise. Columns may not add due to rounding 20
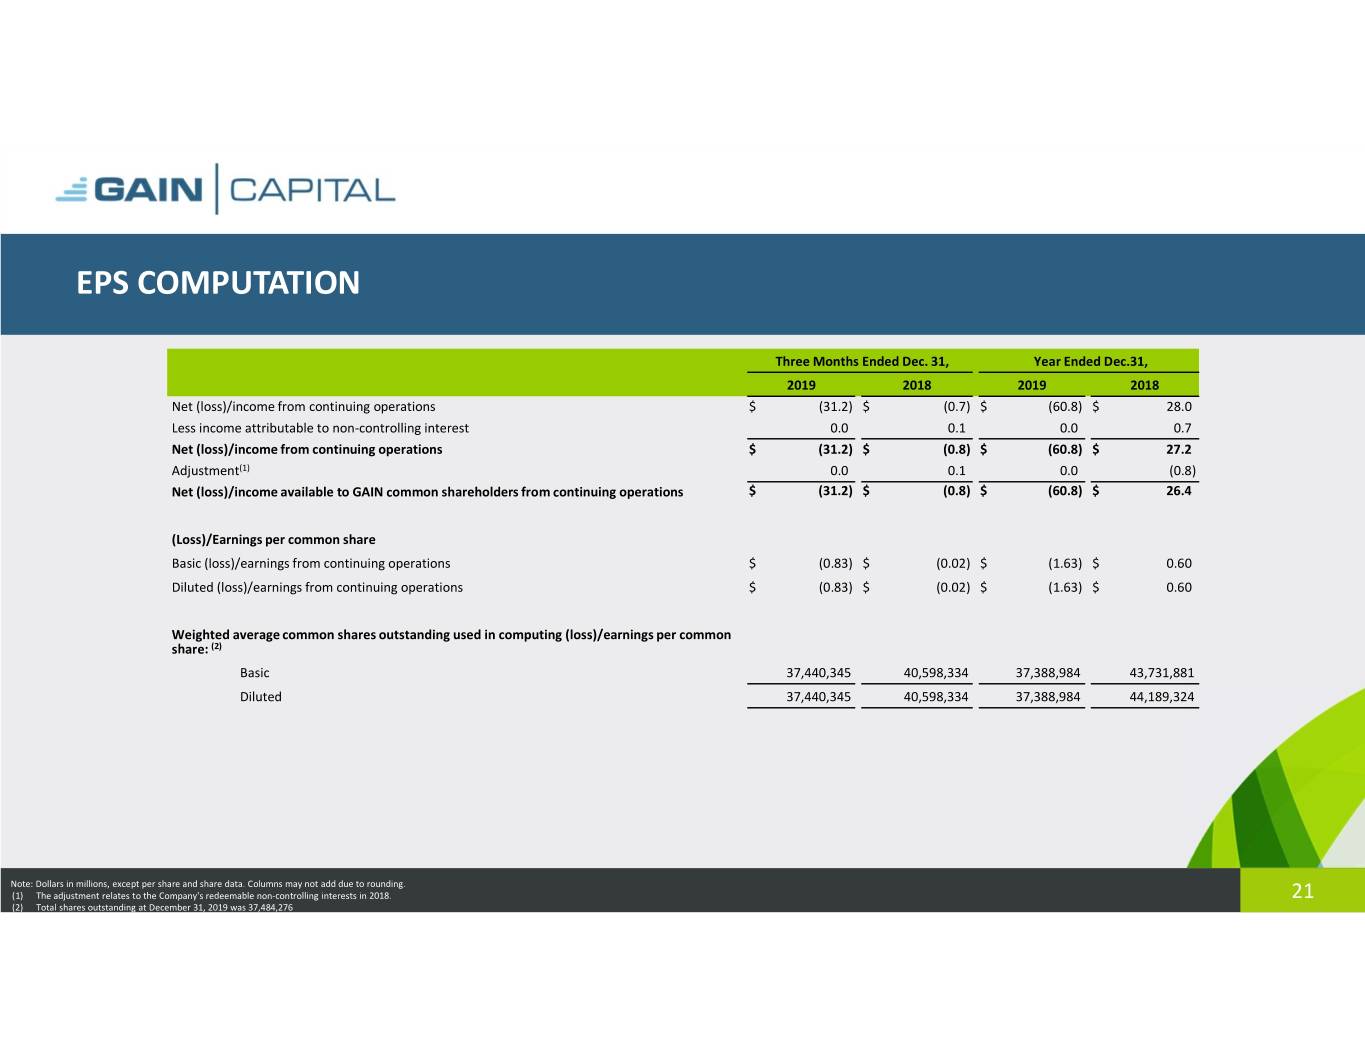
EPS COMPUTATION Three Months Ended Dec. 31, Year Ended Dec.31, 2019 2018 2019 2018 Net (loss)/income from continuing operations $ (31.2) $ (0.7) $ (60.8) $ 28.0 Less income attributable to non-controlling interest 0.0 0.1 0.0 0.7 Net (loss)/income from continuing operations $ (31.2)$ (0.8)$ (60.8)$ 27.2 Adjustment(1) 0.0 0.1 0.0 (0.8) Net (loss)/income available to GAIN common shareholders from continuing operations $ (31.2)$ (0.8)$ (60.8)$ 26.4 (Loss)/Earnings per common share Basic (loss)/earnings from continuing operations $ (0.83) $ (0.02) $ (1.63) $ 0.60 Diluted (loss)/earnings from continuing operations $ (0.83) $ (0.02) $ (1.63) $ 0.60 Weighted average common shares outstanding used in computing (loss)/earnings per common share: (2) Basic 37,440,345 40,598,334 37,388,984 43,731,881 Diluted 37,440,345 40,598,334 37,388,984 44,189,324 Note: Dollars in millions, except per share and share data. Columns may not add due to rounding. (1) The adjustment relates to the Company's redeemable non-controlling interests in 2018. 21 (2) Total shares outstanding at December 31, 2019 was 37,484,276
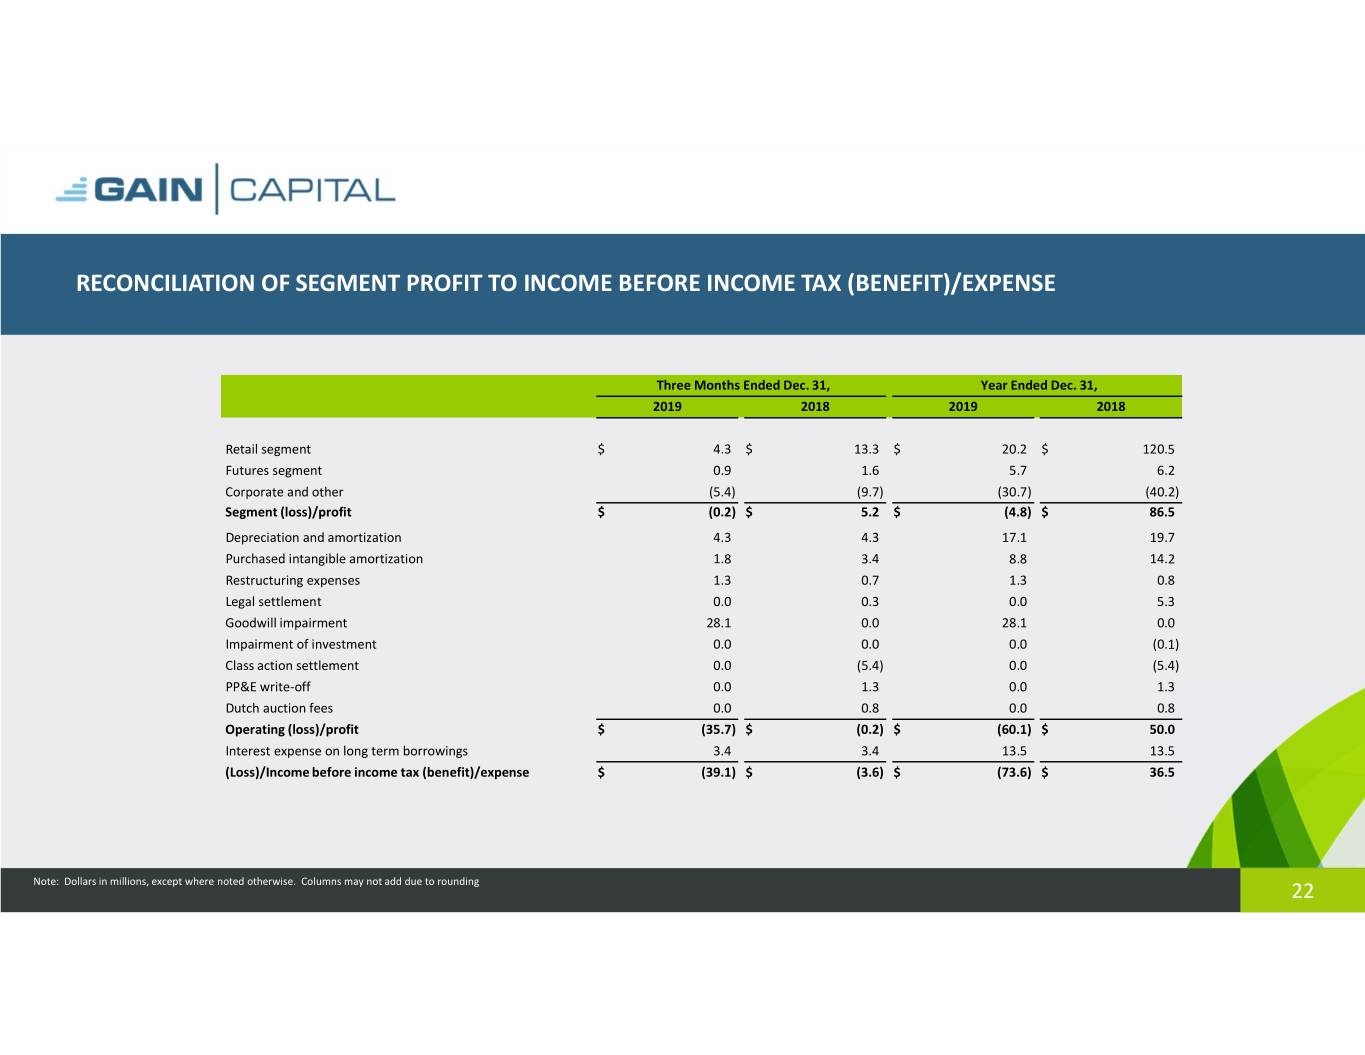
RECONCILIATION OF SEGMENT PROFIT TO INCOME BEFORE INCOME TAX (BENEFIT)/EXPENSE Three Months Ended Dec. 31, Year Ended Dec. 31, 2019 2018 2019 2018 Retail segment $ 4.3 $ 13.3 $ 20.2 $ 120.5 Futures segment 0.9 1.6 5.7 6.2 Corporate and other (5.4) (9.7) (30.7) (40.2) Segment (loss)/profit $ (0.2)$ 5.2$ (4.8)$ 86.5 Depreciation and amortization 4.3 4.3 17.1 19.7 Purchased intangible amortization 1.8 3.4 8.8 14.2 Restructuring expenses 1.3 0.7 1.3 0.8 Legal settlement 0.0 0.3 0.0 5.3 Goodwill impairment 28.1 0.0 28.1 0.0 Impairment of investment 0.0 0.0 0.0 (0.1) Class action settlement 0.0 (5.4) 0.0 (5.4) PP&E write-off 0.0 1.3 0.0 1.3 Dutch auction fees 0.0 0.8 0.0 0.8 Operating (loss)/profit $ (35.7) $ (0.2) $ (60.1) $ 50.0 Interest expense on long term borrowings 3.4 3.4 13.5 13.5 (Loss)/Income before income tax (benefit)/expense $ (39.1) $ (3.6) $ (73.6) $ 36.5 Note: Dollars in millions, except where noted otherwise. Columns may not add due to rounding 22
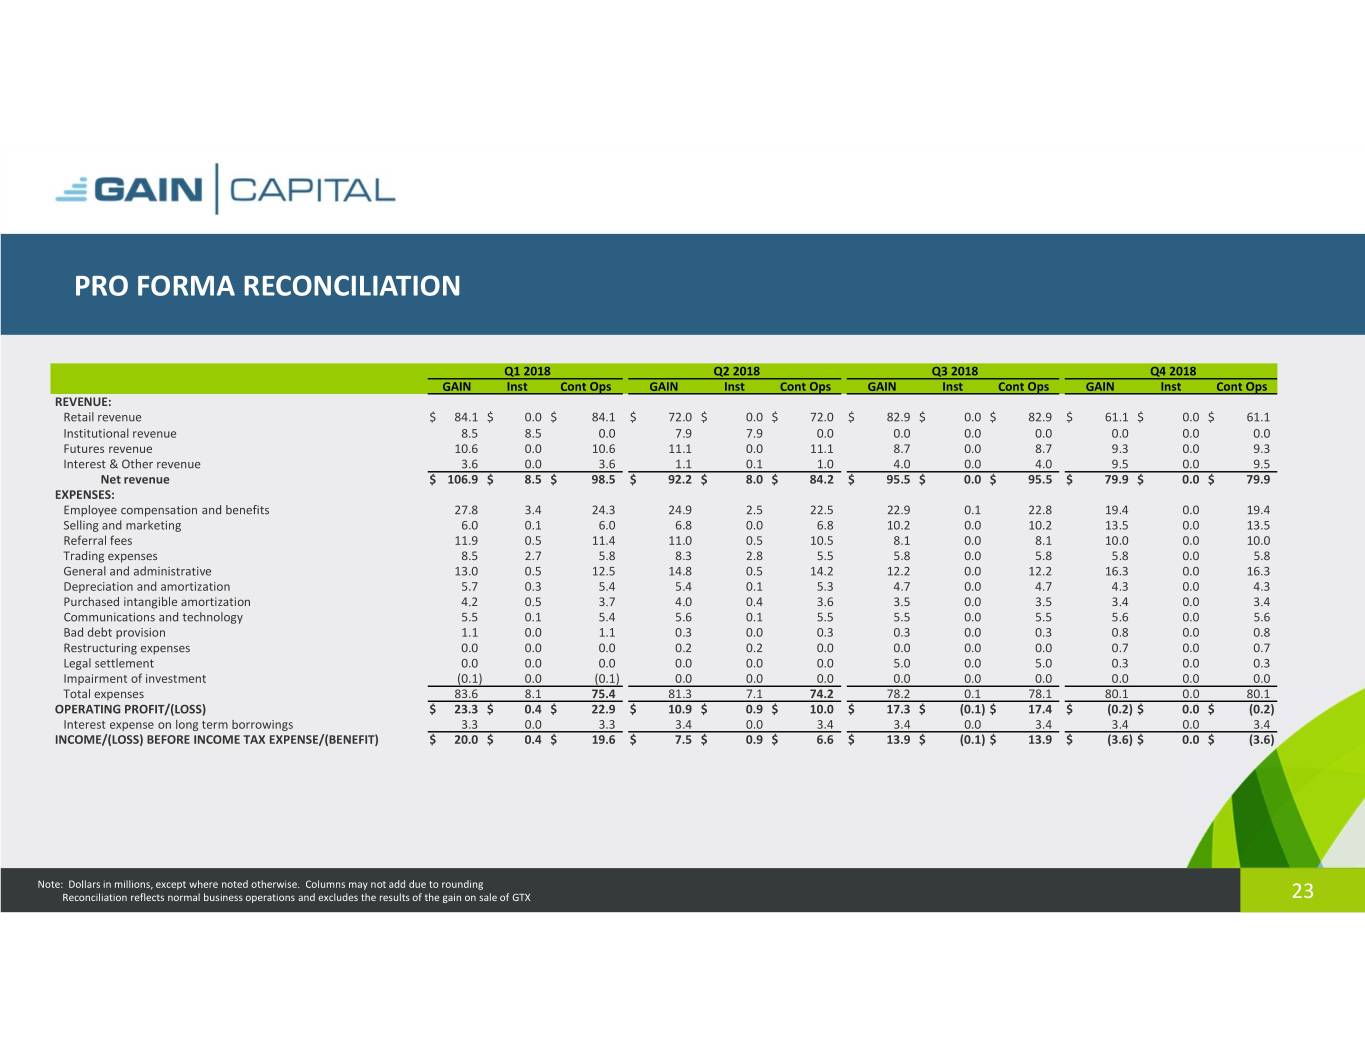
PRO FORMA RECONCILIATION Q1 2018 Q2 2018 Q3 2018 Q4 2018 GAIN Inst Cont Ops GAIN Inst ContOps GAIN Inst ContOps GAIN Inst ContOps REVENUE: Retail revenue $ 84.1 $ 0.0 $ 84.1 $ 72.0 $ 0.0 $ 72.0 $ 82.9 $ 0.0 $ 82.9 $ 61.1 $ 0.0 $ 61.1 Institutional revenue 8.5 8.5 0.0 7.9 7.9 0.0 0.0 0.0 0.0 0.0 0.0 0.0 Futures revenue 10.6 0.0 10.6 11.1 0.0 11.1 8.7 0.0 8.7 9.3 0.0 9.3 Interest & Other revenue 3.6 0.0 3.6 1.1 0.1 1.0 4.0 0.0 4.0 9.5 0.0 9.5 Net revenue $106.9$ 8.5$ 98.5$ 92.2$ 8.0$ 84.2$ 95.5$ 0.0$ 95.5$ 79.9$ 0.0$ 79.9 EXPENSES: Employee compensation and benefits 27.8 3.4 24.3 24.9 2.5 22.5 22.9 0.1 22.8 19.4 0.0 19.4 Selling and marketing 6.0 0.1 6.0 6.8 0.0 6.8 10.2 0.0 10.2 13.5 0.0 13.5 Referral fees 11.9 0.5 11.4 11.0 0.5 10.5 8.1 0.0 8.1 10.0 0.0 10.0 Trading expenses 8.5 2.7 5.8 8.3 2.8 5.5 5.8 0.0 5.8 5.8 0.0 5.8 General and administrative 13.0 0.5 12.5 14.8 0.5 14.2 12.2 0.0 12.2 16.3 0.0 16.3 Depreciation and amortization 5.7 0.3 5.4 5.4 0.1 5.3 4.7 0.0 4.7 4.3 0.0 4.3 Purchased intangible amortization 4.2 0.5 3.7 4.0 0.4 3.6 3.5 0.0 3.5 3.4 0.0 3.4 Communications and technology 5.5 0.1 5.4 5.6 0.1 5.5 5.5 0.0 5.5 5.6 0.0 5.6 Bad debt provision 1.1 0.0 1.1 0.3 0.0 0.3 0.3 0.0 0.3 0.8 0.0 0.8 Restructuring expenses 0.0 0.0 0.0 0.2 0.2 0.0 0.0 0.0 0.0 0.7 0.0 0.7 Legal settlement 0.0 0.0 0.0 0.0 0.0 0.0 5.0 0.0 5.0 0.3 0.0 0.3 Impairment of investment (0.1) 0.0 (0.1) 0.0 0.0 0.0 0.0 0.0 0.0 0.0 0.0 0.0 Total expenses 83.6 8.1 75.4 81.3 7.1 74.2 78.2 0.1 78.1 80.1 0.0 80.1 OPERATING PROFIT/(LOSS) $ 23.3$ 0.4$ 22.9 $ 10.9$ 0.9$ 10.0 $ 17.3$ (0.1)$ 17.4 $ (0.2)$ 0.0$ (0.2) Interest expense on long term borrowings 3.3 0.0 3.3 3.4 0.0 3.4 3.4 0.0 3.4 3.4 0.0 3.4 INCOME/(LOSS) BEFORE INCOME TAX EXPENSE/(BENEFIT) $ 20.0 $ 0.4 $ 19.6 $ 7.5 $ 0.9 $ 6.6 $ 13.9 $ (0.1)$ 13.9 $ (3.6)$ 0.0 $ (3.6) Note: Dollars in millions, except where noted otherwise. Columns may not add due to rounding Reconciliation reflects normal business operations and excludes the results of the gain on sale of GTX 23
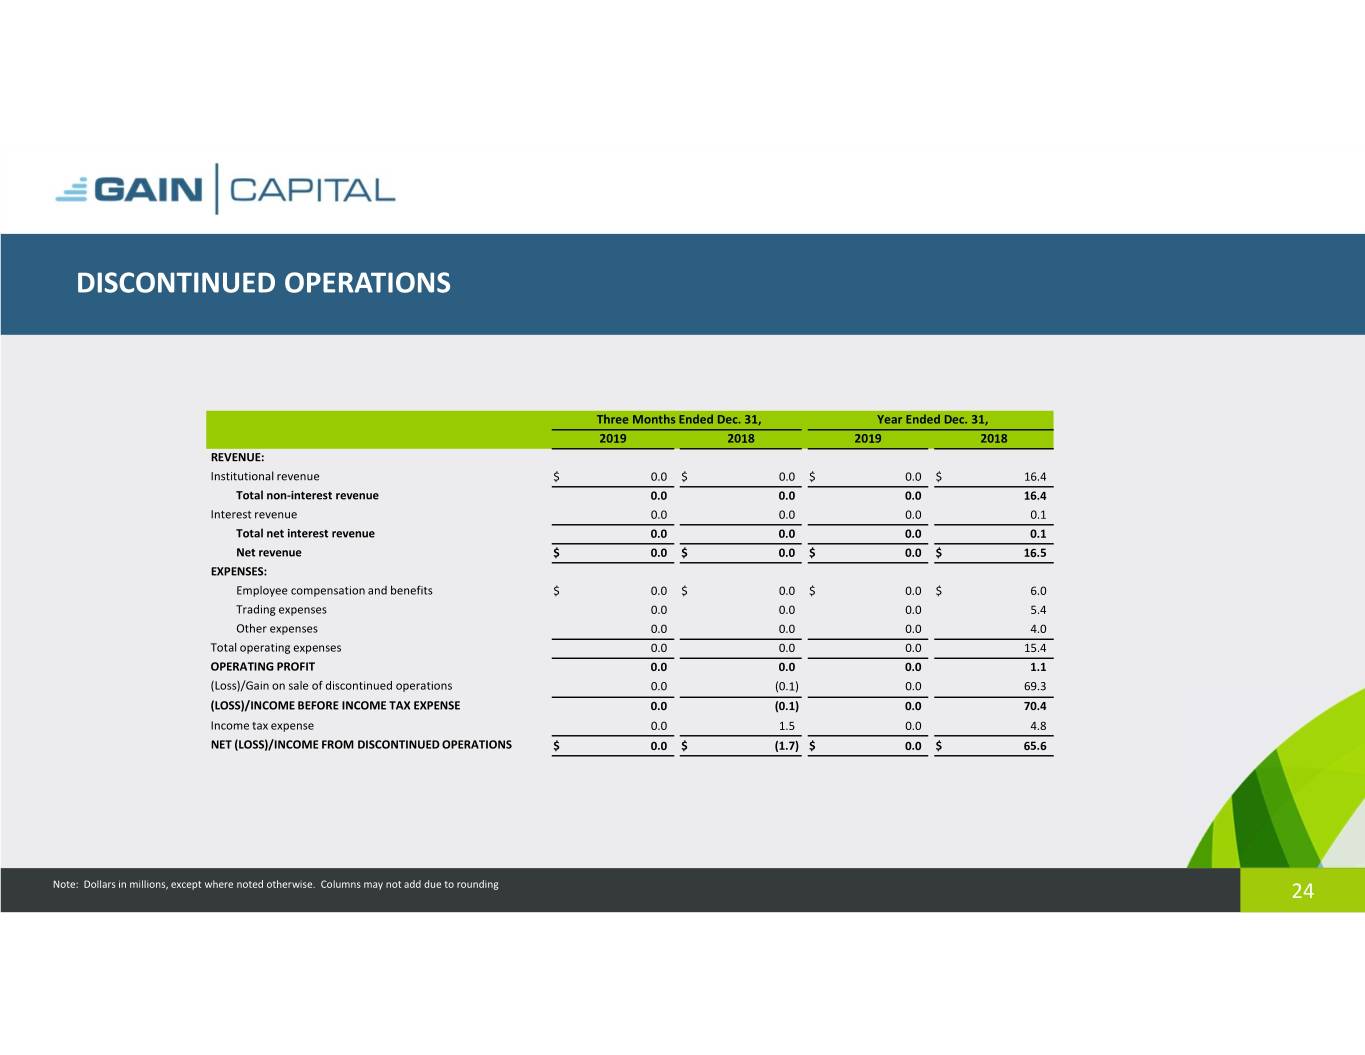
DISCONTINUED OPERATIONS Three Months Ended Dec. 31, Year Ended Dec. 31, 2019 2018 2019 2018 REVENUE: Institutional revenue $ 0.0 $ 0.0 $ 0.0 $ 16.4 Total non-interest revenue 0.0 0.0 0.0 16.4 Interest revenue 0.0 0.0 0.0 0.1 Total net interest revenue 0.0 0.0 0.0 0.1 Net revenue $ 0.0$ 0.0$ 0.0$ 16.5 EXPENSES: Employee compensation and benefits $ 0.0$ 0.0$ 0.0$ 6.0 Trading expenses 0.0 0.0 0.0 5.4 Other expenses 0.0 0.0 0.0 4.0 Total operating expenses 0.0 0.0 0.0 15.4 OPERATING PROFIT 0.0 0.0 0.0 1.1 (Loss)/Gain on sale of discontinued operations 0.0 (0.1) 0.0 69.3 (LOSS)/INCOME BEFORE INCOME TAX EXPENSE 0.0 (0.1) 0.0 70.4 Income tax expense 0.0 1.5 0.0 4.8 NET (LOSS)/INCOME FROM DISCONTINUED OPERATIONS $ 0.0 $ (1.7) $ 0.0 $ 65.6 Note: Dollars in millions, except where noted otherwise. Columns may not add due to rounding 24
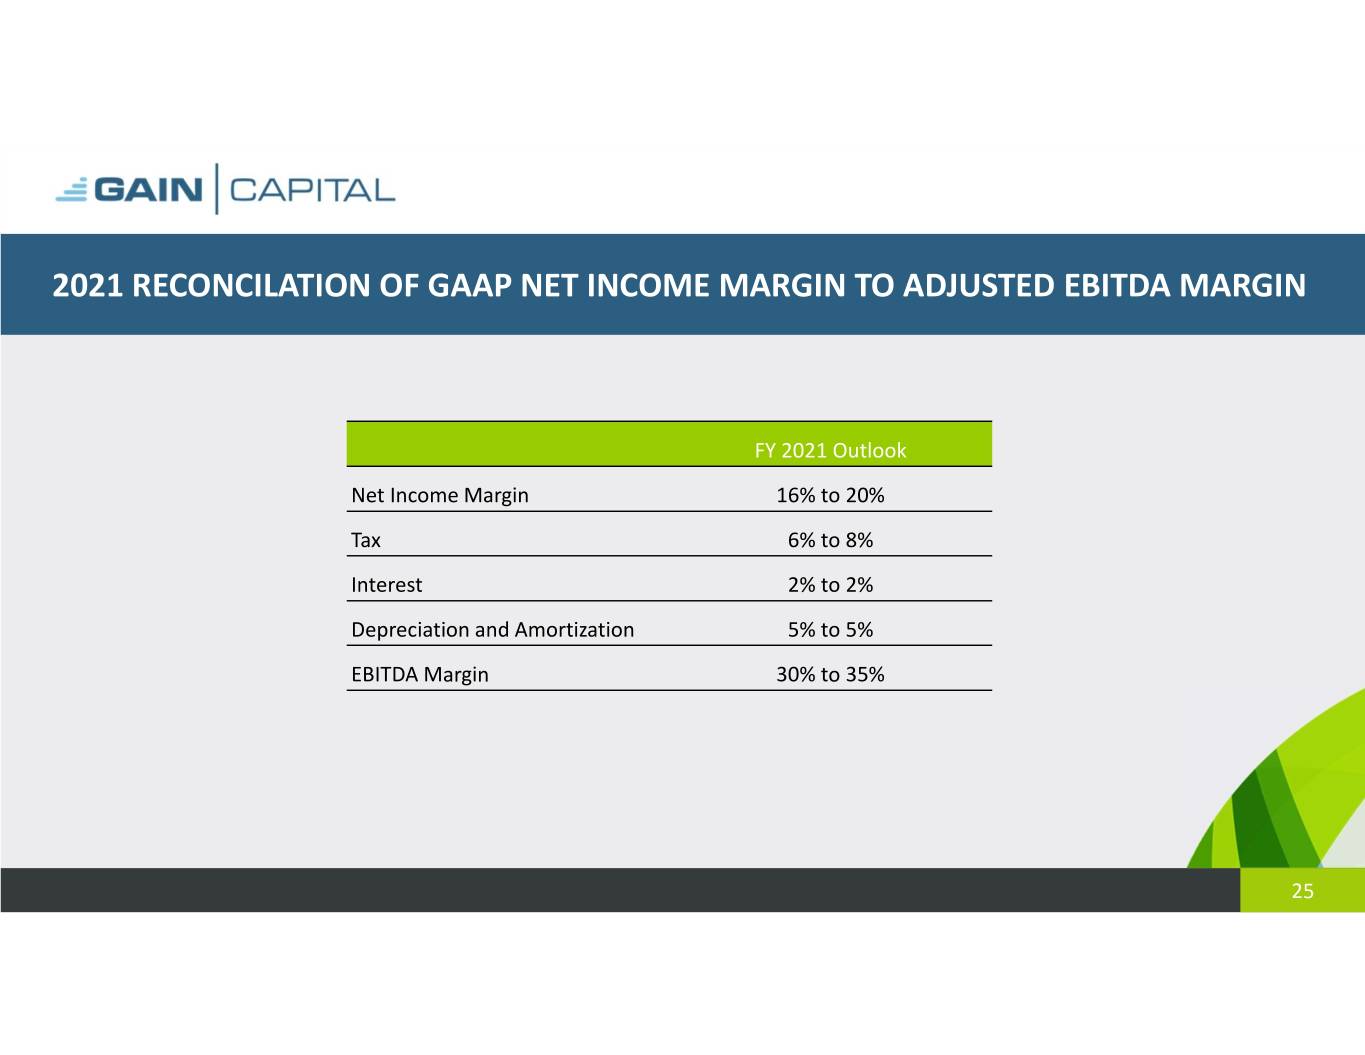
2021 RECONCILATION OF GAAP NET INCOME MARGIN TO ADJUSTED EBITDA MARGIN FY 2021 Outlook Net Income Margin 16% to 20% Tax 6% to 8% Interest 2% to 2% Depreciation and Amortization 5% to 5% EBITDA Margin 30% to 35% 25
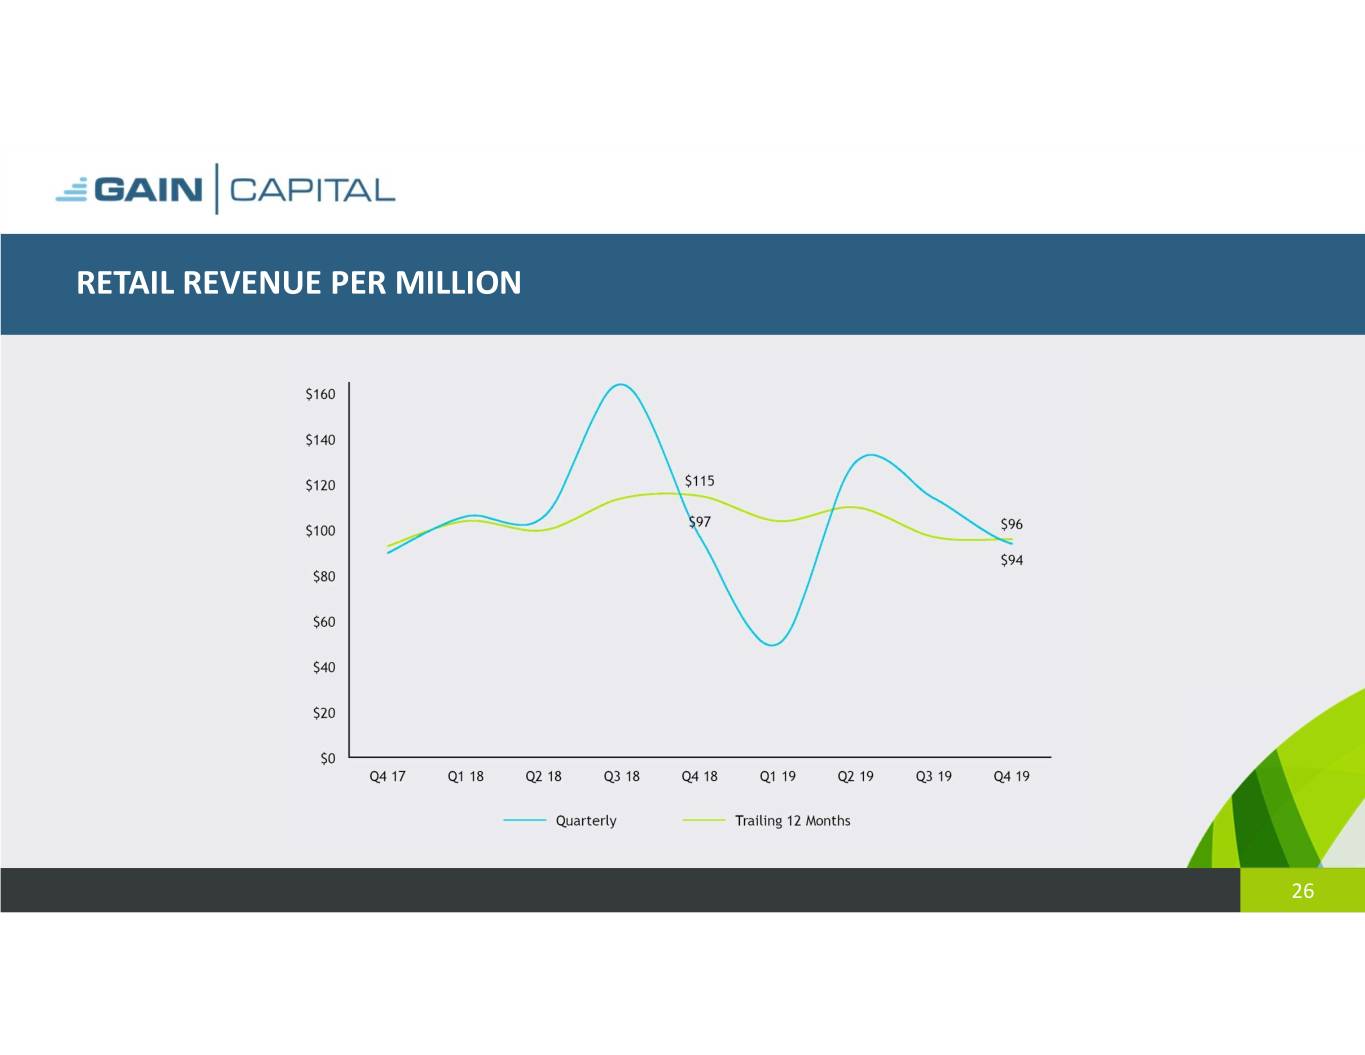
RETAIL REVENUE PER MILLION 26
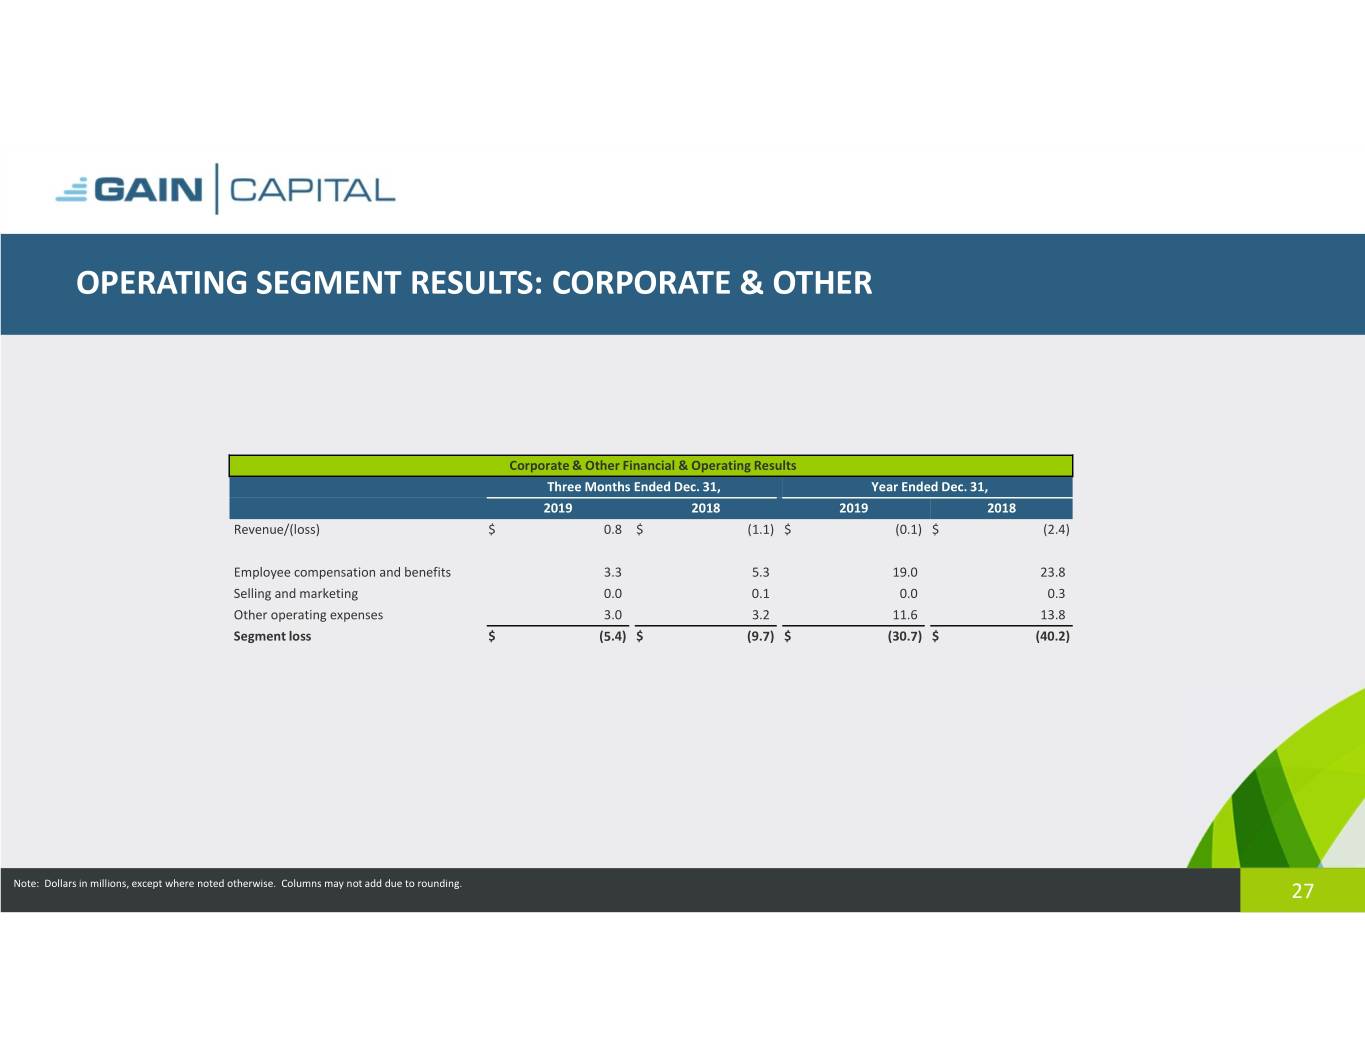
OPERATING SEGMENT RESULTS: CORPORATE & OTHER Corporate & Other Financial & Operating Results Three Months Ended Dec. 31, Year Ended Dec. 31, 2019 2018 2019 2018 Revenue/(loss) $ 0.8 $ (1.1) $ (0.1) $ (2.4) Employee compensation and benefits 3.3 5.3 19.0 23.8 Selling and marketing 0.0 0.1 0.0 0.3 Other operating expenses 3.0 3.2 11.6 13.8 Segment loss $ (5.4)$ (9.7)$ (30.7)$ (40.2) Note: Dollars in millions, except where noted otherwise. Columns may not add due to rounding. 27
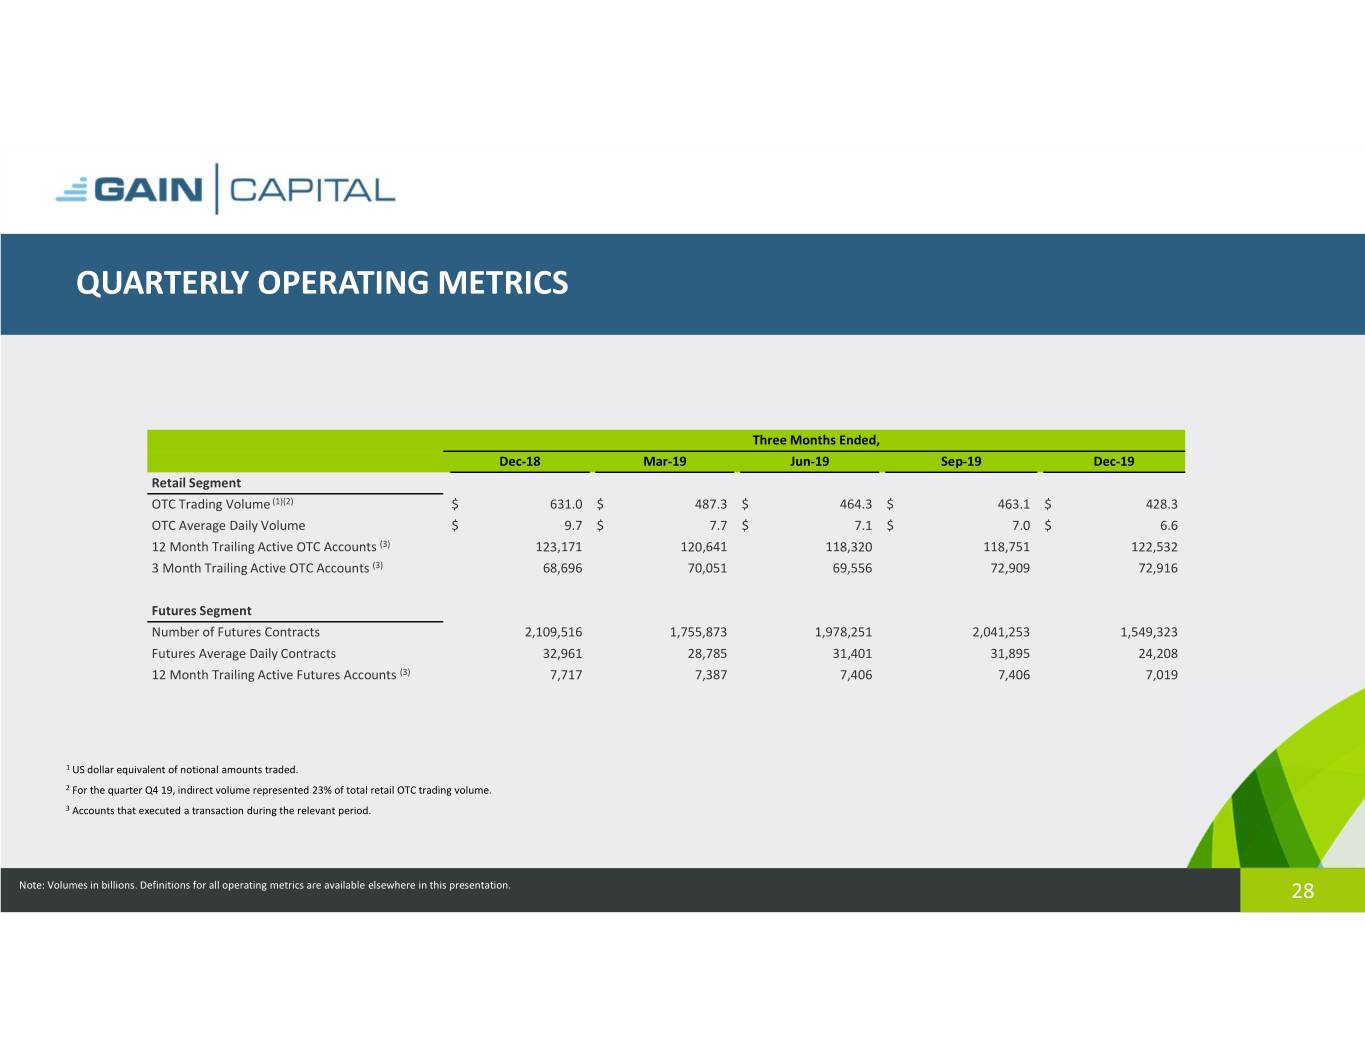
QUARTERLY OPERATING METRICS Three Months Ended, Dec-18 Mar-19 Jun-19 Sep-19 Dec-19 Retail Segment OTC Trading Volume (1)(2) $ 631.0 $ 487.3 $ 464.3 $ 463.1 $ 428.3 OTC Average Daily Volume $ 9.7 $ 7.7 $ 7.1 $ 7.0 $ 6.6 12 Month Trailing Active OTC Accounts (3) 123,171 120,641 118,320 118,751 122,532 3 Month Trailing Active OTC Accounts (3) 68,696 70,051 69,556 72,909 72,916 Futures Segment Number of Futures Contracts 2,109,516 1,755,873 1,978,251 2,041,253 1,549,323 Futures Average Daily Contracts 32,961 28,785 31,401 31,895 24,208 12 Month Trailing Active Futures Accounts (3) 7,717 7,387 7,406 7,406 7,019 1 US dollar equivalent of notional amounts traded. 2 For the quarter Q4 19, indirect volume represented 23% of total retail OTC trading volume. 3 Accounts that executed a transaction during the relevant period. Note: Volumes in billions. Definitions for all operating metrics are available elsewhere in this presentation. 28
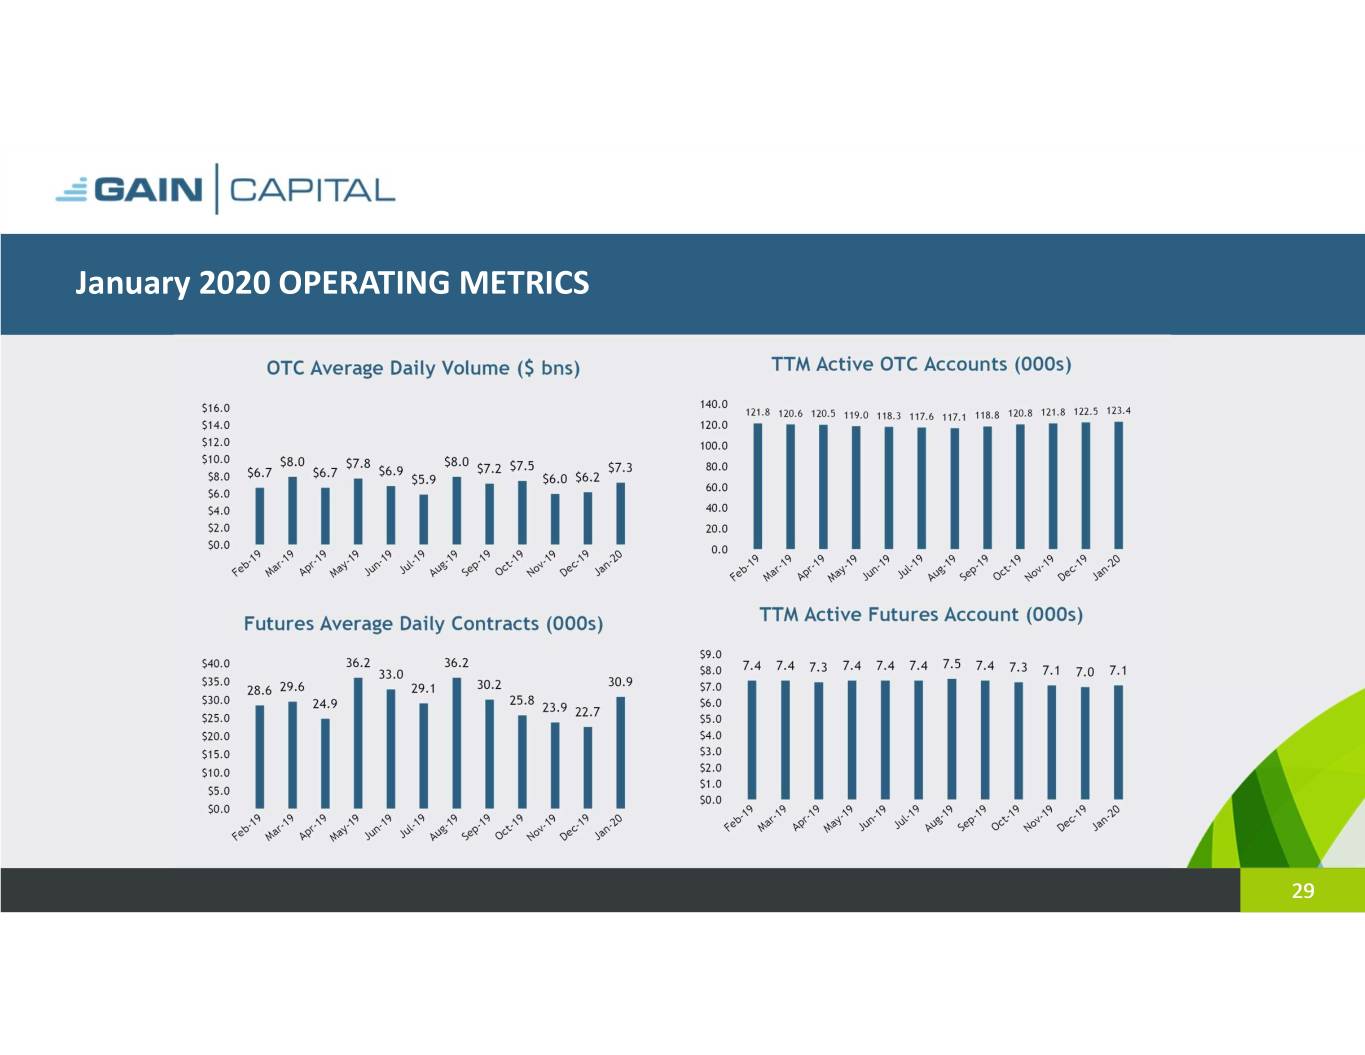
January 2020 OPERATING METRICS 29
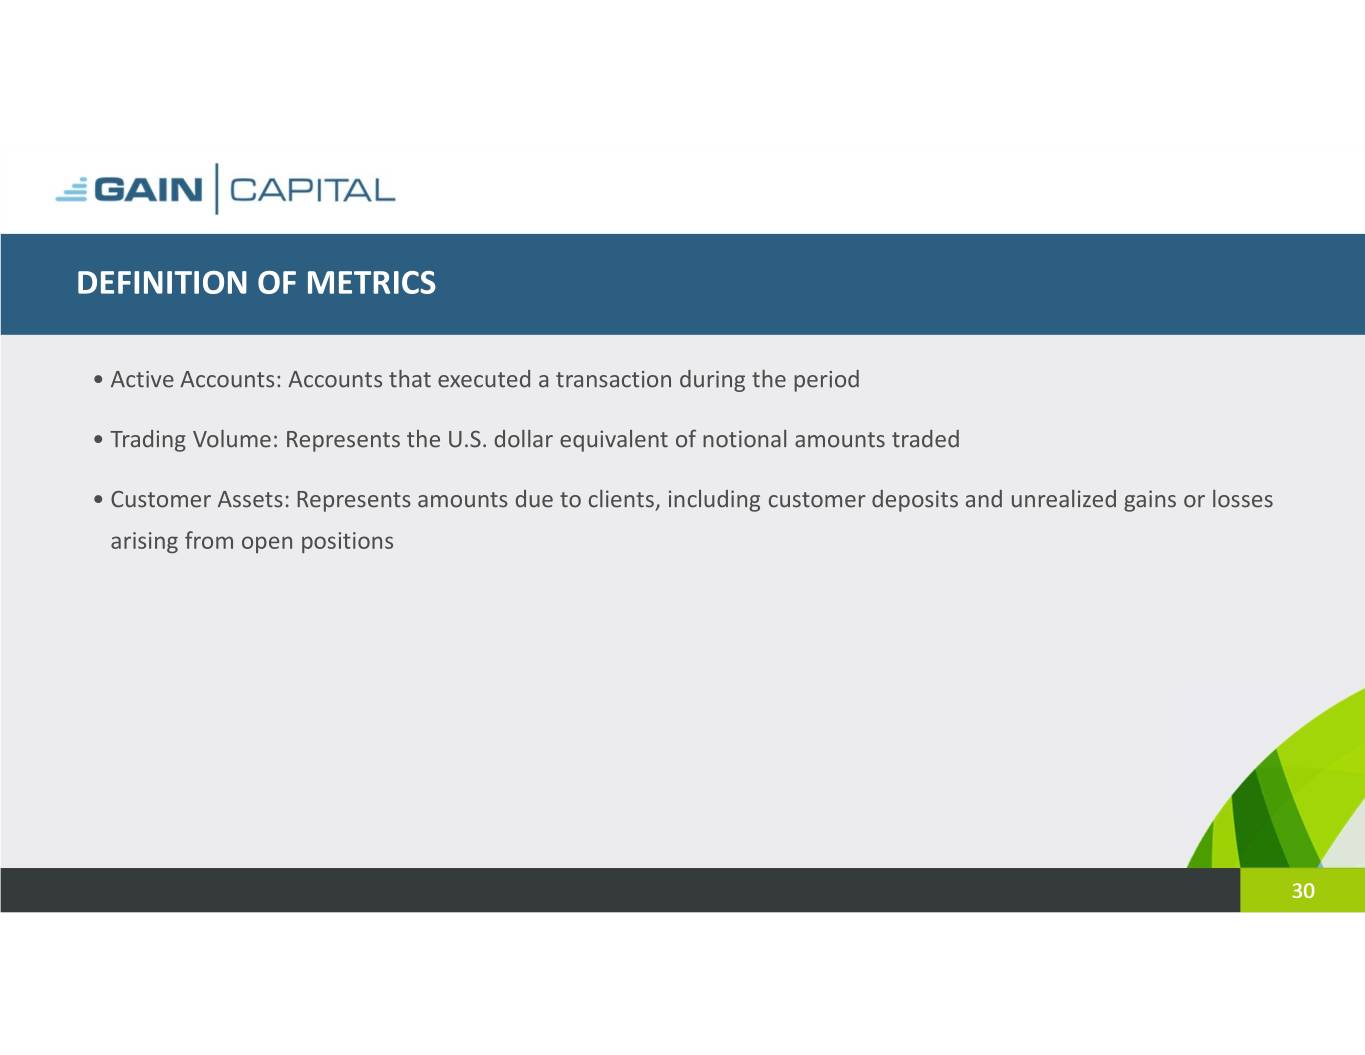
DEFINITION OF METRICS • Active Accounts: Accounts that executed a transaction during the period • Trading Volume: Represents the U.S. dollar equivalent of notional amounts traded • Customer Assets: Represents amounts due to clients, including customer deposits and unrealized gains or losses arising from open positions 30

Additional Disclosures 31
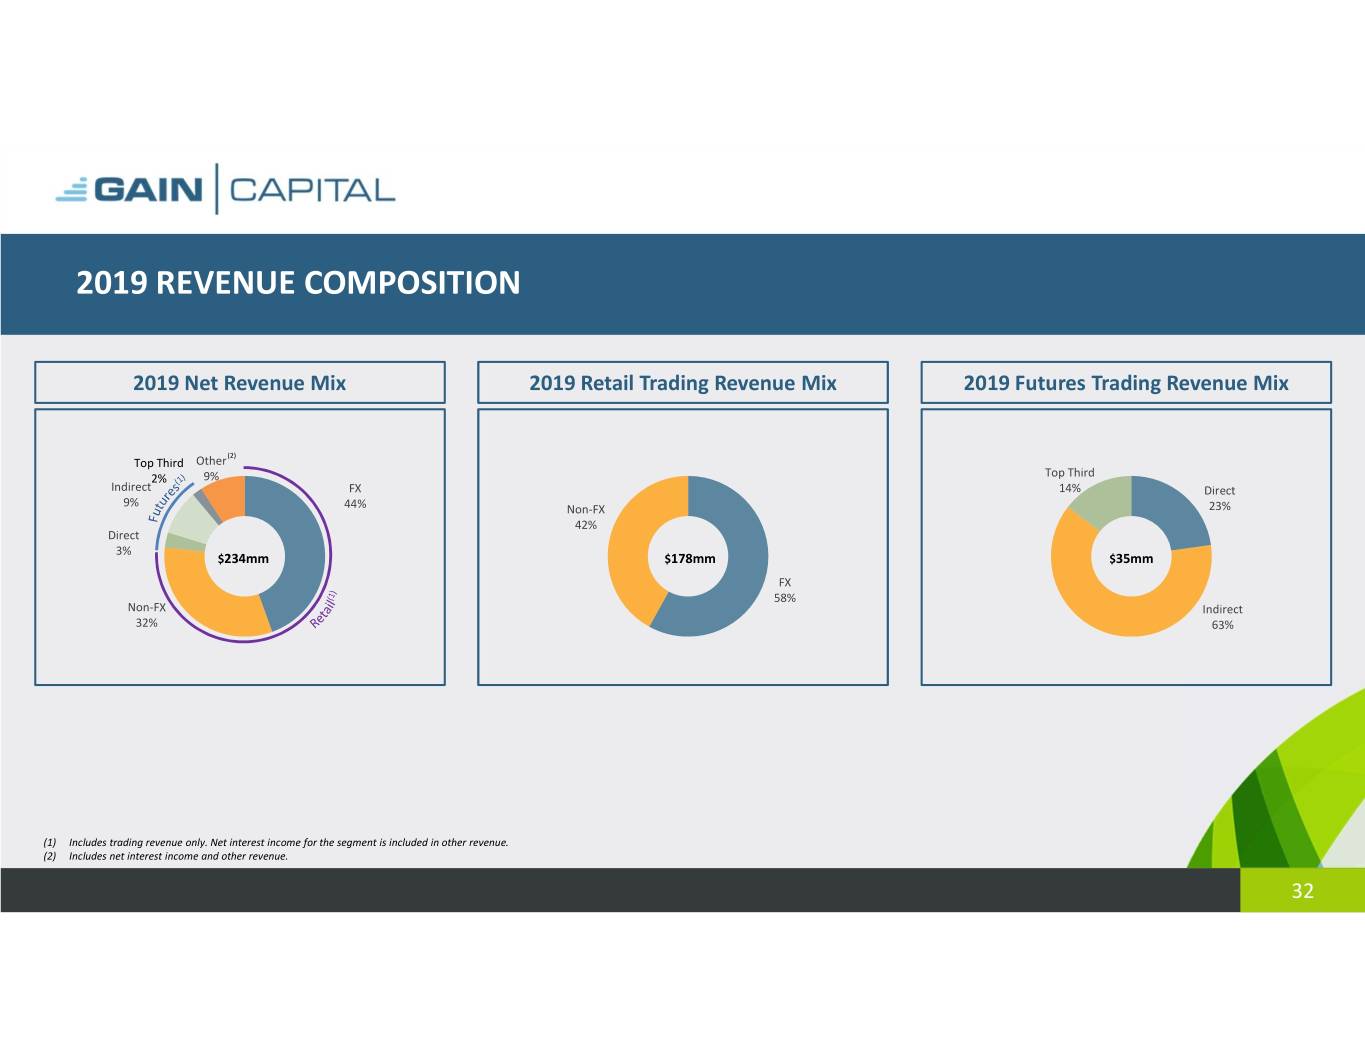
2019 REVENUE COMPOSITION 2019 Net Revenue Mix 2019 Retail Trading Revenue Mix 2019 Futures Trading Revenue Mix (2) Top Third Other 2% 9% Top Third Indirect FX 14% Direct 9% 44% Non-FX 23% 42% Direct 3% $234mm $178mm $35mm FX 58% Non-FX Indirect 32% 63% (1) Includes trading revenue only. Net interest income for the segment is included in other revenue. (2) Includes net interest income and other revenue. 32
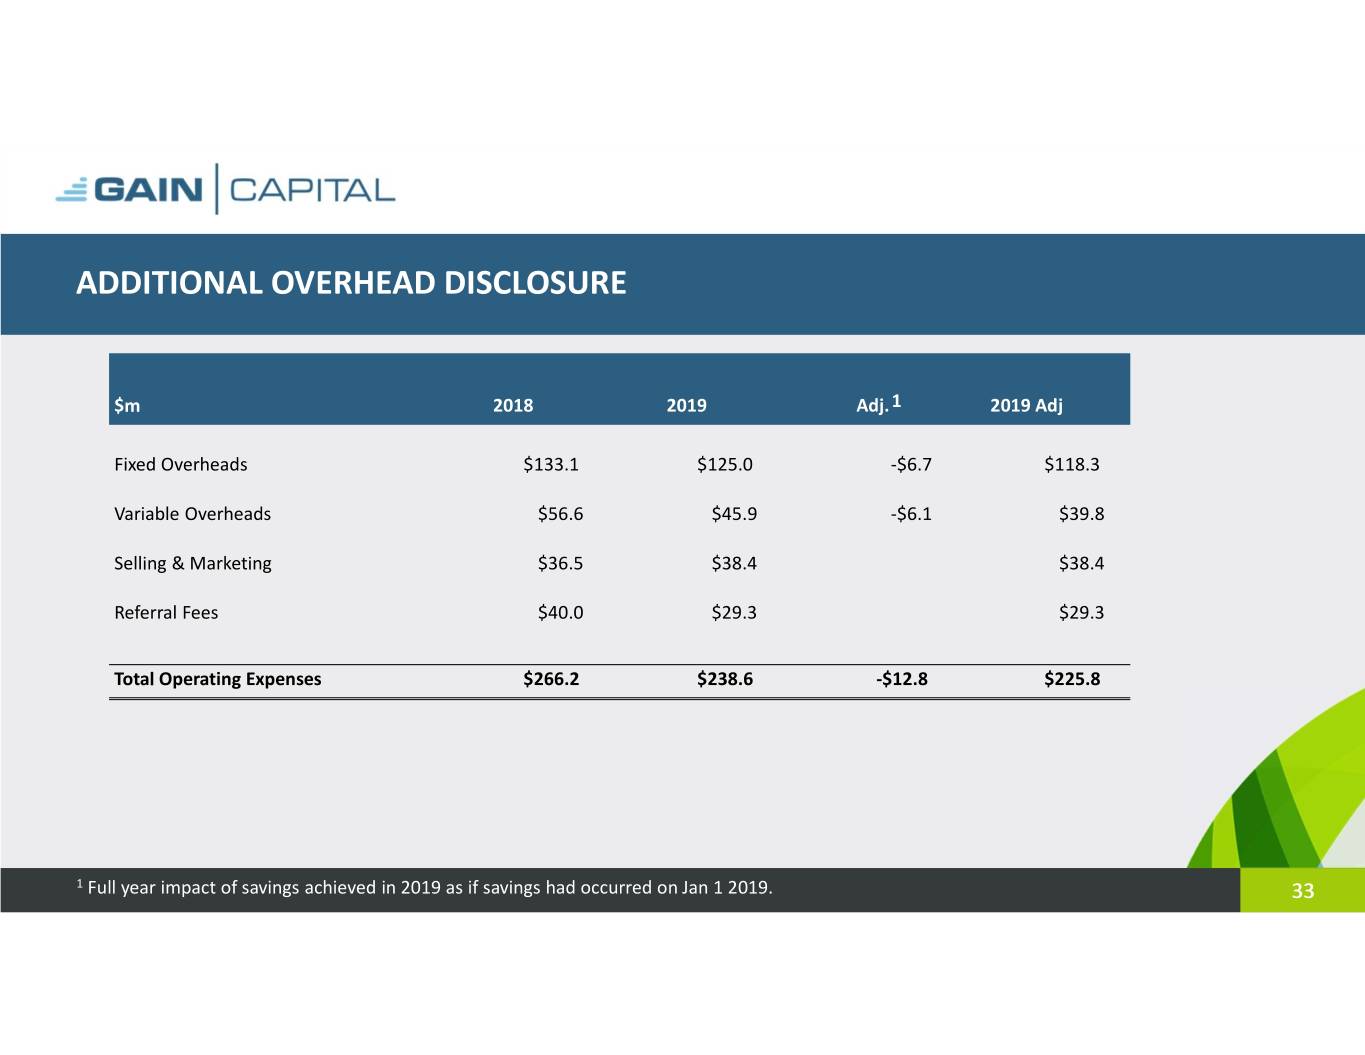
ADDITIONAL OVERHEAD DISCLOSURE $m 2018 2019 Adj. 1 2019 Adj Fixed Overheads $133.1 $125.0 -$6.7 $118.3 Variable Overheads $56.6 $45.9 -$6.1 $39.8 Selling & Marketing $36.5 $38.4 $38.4 Referral Fees $40.0 $29.3 $29.3 Total Operating Expenses $266.2 $238.6 -$12.8 $225.8 1 Full year impact of savings achieved in 2019 as if savings had occurred on Jan 1 2019. 33
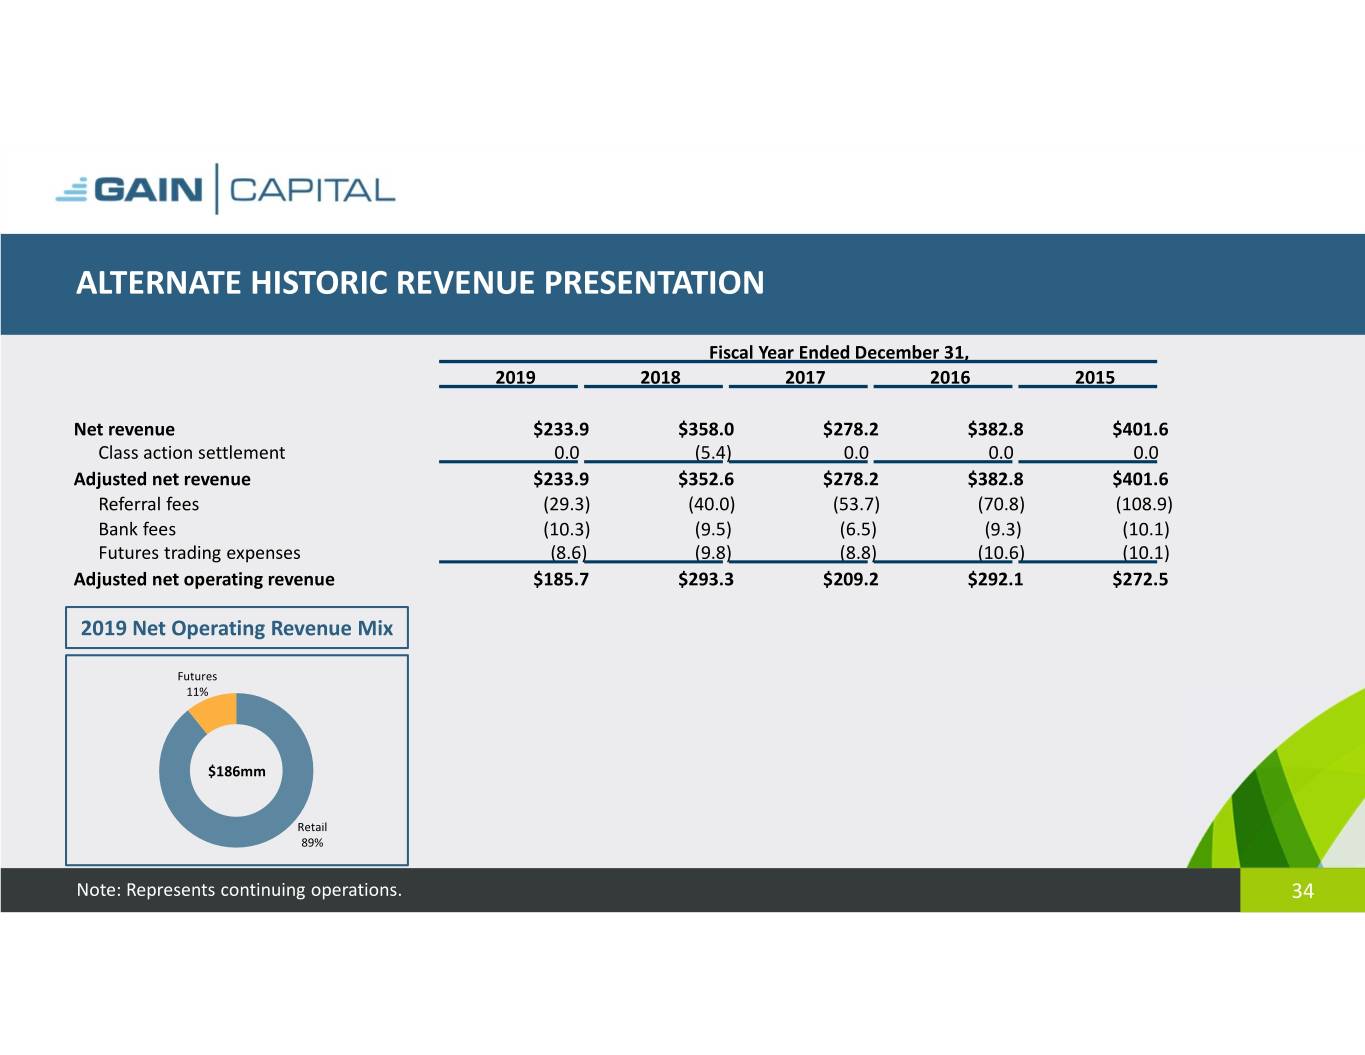
ALTERNATE HISTORIC REVENUE PRESENTATION Fiscal Year Ended December 31, 2019 2018 2017 2016 2015 Net revenue $233.9 $358.0 $278.2 $382.8 $401.6 Class action settlement 0.0 (5.4) 0.0 0.0 0.0 Adjusted net revenue $233.9 $352.6 $278.2 $382.8 $401.6 Referral fees (29.3) (40.0) (53.7) (70.8) (108.9) Bank fees (10.3) (9.5) (6.5) (9.3) (10.1) Futures trading expenses (8.6) (9.8) (8.8) (10.6) (10.1) Adjusted net operating revenue $185.7 $293.3 $209.2 $292.1 $272.5 2019 Net Operating Revenue Mix Futures 11% $186mm Retail 89% Note: Represents continuing operations. 34
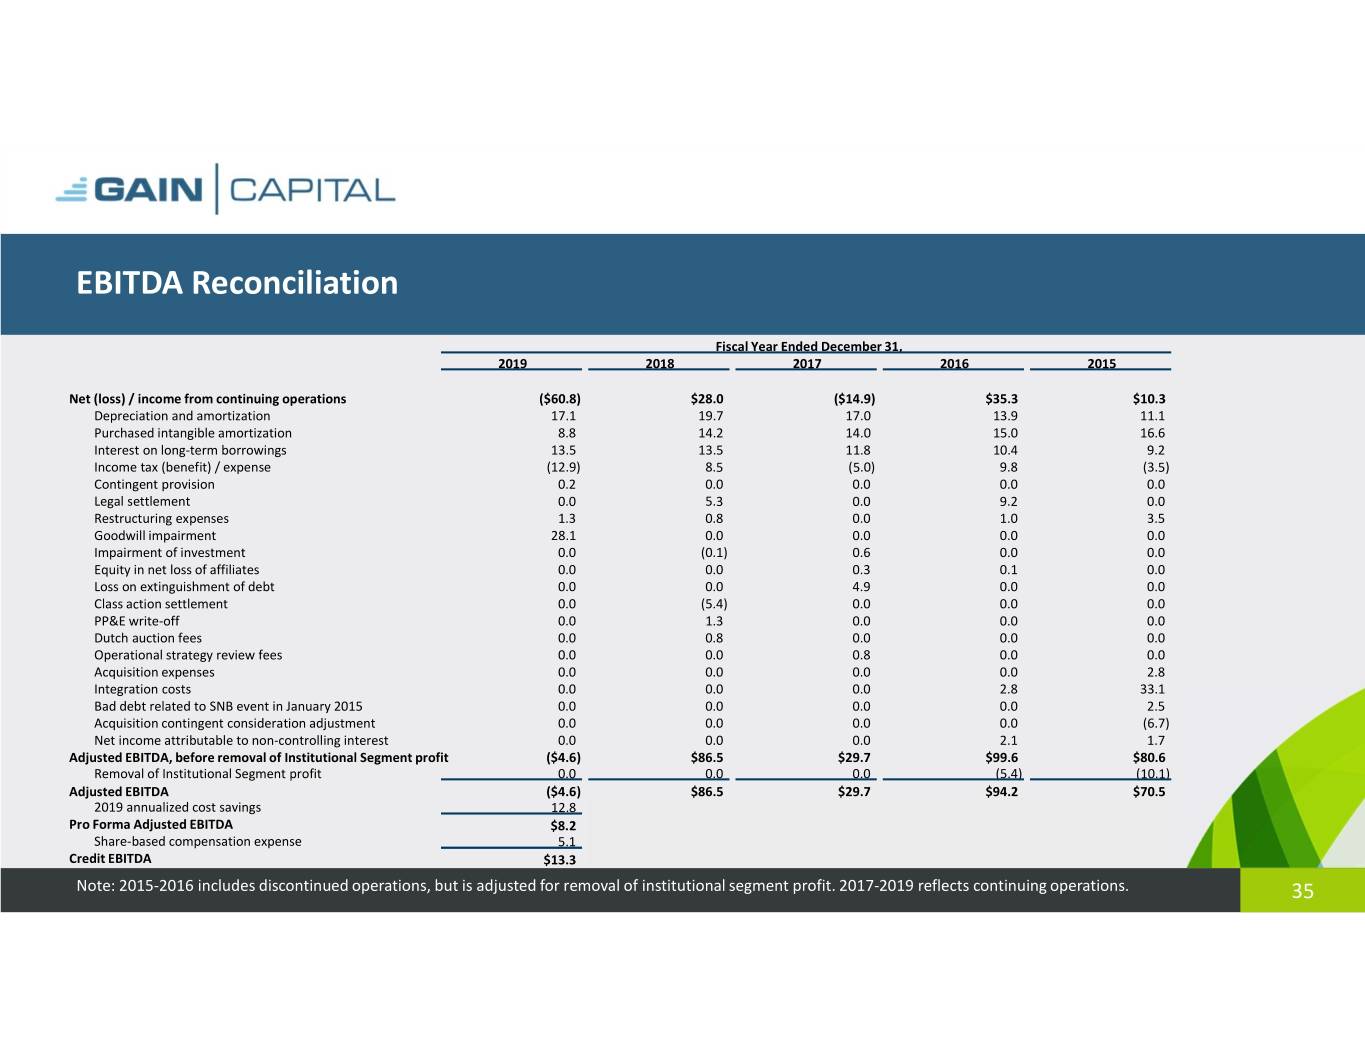
EBITDA Reconciliation Fiscal Year Ended December 31, 2019 2018 2017 2016 2015 Net (loss) / income from continuing operations ($60.8) $28.0 ($14.9) $35.3 $10.3 Depreciation and amortization 17.1 19.7 17.0 13.9 11.1 Purchased intangible amortization 8.8 14.2 14.0 15.0 16.6 Interest on long-term borrowings 13.5 13.5 11.8 10.4 9.2 Income tax (benefit) / expense (12.9) 8.5 (5.0) 9.8 (3.5) Contingent provision 0.2 0.0 0.0 0.0 0.0 Legal settlement 0.0 5.3 0.0 9.2 0.0 Restructuring expenses 1.3 0.8 0.0 1.0 3.5 Goodwill impairment 28.1 0.0 0.0 0.0 0.0 Impairment of investment 0.0 (0.1) 0.6 0.0 0.0 Equity in net loss of affiliates 0.0 0.0 0.3 0.1 0.0 Loss on extinguishment of debt 0.0 0.0 4.9 0.0 0.0 Class action settlement 0.0 (5.4) 0.0 0.0 0.0 PP&E write-off 0.0 1.3 0.0 0.0 0.0 Dutch auction fees 0.0 0.8 0.0 0.0 0.0 Operational strategy review fees 0.0 0.0 0.8 0.0 0.0 Acquisition expenses 0.0 0.0 0.0 0.0 2.8 Integration costs 0.0 0.0 0.0 2.8 33.1 Bad debt related to SNB event in January 2015 0.0 0.0 0.0 0.0 2.5 Acquisition contingent consideration adjustment 0.0 0.0 0.0 0.0 (6.7) Net income attributable to non-controlling interest 0.0 0.0 0.0 2.1 1.7 Adjusted EBITDA, before removal of Institutional Segment profit ($4.6) $86.5 $29.7 $99.6 $80.6 Removal of Institutional Segment profit 0.0 0.0 0.0 (5.4) (10.1) Adjusted EBITDA ($4.6) $86.5 $29.7 $94.2 $70.5 2019 annualized cost savings 12.8 Pro Forma Adjusted EBITDA $8.2 Share-based compensation expense 5.1 Credit EBITDA $13.3 Note: 2015-2016 includes discontinued operations, but is adjusted for removal of institutional segment profit. 2017-2019 reflects continuing operations. 35
