Attached files
Table of Contents
UNITED STATES
SECURITIES AND EXCHANGE COMMISSION
Washington, D.C. 20549
FORM 10-K
| þ | ANNUAL REPORT PURSUANT TO SECTION 13 OR 15(d) OF THE SECURITIES EXCHANGE ACT OF 1934 |
For the Fiscal Year Ended December 31, 2010
OR
| ¨ | TRANSITION REPORT PURSUANT TO SECTION 13 OR 15(d) OF THE SECURITIES EXCHANGE ACT OF 1934 |
For the Transition Period from to .
Commission File Number 001-35008
GAIN CAPITAL HOLDINGS, INC.
(Exact name of registrant as specified in its charter)
| Delaware | 20-4568600 | |
| (State or other jurisdiction of incorporation or organization) |
(I.R.S. Employer Identification No.) | |
| Bedminster One 135 Route 202/206 Bedminster, New Jersey |
07921 | |
| (Address of principal executive offices) | (Zip Code) | |
Registrant’s telephone number, including area code: (908) 731-0700
Securities registered pursuant to Section 12(b) of the Act:
| Title of each class | Name of each exchange on which registered | |
| Common Stock, $0.00001 par value | New York Stock Exchange |
Securities registered pursuant to Section 12(g) of the Act: None.
Indicate by a check mark if the registrant is a well-known seasoned issuer, as defined in Rule 405 of the Securities Act. ¨ Yes þ No
Indicate by a check mark if the registrant is not required to file reports pursuant to Section 13 or Section 15(d) of the Act. ¨ Yes þ No
Indicate by check mark whether the registrant (1) has filed all reports required to be filed by Section 13 or 15(d) of the Securities Exchange Act of 1934 during the preceding 12 months (or for such shorter period that the registrant was required to file such reports), and (2) has been subject to such filing requirements for the past 90 days. þ Yes ¨ No
Indicate by check mark whether the registrant has submitted electronically and posted on its corporate Web site, if any, every Interactive Data File required to be submitted and posted pursuant to Rule 405 of Regulation S-T during the preceding 12 months (or for such shorter period that the registrant was required to submit and post such files) ¨ Yes ¨ No
Indicate by check mark if disclosure of delinquent filers pursuant to Item 405 of Regulation S-K is not contained herein, and will not be contained to the best of the registrant’s knowledge, in definitive proxy or information statements incorporated by reference into Part III of this Form 10-K or any amendment to this Form 10-K. þ
Indicate by check mark whether the registrant is a large accelerated filer, an accelerated filer, a non-accelerated filer, or a smaller reporting company. See the definitions of “large accelerated filer,” “accelerated filer” and “smaller reporting company” in Rule 12b-2 of the Exchange Act.
| Large accelerated filer ¨ | Accelerated filer ¨ | Non-accelerated filer þ | Smaller reporting company ¨ | |||
| (Do not check if a smaller reporting company) | ||||||
Indicate by a check mark whether the registrant is a shell company (as defined in Rule 12b-2). ¨ Yes þ No
The aggregate market value of the voting stock held by non-affiliates of the registrant as of December 31, 2010, was approximately $117.6 million.
As of March 29, 2011, the registrant had 34,511,741 shares of Common Stock outstanding.
DOCUMENTS INCORPORATED BY REFERENCE
Certain information contained in the registrant’s Definitive Proxy Statement to be filed pursuant to Regulation 14A within 120 days after the end of the fiscal year is incorporated by reference into Part III of this Form 10-K.
Table of Contents
Table of Contents
| PART I |
||||||
| Item 1. |
1 | |||||
| Item 1A. |
28 | |||||
| Item 1B. |
50 | |||||
| Item 2. |
51 | |||||
| Item 3. |
51 | |||||
| Item 4. |
Omitted |
|||||
| PART II |
||||||
| Item 5. |
52 | |||||
| Item 6. |
54 | |||||
| Item 7. |
Management’s Discussion and Analysis of Financial Condition and Results of Operations |
58 | ||||
| Item 7A. |
80 | |||||
| Item 8. |
83 | |||||
| Item 9. |
Changes in and Disagreements with Accountants on Accounting and Financial Disclosure |
83 | ||||
| Item 9A. |
83 | |||||
| Item 9B. |
83 | |||||
| PART III |
||||||
| Item 10. |
84 | |||||
| Item 11. |
84 | |||||
| Item 12. |
Security Ownership of Certain Beneficial Owners and Management and Related Stockholder Matters |
84 | ||||
| Item 13. |
Certain Relationships and Related Transactions and Director Independence |
84 | ||||
| Item 14. |
84 | |||||
| PART IV |
||||||
| Item 15. |
85 | |||||
| 91 | ||||||
| 86 | ||||||
Table of Contents
FORWARD-LOOKING INFORMATION
In this Annual Report on Form 10-K, the words “GAIN”, the “Company”, “our”, “we” and “us” refer to GAIN Capital Holdings, Inc. and, except as otherwise specified herein, to GAIN’s subsidiaries. GAIN’s fiscal year ended on December 31, 2010.
This Annual Report on Form 10-K contains a number of forward-looking statements within the meaning of Section 21E of the Securities Exchange Act of 1934 as amended. These forward-looking statements are based on current expectations, estimates, forecasts and projections about the industry and markets in which GAIN operates and management’s current beliefs and assumptions. Any statements contained herein (including without limitation statements to the effect that management, we or GAIN “believes”, “expects”, “anticipates”, “plans” and similar expressions) that are not statements of historical fact should be considered forward-looking statements and should be read in conjunction with the consolidated financial statements and notes to consolidated financial statements included in this report and the section entitled “Management’s Discussion and Analysis of Financial Condition and Results of Operations”. These statements are not guarantees of future performance and involve certain risks, uncertainties and assumptions that are difficult to predict. There are a number of important factors that could cause actual results to differ materially from those indicated by such forward-looking statements. These factors include, without limitation, those set forth in the section entitled “Item 1A – Risk Factors” below and discussed elsewhere herein. The risks and uncertainties described below are not the only ones GAIN faces. Additional risks and uncertainties, including those not presently known to GAIN or that GAIN currently deems immaterial, may also impair the business. GAIN expressly disclaims any obligation to update any forward-looking statements, except as may be required by law.
PART I
| ITEM 1. | BUSINESS |
Overview
We are an online provider of retail and institutional foreign exchange, or forex, trading and related services founded in 1999 by a group of experienced trading and technology professionals. We offer customers 24-hour direct access to the global over-the-counter, or OTC, foreign exchange markets. We also offer our retail customers located outside the United States access to other global markets on an OTC basis, including equity indices and commodities via “contracts-for-difference”, or CFDs, which are investment products with returns linked to the performance of an underlying commodity, index or security. Our trading platforms provide a wide array of information and analytical tools that allow our customers to identify, analyze and execute their trading strategies efficiently and cost-effectively.
Our customer base is comprised of retail self-directed traders, retail managed accounts and institutional customers who utilize our online platforms and tools. For the year ended December 31, 2010, self-directed retail traders represented 77.1% of our customer trading volume. Managed accounts, which are accounts managed by authorized intermediaries trading on behalf of retail clients, represented 7.6% of our customer trading volume for the year ended December 31, 2010. Institutional customers represented 15.3% of our customer trading volume for the year ended December 31, 2010.
1
Table of Contents
We currently service customers residing in more than 140 countries worldwide, with offices in the United States, United Kingdom, Japan, Australia, Hong Kong, South Korea and Singapore. For the year ended December 31, 2010, 43.5% of our customer base was located in the United States, representing approximately 49.7% of our total annual trading volume, while approximately 56.5% of our customer base was located outside of the United States, representing approximately 50.3% of our total annual trading volume. With the exception of the United States, customers in no single country represented customer trading volume in excess of 7.3% for the year ended December 31, 2010. Our total annual customer trading volume, which is based on the U.S. dollar equivalent of notional amounts traded, grew from $447.0 billion in 2006 to $1.6 trillion in 2010, representing a compound annual growth rate of 36.8%. The tables below highlight certain key financial data and operating metrics for the past five years:
| Key Financial Data (in millions) Year Ended December 31, |
||||||||||||||||||||
| 2010 | 2009 | 2008 | 2007 | 2006 | ||||||||||||||||
| Net Revenue |
$ | 189.1 | $ | 153.3 | $ | 188.1 | $ | 119.3 | $ | 70.4 | ||||||||||
| Net income/(loss) |
$ | 37.8 | $ | 28.0 | $ | 231.4 | $ | (134.7 | ) | $ | (49.5 | ) | ||||||||
| Adjusted net income (unaudited)* |
$ | 33.9 | $ | 26.3 | $ | 49.6 | $ | 30.6 | $ | 12.2 | ||||||||||
| Key Operating
Metrics (Unaudited) Year Ended December 31, |
||||||||||||||||||||
| 2010 | 2009 | 2008 | 2007 | 2006 | ||||||||||||||||
| Total Trading Volume ($ in billions) |
$ | 1,564.1 | $ | 1,246.7 | $ | 1,498.6 | $ | 674.5 | $ | 447.4 | ||||||||||
| Traded Retail Accounts |
64,313 | 52,755 | 52,555 | 43,139 | 28,270 | |||||||||||||||
| Funded Retail Accounts |
85,562 | 60,168 | 49,740 | 51,026 | 37,109 | |||||||||||||||
| New Retail Accounts |
56,361 | 37,693 | 33,666 | 31,006 | 24,517 | |||||||||||||||
| Client Assets ($ in millions) |
$ | 256.7 | $ | 199.8 | $ | 124.0 | $ | 108.9 | $ | 75.6 | ||||||||||
| * | Adjusted net income is a non-GAAP financial measure which represents our net income excluding the historical change in fair value of the embedded derivative in preferred stock and the amortization of purchased intangibles. See “Management’s Discussion and Analysis of Financial Condition and Results of Operations – Change in Fair Value of Convertible Preferred Stock and Embedded Derivative and Adjusted Net Income”, for a reconciliation of GAAP net income to adjusted net income. |
We use financial metrics, including trading volume, traded retail accounts, funded retail accounts, new retail accounts, and client assets, to evaluate our current revenue and future revenue potential. Total trading volume represents the U.S. dollar equivalent on notional amounts traded. We believe that a metric which correlates to our trading volume and revenue is the number of traded retail accounts, because it represents retail customers who executed a transaction with us during a particular period. Funded retail accounts represent retail customers who maintain cash balances with us. We believe the number of funded retail accounts is an important indicator of our ability to attract new retail customers that can potentially lead to trading volume and revenue in the future. New retail accounts represent the number of customer accounts that were initially opened and funded during a given period. Client assets represent amounts due to clients, including deposits and unrealized gains or losses arising from open positions.
We seek to attract and support our retail customers through direct and indirect channels and institutional customers through direct channels. The primary direct channel for our retail business is our Internet website, FOREX.com, which is available in English, traditional and simplified Chinese, Japanese, Russian and Arabic. It provides retail traders of all experience levels with full trading capabilities, along with extensive educational and support tools. Our indirect channels include our relationships with retail financial services firms, such as broker-dealers, futures commission merchants, or FCMs, and retail banking institutions. These firms offer our trading services to their existing customers under their own brand in exchange for either a commission based on each referred customer’s trading volume or a net revenue share. We refer to these firms as our “white label partners”. We also have relationships with other entities which refer their customers to us for a fee. We refer to these firms
2
Table of Contents
as “introducing brokers”. Our institutional channel, GAIN GTX, which was launched in March 2010, sources institutional customers, consisting of commercial and investment banks, hedge funds and other professional traders, through a direct sales team. The total customer trading volume sourced through direct, indirect, and institutional channels was 48.7%, 36.0%, and 15.3%, respectively for the year ended December 31, 2010. The total customer trading volume sourced through direct and indirect channels was 65.4% and 34.6%, respectively for the year ended December 31, 2009.
We generate revenue primarily from trading revenue in our retail forex business and commissions in our institutional forex business. We generally act as the counterparty to our retail customers’ trades and as an agent for trades conducted by our institutional customers. For the year ending December 31, 2010, approximately 98.0% of our average daily retail trading volume was either naturally hedged—when one customer executing a trade in a currency pair is offset by a trade made by another customer—or hedged by us with one of our wholesale forex trading partners. Our retail forex trading revenue is generated from our managed flow portfolio, in which trades are either naturally hedged or become part of our net exposure to be managed pursuant to our risk-management policies, and our offset flow portfolio, in which we immediately offset trades with one of our wholesale forex trading partners. In our institutional forex trading business, we generate revenue through transaction-based commissions. The counterparties to our institutional customers’ trades are third-party financial institutions.
Market Opportunity
The retail forex market has grown rapidly over the past decade, with daily trading volumes growing at a compound annual growth rate of 37.1% from average daily volumes of approximately $10.0 billion in 2001 to approximately $125.0 billion in 2009 according to a 2010 analysis performed by the Aite Group.
Historically, participation in the forex trading market was only available to commercial and investment banks and other large institutional investors. We believe that the expansion of online forex trading firms, such as our company, has led to reduced trading costs and increased investor awareness of the forex market, resulting in greater retail participation. We believe that improved accessibility and convenience has spurred the growth of our industry, similar to the impact online equity brokers had on growth in the U.S. equities markets in the late 1990s.
We believe retail forex trading is poised for continued, rapid growth as a result of the following trends:
| • | increasing recognition of currency trading as an alternative investment and as a tool for portfolio diversification by retail traders, authorized traders and investment professionals globally; |
| • | improved access to the forex market, reduced transaction costs and more efficient execution; |
| • | increased availability of investor education relating to the forex market and trading opportunities; |
| • | expansion of marketing efforts by many leading firms in the forex industry; |
| • | increasing media coverage of the forex market; and |
| • | rising global broadband and wireless penetration. |
Despite the strong growth of the retail forex market, online retail forex investors still represent a small fraction of total online investors. The Aite Group estimates that, as of July 2010, there were more than 100 million online retail investors globally, but only 1.25 million online retail investors who trade forex. Since retail forex is an asset class that can be traded 24 hours per day, five days a week, it is convenient for many online investors as they can trade at any time of the day.
Trading Platforms
We offer a variety of innovative trading platforms and tools to support our retail and institutional customers. Our retail trading platforms provide our customers with multiple ways to trade and manage their accounts, based on
3
Table of Contents
their trading experience, level of sophistication or preferred mode of access, including desktop applications, browser-based trading and mobile devices. Our institutional electronic communications network, or ECN, features a diverse liquidity pool and is designed for hedge funds, high frequency traders and financial institutions.
FOREXTrader PRO
FOREXTrader PRO, our downloadable, Windows-based trading platform, is designed to provide our more active and experienced retail customers with split-second trade execution, real-time position and account information, advanced order management features, including advanced order types that allow customers to automate their individual trading strategies, and comprehensive analytical and decision support tools, including charting, real-time news feeds and market research.
Website Trading
Website trading provides our retail customers with streamlined trading, research and account management features in a secure, web-based environment. Website trading compliments our downloadable active trader platform, FOREXTrader PRO, which is designed for more active and experienced traders. We believe website trading is an important part of our long-term strategy to attract a more diverse customer base, including novice traders who prefer easy-to-use trading tools and education, research and customer support features accessed through a customer-friendly website, as well as self-directed retail investors in the United States who are already accustomed to trading on the websites of their existing online brokerage firms.
Mobile Trading
We offer our retail customers a variety of mobile trading solutions, including native applications for iPhone and Android-based devices and a mobile version of our FOREX.com website. Our mobile trading platform provides customers and registered practice trading account users with secure account access to trade and manage their accounts while away from their computers, as well as access to quotes, charts, news and research and an extensive learning section featuring articles and video tutorials. We also offer a wireless access protocol-based mobile trading solution for older web-enabled mobile devices, which allows customers and registered practice trading account users to view rates, place trades and manage their positions.
MetaTrader
To meet the needs of a growing retail customer segment interested in automated trading solutions, we offer a third-party trading platform, MetaTrader, which we license from MetaQuotes Software Corp. MetaTrader users can develop and automate their own custom trading strategies directly on the platform or use trading systems developed by third parties. MetaTrader is available in 17 languages, and is especially popular outside the United States.
GAIN GTX
GAIN GTX is our ECN for buy side institutions, including hedge funds, asset managers and proprietary traders. Launched in March 2010, GAIN GTX provides institutional customers with a fully anonymous trading environment, peer to peer trading and advanced algorithmic trading capabilities. GAIN GTX clients use their existing credit line with a prime broker to trade on the liquidity of other ECN participants. We do not act as counterparty in connection with trades executed through GAIN GTX.
4
Table of Contents
The following table provides a summary description of our key trading platforms:
| Trading Platforms: |
Functionality: | |
| FOREXTrader PRO | Our flagship trading platform for active traders, featuring a highly intuitive user interface, advanced customization features and a full suite of professional trading tools. | |
| Website trading | A comprehensive web-based environment featuring easy-to-use trading tools, a robust learning center and seamless integration of market information, trading functionality and account management tools. | |
| FOREX.com Mobile | Mobile version of our FOREX.com website designed for smartphones and other web-enabled mobile devices, including the iPhone, BlackBerry and Android-based mobile devices. | |
| FOREXTrader for iPhone | Native iPhone application offering full trading capabilities, news, charts, research and account information. Available in English, Japanese, and Russian. | |
| FOREXTrader for Android | Native application built for Android-powered smartphones, offering full trading capabilities, news, charts, research and account information. | |
| MetaTrader 4 | Third-party trading platform that features robust charting and technical analysis tools along with trade automation capabilities. | |
| GAIN GTX | Our ECN for institutional customers, including hedge funds, asset managers and proprietary traders, providing a fully anonymous trading environment, peer to peer trading and advanced algorithmic trading capabilities. | |
Our Customers
Retail Self-Directed Traders
Self-directed retail forex traders constitute the majority of our customer base. For the year ended December 31, 2010, self-directed customers represented approximately 77.1% of our customer trading volume. We believe that our leading industry reputation, advanced trading tools and high level of customer service are the key selling points for these customers.
Retail Managed Accounts
Managed account customers have engaged an intermediary to make trading decisions on their behalf. For the year ended December 31, 2010, authorized traders collectively represented approximately 7.6% of our customer trading volume. These intermediaries, also called authorized traders, include professional money managers, which trade a significant amount of aggregated customer funds, and individuals, such as ex-currency traders, that trade for a small number of customer accounts. We provide authorized traders with our trading and execution services, as well as a full suite of back-office tools and services.
Institutional Customers
Institutional customers include hedge funds, asset managers, financial institutions and proprietary trading firms. For the year ended December 31, 2010, institutional customers represented approximately 15.3% of our customer trading volume. Our GAIN GTX ECN provides institutional customers with a fully anonymous trading environment, peer to peer trading, and advanced algorithmic trading capabilities.
Our Indirect Channel Partners
For the year ended December 31, 2010, trading volume sourced through our indirect channel partners was 36.0% of our total trading volume and 42.5% of our total retail trading volume.
5
Table of Contents
White Label Partners
White label partners are firms that have not developed their own forex trading capabilities and have entered into an arrangement with us whereby we provide all of the front- and back-office services necessary for them to provide forex trading on our platforms under their own brands. We generally seek to enter into arrangements with white label partners in order to expand into new markets where we have not obtained the regulatory authorizations necessary to provide forex trading services directly to retail customers or to tap into a partner’s existing client base. For regulatory purposes, the white label partner’s customers that engage in forex trading are deemed to remain customers of the white label partner, rather than becoming our customers. Our relationships with white label partners also allow us to reduce our direct-marketing expenses, since we do not incur any such costs in connection with soliciting the customers directed to us by our white label partners. We compensate our white label partners with either a commission based on the forex trading volume generated by their customers or a net revenue share.
Our white label partners typically fall into two categories:
| • | Traditional financial services firms, such as banks or other financial institutions, seeking to provide their customers with an online forex trading platform quickly and cost-effectively; or |
| • | Established online brokers, which are registered broker-dealers, FCMs or other online brokerage firms, seeking to expand the number of financial products they offer to their customers. |
Examples of our current white label partners include Standard Bank of South Africa, Questrade and Zecco. Since our white label partners adopt the capabilities of our system as “their own”, we provide a customized trading platform branded with each white label partner’s company name and logo, which is a crucial selling point in white label partner relationships. We provide our white label partners with online access to real-time customer trading volume information and revenue accrual, as well as support through a dedicated partner services team. Our white label partner arrangements contain general termination provisions, including termination by us at any time upon reasonable notice and termination by either party in the event of a material breach by the other party that is not remedied within a specified period following notice of such breach.
Introducing Brokers
We work selectively with introducing brokers that direct to us their customers who are interested in forex trading services. We work with a variety of different types of introducing brokers, ranging from small, specialized firms which specifically identify and solicit customers interested in forex trading, to larger, more established financial services firms seeking to enhance their customer base by offering a broader array of financial products. We pay the introducing broker either a commission based on each referred customer’s trading volume or a net revenue share. To support our introducing brokers, we manage all of their back-office functions related to the forex trading customers they refer to us and provide them with online access to real-time customer trading volume information and revenue accrual, as well as support through a dedicated partners services team. Our introducing broker agreements contain terms and conditions similar to our white label partner agreements.
Our Business
Our Retail OTC Trading Business
We offer our customers the ability to trade spot forex transactions in the OTC market, including 48 different currency pairs and six metals. In a forex trade, a participant buys one currency and simultaneously sells another, a combination known as a “currency pair.” In addition, for customers outside of the United States, we offer 12 CFD products. CFDs are investment products with returns linked to the performance of an underlying commodity, index or security. Our CFD product offering currently includes 10 equity index and two oil CFDs. In the future, we plan to offer additional CFDs. Because of U.S. regulatory requirements, neither we nor our subsidiaries trade or offer CFDs in the United States or to U.S. residents.
6
Table of Contents
Retail customers can fund their trading accounts with us via electronic wire transfer, checks or debit/credit cards. While we do not extend credit to our customers, we allow them to trade notional amounts greater than the funds they have on deposit with us through the use of leverage. The maximum leverage available to retail traders is set by the regulator in each jurisdiction. For example, the maximum leverage available to retail accounts in the United States is 50-to-1. As a result, assuming use of maximum leverage, we require that U.S. customers fund their accounts with a minimum of approximately $200 in order to execute the minimum notional trade amount in a currency, which is $10,000. Outside of the United States, the maximum leverage that we are able to offer our customers varies, ranging from 20-to-1 in Hong Kong to 200–to-1 in the United Kingdom and Australia. In Japan, the maximum available leverage decreased from 100-to-1 to 50-to-1 in August of 2010 and will decrease to 25-to-1 in August 2011. Customers have the option of utilizing less than the maximum available leverage.
We utilize our extensive experience in the global OTC markets, along with proprietary technology and technology licensed from third parties to execute trades, manage market and credit risk and provide information to our clients. Technology allows us to streamline our trading management operations and improve our overall efficiency and profitability. For our retail forex trading business, we use a proprietary pricing engine to electronically aggregate real-time prices from our liquidity sources. We identify the midpoint price between the available “best bid” and “best offer,” which then becomes the basis for the dealing spread quoted to our retail customers. Depending on the currency pair being traded, the dealing spread we offer our retail customers is typically between 2 and 5 basis points (0.0002 — 0.0005), or pips, which is comparable to the dealing spread generally available to institutional customers. We earn the difference between the retail price quoted to our customers and the wholesale price received from our wholesale forex trading partners. This highly automated process enables us to update our prices on average three times per second per currency pair, helping to ensure that our prices always reflect currently available pricing in the global forex market.
We generate revenue primarily from trading revenue in our retail forex business and commissions in our institutional forex business. For the year ending December 31, 2010, approximately 98.0% of our average daily retail trading volume was either naturally hedged—when one customer executing a trade in a currency pair is offset by a trade made by another customer—or hedged by us with one of our wholesale forex trading partners. As discussed below, in our retail forex business, trading revenue is generated from our managed flow portfolio, which accounted for 76.7% of our customer trading volume for the year ended December 31, 2010, and our offset flow portfolio, which accounted for 8.0% of our customer trading volume for the year ended December 31, 2010. Our institutional forex trading business, which we launched in March 2010, accounted for the remaining 15.3% of our customer trading volume for the year ended December 31, 2010.
When a retail customer executes a trade with us, we either direct the trade into our managed flow portfolio or immediately offset the trade with one of our wholesale forex trading partners. Customer trades directed into our managed flow portfolio may either be offset through natural hedging or become part of our net exposure to be managed pursuant to our risk-management policies and procedures. Over time a portion of our net exposure may be offset and hedged with one of our wholesale forex trading partners. In connection with naturally hedged transactions, we have the opportunity to capture the entire retail bid/offer spread on the two offsetting transactions, while completely hedging our exposure and thereby reducing our overall risk. For immediately offset trades we earn the difference between the retail bid/offer spread we offer our customers and the wholesale bid/offer spread we receive from our wholesale forex trading partners, while minimizing market risk in the transaction. Whether a customer’s trade is directed to our managed flow or offset portfolios, the customer’s experience is identical with respect to trade execution, including speed of execution and pricing.
Though we do not actively initiate proprietary directional market positions in anticipation of future movements in the relative prices of the products we offer in the market, through our net exposure we are likely to have open positions in various products at any given time. In the event of unfavorable market movements, we may take a loss on such positions.
7
Table of Contents
In our institutional forex trading business, we generate revenue through transaction-based commissions and do not act as counterparty to these trades. The counterparties to our institutional customers’ trades are third-party financial institutions.
For the year ended December 31, 2009, approximately 98.6% of our average daily retail trading volume was either naturally hedged or hedged by us with one of our wholesale forex trading partners. In 2009, our managed flow portfolio accounted for 88.7% of our customer trading volume and our offset flow portfolio accounted for the remaining 11.3%. For the year ended December 31, 2008, approximately 98.8% of our average daily retail trading volume was either naturally hedged or hedged by us with one of our wholesale forex trading partners. In 2008, our managed flow portfolio accounted for 87.0% of our customer trading volume and our offset flow portfolio accounted for the remaining 13.0%.
Trading revenue represented 99.1% of our total net revenue for the year ended December 31, 2010, 100.0% of our total net revenue for the year ended December 31, 2009 and 98.9% of our total net revenue for the year ended December 31, 2008.
In certain cases, customer trade requests are invalid and, therefore, are not executed. Generally, trades are invalid due to customer error, such as entering an invalid trade amount or requesting a trade that is not covered by the applicable customer agreement, insufficient collateral in the customer’s account or regulatory issues, such as accounts required to be frozen pursuant to National Futures Association, or NFA, or Commodity Futures Trading Commission, or CFTC, request. When a trade request is rejected, the customer is immediately notified on-screen and provided the reason for the rejection. The customer may then attempt to address the issue resulting in the invalid transaction and reenter the trade.
Market Risk Management
We are exposed to market risk in connection with our retail trading activities. Because we act as counterparty to our retail customers’ transactions, we are exposed to risk on each trade that the market price of our position will decline. Accordingly, accurate and efficient management of our exposure is a high priority, and as such we have developed both automated and manual policies and procedures to manage our exposure. These risk-management policies and procedures are established and reviewed regularly by the risk committee of our board of directors. Our risk-management policies require quantitative analyses by currency pair, as well as assessment of a range of market inputs, including trade size, dealing rate, customer margin and market liquidity. Our risk-management procedures require our team of senior traders to monitor risk exposure on a continuous basis and update senior management both informally over the course of the trading day and formally through intraday and end of day reporting. A key component of our approach to managing market risk is that we do not take proprietary directional market positions and therefore do not initiate market positions for our own account in anticipation of future movements in the relative prices of products we offer. To facilitate our risk-management activities, we maintain levels of capital in excess of those currently required under applicable regulations. As of December 31, 2010, we maintained capital levels of $116.7 million, which represented approximately 3.5 times the capital we were required to hold.
Credit Risk Management
Our trading operations require a commitment of our capital and involve risk of loss because of the potential that a customer’s losses may exceed the amount of cash in their account. As a result, we require that each trade must be collateralized in accordance with our margin policies described below. Each customer is required to have minimum funds in their account for opening positions, which we refer to as the initial margin, and for maintaining positions, which we refer to as maintenance margin, depending on the currency pair being traded. Margin requirements are expressed as a percentage of the customer’s total position in that currency, and the customer’s total margin requirement is based on the aggregate margin requirement across all of the positions that a customer holds at any one moment in time. Each net position in a particular currency pair is margined
8
Table of Contents
separately. Accordingly, we do not net across different currency pairs, thereby following a fairly conservative margin policy. Our systems automatically monitor each customer’s margin requirements in real time, and we confirm that each of our customers has sufficient cash collateral in his or her account before we execute their trades. If at any point in time a customer has “negative equity” because his or her trading position does not comply with the applicable margin requirement, the position may be automatically partially or entirely liquidated in accordance with our margin policies and procedures. This policy protects both us and the customer. The incidence of negative equity in customer accounts has been immaterial to our operations in the three years ended December 31, 2010, which we believe was attributable to our real-time margining and liquidation policies and procedures. Our margin and liquidation policies are set forth in our customer agreements.
We are also exposed to potential credit risk relating to the counterparties with which we hedge our trades and the financial institutions with which we deposit cash. We mitigate these risks by transacting with several of the largest financial institutions in the market. In the event that our access to one or more financial institutions becomes limited, our ability to hedge may be impaired.
Relationships with Wholesale Forex Trading Partners
We have leveraged our extensive industry experience to secure a substantial liquidity pool for our retail business by establishing liquidity relationships with major financial institutions. Through these relationships, we are able to price and execute our retail customers’ trades in any of the forex and CFD products we offer. We have direct relationships with Barclays Bank PLC and Morgan Stanley, among others. These relationships are reflected in International Swaps and Derivatives Association, or ISDA, agreements signed with each institution. These standardized agreements are widely used in the interbank market for establishing credit relationships and are typically customized to meet the unique needs of each liquidity relationship. We have had a number of key liquidity relationships in place for more than five years, and as such we believe we have demonstrated a strong track record of meeting and exceeding the requirements associated with each relationship. However, our wholesale forex trading partners have no obligation to continue to provide liquidity to us and may terminate our arrangements with them at any time.
In addition to the direct relationships we have established with our wholesale forex trading partners, we also have entered into three global prime brokerage agreements with Deutsche Bank AG, or Deutsche Bank, UBS AG, or UBS, and The Royal Bank of Scotland, or RBS, for our retail business and fifteen additional prime brokerage relationships to support our institutional business, GAIN GTX. Our prime brokers allow us to source liquidity from a variety of executing dealers, even though we maintain a credit relationship, place collateral, and settle with a single entity — the prime broker. We depend on the services of these prime brokers to assist in providing us access to liquidity. In return for paying a modest prime brokerage fee, we are able to aggregate our trading exposures, thereby reducing our transaction costs and increasing the efficiency of the capital we are required to post as collateral. Our prime brokerage agreements may be terminated at any time by either us or the prime broker upon complying with certain notice requirements. We have also established collateralized trading lines that facilitate trading at the Chicago Mercantile Exchange as an additional source of liquidity. We generally maintain collateral on deposit with our wholesale forex trading partners and prime brokers, which includes our funds and our customers’ funds. Collateral on deposit ranged from $77.5 million to $100.6 million in the aggregate for the year ended December 31, 2010, with the average monthly balances for such period being approximately $84.2 million.
Our Institutional Model
GAIN GTX is our ECN trading platform for institutional customers. GAIN GTX clients use their existing credit line with a prime broker to trade on the liquidity of other ECN participants, including banks, hedge funds and other clients. We act as an agent for the trades executed on the GAIN GTX platform and do not incur market or credit risk. The counterparties to these trades are third-party financial institutions. We generate revenue by
9
Table of Contents
earning a commission on each transaction. For the year ended December 31, 2010, institutional forex trading volume represented 15.3% of our executed forex trading volume.
GAIN GTX is powered by software and services that we license. In July 2010, we entered into an Exclusive Marketing Agreement, or EMA, and related agreements, with Forexster Limited, or Forexster, pursuant to which we receive, subject to certain excluded customers and geographic regions, exclusive rights to use certain Forexster software in the field of forex trading and non-exclusive rights to use such trading services in the field of precious metals trading. The Forexster EMA expands the rights and obligations we had been provided under preexisting agreements with Forexster. Pursuant to the terms of the EMA, we paid Forexster an up-front, non-refundable fee and agreed to make additional payments, up to specified caps, during the term of the agreement based on a percentage of gross revenues earned by us from use of the Forexster software. See “Management’s Discussion and Analysis of Financial Condition and Results of Operations — Forexster Agreement” for further discussion. In the event that certain payment thresholds are not met on or before July 31, 2015, then all payment provisions of the EMA shall cease and the payment provisions of our pre-existing agreement with Forexster will resume. In the event such payment thresholds are met, our rights to the Forexster software under the EMA shall continue for 100 years. Thereafter, the EMA shall automatically renew for additional twelve (12) month periods unless otherwise terminated by the parties. In addition, we have the right, at any point during the term of the contract, to make a lump sum payment of the difference between the aggregate amount paid as of such date and the applicable cap amount, after which no additional payments would be due and we would be entitled to the 100 year license rights described above.
Our Broker-Dealer Business
We offer our customers the ability to trade exchange-traded products through our wholly-owned subsidiary, GAIN Securities, which represented less than 1.0% of our business for the year ended December 31, 2010. A broker dealer registered with the SEC and a member of Financial Industry Regulatory Authority, Inc., or FINRA, GAIN Securities offers direct access to listed U.S. equity securities, including stocks, exchange traded funds, or ETFs, options, mutual funds and bonds. GAIN Securities primarily targets individual self-directed retail investors in the United States through its Internet website at www.gainsecurities.com. To date, we have not marketed GAIN Securities to our forex customers and prospective forex customers, but we are exploring doing so in the future.
GAIN Securities is an introducing broker to its clearing provider, Penson Financial Services Inc., and therefore does not accept customer funds directly or maintain custody of client assets.
Sales and Marketing
Our sales and marketing strategy is designed to attract new customers and to increase the trading activity of existing customers. Our sales and marketing strategy focuses on our two customer acquisition channels to expand our customer base:
| • | For our direct channel, we use a “one-to-one” strategy of direct marketing, principally by leveraging our FOREX.com brand to cost-effectively attract new customers; and |
| • | For our indirect channel, we use a “one-to-many” strategy of forging partnerships with financial services firms, including white label partnerships and introducing brokers, that have existing customers to whom they wish to offer forex trading capabilities. |
In executing our direct marketing strategy, we employ a mixture of online and traditional marketing programs, such as advertising on third party websites, search engine marketing, email marketing and attendance at industry trade shows, all of which are aimed at driving prospective customers to the FOREX.com website to open a practice account or a funded trading account. We also advertise on television, which we believe has significantly increased not only our brand name recognition in the marketplace, but also awareness of the forex market in general. We also engage in an ongoing public relations and education initiative to build awareness of the retail
10
Table of Contents
forex industry and our company, which we believe attracts new customers. In addition, we position senior members of our research team as expert industry resources, resulting in regular appearances on major financial news outlets such as CNBC, FOX News and Bloomberg TV, as well as the Wall Street Journal and Reuters.
We offer prospective customers access to free registered practice trading accounts for a 30-day trial period, which is our principal lead-generation tool. During this trial period, our customer service team is available to assist and educate the prospective customers. From a prospective customer’s point of view, we believe the registered practice trading account serves two important functions. First, it serves as an educational tool, providing the prospective customers with the opportunity to try forex trading in a risk-free environment, without committing any capital. Second, it allows the prospective customer to evaluate our trading platform, tools and services.
Education is an important part of our marketing strategy. Our educational programs are all developed internally and are designed to accommodate a variety of experience levels and learning preferences, from self-study to fully instructional programs. Our educational resources currently include a variety of interactive webinars (web-based seminars) covering topics ranging from getting started in forex trading, to developing advanced technical analysis skills and a comprehensive web-based training course coupled with access to an experienced forex instructor. We also offer video tutorials, articles and other materials. In keeping with our education focus, FOREX.com is co-sponsoring a new 30-minute CNBC program developed to educate self-directed traders about the forex market. The program debuted in March 2011.
Customer Service
We have a dedicated, multilingual customer service staff located in the United States that handles customer inquiries via telephone, email and online chat. Customer support is available seven days a week, with continuous coverage beginning Sunday at 10:00 a.m. through 5:00 p.m. Friday and Saturday 9:00 a.m. to 5:00 p.m. (in each case Eastern Standard Time). We have documented customer issue response and escalation procedures, which help us provide timely resolution to customer inquiries.
Our Growth Strategies
We intend to pursue the following strategies to continue to grow our business and to continue to expand our product offerings to our customers:
Increase Penetration in Our Existing Retail Forex Markets
We plan to expand our retail customer base in the U.S. and other key regions by gaining market share and contributing to the growth of the overall retail forex market. We believe we can gain market share by continuing to enhance our innovative, market leading trading platforms and trading tools, continuing to improve our trade execution and continuing to provide a superior overall customer experience. In addition, we continue to sharpen our targeted marketing programs. We believe we can facilitate the growth of the overall retail forex market by continuing to invest in public relations and education programs that build awareness of the retail forex market and cultivate new retail forex traders.
We have a long history of introducing innovative trading tools to our customer base and will continue to leverage our in-house development capabilities to improve our offering by delivering regular platform enhancements and new tools to our retail customer base. One major area of focus is on our mobile trading solutions, in response to the positive customer take up and trade volume growth via our mobile trading platforms. In 2011, we intend to expand our mobile offering to include applications designed exclusively for the iPad and Windows 7 mobile devices, as well as to make continued enhancements to our existing native iPhone application, FOREXTrader for iPhone and our existing mobile Android-based application, FOREXTrader for Android.
11
Table of Contents
Continue the International Expansion of Our Retail Customer Base
We have made significant progress over the past several years in expanding internationally, including:
| • | In 2008, we acquired 100% of RCG Gain Limited, a then joint venture with Rosenthal Collins Group (now known as GAIN Capital Forex.com UK Limited) and 100% of Fortune Capital Co., Ltd. (now known as Forex.com Japan Co., Ltd.) and established operations in London and Tokyo; |
| • | In 2009, we opened offices in Seoul and Hong Kong; and |
| • | In 2010, we opened offices in Sydney and Singapore. |
In addition, in 2010, we applied to modify our license in Hong Kong to permit us to offer retail forex services directly to customers. To date, we have acted as an introducing broker in Hong Kong. We intend to continue expanding our international customer base by leveraging the FOREX.com brand name globally, using, where permitted under applicable regulations, targeted marketing programs to reach retail traders around the world with an interest in accessing global financial markets. We intend to open additional offices in jurisdictions where a local presence is helpful to our growth efforts, with a focus on geographies with a clear regulatory framework. In addition, we intend to expand internationally by selectively pursuing strategic acquisitions.
Continue Growth of Our Institutional Business
We intend to build our GAIN GTX institutional trading ECN by expanding our direct sales force in the United States, Europe and Asia, adding more liquidity to the platform by expanding the number of relationships with prime brokers and other institutions, and by facilitating new credit solutions that allow us to attract and service customers without a pre-existing credit relationship with a participating bank or prime broker. In addition, we intend to expand our product offering beyond forex trading.
Expand Our Retail Product Offering
We intend to grow our retail forex business by offering our customers additional products that are complementary to our current product offerings. Approximately two-thirds of our existing retail forex customers have told us that they trade or have traded other financial products, such as equities, futures and options. As a result, we believe we have significant growth opportunities to cross-sell complementary products to these customers. Expanding our product offerings to include other financial products will enable our retail forex customers to execute diversified trading strategies across various products using our single, integrated trading platform. For example, we are exploring offering exchange traded products such as equities, ETFs, and options to our retail forex customers through GAIN Securities.
In addition, we intend to expand our existing forex offerings by increasing the number of available currency pairs, as well as adding other currency-related products. We also intend to build upon our existing CFD product offering for our retail customers outside of the United States, including in Europe, Japan, Hong Kong and Australia. We intend to focus on CFDs that have generated interest from retail investors globally, including precious and base metals, energy products, agricultural and other commodities, as well as stock indices and government bonds. These products are not permitted to be offered to U.S. residents and we do not permit U.S. residents to trade CFDs through any of our U.S. and non-U.S. subsidiaries. Finally, our status as a registered FCM provides us with the ability to offer a variety of exchange-traded products, including futures and options on futures contracts, to our customers.
Increase Our Partnerships with Other Financial Services Firms
Through our white label and introducing broker partners, we generated 36.0% of our trade volume for the year ended December 31, 2010. We intend to pursue partnerships with firms in new markets, including markets not available to us without undertaking costly and time consuming registration with the local regulator, as well as
12
Table of Contents
with firms that have a loyal existing client base which we believe we could not otherwise efficiently solicit. We believe we are well-positioned to capture new partnership opportunities given our successful track record of supporting partners globally.
Pursue Strategic Acquisitions and Alliances to Expand Our Product and Service Offerings and Geographic Reach
We believe we can supplement our organic growth strategies by selectively pursuing attractive acquisition and alliance opportunities. In the past, we have successfully expanded the breadth of our product and service offerings by acquiring companies with complementary products and services. We intend to seek acquisition opportunities that will allow us to leverage our existing technology and operational infrastructure in order to grow our account base cost-effectively, take advantage of economies of scale, allow us to accelerate our penetration into new markets or provide us with technology or products that allow us to differentiate ourselves from our competition.
Capture Additional Market Share as a Result of Increased Regulatory Requirements.
We believe that increased regulation in the United States and other jurisdictions has impacted the retail forex industry by reducing the number of firms offering retail forex services, even as the number of retail forex customers and retail forex trade volume has grown. While complying with new regulations may increase our costs, we believe that these regulations have given customers more confidence in retail forex as an asset class and in retail forex firms that are able to comply with them. As the retail forex industry consolidates, scale and ability to comply with regulation will become increasingly important for retail forex brokers, presenting opportunities for larger firms, such as us, that can meet the more stringent regulatory requirements.
Recent Acquisitions
Consistent with our strategy to selectively pursue attractive acquisition and alliance opportunities, in 2010 we acquired $35.0 million in retail forex customer assets in two transactions. Specifically, in October 2010, we acquired the customer account balances and effective customer agreements of Capital Market Services, LLC for $8.0 million, plus certain earn-out payments based on the amount of revenue generated by the acquired assets over the eighteen months following closing of the transaction. In August 2010, we acquired the account balances and effective customer agreements, customer list and marketing list from MG Financial LLC for $0.5 million. See Notes 1 and 6 of our Consolidated Financial Statements provided in response to Item 8 of this annual report on Form 10-K.
Competition
The retail forex trading market is fragmented and highly competitive. Our competitors in the retail forex market can be grouped into several broad categories based on size of net capital, technologies, product offerings, target customers and geographic scope of operations:
| • | Market Leading Forex Trading Firms: include our firm and other firms with similar business models, such as Forex Capital Markets LLC, Global Futures & Forex, LLC and OANDA Corporation. The firms within this category are our primary competition for our existing forex trading services. |
| • | Small/Specialized Forex Trading Firms: include firms such as FXDirectDealer, LLC and InterbankFX, LLC. These firms, to date, have not been our core competitors due to their smaller size and technology and marketing limitations. |
| • | Other Online Trading Firms: include firms such as OptionsXpress Holdings, Inc. (which The Charles Schwab Corporation recently announced it was acquiring), E*TRADE Financial Corp., TDAMERITRADE and Scottrade. These firms are generally either niche players focused on a particular product, such as equity options, or traditional online equity brokers, that have expanded into other financial products that may already, or will in the future, include forex trading. |
13
Table of Contents
| • | Multiproduct Trading Firms: include firms such as Saxo Bank, CMC Group, IG Group Holdings plc, City Index Limited and Interactive Brokers LLC. Among these firms, those based in the United States tend to focus on listed products and provide forex principally as a complementary offering. Other than Saxo Bank, the international firms tend to focus on CFDs. |
There has been an increase of interest in the retail forex market from international banks and other financial institutions with significant forex operations. Since 2007, a number of these institutions announced or launched retail forex operations. In most cases, the financial institutions have chosen to enter into a joint venture with an independent retail forex firm in lieu of building a retail operation. We believe these financial institutions are electing to enter into joint ventures because these arrangements can result in accelerated time to market and increased profitability. We believe that retail forex trading will continue to be an increasing area of focus for international financial institutions in the future.
We believe the key factors that affect our competitive position in the forex market include:
| • | Functionality, performance and reliability of trading platform; |
| • | Speed and quality of trade execution; |
| • | Pricing; |
| • | Level of customer service; |
| • | Brand reputation; |
| • | Efficacy of sales and marketing efforts; |
| • | Strategic partnerships with financial services firms; |
| • | The ability to offer ancillary services, such as research and education; |
| • | Range of product offering; and |
| • | Capacity of trading platform to handle large volumes of customer transactions. |
We attribute our competitive success to the customer experience we deliver, including our innovative trading tools and strong trade execution capabilities, as well as our global marketing capability. We believe that our expertise in trading, technology innovation and marketing will allow us to continue to compete on a global basis as we expand our product and service offerings and further extend our global footprint.
Intellectual Property
We rely on a combination of trademark, copyright, trade secret and fair business practice laws in the United States and other jurisdictions to protect our proprietary technology, intellectual property rights and our brands (Forex.com, GAIN Capital, and GAIN GTX). We also enter into confidentiality and invention assignment agreements with our employees and consultants, and confidentiality agreements with other third parties. We rigorously control access to proprietary technology. Currently, we do not have any pending or issued patents.
We use the following service marks that have been registered or for which we have applied for registration with the U.S. Patent and Trademark Office: GAIN Capital (registered service mark), FOREX.com GAIN Capital Group (registered service mark), Trade Real Time (registered service mark), ForexPro (registered service mark), ForexPremier (registered service mark), Forex Insider (registered service mark), ForexTrader (registered service mark), FOREX.com (registered service mark), ForexPlus (registered service mark) and It’s Your World. Trade It (pending service mark).
14
Table of Contents
Technology Architecture
We leverage a wide variety of proprietary and third party technologies to meet the needs of our customers and our business operations. Leveraging our in-house development expertise, we have invested approximately $7.7 million since the beginning of commercial operations in the development and support of our proprietary technology. We believe that our proprietary trading technology has and will continue to provide us with a significant competitive advantage because we have the ability to adapt quickly to our customers’ changing needs and rapidly incorporate new products and features.
Our proprietary retail trading technology is primarily Microsoft-based — ASP.net for browser-based delivery and C#.net for more technologically advanced delivery. We offer multiple methods through which our customers can transact with us including desktop, browser-based and mobile trading applications.
In addition to our proprietary trading technology, we license MetaTrader, a third-party trading platform, from MetaQuotes Software Corp. The MetaTrader platform utilizes the same infrastructure as our proprietary trading platform. For the year ended December 31, 2010, 30.5% of our forex trading volume was derived from trades utilizing the MetaTrader platform.
Our GAIN GTX ECN platform is powered by software and services that we license from a third party. For the year ended December 31, 2010, 15.3% of our forex trading volume was derived from trades utilizing our GAIN GTX ECN platform.
Scalability
Our trading platforms are designed to meet the demands of our growing customer base by incrementally adding readily available hardware components and Internet bandwidth as necessary. In addition, we work with third-party service providers to continuously provide excess capacity with respect to space, power, heating/cooling systems and communications bandwidth from over 300 communications providers. We believe our approach to scaling allows us to efficiently and effectively address the costs required to support our current business and provide the foundation for rapid growth in the future.
We believe our forex trading platforms have adequate capacity to support our customer activity. Our current trading platform configuration is capable of handling at least 3,000,000 trade requests per trading day. We handle an average of approximately 120,000 retail trade requests per day and have exceeded 295,000 retail trade requests on active days. During peak trading periods, we receive and execute thousands of trade requests within a period of a few minutes. Peak trading periods include the trading days around economic announcements related to gross domestic product, nonfarm payroll and Federal Open Market Committee decisions on the federal funds rate. Our trading platform’s capacity allows us to continue to grow while at the same time developing improvements in both hardware and software aimed at reducing trade latency and increasing capacity.
If a customer has difficulty logging on to our trading platform, or has any other issues or questions, they can contact our customer service team. Most common issues are local to the customer, including issues with respect to customers’ computers, Internet access, firewall configuration and forgotten user I.D.s and passwords. Our customer service team is trained to assist in addressing these issues.
Reliability and Availability
We depend on the availability of our technology systems and have made significant investments in high-availability, layered hardware and software technologies. Our hardware infrastructure is hosted at two separate geographic locations, providing a “live-live” redundancy model. Our primary hardware is housed at a dedicated
15
Table of Contents
International Business Exchange, or IBX, hosted by Equinix, Inc., or Equinix, a provider of environmentally controlled, secure facilities connected to multiple communications providers focused on meeting the demands of the financial services sector. The Equinix IBX center has an uninterruptible power supply, back-up systems, and N+1 (or greater) redundancy with extensive heating, ventilation, air-conditioning systems capable of handling the demands of high-power density deployments. The Equinix IBX center also offers high levels of physical security, power availability and infrastructure flexibility. At Equinix, our forex trading platform resides in the same Internet “neighborhood” as many of our wholesale forex trading providers and white label partners. We believe this close proximity provides a competitive advantage on pricing and execution speed. In addition to our primary Equinix location, we maintain a secondary site (currently located at our corporate headquarters) to balance customer traffic and provide “live-live” redundancy in case of interruptions at our Equinix IBX location.
To further supplement our multisite, “live-live” redundancy model, our technology systems (located at our Equinix and corporate headquarters locations) have been designed to ensure that there are no single points of failure in the system architecture. All hardware (network devices and servers) are configured for high availability which is leveraged by server virtualization where we partition our server technologies at all tiers to facilitate our platform management and allow for rapid response. We also contract with multiple communications carriers at each of our locations to ensure service availability for communications with our customers and wholesale forex trading providers. Our “uptime,” or system availability, is continuously monitored (minute by minute) by our external third-party vendors and during the year ended December 31, 2010, we achieved an uptime of 99.7%.
Security
Securing access to our trading platform and customer information is essential to our business success. We maintain strict internal practices, procedures and controls to enable us to secure our customers’ sensitive information, including social security numbers, bank account information and other personal data. We employ industry-leading firewall technologies at the perimeter of our hosting facilities to restrict inappropriate access. All customer-facing servers are contained within a secure Demilitarized Zone, or DMZ, that partitions customers from our core infrastructure and trading transactional services. We have also partnered with IBM Internet Security System to provide a managed intrusion detection/prevention system which actively monitors and blocks inappropriate traffic on our production network. In addition, IBM’s global Security Operations Centers proactively monitors our production networks 24 hours a day. Access to our information systems is granted to our customers and internal users on an as-needed basis. Customers access our trading platform and secure portals using a user ID and password challenge/response approach.
All customer communications are initiated over secure (128-bit SSL or HTTPS) connections to protect customer data as it traverses the Internet. In addition, all communications with wholesale forex trading providers are made over private or virtual private networks to ensure the secure communication of pricing and trade data. In our processing of credit card transactions, we do not store customer card numbers. We have been tested and are PCI-compliant (Payment Card Industry). Our chief information officer acts as our director of information security and is primarily responsible for the security of our technology infrastructure and application development. We have also engaged an independent registered public accounting firm to perform an audit of our internal controls and procedures and issue an audit report in accordance with Statement on Standards for Attestation Engagements (“SSAE”) No. 16, in the second half of 2011.
In addition, physical access is restricted at our Equinix IBX center and corporate headquarters facilities. Access is granted to technical and support staff using swipe card-based entitlement. Our network operations center is manned 24 hours a day to ensure that our technology services are continuously running, with any potential issues being addressed in real time. Our corporate headquarters is also monitored by building security from 6:00 a.m. until 10:00 p.m. (Eastern Standard time) Mondays through Fridays. The building is also monitored by building management, which is open from 8:00 a.m. until 5:00 p.m. Monday through Friday.
16
Table of Contents
Business Continuity
We maintain formal business continuity policies, practices and procedures aimed at allowing us to recover rapidly from business or trading interruptions. Each of our systems and services has been ranked according to the risk associated with an interruption. Business recovery time objectives have been established relative to our risk assessment and business criticality and our recovery plans and controls have been established to avoid and mitigate such risks. Our recovery plans and controls are tested on an annual basis to determine effectiveness and are continuously maintained and updated in order to support changes in business requirements or IT environments.
To affect these business continuity objectives, our “live-live” redundancy sites are geographically separated (more than 36 miles apart) and are interconnected via private, multilayered high speed circuits, allowing real-time, two way data replication for all of our trading technologies. Each of our locations provides redundant UPS battery power and diesel generator backup to ensure power availability with multiple Internet communications circuits provided by various carriers to ensure availability. In addition, we maintain two separate office locations in the New York/New Jersey area capable of supporting critical functions in order to ensure that our personnel are able to maintain our business in the event that one physical site becomes unavailable.
Regulation
Overview
Our business and industry are highly regulated. Our operating subsidiaries are regulated in a number of jurisdictions, including the United States, the United Kingdom (through which we have accessed regulatory passport rights to operate in a number of European Economic Area jurisdictions), Japan, Australia and Hong Kong. Government regulators and self-regulatory organizations oversee the conduct of our business in many ways, and several perform regular examinations to monitor our compliance with applicable statutes, regulations and rules. These statutes, regulations and rules cover all aspects of our business, including:
| • | sales and marketing activities, including our interaction with, and solicitation of, customers; |
| • | trading practices, including the manner in which we offer investment products and the types of investment products we may offer; |
| • | treatment of customer assets, including custody, control, safekeeping and, in certain countries, segregation of our customer funds and securities; |
| • | maintaining specified minimum amounts of capital and limiting withdrawals of funds from our regulated operating subsidiaries; |
| • | continuing education requirements for our employees; |
| • | anti-money laundering practices; |
| • | recordkeeping and reporting; and |
| • | supervision regarding the conduct of directors, officers and employees. |
For the year ended December 31, 2010, approximately 68.3% of our trading volume was attributable to customers resident in a jurisdiction where we are licensed or regulated or where we deal with customers cross-border in a manner which we believe does not require us to be regulated in that jurisdiction. The remaining 31.7% of our trading volume was attributable to customers sourced through partners licensed or regulated in a particular jurisdiction or customers in jurisdictions in which we are not currently licensed or authorized by the local government or applicable self-regulatory organization. Over the past 12 months (through December 31, 2010), in nearly every jurisdiction in which residents of such jurisdiction accounted for one percent (1.0%) or greater of our customer trading volume, we have consulted with legal counsel as to whether we have the required authorizations, licenses or approvals or whether we may conduct our business cross-border with residents in that
17
Table of Contents
jurisdiction without obtaining local regulatory authorization, approval or consent. In addition, on an on-going basis we proactively evaluate our activities in jurisdictions in which we are not currently licensed or registered. As a result of these evaluations, we consider whether a change in our business practices is required to ensure that we remain in compliance with applicable rules or regulations and, at any given time, we may be in the process of altering our business practices concerning customers in one or more jurisdictions. To the extent that we serve customers in a jurisdiction in which we determine licensing or registration is required, we may also elect to direct such customers to a licensed white label or other partner, rather than pursuing licensing or registration.
In jurisdictions in which we are not licensed or authorized, we may be subject to a variety of restrictions regarding the manner in which we conduct our business or serve customers, including restrictions on:
| • | our sales and marketing activities; |
| • | the use of a website specifically targeted to potential customers in a particular country; |
| • | the minimum income level or financial sophistication of potential customers we may contact; |
| • | our ability to have a physical presence in a particular country; or |
| • | the types of services we may offer customers physically present in each country. |
Though we conduct our business in a manner which we believe complies with applicable local law, regulators generally reserve the right to assert jurisdiction over activities that they deem to take place within the jurisdiction they regulate, and new laws, rules or regulations may be enacted that change the regulatory landscape and result in new, or clarify preexisting, registration or licensing requirements. In any such event, we would determine whether to register or obtain a license in such jurisdiction or change the manner in which we serve customers in the relevant country.
The primary responsibility for ensuring that we maintain compliance with all applicable regulatory requirements is vested in our legal and compliance departments. In addition, our legal and compliance departments are responsible for our ongoing training and education programs, supervision of our personnel required to be licensed by one or more of our regulators, review of sales, marketing and other communications and other related functions. Many members of our senior management team are NFA-registered principals with supervisory responsibility over forex trading or other aspects of our business. In addition, all of our sales employees are licensed pursuant to applicable regulation.
U.S. Regulation
In the United States, the CFTC and the NFA regulate our forex trading activities. Historically, the principal legislation covering our U.S. forex business was the Commodity Exchange Act, which provides federal regulation of all commodities and futures trading activities and requires all futures and commodity options to be traded on organized exchanges. In recent years, as in the case of other companies in the financial services industry, our forex business has been subject to increasing regulatory oversight. Specifically, in 2008, the Congress passed the CFTC Reauthorization Act, which amended the Commodity Exchange Act to grant the CFTC express authority to regulate the retail forex industry. On October 18, 2010, the CFTC adopted a series of rules which regulate various aspects of our business. Specifically, these rules:
| • | created “retail foreign exchange dealers,” or RFEDs, a new regulated category of forex brokers focused on retail investors that are permitted to act as counterparty to retail forex transactions; |
| • | impose an initial minimum security deposit amount of 2.0% of the notional value for retail forex transactions in “major currency” pairs and 5.0% of the notional value for all other retail forex transactions and provide that the NFA will designate which currencies are “major currencies” and will review, at least annually, major currency designations and security deposit requirements and adjust such designations and requirements as necessary in light of changes in the volatility of currencies and other economic and market factors; |
18
Table of Contents
| • | provide that introducing brokers must either (i) register with the CFTC and become members of the NFA or apply for an exemption from registration and (ii) meet the minimum net capital requirements applicable to futures and commodity options introducing brokers or enter into a guarantee agreement with a CFTC-regulated forex dealer member, and permit only one such guaranty agreement per introducing broker; |
| • | require that the risk disclosure statement provided to every retail forex customer include disclosure of the number of profitable and unprofitable non-discretionary accounts maintained by the forex broker during the four most recent calendar quarters; |
| • | prohibit RFEDs, FCMs and introducing brokers from including statements in sales and marketing materials that would appear to convey to potential retail forex customers that there is a guaranty against loss, and require that FCMs, RFEDs and introducing brokers provide retail forex customers with enhanced written disclosure statements that, among other things, inform customers of the risk of loss; and |
| • | require RFEDs to maintain net capital of at least $20.0 million, plus 5.0% of the RFED’s customer obligations in excess of $10.0 million. In addition, in the event an RFED’s net capital position falls below 110.0% of the minimum net capital requirement, the RFED would be subject to additional reporting requirements. |
In July 2010, the Congress passed the Dodd-Frank Wall Street Reform and Consumer Protection Act, or the Dodd-Frank Act, a sweeping law affecting almost every aspect of the U.S. financial services industry. Though most of the Dodd-Frank Act is focused on aspects of the financial services industry that are not related to our business, a number of significant provisions contained in the law affect, or will affect when implementing regulations are adopted by the appropriate federal agencies, our business. Specifically, the Dodd-Frank Act includes:
| • | rules that, beginning in October 2010, require us to ensure that our customers resident in the United States have accounts open only with our NFA-member operating entity, GAIN Capital Group, LLC; |
| • | amendments to the Commodity Exchange Act that, beginning on July 15, 2011, require essentially all retail transactions in any commodity other than foreign currency to be executed on an exchange, rather than in OTC transactions; |
| • | a requirement that federal banking regulators adopt new rules regarding the conduct and operation of retail forex businesses by banks; and |
| • | a requirement that the SEC adopt rules regarding the conduct and operation of retail forex businesses by broker-dealers. |
As a result of the Dodd-Frank Act’s requirement that essentially all transactions in commodities be executed on an exchange, after July 15, 2011, we will no longer be permitted to offer spot metal transactions in the United States. For the year ended December 31, 2010, our spot metals business with U.S. customers generated approximately $10.8 million in revenue. In addition, new regulations regarding banks’ participation in the forex business could significantly affect our wholesale forex trading partners’ ability to do business with us, which could affect the structure, size, depth and liquidity of forex markets generally.
U.S. Patriot Act and Anti-Money Laundering
Like other companies in the financial services industry, we are subject to a variety of statutory and regulatory requirements concerning our relationships with customers and the review and monitoring of their transactions. Specifically, we are subject to the Uniting and Strengthening America by Providing Appropriate Tools Required to Intercept and Obstruct Terrorism Act of 2001, or the Patriot Act, which requires that we maintain a comprehensive anti-money laundering, or AML, program, a customer identification program, or CIP, designate an AML compliance officer, provide specified employee training and conduct an annual independent audit of our AML program. Consistent with the Patriot Act, our CIP includes both documentary and non-documentary review
19
Table of Contents
and analysis of potential customers. Under our CIP, we review each prospective customer’s identity internally and also contract with third-party firms that perform extensive background checks on each prospective customer, including through review of the U.S. Treasury Department’s Office of Foreign Assets and Control, Specially Designated Nationals and Blocked Persons lists. These procedures and tools, coupled with our periodic training, assist us in complying with the Patriot Act, as well as the CFTC’s and NFA’s applicable AML and CIP requirements.
International Regulation
We have provided below a brief description of the key regulatory aspects governing our operations in the jurisdictions in which we have registered with, or obtained a license from, the local regulator.
United Kingdom
GAIN Capital Forex.com UK Limited, or GCUK, is a registered full scope BIPRU 730K investment firm, regulated by the Financial Services Authority.
In the European Union, government officials have announced the intention to propose new laws to regulate OTC derivatives. The new laws would, among other things, require mandatory central clearing of some derivatives, higher collateral requirements and higher capital charges for certain OTC derivatives. These initiatives are still at the consultation stage and details for many aspects of the legislative proposals have not yet been published. If the products that we offer are subjected to mandatory central clearing, exchange trading, higher collateral requirements or higher capital charges, our business, financial condition and results of operations could be materially adversely affected.
Japan
Forex.com Japan Co., Ltd., or GC Japan, is a registered Type I financial instruments business firm regulated by the Financial Services Agency of Japan in accordance with Financial Instruments and Exchange Law (Law No. 25 of 1948, as amended). GC Japan is also regulated by the Japan Ministry of Economy, Trade and Industry, or the JETI, and the Japan Ministry of Agriculture, Forestry and Fisheries, or the JAFF, and is a member of the Financial Futures Association of Japan. As required under applicable law, on January 1, 2011, we obtained a license from the JETI and JAFF.
The regulation of forex trading in Japan has recently undergone significant regulatory changes. In particular, pursuant to a new rules effective August 1, 2011, the maximum permitted leverage ratio for forex products will be 25-to-1 and a new maximum leverage ratio of 20-to-1 for spot gold and spot silver products will take effect on July 1, 2011. These regulatory changes may have a material adverse affect on our forex and metals business with Japanese customers.
Australia
GAIN Capital Forex.com Australia, Pty. Ltd. is regulated by the Australian Securities and Investments Commission in Australia.
The Australian Securities and Investments Commission has proposed its intention to issue new guidance on advertising materials, to introduce disclosure benchmarks for OTC CFD providers and to require OTC CFD providers to adopt written customer suitability policies.
Hong Kong
Our Hong Kong subsidiary, GAIN Capital Forex.com Hong Kong Limited, or GCHK, is a Type 3 leveraged foreign exchange trading firm registered with the Securities and Futures Commission, or SFC, and operates as an
20
Table of Contents
approved introducing agent. GCHK has applied to the SFC to modify its license to permit it to offer retail forex services directly to customers.
Cayman Islands
GAIN Global Markets, Inc., or GGMI, our Cayman Island subsidiary, is a registered securities arranger with the Cayman Islands Monetary Authority.
We have also provided below a brief discussion of material regulatory developments affecting our business in other jurisdictions important to our business, including developments that have presented risks or uncertainties for our operations. See “Item 1A. Risk Factors” for additional information regarding the various risks we face as a result of the regulated nature of our business.
China
The regulatory rules in China are complex and are not as clear as those in many other jurisdictions. Between 2006 and 2008, a significant portion of our trading volume, trading revenue, net income and cash flow was generated from residents of China. When we commenced offering our forex trading to Chinese customers, we believed that our operations complied with applicable Chinese regulations. However, as a result of a review of our regulatory compliance in China during 2008, we became aware of what appeared to be a China Banking and Regulatory Commission prohibition on providing retail forex trading services through the direct solicitation of Chinese residents, including through the Internet, without a China Banking and Regulatory Commission permit. We do not have such a permit and to our knowledge, no such permit exists. In light of the regulatory uncertainty regarding the permit, we terminated all service offerings to residents of China and ceased our trading support operations located inside the country, while undertaking a review of the manner in which to most appropriately serve Chinese customers. As of December 31, 2008, we no longer accepted new customers from China. Based on our review of the relevant regulatory requirements in China, in 2010 we began accepting Chinese customers that neither we nor our partners directly solicit in China.
Canada
In Canada, the securities industry is governed by provincial or territorial legislation, and there is no national regulator. Local legislation differs from province to province and territory to territory. In June 2005, we were advised by the British Columbia Securities Commission, or BCSC, that we were required to register as a dealer to offer our trading services directly to residents of that province. Accordingly, since August 2005, we have conducted our business in British Columbia through a while label partner registered as an investment dealer in Canada. On October 30, 2009, the Ontario Securities Commission, or OSC, issued interim guidance which took the position that rolling spot foreign exchange contracts and similar over-the-counter derivative contracts sold using a trading platform similar to ours fall under the definition of securities, which would, absent exemptive relief, require, among other things, us to comply with the dealer registration and prospectus delivery requirements of Ontario securities law. In November 2010, we received correspondence from the OSC requesting information about our customers and business practices in Ontario and asking us to explain why our activities should not be considered in breach of dealer registration and prospectus delivery requirements under Ontario securities law. In its letter, the OSC states that it is acting in conjunction with the BCSC and the Quebec financial industry regulator, the Autorité des Marchés Financiers, or AMF, in its review of our activities. The AMF has also separately requested that we cease providing forex services in Quebec. We have responded to the regulators and, since November 22, 2010, have ceased accepting new customers from Quebec, Ontario and Alberta and have directed new customers to our white label partner. We are currently reviewing the forex dealer registration requirements in various Canadian provinces and territories and may seek to register in the future.
21
Table of Contents
Singapore
We have a small number of retail forex customers that reside in Singapore. We are not currently licensed to offer forex trading services in Singapore, but are currently reviewing the applicable licensing requirements and have consulted with the Monetary Authority of Singapore in order to determine the appropriate course of action.
Global Anti-Money Laundering
Our anti-money laundering and customer identification programs are designed to comply with applicable rules and regulations on a global basis. In addition, we have developed proprietary methods for risk-management and continue to add specialized processes, queries and automated reports designed to identify potential money laundering, fraud and other suspicious activities.
Minimum Net Capital Requirements
GAIN Capital Group, LLC, our regulated, wholly-owned subsidiary, and its regulated affiliates, are subject to jurisdiction-based specific minimum net capital requirements, which are designed to measure the general financial integrity and liquidity of the regulated entity. In general, net capital rules require that at least a minimum specified amount of a regulated entity’s assets be kept in relatively liquid form. Net capital is generally defined as net worth (assets minus liabilities), plus qualifying subordinated borrowings and discretionary liabilities, less mandatory deductions that result from excluding assets that are not readily convertible into cash and from conservatively valuing other assets.
As part of our risk-management philosophy, we generally maintain capital levels in excess of those required under applicable minimum net capital regulations. We believe that our excess net capital position in the United States compares favorably to that of many of our competitors which operate primarily in forex trading and puts us in a strong position to address potential future increases in minimum capital requirements domestically and abroad. In addition, we believe that our capital position enhances our access to foreign exchange liquidity, thereby improving our ability to provide customers with attractive pricing and facilitating our trading and hedging activities. Our capital position also allows us to provide capital to our affiliates as needed to accommodate their growth and meet any increases of minimum capital requirements. The following table summarizes the excess net capital levels maintained by our regulated subsidiaries as of December 31, 2010 (amounts in millions).
| Entity Name |
Minimum Regulatory Capital Requirements |
Capital Levels Maintained |
Excess Net Capital |
|||||||||
| GAIN Capital Group, LLC |
$ | 26.40 | $ | 76.30 | $ | 49.88 | ||||||
| GAIN Capital Securities, Inc. |
$ | 0.05 | $ | 0.52 | $ | 0.47 | ||||||
| GAIN Capital-Forex.com U.K., Ltd. |
$ | 2.67 | $ | 22.83 | $ | 20.16 | ||||||
| Forex.com Japan Co., Ltd. |
$ | 3.97 | $ | 11.18 | $ | 7.21 | ||||||
| GAIN Capital Forex.com Australia, Pty. Ltd. |
$ | 0.22 | $ | 0.30 | $ | 0.09 | ||||||
| GAIN Capital-Forex.com Hong Kong, Ltd. |
$ | 0.39 | $ | 0.98 | $ | 0.59 | ||||||
| GAIN Global Markets, Inc. |
$ | 0.10 | $ | 0.44 | $ | 0.35 | ||||||
If a firm fails to maintain the required net capital, its regulator may suspend the firm or revoke its license or registration and ultimately could require the firm’s liquidation. Applicable net capital rules may prohibit the payment of dividends, the redemption of stock, the prepayment of subordinated indebtedness and the making of any unsecured advance or loan to a stockholder, employee or affiliate, if the payment would reduce the firm’s net capital below required levels.
22
Table of Contents
The discussion below provides more detailed information regarding the minimum net capital requirements applicable to GAIN Capital Group, LLC. GAIN Capital Group, LLC is subject to the net capital requirements of the Commodity Exchange Act, which are monitored by the CFTC and NFA. Under the net capital rules, the minimum required net capital is $20.0 million plus 5% of the amount of customer liabilities over $10.0 million. GAIN Capital Group, LLC had the following capital as of the dates specified (amounts in thousands):
| As of December 31, | ||||||||||||
| 2010 | 2009 | 2008 | ||||||||||
| Net capital |
$ | 80,429 | $ | 102,577 | $ | 114,978 | ||||||
| Adjusted net capital |
$ | 76,293 | $ | 90,425 | $ | 107,726 | ||||||
| Excess adjusted net capital |
$ | 49,885 | $ | 64,424 | $ | 97,726 | ||||||
Supervision and Compliance
The role of our compliance department is to ensure that we maintain compliance with all laws, regulations, rules and other legal requirements applicable to us and our regulated subsidiaries and also provide education, supervision, surveillance, mediation and communication review. Many members of our senior management team are NFA-registered principals with supervisory responsibility over forex trading or other aspects of our business. In addition, all sales employees have successfully completed licensing requirements as mandated by their local regulatory regimes.
Corporate Information
We were incorporated in Delaware in October 1999 as GAIN Capital, Inc. In order to expand, either directly or through wholly-owned subsidiaries, into business activities not regulated by the Commodity Futures Trading Commission or the National Futures Association, on August 1, 2003, all outstanding capital stock of GAIN Capital, Inc. was converted into capital stock of GAIN Capital Group, Inc. pursuant to an agreement and plan of merger by and among GAIN Capital Group, Inc., GAIN Merger Sub Inc. (a wholly-owned subsidiary of GAIN Capital Group, Inc.) and GAIN Capital, Inc. Pursuant to such agreement and plan of merger, GAIN Merger Sub Inc., merged with and into GAIN Capital, Inc., the surviving entity, and the holders of capital stock, warrants and options of GAIN Capital, Inc. received capital stock, warrants and options of GAIN Capital Group, Inc. on a one-for-one basis, and GAIN Capital, Inc. continued to exist as a wholly-owned subsidiary of GAIN Capital Group, Inc. The GAIN Capital, Inc. stockholders before the merger were the same as the GAIN Capital Group, Inc. stockholders after the merger.
As a condition to entering into a credit facility in 2006, the lending banks required that we pledge the ownership interests in certain of our operating subsidiaries as collateral. In order to facilitate this pledge, on March 27, 2006, all outstanding capital stock of GAIN Capital Group, Inc. was converted into capital stock of GAIN Capital Holdings, Inc. pursuant to an agreement and plan of merger by and among GAIN Capital Group, Inc., GH Formation, Inc. (a wholly-owned subsidiary of GAIN Capital Group, Inc.) and GAIN Capital Holdings, Inc. Pursuant to such agreement and plan of merger, GH Formation, Inc. merged with and into GAIN Capital Group, Inc., the surviving entity, and the holders of capital stock, warrants and options of GAIN Capital Group, Inc. received capital stock, warrants and options of GAIN Capital Holdings, Inc. on a one-for-one basis, and GAIN Capital Group, Inc. continued to exist as an indirect wholly-owned subsidiary of GAIN Capital Holdings, Inc. The GAIN Capital Group, Inc. stockholders before the merger were the same as the GAIN Capital Holdings, Inc. stockholders after the merger.
For tax planning purposes, contemporaneously with the foregoing merger, on March 27, 2006, GAIN Capital Group, Inc. was converted to a limited liability company, GAIN Capital Group, LLC, and GAIN Capital, Inc. was converted to a limited liability company, GAIN Capital, LLC, thereby allowing profits and losses to pass through such entities. At the same time, GAIN Holdings, LLC, a newly created holding company and wholly-
23
Table of Contents
owned subsidiary of GAIN Capital Holdings, Inc., became the sole member and holder of all of the membership interests of GAIN Capital Group, LLC. On April 28, 2006, GAIN Capital, LLC merged with and into GAIN Capital Group, LLC and ceased to exist as a separate entity. The membership interests of GAIN Holdings, LLC were pledged as collateral in connection with the credit facility referenced above.
Our principal executive offices are located at Bedminster One, 135 Route 202/206, Bedminster, New Jersey 07921. Our telephone number is (908) 731-0700. On August 18, 2009, we entered into a lease agreement for approximately 45,000 square feet of office space at 135 Route 202/206, Bedminster, New Jersey, which we are using as our new principal executive offices. The term of the lease runs from January 1, 2010 to December 1, 2025, and we moved to our new facilities in January 2010. We believe this new facility will accommodate our needs for the foreseeable future. We operate our OTC trading risk management and most administrative services out of our Bedminster (New Jersey), London and Tokyo offices and our sales and support services out of our Bedminster, New York City, Woodmere (Ohio), London, Tokyo, Hong Kong, and Australia offices. Our corporate website address is www.gaincapital.com. The information on our website is not incorporated by reference into this annual report and should not be considered to be a part of this annual report.
24
Table of Contents
As of December 31, 2010, the following companies were our principal operating subsidiaries and intermediate holding companies:
| Entity Name |
Business/Services |
Applicable Regulator | ||
| GAIN Capital Holdings, Inc. | Parent holding company | SEC | ||
| GAIN Capital Group, LLC | A registered FCM and RFED, engaging in forex trading services and precious metals spot trading services | CFTC and NFA | ||
| GAIN Capital-Forex.com U.K., Ltd. | Forex trading services and CFD trading service | U.K. Financial Services Authority | ||
| Forex.com Japan Co., Ltd. | Forex trading services and precious metals spot trading | Japan Financial Services Agency | ||
| GAIN Capital Forex.com Australia Pty. Ltd. | Forex trading services and CFD trading services | Australian Securities and Investments Commission | ||
| GAIN Capital-Forex.com Hong Kong, Ltd. | Forex trading services and precious metals spot trading services | Hong Kong Securities and Futures Commission | ||
| GAIN Capital Securities, Inc. | Registered U.S. broker-dealer | SEC and FINRA | ||
| GAIN Global Markets, Inc. | Forex trading services and CFD trading services | Cayman Islands Monetary Authority (Cayman Islands) | ||
| GAIN GTX, LLC | Electronic Communication Network provider | N/A | ||
| GCAM, LLC | Managed account forex trading services | N/A | ||
| GAIN Holdings, LLC | Holding company for U.S. operating entities | N/A | ||
| S.L. Bruce Financial Corporation | Holding company for U.S. broker-dealer | N/A | ||
| GAIN Capital Holdings International, LLC | Holding company for international operating entities | N/A | ||
| GAIN Capital Service Co. | Provides administrative services to GAIN Capital Group | N/A | ||
Employees and Culture
As of December 31, 2010, we had 329 full-time employees and 4 part-time employees. None of our employees are covered by collective bargaining agreements.
25
Table of Contents
Officers and Significant Employees
Our current officers and significant employees, and their ages as of March 30, 2011, are as follows:
| Name |
Age | Position | ||||
| Executive Officers |
||||||
| Glenn H. Stevens |
48 | Chief Executive Officer and Director | ||||
| Henry C. Lyons |
47 | Chief Financial Officer and Treasurer | ||||
| Timothy O’Sullivan |
47 | Global Head of Trading | ||||
| Samantha Roady |
41 | Chief Marketing Officer | ||||
| Diego A. Rotsztain |
41 | General Counsel and Secretary | ||||
| Jeffrey A. Scott |
47 | Chief Commercial Officer | ||||
| Significant Employees |
||||||
| Alexander Bobinski |
47 | Chief Compliance Officer | ||||
| Andrew Haines |
45 | Chief Information Officer | ||||
| Kenneth O’Brien |
39 | Senior Vice President, International Operations | ||||
| Daryl J. Carlough |
39 | Chief Accounting Officer and Corporate Controller | ||||
Executive Officers
Glenn H. Stevens has served as our president and chief executive officer since June 2007 and a member of our board of directors since June 2007. From February 2000 to May 2007, Mr. Stevens served as one of our managing directors. From June 1997 to January 2000, Mr. Stevens served as managing director, head of North American sales and trading, at National Westminster Bank Plc (which was acquired by the Royal Bank of Scotland Group in 2000). From June 1990 to June 1997, Mr. Stevens served as managing director and chief forex dealer at Merrill Lynch & Co., Inc. Mr. Stevens is registered with the CFTC and NFA as a principal and associated person. Mr. Stevens received a BS in Finance from Bucknell University and an MBA in Finance from Columbia University.
Henry C. Lyons has served as our chief financial officer and treasurer since March 2008. From September 2006 to February 2008, Mr. Lyons served as senior vice president and chief financial officer at ACI Worldwide, a global provider of e-payment processing software and services. Mr. Lyons served from April 2004 to August 2006 as chief financial officer for Discovery Systems, a business unit of GE Healthcare Biosciences, Inc. From January 2001 to March 2004, Mr. Lyons was employed by Amersham Biosciences, Inc. (which was acquired by GE Healthcare in 2004) as corporate controller of the Biosciences division. Mr. Lyons received a BBA in Accounting from Millsaps College and an MBA from New York Institute of Technology.
Timothy O’Sullivan has served as global head of trading since March 2000. Mr. O’Sullivan manages the day-to-day operations of our trading desk. From March 1994 to March 2000, Mr. O’Sullivan served as director of the New York Sterling desk at Merrill Lynch & Co., Inc. Mr. O’Sullivan received a BS in Civil Engineering from the University of Delaware.
Samantha Roady has served as our chief marketing officer since August 2006. From September 1999 until August 2006, she was our senior vice president, marketing. From November 1994 to October 1999, Ms. Roady served as director of marketing for FNX Limited, a privately-held provider of trading and risk-management solutions to the international financial community. Ms. Roady is registered with the CFTC and NFA as a principal. Ms. Roady received a BA in International Affairs from James Madison University.
Diego A. Rotsztain was appointed executive vice president, general counsel and secretary in January 2011. From January 2010 to January 2011, Mr. Rotsztain was a corporate and securities partner at Mayer Brown LLP.
26
Table of Contents
Mr. Rotsztain was an associate in the capital markets group of Davis Polk & Wardwell LLP from November 1998 to December 2009. From September 1997 to September 1998, Mr. Rotsztain served as a Law Clerk for the Honorable Judge David G. Trager in the U.S. District Court in the Eastern District of New York. Mr. Rotsztain received his law degree from Columbia University School of Law in May 1997 and a BA in Economics from Tufts University in May 1992.
Jeffrey A. Scott was appointed chief commercial officer in February 2011. From August 2010 through February 2011, Mr. Scott was the president of Toluna USA. From October 2008 to April 2010, Mr. Scott served as a managing director at LexisNexis. From March 2005 through October 2008, Mr. Scott served in various capacities at SourceMedia, Inc., including chief technology officer; president, Accuity, Inc., and most recently, president, banking group. From March 1996 to March 2005, Mr. Scott held various positions at Thomson Financial, including chief technology officer and chief product officer. From August 1994 to March 1996, Mr. Scott served at Thomson Technology Consulting From August 1993 to August 1994, Mr. Scott served as software development manager for Science Applications International Corporation. Mr. Scott began his career at Arinc Research serving as software development manager. Mr. Scott received a BS in Computer Science from the University of Dayton and a MBA from the University of Maryland.
Significant Employees
Alexander Bobinski has served as our chief compliance officer since February 2010. From September 2008 until February 2010, Mr. Bobinski served as our executive vice president of operations. From August 2005 until September 2008, Mr. Bobinski served as chief financial officer and chief compliance officer of our wholly-owned subsidiary, GAIN Capital Group. From January 2002 to March 2005, Mr. Bobinski served as chief financial officer at Refco, LLC, the global commodity futures trading and clearing entity of Refco, Inc. On October 15, 2007, a petition under the federal bankruptcy laws was filed against Mr. Bobinski by Marc Krischner, as trustee for the Refco Litigation Trust, relating to the October 2005 bankruptcy of Refco, Inc., and was settled in March 2008. From July 1990 to December 2001, Mr. Bobinski served as vice president and controller for the futures and options business at Nomura Securities International, a global clearing firm, commodity pool operator and trading advisor. Mr. Bobinski is registered with the CFTC and NFA as a principal. Mr. Bobinski, a Certified Public Accountant, received a BS in Business Administration/Accounting from Ramapo College of New Jersey.
Andrew Haines has served as our chief information officer since September 2007. From September 2004 to July 2005, Mr. Haines was President at Arch Technology Group, LLC, a private technology consulting firm. From July 2005 until September 2007, Mr. Haines served as our vice president, application development. From January 2004 to September 2004, Mr. Haines served as the chief information officer and vice president of technology at Bluefly, Inc., a publicly held online retailer. Mr. Haines received a BS in Finance from the University of Delaware and his MA in Technology Management from the Stevens Institute of Technology.
Kenneth O’Brien has served as our senior vice president, international operations since January 2008. From December 2004 to December 2007, Mr. O’Brien served as our vice president, product management & strategic alliances. From July 2004 to December 2004, Mr. O’Brien served as vice president, North American sales of Accurate Software, Inc., a privately held provider of financial electronic commerce services and products that was acquired by CheckFree Software in 2005. From May 2002 to July 2004, Mr. O’Brien served as vice president, North American sales for City Networks, Inc., a privately held provider of back-office operational software. From July 1994 to May 2002, Mr. O’Brien served in various capacities, including managing director, director of sales support and product manager of back office operations, at FNX Limited, a privately-held provider of trading and risk-management solutions to the international financial community. Mr. O’Brien received a BS in Business Administration from La Salle University.
Daryl J. Carlough has served as our chief accounting officer and corporate controller since December 2009. He has over thirteen years of experience in accounting and auditing, operations, business systems, risk management, international, human resources and mergers and acquisitions. Mr. Carlough served as director of finance from
27
Table of Contents
August 2006 to December 2009 at L-1 Identity Solutions, Inc. From April 2005 to August 2006, Mr. Carlough served as assistant corporate controller at Viisage Technology, which merged into L-1 Identity Solutions, Inc. in August 2006. Prior to that, Mr. Carlough served at The Macgregor Group as corporate controller, from July 2001 to April 2005, which was acquired by Investment Technology Group. Mr. Carlough started his career at Ernst & Young LLP. He is a Certified Public Accountant, and he received an MBA and MS in Accounting from Northeastern University as well as a BS in Business Administration in Finance from Stonehill College.
Internet Website
GAIN maintains a corporate website with the address www.gaincapital.com. Its intended use is as a regular means of disclosing material public information and for complying with disclosure obligations under Regulation FD promulgated by the SEC. Such disclosures will be included on the website under the heading “Investor Relations.” Accordingly, investors should monitor such portions of the website, in addition to following our press releases, SEC filings and public conference calls and webcasts.
We are not incorporating information contained in the website by reference into this Annual Report on Form 10-K. We will make available, free of charge through the website, our Annual Reports on Form 10-K, Quarterly Reports on Form 10-Q and Current Reports on Form 8-K, and any amendments to these reports as soon as reasonably practicable after electronically filing such material with, or furnish such material to, the Securities and Exchange Commission. In addition, we make available on our website (i) the charters for the committees of our Board of Directors, including the Audit Committee, Compensation Committee, Nominating and Corporate Governance Committee and Risk Committee, and (ii) our Code of Business Conduct and Ethics governing our directors, officers and employees. We intend to disclose on our website any amendments to, or waivers from, our Code of Business Conduct and Ethics that are required to be disclosed pursuant to the rules of the Securities and Exchange Commission and the New York Stock Exchange.
Materials filed with the SEC can be read or copied at the SEC’s Public Reference Room at 100 F Street, N.E., Washington, D.C.20549. Please call the SEC at 1-800-SEC-0330 for further information about the Public Reference Room. The SEC also maintains a website, www.sec.gov containing the reports, proxy statements and other information filed with the SEC.
| ITEM 1A. | RISK FACTORS |
Risks Related to Our Business
The Retail Foreign Exchange, or Forex, Market Has Only Recently Become Accessible to Retail Investors and, Accordingly, We Have a Limited Operating History Upon Which to Evaluate Our Performance.
The retail forex market has only recently become accessible to retail investors. Prior to 1996, retail investors generally did not directly trade in the forex market and, we believe most current retail forex traders only recently viewed currency trading as an alternative investment class. We commenced doing business in October 1999 and our forex trading operations were launched in June 2000, at which time we began offering forex trading services domestically and internationally. Accordingly, we have only a limited operating history in the international retail forex trading market upon which you can evaluate our prospects and future performance. Our prospects may be materially adversely affected by the risks, expenses and difficulties frequently encountered in the operation of a new business in a rapidly evolving industry characterized by intense competition and evolving domestic and global regulatory oversight and rules.
Our Revenue and Profitability Are Influenced by Trading Volume and Currency Volatility, Which Are Directly Impacted by Domestic and International Market and Economic Conditions That Are Beyond Our Control.
During the past few years, there has been significant disruption and volatility in the global financial markets. Many countries, including the United States, have recently experienced recessionary conditions. Our revenue is
28
Table of Contents
influenced by the general level of trading activity in the forex market. Our revenue and operating results may vary significantly from period to period due primarily to movements and trends in the world’s currency markets and to fluctuations in trading levels. We have generally experienced greater trading volume in periods of volatile currency markets. In the event we experience lower levels of currency volatility, our revenue and profitability will likely be negatively affected. Like other financial services firms, our business and profitability are directly affected by elements that are beyond our control, such as economic and political conditions, broad trends in business and finance, changes in the volume of foreign currency transactions, changes in supply and demand for currencies, movements in currency exchange rates, changes in the financial strength of market participants, legislative and regulatory changes, changes in the markets in which such transactions occur, changes in how such transactions are processed and disruptions due to terrorism, war or extreme weather events. Any one or more of these factors, or other factors, may adversely affect our business and results of operations and cash flows. A weakness in equity markets, such as the current economic slowdown causing a reduction in trading volume in U.S. or foreign securities and derivatives, could result in reduced trading activity in the forex market and, therefore, could have a material adverse effect on our business, financial condition and results of operations and cash flows. As a result, period-to-period comparisons of our operating results may not be meaningful and our future operating results may be subject to significant fluctuations or declines.
Reduced Spreads in Foreign Currencies, Levels of Trading Activity and Trading Through Alternative Trading Systems Could Reduce Our Profitability.
Tighter spreads and increased competition could make our business less profitable. In addition, new and enhanced alternative trading systems have emerged as an option for individual and institutional investors to avoid directing their trades through retail forex brokers, which could result in reduced revenue derived for our business.
Our Risk-Management Policies and Procedures May Not Be Effective and May Leave Us Exposed to Unidentified or Unexpected Risks.
We are dependent on our risk-management policies and the adherence to such policies by our trading staff. Our policies, procedures and practices used to identify, monitor and control a variety of risks, including risks related to human error, customer defaults, market movements, fraud and money-laundering, are established and reviewed by the risk committee of our board of directors. Some of our methods for managing risk are discretionary by nature and are based on internally developed controls and observed historical market behavior, and also involve reliance on standard industry practices. These methods may not adequately prevent losses, particularly as they relate to extreme market movements, which may be significantly greater than historical fluctuations in the market. Our risk-management methods also may not adequately prevent losses due to technical errors if our testing and quality control practices are not effective in preventing software or hardware failures. In addition, we may elect to adjust our risk-management policies to allow for an increase in risk tolerance, which could expose us to the risk of greater losses. Our risk-management methods rely on a combination of technical and human controls and supervision that are subject to error and failure. These methods may not protect us against all risks or may protect us less than anticipated, in which case our business, financial condition and results of operations and cash flows may be materially adversely affected.
We May Incur Material Trading Losses From Our Forex Trading Activities.
A substantial portion of our revenue and operating profits is derived from our foreign exchange trading business. Through our trading activities, we attempt to derive a profit from the difference between the prices at which we buy and sell, or sell and buy, foreign currencies. Since these activities involve the purchase or sale of foreign currencies for our own account, we may incur trading losses for a variety of reasons, including:
| • | price changes in foreign currencies; |
| • | lack of liquidity in foreign currencies in which we have positions; and |
29
Table of Contents
| • | inaccuracies in our proprietary pricing mechanism, or rate engine, which evaluates, monitors and assimilates market data and reevaluates our outstanding currency quotes, and is designed to publish prices reflective of prevailing market conditions throughout the trading day. |
These risks may affect the prices at which we are able to sell or buy foreign currencies, or may limit or restrict our ability to either resell foreign currencies that we have purchased or repurchase foreign currencies that we have sold.
In addition, competitive forces often require us to match the breadth of quotes our competitors market makers display and to hold varying amounts and types of foreign currencies at any given time. By having to maintain positions in certain currencies, we are subjected to a high degree of risk. We may not be able to manage such risk successfully and may experience significant losses from such activities, which could have a material adverse effect on our business, financial condition and results of operations and cash flows.
We Are Exposed to Losses Due to Lack of Accurate or Timely Information.
We provide forex liquidity by buying from sellers and selling to buyers. We may frequently trade with parties who have different or more timely information than we do, and as a result, we may accumulate unfavorable positions preceding price movements in currency pairs. In a forex trade, participants buy one currency and simultaneously sell another currency. We refer to the two currencies that make up a forex trade as a currency pair. The first currency noted in the pair is the base currency and the second is the counter currency. Should the frequency or magnitude of these unfavorable positions increase, our business, financial condition and results of operations and cash flows would be materially adversely affected.
We Depend on Our Proprietary Technology. Any Disruption or Corruption of Our Proprietary Technology or Our Inability to Maintain Technological Superiority in Our Industry Could Have a Material Adverse Effect on Our Business, Financial Condition and Results of Operations and Cash Flows. We May Experience Failures While Developing Our Proprietary Technology.
We rely on our proprietary technology to receive and properly process internal and external data. Any disruption for any reason in the proper functioning, or any corruption, of our software or erroneous or corrupted data may cause us to make erroneous trades, accept customers from jurisdictions where we do not possess the proper licenses, authorizations or permits, or require us to suspend our services and could have a material adverse effect on our business, financial condition and results of operations and cash flows. In order to remain competitive, our proprietary technology is under continuous development and redesign. As we develop and redesign our proprietary technology, there is an ongoing risk that failures may occur and result in service interruptions or other negative consequences such as slower quote aggregation, slower trade execution, erroneous trades, or mistaken risk-management information.
Our success in the past has largely been attributable to our proprietary technology that has taken many years to develop. We believe our proprietary technology has provided us with a competitive advantage relative to many forex market participants. If our competitors develop more advanced technologies, we may be required to devote substantial resources to the development of more advanced technology to remain competitive. The forex market is characterized by rapidly changing technology, evolving industry standards and changing trading systems, practices and techniques. We may not be able to keep up with these rapid changes in the future, develop new technology, realize a return on amounts invested in developing new technologies or remain competitive in the future.
30
Table of Contents
Systems Failures Could Cause Interruptions in Our Services or Decreases in the Responsiveness of Our Services Which Could Harm Our Business.
If our systems fail to perform, we could experience disruptions in operations, slower response times or decreased customer satisfaction. Our ability to facilitate transactions successfully and provide high quality customer service depends on the efficient and uninterrupted operation of our computer and communications hardware and software systems. These systems have in the past experienced periodic interruptions and disruptions in operations, which we believe will continue to occur from time to time. Our systems also are vulnerable to damage or interruption from human error, natural disasters, power loss, telecommunication failures, break-ins, sabotage, computer viruses, intentional acts of vandalism and similar events. We do not have fully redundant capabilities. While we currently maintain a disaster recovery plan, or DRP, which is intended to minimize service interruptions and secure data integrity, our DRP may not work effectively during an emergency. Any systems failure that causes an interruption in our services or decreases the responsiveness of our services could impair our reputation, damage our brand name and materially adversely affect our business, financial condition and results of operations and cash flows.
We May Not Be Able to Protect Our Intellectual Property Rights or May Be Prevented From Using Intellectual Property Necessary for Our Business.
We rely on a combination of trademark, copyright, trade secret and fair business practice laws in the United States and other jurisdictions to protect our proprietary technology, intellectual property rights and our brand. We also enter into confidentiality and invention assignment agreements with our employees and consultants, and confidentiality agreements with other third parties. We also rigorously control access to proprietary technology. We do not have any patents. It is possible that third parties may copy or otherwise obtain and use our proprietary technology without authorization or otherwise infringe on our rights. We also license or are permitted to use intellectual property or technologies owned by others. In the event such intellectual property or technology becomes material to our business, our inability to continue use of such technologies would have a material adverse effect on our business. We may also face claims of infringement that could interfere with our ability to use technology that is material to our business operations.
In the future, we may have to rely on litigation to enforce our intellectual property rights, protect our trade secrets, determine the validity and scope of the proprietary rights of others or defend against claims of infringement or invalidity. For example, we have recently been contacted regarding our alleged infringement of certain patents owned by Broadband Graphics, LLC. We believe these claims are without merit but this matter may result in litigation. Any litigation, whether successful or unsuccessful, could result in substantial costs and the diversion of resources and the attention of management, any of which could negatively affect our business.
A Portion of Our Cost Structure Is Fixed. If Our Revenues Decline and We Are Unable to Reduce Our Costs, Our Profitability Will Be Adversely Affected.
A portion of our cost structure is fixed. We base our cost structure on historical and expected levels of demand for our products and services, as well as our fixed operating infrastructure, such as computer hardware and software, hosting facilities and security and staffing levels. If demand for our products and services declines and, as a result, our revenues decline, we may not be able to adjust our cost structure on a timely basis and our profitability may be materially adversely affected.
31
Table of Contents
Attrition of Customer Accounts and Failure to Attract New Accounts Could Have a Material Adverse Effect on Our Business, Financial Condition and Results of Operations and Cash Flows. Even if We Do Attract New Customers, We May Fail to Attract the Customers in a Cost-Effective Manner, Which Could Materially Adversely Affect Our Profitability and Growth.
Our customer base is primarily comprised of individual retail customers who generally trade in the forex market with us for short periods. Although we offer products and tailored services designed to educate, support and retain our customers, our efforts to attract new customers or reduce the attrition rate of our existing customers may not be successful. If we are unable to maintain or increase our customer retention rates or generate a substantial number of new customers in a cost-effective manner, our business, financial condition and results of operations and cash flows would likely be adversely affected. For the year ended December 31, 2010, we incurred sales and marketing expenses of $38.4 million. Although we have spent significant financial resources on sales and marketing expenses and related expenses and plan to continue to do so, these efforts may not be cost-effective at attracting new customers. In particular, we believe that rates for desirable advertising and marketing placements, including online, search engine, print and television advertising, are likely to increase in the foreseeable future, and we may be disadvantaged relative to our larger competitors in our ability to expand or maintain our advertising and marketing commitments. Additionally, our sales and marketing methods are subject to regulation by the Commodity Futures Trading Commission, or CFTC, and National Futures Association, or NFA in the United States and other regulators in Non-US jurisdictions. The rules and regulations of these organizations impose specific limitations on our sales methods, advertising and marketing. If we do not achieve our advertising objectives, our profitability and growth may be materially adversely affected.
Our Business Could Be Adversely Affected if Global Economic Conditions Continue to Negatively Impact Our Customer Base.
Our customer base is primarily comprised of individual retail customers who view foreign currency trading as an alternative investment class. If global economic conditions continue to negatively impact the forex market or adverse developments in global economic conditions continue to limit the disposable income of our customers, our business could be materially adversely affected as our customers may choose to curtail their trading in the forex market which could result in reduced customer trading volume and trading revenue.
We Are Subject to Litigation Risk Which Could Adversely Affect Our Reputation, Business, Financial Condition and Results of Operations and Cash Flows.
Many aspects of our business involve risks that expose us to potential liability under U.S. federal and state laws, as well as the rules and enforcement efforts of our regulators and self-regulatory organizations worldwide. These risks include, among others, disputes over trade terms with customers and other market participants, customer losses resulting from system delay or failure and customer claims that we or our employees executed unauthorized transactions, made materially false or misleading statements or lost or diverted customer assets in our custody. We may also be subject to regulatory investigation and enforcement actions seeking to impose significant fines or other sanctions, which in turn could trigger civil litigation for our previous operations that may be deemed to have violated applicable rules and regulations in various jurisdictions.
The volume of claims and the amount of damages and fines claimed in litigation and regulatory proceedings against financial services firms has been increasing and may continue to increase. The amounts involved in the trades we execute, together with rapid price movements in our currency pairs, can result in potentially large damage claims in any litigation resulting from such trades. Dissatisfied customers, regulators or self-regulatory organizations may make claims against us regarding the quality of trade execution, improperly settled trades, mismanagement or even fraud, and these claims may increase as our business expands.
32
Table of Contents
Litigation may also arise from disputes over the exercise of our rights with respect to customer accounts and collateral. Although our customer agreements generally provide that we may exercise such rights with respect to customer accounts and collateral as we deem reasonably necessary for our protection, our exercise of these rights may lead to claims by customers that we did so improperly.
In addition, litigation may arise relating to other parties’ unauthorized use of our intellectual property or from claims by other parties that we have used their intellectual property without authorization.
Even if we prevail in any litigation or enforcement proceedings against us, we could incur significant legal expenses defending against the claims, even those without merit. Moreover, because even claims without merit can damage our reputation or raise concerns among our customers, we may feel compelled to settle claims at significant cost. The initiation of any claim, proceeding or investigation against us, or an adverse resolution of any such matter could have a material adverse effect on our reputation, business, financial condition and results of operations and cash flows.
We May Be Subject to Customer Litigation, Financial Losses, Regulatory Sanctions and Harm to Our Reputation as a Result of Employee Misconduct or Errors That Are Difficult to Detect and Deter.
There have been a number of highly publicized cases involving fraud or other misconduct by employees of financial services firms in recent years. Our employees could execute unauthorized transactions for our customers, use customer assets improperly or without authorization, carry out improper activities on behalf of customers or use confidential customer or company information for personal or other improper purposes, as well as improperly record or otherwise try to hide improper activities from us.
In addition, employee errors, including mistakes in executing, recording or reporting transactions for customers, may cause us to enter into transactions that customers disavow and refuse to settle. Employee errors expose us to the risk of material losses until the errors are detected and the transactions are unwound or reversed. The risk of employee error or miscommunication may be greater for products that are new or have non-standardized terms. Further, such errors may be more likely to occur in the aftermath of any acquisitions during the integration of or migration from technological systems. Misconduct by our employees or former employees could subject us to financial losses or regulatory sanctions and seriously harm our reputation. It may not be possible to deter or detect employee misconduct and the precautions we take to prevent and detect this activity may not be effective in all cases. Our employees may also commit good faith errors that could subject us to financial claims for negligence or otherwise, as well as regulatory actions.
Misconduct by employees of our customers can also expose us to claims for financial losses or regulatory proceedings when it is alleged we or our employees knew or should have known that an employee of our customer was not authorized to undertake certain transactions. Dissatisfied customers can make claims against us, including claims for negligence, fraud, unauthorized trading, failure to supervise, breach of fiduciary duty, employee errors, intentional misconduct, unauthorized transactions by associated persons or failures in the processing of transactions.
Any Restriction in the Availability of Credit Cards as a Payment Option for Our Customers Could Adversely Affect Our Business, Financial Condition and Results of Operations and Cash Flows.
We currently allow our customers to use credit cards to fund their accounts with us. For the year ended December 31, 2010, 37.5% of the notional value of our customers deposits were funded in this manner. There is a risk that in the future, new regulations or credit card issuing institutions may restrict the use of credit and debit cards as a means to fund accounts used to trade in investment products. The elimination or a reduction in the availability of credit cards as a means to fund customer accounts or any increase in the fees associated with such use, could have a material adverse effect on our business, financial condition and results of operations and cash flows.
33
Table of Contents
Our Customer Accounts May Be Vulnerable to Identity Theft and Credit Card Fraud.
Credit card issuers have adopted credit card security guidelines as part of their ongoing efforts to prevent identity theft and credit card fraud. We continue to work with credit card issuers to ensure that our services, including customer account maintenance, comply with these rules. When there is unauthorized access to credit card data that results in financial loss, there is the potential that we could experience reputational damage and parties could seek damages from us.
Failure to Maintain the Anonymity of Our Institutional Customers on Our GAIN GTX Electronic Communications Network, or ECN, Could Harm Our Reputation and Result in a Material Adverse Effect on Our Business, Financial Condition and Results of Operations and Cash Flows.
We operate our GAIN GTX ECN as a fully anonymous trading environment that offers our institutional customers direct market access and trade execution capabilities. If outside individuals determine the identity of our institutional customers, we may be subject to customer claims against us for negligence, fraud, failure to supervise, employee error and intentional misconduct, among others. Any such claims may harm our reputation and result in material adverse effects on our business, financial condition and results of operations and cash flows.
A Financial Services Firm’s Reputation Is Critically Important. If Our Reputation Is Harmed, or the Reputation of the Online Financial Services Industry as a Whole Is Harmed, Our Business, Financial Condition and Results of Operations and Cash Flows may be Materially Adversely Affected.
Our ability to attract and retain customers and employees may be adversely affected if our reputation is damaged. If we fail, or appear to fail, to deal with issues that may give rise to reputation risk, we could harm our business prospects. These issues include, but are not limited to, appropriately dealing with potential conflicts of interest, legal and regulatory requirements, ethical issues, money-laundering, privacy, client data protection, record keeping, sales and trading practices, and the proper identification of the legal, credit, liquidity, and market risks inherent in our business. Failure to appropriately address these issues could also give rise to additional legal risk to us, which could, in turn, increase the size and number of claims and damages asserted against us or subject us to regulatory enforcement actions, fines and penalties. Any such sanction would materially adversely affect our reputation, thereby reducing our ability to attract and retain customers and employees.
In addition, our ability to attract and retain customers may be adversely affected if the reputation of the online financial services industry as a whole or forex industry is damaged. In recent years, a number of financial services firms have suffered significant damage to their reputations from highly publicized incidents that in turn resulted in significant and in some cases irreparable harm to their business. The perception of instability within the online financial services industry could materially adversely affect our ability to attract and retain customers.
The Loss of Our Key Employees Would Materially Adversely Affect Our Business, Including Our Ability to Grow Our Business.
Our key employees, including Glenn Stevens, our chief executive officer, and Tim O’Sullivan, our global head of trading, have significant experience in the forex industry and have made significant contributions to our business. Henry Lyons, our chief financial officer, has significant experience with publicly traded companies and has made significant contributions to our company. In addition, Alexander Bobinski, our chief compliance officer, Samantha Roady, our chief marketing officer, and Andrew Haines, our chief information officer, have made significant contributions to our business. Our continued success is dependent upon the retention of these and other key executive officers and employees, as well as the services provided by our trading staff, technology and programming specialists and a number of other key managerial, marketing, planning, financial, technical and operations personnel. The loss of such key personnel could have a material adverse effect on our business. In addition, our ability to grow our business is dependent, to a large degree, on our ability to retain such employees.
34
Table of Contents
Any Future Acquisitions May Result in Significant Transaction Expenses, Integration and Consolidation Risks and Risks Associated With Entering New Markets, and We May Be Unable to Profitably Operate Our Consolidated Company.
Although our growth strategy has not focused historically on acquisitions, we may in the future selectively pursue acquisitions and new businesses. Any future acquisitions may result in significant transaction expenses and present new risks associated with entering additional markets or offering new products and integrating the acquired companies. Because acquisitions historically have not been a core part of our growth strategy, we do not have significant experience in successfully completing acquisitions. We may not have sufficient management, financial and other resources to integrate companies we acquire or to successfully operate new businesses and we may be unable to profitably operate our expanded company. Additionally, any new businesses that we may acquire, once integrated with our existing operations, may not produce expected or intended results.
The Expansion of Our Trading Activities Into Other Financial Products, Including Listed Securities, Contracts for Difference, or CFDs, Over-the-Counter, or OTC, Currency Derivatives and Gold and Silver Spot Trading Entails Significant Risk, and Unforeseen Events in Such Business Could Have An Adverse Effect on Our Business, Financial Condition and Results of Operations and Cash Flows.
All of the risks that pertain to our trading activities in the forex market also apply to our listed securities, CFDs, OTC currency derivatives and gold and silver spot trading and any other products we may offer in the future. These risks include market risk, counterparty risk, liquidity risk, technology risk, third-party risk and risk of human error. In addition, we have limited experience outside of the forex market and even though we expect to ease into these activities very slowly through internal growth or acquisition, any kind of unexpected event can occur that can result in great financial loss to us, including our inability to effectively integrate new products into our existing trading platform or our failure to properly manage the market risks associated with making-markets for new products. With respect to CFDs, the volatility characteristics of the CFD market may have an adverse impact on our ability to maintain profit margins similar to the profit margins we have realized with respect to forex trading. In addition, by further expanding our listed securities offerings, we are expanding from what is primarily a business model focused on OTC trading into a business model that includes brokerage activities that require reliance upon third-party clearing firms to hold our customers’ funds and execute our customers’ trades. The introduction of these and other potential financial products also poses a risk that our risk-management policies, procedures and practices, and the technology that supports such activities, will be unable to effectively manage these new risks to our business. In addition we would be subject to local securities laws for all of these offerings. Our non-U.S. operating subsidiaries, including, GAIN Capital-Forex.com U.K., Ltd., which is licensed with the Financial Services Authority in the United Kingdom, and GAIN Capital Forex.com Australia Pty. Ltd., which is licensed with the Australian Securities and Investments Commission, offer and sell CFDs outside the United States to non-U.S. persons. CFDs are not and may not be offered in the United States by us, including by any of our U.S. and non-U.S. subsidiaries, and are not eligible for resale to U.S. persons. They are not currently registered with the U.S. Securities and Exchange Commission or any other U.S. regulator. CFDs may not be enforceable in the United States. To the extent our current CFD product offerings constitute an offer or sale of securities under the U.S. federal securities laws; we will need to comply with those U.S. federal securities laws. To the extent our CFD offerings constitute OTC futures contracts or other financial derivative instruments; they are prohibited under the provisions of the U.S. Commodity Exchange Act. To the extent our CFD offerings are determined to constitute swaps or security-based swaps under the Dodd-Frank Act, the Commodity Exchange Act, or the federal securities laws, we would be required to comply with such U.S. laws with respect to such offerings. Failure to effectively manage these risks or properly comply with local laws or regulations relating to our product offerings, including U.S. federal securities laws, may expose us to fines, penalties or other sanctions that could have a material adverse effect upon our business, financial condition and results of operations and cash flows.
35
Table of Contents
We May Be Unable to Effectively Manage Our Rapid Growth and Retain Our Customers.
The rapid growth of our business during our short history has placed significant demands on our management and other resources. If our business continues to grow at a rate consistent with our historical growth, we may need to expand and upgrade the reliability and scalability of our transaction processing systems, network infrastructure and other aspects of our proprietary technology. We may not be able to expand and upgrade our technology systems and infrastructure to accommodate increases in our business activity in a timely manner, which could lead to operational breakdowns and delays, loss of customers, a reduction in the growth of our customer base, increased operating expenses, financial losses, increased litigation or customer claims, regulatory sanctions or increased regulatory scrutiny. In addition, due to our rapid growth, we will need to continue to attract, hire and retain highly skilled and motivated officers and employees. We may not be able to attract or retain the officers and employees necessary to manage this growth effectively.
We May Be Unable to Respond to Customers’ Demands for New Services and Products and Our Business, Financial Condition and Results of Operations and Cash Flows May Be Materially Adversely Affected.
The market for Internet-based trading is characterized by:
| • | changing customer demands; |
| • | the need to enhance existing services and products or introduce new services and products; |
| • | evolving industry practices; and |
| • | rapidly evolving technology solutions. |
New services and products provided by our competitors may render our existing services and products less competitive. Our future success will depend, in part, on our ability to respond to customers’ demands for new services and products on a timely and cost-effective basis and to adapt to address the increasingly sophisticated requirements and varied needs of our customers and prospective customers. We may not be successful in developing, introducing or marketing new services and products. In addition, our new service and product enhancements may not achieve market acceptance. Any failure on our part to anticipate or respond adequately to customer requirements or changing industry practices, or any significant delays in the development, introduction or availability of new services, products or service or product enhancements could have a material adverse effect on our business, financial condition and results of operations and cash flows.
We Face Significant Competition. Many of Our Competitors and Potential Competitors Have Larger Customer Bases, More Established Name Recognition and Greater Financial, Marketing, Technological and Personnel Resources Than We Do Which Could Put Us at a Competitive Disadvantage. Additionally, Some of Our Competitors and Many Potential Competitors Are Better Capitalized Than We Are, and Are Able to Obtain Capital More Easily Which Could Put Us at a Competitive Disadvantage.
We compete in the OTC markets based in part on our ability to execute our customers’ trades at competitive prices, to retain our existing customers and to attract new customers. Our competitors range from numerous sole proprietors with limited resources to a few sophisticated institutions which have larger customer bases, more established name recognition and substantially greater financial, marketing, technological and personnel resources than we do. These advantages may enable them, among other things, to:
| • | develop products and services that are similar to ours, or that are more attractive to customers than ours, in one or more of our markets; |
| • | provide products and services we do not offer; |
| • | provide execution and clearing services that are more rapid, reliable or efficient, or less expensive than ours; |
36
Table of Contents
| • | offer products and services at prices below ours to gain market share and to promote other businesses, such as forex options listed securities, CFDs, spot-precious metals and OTC derivatives; |
| • | adapt at a faster rate to market conditions, new technologies and customer demands; |
| • | offer better, faster and more reliable technology; |
| • | outbid us for desirable acquisition targets; |
| • | more efficiently engage in and expand existing relationships with strategic alliances; |
| • | market, promote and sell their products and services more effectively; and |
| • | develop stronger relationships with customers. |
These larger and better capitalized competitors, including commercial and investment banking firms, may have access to capital in greater amounts and at lower costs than we do, and thus, may be better able to respond to changes in the forex industry, to compete for skilled professionals, to finance acquisitions, to fund internal growth and to compete for market share generally. Access to capital is critical to our business to satisfy regulatory obligations and liquidity requirements. Among other things, access to capital determines our creditworthiness, which if perceived negatively in the market could materially impair our ability to provide clearing services and attract customer assets, both of which are important sources of revenue. Access to capital also determines the degree to which we can expand our operations. Thus, if we are unable to maintain or increase our capital on competitive terms, we could be at a significant competitive disadvantage, and our ability to maintain or increase our revenue and earnings could be materially impaired. Also, new or existing competitors in our markets could make it difficult for us to maintain our current market share or increase it in desirable markets. In addition, our competitors could offer their services at lower prices, and we may be required to reduce our fees significantly to remain competitive. A fee reduction without a commensurate reduction in expenses would decrease our profitability.
We may not be able to compete effectively against these firms, particularly those with greater financial resources, and our failure to do so could materially and adversely affect our business, financial condition and results of operations and cash flows. We may in the future face increased competition, resulting in narrowing bid/offer spreads which could materially adversely affect our business, financial condition and results of operations and cash flows.
Our International Operations Present Special Challenges and Our Failure to Adequately Address Such Challenges or Compete in These Markets, Either Directly or Through Joint Ventures With Local Firms, Could Have a Material Adverse Effect on Our Business, Financial Condition and Results of Operations and Cash Flows.
In 2010, we generated approximately 50.3% of our trading volume from customers outside the United States. Expanding our business in other emerging markets is an important part of our growth strategy. Due to certain cultural, regulatory and other challenges relevant to those markets, however, we may be at a competitive disadvantage in those regions relative to local firms or to international firms that have a well-established local presence. These challenges include:
| • | less developed or mature local technological infrastructure and higher costs, which could make our products and services less attractive or accessible in emerging markets; |
| • | difficulty in complying with the diverse regulatory requirements of multiple jurisdictions, which may be more burdensome, not clearly defined, and subject to unexpected changes, potentially exposing us to significant compliance costs and regulatory penalties; |
| • | less developed and established local financial and banking infrastructure, which could make our products and services less accessible in emerging markets; |
37
Table of Contents
| • | reduced protection of intellectual property rights; |
| • | inability to enforce contracts in some jurisdictions; |
| • | difficulties and costs associated with staffing and managing foreign operations, including reliance on newly hired local personnel; |
| • | tariffs and other trade barriers; |
| • | currency and tax laws that may prevent or restrict the transfer of capital and profits among our various operations around the world; and |
| • | time zone, language and cultural differences among personnel in different areas of the world. |
In addition, in order to be competitive in these local markets, or in some cases because of restrictions on the ability of foreign firms to do business locally, we may seek to operate through joint ventures with local firms as we have done, for example, in Japan. Doing business through joint ventures may limit our ability to control the conduct of the business and could expose us to reputational and greater operational risks. We may also face intense competition from other international firms over relatively scarce opportunities for market entry. Given the intense competition from other international brokers that are also seeking to enter these fast-growing markets, we may have difficulty finding suitable local firms willing to enter into the kinds of relationships with us that we may need to gain access to these markets. This competition could make it difficult for us to expand our business internationally as planned.
GAIN Capital Holdings, Inc. Is a Holding Company and Accordingly Depends on Cash Flow From Its Operating Subsidiaries to Meet Our Obligations. If Our Operating Subsidiaries Are Unable to Pay Us Dividends When Needed, We May Be Unable to Satisfy Our Obligations When They Arise.
As a holding company with no material assets other than the stock of our operating subsidiaries, nearly all of our funds generated from operations are generated by our operating subsidiaries. Historically, we have accessed these funds through receipt of dividends from these subsidiaries. Some of our subsidiaries are subject to requirements of various regulatory bodies, including the CFTC and NFA in the United States, the Financial Services Authority in the United Kingdom, the Financial Services Agency, the Japan Ministry of Economy, Trade and Industry and the Japan Ministry of Agriculture, Forestry and Fisheries in Japan, the Securities and Futures Commission in Hong Kong and the Cayman Islands Monetary Authority in the Cayman Islands, relating to liquidity and capital standards, which limit funds available for the payment of dividends to the holding company. Accordingly, if our operating subsidiaries are unable, due to regulatory restrictions or otherwise, to pay us dividends and make other payments to us when needed, we may be unable to satisfy our obligations when they arise.
Risks Related to Regulation
We Operate in a Heavily Regulated Environment That Imposes Significant Requirements and Costs on Us. Failure to Comply With the Rapidly Evolving Laws and Regulations Governing Our Forex and Other Businesses May Result in Regulatory Agencies Taking Action Against Us, Which Could Significantly Harm Our Business.
Substantially all of our operations involving the execution and clearing of transactions in foreign currencies, CFDs, gold and silver and securities are conducted through subsidiaries that are regulated by governmental bodies or self-regulatory organizations, including in the United States, the United Kingdom, Japan, Australia, Hong Kong and the Cayman Islands. Many of the regulations we are governed by are intended to protect the public, our customers and the integrity of the markets, and not necessarily our shareholders. In the United States, our forex trading activities are regulated by the CFTC and the NFA, and our securities activities are regulated by the Securities and Exchange Commission, or SEC, and the Financial Industry Regulatory Authority, or FINRA. Outside the United States, our principal regulators include the Financial Services Authority in the United
38
Table of Contents
Kingdom, the Australian Securities and Investments Commission in Australia, and the Securities and Futures Commission in Hong Kong, while in Japan, we are regulated by the Financial Services Agency of Japan, the Japan Ministry of Economy, Trade and Industry, or the JETI, and the Japan Ministry of Agriculture, Forestry and Fisheries, or the JAFF.
Among other things, we are subject to regulation with regard to:
| • | sales and marketing activities, including our interaction with, and solicitation of, customers; |
| • | trading practices, including the manner in which we offer investment products and the types of investment products we may offer; |
| • | treatment of customer assets, including custody, control, safekeeping and, in certain countries, segregation of our customer funds and securities; |
| • | maintaining specified minimum amounts of capital and limiting withdrawals of funds from our regulated operating subsidiaries; |
| • | continuing education requirements for our employees; |
| • | anti-money laundering practices; |
| • | recordkeeping and reporting; and |
| • | supervision regarding the conduct of directors, officers and employees. |
Compliance with these regulations is complicated, time consuming and expensive. Our ability to comply with all applicable laws and regulations is dependent in large part on our internal legal and compliance functions, as well as our ability to attract and retain qualified personnel, which we may not be able to do. Regulators and self-regulatory organizations broadly oversee the conduct of our business and several perform regular examinations of our operations to monitor our compliance with applicable laws and regulations. If a regulator finds that we have failed to comply with applicable rules and regulations, we may be subject to censure, fines, cease-and-desist orders, suspension of our business, removal of personnel, civil litigation or other sanctions, including, in some cases, increased reporting requirements or other undertakings, revocation of our operating licenses or criminal conviction. In addition, we could incur significant legal expenses in defending ourselves against and resolving actions or investigations by such regulatory agencies. An adverse resolution of any future actions or investigations by such regulatory agencies against us could result in a negative perception of our company and cause the market price of our common stock to decline or otherwise have a material adverse effect on our business, financial condition, results of operations and cash flows.
As a Result of Recent Regulatory Changes in Certain Jurisdictions, Our Operations and Profitability May Be Disrupted and We May Be Subject to Regulatory Action Taken Against Us if a Regulatory Authority Determines that Our Operations Are Out of Compliance, or Requires Us to Comply With Additional Regulatory Requirements.
Recently, the legislative and regulatory environment in which we operate has undergone significant changes and there are likely to be future regulatory changes affecting our industry. Our ability to expand our presence in various jurisdictions throughout the world will depend on the nature of future changes to the regulatory environment and our ability to continue to comply with evolving requirements. To the extent one or more regulators determines that our current activities do not comply with applicable law or regulations in a given jurisdiction, our services may be disrupted, we may elect to shift our services to a white label partner or we may be required to withdraw or modify our service offering.
In August 2010, the CFTC released new rules, effective as of October 18, 2010, relating to the retail forex industry regarding, among other things, increased initial minimum security deposits, registration of introducing brokers, money managers and fund managers, increased risk disclosures, including disclosures relating to
39
Table of Contents
customer profits and losses, record keeping, financial reporting, minimum capital and other operational standards. In addition, the rules established 50-to-1 as the maximum leverage permitted to be provided to U.S. customers in major currency pairs, and 20-to-1 in all other currency pairs. Our inability to offer U.S. customers leverage in excess of these limits, compared to 100-to-1 previously for all currency pairs, may diminish the trading volume generated by these customers, which could materially adversely affect our revenue and profitability. We can provide no assurance that maximum leverage limits in the United States, or elsewhere, will not be decreased further, which could materially adversely affect our business, results of operations and financial condition. In addition, the new disclosure requirements may impact our ability to attract and retain our retail customers.
The Dodd-Frank Wall Street Reform and Consumer Protection Act, or the Dodd-Frank Act, enacted in July 2010, is also expected to have a significant effect on our U.S. retail forex business. For example, the Dodd-Frank Act further amended the Commodity Exchange Act to prohibit essentially all OTC retail transactions in any commodity other than foreign currency after July 15, 2011. As a result, after such date, we will not be permitted to offer our U.S. retail customers spot metals trading or any product other than forex. For the year ended December 31, 2010, our spot metals trading business in the United States generated approximately $10.8 million in revenue. As such, the loss of our ability to offer this product to our U.S. retail customers could have a material adverse effect on our business, revenue and profitability. In addition, beginning in October 2010, the Dodd-Frank Act requires us to ensure that our customers resident in the United States have accounts with our NFA-registered operating entity and not our international entities. As a result, some of our customers may decide to transact their trading with a foreign forex broker that is not subject to regulation under the Dodd-Frank Act. The Dodd-Frank Act also includes a requirement that federal banking regulators and the SEC adopt new rules regarding the conduct and operation of forex businesses by banks and broker-dealers, respectively. As a result of these new regulations, the ability of our wholesale forex trading partners, many of which are regulated banks and/or broker-dealers, to do business with us could be significantly curtailed, which could materially adversely affect our ability to provide liquidity to our customers. In addition, the new rules could adversely affect the structure, size, depth and liquidity of forex markets generally. Any of these new regulatory developments, alone or in combination, could have a material adverse effect on our business and profitability.
In the European Union, government officials have announced the intention to propose new laws to regulate OTC derivatives. The new laws would, among other things, require mandatory central clearing of some derivatives, higher collateral requirements and higher capital charges for certain OTC derivatives. These initiatives are still at the consultation stage and details for many aspects of the legislative proposals have not yet been published. If the products that we offer are subjected to mandatory central clearing, exchange trading, higher collateral requirements or higher capital charges, our business, financial condition and results of operations could be materially adversely affected.
In Japan, new regulations, which became effective in August 2010, prohibit our ability to offer Japanese residents leverage for forex products in excess of 50-to-1 and in August 2011 the maximum allowable leverage for forex products in Japan will decrease to 25-to-1. For spot gold that we offer in Japan, beginning July 1, 2011, the maximum allowable leverage will be 20-to-1. These changes may result in a decrease in Japanese customer trading volume, which may in turn materially adversely affect our financial condition, results of operations and cash flows.
The Australian Securities and Investments Commission has proposed its intention to issue new guidance on advertising materials, to introduce disclosure benchmarks for OTC CFD providers and to require OTC CFD providers to adopt written customer suitability policies.
In addition, the changing regulatory environment may create uncertainty with respect to certain practices or types of transactions that, in the past, may have been considered permissible and appropriate among financial services firms. Certain established practices may be called into question or become subject to additional regulatory requirements. These legal or regulatory uncertainties and additional regulatory requirements could result in a loss
40
Table of Contents
of, or increase in the cost of, business and could materially adversely affect our revenue, profitability and results of operations. In addition, because of changes in regulation, regulatory interpretations, enforcement practices or for other reasons, we may be found to have violated local regulation and, as a result, we may be subject to enforcement actions and penalties or customer claims.
As We Operate in Many Jurisdictions Without Local Registration, Licensing or Authorization, We May Be Subject to Possible Enforcement Action and Sanction for Our Operations in Such Jurisdictions if Our Operations Are Determined to Have Violated Regulations in Those Jurisdictions. Our Growth May Be Limited by Various Restrictions and We Remain at Risk That We May Be Required to Cease Operations if We Become Subject to Regulation by Local Government Bodies.
For the year ended December 31, 2010, approximately 68.3% of our trading volume was attributable to customers resident in a jurisdiction where we are licensed, regulated or where we deal with customers cross-border in a manner which we believe does not require us to be regulated in that jurisdiction. The remaining 31.7% of our trading volume was attributable to customers in jurisdictions in which we are not currently licensed or authorized by the local government or applicable self-regulatory organization or where we depend on our partners being licensed or regulated. We determine the nature and extent of services we can offer and the manner in which we conduct our business in the various jurisdictions in which we serve customers based on a variety of factors, including legal advice received from local counsel, our review of applicable laws and regulations and, in some cases, our discussions with local regulators. In cases in which we operate in jurisdictions based on local legal advice, we are exposed to the risk that our legal and regulatory analysis is subsequently determined by a local regulatory agency or other authority to be incorrect and that we have not been in compliance with local laws or regulations, including local licensing or authorization requirements, and to the risk that the regulatory environment in a jurisdiction may change, including in a circumstance where laws or regulations or licensing or authorization requirements that previously were not enforced become subject to enforcement
In jurisdictions in which we are not licensed or authorized, we may be subject to a variety of restrictions regarding the manner in which we conduct our business or serve customers, including restrictions on:
| • | our sales and marketing activities; |
| • | the use of a website specifically targeted to potential customers in a particular country; |
| • | the minimum income level or financial sophistication of potential customers we may contact; |
| • | our ability to have a physical presence in a particular country; or |
| • | the types of services we may offer customers physically present in each country. |
These restrictions may limit our ability to grow our business in any such jurisdiction or may result in increased overhead costs or degradation in our services in that jurisdiction. We currently have only a limited presence in a number of important markets and because of these and other regulatory restrictions, we may not be able to gain a significant presence there unless and until the regulatory landscape in these markets is modified. Consequently, we cannot assure you that our international expansion plans will be achieved.
We may be subject to possible enforcement action and penalties if we are determined to have previously offered, or currently offer, our services in violation of applicable laws and regulations in any of the markets in which we serve customers. For example, the regulatory rules in China are complex and are not as clear as those in many other jurisdictions and our forex trading services may not have been, and may not currently be, compliant with applicable Chinese regulations. Between 2006 and 2008, a significant portion of our trading volume, trading revenue, net income and cash flow were generated from residents of China. When we commenced offering our forex trading services to residents of China in October 2003, we believed that our operations were in compliance with applicable Chinese regulations. However, as a result of a review of our regulatory compliance in China during 2008, we became aware of what appeared to be a China Banking and Regulatory Commission prohibition on providing retail forex trading services through the direct solicitation of Chinese residents, including through the Internet, without a China Banking and Regulatory Commission permit. We do not have such a permit and to our knowledge, no such permit exists. In light of the regulatory uncertainty regarding the permit, we terminated
41
Table of Contents
all service offerings to residents of China and ceased our trading support operations located inside the country, while undertaking a review of the manner in which to most appropriately serve Chinese customers. As of December 31, 2008, we no longer accepted new customers from China. However, due to an ongoing relationship with one of our introducing brokers, eight legacy accounts in China, which were originally sourced through that introducing broker prior to the termination of our service offering, remained open. The trading activity by these legacy accounts resulted in an immaterial amount of trading volume to us and were all closed as of December 31, 2009. Based on our review of the relevant regulatory requirements in China, in 2010 we began accepting Chinese customers that neither we nor our partners directly solicit in China. We may be subject to fines, penalties or sanctions as a result of our current and historical forex trading services to Chinese residents.
A small number of our customers also reside in Singapore. We are not currently licensed to offer forex trading services in Singapore, but are currently reviewing the applicable licensing requirements and have consulted with the Monetary Authority of Singapore in order to determine the appropriate course of action. If we are required by the Monetary Authority of Singapore to cease accepting customers prior to receiving a license, we will direct all existing customers to a white label partner. We could also be subject to fines, penalties or other sanctions as a result of our historical activities with customers residing in Singapore.
In any such case, we may be required to cease the conduct of our business with customers in one or more jurisdictions. We may also determine that compliance with the laws or licensing, authorization or other regulatory requirements for continuing the business in one or more jurisdictions are too onerous to justify making the necessary changes. In addition, any such event could impact our relationship with the regulators or self-regulatory organizations in the jurisdictions where we are subject to regulation.
The Canadian regulatory environment is complex and evolving, and our forex trading services may not be compliant with the regulations of each province and territory in Canada. If we have contravened Canadian regulatory requirements, we may be subject to enforcement actions, penalties and customer claims. Canadian securities regulatory authorities have broad remedial authority, including the authority to order disgorgement of profits and suspension of trading activities in appropriate circumstances. We may also be required to register our business in one or more provinces or territories, or to offer our trading services through locally registered white label partners. Any such enforcement actions, penalties, claims or new locally registered white label partnerships could have a significant adverse impact on our profitability in relation to the services we offer in Canada.
Approximately 6.0% of our customer trading volume for the year ended December 31, 2010 was generated from customers located in Canada. In Canada, the securities industry is governed by provincial or territorial legislation, and there is no national regulator. Local legislation differs from province to province and territory to territory.
The Canadian regulatory environment is complex and evolving, and our forex trading services may not have been, and may not currently be, compliant with the regulations of each province and territory. In June 2005, we were advised by the British Columbia Securities Commission, or BCSC, that we were required to register as a dealer to offer our trading services directly to residents of that province. We have therefore conducted our business in British Columbia through Questrade, Inc, a registered investment dealer in Canada, since August 2005. In addition, on October 30, 2009, the Ontario Securities Commission, or OSC, issued interim guidance pursuant to a staff notice which took the position that rolling spot foreign exchange contracts and similar over-the-counter derivative contracts sold using a trading platform similar to ours fall under the definition of securities, which would, absent exemptive relief, require, among other things, us to comply with the dealer registration and prospectus delivery requirements of Ontario securities law. In November 2010, we received correspondence from the OSC requesting information about our customers and business practices in Ontario and asking us to explain why our activities should not be considered in breach of dealer registration and prospectus delivery requirements under Ontario securities law. In its letter, the OSC states that it is acting in conjunction
42
Table of Contents
with the BCSC and the Quebec financial industry regulator, the Autorité des Marchés Financiers, or AMF, in its review of our activities. The OSC staff also provided a copy of a Statement of Allegations that was issued by the OSC staff in November 2010 to a third party introducing broker and authorized trader previously associated with us, which was not registered as a dealer in Ontario and solicited clients over the Internet to invest in the currency market through our accounts in contravention of dealer registration and prospectus delivery requirements under Ontario securities law. We have also received notices from the AMF asserting violations of derivatives regulations in that province and directing us, in light of the alleged contraventions of regulatory requirements, to cease providing services in Quebec. We responded to the regulators and have ceased accepting new customers from Quebec, Ontario and Alberta. Since November 22, 2010, we have directed all new customers resident in Quebec, Ontario and Alberta to our white label partner, Questrade, Inc. If required by the regulators, we will also transfer all existing customers resident in Quebec, Ontario and Alberta to Questrade, Inc. Since we share a portion of the revenue generated from these customers with our white label partner, our profitability relating to our services in these provinces has been adversely affected. Our profitability relating to our Canadian business may be further adversely affected if we are required to enter into white label partnerships in the other provinces of Canada. In addition to the impact on our profitability of our white label partnerships, if our forex trading operations are considered to contravene Canadian regulatory requirements in Quebec, Ontario and Alberta or any other province or territory, we may also be subject to enforcement actions and penalties including disgorgement of profits and suspension of trading activities, as well as customer claims. If we deem it advisable and it is practicable to do so, we may seek to register as a dealer in various Canadian provinces and territories to offer our trading services directly.
We Are Required to Maintain High Levels of Capital, Which Could Constrain Our Growth and Subject Us to Regulatory Sanctions.
Our regulators have stringent rules requiring that we maintain specific minimum levels of regulatory capital in our operating subsidiaries that conduct our spot foreign exchange, CFDs, gold and silver spot trading and securities business. In the United States, as a Futures Commission Merchant, or FCM, and a Retail Forex Exchange Dealer, or RFED, we are required to maintain adjusted net capital of $20.0 million plus 5.0% of the amount of customer liabilities over $10.0 million. On a worldwide basis, as of December 31, 2010, we were required to maintain approximately $33.8 million minimum capital in the aggregate across all jurisdictions, representing a $7.8 million increase from our minimum regulatory capital requirement at December 31, 2009. Regulators continue to evaluate and modify regulatory capital requirements from time to time in response to market events and to improve the stability of the international financial system. Additional revisions to this framework or new capital adequacy rules applicable to us may be proposed and ultimately adopted, which could further increase our minimum capital requirements in the future.
Even if regulators do not change existing regulations or adopt new ones, our minimum capital requirements will generally increase in proportion to the size of the business conducted by our regulated subsidiaries. As a result, we will need to increase our regulatory capital in order to expand our operations and increase our revenue, and our inability to increase our capital on a cost-efficient basis could constrain our growth. In addition, in many cases, we are not permitted to withdraw regulatory capital maintained by our subsidiaries without prior regulatory approval or notice, which could constrain our ability to allocate our capital resources most efficiently throughout our global operations. In particular, these restrictions could adversely affect our ability to withdraw funds needed to satisfy our ongoing operating expenses, debt service and other cash needs and could limit any future decision by our board to declare dividends. Regulators monitor our levels of capital closely. We are required to report the amount of regulatory capital we maintain to our regulators on a regular basis, and we must report any deficiencies or material declines promptly. While we expect that our current amount of regulatory capital will be sufficient to meet anticipated short-term increases in requirements, any failure to maintain the required levels of regulatory capital, or to report any capital deficiencies or material declines in capital could result in severe sanctions, including fines, censure, restrictions on our ability to conduct business and revocation of our registrations. The imposition of one or more of these sanctions could ultimately lead to our liquidation, or the liquidation of one or more of our subsidiaries.
43
Table of Contents
Servicing Customers Via the Internet May Require Us to Comply With the Laws and Regulations of Each Country in Which We Are Deemed to Conduct Business. Failure to Comply With Such Laws May Negatively Impact Our Financial Results.
Since our services are available over the Internet in foreign countries and we have customers residing in foreign countries, foreign jurisdictions may require us to qualify to do business in their country. We believe that the number of our customers residing outside of the United States will increase over time. We are required to comply with the laws and regulations of each country in which we conduct business, including laws and regulations currently in place or which may be enacted related to Internet services available to the residents of each country from service providers located elsewhere. Any failure to develop effective compliance and reporting systems could result in regulatory penalties in the applicable jurisdiction, which could have a material adverse effect on our business, financial condition and results of operations and cash flows.
Procedures and Requirements of the Patriot Act and other Anti-money Laundering and Know Your Customer Regulations May Expose Us to Significant Costs or Penalties.
As participants in the financial services industry, we are, and our subsidiaries are, subject to numerous laws and regulations, including the Uniting and Strengthening America by Providing Appropriate Tools Required to Intercept and Obstruct Terrorism Act of 2001, or the Patriot Act, that require that we know our customers and monitor transactions for suspicious financial activities. The cost of complying with the Patriot Act and similar laws and regulations is significant. We face the risk that our policies, procedures, technology and personnel directed toward complying with these laws and regulations are insufficient and that we could be subject to significant criminal and civil penalties due to noncompliance. Such penalties could have a material adverse effect on our business, financial condition and results of operations and cash flows. In addition, as an online financial services provider with customers worldwide, we may face particular difficulties in identifying our customers and monitoring their activities.
Risks Related to Third Parties
We Are Dependent on Wholesale Forex Trading Partners to Continually Provide Us With Forex Market Liquidity. In the Event That We No Longer Have Access to the Prices and Levels of Liquidity That We Currently Have, We May Be Unable to Provide Competitive Forex Trading Services, Which Will Materially Adversely Affect Our Business, Financial Condition and Results of Operations and Cash Flows.
Given the level of our customers’ trading volume, we rely on third-party financial institutions to provide us with forex market liquidity. As of December 31, 2010, we maintained relationships with three established global prime brokers, including Deutsche Bank AG, or Deutsche Bank, UBS AG, or UBS, and the Royal Bank of Scotland plc, or RBS, as well as relationships with a number of additional wholesale forex trading partners and had access to other trading platforms. We depend on these relationships for our access to a pool of forex liquidity to ensure that we are able to execute our customers’ trades in any of the 48 currency pairs, six metals or 12 CFD product offerings we offer and in notional amount they request. These prime brokers and wholesale forex trading partners, although under contract with us, have no obligation to provide us with liquidity and may terminate our arrangements at any time. In the event that we no longer have access to the competitive wholesale forex pricing spreads and/or levels of liquidity that we currently have, we may be unable to provide competitive forex trading services, which would materially adversely affect our business, financial condition and results of operations and cash flows.
44
Table of Contents
We Depend on the Services of Prime Brokers to Assist in Providing Us Access to Liquidity Through Our Wholesale Forex Trading Partners. The Loss of One or More of Our Prime Brokerage Relationships Could Lead to Increased Transaction Costs and Capital Posting Requirements, As Well As Having a Negative Impact on Our Ability to Verify Our Open Positions, Collateral Balances and Trade Confirmations.
We depend on the services of prime brokers to assist in providing us access to liquidity through our wholesale forex trading partners. We currently have established three prime brokerage relationships with major financial institutions, including Deutsche Bank, UBS, and RBS, which act as central hubs through which we are able to deal with our existing wholesale forex trading partners. Although we have relationships with wholesale forex trading partners who could provide clearing services as a back-up for our prime brokerage services, if we were to experience a disruption in prime brokerage services due to a financial, technical or other development adversely affecting any of our current prime brokers, our business could be materially adversely affected to the extent that we are unable to transfer positions and margin balances to another financial institution in a timely fashion. In the event of the insolvency of a prime broker, we might not be able to fully recover the assets we have deposited (and have deposited on behalf of our customers) with the prime broker or our unrealized profits since we will be among the prime broker’s unsecured creditors.
A Systemic Market Event That Impacts the Various Market Participants With Whom We Interact Could Have a Material Adverse Effect on Our Business, Financial Condition and Results of Operations and Cash Flows.
We interact with various third parties through our relationships with our prime brokers, wholesale forex trading partners, white label partners and introducing brokers. Some of these market participants could be overleveraged. In the event of sudden, large market price movements, such market participants may not be able to meet their obligations to brokers who, in turn, may not be able to meet their obligations to their counterparties. As a result, a system collapse in the financial system could occur, which would have a material adverse effect on our business, financial condition and results of operations and cash flows.
We Are Subject to Risk of Default by Financial Institutions That Hold Our Funds and Our Customers’ Funds.
We have significant deposits with banks and other financial institutions. Pursuant to CFTC and NFA regulations for our U.S.-regulated subsidiaries, we are not required to segregate customer funds from our own funds. As such, we aggregate our customers’ funds and our funds and hold them in collateral and deposit accounts at various financial institutions. In the event of insolvency of one or more of the financial institutions with which we have deposited these funds, both us and our customers may not be able to recover our funds. Because our customers’ funds are aggregated with our own, the extent to which they will be entitled to insurance by the Federal Deposit Insurance Corporation is uncertain. In any such insolvency we and our customers would rank as unsecured creditors in respect of claims to funds deposited with any such financial institution. As a result, we may be subject to claims by customers due to the loss of such funds and our business would be harmed by the loss of our funds.
We Are Subject to Counterparty Risk Whereby Defaults by Parties With Whom We Do Business Can Have an Adverse Effect on Our Business, Financial Condition and Results of Operations and Cash Flows.
Our operations require a commitment of capital and involve risks of losses due to the potential failure of our customers to perform their obligations under their transactions with us. Our margin policy allows customers to leverage their account balances by trading notional amounts that may be significantly larger than their cash balances. We mark our customers’ accounts to market each time a currency price in their portfolio changes. While this allows us to closely monitor each customer’s exposure, it does not guarantee our ability to eliminate negative customer account balances prior to an adverse currency price change. Although we have the ability to alter our margin requirements without prior notice to our customers, this may not eliminate the risk that our access to liquidity becomes limited or market conditions, including currency price volatility and liquidity constraints, change faster than our ability to modify our margin requirements. If our customers default on their obligations, we remain financially liable for such obligations, and although these obligations are collateralized,
45
Table of Contents
since the value of our customers’ forex positions is subject to fluctuation as market prices change, we are subject to market risk in the liquidation of customer collateral to satisfy such obligations. In light of the current turbulence in the global economy, we face increased risk of default by our customers and other counterparties. For example, during the second half of 2008, Lehman Brothers Holdings Inc. declared bankruptcy, and many major U.S. financial institutions were forced to merge or were put into conservatorship by the U.S. federal government. Any default by our counterparties or partners could be significant and could have a material adverse effect on our business, financial condition and results of operations and cash flows.
Failure of Third-Party Systems or Third-Party Service and Software Providers Upon Which We Rely Could Adversely Affect Our Business.
We rely on certain third-party computer systems or third-party service and software providers, including trading platforms, back-office systems, Internet service providers and communications facilities. For example, for the year ended December 31, 2010, 30.5% of our forex trading volume was derived from trades utilizing the MetaTrader platform, a third-party trading platform we license that is popular in the international retail trading community and offers our customers a choice in trading interfaces. Additionally, we also rely on an agreement we entered into with Trading Central whereby Trading Central will provide us with investment research that we distribute to our customers. Any interruption in these third-party services, or deterioration in their performance or quality, could adversely affect our business. If our arrangement with any third party is terminated, we may not be able to find an alternative systems or services provider on a timely basis or on commercially reasonable terms. This could have a material adverse effect on our business, financial condition and results of operations and cash flows.
Our Computer Infrastructure May Be Vulnerable to Security Breaches. Any Such Problems Could Jeopardize Confidential Information Transmitted Over the Internet, Cause Interruptions in Our Operations or Give Rise to Liabilities to Third Parties.
Our computer infrastructure is potentially vulnerable to physical or electronic computer break-ins, viruses and similar disruptive problems and security breaches. Any such problems or security breaches could give rise to liabilities to one or more third parties, including our customers, and disrupt our operations. A party able to circumvent our security measures could misappropriate proprietary information or customer information, jeopardize the confidential nature of information we transmit over the Internet or cause interruptions in our operations. Concerns over the security of Internet transactions and the safeguarding of confidential personal information could also inhibit our customers’ use of our systems to conduct forex transactions over the Internet. To the extent that our activities involve the storage and transmission of proprietary information and personal financial information, security breaches could expose us to a risk of financial loss, litigation and other liabilities. Our current insurance policies may not protect us against all of such losses and liabilities. Any of these events, particularly if they result in a loss of confidence in our services, could have a material adverse effect on our business, financial condition and results of operations and cash flows.
We Have Relationships With Introducing Brokers Who Direct New Customers to Us. Failure to Maintain These Relationships Could Have a Material Adverse Effect on Our Business, Financial Condition and Results of Operations and Cash Flows.
We have relationships with introducing brokers who direct new customers to us and provide marketing and other services for these customers. In certain jurisdictions, we are only able to provide our services through introducing brokers. For the year ended December 31, 2010, approximately 36.0% of our forex trading volume was derived from introducing brokers. Many of our relationships with introducing brokers are nonexclusive or may be terminated by the brokers on short notice. In addition, under our agreements with introducing brokers, they have no obligation to provide us with new customers or minimum levels of transaction volume. Our failure to maintain our relationships with these introducing brokers, the failure of the introducing brokers to provide us with customers or our failure to create new relationships with introducing brokers would result in a loss of revenue, which could have a material adverse effect on our business, financial condition and results of operations and cash
46
Table of Contents
flows. To the extent any of our competitor’s offers more attractive compensation terms to one of our introducing brokers, we could lose the broker’s services or be required to increase the compensation we pay to retain the broker. In addition, we may agree to set the compensation for one or more introducing brokers at a level where, based on the transaction volume generated by customers directed to us by such brokers, it would have been more economically attractive to seek to acquire the customers directly rather than through the introducing broker.
For the year ended December 31, 2010, approximately 5.6% of our forex trading volume was derived from TradeStation Securities, Inc., or TradeStation, one of our largest introducing brokers. TradeStation recently formed a wholly-owned subsidiary, TradeStation Forex, Inc., to assume, own and conduct all of TradeStation’s forex brokerage business. TradeStation Forex Inc.’s application for CFTC registration and NFA membership was recently approved and we are awaiting notice from TradeStation that it has obtained all other required approvals and wishes to have us transfer our TradeStation-introduced customers to it. We may be unable to offset the loss of TradeStation with new introducing brokers, if at all. If we do not enter into the most economically attractive relationships with introducing brokers, our introducing brokers terminate their relationship with us or our introducing brokers fail to provide us with customers, our business, financial condition and results of operations and cash flows would be materially, adversely affected.
Our Relationships With Our Introducing Brokers May Also Expose Us to Significant Reputational and Other Risks as We Could Be Harmed by Introducing Broker Misconduct or Errors That Are Difficult to Detect and Deter.
It may be perceived that we are responsible for the improper conduct by our introducing brokers, even though we do not control their activities. Many of our introducing brokers operate websites, which they use to advertise our services or direct customers to us. It is difficult for us to closely monitor the contents of their websites to ensure that the statements they make in relation to our services are accurate and comply with applicable rules and regulations. While historically we have been responsible for the activities of our introducing brokers that were not members or associates of NFA and subject to disciplinary action for failure to adequately supervise them, under the new NFA and CFTC rules, we are no longer responsible for the activities of any party that solicits or introduces a customer to us, as our introducing brokers will now be required to be members of the NFA and are therefore directly supervised by the NFA. However, it may be perceived that we are responsible for any misleading statements about us made on websites of our introducing brokers and any disciplinary action taken against any of our introducing brokers in the United States and abroad could have a material adverse effect on our reputation, damage our brand name and materially adversely affect our business, financial condition and results of operations and cash flows.
We Have Relationships With White Label Partners Who Direct Customer Trading Volume to Us. Failure to Maintain These Relationships or Develop New White Label Partner Relationships Could Have a Material Adverse Effect on Our Business, Financial Condition and Results of Operations and Cash Flows.
We have relationships with white label partners who provide forex trading to their customers by using our trading platform and other services and, therefore, provide us with an additional source of revenue. For the year ended December 31, 2010, approximately 8.7% of our forex trading volume was derived from white label partners. Many of our relationships with white label partners are non-exclusive or may be terminated by them on short notice. In addition, our white label partners have no obligation to provide us with minimum levels of transaction volume. Our failure to maintain our relationships with these white label partners, the failure of these white label partners to continue to offer online forex trading services to their customers using our trading platform, the loss of requisite licenses by our white label partners or our inability to enter into new relationships with white label partners would result in a loss of revenue, which could have a material adverse effect on our business, financial condition and results of operations and cash flows. To the extent any of our competitor’s offers more attractive compensation terms to one or more of our white label partners, we could lose the white label partnership or be required to increase the compensation we pay to retain the white label partner. Our relationships with our white label partners also may expose us to significant regulatory, reputational and other risks as we could be harmed by white label partner misconduct or errors that are difficult to detect and deter. If
47
Table of Contents
any of our white label partners provided unsatisfactory service to their customers or were deemed to have failed to comply with applicable laws or regulations, our reputation may be harmed as a result of our affiliation with such white label partner. Any such harm to our reputation would have a material adverse effect on our business, financial condition and results of operations and cash flows.
Risks Related to our Common Stock
An Active Trading Market for Our Common Stock May Not Develop, Which May Cause Our Common Stock to Trade at a Discount From the Initial Offering Price and Make It Difficult for You to Sell the Shares You Purchase.
Prior to the initial public offering of our common stock in December 2010 there was no public trading market for our common stock. We cannot predict the extent to which investor interest in our company will lead to the development or maintenance of an active trading market. If an active trading market does not develop, there may be difficulty selling any shares of our common stock.
The Market Price of Our Common Stock May Be Volatile.
Securities markets worldwide experience significant price and volume fluctuations. This market volatility, as well as the factors listed below, some of which are beyond our control, could affect the market price of our common stock:
| • | quarterly variations in our results of operations and cash flows or the results of operations and cash flows of our competitors; |
| • | our failure to achieve actual operating results that meet or exceed guidance that we may have provided due to factors beyond our control, such as currency volatility and trading volumes; |
| • | future announcements concerning us or our competitors, including the announcement of acquisitions; |
| • | changes in government regulations or in the status of our regulatory approvals or licensure; |
| • | public perceptions of risks associated with our services or operations; |
| • | developments in our industry; and |
| • | general economic, market and political conditions and other factors that may be unrelated to our operating performance or the operating performance of our competitors. |
If Securities or Industry Analysts Do Not Publish Research or Reports About Our Business, if They Change Their Recommendations Regarding Our Common Stock Adversely, or if We Fail to Achieve Analysts’ Earnings Estimates, the Market Price and Trading Volume of Our Common Stock Could Decline.
The trading market for our common stock will be influenced by the research and reports that industry or securities analysts publish about us or our business. If one or more of the analysts who cover us or our industry make unfavorable comments about our market opportunity or business, the market price of our common stock would likely decline. If one or more of these analysts ceases coverage of us or fails to regularly publish reports on us, we could lose visibility in the financial markets, which could cause the market price of our common stock or trading volume to decline. On our part, if we fail to achieve analysts’ earnings estimates, the market price of our common stock would also likely decline.
Because We Do Not Intend to Pay Dividends for the Foreseeable Future, Investors Will Benefit From Their Investment in Shares Only if Our Common Stock Appreciates in Value.
We currently intend to retain our future earnings, if any, to finance the operation and growth of our business and do not expect to pay any dividends in the foreseeable future. As a result, the success of an investment in our common stock will depend upon any future appreciation in its value. Our common stock may not appreciate in value or even maintain the price at which investors have purchased their shares.
48
Table of Contents
Certain Provisions in Our Amended and Restated Certificate of Incorporation May Prevent Efforts by Our Stockholders to Change Our Direction or Management.
Provisions contained in our amended and restated certificate of incorporation could make it more difficult for a third party to acquire us, even if doing so might be beneficial to our stockholders. For example, our amended and restated certificate of incorporation authorizes our board of directors to determine the rights, preferences, privileges and restrictions of unissued series of preferred stock, without any vote or action by our stockholders. We could issue a series of preferred stock that could impede the completion of a merger, tender offer or other takeover attempt. These provisions may discourage potential acquisition proposals and may delay, deter or prevent a change of control of us, including through transactions, and, in particular, unsolicited transactions, that some or all of our stockholders might consider to be desirable.
We Cannot Predict Our Future Capital Needs. As a Result, We May Need to Raise Significant Amounts of Additional Capital. We May Be Unable to Obtain the Necessary Capital When We Need It, or on Acceptable Terms, if at All.
Our business depends on the availability of adequate funding and regulatory capital under applicable regulatory requirements. Historically, we have satisfied these needs from internally generated funds and from our preferred equity securities financings. While we currently anticipate that our available cash resources will be sufficient to meet our presently anticipated working capital and capital expenditure requirements for at least the next 12 months, we may need to raise additional funds to:
| • | support more rapid expansion; |
| • | develop new or enhanced services and products; |
| • | respond to competitive pressures; |
| • | acquire complementary businesses, products or technologies; or |
| • | respond to unanticipated requirements. |
Additional financing may not be available when needed on terms favorable to us.
Our Management and Other Affiliates Have Significant Control of Our Common Stock and Could Control Our Actions in a Manner That Conflicts With Our Interests and the Interests of Other Stockholders.
As of December 31, 2010, our executive officers, directors and our current 5.0% stockholders and their affiliated entities together beneficially owned approximately 71.0% of our outstanding capital stock. VantagePoint Venture Partners IV(Q), L.P., VantagePoint Venture Partners IV, L.P., VantagePoint Venture Partners IV Principals Fund, L.P., VP New York Venture Partners, L.P., referred to herein as the VPVP Funds, 3i U.S. Growth Partners L.P., 3i Technology Partners III L.P., 3i Growth Capital (USA) D L.P., 3i Growth Capital (USA) E L.P. 3i Growth Capital (USA) P L.P., and Edison Venture Fund IV SBIC, L.P., collectively referred to herein as the Venture Funds, together beneficially owned approximately 57.3% of our outstanding capital stock as of December 31, 2010. Two of our directors, Messrs. Sugden and Mills, are affiliated with their respective venture fund. As a result, these stockholders, acting together, are able to exercise considerable influence over matters requiring approval by our stockholders, including the election of directors, and may not always act in the best interests of other stockholders. Such a concentration of ownership may have the effect of delaying or preventing a change in our control, including transactions in which our stockholders might otherwise receive a premium for their shares over then current market prices.
Pursuant to our amended and restated certificate of incorporation and amended and restated bylaws, until the earlier of (i) such time that the VPVP Funds own less than 50% of all shares of our common stock that the VPVP Funds owned upon the completion of our initial public offering, (ii) immediately prior to our 2014 annual meeting of stockholders and (iii) such time that the VPVP Funds notify our board of directors that they no longer
49
Table of Contents
require that an individual designated by them serve on our board of directors, the VPVP Funds have the right to nominate one individual in the slate of director nominees for election at our 2011 annual meeting of stockholders and have such designee serve on our board of directors.
Our Internal Controls Over Financial Reporting May Not Be Effective and Our Independent Registered Public Accounting Firm May Not Be Able to Certify as to Their Effectiveness, Which Could Have a Significant and Adverse Effect on Our Business and Reputation.
We are evaluating our internal controls over financial reporting in order to allow management to report on our internal controls over financial reporting, as required by Section 404 of the Sarbanes-Oxley Act of 2002, as amended, and rules and regulations of the SEC thereunder, which we refer to as Section 404. We are in the process of documenting and testing our internal control procedures in order to satisfy the requirements of Section 404, which includes annual management assessments of the effectiveness of our internal controls over financial reporting and a report by our independent registered public accounting firm that addresses the effectiveness of internal controls.
As we continue our evaluation, we may identify material weaknesses that we may not be able to remediate in time to meet the deadline imposed by the Sarbanes-Oxley Act of 2002, as amended, for compliance with the requirements of Section 404. We will be required to comply with the requirements of Section 404 for the year ending December 31, 2011. In addition, if we fail to achieve and maintain the adequacy of our internal controls, as such standards are modified, supplemented or amended from time to time, we may not be able to ensure that we can conclude on an ongoing basis that we have effective internal controls over financial reporting in accordance with Section 404. We cannot be certain as to the timing of completion of our evaluation, testing and any remediation actions or the impact of the same on our operations. If we are not able to implement the requirements of Section 404 in a timely manner or with adequate compliance, our independent registered public accounting firm may not be able to opine as to the effectiveness of our internal control over financial reporting and we may be subject to sanctions or investigation by regulatory authorities, such as the SEC. As a result, there could be a negative reaction in the financial markets due to a loss of confidence in the reliability of our financial statements. In addition, we may be required to incur costs in improving our internal control system and the hiring of additional personnel. Any such action could negatively affect our results of operations and cash flows.
Shareholders May Be Diluted by the Future Issuance of Additional Common Stock in Connection With Our Incentive Plans, Acquisitions or Otherwise.
As of December 31, 2010, we had approximately 28.8 million shares of common stock authorized but unissued. Our certificate of incorporation authorizes us to issue these shares of common stock and options, rights, warrants and appreciation rights relating to common stock for the consideration and on the terms and conditions established by our board of directors in its sole discretion, whether in connection with acquisitions, in future common stock offerings or otherwise. We have reserved an aggregate of 8.5 million shares for issuance under our equity incentive compensation plans (1.4 million to be issued pursuant to future awards and grants under the 2010 Omnibus Incentive Compensation plan, or the 2010 plan, 6.6 million shares that are subject to outstanding grants under the 2006 Plan as of the effective date of the 2010 Plan, and 0.5 million shares to be issued pursuant to the 2011 Employee Stock Purchase Plan). Any common stock that we issue, including under our 2010 Omnibus Incentive Compensation Plan, 2011 Employee Stock Purchase Plan or other equity incentive plans that we may adopt in the future, will dilute the percentage ownership held by investors who own our common stock.
| ITEM 1B. | UNRESOLVED STAFF COMMENTS |
There are no unresolved staff comments.
50
Table of Contents
| ITEM 2. | PROPERTIES |
We do not own any properties. We currently have locations in the following sites: Our headquarters in Bedminster, New Jersey; sales and support offices in New York City; Woodmere, Ohio; London; Hong Kong; Japan; Australia; South Korea; Singapore; and a representative office and a technology development office in Shanghai and the Cayman Islands. These sites comprise approximately 84,000 square feet in aggregate. Our significant leasing arrangements are outlined below:
GAIN Facilities
|
Location |
Function |
Square Feet | Lease |
Headcount as of December 31, 2010 |
||||||||
| Bedminster, New Jersey |
Management, Marketing, Operations, Compliance, Legal, Human Resources, Call Center | 45,000 | December 2025 | 205 | ||||||||
| New York City, New York |
Sales and Customer Service | 23,294 | May 2011 | 69 | ||||||||
| Tokyo, Japan |
Management, Sales, Compliance, Operations | 4,090 | May 2011 | 19 | ||||||||
| Woodmere, Ohio |
Management, Operations, Customer Service, Compliance | 1,200 | October 2011 | 5 | ||||||||
| London, England |
Management, Sales, Compliance, Operations | 4,200 | January 2021 | 23 | ||||||||
| Hong Kong |
Management, Sales, Compliance | 1,804 | February 2012 | 5 | ||||||||
| Singapore |
Management, Sales, Compliance, Operations | 1,969 | January 2013 | 1 | ||||||||
| Australia |
Management, Sales, Compliance, Operations | 1,888 | March 2013 | 6 | ||||||||
While we believe that these facilities are adequate to meet our current needs, it may become necessary to secure additional space in the future to accommodate any future growth. We believe that such additional space will be available as needed in the future on commercially reasonable terms.
| ITEM 3. | LEGAL PROCEEDINGS |
We are involved in various claims and legal actions arising in the ordinary course of business. In the opinion of our management, the outcome of such claims and legal actions, if decided adversely, is not expected to have a material adverse effect on our quarterly or annual operating results, cash flows or consolidated financial position.
On February 15, 2011, we were informed by Broadband Graphics, LLC, or Broadband, that Broadband believes we have infringed certain patents it owns. Broadband filed a complaint reflecting the foregoing with the U.S. District Court for the District of Oregon. From a review of public records, it appears that Broadband has taken similar action against several other companies in the forex brokerage industry, with such other matters generally resulting in a settlement of litigation. Though we intend to vigorously defend ourselves and believe that Broadband’s claims are without merit, we can provide no assurances regarding the outcome of this matter.
51
Table of Contents
PART II
| ITEM 5. | MARKET FOR REGISTRANT’S COMMON EQUITY, RELATED STOCKHOLDER MATTERS AND ISSUER PURCHASES OF EQUITY SECURITIES |
MARKET FOR GAIN COMMON STOCK
Our common stock began trading on the New York Stock Exchange under the symbol “GCAP” on December 15, 2010. Prior to that date, there was no established trading market for our common stock. As of March 29, 2011, we estimate that we had approximately 168 stockholders of record and approximately 1,084 beneficial holders of our common stock.
The following table details the high and low sales prices for the common stock as reported by the New York Stock Exchange for the periods indicated.
| 2010 | ||||||||
| Quarter |
High | Low | ||||||
| Fourth Quarter |
$ | 9.35 | $ | 8.08 | ||||
DIVIDEND POLICY
We have never declared or paid cash dividends on our common stock. We currently intend to retain all available funds and any future earnings for use in the operation of our business and do not anticipate paying any cash dividends in the foreseeable future. Any future determination to declare cash dividends will be made at the discretion of our board of directors and will depend on our financial condition, results of operations, capital requirements, general business conditions and other factors that our board of directors may deem relevant.
RECENT SALES OF UNREGISTERED SECURITIES; USE OF PROCEEDS FROM REGISTERED SECURITIES
RECENT SALES OF UNREGISTERED SECURITIES
None.
USE OF PROCEEDS FROM REGISTERED SECURITIES
On December 20, 2010, we closed our initial public offering of 9,000,000 shares of our common stock at an initial public offering price of $9.00 per share. Of the 9,000,000 shares of common stock sold, we issued and sold 407,692 shares of common stock and our selling stockholders sold 8,592,308 shares of common stock, resulting in net proceeds to us of $4.0 million, after deducting underwriting discounts (which included a $0.6 million reimbursement to us by the underwriters for our out-of-pocket expenses incurred during the offering).
Morgan Stanley & Co. Incorporated and Deutsche Bank Securities acted as lead underwriters and JMP Securities LLC, Raymond James & Associates, Inc. and Sandler O’Neil & Partners, L.P. acted as managing underwriters. Our proceeds from the offering were used to pay a portion of our initial public offering expenses, which included (i) approximately $2.1 million in legal, accounting and printing fees incurred in 2010; (ii) approximately $0.3 million in underwriters’ discounts, fees and commissions; and (iii) approximately $3.6 million of our historical offering-related expenses and deferred costs incurred in fiscal years 2007, 2008 and 2009. The Registration Statement on Form S-1 (Reg. No. 333-161632) we filed to register our common stock was declared effective by the Securities and Exchange Commission on December 14, 2010.
On January 19, 2011, the underwriters’ exercised their overallotment option to purchase shares of our common stock from our selling stockholders in an amount equal to an aggregate of 80,000 shares. We did not receive any proceeds from the exercise of the overallotment option.
52
Table of Contents
REPURCHASES OF COMMON STOCK
None.
STOCK PERFORMANCE GRAPH
The following performance chart assumes an investment of $100 on December 15, 2010 and compares the change through December 31, 2010 in the market price for our common stock with the Russell 2000 Index, the NASDAQ Composite Index, and a peer group identified by the Company (the “Selected Peer Group Index”). The Selected Comparative Group Index was selected to include publicly-traded companies engaging in one or more of the Company’s lines of business.
The Selected Comparative Group Index is weighted according to the respective issuer’s stock market capitalization and is comprised of the following companies: Advent Software, Inc., BGC Partners, Inc., DST Systems, E*Trade Financial Corporation, FactSet Research Systems, Inc., FXCM, Inc., GFIG Group, Inc., Knight Capital Group, Inc., LaBranche & Co, Inc., Market Axcess Holdings, Inc., MSCI, Inc., optionsXpress Holdings, Inc., and TradeStation Group, Inc.
The comparisons in the graphs below are based on historical data and are not intended to forecast the possible future performance of GAIN’s common stock.
STOCK PERFORMANCE GRAPH
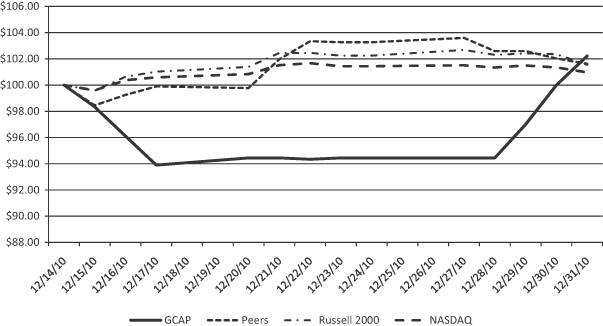
Index is market cap weighted.
53
Table of Contents
EQUITY COMPENSATION PLAN INFORMATION
The following table provides information with respect to our compensation plans under which equity compensation is authorized as of December 31, 2010.
| Plan category |
Number of securities to be issued upon exercise of outstanding options, warrants and rights (a) |
Weighted-average exercise price of outstanding options, warrants and rights (b) |
Number of securities remaining available for future issuance under equity compensation plans (excluding securities reflected in column (a)) (c) |
|||||||||
| Equity compensation plans approved by security holders |
4,681,196 | $ | 2.32 | 1,900,000 | ||||||||
| Total |
4,681,196 | $ | 2.32 | 1,900,000 | ||||||||
| ITEM 6. | SELECTED FINANCIAL DATA |
The financial data set forth below should be read in conjunction with “Management’s Discussion and Analysis of Financial Condition and Results of Operations” and our audited consolidated financial statements as of December 31, 2010 and 2009 and for the three years ended December 31, 2010 included in this annual report on Form 10-K. The selected Consolidated Statement of Operation data for the years ended December 31, 2007 and 2006 and the selected Consolidated Statement of Financial Condition data as of December 31, 2008, 2007 and 2006 are derived from our audited consolidated financial statements not included in this Annual Report on Form 10-K. Our historical results of operations are not necessarily indicative of future results.
54
Table of Contents
| (in thousands, except share and per share data) | ||||||||||||||||||||
| Year Ended December 31, | ||||||||||||||||||||
| 2010(1) | 2009(1) | 2008(1) | 2007(1) | 2006(1) | ||||||||||||||||
| Consolidated Statements of Operations Data: |
||||||||||||||||||||
| REVENUE |
||||||||||||||||||||
| Trading revenue |
$ | 187,356 | $ | 153,375 | $ | 186,004 | $ | 118,176 | $ | 69,471 | ||||||||||
| Other revenue |
3,417 | 2,108 | 2,366 | 437 | 242 | |||||||||||||||
| Total non-interest revenue |
190,773 | 155,483 | 188,370 | 118,613 | 69,713 | |||||||||||||||
| Interest revenue |
364 | 292 | 3,635 | 5,024 | 3,145 | |||||||||||||||
| Interest expense |
(2,039 | ) | (2,456 | ) | (3,905 | ) | (4,299 | ) | (2,431 | ) | ||||||||||
| Total net interest revenue/(expense) |
(1,675 | ) | (2,164 | ) | (270 | ) | 725 | 714 | ||||||||||||
| Net revenue |
189,098 | 153,319 | 188,100 | 119,338 | 70,427 | |||||||||||||||
| EXPENSES |
||||||||||||||||||||
| Employee compensation and benefits |
45,439 | 41,503 | 37,024 | 25,093 | 17,258 | |||||||||||||||
| Selling and marketing |
38,395 | 36,875 | 29,312 | 21,836 | 12,517 | |||||||||||||||
| Trading expenses and commissions |
25,658 | 14,955 | 16,310 | 10,436 | 10,321 | |||||||||||||||
| Bank fees |
4,239 | 4,466 | 3,754 | 2,316 | 935 | |||||||||||||||
| Depreciation and amortization |
4,647 | 2,689 | 2,496 | 1,911 | 897 | |||||||||||||||
| Communications and data processing |
2,951 | 2,676 | 2,467 | 1,659 | 873 | |||||||||||||||
| Occupancy and equipment |
4,038 | 3,548 | 2,419 | 1,616 | 1,045 | |||||||||||||||
| Bad debt provision |
597 | 760 | 1,418 | 1,164 | 574 | |||||||||||||||
| Professional fees |
3,910 | 3,729 | 3,104 | 1,380 | 1,295 | |||||||||||||||
| Software expense |
1,845 | 1,132 | 888 | 123 | 78 | |||||||||||||||
| Professional dues and memberships |
275 | 698 | 773 | 187 | 48 | |||||||||||||||
| Write-off of deferred initial public offering costs |
— | — | 1,897 | — | — | |||||||||||||||
| Change in fair value of convertible, redeemable preferred stock embedded derivative(1) |
(4,691 | ) | (1,687 | ) | (181,782 | ) | 165,280 | 61,732 | ||||||||||||
| Impairment of intangible assets |
— | — | — | — | 165 | |||||||||||||||
| Other |
4,343 | 1,746 | 1,424 | (627 | ) | 3,085 | ||||||||||||||
| Total |
131,646 | 113,090 | (78,496 | ) | 232,374 | 110,823 | ||||||||||||||
| INCOME/(LOSS) BEFORE INCOME TAX EXPENSE AND EQUITY IN EARNINGS OF EQUITY METHOD INVESTMENT |
57,452 | 40,229 | 266,596 | (113,036 | ) | (40,396 | ) | |||||||||||||
| Income tax expense |
20,009 | 12,556 | 34,977 | 21,615 | 9,063 | |||||||||||||||
| Equity in earnings of equity method investment |
— | — | (214 | ) | — | (43 | ) | |||||||||||||
| NET INCOME/(LOSS) |
37,443 | 27,673 | 231,405 | (134,651 | ) | (49,502 | ) | |||||||||||||
| Net income/(loss) applicable to noncontrolling interest |
(402 | ) | (321 | ) | (21 | ) | — | — | ||||||||||||
| Net income/(loss) applicable to GAIN Capital Holdings, Inc. |
$ | 37,845 | $ | 27,994 | $ | 231,426 | $ | (134,651 | ) | $ | (49,502 | ) | ||||||||
| Effect of redemption of preferred shares |
— | — | (63,913 | ) | — | (39,006 | ) | |||||||||||||
| Effect of preferred share accretion |
— | — | — | — | 2,205 | |||||||||||||||
| Net income/(loss) applicable to GAIN Capital Holdings, Inc. Common Shareholders |
$ | 37,845 | $ | 27,994 | $ | 167,513 | $ | (134,651 | ) | $ | (86,303 | ) | ||||||||
| Earnings/(loss) per common share: (2) |
||||||||||||||||||||
| Basic |
$ | 8.62 | $ | 9.47 | $ | 57.54 | $ | (31.35 | ) | $ | (13.66 | ) | ||||||||
| Diluted |
$ | 1.00 | $ | 0.75 | $ | 4.94 | $ | (31.35 | ) | $ | (13.66 | ) | ||||||||
| Weighted average common shares outstanding used in computing earnings/(loss) per common share: (2) |
||||||||||||||||||||
| Basic |
4,392,798 | 2,956,377 | 2,911,107 | 4,295,082 | 6,315,573 | |||||||||||||||
| Diluted |
37,742,902 | 37,282,069 | 33,924,649 | 4,295,082 | 6,315,573 | |||||||||||||||
55
Table of Contents
| (in thousands) | ||||||||||||||||||||
| As of December 31, | ||||||||||||||||||||
| 2010 | 2009 | 2008 | 2007 | 2006 | ||||||||||||||||
| Consolidated Statements of Financial Condition Data: |
||||||||||||||||||||
| Cash and cash equivalents |
$ | 284,210 | $ | 222,524 | $ | 176,431 | $ | 98,894 | $ | 31,476 | ||||||||||
| Receivables from brokers |
$ | 98,135 | $ | 76,391 | $ | 50,817 | $ | 74,630 | $ | 71,750 | ||||||||||
| Total assets |
$ | 443,071 | $ | 351,940 | $ | 264,816 | $ | 180,628 | $ | 113,491 | ||||||||||
| Payables to brokers, dealers, futures commission merchants, and other regulated entities |
$ | 6,102 | $ | 2,769 | $ | 1,679 | $ | 2,163 | $ | 5,248 | ||||||||||
| Payables to customers |
$ | 250,572 | $ | 196,985 | $ | 122,293 | $ | 106,741 | $ | 70,321 | ||||||||||
| Convertible, redeemable preferred stock embedded derivative |
$ | — | $ | 81,098 | $ | 82,785 | $ | 264,566 | $ | 99,286 | ||||||||||
| Notes payable |
$ | 18,375 | $ | 28,875 | $ | 39,375 | $ | 49,875 | $ | 27,500 | ||||||||||
| Total shareholders’ equity/(deficit) |
$ | 149,849 | $ | (139,890 | ) | $ | (172,154 | ) | $ | (316,640 | ) | $ | (154,242 | ) | ||||||
| (1) | For each of the periods indicated, in accordance with ASC 815, Derivatives and Hedging, we accounted for an embedded derivative liability attributable to the redemption feature of our then outstanding preferred stock. This redemption feature and the associated embedded derivative liability is no longer required to be recognized due to the conversion of all of our outstanding preferred stock in connection with the completion of our initial public offering of common stock in December 2010. |
| (2) | In connection with the completion of our initial public offering, we performed a 2.29-for-1 stock split of our common stock effective immediately prior to the completion of the IPO as well as the settlement of the primary share offering which was allocated to all common shareholders on a pro-rata basis resulting in an effective stock split of 2.26-for-1. As a result, the earnings per common share and weighted average common shares outstanding used in computing earnings per share have been retroactively adjusted to reflect the effective stock split. |
Selected Operational Data
($ in thousands unless otherwise stated)
| As of December 31, | ||||||||||||||||||||
| 2010 | 2009 | 2008 | 2007 | 2006 | ||||||||||||||||
| Number of traded retail accounts: |
64,313 | 52,755 | 52,555 | 43,139 | 28,270 | |||||||||||||||
| Number of funded retail accounts: |
85,562 | 60,168 | 49,740 | 51,026 | 37,109 | |||||||||||||||
| Number of new retail accounts: |
56,361 | 37,693 | 33,666 | 31,006 | 24,517 | |||||||||||||||
| Adjusted net capital in excess of regulatory requirements(3) |
$ | 112,551 | $ | 71,087 | $ | 98,571 | $ | 44,856 | $ | 15,296 | ||||||||||
| Year Ended December 31, | ||||||||||||||||||||
| 2010 | 2009 | 2008 | 2007 | 2006 | ||||||||||||||||
| Total trading volume (dollars in billions) |
$ | 1,564.1 | $ | 1,246.7 | $ | 1,498.6 | $ | 674.5 | $ | 447.4 | ||||||||||
| Net deposits received from retail customers (dollars in millions): |
$ | 267.8 | $ | 257.1 | $ | 277.3 | $ | 184.2 | $ | 102.8 | ||||||||||
| Retail revenue per million traded |
$ | 141.5 | $ | 123.0 | $ | 124.1 | $ | 175.2 | $ | 155.3 | ||||||||||
| Client assets |
$ | 256.7 | $ | 199.8 | $ | 124.0 | $ | 108.9 | $ | 75.6 | ||||||||||
| (3) | Adjusted net capital in excess of regulatory requirements represents the excess funds over the regulatory minimum requirements applicable to us. |
56
Table of Contents
Selected Geographic Data
| 2010 | 2009 | 2008 | 2007 | 2006 | ||||||||||||||||
| Customer trading volume by region (dollars in billions): |
||||||||||||||||||||
| U.S. |
$ | 777.0 | $ | 679.2 | $ | 878.9 | $ | 355.4 | $ | 238.3 | ||||||||||
|
China(4) |
4.9 | 0.4 | 172.4 | 103.4 | 50.8 | |||||||||||||||
| Canada |
93.9 | 142.5 | 122.9 | 58.6 | 29.2 | |||||||||||||||
| Europe, Middle East and Africa |
262.4 | 179.5 | 153.1 | 64.3 | 42.9 | |||||||||||||||
| Asia (ex-China) |
318.8 | 159.1 | 96.4 | 54.0 | 42.7 | |||||||||||||||
| Rest of World |
107.0 | 86.0 | 74.9 | 38.8 | 43.5 | |||||||||||||||
| Total |
$ | 1,564.1 | $ | 1,246.7 | $ | 1,498.6 | $ | 674.5 | $ | 447.4 | ||||||||||
| (4) | In 2008, a result of our review of our regulatory compliance in China, we decided to terminate our service offerings to residents of China. Based on a more recent review of the relevant regulatory requirements in China, in 2010, we began accepting customers that neither we nor our partners directly solicit in China. |
57
Table of Contents
| ITEM 7. | MANAGEMENT’S DISCUSSION AND ANALYSIS OF FINANCIAL CONDITION AND RESULTS OF OPERATIONS |
The following discussion and analysis should be read in conjunction with our audited consolidated financial statements and the accompanying notes thereto provided pursuant to “Item 8. Financial Statements and Supplementary Data” contained within this Annual Report on Form 10-K.
OVERVIEW
We are an online provider of retail and institutional foreign exchange, or forex, trading and related services founded in 1999 by a group of experienced trading and technology professionals. We offer our customers 24-hour direct access to the global over-the-counter, or OTC, foreign exchange markets. We also offer some of our retail customers access to other global markets on an OTC basis, including the spot gold and silver markets, as well as equity indices and commodities via instruments called contracts-for-difference, or CFDs which are investment products with returns linked to the performance of an underlying commodity, index or security. Our trading platforms provide a wide array of information and analytical tools that allow our customers to identify, analyze and execute their trading strategies efficiently and cost-effectively. We believe our proprietary technology, multilingual customer service professionals and effective educational programs provide a high degree of customer satisfaction and loyalty. Furthermore, our scalable and flexible technology infrastructure allows us to enhance our product service offerings to meet the rapidly changing needs of the marketplace. We also believe our net capital position and customer assets help make us one of the largest global retail foreign exchange services providers.
We use financial metrics, including funded retail accounts and traded retail accounts, to measure our aggregate customer account activity. Funded retail accounts represent retail customers who maintain cash balances with us. As of December 31, 2010 we had 85,562 funded retail accounts compared to 60,168 as of December 31, 2009. We believe the number of funded retail accounts is an important indicator of our ability to attract new retail customers that can potentially lead to trading volume and revenue in the future, however, it does not represent actual trades executed. We believe that the metric that most closely correlates to volume and revenue is the number of traded retail accounts, because this represents retail customers who executed a transaction with us during a particular period. During the year ended December 31, 2010, we had 64,313 traded retail accounts compared to 52,755 traded retail accounts for the year ended December 31, 2009, representing an increase of 21.9%.
For the year ended December 31, 2010, we generated $189.1 million of total net revenue and net income of $37.8 million, including a gain of $4.7 million relating to the change in fair value of our preferred stock embedded derivative. For the year ended December 31, 2009 we generated $153.3 million of total net revenue and net income of $28.0 million, including a gain of $1.7 million relating to the change in fair value of our preferred stock embedded derivative. For the year ended December 31, 2008, we generated $188.1 million of total net revenue and net income of $231.4 million and a gain of $181.8 million relating to the change in the fair value of our preferred stock embedded derivative. The preferred stock embedded derivative liability is attributable to the redemption feature of our previously outstanding preferred stock which allowed the holders of our preferred stock at any time on or after March 31, 2011, to require us to redeem all of the shares of preferred stock then outstanding. The preferred stock embedded derivative was a non-cash liability and, therefore, caused net income to fluctuate but did not reflect our operating performance. This redemption provision and the associated embedded derivative liability are no longer required to be recognized due to the conversion of all of our outstanding preferred stock in connection with our initial public offering. Excluding the impact of a $4.7 million gain relating to the change in fair market value of our embedded derivative during the period from January 1, 2010 through the effective date of the initial public offering and the impact of amortization related to purchased intangibles, our adjusted net income for the year ended December 31, 2010 was $33.9 million. Adjusted net income is a non-GAAP financial measure for which we provide a reconciliation of net income to adjusted net income under “— Operating Expenses – Change in Fair Value of Convertible Preferred Stock Embedded Derivative” below.
58
Table of Contents
We believe the following operating measurements are the main drivers of our revenue:
| • | customer trading volume; |
| • | retail trading revenue per million traded; |
| • | net deposits received from retail customers; |
| • | traded retail accounts, and |
| • | client assets. |
Customer trading volume is the U.S. dollar equivalent of aggregate notional value of trades executed by our customers. Retail trading revenue per million traded is the revenue we realize from our forex, CFDs and metals trading activities (including the revenue we realize from the difference between the “bid” price and the “offer” price for our customer’s executed trades, or the spread revenue) per one million of U.S. dollar-equivalent trading volume, and is calculated as retail trading revenue divided by the result obtained from dividing trading volume by one million. Net deposits received from retail customers represents customers’ deposits less withdrawals for a given period, and correlates to our customers’ ability to place additional trades, which potentially increases our trading volumes. Traded retail accounts impact our revenue because this represents the number of customers who executed trades during a specific period, which also affects our customer trading volume. Client assets represent amounts due to clients, including customer deposits and unrealized gains or losses arising from open positions.
Our customer base resides in over 140 countries outside of the United States and is comprised of three categories. The first are direct customers sourced through our retail forex trading website, FOREX.com (our flagship brand), which is a currency trading Internet site available in English, traditional and simplified Chinese, Japanese, Russian and Arabic, and provides currency traders of all experience levels with a full-service trading platform, along with extensive educational and support tools. The second are indirect customers sourced through either retail financial services firms that provide customers to us, which we refer to as introducing brokers, or financial institutions which offer our currency trading services to their existing client base under their own brand, which we refer to as white label partners. The third are institutional customers sourced through hedge funds, institutional asset managers and proprietary trading firms. For the year ended December 31, 2010, 48.7% of customer trading volume was generated from our direct customers, 36.0% was generated from introducing brokers and white label partners and 15.3% was generated from our institutional customers. For the year ended December 31, 2009, 65.4% of customer trading volume was generated from our direct customers and 34.6% was generated from introducing brokers and white label partners. We launched our institutional trading services in March 2010.
For the year ended December 31, 2010, customer trading volume was $1.6 trillion, retail trading revenue per million traded was $141.5, net deposits received from retail customers was $267.8 million and the number of traded retail accounts was 64,313. For the year ended December 31, 2009, the total dollar value traded by our customers, or customer trading volume, was $1.2 trillion, retail trading revenue per million traded was $123.0, net deposits received from retail customers was $257.1 million and the number of traded retail accounts was 52,755. For the year ended December 31, 2008, customer trading volume was $1.5 trillion, retail trading revenue per million traded was $124.1, net deposits received from retail customers was $277.3 million and the number of traded retail accounts was 52,555.
Forexster Agreement
In July 2010, we entered into an Exclusive Marketing Agreement, or EMA, and related agreements, with Forexster Limited, or Forexster, pursuant to which we receive, subject to certain excluded customers and geographic regions, exclusive rights to use certain Forexster software in the field of forex trading and non-exclusive rights to use such trading services in the field of precious metals trading. The Forexster EMA expands the rights and obligations we had been provided under preexisting agreements with Forexster. Pursuant
59
Table of Contents
to the terms of the EMA, we paid Forexster an up-front, non-refundable $7.5 million and agreed to pay Forexster a monthly revenue share, during the term of the agreement, equal to a percentage of all gross revenues earned by us from use of the Forexster software, provided certain minimum net income thresholds are met. Our aggregate revenue share payment obligations under the EMA are capped at $60.0 million, or the Cap, if paid in-full on or before July 31, 2013 or $65.0 million, or the Additional Cap, if paid in-full on or before July 31, 2015. We are under no duty to pay the Cap or Additional Cap if not earned, but we may choose to prepay all or part of the Cap or Additional Cap without penalty. In the event the Additional Cap is not paid in-full on or before July 31, 2015, then all payment provisions of the EMA shall cease and the payment provisions of our pre-existing agreement with Forexster will resume. Under the preexisting agreement, we were required to pay Forexster fees based on trading volume and $0.1 million per month. In the event we pay the Cap in-full on or before July 31, 2013 or the Additional Cap in-full on or before July 31, 2015, as applicable, then we shall owe no further fees, costs or expenses to Forexster for use of the Forexster software and our rights to the Forexster software under the EMA shall continue for 100 years. Thereafter, the EMA shall automatically renew for additional twelve (12) month periods unless otherwise terminated by the parties.
Revenue
We generate revenue from trading revenue, other revenue, which primarily consists of commissions earned in our GAIN GTX institutional forex trading business, and interest income.
Trading revenue is our largest source of revenue and is generated in our retail forex business as follows:
| • | In our managed flow portfolio, which accounted for 76.7% of our customer trading volume for the year ended December 31, 2010, (i) for trades that are naturally hedged against an offsetting trade from another customer, we receive the entire retail bid/offer spread we offer our customers on the two offsetting transactions and (ii) in respect of the remaining customer trades, which we refer to as our net exposure, we receive the net gains, if any, generated through these transactions; and |
| • | In our offset flow portfolio, which accounted for 8.0% of our customer trading volume for the year ended December 31, 2010, we receive the difference between the retail bid/offer spread we offer our customers and the wholesale bid/offer spread we receive from the wholesale forex trading partners. |
For the year ending December 31, 2010, approximately 98.0% of our average daily retail trading volume was either naturally hedged or hedged by us with one of our wholesale forex trading partners.
We manage our net exposure by applying position and exposure limits established under our risk-management policies and by continuous, active monitoring by our traders. Based on our risk management policies and procedures, over time a portion of our net exposure may be offset and hedged with our wholesale forex trading. Though we do not actively initiate proprietary directional market positions in anticipation of future movements in the relative prices of the products we offer in the market, through our net exposure we are likely to have open positions in various products at any given time. In the event of unfavorable market movements, we may take a loss on such positions. Offset trades are hedged with our wholesale forex trading partners.
The remaining 15.3% of our customer trading volume for the year ended December 31, 2010 was generated by our GAIN GTX institutional forex trading business. Commissions generated by institutional trading are recorded under other revenue.
For the year ended December 31, 2009, approximately 98.6% of our average daily retail trading volume was either naturally hedged or hedged by us with one of our wholesale forex trading partners. In 2009, our managed flow portfolio accounted for 88.7% of our customer trading volume and our offset flow portfolio accounted for the remaining 11.3%. For the year ended December 31, 2008, approximately 98.8% of our average daily retail trading volume was either naturally hedged or hedged by us with one of our wholesale forex trading partners. In
60
Table of Contents
2008, our managed flow portfolio accounted for 87.0% of our customer trading volume and our offset flow portfolio accounted for the remaining 13.0%.
Trading revenue represented 99.1% of our total net revenue for the year ended December 31, 2010, 100.0% of our total net revenue for the year ended December 31, 2009 and 98.9% of our total net revenue for the year ended December 31, 2008.
We earn interest income from our funds and our customers’ funds on deposit with various financial institutions.
We believe that our customer trading volumes are driven by ten main factors. Six of these factors are broad external factors outside of our control which generally impact forex market trading, as well as our customer trading volumes, and include:
| • | changes in the financial strength of market participants; |
| • | economic and political conditions; |
| • | trends in business and finance; |
| • | changes in the supply, demand and volume of foreign currency transactions; |
| • | legislative changes; and |
| • | regulatory changes. |
Many of the above factors impact the volatility of foreign currency rates, which is in turn positively correlated with forex trading volume. Our customer trading volume is also affected by four other factors which we believe differentiate us from our competitors:
| • | the effectiveness of our sales activities; |
| • | the attractiveness of our Forex.com website; |
| • | the effectiveness of our customer service team; and |
| • | the effectiveness of our marketing activities. |
In order to increase customer trading volume, we focus our marketing and our customer service and education activities on attracting new customers, growing net deposits received from retail customers and increasing overall customer trading activity.
Trading revenue is recorded on a trade-date basis. Changes in net unrealized gains or losses are recorded under trading revenue on the Consolidated Statements of Operations and Comprehensive Income for a specified period of time. For the year ended December 31, 2010 and the year ended December 31, 2009, no single customer accounted for more than 3.0% of our trading volume for the period.
Other revenue is comprised of account management, transaction and performance fees related to customers who have assigned trading authority to Gain Capital Asset Management, or GCAM, inactivity and training fees charged to customer accounts, revenue from GAIN GTX, as well as other miscellaneous items. For the year ended December 31, 2010, other revenue was $3.4 million, which included GAIN GTX revenue of $2.0 million, and for the year ended December 31, 2009 and 2008, other revenue was $2.1 million and 2.4 million, respectively.
Net interest revenue consists primarily of the revenue generated by our cash and customer cash held by us at banks, money market funds and on deposit at our wholesale forex trading partners, less interest paid to customers on their net liquidating account value and interest expense on notes payable. A customer’s net liquidating account value equals cash on deposit plus the marking to market of open positions as of the measurement date.
61
Table of Contents
Our cash and customer cash is generally invested in money market funds which primarily invest in short-term U.S. government securities. Such deposits and investments earned interest at an average effective rate of approximately 0.1% for each of the years ended December 31, 2010 and 2009, and 1.5% for the year ended December 31, 2008. Interest paid to customers varies among customer accounts primarily due to the net liquidating value of a customer account, as well as interest promotions that we may make available from time to time. Interest income and interest expense are recorded when earned and incurred, respectively. Net interest expense was $1.7 million, $2.2 million and $0.3 million for the years ended December 31, 2010, 2009, 2008, respectively.
Operating Expenses
Employee Compensation and Benefits
Employee compensation and benefits includes salaries, bonuses, stock-based compensation, group insurance, contributions to benefit programs and other related employee costs. Compensation and benefits as a percentage of net revenue has decreased from 27.1% for the year ended December 31, 2009 to 24.0% for the year ended December 31, 2010, primarily due to an increase in net revenue for the year ended December 31, 2010 as compared to the same period in 2009. Compensation and benefits as a percentage of net revenue increased from 19.7% for the year ended December 31, 2008 to 27.1% for the year ended December 31, 2009, primarily due to a decrease in net revenue for the year ended December 31, 2009 as compared to the same period in 2008. Bonus costs, which are performance based and vary year to year, represented 21.4% of our employee compensation and benefits for the year ended December 31, 2010 compared to 18.1% for the year ended December 31, 2009 and 26.4% for the year ended December 31, 2008.
Selling and Marketing
Selling and marketing expense is primarily concentrated in online display and search engine advertising, and to a lesser extent print and television advertising. Our marketing strategy employs a combination of direct marketing and focused branding programs, with the goal of raising awareness of our retail forex trading Internet website, FOREX.com, and attracting customers in a cost-efficient manner. As part of our strategy to increase customer trading volume and attract new accounts, we have increased selling and marketing expense from $29.3 million for the year ended December 31, 2008 to $36.9 million for the year ended December 31, 2009 to $38.4 million for the year ended December 31, 2010 as we continue to invest in our global brand to increase trading volumes and net deposits received from retail customers.
Trading Expense and Commissions
Trading expense and commissions consists primarily of compensation paid to our white label partners and introducing brokers. We generally provide white label partners with the platform, systems and back-office services necessary for them to offer forex trading services to their customers. We also establish relationships with introducing brokers that identify and direct potential forex trading customers to us. White label partners and introducing brokers generally handle marketing and the other expenses associated with attracting the customers they direct to us. Accordingly, we do not incur any incremental sales and marketing expense in connection with trading revenue generated by customers provided through our white label partners and introducing brokers. We do, however, pay a portion of the forex trading revenue generated by the customers of our white label partners and introducing brokers to our white label partners and introducing broker partners and record this payment under trading expense. These costs are largely variable and fluctuate according to the trading volume produced by the customers directed to us. During the year ended December 31, 2010, we generated approximately 36.0% of our trading volume through customers introduced to us by white label partners and introducing brokers and paid approximately $25.6 million in total trading expenses and commissions compared to 34.6% of our total trading volume and a payment of $15.0 million in total trading expenses and commissions in the year ended December 31, 2009. The trading volume generated through customers introduced to us by white label partners
62
Table of Contents
and introducing brokers increased significantly in 2010 from the prior year, resulting in the $10.6 million increase in total trading expenses and commissions for the year ended December 31, 2010. In the year ended December 31, 2008, we generated approximately 32.7% of our trading volume through customers introduced to us by white label partners and introducing brokers and paid approximately $16.3 million in total trading expenses and commissions.
Other Expenses
Other expense categories separately disclosed in our results of operations include bank fees, depreciation and amortization, communications and data processing, occupancy and equipment, bad debt provision, professional fees and other miscellaneous expenses.
Change in Fair Value of Convertible Preferred Stock and Embedded Derivative and Adjusted Net Income
Our Convertible, Redeemable Preferred Stock Series A, Series B, Series C, Series D, and Series E, which was converted into common stock in connection with our initial public offering, contained a redemption feature which allowed the holders of our then outstanding preferred stock at any time on or after March 31, 2011, upon the written request of holders of at least a majority of the outstanding shares of preferred stock voting together as a single class, to require us to redeem all of the shares of preferred stock then outstanding. We determined that this redemption feature effectively provided such holders with an embedded option derivative meeting the definition of an “embedded derivative” pursuant to ASC 815, Derivatives and Hedging. Consequently, the embedded derivative was bifurcated and accounted for separately. Historically, in accordance with ASC 815, we adjusted the carrying value of the embedded derivative to the fair value of our company at each reporting date, based upon the Black-Scholes options pricing model, and reported the preferred stock embedded derivative liability on the Consolidated Statements of Financial Condition with change in fair value recorded in our Consolidated Statements of Operations and Comprehensive Income. This impacted our net income but did not affect our cash flow generation or operating performance. This accounting treatment caused our earnings to fluctuate, but in our view did not reflect the historical operating or potential future performance of our company. As noted above, in connection with the successful completion of our initial public offering in December 2010, all outstanding Convertible, Redeemable Preferred Stock was converted into Common Stock and the associated preferred stock embedded derivative liability was settled. As such, the change in fair value of the Convertible, Redeemable Preferred Stock recognized during 2010 was related to the change in value from January 1, 2010 through the effective date of the IPO on December 14, 2010. See “— Critical Accounting Policies and Estimates — Fair Value of Derivative Liabilities”.
Adjusted net income is a non-GAAP financial measure and represents our net income/(loss) excluding (i) the change in fair value of the embedded derivative in our preferred stock and (ii) the after-tax impact of purchased intangibles amortization. As noted above, the embedded derivative in our preferred stock was extinguished at the time of our IPO. Accordingly, beginning in 2011, we will no longer include an adjustment for changes in fair value of the embedded derivative and adjusted net income will represent our net income excluding only the after-tax impact of purchased intangibles amortization. This non-GAAP financial measure has certain limitations, including that it does not have a standardized meaning and, therefore, our definition may be different from similar non-GAAP financial measures used by other companies and/or analysts. Therefore, it may be more difficult to compare our financial performance to that of other companies.
63
Table of Contents
The following table provides a reconciliation of GAAP net income to adjusted net income, adjusted earnings per common share and to our adjusted effective tax rate (amounts in thousands unless otherwise stated).
| Year Ended December 31, | ||||||||||||
| 2010 | 2009 | 2008 | ||||||||||
| Net (loss)/income applicable to GAIN Capital Holdings, Inc. |
$ | 37,845 | $ | 27,994 | $ | 231,426 | ||||||
| Change in fair value of convertible, redeemable preferred stock embedded derivative |
(4,691 | ) | (1,687 | ) | (181,782 | ) | ||||||
| Add back of purchased intangible amortization, net of tax |
749 | — | — | |||||||||
| Adjusted net income |
$ | 33,903 | $ | 26,307 | $ | 49,644 | ||||||
| Adjusted earnings per common share(1) |
||||||||||||
| Basic |
$ | 7.72 | $ | 8.90 | $ | 17.05 | ||||||
| Diluted |
$ | 0.90 | $ | 0.71 | $ | 1.46 | ||||||
| Net revenue |
$ | 189,098 | $ | 153,319 | $ | 188,100 | ||||||
| Total expenses |
131,646 | 113,090 | (78,496 | ) | ||||||||
| Income before income tax expense and equity in earnings of equity method investment |
57,452 | 40,229 | 266,596 | |||||||||
| Change in fair value of convertible, redeemable preferred stock embedded derivative |
(4,691 | ) | (1,687 | ) | (181,782 | ) | ||||||
| Adjusted income before income tax expense and equity in earnings of equity method investment |
$ | 52,761 | $ | 38,542 | $ | 84,814 | ||||||
| Income tax expense |
$ | 20,009 | $ | 12,556 | $ | 34,977 | ||||||
| Adjusted effective tax rate |
37.9 | % | 32.6 | % | 41.2 | % | ||||||
| (1) | In connection with the successful completion of our initial public offering we performed a 2.29-for-1 stock split of our common stock effective immediately prior to the completion of the IPO as well as the settlement of the primary share offering which was allocated to all common shareholders on a pro-rata basis resulting in an effective stock split of 2.26-for-1. As a result, the earnings per common share and weighted average common shares outstanding used in computing earnings per share have been retroactively adjusted to reflect the effective stock split. |
We believe our reporting of adjusted net income and adjusted earnings per common share assists investors in evaluating our operating performance. We also believe adjusted net income and adjusted earnings per common share give investors a presentation of our operating performance in prior periods that more accurately reflects how we will be reporting our operating performance in future periods. However, adjusted net income and adjusted earnings per common share are not measures of financial performance calculated in accordance with GAAP and such measures should be considered in addition to, but not as a substitute for, other measures of our financial performance reported in accordance with GAAP, such as net income and earnings per common share.
Write-off of Initial Public Offering Costs
In December 2008, we wrote off $1.9 million of legal, audit, tax and other professional fees that were previously capitalized in anticipation of an initial public offering in 2008. As of December 31, 2009, we capitalized $1.7 million. During 2010, we capitalized an additional $2.1 million of legal, audit, tax and other professional fees in anticipation of our initial public offering. Upon successful completion of our initial public offering in December 2010, all capitalized amounts were subsequently offset by the net proceeds from the offering of $3.4 million and a reimbursement of $0.6 million from the underwriters of the initial public offering for our out of pocket costs.
64
Table of Contents
Public Company Expense
As a public company we are subject to the reporting requirements of the Securities Exchange Act of 1934, as amended, and the other rules and regulations of the SEC, as well as the requirements of the Sarbanes-Oxley Act of 2002 for the year ended December 31, 2011. These rules and regulations have increased our legal, accounting, auditing and other financial compliance costs. As such, we expect to incur significant expenditures in the near term to expand our systems and hire and train personnel to assist us in complying with these requirements.
General Market and Economic Conditions
In the past three years, the global market and general economic conditions have experienced volatility marked by a significant recession and declining equity markets. In the United States, market and economic conditions remain challenged. U.S. equity markets have more recently somewhat recovered, but challenging conditions in the credit markets remain and there is continued general uncertainty. In addition, over the past three years, U.S. economic activity was negatively impacted by declines in consumer spending, business investment and the downturn in the commercial and residential real estate markets. In Europe and Asia, market and economic conditions were also challenged by adverse economic developments. We believe that these conditions, together with deterioration in the overall economy and increased unemployment rates, impacted overall retail consumer spending, including the discretionary funds and trading patterns of our customer base. We also believe that forex trading prices and volumes have been impacted by the volatility created across the global markets. In the year ended December 31, 2010, we experienced periods of low and high volatility in reaction to various market conditions. For example, the recent fiscal crisis in Greece and other European Union nations resulted in elevated forex volatility levels across multiple markets, fluctuating prices and an increase in our customer trading activity during the year ended December 31, 2010. We are unable to predict the degree and duration of the impact of the current global market and general economic conditions on currency prices and on our business.
65
Table of Contents
Results of Operations
Year End Results
The following table sets forth our Results of Operations for the three years ended December 31, 2010 (dollars in thousands):
| Increase/(Decrease) | ||||||||||||||||||||||||||||||||
| Year Ended December 31, 2010 |
% of Net Revenue |
Year Ended December 31, 2009 |
% of Net Revenue |
Year Ended December 31, 2008 |
% of Net Revenue |
2010 Over 2009 |
2009 Over 2008 |
|||||||||||||||||||||||||
| (dollars in thousands) | ||||||||||||||||||||||||||||||||
| REVENUE: |
||||||||||||||||||||||||||||||||
| Trading revenue |
$ | 187,356 | 99.1 | % | $ | 153,375 | 100.0 | % | $ | 186,004 | 98.9 | % | 22.2 | % | (17.5 | )% | ||||||||||||||||
| Other revenue |
3,417 | 1.8 | % | 2,108 | 1.4 | % | 2,366 | 1.3 | % | 62.1 | % | (10.9 | )% | |||||||||||||||||||
| Total non-interest revenue |
190,773 | 100.9 | % | 155,483 | 101.4 | % | 188,370 | 100.1 | % | 22.7 | % | (17.5 | )% | |||||||||||||||||||
| Interest revenue |
364 | 0.2 | % | 292 | 0.2 | % | 3,635 | 1.9 | % | 24.7 | % | (92.0 | )% | |||||||||||||||||||
| Interest expense |
(2,039 | ) | (1.1 | )% | (2,456 | ) | (1.6 | )% | (3,905 | ) | (2.1 | )% | (17 | )% | (37.1 | )% | ||||||||||||||||
| Total net interest revenue / (expense) |
(1,675 | ) | (0.9 | )% | (2,164 | ) | (1.4 | )% | (270 | ) | (0.1 | )% | (22.5 | )% | 701.5 | % | ||||||||||||||||
| Net revenue |
189,098 | 100 | % | 153,319 | 100.0 | % | 188,100 | 100.0 | % | 23.3 | % | 18.5 | % | |||||||||||||||||||
| EXPENSES: |
||||||||||||||||||||||||||||||||
| Employee compensation and benefits |
45,439 | 24.0 | % | 41,503 | 27.1 | % | 37,024 | 19.7 | % | 9.5 | % | 12.12 | % | |||||||||||||||||||
| Selling and marketing |
38,395 | 20.3 | % | 36,875 | 24.1 | % | 29,312 | 15.6 | % | 4.1 | % | 25.8 | % | |||||||||||||||||||
| Trading expenses and commissions |
25,658 | 13.6 | % | 14,955 | 9.8 | % | 16,310 | 8.7 | % | 71.6 | % | (8.3 | )% | |||||||||||||||||||
| Bank fees |
4,239 | 2.2 | % | 4,466 | 2.9 | % | 3,754 | 2.0 | % | (5.1 | )% | 19.0 | % | |||||||||||||||||||
| Depreciation and amortization |
4,647 | 2.5 | % | 2,689 | 1.8 | % | 2,496 | 1.3 | % | 72.8 | % | 7.7 | % | |||||||||||||||||||
| Communications and data processing |
2,951 | 1.6 | % | 2,676 | 1.7 | % | 2,467 | 1.3 | % | 10.3 | % | 8.5 | % | |||||||||||||||||||
| Occupancy and equipment |
4,038 | 2.1 | % | 3,548 | 2.3 | % | 2,419 | 1.3 | % | 13.8 | % | 46.7 | % | |||||||||||||||||||
| Bad debt provision |
597 | 0.3 | % | 760 | 0.5 | % | 1,418 | 0.8 | % | (21.4 | )% | (46.4 | )% | |||||||||||||||||||
| Professional fees |
3,910 | 2.1 | % | 3,729 | 2.4 | % | 3,104 | 1.7 | % | 4.9 | % | 20.1 | % | |||||||||||||||||||
| Software expense |
1,845 | 1.0 | % | 1,132 | 0.7 | % | 888 | 0.5 | % | 63.0 | % | 27.5 | % | |||||||||||||||||||
| Professional dues and memberships |
275 | 0.1 | % | 698 | 0.5 | % | 773 | 0.4 | % | (60.6 | %) | (9.7 | )% | |||||||||||||||||||
| Write-off of deferred initial public offering costs |
— | 0.0 | % | — | 0.0 | % | 1,897 | 1.0 | % | 0.0 | (100.0 | )% | ||||||||||||||||||||
| Change in fair value of convertible preferred stock embedded derivative |
(4,691 | ) | (2.5 | )% | (1,687 | ) | (1.1 | )% | (181,782 | ) | (96.6 | )% | 178.1 | % | (99.1 | )% | ||||||||||||||||
| Other |
4,343 | 2.3 | % | 1,746 | 1.1 | % | 1,424 | 0.8 | % | 148.8 | % | 22.6 | % | |||||||||||||||||||
| Total |
$ | 131,646 | 69.6 | % | $ | 113,090 | 73.8 | % | $ | (78,496 | ) | (41.7 | )% | 16.4 | % | (244.1 | )% | |||||||||||||||
| INCOME BEFORE INCOME TAX EXPENSE AND EQUITY IN EARNINGS OF EQUITY METHOD INVESTMENT |
$ | 57,452 | 30.4 | % | $ | 40,229 | 26.2 | % | $ | 266,596 | 141.7 | % | 42.8 | % | (84.9 | )% | ||||||||||||||||
| Income tax expense |
20,009 | 10.6 | % | 12,556 | 8.2 | % | 34,977 | 18.6 | % | 59.4 | % | (64.1 | )% | |||||||||||||||||||
| Equity in earnings of equity method investment |
— | 0.0 | % | — | 0.0 | % | (214 | ) | (0.1 | )% | 0.0 | % | (100.0 | )% | ||||||||||||||||||
| NET INCOME |
37,443 | 19.8 | % | 27,673 | 18.0 | % | 231,405 | 123.0 | % | 35.3 | % | (88.0 | )% | |||||||||||||||||||
| Net loss applicable to noncontrolling interest |
(402 | ) | (0.2 | )% | (321 | ) | (0.2 | )% | (21 | ) | 0.0 | % | 25.2 | % | 1,428.6 | % | ||||||||||||||||
| Net income applicable to GAIN Capital Holdings, Inc. |
$ | 37,845 | 20.0 | % | $ | 27,994 | 18.3 | % | $ | 231,426 | 123.0 | % | 35.2 | % | (87.9 | )% | ||||||||||||||||
66
Table of Contents
Year Ended December 31, 2010 Compared to Year Ended December 31, 2009
Revenue
Our total net revenue increased $35.8 million, or 23.3%, to $189.1 million for the year ended December 31, 2010, compared to $153.3 million for the year ended December 31, 2009. Trading revenue increased $34.0 million to $187.4 million for the year ended December 31, 2010, compared to $153.4 million for the year ended December 31, 2009. The increase in trading revenue was primarily due to an increase in customer trading volume for the year ended December 31, 2010 of $317.4 billion, or 25.5%, to $1.6 trillion, compared to $1,246.7 billion for the year ended December 31, 2009.
Retail trading revenue per million traded increased by $18.5, or 15.0%, to $141.5 compared to $123.0 for the year ended December 31, 2009 and net deposits received from retail customers increased for the year ended December 31, 2010 by $10.7 million, or 4.2%, to $267.8 million compared to $257.1 million for the year ended December 31, 2009.
Our other revenue increased $1.3 million to $3.4 million for the year ended December 31, 2010 from $2.1 million for the year ended December 31, 2009, primarily due to the increase in revenue generated from GAIN GTX, our institutional trading platform, which we launched in March 2010.
Our net interest expense decreased $0.5 million to $1.7 million for the year ended December 31, 2010 compared to $2.2 million for the year ended December 31, 2009 primarily due to a lower average outstanding term loan balance and decrease in the interest rate on our term loan during the second half of the year.
Operating Expenses
Our total expenses increased $18.5 million to a net expense of $131.6 million for the year ended December 31, 2010, including a gain of $4.7 million relating to the change in fair value of our preferred stock embedded derivative, compared to $113.1 million for the year ended December 31, 2009. Other changes in our expenses were primarily due to a $10.7 million increase in trading expenses and commissions, a $3.9 million increase in employee compensation and benefits, a $2.6 million increase in other expenses, a $1.9 million increase in depreciation and amortization, a $1.5 million increase in selling and marketing, a $0.7 million increase in software expense and a $0.5 million increase in occupancy and equipment offset by a $3.0 million increase in the fair value of the preferred stock embedded derivative and a decrease in professional dues and memberships of $0.4 million.
Employee Compensation and Benefits
Employee compensation and benefits expenses increased $3.9 million, or 9.4%, to $45.4 million for the year ended December 31, 2010, from $41.5 million for the year ended December 31, 2009. Salaries and benefits (excluding bonus and stock compensation) increased $1.8 million primarily due to an increase in headcount in our international locations to support our international expansion during 2010. Bonus expense increased $2.2 million primarily due to the increase in operating results of our business for the year ended December 31, 2010 as compared to December 31, 2009.
Selling and Marketing Expense
Selling and marketing expenses increased $1.5 million, or 4.1%, to $38.4 million for the year ended December 31, 2010 from $36.9 million for the year ended December 31, 2009. Increased sales and marketing expenses were primarily due to increased advertising and promotional fees and credits.
67
Table of Contents
Trading Expense and Commissions
Trading expenses and commissions increased $10.7 million to $25.7 million for the year ended December 31, 2010 compared to $15.0 million for the year ended December 31, 2009, primarily due to an increase in introducing broker commissions. The increase in introducing broker commissions is due to an increase in customer trading volume directed to us from our white label partners and introducing brokers of $131.1 billion to $562.5 billion for the year ended December 31, 2010, compared to $431.4 billion for the year ended December 31, 2009. This expense is largely variable and is directly associated with customer trading volume directed to us from our white label partners and introducing brokers.
Other Expenses
Other expense increased $2.6 million to $4.3 million for the year ended December 31, 2010 compared to $1.7 million for the year ended December 31, 2009, primarily due to an increase in fines and penalties, and litigation expense of $1.1 million and $0.5 million respectively, offset by a decrease in a loss on disposal of property and equipment of $0.3 million. The increase in fines and penalties and litigation expense was due to the legal costs incurred and the fine paid in connection with settlement of an NFA complaint in 2010.
Depreciation and amortization expense increased $1.9 million to $4.6 million for the year ended December 31, 2010 from $2.7 million for the year ended December 31, 2009. This increase was primarily due to amortization of $1.2 million for intangible assets purchased during the year.
Occupancy and equipment increased $0.5 million to $4.0 million for the year ended December 31, 2010 from $3.5 million for the year ended December 31, 2009. The increase was primarily due to an increase in rent and facilities expense of $0.6 million which resulted from our move to our new corporate headquarters and our international expansion during 2010.
Professional fee expense increased $0.2 million to $3.9 million for the year ended December 31, 2010 compared to $3.7 million for the year ended December 31, 2009 primarily due to a $0.1 million increase in consulting fees, $0.3 million in temporary labor and $0.2 million in legal expense, offset by a decrease in audit expenses of $0.3 million. These increased expenses were required to support the overall growth of our business.
Communications and data processing expenses increased $0.3 million. This increase was required to support the overall growth of our business.
The change in fair value of the preferred stock embedded derivative resulted in a gain of $4.7 million for the year ended December 31, 2010 compared to a gain of $1.7 million for the year ended December 31, 2009. The increase was due to the decrease in the preferred stock embedded derivative from December 31, 2009. In connection with our initial public offering, all of our previously outstanding preferred stock converted to common stock and we settled our preferred stock embedded derivative liability.
Income Taxes
Income taxes increased $7.4 million to $20.0 million for the year ended December 31, 2010 from $12.6 million for the year ended December 31, 2009. Our effective tax rate was 34.8% for year ended December 31, 2010 and 31.2% for the year ended December 31, 2009. Our adjusted effective tax rate was 37.9% for the year ended December 31, 2010 compared to 32.6% for the year ended December 31, 2009. Adjusted effective tax rate, a non-GAAP financial measure, has certain limitations as it does not have a standardized meaning and, thus, our definition may be different from similar non-GAAP financial measures used by other companies and/or analysts and may differ from period to period. Thus, it may be more difficult to compare our financial performance to that of other companies. The difference between our effective tax rate and adjusted effective tax rate is due to the fact that our income tax expense is not affected by the change in fair value of our preferred stock embedded derivative.
68
Table of Contents
Year Ended December 31, 2009 Compared to Year Ended December 31, 2008
Revenue
Our total net revenue decreased $34.8 million, or 18.5%, to $153.3 million for the year ended December 31, 2009, compared to $188.1 million for the year ended December 31, 2008. Trading revenue decreased $32.6 million to $153.4 million for the year ended December 31, 2009, compared to $186.0 million for the year ended December 31, 2008. The decrease in trading revenue was primarily due to a decrease in customer trading volume for the year ended December 31, 2009 of $251.9 billion, or 16.8%, to $1,246.7 billion, compared to $1,498.6 billion for the year ended December 31, 2008. We believe our net revenue and trading revenue declines were primarily the result of our termination of our service offerings and trading services in China as of December 31, 2008 and global economic conditions. For the year ended December 31, 2009 net revenue associated with customers residing in China was immaterial compared to $24.4 million for the year ended December 31, 2008.
Retail trading revenue per million traded decreased by $1.1, or 0.9%, to $123.0 and net deposits received from customers decreased for the year ended December 31, 2009 by $20.2 million, or 7.3%, to $257.1 million compared to $277.3 million for the year ended December 31, 2008. We do not believe that our retail trading revenue per million traded results were materially impacted by our termination of our business with customers residing in China.
Our other revenue decreased $0.3 million to $2.1 million for the year ended December 31, 2009 from $2.4 million for the year ended December 31, 2008.
Our net interest expense increased $1.9 million to $2.2 million for the year ended December 31, 2009 compared to $0.3 million for the year ended December 31, 2008 due to a decrease in the average effective interest rate earned on our deposits and investments which was 0.1% for the year ended December 31, 2009 compared to 1.5% for the year ended December 31, 2008.
Operating Expenses
Our total expenses increased $191.6 million to a net expense of $113.1 million for the year ended December 31, 2009, including a gain of $1.7 million relating to the change in fair value of our preferred stock embedded derivative, compared to a net gain of $78.5 million, including a net gain of $181.8 million relating to the change in fair value of our preferred stock embedded derivative, for the year ended December 31, 2008. Other changes in our expenses were primarily due to a $4.5 million increase in employee compensation and benefits, a $7.6 million increase in selling and marketing, a $1.1 million increase in occupancy and equipment offset by a $1.9 million decrease in write-off of deferred public offering costs, and a $1.3 million decrease in trading expenses. The remaining increase of $0.6 million was due to changes in each of our remaining expense categories with no individual category increasing or decreasing more than $0.7 million. For the year ended December 31, 2009, there were no material direct expenses associated with our operations in China compared to $5.9 million for the year ended December 31, 2008.
Employee Compensation and Benefits
Employee compensation and benefits expenses increased $4.5 million, or 12.2%, to $41.5 million for the year ended December 31, 2009, from $37.0 million for the year ended December 31, 2008. Salaries and benefits (excluding bonus and stock compensation) increased $5.6 million primarily due to increases in head count from 319 at December 31, 2008 to 378 at December 31, 2009. The increase in the head count was required to support the overall growth in our business and continued international expansion. Stock compensation expense increased $1.1 million due to grants distributed in 2009. Bonus expense decreased $2.3 million primarily due to the decrease in operating results of our business for the year ended December 31, 2009 as compared to December 31,
69
Table of Contents
2008. For the year ended December 31, 2009, there were no material direct employee compensation and benefits expenses associated with our operations in China compared to $1.4 million for the year ended December 31, 2008.
Selling and Marketing Expense
Selling and marketing expenses increased $7.6 million, or 26.0%, to $36.9 million for the year ended December 31, 2009 from $29.3 million for the year ended December 31, 2008. Increased sales and marketing expenses were primarily due to increased online, search engine, consulting, print and television advertising. For the year ended December 31, 2009, there were no direct selling and marketing expenses associated with our operations in China compared to $3.1 million for the year ended December 31, 2008.
Trading Expense and Commissions
Trading expenses and commissions decreased $1.3 million, or 7.8%, to $15.0 million for the year ended December 31, 2009 compared to $16.3 million for the year ended December 31, 2008, primarily due to an decrease in customer trading volume directed to us from our white label partners and introducing brokers of $58.0 billion to $431.4 billion for the year ended December 31, 2009, compared to $489.4 billion for the year ended December 31, 2008. This expense is largely variable and is directly associated with customer trading volume directed to us from our white label partners and introducing brokers. For the year ended December 31, 2009, there were no direct trading expenses and commissions from our operations in China compared to $0.7 million for the year ended December 31, 2008.
Other Expenses
Other expense increased $0.3 million to $1.7 million for the year ended December 31, 2009 compared to $1.4 million for the year ended December 31, 2008, primarily due to an increase on the loss on disposal of property and equipment of $0.3 million, an increase in litigation expenses of $0.2 million, and an increase in office supplies expense of $0.1 million. These increases were offset by a decrease in travel expenses of $0.3 million. These increased expenses were required to support the overall growth of our business.
Professional fee expense increased $0.6 million to $3.7 million for the year ended December 31, 2009 compared to $3.1 million for the year ended December 31, 2008 due to a $0.3 million increase in professional fees, $0.3 million in tax services, $0.9 million increase in consulting expense and $0.2 million increase in audit fees, offset by a decrease in legal expenses of $1.1 million. These increased expenses were required to support the overall growth of our business.
Bank fees increased $0.7 million to $4.5 million for the year ended December 31, 2009 from $3.8 million for the year ended December 31, 2008. Increased bank fees were primarily due to an increase in credit card processing fees as a result of an increase of $30.1 million in the total net deposits received from customers funded through the use of customer credit cards.
Communications and data processing expenses increased $0.2 million, occupancy and equipment expenses increased $1.1 million, and depreciation and amortization expense increased $0.2 million. These increased expenses were required to support the overall growth of our business.
The change in fair value of the preferred stock embedded derivative amounted to a gain of $1.7 million for the year ended December 31, 2009 compared to a gain of $181.8 million for the year ended December 31, 2008. We have determined that the convertible feature in our preferred stock meets the definition of an “embedded derivative” in accordance with ASC 815. Based on the Black-Scholes options pricing model, the embedded derivative is recorded at fair value and reported in the preferred stock embedded derivative liability on the Consolidated Statements of Financial Condition with change in fair value recorded to our Consolidated Statements of Operations and Comprehensive Income.
70
Table of Contents
Income Taxes
Income taxes decreased $22.4 million to $12.6 million for the year ended December 31, 2009 from $35.0 million for the year ended December 31, 2008. Our effective tax rate was 31.2% for year ended December 31, 2009 and 13.1% for the year ended December 31, 2008. Our adjusted effective tax rate was 32.6% for the year ended December 31, 2009 compared to 41.2% for the year ended December 31, 2008. This non-GAAP financial measure has certain limitations in that it does not have a standardized meaning and, thus, our definition may be different from similar non-GAAP financial measures used by other companies and/or analysts and may differ from period to period. Thus, it may be more difficult to compare our financial performance to that of other companies. For the year ended December 31, 2009, there was no income tax expense related to our operations in China compared to $7.5 million for the year ended December 31, 2008. The difference between our effective tax rate and adjusted effective tax rate is due to the fact that our income tax expense is not affected by the change in fair value of our preferred stock embedded derivative.
Liquidity and Capital Resources
We have historically financed our liquidity and capital needs primarily through the use of funds generated from operations, the issuance of preferred stock and access to secured lines of credit for general corporate purposes. We plan to finance our future operating liquidity and regulatory capital needs from our operations. Although we have no current plans to do so, we may issue equity or debt securities or enter into secured lines of credit from time to time. We expect that our capital expenditures for the next 12 months will be consistent with our historical annual spend.
We primarily hold and invest our cash at various financial institutions and in various investments, including cash held at banks, deposits at our wholesale forex trading partners and money market funds which invest in short-term U.S. government securities. In general, we believe all of our investments and deposits are of high credit quality and we have more than adequate liquidity to conduct our businesses.
As a holding company, nearly all of our funds generated from operations are generated by our operating subsidiaries. Historically, we have accessed these funds through receipt of dividends from these subsidiaries. Some of our operating subsidiaries are subject to requirements of various regulatory bodies, including the CFTC and NFA in the United States, the Financial Services Authority in the United Kingdom, the Financial Services Agency in Japan, the Securities and Futures Commission in Hong Kong, the Australian Securities and Investments Commission, and the Cayman Islands Monetary Authority in the Cayman Islands, relating to liquidity and capital standards, which limit funds available for the payment of dividends to the holding company. As a result, we may be unable to access funds which are generated by our operating subsidiaries when we need them. In accordance with CFTC regulation 1.12 and NFA Financial Requirements Section 1, a 20.0% decrease in GAIN Capital Group, LLC’s net capital and a 30.0% decrease in excess net capital due to a planned equity withdrawal requires regulatory notification and/or approval.
71
Table of Contents
The following table illustrates the minimum regulatory capital our subsidiaries were required to maintain as of December 31, 2010 and the actual amounts of capital that were maintained (amounts in millions):
| Entity Name |
Minimum Regulatory Capital Requirements |
Capital Levels Maintained |
Excess Net Capital |
|||||||||
| GAIN Capital Group, LLC |
$ | 26.40 | $ | 76.30 | $ | 49.88 | ||||||
| GAIN Capital Securities, Inc. |
$ | 0.05 | $ | 0.52 | $ | 0.47 | ||||||
| GAIN Capital-Forex.com U.K., Ltd. |
$ | 2.67 | $ | 22.83 | $ | 20.16 | ||||||
| Forex.com Japan Co., Ltd. |
$ | 3.97 | $ | 11.18 | $ | 7.21 | ||||||
| GAIN Capital Forex.com Australia, Pty. Ltd. |
$ | 0.22 | $ | 0.30 | $ | 0.09 | ||||||
| GAIN Capital-Forex.com Hong Kong, Ltd. |
$ | 0.39 | $ | 0.98 | $ | 0.59 | ||||||
| GAIN Global Markets, Inc. |
$ | 0.10 | $ | 0.44 | $ | 0.35 | ||||||
Our futures commission merchant and forex dealer subsidiary, GAIN Capital Group, LLC, is subject to the Commodity Futures Trading Commission Net Capital Rule (Rule 1.17) and NFA Financial Requirements Sections 11 and 12. Under applicable provisions of these rules, GAIN Capital Group, LLC is required to maintain adjusted net capital of $20.0 million plus 5.0% of the total payables to customers over $10.0 million, as these terms are defined under applicable rules. Net capital represents our current assets less total liabilities as defined by CFTC Rule 1.17. Our current assets consist primarily of cash and cash equivalents reported on our balance sheet as cash, receivables from brokers and trading securities which primarily invest in short-term U.S. government securities. Our total liabilities include payables to customers, accrued expenses, accounts payable, sales and marketing expense payable, introducing broker fees payable and other liabilities. From net capital we take certain percentage deductions against assets held based on factors required by the Commodity Exchange Act to calculate adjusted net capital. Our net capital and adjusted net capital changes from day to day. As of December 31, 2010, GAIN Capital Group, LLC had net capital of approximately $80.4 million, adjusted net capital of $76.3 million and net capital requirements of $26.4 million. As of December 31, 2010, our excess net capital was $78.7 million. We believe that we currently have sufficient capital to satisfy these on-going minimum net capital requirements.
We are required to maintain cash on deposit with our wholesale forex trading partners in order to conduct our hedging activities. As of December 31, 2010, we posted $102.0 million in cash with wholesale forex trading partners, of which $26.6 million was required as collateral pursuant to our agreements for holding spot foreign exchange positions with such institutions, and the remaining $75.4 million represented available cash in excess of required collateral. As of December 31, 2010, total client assets were $256.7 million. Total client assets represent amounts due to clients, including deposits and unrealized gains or losses arising from open positions.
We expect to incur increased costs as a result of having publicly traded common stock. Prior to our initial public offering in December 2010, we were not subject to the reporting requirements of the Exchange Act, or the other rules and regulations of the SEC or any securities exchange relating to public companies. We are working to enhance our financial and management control systems, including our corporate control, internal audit, disclosure controls and procedures and financial reporting and accounting systems, to manage our growth as a public company. We also anticipate that we will incur costs associated with corporate governance requirements, including requirements under the Sarbanes-Oxley Act of 2002, as amended, as well as rules implemented by the SEC and the New York Stock Exchange, or NYSE. We anticipate annual legal and financial compliance expenditures of approximately $3.0 million in connection with our having publicly traded common stock. We believe that we currently have sufficient capital to satisfy these additional expenses for at least the next 12 months.
72
Table of Contents
Credit Facility
We have a $52.5 million term loan and a $20.0 million revolving line of credit through a loan and security agreement with Silicon Valley Bank and JPMorgan Chase Bank. On June 16, 2010, we entered into a sixth loan modification agreement related to the term loan. The loan modification reduced the prime rate margin on the term loan from 0.75% to 0.5% and reduced the prime rate margin on the revolving credit line from 0.75% to 0% and amended the revolving line maturity date from June 17, 2010 to June 16, 2011. On March 29, 2011, we entered into a seventh loan modification agreement related to the term loan. The loan modification extended the time allowed for us to provide monthly consolidated and consolidating balance sheet and income statement information, as well as a certificate confirming compliance with the financial covenants under the term loan during the month, to 45 days after month end, rather than 30 days after month end. In addition, the loan modification changed the debt service coverage financial covenant to provide that we are required to comply with such covenant at the end of each fiscal quarter based on our EBITDA for the twelve-month period as of the last day of each quarter. Previously, we were required to comply with this covenant based on our EBITDA for the relevant fiscal quarter. The loan modification also changed the required debt service coverage ratio to a minimum of 3.0 to 1.0 from 2.0 to 1.0.
There was no amount due on the revolving credit line at December 31, 2010. The term loan is payable in 20 quarterly installments of principal and the payments commenced on October 1, 2007. Interest is paid monthly and is based upon the prime rate of interest plus 0.5%. Under the terms of the term loan, when the total funded debt drops below earnings before income tax expense, interest expense, and depreciation and amortization expense, or EBITDA, the interest rate will decline by 0.5%. The interest rate as of December 31, 2010 was 3.75%. The term loan is secured by certain of our assets, a pledge of our membership interests in our wholly-owned subsidiary GAIN Holdings, LLC and a guarantee by GAIN Holdings, LLC. The term loan maturity date is July 1, 2012. Interest for the revolving line of credit accrues at a floating per annum rate equal to the prime rate of interest plus 0.5%. The amount of availability under the revolving line of credit is determined by subtracting from $20.0 million the amount outstanding under the revolving line of credit. The revolving line of credit maturity date is June 16, 2011. We intend to renew the revolving line of credit upon maturity. As of December 31, 2010, we had $18.4 million outstanding under the term loan and no amounts were outstanding under the revolving line of credit. In accordance with the provisions of our term loan and revolving line of credit as outlined in the loan and security agreement and subsequent modifications, we are required to adhere to various financial, regulatory, operational and reporting covenants. As of December 31, 2010 and during the entire term of such loan, we were in compliance with such covenants.
Cash Flow
The following table sets forth a summary of our cash flow for the three years ended December 31, 2010, amounts in thousands:
| Year Ended December 31, | ||||||||||||
| 2010 | 2009 | 2008 | ||||||||||
| Cash provided by operating activities |
$ | 89,304 | $ | 62,127 | $ | 69,320 | ||||||
| Cash used for investing activities |
(12,421 | ) | (5,003 | ) | (3,792 | ) | ||||||
| Cash provided by / (used for) financing activities |
(8,880 | ) | (11,788 | ) | 12,062 | |||||||
| Effect of exchange rate changes on cash and cash equivalents |
(6,317 | ) | 757 | (53 | ) | |||||||
| Net increase in cash and cash equivalents |
$ | 61,686 | $ | 46,093 | $ | 77,537 | ||||||
The primary drivers of our cash flow provided by operating activities are net deposits received from customers, amounts posted as collateral with wholesale forex trading partners and amounts paid to fund the operations of our business.
Net deposits received from retail customers represent customer deposits less withdrawals for a given period. These amounts correlate to our customers’ ability to place additional trades, which potentially increases our
73
Table of Contents
trading volume, and include the impact of realized gains and losses on customer accounts. Net deposits received from retail customers increase when we receive initial deposits from new retail customers or additional deposits from existing retail customers. Net deposits received from retail customers decrease when a retail customer withdraws funds partially or in full. To some extent our net deposit activity is influenced by our customers’ trading positions as our customers may be required to post additional funds to maintain open positions or may choose to withdraw excess funds on open positions. We consider net deposits received from retail customers to be a key measurement of the success of the strategies that we implement to grow our business.
Amounts posted as collateral with brokers are classified on our balance sheet as receivables from brokers and represent collateral required to be deposited with our wholesale forex trading partners in order for us to hold spot foreign exchange positions, as well as the and cash posted with wholesale forex trading partners in excess of required collateral. We post cash with wholesale forex trading partners in excess of required collateral to allow for adverse currency price moves relative to our positions, which would raise our level of required collateral. We receive interest on amounts we have posted as collateral with wholesale forex trading partners. The amount of collateral required by our wholesale forex trading partners in the future will be commensurate with the amount of spot foreign exchange positions that they hold on our behalf. The amount of cash posted with wholesale forex trading partners in excess of required collateral is discretionary and may increase or decrease in future periods as we determine the most efficient uses of our cash.
Our largest operating expenses are employee compensation and benefits, selling and marketing, trading expenses and commissions and income taxes. Employee compensation and benefits include salaries, bonuses and other employee related costs. Selling and marketing expenses include online and search engine advertising and print and television advertising. Trading expenses and commissions consist primarily of compensation paid to our white label partners and introducing brokers. Income taxes are variable based on our taxable income. Other cash expense categories include interest expense on notes payable, bank fees, communications and data processing, occupancy and equipment, professional fees and other miscellaneous expenses. We believe our operating expenses will increase in future periods in order to support the overall growth of our business and to support the requirements associated with being a publicly traded company.
Unrealized gains and losses on cash positions revalued at prevailing foreign currency exchange rates are included in trading revenue but have no direct impact on cash flow from operations. Gains and losses become realized and impact cash flow from operations when customer transactions are liquidated. To some extent, however, our net deposit activity is influenced by unrealized gains and losses because our customers’ trading positions are impacted by unrealized gains and losses and our customers may be required to post additional funds to maintain open positions or may choose to withdraw excess funds on open positions.
In December 2008, we terminated our service offerings and trading services to residents of China. Management estimates that cash flow from operations related to our service offerings and trading services to residents of China was $6.0 million for the year ended December 31, 2008.
The embedded derivative is recorded at fair value and changes in the fair value are reflected in other expenses, but the change in fair value of preferred stock embedded derivative has no direct impact on cash flow from operations. The redemption feature enabled the holders of the preferred stock to elect a net cash settlement on the date of redemption. The convertible, redeemable preferred stock embedded derivative was settled in shares of common stock upon the successful completion of our initial public offering in December 2010, resulting in a gain of $4.7 million recognized for the year ended December 31, 2010. The conversion into common stock and the gain of $4.7 million had no impact on cash flow from operations.
Year Ended December 31, 2010 Compared to Year Ended December 31, 2009
Cash provided by operating activities was $89.3 million for the year ended December 31, 2010, compared to $62.1 million for the year ended December 31, 2009. The primary reasons for the increase in cash provided by
74
Table of Contents
operating activities were an increase in net income $9.8 million, a $17.5 million increase in payables to customers, a $13.1 million increase in income taxes payable, an $8.5 million increase in short term investments, a $5.0 million increase in trading securities and increases of $2.3 million, $2.2 million, and $2.0 million in accrued compensation and benefits, payables to brokers, dealers, FCMs and other regulated entities and depreciation and amortization, respectively. These increases were offset by an increase in unrealized loss on foreign exchange transactions with liquidity providers of $28.4 million, an increase in prepaid assets of $7.5 million and an increase in the change in fair value of embedded derivative of $3.0 million.
Cash used in investing activities was $12.4 million for the year ended December 31, 2010, compared to $5.0 million for the year ended December 31, 2009. The increase in cash used in investing activities was primarily due to the acquisition of customer and marketing lists from MG Financial, LLC and Capital Market Services, LLC.
Cash used for financing activities was $8.9 million for the year ended December 31, 2010, compared to cash used for financing activities of $11.8 million for the year ended December 31, 2009. The decrease in cash used was primarily due to the increase in deferred initial public offering costs of $3.0 million, proceeds from the initial public offering, net of underwriting discounts and other direct costs of $0.2 million, and an increase in the proceeds from the exercise of stock options of $0.1 million, offset by the purchase of the remaining noncontrolling interest in Forex.com Japan Ltd for $0.4 million.
Capital Expenditures
Capital expenditures were $3.9 million for the year ended December 31, 2010 compared to $4.1 million for the year ended December 31, 2009. Capital expenditures for the years ended December 31, 2010 and 2009 were primarily related to the development of our trading platforms, websites and new corporate headquarters, which included furniture and technology infrastructure to support our facility.
Year Ended December 31, 2009 Compared to Year Ended December 31, 2008
Cash provided by operating activities was $62.1 million for the year ended December 31, 2009, compared to $69.3 million for the year ended December 31, 2008. Net income decreased $203.7 million for the year ended December 31, 2009 compared to the year ended December 31, 2008 primarily due to a $180.1 million decrease of the change in fair value of preferred stock embedded derivative. The primary reasons for the decrease in cash provided by operating activities was a $48.7 million decrease in receivables from brokers, a $16.8 million decrease in net taxes receivable and payable, offset by a $67.8 million increase in amounts payable to customers, a $20.6 million net increase in investments, a $9.5 million increase in unrealized forex losses and a $1.1 million increase in stock compensation expense.
Cash used in investing activities was $5.0 million for the year ended December 31, 2009, compared to $3.8 million for the year ended December 31, 2008. The increase in cash used in investing activities is primarily due to the acquisition of an additional 19% ownership interest in Fortune Capital Co., Ltd. (now known as Forex.com Japan Co., Ltd.) for $0.9 million and an increase in capital expenditures of $1.4 million.
Cash used for financing activities was $11.8 million for the year ended December 31, 2009, compared to cash provided by financing activities of $12.1 million for the year ended December 31, 2008. The increase in cash used was primarily due to the net proceeds of $116.8 million in 2008 from our Series E preferred stock offering, offset by $94.2 million related to repurchase of common and preferred shares in 2008, with no comparable transactions in 2009.
Capital Expenditures
Capital expenditures were $4.1 million for the year ended December 31, 2009 compared to $2.7 million for the year ended December 31, 2008. Capital expenditures for the years ended December 31, 2009 and 2008 were primarily related to the development of our trading platforms, websites, and new corporate headquarters (in 2009), which included furniture and technology infrastructure to support our facility.
75
Table of Contents
Off-Balance-Sheet Arrangements
At December 31, 2010, 2009 and 2008, we did not have any relationships with unconsolidated entities or financial partnerships, such as entities often referred to as structured finance or special purpose entities, which would have been established for the purpose of facilitating off-balance sheet arrangements or other contractually narrow or limited purposes.
Contractual Obligations
The following table sets forth our contractual obligations as of December 31, 2010 (amounts in thousands):
| Total | Less than 1 Year |
1-3 Years |
3-5 Years |
More than 5 Years |
||||||||||||||||
| Long-term Debt |
$ | 18,375 | $ | 10,500 | $ | 7,875 | $ | — | $ | — | ||||||||||
| Capital Leases |
330 | 330 | — | — | — | |||||||||||||||
| Vendor Obligations |
7,846 | 5,412 | 2,432 | 2 | — | |||||||||||||||
| Operating Leases |
18,690 | 1,884 | 2,531 | 2,338 | 11,937 | |||||||||||||||
| Total |
$ | 45,241 | $ | 18,126 | $ | 12,838 | $ | 2,440 | $ | 11,937 | ||||||||||
Critical Accounting Policies
Our consolidated financial statements and accompanying notes have been prepared in accordance with GAAP applied on a consistent basis. The preparation of these financial statements requires us to make certain estimates and assumptions that affect the reported amounts of assets and liabilities, disclosure of contingent assets and liabilities at the date of the financial statements and the reported amounts of revenue and expenses during the periods presented. We evaluate these estimates and assumptions on an ongoing basis. We base our estimates on the information currently available to us and on various other assumptions that we believe to be reasonable under the circumstances. Actual results may differ from these estimates under different assumptions or conditions.
An accounting policy is deemed to be critical if it requires an accounting estimate to be made based on assumptions about matters that are highly uncertain at the time the estimate is made; if different estimates reasonably could have been used; or if changes in the estimate that are reasonably likely to occur periodically could materially impact the financial statements. While our significant accounting policies are described in more detail in the notes to our consolidated financial statements included in this annual report, we believe the following accounting policies to be critical to the estimates and assumptions used in the preparation of our consolidated financial statements.
Revenue Recognition
Foreign exchange contracts generally involve the exchange of two currencies at market rates on a specified date; spot contracts usually require the exchange of currencies to occur within two business days of the contract date. Customer transactions and related revenue and expenses are recorded on a trade-date basis.
Gains or losses are realized when customer transactions are liquidated. Unrealized gains or losses on cash positions revalued at prevailing foreign currency exchange rates (the difference between contract price and market price) at the date of the statement of financial condition are included in Receivables from brokers, Payables to customers and Payables to brokers, dealers, FCMs and other regulated entities on the Consolidated Statements of Financial Condition. Changes in net unrealized gains or losses are recorded in Trading revenue on the Consolidated Statements of Operations and Comprehensive Income.
We earn fees on customer-managed foreign exchange accounts. Fees are comprised of account management, transaction fees and performance fees, all payable monthly. We reported managed account fees of $117,735 in
76
Table of Contents
Other revenue for the year ended December 31, 2010, with $20,430 from GAIN Capital Group, LLC and $97,305 from GCAM, LLC. We reported managed account fees of $55,070 in Other revenue for the year ended December 31, 2009, with $11,693 from GAIN Capital Group, LLC and $43,376 from GCAM, LLC. We reported managed account fees of $26,097 in Other revenue for the year ended December 31, 2008, with $8,942 from GAIN Capital Group, LLC and $17,155 from GCAM, LLC.
Allowance for Doubtful Accounts
We must make estimates of the uncollectibility of accounts receivable. The allowance for doubtful accounts, which is netted against other assets on our Consolidated Statements of Financial Condition, totaled approximately $0.1 million at December 31, 2010 and $0.3 million at December 31, 2009. We record an increase in the allowance for doubtful accounts when the prospect of collecting a specific account balance becomes doubtful. Management specifically analyzes accounts receivable and historical bad debt experience when evaluating the adequacy of the allowance for doubtful accounts. Should any of these factors change, the estimates made by management will also change, which could affect the level of our future provision for doubtful accounts.
Specifically, if the financial condition of our customers were to deteriorate, affecting their ability to make payments, an additional provision for doubtful accounts may be required, and such provision may be material.
Income Taxes
GAIN Capital Holdings, Inc. prepares and files the income taxes due as the consolidated legal entity. We account for income taxes in accordance with Financial Accounting Standards Board Accounting Standards Codification, or ASC, 740-10, Income Taxes. Income tax expenses are provided using the asset and liability method, under which deferred tax assets and liabilities are determined based upon the temporary differences between the consolidated financial statements and the income tax basis, using currently enacted tax rates. The effect on deferred tax assets and liabilities of a change in tax rates is recognized in our Consolidated Statements of Operations and Comprehensive Income in the period of enactment. We routinely evaluate all deferred tax assets to determine the likelihood of their realization.
We use estimates in determining income tax positions under ASC 740-10-25, Income Taxes. Although we believe that our tax estimates are reasonable, the ultimate tax determination involves significant judgment and is subject to audit by tax authorities in the ordinary course of business.
To the extent we are required to pay amounts in excess of our reserves, our effective income tax rate in a given financial statement period could be materially affected. An unfavorable tax settlement could require use of our cash and result in an increase in our effective income tax rate in the period of resolution.
Impairment of Long-Lived Assets
In accordance with ASC 360-10, Property, Plant and Equipment, we periodically evaluate the carrying value of long-lived assets when events and circumstances warrant such review. The carrying value of a long-lived asset is considered impaired when the anticipated undiscounted cash flow from such an asset is separately identifiable and is less than the carrying value. In that event, a loss is recognized in the amount by which the carrying value exceeds the fair market value of the long-lived asset.
Goodwill and Intangible Assets
ASC 350-30, General Intangibles, requires purchased intangible assets other than goodwill to be amortized over their useful lives unless the useful lives are determined to be indefinite. If the assets are determined to have a finite life in the future, we will amortize the carrying value over the remaining useful life at that time. In accordance with ASC 350-30, our URLs (foreignexchange.com and forex.com) are indefinite life intangible
77
Table of Contents
assets and are, therefore, not amortized. We compare the recorded value of the indefinite life intangible assets to their fair value on an annual basis and whenever circumstances arise that indicates that an impairment may have occurred.
Accrued Compensation
We make significant estimates in determining our quarterly and annual accrued non-share based compensation. A significant portion of our employee incentive compensation programs are discretionary. Each quarter and year-end we determine the amount of discretionary cash bonus pools. We also review compensation throughout the year to determine how overall performance compares to management’s expectations. We take these and other factors, including historical performance and our performance relative to budget, into account in reviewing accrued discretionary cash compensation estimates quarterly and adjusting accrual rates as appropriate. Changes to these factors could cause a material increase or decrease in the amount of compensation expense that we report in a particular period.
Fair Value of Derivative Liabilities
ASC 815-10, Derivatives and Hedging Activities, as amended, establishes accounting and reporting standards for derivative instruments. We determined that the redemption feature contained in our preferred stock, which allowed the holders of our preferred stock at any time on or after March 31, 2011, upon the written request of at least a majority of the outstanding shares of preferred stock voting together as a single class, to require us to redeem all of the shares of preferred stock then outstanding, was an embedded derivative required to be bifurcated and accounted for separately. The embedded derivative is recorded at fair value and changes in the fair value are reflected in earnings.
The embedded derivative was recorded at fair value and reported in convertible preferred stock embedded derivative on the Consolidated Statements of Financial Condition with changes in fair value recorded in our Consolidated Statements of Operations and Comprehensive Income. As a result of the successful completion of our initial public offering, all shares of the redeemable, convertible preferred stock were converted to common stock, and as of December 31, 2010 we were no longer required to record a liability relating to the embedded derivative.
Share Based Payments
ASC 718-10, Compensation — Stock Compensation, requires measurement of share based payment arrangements at fair value and recognition of compensation cost over the service period, net of estimated forfeitures. The fair value of restricted stock units is determined based on the number of units granted and the grant date fair value of GAIN Capital Holding, Inc.’s common stock.
We measure the fair value of stock options on the date of grant using the Black-Scholes option pricing model which requires the use of several estimates, including:
| • | The volatility of our stock price; |
| • | The expected life of the option; |
| • | Risk free interest rates; and |
| • | Expected dividend yield. |
The use of different assumptions in the Black-Scholes pricing model would result in different amounts of stock-based compensation expense. Furthermore, if different assumptions are used in future periods, stock-based compensation expense could be materially impacted in the future.
78
Table of Contents
The expected volatility was calculated based upon the volatility of public companies, in similar industries or financial service companies. The average risk free rate is based upon the five year bond rate converted to a continuously compounded interest rate.
Recent Accounting Pronouncements
In December 2010, the Financial Accounting Standards Board, or FASB, issued Accounting Standards Update, or ASU 2010-29, Disclosure of Supplementary Pro Forma Information for Business Combinations. This new standard impacts the pro forma reporting requirements for public companies that enter into business combinations that are material on an individual or aggregate basis. This new standard is effective for us beginning in the first quarter of 2011, however early adoption is permitted. We do not expect the adoption of ASU 2010-29 to have a material impact on our consolidated financial statements.
In December 2010, the FASB issued ASU No. 2010-28, Intangibles — Goodwill and Other (ASC 350): When to Perform Step 2 of the Goodwill Impairment Test for Reporting Units with Zero or Negative Carrying Amounts — a consensus of the FASB Emerging Issues Task Force, which modifies Step 1 of the goodwill impairment test for reporting units with zero or negative carrying amounts. This amendment requires an entity to perform Step 2 of the goodwill impairment test if it is more likely than not that a goodwill impairment exists and to consider whether there are any adverse qualitative factors indicating that an impairment may exist. ASU No. 2010-28 is effective for fiscal years, and interim periods within those years, beginning after December 15, 2010. The adoption of ASU No. 2010-28 did not have a material impact on our consolidated financial statements.
In July 2010, the FASB issued ASU 2010-20, Disclosures about the Credit Quality of Financing Receivables and the Allowance for Credit Losses, which requires significant new disclosures about the allowance for credit losses and the credit quality of financing receivables. The requirements are intended to enhance transparency regarding credit losses and the credit quality of loan and lease receivables. Under this statement, allowance for credit losses and fair value are to be disclosed by portfolio segment, while credit quality information, impaired financing receivables and nonaccrual status are to be presented by class of financing receivable. The disclosures are to be presented at the level of disaggregation that management uses when assessing and monitoring the portfolio’s risk and performance. The adoption of ASU 2010-20 did not have a material impact on our consolidated financial statements.
In February 2010, the FASB issued ASU 2010-09, Subsequent Events (“ASU 2010-09”). ASU 2010-09 amends ASC 855, Subsequent Events, by requiring less disclosure regarding subsequent events. ASU 2010-09 changes the criteria for determining whether an entity would evaluate subsequent events through the date that financial statements are issued or when they are available to be issued We are still required to evaluate subsequent events through the date that the financial statements are issued. ASU 2010-09 was effective for our interim period ended June 30, 2010. The adoption of ASU 2010-09 did not have a material impact on our consolidated financial statements.
In January 2010, the FASB issued ASU, 2010-6, Improving Disclosures About Fair Value Measurements (“ASU 2010-06”). ASU 2010-6 provides new disclosures and clarifications of existing disclosures and is effective for interim and annual reporting periods beginning after December 15, 2009, except for disclosures about purchases, sales, issuances, and settlements in the roll-forward activity in Level 3 fair value measurements. Those disclosures are effective for fiscal years beginning after December 15, 2010, and for interim periods within those fiscal years. Therefore, ASU 2010—06 was effective for our fiscal year beginning January 1, 2010. The adoption of ASU 2010—06 did not have a material impact on our consolidated financial statements.
In June 2009, the FASB issued Accounting Standards Codification, or ASC, 810, Consolidation, which changes how a reporting entity determines when an entity that is insufficiently capitalized or is not controlled through voting (or similar rights) should be consolidated. The determination of whether a reporting entity is required to consolidate another entity is based on, among other things, the other entity’s purpose and design and the
79
Table of Contents
reporting entity’s ability to direct the activities of the other entity that most significantly impact the other entity’s economic performance. Our adoption of ASC 810 on January 1, 2010 did not have a material impact on our consolidated financial statements.
| ITEM 7A. | QUANTITATIVE AND QUALITATIVE DISCLOSURE ABOUT MARKET RISK |
Interest Rate Risk
Interest rate risk arises from the possibility that changes in interest rates will impact our financial statements. Our net interest revenue is directly affected by the spread between the short-term interest rates we pay our customers on their balances and the short-term interest rates we earn from re-investing their cash. These spreads can widen or narrow when interest rates change. In addition, a portion of our interest income relates to customer balances on which we do not pay interest and, therefore, is directly affected by the absolute level of short-term interest rates. As a result, a portion of our interest income will decline if interest rates fall, regardless of the interest rate spreads that effect the remaining portion of our interest income. Short-term interest rates are highly sensitive to factors that are beyond our control, including general economic conditions and the policies of various governmental and regulatory authorities. Our cash and customer cash held is held in cash and cash equivalents including: cash at banks, deposits at wholesale forex trading partners and in money market funds which invest in short-term U.S. government securities. The interest rates earned on these deposits and investments affects our interest revenue. In addition, the interest we pay on our notes payable is based on the prime rate plus interest of 0.5%. We estimate that as of December 31, 2010, an immediate 100 basis point increase in short-term interest rates would result in approximately $3.7 million more in annual pretax income.
Foreign Currency Exposures
Currency risk arises from the possibility that fluctuations in foreign exchange rates will impact the value of our assets denominated in foreign currencies as well as our earnings due to the translation of our balance sheet and income statement from local currencies to United States dollars. We currently have limited exposure to currency risk and as of December 31, 2010, 82.1% of our assets, 85.1% of our liabilities, 99.2% of our revenue, and 84.5% of our expenses were denominated in U.S. dollars. We currently do not take proprietary directional positions to mitigate our exposure to foreign currency exchange rates. However, as a result of our hedging activities, we are likely to have open positions in various currencies at any given time. For the year ended December 31, 2010, approximately 98.0% of our average daily trading volume, on any given day, was either naturally hedged, where one of our customers executing a trade in a currency is offset by a trade taken by another customer, or hedged by us with a third-party financial institution. As we implement our growth strategies, our exposure to foreign currency exchange rates may increase and we may consider entering into hedging transactions to mitigate our exposure to foreign currency exchange rates. These hedging transactions may not be successful.
Credit Risk
Our trading operations require a commitment of our capital and involve risk of loss because of the potential that a customer’s losses may exceed the amount of cash in their account. As a result, we require that each trade must be collateralized in accordance with our margin policies described below. Each customer is required to have minimum funds in their account for opening positions, which we refer to as the initial margin, and for maintaining positions, which we refer to as maintenance margin, depending on the currency pair being traded. Margin requirements are expressed as a percentage of the customer’s total position in that currency, and the customer’s total margin requirement is based on the aggregate margin requirement across all of the positions that a customer holds at any one moment in time. Each net position in a particular currency pair is margined separately. Accordingly, we do not net across different currency pairs, thereby following a fairly conservative margin policy. Our systems automatically monitor each customer’s margin requirements in real time, and we confirm that each of our customers has sufficient cash collateral in his or her account before we execute their trades. If at any point in time a customer has “negative equity” because his or her trading position does not
80
Table of Contents
comply with the applicable margin requirement, the position may be automatically partially or entirely liquidated in accordance with our margin policies and procedures. This policy protects both us and the customer. The incidence of negative equity in customer accounts has been immaterial to our operations in the three years ended December 31, 2010, which we believe was attributable to our real-time margining and liquidation policies and procedures. Our margin and liquidation policies are set forth in our customer agreements.
We are also exposed to potential credit risk relating to the counterparties with which we hedge our trades and the financial institutions with which we deposit cash. We mitigate these risks by transacting with several of the largest financial institutions in the market. In the event that our access to one or more financial institutions becomes limited, our ability to hedge may be impaired.
Market Risk-Management
We are exposed to market risk in connection with our retail trading activities. Because we act as counterparty to our retail customers’ transactions, we are exposed to risk on each trade that the market price of our position will decline. Accordingly, accurate and efficient management of our net exposure is a high priority, and as such we have developed both automated and manual policies and procedures to manage our exposure. These risk-management policies and procedures are established and reviewed regularly by the risk committee of our board of directors. Our risk-management policies require quantitative analyses by currency pair, as well as assessment of a range of market inputs, including trade size, dealing rate, customer margin and market liquidity. Our risk-management procedures require our team of senior traders to monitor risk exposure on a continuous basis and update senior management both informally over the course of the trading day and formally through intraday and end of day reporting. A key component of our approach to managing market risk is that we do not take proprietary directional market positions and therefore do not initiate market positions for our own account in anticipation of future movements in the relative prices of products we offer. To facilitate our risk-management activities, we maintain levels of capital in excess of those currently required under applicable regulations. As of December 31, 2010, we maintained capital levels of $116.7 million, which represented approximately 3.5 times the capital we were required to hold.
Cash Liquidity Risk
In normal conditions, our market making business of providing online forex trading and related services is self financing as we generate sufficient cash flows to pay our expenses as they become due. As a result, we generally do not face the risk that we will be unable to raise cash quickly enough to meet our payment obligations as they arise. Our cash flows, however, are influenced by customer trading volume, currency volatility and liquidity in foreign currencies pairs in which we have positions. These factors are directly impacted by domestic and international market and economic conditions that are beyond our control. In an effort to manage this risk, we have secured a substantial liquidity pool by establishing trading relationships with nine financial institutions. These relationships provide us with sufficient access to liquidity to allow us to consistently execute significant trades in varying market conditions at the notional amounts our customers’ desire by providing us with as much as 50:1 leverage on the notional amounts of our available collateral we have on deposit with such financial institutions. We generally maintain collateral on deposit, which includes our funds and our customers’ funds. Collateral on deposit ranged from $77.5 million to $100.6 million in the aggregate, for the year ended December 31, 2010.
Additionally, we do not actively initiate proprietary positions in anticipation of future movements in the relative prices of currencies, referred to as proprietary directional market positions. However, as a result of our hedging activities, we are likely to have open positions in various currencies at any given time. Similarly, we do not take proprietary directional positions with respect to the future movements in the relative prices of CFDs and gold and silver spot markets. As a market maker, we stand ready to make simultaneous bids/offers for transactions in any of our 48 currency pairs, six metals or 12 CFD. For the year ended December 31, 2010 approximately 98.0% of our average daily trading volume was either naturally hedged, where one of our customers executing a trade in a
81
Table of Contents
currency is offset by a trade taken by another customer, or hedged by us with a third-party financial institution. We treat trade requests from our customers in two distinct ways, we immediately hedge the trade through the execution of an equal and offsetting trade with our wholesale forex trading partners or we direct the trade into our managed flow portfolio. We believe the combination of our managed flow portfolio and immediately offset trades provides a certain level of protection from cash liquidity risk.
However, our forex trading operations require a commitment of capital and involve risks of losses due to the potential failure of our customers to perform their obligations under these transactions which heighten our exposure to cash liquidity risk. To reduce this risk, we have created a margin policy which allows customers to leverage their account balances by trading notional amounts that may be significantly larger than their cash balances. We mark our customers’ accounts to market each time a currency price in their portfolio changes. While our margin policy allows us to closely monitor each customer’s exposure and thereby reduces our exposure to cash liquidity risk, it does not guarantee our ability to eliminate negative customer account balances prior to an adverse currency price change.
Operational Risk
Our operations are subject to broad and various risks resulting from technological interruptions, failures, or capacity constraints in addition to risks involving human error or misconduct. Regarding technological risks, we are heavily dependent on the capacity and reliability of the computer and communications systems supporting our operations. We have established a program to monitor our computer systems, platforms and related technologies and to address issues that arise promptly. We have also established disaster recovery facilities in strategic locations to ensure that we can continue to operate with limited interruptions in the event that our primary systems are damaged. As with our technological systems, we have established policies and procedures designed to monitor and prevent both human errors, such as clerical mistakes and incorrectly placed trades, as well as human misconduct, such as unauthorized trading, fraud, and negligence. In addition we seek to mitigate the impact of any operational issues by maintaining insurance coverage for various contingencies.
Regulatory Capital Risk
Various domestic and foreign government bodies and self-regulatory organizations responsible for overseeing our business activities require that we maintain specified minimum levels of regulatory capital in our operating subsidiaries. If not properly monitored or adjusted, our regulatory capital levels could fall below the required minimum amounts set by our regulators, which could expose us to various sanctions ranging from fines and censure to imposing partial or complete restrictions on our ability to conduct business. To mitigate this risk, we continuously evaluate the levels of regulatory capital at each of our operating subsidiaries and adjust the amounts of regulatory capital in each operating subsidiary as necessary to ensure compliance with all regulatory capital requirements. These may increase or decrease as required by regulatory authorities from time to time. We also maintain excess regulatory capital to provide liquidity during periods of unusual or unforeseen market volatility, and we intend to continue to follow this policy. In addition, we monitor regulatory development regarding capital requirements and are prepared for increases in the required minimum levels of regulatory capital that may occur from time to time in the future.
Regulatory Risk
We operate in a highly regulated industry and are subject to the risk of sanctions from U.S., federal and state, and international authorities if we fail to comply adequately with regulatory requirements. Failure to comply with applicable regulations could result in financial, structural, and operational penalties. Our authority to conduct business could be suspended or revoked. In addition, efforts to comply with applicable regulations may increase our costs and, or limit our ability to pursue certain business opportunities. Federal and state regulations significantly limit the types of activities in which we may engage. U.S. and international legislative and regulatory authorities occasionally consider changing these regulations.
82
Table of Contents
| ITEM 8. | FINANCIAL STATEMENTS AND SUPPLEMENTARY DATA |
Our consolidated financial statements are included in pages F-1 to F-43 of this annual report on Form 10-K.
| ITEM 9. | CHANGES IN AND DISAGREEMENTS WITH ACCOUNTANTS ON ACCOUNTING AND FINANCIAL DISCLOSURE |
None.
| ITEM 9A. | CONTROLS AND PROCEDURES |
Evaluation of disclosure controls and procedures
We have established and maintained disclosure controls and procedures (as defined in Rules 13a – 15(c) and 15d – 15(e) under the Exchange Act) that are designed to ensure that material information relating to GAIN and GAIN subsidiaries required to be disclosed in our reports under the Securities Exchange Act of 1934, as amended, or the Exchange Act, is recorded, processed, summarized and reported within the time periods specified in the SEC’s rules and forms, and that such information is accumulated and communicated to our management, including our Chief Executive Officer, or CEO, and Chief Financial Officer, or CFO, as appropriate to allow timely decisions regarding required disclosure. In designing and evaluating the disclosure controls and procedures, management recognized that any controls and procedures, no matter how well designed and operated, can provide only reasonable assurance of achieving the desired control objectives, and management necessarily was required to apply its judgment in evaluating the cost-benefit relationship of possible controls and procedures.
In connection with the preparation of this Annual Report on Form 10-K, an evaluation under the supervision and with the participation of our management, including the CEO and CFO, of the effectiveness of the design and operation of our disclosure controls and procedures (as defined in Rules 13a – 15(e) and 15d – 15(e) under the Exchange Act) was performed as of December 31, 2010. Based on this evaluation, our CEO and CFO concluded that our disclosure controls and procedures were effective as of December 31, 2010.
This annual report does not include a report of management’s assessment regarding internal control over financial reporting or an attestation report of the Company’s independent registered public accounting firm due to a transition period established by rules of the SEC for newly public companies.
Changes in internal controls
No changes in our internal control over financial reporting (as defined in Rules 13a-15(f) and 15d-15(f) under the Exchange Act) occurred during the fiscal quarter ended December 31, 2010 that have materially affected, or are reasonably likely to materially affect, our internal control over financial reporting.
| ITEM 9B. | OTHER INFORMATION |
On March 25, 2011, we amended our code of business conduct and ethics, or the Code, to remove a section of the Code concerning the establishment of forex trading accounts with the Company by directors, officers and other employees. The Company’s employee manual also contains provisions addressing this matter and the Company’s management believes that this subject is more appropriately addressed in the Company’s employee manual and other policies and procedures, including guidelines established for our directors, rather than in the Code.
83
Table of Contents
PART III
| ITEM 10. | DIRECTORS AND EXECUTIVE OFFICERS OF THE REGISTRANT |
Information required to be included in this item is incorporated by reference from our definitive proxy statement to be filed pursuant to Regulation 14A, which we intend to file within 120 days of the end of our fiscal year.
| ITEM 11. | EXECUTIVE COMPENSATION |
Information required to be included in this item is incorporated by reference from our definitive proxy statement to be filed pursuant to Regulation 14A, which we intend to file within 120 days of the end of our fiscal year.
The Code applies to all of our employees, directors and officers, including our principal executive officer, principal financial officer and principal accounting officer, or persons performing similar functions. We make the Code available free of charge through our website which is located at www.gaincapital.com. We intend to disclose any amendments to, or waivers from, the Code that are required to be publicly disclosed pursuant to rules of the SEC and the New York Stock Exchange in filings with the SEC and by posting such information on our website.
| ITEM 12. | SECURITY OWNERSHIP OF CERTAIN BENEFICIAL OWNERS AND MANAGEMENT AND RELATED STOCKHOLDER MATTERS |
Information required to be included in this item is incorporated by reference from our proxy statement to be filed pursuant to Regulation 14A, which we intend to file within 120 days of the end of our fiscal year.
| ITEM 13. | CERTAIN RELATIONSHIPS AND RELATED TRANSACTIONS, AND DIRECTOR INDEPENDENCE |
Information required to be included in this item is incorporated by reference from our proxy statement to be filed pursuant to Regulation 14A, which we intend to file within 120 days of the end of our fiscal year.
| ITEM 14. | PRINCIPAL ACCOUNTING FEES AND SERVICES |
Information to be included in this item is incorporated by reference from our proxy statement to be filed pursuant to Regulation 14A, which we intend to file within 120 days of the end of our fiscal year.
84
Table of Contents
PART IV
| ITEM 15. | EXHIBITS AND FINANCIAL STATEMENT SCHEDULES |
Financial Statements and Schedules:
1. Financial Statements
The following financial statements and reports of independent registered public accounting firm are included herein:
| Reports of Independent Registered Public Accounting Firm |
F-2 | |||
| Consolidated Statements of Financial Condition as of December 31, 2010 and 2009 |
F-3 | |||
| Consolidated Statements of Operations and Comprehensive Income for the Years Ended December 31, 2010, 2009 and 2008 |
F-4 | |||
| Consolidated Statements of Shareholders’ Equity / (Deficit) for the Years Ended December 31, 2010, 2009 and 2008 |
F-5 | |||
| Consolidated Statements of Cash Flows for the Years Ended December 31, 2010, 2009 and 2008 |
F-6 | |||
| Notes to Consolidated Financial Statements |
F-8 |
2. Financial Statement Schedules
The following supplemental schedule is filed herewith:
| Financial Statement Schedule: |
||||
| Schedule 1 — Condensed Financial Information of GAIN Capital Holdings, Inc. (Parent Company Only) as of December 31, 2010 and 2009 and for each of the three years in the period ended December 31, 2010 |
F-39 |
Schedules other than those listed above have been omitted because they are not applicable or the required information is included in the financial statements or notes thereto.
85
Table of Contents
| Exhibit |
Description | |
| 3.1 | Third Amended and Restated Certificate of Incorporation (Incorporated by reference to Exhibit 3.3 of the Registrant’s Registration Statement on Form S-1, as amended, No. 333-161632). | |
| 3.2 | Amended and Restated By-laws (Incorporated by reference to Exhibit 3.2 of the Registrant’s Registration Statement on Form S-1, as amended, No. 333-161632). | |
| 4.1 | Specimen Certificate evidencing shares of common stock (Incorporated by reference to Exhibit 4.1 of the Registrant’s Registration Statement on Form S-1, as amended, No. 333-161632). | |
| 4.2 | Investor Rights Agreement, dated January 11, 2008, by and among the Company, the Investors and the Founding Stockholder, as defined therein (Incorporated by reference to Exhibit 4.2 of the Registrant’s Registration Statement on Form S-1, as amended, No. 333-161632). | |
| 10.1 | 2010 Omnibus Incentive Compensation Plan (Incorporated by reference to Exhibit 10.2 of the Registrant’s Registration Statement on Form S-1, as amended, No. 333-161632).** | |
| 10.2 | 2011 Employee Stock Purchase Plan (Incorporated by reference to Exhibit 10.3 of the Registrant’s Registration Statement on Form S-1, as amended, No. 333-161632).** | |
| 10.3 | Nonqualified Deferred Compensation Plan.* ** | |
| 10.4 | Form of Incentive Stock Option Agreement (Incorporated by reference to Exhibit 10.4 of the Registrant’s Registration Statement on Form S-1, as amended, No. 333-161632). ** | |
| 10.5 | Form of Nonqualified Stock Option Agreement (Incorporated by reference to Exhibit 10.5 of the Registrant’s Registration Statement on Form S-1, as amended, No. 333-161632). ** | |
| 10.6 | Form of Restricted Stock Agreement (Incorporated by reference to Exhibit 10.6 of the Registrant’s Registration Statement on Form S-1, as amended, No. 333-161632). ** | |
| 10.7 | Form of Restricted Stock Unit Agreement (Time Vesting) (Incorporated by reference to Exhibit 10.7 of the Registrant’s Registration Statement on Form S-1, as amended, No. 333-161632).** | |
| 10.8 | Form of Restricted Stock Unit Agreement (Performance Vesting) (Incorporated by reference to Exhibit 10.8 of the Registrant’s Registration Statement on Form S-1, as amended, No. 333-161632).** | |
| 10.9 | Form of Indemnification Agreement with the Company’s Non-Employee Directors (Incorporated by reference to Exhibit 10.10 of the Registrant’s Registration Statement on Form S-1, as amended, No. 333-161632).** | |
| 10.10 | Amended and Restated 2006 Equity Compensation Plan, effective December 31, 2006 (Incorporated by reference to Exhibit 10.60 of the Registrant’s Registration Statement on Form S-1, as amended, No. 333-161632).** | |
| 10.11 | Amendment No. 2007-1 to the GAIN Capital Holdings, Inc. 2006 Equity Compensation Plan (Incorporated by reference to Exhibit 10.61 of the Registrant’s Registration Statement on Form S-1, as amended, No. 333-161632).** | |
| 10.12 | Amendment No. 2008-1 to the GAIN Capital Holdings, Inc. 2006 Equity Compensation Plan (Incorporated by reference to Exhibit 10.62 of the Registrant’s Registration Statement on Form S-1, as amended, No. 333-161632).** | |
| 10.32 | Amendment No. 2010-1 to the GAIN Capital Holdings, Inc. 2006 Equity Compensation Plan (Incorporated by reference to Exhibit 10.63 of the Registrant’s Registration Statement on Form S-1, as amended, No. 333-161632).** | |
86
Table of Contents
| Exhibit |
Description | |
| 10.14 | Loan and Security Agreement, dated as of March 29, 2006, by and among GAIN Capital Holdings, Inc., Silicon Valley Bank and JPMorgan Chase Bank, N.A. (Incorporated by reference to Exhibit 10.11 of the Registrant’s Registration Statement on Form S-1, as amended, No. 333-161632). | |
| 10.15 | Pledge and Security Agreement, dated as of March 29, 2006, by and among GAIN Capital Holdings, Inc., Silicon Valley Bank and JPMorgan Chase Bank, N.A. (Incorporated by reference to Exhibit 10.12 of the Registrant’s Registration Statement on Form S-1, as amended, No. 333-161632). | |
| 10.16 | Unconditional Guaranty, dated as of March 29, 2006, by and among GAIN Holdings, LLC, Silicon Valley Bank and JPMorgan Chase Bank, N.A. (Incorporated by reference to Exhibit 10.13 of the Registrant’s Registration Statement on Form S-1, as amended, No. 333-161632). | |
| 10.17 | First Loan Modification Agreement, dated as of October 16, 2006, by and among GAIN Capital Holdings, Inc., Silicon Valley Bank and JPMorgan Chase Bank, N.A. (Incorporated by reference to Exhibit 10.14 of the Registrant’s Registration Statement on Form S-1, as amended, No. 333-161632). | |
| 10.18 | Second Loan Modification Agreement, dated as of March 20, 2007, by and among GAIN Capital Holdings, Inc., Silicon Valley Bank and JP Chase Bank, N.A. (Incorporated by reference to Exhibit 10.15 of the Registrant’s Registration Statement on Form S-1, as amended, No. 333-161632). | |
| 10.19 | Third Loan Modification Agreement, dated June 6, 2007, by and among GAIN Capital Holdings, Inc., Silicon Valley Bank and JPMorgan Chase Bank, N.A. (Incorporated by reference to Exhibit 10.16 of the Registrant’s Registration Statement on Form S-1, as amended, No. 333-161632). | |
| 10.20 | Fourth Loan Modification Agreement, dated as of March 18, 2008, by and among GAIN Capital Holdings, Inc., Silicon Valley Bank and JPMorgan Chase Bank, N.A. (Incorporated by reference to Exhibit 10.173.2 of the Registrant’s Registration Statement on Form S-1, as amended, No. 333-161632). | |
| 10.21 | Fifth Loan Modification Agreement, dated as of June 18, 2009 and effective as of March 17, 2009, by and among GAIN Capital Holdings, Inc., Silicon Valley Bank and JPMorgan Chase Bank, N.A. (Incorporated by reference to Exhibit 10.18 of the Registrant’s Registration Statement on Form S-1, as amended, No. 333-161632). | |
| 10.22 | Sixth Loan Modification Agreement, dated June 16, 2010, by and among GAIN Capital Holdings, Inc., Silicon Valley Bank and JPMorgan Chase Bank, N.A. (Incorporated by reference to Exhibit 10.50 of the Registrant’s Registration Statement on Form S-1, as amended, No. 333-161632). | |
| 10.23 | Seventh Loan Modification Agreement, dated March 29, 2011, by and among GAIN Capital Holdings, Inc., Silicon Valley Bank and JPMorgan Chase Bank, N.A.* | |
| 10.24 | Separation Agreement, dated as of January 11, 2008, by and between Mark Galant and GAIN Capital Holdings, Inc. (Incorporated by reference to Exhibit 10.23 of the Registrant’s Registration Statement on Form S-1, as amended, No. 333-161632). | |
| 10.25† | FX Prime Brokerage Master Agreement, dated as of December 6, 2006, by and between GAIN Capital Group, LLC and The Royal Bank of Scotland, plc. (Incorporated by reference to Exhibit 10.24 of the Registrant’s Registration Statement on Form S-1, as amended, No. 333-161632). | |
| 10.26† | FX Prime Brokerage Agreement, dated as of July 8, 2005, by and between UBS AG and GAIN Capital, Inc. (Incorporated by reference to Exhibit 10.25 of the Registrant’s Registration Statement on Form S-1, as amended, No. 333-161632). | |
| 10.27† | Foreign Exchange Prime Brokerage Agency Agreement, dated as of July 12, 2006, by and between GAIN Capital Group, LLC and The Royal Bank of Scotland, plc. (Incorporated by reference to Exhibit 10.26 of the Registrant’s Registration Statement on Form S-1, as amended, No. 333-161632). | |
| 10.28† | Foreign Exchange Prime Brokerage Agreement, dated October 18, 2005, by and between Deutsche Bank AG, London Branch and GCAM, LLC (Incorporated by reference to Exhibit 10.27 of the Registrant’s Registration Statement on Form S-1, as amended, No. 333-161632). | |
87
Table of Contents
| Exhibit |
Description | |
| 10.29 | Amendment to Foreign Exchange Prime Brokerage Agreement, dated January 26, 2006, by and between Deutsche Bank AG, London Branch and GCAM, LLC (Incorporated by reference to Exhibit 10.28 of the Registrant’s Registration Statement on Form S-1, as amended, No. 333-161632). | |
| 10.30 | Form of ISDA Master Agreement, 1992 edition (Incorporated by reference to Exhibit 10.29 of the Registrant’s Registration Statement on Form S-1, as amended, No. 333-161632). | |
| 10.31 | Form of Introducing Broker Agreement (Incorporated by reference to Exhibit 10.30 of the Registrant’s Registration Statement on Form S-1, as amended, No. 333-161632). | |
| 10.32 | Form of Agreement for White Label Services (Incorporated by reference to Exhibit 10.31 of the Registrant’s Registration Statement on Form S-1, as amended, No. 333-161632). | |
| 10.33 | Sublease, dated March 31, 2005, by and between GAIN Capital, Inc. and NUI Corporation (Incorporated by reference to Exhibit 10.32 of the Registrant’s Registration Statement on Form S-1, as amended, No. 333-161632). | |
| 10.34 | Agreement of Sublease, dated November 14, 2005, by and between Mellon Investor Services LLC and GAIN Capital, Inc. (Incorporated by reference to Exhibit 10.33 of the Registrant’s Registration Statement on Form S-1, as amended, No. 333-161632). | |
| 10.35 | First Amendment to Sublease, dated July 20, 2006, by and between Mellon Investor Services LLC and GAIN Capital, Inc. (Incorporated by reference to Exhibit 10.34 of the Registrant’s Registration Statement on Form S-1, as amended, No. 333-161632). | |
| 10.36 | Services Agreement, dated February 1, 2008, by and between GAIN Capital Group, LLC and Scivantage, Inc. (Incorporated by reference to Exhibit 10.35 of the Registrant’s Registration Statement on Form S-1, as amended, No. 333-161632). | |
| 10.37 | Schedule 1(b) to Services Agreement, dated February 15, 2009, by and between GAIN Capital Group, LLC and Scivantage, Inc. (Incorporated by reference to Exhibit 10.36 of the Registrant’s Registration Statement on Form S-1, as amended, No. 333-161632). | |
| 10.38 | Lease and Lease Agreement, dated August 18, 2009, by and between S/K Bed One Associates LLC and GAIN Capital Holdings, Inc. (Incorporated by reference to Exhibit 10.37 of the Registrant’s Registration Statement on Form S-1, as amended, No. 333-161632). | |
| 10.39† | Access Agreement, dated December 1, 2004, by and between Questrade, Inc. and GAIN Capital, Inc. (Incorporated by reference to Exhibit 10.38 of the Registrant’s Registration Statement on Form S-1, as amended, No. 333-161632). | |
| 10.40 | Agreement for Lease, dated May 5, 2009, by and between Pontsarn Investments Limited and GAIN Capital — Forex.com U.K., Ltd. (Incorporated by reference to Exhibit 10.39 of the Registrant’s Registration Statement on Form S-1, as amended, No. 333-161632). | |
| 10.41† | Addendum to Access Agreement, dated July 23, 2007, by and between GAIN Capital Group, LLC and Questrade, Inc. (Incorporated by reference to Exhibit 10.40 of the Registrant’s Registration Statement on Form S-1, as amended, No. 333-161632). | |
| 10.42† | Addendum to Access Agreement, dated October 12, 2007, by and between GAIN Capital Group, LLC and Questrade, Inc. (Incorporated by reference to Exhibit 10.41 of the Registrant’s Registration Statement on Form S-1, as amended, No. 333-161632). | |
| 10.43† | Software Licensing and Services Agreement, dated December 1, 2004, by and between Questrade, Inc. and GAIN Capital, Inc. (Incorporated by reference to Exhibit 10.42 of the Registrant’s Registration Statement on Form S-1, as amended, No. 333-161632). | |
88
Table of Contents
| Exhibit |
Description | |
| 10.44† | License Agreement, dated August 9, 2007, by and between GAIN Capital Group, LLC and MetaQuotes Software Corp. (Incorporated by reference to Exhibit 10.43 of the Registrant’s Registration Statement on Form S-1, as amended, No. 333-161632). | |
| 10.45† | Agreement, dated November 22, 2004, by and between esignal, a division of Interactive Data Corporation, and GAIN Capital, Inc. (Incorporated by reference to Exhibit 10.44 of the Registrant’s Registration Statement on Form S-1, as amended, No. 333-161632). | |
| 10.46† | Sales Lead Agreement, dated October 9, 2006, by and between GAIN Capital Group, LLC and Trading Central (Incorporated by reference to Exhibit 10.45 of the Registrant’s Registration Statement on Form S-1, as amended, No. 333-161632). | |
| 10.47† | Forex Introducing Broker Agreement, dated April 20, 2005, by and between GAIN Capital Group, Inc. and TradeStation Securities, Inc. (Incorporated by reference to Exhibit 10.46 of the Registrant’s Registration Statement on Form S-1, as amended, No. 333-161632). | |
| 10.48† | Addendum to Introducing Broker Agreement, dated October 1, 2007, by and between GAIN Capital Group, LLC and TradeStation Securities, Inc. (Incorporated by reference to Exhibit 10.47 of the Registrant’s Registration Statement on Form S-1, as amended, No. 333-161632). | |
| 10.49† | Second Addendum to Introducing Broker Agreement, dated April 1, 2009, by and between GAIN Capital Group, LLC and TradeStation Securities, Inc. (Incorporated by reference to Exhibit 10.48 of the Registrant’s Registration Statement on Form S-1, as amended, No. 333-161632). | |
| 10.50 | Form of ISDA Master Agreement, 2002 edition (Incorporated by reference to Exhibit 10.49 of the Registrant’s Registration Statement on Form S-1, as amended, No. 333-161632). | |
| 10.51 | Amended and Restated Employment Agreement, dated as of November 23, 2010, by and between GAIN Capital Holdings, Inc. and Glenn Stevens (Incorporated by reference to Exhibit 10.52 of the Registrant’s Registration Statement on Form S-1, as amended, No. 333-161632).** | |
| 10.52 | Executive Employment Agreement, dated as of November 23, 2010, by and between GAIN Capital Holdings, Inc. and Henry Lyons (Incorporated by reference to Exhibit 10.53 of the Registrant’s Registration Statement on Form S-1, as amended, No. 333-161632).** | |
| 10.53 | Retention Agreement, dated as of November 23, 2010, by and between GAIN Capital Holdings, Inc. and Henry Lyons (Incorporated by reference to Exhibit 10.54 of the Registrant’s Registration Statement on Form S-1, as amended, No. 333-161632).** | |
| 10.54 | Executive Employment Agreement, dated as of December 6, 2010, by and between GAIN Capital Holdings, Inc. and Timothy O’Sullivan (Incorporated by reference to Exhibit 10.55 of the Registrant’s Registration Statement on Form S-1, as amended, No. 333-161632).** | |
| 10.55 | Executive Employment Agreement, dated as of November 23, 2010, by and between GAIN Capital Holdings, Inc. and Samantha Roady (Incorporated by reference to Exhibit 10.56 of the Registrant’s Registration Statement on Form S-1, as amended, No. 333-161632).** | |
| 10.56 | Executive Employment Agreement, dated as of November 24, 2010, by and between GAIN Capital Holdings, Inc. and Andrew Haines (Incorporated by reference to Exhibit 10.57 of the Registrant’s Registration Statement on Form S-1, as amended, No. 333-161632).** | |
| 10.57 | Executive Employment Agreement, dated as of November 23, 2010, by and between GAIN Capital Holdings, Inc. and Kenneth O’Brien (Incorporated by reference to Exhibit 10.58 of the Registrant’s Registration Statement on Form S-1, as amended, No. 333-161632).** | |
| 10.58 | Executive Employment Agreement, dated as of December 6, 2010, by and between GAIN Capital Holdings, Inc. and Alexander Bobinski (Incorporated by reference to Exhibit 10.59 of the Registrant’s Registration Statement on Form S-1, as amended, No. 333-161632).** | |
89
Table of Contents
| Exhibit |
Description | |
| 10.59 | Executive Employment Agreement, dated as of January 24, 2011, by and between GAIN Capital Holdings, Inc. and Diego Rotsztain.* ** | |
| 10.60 | Amended and Restated Executive Employment Agreement, dated as of March 25, 2011, by and between GAIN Capital Holdings, Inc. and Diego Rotsztain.* ** | |
| 10.61 | Executive Employment Agreement, dated as of February 23, 2011, by and between GAIN Capital Holdings, Inc. and Jeffrey Scott.* ** | |
| 10.62 | Amended and Restated Executive Employment Agreement, dated as of March 25, 2011, by and between GAIN Capital Holdings, Inc. and Jeffrey Scott. * ** | |
| 10.63 | Asset Purchase Agreement, dated as of October 5, 2010, by and among GAIN Capital Group, LLC, GAIN Capital-Forex.com U.K., and GAIN Capital Forex.com Japan, Co. Ltd., and Capital Market Services, LLC, Capital Market Services UK Ltd., Capital Market Services International — BM, Ltd., and CMS Japan K.K. (Incorporated by reference to Exhibit 10.64 of the Registrant’s Registration Statement on Form S-1, as amended, No. 333-161632). | |
| 10.64 | Amendment No. 1 to Asset Purchase Agreement, dated as of November 23, 2010, by and among GAIN Capital Group, LLC, GAIN Capital-Forex.com U.K., and GAIN Capital Forex.com Japan, Co. Ltd., and Capital Market Services, LLC, Capital Market Services UK Ltd., Capital Market Services International — BM, Ltd., and CMS Japan K.K. (Incorporated by reference to Exhibit 10.65 of the Registrant’s Registration Statement on Form S-1, as amended, No. 333-161632). | |
| 21.1 | Subsidiaries of the Registrant.* | |
| 23.1 | Consent of Deloitte & Touche LLP.* | |
| 23.2 | Consent of Aite Group, LLC., dated March 21, 2011* | |
| 31.1 | Certification of Chief Executive Officer pursuant to rules 13a-14(a) under the Securities Exchange Act of 1934, as amended.* | |
| 31.2 | Certification of Chief Financial Officer pursuant to rules 13a-14(a) under the Securities Exchange Act of 1934, as amended.* | |
| 32.1 | Certification of Chief Executive Officer as required by section 906 of the Sarbanes-Oxley Act of 2002.* | |
| 32.2 | Certification of Chief Financial Officer as required by section 906 of the Sarbanes-Oxley Act of 2002.* | |
| * | Filed herewith. |
| ** | Compensation related contract. |
| † | Confidential treatment requested. Confidential materials omitted and filed separately with the Securities and Exchange Commission. |
90
Table of Contents
Pursuant to the requirements of Section 13 or 15(d) of the Securities Exchange Act of 1934, the registrant has duly caused this report to be signed on its behalf by the undersigned, thereunto duly authorized on the 30th day of March, 2011.
| GAIN CAPITAL HOLDINGS, INC. | ||
| By: | /s/ Glenn H. Stevens | |
| Glenn H. Stevens President and Chief Executive Officer | ||
Pursuant to the requirements of the Securities Exchange Act of 1934, this report has been signed below by the following persons on behalf of the registrant and in the capacities indicated.
| Signature |
Title |
Date | ||
| /s/ Glenn H. Stevens Glenn H. Stevens |
President and Chief Executive Officer (Principal Executive Officer) | March 30, 2011 | ||
| /s/ Henry C. Lyons Henry C. Lyons |
Executive Vice President, Chief Financial Officer and Treasurer (Principal Financial Officer) | March 30, 2011 | ||
| /s/ Daryl J. Carlough Daryl J. Carlough |
Chief Accounting Officer and Corporate Controller (Principal Accounting Officer) | March 30, 2011 | ||
| /s/ Peter Quick Peter Quick |
Chairman of the Board of Directors | March 30, 2011 | ||
| /s/ Susanne D. Lyons Susanne D. Lyons |
Director | March 30, 2011 | ||
| /s/ Joseph A. Schenk Joseph A. Schenk |
Director | March 30, 2011 | ||
| /s/ James C. Mills James C. Mills |
Director | March 30, 2011 | ||
| /s/ Mark E. Galant Mark E. Galant |
Director | March 30, 2011 | ||
| /s/ Christopher W. Calhoun Christopher W. Calhoun |
Director | March 30, 2011 | ||
| /s/ Christopher S. Sugden Christopher S. Sugden |
Director | March 30, 2011 | ||
91
Table of Contents
CONSOLIDATED FINANCIAL STATEMENTS AND
FINANCIAL STATEMENT SCHEDULE
| Consolidated Financial Statements: |
||||
| F-2 | ||||
| Consolidated Statements of Financial Condition as of December 31, 2010 and 2009 |
F-3 | |||
| F-4 | ||||
| F-5 | ||||
| Consolidated Statements of Cash Flows for the Years Ended December 31, 2010, 2009 and 2008 |
F-6 | |||
| F-8 | ||||
| Financial Statement Schedule: |
||||
| F-39 | ||||
F-1
Table of Contents
REPORT OF INDEPENDENT REGISTERED PUBLIC ACCOUNTING FIRM
To the Board of Directors and Shareholders of
GAIN Capital Holdings, Inc.
Bedminster, New Jersey
We have audited the accompanying consolidated statements of financial condition of GAIN Capital Holdings, Inc. and subsidiaries (the “Company”) as of December 31, 2010 and 2009, and the related consolidated statements of operations and comprehensive income, shareholders’ equity/(deficit), and cash flows for each of the three years in the period ended December 31, 2010. These consolidated financial statements are the responsibility of the Company’s management. Our responsibility is to express an opinion on these consolidated financial statements based on our audits.
We conducted our audits in accordance with the standards of the Public Company Accounting Oversight Board (United States). Those standards require that we plan and perform the audit to obtain reasonable assurance about whether the financial statements are free of material misstatement. The Company is not required to have, nor were we engaged to perform, an audit of its internal control over financial reporting. Our audits included consideration of internal control over financial reporting as a basis for designing audit procedures that are appropriate in the circumstances, but not for the purpose of expressing an opinion on the effectiveness of the Company’s internal control over financial reporting. Accordingly, we express no such opinion. An audit also includes examining, on a test basis, evidence supporting the amounts and disclosures in the financial statements, assessing the accounting principles used and significant estimates made by management, as well as evaluating the overall financial statement presentation. We believe that our audits provide a reasonable basis for our opinion.
In our opinion, such consolidated financial statements present fairly, in all material respects, the financial position of GAIN Capital Holdings, Inc. and subsidiaries at December 31, 2010 and 2009, and the results of their operations and their cash flows for each of the three years in the period ended December 31, 2010, in conformity with accounting principles generally accepted in the United States of America.
/s/ Deloitte & Touche LLP
New York, New York
March 30, 2011
F-2
Table of Contents
GAIN CAPITAL HOLDINGS, INC. AND SUBSIDIARIES
CONSOLIDATED STATEMENTS OF FINANCIAL CONDITION
(in thousands except share and per share data)
| As of December 31, | ||||||||
| 2010 | 2009 | |||||||
| ASSETS: | ||||||||
| Cash and cash equivalents |
$ | 284,210 | $ | 222,524 | ||||
| Short term investments |
75 | 4,276 | ||||||
| Trading securities |
20,060 | 25,040 | ||||||
| Receivables from brokers |
98,135 | 76,391 | ||||||
| Property and equipment — (net of accumulated depreciation and amortization of $10,464 and $7,054 at December 31, 2010 and 2009, respectively) |
7,294 | 6,843 | ||||||
| Prepaid assets |
9,938 | 2,044 | ||||||
| Deferred financing costs |
138 | 226 | ||||||
| Deferred initial public offering costs |
— | 1,732 | ||||||
| Goodwill |
3,092 | 3,092 | ||||||
| Intangible assets — (net of accumulated amortization of $2,017 and $809 at December 31, 2010 and 2009, respectively) |
9,089 | 320 | ||||||
| Other assets — (net of allowance for doubtful accounts of $74 and $332 at December 31, 2010 and 2009, respectively) |
11,040 | 9,452 | ||||||
| Total assets |
$ | 443,071 | $ | 351,940 | ||||
| LIABILITIES AND SHAREHOLDERS’ EQUITY / (DEFICIT): | ||||||||
| Liabilities |
||||||||
| Payables to brokers, dealers, FCMs and other regulated entities |
$ | 6,102 | $ | 2,769 | ||||
| Payables to customers |
250,572 | 196,985 | ||||||
| Accrued compensation and benefits |
5,117 | 4,040 | ||||||
| Accrued expenses and other liabilities |
10,506 | 8,673 | ||||||
| Income tax payable |
2,550 | — | ||||||
| Convertible, redeemable preferred stock embedded derivative (see note 10) |
— | 81,098 | ||||||
| Notes payable |
18,375 | 28,875 | ||||||
| Total liabilities |
293,222 | 322,440 | ||||||
| Commitments and Contingencies (See Note 15) |
||||||||
| Convertible, Redeemable Preferred Stock |
||||||||
| Series A Convertible, Redeemable Preferred Stock; ($0.00001 par value; 4,545,455 shares authorized; zero and 865,154 shares issued and outstanding as of December 31, 2010 and 2009, respectively) |
— | 2,009 | ||||||
| Series B Convertible, Redeemable Preferred Stock; ($0.00001 par value; 7,000,000 shares authorized; zero and 2,610,210 shares issued and outstanding as of December 31, 2010 and 2009, respectively) |
— | 5,412 | ||||||
| Series C Convertible, Redeemable Preferred Stock; ($0.00001 par value; 2,496,879 shares authorized; zero and 1,055,739 shares issued and outstanding as of December 31, 2010 and 2009, respectively) |
— | 5,319 | ||||||
| Series D Convertible, Redeemable Preferred Stock; ($0.00001 par value; 3,254,678 shares authorized; zero and 3,254,678 shares issued and outstanding as of December 31, 2010 and 2009, respectively) |
— | 39,840 | ||||||
| Series E Convertible, Redeemable Preferred Stock; ($0.00001 par value; 3,738,688 shares authorized; zero and 2,611,606 shares issued and outstanding as of December 31, 2010 and 2009, respectively) |
— | 116,810 | ||||||
| Total convertible, redeemable preferred stock |
— | 169,390 | ||||||
| GAIN Capital Holdings, Inc. Shareholders’ Equity / (Deficit) |
||||||||
| Common Stock; ($0.00001 par value; 60 million shares authorized; 31,174,651 and 2,966,034 shares issued and outstanding as of December 31, 2010 and 2009, respectively) |
— | — | ||||||
| Accumulated other comprehensive income |
428 | 348 | ||||||
| Additional paid-in capital |
73,381 | (178,409 | ) | |||||
| Retained earnings |
76,040 | 38,195 | ||||||
| Total GAIN Capital Holdings, Inc. shareholders’ equity (deficit) |
149,849 | (139,866 | ) | |||||
| Noncontrolling interest |
— | (24 | ) | |||||
| Total equity (deficit) |
149,849 | (139,890 | ) | |||||
| Total |
$ | 443,071 | $ | 351,940 | ||||
See Notes to Consolidated Financial Statements
F-3
Table of Contents
GAIN CAPITAL HOLDINGS, INC. AND SUBSIDIARIES
CONSOLIDATED STATEMENTS OF OPERATIONS AND COMPREHENSIVE INCOME
(in thousands except share and per share data)
| For the Fiscal Year Ended December 31, | ||||||||||||
| 2010 | 2009 | 2008 | ||||||||||
| REVENUE: |
||||||||||||
| Trading revenue |
$ | 187,356 | $ | 153,375 | $ | 186,004 | ||||||
| Other revenue |
3,417 | 2,108 | 2,366 | |||||||||
| Total non-interest revenue |
190,773 | 155,483 | 188,370 | |||||||||
| Interest revenue |
364 | 292 | 3,635 | |||||||||
| Interest expense |
(2,039 | ) | (2,456 | ) | (3,905 | ) | ||||||
| Total net interest revenue (expense) |
(1,675 | ) | (2,164 | ) | (270 | ) | ||||||
| Net revenue |
189,098 | 153,319 | 188,100 | |||||||||
| EXPENSES: |
||||||||||||
| Employee compensation and benefits |
45,439 | 41,503 | 37,024 | |||||||||
| Selling and marketing |
38,395 | 36,875 | 29,312 | |||||||||
| Trading expenses and commissions |
25,658 | 14,955 | 16,310 | |||||||||
| Bank fees |
4,239 | 4,466 | 3,754 | |||||||||
| Depreciation and amortization |
4,647 | 2,689 | 2,496 | |||||||||
| Communications and data processing |
2,951 | 2,676 | 2,467 | |||||||||
| Occupancy and equipment |
4,038 | 3,548 | 2,419 | |||||||||
| Bad debt provision |
597 | 760 | 1,418 | |||||||||
| Professional fees |
3,910 | 3,729 | 3,104 | |||||||||
| Software expense |
1,845 | 1,132 | 888 | |||||||||
| Professional dues and memberships |
275 | 698 | 773 | |||||||||
| Write-off of deferred initial public offering costs |
— | — | 1,897 | |||||||||
| Change in fair value of convertible, redeemable preferred stock embedded derivative |
(4,691 | ) | (1,687 | ) | (181,782 | ) | ||||||
| Other |
4,343 | 1,746 | 1,424 | |||||||||
| Total |
131,646 | 113,090 | (78,496 | ) | ||||||||
| INCOME BEFORE INCOME TAX EXPENSE AND EQUITY IN EARNINGS OF EQUITY METHOD INVESTMENT |
57,452 | 40,229 | 266,596 | |||||||||
| Income tax expense |
20,009 | 12,556 | 34,977 | |||||||||
| Equity in earnings of equity method investment |
— | — | (214 | ) | ||||||||
| NET INCOME |
37,443 | 27,673 | 231,405 | |||||||||
| Net loss applicable to noncontrolling interest |
(402 | ) | (321 | ) | (21 | ) | ||||||
| NET INCOME APPLICABLE TO GAIN CAPITAL HOLDINGS, INC. |
37,845 | 27,994 | 231,426 | |||||||||
| Other comprehensive income, net of tax: |
||||||||||||
| Foreign currency translation adjustment |
112 | 288 | 28 | |||||||||
| NET COMPREHENSIVE INCOME |
37,957 | 28,282 | 231,454 | |||||||||
| Comprehensive income applicable to noncontrolling interest, net of tax |
— | (24 | ) | 7 | ||||||||
| NET COMPREHENSIVE INCOME APPLICABLE TO GAIN CAPITAL HOLDINGS, INC. |
$ | 37,957 | $ | 28,306 | $ | 231,447 | ||||||
| Effect of redemption of preferred shares |
$ | — | $ | — | $ | (63,913 | ) | |||||
| Net income applicable to GAIN Capital Holdings, Inc. common shareholders |
$ | 37,845 | $ | 27,994 | $ | 167,513 | ||||||
| Earnings per common share(1): |
||||||||||||
| Basic |
$ | 8.62 | $ | 9.47 | $ | 57.54 | ||||||
| Diluted |
$ | 1.00 | $ | 0.75 | $ | 4.94 | ||||||
| Weighted average common shares outstanding used in computing earnings per common share(1): |
||||||||||||
| Basic |
4,392,798 | 2,956,377 | 2,911,107 | |||||||||
| Diluted |
37,742,902 | 37,282,069 | 33,924,548 | |||||||||
| (1) | On November 23, 2010, the Company’s board of directors approved a 2.29-for-1 stock split of our common stock effective immediately prior to the completion of the IPO as well as the settlement of the primary share offering which was allocated to all common shareholders on a pro-rata basis resulting in an effective stock split of 2.26-for-1. In connection with and immediately subsequent to the Company’s IPO, certain shareholders were subject to satisfy indemnification obligations related to past preferred stock issuances and subsequent sales. All references to common shares, preferred shares, additional paid-in capital, retained earnings (accumulated deficit), share and per share data for prior periods have been retroactively restated to reflect the stock split as if it had occurred at the beginning of the earliest period presented. |
See Notes to Consolidated Financial Statements
F-4
Table of Contents
GAIN CAPITAL HOLDINGS, INC. AND SUBSIDIARIES
CONSOLIDATED STATEMENTS OF SHAREHOLDERS’ EQUITY / (DEFICIT)
(in thousands, except share and per share data)
| Common Stock | Additional Paid in Capital |
(Accumulated Deficit)/ Retained Earnings |
Accumulated Other Comprehensive Income |
Noncontrolling Interest |
Total | |||||||||||||||||||||||
| Shares | Amount | |||||||||||||||||||||||||||
| BALANCE — January 1, 2008 |
3,469,406 | $ | — | $ | (95,115 | ) | $ | (221,225 | ) | $ | — | $ | — | $ | (316,340 | ) | ||||||||||||
| Exercise of options |
1,397,072 | — | 1,686 | — | — | — | 1,686 | |||||||||||||||||||||
| Repurchase of common shares |
(2,068,122 | ) | — | (40,752 | ) | — | — | — | (40,752 | ) | ||||||||||||||||||
| Repurchase of preferred shares |
— | — | (60,064 | ) | — | — | — | (60,064 | ) | |||||||||||||||||||
| Conversion restricted stock units into common stock |
150,445 | — | — | — | — | — | — | |||||||||||||||||||||
| Repurchase of warrants |
— | — | (3,848 | ) | — | — | — | (3,848 | ) | |||||||||||||||||||
| Tax benefit from employee exercises |
— | — | 10,709 | — | — | — | 10,709 | |||||||||||||||||||||
| Reversal of call option liability |
— | — | 1 | — | — | — | 1 | |||||||||||||||||||||
| Stock compensation expense |
— | — | 4,492 | — | — | — | 4,492 | |||||||||||||||||||||
| Foreign currency translation adjustment |
— | — | — | — | 21 | 7 | 28 | |||||||||||||||||||||
| Increase in noncontrolling interest related to acquisition of subsidiary |
— | — | — | — | — | 529 | 529 | |||||||||||||||||||||
| Net income |
— | — | — | 231,426 | — | (21 | ) | 231,405 | ||||||||||||||||||||
| BALANCE — December 31, 2008 |
2,948,801 | $ | — | $ | (182,891 | ) | $ | 10,201 | $ | 21 | $ | 515 | $ | (172,154 | ) | |||||||||||||
| Exercise of options |
7,932 | — | 8 | — | — | — | 8 | |||||||||||||||||||||
| Conversion restricted stock units into common stock |
9,301 | — | — | — | — | — | — | |||||||||||||||||||||
| Tax benefit from employee exercises |
— | — | — | — | — | — | — | |||||||||||||||||||||
| Stock compensation expense |
— | — | 5,609 | — | — | — | 5,609 | |||||||||||||||||||||
| Foreign currency translation adjustment |
— | — | — | — | 327 | (39 | ) | 288 | ||||||||||||||||||||
| Increase in noncontrolling interest related to acquisition of subsidiary |
— | — | (1,135 | ) | — | — | (179 | ) | (1,314 | ) | ||||||||||||||||||
| Net income |
— | — | — | 27,994 | — | (321 | ) | 27,673 | ||||||||||||||||||||
| BALANCE — December 31, 2009 |
2,966,034 | $ | — | $ | (178,409 | ) | $ | 38,195 | $ | 348 | $ | (24 | ) | $ | (139,890 | ) | ||||||||||||
| Exercise of options |
75,448 | — | 107 | — | — | — | 107 | |||||||||||||||||||||
| Conversion restricted stock units into common stock |
67,988 | — | — | — | — | — | — | |||||||||||||||||||||
| Conversion of preferred stock |
27,757,770 | — | 169,390 | — | — | — | 169,390 | |||||||||||||||||||||
| Settlement of preferred stock embedded derivative |
— | — | 76,407 | — | — | — | 76,407 | |||||||||||||||||||||
| Net proceeds from initial public offering after underwriting discounts, commissions, and expenses |
407,692 | — | 208 | — | — | — | 208 | |||||||||||||||||||||
| Series E indemnification |
(100,281 | ) | — | 835 | — | — | — | 835 | ||||||||||||||||||||
| Stock compensation expense |
— | — | 5,457 | — | — | — | 5,457 | |||||||||||||||||||||
| Foreign currency translation adjustment |
— | — | — | 80 | 32 | 112 | ||||||||||||||||||||||
| Increase in noncontrolling interest related to acquisition of subsidiary |
— | — | (614 | ) | — | — | 394 | (220 | ) | |||||||||||||||||||
| Net income |
37,845 | (402 | ) | 37,443 | ||||||||||||||||||||||||
| BALANCE — December 31, 2010 |
31,174,651 | $ | $ | 73,381 | $ | 76,040 | $ | 428 | $ | — | $ | 149,849 | ||||||||||||||||
See Notes to Consolidated Financial Statements
F-5
Table of Contents
GAIN CAPITAL HOLDINGS, INC. AND SUBSIDIARIES
CONSOLIDATED STATEMENTS OF CASH FLOWS
(in thousands)
| For the Fiscal Year Ended December 31, |
||||||||||||
| 2010 | 2009 | 2008 | ||||||||||
| CASH FLOWS FROM OPERATING ACTIVITIES: |
||||||||||||
| Net income |
$ | 37,443 | $ | 27,673 | $ | 231,405 | ||||||
| Adjustments to reconcile net income to cash provided by operating activities |
||||||||||||
| Unrealized foreign exchange transactions — liquidity providers and customers |
(34,061 | ) | (7,706 | ) | 1,776 | |||||||
| Loss on foreign currency exchange rates |
239 | 28 | 191 | |||||||||
| Depreciation and amortization |
4,647 | 2,689 | 2,496 | |||||||||
| Deferred taxes |
(1,227 | ) | (1,787 | ) | (932 | ) | ||||||
| Write-off of deferred initial public offering costs |
— | — | 42 | |||||||||
| Amortization of deferred financing costs |
87 | 87 | 89 | |||||||||
| Interest income |
(46 | ) | (77 | ) | (183 | ) | ||||||
| Bad debt provision |
597 | 1,101 | 1,418 | |||||||||
| Loss in earnings of equity method investment |
— | — | 214 | |||||||||
| Loss on disposal of fixed assets |
37 | 353 | 91 | |||||||||
| Stock compensation expense |
5,457 | 5,609 | 4,492 | |||||||||
| Tax benefit from employee stock option exercises |
— | — | (10,709 | ) | ||||||||
| Change in fair value of preferred stock embedded derivative |
(4,691 | ) | (1,687 | ) | (181,782 | ) | ||||||
| Changes in operating assets and liabilities: |
||||||||||||
| Short term investments |
4,208 | (4,276 | ) | — | ||||||||
| Trading securities |
5,018 | 37 | (24,817 | ) | ||||||||
| Receivables from brokers |
(26,283 | ) | (26,068 | ) | 22,620 | |||||||
| Prepaid assets |
(7,894 | ) | (412 | ) | (849 | ) | ||||||
| Other assets |
831 | (6,072 | ) | (3,043 | ) | |||||||
| Deferred initial public offering costs |
— | — | (42 | ) | ||||||||
| Payables to customers |
96,784 | 81,312 | 13,528 | |||||||||
| Accrued compensation and benefits |
1,077 | (1,242 | ) | 354 | ||||||||
| Payables to brokers, dealers, FCMs and other regulated entities |
3,333 | 1,090 | (483 | ) | ||||||||
| Accrued expenses and other liabilities |
1,198 | 2,013 | 939 | |||||||||
| Income tax payable |
2,550 | (10,538 | ) | 12,505 | ||||||||
| Cash provided by operating activities |
89,304 | 62,127 | 69,320 | |||||||||
| CASH FLOWS FROM INVESTING ACTIVITIES: |
||||||||||||
| Purchases of property and equipment |
(3,873 | ) | (4,059 | ) | (2,679 | ) | ||||||
| Acquisition and funding of Fortune Capital Co., Ltd, net of cash acquired |
— | — | (666 | ) | ||||||||
| Acquisition and funding of S.L. Bruce Financial Corporation, net of cash acquired |
— | — | (248 | ) | ||||||||
| Acquisition and funding of RCG GAIN Limited, net of cash acquired |
— | — | (199 | ) | ||||||||
| Purchase of subsidiary shares from noncontrolling interest |
(944 | ) | — | |||||||||
| Purchase of customer and marketing lists |
(8,505 | ) | — | — | ||||||||
| Purchase of intangible assets |
(43 | ) | ||||||||||
| Cash used for investing activities |
(12,421 | ) | (5,003 | ) | (3,792 | ) | ||||||
| CASH FLOWS FROM FINANCING ACTIVITIES: |
||||||||||||
| Proceeds from initial public offering of common stock, net of underwriting discounts and other direct costs of $3.8 million |
208 | — | — | |||||||||
| Deferred initial public offering costs |
1,732 | (1,296 | ) | — | ||||||||
| Payment on notes payable |
(10,500 | ) | (10,500 | ) | (10,500 | ) | ||||||
| Proceeds from exercise of stock options |
107 | 8 | 1,686 | |||||||||
| Proceeds from exercise of warrants |
— | — | 97 | |||||||||
| Issuance of Series E preferred shares |
— | — | 117,000 | |||||||||
| Series E issuance costs |
— | — | (190 | ) | ||||||||
| Tax benefit from employee stock option exercises |
— | — | 10,709 | |||||||||
| Repurchase of warrants |
— | — | (3,945 | ) | ||||||||
| Repurchase of common shares |
— | — | (40,752 | ) | ||||||||
| Repurchase of preferred shares |
— | — | (62,043 | ) | ||||||||
| Purchase of subsidiary shares from noncontrolling interest |
(427 | ) | — | — | ||||||||
| Cash provided by/(used for) financing activities |
(8,880 | ) | (11,788 | ) | 12,062 | |||||||
F-6
Table of Contents
GAIN CAPITAL HOLDINGS, INC. AND SUBSIDIARIES
CONSOLIDATED STATEMENTS OF CASH FLOWS — (Continued)
(in thousands)
| For the Fiscal Year Ended December 31, |
||||||||||||
| 2010 | 2009 | 2008 | ||||||||||
| Effect of exchange rate changes on cash and cash equivalents |
(6,317 | ) | 757 | (53 | ) | |||||||
| INCREASE IN CASH AND CASH EQUIVALENTS |
61,686 | 46,093 | 77,537 | |||||||||
| CASH AND CASH EQUIVALENTS — Beginning of year |
222,524 | 176,431 | 98,894 | |||||||||
| CASH AND CASH EQUIVALENTS — End of year |
$ | 284,210 | $ | 222,524 | $ | 176,431 | ||||||
| SUPPLEMENTARY DISCLOSURES OF CASH FLOW INFORMATION: |
||||||||||||
| Cash paid during the year for: |
||||||||||||
| Interest |
$ | 1,799 | $ | 2,377 | $ | 3,959 | ||||||
| Taxes |
$ | 15,674 | $ | 28,200 | $ | 20,731 | ||||||
| Non-cash investing activities: |
||||||||||||
| Purchase of fixed assets in accrued expense and other liabilities |
$ | 54 | $ | 1,233 | $ | 153 | ||||||
| Contingent liability for CMS acquisition |
$ | 1,429 | $ | — | $ | — | ||||||
| Capital lease of property and equipment |
$ | — | $ | 650 | $ | — | ||||||
| Investment in S.L. Bruce Financial Corporation in accrued expenses and other liabilities |
$ | — | $ | — | $ | 325 | ||||||
| Accrual to acquire additional shares of Forex.com Japan Co., Ltd. |
$ | — | $ | 350 | $ | — | ||||||
| Non-cash financing activities: |
||||||||||||
| Accrued initial public offering costs |
$ | 1,305 | $ | 436 | $ | — | ||||||
| Series E indemnification |
$ | 835 | $ | — | $ | — | ||||||
| Reversal of call option liability |
$ | — | $ | — | $ | 1 | ||||||
| Settlement of Preferred Stock embedded derivative |
$ | 76,407 | $ | — | $ | — | ||||||
| Settlement of Convertible, Redeemable preferred stock |
$ | 169,390 | $ | — | $ | — | ||||||
See Notes to Consolidated Financial Statements
F-7
Table of Contents
GAIN CAPITAL HOLDINGS, INC. AND SUBSIDIARIES
NOTES TO CONSOLIDATED FINANCIAL STATEMENTS
| 1. | Nature of Operations and Significant Accounting Policies |
Nature of Operations
GAIN Capital Holdings, Inc. and subsidiaries (the “Company”) is a Delaware corporation formed and incorporated on March 24, 2006. GAIN Holdings, LLC is a wholly-owned subsidiary of GAIN Capital Holdings, Inc., and owns all outstanding membership units in GAIN Capital Group, LLC, the operating company.
GAIN Capital Group, Inc., a Delaware corporation, was formed and incorporated on August 1, 2003. Immediately following the formation of the corporation, it acquired all the outstanding equity of GAIN Capital, Inc. On March 27, 2006, GAIN Capital Group, Inc. converted to a Delaware limited liability company known as GAIN Capital Group, LLC (“Group, LLC”).
Group, LLC is a managed flow business in a number of foreign currencies. Its Internet trading platform provides a market for customers to trade, on a margin basis, spot foreign exchange. In connection with its managed flow activities, Group, LLC seeks to manage its market risk by entering into offsetting positions with large money center banks and other financial institutions. As a result of its managed flow operations, Group, LLC, may have open positions in various currencies at any given time. Group, LLC manages its open positions and exposure in real time. The majority of Group, LLC’s foreign exchange business relates to major foreign currencies such as U.S. dollars, Japanese yen, Euros, United Kingdom pound sterling, Swiss francs and Canadian dollars.
The counterparties to Group, LLC’s foreign exchange transactions include retail traders, investment advisors, commercial banks, small to mid-sized corporations, hedge funds, investment banks and broker-dealers.
Group, LLC is a registered Futures Commission Merchant (“FCM”) with the Commodity Futures Trading Commission (“CFTC”). As such, it is subject to the regulations of the CFTC, an agency of the U.S. Government, and the rules of the National Futures Association (“NFA”), an industry self-regulatory organization.
GAIN Capital Holdings, Inc. and subsidiaries strategically expanded its operations from 2007 to 2010:
| • | The Company established a wholly-owned subsidiary, JiaShen Forex Software Development Technology, LLC (“JiaShen, LLC”) in Shanghai, China in 2007. This entity was closed in 2009. See Note 20 for additional information. |
| • | GCAM, LLC is a Delaware limited liability company formed on April 10, 2006 to operate as a private investment vehicle. GCAM, LLC is engaged primarily in the business of trading and investing in over the counter (“OTC”) foreign currencies and was the general partner of the GCAM Madison Fund, L.P., through the fund closure in December 31, 2008. The general partner directed the fund’s trading and investments as well as its day-to-day operations. GCAM, LLC currently directs the asset management program of Group, LLC. In January 2007 Group, LLC subsequently transitioned its investment in GCAM, LLC to the ultimate parent, GAIN Capital Holdings, Inc. |
| • | GAIN Global Markets, Inc. (“GGMI”) was incorporated in the Cayman Islands on January 19, 2006. In 2007, GGMI became wholly owned by GAIN Capital Holdings International, LLC., which is 100% owned by the Company. GGMI is registered with the Cayman Islands Monetary Authority (“CIMA”) as an Exchange Contracts Dealer and operates a trading platform called Trade Real-Time which provides self-directed traders with direct access to Contracts for Difference (“CFD”), Forex, Metals and Energy markets. |
| • | Group, LLC entered into a joint venture with Rosenthal Collins Group (“RCG”), a leading independent futures clearing firm, that was approved by the U.K. Financial Services Authority (“U.K. FSA”) |
F-8
Table of Contents
| effective January 2008 in which Group, LLC and RCG each owned a 50% interest in RCG GAIN Limited (“RCGGL”). On December 22, 2008, Group, LLC acquired RCG’s 50% interest in RCGGL. Prior to the acquisition of the remaining 50% interest, the joint venture was accounted for as an equity method investment and was fully consolidated as of December 31, 2008. Upon achieving complete ownership, the legal name was changed to GAIN Capital Forex.com UK Limited (“GCUK”). |
| • | On October 3, 2008, the Company acquired all outstanding common stock of S.L. Bruce Financial Corporation, the parent company of State Discount Brokers, Inc. which is a broker-dealer registered with the Securities and Exchange Commission and a member of the Financial Industry Regulatory Authority, Inc. (“FINRA”). The Company subsequently changed the name of State Discount Brokers, Inc. to GAIN Capital Securities, Inc. (“GCSI”). |
| • | GAIN Holdings International, LLC acquired a 51% controlling interest, with rights to acquire up to a 95% interest, in Fortune Capital Co., Ltd. (“FORTUNE”) on December 12, 2008. On October 1, 2009, the Company purchased an additional 196 shares of FORTUNE, increasing the ownership interest from 51% to 70% of the outstanding shares, in April 2010, the Company acquired the remaining 30% interest in Forex.com Japan Co., Ltd. for $0.4 million, increasing the ownership interest from 70% to 100%. FORTUNE was previously a privately owned provider of forex trading services in Japan, and has been a white label partner to Group, LLC since 2002. FORTUNE maintains a Type I financial instruments business registration with Japan’s Financial Services Agency (“Japan FSA”). FORTUNE was subsequently renamed Forex.com Japan Co., Ltd. (“GC Japan”). |
| • | The Company incorporated GAIN Capital Forex.com Hong Kong Limited (“GCHK”) on July 9, 2008. In July 2009, GCHK was granted a license by the Securities and Futures Commission (“SFC”) which regulates forex trading in Hong Kong. |
| • | The Company incorporated GAIN Capital — Forex.com Singapore Pte Ltd. in January 2009. |
| • | The Company incorporated GAIN Capital Forex.com Australia Pty Ltd. in July 2009. |
| • | The Company incorporated GAIN Capital Service Company, LLC in May 2010. |
| • | The Company incorporated GAIN GTX, LLC in November 2010. |
| • | The Company acquired the customer account balances, customer agreements and customer and marketing lists of MG Financial, LLC (“MG”) in August 2010. See Note 6 for additional information. |
| • | The Company acquired the customer account balances and effective customer agreements of Capital Market Services, LLC and certain of its affiliates (“CMS”) in October 2010. See Note 6 for additional information. |
Initial Public Offering
On December 20, 2010 the Company closed its initial public offering of common stock (“IPO”) of 9,000,000 shares of common stock at an offering price of $9.00 per share, of which 407,692 shares were sold by the Company and 8,592,308 shares were sold by selling stockholders, resulting in net proceeds to the Company of $4.0 million, after deducting underwriting discounts (which included a $0.6 million reimbursement by the underwriters for our out-of-pocket expenses incurred during the offering).Upon the closing of the IPO, all of the Company’s outstanding shares of convertible preferred stock were automatically converted into 27,757,770 shares of common stock, in accordance with our Second Amended and Restated Certificate of Incorporation. As a result, the conversion of the convertible preferred stock the embedded derivative liability was settled and recorded to additional paid-in-capital.
Costs directly associated with the Company’s IPO of $3.8 million were capitalized and recorded as deferred initial public offering costs prior to the closing of the IPO. Once the IPO was closed, these costs were recorded as a reduction of the net proceeds received.
F-9
Table of Contents
| 2. | Summary of Significant Accounting Policies |
Basis of Accounting
The Company and its subsidiaries’ consolidated financial statements are prepared in accordance with accounting principles generally accepted in the United States of America (“generally accepted accounting principles”).
Stock Split
On November 23, 2010, the Company’s board of directors approved a 2.29-for-1 stock split of our common stock effective immediately prior to the completion of the IPO as well as the settlement of the primary share offering which was allocated to all common shareholders on a pro-rata basis resulting in an effective stock split of 2.26-for-1. Immediately subsequent to the Company’s IPO, certain shareholders were subject to satisfy indemnification obligations related to past preferred stock issuances and subsequent sales. All references to common shares, preferred shares, additional paid-in capital, retained earnings (accumulated deficit), share and per share data for prior periods have been retroactively restated to reflect the stock split as if it had occurred at the beginning of the earliest period presented.
Consolidation
The consolidated financial statements include the accounts of the Company and its wholly-owned subsidiaries and majority owned subsidiary. The consolidated financial statements include 100% of the assets and liabilities of the majority owned subsidiary and the ownership interest of minority investors is recorded as noncontrolling interest. All intercompany transactions and balances are eliminated in consolidation.
The Company applies Accounting Standards Codification (“ASC”) 810-10, Consolidation, in its principles of consolidation. ASC 810-10 addresses arrangements where a company does not hold a majority of the voting or similar interests of a variable interest entity (“VIE”). A company is required to consolidate a VIE if it has determined it is the primary beneficiary. Accounting Research Bulletin 51 addresses the policy when a company owns a majority of the voting or similar rights and exercises effective control.
Use of Estimates
The preparation of financial statements in conformity with generally accepted accounting principles requires management to make estimates and assumptions that affect the reported amounts of assets and liabilities and disclosure of contingent assets and liabilities at the date of the financial statements and the reported amounts of revenue and expenses during the reporting period. In presenting the consolidated financial statements, management makes estimates regarding:
| • | Valuation of assets and liabilities requiring fair value estimates; |
| • | The allowance for doubtful accounts; |
| • | The realization of deferred taxes; |
| • | The carrying amount of goodwill and other intangible assets; |
| • | The amortization period of intangible assets with definite lives; |
| • | Incentive based compensation accruals and valuation of share-based payment arrangements; and |
| • | Other matters that affect the reported amounts and disclosure of contingencies in the consolidated financial statements. |
Estimates, by their nature, are based on judgment and available information. Therefore, actual results could differ from those estimates and could have a material impact on the consolidated financial statements, and it is possible that such changes could occur in the near term.
F-10
Table of Contents
The Company makes estimates of the uncollectibility of accounts receivable and records an increase in the allowance for doubtful accounts when the prospect of collecting a specific account balance becomes doubtful. Management specifically analyzes accounts receivable and historical bad debt experience when evaluating the adequacy of the allowance for doubtful accounts. Should any of these factors change, the estimates made by management will also change, which could affect the level of our future provision for doubtful accounts.
Revenue Recognition
The Company’s revenue is derived from our managed flow activities between our retail customers, where we act as the counterparty to our customers’ trades. Revenue is recognized in accordance with ASC 605-10-S99, Revenue Recognition (“Staff Accounting Bulletin (“SAB”) No. 104, Revenue Recognition). The Company generates revenue from forex trading. SAB 104 requires that four basic criteria must be met before revenue can be recognized: (1) persuasive evidence of an arrangement exists; (2) delivery has occurred or services rendered; (3) the seller’s price to the buyer is fixed and determinable; and (4) collectability is reasonably assured.
Foreign exchange contracts generally involve the exchange of two currencies at market rates on a specified date; spot contracts usually require the exchange of currencies to occur within two business days of the contract date. Customer transactions and related revenue and expenses are recorded on a trade date basis.
Gains or losses are realized when customer transactions are liquidated. Unrealized gains or losses on cash positions revalued at prevailing foreign currency exchange rates (the difference between contract price and market price) at the date of the statement of financial condition are included in Receivables from brokers, Payables to customers and Payables to brokers, dealers, FCMs and other regulated entities on the Consolidated Statements of Financial Condition. Changes in net unrealized gains or losses are recorded in Trading revenue on the Consolidated Statements of Operations and Comprehensive Income.
Other revenue, on the Consolidated Statements of Operations and Comprehensive Income, is comprised primarily of trading commissions related to the Forex Pro trading program which allows customers to receive tighter spreads in return for a commission fee paid to us. The Company also records to Other revenue the inactivity fees charged monthly to customers who have not executed trades and maintained the required minimum account balance.
Interest revenue and interest expense are recorded when earned and incurred, respectively. Net interest revenue (expense) consists primarily of the revenue generated by Company cash and customer cash held and invested at banks, money market funds and deposits at wholesale forex trading partners, less interest paid to customers on their balances and interest expense on notes payable.
Advertising
Advertising costs are incurred for the production and communication of advertising, as well as other marketing activities. The Company expenses the cost of advertising as incurred, except for costs related to the production of broadcast advertising, which are expensed when the first broadcast occurs. The Company did not capitalize any production costs associated with broadcast advertising for 2010, 2009, or 2008. The total amount charged to advertising expense was $38.4 million, $36.9 million and $29.3 million for the years ended December 31 2010, 2009 and 2008, respectively.
Cash and Cash Equivalents
The Company considers all highly liquid investments with an original maturity of 90 days or less at the time of acquisition to be cash equivalents. Included in this balance are funds deposited by customers and funds accruing to customers as a result of trades or contracts. At December 31, 2010 and 2009, the Company’s cash equivalents consisted of money market accounts. Cash equivalents are recorded at fair value.
F-11
Table of Contents
Short Term Investments
The Company considers all investments with an original maturity of less than one year short term investments. Short term investments consist of short-term certificates of deposit and are recorded at fair value. All income from the certificates of deposit is recorded as interest income when earned.
Trading Securities
Trading securities consist of U.S. Treasury Bills and equity securities and are reported at fair value, with unrealized gains or losses resulting from changes in fair value recognized as other income, net in the Consolidated Statements of Operations and Comprehensive Income.
Fair Value
The carrying amounts of assets, excluding goodwill and intangibles, and liabilities approximate their fair values due to the short term maturities. Some of the Company’s financial instruments are not measured at fair value on a recurring basis but nevertheless are recorded at amounts that approximate fair value. Such financial assets and liabilities include: cash, receivables from broker, other assets, payables to customers, and accrued expenses and other liabilities. The fair value of the term loan is based on transaction prices. The fair value spot foreign exchange positions are determined based the estimated amounts that such positions could be settled with the counterparty at the balance sheet date.
Concentrations of Credit Risk
Financial instruments that subject the Company to credit risk primarily consist of cash equivalents. The Company’s credit risk is managed by investing cash and cash equivalents primarily in high-quality money market and U.S. Government instruments. The majority of the Company’s cash and cash equivalents are held at ten financial institutions.
Prepaid Assets
The Company records goods and services paid for but not to be received until a future date as prepaid assets. These include payments for advertising and insurance. Also included in prepaid assets is an upfront, non-refundable $7.5 million pre-payment for the use of the Forexster Trading Services. Pursuant to the terms of the Exclusive Marketing Agreement, the prepayment for use of the Forexster Trading Services will be amortized as revenue associated with Forexster Trading Services is recognized.
Receivables from Brokers
The Company has posted funds with brokers as collateral as required by agreements for holding spot foreign exchange positions. In addition, the Company has cash in excess of required collateral. These amounts are reflected as receivables from brokers and include gains or losses realized on liquidated contracts, as well as unrealized gains or losses on open positions.
F-12
Table of Contents
Property and Equipment
Property and equipment are recorded at cost, net of accumulated depreciation. Identifiable significant improvements are capitalized and expenditures for maintenance and repairs are charged to expense as incurred.
Property and equipment are depreciated on a straight-line basis over the estimated useful lives of the assets as follows:
| Purchased software |
3 years | |
| Furniture and fixtures |
3 years | |
| Leasehold improvements |
Shorter of lease term or estimated useful life | |
| Telephone equipment |
3 years | |
| Office equipment |
3 years | |
| Vehicles |
5 years |
The Company accounts for costs incurred to develop its trading platform and related software in accordance with the American Institute of Certified Public Accountants (“AICPA”) Statement of Position 98-1 (“SOP 98-1”), Accounting for the Costs of Computer Software Developed or Obtained for Internal Use. SOP 98-1 requires that such technology be capitalized in the application and infrastructure development stages. Costs related to training, administration and non-value-added maintenance are charged to expense as incurred. Capitalized software development costs are being amortized over the useful life, which the Company has estimated at three years.
Foreign Currencies
The Company has determined that its functional currency is U.S. dollars (“USD”). Realized foreign currency transaction gains and losses are recorded in Trading revenue on the Consolidated Statements of Operations and Comprehensive Income during the year at the exchange rate on the date of the transaction. Unrealized foreign currency transaction gains and losses are computed using the closing rate of exchange prevailing at the date of the Consolidated Statements of Financial Condition. Gains and losses arising from these transactions are also recorded in Trading revenue on the Consolidated Statements of Operations and Comprehensive Income.
In accordance with ASC 830-10, Foreign Currency Matters, monetary assets and liabilities denominated in foreign currencies are converted into USD at rates of exchange in effect at the date of the Consolidated Statements of Financial Condition. The Company recorded foreign currency transaction gains and losses in Other revenue on the Consolidated Statements of Operations and Comprehensive Income. The Company recorded losses of $0.2 million, $0.03 million and $0.2 million for the years ended December 31, 2010, 2009 and 2008, respectively.
Intangible Assets
ASC 350, Intangibles — Goodwill and Other (“ASC 350”), requires purchased intangible assets other than goodwill to be amortized over their useful lives unless their lives are determined to be indefinite. If the assets are determined to have a finite life in the future, the Company will amortize the carrying value over the remaining useful life at that time.
The Company compares the recorded value of its indefinite life intangible assets to their fair value on an annual basis and whenever circumstances arise that indicate that an impairment may have occurred. See Note 6 for additional information.
Goodwill
In accordance with ASC 350, the Company tests goodwill for impairment on an annual basis during the fourth quarter and on an interim basis when conditions indicate impairment has occurred. Goodwill impairment is
F-13
Table of Contents
determined by comparing the estimated fair value of the reporting unit with its respective book value. The Company utilized a discounted cash flow approach in order to determine the fair value. The Company believes that its procedures for estimating discounted future cash flows were reasonable and consistent with market conditions at the time of estimation. The Company recorded goodwill with the acquisition of GCAM, LLC, GCSI, GC Japan, and GCUK. No amount of goodwill is expected to be deductible for tax purposes. See Note 7 for additional information.
Other Assets
The Company recorded receivables from vendors, security deposits, current and deferred tax assets and miscellaneous receivables in Other assets on the Consolidated Statements of Financial Condition. See Note 8 for additional information.
Allowance for Doubtful Accounts
The Company records an increase in the allowance for doubtful accounts when the prospect of collecting a specific customer account balance becomes doubtful. Management specifically analyzes accounts receivable and historical bad debt experience when evaluating the adequacy of the allowance for doubtful accounts. Should any of these factors change, the estimates made by management will also change, which could affect the level of our future provision for doubtful accounts. The allowance for doubtful accounts is included in Other assets on the Consolidated Statements of Financial Condition. Receivables from customers are reserved for and recorded in Bad debt provision on the Consolidated Statements of Operations and Comprehensive Income. The allowance for doubtful accounts consisted of the following (amounts in thousands):
| Balance as of January 1, 2008 |
$ | (1,129 | ) | |
| Addition to provision |
(1,418 | ) | ||
| Amounts written off |
334 | |||
| Balance as of December 31, 2008 |
(2,213 | ) | ||
| Addition to provision |
(1,101 | ) | ||
| Amounts written off |
2,641 | |||
| Recoveries |
341 | |||
| Balance as of December 31, 2009 |
(332 | ) | ||
| Addition to provision |
(597 | ) | ||
| Amounts written off |
855 | |||
| Balance as of December 31, 2010 |
$ | (74 | ) | |
Long-Lived Assets
In accordance with ASC 360-10, Property, Plant and Equipment, the Company periodically evaluates the carrying value of long-lived assets when events and circumstances warrant such review. The carrying value of a long-lived asset is considered impaired when the anticipated undiscounted cash flow from such an asset is separately identifiable and is less than the carrying value. In that event, a loss is recognized in the amount by which the carrying value exceeds the fair market value of the long-lived asset. The Company has identified no such impairment losses.
Payables to Customers
Payables to customers, included on the Consolidated Statements of Financial Condition, include amounts due on cash and margin transactions. These transactions include deposits, commissions and gains or losses arising from settled trades. The Payables to customers balance also reflects unrealized gains or losses arising from open positions in customer accounts.
F-14
Table of Contents
Payables to Brokers, Dealers, FCMs and Other Regulated Entities
The Company engages in white label, or omnibus relationships, with other regulated financial institutions. The payables balance includes amounts deposited by these financial institutions in order for the Company to act as clearing broker. The payables balance includes deposits from all NFA registered entities.
Noncontrolling Interest
Noncontrolling interest represents the portion of the Company’s operating profit that is attributable to the ownership interest of the noncontrolling interest owners in GC Japan. There is no longer a noncontrolling interest as of December 31, 2010. See Note 7 for additional information.
Accumulated Other Comprehensive Income
The Company’s Accumulated other comprehensive income, consists of foreign currency translation adjustments from their subsidiaries not using the U.S. dollar as their functional currency.
Income Taxes
Income tax expense is provided for using the asset and liability method, under which deferred tax assets and liabilities are determined based upon the temporary differences between the financial statement and income tax bases of assets and liabilities using currently enacted tax rates.
Convertible, Redeemable Preferred Stock Embedded Derivative
ASC 815, Derivatives and Hedging, establishes accounting and reporting standards for derivative instruments. The Company has determined that it must bifurcate and account for the conversion feature in its Series A, Series B, Series C, Series D, and Series E preferred stock. The embedded derivative is recorded at fair value and changes in the fair value are reflected in earnings. The Company recorded a $4.7 million gain on the change in fair market value of the preferred stock embedded derivative, which represents the change in fair market value from January 1, 2010 through the effective date of the IPO. The conversion feature and the associated embedded derivative liability is no longer required to be recognized due to the conversion of all outstanding preferred stock to common stock in connection with the IPO.
Share Based Payment
In accordance with ASC 718, Stock Compensation, the Company recognizes all share-based payments to employees, including grants of employee stock options, in the Statements of Operations and Comprehensive Income based on their fair values.
ASC 718-10 requires measurement of share based payment arrangements at fair value and recognition of compensation cost over the service period, net of estimated forfeitures. The fair value of restricted stock units is determined based on the number of units granted and the grant date fair value of GAIN Capital Holding, Inc.’s common stock.
See Note 13 for additional share based payment disclosure.
Earnings Per Common Share
Basic earnings per common share is calculated using the weighted average common shares outstanding during the year. Common equivalent shares from stock options and restricted stock awards, using the treasury stock method, are also included in the diluted per share calculations unless their effect of inclusion would be antidilutive.
F-15
Table of Contents
On November 23, 2010, the Company’s board of directors approved a 2.29-for-1 stock split of our common stock effective immediately prior to the completion of the IPO as well as the settlement of the primary share offering which was allocated to all common shareholders on a pro-rata basis resulting in an effective stock split of 2.26-for-1. Immediately subsequent to the Company’s IPO, certain shareholders were subject to satisfy indemnification obligations related to past preferred stock issuances and subsequent sales. All references to common shares, preferred shares, share and per share data for prior periods have been retroactively restated to reflect the stock split as if it had occurred at the beginning of the earliest period presented.
Management Risk
In the normal course of business, the Company executes foreign exchange transactions with its customers upon request on a margin basis. In connection with these activities, the Company acts as the counterparty in 48 foreign currencies pairs. The Company actively trades currencies in the spot market, earning a dealer spread. The Company seeks to manage its market risk by generally entering into offsetting contracts in the interbank market, also on a margin basis. The Company deposits margin collateral with large money center banks and other major financial institutions. The Company is subject to credit risk or loss from counterparty nonperformance. The Company seeks to control the risks associated with its customers’ activities by requiring its customers to maintain margin collateral. The trading platform does not allow customers to enter into trades if sufficient margin collateral is not on deposit with the Company.
The Company developed risk-management systems and procedures that allow it to manage the market and credit risk associated with managed flow activities in real-time. The Company does not actively initiate directional market positions in anticipation of future movements in the relative prices of currencies and evaluates market risk exposure on a continuous basis. As a result of the Company’s hedging activities, the Company is likely to have open positions in various currencies at any given time. An additional component of the risk-management approach is that levels of capital are maintained in excess of those required under applicable regulations. The Company also maintains liquidity relationships with three established, global prime brokers and at least six other wholesale forex trading partners, providing the Company with access to a forex liquidity pool.
Litigation
The Company contests liability and/or the amount of damages as appropriate in each pending matter. Where available information indicates that it is probable a liability had been incurred at the date of the consolidated financial statements and the Company can reasonably estimate the amount of that loss, the Company accrues the estimated loss by a charge to income. In many proceedings, however, it is inherently difficult to determine whether any loss is probable or even possible or to estimate the amount of any loss. In addition, even where loss is possible or an exposure to loss exists in excess of the liability already accrued with respect to a previously recognized loss contingency, it is not possible to reasonably estimate the size of the possible loss or range of loss.
For certain legal proceedings, the Company can estimate possible losses, additional losses, ranges of loss or ranges of additional loss in excess of amounts accrued, but does not believe, based on current knowledge and after consultation with counsel, such losses will have a material adverse effect on the Company’s results of operations, cash flows or financial condition. For certain other legal proceedings, the Company cannot reasonably estimate such losses, if any, since the Company cannot predict if, how or when such proceedings will be resolved or what the eventual settlement, fine, penalty or other relief, if any, may be, particularly for proceedings that are in their early stages of development or where plaintiffs seek substantial or indeterminate damages. Numerous issues must be developed, including the need to discover and determine important factual matters and the need to address novel or unsettled legal questions relevant to the proceedings in question, before a loss or additional loss or range of loss or additional loss can be reasonably estimated for any proceeding.
F-16
Table of Contents
Write-Off of Initial Public Offering Costs
The Company deferred costs incurred for an initial public offering (“IPO”) of common stock in 2008 including legal, audit, tax and other professional fees. The IPO was delayed due to market conditions, and as a result the Company recorded a write-off of the deferred costs of $1.9 million incurred during the year ended December 31, 2008.
Recent Accounting Pronouncements
In December 2010, the Financial Accounting Standards Board, or FASB, issued Accounting Standards Update, or ASU, 2010-29, Disclosure of Supplementary Pro Forma Information for Business Combinations. This new standard impacts the pro forma reporting requirements for public companies that enter into business combinations that are material on an individual or aggregate basis. This new standard is effective for the Company beginning in the first quarter of 2011, however early adoption is permitted. The Company does not expect this new standard to significantly impact its consolidated financial statements.
In December 2010, the FASB issued ASU No. 2010-28, Intangibles — Goodwill and Other (ASC 350): When to Perform Step 2 of the Goodwill Impairment Test for Reporting Units with Zero or Negative Carrying Amounts — a consensus of the FASB Emerging Issues Task Force, which modifies Step 1 of the goodwill impairment test for reporting units with zero or negative carrying amounts. This amendment requires an entity to perform Step 2 of the goodwill impairment test if it is more likely than not that a goodwill impairment exists and to consider whether there are any adverse qualitative factors indicating that an impairment may exist. ASU No. 2010-28 is effective for fiscal years, and interim periods within those years, beginning after December 15, 2010. The adoption of ASU No. 2010-28 did not have a material impact on the Company’s consolidated financial statements.
In July 2010, the FASB issued ASU 2010-20, Disclosures about the Credit Quality of Financing Receivables and the Allowance for Credit Losses, which requires significant new disclosures about the allowance for credit losses and the credit quality of financing receivables. The requirements are intended to enhance transparency regarding credit losses and the credit quality of loan and lease receivables. Under this statement, allowance for credit losses and fair value are to be disclosed by portfolio segment, while credit quality information, impaired financing receivables and nonaccrual status are to be presented by class of financing receivable. The disclosures are to be presented at the level of disaggregation that management uses when assessing and monitoring the portfolio’s risk and performance. The adoption of ASU 2010-20 did not have a material impact on the Company’s consolidated financial statements.
In February 2010, the FASB issued ASU 2010-09, Subsequent Events (“ASU 2010-09”). ASU 2010-09 amends ASC 855, Subsequent Events, by requiring less disclosure regarding subsequent events. ASU 2010-09 changes the criteria for determining whether an entity would evaluate subsequent events through the date that financial statements are issued or when they are available to be issued. The Company is still required to evaluate subsequent events through the date that the financial statements are issued. ASU 2010-09 was effective for the Company’s interim period ended June 30, 2010. The adoption of ASU 2010-09 did not have a material impact on the Company’s consolidated financial statements.
In January 2010, the FASB issued ASU, 2010-6, Improving Disclosures About Fair Value Measurements (“ASU 2010-06”). ASU 2010-6 provides new disclosures and clarifications of existing disclosures and is effective for interim and annual reporting periods beginning after December 15, 2009, except for disclosures about purchases, sales, issuances, and settlements in the roll-forward activity in Level 3 fair value measurements. Those disclosures are effective for fiscal years beginning after December 15, 2010, and for interim periods within those fiscal years. Therefore, ASU 2010-06 was effective for the Company’s fiscal year beginning January 1, 2010. The adoption of ASU 2010-06 did not have a material impact on the Company’s consolidated financial statements.
F-17
Table of Contents
In June 2009, the FASB issued ASC 810, Consolidation, which changes how a reporting entity determines when an entity that is insufficiently capitalized or is not controlled through voting (or similar rights) should be consolidated. The determination of whether a reporting entity is required to consolidate another entity is based on, among other things, the other entity’s purpose and design and the reporting entity’s ability to direct the activities of the other entity that most significantly impact the other entity’s economic performance. The adoption of ASC 810 by the Company in January 1, 2010 did not have a material impact on the Company’s consolidated financial statements.
| 3. | Fair Value Disclosures |
The following table presents the Company’s assets and liabilities that are measured at fair value and the related hierarchy levels:
| Fair Value Measurements on a Recurring
Basis as of December 31, 2010 |
||||||||||||||||||||
| Level 1 | Level 2 | Level 3 | Netting(1) | Total | ||||||||||||||||
| (in thousands) | ||||||||||||||||||||
| Assets: |
||||||||||||||||||||
| Money market accounts |
$ | 82,526 | — | — | — | $ | 82,526 | |||||||||||||
| Certificates of deposit |
$ | 75 | — | — | — | $ | 75 | |||||||||||||
| Equity securities |
$ | 60 | — | — | — | $ | 60 | |||||||||||||
| U.S. treasury securities |
$ | 20,000 | — | — | — | $ | 20,000 | |||||||||||||
| Futures contracts |
$ | (70 | ) | — | — | $ | 123 | $ | 53 | |||||||||||
| Investment in gold |
$ | 142 | — | — | — | $ | 142 | |||||||||||||
| Liabilities: |
||||||||||||||||||||
| CMS Contingent Liability |
$ | — | — | $ | 1,429 | — | $ | 1,429 | ||||||||||||
| Fair Value Measurements on a Recurring
Basis as of December 31, 2009 |
||||||||||||||||||||
| Level 1 | Level 2 | Level 3 | Netting(1) | Total | ||||||||||||||||
| (in thousands) | ||||||||||||||||||||
| Assets: |
||||||||||||||||||||
| Money market accounts |
$ | 88,281 | — | — | — | $ | 88,281 | |||||||||||||
| Certificates of deposit |
$ | 4,276 | — | — | — | $ | 4,276 | |||||||||||||
| Equity securities |
$ | 43 | — | — | — | $ | 43 | |||||||||||||
| U.S. treasury securities |
$ | 24,997 | — | — | — | $ | 24,997 | |||||||||||||
| Futures contracts |
$ | (143 | ) | — | — | $ | 182 | $ | 39 | |||||||||||
| Investment in gold |
$ | 110 | — | — | — | $ | 110 | |||||||||||||
| Liabilities: |
||||||||||||||||||||
| Convertible, redeemable preferred stock embedded derivative |
$ | — | — | $ | 81,098 | — | $ | 81,098 | ||||||||||||
| (1) | Represents cash collateral netting. |
There were no transfers between levels for the year ended December 31, 2010.
Level 1 Financial Assets
The Company has money market accounts, certificates of deposit, equity securities, U.S. treasury securities, futures contracts and an investment in gold that are Level 1 financial instruments that are recorded based upon listed or quoted market rates. The money market accounts are recorded in Cash and cash equivalents, the certificates of deposit are recorded in Short term investments, the equity securities and U.S. treasury securities are recorded in Trading securities and the futures contracts and investment in gold are recorded in Receivables from brokers.
F-18
Table of Contents
Level 3 Financial Assets
The Company has a contingent liability associated with the future payments to be made to CMS based upon revenues generated from the CMS customers for an eighteen month period following the acquisition and an embedded derivative liability associated with the conversion feature of its convertible, redeemable preferred stock.
The Company measures the fair value of the future payments to CMS based upon estimated cash flows See Note 6 for additional information.
The Company measures the fair value of the embedded derivative through the use of unobservable inputs which include estimations for the expected volatility of common stock, an appropriate risk-free interest rate plus a credit spread and the fair value of the common stock. See Note 10 for additional information.
The table below provides a reconciliation of the fair value of the embedded derivative measured on a recurring basis for which the Company used Level 3 for the year ended December 31, 2010 (amounts in thousands):
| Beginning January 1, 2010 |
$ | 81,098 | ||
| Unrealized gain included in change in fair value of convertible, redeemable preferred stock embedded derivative |
(4,691 | ) | ||
| Purchases, issuances and settlements |
76,407 | |||
| Transfers in/out of Level 3 |
— | |||
| Balance at December 31, 2010 |
$ | — | ||
The Level 3 purchases, issuances and settlements is attributable to the change in fair value of the convertible, redeemable preferred stock embedded derivative related to the conversion of all series of preferred stock during 2010 as a result of the IPO.
| 4. | Receivables From Brokers |
Amounts receivable from brokers consisted of the following at December 31 (amounts in thousands):
| 2010 | 2009 | |||||||
| Required collateral |
$ | 26,561 | $ | 15,080 | ||||
| Cash in excess of required collateral |
75,443 | 60,724 | ||||||
| Open spot foreign exchange positions |
(3,869 | ) | 587 | |||||
| $ | 98,135 | $ | 76,391 | |||||
The Company has posted funds with brokers as collateral as required by agreements for holding spot foreign exchange positions. In addition, the Company has cash in excess of required collateral, which includes the value of futures contracts of $0.1 million recorded based upon listed or quoted market rates that approximate fair value at December 31, 2010. Open foreign exchange positions include the unrealized gains or losses due to the differences in exchange rates between the dates at which a trade was initiated versus the exchange rates in effect at the date of the consolidated financial statements. These amounts are reflected as Receivables from brokers in the Consolidated Statements of Financial Condition.
F-19
Table of Contents
| 5. | Property and Equipment |
Property and equipment, including leasehold improvements and capitalized software development costs, consisted of the following as of December 31 (amounts in thousands):
| 2010 | 2009 | |||||||
| Software |
$ | 10,120 | $ | 7,846 | ||||
| Computer equipment |
4,587 | 3,801 | ||||||
| Leasehold improvements |
1,359 | 1,235 | ||||||
| Telephone equipment |
642 | 609 | ||||||
| Office equipment |
223 | 226 | ||||||
| Furniture and fixtures |
198 | 93 | ||||||
| Web site development costs |
629 | 87 | ||||||
| 17,758 | 13,897 | |||||||
| Less: Accumulated depreciation and amortization |
(10,464 | ) | (7,054 | ) | ||||
| Property and equipment, net |
$ | 7,294 | $ | 6,843 | ||||
Depreciation expense was $3.4 million, $2.7 million, and $2.3 million for the years ended December 31, 2010, 2009 and 2008, respectively.
| 6. | Intangible Assets |
In 2003, the Company acquired the Forex.com domain name for $0.2 million, and in 2004, the foreignexchange.com domain name was purchased for $0.1 million. Based on the fact that the rights to use these domain names requires the payment of a nominal annual renewal fee, management determined that there was no legal or regulatory limitations on the useful life and furthermore that there is currently no technological limitation to their useful lives. These indefinite-lived assets are not amortized. In accordance with ASC 350-10, the Company tests intangible assets for impairment on an annual basis in the fourth quarter and on an interim basis when conditions indicate impairment has occurred.
The Company acquired a marketing list in November 2006 for $0.8 million that is being amortized over its useful life, with an amortization period no longer than 18 months. Amortization of $0.2 million was recorded in 2008, with no impairment recorded. The marketing list was fully amortized as of June 30, 2008.
In August 2010, the Company acquired the account balances and effective customer agreements, customer list and marketing list from MG Financial LLC, or (“MG”), for $0.5 million. The total retail forex customer assets acquired from MG were $3.1 million. The customer and marketing lists are intangible assets and are being amortized over their useful lives of one year.
In October 2010, the Company acquired the customer account balances and effective customer agreements from Capital Market Services, LLC, or (“CMS”), for a total of $8.0 million. The Company determined the fair value of the assets acquired was $9.4 million, which includes the payments made to acquire the assets and approximately $1.4 million of future payments at fair value to be made to CMS based upon revenues generated from the CMS customers for an eighteen month period following the acquisition. The future payments are considered a contingent liability and the Company will mark to market the liability on a quarterly basis. The total retail forex customer assets acquired from CMS were $31.9 million. The purchase price was allocated to customers list and is being amortized over its useful life of 18 months.
F-20
Table of Contents
As of December 31, 2010 and 2009, the accumulated amortization related to intangibles was $2.0 million and $0.8 million, respectively. Intangible assets consisted of the following (amounts in thousands):
| Balance at January 1, 2008 |
$ | 523 | ||
| Amortization of marketing list |
(203 | ) | ||
| Balance at December 31, 2008 |
320 | |||
| Balance at December 31, 2009 |
320 | |||
| Purchase of MG customer and marketing list |
469 | |||
| Purchase of CMS customer list |
9,465 | |||
| Purchase of indefinite life intangible assets |
43 | |||
| Amortization |
(1,208 | ) | ||
| Balance at December 31, 2010 |
$ | 9,089 | ||
The expected amortization expense for the years ended December 31, 2011 and 2012 is $6.6 million and $2.1 million, respectively.
| 7. | Acquisitions |
Goodwill is calculated as the difference between the cost of acquisition and the fair value of the net assets of an acquired business. Goodwill consists of the following as of December 31, 2010 and 2009 (amounts in thousands):
| GC Japan (formerly, FORTUNE) |
$ | 1,278 | ||
| GCAM, LLC |
1,078 | |||
| GAIN Capital Securities, Inc. (formerly, State Discount Brokers, Inc.) |
533 | |||
| GAIN Capital Forex.com U.K., Ltd (formerly, RCGGL) |
203 | |||
| $ | 3,092 | |||
The Company owns GCAM, LLC. The Company issued 68,250 Restricted Stock Units (“RSUs”) in exchange for 13,980 shares in GCAM, LLC. The RSU agreement relating to the purchase of GCAM, LLC in 2007 was revised, so that the restricted shares at January 1, 2008 unrestrict over 24 months. At December 31, 2010 and 2009, the goodwill associated with the acquisition was $1.1 million.
The joint venture, entered into on December 20, 2007 and known as RCGGL, received regulatory approval from the U.K. Financial Services Authority (“U.K. FSA”) in January 2008 and was subsequently transferred to the Company on December 22, 2008 with a transfer of 100,000 shares. The Company acquired the remaining 100,000 shares of RCGGL owned by RCG on December 31, 2008, resulting in complete control of the legal entity. Goodwill associated with the purchase of RCG’s shares of RCGGL amounted to $0.2 million. RCG owned 50% interest in the joint venture, and the purchase and transfer of these shares provided the Company with 100% ownership of RCGGL, now known as GAIN Capital Forex.com U.K., Ltd.
The Company acquired GAIN Capital Securities, Inc. on October 3, 2008, generating $0.5 million in goodwill from the transaction.
Goodwill associated with the acquisition of 51% of the outstanding shares of GC Japan in December 2008 amounted to $1.3 million. In October 2009, the Company acquired an additional 19% of GC Japan per the purchase agreement for $1.3 million. In April 2010, the Company acquired the remaining 30% of GC Japan’s outstanding shares for $0.4 million, which did not generate any additional goodwill.
F-21
Table of Contents
The following schedule summarizes the effects of changes in the Company’s ownership interest in GC Japan on the Company’s equity (amounts in thousands):
| 2010 | 2009 | |||||||
| Net income attributable to GAIN Capital Holdings, Inc. |
$ | 37,845 | $ | 27,994 | ||||
| Transfers to the noncontrolling interest |
||||||||
| Decrease in GAIN Capital Holdings, Inc.’s paid-in capital for purchase of GC Japan common shares in 2010 and 2009 |
(614 | ) | (1,136 | ) | ||||
| Increase in noncontrolling interest related to acquisition of subsidiary |
394 | — | ||||||
| Change from net income attributable to GAIN Capital Holdings Inc. and transfers to noncontrolling interest |
$ | 37,625 | $ | 26,858 | ||||
The acquisitions, individually and in the aggregate, did not meet the conditions of a material business combination and therefore were not subject to the disclosure requirements of ASC 805, Business Combinations. The consolidated financial statements include the operating results of each business from the date of acquisition. No goodwill impairment was recorded for the years ended December 31, 2010, 2009 and 2008.
| 8. | Other Assets |
Other assets consisted of the following at December 31 (amounts in thousands):
| 2010 | 2009 | |||||||
| Vendor and security deposits |
$ | 3,603 | $ | 3,371 | ||||
| Current tax receivable |
1,826 | 3,646 | ||||||
| Deferred tax assets |
3,119 | 1,892 | ||||||
| Miscellaneous receivables |
2,492 | 543 | ||||||
| $ | 11,040 | $ | 9,452 | |||||
| 9. | Notes Payable |
The Company has a $52.5 million term loan and a $20.0 million revolving line of credit through a loan and security agreement with Silicon Valley Bank and JPMorgan Chase Bank. The term loan is payable in 20 quarterly installments of principal and the payments commenced on October 1, 2007. Interest is paid monthly and is based upon the prime rate of interest plus 0.5%. Under the terms of the term loan, when the total funded debt drops below earnings before income tax expense, interest expense, and depreciation and amortization expense, or EBITDA, the interest rate will decline by 0.5%. The interest rate as of December 31, 2010 was 3.75%. The term loan is secured by certain of our assets, a pledge of our membership interests in our wholly-owned subsidiary GAIN Holdings, LLC and a guarantee by GAIN Holdings, LLC. The term loan maturity date is July 1, 2012. Interest for the revolving line of credit accrues at a floating per annum rate equal to the prime rate of interest plus 0.5%. The amount of availability under the revolving line of credit is determined by subtracting from $20.0 million the amount outstanding under the revolving line of credit. The revolving line of credit maturity date is June 16, 2011. We intend to renew the revolving line of credit upon maturity. As of December 31, 2010, we had $18.4 million outstanding under the term loan and no amounts were outstanding under the revolving line of credit. In accordance with the provisions of our term loan and revolving line of credit as outlined in the loan and security agreement and subsequent modifications, we are required to adhere to various financial, regulatory, operational and reporting covenants. As of December 31, 2010 and during the entire term of such loan, we were in compliance with such covenants.
F-22
Table of Contents
The carrying amount of notes payable approximates fair value. The Company had a balance of $18.4 million and $28.9 million outstanding on the term loan as of December 31, 2010 and 2009, respectively, with future maturities of the notes payable as follows (amounts in thousands):
| Years Ended December 31: |
||||
| 2011 |
$ | 10,500 | ||
| 2012 |
7,875 | |||
| $ | 18,375 | |||
Loan fees were capitalized to deferred finance costs and are being amortized over the life of the loan. Deferred loan costs amortized to interest expense were $0.1 million for the years ended December 31, 2010, 2009 and 2008, respectively. The Company had Deferred financing costs on the Consolidated Statements of Financial Condition of $0.1 million and $0.2 million at December 31, 2010 and 2009, respectively.
| 10. | Convertible, Redeemable Preferred Stock |
Convertible, Redeemable Series A Preferred Stock — At December 31, 2009, the Company has authorized 4,545,455 shares of Convertible, redeemable Series A Preferred Stock (“Series A”). The Series A shares convert on a one for one basis. The liquidation value of Series A is calculated as the purchase price of the shares plus 8 percent per year, commencing upon the initial issuance date. The Series A redemption price is calculated based upon the greater of (i) the purchase price plus all unpaid dividends, compounded annually from the date of issuance or (ii) the fair market value of the Series A as if converted to Common Stock.
Convertible, Redeemable Series B Preferred Stock — At December 31, 2009, the Company has authorized 7,000,000 shares of Convertible, redeemable Series B Preferred Stock (“Series B”). The Series B shares are convertible into common shares on a one for one basis. Conversion may occur with a majority vote, or with automatic conversion upon an initial public offering. In the event of default or liquidation, the value of these preferred shares is calculated as the greater of (i) 200 percent of the original purchase price per share ($2.22) or (ii) the amount that would be payable in such liquidation to the holder of that number of common shares into which each share of Series B would be convertible immediately prior to such liquidation.
The Company’s board of directors and shareholders voted on January 31, 2005 to change the mandatory redemption features of the Series B to require a super majority vote of the shareholders in the class. The Series B redemption price is calculated as the greater of (i) the original purchase price, plus an amount equal to (a) 50 percent of accrued earnings from the date of issuance to the date of redemption divided by (b) number of outstanding shares of Series B, provided that the amount shall not exceed all unpaid dividends (at 12 percent, compounded annually) or (ii) the fair market value of Series B as if converted into Common Stock, based upon an independent appraisal.
In accordance with EITF No. 00-27, Application of Issue No. 98-5 to Certain Convertible Instruments, and after considering the allocation of the proceeds to the Series B, the Company determined that the Series B contained a beneficial conversion feature (“BCF”). In prior years, the Series B Preferred Stock had a stated mandatory redemption date of August 1, 2008, so the Company was amortizing the BCF over the period from issuance until the redemption date. The BCF was subsequently eliminated pursuant to the Company’s Amended and Restated Certificate of Incorporation.
The Series B were issued with attached warrants to purchase Series B at $1.11 per share. The Company allocated the proceeds, net of cash transaction costs, to the Series B Preferred Stock and warrants based on the relative fair value of each instrument. The fair value of the Series B was determined based on a discounted cash flow analysis and the fair value of the warrants was determined based on the Black-Scholes options pricing model.
F-23
Table of Contents
Warrants totaling 3,297,733 to purchase Series B remain outstanding as of December 31, 2010 and 2009, respectively.
Convertible, Redeemable Series C Preferred Stock — At December 31, 2009, the Company has authorized and issued 2,496,879 shares of convertible, redeemable Series C Preferred Stock (“Series C”). The Series C shares are convertible into common shares at a ratio of 1:1.284095064.
Preferred shares can be converted by a majority vote, as defined in the preferred stock agreement. The default or liquidation value of these preferred shares is calculated as the greater of (i) 200 percent of the original price per share and all unpaid dividends (at 15 percent, compounded annually) or (ii) the amount that would be payable in such liquidation to the holder of that number of common shares into which each share of Series C would be convertible immediately prior to such liquidation.
Prior to 2005, the Company was accreting the Series C to the redemption value using the effective interest method through the redemption period of five years. The Company’s board of directors and stockholders voted on January 31, 2005 to change the mandatory redemption features of Series C Preferred Stock, so that it is now redeemable on a super majority vote of the shareholders in the class. The Series C redemption price is calculated as equal to the greater of (i) the Series C Liquidation value which includes all unpaid dividends or (ii) the fair market value of Series C as if converted into Common Stock, based upon an independent appraisal.
Convertible, Redeemable Series D Preferred Stock — At December 31, 2009, the Company has authorized and issued 3,254,678 shares of convertible, redeemable Series D Preferred Stock for $40 million.
Preferred shares can be converted by a majority vote, as defined in the preferred stock agreement. The default or liquidation value of these preferred shares is calculated as the greater of (i) the sum of the Series D multiplier, or 1.5, times the Series D Original Purchase Price plus all unpaid dividends (at 12 percent, compounded annually) or (ii) the amount that would be payable in such liquidation to the holder of that number of common shares into which each share of Series D would be convertible immediately prior to such liquidation.
Convertible, Redeemable Series E Preferred Stock — At December 31, 2009, the Company authorized 3,738,688 shares and issued 2,611,606 shares of convertible, redeemable Series E Preferred Stock for $117 million, incurring $0.2 million in issuance costs.
Preferred shares can be converted by a majority vote, as defined in the preferred stock agreement. The default or liquidation value of these preferred shares is calculated as the greater of (i) the Series E Original Purchase Price plus all unpaid dividends (at 8 percent, compounded annually) or (ii) the amount that would be payable in such liquidation to the holder of that number of common shares into which each share of Series E would be convertible immediately prior to such liquidation.
The net proceeds from the issuance of Series E Preferred Stock were used to repurchase Series A (1,162,248 shares), Series B (1,601 shares), and Series C Preferred Stock (173,831 shares) and common stock (914,572 shares), thus reducing the number of shares outstanding on a fully diluted basis. Employees holding fully vested stock option awards were able to convert a portion of their options to common stock, subject to repurchase by the Company. Existing shareholders received the same election. As a result of this election, there were 66,530 RSUs converted into common stock on a 1:1 ratio as of December 31, 2008.
Pursuant to the Second Amended and Restated Certificate of Incorporation dated January 11, 2008, there will be an adjustment to the conversion price with respect to the Series E preferred stock if the initial public offering Offer Price or Revised Offer Price, as applicable (each as defined in our Second Amended and Restated Certificate of Incorporation), is less than $53.76.
F-24
Table of Contents
Each preferred stock shareholder who sold shares back to the Company pursuant to a repurchase agreement is required by the repurchase agreement to indemnify the Company if there is an adjustment to the Series E preferred stock conversion price, subject to the indemnification limits described below. In such an event, the shareholders will, severally (and not jointly) and pro rata to the payments they received for the repurchased securities sold by each shareholder, indemnify the Company in an aggregate amount equal to the product of (a) the number of additional shares of common stock issuable as a result of any adjustment to the Series E preferred stock conversion price with respect to 2,070,312 out of a total of 3,738,688 authorized shares of Series E preferred stock, multiplied by (b) the offer price or revised offer price, as applicable. The preferred stock shareholder shall be entitled to make any indemnification payments in cash or in shares of Company common stock. The repurchase agreement provides that the indemnification obligation is capped at an offer price or revised offer price, as applicable, of $48.96. Should the offer price or revised offer price, as applicable, be lower than $48.96, it shall be deemed to be $48.96 for the purpose of calculating the indemnification amount.
Dividends — As set forth in the Amended and Restated Certificate of Incorporation dated January 11, 2008, dividends can be issued upon approval in writing by holders of a majority of the outstanding shares of preferred stock, voting together as a single class, if the board of directors determines that the fully diluted equity value of the Company exceeds $400 million. Dividends would be declared and paid to the holders of common stock and preferred stock (on an as-converted basis).
Rank — The Series D Preferred Stock ranks senior to the Series A, Series B, Series C, and Series E Preferred Stock and the common stock as to dividends and upon redemption, liquidation, or default. Series C and Series B Preferred Stock rank equally and senior to Series A, Series E and common stock as to dividends and upon redemption, liquidation or default. Series A Preferred Stock ranks senior to Series E Preferred Stock and common stock as to dividends and upon redemption, liquidation or default, with Series E then ranking senior to common stock.
Rights and Privileges on Convertible, Redeemable Preferred Stock — At December 31, 2009, the Company had five series of convertible, redeemable preferred stock subject to certain rights and privileges under the Company’s Second Amended and Restated Certificate of Incorporation.
The Company classified the convertible, redeemable preferred stock as mezzanine equity on the Consolidated Statements of Financial Condition at December 31, 2009 at the carrying value of the preferred stock.
The following table presents a summary of the convertible, redeemable preferred stock (amounts in thousands):
| Preferred Stock Series A |
Preferred Stock Series B |
Preferred Stock Series C |
Preferred Stock Series D |
Preferred Stock Series E |
Total Convertible, Redeemable Preferred Stock |
|||||||||||||||||||
| BALANCE — December 31, 2009 |
$ | 2,009 | $ | 5,412 | $ | 5,319 | $ | 39,840 | $ | 116,810 | $ | 169,390 | ||||||||||||
As a result of the Company’s IPO, the convertible, redeemable preferred stock was converted to common stock and there is no outstanding convertible, redeemable preferred stock at December 31, 2010.
Automatic Conversion — Preferred stock converts to common stock immediately prior to a qualified initial public offering (“IPO”), as defined in the investor rights agreement for each series of preferred stock. Series A, Series B, Series D preferred stock convert on a one-to-one basis into shares of common stock, and the Series C preferred stock converts on a 1:1284095064 basis into shares of common stock. This conversion took place on December 14, 2010 in connection with the successful completion of a qualified IPO.
If the majority of Series E preferred stockholders vote to do so, or the IPO price equals or exceeds $67.20, all outstanding shares of Series E preferred stock will be converted on a one-to-one basis into shares of common stock. If the IPO price is less than $67.20, the Series E preferred stock will be converted into shares of common stock if a majority of all preferred stockholders, voting as one class, approve such conversion. In the event there
F-25
Table of Contents
is a conversion of Series E preferred stock where the IPO price is less than $53.76, there will be an adjustment to the Series E preferred stock conversion price as outlined in the Second Amended and Restated Certificate of Incorporation dated January 11, 2008.
Preferred Stock Embedded Derivative — The Company has determined that the conversion feature in the Company’s Convertible, Redeemable Preferred Stock Series A, Series B, Series C, Series D and Series E meets the definition of an “embedded derivative” in accordance with ASC 815, Derivatives and Hedging.
The redemption feature enabled the holder to elect a net cash settlement at date of redemption. This event is deemed to be outside the control of the Company. These provisions required that these instruments be bifurcated such that the embedded conversion option is separated from the host contract, and accounted for as a derivative liability.
The pricing model that the Company uses for determining fair values of the embedded derivative is a Black-Scholes options pricing model, which requires the input of highly subjective assumptions. These assumptions include estimating the expected volatility of our common stock, an appropriate risk-free interest rate plus a credit spread and the fair value of the underlying common stock. The expected volatility is calculated based on stock volatilities for publicly traded companies in a similar industry and general stage of development as the Company. The risk-free interest rate is based on the U.S. Treasury yield curve consistent with the expected life of the preferred shares until the date of redemption. The expected term of the conversion option is based upon the period remaining until the redemption date of March 31, 2011. Valuations derived from this model are subject to ongoing internal and external verification and review. Separating an embedded derivative from its host contract requires careful analysis and judgment, and an understanding of the terms and conditions of the instrument. Selection of inputs involves management’s judgment and may impact net income.
At December 31, 2009 the embedded derivative is recorded at fair value and reported in Preferred stock embedded derivative on the Consolidated Statements of Financial Condition with change in fair value recorded in the Company’s Consolidated Statements of Operations and Comprehensive Income. The gains on the embedded derivative amounted to $4.7 million, $1.7 million and $181.8 million for the years ended December 31, 2010, 2009 and 2008, respectively.
The following summarizes the preferred stock conversion value by preferred stock share class as of December 31, 2009 (amounts in thousands):
| 2009 | ||||
| Preferred stock series A |
$ | 14,308 | ||
| Preferred stock series B |
41,490 | |||
| Preferred stock series C |
14,471 | |||
| Preferred stock series D |
10,462 | |||
| Preferred stock series E |
367 | |||
| $ | 81,098 | |||
| 11. | Shareholders’ Equity / (Deficit) |
Common Stock — At December 31, 2010 and 2009, the Company had authorized 60,000,000 shares of Common Stock (“Common Stock”), of which 31,174,651 and 2,966,034 shares were issued and outstanding, respectively.
In connection with the IPO, the Company received net proceeds of $3.4 million and is entitled to receive an additional $0.6 million from the underwriters for reimbursement of out-of-pocket expenses. The Company had deferred initial public offering costs of $3.8 million, which were applied to the net proceeds in Additional Paid-in Capital on the Consolidated Statement of Financial Condition. In addition, the convertible, preferred stock was converted to common stock and the preferred stock liability associated with the conversion feature was settled.
F-26
Table of Contents
As a result, the Company reclassified the convertible, redeemable preferred stock and the associated preferred stock liability of $169.4 million and $76.4 million, respectively, to Additional Paid-in Capital on the Consolidated Statement of Financial Condition.
| 12. | Related Party Transactions |
Management has personal funds on deposit in customer accounts of Group, LLC, recorded in Payables to customers on the Consolidated Statements of Financial Condition. The balance was $2.8 million and $2.9 million at December 31, 2010 and 2009, respectively.
Group, LLC entered into a services agreement with Scivantage, Inc. on February 1, 2008 for a one year term with an option to renew whereby Scivantage provided certain office workstations and related services in Jersey City, New Jersey. The agreement was later amended to add additional workstations and services extending the term until December 31, 2009 for a fee of $14,475 per month. Per its terms, the agreement automatically renewed for an additional one year and expired on December 31, 2010. Scivantage also provides hosting services to GCSI under a master hosting services agreement entered into on September 16, 2003 in which Scivantage provides the technology infrastructure hosting facility for GCSI, who provides brokerage securities services. Two of our board of directors members, Messrs. Galant and Sugden, are members of the board of directors of Scivantage.
| 13. | Share Based Payment |
On March 27, 2006, the Company’s shareholders approved the GAIN Capital Holdings, Inc. 2006 Equity Incentive Plan (the “Plan”), under which 12.5 million shares are available for awards to employees, consultants and directors. The Plan provides for the issuance of share based award which include restricted stock units (“RSUs”), Incentive Stock Options (“ISOs”), and nonqualified stock options (“NQSQs”). ISOs are granted at fair market value and are subject to the requirements of Section 422 of the Internal Revenue Code of 1986, as amended. All share based awards are granted at a price or conversion price determined by the Company’s board of directors. Grants of stock options usually vest over three or four years upon anniversary date. RSUs usually vest over four years with one-fourth vesting upon the grant anniversary. All options granted under these plans expire ten years from the date of grant.
On November 22, 2010, the Company’s board of directors adopted the GAIN Capital Holdings, Inc. 2010 Omnibus Incentive Compensation Plan, (the “2010 Plan”), which became effective December 13, 2010 (the day immediately prior to the date the underwriting agreement was executed and the Common Stock was priced for the IPO). In addition, on November 23, 2010 the Company’s board of directors approved a 2.29-for 1 stock split of the Company’s common stock effective immediately prior to the completion of the IPO. Accordingly, all references to stock options, exercise prices and RSUs have been retroactively restated to reflect the stock split as if it had occurred at the beginning of the earliest period presented. As of the effective date of the 2010 Plan, the 2006 Plan was merged with and into the 2010 Plan, and no additional grants will be made under the 2006 Plan. The 2010 Plan makes available 8.5 million shares (1.4 million to be issued pursuant to future awards and grants under the 2010 Omnibus Incentive Compensation plan, 6.6 million shares that are subject to outstanding grants under the 2006 Plan as of the effective date of the 2010 Plan, and 0.5 million shares to be issued pursuant to the 2011 Employee Stock Purchase Plan) for awards to employees, nonemployee directors and consultants and advisors in the form of incentive stock options, nonqualified stock options, stock awards, stock units, stock appreciation rights and other stock-based awards.
Under the 2010 Plan, the committee will determine the exercise price of the options granted and may grant options to purchase shares of our common stock in amounts as determined by the committee. The committee may grant options that are intended to qualify as incentive stock options (“ISOs”) under Section 422 of the Internal Revenue Code, or nonqualified stock options (“NQSQs”), which are not intended to so qualify. ISOs may only be granted to employees. Anyone eligible to participate in the 2010 Plan may receive a grant of NQSQs. The exercise price of a stock option granted under the Plan cannot be less than the fair market value of a share of our common stock on the date the option is granted.
F-27
Table of Contents
Stock Options
The following table summarizes the stock option activity under all plans from January 1, 2010 through December 31, 2010:
| Number of Options |
Weighted Average Exercise Price |
Weighted Average Remaining Life (Years) |
Aggregate Intrinsic Value |
|||||||||||||
| Outstanding, January 1, 2010 |
3,505,185 | $ | 1.72 | |||||||||||||
| Granted |
1,325,095 | $ | 3.83 | |||||||||||||
| Exercised |
(75,448 | ) | $ | 1.42 | ||||||||||||
| Forfeited |
(73,636 | ) | $ | 2.08 | ||||||||||||
| Outstanding, December 31, 2010 |
4,681,196 | $ | 2.32 | 5.6 | $ | 32,191,376 | ||||||||||
| Vested and expected to vest options |
4,608,828 | $ | 2.30 | 5.5 | $ | 31,803,178 | ||||||||||
| Exercisable, December 31, 2010 |
3,508,251 | $ | 1.82 | 4.3 | $ | 25,899,497 | ||||||||||
| Fair market value of common stock at exercise date |
$ | 572,588 | ||||||||||||||
| Cost to exercise |
107,075 | |||||||||||||||
| Net value of Stock Options exercised |
$ | 465,513 | ||||||||||||||
The following table summarizes information concerning outstanding and exercisable stock options as of December 31, 2010:
| Options Outstanding | Options Exercisable | |||||||||||||||||||
| Exercise Price |
Number Outstanding As of 12/31/10 |
Weighted Average Exercise Price |
Weighted Average Remaining Contractual Life (Years) |
Number of Options Exercisable |
Weighted Average Exercise Price |
|||||||||||||||
| $0.38 |
9,045 | $ | 0.38 | 1.09 | 9,045 | $ | 0.38 | |||||||||||||
| $0.77 |
460,882 | 0.77 | 2.48 | 460,882 | 0.77 | |||||||||||||||
| $1.11 |
466,007 | 1.11 | 3.21 | 466,007 | 1.11 | |||||||||||||||
| $1.55 |
423,668 | 1.55 | 4.09 | 423,668 | 1.55 | |||||||||||||||
| $1.99 |
1,365,658 | 1.99 | 4.47 | 1,365,658 | 1.99 | |||||||||||||||
| $2.43 |
586,672 | 2.43 | 4.94 | 586,672 | 2.43 | |||||||||||||||
| $2.87 |
59,585 | 2.87 | 5.09 | 59,585 | 2.87 | |||||||||||||||
| $3.32 |
1,544 | 3.32 | 5.15 | 1,544 | 3.32 | |||||||||||||||
| $3.83 |
1,308,135 | 3.83 | 9.58 | 135,190 | 3.83 | |||||||||||||||
| 4,681,196 | $ | 2.32 | 5.6 | 3,508,251 | $ | 1.82 | ||||||||||||||
The weighted-average remaining contractual life for the 4.7 million outstanding options as of December 31, 2010, is approximately 5.6 years. There are 3.5 million stock options exercisable as of December 31, 2010. The total intrinsic value of stock options exercised during 2010, 2009 and 2008 respectively were $0.5 million, $0.1 million and $25.4 million. During 2010, the Company had 0.1 million shares of stock options vest. The Company received $0.1 million, $0.01 million, and $1.7 million from stock option exercises in 2010, 2009 and 2008, respectively.
No stock options were granted in 2008 or 2009. In 2010, 1.3 million options were granted under the 2006 Plan, of which 1.0 million was granted to employees and 0.3 million was granted to board of director’s members, and no options were granted under the 2010 Plan.
F-28
Table of Contents
The fair market value of the options granted during 2010 was estimated based on a Black Scholes option pricing valuation model using the following assumptions as approved by the Compensation Committee of the Company’s Board of Directors.
| For the fiscal year ended December 31, | ||
| 2010 | ||
| Average risk-free interest rate |
2.43% | |
| Expected dividend yield |
— % | |
| Expected life |
6.25 years | |
| Expected volatility |
33.45% |
The expected volatility was calculated based upon the volatility of public companies in similar industries or financial service companies. The average risk free rate is based upon the risk free rate of the U.S. Treasury bond rate with a maturity commensurate with the expected term. The Company has no history or expectation of paying cash dividends on its common stock.
The Company recorded stock-based compensation expense related to options in accordance with ASC 718-10 of $0.3 million in 2010. Stock-based compensation expense associated with stock options was immaterial in both 2009 and 2008. The stock-based compensation expense is recorded in Employee compensation and benefits on the Consolidated Statements of Operations and Comprehensive Income.
Restricted Stock Units — The Plan provides for the issuance of RSUs that are convertible on a 1:1 basis into shares of GAIN Capital Holdings, Inc.’s common stock. GAIN Capital Holdings, Inc. maintains a restricted unit account for each grantee. Restrictions lapse over four years, with 25% lapsing on each anniversary date of the grant. After the restrictions lapse, the grantee shall receive payment in the form of cash, shares of GAIN Capital Holdings, Inc.’s common stock, or in a combination of the two, as determined by GAIN Capital Holdings, Inc., upon a change in control of GAIN Capital Holdings, Inc. or the employee leaving the Company. GAIN Capital Holdings, Inc. may also issue performance grants which have restrictions lapsing immediately, but delivery of the common stock deferred until a later date.
GAIN Capital Holdings, Inc. RSUs are assigned the value of the common stock at date of grant issuance, and the cost is amortized over a four year period. Under the 2006 Plan, GAIN Capital Holdings, Inc. issued 0.4 million and 0.5 million restricted units to employees in 2009 and 2008, respectively, with an additional 0.04 million and 0.03 million issued to board of director’s members that unrestricted immediately in 2009 and 2008, respectively. No restricted stock units were issued during 2010.
The Company recorded $5.1 million, $5.6 million and $4.4 million in stock-based compensation expense related to RSUs as of December 31, 2010, 2009 and 2008, respectively. GAIN Capital Holdings, Inc. recorded $0.1 million in stock-based compensation expense associated with the acquisition of GCAM, LLC in Employee compensation and benefits on the Consolidated Statements of Operations and Comprehensive Income for the year ended December 31, 2008.
A summary of the status of the Company’s nonvested shares of as of December 31, 2010 and changes during the year ended December 31, 2010, is presented below:
| Non-Vested Shares |
Number of Shares |
Weighted Average Grant Date Fair Value |
||||||
| Non-vested at January 1, 2010 |
1,026,248 | $ | 12.22 | |||||
| Granted |
— | |||||||
| Vested |
(408,933 | ) | 11.59 | |||||
| Forfeited |
(42,881 | ) | 12.70 | |||||
| Non-vested at December 31, 2010 |
574,434 | $ | 12.62 | |||||
F-29
Table of Contents
As of December 31, 2010 there was $4.8 million of total unrecognized compensation cost related to non-vested share-based compensation arrangements granted under the 2006 Plan. The cost is expected to be recognized over a weighted-average period of approximately two years. The fair market value on the grant date for RSUs vested during the years ended December 31, 2010, 2009 and 2008 was $4.7 million, $5.2 million and $3.1 million, respectively. The total value of the RSUs that unrestricted during the year ended December 31, 2010 was $2.2 million at the date they became unrestricted. RSUs that were unrestricted as of December 31, 2010 had a value at grant date of $14.1 million. The Company did not grant any RSUs during the year ended December 31, 2010. The fair market value of RSUs at the date of grant during the years ended December 31, 2009 and 2008 was $3.6 million and $8.7 million, respectively.
Employee Stock Purchase Plan
The 2011 Employee Stock Purchase Plan, or the ESPP, was adopted by our board of directors on November 22, 2010. The ESPP will become effective on January 1, 2011. The ESPP permits eligible employees to purchase shares of our common stock, at a 15% discount from the lesser of the fair market value per share of our common stock on the first day of the offering period or the fair market value of our common stock on the interim purchase date, through after-tax payroll deductions. Shares reserved for issuance under the plan is initially 500,000. It is intended that the ESPP meet the requirements for an “employee stock purchase plan” under Section 423 of the Internal Revenue Code. There was no activity associated with the ESPP for the year ended December 31, 2010.
| 14. | Income Taxes |
The provision for income tax expense/(benefit) consisted of (amounts in thousands):
| For the Fiscal Year Ended December 31, |
||||||||||||
| 2010 | 2009 | 2008 | ||||||||||
| Current |
||||||||||||
| Federal |
$ | 13,881 | $ | 12,144 | $ | 27,775 | ||||||
| State |
2,526 | 1,207 | 8,059 | |||||||||
| Non U.S. |
4,829 | 992 | 75 | |||||||||
| 21,236 | 14,343 | 35,909 | ||||||||||
| Deferred |
||||||||||||
| Federal |
114 | (1,482 | ) | (723 | ) | |||||||
| State |
100 | (305 | ) | (209 | ) | |||||||
| Non U.S. |
(1,513 | ) | (377 | ) | 284 | |||||||
| Valuation allowance |
72 | 377 | (284 | ) | ||||||||
| (1,227 | ) | (1,787 | ) | (932 | ) | |||||||
| Total income tax expense |
$ | 20,009 | $ | 12,556 | $ | 34,977 | ||||||
F-30
Table of Contents
Deferred income taxes reflect the net tax effects of temporary differences between the financial reporting and tax basis of assets and liabilities and are measured using the enacted tax rates and laws that will be in effect when such differences are expected to reverse. The Company’s net deferred tax assets are included in Other assets on the Consolidated Statements of Financial Condition. Significant components of the Company’s deferred tax assets and liabilities at December 31, 2010 and 2009 were as follows (amounts in thousands):
| 2010 | 2009 | |||||||
| Deferred tax assets |
||||||||
| Allowance for doubtful accounts |
$ | 22 | $ | 138 | ||||
| Deferred rent |
313 | 88 | ||||||
| Accrued expenses |
117 | 405 | ||||||
| Net foreign operating losses |
2,173 | 661 | ||||||
| Stock-based compensation expense |
6,921 | 4,957 | ||||||
| Intangibles |
439 | — | ||||||
| Total deferred tax assets |
9,985 | 6,249 | ||||||
| Valuation allowance |
(733 | ) | (661 | ) | ||||
| Total deferred tax assets after valuation allowance |
$ | 9,252 | $ | 5,588 | ||||
| Deferred tax liabilities |
||||||||
| Unrealized trading differences |
$ | (4,465 | ) | $ | (3,301 | ) | ||
| Basis difference in property and equipment |
(1,430 | ) | (200 | ) | ||||
| State taxes |
(80 | ) | (141 | ) | ||||
| Other |
(158 | ) | (54 | ) | ||||
| Total deferred tax liabilities |
$ | (6,133 | ) | $ | (3,696 | ) | ||
| Net deferred tax assets |
$ | 3,119 | $ | 1,892 | ||||
The following table reconciles the provision to the U.S. federal statutory income tax rate:
| 2010 | 2009 | 2008 | ||||||||||
| Federal income tax at statutory rate |
35.00 | % | 35.00 | % | 35.00 | % | ||||||
| Increase/(decrease) in taxes resulting from: |
||||||||||||
| State income tax |
2.97 | % | 0.08 | % | 1.91 | % | ||||||
| Embedded derivative |
(2.86 | )% | (1.47 | )% | (23.92 | )% | ||||||
| Foreign rate differential |
(0.89 | )% | (0.61 | )% | 0.16 | % | ||||||
| Meals & entertainment |
0.16 | % | 0.17 | % | 0.03 | % | ||||||
| R&D credit |
(0.81 | )% | (1.09 | )% | — | % | ||||||
| Other permanent differences |
1.25 | % | (0.87 | )% | (0.07 | )% | ||||||
| Effective Tax Rate |
34.82 | % | 31.21 | % | 13.11 | % | ||||||
The Company has $7.8 million in foreign net operating loss (“NOL”) carry forwards as of December 31, 2010, for which the Company has established full valuation allowance against $3.0 million. These NOLs begin to expire in 2013.
No provision has been made for foreign taxes associated with the cumulative undistributed earnings of foreign subsidiaries as of December 31, 2010, as these earnings are expected to be reinvested in working capital and other business needs indefinitely. Upon repatriation of those earnings, in the form of dividends or otherwise, the Company would be subject to income taxes, subject to an adjustment for the participation exemption and foreign tax credits. A determination of the amount of the unrecognized deferred tax liability with respect to such earnings is not practicable.
F-31
Table of Contents
The Company has recorded a liability of $0.1 million related to uncertain tax positions at December 31, 2010 in accordance with ASC 740-10, Income Taxes. The Company’s open tax years for its federal returns range from 2007 through 2010 and from 2006 through 2010 for its major state jurisdictions.
| 15. | Commitments and Contingencies |
Leases — The Company leases office space under non-cancelable operating lease agreements that expire on various dates through 2025. Future annual minimum lease payments, including maintenance and management fees, for non-cancellable operating leases, are as follows (amounts in thousands):
| Years Ended December 31: |
||||
| 2011 |
$ | 1,884 | ||
| 2012 |
1,318 | |||
| 2013 |
1,213 | |||
| 2014 |
1,108 | |||
| 2015 |
1,230 | |||
| 2016 and beyond |
11,937 | |||
| $ | 18,690 | |||
Rent expense was $2.4 million, $1.8 million, and $1.4 million for the years ended December 31, 2010, 2009 and 2008, respectively.
On December 31, 2009, the Company entered into capital leases for computer equipment that expire on various dates through 2011. Assets recorded under capital leases amounted to $0.6 million. In accordance with ASC 840-30, Capital leases, the Company measured the present value of the minimum lease payments and the capital lease obligation of $0.3 million is recorded in Accrued expenses and other liabilities as of December 31, 2010. Future annual minimum lease payments for capital leases are as follows (amounts in thousands):
| Years Ended December 31: |
||||
| 2011 |
$ | 330 | ||
Litigation — On June 30, 2010, the National Futures Association, or NFA, filed a complaint against GAIN Capital Group, LLC, the Company’s wholly-owned operating subsidiary, and Glenn H. Stevens, the Company’s president and chief executive officer, alleging, among other things, that certain aspects of the Company’s liquidation, trade execution and records maintenance, along with the Company’s review of our introducing brokers’ activities did not comply with applicable NFA rules and that, as a result, the matter with the Company and Mr. Stevens did not properly supervise operations. On October 27, 2010 the Company settled the matter with the NFA without admitting or denying the allegations. Pursuant to the settlement, the NFA made no findings with respect to allegations that Mr. Stevens’ supervision and operations was not compliant with certain NFA rules and standards. As part of the settlement that resulted in the NFA action being terminated, however, the Company agreed to pay a fine of approximately $0.5 million. The Company has also agreed to no longer use certain liquidation and trade execution processes. For those customers that were impacted by these liquidation and trade execution processes, the Company also agreed to reimburse them within 30 days of the settlement.
The Company has no material litigation pending as of December 31, 2010.
| 16. | Retirement Plans |
The Company sponsors a 401(k) retirement plan. Substantially all of the Company’s employees are eligible to participate in the plan. Pursuant to the provisions of the plan, the Company is obligated to match 25% of the employee’s contribution to the plan up to 15% of the employee’s compensation for each payroll period. The Company matches 50% for employees with three years or more of service.
F-32
Table of Contents
In January 2008, the Company added a 401(k) / Profit sharing plan which was made available to eligible employees and added a Roth 401(k) option to the plan. As of December 31, 2008, the 401(k) / Profit sharing plan was merged into the original 401(k) retirement plan. The expense recorded to employee compensation and benefits on the Consolidated Statements of Operations and Comprehensive Income by the Company for its employees’ participation in the plan during the years ended December 31, 2010, 2009 and 2008 was $0.5 million, $0.5 million, and $0.6 million, respectively.
In July 2010 the Board approved and the Company adopted a new “Safe Harbor” 401(k) retirement plan which will be in effect as of January 1, 2011. The new plan provides for a 100% match by GAIN on the first 3% of the employee’s salary contributed to the plan and 50% on the next 2% with immediate vesting on all employer contributions.
| 17. | Earnings per Common Share |
Basic and diluted earnings per common share are computed by dividing net income by the weighted average number of common shares outstanding during the period. Diluted earnings per share includes the determinants of basic net income per share and, in addition, gives effect to the potential dilution that would occur if securities or other contracts to issue common stock are exercised, vested or converted into common stock unless they are anti-dilutive. Diluted weighted average common shares includes preferred stock, warrants, vested and unvested stock options and unvested restricted stock units. No stock options or restricted stock units were excluded from the calculation of diluted earnings per share for the years ended December 31, 2010, 2009 and 2008.
On November 23, 2010, the Company’s board of directors approved a 2.29-for-1 stock split of our common stock effective immediately prior to the completion of the IPO as well as the settlement of the primary share offering which was allocated to all common shareholders on a pro-rata basis resulting in an effective stock split of 2.26-for-1. Immediately subsequent to the Company’s IPO, certain shareholders were subject to satisfy indemnification obligations related to past preferred stock issuances and subsequent sales. All references to common shares, preferred shares, additional paid-in capital, retained earnings (accumulated deficit), share and per share data for prior periods have been retroactively restated to reflect the stock split as if it had occurred at the beginning of the earliest period presented.
F-33
Table of Contents
The following table sets forth the computation of earnings per share (amounts in thousands except share and per share data):
| For the Years Ended December 31, | ||||||||||||
| 2010(1) | 2009 | 2008 | ||||||||||
| Net income |
$ | 37,845 | $ | 27,994 | $ | 231,426 | ||||||
| Effect of redemption of preferred shares |
— | — | (63,913 | ) | ||||||||
| Net income applicable to GAIN Capital Holdings, Inc. common shareholders |
$ | 37,845 | $ | 27,994 | $ | 167,513 | ||||||
| Weighted average common shares outstanding: |
||||||||||||
| Basic weighted average common shares outstanding |
4,392,798 | 2,956,377 | 2,911,107 | |||||||||
| Effect of dilutive securities: |
||||||||||||
| Preferred stock series A |
1,645,213 | 1,725,584 | 2,034,415 | |||||||||
| Preferred stock series B |
5,405,287 | 5,669,339 | 5,902,567 | |||||||||
| Preferred stock series C |
2,835,920 | 2,974,455 | 3,079,366 | |||||||||
| Preferred stock series D |
7,017,038 | 7,359,825 | 7,359,803 | |||||||||
| Preferred stock series E |
9,561,484 | 10,028,567 | 5,744,269 | |||||||||
| Warrants |
3,075,314 | 3,127,200 | 3,185,550 | |||||||||
| Stock options |
2,544,927 | 2,859,884 | 3,121,134 | |||||||||
| RSUs |
1,264,921 | 580,838 | 586,337 | |||||||||
| Diluted weighted average common shares outstanding |
37,742,902 | 37,282,069 | 33,924,548 | |||||||||
| Earnings per common share |
||||||||||||
| Basic |
$ | 8.62 | $ | 9.47 | $ | 57.54 | ||||||
| Diluted |
$ | 1.00 | $ | 0.75 | $ | 4.94 | ||||||
| (1) | The preferred stock dilutive securities were converted to common stock in connection with the Company’s initial public offering in December 2010. The dilutive preferred stock represents the weighted average outstanding preferred stock for the year ended December 31, 2010. |
There were no anti-dilutive weighted average common shares for the years ended December 31, 2010, 2009, and 2008.
| 18. | Regulatory Requirements |
GAIN Capital Group, LLC a registered futures commission merchant and forex dealer member, is subject to the net capital requirements of Rule 1.17 (the “Rule”) under the Commodity Exchange Act (the “Act”) and capital requirements of the CFTC and NFA. Under the Rule, the minimum required net capital, as defined, is $20.0 million plus 5% of the amount of customer liabilities over $10.0 million. The Company was compliant with the regulations The below table summarizes our excess net capital for the respective years, (amounts in thousands).
| For the Years Ended December 31, | ||||||||||||
| 2010 | 2009 | 2008 | ||||||||||
| GAIN Capital Group, LLC |
||||||||||||
| Net capital |
$ | 80,429 | $ | 102,577 | $ | 114,978 | ||||||
| Adjusted net capital |
$ | 76,293 | $ | 90,425 | $ | 107,726 | ||||||
| Excess adjusted net capital |
$ | 49,885 | $ | 64,424 | $ | 97,726 | ||||||
F-34
Table of Contents
GAIN Global Markets, Inc. (“GGMI”), the Company’s Cayman Island subsidiary, is a registered securities arranger with the Cayman Islands Monetary Authority. GGMI is required to maintain a capital level that is the greater of one quarter of relevant annual expenditure, or $100,000. A licensee must at all times maintain financial resources in excess of its financial resources requirement. GGMI was compliant with CIMA regulations and required capital levels at December 31, 2010.
GCSI is a registered broker-dealer with the Securities and Exchange Commission under the Securities Exchange Act of 1934. GCSI is a member of the FINRA, Municipal Securities Rulemaking Board (“MSRB”), and Securities Investor Protection Corporation (“SIPC”). GCSI is required to maintain a minimum net capital balance (as defined) of $0.05 million, pursuant to the SEC’s Uniform Net Capital Rule 15c3-1. GCSI must also maintain a ratio of aggregate indebtedness (as defined) to net capital of not more than 15 to 1. GCSI was compliant with the regulations and required capital levels at December 31, 2010.
GAIN Capital Forex.com UK Limited (“GCUK”), is a registered full scope BIPRU 730K investment firm, regulated by the Financial Services Authority (“U.K. FSA”). It is required to maintain the greater of $1.0 million (730k Euros) or the Financial Resources Requirement which is the sum of the firm’s operational, credit, counterparty, and forex risk. GCUK was compliant with U.K. FSA regulations at December 31, 2010 and required capital levels at December 31, 2010.
Forex.com Japan Co., Ltd., (“GC Japan”), a registered Type I financial instruments business firm regulated by the Financial Services Agency of Japan in accordance with Financial Instruments and Exchange Law (Law No. 25 of 1948, as amended). It is a member of the Financial Futures Association of Japan. GC Japan is subject to a minimum capital adequacy ratio of 140%. This calculation is derived by dividing Net Capital by the sum of GC Japan’s market, counterparty credit risk, and operational risk. GC Japan was compliant with regulations and required capital levels at December 31, 2010.
GAIN Capital Forex.com Hong Kong Limited (“GCHK”) is a registered Type 3 leveraged foreign exchange trading firm with the Securities and Futures Commission (“SFC”) operating as an approved introducing agent. GCHK is subject to the requirements of section 145 of the Securities and Futures Ordinance (Cap.571). Under this rule, GCHK is required to maintain a minimum liquid capital requirement of the higher of $0.39 million or the sum of 1.5% of its aggregate gross foreign currency position and 5% of its adjusted liabilities calculated in accordance with the Securities and Futures (Financial Resources) Rules (Cap.571N). GCHK was compliant with SFC regulations and required capital levels at December 31, 2010.
| 19. | Segment Information |
ASC 280, Disclosures about Segments of an Enterprise and Related Information, establishes standards for reporting information about operating segments. Operating segments are defined as components of an enterprise about which separate financial information is available that is evaluated regularly by the chief operating decision-maker, or decision making group, in deciding how to allocate resources and in assessing performance. The Company’s operations relate to foreign exchange trading and related services. Based on the Company’s management strategies, and common production, marketing, development and client coverage teams, the Company assesses that it operates in a single operating segment.
For fiscal years ended December 31, 2010, 2009 and 2008, no single customer accounted for more than 10% of the Company’s trading revenue. The Company does not allocate revenues by geographic regions since the Company selectively hedges customer trades on an aggregate basis and does not have a method to systematically attribute trading volume from a geographic region to associated trading revenue from a particular geographic region.
F-35
Table of Contents
| 20. | Closure of Shanghai Company |
Group, LLC incorporated Jia Shen Forex Software Development Technology, LLC (“JiaShen”) in Shanghai, China, and commenced operations on January 1, 2007. Upon registration of JiaShen with the Shanghai Jin An District government, Group, LLC funded registration capital of $0.8 million.
Between 2006 and 2008, a significant portion of the Company’s trading volume, trading revenue, net income and cash flow were generated from residents of China. When the Company commenced offering its forex trading services through its Chinese language website to residents of China in October 2003, the Company believed that its operations were in compliance with applicable Chinese regulations. However, as a result of the Company’s review of its regulatory compliance in China during 2008 the Company became aware of a China Banking and Regulatory Commission, or CBRC, prohibition on forex trading firms providing retail forex trading services to Chinese residents through the Internet without a CBRC permit. The Company does not have such a permit and to its knowledge, no such permit exists. As a result of this regulatory uncertainty, the Company decided to terminate all service offerings to residents of China and ceased our trading support operations located in that country. As of December 31, 2008, the Company no longer accepted new customers.
However, pursuant to the Company’s most recent review of the relevant regulatory requirements in China, the Company now believes that it can accept customers from China if the customers come to the Company’s website without being solicited by the Company or by the Company’s introducing brokers, agents or white label partners to do so. As a result, the Company began accepting customers from China in this manner in June 2010. The Company cannot provide any assurance that it will not be subject to fines or penalties, and if so in what amounts, relating to its forex trading services through the Internet to Chinese residents.
JiaShen reduced its work force in 2008 and is in the process of formally filing for closure with Chinese authorities. The Company expects JiaShen to be closed by 2011. The Shanghai lease expired in September 2010 and there were no vendor contract termination costs.
F-36
Table of Contents
| 21. | Quarterly Financial Data (Unaudited) |
The following table sets forth selected quarterly financial data for 2010 and 2009 (in thousands, except per share data):
| First Quarter |
Second Quarter |
Third Quarter |
Fourth Quarter |
|||||||||||||
| For the Year Ended December 31, 2010 |
||||||||||||||||
| Revenues |
$ | 41,969 | $ | 54,707 | $ | 51,472 | $ | 40,950 | ||||||||
| Gross profit/(loss) |
$ | 69,650 | $ | 21,184 | $ | (91,975 | ) | $ | 58,593 | |||||||
| Net income /(loss) |
$ | 65,560 | $ | 13,795 | $ | (98,688 | ) | $ | 56,776 | |||||||
| Net income/(loss) applicable to non-controlling interest |
$ | (402 | ) | $ | — | $ | — | $ | — | |||||||
| Net income/(loss) applicable to GAIN Capital Holdings, Inc. |
$ | 65,962 | $ | 13,795 | $ | (98,688 | ) | $ | 56,776 | |||||||
| Basic net income (loss) per share(1) |
$ | 22.22 | $ | 4.62 | $ | (32.38 | ) | $ | 6.62 | |||||||
| Diluted net income (loss) per share(1) |
$ | 1.80 | $ | 0.37 | $ | (2.53 | ) | $ | 1.44 | |||||||
| For the Year Ended December 31, 2009 |
||||||||||||||||
| Revenues |
$ | 32,055 | $ | 44,930 | $ | 36,845 | $ | 39,489 | ||||||||
| Gross profit/(loss) |
$ | 2,807 | $ | (41,380 | ) | $ | 29,466 | $ | 49,336 | |||||||
| Net income /(loss) |
$ | (141 | ) | $ | (48,578 | ) | $ | 28,189 | $ | 48,203 | ||||||
| Net income/(loss) applicable to non-controlling interest |
$ | (45 | ) | $ | 34 | $ | (4 | ) | $ | (306 | ) | |||||
| Net income (loss) applicable to GAIN Capital Holdings, Inc. |
$ | (96 | ) | $ | (48,612 | ) | $ | 28,193 | $ | 48,509 | ||||||
| Basic net income (loss) per share(1) |
$ | (0.03 | ) | $ | (16.46 | ) | $ | 9.53 | $ | 16.37 | ||||||
| Diluted net income (loss) per share(1) |
$ | (0.00 | ) | $ | (1.30 | ) | $ | 0.75 | $ | 1.30 | ||||||
| (1) | On November 23, 2010, the Company’s board of directors approved a 2.29-for-1 stock split of our common stock effective immediately prior to the completion of the IPO as well as the settlement of the primary share offering which was allocated to all common shareholders on a pro-rata basis resulting in an effective stock split of 2.26-for-1. Immediately subsequent to the Company’s IPO, certain shareholders were subject to satisfy indemnification obligations related to past preferred stock issuances and subsequent sales. All references to common shares, preferred shares, additional paid-in capital, retained earnings (accumulated deficit), share and per share data for prior periods have been retroactively restated to reflect the stock split as if it had occurred at the beginning of the earliest period presented. |
| 22. | Subsequent Events |
On January 19, 2011, the underwriters to the Company’s initial public offering exercised a portion of their overallotment option to purchase shares of the Company’s common stock, in an amount equal to an aggregate of 80,000 shares, resulting in additional 33,405 shares issued and outstanding.
In January 2011, all of the outstanding warrants were exercised resulting in an additional 3.3 million shares of common stock issued and outstanding.
On March 29, 2011, the Company entered into a seventh loan modification agreement related to its existing loan and security agreement with Silicon Valley Bank. The loan modification extended the time allowed for the Company to provide monthly consolidated and consolidating balance sheet and income statement information, as well as a certificate confirming compliance with the financial covenants under the term loan during the month, to 45 days after month end, rather than 30 days after month end. In addition, the loan modification changed the debt service coverage financial covenant to provide that the Company is required to comply with such covenant at the end of each fiscal quarter based on the Company’s earnings before interest, taxes, depreciation and amortization (“EBITDA”) for the twelve-month period as of the last day of each quarter. Previously, the Company was required to comply with this covenant based on our EBITDA for the relevant fiscal quarter. The loan modification also changed the required debt service coverage ratio to a minimum of 3.0 to 1.0 from 2.0 to 1.0.
The Company has evaluated its subsequent events through the filing date of this Form 10-K Report.
******
F-37
Table of Contents
REPORT OF INDEPENDENT REGISTERED PUBLIC ACCOUNTING FIRM
To the Board of Directors and Stockholders of
Gain Capital Holdings, Inc.
Bedminster, New Jersey
We have audited the consolidated financial statements of Gain Capital Holdings, Inc. and subsidiaries (the “Company”) as of December 31, 2010 and 2009, and for each of the three years in the period ended December 31, 2010, and have issued our report thereon dated March 30, 2011; such consolidated financial statements and report are included in your 2010 Annual Report on Form 10K. Our audits also included Schedule I listed in the Index to Consolidated Financial Statements and Financial Statement Schedule. This financial statement schedule is the responsibility of the Company’s management. Our responsibility is to express an opinion based on our audits. In our opinion, such financial statement schedule, when considered in relation to the basic financial statements taken as a whole, presents fairly, in all material respects, the information set forth therein.
/s/ Deloitte & Touche LLP
New York, New York
March 30, 2011
F-38
Table of Contents
GAIN CAPITAL HOLDINGS, INC.
(PARENT COMPANY ONLY)
CONDENSED STATEMENTS OF FINANCIAL CONDITION
(in thousands, except share and per share data)
| As of December 31, | ||||||||
| 2010 | 2009 | |||||||
| ASSETS: | ||||||||
| Cash and cash equivalents |
$ | 315 | $ | 83 | ||||
| Investments in subsidiaries, equity basis |
158,464 | 129,568 | ||||||
| Receivables from affiliates |
6,414 | 3,012 | ||||||
| Current tax receivable |
1,826 | 4,618 | ||||||
| Deferred initial public offering costs |
— | 1,732 | ||||||
| Other assets |
3,386 | 2,119 | ||||||
| Total assets |
$ | 170,405 | $ | 141,132 | ||||
| LIABILITIES AND SHAREHOLDERS’ EQUITY/(DEFICIT): | ||||||||
| Liabilities |
||||||||
| Accrued expenses and other liabilities |
$ | 2,181 | $ | 1,472 | ||||
| Convertible, redeemable preferred stock embedded derivative (See Note 3) |
— | 81,098 | ||||||
| Notes payable |
18,375 | 28,875 | ||||||
| Total liabilities |
20,556 | 111,445 | ||||||
| Commitments and Contingencies (See Note 7) |
||||||||
| Convertible, Redeemable Preferred Stock |
||||||||
| Series A Convertible, Redeemable Preferred Stock; ($0.00001 par value; 4,545,455 shares authorized; zero and 865,154 shares issued and outstanding as of December 31, 2010 and 2009, respectively) |
— | 2,009 | ||||||
| Series B Convertible, Redeemable Preferred Stock; ($0.00001 par value; 7,000,000 shares authorized; zero and 2,610,210 shares issued and outstanding as of December 31, 2010 and 2009, respectively) |
— | 5,412 | ||||||
| Series C Convertible, Redeemable Preferred Stock; ($0.00001 par value; 2,496,879 shares authorized; zero and 1,055,739 shares issued and outstanding as of December 31, 2010 and 2009, respectively) |
— | 5,319 | ||||||
| Series D Convertible, Redeemable Preferred Stock; ($0.00001 par value; 3,254,678 shares authorized; zero and 3,254,678 issued and outstanding as of December 31, 2010 and 2009, respectively) |
— | 39,840 | ||||||
| Series E Convertible, Redeemable Preferred Stock; ($0.00001 par value; 3,738,688 shares authorized; zero and 2,611,606 shares issued and outstanding as of December 31, 2010 and 2009, respectively) |
— | 116,810 | ||||||
| Total convertible, redeemable preferred stock |
169,390 | |||||||
| Shareholders’ Equity/(Deficit) |
||||||||
| Common Stock; ($0.00001 par value; 60 million shares authorized and 31,174,651 and 2,966,034 shares issued and outstanding as of December 31, 2010 and 2009, respectively) |
— | — | ||||||
| Accumulated other comprehensive income |
428 | 347 | ||||||
| Additional paid-in capital |
73,381 | (178,245 | ) | |||||
| Retained earnings |
76,040 | 38,195 | ||||||
| Total Shareholders’ Equity/(Deficit) |
149,849 | (139,703 | ) | |||||
| Total |
$ | 170,405 | $ | 141,132 | ||||
See Notes to Condensed Financial Statements
F-39
Table of Contents
GAIN CAPITAL HOLDINGS, INC.
(PARENT COMPANY ONLY)
CONDENSED STATEMENTS OF OPERATIONS AND COMPREHENSIVE INCOME
(in thousands, except share and per share data)
| For the Fiscal Year Ended December 31, |
||||||||||||
| 2010 | 2009 | 2008 | ||||||||||
| REVENUE: |
||||||||||||
| Undistributed earnings of subsidiaries |
$ | 51,030 | $ | 39,673 | $ | 88,462 | ||||||
| EXPENSES: |
||||||||||||
| Employee compensation and benefits |
373 | 525 | 567 | |||||||||
| Bank fees |
7 | 10 | 33 | |||||||||
| Professional fees |
598 | 897 | 1,043 | |||||||||
| Write-off of initial public offering costs |
— | — | 1,897 | |||||||||
| Change in fair value of convertible, redeemable preferred stock embedded derivative |
(4,691 | ) | (1,687 | ) | (181,782 | ) | ||||||
| Other |
277 | 381 | 377 | |||||||||
| Total |
(3,436 | ) | 126 | (177,865 | ) | |||||||
| INCOME BEFORE INCOME TAX EXPENSE |
54,466 | 39,547 | 266,327 | |||||||||
| Income tax expense |
16,621 | 11,553 | 34,901 | |||||||||
| NET INCOME |
$ | 37,845 | $ | 27,994 | $ | 231,426 | ||||||
| Other comprehensive income, net of tax: |
||||||||||||
| Foreign currency translation adjustment |
(186 | ) | 16 | 21 | ||||||||
| NET COMPREHENSIVE INCOME |
$ | 37,659 | $ | 28,010 | $ | 231,447 | ||||||
| Effect of redemption of preferred shares |
$ | — | $ | — | $ | (63,913 | ) | |||||
| Net income applicable to GAIN Capital Holdings, Inc. common shareholders |
$ | 37,845 | $ | 27,994 | $ | 167,513 | ||||||
See Notes to Condensed Financial Statements
F-40
Table of Contents
GAIN CAPITAL HOLDINGS, INC.
(PARENT COMPANY ONLY)
CONDENSED STATEMENTS OF CASH FLOWS
(in thousands)
| For the Fiscal Year Ended December 31, |
||||||||||||
| 2010 | 2009 | 2008 | ||||||||||
| CASH FLOWS FROM OPERATING ACTIVITIES: |
||||||||||||
| Net income |
$ | 37,659 | $ | 28,010 | $ | 231,447 | ||||||
| Adjustments to reconcile net income to cash provided by operating activities |
||||||||||||
| Equity in income of subsidiaries |
(52,133 | ) | (41,340 | ) | (91,159 | ) | ||||||
| Loss on foreign currency exchange rates |
3 | 203 | 59 | |||||||||
| Deferred taxes |
214 | (1,787 | ) | (842 | ) | |||||||
| Write-off of deferred initial public offering costs |
— | — | 42 | |||||||||
| Amortization of deferred finance costs |
87 | 87 | 89 | |||||||||
| Stock compensation expense |
198 | 282 | 541 | |||||||||
| Tax benefit from employee stock option exercises |
— | (10,709 | ) | |||||||||
| Change in fair value of preferred stock embedded derivative |
(4,691 | ) | (1,687 | ) | (181,782 | ) | ||||||
| Changes in operating assets and liabilities: |
||||||||||||
| Receivables from affiliates |
1,856 | 3,737 | 2,637 | |||||||||
| Other assets |
(736 | ) | (160 | ) | (191 | ) | ||||||
| Current tax receivable |
2,792 | (4,618 | ) | — | ||||||||
| Accrued expenses and other liabilities |
709 | (527 | ) | 1,102 | ||||||||
| Income tax payable |
— | (10,538 | ) | 12,505 | ||||||||
| Cash used for operating activities |
(14,042 | ) | (28,338 | ) | (32,261 | ) | ||||||
| CASH FLOWS FROM INVESTING ACTIVITIES: |
||||||||||||
| Investment and funding of subsidiaries |
22,727 | 39,362 | 24,873 | |||||||||
| Cash provided by investing activities |
22,727 | 39,362 | 24,873 | |||||||||
| CASH FLOWS FROM FINANCING ACTIVITIES: |
||||||||||||
| Deferred initial public offering costs |
1,732 | (1,296 | ) | — | ||||||||
| Proceeds from initial public offering of common stock, net of underwriting discount and other direct costs of $3.8 million |
208 | — | — | |||||||||
| Payment on notes payable |
(10,500 | ) | (10,500 | ) | (10,500 | ) | ||||||
| Proceeds from exercise of stock options |
107 | 8 | 1,686 | |||||||||
| Proceeds from exercise of warrants |
— | — | 97 | |||||||||
| Issuance of Series E preferred shares |
— | — | 117,000 | |||||||||
| Series E issuance costs |
— | — | (190 | ) | ||||||||
| Tax benefit from employee stock option exercises |
— | — | 10,709 | |||||||||
| Repurchase of warrants |
— | — | (3,945 | ) | ||||||||
| Repurchase of common shares |
— | — | (40,752 | ) | ||||||||
| Repurchase of preferred shares |
— | — | (62,043 | ) | ||||||||
| Cash provided by/(used for) financing activities |
(8,453 | ) | (11,788 | ) | 12,062 | |||||||
| Effect of exchange rate changes on cash and cash equivalents |
— | (58 | ) | (21 | ) | |||||||
| INCREASE (DECREASE) IN CASH AND CASH EQUIVALENTS |
232 | (822 | ) | 653 | ||||||||
| CASH AND CASH EQUIVALENTS — Beginning of year |
83 | 905 | 252 | |||||||||
| CASH AND CASH EQUIVALENTS — End of year |
$ | 315 | $ | 83 | $ | 905 | ||||||
| SUPPLEMENTARY DISCLOSURES OF CASH FLOW INFORMATION: |
||||||||||||
| Cash paid during the year for: |
||||||||||||
| Interest |
$ | 1,068 | $ | 1,622 | $ | 2,795 | ||||||
| Taxes |
$ | 13,759 | $ | 28,200 | $ | 20,731 | ||||||
| Non-cash investing activities: |
||||||||||||
| Investment in S.L. Bruce Financial Corporation in accrued expenses and other liabilities |
$ | — | $ | — | $ | 325 | ||||||
| Accrual to acquire additional shares of GAIN Capital Japan Co Ltd |
$ | — | $ | 350 | $ | — | ||||||
| Non-cash financing activities: |
||||||||||||
| Accrued initial public offering costs |
$ | 1,305 | $ | 436 | $ | — | ||||||
| Series E indemnification |
$ | 835 | $ | — | $ | — | ||||||
| Reversal of call option liability |
$ | — | $ | — | $ | 1 | ||||||
| Settlement of Preferred Stock embedded derivative |
$ | 76,407 | $ | — | $ | — | ||||||
| Settlement of Convertible, Redeemable preferred stock |
$ | 169,390 | $ | — | $ | — | ||||||
See Notes to Condensed Financial Statements
F-41
Table of Contents
GAIN CAPITAL HOLDINGS, INC.
(PARENT COMPANY ONLY)
NOTES TO CONDENSED FINANCIAL STATEMENTS
| 1. | Basis of Presentation |
Basis of Financial Information — The accompanying financial statements of GAIN Capital Holdings, Inc. (“Parent Company”), including the notes thereto, should be read in conjunction with the consolidated financial statements of GAIN Capital Holdings, Inc. and Subsidiaries (the “Company”) and the notes thereto found on pages F-8 to F-37.
The financial statements are prepared in accordance with accounting principles generally accepted in the U.S. which require the Company or Parent Company to make estimates and assumptions regarding valuations of certain financial instruments and other matters that affect the Parent Company Financial Statements and related disclosures. Actual results could differ from these estimates.
The Parent Company on a stand-alone basis, has accounted for majority-owned subsidiaries using the equity method of accounting.
Initial Public Offering
On December 14, 2010 the Company completed its initial public offering of common stock (“IPO”) of 9,000,000 shares of common stock at an offering price of $9.00 per share, of which 407,692 shares were sold by the Company and 8,592,308 shares were sold by selling stockholders, resulting in net proceeds to the Company of $4.0 million, after deducting underwriting discounts (which included a $0.6 million reimbursement by the underwriters for our out-of-pocket expenses incurred during the offering). Upon the closing of the IPO, all of the Company’s outstanding shares of convertible preferred stock were automatically converted into 27,757,770 shares of common stock, in accordance with our Second Amended and Restated Certificate of Incorporation. As a result, the conversion of the convertible preferred stock the embedded derivative liability was settled and recorded to additional paid-in-capital.
Costs directly associated with the Company’s IPO of $3.8 million were capitalized and recorded as deferred initial public offering costs prior to the closing of the IPO. Once the IPO was closed, these costs were recorded as a reduction of the net proceeds received.
Income Taxes
Income tax expense is provided for using the asset and liability method, under which deferred tax assets and liabilities are determined based upon the temporary differences between the financial statement and income tax bases of assets and liabilities using currently enacted tax rates.
Convertible, Redeemable Preferred Stock Embedded Derivative
ASC 815 establishes accounting and reporting standards for derivative instruments. The Parent Company has determined that it must bifurcate and account for the conversion feature in its previously outstanding Series A, Series B, Series C, Series D, and Series E preferred stock. The embedded derivative is recorded at fair value and changes in the fair value are reflected in earnings. The conversion feature and the associated embedded derivative liability is no longer required to be recognized due to the conversion of all preferred stock to common stock in connection with the IPO, see Note 10 to the Company’s consolidated financial statements.
F-42
Table of Contents
| 2. | Notes Payable |
For a discussion of notes payable, see Note 9 to the Company’s consolidated financial statements.
| 3. | Convertible, Redeemable Preferred Stock |
For a discussion of convertible, redeemable preferred stock, see Note 10 to the Company’s consolidated financial statements.
| 4. | Shareholders’ Equity/(Deficit) |
For a discussion of the shareholders’ deficit, see Note 11 to the Company’s consolidated financial statements.
| 5. | Transactions with Subsidiaries |
The Parent Company has transactions with its subsidiaries determined on an agreed upon basis. Cash dividends from its subsidiaries totaled $42.3 million, $54.6 million and $31.5 million for the years ended December 31, 2010, 2009 and 2008, respectively.
| 6. | Income Taxes |
ASC 740-10-65, Income Taxes, provides measurement and recognition guidance related to accounting for uncertainty in income taxes by prescribing a recognition threshold for tax positions. ASC 740-10-65 also requires extensive disclosures about uncertainties in the income tax positions taken.
The Parent Company’s open tax years for its federal returns range from 2007 through 2010 and from 2007 through 2010 for its major state jurisdictions.
The Parent Company classifies interest expense and potential penalties related to unrecognized tax benefits as a component of income tax expense.
| 7. | Commitments and Contingencies |
For a discussion of commitments and contingencies, see Note 15 to the Company’s consolidated financial statements.
F-43