Attached files
| file | filename |
|---|---|
| EX-32.1 - EX-32.1 - BRIGHTCOVE INC | d768281dex321.htm |
| EX-31.2 - EX-31.2 - BRIGHTCOVE INC | d768281dex312.htm |
| EX-31.1 - EX-31.1 - BRIGHTCOVE INC | d768281dex311.htm |
| EX-23.1 - EX-23.1 - BRIGHTCOVE INC | d768281dex231.htm |
| EX-21.1 - EX-21.1 - BRIGHTCOVE INC | d768281dex211.htm |
| EX-4.9 - EX-4.9 - BRIGHTCOVE INC | d768281dex49.htm |
Table of Contents
UNITED STATES
SECURITIES AND EXCHANGE COMMISSION
Washington, D.C. 20549
FORM 10-K
(Mark One)
| ☒ | ANNUAL REPORT PURSUANT TO SECTION 13 OR 15(d) OF THE SECURITIES EXCHANGE ACT OF 1934 |
For the fiscal year ended December 31, 2019
OR
| ☐ | TRANSITION REPORT PURSUANT TO SECTION 13 OR 15(d) OF THE SECURITIES EXCHANGE ACT OF 1934 |
For the transition period from to
Commission File Number: 001-35429
BRIGHTCOVE INC.
(Exact name of registrant as specified in its charter)
| Delaware | 20-1579162 | |
| (State or other jurisdiction of incorporation) |
(I.R.S. Employer Identification No.) | |
| 290 Congress Street Boston, Massachusetts |
02210 | |
| (Address of principal executive offices) | (Zip Code) | |
(888) 882-1880
(Registrant’s telephone number, including area code)
Securities Registered pursuant to Section 12(b) of the Act:
| Title of Each Class |
Trading Symbol(s) |
Name of Exchange on Which Registered | ||
| Common Stock, par value $0.001 per share | BCOV | The NASDAQ Global Market |
Securities Registered pursuant to Section 12(g) of the Act:
None
Indicate by check mark if the registrant is a well-known seasoned issuer, as defined in Rule 405 of the Securities Act. Yes ☐ No ☒
Indicate by check mark if the registrant is not required to file reports pursuant to Section 13 or Section 15(d) of the Act. Yes ☐ No ☒
Indicate by check mark whether the registrant: (1) has filed all reports required to be filed by Section 13 or 15(d) of the Securities Exchange Act of 1934 during the preceding 12 months (or for such shorter period that the Registrant was required to file such reports), and (2) has been subject to such filing requirements for the past 90 days. Yes ☒ No ☐
Indicate by check mark whether the registrant has submitted electronically every Interactive Data File required to be submitted pursuant to Rule 405 of Regulation S-T during the preceding 12 months (or for such shorter period that the registrant was required to submit such files). Yes ☒ No ☐
Indicate by check mark whether the registrant is a large accelerated filer, an accelerated filer, a non-accelerated filer, or a smaller reporting company. See the definitions of “large accelerated filer,” “accelerated filer,” “smaller reporting company” and “emerging growth company” in Rule 12b-2 of the Exchange Act.
| Large accelerated filer | ☐ | Accelerated filer | ☒ | |||
| Non-accelerated filer | ☐ |
Smaller reporting company |
☐ | |||
| Emerging growth company | ☐ |
If an emerging growth company, indicate by check mark if the registrant has elected not to use the extended transition period for complying with any new or revised financial accounting standards provided pursuant to Section 13(a) of the Exchange Act. ☐
Indicate by check mark whether the registrant is a shell company (as defined in Rule 12b-2 of the Exchange Act). Yes ☐ No ☒
The aggregate market value of common stock held by non-affiliates of the registrant based on the closing price of the registrant’s common stock as reported on the NASDAQ Global Market on June 30, 2019, was $390,496,282.
As of February 24, 2020 there were 38,957,059 shares of the registrant’s common stock, $0.001 par value per share, outstanding.
DOCUMENTS INCORPORATED BY REFERENCE
Portions of the registrant’s definitive Proxy Statement relating to its 2019 Annual Meeting of Stockholders are incorporated by reference into Part III of this Annual Report on Form 10-K where indicated. Such Proxy Statement will be filed with the U.S. Securities and Exchange Commission within 120 days after the end of the fiscal year to which this report relates.
Table of Contents
BRIGHTCOVE INC.
| Page | ||||||
| Item 1. |
4 | |||||
| Item 1A. |
14 | |||||
| Item 1B. |
32 | |||||
| Item 2. |
32 | |||||
| Item 3. |
33 | |||||
| Item 4. |
33 | |||||
| Item 5. |
34 | |||||
| Item 6. |
35 | |||||
| Item 7. |
Management’s Discussion and Analysis of Financial Condition and Results of Operations |
37 | ||||
| Item 7A. |
55 | |||||
| Item 8. |
58 | |||||
| Item 9. |
Changes in and Disagreements with Accountants on Accounting and Financial Disclosure |
59 | ||||
| Item 9A. |
59 | |||||
| Item 9B. |
62 | |||||
| Item 10. |
62 | |||||
| Item 11. |
62 | |||||
| Item 12. |
Security Ownership of Certain Beneficial Owners and Management and Related Stockholder Matters |
62 | ||||
| Item 13. |
Certain Relationships and Related Transactions, and Director Independence |
62 | ||||
| Item 14. |
62 | |||||
| Item 15. |
62 | |||||
| Item 16. |
67 | |||||
| Signatures | 68 | |||||
2
Table of Contents
SPECIAL NOTE REGARDING FORWARD-LOOKING STATEMENTS
This Annual Report on Form 10-K contains “forward-looking statements” that involve risks and uncertainties, as well as assumptions that, if they never materialize or prove incorrect, could cause our results to differ materially from those expressed or implied by such forward-looking statements. The statements contained in this Annual Report on Form 10-K that are not purely historical are forward-looking statements within the meaning of Section 27A of the Securities Act of 1933, as amended, or Securities Act, and Section 21E of the Securities Exchange Act of 1934, as amended, or Exchange Act. Such forward-looking statements include any expectation of earnings, revenue or other financial items; any statements of the plans, strategies and objectives of management for future operations; factors that may affect our operating results; statements related to adding employees; statements related to potential benefits of acquisitions; statements related to future capital expenditures; statements related to future economic conditions or performance; statements as to industry trends and other matters that do not relate strictly to historical facts or statements of assumptions underlying any of the foregoing. Forward-looking statements are often identified by the use of words such as, but not limited to, “anticipate,” “believe,” “can,” “continue,” “could,” “estimate,” “expect,” “intend,” “may,” “will,” “plan,” “project,” “seek,” “should,” “target,” “will,” “would,” and similar expressions or variations intended to identify forward-looking statements. These statements are based on the beliefs and assumptions of our management based on information currently available to management. Such forward-looking statements are subject to risks, uncertainties and other important factors that could cause actual results and the timing of certain events to differ materially from future results expressed or implied by such forward-looking statements. Factors that could cause or contribute to such differences include, but are not limited to, those identified below, and those discussed in the section titled “Risk Factors” included in Item 1A of Part I of this Annual Report on Form 10-K, and the risks discussed in our other Securities and Exchange Commission, or SEC, filings. Furthermore, such forward-looking statements speak only as of the date of this report. Except as required by law, we undertake no obligation to update any forward-looking statements to reflect events or circumstances after the date of such statements. Forward-looking statements in this Annual Report on Form 10-K may include statements about:
| • | our ability to achieve profitability; |
| • | our competitive position and the effect of competition in our industry; |
| • | our ability to retain and attract new customers; |
| • | our ability to penetrate existing markets and develop new markets for our services; |
| • | our ability to retain or hire qualified accounting and other personnel; |
| • | our ability to successfully integrate acquired businesses, including the online video platform assets of Ooyala, Inc. and certain of its subsidiaries that we acquired during 2019; |
| • | our ability to protect our intellectual property and operate our business without infringing upon the intellectual property rights of others; |
| • | our ability to maintain the security and reliability of our systems; |
| • | our estimates with regard to our future performance and total potential market opportunity; |
| • | our estimates regarding our anticipated results of operations, future revenue, bookings growth, capital requirements and our needs for additional financing; and |
| • | our goals and strategies, including those related to revenue and bookings growth. |
3
Table of Contents
| Item 1. | Business |
Overview
Brightcove Inc., or Brightcove, is a leading global provider of cloud-based services for video. Brightcove was incorporated in Delaware in August 2004 and our headquarters are in Boston, Massachusetts. Our suite of products and services reduces the cost and complexity associated with publishing, distributing, measuring and monetizing video across devices.
Brightcove Video Cloud, or Video Cloud, our flagship product, is the world’s leading online video platform. Video Cloud enables our customers to publish and distribute video to Internet-connected devices quickly, easily and in a cost-effective and high-quality manner. Brightcove Video Marketing Suite, or Video Marketing Suite, is a comprehensive suite of video technologies designed to address the needs of marketers to drive awareness, engagement and conversion. Brightcove Enterprise Video Suite, or Enterprise Video Suite, is an enterprise-class platform for internal communications, employee training, live streaming, marketing and ecommerce videos. Brightcove OTT Flow is a service for media companies and content owners to rapidly deploy high-quality, direct-to-consumer, live and on-demand video services across platforms.
We also have a number of modular solutions for customers, including Brightcove Zencoder, or Zencoder, which is a cloud-based video encoding service. Brightcove SSAI, or SSAI, is an innovative, cloud-based ad insertion and video stitching service that addresses the limitations of traditional online video ad insertion technology. Brightcove Player, or Player, is a cloud-based service for creating and managing video player experiences.
In September 2019, we released Brightcove Beacon, which is a purpose-built app that enables companies to deliver and launch premium OTT video experiences quickly and cost effectively across mobile, web, smart TVs and connected TVs, all with the flexibility of multiple monetization models. In January 2020, we released Brightcove Campaign, which is a purpose-built app that enables marketers to easily create video-driven marketing campaigns that yield insightful data with the ability to compare video performance to a variety of industry benchmarks.
As of December 31, 2019, we had 3,595 customers in over 80 countries, including many of the world’s leading media companies, broadcasters, publishers, sports and entertainment companies, fashion and hospitality brands and corporations, faith-based institutions, e-commerce platforms, and hi-tech organizations, as well as governments, educational institutions and non-profit organizations.
We primarily generate revenue by offering our products to customers on a subscription-based, software as a service, or SaaS, model. Our revenue grew from $164.8 million in the year ended December 31, 2018 to $184.5 million in the year ended December 31, 2019. As of December 31, 2018, we had 3,783 customers, of which 2,226 used our premium offerings and 1,557 used our volume offerings. As of December 31, 2019, we had 3,595 customers, of which 2,338 used our premium offerings and 1,257 used our volume offerings. Substantially all of our revenue has historically been attributable to our Video Cloud product, and we expect that revenue from Video Cloud will continue to comprise a significant portion of our revenue. In addition to being offered on a stand-alone basis, Video Cloud is also a core component of OTT Flow, Video Marketing Suite and Enterprise Video Suite.
Our Solutions
Our solutions provide our customers with the following key benefits:
| • | Comprehensive, modular and scalable solutions. Video Cloud provides a single, integrated solution to meet a range of video publishing and distribution needs. Brightcove Beacon and Brightcove Campaign |
4
Table of Contents
| are end-to-end solutions of video technologies built for media companies and marketers. Each of Zencoder, SSAI and Player are modular solutions that customers can license on a stand-alone basis and integrate into their existing video workflows. In addition, our multi-tenant architecture enables us to deliver each of our solutions across our customer base with a single version of our software for each product, making it easier to scale our solutions as our customer and end user base expands. |
| • | Easy to use and low total cost of ownership. Our products were designed to be intuitive and easy to use. We provide reliable, cost-effective, on-demand solutions to our customers, relieving them of the cost, time and resources associated with in-house solutions and enabling them to be up and running quickly after signing with us. |
| • | Open platforms and extensive ecosystem. Our open and extensible platforms enable our customers to customize standard features and functionality and easily integrate third-party technology to meet their own specific requirements and business objectives. We have an extensive ecosystem of partners, which we refer to as the Brightcove Partner Program. More than 150 members of the Brightcove Partner Program have solutions that are integrated with our platform. This ecosystem includes leading technology companies such as Akamai, comScore, Google and Oracle and providers of niche technology services. These integrated technologies provide our customers with enhanced flexibility, functionality and ease of use. |
| • | Help customers achieve business objectives. Our customers use our products to achieve key business objectives such as driving site traffic, increasing viewer engagement on their sites, monetizing content, increasing conversion rates for transactions, increasing brand awareness and expanding their audiences, internal communications, employee training and customer support. We believe our customers view us as a strategic partner in part because our business model is not dependent on building our own audience or generating our own ad revenue. Our business interests align with our customers’ interests as we each benefit from the success of our customers’ online video strategy. |
| • | Ongoing customer-driven development. Through our account managers, customer success and support teams, product teams and regular outreach from senior leadership, we solicit and capture feedback from our customer base for incorporation into ongoing enhancements to our solutions. We regularly provide our customers with enhancements to our products. Delivering cloud-based solutions allows us to serve additional customers with little incremental expense and to deploy innovations and best practices quickly and efficiently to our existing customers. |
Our Business Strengths
We believe that the following business strengths differentiate us from our competitors and are key to our success:
| • | We are the recognized online video platform market leader. In 2019, our customers used Video Cloud to deliver an average of approximately 3.65 billion video streams per month, which we believe is more video streams per month than any other professional solution. We have in recent years received numerous awards for our market leadership from industry analysts such as Frost & Sullivan and Gartner and publishers such as Fast Company and Digiday. |
| • | We have established a global presence. We have established a global presence with operations in Europe, Japan, Asia Pacific, the Middle East, India and Mexico. Today, we have employees in fourteen countries. We built our solutions to be localized into almost any language and currently offer 24/7 customer support worldwide. As of December 31, 2019, organizations throughout the world used Video Cloud to reach viewers in approximately 252 countries and territories. |
| • | We have high visibility and predictability in our business. We generally sell our subscription and support services through monthly or annual contracts and recognize revenue ratably over the committed term. The majority of our revenue comes from annual contracts. Our existing contracts |
5
Table of Contents
| provide us with visibility into revenue that has not yet been recognized. We have also achieved an overall recurring dollar retention rate of at least 85% in each of the last four fiscal quarters, including 95%, 87%, 85% and 89% for the three months ended March 31, 2019, June 30, 2019, September 30, 2019 and December 31, 2019, respectively. Our business model and customer loyalty provide greater levels of recurring revenue and predictability compared to traditional, perpetual-license business models. |
| • | We have customers of all sizes across multiple industries. We offer different editions of our products tailored to meet the needs of organizations of various sizes and across industries. Our offerings range from entry-level editions to enterprise-level editions used by multiple departments in a single organization. |
| • | Our management team has experience building and scaling software companies. Our senior leadership team has built innovative software platform businesses. Members of our senior leadership team have held senior product, business and technology roles at companies such as CA Technologies, DassaultSystemes, DS SolidWorks, Ellucian, Fidelity Investments, IBM, RSA, PTC, and SAP Americas. |
Our Customers
As of December 31, 2019, we had 3,595 customers in over 80 countries and territories. We provide our solutions to many of the world’s leading media companies, broadcasters, publishers, sports and entertainment companies, fashion and hospitality brands and corporations, faith-based institutions, e-commerce platforms, and hi-tech organizations, as well as governments, educational institutions and non-profit organizations. We believe our solutions can benefit any organization with digital video content.
Our Products and Services
Video Cloud
Video Cloud, the world’s leading online video platform, enables our customers to publish and distribute video to Internet-connected devices quickly, easily and in a cost-effective and high-quality manner. Our innovative technology and intuitive user interface give customers control over a wide range of features and functionality needed to publish and deliver a compelling user experience, including the following:
| • | Uploading and Encoding. Using Video Cloud, customers may upload videos in various formats for adaptive encoding that maximizes quality and minimizes file size. Video Cloud then automatically enables the content to be delivered to end users via a third-party content delivery network, or CDN, such as Akamai Technologies, Inc., or Akamai, Fastly, Inc., or Fastly, or Amazon Web Services, or AWS. |
| • | Content Management. Whether a customer has a few short video clips or thousands of full-length episodes, Video Cloud makes it easy to organize a media library. Videos can be grouped together with drag-and-drop controls or smart playlists that automatically organize content. Customers can set rules for geographic access and schedules to define where and when their videos can be viewed. |
| • | Video Players. Video Cloud includes leading video player technology, with fast load times and fast video starts. Video Cloud allows for point-and-click styling and configuration of video players that can reflect the brand or design of the customer. Our video players also include built-in support for advertising, analytics and content protection, and provide a consistent cross-platform playback experience. Developers can also take advantage of a set of tools to create completely custom video player experiences. |
| • | Multi-platform video experiences. We have built Video Cloud to support numerous operating systems, formats and devices. In addition to web-based experiences, Video Cloud provides publishing and |
6
Table of Contents
| delivery services for cross-platform devices including smartphones, tablets, media streaming devices and Connected TVs. Our solution includes automated device detection and manages multiple renditions of the same video encoded in different forms with optimized delivery protocols for different target formats. |
| • | Live Video Streaming. In addition to on-demand video distribution, Video Cloud includes support for live video broadcasts. Video Cloud accepts multiple live streams at different quality levels and delivers the rendition that best matches each viewer’s available bandwidth, processor utilization and player size. |
| • | Distribution and Syndication. Video Cloud supports a blended distribution strategy across the Internet, allowing customers to distribute videos on their own website, partner websites or video-sharing sites such as YouTube. These tools help content owners to drive site traffic, increase brand awareness and expand their audience. |
| • | Social Media. Customers can expand their audience by leveraging the social network of their viewers. Through integrated Video Cloud capabilities, users can share complete videos or video clips through Facebook, YouTube, Twitter and other social media destinations. Brightcove Social allows customers to manage their video presence across social networks from a single interface. With Brightcove Social, customers can clip and publish videos to the native playback environments of Facebook, YouTube and Twitter, as well as their own websites, from Video Cloud and track performance in a single location. |
| • | Advertising and Monetization. Video Cloud can help customers grow and monetize their audience with video ad features such as tools for ad insertions and built-in ad server and network integrations. Video Cloud includes tools to support synchronized in-player ads with embedded link functionality and overlays for persistent branding. |
| • | Analytics. Video Cloud’s integrated video analytics present information to optimize and support customers’ online video publishing and distribution strategy. Online publishers can also choose to integrate web analytics solutions such as Adobe Omniture or Google Analytics with Video Cloud. |
| • | APIs, SDKs and Developer Resources. Video Cloud includes comprehensive APIs to customize, extend and integrate with our platform. Our SDKs for iOS, tvOS, Android and AndroidTV offer customers tools to jump-start projects and deliver high quality mobile video applications and connected TV experiences. Our developer center gives customers unlimited access to comprehensive product documentation, sample code, developer articles and technical videos, making it easy for them to access additional information. |
Zencoder
Zencoder is a cloud-based video encoding service. Zencoder provides our customers with high-quality, reliable encoding of live and on-demand video and access to highly scalable encoding power without having to pay for, manage and scale expensive hardware and software. Zencoder includes the following principal features and functionality:
| • | File Support. Zencoder accepts files in an extensive range of formats and codecs and supports video output to a multitude of devices. |
| • | Quality and Control. Zencoder includes tools to support high quality video output and to adjust and edit video. |
| • | Speed and Reliability. Zencoder provides extremely fast transcoding and industry leading reliability. |
| • | Platform and Security. Zencoder is scalable, globally distributed and includes advanced security features designed to protect content. |
| • | Account and Integration. Zencoder provides a simple API for streamlined integration, supports most major transfer protocols and accelerated file transfers and allows users to manage their accounts and encoding jobs from an intuitive, online dashboard. |
7
Table of Contents
SSAI
SSAI is an innovative, cloud-based ad insertion and video stitching service that addresses the limitations of traditional online video ad insertion technology. SSAI reduces or eliminates the need for platform-specific ad technology and makes it possible for customers to reliably deliver live or on-demand video with dynamically customized programming and targeted ads to the maximum range of devices. SSAI includes the following principal features and functionality:
| • | Reach. SSAI features cloud-based ad monetization of video on demand across devices, apps and websites. |
| • | Integrations. SSAI is pre-integrated with ad networks and ad decision systems. |
| • | Server-Side Solution. SSAI is a server-side solution, requiring no SDKs, plug-ins or client-side code. |
| • | Simplicity. SSAI uses a single URL with automatic device detection to deliver high bit-rate broadcast quality video ads. |
Player
Player is a cloud-based service for creating and managing video player experiences. This service provides customers with leading video player technology, a robust set of management APIs and performance optimization services. Player delivers cross-platform playback experiences and includes built-in support for advertising, analytics and content protection. Player includes the following principal features and functionality:
| • | Leading Video Player Technology. Player includes a fast HTML5-first video player, responsive design, social sharing and integration tools and support for adaptive bitrate streaming across all major mobile and desktop platforms. |
| • | Speed. Player is designed to have the fastest load times and the fastest video starts. Player’s precompiled plugins, skinned assets and thumbnails minimize download size. Player is optimized to reduce network traffic. Player also allows customers to deploy changes to thousands of player embeds with batch publishing to accelerate time-to-market. |
| • | Wide Reach. Player allows customers to reach the maximum range of Internet-connected devices and operating systems with consistent playback across desktop and mobile devices. |
| • | Powerful APIs, Plugins and SDKs. The developer-friendly, HTML5 video player is easily customized with CSS and JavaScript APIs. Player’s Management APIs also allow customers to easily control player configurations. Player has a robust ecosystem of plugins and integrations, including built-in support for advertising, analytics and content protection, as well as numerous open-source plugins from the Video.js community. Player also includes native player SDKs for easy development and deployment of native applications. |
OTT Flow
OTT Flow is a service for media companies and content owners to rapidly deploy high-quality, direct-to-consumer, live and on-demand video services across platforms. OTT Flow enables video content delivery with a consistent user interface across multiple platforms, including desktop, Apple and Android smartphones and tablets, and Google Chromecast. OTT Flow also includes support for ad-supported and subscription video-on-demand models with ecommerce, customer relationship management, or CRM, and billing engine interfaces. This product also features a flexible and intuitive web-based administrative console for user interface and user experience configuration, rules-based content packaging and scheduling capabilities, robust analytics and subtitle and caption support. OTT Flow provides an Over the Top (OTT) solution that allows for UX flexibility, support for complex integrations, delivery to a large number of platforms, TV Everywhere (TVE) authentication and support for transactional business models.
8
Table of Contents
Video Marketing Suite
Video Marketing Suite is a comprehensive suite of video technologies designed to address the needs of marketers to drive awareness, engagement and conversion. Video Marketing Suite is a bundled offering of Video Cloud, Brightcove Gallery, or Gallery, and Brightcove Social. Gallery is a cloud-based service that enables customers to create and publish video portals. This service combines portal templates with best practices for search engine optimization, responsive design, social sharing and conversion in a single solution that can be implemented and updated with ease. Gallery allows customers to create engaging video experiences such as video channels, product showcases, event microsites and video support centers. Brightcove Social allows customers to manage their video presence across social networks from a single interface. With Brightcove Social, customers can edit, publish and track their videos in the native playback environments of Facebook, YouTube and Twitter, as well as their own websites, from Video Cloud.
Enterprise Video Suite
Enterprise Video Suite is an enterprise-class platform that is designed to reduce the cost and complexity traditionally involved with internal video communications. The platform enables organizations to stream live internal town halls, train sales teams, ramp new employees, and build customized video portals. Enterprise Video Suite is a bundled offering of Video Cloud, Gallery, and Brightcove Live. It offers security features like IP restriction, URL tokenization, and single sign on, as well as analytics on user-level video engagement. Brightcove Live is an optional add-on to Video Cloud designed to enable non-technical users to set up live events and deliver multi-bitrate streams to multiple devices, without the need for hardware encoders or development work.
Brightcove Beacon
Brightcove Beacon is a purpose-built app that enables companies to deliver and launch premium OTT video experiences quickly and cost effectively across mobile, web, smart TVs and connected TVs, all with the flexibility of multiple monetization models. Brightcove Beacon includes the following principal features and functionality:
| • | Experience Management. Brightcove Beacon allows customers to define consistent viewer app experiences on mobile devices, tablets, connected TVs and smart TVs, significantly reducing time-to-market. |
| • | Content Management. Brightcove Beacon allows customers to curate and deliver content to its audience segments, automate the curation of playlists and carousels, securely store and deliver content with DRM protection, automate content availability windows by time, geography and device and configure VOD and live content offerings for the any demographic changes that occur throughout the day or week. |
| • | Viewer Management. Brightcove Beacon allows customers to streamline the purchase process with in-app purchasing through numerous stores or platforms. Brightcove Beacon also creates a frictionless viewer registration experience, enables users to sign-on and authenticate easily, maintains watch history and preferences with viewer profiles, allows for the creation of customized packages for different types of viewers, and allows customers to manage stream concurrency to allow or restrict account sharing. |
| • | Analytics. Brightcove Beacon allows customers to gather insights on viewer behavior to drive content programming, product layout, and monetization decisions. |
| • | Monetization. Brightcove Beacon allows customers to choose from various monetization models, including subscription video on demand (SVOD), advertising-based video on demand (AVOD), authenticated video on demand (AuthVOD) and freemium, and to combine monetization methods to create customized offers. |
9
Table of Contents
| • | Device Management. Brightcove Beacon allows customers to secure its content and limit the number of devices accessing content per account. Brightcove Beacon also allows customers to maintain control and easily enable and disable devices, and easily deploy changes across all devices. |
Brightcove Campaign
Brightcove Campaign is a purpose-built app that enables marketers to easily create video-driven marketing campaigns that yield insightful data with the ability to compare video performance to a variety of industry benchmarks. Brightcove Campaign includes the following principal features and functionality:
| • | Customized, easy-to-follow campaign advice and best practices. |
| • | Advanced analytics reporting, including industry benchmarking comparisons. |
| • |
One-click-to-publish capability across multiple marketing channels. |
| • | Social sharing capabilities. |
| • | Customized thumbnail codes for email distribution and video optimization. |
| • |
Out-of-the-box marketing automation integration with Eloqua, Marketo, HubSpot and Salesforce. |
| • | Google Chrome extension for easy video analysis. |
| • | Google and Adobe Analytics integration. |
Editions
Each of our products is offered to customers on a subscription-based SaaS model, with varying levels of usage entitlements, support and, in certain cases, functionality. Our customers generally pay us a monthly or annual subscription fee for access to our products. This model allows our customers to scale their level of investment and usage based on the size and complexity of their needs.
Video Cloud is offered in two product lines. The first product line is comprised of our premium product editions. All premium editions include functionality to publish and distribute video to Internet-connected devices, with higher levels of the premium editions providing additional features and functionality. The second product line is comprised of our volume product edition. Our volume editions target small and medium-sized businesses, or SMBs. The volume editions provide customers with the same basic functionality that is offered in our premium product editions but have been designed for customers who have lower usage requirements and do not typically require advanced features or functionality.
Video Marketing Suite and Enterprise Video Suite are each generally available in Starter, Pro and Enterprise editions. The Starter edition for each provides customers with the same basic functionality that is offered in the Pro and Enterprise editions but has been designed for customers who have lower usage requirements and do not typically require advanced features and functionality. All Video Marketing Suite and Enterprise Video Suite customers are considered premium customers.
Zencoder customers are considered premium customers other than Zencoder customers on month-to-month contracts or pay-as-you-go contracts, which are considered volume customers.
All Brightcove Beacon, Brightcove Campaign, SSAI, Player and OTT Flow customers are considered premium customers.
Support
Our products generally include basic support for technical and operational issues from our support team via web-based submission or email. The premium editions of our products generally include additional support
10
Table of Contents
options such as phone support, live chat, dedicated live event support, 24x7x365 support and more. Our award-winning, TSIA certified team supports our customers from our offices in Boston, London, Sydney, Tokyo, Seoul, Scottsdale, Guadalajara and Singapore. We also have a dedicated customer success team that offers various onboarding and related services to new and existing customers looking to get the most out of our products and services.
Training
We offer free basic online training to registered users of our products. We also offer customized, onsite training for customers that is priced on a per engagement basis.
Account Management
An important component of our sales strategy is our account management organization. This organization is focused on ongoing customer success and engagement, as well as contract renewals and upsells to our customer base.
Professional Services
While our products are easy for customers to use and deploy without any additional specialized services, we offer a range of professional services for customers who seek customization of our products or assistance with their implementations. These professional services are priced on a time and materials basis or a per project basis and include projects such as content migrations from other vendors or in-house solutions, video player enhancements, mobile and connected TV app development and the creation of web pages optimized for video.
Sales and Marketing
We sell our products primarily through our global direct sales organization. Our sales team is organized by the following geographic regions: Americas, Europe and the Middle East, Asia Pacific, and Japan. We further organize our go-to-market approach by focusing our sales and marketing teams on selling primarily to organizations in a wide range of industries, who generally want to distribute video content to a broad audience or use video for marketing or enterprise communication purposes. A small amount of sales are generated through referral partners, channel partners and resellers. We also sell some of our products online through our website.
We generate customer leads, accelerate sales opportunities and build brand awareness through our marketing programs. Our marketing programs target executives, technology professionals and senior business leaders. Our marketing programs typically target specific geographies and industry segments. Our principal marketing programs include:
| • | public relations and social media; |
| • | online event marketing activities, direct email, search engine marketing and display ads and blogs; |
| • | field marketing events for customers and prospects; |
| • | participation in, and sponsorship of, user conferences, trade shows and industry events; |
| • | use of our website to provide product and organization information, as well as learning opportunities for potential customers; |
| • | cooperative marketing efforts with partners, including joint press announcements, joint trade show activities, channel marketing campaigns and joint seminars; |
| • | telemarketing and lead generation representatives who respond to incoming leads to convert them into new sales opportunities; and |
| • | customer programs, including user meetings and our online customer community. |
11
Table of Contents
Operations
We use a number of third-party cloud computing platforms to provide our products and services to customers. We take advantage of this geographically dispersed, third-party, cloud computing capacity to improve the responsiveness of our service and lower network latency for our customers. We also operate our own servers for systems that manage meta-data and business rules.
Media delivery to end users, including video, audio, images and JavaScript components, is served primarily through CDN providers, including Akamai, Fastly, and AWS. We believe our agreements with our CDN providers are based on competitive market terms and conditions, including service level commitments from these CDN providers.
We entered into our agreement with Akamai in July 2010. It enables us to use Akamai CDN services for our own benefit and to resell Akamai CDN services to our customers. The current expiration date of the agreement is April 30, 2020. We expect to enter into a new agreement with Akamai in the first half of 2020.
We entered into our agreement with Fastly in April 2017. It enables us to use Fastly CDN services for our own benefit and to resell Fastly CDN services to our customers. The current expiration date of the agreement is April 30, 2020. We expect to enter into a new agreement with Fastly in the first half of 2020.
Our agreements with each of Akamai and Fastly contain a service continuation period following expiration of the agreement, which we believe is sufficient to enable transition to an alternative provider to avoid material disruption to our business or to our customers. Our agreement with Akamai provides that, upon termination, Akamai will continue to provide CDN services to our existing customers for up to twelve months. Our agreement with Fastly provides that, upon termination by Fastly, Fastly will continue to provide CDN services for up to six months.
We use AWS to provide cloud-based computing, storage and CDN services to our customers. We entered into our agreement with AWS on May 17, 2012. We believe our agreement with AWS is based on competitive market terms and conditions, including service level commitments. The current expiration date of our agreement with AWS is June 30, 2022. Our agreement with AWS provides that, upon termination, AWS will continue to store our content for 30 days and will, upon mutual agreement, provide additional post-termination assistance.
Intellectual Property
We rely principally on a combination of trademark, patent, copyright and trade secret laws in the United States and other jurisdictions, as well as confidentiality procedures and contractual provisions to protect our proprietary technology, confidential information, business strategies and brands. We also believe that factors such as the technological and creative skills of our employees coupled with the creation of new features, functionality and products are essential to establishing and maintaining a technology leadership position. We enter into confidentiality and invention assignment agreements with our employees and consultants and confidentiality agreements with other third parties, and we rigorously control access to our proprietary technology.
In the United States, we have 46 issued and/or allowed patents and 7 patent applications pending. Internationally, we have 30 issued and/or allowed patents and we are currently pursuing 22 patent applications, including three patent applications undergoing examination at the European Patent Office. We currently have patent applications pending in the United States, Canada, United Kingdom, Australia, Japan, China, India, Brazil, Singapore and Hong Kong, and we may seek coverage in additional jurisdictions to the extent we determine such coverage is appropriate and cost-effective. Our issued patents cover a variety of technical domains relevant to our business, including aspects of publishing and distributing digital media online, cloud-based stream delivery and ad insertion.
12
Table of Contents
Our registered trademarks in the United States include “BRIGHTCOVE”, “ZENCODER” and our logo. These trademarks are also registered in certain non-U.S. jurisdictions, including the European Union, Japan and Canada. We may apply for registrations of other marks, and of these marks in additional jurisdictions, to the extent we determine such coverage is appropriate and cost-effective.
Despite our efforts to protect our proprietary rights, unauthorized parties may attempt to copy or obtain and use our technology to develop products with the same functionality as our solutions. Policing unauthorized use of our technology is difficult and expensive. Our competitors could also independently develop technologies equivalent to ours, and our intellectual property rights may not be broad enough for us to prevent competitors from selling products incorporating those technologies.
Competition
We compete with video-sharing sites such as YouTube, in-house solutions, online video platforms and a broad range of other technology providers. Some of our actual and potential competitors may enjoy competitive advantages over us, such as larger marketing budgets and larger sales teams, as well as greater financial, technical and other resources. The overall markets for our products are fragmented, rapidly evolving and highly competitive.
We expect that the competitive landscape will change as our markets consolidate and mature. We believe the principal competitive factors in our industry include the following:
| • | total cost of ownership; |
| • | breadth and depth of product functionality; |
| • | ability to innovate and respond to customer needs rapidly; |
| • | level of resources and investment in sales, marketing, product and technology; |
| • | ease of deployment and use of solutions; |
| • | level of integration into existing workflows, configurability, scalability and reliability; |
| • | customer service; |
| • | brand awareness and reputation; |
| • | ability to integrate with third-party applications and technologies; |
| • | size and scale of provider; and |
| • | size of customer base and level of user adoption. |
The mix of factors relevant in any given situation varies with regard to each prospective customer. We believe we compete favorably with respect to all of these factors.
Some of our competitors have made or may make acquisitions or enter into partnerships or other strategic relationships to offer a more comprehensive service than we do. These combinations may make it more difficult for us to compete effectively, including on the basis of price, sales and marketing programs, technology or service functionality. We expect these challenges to continue as organizations attempt to strengthen or maintain their market positions.
Research and Development
We have focused our research and development efforts on expanding the functionality and scalability of our products and enhancing their ease of use, as well as creating new product offerings. We expect research and
13
Table of Contents
development expenses to increase in absolute dollars as we intend to continue to regularly release new features and functionality, expand our product offerings, continue the localization of our products in various languages, upgrade and extend our service offerings, and develop new technologies. Over the long term, we believe that research and development expenses as a percentage of revenue will decrease, but will vary depending upon the mix of revenue from new and existing products, features and functionality, as well as changes in the technology that our products must support, such as new operating systems or new Internet-connected devices.
Employees
As of December 31, 2019, we had 610 employees, of which 444 were located in the United States and 166 were located outside of the United States. None of our U.S. employees are represented by a labor union or covered by a collective bargaining agreement. We consider our relationship with our employees to be good.
Information about Segment and Geographic Revenue
Information about segment and geographic revenue is set forth in Note 12 of the Notes to Consolidated Financial Statements under Item 8 of this Annual Report on Form 10-K.
Available Information
Our principal executive offices are located at 290 Congress Street, Boston, Massachusetts, 02210. Our telephone number is (888) 882-1880. Our website address is www.brightcove.com. Our Annual Reports on Form 10-K, Quarterly Reports on Form 10-Q, Current Reports on Form 8-K and amendments to those reports filed or furnished pursuant to Section 13(a) or 15(d) of the Securities Exchange Act of 1934 are available free of charge through the investor relations page of our website as soon as reasonably practicable after we electronically file such material with, or furnish it to, the Securities and Exchange Commission. The information that is posted on or is accessible through our website is not incorporated by reference into this Annual Report on Form 10-K and should not be considered part of this or any other report that we file with or furnish to the SEC. Alternatively, these reports may be accessed at the SEC’s website at www.sec.gov.
| Item 1A. | Risk Factors |
You should carefully review the risk factors described below and those described in other reports we file with the Securities and Exchange Commission, as well as the other information contained in this Annual Report on Form 10-K, in evaluating our business. Our business, prospects, financial condition, or operating results could be harmed by any of these risks, as well as other risks not currently known to us or that we currently consider immaterial. If any of such risks and uncertainties actually occurs, our business, financial condition or operating results could differ materially from the plans, projections and other forward-looking statements included in the section titled “Management’s Discussion and Analysis of Financial Condition and Results of Operations” and elsewhere in this report and in our other public filings. The trading price of our common stock could decline due to any of these risks, and, as a result, you may lose all or part of your investment.
We have a history of losses, we expect to continue to incur losses and we may not achieve or sustain profitability in the future.
We have incurred significant losses in each fiscal year since our inception in 2004. We experienced a consolidated net loss of $21.9 million for the year ended December 31, 2019, a consolidated net loss of $14.0 million for the year ended December 31, 2018 and a consolidated net loss of $19.5 million for the year ended December 31, 2017. These losses were due to the substantial investments we made to build our products and services, grow and maintain our business and acquire customers. Key elements of our growth strategy include acquiring new customers and continuing to innovate and build our brand. As a result, we expect our operating expenses to increase in the future due to expected increased sales and marketing expenses, operations
14
Table of Contents
costs, research and development costs and general and administrative costs and, therefore, our operating losses will continue or even potentially increase for the foreseeable future. In addition, as a public company we incur significant legal, accounting and other expenses. Furthermore, to the extent that we are successful in increasing our customer base, we will also incur increased expenses because costs associated with generating and supporting customer agreements are generally incurred up front, while revenue is generally recognized ratably over the committed term of the agreement. You should not rely upon our recent bookings or revenue growth as indicative of our future performance. We cannot assure you that we will reach profitability in the future or at any specific time in the future or that, if and when we do become profitable, we will sustain profitability. If we are ultimately unable to generate sufficient revenue to meet our financial targets, become profitable and have sustainable positive cash flows, investors could lose their investment.
Substantially all of our revenue has historically come from a single product, Video Cloud.
We have historically been substantially dependent on revenue from a single product, Video Cloud, and we expect that revenue from Video Cloud will continue to comprise a significant portion of our revenue. Our business would be harmed by a decline in the market for Video Cloud, increased competition in the market for online video platforms, or our failure or inability to provide sufficient investment to support Video Cloud as needed to maintain or grow its competitive position.
If we are unable to retain our existing customers, our revenue and results of operations will be adversely affected.
We sell our products pursuant to agreements that are generally for annual terms. Our customers have no obligation to renew their subscriptions after their subscription period expires, and we have experienced losses of customers that elected not to renew, in some cases, for reasons beyond our control. For example, our largest customer during 2016 faced distressing financial circumstances and, as a result, we lost substantially all of the revenue we expected to generate from this customer in 2017. In addition, even if subscriptions are renewed, they may not be renewed on the same or on more profitable terms. As a result, our ability to retain our existing customers and grow depends in part on subscription renewals. We may not be able to accurately predict future trends in customer renewals, and our customers’ renewal rates have and may continue to fluctuate because of several factors, including their satisfaction or dissatisfaction with our services, the cost of our services and the cost of services offered by our competitors, reductions in our customers’ spending levels or the introduction by competitors of attractive features and functionality. If our customer retention rate decreases, we may need to increase the rate at which we add new customers in order to maintain and grow our revenue, which may require us to incur significantly higher sales and marketing expenses than we currently anticipate, or our revenue may decline. If our customers do not renew their subscriptions for our services, renew on less favorable terms, or do not purchase additional functionality or subscriptions, our revenue may grow more slowly than expected or decline, and our profitability and gross margins may be harmed or affected.
Our long term financial targets are predicated on bookings and revenue growth and operating margin improvements that we may fail to achieve, which could reduce our expected earnings and cause us to fail to meet the expectations of analysts or investors and cause the price of our securities to decline.
We are projecting long-term bookings and revenue growth. Our projections are based on the expected growth potential in our premium customer base, as well as the market for on-demand software solutions generally. We may not achieve the expected bookings and revenue growth if the markets we serve do not grow at expected rates, if customers do not purchase or renew subscriptions as we expect, and/or if we are not able to deliver products desired by customers and potential customers. Our long-term operating margin improvement targets are predicated on operating leverage as long term revenue increases and improved operating efficiencies from moving to additional cloud-based delivery of services, together with lower cost of goods sold, research and development expenses and general and administrative expenses as a percentage of total revenue. If operating margins do not improve, our earnings could be adversely affected and the price of our securities could decline.
15
Table of Contents
The actual market for our solutions could be significantly smaller than our estimates of our total potential market opportunity, and if customer demand for our services does not meet expectations, our ability to generate revenue and meet our financial targets could be adversely affected.
While we expect strong growth in the markets for our products, it is possible that the growth in some or all of these markets may not meet our expectations, or materialize at all. The methodology on which our estimate of our total potential market opportunity is based includes several key assumptions based on our industry knowledge and customer experience. If any of these assumptions proves to be inaccurate, then the actual market for our solutions could be significantly smaller than our estimates of our total potential market opportunity. If the customer demand for our services or the adoption rate in our target markets does not meet our expectations, our ability to generate revenue from customers and meet our financial targets could be adversely affected.
Our business is substantially dependent upon the continued growth of the market for on-demand software solutions.
We derive, and expect to continue to derive, substantially all of our revenue from the sale of our on-demand solutions. As a result, widespread acceptance and use of the on-demand business model is critical to our future growth and success. Under the perpetual or periodic license model for software procurement, users of the software would typically install and operate the applications on their hardware. Because many companies are generally predisposed to maintaining control of their information technology, or IT, systems and infrastructure, there may be resistance to the concept of accessing software as a service provided by a third party. In addition, the market for on-demand software solutions is still evolving, and competitive dynamics may cause pricing levels to change as the market matures and as existing and new market participants introduce new types of solutions and different approaches to enable organizations to address their technology needs. As a result, we may be forced to reduce the prices we charge for our products and may be unable to renew existing customer agreements or enter into new customer agreements at the same prices and upon the same terms that we have historically. If the market for on-demand software solutions fails to grow, grows more slowly than we currently anticipate or evolves and forces us to reduce the prices we charge for our products, our bookings growth, revenue, gross margin and other operating results could be materially adversely affected.
Our operating results may fluctuate from quarter to quarter, which could make them difficult to predict.
Our quarterly operating results are tied to certain financial and operational metrics that have fluctuated in the past and may fluctuate significantly in the future. As a result, you should not rely upon our past quarterly operating results as indicators of future performance. Our operating results depend on numerous factors, many of which are outside of our control. In addition to the other risks described in this “Risk Factors” section, the following risks could cause our operating results to fluctuate:
| • | our ability to retain existing customers and attract new customers; |
| • | the rates at which our customers renew; |
| • | the amount of revenue generated from our customers’ use of our products or services in excess of their committed contractual entitlements; |
| • | the timing and amount of costs of new and existing sales and marketing efforts; |
| • | the timing and amount of operating costs and capital expenditures relating to expansion of our business, operations and infrastructure; |
| • | the cost and timing of the development and introduction of new product and service offerings by us or our competitors; and |
| • | system or service failures, security breaches or network downtime. |
16
Table of Contents
We operate in a relatively new and rapidly developing market, which makes it difficult to evaluate our business and future prospects.
The market for our products and services is relatively new and rapidly developing, which makes it difficult to evaluate our business and future prospects. We have encountered, and will continue to encounter, risks and difficulties frequently experienced by growing companies in rapidly changing industries, including those related to:
| • | market acceptance of our current and future products and services; |
| • | customer renewal rates; |
| • | our ability to compete with other companies that are currently in, or may in the future enter, the market for our products; |
| • | our ability to successfully expand our business, especially internationally; |
| • | our ability to control costs, including our operating expenses; |
| • | the amount and timing of operating expenses, particularly sales and marketing expenses, related to the maintenance and expansion of our business, operations and infrastructure; |
| • | network outages or security breaches and any associated expenses; |
| • | foreign currency exchange rate fluctuations; |
| • | write-downs, impairment charges or unforeseen liabilities in connection with acquisitions; |
| • | our ability to successfully manage acquisitions; and |
| • | general economic and political conditions in our domestic and international markets. |
If we do not manage these risks successfully, our business will be harmed.
Our long-term success depends, in part, on our ability to expand the sales of our products to customers located outside of the United States, and thus our business is susceptible to risks associated with international sales and operations.
We currently maintain offices and have sales personnel in Australia, France, India, Japan, Singapore, South Korea, Spain, the United Arab Emirates, Mexico, Portugal, Germany, and the United Kingdom, or U.K., and we intend to expand our international operations. Any international expansion efforts that we may undertake may not be successful. In addition, conducting international operations subjects us to new risks that we have not generally faced in the United States. These risks include:
| • | unexpected costs and errors in the localization of our products, including translation into foreign languages and adaptation for local practices and regulatory requirements; |
| • | lack of familiarity with and burdens of complying with foreign laws, legal standards, regulatory requirements, tariffs, and other barriers; |
| • | unexpected changes in regulatory requirements, taxes, trade laws, tariffs, export quotas, custom duties or other trade restrictions; |
| • | difficulties in managing systems integrators and technology partners; |
| • | differing technology standards; |
| • | longer accounts receivable payment cycles and difficulties in collecting accounts receivable; |
| • | difficulties in managing and staffing international operations and differing employer/employee relationships; |
| • | fluctuations in exchange rates that may increase the volatility of our foreign-based revenue; |
17
Table of Contents
| • | potentially adverse tax consequences, including the complexities of foreign value added tax (or other tax) systems and restrictions on the repatriation of earnings; |
| • | uncertain political and economic climates (including, for example, the U.K.’s exit from the European Union, or EU, on January 31, 2020, commonly referred to as “Brexit”, which has created economic and political uncertainty in the EU); and |
| • | reduced or varied protection for intellectual property rights in some countries. |
These factors may cause our costs of doing business in these geographies to exceed our comparable domestic costs. Operating in international markets also requires significant management attention and financial resources. Any negative impact from our international business efforts could negatively impact our business, results of operations and financial condition as a whole.
Economic conditions and regulatory changes following the United Kingdom’s exit from the European Union could have a material adverse effect on our business and results of operations.
The U.K. formally left the EU on January 31, 2020, typically referred to as “Brexit.” Pursuant to the formal withdrawal arrangements agreed between the U.K. and EU, the U.K. will be subject to a transition period until December 31, 2020 during which EU rules will continue to apply. Negotiations between the U.K. and EU are expected to continue in relation to the customs and trading relationship between the U.K. and EU following the expiration of the transition period. The uncertainty concerning the U.K.’s legal, political and economic relationship with the EU after the transition period may be a source of instability in international markets, create significant currency fluctuations and otherwise adversely affect trading agreements or similar cross-border cooperation arrangements, whether economic, tax, fiscal, legal, regulatory or otherwise. While the full effects of Brexit will not be known for some time, Brexit could cause disruptions to, and create uncertainty surrounding, our business and results of operations. For example, following the transition period, the U.K. could lose the benefits of global trade agreements negotiated by the EU on behalf of its members, which may result in increased trade barriers that could make our doing business in the EU and the European Economic Area more difficult. Ongoing global market volatility and a deterioration in economic conditions due to uncertainty surrounding the future relationship between the U.K. and EU could significantly disrupt the markets in which we operate and lead our customers to closely monitor their costs and delay capital spending decisions.
Additionally, Brexit has resulted in the strengthening of the U.S. dollar against foreign currencies in which we conduct business. Although this strengthening has been somewhat ameliorated by the implementation of the transition period, because we translate revenue denominated in foreign currency into U.S. dollars for our financial statements, during periods of a strengthening U.S. dollar, our reported revenue from foreign operations is reduced. As a result of Brexit and the continued negotiations between the U.K. and EU, there may be further periods of volatility in the currencies in which we conduct business.
The effects of Brexit will depend on any agreements the U.K. makes to retain access to EU markets following the transition period. The measures could potentially disrupt the markets we serve and may cause us to lose customers and employees. In addition, Brexit could lead to legal uncertainty and potentially divergent national laws and regulations as the U.K. determines which EU laws to replace or replicate, which could present new regulatory costs and challenges.
Any of these effects of Brexit could materially adversely affect our business, results of operations and financial condition.
We must keep up with rapid technological change to remain competitive in a rapidly evolving industry.
Our markets are characterized by rapid technological change, frequent new product and service introductions and evolving industry standards. Our future success will depend on our ability to adapt quickly to
18
Table of Contents
rapidly changing technologies, to adapt our services and products to evolving industry standards and to improve the performance and reliability of our services and products. To achieve market acceptance for our products, we must effectively anticipate and offer products that meet changing customer demands in a timely manner. Customers may require features and functionality that our current products do not have. If we fail to develop products that satisfy customer preferences in a timely and cost-effective manner, our ability to renew our contracts with existing customers and our ability to create or increase demand for our products will be harmed.
We may experience difficulties with software development, industry standards, design or marketing that could delay or prevent our development, introduction or implementation of new products and enhancements. The introduction of new products by competitors, the emergence of new industry standards or the development of entirely new technologies to replace existing offerings could render our existing or future products obsolete.
If we are unable to successfully develop or acquire new features and functionality, enhance our existing products to anticipate and meet customer requirements or sell our products into new markets, our bookings growth, revenue and results of operations will be adversely affected.
We face significant competition and may be unsuccessful against current and future competitors. If we do not compete effectively, our operating results and future growth could be harmed.
We compete with video sharing sites, in-house solutions, online video platforms and certain niche technology providers, as well as larger companies that offer multiple services, including those that may be used as substitute services for our products. Competition is already intense in these markets and, with the introduction of new technologies and market entrants, we expect competition to further intensify in the future. In addition, some of our competitors may make acquisitions, be acquired, or enter into strategic relationships to offer a more comprehensive service than we do. These combinations may make it more difficult for us to compete effectively. We expect these trends to continue as competitors attempt to strengthen or maintain their market positions.
Demand for our services is sensitive to price. Many factors, including our marketing, customer acquisition and technology costs, commoditization of our products and services and our current and future competitors’ pricing and marketing strategies, can significantly affect our pricing strategies. There can be no assurance that we will not be forced to engage in price-cutting initiatives, or to increase our marketing and other expenses to attract and retain customers in response to competitive pressures, either of which could have a material adverse effect on our revenue, operating results and resources.
We will likely encounter significant, growing competition in our business from many sources, including portals and digital media retailers, search engines, social networking and consumer-sharing services companies, broadband media distribution platforms, technology suppliers, direct broadcast satellite television service companies and digital and traditional cable systems. Many of our present and likely future competitors have substantially greater financial, marketing, technological and other resources than we do. Some of these companies may even choose to offer services competitive with ours at no cost as a strategy to attract or retain customers of their other services. Technological and commercial developments may lead to the increasing commoditization of our products and services, including content delivery and storage, further increasing downward pressure on the prices we can charge. If we are unable to compete successfully with traditional and other emerging providers of competing services, our business, financial condition and results of operations could be adversely affected.
We depend on the experience and expertise of our executive officers, senior management team and key technical employees, and the loss of any key employee could have an adverse effect on our business, financial condition and results of operations.
Our success depends upon the continued service of our executive officers, senior management team and key technical employees, as well as our ability to continue to attract and retain additional highly qualified personnel.
19
Table of Contents
Each of our executive officers, senior management team, key technical personnel and other employees could terminate his or her relationship with us at any time. The loss of any member of our senior management team or key personnel might significantly delay or prevent the achievement of our business objectives and could materially harm our business and our customer relationships. In addition, because of the nature of our business, the loss of any significant number of our existing engineering, project management and sales personnel could have an adverse effect on our business, financial condition and results of operations.
Changes in our business and operations, as well as organizational changes, have placed, and may continue to place, significant demands on our management and infrastructure. If we fail to manage these changes effectively and successfully recruit additional highly-qualified employees, we may be unable to execute our business plan, maintain high levels of service or address competitive challenges adequately.
Our business, headcount and operations have grown, both domestically and internationally, since our inception. In addition, we have seen organizational changes during that time, including the addition of several new members to our leadership team in 2018 and 2019. This growth and these organizational changes have placed, and will continue to place, a significant strain on our management, administrative, operational and financial infrastructure. We anticipate further growth will be required to address increases in our product and service offerings and continued international expansion. Our success will depend in part upon the ability of our senior management team to manage Brightcove effectively. To do so, we must continue to recruit, hire, train, manage and integrate a significant number of qualified managers, technical personnel and employees in specialized roles within our company, including in technology, sales and marketing. If our new employees perform poorly, or if we are unsuccessful in recruiting, hiring, training, managing and integrating these new employees, or retaining these or our existing employees, our business may suffer.
In addition, to manage the expected continued growth of our business, headcount, operations and geographic expansion, we will need to continue to improve our information technology infrastructure, operational, financial and management systems and procedures. Our expected additional headcount and capital investments will increase our costs, which will make it more difficult for us to address any future revenue shortfalls by reducing expenses in the short term. If we fail to successfully manage our growth we will be unable to successfully execute our business plan, which could have a negative impact on our business, financial condition or results of operations.
Our transaction with Ooyala, Inc. and/or potential future acquisitions could be difficult to integrate, divert the attention of key personnel, disrupt our business, dilute stockholder value and impair our financial results.
As part of our business strategy, we intend to consider acquisitions of companies, technologies and products that we believe could accelerate our ability to compete in our core markets or allow us to enter new markets. For example, in April 2019, we acquired the online video player related assets of Ooyala, Inc. (“Ooyala”) and certain of its subsidiaries. Acquisitions, including the Ooyala transaction, involve numerous risks, any of which could harm our business, including:
| • | difficulties in integrating the technologies, products, operations and existing contracts of a target company and realizing the anticipated benefits of the combined businesses; |
| • | difficulties in integrating the personnel of a target company, including the onboarding of approximately 100 Ooyala employees hired in connection with the Ooyala transaction; |
| • | difficulties in supporting and transitioning customers, if any, of a target company, including the customers that we acquired in connection with the Ooyala transaction; |
| • | diversion of financial and management resources from existing operations; |
| • | the price we pay or other resources that we devote may exceed the value we realize, or the value we could have realized if we had allocated the purchase price or other resources to another opportunity; |
20
Table of Contents
| • | risks of entering new markets in which we have limited or no experience; |
| • | potential loss of key employees, customers and strategic alliances from either our current business or a target company’s business, including the customers that we acquired in connection with the Ooyala transaction; and |
| • | inability to generate sufficient revenue to offset acquisition costs. |
Acquisitions also frequently result in the recording of goodwill and other intangible assets which are subject to potential impairments in the future that could harm our financial results. In addition, if we finance acquisitions by issuing equity securities, our existing stockholders may be diluted. As a result, if we fail to properly evaluate acquisitions or investments, we may not achieve the anticipated benefits of any such acquisitions, and we may incur costs in excess of what we anticipate. The failure to successfully evaluate and execute acquisitions or investments or otherwise adequately address these risks could materially harm our business and financial results.
We may experience delays in product and service development, including delays beyond our control, which could prevent us from achieving our growth objectives and hurt our business.
Many of the problems, delays and expenses we may encounter may be beyond our control. Such problems may include, but are not limited to, problems related to the technical development of our products and services, problems with the infrastructure for the distribution and delivery of online media, the competitive environment in which we operate, marketing problems, consumer acceptance and costs and expenses that may exceed current estimates. Problems, delays or expenses in any of these areas could have a negative impact on our business, financial conditions or results of operations.
Delays in the timely design, development, deployment and commercial operation of our product and service offerings, and consequently the achievement of our revenue targets and positive cash flow, could result from a variety of causes, including many causes that are beyond our control. Such delays include, but are not limited to, delays in the integration of new offers into our existing offering, changes to our products and services made to correct or enhance their features, performance or marketability or in response to regulatory developments or otherwise, delays encountered in the development, integration or testing of our products and services and the infrastructure for the distribution and delivery of online media and other systems, unsuccessful commercial launches of new products and services, delays in our ability to obtain financing, insufficient or ineffective marketing efforts and slower-than-anticipated consumer acceptance of our products. Delays in any of these matters could hinder or prevent our achievement of our growth objectives and hurt our business.
There is no assurance that the current cost of Internet connectivity and network access will not rise with the increasing popularity of online media services.
We rely on third-party service providers for our principal connections to the Internet and network access, and to deliver media to consumers. As demand for online media increases, there can be no assurance that Internet and network service providers will continue to price their network access services on reasonable terms. The distribution of online media requires delivery of digital content files and providers of network access and distribution may change their business models and increase their prices significantly, which could slow the widespread adoption of such services. In order for our services to be successful, there must be a reasonable price model in place to allow for the continuous distribution of digital media files. We have limited or no control over the extent to which any of these circumstances may occur, and if network access or distribution prices rise, our business, financial condition and results of operations would likely be adversely affected.
Failure of our infrastructure for the distribution and delivery of online media could adversely affect our business.
Our success as a business depends, in large part, on our ability to provide a consistently high-quality digital experience to consumers via our relationships and infrastructure for the distribution and delivery of online media
21
Table of Contents
generally. There is no guarantee that our relationships and infrastructure will not experience problems or other performance issues, which could seriously impair the quality and reliability of our delivery of digital media to end users. For example, we primarily use three content delivery networks, or CDNs, to deliver content to end users. If one or more of these CDNs were to experience sustained technical failures, it could cause delays in our service and we could lose customers. If we do not accurately predict our infrastructure capacity requirements, our customers could experience service outages or service degradation that may subject us to financial penalties and liabilities and result in customer losses. In the past we have, on limited occasions, suffered temporary interruptions of certain aspects of our service, including our customers’ ability to upload new content into our system, our customers’ ability to access administrative control of their accounts, and our ability to deliver content to end users in certain geographic locations. These service interruptions were the results of human error, hardware and software failures or failures of third-party networks. On a limited number of occasions, these service interruptions have required us to provide service credits to customers. We cannot guarantee that service interruptions will not occur again or predict the duration of interruptions of our service or the impact of such interruptions on our customers. Failures and interruptions of our service may impact our reputation, result in our payment of compensation or service credits to our customers, result in loss of customers and adversely affect our financial results and ability to grow our business. In addition, if AWS or our hosting infrastructure capacity fails to keep pace with increased sales or if our delivery capabilities fail, customers may experience delays as we seek to obtain additional capacity or enable alternative delivery capability, which could harm our reputation and adversely affect our revenue growth.
We may have difficulty scaling and adapting our existing infrastructure to accommodate increased traffic and storage, technology advances or customer requirements.
In the future, advances in technology, increases in traffic and storage, and new customer requirements may require us to change our infrastructure, expand our infrastructure or replace our infrastructure entirely. Scaling and adapting our infrastructure is likely to be complex and require additional technical expertise. If we are required to make any changes to our infrastructure, we may incur substantial costs and experience delays or interruptions in our service. These delays or interruptions may cause customers and partners to become dissatisfied with our service and move to competing service providers. Our failure to accommodate increased traffic and storage, increased costs, inefficiencies or failures to adapt to new technologies or customer requirements and the associated adjustments to our infrastructure could harm our business, financial condition and results of operations.
We rely on software and services licensed from other parties. The loss of software or services from third parties could increase our costs and limit the features available in our products and services.
Components of our service and product offerings include various types of software and services licensed from unaffiliated parties. If any of the software or services we license from others or functional equivalents thereof were either no longer available to us or no longer offered on commercially reasonable terms, we would be required to either redesign our services and products to function with software or services available from other parties or develop these components ourselves. In either case, the transition to a new service provider or an internally-developed solution could result in increased costs and could result in delays in our product launches and the release of new service and product offerings. Furthermore, we might be forced to temporarily limit the features available in our current or future products and services. If we fail to maintain or renegotiate any of these software or service licenses, we could face significant delays and diversion of resources in attempting to license and integrate functional equivalents.
If our software products contain serious errors or defects, then we may lose revenue and market acceptance and may incur costs to defend or settle claims.
Complex software applications such as ours often contain errors or defects, particularly when first introduced or when new versions or enhancements are released. Despite internal testing and testing by our
22
Table of Contents
customers, our current and future products may contain serious defects, which could result in lost revenue, lost customers, slower growth or a delay in market acceptance.
Since our customers use our products for critical business applications, errors, defects or other performance problems could result in damage to our customers. They could seek significant compensation from us for the losses they suffer. Although our customer agreements typically contain provisions designed to limit our exposure to claims, existing or future laws or unfavorable judicial decisions could negate these limitations. Even if not successful, a claim brought against us would likely be time-consuming and costly and could seriously damage our reputation in the marketplace, making it harder for us to sell our products.
Unauthorized disclosure of data, unauthorized access to our service and misuse of our service could adversely affect our business.
Any security breaches, unauthorized access, unauthorized usage, virus or similar breach or disruption could result in loss of confidential information, personal data and customer content, damage to our reputation, early termination of our contracts, litigation, regulatory investigations, increased costs or other liabilities. If our security measures, or those of our partners or service providers, are breached as a result of third-party action, employee error, malfeasance or otherwise and, as a result, someone obtains unauthorized access to confidential information, personal data or customer content, our reputation will be damaged, our business may suffer or we could incur significant liability. If the measures we have put in place to limit or restrict access to and use of functionality, usage entitlements and support for customers or prospective customers are breached, circumvented or ineffective as a result of third-party action, employee error, malfeasance or otherwise and, as a result, someone obtains unauthorized access to and use of functionality, usage entitlements and support, our business may suffer or we could incur significant liability and/or costs.
Techniques used to obtain unauthorized access or use or to sabotage systems change frequently and generally are not recognized until launched against a target. As a result, we may be unable to anticipate these techniques or to implement adequate preventative measures. If an actual or perceived security breach occurs, the market perception of our security measures could be harmed and we could lose sales and customers. Any significant violations of data privacy or unauthorized disclosure of information could result in the loss of business, litigation and regulatory investigations and penalties that could damage our reputation and adversely impact our results of operations and financial condition. Moreover, if a security breach occurs with respect to another software as a service, or SaaS, provider, our customers and potential customers may lose trust in the security of the SaaS business model generally, which could adversely impact our ability to retain existing customers or attract new ones.
There can be no assurance that any limitations of liability provisions in our contracts for a security breach would be enforceable or adequate or would otherwise protect us from any such liabilities or damages with respect to any particular claim. We also cannot be sure that our existing general liability insurance coverage and coverage for errors or omissions will continue to be available on acceptable terms or will be available in sufficient amounts to cover one or more large claims, or that the insurer will not deny coverage as to any future claim. The successful assertion of one or more large claims against us that exceed available insurance coverage, or the occurrence of changes in our insurance policies, including premium increases or the imposition of large deductible or co-insurance requirements, could have a material adverse effect on our business, financial condition and operating results.
We use a data center and cloud computing services facilities to deliver our services. Any disruption of service at these facilities could harm our business.
We manage our services and serve all of our customers from cloud computing services facilities, such as AWS, as well as one physical data center facility. While we control the actual computer and storage systems upon which our software runs, and deploy them to these facilities, we do not control the operation or availability of these facilities.
23
Table of Contents
The owners of these facilities have no obligation to renew their agreements with us on commercially reasonable terms, or at all. If we are unable to renew these agreements on commercially reasonable terms, we may be required to transfer to new facilities, and we may incur significant costs and possible service interruption in connection with doing so.
Any changes in third-party service levels at these facilities or any errors, defects, disruptions or other performance problems at or related to these facilities that affect our services could harm our reputation and may damage our customers’ businesses. Interruptions in our services might reduce our revenue, cause us to issue credits to customers, subject us to potential liability, and cause customers to terminate their subscriptions or harm our renewal rates.
These facilities are vulnerable to damage or service interruption resulting from human error, intentional bad acts, security breaches, earthquakes, hurricanes, floods, fires, war, terrorist attacks, power losses, hardware failures, systems failures, telecommunications failures and similar events. For example, on September 18, 2014, we suffered a service disruption resulting from a distributed denial-of-service attack at third-party data center facilities used by us. By September 20, 2014, we had restored the services impacted by the attack. We contacted federal law enforcement authorities regarding the denial-of-service attack and cooperated with them. We also conducted an assessment of our internet service providers and data center providers, potential future vulnerability to malicious activity, and the sufficiency of our infrastructure to withstand and recover rapidly from such attacks. While this matter did not have a material adverse effect on our operating results, there can be no assurance that such incidents will not occur again, and they could occur more frequently and on a more significant scale. The occurrence of a natural disaster or an act of terrorism, or vandalism or other misconduct, or a decision to close the facilities without adequate notice or other unanticipated problems could result in lengthy interruptions in our services.
Our business may be adversely affected by third-party claims, including by governmental bodies, regarding the content and advertising distributed through our service.
We rely on our customers to secure the rights to redistribute content over the Internet, and we do not screen the content that is distributed through our service. There is no assurance that our customers have licensed all rights necessary for distribution, including Internet distribution. Other parties may claim certain rights in the content of our customers.
In the event that our customers do not have the necessary distribution rights related to content, we may be required to cease distributing such content, or we may be subject to lawsuits and claims of damages for infringement of such rights. If these claims arise with frequency, the likelihood of our business being adversely affected would rise significantly. In some cases, we may have rights to indemnification or claims against our customers if they do not have appropriate distribution rights related to specific content items, however there is no assurance that we would be successful in any such claim.
We operate an “open” publishing platform and do not screen the content that is distributed through our service. Content may be distributed through our platform that is illegal or unlawful under international, federal, state or local laws or the laws of other countries. We may face lawsuits, claims or even criminal charges for such distribution, and we may be subject to civil, regulatory or criminal sanctions and damages for such distribution. Any such claims or investigations could adversely affect our business, financial condition and results of operations.
We could incur substantial costs as a result of any claim of infringement of another party’s intellectual property rights.
In recent years, there has been significant litigation in the United States involving patents and other intellectual property rights. Companies providing Internet-related products and services are increasingly bringing
24
Table of Contents
and becoming subject to suits alleging infringement of proprietary rights, particularly patent rights. These risks have been amplified by the increase in third parties whose sole or primary business is to assert such claims, some of whom have sent letters to and/or filed suit alleging infringement against some of our customers. From time to time, third parties claim that we are infringing upon their intellectual property rights. We could incur substantial costs in prosecuting or defending any intellectual property litigation. Additionally, the defense or prosecution of claims could be time-consuming, and could divert our management’s attention away from the execution of our business plan.
Moreover, any settlement or adverse judgment resulting from a claim could require us to pay substantial amounts or obtain a license to continue to use the technology that is the subject of the claim, or otherwise restrict or prohibit our use of the technology. There can be no assurance that we would be able to obtain a license from the third party asserting the claim on commercially reasonable terms, if at all, that we would be able to develop alternative technology on a timely basis, if at all, or that we would be able to obtain a license to use a suitable alternative technology to permit us to continue offering, and our customers to continue using, our affected product or service. In addition, we may be required to indemnify our customers for third-party intellectual property infringement claims, which would increase the cost to us. An adverse determination could also prevent us from offering our products or services to others. Infringement claims asserted against us may have an adverse effect on our business, financial condition and results of operations.
Our agreements with customers often include contractual obligations to indemnify them against claims that our products infringe the intellectual property rights of third parties. The results of any intellectual property litigation to which we might become a party, or for which we are required to provide indemnification, may force us to do one or more of the following:
| • | cease selling or using products or services that incorporate the challenged intellectual property; |
| • | make substantial payments for costs or damages; |
| • | obtain a license, which may not be available on reasonable terms, to sell or use the relevant technology; or |
| • | redesign those products or services to avoid infringement. |
If we are required to make substantial payments or undertake any of the other actions noted above as a result of any intellectual property infringement claims against us or any obligation to indemnify our customers for such claims, such payments or costs could have a material adverse effect upon our business and financial results.
Failure to adequately protect our intellectual property could substantially harm our business and operating results.
Because our business depends substantially on our intellectual property, the protection of our intellectual property rights is important to the success of our business. We rely upon a combination of trademark, patent, trade secret and copyright law and contractual restrictions to protect our intellectual property. These afford only limited protection. Despite our efforts to protect our property rights, unauthorized parties may attempt to copy aspects of our products, service, software and functionality or obtain and use information that we consider proprietary. Moreover, policing our proprietary rights is difficult and may not always be effective. In addition, we may need to enforce our rights under the laws of countries that do not protect proprietary rights to as great an extent as do the laws of the United States.
Litigation or proceedings before the U.S. Patent and Trademark Office or other governmental authorities and administrative bodies in the United States and abroad may be necessary in the future to enforce our intellectual property rights, to protect our patent rights, trade secrets, trademarks and domain names, and to determine the validity and scope of the proprietary rights of others. Such litigation or proceedings may be very costly and impact our financial performance. We may also incur substantial costs defending against frivolous
25
Table of Contents
litigation or be asked to indemnify our customers against the same. Our efforts to enforce or protect our proprietary rights may prove to be ineffective and could result in substantial costs and diversion of resources and could substantially harm our operating results.
Our exposure to risks associated with the use of intellectual property may increase as a result of acquisitions, as we have less opportunity to have visibility into the development process with respect to acquired technology or the care taken to safeguard against infringement risks. Third parties may make infringement and similar or related claims after we have acquired technology that had not been asserted prior to our acquisition.
Confidentiality agreements with employees and others may not adequately prevent disclosure of trade secrets and other proprietary information.
We have devoted substantial resources to the development of our technology, business operations and business plans. In order to protect our trade secrets and proprietary information, we rely in significant part on confidentiality agreements with our employees, licensees, independent contractors, advisers and customers. These agreements may not be effective to prevent disclosure of confidential information, including trade secrets, and may not provide an adequate remedy in the event of unauthorized disclosure of confidential information. In addition, others may independently discover trade secrets and proprietary information, and in such cases we would not be able to assert trade secret rights against such parties. To the extent that our employees and others with whom we do business use intellectual property owned by others in their work for us, disputes may arise as to the rights in related or resulting know-how and inventions. Laws regarding trade secret rights in certain markets in which we operate may afford little or no protection to our trade secrets. The loss of trade secret protection could make it easier for third parties to compete with our products by copying functionality. In addition, any changes in, or unexpected interpretations of, the trade secret and other intellectual property laws in any country in which we operate may compromise our ability to enforce our trade secret and intellectual property rights. Costly and time-consuming litigation could be necessary to enforce and determine the scope of our proprietary rights, and failure to obtain or maintain trade secret protection could adversely affect our competitive business position.
Our use of “open source” software could negatively affect our ability to sell our services and subject us to possible litigation.
A portion of the technology licensed by us incorporates “open source” software, and we may incorporate open source software in the future. Such open source software is generally licensed by its authors or other third parties under open source licenses. If we fail to comply with these licenses, we may be subject to certain conditions, including requirements that we offer our services that incorporate the open source software for no cost, that we make available source code for modifications or derivative works we create based upon, incorporating or using the open source software and that we license such modifications or alterations under the terms of the particular open source license. If an author or other third party that distributes such open source software were to allege that we had not complied with the conditions of one or more of these licenses, we could be required to incur significant legal expenses defending against such allegations and could be subject to significant damages, enjoined from the sale of our services that contained the open source software and required to comply with the foregoing conditions, which could disrupt the distribution and sale of some of our services.
Fluctuations in the exchange rate of foreign currencies could result in currency translation losses.
We currently have foreign sales denominated in Australian dollars, British pound sterling, Euros, Japanese yen and New Zealand dollars and may, in the future, have sales denominated in the currencies of additional countries in which we establish or have established sales offices. In addition, we incur a portion of our operating expenses in British pound sterling, Euros, Japanese yen and, to a lesser extent, other foreign currencies. Any fluctuation in the exchange rate of these foreign currencies may negatively impact our business, financial condition and operating results. We have not previously engaged in foreign currency hedging. If we decide to
26
Table of Contents
hedge our foreign currency exposure, we may not be able to hedge effectively due to lack of experience, unreasonable costs or illiquid markets.
We may be required to collect sales and use taxes on the services we sell in additional jurisdictions in the future, which may decrease sales, and we may be subject to liability for sales and use taxes and related interest and penalties on prior sales.
State and local taxing jurisdictions have differing rules and regulations governing sales and use taxes and these rules and regulations are subject to varying interpretations that may change over time. On June 21, 2018, the United States Supreme Court ruled in South Dakota v. Wayfair that states can impose sales and use taxes on transactions made with out-of-state sellers. Following this ruling, certain states have enforced tax laws requiring taxation of out-of-state purchases. We have performed an assessment of sales taxes owed under the new court ruling and determined that we need to remit sales taxes to certain states. There is a risk that states which do not currently impose taxes on out-of-state purchases will do so in the future. We cannot assure you that we will not be subject to sales and use taxes or related penalties for past sales in states where we presently believe sales and use taxes are not due. We reserve estimated sales and use taxes in our financial statements but we cannot be certain that we have made sufficient reserves to cover all taxes that might be assessed.
If one or more taxing authorities determines that taxes should have, but have not, been paid with respect to our services, we may be liable for past taxes in addition to being required to collect sales or similar taxes in respect of our services going forward. Liability for past taxes may also include substantial interest and penalty charges. Our client contracts typically provide that our clients must pay all applicable sales and similar taxes. Nevertheless, clients may be reluctant to pay back taxes and may refuse responsibility for interest or penalties associated with those taxes or we may determine that it would not be feasible to seek reimbursement. If we are required to collect and pay back taxes and the associated interest and penalties and if our clients do not reimburse us for all or a portion of these amounts, we will incur unplanned expenses that may be substantial. Moreover, imposition of such taxes on our services going forward will effectively increase the cost of such services to our clients and may adversely affect our ability to retain existing clients or to gain new clients in the areas in which such taxes are imposed.
Government and industry regulation of the Internet is evolving and could directly restrict our business or indirectly affect our business by limiting the growth of our markets. Unfavorable changes in government regulation or our failure to comply with regulations could harm our business and operating results.
Federal, state and foreign governments and agencies have adopted and could in the future adopt regulations covering issues such as user privacy, content, and taxation of products and services. Government regulations could limit the market for our products and services or impose burdensome requirements that render our business unprofitable. Our products enable our customers to collect, manage and store a wide range of data. The United States and various state governments have adopted or proposed limitations on the collection, distribution and use of personal information. Several foreign jurisdictions, including the European Union and the United Kingdom, have adopted legislation (including directives or regulations) that increase or change the requirements governing data collection and storage in these jurisdictions. If our privacy or data security measures fail to comply with current or future laws and regulations, we may be subject to litigation, regulatory investigations or other liabilities, or our customers may terminate their relationships with us.
In addition, although many regulations might not apply to our business directly, we expect that laws regulating the solicitation, collection or processing of personal and consumer information could affect our customers’ ability to use and share data, potentially reducing demand for our services. The Telecommunications Act of 1996 and the EU General Data Protection Regulation 2016/679, along with other similar laws and regulations prohibit certain types of information and content from being transmitted over the Internet. The scope of these types of prohibitions in jurisdictions around the world and the liability associated with a violation are evolving. In addition, although substantial portions of the Communications Decency Act were held to be
27
Table of Contents
unconstitutional, we cannot be certain that similar legislation will not be enacted and upheld in the future. Legislation like the Telecommunications Act and the Communications Decency Act could dampen the growth in web usage and decrease its acceptance as a medium of communications and commerce. Moreover, if future laws and regulations limit our customers’ ability to use and share consumer data or our ability to store, process and share data with our customers over the Internet, demand for our products could decrease, our costs could increase, and our results of operations and financial condition could be harmed.
In addition, taxation of services provided over the Internet or other charges imposed by government agencies or by private organizations for accessing the Internet may be imposed. Any regulation imposing greater fees for Internet use or restricting information exchange over the Internet could result in a decline in the use of the Internet and the viability of Internet-based services, which could harm our business and operating results.
Our business is subject to a variety of U.S. and international laws and regulations, including those regarding privacy, data protection and information security, and our customers may be subject to regulations related to the handling and transfer of certain types of sensitive and confidential information. Any failure to comply with applicable laws and regulations would harm our business, results of operations and financial condition.
We and our customers may be subject to privacy- and data protection-related laws and regulations that impose obligations in connection with the collection, use, storage, transfer, dissemination, security, and/or other processing (“Processing”) of personally identifiable information (such personally identifiable information collectively with all information defined or described by applicable law as “personal data,” “personal information,” “PII” or any similar term, “Personally Identifiable Information”) or other sensitive data. Existing U.S. federal and various state and foreign privacy- and data protection-related laws and regulations are evolving and subject to potentially differing interpretations, and various legislative and regulatory bodies may expand current or enact new laws and regulations regarding privacy- and data protection-related matters. New laws, amendments to or re-interpretations of existing laws and regulations, rules of self-regulatory bodies, industry standards and contractual obligations may impact our business and practices, and we may be required to expend significant resources to adapt to these changes or stop offering our products in certain countries. These developments could adversely affect our business, results of operations and financial condition. If our privacy or data security measures fail to comply with current or future laws, regulations, policies, legal obligations or industry standards, we may be subject to litigation, regulatory investigations, fines or other liabilities, as well as negative publicity and a potential loss of business.
The U.S. federal and various state and foreign governments have adopted or proposed limitations on, or requirements regarding, the Processing of Personally Identifiable Information of individuals. For example, in June 2018 California adopted the California Consumer Privacy Act, or CCPA, that became effective on January 1, 2020. The CCPA broadly defines personal information, imposes stringent consumer data protection requirements, gives California residents expanded privacy rights and protections and provides for civil penalties for violations and introduces a private right of action for data breaches. Further, the U.S. Federal Trade Commission and numerous state attorneys general are applying federal and state consumer protection laws to impose standards on the online Processing of data, and to the security measures applied to such data. Similarly, many foreign countries and governmental bodies, including the EU member states, have laws and regulations concerning the Processing of Personally Identifiable Information obtained from their residents and/or individuals located in their jurisdictions or by businesses operating within their jurisdiction, which are often more restrictive than those in the United States. For example, on April 27, 2016 the European Union adopted the General Data Protection Regulation 2016 / 679 (GDPR) that took effect on May 25, 2018. The GDPR applies to any company established in the EU, as well as to those outside the EU if they process personal data (as defined under the GDPR) in connection with the provision of goods or services to individuals in the EU or monitor their behavior. The GDPR enhances data protection obligations for businesses and provides direct legal obligations for service providers processing personal data on behalf of customers. Moreover, the GDPR requirements apply not only to third-party transactions, but also to transfers of information between us and our subsidiaries, including employee information. Noncompliance with the GDPR can trigger steep fines of up to €20 million or 4% of global annual
28
Table of Contents
revenues, whichever is higher. Relatedly, there continue to be concerns about whether the EU-US Privacy Shield, approved on July 8, 2016 by the European Member State representatives as a successor to the Safe Harbor framework, will face additional challenges. We are currently certified to the EU-US Privacy Shield. Until the remaining legal uncertainties regarding the future of the EU-US Privacy Shield are settled, we will continue to face uncertainty as to whether our efforts to comply with our obligations under European privacy laws will be sufficient. We may also experience hesitancy, reluctance, or refusal by European or multi-national customers to continue to use our services due to the potential risk exposure to such customers in the event the EU-US Privacy Shield is invalidated. Further, the United Kingdom’s exit from the European Union, often referred to as Brexit, has created uncertainty with regard to data protection regulation in the United Kingdom. In particular, it is unclear how data transfers to and from the United Kingdom will be regulated now that the United Kingdom has officially left the EU.
In addition to the GDPR, the European Union is also in the process of replacing the e-Privacy Directive (2002/58/EC) with a new set of rules taking the form of a regulation. Originally planned to be adopted and implemented at the same time as the GDPR, the ePrivacy Regulation is still going through the European legislative process. Draft regulations were rejected by the Permanent Representatives Committee of the Council of EU on November 22, 2019; it is not clear when new regulations will be adopted. Preparing for and complying with the GDPR, the ePrivacy Regulation (if and when it becomes effective) and other foreign laws has required and will continue to require us to incur substantial operational costs and may require us to change our business practices. Despite our efforts to bring practices into compliance with the GDPR and before the effective date of the ePrivacy Regulation, we may not be successful either due to internal or external factors such as resource allocation limitations.
With respect to all of the foregoing, any failure or perceived failure by us to comply with U.S., EU or other foreign privacy or data security laws, policies, industry standards or legal obligations, or any security incident that results in the unauthorized Processing of Personally Identifiable Information or other customer data may result in governmental investigations, inquiries, enforcement actions and prosecutions, private litigation, fines and penalties or adverse publicity, and could have a negative effect on our existing business and on our ability to attract and retain new customers.
Our stock price has been volatile and is likely to be volatile in the future.
The market price of our common stock has been and is likely to be highly volatile and could be subject to significant fluctuations in response to, among other things, the risk factors described in this report and other factors beyond our control. Market prices for securities of early stage companies have historically been particularly volatile. Some, but not all, of the factors that may cause the market price of our common stock to fluctuate include:
| • | fluctuations in our quarterly or annual financial results or the quarterly or annual financial results of companies perceived to be similar to us or relevant for our business; |
| • | changes in estimates of our financial results or recommendations by securities analysts; |
| • | failure of our products to achieve or maintain market acceptance; |
| • | changes in market valuations of similar or relevant companies; |
| • | success of competitive service offerings or technologies; |
| • | changes in our capital structure, such as the issuance of securities or the incurrence of debt; |
| • | announcements by us or by our competitors of significant services, contracts, acquisitions or strategic alliances; |
| • | regulatory developments in the United States, foreign countries, or both; |
29
Table of Contents
| • | litigation; |
| • | additions or departures of key personnel; |
| • | investors’ general perceptions; and |
| • | changes in general economic, industry or market conditions. |
In addition, if the market for technology stocks, or the stock market in general, experiences a loss of investor confidence, the trading price of our common stock could decline for reasons unrelated to our business, financial condition, or results of operations. If any of the foregoing occurs, it could cause our stock price to fall and may expose us to lawsuits that, even if unsuccessful, could be costly to defend and a distraction to management.
Our business and operations could be adversely affected if we are subject to stockholder activism, which could cause us to incur significant expense and impact the market price of our common stock.
In recent years, proxy contests and other forms of stockholder activism have been directed against numerous public companies. Stockholder activism, including potential proxy contests, could result in substantial costs and divert the attention of our management and our board of directors and resources from our business. Activist campaigns can create perceived uncertainties as to our future direction, strategy or leadership and may result in the loss of potential business opportunities and harm our ability to attract new customers, employees and investors. In addition, we may be required to incur significant legal fees and other expenses related to any activist stockholder matters. Further, the market price of our common stock could be subject to significant fluctuation or otherwise be adversely affected by the events, risks, and uncertainties of any stockholder activism.
If securities or industry analysts do not publish, or cease publishing, research or reports about us, our business or our market, or if they adversely change their recommendations regarding our stock, our stock price and trading volume could decline.
The trading market for our common stock could be influenced by research and reports that industry or security analysts may publish about us, our business, our market or our competitors. If any of the analysts who may cover us adversely change their recommendations regarding our stock, or provide more favorable relative recommendations about our competitors, our stock price would likely decline. If any analyst who may cover us were to cease coverage of our company or fail to regularly publish reports on us, we could lose visibility in the financial markets, which in turn could cause our stock price or trading volume to decline.
A significant portion of our total outstanding shares may be sold into the public market in the future, which could cause the market price of our common stock to drop significantly, even if our business is doing well.
Sales of up to 1,056,763 shares of our common stock in the public market could occur at any time after April 1, 2020, the expiration of the 12 month lock-up agreement entered into in connection with our acquisition of certain assets of Ooyala. Sales of up to 270,686 shares of our common stock in the public market could occur at any time after August 1, 2020, the expiration of the 12 month lock-up agreements entered into in connection with the August Acquisition. After April 1, 2020 and August 1, 2020, respectively, these shares will be eligible for resale in compliance with Rule 144. These sales or the market perception that the holder or holders of a large number of shares intend to sell shares, could reduce the market price of our common stock.
We do not expect to declare any dividends in the foreseeable future.
We do not anticipate declaring any dividends to holders of our common stock in the foreseeable future. Consequently, investors may need to rely on sales of their common stock after price appreciation, which may never occur, as the only way to realize any future gains on their investment. Investors seeking dividends should not purchase our common stock.
30
Table of Contents
We may be unable to meet our future capital requirements, which could limit our ability to grow.
We believe our existing cash and cash equivalents will be sufficient to meet our anticipated working capital and capital expenditure needs over at least the next 12 months. We may, however, need, or could elect to seek, additional funding at any time. To the extent that existing resources are insufficient to fund our business operations, our future activities for the expansion of our service and our product offerings, developing and sustaining our relationships and infrastructure for the distribution and delivery of digital media online, marketing, and supporting our office facilities, we may need to raise additional funds through equity or debt financing. Additional funds may not be available on terms favorable to us or our stockholders. Furthermore, if we issue equity securities, our stockholders may experience additional dilution or the new equity securities may have rights, preferences and privileges senior to those of our existing classes of stock. If we cannot raise funds on acceptable terms, we may not be able to develop or enhance our products, take advantage of future opportunities or respond to competitive pressures or unanticipated requirements.
Failure to maintain effective internal control over financial reporting could result in our failure to accurately report our financial results. Any inability to report and file our financial results accurately and timely could harm our business and adversely impact investor confidence in our company and, as a result, the value of our common stock.
We are required to evaluate our internal control over financial reporting in connection with Section 404 of the Sarbanes-Oxley Act, and our independent registered public accounting firm is required to attest to the effectiveness of our internal control over financial reporting. This assessment includes the disclosure of any material weaknesses in our internal control over financial reporting identified by our management, as well as our independent registered public accounting firm’s attestation report on our internal control over financial reporting. During the evaluation and testing process, if we identify one or more material weaknesses in our internal control over financial reporting, we will be unable to assert that our internal control over financial reporting is effective. If we are unable to assert that our internal control over financial reporting is effective, or if our independent registered public accounting firm is unable to express an opinion on the effectiveness of our internal control over financial reporting, we could lose investor confidence in the accuracy and completeness of our financial reports, which could have a material adverse effect on the price of our common stock.
Anti-takeover provisions contained in our amended and restated certificate of incorporation and amended and restated bylaws, as well as provisions of Delaware law, could impair a takeover attempt.
Our amended and restated certificate of incorporation and bylaws, and Delaware law, contain provisions that could have the effect of rendering more difficult or discouraging an acquisition deemed undesirable by our board of directors. Our corporate governance documents include provisions:
| • | authorizing blank check preferred stock, which could be issued with voting, liquidation, dividend, and other rights superior to our common stock; |
| • | limiting the liability of, and providing indemnification to, our directors and officers; |
| • | limiting the ability of our stockholders to call and bring business before special meetings and to take action by written consent in lieu of a meeting; |
| • | requiring advance notice of stockholder proposals for business to be conducted at meetings of our stockholders and for nominations of candidates for election to our board of directors; |
| • | controlling the procedures for the conduct and scheduling of board of directors and stockholder meetings; |
| • | providing our board of directors with the express power to postpone previously scheduled annual meetings and to cancel previously scheduled special meetings; |
| • | establishing a classified board of directors so that not all members of our board are selected at one time; |
31
Table of Contents
| • | limiting the determination of the number of directors on our board of directors and the filling of vacancies or newly created seats on the board to our board of directors then in office; and |
| • | providing that directors may be removed by stockholders only for cause. |
These provisions, alone or together, could delay hostile takeovers and changes in control of our company or changes in our management.
As a Delaware corporation, we are also subject to provisions of Delaware law, including Section 203 of the Delaware General Corporation Law, which prevents some stockholders holding more than 15% of our outstanding common stock from engaging in certain business combinations without approval of the holders of substantially all of our outstanding common stock. Any provision of our amended and restated certificate of incorporation or bylaws or Delaware law that has the effect of delaying or deterring a change in control could limit the opportunity for our stockholders to receive a premium for their shares of our common stock, and could also affect the price that some investors are willing to pay for our common stock.
We record substantial expenses related to our issuance of equity awards that may have a material adverse impact on our operating results for the foreseeable future.
We expect our stock-based compensation expenses will continue to be significant in future periods, which will have an adverse impact on our operating results. The model used by us requires the input of subjective assumptions, including the price volatility of the option’s underlying stock, the expected life of the options and the risk-free interest rate. If facts and circumstances change and we employ different assumptions for estimating stock-based compensation expense in future periods, or if we decide to use a different valuation model, the future period expenses may differ significantly from what we have recorded in the current period and could materially affect the fair value estimate of stock-based payments, our operating income, net income and net income per share.
Failure of our customers to pay the amounts owed to us, or to pay such amounts in a timely manner, may adversely affect our financial condition and operating results.
If any of our significant customers have insufficient liquidity, we could encounter significant delays or defaults in payments owed to us by such customers, and we may need to extend our payment terms or restructure the receivables owed to us, which could have a significant adverse effect on our financial condition, including impacting the timing of revenue recognition. Any deterioration in the financial condition of our customers will increase the risk of uncollectible receivables. Global economic uncertainty could also affect our customers’ ability to pay our receivables in a timely manner or at all or result in customers going into bankruptcy or reorganization proceedings, which could also affect our ability to collect our receivables.
| Item 1B. | Unresolved Staff Comments |
Not applicable.
| Item 2. | Properties |
Our corporate headquarters are located in Boston, Massachusetts. We lease 82,184 square feet pursuant to a lease that terminates March 31, 2022. We have sales and marketing offices in Tokyo, Japan; Sydney, Australia; Seoul, South Korea; Mumbai, India; and Singapore. Our offices in New York, New York; London, England; Seattle, Washington; and Scottsdale, Arizona are used for sales and marketing as well as research and development. Our offices in Guadalajara, Mexico and Funchal, Portugal are primarily used for research and development. We believe our facilities are adequate for our current needs.
32
Table of Contents
The Company’s primary office lease has the option to renew the lease for two successive periods of five years each. In connection with the office lease, the Company entered into a letter of credit in the amount of $2.4 million.
| Item 3. | Legal Proceedings |
The Company, from time to time, is party to litigation arising in the ordinary course of business. Management does not believe that the outcome of these claims will have a material adverse effect on the consolidated financial position, results of operations or cash flows of the Company based on the status of proceedings at this time.
| Item 4. | Mine Safety Disclosures |
Not applicable.
33
Table of Contents
| Item 5. | Market for Registrant’s Common Equity, Related Stockholder Matters and Issuer Purchases of Equity Securities |
Our common stock has been traded on the NASDAQ Global Market under the symbol “BCOV” since our initial public offering on February 17, 2012. Prior to this time, there was no public market for our common stock.
Dividend Policy
We have never paid or declared any cash dividends on our common stock. We currently intend to retain any cash flow to finance the growth and development of our business, and we do not expect to pay any cash dividends on our common stock in the foreseeable future. Payment of future dividends, if any, will be at the discretion of our board of directors and will depend on our financial condition, results of operations, capital requirements, restrictions contained in current or future financing instruments and other factors our board of directors deems relevant.
Stockholders
As of February 24, 2020, there were approximately 84 holders of record of our common stock (not including beneficial holders of stock held in street name).
Stock Performance Graph
The graph set forth below compares the cumulative total stockholder return on our common stock between January 1, 2015 and December 31, 2019, with the cumulative total return of (a) the NASDAQ Computer & Data Processing Index and (b) the NASDAQ Composite Index, over the same period. This graph assumes the investment of $100 on January 1, 2015 in our common stock, the NASDAQ Computer & Data Processing Index and the NASDAQ Composite Index and assumes the reinvestment of dividends, if any. The graph assumes our closing sales price on December 31, 2014 of $7.78 per share as the initial value of our common stock.
34
Table of Contents
The comparisons shown in the graph below are based upon historical data. We caution that the stock price performance shown in the graph below is not necessarily indicative of, nor is it intended to forecast, the potential future performance of our common stock. Information used in the graph was obtained from the NASDAQ Stock Market LLC, a financial data provider and a source believed to be reliable. The NASDAQ Stock Market LLC is not responsible for any errors or omissions in such information.
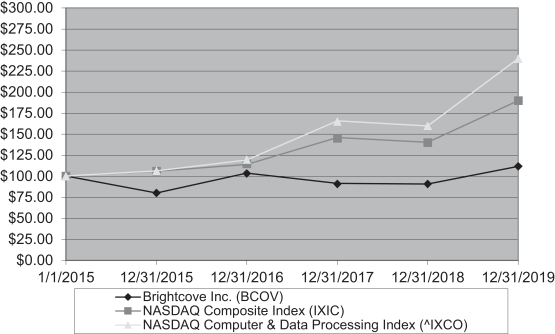
| 1/1/2015 | 12/31/2015 | 12/31/2016 | 12/31/2017 | 12/31/2018 | 12/31/2019 | |||||||||||||||||||
| Brightcove Inc. |
100.0 | 79.7 | 103.5 | 91.3 | 90.5 | 111.7 | ||||||||||||||||||
| NASDAQ Composite Index |
100.0 | 105.7 | 113.7 | 145.8 | 140.1 | 189.5 | ||||||||||||||||||
| NASDAQ Computer & Data Processing Index |
100.0 | 106.2 | 119.3 | 165.5 | 159.4 | 239.7 | ||||||||||||||||||
Purchases of Equity Securities by the Issuer or Affiliated Purchasers
There were no repurchases of shares of common stock made during the year ended December 31, 2019.
| Item 6. | Selected Consolidated Financial Data |
The following selected consolidated financial data should be read in conjunction with “Management’s Discussion and Analysis of Financial Condition and Results of Operations”, the consolidated financial statements and related notes, and other financial information included in this Annual Report on Form 10-K.
We derived the consolidated financial data for the years ended December 31, 2019, 2018 and 2017 and as of December 31, 2019 and 2018 from our audited consolidated financial statements, which are included elsewhere in this Annual Report on Form 10-K. We derived the consolidated financial data for the years ended December 31, 2016 and 2015 and as of December 31, 2017, 2016 and 2015 from our audited consolidated
35
Table of Contents
financial statements, which are not included in this Annual Report on Form 10-K. Historical results are not necessarily indicative of the results to be expected in future periods.
| Year Ended December 31, | ||||||||||||||||||||
| 2019 | 2018 | 2017 | 2016 | 2015 | ||||||||||||||||
| (in thousands, except per share data) | ||||||||||||||||||||
| Consolidated statements of operations data: |
||||||||||||||||||||
| Revenue |
$ | 184,455 | $ | 164,833 | $ | 155,913 | $ | 150,266 | $ | 134,706 | ||||||||||
| Gross profit |
108,986 | 98,209 | 91,295 | 94,419 | 88,229 | |||||||||||||||
| Loss from operations |
(21,063 | ) | (13,101 | ) | (19,696 | ) | (8,978 | ) | (6,931 | ) | ||||||||||
| Consolidated net loss |
(21,903 | ) | (14,028 | ) | (19,519 | ) | (9,986 | ) | (7,580 | ) | ||||||||||
| Basic and diluted net loss per share |
(0.58 | ) | (0.39 | ) | (0.57 | ) | (0.30 | ) | (0.23 | ) | ||||||||||
| As of December 31, | ||||||||||||||||||||
| 2019 | 2018 | 2017 | 2016 | 2015 | ||||||||||||||||
| (in thousands) | ||||||||||||||||||||
| Consolidated Balance Sheet Data: |
||||||||||||||||||||
| Cash and cash equivalents |
$ | 22,759 | $ | 29,306 | $ | 26,132 | $ | 36,813 | $ | 27,637 | ||||||||||
| Accounts receivable, net |
31,181 | 23,264 | 25,236 | 21,575 | 21,213 | |||||||||||||||
| Property and equipment, net |
12,086 | 9,703 | 9,143 | 9,264 | 8,689 | |||||||||||||||
| Working capital |
(20,452 | ) | 2,966 | (983 | ) | 7,792 | 6,592 | |||||||||||||
| Total assets |
172,867 | 133,356 | 127,615 | 136,424 | 127,668 | |||||||||||||||
| Deferred revenue |
49,260 | 39,992 | 39,614 | 34,756 | 29,931 | |||||||||||||||
| Total stockholders’ equity |
74,123 | 70,614 | 66,756 | 78,196 | 78,135 | |||||||||||||||
36
Table of Contents
| Item 7. | Management’s Discussion and Analysis of Financial Condition and Results of Operations |
The following discussion and analysis of our financial condition and results of operations should be read in conjunction with the financial statements and related notes appearing elsewhere in this Annual Report on Form 10-K. The following discussion contains forward-looking statements that reflect our plans, estimates, and beliefs. Our actual results could differ materially from those discussed in the forward-looking statements. Factors that could cause or contribute to these differences include those discussed below and elsewhere in this Annual Report on Form 10-K, particularly in “Risk Factors.”
Overview
We are a leading global provider of cloud-based services for video. We were incorporated in Delaware in August 2004 and our headquarters are in Boston, Massachusetts. Our suite of products and services reduce the cost and complexity associated with publishing, distributing, measuring and monetizing video across devices.
Brightcove Video Cloud, or Video Cloud, our flagship product, is the world’s leading online video platform. Video Cloud enables our customers to publish and distribute video to Internet-connected devices quickly, easily and in a cost-effective and high-quality manner. Brightcove OTT Flow is a service for media companies and content owners to rapidly deploy high-quality, direct-to-consumer, live and on-demand video services across platforms. Brightcove Video Marketing Suite, or Video Marketing Suite, is a comprehensive suite of video technologies designed to address the needs of marketers to drive awareness, engagement and conversion. Brightcove Enterprise Video Suite, or Enterprise Video Suite, is an enterprise-class platform for internal communications, employee training, live streaming, marketing and ecommerce videos.
We also have a number of modular solutions for customers, including Brightcove Zencoder, or Zencoder, which is a cloud-based video encoding service. Brightcove SSAI, or SSAI, is an innovative, cloud-based ad insertion and video stitching service that addresses the limitations of traditional online video ad insertion technology. Brightcove Player, or Player, is a cloud-based service for creating and managing video player experiences.
In September 2019, we released Brightcove Beacon, which is a purpose-built app that enables companies to deliver and launch premium OTT video experiences quickly and cost effectively across mobile, web, smart TVs and connected TVs, all with the flexibility of multiple monetization models. In January 2020, we released Brightcove Campaign, which is a purpose-built app that enables marketers to easily create video-driven marketing campaigns that yield insightful data with the ability to compare video performance to a variety of industry benchmarks.
Our philosophy for the next few years will continue to be to invest in our product strategy and development, sales, and go-to-market activities to support our long-term revenue growth. We believe these investments will help us address some of the challenges facing our business such as demand for our products by existing and potential customers, rapid technological change in our industry, increased competition and resulting price sensitivity. These investments include support for the expansion of our infrastructure within our hosting facilities, the hiring of additional technical and sales personnel, the innovation of new features for existing products and the development of new products. We believe this strategy will help us retain our existing customers, increase our average annual subscription revenue per premium customer and lead to the acquisition of new customers. Additionally, we believe customer growth will enable us to achieve economies of scale which will reduce our cost of goods sold, research and development and general and administrative expenses as a percentage of total revenue.
On April 1, 2019, we purchased the online video platform assets of Ooyala, Inc. (“Ooyala”), which included Ooyala’s online video platform customers, technology and Ooyala’s operations in Guadalajara, Mexico. We discuss the effect of the Ooyala transaction (“Ooyala Acquisition”), when applicable, in our discussion and analysis of the financial condition and results of operations below. We are currently transitioning the acquired customers to our technology as we feel that our cloud-based services will add value for the acquired customers.
37
Table of Contents
On August 1, 2019, we completed an acquisition of a company to help expand our offerings in key market segments. Revenue and earnings attributable to the August 1, 2019 acquisition were not material.
As of December 31, 2019, we had 610 employees and 3,595 customers, of which 2,338 used our premium offerings and 1,257 used our volume offerings. As of December 31, 2018, we had 495 employees and 3,783 customers, of which and 2,226 used our premium offerings and 1,557 used our volume offerings.
We generate revenue by offering our products to customers on a subscription-based, software as a service, or SaaS, model. Our revenue grew from $164.8 million in the year ended December 31, 2018 to $184.5 million in the year ended December 31, 2019, primarily related to $17.9 million of incremental revenue from the Ooyala Acquisition and, to a lesser extent, an increase in sales of Video Cloud to both new and existing customers. Our consolidated net loss was $21.9 million and $14.0 million for the years ended December 31, 2019 and 2018, respectively. Included in consolidated net loss for the year ended December 31, 2019 was merger-related expense, stock-based compensation expense and amortization of acquired intangible assets of $11.4 million, $9.3 million and $3.2 million, respectively. Included in consolidated net loss for the year ended December 31, 2018 was stock-based compensation expense and amortization of acquired intangible assets of $6.6 million and $2.3 million, respectively.
For the years ended December 31, 2019 and 2018, our revenue derived from customers located outside North America was 47% and 46%, respectively. We expect the percentage of total net revenue derived from outside North America to increase in future periods as we continue to expand our international operations.
Key Metrics
We regularly review a number of metrics, including the following key metrics, to evaluate our business, measure our performance, identify trends affecting our business, formulate financial projections and make strategic decisions.
| • | Number of Customers. We define our number of customers at the end of a particular quarter as the number of customers generating subscription revenue at the end of the quarter. We believe the number of customers is a key indicator of our market penetration, the productivity of our sales organization and the value that our products bring to our customers. We classify our customers by including them in either premium or volume offerings. Our premium offerings include our premium Video Cloud customers (Enterprise and Pro editions), our Zencoder customers (other than Zencoder customers on month-to-month contracts and pay-as-you-go contracts), our SSAI customers, our Player customers, our OTT Flow customers, our Video Marketing Suite customers, our Enterprise Video Suite customers, our Brightcove Beacon customers and our Brightcove Campaign customers. Our volume offerings include our Video Cloud Express customers and our Zencoder customers on month-to-month contracts and pay-as-you-go contracts. |
As of December 31, 2019, we had 3,595 customers, of which and 2,338 used our premium offerings and 1,257 used our volume offerings. As of December 31, 2018, we had 3,783 customers, of which 2,226 used our premium offerings and 1,557 used our volume offerings. Our go-to-market focus and growth strategy is to expand our premium customer base, as we believe our premium customers represent a greater opportunity for our solutions. Volume customers decreased in recent periods primarily due to our discontinuation of the promotional Video Cloud Express offering. As a result, we have experienced attrition of this base level offering without a corresponding addition of customers. We expect customers using our volume offerings to continue to decrease in 2020 and beyond as we continue to focus on the market for our premium solutions.
| • | Recurring Dollar Retention Rate. We assess our ability to retain customers using a metric we refer to as our recurring dollar retention rate. We calculate the recurring dollar retention rate by dividing the |
38
Table of Contents
| retained recurring value of subscription revenue for a period by the previous recurring value of subscription revenue for the same period. We define retained recurring value of subscription revenue as the committed subscription fees for all contracts that renew in a given period, including any increase or decrease in contract value. We define previous recurring value of subscription revenue as the recurring value from committed subscription fees for all contracts that expire in that same period. We typically calculate our recurring dollar retention rate on a monthly basis. Recurring dollar retention rate provides visibility into our ongoing revenue. During the years ended December 31, 2019 and 2018, the recurring dollar retention rate was 89% and 99%, respectively. |
| • | Average Annual Subscription Revenue Per Premium Customer. We define average annual subscription revenue per premium customer as the total subscription revenue from premium customers for an annual period, excluding professional services revenue, divided by the average number of premium customers for that period. We believe that this metric is important in understanding subscription revenue for our premium offerings in addition to the relative size of premium customer arrangements. As our Starter edition has a price point of $199 or $499 per month, we disclose the average annual subscription revenue per premium customer separately for Starter edition customers and all other premium customers. |
| • | Backlog. We define backlog as the aggregate amount of transaction price that is allocated to performance obligations that have not yet been satisfied, excluding professional service engagements. We believe that this metric is important in understanding future business performance. As of December 31, 2019, the total backlog for subscription and support contracts was approximately $128.9 million, of which approximately $100.6 million is expected to be recognized over the next 12 months. As of December 31, 2018, the total backlog for subscription and support contracts was approximately $109.4 million, of which approximately $90.7 million was expected to be recognized over the next 12 months. |
The following table includes our key metrics for the periods presented:
| Year Ended December 31, |
||||||||
| 2019 | 2018 | |||||||
| Customers (at period end) |
||||||||
| Volume |
1,257 | 1,557 | ||||||
| Premium |
2,338 | 2,226 | ||||||
|
|
|
|
|
|||||
| Total customers (at period end) |
3,595 | 3,783 | ||||||
|
|
|
|
|
|||||
| Recurring dollar retention rate |
89 | % | 99 | % | ||||
| Average annual subscription revenue per premium customer, excluding Starter edition customers (in thousands) |
$ | 82.4 | $ | 74.9 | ||||
| Average annual subscription revenue per premium customer for Starter edition customers only (in thousands) |
$ | 4.6 | $ | 4.7 | ||||
| Total backlog, excluding professional services engagements (in millions) |
$ | 128.9 | $ | 109.4 | ||||
| Total backlog to be recognized over next 12 months, excluding professional services engagements (in millions) |
$ | 100.6 | $ | 90.7 | ||||
Components of Consolidated Statements of Operations
Revenue
Subscription and Support Revenue — We generate subscription and support revenue from the sale of our products.
Video Cloud is offered in two product lines. The first product line is comprised of our premium product editions. All premium editions include functionality to publish and distribute video to Internet-connected devices,
39
Table of Contents
with higher levels of premium editions providing additional features and functionality. Customer arrangements are typically one year contracts, which include a subscription to Video Cloud, basic support and a pre-determined amount of video streams, bandwidth, transcoding and storage. We also offer gold support or platinum support to our premium customers for an additional fee, which includes extended phone support. The pricing for our premium editions is based on the value of our software, as well as the number of users, accounts and usage, which is comprised of video streams, bandwidth, transcoding and storage. Should a customer’s usage exceed the contractual entitlements, the contract will provide the rate at which the customer must pay for actual usage above the contractual entitlements. The second product line is comprised of our volume product edition. Our volume editions target small and medium-sized businesses, or SMBs. The volume editions provide customers with the same basic functionality that is offered in our premium product editions but have been designed for customers who have lower usage requirements and do not typically require advanced features and functionality. We discontinued the lower level pricing options for the Express edition of our volume offering and expect the total number of customers using the Express edition to continue to decrease. Customers who purchase the volume editions generally enter into month-to-month agreements. Volume customers are generally billed on a monthly basis and pay via a credit card.
Zencoder is offered to customers on a subscription basis, with either committed contracts or pay-as-you-go contracts. The pricing is based on usage, which is comprised of minutes of video processed. The committed contracts include a fixed number of minutes of video processed. Should a customer’s usage exceed the contractual entitlements, the contract will provide the rate at which the customer must pay for actual usage above the contractual entitlements. Zencoder customers are considered premium customers other than Zencoder customers on month-to-month contracts or pay-as-you-go contracts, which are considered volume customers.
SSAI is offered to customers on a subscription basis, with varying levels of functionality, usage entitlements and support based on the size and complexity of a customer’s needs.
Player is offered to customers on a subscription basis. Customer arrangements are typically one-year contracts, which include a subscription to Player, basic support and a pre-determined amount of video streams. We also offer gold support or platinum support to our Player customers for an additional fee, which includes extended phone support. The pricing for Player is based on the number of users, accounts and usage, which is comprised of video streams. Should a customer’s usage exceed the contractual entitlements, the contract will provide the rate at which the customer must pay for actual usage above the contractual entitlements.
OTT Flow, Brightcove Beacon and Brightcove Campaign are each offered to customers on a subscription basis, with varying levels of functionality, usage entitlements and support based on the size and complexity of a customer’s needs. Customer arrangements are typically one-year contracts.
Video Marketing Suite and Enterprise Video Suite are offered to customers on a subscription basis in Starter, Pro and Enterprise editions. The Pro and Enterprise customer arrangements are typically one-year contracts, which typically include a subscription to Video Cloud, Gallery, Brightcove Social (for Video Marketing Suite customers) or Brightcove Live (for Enterprise Video Suite customers), basic support and a pre-determined amount of video streams or plays (for Video Marketing Suite customers), viewers (for Enterprise Video Suite customers), bandwidth and storage or videos. We also generally offer gold support or platinum support to these customers for an additional fee, which includes extended phone support. The pricing for our Pro and Enterprise editions is based on the number of users, accounts and usage, which is comprised of video streams or plays, viewers, bandwidth and storage or videos. Should a customer’s usage exceed the contractual entitlements, the contract will provide the rate at which the customer must pay for actual usage above the contractual entitlements, or will require the customer to upgrade its package upon renewal. The Starter edition provides customers with the same basic functionality that is offered in our Pro and Enterprise editions but has been designed for customers who have lower usage requirements and do not typically seek advanced features and functionality. Customers who purchase the Starter edition may enter into one-year agreements or month-to-month agreements. Starter customers with month-to-month agreements are generally billed on a monthly basis and pay via a credit card.
40
Table of Contents
All Brightcove Beacon, Brightcove Campaign, SSAI, Player, OTT Flow, Video Marketing Suite and Enterprise Video Suite customers are considered premium customers.
Professional Services and Other Revenue — Professional services and other revenue consists of services such as implementation, software customizations and project management for customers who subscribe to our premium editions. These arrangements are priced either on a fixed fee basis with a portion due upon contract signing and the remainder due when the related services have been completed, or on a time and materials basis.
Cost of Revenue
Cost of subscription, support and professional services revenue primarily consists of costs related to supporting and hosting our product offerings and delivering our professional services. These costs include salaries, benefits, incentive compensation and stock-based compensation expense related to the management of our data centers, our customer support team and our professional services staff. In addition to these expenses, we incur third-party service provider costs such as data center and content delivery network, or CDN, expenses, allocated overhead, depreciation expense and amortization of capitalized internal-use software development costs and acquired intangible assets. We allocate overhead costs such as rent, utilities and supplies to all departments based on relative headcount. As such, general overhead expenses are reflected in cost of revenue in addition to each operating expense category. The costs associated with providing professional services are significantly higher as a percentage of related revenue than the costs associated with delivering our subscription and support services due to the labor costs of providing professional services.
Cost of revenue increased in absolute dollars from 2018 to 2019. In future periods we expect our cost of revenue will increase in absolute dollars as our revenue increases. Cost of revenue as a percentage of revenue could fluctuate from period to period depending on the number of our professional services engagements and any associated costs relating to the delivery of subscription services and the timing of significant expenditures. To the extent that our customer base grows, we intend to continue to invest additional resources in expanding the delivery capability of our products and other services. The timing of these additional expenses could affect our cost of revenue, both in terms of absolute dollars and as a percentage of revenue, in any particular quarterly or annual period.
Operating Expenses
We classify our operating expenses as follows:
Research and Development. Research and development expenses consist primarily of personnel and related expenses for our research and development staff, including salaries, benefits, incentive compensation and stock-based compensation, in addition to the costs associated with contractors and allocated overhead. We have focused our research and development efforts on expanding the functionality and scalability of our products and enhancing their ease of use, as well as creating new product offerings. We expect research and development expenses to increase in absolute dollars as we intend to continue to periodically release new features and functionality, expand our product offerings, continue the localization of our products in various languages, upgrade and extend our service offerings, and develop new technologies. Over the long term, we believe that research and development expenses as a percentage of revenue will decrease, but will vary depending upon the mix of revenue from new and existing products, features and functionality, as well as changes in the technology that our products must support, such as new operating systems or new Internet-connected devices.
Sales and Marketing. Sales and marketing expenses consist primarily of personnel and related expenses for our sales and marketing staff, including salaries, benefits, incentive compensation, commissions, stock-based compensation and travel costs, amortization of acquired intangible assets, in addition to costs associated with marketing and promotional events, corporate communications, advertising, other brand building and product marketing expenses and allocated overhead. Our sales and marketing expenses have increased in absolute dollars
41
Table of Contents
in each of the last three years. We intend to continue to invest in sales and marketing and expand the sale of our product offerings within our existing customer base, build brand awareness and sponsor additional marketing events. Accordingly, we expect sales and marketing expense to continue to be our most significant operating expense in future periods. Over the long term, we believe that sales and marketing expense as a percentage of revenue will decrease, but will vary depending upon the mix of revenue from new and existing customers and from small, medium-sized and enterprise customers, as well as changes in the productivity of our sales and marketing programs.
General and Administrative. General and administrative expenses consist primarily of personnel and related expenses for executive, legal, finance, information technology and human resources functions, including salaries, benefits, incentive compensation and stock-based compensation. General and administrative expenses also include the costs associated with professional fees, insurance premiums, other corporate expenses and allocated overhead. Over the long term, we believe that general and administrative expenses as a percentage of revenue will decrease.
Merger-related. Merger-related costs consist of expenses related to mergers and acquisitions, integration costs and general corporate development activities.
Other Expense
Other expense consists primarily of interest income earned on our cash, cash equivalents, foreign exchange gains and losses.
Income Taxes
As part of the process of preparing our consolidated financial statements, we are required to estimate our taxes in each of the jurisdictions in which we operate. We account for income taxes in accordance with the asset and liability method. Under this method, deferred tax assets and liabilities are recognized based on temporary differences between the financial reporting and income tax bases of assets and liabilities using statutory rates. In addition, this method requires a valuation allowance against net deferred tax assets if, based upon the available evidence, it is more likely than not that some or all of the deferred tax assets will not be realized. We have provided a valuation allowance against our existing U.S. net deferred tax assets at December 31, 2019. We maintain net deferred tax liabilities for temporary differences related to our foreign subsidiaries.
Stock-Based Compensation Expense
Our cost of revenue, research and development, sales and marketing, and general and administrative expenses include stock-based compensation expense. Stock-based compensation expense represents the fair value of outstanding stock options and restricted stock awards, which is recognized as expense over the respective stock option and restricted stock award service periods. For the years ended December 31, 2019, 2018 and 2017, we recorded stock-based compensation expense of $9.3 million, $6.6 million, and $7.2 million, respectively. We expect stock-based compensation expense to increase in absolute dollars in future periods.
Foreign Currency Translation
With regard to our international operations, we frequently enter into transactions in currencies other than the U.S. dollar. As a result, our revenue, expenses and cash flows are subject to fluctuations due to changes in foreign currency exchange rates, particularly changes in the euro, British pound, Australian dollar, and Japanese yen. In periods when the U.S. dollar declines in value as compared to the foreign currencies in which we conduct business, our foreign currency-based revenue and expenses generally increase in value when translated into U.S. dollars. We expect the percentage of total net revenue derived from outside North America to increase in future periods as we continue to expand our international operations.
42
Table of Contents
Critical Accounting Policies and Estimates
Our consolidated financial statements are prepared in accordance with accounting principles generally accepted in the United States. The preparation of these financial statements requires us to make estimates and assumptions that affect the reported amounts of assets and liabilities and the disclosure of contingent assets and liabilities at the date of the financial statements and the reported amounts of revenue and expenses during the reporting periods. We base our estimates on historical experience and on various other assumptions that are believed to be reasonable under the circumstances, the results of which form the basis for making judgments about the carrying values of assets and liabilities that are not readily apparent from other sources. Our actual results may differ from these estimates under different assumptions or conditions.
We believe that the following significant accounting policies, which are more fully described in the notes to our consolidated financial statements included elsewhere in this Annual Report on Form 10-K, involve a greater degree of judgment and complexity. Accordingly, these are the policies we believe are the most critical to aid in fully understanding and evaluating our financial condition and results of operations.
Revenue Recognition
We primarily derive revenue from the sale of our online video platform, which enables our customers to publish and distribute video to Internet-connected devices quickly, easily and in a cost-effective and high-quality manner. Revenue is derived from three primary sources: (1) the subscription to our technology and related support; (2) hosting, bandwidth and encoding services; and (3) professional services, which include customization services.
In May 2014, the Financial Accounting Standards Board (FASB) issued ASU No. 2014-09, Revenue from Contracts with Customers (Topic 606), which modifies how all entities recognize revenue, and consolidates revenue recognition guidance into one ASC Topic (ASC Topic 606, Revenue from Contracts with Customers) (“ASC 606”). We adopted ASC 606 on January 1, 2018. ASC 606 outlines a comprehensive five-step revenue recognition model based on the principle that an entity should recognize revenue to depict the transfer of promised goods or services to customers in an amount that reflects the consideration to which the entity expects to be entitled in exchange for those goods or services.
| 1) | Identify the contract with a customer |
| 2) | Identify the performance obligations in the contract |
| 3) | Determine the transaction price |
| 4) | Allocate the transaction price to performance obligations in the contract |
| 5) | Recognize revenue when or as the Company satisfies a performance obligation |
Our subscription arrangements provide customers the right to access our hosted software applications. Customers do not have the right to take possession of our software during the hosting arrangement. Contracts for premium customers generally have a term of one year and are non-cancellable. These contracts generally provide the customer with a maximum annual level of entitlement and provide the rate at which the customer must pay for actual usage above the annual entitlement allowance. These subscription arrangements are considered stand ready obligations that are providing a series of distinct services that are substantially the same and are transferred with the same pattern to the customer. As such, these subscription arrangements are treated as a single performance obligation and the related fees are recognized as revenue ratably over the term of the underlying arrangement.
Under ASC 606, when the transaction price includes a variable amount of consideration, an entity is required to estimate the consideration that is expected to be received for a particular customer arrangement. We evaluate variable consideration for usage-based fees at contract inception and re-evaluate quarterly over the
43
Table of Contents
course of the contract. Specifically, we estimate the revenue pertaining to a customer’s usage that is expected to exceed the annual entitlement allowance and allocate such revenue to the distinct service within the related contract that gives rise to the variable payment. Estimates of variable consideration include analyzing customer usage against the applicable entitlement limit at the end of each reporting period and estimating the amount and timing of additional amounts to be invoiced in connection with projected usage. Estimates of variable consideration relating to customer usage do not include amounts for which it is probable that a significant reversal will occur. Determining the amount of variable consideration to recognize as revenue involves significant judgment on the part of management and it is possible that actual revenue will deviate from estimates over the course of a customer’s committed contract term.
Contracts with customers that are month-to-month arrangements (volume customers) have a maximum monthly level of usage and provide the rate at which the customer must pay for actual usage above the monthly allowable usage. The monthly volume subscription and support and usage fees are recognized as revenue during the related period of performance. Contracts with customers that are invoiced on a pay-as-you-go basis, where there is no monthly or annual commitment for usage, provide the rate at which the customer must pay for actual usage for a particular period. Fees that are invoiced on a pay-as-you-go basis are recognized as revenue during the period of performance.
Professional services and other revenue consist of services such as implementation, software customizations and project management for customers who subscribe to our premium editions. These arrangements are priced either on a fixed fee basis with a portion due upon contract signing and the remainder due when the related services have been completed, or on a time and materials basis. Professional services and other revenue sold on a stand-alone basis are recognized as the services are performed, subject to any refund or other obligation. Deferred revenue includes amounts billed to customers for which revenue has not been recognized, and primarily consists of the unearned portion of annual software subscription and support fees, and deferred professional service fees. Revenue is presented net of any taxes collected from customers.
We periodically enter into multiple-element service arrangements that include platform subscription fees, support fees, and, in certain cases, other professional services. These contracts include multiple promises that we evaluate to determine if the promises are separate performance obligations. Performance obligations are identified based on services to be transferred to a customer that are both capable of being distinct and are distinct within the context of the contract. Once we determine the performance obligations, we determine the transaction price, which includes estimating the amount of variable consideration to be included in the transaction price, if any. We then allocate the transaction price to each performance obligation in the contract based on a relative stand-alone selling price method. The transaction price post allocation is recognized as revenue as the related performance obligation is satisfied.
Income Taxes
We are subject to income taxes in both the United States and international jurisdictions, and we use estimates in determining our provision for income taxes. We account for income taxes under the asset and liability method for accounting and reporting for income taxes. Deferred tax assets and liabilities are recognized based on temporary differences between the financial reporting and income tax basis of assets and liabilities using statutory rates. This process requires us to project our current tax liability and estimate our deferred tax assets and liabilities, including net operating losses and tax credit carryforwards. In assessing the need for a valuation allowance, we considered our recent operating results, future taxable income projections and feasible tax planning strategies. We have provided a valuation allowance against substantially all of our net U.S. deferred tax assets at December 31, 2019. We recognized a deferred tax liability in the U.S. for a portion of our indefinite lived intangibles and other deferred tax liabilities that would not be offset against deferred tax assets. We maintain net deferred tax liabilities for temporary differences related to our foreign subsidiaries. Due to the evolving nature and complexity of tax regulations combined with the number of jurisdictions in which we
44
Table of Contents
operate, it is possible that our estimates of our tax liability could change in the future, which may result in additional tax liabilities and adversely affect our results of operations, financial condition and cash flows.
As of December 31, 2019 and 2018, we had no material unrecognized tax benefits.
Business Combinations
We record tangible and intangible assets acquired and liabilities assumed in business combinations under the purchase method of accounting. Amounts paid for each acquisition are allocated to the assets acquired and liabilities assumed based on their fair values at the date of acquisition. We then allocate the purchase price in excess of net tangible assets acquired to identifiable intangible assets based on detailed valuations that use information and assumptions provided by management. We allocate any excess purchase price over the fair value of the net tangible and intangible assets acquired and liabilities assumed to goodwill.
Significant management judgments and assumptions are required in determining the fair value of acquired assets and liabilities, particularly acquired intangible assets. The valuation of purchased intangible assets is based upon estimates of the future performance and cash flows from the acquired business. Each asset is measured at fair value from the perspective of a market participant. Critical estimates in valuing purchased technology and customer lists include future cash flows that we expect to generate from the acquired assets. If the subsequent actual results and updated projections of the underlying business activity change compared with the assumptions and projections used to develop these values, we could experience impairment charges which could be material. In addition, we have estimated the economic lives of certain acquired assets and these lives are used to calculate depreciation and amortization expense. If our estimates of the economic lives change, depreciation or amortization expenses could be accelerated or slowed.
If different assumptions are used, it could materially impact the purchase price allocation and adversely affect our results of operations, financial condition and cash flows.
Goodwill and Acquired Intangible Assets
We record goodwill when consideration paid in a purchase acquisition exceeds the fair value of the net assets acquired. Goodwill is not amortized, but rather is tested for impairment annually or more frequently if facts and circumstances warrant a review. Conditions that could trigger a more frequent impairment assessment include, but are not limited to, a significant adverse change in certain agreements, significant underperformance relative to historical or projected future operating results, an economic downturn in customers’ industries, increased competition, a significant reduction in our stock price for a sustained period or a reduction of our market capitalization relative to net book value. We evaluate impairment by comparing the estimated fair value of each reporting unit to its carrying value. We estimate fair value primarily utilizing the market approach, which calculates fair value based on the market values of comparable companies or comparable transactions. Actual results may differ materially from these estimates. The estimates we make in determining the fair value of our reporting unit involve the application of judgment, which could affect the timing and size of any future impairment charges. Impairment of our goodwill could significantly affect our operating results and financial position.
Intangible assets are recorded at their estimated fair value at the date of acquisition. We amortize our intangible assets over their estimated useful lives based on the pattern of consumption of the economic benefit or, if that pattern cannot be readily determined, on a straight-line basis. Amortization is recorded over the estimated useful lives ranging from one to fourteen years.
We review our intangible assets subject to amortization to determine if any adverse conditions exist or a change in circumstances has occurred that would indicate impairment or a change in the remaining useful life. If the carrying value of an asset exceeds its undiscounted cash flows, we will write down the carrying value of the
45
Table of Contents
intangible asset to its fair value in the period identified. In assessing recoverability, we must make assumptions regarding estimated future cash flows and discount rates. If these estimates or related assumptions change in the future, we may be required to record impairment charges. We generally calculate fair value as the present value of estimated future cash flows to be generated by the asset using a risk adjusted discount rate. If the estimate of an intangible asset’s remaining useful life is changed, we will amortize the remaining carrying value of the intangible asset prospectively over the revised remaining useful life.
When goodwill is impaired, we record an impairment charge based on the excess of a reporting unit’s carrying amount over its fair value. For the year ended December 31, 2019, we have not identified any impairment of our goodwill.
Results of Operations
The following tables set forth our results of operations for the periods presented.
| Year Ended December 31, | ||||||||||||
| 2019 | 2018 | 2017 | ||||||||||
| (in thousands, except share and per share data) |
||||||||||||
| Revenue: |
||||||||||||
| Subscription and support revenue |
$ | 173,818 | $ | 150,941 | $ | 143,159 | ||||||
| Professional services and other revenue |
10,637 | 13,892 | 12,754 | |||||||||
|
|
|
|
|
|
|
|||||||
| Total revenue |
184,455 | 164,833 | 155,913 | |||||||||
| Cost of revenue: |
||||||||||||
| Cost of subscription and support revenue |
67,064 | 53,311 | 50,664 | |||||||||
| Cost of professional services and other revenue |
8,405 | 13,313 | 13,954 | |||||||||
|
|
|
|
|
|
|
|||||||
| Total cost of revenue |
75,469 | 66,624 | 64,618 | |||||||||
|
|
|
|
|
|
|
|||||||
| Gross profit |
108,986 | 98,209 | 91,295 | |||||||||
| Operating expenses: |
||||||||||||
| Research and development |
32,535 | 31,716 | 31,850 | |||||||||
| Sales and marketing |
60,375 | 55,775 | 57,294 | |||||||||
| General and administrative |
25,692 | 23,103 | 21,847 | |||||||||
| Merger-related |
11,447 | 716 | — | |||||||||
|
|
|
|
|
|
|
|||||||
| Total operating expenses |
130,049 | 111,310 | 110,991 | |||||||||
|
|
|
|
|
|
|
|||||||
| Loss from operations |
(21,063 | ) | (13,101 | ) | (19,696 | ) | ||||||
| Other income (expense), net |
(280 | ) | (326 | ) | 547 | |||||||
|
|
|
|
|
|
|
|||||||
| Loss before income taxes |
(21,343 | ) | (13,427 | ) | (19,149 | ) | ||||||
| Provision for income taxes |
560 | 601 | 370 | |||||||||
|
|
|
|
|
|
|
|||||||
| Net loss |
$ | (21,903 | ) | $ | (14,028 | ) | $ | (19,519 | ) | |||
|
|
|
|
|
|
|
|||||||
| Net loss per share - basic and diluted |
$ | (0.58 | ) | $ | (0.39 | ) | $ | (0.57 | ) | |||
|
|
|
|
|
|
|
|||||||
| Weighted-average number of common shares used in computing net loss per share - basic and diluted |
38,028 | 35,808 | 34,376 | |||||||||
|
|
|
|
|
|
|
|||||||
Overview of Results of Operations for the Years Ended December 31, 2019 and 2018
Total revenue increased by 12%, or $19.6 million, in 2019 compared to 2018 due to an increase in subscription and support revenue of 15%, or $22.9 million, primarily related to the acquired Ooyala customers. Substantially all of the revenue from the Ooyala Acquisition is subscription and support revenue. This increase was offset by a decrease in professional services and other revenue of 23%, or $3.3 million. Professional services
46
Table of Contents
and other revenue will vary from period to period depending on the number of implementations and other projects that are in process. In addition, our revenue from premium offerings grew by $20.3 million, or 13%, in 2019 compared to 2018. Our ability to continue to provide the product functionality and performance that our customers require will be a major factor in our ability to continue to increase revenue.
Our gross profit increased by $10.8 million, or 11%, in 2019 compared to 2018, primarily due to an increase in revenue. Our ability to continue to maintain our overall gross profit will depend primarily on our ability to continue controlling our costs of delivery.
Loss from operations was $21.1 million in 2019 compared to $13.1 million in 2018. Our ability to decrease operating loss will depend primarily on greater revenue from both new and existing customers and from improved efficiencies. As of December 31, 2019, we had $22.8 million of unrestricted cash and cash equivalents, a decrease of $6.5 million from $29.3 million at December 31, 2018, due primarily to $6.2 million in capitalized internal-use software costs, $5.3 million paid as consideration in the Ooyala Acquisition and August Acquisition, $1.0 million in capital expenditures and $296,000 in other financing activities. These decreases were offset by proceeds from exercises of stock options of $3.5 million and $2.7 million of cash provided by operating activities.
Revenue
| Year Ended December 31, | ||||||||||||||||||||||||
| 2019 | 2018 | Change | ||||||||||||||||||||||
| Revenue by Product Line |
Amount | Percentage of Revenue |
Amount | Percentage of Revenue |
Amount | % | ||||||||||||||||||
| (in thousands, except percentages) | ||||||||||||||||||||||||
| Premium |
$ | 180,624 | 98 | % | $ | 160,285 | 97 | % | $ | 20,339 | 13 | % | ||||||||||||
| Volume |
3,831 | 2 | 4,548 | 3 | (717 | ) | (16 | ) | ||||||||||||||||
|
|
|
|
|
|
|
|
|
|
|
|
|
|||||||||||||
| Total |
$ | 184,455 | 100 | % | $ | 164,833 | 100 | % | $ | 19,622 | 12 | % | ||||||||||||
|
|
|
|
|
|
|
|
|
|
|
|
|
|||||||||||||
During 2019, revenue increased by $19.6 million, or 12%, compared to 2018, primarily due to an increase in revenue from our premium offerings, which consist of subscription and support revenue, as well as professional services and other revenue. The increase in premium revenue of $20.3 million, or 13%, is primarily the result of a 5% increase in the number of premium customers, some of which were acquired in the Ooyala Acquisition. Premium customers increased from 2,226 at December 31, 2018 to 2,338 at December 31, 2019. During 2019, volume revenue decreased by $717,000, or 16%, compared to 2018, driven by a decrease in customers as we continue to focus on the market for our premium solutions.
| Year Ended December 31, | ||||||||||||||||||||||||
| 2019 | 2018 | Change | ||||||||||||||||||||||
| Revenue by Type |
Amount | Percentage of Revenue |
Amount | Percentage of Revenue |
Amount | % | ||||||||||||||||||
| (in thousands, except percentages) | ||||||||||||||||||||||||
| Subscription and support |
$ | 173,818 | 94 | % | $ | 150,941 | 92 | % | $ | 22,877 | 15 | % | ||||||||||||
| Professional services and other |
10,637 | 6 | 13,892 | 8 | (3,255 | ) | (23 | ) | ||||||||||||||||
|
|
|
|
|
|
|
|
|
|
|
|
|
|||||||||||||
| Total |
$ | 184,455 | 100 | % | $ | 164,833 | 100 | % | $ | 19,622 | 12 | % | ||||||||||||
|
|
|
|
|
|
|
|
|
|
|
|
|
|||||||||||||
During 2019, subscription and support revenue increased by $22.9 million, or 15%, compared to 2018. The increase was primarily related to a 5% increase in the number of premium customers, some of which were acquired in the Ooyala Acquisition. Premium customers increased from 2,226 at December 31, 2018 to 2,338 at December 31, 2019 and the average annual subscription revenue per premium customer increased 10% during the year ended December 31, 2019. In addition, professional services and other revenue decreased by
47
Table of Contents
$3.3 million, or 23%, compared to the prior year. Professional services and other revenue will vary from period to period depending on the number of implementations and other projects that are in process.
| Year Ended December 31, | ||||||||||||||||||||||||
| 2019 | 2018 | Change | ||||||||||||||||||||||
| Revenue by Geography |
Amount | Percentage of Revenue |
Amount | Percentage of Revenue |
Amount | % | ||||||||||||||||||
| (in thousands, except percentages) | ||||||||||||||||||||||||
| North America |
$ | 97,309 | 53 | % | $ | 88,778 | 54 | % | $ | 8,531 | 10 | % | ||||||||||||
|
|
|
|
|
|
|
|
|
|
|
|
|
|||||||||||||
| Europe |
31,587 | 17 | 27,754 | 17 | 3,833 | 14 | ||||||||||||||||||
| Japan |
22,150 | 12 | 21,960 | 13 | 190 | 1 | ||||||||||||||||||
| Asia Pacific |
32,391 | 17 | 25,766 | 16 | 6,625 | 26 | ||||||||||||||||||
| Other |
1,018 | 1 | 575 | — | 443 | 77 | ||||||||||||||||||
|
|
|
|
|
|
|
|
|
|
|
|
|
|||||||||||||
| International subtotal |
87,146 | 47 | 76,055 | 46 | 11,091 | 15 | ||||||||||||||||||
|
|
|
|
|
|
|
|
|
|
|
|
|
|||||||||||||
| Total |
$ | 184,455 | 100 | % | $ | 164,833 | 100 | % | $ | 19,622 | 12 | % | ||||||||||||
|
|
|
|
|
|
|
|
|
|
|
|
|
|||||||||||||
For purposes of this section, we designate revenue by geographic regions based upon the locations of our customers. North America is comprised of revenue from the United States, Canada and Mexico. International is comprised of revenue from locations outside of North America. Depending on the timing of new customer contracts, revenue mix from a geographic region can vary from period to period.
During 2019, total revenue for North America increased $8.5 million, or 10%, compared to 2018. During 2019, total revenue outside of North America increased $11.1 million, or 15%, compared to 2018. The increase in revenue from international regions is primarily related to increases in revenue in Europe and Asia Pacific.
Cost of Revenue
| Year Ended December 31, | ||||||||||||||||||||||||
| 2019 | 2018 | Change | ||||||||||||||||||||||
| Cost of Revenue |
Amount | Percentage of Related Revenue |
Amount | Percentage of Related Revenue |
Amount | % | ||||||||||||||||||
| (in thousands, except percentages) | ||||||||||||||||||||||||
| Subscription and support |
$ | 67,064 | 39 | % | $ | 53,311 | 35 | % | $ | 13,753 | 26 | % | ||||||||||||
| Professional services and other |
8,405 | 79 | 13,313 | 96 | (4,908 | ) | (37 | ) | ||||||||||||||||
|
|
|
|
|
|
|
|
|
|
|
|
|
|||||||||||||
| Total |
$ | 75,469 | 41 | % | $ | 66,624 | 40 | % | $ | 8,845 | 13 | % | ||||||||||||
|
|
|
|
|
|
|
|
|
|
|
|
|
|||||||||||||
During 2019, cost of subscription and support revenue increased $13.8 million, or 26%, compared to 2018. The increase resulted primarily from increases in network hosting expense, content delivery expense, third-party software integrated with our service offering expense, and maintenance expense of $5.8 million, $3.8 million, $1.4 million, and $1.3 million, respectively. There were also increases in partner commission, amortization, and stock-based compensation expenses of $1.1 million, $987,000, and $202,000, respectively. These increases were offset in part by decreases in employee-related, contractor, and rent expenses of $392,000, $267,000, and $131,000, respectively.
During 2019, cost of professional services and other revenue decreased $4.9 million, or 37%, compared to 2018. This decrease corresponds to decreases in contractor, employee-related, and recruiting expenses of $3.8 million, $981,000 and $113,000, respectively due to lower levels of implementation and professional services.
48
Table of Contents
Gross Profit
| Year Ended December 31, | ||||||||||||||||||||||||
| 2019 | 2018 | Change | ||||||||||||||||||||||
| Gross Profit |
Amount | Percentage of Related Revenue |
Amount | Percentage of Related Revenue |
Amount | % | ||||||||||||||||||
| (in thousands, except percentages) | ||||||||||||||||||||||||
| Subscription and support |
$ | 106,754 | 61 | % | $ | 97,630 | 65 | % | $ | 9,124 | 9 | % | ||||||||||||
| Professional services and other |
2,232 | 21 | 579 | 4 | 1,653 | 285 | ||||||||||||||||||
|
|
|
|
|
|
|
|
|
|
|
|
|
|||||||||||||
| Total |
$ | 108,986 | 59 | % | $ | 98,209 | 60 | % | $ | 10,777 | 11 | % | ||||||||||||
|
|
|
|
|
|
|
|
|
|
|
|
|
|||||||||||||
The overall gross profit percentage was 59% and 60% for the years ended December 31, 2019 and 2018, respectively. Subscription and support gross profit increased $9.1 million, or 9%, compared to 2018. In addition, professional services and other gross profit increased $1.7 million, or 285 %, compared to 2018 It is likely that gross profit, as a percentage of revenue, will fluctuate quarter by quarter due to the timing and mix of subscription and support revenue and professional services and other revenue, and the type, timing and duration of service required in delivering certain projects.
Operating Expenses
| Year Ended December 31, | ||||||||||||||||||||||||
| 2019 | 2018 | Change | ||||||||||||||||||||||
| Operating Expenses |
Amount | Percentage of Revenue |
Amount | Percentage of Revenue |
Amount | % | ||||||||||||||||||
| (in thousands, except percentages) | ||||||||||||||||||||||||
| Research and development |
$ | 32,535 | 18 | % | $ | 31,716 | 19 | % | $ | 819 | 3 | % | ||||||||||||
| Sales and marketing |
60,375 | 33 | 55,775 | 34 | 4,600 | 8 | ||||||||||||||||||
| General and administrative |
25,692 | 14 | 23,103 | 14 | 2,589 | 11 | ||||||||||||||||||
| Merger-related |
11,447 | 6 | 716 | — | 10,731 | nm | ||||||||||||||||||
|
|
|
|
|
|
|
|
|
|
|
|
|
|||||||||||||
| Total |
$ | 130,049 | 71 | % | $ | 111,310 | 68 | % | $ | 18,739 | 17 | % | ||||||||||||
|
|
|
|
|
|
|
|
|
|
|
|
|
|||||||||||||
nm – not meaningful
Research and Development. During 2019, research and development expense increased by $819,000, or 3%, compared to 2018. This increase was primarily due to increases in computer maintenance and support expense, recruiting expense, and travel expense of $592,000, $570,000 and $226,000, respectively. There was also an increase in stock-based compensation expense of $163,000, as well as increases in a number of immaterial R&D related accounts amounting to $273,000. These increases were offset by a decrease in employee-related expenses of $1.1 million as a result of an increase in capitalized software development costs. We expect our research and development expense to remain relatively unchanged in future periods.
Sales and Marketing. During 2019, sales and marketing expense increased by $4.6 million, or 8%, compared to 2018 primarily due to increases in employee-related, travel, and intangible amortization expenses of $1.4 million, $1.2 million, and $919,000, respectively. There were also increases in stock-based compensation, conference, and computer maintenance and support expenses of $336,000, $329,000, and $282,000, respectively. There were additional increases in commissions, training, and marketing programs expenses of $230,000, $227,000, and $97,000, respectively. These increases were partially offset by decreases in contractor and recruiting expenses of $278,000 and $216,000, respectively. We expect that our sales and marketing expense will increase in absolute dollars along with our revenue, as we continue to expand sales coverage and build brand awareness through what we believe are cost-effective channels.
49
Table of Contents
General and Administrative. During 2019, general and administrative expense increased by $2.6 million, or 11%, compared to 2018 primarily due to increases in stock-based compensation, bad debt, outside accounting and legal fees, and employee-related expenses of $1.9 million, $939,000, $408,000 and $408,000, respectively. There were also increases in computer maintenance and support, rent, and insurance expenses of $183,000, $116,000, and $106,000, respectively. Additionally there was an increase in a number of immaterial G&A related accounts amounting to $163,000. These increases were offset by decreases in contractor, commission, recruiting, and amortization expenses of $1.1 million, $209,000, $176,000 and $165,000, respectively. In future periods, we expect general and administrative expense to remain relatively unchanged.
Merger-Related. During 2019, merger-related expenses increased by $10.7 million primarily due to costs incurred in connection with the entry into a definitive agreement in February 2019 to acquire the online video player related assets from Ooyala, Inc. and certain of its subsidiaries and costs related to the transition of Ooyala customers to the Company’s technology.
Overview of Results of Operations for the Years Ended December 31, 2018 and 2017
Total revenue increased by 6%, or $8.9 million, in 2018 compared to 2017 due to an increase in subscription and support revenue of 5%, or $7.8 million, primarily related to the continued growth of our customer base for our premium offerings including sales to both new and existing customers. The increase in professional services and other revenue of 9%, or $1.1 million, was primarily related to the size and number of professional services engagements in 2018 compared to 2017. In addition, our revenue from premium offerings grew by $10.0 million, or 7%, in 2018 compared to 2017. Our ability to continue to provide the product functionality and performance that our customers require will be a major factor in our ability to continue to increase revenue.
Our gross profit increased by $6.9 million, or 8%, in 2018 compared to 2017, primarily due to an increase in revenue. Our ability to continue to maintain our overall gross profit will depend primarily on our ability to continue controlling our costs of delivery. Loss from operations was $13.1 million in 2018 compared to $19.7 million in 2017. We expect operating loss to decrease from greater sales to both new and existing customers and from improved efficiencies throughout our organization as we continue to grow and scale our operations.
As of December 31, 2018, we had $29.3 million of unrestricted cash and cash equivalents, an increase of $3.2 million from $26.1 million at December 31, 2017, due primarily to $5.8 million of proceeds from exercises of stock options and $2.6 million of cash provided by operating activities. These increases were offset by cash outflows of $3.0 million in capitalized internal-use software costs, and $1.5 million in capital expenditures. There were also cash outflows of $311,000 in payments under capital lease obligations, $170,000 in payments of withholding tax on RSU vesting and $26,000 for payments on equipment financing.
Revenue
| Year Ended December 31, | ||||||||||||||||||||||||
| 2018 | 2017 | Change | ||||||||||||||||||||||
| Revenue by Product Line |
Amount | Percentage of Revenue |
Amount | Percentage of Revenue |
Amount | % | ||||||||||||||||||
| (in thousands, except percentages) | ||||||||||||||||||||||||
| Premium |
$ | 160,285 | 97 | % | $ | 150,304 | 96 | % | $ | 9,981 | 7 | % | ||||||||||||
| Volume |
4,548 | 3 | 5,609 | 4 | (1,061 | ) | (19 | ) | ||||||||||||||||
| Total |
$ | 164,833 | 100 | % | $ | 155,913 | 100 | % | $ | 8,920 | 6 | % | ||||||||||||
During 2018, revenue increased by $8.9 million, or 6%, compared to 2017, primarily due to an increase in revenue from our premium offerings, which consist of subscription and support revenue, as well as professional services and other revenue. The increase in premium revenue of $10.0 million, or 7%, is partially the result of a 3% increase in the number of premium customers from 2,167 at December 31, 2017 to 2,226 at December 31,
50
Table of Contents
2018, and a $1.1 million, or 9%, increase in professional services revenue. During 2018, volume revenue decreased by $1.1 million, or 19%, compared to 2017, driven by a decrease in customers as we continue to focus on the market for our premium solutions.
| Year Ended December 31, | ||||||||||||||||||||||||
| 2018 | 2017 | Change | ||||||||||||||||||||||
| Revenue by Type |
Amount | Percentage of Revenue |
Amount | Percentage of Revenue |
Amount | % | ||||||||||||||||||
| (in thousands, except percentages) | ||||||||||||||||||||||||
| Subscription and support |
$ | 150,941 | 92 | % | $ | 143,159 | 92 | % | $ | 7,782 | 5 | % | ||||||||||||
| Professional services and other |
13,892 | 8 | 12,754 | 8 | 1,138 | 9 | ||||||||||||||||||
| Total |
$ | 164,833 | 100 | % | $ | 155,913 | 100 | % | $ | 8,920 | 6 | % | ||||||||||||
During 2018, subscription and support revenue increased by $7.8 million, or 5%, compared to 2017. The increase was primarily related to a 3% increase in the number of premium customers from 2,167 at December 31, 2017 to 2,226 at December 31, 2018 and a 6% increase in the average annual subscription revenue per premium customer during the year ended December 31, 2018. In addition, professional services and other revenue increased by $1.1 million, or 9%, primarily related to the size and number of professional services engagements during 2018 compared to the prior year. Professional services and other revenue will vary from period to period depending on the number of implementations and other projects that are in process.
| Year Ended December 31, | ||||||||||||||||||||||||
| 2018 | 2017 | Change | ||||||||||||||||||||||
| Revenue by Geography |
Amount | Percentage of Revenue |
Amount | Percentage of Revenue |
Amount | % | ||||||||||||||||||
| (in thousands, except percentages) | ||||||||||||||||||||||||
| North America |
$ | 88,778 | 54 | % | $ | 91,358 | 59 | % | $ | (2,580 | ) | (3 | )% | |||||||||||
| Europe |
27,754 | 17 | 24,425 | 16 | 3,329 | 14 | ||||||||||||||||||
| Japan |
21,960 | 13 | 16,881 | 11 | 5,079 | 30 | ||||||||||||||||||
| Asia Pacific |
25,766 | 16 | 22,539 | 14 | 3,227 | 14 | ||||||||||||||||||
| Other |
575 | — | 710 | — | (135 | ) | (19 | ) | ||||||||||||||||
| International subtotal |
76,055 | 46 | 64,555 | 41 | 11,500 | 18 | ||||||||||||||||||
| Total |
$ | 164,833 | 100 | % | $ | 155,913 | 100 | % | $ | 8,920 | 6 | % | ||||||||||||
For purposes of this section, we designate revenue by geographic regions based upon the locations of our customers. North America is comprised of revenue from the United States, Canada and Mexico. International is comprised of revenue from locations outside of North America. Depending on the timing of new customer contracts, revenue mix from a geographic region can vary from period to period.
During 2018, total revenue for North America decreased $2.6 million, or 3%, compared to 2017. During 2018, total revenue outside of North America increased $11.5 million, or 18%, compared to 2017. The increase in revenue from international regions is primarily related to increases in revenue in Japan, Europe and Asia Pacific.
Cost of Revenue
| Year Ended December 31, | ||||||||||||||||||||||||
| 2018 | 2017 | Change | ||||||||||||||||||||||
| Cost of Revenue |
Amount | Percentage of Related Revenue |
Amount | Percentage of Related Revenue |
Amount | % | ||||||||||||||||||
| (in thousands, except percentages) | ||||||||||||||||||||||||
| Subscription and support |
$ | 53,311 | 35 | % | $ | 50,664 | 35 | % | $ | 2,647 | 5 | % | ||||||||||||
| Professional services and other |
13,313 | 96 | 13,954 | 109 | (641 | ) | (5 | ) | ||||||||||||||||
| Total |
$ | 66,624 | 40 | % | $ | 64,618 | 41 | % | $ | 2,006 | 3 | % | ||||||||||||
51
Table of Contents
During 2018, cost of subscription and support revenue increased $2.6 million, or 5%, compared to 2017. The increase resulted primarily from increases in network hosting, amortization and partner commission expenses of $1.9 million, $1.1 million, and $1.0 million, respectively. There were also increases in third-party software integrated with our service offering expense, employee-related expense, rent expense, and consultant expense of $866,000, $773,000, $268,000 and $253,000, respectively. These increases were offset in part by decreases in content delivery, depreciation, intangible amortization, and maintenance expenses of $2.1 million, $917,000, $380,000 and $103,000, respectively.
During 2018, cost of professional services and other revenue decreased $641,000, or 5%, compared to 2017. This decrease corresponds to a decrease in consultant expense of $1.6 million. This decrease was offset in part by increases in employee-related and rent expenses of $715,000 and $150,000, respectively.
Gross Profit
| Year Ended December 31, | ||||||||||||||||||||||||
| 2018 | 2017 | Change | ||||||||||||||||||||||
| Gross Profit |
Amount | Percentage of Related Revenue |
Amount | Percentage of Related Revenue |
Amount | % | ||||||||||||||||||
| (in thousands, except percentages) | ||||||||||||||||||||||||
| Subscription and support |
$ | 97,630 | 65 | % | $ | 92,495 | 65 | % | $ | 5,135 | 6 | % | ||||||||||||
| Professional services and other |
579 | 4 | (1,200 | ) | (9 | ) | 1,779 | nm | ||||||||||||||||
| Total |
$ | 98,209 | 60 | % | $ | 91,295 | 59 | % | $ | 6,914 | 8 | % | ||||||||||||
nm – not meaningful
The overall gross profit percentage was 60% and 59% for the years ended December 31, 2018 and 2017, respectively. Subscription and support gross profit increased $5.1 million, or 6%, compared to 2017. In addition, professional services and other gross profit increased $1.8 million compared to 2017. It is likely that gross profit, as a percentage of revenue, will fluctuate quarter by quarter due to the timing and mix of subscription and support revenue and professional services and other revenue, and the type, timing and duration of service required in delivering certain projects.
Operating Expenses
| Year Ended December 31, | ||||||||||||||||||||||||
| 2018 | 2017 | Change | ||||||||||||||||||||||
| Operating Expenses |
Amount | Percentage of Revenue |
Amount | Percentage of Revenue |
Amount | % | ||||||||||||||||||
| (in thousands, except percentages) | ||||||||||||||||||||||||
| Research and development |
$ | 31,716 | 19 | % | $ | 31,850 | 20 | % | $ | (134 | ) | 0 | % | |||||||||||
| Sales and marketing |
55,775 | 34 | 57,294 | 37 | (1,519 | ) | (3 | ) | ||||||||||||||||
| General and administrative |
23,103 | 14 | 21,847 | 14 | 1,256 | 6 | ||||||||||||||||||
| Merger-related |
716 | — | — | — | 716 | nm | ||||||||||||||||||
| Total |
$ | 111,310 | 68 | % | $ | 110,991 | 71 | % | $ | 319 | 0 | % | ||||||||||||
nm – not meaningful
Research and Development. During 2018, research and development expense decreased by $134,000, or 0%, compared to 2017 primarily due to a decrease in stock-based compensation of $282,000. This decrease was offset by increases in rent and employee-related expenses of $181,000 and $126,000, respectively. We expect our research and development expense to remain relatively unchanged in future periods.
52
Table of Contents
Sales and Marketing. During 2018, sales and marketing expense decreased by $1.5 million, or 3%, compared to 2017 primarily due to decreases in travel, employee-related, and commission expenses of $1 million, $656,000, and $485,000, respectively. There were also decreases in stock-based compensation, computer maintenance and support, and consulting expenses of $373,000, $149,000, and $114,000, respectively. These decreases were partially offset by increases in rent expense, executive severance, conference expense, and marketing programs expense of $659,000, $386,000, $270,000 and $118,000, respectively. We expect that our sales and marketing expense will increase in absolute dollars along with our revenue, as we continue to expand sales coverage and build brand awareness through what we believe are cost-effective channels.
General and Administrative. During 2018, general and administrative expense increased by $1.3 million, or 6%, compared to 2017 primarily due to increases in consulting, employee-related, recruiting, and tax expenses of $1.2 million, $578,000, $464,000, and $184,000, respectively. These increases were offset by decreases in legal, depreciation, and travel expenses of $716,000, $232,000, and $130,000, respectively. In future periods, we expect general and administrative expense to remain relatively unchanged.
Merger-Related. During 2018, merger-related expenses increased by $716,000 primarily due to costs incurred in connection with the entry into a definitive agreement in February 2019 to acquire the online video player related assets from Ooyala, Inc. and certain of its subsidiaries.
Liquidity and Capital Resources
Cash and cash equivalents.
Our cash and cash equivalents at December 31, 2019 were held for working capital purposes and were invested primarily in money market funds. We do not enter into investments for trading or speculative purposes. At December 31, 2019 and 2018, we had $14.0 million and $9.9 million, respectively, of cash and cash equivalents held by subsidiaries in international locations, including subsidiaries located in Japan and the United Kingdom. As a result of changes in tax law, these earnings can be repatriated to the United States tax-free but could still be subject to foreign withholding taxes. On April 1, 2019, we completed the acquisition of the online video platform assets of Ooyala in exchange for 1,056,763 unregistered shares of our common stock and $2.6 million in cash. On August 1, 2019, we completed the acquisition of a company in exchange for 270,686 unregistered shares of our common stock and $2.8 million in cash. We believe that our existing cash and cash equivalents will be sufficient to meet our anticipated working capital and capital expenditure needs over at least the next 12 months.
| Year Ended December 31, | ||||||||||||
| Condensed Consolidated Statements of Cash Flow Data |
2019 | 2018 | 2017 | |||||||||
| (in thousands) | ||||||||||||
| Cash flows provided by (used in) operating activities |
2,708 | 2,550 | (6,441 | ) | ||||||||
| Cash flows used in investing activities |
(12,618 | ) | (4,531 | ) | (4,112 | ) | ||||||
| Cash flows provided by (used in) financing activities |
3,177 | 5,250 | (544 | ) | ||||||||
Accounts receivable, net.
Our accounts receivable balance fluctuates from period to period, which affects our cash flow from operating activities. The fluctuations vary depending on the timing of our billing activity, cash collections, and changes to our allowance for doubtful accounts. In many instances we receive cash payment from a customer prior to the time we are able to recognize revenue on a transaction. We record these payments as deferred revenue, which has a positive effect on our accounts receivable balances.
Cash flows provided by (used in) operating activities.
Cash provided by operating activities consists primarily of net loss adjusted for certain non-cash items including depreciation and amortization, stock-based compensation expense, the provision for bad debts and the
53
Table of Contents
effect of changes in working capital and other activities. Cash provided by operating activities during the year ended December 31, 2019 was $2.7 million. The cash flow provided by operating activities primarily resulted from net non-cash charges of $18.8 million and changes in our operating assets and liabilities of $5.8 million, partially offset by net losses of $21.9 million. Net non-cash expenses consisted of $9.3 million for stock-based compensation, $8.4 million for depreciation and amortization, and $1.1 million for provision for reserves on accounts receivable. Cash provided from changes in our operating assets and liabilities consisted primarily of increases in accrued expenses, deferred revenue, accounts payable and prepaid expenses of $6.7 million, $2.7 million, $1.7 million, and $1.2 million, respectively. These inflows were offset in part by increases in accounts receivable and other assets of $5.5 million and $758,000, respectively.
Cash flows used in investing activities.
Cash used in investing activities during the year ended December 31, 2019 was $12.6 million, consisting primarily of $6.2 million for the capitalization of internal-use software costs, $5.3 million in cash paid for the acquisition, and $1.0 million in capital expenditures to support the business.
Cash flows provided by (used in) financing activities.
Cash provided by financing activities for the year ended December 31, 2019 was $3.2 million, consisting of proceeds received on the exercise of common stock options of $3.5 million, offset by other activity of $296,000.
Credit facility.
On December 14, 2018, we entered into an amended and restated loan and security agreement with a lender (the “Loan Agreement”) providing for up to a $30.0 million asset based line of credit (the “Line of Credit”). Borrowings under the Line of Credit are secured by substantially all of our assets, excluding our intellectual property. Outstanding amounts under the Line of Credit accrue interest at a rate as follows; (i) for prime rate advances, the greater of (A) the prime rate and (B) 4%, and (ii) for LIBOR advances, the greater of (A) the LIBOR rate plus 225 basis points (the “LIBOR rate margin”) and (B) 4%. Under the Loan Agreement, we must comply with certain financial covenants, including maintaining a minimum asset coverage ratio. If the outstanding principal during any month is at least $15.0 million, the Company must also maintain a minimum net income threshold based on non-GAAP operating measures. Failure to comply with these covenants, or the occurrence of an event of default, could permit the Lenders under the Line of Credit to declare all amounts borrowed under the Line of Credit, together with accrued interest and fees, to be immediately due and payable. We were in compliance with all covenants under the Line of Credit as of December 31, 2019. As we have not drawn on the Line of Credit, there are no amounts outstanding as of December 31, 2019.
Net operating loss carryforwards.
As of December 31, 2019, we had federal and state net operating losses of approximately $161.8 million and $82.4 million, respectively, which are available to offset future taxable income, if any, through 2039. We had federal and state net operating losses of approximately $23.9 million and $1.7 million, respectively, which are available to offset future taxable income, if any, indefinitely. We had federal and state research and development tax credits of $7.8 million and $4.8 million, respectively, which expire in various amounts through 2039. Our net operating loss and tax credit amounts are subject to annual limitations under Section 382 change of ownership rules of the U.S. Internal Revenue Code of 1986, as amended.
In assessing our ability to utilize our net deferred tax assets, we considered whether it is more likely than not that some portion or all of our net deferred tax assets will not be realized. Based upon the level of our historical U.S. losses and future projections over the period in which the net deferred tax assets are deductible, at this time, we believe it is more likely than not that we will not realize the benefits of these deductible differences. Accordingly, we have provided a valuation allowance against our U.S. deferred tax assets as of December 31, 2019 and 2018.
54
Table of Contents
Contractual Obligations and Commitments
Our principal commitments consist primarily of obligations under our leases for our office space and contractual commitments for content delivery network services, hosting and other support services. Other than these lease obligations and contractual commitments, we do not have commercial commitments under lines of credit, standby repurchase obligations or other such debt arrangements. The following table summarizes these contractual obligations at December 31, 2019:
| Payment Due by Period | ||||||||||||||||||||
| Total | Less than 1 Year |
1 - 3 Years |
3 - 5 Years |
More than 5 Years |
||||||||||||||||
| Operating lease obligations |
$ | 19,191 | $ | 6,786 | $ | 9,026 | $ | 3,169 | $ | 210 | ||||||||||
| Outstanding purchase obligations |
64,581 | 28,331 | 36,250 | — | — | |||||||||||||||
|
|
|
|
|
|
|
|
|
|
|
|||||||||||
| Total |
$ | 83,772 | $ | 35,117 | $ | 45,276 | $ | 3,169 | $ | 210 | ||||||||||
|
|
|
|
|
|
|
|
|
|
|
|||||||||||
Anticipated Cash Flows
We expect to incur significant operating costs, particularly related to services delivery costs, sales and marketing and research and development, for the foreseeable future in order to execute our business plan. We anticipate that such operating costs, as well as planned capital expenditures will constitute a material use of our cash resources. As a result, our net cash flows will depend heavily on the level of future sales, changes in deferred revenue and our ability to manage infrastructure costs.
We believe our existing cash and cash equivalents will be sufficient to meet our working capital and capital expenditures for at least the next 12 months. Our future working capital requirements will depend on many factors, including the rate of our revenue growth, our introduction of new products and enhancements, and our expansion of sales and marketing and product development activities. To the extent that our cash and cash equivalents, and cash flow from operating activities are insufficient to fund our future activities, we may need to raise additional funds through bank credit arrangements or public or private equity or debt financings. We also may need to raise additional funds in the event we determine in the future to acquire businesses, technologies and products that will complement our existing operations. In the event funding is required, we may not be able to obtain bank credit arrangements or equity or debt financing on terms acceptable to us or at all.
Off-Balance Sheet Arrangements
We do not have any special purpose entities or off-balance sheet arrangements.
Recent Accounting Pronouncements
For information on recent accounting pronouncements, see Recently Issued and Adopted Accounting Standards in the notes to the condensed consolidated financial statements appearing elsewhere in this Annual Report on Form 10-K.
| ITEM 7A. | QUANTITATIVE AND QUALITATIVE DISCLOSURES ABOUT MARKET RISK |
Quantitative and Qualitative Disclosures About Market Risk
We have operations both within the United States and internationally, and we are exposed to market risks in the ordinary course of our business. These risks include primarily foreign exchange risks, interest rate and inflation.
55
Table of Contents
Financial instruments
Financial instruments meeting fair value disclosure requirements consist of cash equivalents, accounts receivable and accounts payable. The fair value of these financial instruments approximates their carrying amount.
Foreign currency exchange risk
Our results of operations and cash flows are subject to fluctuations due to changes in foreign currency exchange rates, particularly changes in the euro, British pound, Australian dollar and Japanese yen. Except for revenue transactions in Japan, we enter into transactions directly with substantially all of our foreign customers.
Percentage of revenues and expenses in foreign currency is as follows:
| Twelve Months Ended December 31, | ||||||||
| 2019 | 2018 | |||||||
| Revenues generated in locations outside the United States |
51 | % | 49 | % | ||||
| Revenues in currencies other than the United States dollar (1) |
31 | % | 31 | % | ||||
| Expenses in currencies other than the United States dollar (1) |
16 | % | 16 | % | ||||
| (1) | Percentage of revenues and expenses denominated in foreign currency for the years ended December 31, 2019 and 2018: |
| Twelve Months Ended December 31, 2019 |
||||||||
| Revenues | Expenses | |||||||
| Euro |
7 | % | 1 | % | ||||
| British pound |
7 | 6 | ||||||
| Japanese Yen |
12 | 3 | ||||||
| Other |
5 | 6 | ||||||
|
|
|
|
|
|||||
| Total |
31 | % | 16 | % | ||||
| Twelve Months Ended December 31, 2018 |
||||||||
| Revenues | Expenses | |||||||
| Euro |
6 | % | 1 | % | ||||
| British pound |
7 | 6 | ||||||
| Japanese Yen |
13 | 4 | ||||||
| Other |
5 | 5 | ||||||
|
|
|
|
|
|||||
| Total |
31 | % | 16 | % | ||||
As of December 31, 2019 and 2018, we had $7.5 million and $7.2 million, respectively, of receivables denominated in currencies other than the U.S. dollar. We also maintain cash accounts denominated in currencies other than the local currency, which exposes us to foreign exchange rate movements.
In addition, although our foreign subsidiaries have intercompany accounts that are eliminated upon consolidation, these accounts expose us to foreign currency exchange rate fluctuations. Exchange rate fluctuations on short-term intercompany accounts are recorded in our consolidated statements of operations under “other income (expense), net”, while exchange rate fluctuations on long-term intercompany accounts are recorded as a component of other comprehensive income (loss), as they are considered part of our net investment.
56
Table of Contents
Currently, our largest foreign currency exposures are the euro and British pound primarily because our European operations have a higher proportion of our local currency denominated expenses, in addition to the Japanese Yen as result of our ongoing operations in Japan. Relative to foreign currency exposures existing at December 31, 2019, a 10% unfavorable movement in foreign currency exchange rates would expose us to significant losses in earnings or cash flows or significantly diminish the fair value of our foreign currency financial instruments. For the year ended December 31, 2019, we estimated that a 10% unfavorable movement in foreign currency exchange rates would have decreased revenues by $5.6 million, decreased expenses by $3.3 million and increased operating losses by $2.3 million. The estimates used assume that all currencies move in the same direction at the same time and the ratio of non-U.S. dollar denominated revenue and expenses to U.S. dollar denominated revenue and expenses does not change from current levels. Since a portion of our revenue is deferred revenue that is recorded at different foreign currency exchange rates, the impact to revenue of a change in foreign currency exchange rates is recognized over time, and the impact to expenses is more immediate, as expenses are recognized at the current foreign currency exchange rate in effect at the time the expense is incurred. All of the potential changes noted above are based on sensitivity analyses performed on our financial results as of December 31, 2019.
Interest rate risk
We had cash and cash equivalents totaling $22.8 million at December 31, 2019. Cash and cash equivalents were invested primarily in money market funds and are held for working capital purposes. We do not use derivative financial instruments in our investment portfolio. Declines in interest rates, however, would reduce future interest income. In the event that we borrow under our line of credit, the related interest expense recorded would be subject to changes in the rate of interest.
Inflation risk
We do not believe that inflation has had a material effect on our business, financial condition or results of operations. If our costs were to become subject to significant inflationary pressures, we may not be able to fully offset such higher costs through price increases. Our inability or failure to do so could harm our business, financial condition and results of operations.
57
Table of Contents
| Item 8. | Financial Statements and Supplementary Data |
Brightcove Inc.
Index to Consolidated Financial Statements
58
Table of Contents
| Item 9. | Changes in and Disagreements with Accountants on Accounting and Financial Disclosure |
None.
| Item 9A. | Controls and Procedures |
Evaluation of Disclosure Controls and Procedures
Our management, with the participation of our principal executive officer and principal financial officer, has evaluated the effectiveness of our disclosure controls and procedures (as defined in Rules 13a-15(e) and 15d-15(e) under the Securities Exchange Act of 1934, as amended (the “Exchange Act”), as of the end of the period covered by this Annual Report on Form 10-K. Based on such evaluation, our principal executive officer and principal financial officer have concluded that as of such date, our disclosure controls and procedures were effective.
Management’s Annual Report on Internal Control Over Financial Reporting
Our management is responsible for establishing and maintaining adequate internal control over financial reporting as defined in Rule 13a-15(f) or 15d-15(f) of the Exchange Act. Internal control over financial reporting is a process designed to provide reasonable assurance regarding the reliability of financial reporting and the preparation of financial statements for external purposes in accordance with generally accepted accounting principles, and includes those policies and procedures that: (i) pertain to the maintenance of records that, in reasonable detail, accurately and fairly reflect the transactions and dispositions of our assets; (ii) provide reasonable assurance that transactions are recorded as necessary to permit preparation of financial statements in accordance with generally accepted accounting principles, and that our receipts and expenditures are being made only in accordance with authorizations of our management and directors; and (iii) provide reasonable assurance regarding prevention or timely detection of unauthorized acquisition, use or disposition of our assets that could have a material effect on our financial statements.
Because of its inherent limitations, internal control over financial reporting may not prevent or detect misstatements. Also, projections of any evaluation of effectiveness to future periods are subject to the risk that controls may become inadequate because of changes in conditions, or that the degree of compliance with the policies or procedures may deteriorate.
Our management assessed the effectiveness of our internal control over financial reporting as of December 31, 2019 using the criteria set forth by the Committee of Sponsoring Organizations of the Treadway Commission (COSO) in its Internal Control-Integrated Framework (2013). Based on this assessment and those criteria, management concluded that our internal control over financial reporting was effective as of December 31, 2019.
Management excluded from its assessment of our internal control over financial reporting as of December 31, 2019, the internal control over financial reporting of the Ooyala Acquisition. This exclusion is consistent with guidance issued by the SEC that an assessment of recently acquired business may be omitted from the scope of management’s report on internal control over financial reporting in the year of acquisition. Total and net assets acquired in the Ooyala Acquisition as of December 31, 2019, excluding goodwill and other intangible assets, which are included in management’s assessment of internal control over financial reporting as of December 31, 2019, were approximately $4.9 million and $3.9 million, respectively. Net revenues resulting from the Ooyala Acquisition were $17.9 million for the year ended December 31, 2019.
See a discussion of this acquisition in Note 3, Business Combinations, of the Notes to the Consolidated Financial Statements contained in Item 8 of this Annual Report on Form 10-K.The effectiveness of our internal control over financial reporting as of December 31, 2019 has been audited by Ernst & Young LLP, an independent registered public accounting firm, as stated in their report which is included herein.
Changes in Internal Control Over Financial Reporting
There were no changes in our internal control over financial reporting during our most recent fiscal quarter that have materially affected, or are reasonably likely to materially affect, our internal control over financial reporting.
59
Table of Contents
Report of Independent Registered Public Accounting Firm
To the Shareholders and the Board of Directors of
Brightcove Inc.
Opinion on Internal Control Over Financial Reporting
We have audited Brightcove Inc.’s internal control over financial reporting as of December 31, 2019, based on criteria established in Internal Control-Integrated Framework issued by the Committee of Sponsoring Organizations of the Treadway Commission (2013 framework) (the COSO criteria). In our opinion, Brightcove Inc. (the Company) maintained, in all material respects, effective internal control over financial reporting as of December 31, 2019, based on the COSO criteria.
As indicated in the accompanying Management’s Annual Report on Internal Control Over Financial Reporting, management’s assessment of and conclusion on the effectiveness of internal control over financial reporting did not include the internal controls of the Ooyala Acquisition, which is included in the 2019 consolidated financial statements of the Company and constituted $4.9 million and $3.9 million of total and net assets, respectively, as of December 31, 2019 and $17.9 million of revenue for the year then ended. Our audit of internal control over financial reporting of the Company also did not include an evaluation of the internal control over financial reporting of the Ooyala Acquisition.
We also have audited, in accordance with the standards of the Public Company Accounting Oversight Board (United States) (PCAOB), the consolidated balance sheets of the Company as of December 31, 2019 and 2018, the related consolidated statements of operations, comprehensive loss, stockholders’ equity and cash flows for each of the three years in the period ended December 31, 2019, and the related notes and our report dated February 26, 2020 expressed an unqualified opinion thereon.
Basis for Opinion
The Company’s management is responsible for maintaining effective internal control over financial reporting and for its assessment of the effectiveness of internal control over financial reporting included in the accompanying Management’s Annual Report on Internal Control Over Financial Reporting. Our responsibility is to express an opinion on the Company’s internal control over financial reporting based on our audit. We are a public accounting firm registered with the PCAOB and are required to be independent with respect to the Company in accordance with the U.S. federal securities laws and the applicable rules and regulations of the Securities and Exchange Commission and the PCAOB.
We conducted our audit in accordance with the standards of the PCAOB. Those standards require that we plan and perform the audit to obtain reasonable assurance about whether effective internal control over financial reporting was maintained in all material respects.
Our audit included obtaining an understanding of internal control over financial reporting, assessing the risk that a material weakness exists, testing and evaluating the design and operating effectiveness of internal control based on the assessed risk, and performing such other procedures as we considered necessary in the circumstances. We believe that our audit provides a reasonable basis for our opinion.
Definition and Limitations of Internal Control Over Financial Reporting
A company’s internal control over financial reporting is a process designed to provide reasonable assurance regarding the reliability of financial reporting and the preparation of financial statements for external purposes in accordance with generally accepted accounting principles. A company’s internal control over financial reporting includes those policies and procedures that (1) pertain to the maintenance of records that, in reasonable detail,
60
Table of Contents
accurately and fairly reflect the transactions and dispositions of the assets of the company; (2) provide reasonable assurance that transactions are recorded as necessary to permit preparation of financial statements in accordance with generally accepted accounting principles, and that receipts and expenditures of the company are being made only in accordance with authorizations of management and directors of the company; and (3) provide reasonable assurance regarding prevention or timely detection of unauthorized acquisition, use, or disposition of the company’s assets that could have a material effect on the financial statements.
Because of its inherent limitations, internal control over financial reporting may not prevent or detect misstatements. Also, projections of any evaluation of effectiveness to future periods are subject to the risk that controls may become inadequate because of changes in conditions, or that the degree of compliance with the policies or procedures may deteriorate.
/s/ Ernst & Young LLP
Boston, Massachusetts
February 26, 2020
61
Table of Contents
| Item 9B. | Other Information |
None.
| Item 10. | Directors, Executive Officers, and Corporate Governance |
Incorporated by reference from the information in our Proxy Statement for our 2018 Annual Meeting of Stockholders, which we will file with the SEC within 120 days of the end of the fiscal year to which this Annual Report on Form 10-K relates.
| Item 11. | Executive Compensation |
Incorporated by reference from the information in our Proxy Statement for our 2018 Annual Meeting of Stockholders, which we will file with the SEC within 120 days of the end of the fiscal year to which this Annual Report on Form 10-K relates.
| Item 12. | Security Ownership of Certain Beneficial Owners and Management and Related Stockholder Matters |
Incorporated by reference from the information in our Proxy Statement for our 2018 Annual Meeting of Stockholders, which we will file with the SEC within 120 days of the end of the fiscal year to which this Annual Report on Form 10-K relates.
| Item 13. | Certain Relationships and Related Transactions and Director Independence |
Incorporated by reference from the information in our Proxy Statement for our 2018 Annual Meeting of Stockholders, which we will file with the SEC within 120 days of the end of the fiscal year to which this Annual Report on Form 10-K relates.
| Item 14. | Principal Accountant Fees and Services |
Incorporated by reference from the information in our Proxy Statement for our 2018 Annual Meeting of Stockholders, which we will file with the SEC within 120 days of the end of the fiscal year to which this Annual Report on Form 10-K relates.
| Item 15. | Exhibits, Financial Statements and Schedules |
(a)(1) Financial Statements.
The response to this portion of Item 15 is set forth under Item 8 above.
(a)(2) Financial Statement Schedules.
All schedules have been omitted because they are not required or because the required information is given in the Consolidated Financial Statements or Notes thereto set forth under Item 8 above.
62
Table of Contents
(a)(3) Exhibits.
The exhibits listed below are filed or incorporated by reference as part of this Annual Report on Form 10-K.
63
Table of Contents
64
Table of Contents
| Exhibits |
||
| 21.1** | Subsidiaries of the Registrant. | |
| 23.1** | Consent of Ernst & Young LLP, Independent Registered Public Accounting Firm. | |
| 24.1** | Power of Attorney (included on signature page). | |
| 31.1** | Certification of Chief Executive Officer Pursuant to Section 302 of the Sarbanes-Oxley Act of 2002. | |
| 31.2** | Certification of Chief Financial Officer Pursuant to Section 302 of the Sarbanes-Oxley Act of 2002. | |
| 32.1**• | Certification of Chief Executive Officer and Chief Financial Officer Pursuant to Section 906 of the Sarbanes-Oxley Act of 2002. | |
| 101.INS** | XBRL Instance Document. | |
| 101.SCH** | XBRL Taxonomy Extension Schema Document. | |
| 101.CAL** | XBRL Taxonomy Extension Calculation Linkbase Document. | |
| 101.DEF** | XBRL Taxonomy Extension Definition Linkbase Document. | |
| 101.LAB** | XBRL Taxonomy Extension Label Linkbase Document. | |
| 101.PRE** | XBRL Taxonomy Extension Presentation Linkbase Document. | |
| (1) | Filed as Exhibit 2.1 to the Registrant’s Current Report on Form 8-K filed with the Securities and Exchange Commission on July 26, 2012. |
| (2) | Filed as Exhibit 2.1 to the Registrant’s Current Report on Form 8-K filed with the Securities and Exchange Commission on January 6, 2014. |
| (3) | Filed as Exhibit 3.2 to Amendment No. 5 to the Registrant’s Registration Statement on Form S-1 filed with the Securities and Exchange Commission on February 6, 2012. |
| (4) | Filed as Exhibit 3.3 to Amendment No. 5 to the Registrant’s Registration Statement on Form S-1 filed with the Securities and Exchange Commission on February 6, 2012. |
| (5) | Filed as Exhibit 4.1 to Amendment No. 5 to the Registrant’s Registration Statement on Form S-1 filed with the Securities and Exchange Commission on February 6, 2012. |
| (6) | Filed as Exhibit 4.2 to the Registrant’s Registration Statement on Form S-1 filed with the Securities and Exchange Commission on August 24, 2011. |
| (7) | Filed as Exhibit 4.4 to the Registrant’s Registration Statement on Form S-1 filed with the Securities and Exchange Commission on August 24, 2011. |
| (8) | Filed as Exhibit 4.4 to the Registrant’s Registration Statement on Form S-8 filed with the Securities and Exchange Commission on August 14, 2012. |
| (9) | Filed as Exhibit 4.5 to the Registrant’s Registration Statement on Form S-8 filed with the Securities and Exchange Commission on August 14, 2012. |
| (10) | Filed as Exhibit 4.4 to Registrant’s Registration Statement on Form S-8 filed with the Securities and Exchange Commission on May 1, 2018. |
| (11) | Filed as Exhibit 4.5 to Registrant’s Registration Statement on Form S-8 filed with the Securities and Exchange Commission on May 1, 2018. |
| (12) | Filed as Exhibit 4.6 to Registrant’s Registration Statement on Form S-8 filed with the Securities and Exchange Commission on May 1, 2018. |
| (13) | Filed as Exhibit 10.1 to Amendment No. 5 to the Registrant’s Registration Statement on Form S-1 filed with the Securities and Exchange Commission on February 6, 2012. |
| (14) | Filed as Exhibit 10.2 to the Registrant’s Registration Statement on Form S-1 filed with the Securities and Exchange Commission on August 24, 2011. |
65
Table of Contents
| (15) | Filed as Exhibit 10.3 to Amendment No. 5 to the Registrant’s Registration Statement on Form S-1 filed with the Securities and Exchange Commission on February 6, 2012. |
| (16) | Filed as Exhibit 10.4 to Amendment No. 5 to the Registrant’s Registration Statement on Form S-1 filed with the Securities and Exchange Commission on February 6, 2012. |
| (17) | Filed as Exhibit 10.5 to Amendment No. 5 to the Registrant’s Registration Statement on Form S-1 filed with the Securities and Exchange Commission on February 6, 2012. |
| (18) | Filed as Exhibit 10.6 to the Registrant’s Registration Statement on Form S-1 filed with the Securities and Exchange Commission on August 24, 2011. |
| (19) | Filed as Exhibit 10.7 to the Registrant’s Registration Statement on Form S-1 filed with the Securities and Exchange Commission on August 24, 2011. |
| (20) | Filed as Exhibit 10.8 to the Registrant’s Registration Statement on Form S-1 filed with the Securities and Exchange Commission on August 24, 2011. |
| (21) | Filed as Exhibit 10.1 to the Registrant’s Current Report on Form 8-K filed with the Securities and Exchange Commission on April 30, 2013. |
| (22) | Filed as Exhibit 10.1 to the Registrant’s Current Report on Form 8-K filed with the Securities and Exchange Commission on October 7, 2014. |
| (23) | Filed as Exhibit 10.1 to the Registrant’s Current Report on Form 8-K filed with the Securities and Exchange Commission on November 20, 2015. |
| (24) | Filed as Exhibit 10.9 to the Registrant’s Registration Statement on Form S-1 filed with the Securities and Exchange Commission on August 24, 2011. |
| (25) | Filed as Exhibit 10.10 to the Registrant’s Registration Statement on Form S-1 filed with the Securities and Exchange Commission on August 24, 2011. |
| (26) | Filed as Exhibit 10.11 to the Registrant’s Registration Statement on Form S-1 filed with the Securities and Exchange Commission on August 24, 2011. |
| (27) | Filed as Exhibit 10.13 to the Registrant’s Registration Statement on Form S-1 filed with the Securities and Exchange Commission on August 24, 2011. |
| (28) | Filed as Exhibit 10.14 to the Registrant’s Annual Report on Form 10-K filed with the Securities and Exchange Commission on March 5, 2013. |
| (29) | Filed as Exhibit 10.1 to the Registrant’s Current Report on Form 8-K filed with the Securities and Exchange Commission on July 25, 2013. |
| (30) | Filed as Exhibit 10.1 to the Registrant’s Quarterly Report on Form 10-Q filed with the Securities and Exchange Commission on November 3, 2014. |
| (31) | Filed as Exhibit 10.2 to the Registrant’s Quarterly Report on Form 10-Q filed with the Securities and Exchange Commission on November 3, 2014. |
| (32) | Filed as Exhibit 10.3 to the Registrant’s Quarterly Report on Form 10-Q filed with the Securities and Exchange Commission on November 3, 2014. |
| (33) | Filed as Exhibit 10.1 to the Registrant’s Current Report on Form 8-K filed with the Securities and Exchange Commission on November 10, 2014. |
| (34) | Filed as Exhibit 10.14 to Amendment No. 5 to the Registrant’s Registration Statement on Form S-1 filed with the Securities and Exchange Commission on February 6, 2012. |
| (35) | Filed as Exhibit 10.15 to Amendment No. 5 to the Registrant’s Registration Statement on Form S-1 filed with the Securities and Exchange Commission on February 6, 2012. |
| (36) | Filed as Exhibit 10.16 to Amendment No. 5 to the Registrant’s Registration Statement on Form S-1 filed with the Securities and Exchange Commission on February 6, 2012. |
| (37) | Filed as Exhibit 10.17 to Amendment No. 5 to the Registrant’s Registration Statement on Form S-1 filed with the Securities and Exchange Commission on February 6, 2012. |
| (38) | Filed as Exhibit 10.18 to Amendment No. 5 to the Registrant’s Registration Statement on Form S-1 filed with the Securities and Exchange Commission on February 6, 2012. |
| (39) | Filed as Exhibit 10.19 to Amendment No. 5 to the Registrant’s Registration Statement on Form S-1 filed with the Securities and Exchange Commission on February 6, 2012. |
| (40) | Filed as Exhibit 99.2 to the Registrant’s Current Report on Form 8-K filed with the Securities and Exchange commission on July 26, 2017. |
66
Table of Contents
| (41) | Filed as Exhibit 99.3 to the Registrant’s Current Report on Form 8-K filed with the Securities and Exchange commission on July 26, 2017. |
| (42) | Filed as Exhibit 10.1 to the Registrant’s Quarterly Report on Form 10-Q filed with the Securities and Exchange Commission on October 26, 2017. |
| (43) | Filed as Exhibit 99.1 to the Registrant’s Current Report on Form 8-K filed with the Securities and Exchange Commission on April 11, 2018. |
| (44) | Filed as Exhibit 99.2 to the Registrant’s Current Report on Form 8-K filed with the Securities and Exchange Commission on April 11, 2018. |
| (45) | Filed as Exhibit 99.5 to Registrant’s Current Report on Form 8-K filed with the Securities and Exchange Commission on April 11, 2018. |
| (46) | Filed as Exhibit 99.1 to the Registrant’s Current Report on Form 8-K filed with the Securities and Exchange Commission on May 4, 2018. |
| (47) | Filed as Exhibit 10.1 to the Registrant’s Current Report on Form 8-K filed with the Securities and Exchange Commission on December 14, 2018. |
| (48) | Filed as Exhibit 10.1 to the Registrant’s Quarterly Report on Form 10-Q filed with the Securities and Exchange Commission on April 24, 2019. |
| * | Incorporated herein by reference. |
| ** | Filed herewith. |
| • | The certifications furnished in Exhibit 32.1 hereto are deemed to accompany this Annual Report on Form 10-K and will not be deemed “filed” for purposes of Section 18 of the Securities Exchange Act of 1934, as amended. Such certifications will not be deemed to be incorporated by reference into any filings under the Securities Act of 1933, as amended, or the Securities Exchange Act of 1934, as amended, except to the extent that the Registrant specifically incorporates it by reference. |
| † | Indicates a management contract or any compensatory plan, contract or arrangement. |
| Item 16. | Form 10-K Summary |
Not applicable.
67
Table of Contents
Pursuant to the requirements of Section 13 or 15(d) of the Securities Exchange Act of 1934, the registrant has duly caused this report to be signed on its behalf by the undersigned, thereunto duly authorized on the 26th day of February, 2020.
| BRIGHTCOVE INC. | ||
| By: | /s/ Jeff Ray | |
| Jeff Ray | ||
| Chief Executive Officer | ||
68
Table of Contents
Each person whose individual signature appears below hereby constitutes and appoints Robert Noreck and David Plotkin, and each of them, with full power of substitution and resubstitution and full power to act without the other, as his or her true and lawful attorney-in-fact and agent to act in his or her name, place and stead and to execute in the name and on behalf of each person, individually and in each capacity stated below, and to file any and all amendments to this Annual Report on Form 10-K, and to file the same, with all exhibits thereto, and other documents in connection therewith, with the Securities and Exchange Commission, granting unto said attorneys-in-fact and agents, and each of them, full power and authority to do and perform each and every act and thing, ratifying and confirming all that said attorneys-in-fact and agents or any of them or their or his substitute or substitutes may lawfully do or cause to be done by virtue thereof.
Pursuant to the requirements of the Securities Exchange Act of 1934, this report has been signed below by the following persons on behalf of the registrant and in the capacities and on the dates indicated.
| Name |
Title |
Date | ||
| /s/ Jeff Ray Jeff Ray |
Chief Executive Officer (Principal Executive Officer) and Director |
February 26, 2020 | ||
| /s/ Robert Noreck Robert Noreck |
Chief Financial Officer (Principal Financial Officer) |
February 26, 2020 | ||
| /s/ Deborah Besemer Deborah Besemer |
Chairperson of the Board of Directors | February 26, 2020 | ||
| /s/ Kristin Frank Kristin Frank |
Director | February 26, 2020 | ||
| /s/ Gary Haroian Gary Haroian |
Director | February 26, 2020 | ||
| /s/ Diane Hessan Diane Hessan |
Director | February 26, 2020 | ||
| /s/ Scott Kurnit Scott Kurnit |
Director | February 26, 2020 | ||
| /s/ Thomas E. Wheeler Thomas E. Wheeler |
Director | February 26, 2020 | ||
69
Table of Contents
Report of Independent Registered Public Accounting Firm
To the Shareholders and Board of Directors of
Brightcove Inc.
Opinion on the Financial Statements
We have audited the accompanying consolidated balance sheets of Brightcove Inc. (the Company) as of December 31, 2019 and 2018, the related consolidated statements of operations, comprehensive loss, stockholders’ equity, and cash flows for each of the three years in the period ended December 31, 2019, and the related notes (collectively referred to as the “consolidated financial statements”). In our opinion, the consolidated financial statements present fairly, in all material respects, the financial position of the Company at December 31, 2019 and 2018, and the results of its operations and its cash flows for each of the three years in the period ended December 31, 2019, in conformity with U.S. generally accepted accounting principles.
We also have audited, in accordance with the standards of the Public Company Accounting Oversight Board (United States) (PCAOB), the Company’s internal control over financial reporting as of December 31, 2019, based on criteria established in Internal Control-Integrated Framework issued by the Committee of Sponsoring Organizations of the Treadway Commission (2013 framework), and our report dated February 26, 2020 expressed an unqualified opinion thereon.
Adoption of ASU No. 2018-11
As discussed in Note 2 to the consolidated financial statements, the Company changed its method for accounting for leases as a result of the adoption of Accounting Standards Update (ASU) No. 2018-11, Leases (Topic 842), effective January 1, 2019.
Adoption of ASU No. 2014-09
As discussed in Note 2 to the consolidated financial statements, the Company changed its method for recognizing revenue in 2018 as a result of the adoption of Accounting Standards Update (ASU) No. 2014-09, Revenue from Contracts with Customers (Topic 606), and the amendments in ASUs 2015-14, 2016-08, 2016-10 and 2016-12 effective January 1, 2018.
Basis for Opinion
These financial statements are the responsibility of the Company’s management. Our responsibility is to express an opinion on the Company’s financial statements based on our audits. We are a public accounting firm registered with the PCAOB and are required to be independent with respect to the Company in accordance with the U.S. federal securities laws and the applicable rules and regulations of the Securities and Exchange Commission and the PCAOB.
We conducted our audits in accordance with the standards of the PCAOB. Those standards require that we plan and perform the audit to obtain reasonable assurance about whether the financial statements are free of material misstatement, whether due to error or fraud. Our audits included performing procedures to assess the risks of material misstatement of the financial statements, whether due to error or fraud, and performing procedures that respond to those risks. Such procedures included examining, on a test basis, evidence regarding the amounts and disclosures in the financial statements. Our audits also included evaluating the accounting principles used and significant estimates made by management, as well as evaluating the overall presentation of the financial statements. We believe that our audits provide a reasonable basis for our opinion.
/s/ Ernst & Young LLP
We have served as the Company’s auditor since 2010.
Boston, Massachusetts
February 26, 2020
F-1
Table of Contents
Brightcove Inc.
| December 31, | ||||||||
| 2019 | 2018 | |||||||
| (in thousands, except share and per share data) |
||||||||
| Assets |
||||||||
| Current assets: |
||||||||
| Cash and cash equivalents |
$ | 22,759 | $ | 29,306 | ||||
| Accounts receivable, net of allowance of $904 and $190 at December 31, 2019 and December 31, 2018, respectively |
31,181 | 23,264 | ||||||
| Prepaid expenses |
5,171 | 4,866 | ||||||
| Other current assets |
6,713 | 7,070 | ||||||
|
|
|
|
|
|||||
| Total current assets |
65,824 | 64,506 | ||||||
| Property and equipment, net |
12,086 | 9,703 | ||||||
| Operating lease right-of-use asset |
16,912 | — | ||||||
| Intangible assets, net |
13,875 | 5,919 | ||||||
| Goodwill |
60,902 | 50,776 | ||||||
| Other assets |
3,268 | 2,452 | ||||||
|
|
|
|
|
|||||
| Total assets |
$ | 172,867 | $ | 133,356 | ||||
|
|
|
|
|
|||||
| Liabilities and stockholders’ equity |
||||||||
| Current liabilities: |
||||||||
| Accounts payable |
$ | 9,917 | $ | 7,712 | ||||
| Accrued expenses |
20,925 | 13,982 | ||||||
| Operating lease liability |
6,174 | — | ||||||
| Deferred revenue |
49,260 | 39,846 | ||||||
|
|
|
|
|
|||||
| Total current liabilities |
86,276 | 61,540 | ||||||
| Operating lease liability, net of current portion |
11,701 | — | ||||||
| Other liabilities |
767 | 1,202 | ||||||
|
|
|
|
|
|||||
| Total liabilities |
98,744 | 62,742 | ||||||
| Commitments and contingencies (Note 7) |
||||||||
| Stockholders’ equity: |
||||||||
| Undesignated preferred stock, $0.001 par value; 5,000,000 shares authorized; no shares issued |
— | — | ||||||
| Common stock, $0.001 par value; 100,000,000 shares authorized; 39,042,787 and 36,752,469 shares issued at December 31, 2019 and 2018, respectively |
39 | 37 | ||||||
| Additional paid-in capital |
276,365 | 251,122 | ||||||
| Treasury stock, at cost; 135,000 shares |
(871 | ) | (871 | ) | ||||
| Accumulated other comprehensive loss |
(785 | ) | (952 | ) | ||||
| Accumulated deficit |
(200,625 | ) | (178,722 | ) | ||||
|
|
|
|
|
|||||
| Total stockholders’ equity |
74,123 | 70,614 | ||||||
|
|
|
|
|
|||||
| Total liabilities and stockholders’ equity |
$ | 172,867 | $ | 133,356 | ||||
|
|
|
|
|
|||||
See accompanying notes.
F-2
Table of Contents
Brightcove Inc.
Consolidated Statements of Operations
| Year Ended December 31, | ||||||||||||
| 2019 | 2018 | 2017 | ||||||||||
| (in thousands, except per share data) | ||||||||||||
| Revenue: |
||||||||||||
| Subscription and support revenue |
$ | 173,818 | $ | 150,941 | $ | 143,159 | ||||||
| Professional services and other revenue |
$ | 10,637 | 13,892 | 12,754 | ||||||||
|
|
|
|
|
|
|
|||||||
| Total revenue |
184,455 | 164,833 | 155,913 | |||||||||
| Cost of revenue: |
||||||||||||
| Cost of subscription and support revenue |
67,064 | 53,311 | 50,664 | |||||||||
| Cost of professional services and other revenue |
8,405 | 13,313 | 13,954 | |||||||||
|
|
|
|
|
|
|
|||||||
| Total cost of revenue |
75,469 | 66,624 | 64,618 | |||||||||
|
|
|
|
|
|
|
|||||||
| Gross profit |
108,986 | 98,209 | 91,295 | |||||||||
| Operating expenses: |
||||||||||||
| Research and development |
32,535 | 31,716 | 31,850 | |||||||||
| Sales and marketing |
60,375 | 55,775 | 57,294 | |||||||||
| General and administrative |
25,692 | 23,103 | 21,847 | |||||||||
| Merger-related |
11,447 | 716 | — | |||||||||
|
|
|
|
|
|
|
|||||||
| Total operating expenses |
130,049 | 111,310 | 110,991 | |||||||||
|
|
|
|
|
|
|
|||||||
| Loss from operations |
(21,063 | ) | (13,101 | ) | (19,696 | ) | ||||||
| Other (expense) income, net |
(280 | ) | (326 | ) | 547 | |||||||
|
|
|
|
|
|
|
|||||||
| Loss before income taxes |
(21,343 | ) | (13,427 | ) | (19,149 | ) | ||||||
| Provision for income taxes |
560 | 601 | 370 | |||||||||
|
|
|
|
|
|
|
|||||||
| Net loss |
$ | (21,903 | ) | $ | (14,028 | ) | $ | (19,519 | ) | |||
|
|
|
|
|
|
|
|||||||
| Net loss per share — basic and diluted |
$ | (0.58 | ) | $ | (0.39 | ) | $ | (0.57 | ) | |||
|
|
|
|
|
|
|
|||||||
| Weighted-average number of common shares used in computing net loss per share — basic and diluted |
38,028 | 35,808 | 34,376 | |||||||||
|
|
|
|
|
|
|
|||||||
See accompanying notes.
F-3
Table of Contents
Brightcove Inc.
Consolidated Statements of Comprehensive Loss
| Year Ended December 31, | ||||||||||||
| 2019 | 2018 | 2017 | ||||||||||
| (in thousands) | ||||||||||||
| Net loss |
$ | (21,903 | ) | $ | (14,028 | ) | $ | (19,519 | ) | |||
| Other comprehensive (loss) income: |
||||||||||||
| Foreign currency translation adjustments |
167 | (143 | ) | 363 | ||||||||
|
|
|
|
|
|
|
|||||||
| Comprehensive loss |
$ | (21,736 | ) | $ | (14,171 | ) | $ | (19,156 | ) | |||
|
|
|
|
|
|
|
|||||||
See accompanying notes.
F-4
Table of Contents
Brightcove Inc.
Consolidated Statements of Stockholders’ Equity
(in thousands, except share data)
| Year Ended December 31, | ||||||||||||
| 2019 | 2018 | 2017 | ||||||||||
| (in thousands, except share data) | ||||||||||||
| Shares of common stock issued |
||||||||||||
| Balance, beginning of period |
36,752,469 | 34,933,408 | 34,143,148 | |||||||||
| Common stock issued upon acquisition |
1,286,846 | — | — | |||||||||
| Issuance of common stock upon exercise of stock options and pursuant to restricted stock units |
1,003,472 | 1,819,061 | 790,260 | |||||||||
|
|
|
|
|
|
|
|||||||
| Balance, end of period |
39,042,787 | 36,752,469 | 34,933,408 | |||||||||
|
|
|
|
|
|
|
|||||||
| Shares of treasury stock |
||||||||||||
| Balance, beginning of period |
(135,000 | ) | (135,000 | ) | (135,000 | ) | ||||||
|
|
|
|
|
|
|
|||||||
| Balance, end of period |
(135,000 | ) | (135,000 | ) | (135,000 | ) | ||||||
|
|
|
|
|
|
|
|||||||
| Par value of common stock issued |
||||||||||||
| Balance, beginning of period |
$ | 37 | $ | 35 | $ | 34 | ||||||
| Common stock issued upon acquisition |
1 | — | — | |||||||||
| Issuance of common stock upon exercise of stock options and pursuant to restricted stock units |
1 | 2 | 1 | |||||||||
|
|
|
|
|
|
|
|||||||
| Balance, end of period |
$ | 39 | $ | 37 | $ | 35 | ||||||
|
|
|
|
|
|
|
|||||||
| Value of treasury stock |
||||||||||||
| Balance, beginning of period |
$ | (871 | ) | $ | (871 | ) | $ | (871 | ) | |||
|
|
|
|
|
|
|
|||||||
| Balance, end of period |
$ | (871 | ) | $ | (871 | ) | $ | (871 | ) | |||
|
|
|
|
|
|
|
|||||||
| Additional paid-in capital |
||||||||||||
| Balance, beginning of period |
$ | 251,122 | $ | 238,700 | $ | 230,788 | ||||||
| Common stock issued upon acquisition |
12,248 | — | — | |||||||||
| Issuance of common stock upon exercise of stock options and pursuant to restricted stock units |
3,413 | 5,585 | 251 | |||||||||
| Stock-based compensation expense |
9,582 | 6,837 | 7,464 | |||||||||
| Impact of adoption of ASU 2016-09 as of January 1, 2017 |
— | — | 197 | |||||||||
|
|
|
|
|
|
|
|||||||
| Balance, end of period |
$ | 276,365 | $ | 251,122 | $ | 238,700 | ||||||
|
|
|
|
|
|
|
|||||||
| Accumulated deficit |
||||||||||||
| Balance, beginning of period |
$ | (178,722 | ) | $ | (170,299 | ) | $ | (150,583 | ) | |||
| Net loss |
(21,903 | ) | (14,028 | ) | (19,519 | ) | ||||||
| Impact of adoption of ASU 2014-09 as of January 1, 2018 |
— | 5,605 | (197 | ) | ||||||||
|
|
|
|
|
|
|
|||||||
| Balance, end of period |
$ | (200,625 | ) | $ | (178,722 | ) | $ | (170,299 | ) | |||
|
|
|
|
|
|
|
|||||||
| Accumulated other comprehensive loss |
||||||||||||
| Balance, beginning of period |
$ | (952 | ) | $ | (809 | ) | $ | (1,172 | ) | |||
| Foreign currency translation adjustment |
167 | (143 | ) | 363 | ||||||||
|
|
|
|
|
|
|
|||||||
| Balance, end of period |
$ | (785 | ) | $ | (952 | ) | $ | (809 | ) | |||
|
|
|
|
|
|
|
|||||||
| Total stockholders’ equity |
$ | 74,123 | $ | 70,614 | $ | 66,756 | ||||||
|
|
|
|
|
|
|
|||||||
See accompanying notes.
F-5
Table of Contents
Brightcove Inc.
Consolidated Statements of Cash Flows
| Year Ended December 31, | ||||||||||||
| 2019 | 2018 | 2017 | ||||||||||
| (in thousands) | ||||||||||||
| Operating activities |
||||||||||||
| Net loss |
$ | (21,903 | ) | $ | (14,028 | ) | $ | (19,519 | ) | |||
| Adjustments to reconcile net loss to net cash provided by (used in) operating activities: |
||||||||||||
| Depreciation and amortization |
8,422 | 6,796 | 7,257 | |||||||||
| Stock-based compensation |
9,259 | 6,649 | 7,243 | |||||||||
| Provision for reserves on accounts receivable |
1,137 | 199 | 203 | |||||||||
| Loss on disposal of equipment |
— | — | — | |||||||||
| Changes in assets and liabilities: |
||||||||||||
| Accounts receivable |
(5,537 | ) | 2,791 | (3,811 | ) | |||||||
| Prepaid expenses and other current assets |
1,213 | 294 | (1,484 | ) | ||||||||
| Other assets |
(758 | ) | (418 | ) | 94 | |||||||
| Accounts payable |
1,682 | 1,197 | 1,758 | |||||||||
| Accrued expenses |
6,749 | 326 | (2,930 | ) | ||||||||
| Operating leases |
(302 | ) | — | — | ||||||||
| Deferred revenue |
2,746 | (1,256 | ) | 4,748 | ||||||||
|
|
|
|
|
|
|
|||||||
| Net cash provided by (used in) operating activities |
2,708 | 2,550 | (6,441 | ) | ||||||||
| Investing activities |
||||||||||||
| Cash paid for acquisition, net of cash acquired |
(5,339 | ) | — | — | ||||||||
| Purchases of property and equipment, net of returns (Note 2) |
(1,047 | ) | (1,538 | ) | (1,102 | ) | ||||||
| Capitalized internal-use software costs |
(6,232 | ) | (2,993 | ) | (3,010 | ) | ||||||
|
|
|
|
|
|
|
|||||||
| Net cash used in investing activities |
(12,618 | ) | (4,531 | ) | (4,112 | ) | ||||||
| Financing activities |
||||||||||||
| Proceeds from exercise of stock options |
3,473 | 5,757 | 520 | |||||||||
| Other financing activities |
(296 | ) | (507 | ) | (1,064 | ) | ||||||
|
|
|
|
|
|
|
|||||||
| Net cash provided by (used in) financing activities |
3,177 | 5,250 | (544 | ) | ||||||||
| Effect of exchange rate changes on cash and cash equivalents |
186 | (95 | ) | 416 | ||||||||
|
|
|
|
|
|
|
|||||||
| Net (decrease) increase in cash and cash equivalents |
(6,547 | ) | 3,174 | (10,681 | ) | |||||||
| Cash and cash equivalents at beginning of period |
29,306 | 26,132 | 36,813 | |||||||||
|
|
|
|
|
|
|
|||||||
| Cash and cash equivalents at end of period |
$ | 22,759 | $ | 29,306 | $ | 26,132 | ||||||
|
|
|
|
|
|
|
|||||||
| Supplemental disclosure of cash flow information |
||||||||||||
| Cash paid for operating lease liabilities |
$ | 7,382 | $ | — | $ | — | ||||||
|
|
|
|
|
|
|
|||||||
| Cash paid for income taxes |
$ | 555 | $ | 384 | $ | 500 | ||||||
|
|
|
|
|
|
|
|||||||
| Cash paid for interest |
$ | 6 | $ | 8 | $ | 26 | ||||||
|
|
|
|
|
|
|
|||||||
| Supplemental disclosure of non-cash operating activities |
||||||||||||
| Capitalization of stock-based compensation related to internal use software |
$ | 322 | $ | 188 | $ | 221 | ||||||
|
|
|
|
|
|
|
|||||||
| Supplemental disclosure of non-cash investing and financing activities |
||||||||||||
| Unpaid internal-use software costs |
$ | 20 | $ | — | $ | 28 | ||||||
|
|
|
|
|
|
|
|||||||
| Fair value of shares issued for acquisition of a business |
$ | 12,250 | $ | — | $ | — | ||||||
|
|
|
|
|
|
|
|||||||
See accompanying notes.
F-6
Table of Contents
Brightcove Inc.
Notes to Consolidated Financial Statements
Years Ended December 31, 2018, 2017 and 2016
(in thousands, except share and per share data, unless otherwise noted)
1. Business Description
Brightcove Inc. (the Company) is a global provider of cloud services for video which enable its customers to publish and distribute video to Internet-connected devices quickly, easily and in a cost-effective and high-quality manner.
The Company is headquartered in Boston, Massachusetts and was incorporated in the state of Delaware on August 24, 2004.
2. Summary of Significant Accounting Policies
The accompanying consolidated financial statements reflect the application of certain significant accounting policies as described below and elsewhere in these notes to the consolidated financial statements.
The Company believes that a significant accounting policy is one that is both important to the portrayal of the Company’s financial condition and results, and requires management’s most difficult, subjective, or complex judgments, often as the result of the need to make estimates about the effect of matters that are inherently uncertain.
Basis of Presentation
The accompanying consolidated financial statements have been prepared in conformity with accounting principles generally accepted in the United States of America (GAAP). Any reference in these notes to applicable guidance is meant to refer to the authoritative United States generally accepted accounting principles as found in the Accounting Standards Codification (ASC) and Accounting Standards Update (ASU) of the Financial Accounting Standards Board (FASB). The Company adopted ASC 842 using the additional transition method introduced by ASU 2018-11 on January 1, 2019 and ASC 606 using the modified retrospective method on January 1, 2018.
Use of Estimates and Uncertainties
The preparation of financial statements in conformity with GAAP requires management to make estimates and assumptions that affect the reported amounts of assets and liabilities, and the disclosure of contingent assets and liabilities at the date of the financial statements, and the reported amounts expensed during the reporting period.
Significant estimates relied upon in preparing these consolidated financial statements include revenue recognition and revenue reserves, contingent liabilities, intangible asset valuations, and the realizability of the Company’s deferred tax assets.
Although the Company regularly assesses these estimates, actual results could differ materially from these estimates. Changes in estimates are recorded in the period in which they become known. The Company bases its estimates on historical experience and various other assumptions that it believes to be reasonable under the circumstances. Actual results may differ from management’s estimates if these results differ from historical experience, or other assumptions do not turn out to be substantially accurate, even if such assumptions are reasonable when made.
F-7
Table of Contents
The Company is subject to a number of risks and uncertainties common to companies in similar industries and stages of development including, but not limited to, rapid technological changes, competition from substitute products and services from larger companies, customer concentration, management of international activities, protection of proprietary rights, patent litigation, and dependence on key individuals.
Principles of Consolidation
The consolidated financial statements include the accounts of the Company and its wholly-owned subsidiaries. All significant intercompany balances and transactions have been eliminated in consolidation.
Subsequent Events Considerations
The Company considers events or transactions that occur after the balance sheet date but prior to the issuance of the financial statements to provide additional evidence for certain estimates or to identify matters that require additional disclosure. Subsequent events have been evaluated as required. The Company has evaluated all subsequent events and determined that, other than as reported herein and described below, there are no material recognized or unrecognized subsequent events.
Foreign Currency Translation
The reporting currency of the Company is the U.S. dollar. The functional currency of the Company’s foreign subsidiaries is the local currency of each subsidiary. All assets and liabilities in the balance sheets of entities whose functional currency is a currency other than the U.S. dollar are translated into U.S. dollar equivalents at exchange rates as follows: (1) asset and liability accounts at period-end rates, (2) income statement accounts at weighted-average exchange rates for the period, and (3) stockholders’ equity accounts at historical exchange rates. The resulting translation adjustments are excluded from income (loss) and reflected as a separate component of stockholders’ equity. Foreign currency transaction gains and losses are included in net loss for the period. The Company may periodically have certain intercompany foreign currency transactions that are deemed to be of a long-term investment nature; exchange adjustments related to those transactions are made directly to a separate component of stockholders’ equity.
Cash and Cash Equivalents
The Company considers all highly liquid investments with an original maturity of three months or less at the date of purchase to be cash equivalents. Management determines the appropriate classification of investments at the time of purchase, and re-evaluates such determination at each balance sheet date. The Company did not have any short-term or long-term investments at December 31, 2019 or 2018.
Cash and cash equivalents primarily consist of cash on deposit with banks and amounts held in interest-bearing money market accounts. Cash equivalents are carried at cost, which approximates their fair market value.
Cash and cash equivalents as of December 31, 2019 and 2018 consist of the following:
| December 31, 2019 | ||||||||||||||||
| Description |
Contracted Maturity |
Amortized Cost | Fair Market Value |
Balance Per Balance Sheet |
||||||||||||
| Cash |
Demand | $ | 22,718 | $ | 22,718 | $ | 22,718 | |||||||||
| Money market funds |
Demand | 41 | 41 | 41 | ||||||||||||
|
|
|
|
|
|
|
|||||||||||
| Total cash and cash equivalents |
$ | 22,759 | $ | 22,759 | $ | 22,759 | ||||||||||
|
|
|
|
|
|
|
|||||||||||
F-8
Table of Contents
| December 31, 2018 | ||||||||||||||||
| Description |
Contracted Maturity |
Amortized Cost | Fair Market Value |
Balance Per Balance Sheet |
||||||||||||
| Cash |
Demand | $ | 21,007 | $ | 21,007 | $ | 21,007 | |||||||||
| Money market funds |
Demand | 8,299 | 8,299 | 8,299 | ||||||||||||
|
|
|
|
|
|
|
|||||||||||
| Total cash and cash equivalents |
$ | 29,306 | $ | 29,306 | $ | 29,306 | ||||||||||
|
|
|
|
|
|
|
|||||||||||
Disclosure of Fair Value of Financial Instruments
The carrying amounts of the Company’s financial instruments, which include cash, cash equivalents, accounts receivable, accounts payable, accrued expenses, capital lease liabilities and equipment financing, approximated their fair values at December 31, 2019 and 2018, due to the short-term nature of these instruments.
The Company has evaluated the estimated fair value of financial instruments using available market information and management’s estimates. The use of different market assumptions and/or estimation methodologies could have a significant impact on the estimated fair value amounts. See Note 6 for further discussion.
Revenue
The Company accounts for revenue in accordance with ASC Topic 606, Revenue from Contracts with Customers, which was adopted on January 1, 2018 using the modified retrospective method. For further discussion of the Company’s accounting policies related to revenue, see Note 4.
Cost of Revenue
Cost of revenue primarily consists of costs related to supporting and hosting the Company’s product offerings and delivering professional services. These costs include salaries, benefits, incentive compensation and stock-based compensation expense related to the management of the Company’s data centers, customer support team and the Company’s professional services staff, in addition to third-party service provider costs such as data center and networking expenses, allocated overhead, amortization of capitalized internal-use software development costs and intangible assets and depreciation expense.
Allowance for Doubtful Accounts
The Company offsets gross trade accounts receivable with an allowance for doubtful accounts. The allowance for doubtful accounts is the Company’s best estimate of the amount of probable credit losses in the Company’s existing accounts receivable and is based upon historical loss patterns, the number of days that billings are past due, and an evaluation of the potential risk of loss associated with specific accounts. Account balances are charged against the allowance after all means of collection have been exhausted and the potential for recovery is considered remote. Provisions for allowances for doubtful accounts are recorded in general and administrative expense.
Below is a summary of the changes in the Company’s allowance for doubtful accounts for the years ended December 31, 2019, 2018 and 2017:
| Balance at Beginning of Period |
Provision | Write-offs | Balance at End of Period |
|||||||||||||
| Year ended December 31, 2019 |
$ | 190 | $ | 1,137 | $ | (423 | ) | $ | 904 | |||||||
| Year ended December 31, 2018 |
146 | 199 | (155 | ) | 190 | |||||||||||
| Year ended December 31, 2017 |
154 | 203 | (211 | ) | 146 | |||||||||||
F-9
Table of Contents
Off-Balance Sheet Risk and Concentration of Credit Risk
The Company has no significant off-balance sheet risk, such as foreign exchange contracts, option contracts, or other foreign hedging arrangements. Financial instruments that potentially expose the Company to concentrations of credit risk consist primarily of cash, cash equivalents and trade accounts receivable. The Company maintains its cash and cash equivalents principally with accredited financial institutions of high credit standing. Although the Company deposits its cash with multiple financial institutions, its deposits, at times, may exceed federally insured limits. The Company generally has not experienced any material losses related to receivables from individual customers, or groups of customers. The Company does not require collateral. Due to these factors, no additional credit risk beyond amounts provided for collection losses is believed by management to be probable in the Company’s accounts receivable.
For the years ended December 31, 2019, 2018 and 2017, no individual customer accounted for more than 10% of total revenue. As of December 31, 2019 and 2018, no individual customer accounted for more than 10% of accounts receivable, net.
Concentration of Other Risks
The Company is dependent on certain content delivery network providers who provide digital media delivery functionality enabling the Company’s on-demand application service to function as intended for the Company’s customers and ultimate end-users. The disruption of these services could have a material adverse effect on the Company’s business, financial position, and results of operations.
Software Development Costs
Costs incurred to develop software applications used in the Company’s on-demand application services consist of (a) certain external direct costs of materials and services incurred in developing or obtaining internal-use computer software, and (b) payroll and payroll-related costs for employees who are directly associated with, and who devote time to, the project. These costs generally consist of internal labor during configuration, coding, and testing activities. Research and development costs incurred during the preliminary project stage or costs incurred for data conversion activities, training, maintenance and general and administrative or overhead costs are expensed as incurred. Capitalization begins when the preliminary project stage is complete, management, with the relevant authority, authorizes and commits to the funding of the software project, it is probable the project will be completed, the software will be used to perform the functions intended and certain functional and quality standards have been met. Qualified costs incurred during the operating stage of the Company’s software applications relating to upgrades and enhancements are capitalized to the extent it is probable that they will result in added functionality, while costs that cannot be separated between maintenance of, and minor upgrades and enhancements to, internal-use software are expensed as incurred. These capitalized costs are amortized on a straight-line basis over the expected useful life of the software, which is estimated to be three years. Capitalized internal-use software development costs are classified as “Software” within “Property and Equipment, net” in the accompanying consolidated balance sheets.
During the years ended December 31, 2019, 2018 and 2017, the Company capitalized $6,574, $3,152 and $3,239, respectively, of internal-use software development costs. The Company recorded amortization expense associated with its capitalized internal-use software development costs of $3,784, $2,962 and $1,867 for the years ended December 31, 2019, 2018 and 2017, respectively.
Property and Equipment
Property and equipment are recorded at cost and depreciated over their estimated useful lives using the straight-line method. Leasehold improvements are amortized over the shorter of the lease term or the estimated useful life of the related asset. Upon retirement or sale, the cost of assets disposed of, and the related accumulated depreciation, are removed from the accounts, and any resulting gain or loss is included in the determination of net income or loss in the period of retirement.
F-10
Table of Contents
Property and equipment consists of the following:
| Estimated Useful Life (in Years) |
December 31, | |||||||||||
| 2019 | 2018 | |||||||||||
| Computer equipment |
3 | $ | 14,807 | $ | 14,076 | |||||||
| Software |
3 - 6 | 27,882 | 21,208 | |||||||||
| Furniture and fixtures |
5 | 2,965 | 2,929 | |||||||||
| Leasehold improvements |
|
Shorter of lease term or the estimated useful life |
|
1,821 | 1,665 | |||||||
|
|
|
|
|
|||||||||
| 47,475 | 39,878 | |||||||||||
| Less accumulated depreciation and amortization |
35,389 | 30,175 | ||||||||||
|
|
|
|
|
|||||||||
| $ | 12,086 | $ | 9,703 | |||||||||
|
|
|
|
|
|||||||||
Depreciation and amortization expense, which includes amortization expense associated with capitalized internal-use software development costs, for the years ended December 31, 2019, 2018 and 2017 was $5,217, $4,479 and $4,523, respectively.
Expenditures for maintenance and repairs are charged to expense as incurred, whereas major improvements are capitalized as additions to property and equipment.
Right-of-Use Asset and Lease Liability
The Company accounts for its right-of-use assets and lease liabilities in accordance with ASC Topic 842, Leases, which was adopted on January 1, 2019 using the transition method introduced by ASU 2018-11. For further discussion of the Company’s accounting policies related to right-of-use assets and lease liabilities, see Note 7.
Long-Lived Assets
The Company reviews long-lived assets and certain identifiable intangible assets for impairment whenever events or changes in circumstances indicate that the carrying amount of an asset may not be recoverable. During this review, the Company re-evaluates the significant assumptions used in determining the original cost and estimated lives of long-lived assets. Although the assumptions may vary from asset to asset, they generally include operating results, changes in the use of the asset, cash flows, and other indicators of value. Management then determines whether the remaining useful life continues to be appropriate, or whether there has been an impairment of long-lived assets based primarily upon whether expected future undiscounted cash flows are sufficient to support the assets’ recovery. If impairment exists, the Company adjusts the carrying value of the asset to fair value, generally determined by a discounted cash flow analysis.
For the years ended December 31, 2019, 2018 and 2017, the Company has not identified any impairment of its long-lived assets.
Business Combinations
The Company records tangible and intangible assets acquired and liabilities assumed in business combinations under the purchase method of accounting. Amounts paid for each acquisition are allocated to the assets acquired and liabilities assumed based on their fair values at the date of acquisition. The Company then allocates the purchase price in excess of net tangible assets acquired to identifiable intangible assets based on detailed valuations that use information and assumptions provided by management. Any excess purchase price over the fair value of the net tangible and intangible assets acquired and liabilities assumed is allocated to goodwill. If the fair value of the assets acquired exceeds the purchase price, the excess is recognized as a gain.
F-11
Table of Contents
Significant management judgments and assumptions are required in determining the fair value of acquired assets and liabilities, particularly acquired intangible assets. The valuation of purchased intangible assets is based upon estimates of the future performance and cash flows from the acquired business. Each asset is measured at fair value from the perspective of a market participant.
If different assumptions are used, it could materially impact the purchase price allocation and adversely affect our results of operations, financial condition and cash flows.
For further discussion of the Company’s accounting policies related to business combinations, see Note 3.
Intangible Assets and Goodwill
Intangible assets that have finite lives are amortized over their estimated useful lives based on the pattern of consumption of the economic benefit or, if that pattern cannot be readily determined, on a straight-line basis and are reviewed for impairment whenever events or changes in circumstances indicate that the carrying amount of an asset may not be recoverable, as discussed above.
Goodwill is not amortized, but is evaluated for impairment annually, or whenever events or changes in circumstances indicate that the carrying value may not be recoverable. Conditions that could trigger a more frequent impairment assessment include, but are not limited to, a significant adverse change in certain agreements, significant underperformance relative to historical or projected future operating results, an economic downturn in customers’ industries, increased competition, a significant reduction in our stock price for a sustained period or a reduction of our market capitalization relative to net book value.
The Company has determined, based on its organizational structure, that it had one reporting unit as of December 31, 2019 and 2018. The Company evaluates impairment by comparing the estimated fair value of its reporting unit to its carrying value. The Company estimates fair value primarily utilizing the market approach.
The Company adopted ASU 2017-04 during the year ended December 31, 2018. The updated guidance eliminates Step 2 of the impairment test, which requires entities to calculate the implied fair value of goodwill to measure a goodwill impairment charge. Instead, entities will record an impairment charge based on the excess of a reporting unit’s carrying amount over its fair value, determined in Step 1. For the year ended December 31, 2019, the Company has not identified any impairment of its goodwill.
Comprehensive Income (Loss)
Comprehensive income (loss) is defined as the change in equity of a business enterprise during a period from transactions, other events, and circumstances from non-owner sources. Accumulated other comprehensive loss is presented separately on the consolidated balance sheets and consists entirely of cumulative foreign translation adjustments as of December 31, 2019 and 2018.
Net Loss per Share
The Company calculates basic and diluted net loss per common share by dividing the net loss by the number of common shares outstanding during the period. The Company has excluded other potentially dilutive shares, which include warrants to purchase common stock and outstanding common stock options and unvested restricted stock units, from the number of common shares outstanding as their inclusion in the computation for all
F-12
Table of Contents
periods would be anti-dilutive due to net losses incurred. The following outstanding common shares have been excluded from the computation of dilutive net loss per share as of December 31, 2019, 2018 and 2017:
| Year Ended December 31, | ||||||||||||
| 2019 | 2018 | 2017 | ||||||||||
| Options outstanding |
2,479 | 2,738 | 4,127 | |||||||||
| Restricted stock units outstanding |
3,626 | 3,034 | 2,050 | |||||||||
Income Taxes
The Company accounts for income taxes in accordance with the asset and liability method. Under this method, deferred tax assets and liabilities are recognized based on temporary differences between the financial reporting and income tax bases of assets and liabilities using statutory rates. In addition, this method requires a valuation allowance against net deferred tax assets if, based upon the available evidence, it is more likely than not that some or all of the deferred tax assets will not be realized.
The Company accounts for uncertain tax positions recognized in the consolidated financial statements by prescribing a more-likely-than-not threshold for financial statement recognition and measurement of a tax position taken or expected to be taken in a tax return. Interest and penalties, if applicable, related to uncertain tax positions would be recognized as a component of income tax expense. The Company has no recorded liabilities for uncertain tax positions as of December 31, 2019 or 2018.
Stock-Based Compensation
At December 31, 2019, the Company had five stock-based compensation plans, which are more fully described in Note 8.
The Company values its shares of common stock in connection with the issuance of stock-based equity awards using the closing price of the Company’s shares of common stock on the NASDAQ Global Market on the date of the grant. Accounting guidance requires employee stock-based payments to be accounted for under the fair value method. Under this method, the Company is required to record compensation cost based on the estimated fair value for stock-based awards granted over the requisite service periods for the individual awards, which generally equals the vesting periods. The Company uses the straight-line amortization method for recognizing stock-based compensation expense associated with equity awards to employees.
For stock options issued under the Company’s stock-based compensation plans, the fair value of each option grant is estimated on the date of grant. For service-based options, the Company recognizes compensation expense on a straight-line basis over the requisite service period of the award.
The fair value of each option grant issued under the Company’s stock-based compensation plans was estimated using the Black-Scholes option-pricing model. The expected volatility of options granted has been determined using a weighted-average of the historical volatility measures of a peer group of companies that issued options with substantially similar terms as well as the historical volatility of the Company’s own common stock. The expected life of options has been determined utilizing the “simplified method”. The simplified method is based on the average of the vesting tranches and the contractual life of each grant. The risk-free interest rate is based on a treasury instrument whose term is consistent with the expected life of the stock options. The Company has not paid, and does not anticipate paying, cash dividends on its common stock; therefore, the expected dividend yield is assumed to be zero.
F-13
Table of Contents
The weighted-average fair value of options granted during the years ended December 31, 2019, 2018 and 2017, was $4.49, $4.11 and $3.08 per share, respectively. The weighted-average assumptions utilized to determine such values are presented in the following table:
| Year Ended December 31, | ||||||||||||
| 2019 | 2018 | 2017 | ||||||||||
| Risk-free interest rate |
2.25 | % | 2.88 | % | 2.08 | % | ||||||
| Expected volatility |
44 | % | 43 | % | 42 | % | ||||||
| Expected life (in years) |
6.2 | 6.2 | 6.1 | |||||||||
| Expected dividend yield |
— | — | — | |||||||||
For restricted stock units issued under the Company’s stock-based compensation plans, the fair value of each grant is calculated based on the Company’s stock price on the date of grant. For performance-based awards with service-based vesting conditions, the Company recognizes compensation expense based upon a review of the Company’s expected achievement against the specified targets. The Company recognized $2.9 million of stock-based compensation expense relating to performance-based awards for the year ended December 31, 2019.
As of December 31, 2019, there was $22,423 of total unrecognized stock-based compensation expense related to stock-based awards that is expected to be recognized over a weighted-average period of 2.15 years. The following table summarizes stock-based compensation expense as included in the consolidated statement of operations for the years ended December 31, 2019, 2018 and 2017:
| Year Ended December 31, | ||||||||||||
| 2019 | 2018 | 2017 | ||||||||||
| Cost of subscription and support revenue |
$ | 683 | $ | 481 | $ | 439 | ||||||
| Cost of professional services and other revenue |
289 | 242 | 251 | |||||||||
| Research and development |
1,444 | 1,281 | 1,563 | |||||||||
| Sales and marketing |
2,713 | 2,377 | 2,750 | |||||||||
| General and administrative |
4,130 | 2,268 | 2,240 | |||||||||
|
|
|
|
|
|
|
|||||||
| $ | 9,259 | $ | 6,649 | $ | 7,243 | |||||||
|
|
|
|
|
|
|
|||||||
Upon the adoption of ASU 2016-09 on January 1, 2017, we have elected to recognize prospectively gross stock-based compensation expense with actual forfeitures recognized as they occur. Prior to the adoption of ASU 2016-09, we estimated forfeitures at the time of grant and revised those estimates in subsequent periods if actual forfeitures differed from estimates.
See Note 8 for a summary of the stock option and restricted stock activity under the Company’s stock-based compensation plans for the year ended December 31, 2019.
Advertising Costs
Advertising costs are charged to operations as incurred. The Company incurred advertising costs of $2,658, $2,657and $2,485 for the years ended December 31, 2019, 2018 and 2017, respectively.
Merger-related Costs
Merger-related costs consist of expenses related to mergers and acquisitions, integration costs and general corporate development activities. In 2019, merger-related costs incurred were primarily in connection with the entry into a definitive agreement in February 2019 to acquire the online video player related assets from Ooyala, Inc. and certain of its subsidiaries and costs related to the transition of Ooyala customers to the Company’s technology. The Company incurred merger-related costs of $11,447, $716 and $0 for the years ended December 31, 2019, 2018 and 2017, respectively.
F-14
Table of Contents
Recent Accounting Pronouncements and Standards
Recently Issued Accounting Pronouncements
In June 2016, the FASB issued ASU No. 2016-13, which requires measurement and recognition of expected credit losses for financial assets held. This guidance will be effective for the Company on January 1, 2020. The Company does not expect application of this guidance to have a material impact on its consolidated financial statements.
3. Business Combinations
Ooyala
On April 1, 2019, pursuant to an Asset Purchase and Sale Agreement (the “Purchase Agreement”), the Company completed its acquisition of the online video platform assets of Ooyala, Inc. and certain of its subsidiaries (“Ooyala”), a provider of cloud video technology, in exchange for common stock of the Company and cash (the “Ooyala Acquisition”). At the closing, the Company issued 1,056,763 unregistered shares of common stock of the Company valued at $8.9 million and paid $2.6 million in cash Pursuant to the Purchase Agreement, approximately $2.65 million of the cash consideration was placed into an escrow account to secure payment of any claims of indemnification for breaches or inaccuracies in the Sellers’ representations and warranties, covenants and agreements.
The Ooyala Acquisition was accounted for using the purchase method of accounting in accordance with Accounting Standards Codification 805 — Business Combinations. Accordingly, the results of operations of Ooyala have been included in the accompanying condensed consolidated financial statements since the date of acquisition. The purchase price has been allocated to the tangible and intangible assets acquired and liabilities assumed based upon the respective estimates of fair value as of the date of the Ooyala Acquisition, which are final as of December 31, 2019, and using assumptions that the Company’s management believes are reasonable given the information currently available.
The process for estimating the fair values of identifiable intangible assets and certain tangible assets requires the use of significant estimates and assumptions, including estimating future cash flows and developing appropriate discount rates. The fair value of the intangible assets has been estimated using the income approach in which the after-tax cash flows are discounted to present value. The cash flows are based on estimates used to price the transaction, and the discount rates applied were benchmarked with reference to the implied rate of return from the transaction model as well as the weighted average cost of capital.
During the year ended December 31, 2019, the Company incurred $3.4 million of costs incurred related to the closing of the Ooyala Acquisition.
The excess of the purchase price over the estimated amounts of net assets as of the effective date of the acquisition was allocated to goodwill in accordance with the accounting guidance. The factors contributing to the recognition of the amount of goodwill are based on several strategic and synergistic benefits that are expected to be realized from the Ooyala Acquisition. These benefits include the acquired workforce and with the Company’s direct sales force and larger channel coverage, the Company anticipates significant cross-selling opportunities. The goodwill is expected to be deductible for tax purposes.
F-15
Table of Contents
The total purchase price for Ooyala has been allocated as follows:
| Accounts receivable |
$ | 3,175 | ||
| Other tangible assets |
$ | 811 | ||
| Identifiable intangible assets |
$ | 9,636 | ||
| Goodwill |
$ | 4,585 | ||
| Deferred revenue |
$ | (6,633 | ) | |
| Other liabilities |
$ | (196 | ) | |
|
|
|
|||
| Total estimated purchase price |
$ | 11,378 | ||
|
|
|
The following are the identifiable intangible assets acquired and their respective useful lives, as determined based on valuations:
| Amount | Useful Life | |||||||
| Customer relationships |
$ | 8,998 | 7 | |||||
| Developed technology |
638 | 1 | ||||||
|
|
|
|||||||
| Total |
$ | 9,636 | ||||||
|
|
|
|||||||
The fair value of the intangible assets has been estimated using the income approach in which the after-tax cash flows are discounted to present value. The cash flows are based on estimates used to price the transaction, and the discount rates applied were benchmarked with reference to the implied rate of return from the transaction model as well as the weighted average cost of capital.
The estimated amortization expense for 2019 and for each of the five succeeding years and thereafter is as follows:
| Year Ending December 31, |
Amount | |||
| 2019 |
$ | 1,443 | ||
| 2020 |
1,445 | |||
| 2021 |
1,286 | |||
| 2022 |
1,285 | |||
| 2023 |
1,285 | |||
| 2024 and thereafter |
2,892 | |||
|
|
|
|||
| Total |
$ | 9,636 | ||
|
|
|
|||
Pro Forma Financial Information (Unaudited)
The unaudited financial information in the table below summarizes the combined results of operations of the Company and Ooyala, on a pro forma basis, as though the Company had acquired Ooyala at the beginning of the periods presented. The pro forma information for all periods presented also includes the effects of business combination accounting resulting from the acquisition.
| Year Ended December 31, |
||||||||
| 2019 | 2018 | |||||||
| Total revenue |
$ | 192,070 | $ | 195,293 | ||||
| Net loss |
(20,616 | ) | (16,955 | ) | ||||
| Earnings per share — basic and diluted |
(0.54 | ) | (0.46 | ) | ||||
Revenue and net loss attributable to the Ooyala Acquisition since the date of the acquisition was $17.9 million and $3.0 million, respectively, for the year ended December 31, 2019. Revenue comprised revenue
F-16
Table of Contents
recognized for customers that were acquired as part of the transaction, including customers who have since migrated onto the company’s technology. Net loss does not reflect any expenses for resources or vendors that were not acquired as part of the transaction but may have supported acquired customers.
Other Business Combinations
On August 1, 2019, pursuant to a Share Purchase Agreement (the “SPA”), the Company completed its acquisition of a company and its subsidiary (the “August Acquisition”) in exchange for common stock of the Company and cash. Consideration was comprised of: (a) 270,686 unregistered shares of common stock of the Company valued at $3.4 million, of which 40,603 were held back to secure payment of any claims of indemnification for breaches or inaccuracies in the sellers’ representations and warranties, covenants and agreements, (b) approximately $3.3 million in cash, of which $488 was held back to secure payment of any claims of indemnification for breaches or inaccuracies in the Sellers’ representations and warranties, covenants and agreements, and (c) approximately $1 million in cash for cash acquired as part of the transaction.
The August Acquisition was accounted for using the purchase method of accounting in accordance with Accounting Standards Codification 805 — Business Combinations. Accordingly, the results of operations of the acquired company have been included in the accompanying condensed consolidated financial statements since the date of acquisition. The purchase price has been allocated to the tangible and intangible assets acquired and liabilities assumed based upon the respective estimates of fair value as of the date of the August Acquisition and using assumptions that the Company’s management believes are reasonable given the information currently available.
During the year ended December 31, 2019, the Company incurred $400 of merger-related costs related to the August Acquisition.
The excess of the purchase price over the estimated amounts of net assets as of the effective date of the acquisition was allocated to goodwill in accordance with the accounting guidance. The factors contributing to the recognition of the amount of goodwill are based on several strategic and synergistic benefits that are expected to be realized from the August Acquisition. These benefits include the acquired workforce and opportunities to expand the Company’s offerings in target market segments. The goodwill is expected to be non-deductible for tax purposes.
The total purchase price for the August Acquisition has been allocated as follows:
| Cash |
$ | 981 | ||
| Accounts receivable |
$ | 393 | ||
| Other tangible assets |
$ | 210 | ||
| Identifiable intangible assets |
$ | 1,525 | ||
| Goodwill |
$ | 5,541 | ||
| Accounts payable |
$ | (177 | ) | |
| Deferred revenue |
$ | (138 | ) | |
| Accrued expenses |
$ | (322 | ) | |
| Deferred tax liability |
$ | (333 | ) | |
|
|
|
|||
| Total estimated purchase price |
$ | 7,680 | ||
|
|
|
The following are the identifiable intangible assets acquired and their respective useful lives, as determined based on the valuations:
| Amount | Useful Life | |||||||
| Developed technology |
$ | 232 | 4 | |||||
| Customer relationships |
1,293 | 4 | ||||||
|
|
|
|||||||
| Total |
$ | 1,525 | ||||||
|
|
|
|||||||
F-17
Table of Contents
The fair value of the intangible assets has been estimated using the income approach in which the after-tax cash flows are discounted to present value. The cash flows are based on estimates used to price the transaction, and the discount rates applied were benchmarked with reference to the implied rate of return from the transaction model as well as the weighted average cost of capital.
The estimated remaining amortization expense for 2019 and for each of the five succeeding years and thereafter is as follows:
| Year Ending December 31, |
Amount | |||
| 2019 |
$ | 160 | ||
| 2020 |
381 | |||
| 2021 |
381 | |||
| 2022 |
381 | |||
| 2023 |
222 | |||
| 2024 and thereafter |
— | |||
|
|
|
|||
| Total |
$ | 1,525 | ||
|
|
|
|||
Pro forma results of operations for the August Acquisition have not been presented because the effect of the acquisition is not material to the Company’s consolidated financial results. Revenue and earnings attributable to acquired operations since the date of the acquisition are included in the Company’s consolidated statements of operations.
The changes in the carrying amount of goodwill for the year ended December 31, 2019 were as follows:
| Balance as of January 1, 2019 |
$ | 50,776 | ||
| Goodwill from acquisitions |
10,126 | |||
|
|
|
|||
| Balance as of December 31, 2019 |
$ | 60,902 | ||
|
|
|
4. Revenue from Contracts with Customers
The Company primarily derives revenue from the sale of its online video platform, which enables its customers to publish and distribute video to Internet-connected devices quickly, easily and in a cost-effective and high-quality manner. Revenue is derived from three primary sources: (1) the subscription to its technology and related support; (2) hosting, bandwidth and encoding services; and (3) professional services, which include initiation, set-up and customization services.
In May 2014, the Financial Accounting Standards Board (FASB) issued ASU No. 2014-09, Revenue from Contracts with Customers (Topic 606), which modifies how all entities recognize revenue, and consolidates revenue recognition guidance into one ASC Topic (ASC Topic 606, Revenue from Contracts with Customers). The Company adopted ASC 606 on January 1, 2018 and applied the modified retrospective method of adoption with a cumulative catch-up adjustment to the opening balance of retained earnings at January 1, 2018. Under this method, the Company applied the revised guidance for the year of adoption and applied ASC Topic 605, Revenue Recognition (“ASC 605”), in the prior years. As a result, the Company applied ASC 606 only to contracts that were not yet completed as of January 1, 2018. The Company recognized a cumulative catch-up adjustment to the opening balance of accumulated deficit at the effective date for contracts that still require performance by the entity at the date of adoption. ASC 606 outlines a comprehensive five-step revenue recognition model based on the principle that an entity should recognize revenue to depict the transfer of promised goods or services to customers in an amount that reflects the consideration to which the entity expects to be entitled in exchange for those goods or services.
| 1) | Identify the contract with a customer |
F-18
Table of Contents
| 2) | Identify the performance obligations in the contract |
| 3) | Determine the transaction price |
| 4) | Allocate the transaction price to performance obligations in the contract |
| 5) | Recognize revenue when or as the Company satisfies a performance obligation |
The Company satisfies performance obligations as discussed in further detail below. Revenue is recognized at the time the related performance obligation is satisfied by transferring a promised service to a customer. The transaction price is the total amount of consideration to which the Company expects to be entitled in exchange for transferring the promised services to the customer. The Company has elected to exclude from the measurement of the transaction price all taxes assessed by a governmental authority that are both imposed on and concurrent with a specific revenue-producing transaction and collected by the Company from a customer (e.g. sales and use tax).
Disaggregation of Revenue
Subscription and Support
The Company’s subscription arrangements provide customers the right to access its hosted software applications. Customers do not have the right to take possession of the Company’s software during the hosting arrangement. Contracts for premium customers generally have a term of one year and are non-cancellable. These contracts generally provide the customer with a maximum annual level of entitlement, and provide the rate at which the customer must pay for actual usage above the annual entitlement allowance. These subscription arrangements are considered stand ready obligations that are providing a series of distinct services that are substantially the same and are transferred with the same pattern to the customer. As such, these subscription arrangements are treated as a single performance obligation and the related fees are recognized as revenue ratably over the term of the underlying arrangement.
Under ASC 605, if usage exceeded the annual allowance level for a particular customer arrangement, the associated revenue was recognized in the period that the additional usage occurred. Under ASC 606, when the transaction price includes a variable amount of consideration, an entity is required to estimate the consideration that is expected to be received for a particular customer arrangement. The Company evaluates variable consideration for usage-based fees at contract inception and re-evaluates quarterly over the course of the contract. Specifically, the Company estimates the revenue pertaining to a customer’s usage that is expected to exceed the annual entitlement allowance and allocates such revenue to the distinct service within the related contract that gives rise to the variable payment. Estimates of variable consideration include analyzing customer usage against the applicable entitlement limit at the end of each reporting period and estimating the amount and timing of additional amounts to be invoiced in connection with projected usage. Estimates of variable consideration relating to customer usage do not include amounts for which it is probable that a significant reversal will occur. Determining the amount of variable consideration to recognize as revenue involves significant judgment on the part of management and it is possible that actual revenue will deviate from estimates over the course of a customer’s committed contract term.
Contracts with customers that are month-to-month arrangements (volume customers) have a maximum monthly level of usage and provide the rate at which the customer must pay for actual usage above the monthly allowable usage. The monthly volume subscription and support and usage fees are recognized as revenue during the related period of performance. Contracts with customers that are invoiced on a pay-as-you-go basis, where there is no monthly or annual commitment for usage, provide the rate at which the customer must pay for actual usage for a particular period. Fees that are invoiced on a pay-as-you-go basis are recognized as revenue during the period of performance.
F-19
Table of Contents
Professional Services and Other Revenue
Professional services and other revenue consist of services such as implementation, software customizations and project management for customers who subscribe to our premium editions. These arrangements are priced either on a fixed fee basis with a portion due upon contract signing and the remainder due when the related services have been completed, or on a time and materials basis. Professional services and other revenue sold on a stand-alone basis are recognized as the services are performed, subject to any refund or other obligation.
Contracts with Multiple Performance Obligations
The Company periodically enters into multiple-element service arrangements that include platform subscription fees, support fees, and, in certain cases, other professional services. These contracts include multiple promises that the Company evaluates to determine if the promises are separate performance obligations. Performance obligations are identified based on services to be transferred to a customer that are both capable of being distinct and are distinct within the context of the contract. Once the Company determines the performance obligations, the Company determines the transaction price, which includes estimating the amount of variable consideration to be included in the transaction price, if any. The Company then allocates the transaction price to each performance obligation in the contract based on a relative stand-alone selling price method. The transaction price post allocation is recognized as revenue as the related performance obligation is satisfied.
Costs to Obtain a Contract
Commissions are paid to internal sales representatives as compensation for obtaining contracts. Under the new guidance, the Company capitalizes commissions that are incremental, as a result of costs incurred to obtain a customer contract, if those costs are not within the scope of another topic within the accounting literature and meet the specified criteria. Assets recognized for costs to obtain a contract are amortized over the period of performance for the underlying customer contracts. The commission expense on contracts with new customers was previously recorded over the respective contract term. Under the new guidance, the commission expense on contracts with new customers will be recorded over the average life of a customer given the commission amount associated with sales to new customers is not commensurate with the commission amount associated with the contract renewal for those same customers. The commission amount associated with the renewal of a contract in addition to any commission amount related to incremental sales was previously recorded as expense in the quarter the commission was earned; however, under ASC 606 these commission amounts are recorded as expense over the term of the renewed contract. These assets are periodically assessed for impairment.
F-20
Table of Contents
Financial Statement Impact of Adoption ASC 606
The cumulative effect of applying the new guidance to all contracts with customers that were not completed as of January 1, 2018 was recorded as an adjustment to accumulated deficit as of the adoption date. As a result of applying the modified retrospective method to adopt the new revenue guidance, the following adjustments were made on the condensed consolidated balance sheet as of January 1, 2018.
| As Reported | Adjustments | Adjusted | ||||||||||||||
| December 31, 2017 |
Subscription and Support Revenue |
Costs to Obtain a Contract |
January 1, 2018 |
|||||||||||||
| Assets |
||||||||||||||||
| Current assets: |
||||||||||||||||
| Cash and cash equivalents |
$ | 26,132 | $ | 26,132 | ||||||||||||
| Accounts receivable, net |
25,236 | 926 | 26,162 | |||||||||||||
| Prepaid expenses |
3,991 | 3,991 | ||||||||||||||
| Other current assets |
3,045 | 1,861 | 3,384 | 8,290 | ||||||||||||
|
|
|
|
|
|
|
|
|
|||||||||
| Total current assets |
58,404 | 2,787 | 3,384 | 64,575 | ||||||||||||
| Property and equipment, net |
9,143 | 9,143 | ||||||||||||||
| Intangible assets, net |
8,236 | 8,236 | ||||||||||||||
| Goodwill |
50,776 | 50,776 | ||||||||||||||
| Deferred tax asset |
87 | 87 | ||||||||||||||
| Other assets |
969 | 978 | 1,947 | |||||||||||||
|
|
|
|
|
|
|
|||||||||||
| Total assets |
$ | 127,615 | $ | 2,787 | $ | 4,362 | $ | 134,764 | ||||||||
|
|
|
|
|
|
|
|
|
|||||||||
| Liabilities and stockholders’ equity |
||||||||||||||||
| Current liabilities: |
||||||||||||||||
| Accounts payable |
$ | 6,142 | $ | 6,142 | ||||||||||||
| Accrued expenses |
13,621 | 13,621 | ||||||||||||||
| Capital lease liability |
228 | 228 | ||||||||||||||
| Equipment financing |
26 | 26 | ||||||||||||||
| Deferred revenue |
39,370 | 1,429 | 40,799 | |||||||||||||
|
|
|
|
|
|
|
|
|
|||||||||
| Total current liabilities |
59,387 | 1,429 | — | 60,816 | ||||||||||||
| Deferred revenue, net of current portion |
244 | 115 | 359 | |||||||||||||
| Other liabilities |
1,228 | 1,228 | ||||||||||||||
|
|
|
|
|
|
|
|
|
|||||||||
| Total liabilities |
60,859 | 1,544 | — | 62,403 | ||||||||||||
| Commitments and contingencies |
||||||||||||||||
| Stockholders’ equity: |
||||||||||||||||
| Undesignated preferred stock |
— | — | ||||||||||||||
| Common stock |
35 | 35 | ||||||||||||||
| Additional paid-in capital |
238,700 | 238,700 | ||||||||||||||
| Treasury stock |
(871 | ) | (871 | ) | ||||||||||||
| Accumulated other comprehensive loss |
(809 | ) | (809 | ) | ||||||||||||
| Accumulated deficit |
(170,299 | ) | 1,243 | 4,362 | (164,694 | ) | ||||||||||
|
|
|
|
|
|
|
|
|
|||||||||
| Total stockholders’ equity |
66,756 | 1,243 | 4,362 | 72,361 | ||||||||||||
|
|
|
|
|
|
|
|
|
|||||||||
| Total liabilities and stockholders’ equity |
$ | 127,615 | $ | 2,787 | $ | 4,362 | $ | 134,764 | ||||||||
|
|
|
|
|
|
|
|
|
|||||||||
Subscription and Support
Under ASC 606, the Company estimates the variable consideration to be received and recognizes those amounts, subject to constraint, as the Company satisfies its performance obligation. In conjunction with the
F-21
Table of Contents
January 1, 2018 adoption of ASC 606, the Company reduced accumulated deficit by $1,243 reflecting the recognition of revenue primarily relating to variable consideration, for contracts that still require performance by the entity at the date of adoption.
Costs to Obtain a Contract
Under the new guidance, the commission expense on contracts with new customers will be recorded over the average life of a customer given the commission amount associated with sales to new customers is not commensurate with the commission amount associated with the contract renewal for those same customers. The commission amount associated with the renewal of a contract in addition to any related incremental sale is recorded as expense over the term of the renewed contract. The net impact of these changes resulted in a $4,362 reduction to accumulated deficit for contracts that still require performance by the Company at the date of adoption.
Income Taxes
The adoption of ASC 606 primarily resulted in an acceleration of revenue and the reduction of expense as of December 31, 2017, which in turn generated additional deferred tax liabilities. As the Company fully reserves its net deferred tax assets in the jurisdictions impacted by the adoption of ASC 606, this impact was offset by a corresponding reduction to the valuation allowance.
The following summarizes the opening and closing balances of receivables, contract assets and contract liabilities from contracts with customers.
| Accounts Receivable, net |
Contract Assets (current) |
Deferred Revenue (current) |
Deferred Revenue (non-current) |
Total Deferred Revenue |
||||||||||||||||
| Balance at December 31, 2018 |
$ | 23,264 | $ | 1,640 | $ | 39,846 | $ | 146 | $ | 39,992 | ||||||||||
| Balance at December 31, 2019 |
31,181 | 1,871 | 49,260 | 299 | 49,559 | |||||||||||||||
Revenue recognized during the year ended December 31, 2019 from amounts included in deferred revenue at the beginning of the period was approximately $39.6 million. During the year ended December 31, 2019, the Company did not recognize revenue from performance obligations satisfied or partially satisfied in previous periods.
The assets recognized for costs to obtain a contract were $5.9 million and $5.9 million as of December 31, 2019 and December 31, 2018, respectively. Amortization expense recognized for costs to obtain a contract was $7.3 million and $7.2 million during the year ended December 31, 2019 and December 31, 2018, respectively.
Transaction Price Allocated to Future Performance Obligations
As of December 31, 2019, the total aggregate transaction price allocated to the unsatisfied performance obligations for subscription and support contracts was approximately $128.9 million, of which approximately $100.6 million is expected to be recognized over the next 12 months. The Company expects to recognize substantially all of the remaining unsatisfied performance obligations by December 2022.
F-22
Table of Contents
5. Intangible Assets and Goodwill
Finite-lived intangible assets consist of the following as of December 31, 2019:
| Description |
Weighted Average Estimated Useful Life (in years) |
Gross Carrying Value |
Accumulated Amortization |
Net Carrying Value |
||||||||||||
| Developed technology |
7 | $ | 16,154 | $ | 12,714 | $ | 3,440 | |||||||||
| Customer relationships |
9 | 15,487 | 5,052 | 10,435 | ||||||||||||
| Non-compete agreements |
3 | 1,912 | 1,912 | — | ||||||||||||
| Tradename |
3 | 368 | 368 | — | ||||||||||||
|
|
|
|
|
|
|
|||||||||||
| Total |
$ | 33,921 | $ | 20,046 | $ | 13,875 | ||||||||||
|
|
|
|
|
|
|
|||||||||||
Finite-lived intangible assets consist of the following as of December 31, 2018:
| Description |
Weighted Average Estimated Useful Life (in years) |
Gross Carrying Value |
Accumulated Amortization |
Net Carrying Value |
||||||||||||
| Developed technology |
7 | $ | 14,223 | $ | 11,082 | $ | 3,141 | |||||||||
| Customer relationships |
11 | 6,257 | 3,479 | 2,778 | ||||||||||||
| Non-compete agreements |
3 | 1,912 | 1,912 | — | ||||||||||||
| Tradename |
3 | 368 | 368 | — | ||||||||||||
|
|
|
|
|
|
|
|||||||||||
| Total |
$ | 22,760 | $ | 16,841 | $ | 5,919 | ||||||||||
|
|
|
|
|
|
|
|||||||||||
The following table summarizes amortization expense related to intangible assets for the years ended December 31, 2019, 2018 and 2017:
| Year Ended December 31, | ||||||||||||
| 2019 | 2018 | 2017 | ||||||||||
| Cost of subscription and support revenue |
$ | 1,621 | $ | 1,651 | $ | 2,031 | ||||||
| Research and development |
— | — | 11 | |||||||||
| Sales and marketing |
1,584 | 666 | 692 | |||||||||
|
|
|
|
|
|
|
|||||||
| $ | 3,205 | $ | 2,317 | $ | 2,734 | |||||||
|
|
|
|
|
|
|
|||||||
The estimated remaining amortization expense for each of the five succeeding years and thereafter is as follows:
| Year Ending December 31, |
Amount | |||
| 2020 |
$ | 3,410 | ||
| 2021 |
2,994 | |||
| 2022 |
2,037 | |||
| 2023 |
1,793 | |||
| 2024 |
1,571 | |||
| 2025 and thereafter |
2,070 | |||
|
|
|
|||
| Total |
$ | 13,875 | ||
|
|
|
|||
The carrying amount of goodwill was $60,902 and 50,776 as of December 31, 2019 and 2018, respectively.
F-23
Table of Contents
6. Fair Value Measurements
ASC 820, Fair Value Measurements and Disclosures, establishes a three-level valuation hierarchy for instruments measured at fair value that distinguishes between assumptions based on market data (observable inputs) and the Company’s own assumptions (unobservable inputs). Observable inputs are inputs that market participants would use in pricing the asset or liability based on market data obtained from sources independent of the Company. Unobservable inputs are inputs that reflect the Company’s assumptions about the inputs that market participants would use in pricing the asset or liability, and are developed based on the best information available in the circumstances.
ASC 820 identifies fair value as an exit price, representing the price that would be received to sell an asset or paid to transfer a liability in an orderly transaction between market participants based on the highest and best use of the asset or liability. As such, fair value is a market-based measurement that should be determined based on assumptions that market participants would use in pricing an asset or liability. The Company uses valuation techniques to measure fair value that maximize the use of observable inputs and minimize the use of unobservable inputs. These inputs are prioritized as follows:
| • | Level 1: Observable inputs, such as quoted prices for identical assets or liabilities in active markets; |
| • | Level 2: Inputs, other than the quoted prices in active markets, that are observable either directly or indirectly, such as quoted prices for similar assets or liabilities, or market-corroborated inputs; and |
| • | Level 3: Unobservable inputs for which there is little or no market data which require the reporting entity to develop its own assumptions about how market participants would price the assets or liabilities. |
The valuation techniques that may be used to measure fair value are as follows:
A. Market approach — Uses prices and other relevant information generated by market transactions involving identical or comparable assets or liabilities.
B. Income approach — Uses valuation techniques to convert future amounts to a single present amount based on current market expectations about those future amounts, including present value techniques, option-pricing models, and excess earnings method.
C. Cost approach — Based on the amount that currently would be required to replace the service capacity of an asset (replacement cost).
The following tables set forth the Company’s financial instruments carried at fair value using the lowest level of input as of December 31, 2019 and 2018:
| December 31, 2019 | ||||||||||||||||
| Quoted Prices in Active Markets for Identical Items (Level 1) |
Significant Other Observable Inputs (Level 2) |
Significant Unobservable Inputs (Level 3) |
Total | |||||||||||||
| Assets: |
||||||||||||||||
| Money market funds |
$ | 41 | $ | — | $ | — | $ | 41 | ||||||||
|
|
|
|
|
|
|
|
|
|||||||||
| Total assets |
$ | 41 | $ | — | $ | — | $ | 41 | ||||||||
|
|
|
|
|
|
|
|
|
|||||||||
F-24
Table of Contents
| December 31, 2018 | ||||||||||||||||
| Quoted Prices in Active Markets for Identical Items (Level 1) |
Significant Other Observable Inputs (Level 2) |
Significant Unobservable Inputs (Level 3) |
Total | |||||||||||||
| Assets: |
||||||||||||||||
| Money market funds |
$ | 8,299 | $ | — | $ | — | $ | 8,299 | ||||||||
|
|
|
|
|
|
|
|
|
|||||||||
| Total assets |
$ | 8,299 | $ | — | $ | — | $ | 8,299 | ||||||||
|
|
|
|
|
|
|
|
|
|||||||||
Realized gains and losses from sales of the Company’s investments are included in “Other income (expense), net”.
The Company measures eligible assets and liabilities at fair value, with changes in value recognized in earnings. Fair value treatment may be elected either upon initial recognition of an eligible asset or liability or, for an existing asset or liability, if an event triggers a new basis of accounting. The Company did not elect to remeasure any of its existing financial assets or liabilities, and did not elect the fair value option for any financial assets and liabilities transacted in the years ended December 31, 2019 or 2018.
7. Right-of-Use Asset and Lease Liability
Effective January 1, 2019, the Company adopted ASC 842, which replaced the existing guidance for leases using the transition method introduced by ASU 2018-11, which adjusts the January 1, 2019 balance for the cumulative effects of the change in accounting.
Under ASC 842, a right-of-use asset and lease liability is recorded for all leases and the statement of operations reflects the lease expense for operating leases and amortization/interest expense for financing leases. The balance sheet amount recorded for existing leases at the date of adoption of ASC 842 is calculated using the applicable incremental borrowing rate at the date of adoption. The adoption of the new standard resulted in the recording of right-of-use assets and lease liabilities of $19.6 million and $20.9 million, respectively, as of January 1, 2019. Additionally, the Company reversed its deferred rent liability of $1.3 million as a result of the adoption. The adoption of the lease standard did not result in a cumulative catch-up adjustment to the opening balance of retained earnings.
The new standard provided various practical expedients, which were assessed to determine the ultimate impact of the new standard upon adoption. The Company elected the package of practical expedients, which permits the Company to not reassess (1) whether any expired or existing contracts are or contain leases, (2) the lease classification for any expired or existing leases and (3) any initial direct costs for any existing leases as of the effective date. The Company also elected the practical expedients to not apply the recognition requirements in the standard to a lease that at commencement date has a lease term of twelve months or less and does not contain a purchase option that it is reasonably certain to exercise and to not separate lease and related non-lease components.
The Company leases its facilities under non-cancelable operating leases. Right-of-use assets represent the right to use an underlying asset for the lease term, and lease liabilities represent the obligation to make lease payments arising from the lease. Right-of-use assets and lease liabilities are recognized at the commencement date based on the present value of lease payments over the lease term. As most of the Company’s leases do not provide an implicit rate, the Company uses its incremental borrowing rate based on the information available at commencement date in determining the present value of lease payments. Many of the Company’s lessee agreements include options to extend the lease, which are not included in the minimum lease terms unless they are reasonably certain to be exercised.
F-25
Table of Contents
The Company’s rent expense was $7.9 million, $7.9 million and $6.6 million for the years ended 2019, 2018 and 2017, respectively.
The Company entered into three operating lease agreements in the current year, resulting in the recording of an initial liability and corresponding right-of-use asset of $3.5 million.
The weighted-average remaining non-cancelable lease term for our operating leases was three years at December 31, 2019. The weighted-average discount rate was 4.3% at December 31, 2019.
The Company’s operating leases expire at various dates through 2025. The following shows the undiscounted cash flows for the remaining years under operating leases at December 31, 2019:
| Year Ending December 31, |
Operating Lease Commitments |
|||
| 2020 |
$ | 6,786 | ||
| 2021 |
6,186 | |||
| 2022 |
2,840 | |||
| 2023 |
1,644 | |||
| 2024 |
1,525 | |||
| 2025 and thereafter |
210 | |||
|
|
|
|||
| Total operating lease commitments |
19,191 | |||
| Less imputed interest |
(1,316 | ) | ||
|
|
|
|||
| Total lease liabilities |
$ | 17,875 | ||
|
|
|
|||
Legal Matters
The Company, from time to time, is party to litigation arising in the ordinary course of business. Management does not believe that the outcome of these claims will have a material adverse effect on the consolidated financial position, results of operations or cash flows of the Company based on the status of proceedings at this time.
Guarantees and Indemnification Obligations
The Company typically enters into indemnification agreements in the ordinary course of business. Pursuant to these agreements, the Company indemnifies and agrees to reimburse the indemnified party for losses and costs incurred by the indemnified party, generally the Company’s customers, in connection with patent, copyright, trade secret, or other intellectual property or personal right infringement claims by third parties with respect to the Company’s technology. The term of these indemnification agreements is generally perpetual after execution of the agreement. Based on when customers first subscribe for the Company’s service, the maximum potential amount of future payments the Company could be required to make under certain of these indemnification agreements is unlimited, however, more recently the Company has typically limited the maximum potential value of such potential future payments in relation to the value of the contract. Based on historical experience and information known as of December 31, 2019, the Company has not incurred any costs for the above guarantees and indemnities. The Company has received requests for indemnification from customers in connection with patent infringement suits brought against the customer by a third party. To date, the Company has not agreed that the requested indemnification is required by the Company’s contract with any such customer.
In certain circumstances, the Company warrants that its products and services will perform in all material respects in accordance with its standard published specification documentation in effect at the time of delivery of the licensed products and services to the customer for the warranty period of the product or service. To date, the Company has not incurred significant expense under its warranties and, as a result, the Company believes the estimated fair value of these agreements is immaterial.
F-26
Table of Contents
8. Stockholders’ Equity
Common Stock
Common stockholders are entitled to one vote per share. Holders of common stock are entitled to receive dividends, when and if declared by the Board.
Treasury Stock
The Company has recorded 135,000 shares as treasury stock as of December 31, 2019 and 2018.
Equity Incentive Plans
At December 31, 2019, the Company had five stock-based compensation plans, the Amended and Restated 2004 Stock Option and Incentive Plan (the 2004 Plan), the 2012 Stock Incentive Plan (the 2012 Plan), the Brightcove Inc. 2012 RSU Inducement Plan (the RSU Plan), the Brightcove Inc. 2014 Stock Option Inducement Plan (the 2014 Stock Inducement Plan), and the 2018 Inducement Plan (the 2018 plan). The 2004 Plan and the 2012 Plan provided for the issuance of incentive and non-qualified stock options, restricted stock, and other equity awards to the Company’s employees, officers, directors, consultants and advisors. In conjunction with the effectiveness of the 2012 Plan, the Board voted that no further stock options or other equity-based awards may be granted under the 2004 Plan.
The number of shares reserved and available for issuance under the 2012 Plan automatically increases each January 1, beginning in 2013, by 4% of the outstanding number of shares of the Company’s common stock on the immediately preceding December 31 or such lesser number of shares as determined by the Company’s compensation committee subject to an overall overhang limit of 30%. This number is subject to adjustment in the event of a stock split, stock dividend or other change in the Company’s capitalization.
In 2012, the Company adopted the RSU Plan in connection with the acquisition of Zencoder. The restricted stock units were settled in shares of the Company’s common stock upon vesting.
In 2014, the Company adopted the 2014 Stock Inducement Plan in connection with the Unicorn asset purchase agreement.
Effective April 11, 2018, the Company adopted the 2018 Plan. The 2018 Plan provides for the issuance of stock options and restricted stock units to the Company’s Chief Executive Officer (“CEO”).
During 2019 and 2018, the Company granted an aggregate of 641,000 and 1,169,000 restricted stock units, respectively, to certain key executives, which contain both performance-based and service-based vesting conditions. The Company measures compensation expense for these performance-based awards based upon a review of the Company’s expected achievement against specified financial performance targets. Compensation cost is recognized on a ratable basis over the requisite service period for each series of grants to the extent management has deemed that such awards are probable of vesting based upon the expected achievement against the specified targets. On a periodic basis, management reviews the Company’s expected performance and adjusts the compensation cost, if needed, at such time. The Company determined that a portion of the performance-based restricted stock units are probable of vesting in the first quarter of 2020. As such, the Company recognized $2.9 million of stock-based compensation expense relating to performance-based awards for the year ended December 31, 2019.
F-27
Table of Contents
The following is a summary of the stock option activity for all stock option plans during the year ended December 31, 2019:
| Number of Shares |
Weighted-Average Exercise Price |
Weighted-Average Remaining Contractual Term (In Years) |
Aggregate Intrinsic Value (1) |
|||||||||||||
| Outstanding at December 31, 2018 |
2,737,655 | $ | 8.57 | |||||||||||||
| Granted |
770,038 | 9.89 | ||||||||||||||
| Exercised |
(466,110 | ) | 7.45 | $ | 1,286 | |||||||||||
| Cancelled |
(562,160 | ) | 9.57 | |||||||||||||
|
|
|
|||||||||||||||
| Outstanding at December 31, 2019 |
2,479,423 | $ | 8.96 | 7.24 | $ | 1,558 | ||||||||||
|
|
|
|||||||||||||||
| Exercisable at December 31, 2019 |
1,117,747 | $ | 8.32 | 5.37 | $ | 1,291 | ||||||||||
|
|
|
|||||||||||||||
| (1) | The aggregate intrinsic value was calculated based on the positive difference between the estimated fair value of the Company’s common stock on December 31, 2019 of $8.69 per share, or the date of exercise, as appropriate, and the exercise price of the underlying options. |
The aggregate intrinsic value for options exercised during the years ended December 31, 2018 and 2017 was $4,897 and $1,243, respectively.
The Company has entered into restricted stock unit (RSU) agreements with certain of its employees pursuant to the 2012 Plan and the RSU Plan. Vesting occurs periodically at specified time intervals, ranging from three months to four years, and in specified percentages. Upon vesting, the holder will receive one share of the Company’s common stock for each unit vested.
The following table summarizes the RSU activity during the year ended December 31, 2019:
| Shares | Weighted Average Grant Date Fair Value |
|||||||
| Unvested by December 31, 2018 |
3,033,582 | $ | 8.07 | |||||
| Granted |
2,032,072 | 10.59 | ||||||
| Vested and issued |
(537,362 | ) | 7.91 | |||||
| Cancelled |
(901,928 | ) | 8.45 | |||||
|
|
|
|
|
|||||
| Unvested by December 31, 2019 |
3,626,364 | $ | 9.03 | |||||
|
|
|
|
|
|||||
The aggregate fair value of vested and issued RSUs for the years ended December 31, 2019, 2018 and 2017 was $5.9 million, $5.5 million and $4.2 million, respectively.
Common Stock Reserved for Future Issuance
At December 31, 2019, the Company has reserved the following shares of common stock for future issuance:
| December 31, 2019 |
||||
| Common stock options outstanding |
2,479,423 | |||
| Restricted stock unit awards outstanding |
3,626,364 | |||
| Shares available for issuance under all stock-based compensation plans |
2,136,689 | |||
|
|
|
|||
| Total shares of authorized common stock reserved for future issuance |
8,242,476 | |||
|
|
|
|||
F-28
Table of Contents
9. Income Taxes
Loss before the provision for income taxes consists of the following:
| Year Ended December 31, | ||||||||||||
| 2019 | 2018 | 2017 | ||||||||||
| Domestic |
$ | (23,388 | ) | $ | (15,026 | ) | $ | (20,528 | ) | |||
| Foreign |
2,045 | 1,599 | 1,379 | |||||||||
|
|
|
|
|
|
|
|||||||
| Total |
$ | (21,343 | ) | $ | (13,427 | ) | $ | (19,149 | ) | |||
|
|
|
|
|
|
|
|||||||
The provision for income taxes in the accompanying consolidated financial statements consists of the following:
| Year Ended December 31, | ||||||||||||
| 2019 | 2018 | 2017 | ||||||||||
| Current provision: |
||||||||||||
| Federal |
$ | — | $ | — | $ | — | ||||||
| State |
18 | 19 | 21 | |||||||||
| Foreign |
626 | 464 | 311 | |||||||||
|
|
|
|
|
|
|
|||||||
| Total current |
644 | 483 | 332 | |||||||||
|
|
|
|
|
|
|
|||||||
| Deferred (benefit): |
||||||||||||
| Federal |
7 | — | — | |||||||||
| State |
8 | — | — | |||||||||
| Foreign |
(99 | ) | 118 | 38 | ||||||||
|
|
|
|
|
|
|
|||||||
| Total deferred |
(84 | ) | 118 | 38 | ||||||||
|
|
|
|
|
|
|
|||||||
| Total provision |
$ | 560 | $ | 601 | $ | 370 | ||||||
|
|
|
|
|
|
|
|||||||
A reconciliation of the U.S. federal statutory rate to the Company’s effective tax rate is as follows:
| Year Ended December 31, | ||||||||||||
| 2019 | 2018 | 2017 | ||||||||||
| Tax at statutory rates |
(21.0 | )% | (21.0 | )% | (34.0 | )% | ||||||
| State income taxes |
(4.2 | ) | (5.5 | ) | (4.1 | ) | ||||||
| Change in tax rate |
(0.1 | ) | — | 103.9 | ||||||||
| Permanent differences |
5.0 | 7.0 | 7.1 | |||||||||
| Foreign rate differential |
0.7 | 1.4 | (0.7 | ) | ||||||||
| Research and development credits |
(4.4 | ) | (6.1 | ) | (3.7 | ) | ||||||
| Change in valuation allowance |
26.8 | 29.2 | (66.3 | ) | ||||||||
| Other, net |
(0.2 | ) | (0.5 | ) | (0.3 | ) | ||||||
|
|
|
|
|
|
|
|||||||
| Effective tax rate |
2.6 | % | 4.5 | % | 1.9 | % | ||||||
|
|
|
|
|
|
|
|||||||
F-29
Table of Contents
The income tax effect of each type of temporary difference and carryforward as of December 31, 2019 and 2018 is as follows:
| As of December 31, | ||||||||
| 2019 | 2018 | |||||||
| Deferred tax assets: |
||||||||
| Net operating loss carry-forwards |
$ | 43,886 | $ | 41,440 | ||||
| Tax credit carry-forwards |
11,602 | 10,327 | ||||||
| Stock-based compensation |
1,364 | 974 | ||||||
| Fixed Assets |
213 | 179 | ||||||
| Account receivable reserves |
420 | 136 | ||||||
| Accrued compensation |
1,026 | 910 | ||||||
| Lease Liability |
4,005 | — | ||||||
| Capitalized start-up costs |
46 | 92 | ||||||
| Other temporary differences |
1,479 | 325 | ||||||
|
|
|
|
|
|||||
| Total deferred tax assets |
64,041 | 54,383 | ||||||
| Deferred tax liabilities: |
||||||||
| Other deferred tax liabilities |
(1,422 | ) | (1,520 | ) | ||||
| ROU Asset |
(3,951 | ) | — | |||||
| Intangible assets |
(3,435 | ) | (3,100 | ) | ||||
|
|
|
|
|
|||||
| Total deferred tax liabilities |
(8,808 | ) | (4,620 | ) | ||||
|
|
|
|
|
|||||
| Valuation allowance |
(55,507 | ) | (49,791 | ) | ||||
|
|
|
|
|
|||||
| Net deferred tax asset (liability) |
$ | (274 | ) | $ | (28 | ) | ||
|
|
|
|
|
|||||
The Company is required to compute income tax expense in each jurisdiction in which it operates. This process requires the Company to project its current tax liability and estimate its deferred tax assets and liabilities, including net operating loss (NOL) and tax credit carry-forwards. In assessing the ability to realize the net deferred tax assets, management considers whether it is more likely than not that some portion or all of the net deferred tax assets will not be realized.
The Company has provided a valuation allowance against substantially all of its remaining U.S. net deferred tax assets as of December 31, 2019 and all of its net deferred tax assets as of December 31, 2018, as based upon the level of historical U.S. losses and future projections over the period in which the net deferred tax assets are deductible, at this time, management believes it is more likely than not that the Company will not realize the benefits of these deductible differences. The increase in the valuation allowance from 2018 to 2019 of $5.7 million principally relates to the current year taxable loss. The Company maintains net deferred tax liabilities for temporary differences related to its foreign subsidiaries.
As of December 31, 2019, the Company had federal net operating losses of approximately $185.6 million, of which $161.8 million are available to offset future taxable income, if any, through 2037 and $23.8 million which are available to offset future taxable income indefinitely. As of December 31, 2019, the Company had state net operating losses of approximately $84.1 million, of which $82.4 million are available to offset future taxable income, if any, through 2039 and $1.7 million which are available to offset future taxable income indefinitely. The Company also had federal and state research and development tax credits of $7.8 million and $4.8 million, respectively, which expire in various amounts through 2039. The net operating loss and tax credit amounts are subject to annual limitations under Section 382 change of ownership rules under the U.S. Internal Revenue Code of 1986, as amended. This could limit the amount of tax attributes that can be utilized annually to offset future taxable income or tax liabilities. The amount of the annual limitation is determined based on the value of the Company immediately prior to the ownership change. Subsequent ownership changes may further affect the limitation in future years. The Company has not conducted an assessment to determine whether there
F-30
Table of Contents
may have been a Section 382 ownership change from June 30, 2014, the date of the most recent completed study, through December 31, 2019. If a change in ownership were to have occurred during that period, and resulted in the restriction of net operating loss and tax credit carryforwards, the reduction in the related deferred tax asset would be offset with a corresponding reduction in the valuation allowance.
On January 1, 2009, the Company adopted the provision for uncertain tax positions under ASC 740, Income Taxes. The adoption did not have an impact on the Company’s retained earnings balance. At December 31, 2019 and 2018, the Company had no recorded liabilities for uncertain tax positions.
At December 31, 2019 and 2018, the Company had no accrued interest or penalties related to uncertain tax positions.
The Company files income tax returns in the U.S. federal tax jurisdiction, various state and various foreign jurisdictions. The Company is currently open to examination under the statute of limitations by the Internal Revenue Service and state jurisdictions for the tax years ended 2016 through 2019. Since the Company is in a U.S. loss carryforward position, carryforward tax attributes generated in prior years may still be adjusted upon future examination if they have or will be used in a future period. Additionally, certain non-U.S. jurisdictions are no longer subject for income tax examinations by authorities for tax years before 2014.
On December 22, 2017, the Tax Cuts and Jobs Act (the “Act”) was enacted in the United States. The Act reduces the U.S. federal corporate tax rate from 34% to 21%, requires companies to pay a one-time transition tax on earnings of certain foreign subsidiaries that were previously tax deferred and creates new taxes on certain foreign sourced earnings. In December 2017, the SEC issued SAB 118, which directs taxpayers to consider the impact of the U.S. legislation as “provisional” when it does not have the necessary information available, prepared or analyzed (including computations) in reasonable detail to complete its accounting for the change in tax law.
As of December 31, 2018, the Company had completed its accounting for all of the tax effects of the enactment of the Act, including the effects on its existing deferred tax balances and the one-time transition tax. The Company had not recognized any material adjustment to the provisional tax expense estimate previously recorded related to the Act.
No additional U.S. income taxes or foreign withholding taxes have been provided for any additional outside basis differences inherent in the Company’s foreign entities as these amounts continue to be indefinitely reinvested in foreign operations based on management’s current intentions. Determining the amount of unrecognized deferred tax liability related to any remaining undistributed foreign earnings not subject to the transition tax and additional outside basis difference in these entities (i.e., basis difference in excess of that subject to the one-time transition tax) is not practicable.
10. Debt
On December 14, 2018, the Company entered into an amended and restated loan and security agreement with a lender (the “Loan Agreement”) providing for up to a $30.0 million asset based line of credit (the “Line of Credit”). Under the Line of Credit, the Company can borrow up to $30.0 million. Borrowings under the Line of Credit are secured by substantially all of the Company’s assets, excluding its intellectual property. Outstanding amounts under the Line of Credit accrue interest at a rate as follows: (i) for prime rate advances, the greater of (A) the prime rate and (B) 4%, and (ii) for LIBOR advances, the greater of (A) the LIBOR rate plus 225 basis points and (B) 4%. Under the Loan Agreement, the Company must comply with certain financial covenants, including maintaining a minimum asset coverage ratio. If the outstanding principal during any month is at least $15.0 million, the Company must also maintain a minimum net income threshold based on non-GAAP operating measures. Failure to comply with these covenants, or the occurrence of an event of default, could permit the lenders under the Line of Credit to declare all amounts borrowed under the Line of Credit, together with accrued interest and fees, to be immediately due and payable. The Line of Credit agreement will expire on December 14,
F-31
Table of Contents
2021. The Company was in compliance with all covenants under the Line of Credit as of December 31, 2019 and there were no borrowings outstanding as of December 31, 2019.
11. Accrued Expenses
Accrued expenses consist of the following:
| December 31, | ||||||||
| 2019 | 2018 | |||||||
| Accrued payroll and related benefits |
$ | 7,195 | $ | 4,777 | ||||
| Accrued sales and other taxes |
2,323 | 1,639 | ||||||
| Accrued professional fees and outside contractors |
3,638 | 1,253 | ||||||
| Accrued content delivery |
3,821 | 2,979 | ||||||
| Accrued other liabilities |
3,948 | 3,334 | ||||||
|
|
|
|
|
|||||
| Total |
$ | 20,925 | $ | 13,982 | ||||
|
|
|
|
|
|||||
12. Segment Information
Disclosure requirements about segments of an enterprise and related information establishes standards for reporting information regarding operating segments in annual financial statements and requires selected information of those segments to be presented in interim financial reports issued to stockholders. Operating segments are identified as components of an enterprise about which separate discrete financial information is available for evaluation by the chief operating decision-maker, or decision-making group, in making decisions on how to allocate resources and assess performance. The Company’s chief decision maker is its chief executive officer. The Company and the chief decision maker view the Company’s operations and manage its business as one operating segment.
Geographic Data
Total revenue to unaffiliated customers by geographic area, based on the location of the customer, was as follows:
| Year Ended December 31, | ||||||||||||
| 2019 | 2018 | 2017 | ||||||||||
| Revenue: |
||||||||||||
| North America |
$ | 97,309 | $ | 88,778 | $ | 91,358 | ||||||
| Europe |
31,587 | 27,754 | 24,425 | |||||||||
| Japan |
22,150 | 21,960 | 16,881 | |||||||||
| Asia Pacific |
32,391 | 25,766 | 22,539 | |||||||||
| Other |
1,018 | 575 | 710 | |||||||||
|
|
|
|
|
|
|
|||||||
| Total revenue |
$ | 184,455 | $ | 164,833 | $ | 155,913 | ||||||
|
|
|
|
|
|
|
|||||||
North America is comprised of revenue from the United States, Canada and Mexico. Revenue from customers located in the United States was $90,515, $83,435 and $85,459 during the years ended December 31, 2019, 2018 and 2017, respectively. Other than the United States and Japan, no other country contributed more than 10% of the Company’s total revenue during the years ended December 31, 2019 and 2018.
As of December 31, 2019 and December 31, 2018, property and equipment at locations outside the U.S. was not material.
F-32
Table of Contents
13. 401(k) Savings Plan
The Company maintains a defined contribution savings plan covering all eligible U.S. employees under Section 401(k) of the Internal Revenue Code. Company contributions to the plan may be made at the discretion of the Board. During the years ended December 31, 2019, 2018 and 2017, the Company has made contributions to the plan of $392, $424 and $425, respectively.
14. Quarterly Financial Data (unaudited)
The following table presents certain unaudited quarterly financial information for the eight quarters in the period ended December 31, 2019. This information has been prepared on the same basis as the audited financial statements and includes all adjustments (consisting only of normal recurring adjustments) necessary to present fairly the unaudited quarterly results of operations set forth herein.
| For the three months ended: | ||||||||||||||||||||||||||||||||
| Dec. 31, 2019 |
Sep. 30, 2019 |
Jun. 30, 2019 |
Mar. 31, 2019 |
Dec. 31, 2018 |
Sep. 30, 2018 |
Jun. 30, 2018 |
Mar. 31, 2018 |
|||||||||||||||||||||||||
| Revenue |
$ | 47,603 | $ | 47,434 | $ | 47,582 | $ | 41,836 | $ | 40,864 | $ | 41,121 | $ | 41,654 | $ | 41,194 | ||||||||||||||||
| Gross profit |
28,803 | 29,120 | 25,973 | 25,090 | 24,387 | 24,803 | 25,036 | 23,983 | ||||||||||||||||||||||||
| Loss from operations |
(6,870 | ) | (2,358 | ) | (7,082 | ) | (4,753 | ) | (2,527 | ) | (3,141 | ) | (5,017 | ) | (2,416 | ) | ||||||||||||||||
| Net loss |
(6,712 | ) | (2,970 | ) | (7,238 | ) | (4,983 | ) | (2,617 | ) | (3,502 | ) | (5,652 | ) | (2,257 | ) | ||||||||||||||||
| Basic and diluted net loss per share |
(0.17 | ) | (0.08 | ) | (0.19 | ) | (0.14 | ) | (0.07 | ) | (0.10 | ) | (0.16 | ) | (0.06 | ) | ||||||||||||||||
15. Restructuring
During the second quarter of 2019, the Company committed to an action to restructure certain parts of the Company with the intent of aligning skills with the Company’s strategy and facilitating cost efficiencies and savings. As a result, certain headcount reductions were necessary. The Company incurred approximately $752 in restructuring charges during the second quarter of 2019. The restructuring charges reflect post-employment benefits and are reflected in the Condensed Consolidated Statements of Operations as follows: $186 – Cost of subscription and support revenue; $107 – Cost of professional services and other revenue; $421 – Sales and Marketing; and $38 – Research and Development. The Company has paid all amounts due relating to the restructuring and does not expect to incur any additional restructuring charges related to this action.
F-33