Attached files
| file | filename |
|---|---|
| EX-10.16 - EX-10.16 - DIRTT ENVIRONMENTAL SOLUTIONS LTD | d845228dex1016.htm |
| EX-32.2 - EX-32.2 - DIRTT ENVIRONMENTAL SOLUTIONS LTD | d845228dex322.htm |
| EX-32.1 - EX-32.1 - DIRTT ENVIRONMENTAL SOLUTIONS LTD | d845228dex321.htm |
| EX-31.2 - EX-31.2 - DIRTT ENVIRONMENTAL SOLUTIONS LTD | d845228dex312.htm |
| EX-31.1 - EX-31.1 - DIRTT ENVIRONMENTAL SOLUTIONS LTD | d845228dex311.htm |
| EX-23.1 - EX-23.1 - DIRTT ENVIRONMENTAL SOLUTIONS LTD | d845228dex231.htm |
| EX-21.1 - EX-21.1 - DIRTT ENVIRONMENTAL SOLUTIONS LTD | d845228dex211.htm |
| EX-10.17 - EX-10.17 - DIRTT ENVIRONMENTAL SOLUTIONS LTD | d845228dex1017.htm |
| EX-4.2 - EX-4.2 - DIRTT ENVIRONMENTAL SOLUTIONS LTD | d845228dex42.htm |
Table of Contents
UNITED STATES
SECURITIES AND EXCHANGE COMMISSION
Washington, D.C. 20549
FORM 10-K
(Mark One)
| ☒ | ANNUAL REPORT PURSUANT TO SECTION 13 OR 15(d) OF THE SECURITIES EXCHANGE ACT OF 1934 |
For the fiscal year ended December 31, 2019
OR
| ☐ | TRANSITION REPORT PURSUANT TO SECTION 13 OR 15(d) OF THE SECURITIES EXCHANGE ACT OF 1934 |
For the transition period from to
Commission File Number 001-39061
DIRTT ENVIRONMENTAL SOLUTIONS LTD.
(Exact name of Registrant as specified in its Charter)
| Alberta, Canada | N/A | |
| (State or other jurisdiction of incorporation or organization) |
(IRS Employer Identification No.) | |
| 7303 30th Street S.E. Calgary, Alberta, Canada |
T2C 1N6 | |
| (Address of principal executive offices) | (Zip code) | |
Registrant’s telephone number, including area code: (403) 723-5000
Securities registered pursuant to Section 12(b) of the Exchange Act:
| Title of Each Class |
Trading Symbol(s) |
Name of Each Exchange on Which Registered | ||
| Common Shares, without par value | DRTT | The Nasdaq Stock Market LLC |
Securities registered pursuant to Section 12(g) of the Act: None
Indicate by check mark if the registrant is a well-known seasoned issuer, as defined in Rule 405 of the Securities Act. Yes ☐ No ☒
Indicate by check mark if the registrant is not required to file reports pursuant to Section 13 or 15(d) of the Act. Yes ☐ No ☒
Indicate by check mark whether the registrant: (1) has filed all reports required to be filed by Section 13 or 15(d) of the Securities Exchange Act of 1934 during the preceding 12 months (or for such shorter period that the Registrant was required to file such reports), and (2) has been subject to such filing requirements for the past 90 days. Yes ☒ No ☐
Indicate by check mark whether the registrant has submitted electronically every Interactive Data File required to be submitted pursuant to Rule 405 of Regulation S-T (§232.405 of this chapter) during the preceding 12 months (or for such shorter period that the registrant was required to submit such files). Yes ☒ No ☐
Indicate by check mark whether the registrant is a large accelerated filer, an accelerated filer, a non-accelerated filer, a smaller reporting company or an emerging growth company. See the definitions of “large accelerated filer,” “accelerated filer,” “smaller reporting company,” and “emerging growth company” in Rule 12b-2 of the Exchange Act.
| Large accelerated filer | ☐ | Accelerated filer | ☐ | |||
| Non-accelerated filer | ☒ | Small reporting company | ☐ | |||
| Emerging growth company | ☒ | |||||
If an emerging growth company, indicate by check mark if the registrant has elected not to use the extended transition period for complying with any new or revised financial accounting standards provided pursuant to Section 13(a) of the Exchange Act. ☒
Indicate by check mark whether the registrant is a shell company (as defined in Rule 12b-2 of the Act). Yes ☐ No ☒
The aggregate market value of the voting and non-voting common equity held by non-affiliates of the registrant, based on the closing price of the shares of common shares on The Toronto Stock Exchange on June 28, 2019, converted to U.S. dollars using the daily average exchange rate as reported by the H.10 statistical release of the Board of Governors of the Federal Reserve System on June 28, 2019 of C$1.3091 = US$1.00, was $409,123,019.
The registrant had 84,681,364 common shares outstanding as of February 19, 2020.
DOCUMENTS INCORPORATED BY REFERENCE
Portions of the registrant’s Proxy Statement relating to the Annual and Special Meeting of Shareholders, scheduled to be held on May 22, 2020, are incorporated by reference into Part III of this Annual Report on Form 10-K.
Table of Contents
1
Table of Contents
EXPLANATORY NOTE
Currency and Exchange Rate Information
Unless otherwise indicated, references in this Annual Report to “$” or “dollars” are expressed in U.S. dollars (US$). References in this Annual Report to Canadian dollars are noted as “C$.”
Our consolidated financial statements that are included in this Annual Report are presented in U.S. dollars. Unless otherwise stated, all figures presented in Canadian dollars and translated into U.S. dollars were calculated using the daily average exchange rate as reported by the H.10 statistical release of the Board of Governors of the Federal Reserve System on January 29, 2020 of C$1.3201 = US$1.00.
Market and Industry Data
Certain market and industry data contained in this Annual Report, including Item 1. “Business” and Item 7. “Management’s Discussion and Analysis of Financial Condition and Results of Operations,” are based upon information from government or other third-party publications, reports and websites or based on estimates derived from such publications, reports and websites. Government and other third-party publications, reports and websites do not guarantee the accuracy or completeness of their information. While management believes this data to be reliable, market and industry data are subject to variations and cannot be verified with complete certainty due to limits on the availability and reliability of raw data, the voluntary nature of the data-gathering process, and other limitations and uncertainties inherent in any statistical survey.
2
Table of Contents
SPECIAL NOTE REGARDING FORWARD-LOOKING STATEMENTS
Certain statements contained in this Annual Report are “forward-looking statements” within the meaning of “safe harbor” provisions of the United States Private Securities Litigation Reform Act of 1995 and Section 21E of the Securities Exchange Act of 1934 (the “Exchange Act”) and “forward-looking information” within the meaning of applicable Canadian securities laws. All statements, other than statements of historical fact included in this Annual Report, regarding our strategy, future operations, financial position, estimated revenues and losses, projected costs, prospects, plans and objectives of management are forward-looking statements. When used in this Annual Report, the words “anticipate,” “believe,” “expect,” “estimate,” “intend,” “plan,” “project,” “outlook,” “may,” “will,” “should,” “would,” “could,” “can,” the negatives thereof, variations thereon and other similar expressions are intended to identify forward-looking statements, although not all forward-looking statements contain such identifying words. In particular and without limitation, this Annual Report contains forward-looking information pertaining to the effect of our strategic priorities on increasing value creation; the availability of additional or substitute manufacturing space and the Company’s expectations regarding the building of a new combined tile and millwork facility in Rock Hill, South Carolina; the effect that complying with applicable law and regulations, current claims against the Company and expiring patents will have on the Company’s business, financial condition and results of operation; and the effect the rating systems established by the U.S. Green Building Council will have on demand for products, systems and services in the U.S. market. Forward-looking statements are based on certain estimates, beliefs, expectations and assumptions made in light of management’s experience and perception of historical trends, current conditions and expected future developments, as well as other factors that may be appropriate.
Forward-looking statements necessarily involve unknown risks and uncertainties, which could cause actual results or outcomes to differ materially from those expressed or implied in such statements. Due to the risks, uncertainties and assumptions inherent in forward-looking information, you should not place undue reliance on forward-looking statements. Factors that could have a material adverse effect on our business, financial condition, results of operations and growth prospects can be found in Item 1A. “Risk Factors,” Item 7. “Management’s Discussion and Analysis of Financial Condition and Results of Operations,” and elsewhere in this Annual Report. These factors include, but are not limited to, the following:
| • | competition in the interior construction industry; |
| • | global economic, political and social conditions and financial markets; |
| • | our reliance on our network of Distribution Partners (as defined herein) for sales, marketing and installation of our solutions; |
| • | our ability to maintain and manage growth effectively; |
| • | our ability to implement our strategic plan; |
| • | our ability to introduce new designs, solutions and technology and gain client and market acceptance; |
| • | our periodic fluctuations in results of operations and financial conditions; |
| • | loss of our key executives and difficulties in recruiting or retaining key employees; |
| • | labor shortages and disruptions in our manufacturing facilities; |
| • | product liability, product defects and warranty claims brought against us; |
| • | claims arising from the conduct of general contractors and their sub-contractors; |
| • | defects in our designing and manufacturing software; |
| • | our former co-founders’ competitive behavior against us; |
| • | infringement on our patents and other intellectual property; |
| • | cyber-attacks and other security breaches of our information and technology systems; |
3
Table of Contents
| • | damage to our information technology and software systems; |
| • | material fluctuations of commodity prices, including raw materials; |
| • | shortages of supplies of certain key components and materials or disruption in supplies due to global events; |
| • | our ability to achieve requisite capacity from our existing manufacturing facilities; |
| • | our requirements to comply with applicable environmental, health and safety laws; |
| • | our exposure to currency exchange rates, tax rates and other fluctuations, including those resulting from changes in laws; |
| • | legal and regulatory proceedings brought against us; |
| • | our exposure to increased counterparty credit risk, including from Distribution Partners and clients; |
| • | the availability of capital or financing on acceptable terms, which may impair our ability to make investments in the business; |
| • | our requirements to comply with the agreements that govern our indebtedness; |
| • | our ability to generate sufficient revenue to achieve and sustain profitability; |
| • | our ability to maintain adequate insurance to protect us from claims that may arise in connection with our business and operations; |
| • | future mergers and acquisitions we may engage in; |
| • | volatility of our share price; |
| • | our requirements to maintain a dual listing in the United States and Canada; |
| • | the effect of reduced disclosure requirements on our common shares; |
| • | our history of not paying dividends; |
| • | the effect of being governed by the corporate laws of a foreign country, including the difficulty of enforcing civil liabilities against directors and officers residing in a foreign country; |
| • | the effect of analyst reports on our common shares; |
| • | our potential treatment as a “passive foreign investment company”; |
| • | the potential that our common shares could be delisted from the Nasdaq or TSX; and |
| • | other factors and risks described under the heading “Risk Factors” in Item 1A. of this Annual Report. |
These risks are not exhaustive. Because of these risks and other uncertainties, our actual results, performance or achievement, or industry results, may be materially different from the anticipated or estimated results discussed in the forward-looking statements in this Annual Report. New risk factors emerge from time to time, and it is not possible for our management to predict all risk factors nor can we assess the effects of all factors on our business or the extent to which any factor, or combination of factors, may cause actual results to differ materially from those contained in, or implied by, any forward-looking statements. Our past results of operations are not necessarily indicative of our future results. You should not rely on any forward-looking statements, which represent our beliefs, assumptions and estimates only as of the dates on which they were made, as predictions of future events. We undertake no obligation to update these forward-looking statements, even though circumstances may change in the future, except as required under applicable securities laws. We qualify all of our forward-looking statements by these cautionary statements.
4
Table of Contents
PART I
| Item 1. | Business. |
Overview
DIRTT Environmental Solutions Ltd. is an innovative manufacturing company featuring a proprietary software and virtual reality visualization platform, coupled with vertically integrated manufacturing that designs, configures and manufactures prefabricated interior solutions used primarily in commercial spaces across a wide range of industries and businesses. We combine innovative product design with our industry-leading, proprietary ICE® Software (“ICE” or “ICE Software”), and technology-driven, lean manufacturing practices and sustainable materials to provide end-to-end solutions for the traditionally inefficient and fragmented interior construction industry. We create customized interiors with the aesthetics of conventional construction but with greater schedule and cost certainty, shorter lead times, greater future flexibility, and better environmental sustainability than conventional construction.
Our ICE Software allows us to sell, design, visualize (including 3D virtual reality modeling of interiors), configure, price, communicate, engineer, specify, order and manage projects, thereby reducing challenges associated with traditional construction, including cost overruns, change orders, inconsistent quality, delays and material waste. While other software programs and virtual reality tools are used in the architectural and construction industries, we believe our ICE Software is the only interior construction technology that provides end-to-end integration and management, from design through engineering, manufacturing and installation. Our interior construction solutions include prefabricated, customized interior modular walls, ceilings, and floors; decorative and functional millwork; power infrastructure; network infrastructure; and pre-installed medical gas piping systems. We strive to incorporate environmentally sustainable materials and reusable components into our solutions while creating flexible, functional and well-designed environments for the people who will use them.
We offer our interior construction solutions throughout the United States and Canada, as well as in select international markets, through a network of independent distribution partners (“Distribution Partners”) and an internal sales team. Our Distribution Partners use ICE to work with end users to envision and design their spaces, and orders are electronically routed through ICE to our manufacturing facilities for production, packing and shipping. Our Distribution Partners then coordinate the receipt and installations of our interior solutions at the end users’ locations.
Our name “DIRTT” stands for Doing It Right This Time. DIRTT was incorporated in Alberta, Canada, under the Business Corporations Act (Alberta) (“ABCA”) on March 4, 2003. Our headquarters are located at 7303 30th Street S.E., Calgary, Alberta, T2C 1N6, Canada, and our telephone number at that address is (403) 723-5000. Our manufacturing facilities are in Calgary, Alberta; Phoenix, Arizona; and Savannah, Georgia; with an additional facility under construction in Rock Hill, South Carolina.
We completed our initial public offering in Canada in November 2013 and listed our common shares on The Nasdaq Global Select Market (“Nasdaq”) in October 2019. Our common shares trade on the Toronto Stock Exchange (“TSX”) under the ticker symbol “DRT” and on Nasdaq under the ticker symbol “DRTT.”
Unless otherwise specified or the context otherwise requires, references to “we,” “us,” “our,” “its,” “the Company” or “DIRTT” mean DIRTT Environmental Solutions Ltd. and, where the context so requires, includes our subsidiaries.
Available Information
We file or furnish annual, quarterly and current reports, proxy statements and other documents with the U.S. Securities and Exchange Commission (“SEC”) under the Exchange Act. The SEC maintains a website (www.sec.gov) that contains reports, proxy and information statements, and other information regarding issuers, including DIRTT, that file electronically with the SEC. We are also subject to requirements of applicable securities laws in Canada, and documents that we file with the securities commissions or similar regulatory authorities in Canada may be found at www.sedar.com.
5
Table of Contents
We make available free of charge through our website (www.dirtt.com) our Annual Reports on Form 10-K, Quarterly Reports on Form 10-Q, Current Reports on Form 8-K and, if applicable, amendments to those reports filed or furnished pursuant to Section 13(a) of the Exchange Act as soon as reasonably practicable after we electronically file such material with, or furnish it to, the SEC or the securities commissions or similar regulatory authorities in Canada. In addition to the reports filed or furnished with the SEC and the securities commissions or similar regulatory authorities in Canada, we publicly disclose information from time to time in our press releases, investor presentations posted on our website and at publicly accessible conferences. Such information, including information posted on or connected to our website, is not a part of, or incorporated by reference in, this Annual Report or any other document we file with or furnish to the SEC or the securities commissions or similar regulatory authorities in Canada.
We will provide without charge to you, upon your request, a copy of our annual report on Form 10-K for the year ended December 31, 2019 filed with the SEC and the applicable securities commissions or similar regulatory authorities in Canada. Requests for copies should be addressed to 7303 30th Street S.E., Calgary, Alberta, T2C 1N6, Canada, Attention: Investor Relations.
Our Solutions
We offer a wide array of interior construction solutions powered by technology that address the challenges inherent in traditional interior designing and construction methods. Unlike traditional interior construction, including traditional prefabricated products, our solutions do not have predetermined configurations, shapes or sizes, so clients are free to design any shape, size or configuration. Our design and visualization technologies integrate with our manufacturing capabilities and enable short and precise manufacturing times. With a strong network of Distribution Partners, we are able to complete an interior construction project in as few as 30 days, from visualization and completion of design to installation and move-in. Because our solutions remain highly adaptable over time, clients are able to change and customize our solutions even after installation to maintain satisfaction with the functionality and aesthetics of their space as their needs change.
Sustainability practices are a core part of our business, from design and manufacturing to installation and beyond. Our solutions are form-fit, so the only waste produced at job sites is packing material, which is biodegradable, recyclable or able to be returned to DIRTT for reuse.
DIRTT Solutions
Our solutions typically encompass over 90% of an interior space. Walls, doors, cabinetry, access floor, ceilings, power solutions, data networks, heavy timber and medical gas components are all fabricated in our manufacturing facilities and shipped to the site for final assembly and installation. The following table provides a brief description of our primary solutions (together with related complementary offerings, “DIRTT Solutions”):
| DIRTT Solution |
Description | |
| DIRTT Walls |
Prefabricated, customized, modular solid or glass interior wall solutions that support new and legacy furniture, that include glass walls, doors or windows, and that support integrated technology for commercial, healthcare, education, hospitality and other industries and medical gas piping systems for healthcare. | |
| DIRTT Millwork |
Fully customized modular cabinetry that may be used in a variety of industries, including commercial, healthcare, education and hospitality. | |
| DIRTT Floors |
Low-profile floors that allow quick access to modular power and network infrastructure, facilitating future adaptation and reconfiguration in both existing facilities and new buildings. | |
| DIRTT Ceilings |
Prefabricated custom ceilings that increase sound privacy and reduce noise. | |
6
Table of Contents
| DIRTT Solution |
Description | |
| DIRTT Power |
Quick-connect, pre-tested adaptable power solutions that are prefabricated to arrive on-site in correct lengths with factory components ready for installation and use, eliminating waste and providing future flexibility. | |
| DIRTT Networks |
Prefabricated, pre-tested and componentized passive optical networks utilizing single mode fiber cables instead of traditional copper cables. Similar to DIRTT Power, data infrastructure components arrive on the job site pre-cut to correct lengths and with components ready for quick-connect installation and use. | |
| DIRTT Timber |
Prefabricated timber construction for interior mezzanines, structural elements for low-rise buildings, and other architectural elements, including completely customized cross-laminated timber and glue-laminated (glulam) timber. | |
Our DIRTT Power and DIRTT Networks solutions may be integrated with DIRTT Walls, and DIRTT Networks solutions may also be integrated with DIRTT Floors and DIRTT Ceilings. DIRTT Millwork solutions may be added to DIRTT Walls for decorative and functional purposes. Additionally, DIRTT Walls, DIRTT Floors, DIRTT Ceilings and DIRTT Timber may be integrated among each solution.
ICE® Software
Our manufacturing approach is built on a foundation of technology, the core of which is our proprietary ICE Software. We use ICE to sell, design, visualize, configure, price, communicate, engineer, construct, specify, order and manage projects. ICE enables us to efficiently manufacture fully custom interiors while addressing challenges associated with traditional construction, including cost overruns, inconsistent quality, delays and significant material waste. ICE also gives our clients full control over the look, cost and timing of their interior construction projects.
Clients typically engage an architect or designer and initially design their interior space and customize their solutions components, including material, color, finish and layout, in two-dimensional renderings. A DIRTT Distribution Partner imports this design into ICE and prices projects in real time. Clients can easily make changes after the design is imported into ICE, which will immediately be reflected in the price quote. Once the design is ready, clients can then explore and walk through their designed space in immersive and interactive 3D virtual reality or on-screen computer renderings so they can more readily conceptualize the design. This is a significantly enhanced experience for our clients as compared with the experience of reviewing a two-dimensional blueprint or CAD drawing. We currently have four virtual reality walk-through centers, including one at our corporate headquarters, that allow clients to use virtual reality headsets to walk through a 3D virtual reality model of their design. We also integrated ICE with augmented (mixed) reality technology, including phones and tablets, to allow project stakeholders in different physical locations to visualize, interact and discuss their future spaces without having to visit one of our virtual reality walk-through centers.
Once the client is satisfied with the design in ICE, the specifications are transmitted to our manufacturing facilities, where the solutions are created to the exact design standards and specifications set forth in the design. ICE manages many aspects of the manufacturing process, including product inventory and cataloguing, price quotation, order submission, parts manufacturing, and production management, thereby facilitating the delivery of custom solutions with shorter production times. We allocate production among our manufacturing facilities based on proximity and capacity. ICE allows an entire project to be tracked and managed across the entire life of the project, from sales, production, delivery, and installation. The ICE file (containing all of a project’s engineering and manufacturing data) generated during the design and specification process is preserved and can be used for optimizing future reconfigurations, renovations, technology integration initiatives and changes to a client’s space at lower cost than traditional construction methods.
7
Table of Contents
Our Business Strategy
Our goal is to help clients envision and design interior construction projects and then build and deliver those projects faster, cleaner, more efficiently and with a better overall client experience and satisfaction than traditional construction methods. The modular aspect of our DIRTT Solutions allows them to be easily reconfigured with a minimal amount of waste as client space needs change. Our innovative, technology-driven approach includes outstanding product design that is customized for each client application and delivered on time and on budget.
Our strategy is founded on the following priorities:
| • | The identification and pursuit of client segments that benefit most from DIRTT’s value proposition; |
| • | Client-centric, continuous innovation in DIRTT Solutions and our technology to enhance product differentiation and drive market penetration and growth; |
| • | Technology-enabled manufacturing processes that facilitate short lead times, a reliable client service platform, and outstanding quality on a cost-effective basis; and |
| • | Ongoing development and support of our Distribution Partners to ensure flawless execution and a superior end client experience. |
In combination with a focus on cost-disciplined control, a continuous improvement philosophy, and a focused approach to capital investment, we believe these strategic priorities will drive increased value creation for our employees, clients, Distribution Partners, and shareholders.
Our Competitive Strengths
We believe the following attributes provide us with competitive strengths in the interior solutions manufacturing industry:
| • | Leader in Integrated Design and Manufacturing Technology. We believe our ICE Software is the only interior construction technology that efficiently integrates the design, configuration, and virtual reality visualization processes with the manufacturing process. The use of 3D technology in a design environment, mimicking video game visuals, is an approach pioneered by DIRTT. |
| • | Easy and Intuitive Software Interface. Our ICE Software is a fast, powerful tool with an intuitive user interface. Our software’s ease of use enables rapid time-to-value for our clients and collaboration among all the stakeholders involved in the design, reconfiguration, budgeting and manufacturing processes. Our use of 3D virtual reality and augmented (mixed) reality technologies enables clients to visualize and modify their designs before manufacturing begins, thereby reducing cost and time to completion. |
| • | Proprietary Solutions Components. The physical components that comprise our DIRTT Solutions have been designed to provide clients with numerous options and full modularity. As a result, we are able to create interior environments that are fully customizable and not limited by a pre-set product list. The modular nature of our components allows them to be reconfigured easily, with minimal disruption to the occupants of the space and with minimal job site waste. |
| • | Strong Distribution Partner and Sales Network. Our strong network of Distribution Partners and DIRTT sales representatives allows us to maximize our geographic reach, helps build brand awareness in the interior construction market, and enhances our positioning in our target markets. |
8
Table of Contents
| • | Superior Results Compared to Traditional Design and Construction. We believe we produce superior client results as compared with traditional design and construction methods in sequencing, certainty, budget allocation, and outcome. |
| • | Effective Sequencing. Conventional construction generally follows a rigid sequencing process. Typically, wall framing is constructed first, followed by floors and electrical and data networks. This process is then followed by drywall installation, painting, and flooring, and then installation or building of millwork and fixtures. These steps generate significant waste and create opportunities for delay, change orders, cost overruns and rework. In contrast, DIRTT Solutions design and integrate the walls, floors and ceiling, including the finish, electrical wiring and data networks. They are manufactured off-site and arrive on-site organized, labeled and ready to be installed. This enables the interior solutions to be produced concurrently with on-site construction work, thereby reducing on-site time and the overall construction schedule. |
| • | Certainty. Our technology-based design and manufacturing solutions address changes in design, communications with clients, and material costs with more certainty than conventional construction methods, which often involve retrofitting electrical and data networks, change orders, uncertain timelines, and costly rework. Our controlled manufacturing environment reduces deficiencies and errors and produces more consistent solutions in predictable time frames. |
| • | Budget. Because of our integrated design, visualization and manufacturing technologies, we can price the effect of design choices and changes immediately and deliver the fully designed, manufactured interior solutions ready to install. This provides budget certainty both in the cost of our DIRTT Solutions as well as in on-site labor for the installation process. |
| • | Outcome. Our interior spaces look like the images our clients expect from the design drawings and virtual visualizations, because those same drawings and visualizations drive the manufacturing process. Plumbing, electrical, A/V and data networks are integrated into the architecture of our DIRTT Solutions. For example, DIRTT Walls look and perform like permanent walls, but if an IT or facilities team needs to get inside the wall for any reason, they can use a tool to remove the surface of the wall to examine the wall cavity quickly, cleanly and quietly. This eliminates the need to knock down, and then patch and repaint, drywall or reconfigure fixtures and cabinetry. Our modular designs offer flexibility and interconnectivity with any technology, furniture, millwork or DIRTT Solutions that were previously used or that will be used in the future, allowing clients to reconfigure and repurpose their space while reducing disruptive and time-consuming demolition and waste removal. |
Distribution Partners and Sales Network
We primarily sell DIRTT Solutions through a network of independent Distribution Partners working in conjunction with local DIRTT sales representatives, as well as internal DIRTT industry specialists, business development professionals and a dedicated Distribution Partner support team. Distribution Partners and local sales representatives are located in cities throughout the United States and Canada, as well as in select international markets. The use of a dispersed network of Distribution Partners greatly enhances our ability to drive awareness of the DIRTT brand throughout our markets.
As part of our distribution agreements, our Distribution Partners are typically required to invest in their own DIRTT Experience Center (“DXC”) so that they are able to effectively showcase DIRTT Solutions. These DXCs are showrooms that provide mock-ups of DIRTT Solutions and related product offerings. Including those operated by our Distribution Partners, there are 82 DXCs throughout North America, the Middle East and India. As of December 31, 2019, there were 76 Distribution Partner-operated DXCs and six DIRTT-operated DXCs.
Our Distribution Partners operate under agreements that outline sales goals and marketing territories which are generally non-exclusive. We expect our Distribution Partners to build regional DIRTT-dedicated teams (sales, design and project management) and to use our ICE Software in the sales process. In addition to sales and marketing, our Distribution Partners provide value throughout the construction process. At the pre-construction stage, Distribution Partners provide design assistance services to the architect and designer; throughout the construction process, Distribution Partners act as a specialty subcontractor to the general contractor and provide installation and other construction services; and post-move in, Distribution Partners provide warranty work, ongoing maintenance and reconfiguring support. Local DIRTT sales representatives work closely with the Distribution Partners throughout the process to ensure successful project implementation and the highest client satisfaction. Distribution Partners generally place orders for DIRTT Solutions directly with us and pay us directly for such orders.
9
Table of Contents
We have the ability to bring on new Distribution Partners in a wide range of geographic areas, which permits us to quickly establish a presence in new market areas. Our Distribution Partners also scale our virtual reality technology, such as our phone- and tablet-based applications, to fit their capacity and needs.
At December 31, 2019, we had a total of 87 Distribution Partners and 71 sales representatives across North America, the United Kingdom, India and Singapore. We are not dependent on any one Distribution Partner or sales representative.
Manufacturing and Properties
Our DIRTT Solutions are manufactured at our facilities in Calgary, Alberta; Phoenix, Arizona; and Savannah, Georgia. Our wall surfaces (which we call tiles), millwork and timber solutions are manufactured in Calgary, while aluminum, glass and power components are manufactured at all three locations. Through distributed manufacturing we can shift production of some components among our manufacturing sites, reduce transportation times and costs, and meet targeted lead times. In 2019, we conducted an evaluation of our aluminum, tile and millwork capacities under various growth scenarios and concluded that the capacity of our aluminum manufacturing facilities is currently sufficient to support our anticipated growth. Given the longer lead time to acquire tile and millwork manufacturing equipment, combined with a lack of redundancy in those manufacturing facilities, we also concluded that we should commence construction of a new combined tile and millwork facility. In the fourth quarter of 2019, we entered into a lease for a build-to-suit building located in Rock Hill, South Carolina, which will provide for approximately 130,000 square feet of manufacturing space for the combined tile and millwork factory. We currently expect construction of this factory to be substantially completed and commissioned in the first quarter of 2021. Should the need arise, we have the expansion rights to lease an additional 130,000 square feet of space. Should we experience additional growth, we may need to add or expand additional manufacturing facilities. Alternatively, should we see a significant contraction in sales relative to expectations, we may defer the commissioning of the Rock Hill facility until later in 2021.
Suppliers and Raw Materials
Our inventory balances consist primarily of raw materials, which are kept on hand as components of our custom manufacturing process. Managing our raw material inventory is essential to our business, given our short lead times from order to shipment and our high level of order customization. Our key manufacturing materials are aluminum, hardware, wood and glass. For the twelve months ended December 31, 2019, aluminum accounted for approximately 31.8% of our purchased materials, while wood, hardware and glass accounted for approximately 14.3%, 12.4% and 7.5%, respectively. While we maintain multiple suppliers for key materials, for the twelve months ended December 31, 2019, two suppliers accounted for approximately 32% and 21% of our aluminum supply, two suppliers accounted for approximately 47% and 42% of our wood supply and one supplier accounted for approximately 28% of our hardware supply.
Materials are sourced domestically and, to a much lesser extent, overseas. Approximately 94% of our materials are manufactured and purchased in North America. Purchase decisions are made on the basis of cost, quality and ability to meet delivery requirements. We do not typically enter into long-term agreements with suppliers. In general, adequate supplies of raw materials are available to all of our operations, although aluminum purchases may be subject to market capacity constraints.
Technology and Development
We continue to focus on developing client-centric innovations and enhancements of both ICE Software and DIRTT Solutions with a primary focus on improving client experience, increasing market penetration and growing key markets. At December 31, 2019, we employed 116 employees within our technology and development groups and, including capitalized amounts, invested $11.3 million, $9.4 million and $11.8 million in 2019, 2018 and 2017, respectively, in innovation activities.
10
Table of Contents
Clients
DIRTT’s principal geographic markets are the United States, Canada, and, to a more limited extent, select international markets. Our revenue is derived almost entirely from projects in North America sold by our North American Distribution Partners.
Our revenue opportunities primarily come from commercial projects, including both new construction projects and renovations of existing buildings. Clients range from small owner-managed businesses to multinational Fortune 500 companies across a variety of industries, including healthcare, education, financial services, government and military, manufacturing, non-profit, energy, professional services, retail, technology and hospitality. We view DIRTT Solutions as generally industry agnostic, with applications in many different industries with minimal adjustments. We are not dependent on any one client or industry segment. No single client represented more than 10% of our revenue for the years ended December 31, 2019, 2018 or 2017.
Competition
The overall market for interior construction is fragmented and highly competitive. The principal competitive factors in the interior construction industry include price (including cost certainty), speed, quality, customization and service. Our main competitors are comprised primarily of conventional construction firms, individual tradespeople (including framers, drywall installers, and interior product designers) and modular systems manufacturers. Additionally, conventional construction firms are beginning to develop customizable wall paneling and other interior construction solutions and may directly compete with our DIRTT Solutions. We also compete with commercial furniture manufacturers, such as Teknion Corporation, Haworth Inc. and Allsteel Inc., who offer a variety of prefabricated interior wall solutions. We expect competition to increase as new entrants or solutions enter the interior construction market. See Item 1A “Risk Factors”.
Seasonality
The construction industry has also historically experienced seasonal slowdowns related to winter weather conditions and holiday schedules, which affect shipping and on-site installation dates, in the fourth and first quarters of each calendar year. Our business has generally, but not always, followed this trend with a slight time lag, leading to stronger sales in the second half of the year versus the first half. Weather factors can also influence third-party exterior construction schedules and site conditions, which may in turn affect timing of interior renovations.
Due to the fixed nature of certain of our manufacturing costs, such as our facilities leases and related indirect operating costs, periods of higher revenue volume tend to generate higher operating income margins while periods of lower volume tend to result in lower operating income margins. Quarters that contain consistent monthly manufacturing volumes tend to generate higher gross profit than those where manufacturing levels vary significantly from month to month.
Patent and Intellectual Property Rights
Our success depends, in part, upon our intellectual property rights relating to our products, production processes, our technology, including our ICE Software, and other operations. We rely on a combination of trade secret, nondisclosure and other contractual arrangements, as well as patent, copyright and trademark laws, to protect our proprietary rights and competitive advantage. We register our patents and trademarks as we deem appropriate and take measures to defend patents where we deem others are infringing on our patents. The following table presents the status as of December 31, 2019 of our issued and pending patents relating to various aspects of DIRTT Solutions and ICE Software:
| Jurisdiction |
Granted Patents |
Applications Pending |
||||||
| Canada |
56 | 41 | ||||||
| United States |
105 | 35 | ||||||
| European Union |
35 | 38 | ||||||
| Singapore |
16 | 12 | ||||||
| Patent Cooperation Treaty |
— | 3 | ||||||
| Other |
23 | — | ||||||
|
|
|
|
|
|||||
| Total |
245 | 129 | ||||||
11
Table of Contents
Our issued patents expire between 2021 and 2039. We do not believe that the expiration of any individual patent will have a material adverse effect on our business, financial condition or results of operations. As we develop new innovations and technology, we expect to file additional and supplemental patents to protect our rights in those innovations and new technology.
Sustainability and Environmental Matters
Conventional construction typically generates substantial waste, with approximately 40% of solid waste in the United States in 2012 coming from construction and demolition, according to a 2014 briefing by the Environmental and Energy Study Institute. Imprecise calculations or last-minute design changes may result in excess materials on the job site, such as wiring, drywall, wood, paint and flooring, that are sometimes unable to be reused or recycled. Measuring and cutting materials on-site leads to scrap waste that generally is sent to landfills. Sustainability is an integral component of our corporate brand identity and DIRTT Solutions. DIRTT Solutions are designed for disassembly, are form-fit and allow for less materials waste throughout the manufacturing process. We integrate environmentally friendly elements into our business wherever possible, including utilizing solar energy at most of our factories to offset a portion of the cost of electricity and the environmental impact of our operations, and utilizing materials with high recycled content in our DIRTT Solutions. We also ship DIRTT Solutions with recyclable or reusable packing and shipping materials.
The adoption of environmentally responsible building codes and standards, such as the Leadership in Energy and Environmental Design (“LEED”) rating system established by the U.S. Green Building Council, also has the potential to increase demand for products, systems and services that contribute to building sustainable spaces. Many of our DIRTT Solutions can contribute to the award of LEED credits and other green building rating systems. We continue to develop new products, systems and services to address market demand for products that enable construction of buildings that require fewer natural resources to build, operate and maintain. Our EnzoTM line of wall components received the Canadian Green Building Council’s Green Building Product of the Year Award in 2015 due to its ingenuity and application, particularly as a benefit to healthcare facilities. With the help of Climate Earth, in 2014 DIRTT was the first modular wall manufacturer to complete a full scope Life Cycle Assessment, resulting in 15 Environmental Product Declarations. In May 2019, we completed our second Life Cycle Assessment and released updated Environmental Product Declarations.
Government Regulations
The operation of our business is subject to stringent and complex laws and regulations pertaining to health, safety and the environment. As an owner or operator of various manufacturing facilities, we must comply with these laws and regulations at the federal, state, provincial and local levels in both the United States and Canada. Failure to comply with environmental laws and regulations may trigger a variety of administrative, civil or criminal enforcement actions, including the assessment of monetary penalties, the imposition of investigative or remedial requirements, or the issuance of orders limiting current or future operations. Certain environmental statutes impose strict, joint and several liability for costs required to clean up and restore sites where hazardous substances or industrial wastes have been mismanaged or otherwise released.
While we do not believe that compliance with federal, state, provincial or local environmental laws and regulations will have a material adverse effect on our business, financial position or results of operations, we cannot provide any assurances that future events, such as changes in existing laws or regulations, the promulgation of new laws or regulations, or the development or discovery of new facts or conditions related to our operations will not cause us to incur significant costs.
12
Table of Contents
Legal and Regulatory Proceedings
We may be involved from time to time in various lawsuits, claims, investigations and other legal matters that arise in the ordinary course of business, including matters involving our products, intellectual property, relationships with suppliers, relationships with Distribution Partners, relationships with competitors, employees and other matters. We may, for example, be a party to various litigation matters that involve product liability, tort liability and claims under other allegations, including claims from our employees either individually or collectively. We do not believe that any current claims, individually or in the aggregate, will have a material adverse effect on our financial condition, liquidity or results of operations. For additional information regarding our current legal proceedings, see Item 3. “Legal Proceedings.”
Implications of Being an Emerging Growth Company
We are an “emerging growth company” as defined in the Jumpstart Our Business Startups Act (the “JOBS Act”) enacted in April 2012. Certain specified reduced reporting and other regulatory requirements are available to public companies that are emerging growth companies. These provisions include:
| • | an exemption from the auditor attestation requirement in the assessment of our internal controls over financial reporting required by Section 404 of the Sarbanes-Oxley Act of 2002; |
| • | an exemption from the adoption of new or revised financial accounting standards until they would apply to private companies; |
| • | an exemption from compliance with any new requirements adopted by the Public Company Accounting Oversight Board requiring mandatory audit firm rotation or a supplement to the auditor’s report in which the auditor would be required to provide additional information about our audit and our financial statements; and |
| • | reduced disclosure about our executive compensation arrangements. |
We will continue to be an emerging growth company until the earliest of:
| • | the last day of our fiscal year in which we have total annual gross revenues of $1.07 billion (as such amount is indexed for inflation every five years by the SEC to reflect the change in the Consumer Price Index for All Urban Consumers published by the Bureau of Labor Statistics, setting the threshold to the nearest $1 million) or more; |
| • | the last day of our fiscal year following the fifth anniversary of the date of our first sale of common equity securities pursuant to an effective registration statement under the Securities Act of 1933 (“Securities Act”); |
| • | the date on which we have, during the prior three-year period, issued more than $1 billion in non-convertible debt; or |
| • | the date on which we are deemed to be a “large accelerated filer” under the rules of the SEC, which means the market value of our common shares that is held by non-affiliates (or public float) exceeds $700 million as of the last day of our second fiscal quarter in our prior fiscal year. |
We have elected to take advantage of certain of the reduced disclosure obligations in this Annual Report and may elect to take advantage of other reduced reporting requirements in future filings. As a result, the information that we provide to our shareholders may be different than what you might receive from other public reporting companies in which you hold equity interests. However, we have irrevocably elected not to avail ourselves of the extended transition period for complying with new or revised accounting standards and, therefore, we will be subject to the same new or revised accounting standards as other public companies that are not emerging growth companies.
13
Table of Contents
Employees
As of December 31, 2019, we had 1,169 full-time employees consisting of 790 employees in production, 102 employees in sales and marketing, 119 employees in technology and development, 84 employees in operations support, and 71 general and administrative employees. None of our employees are covered by collective bargaining agreements. We have never experienced labor-related work stoppages or strikes, and we believe we currently have a positive relationship with our employees.
14
Table of Contents
| Item 1A. | Risk Factors. |
Investing in our common shares involves a high degree of risk. You should carefully consider the risks described below, as well as the other information in this Annual Report, including our consolidated financial statements and the related notes and Part II, Item 7. entitled “Management’s Discussion and Analysis of Financial Condition and Results of Operations,” and in any documents incorporated in this Annual Report by reference, before deciding whether to invest in our common shares. The occurrence of any of the events or developments described below could harm our business, financial condition, results of operations, and growth prospects. In such an event, the market price of our common shares could decline, and you may lose all or part of your investment. Although we have discussed all known material risks, the risks described below are not the only ones that we may face. Additional risks and uncertainties not currently known to us or that we currently deem immaterial may also impair our business operations. Certain statements below are forward-looking statements. See also “Special Note Regarding Forward-Looking Statements” in this Annual Report.
Risks Related to Our Industry
Our industry is highly competitive, and our success depends on our ability to continue to persuade clients to utilize our innovative and unique approach to interior construction rather than traditional interior construction methods. Our failure to compete effectively by not offering compelling products and services or by not pricing our solutions competitively could materially and adversely affect our market share, liquidity, financial condition and results of operations.
We operate in a highly competitive industry that is constantly developing and changing. We compete on the basis of, among other things, price, predictability of timing and cost, speed, quality, customization, and product design. Our main competitors primarily consist of conventional construction firms, individual tradespeople (including framers, drywall installers, and interior product designers) and modular systems manufacturers. In addition, new market entrants and conventional construction firms are beginning to develop customizable wall paneling and other modular interior construction solutions. We also compete with commercial furniture manufacturers, such as Teknion Corporation, Haworth Inc. and Allsteel Inc., who offer a variety of prefabricated interior wall solutions. Our competitors may have greater financial, technical, sales, production and marketing resources, and they may develop products that achieve greater market acceptance, hire key personnel, or introduce competing or disruptive technology, all of which may reduce demand for DIRTT Solutions. In addition, we face pricing pressure on large construction projects from our competitors who take on projects at reduced prices or at a loss to ensure continuity of work. If we are unable to provide competitive pricing terms for DIRTT Solutions, our sales may be reduced. If we reduce our pricing to compete in these situations, our revenues and operating margins may decrease.
Our products are unique and offer an alternative to traditional construction techniques. Market acceptance of offsite construction methods is growing, but this still represents only a fraction of all construction methods and the overall construction market. Our ability to grow and increase market share depends, in part, on our success in continuing to increase demand for modular construction methods and products as an alternative to more traditional construction methods. While we intend to follow a strategy of continuing product development to enhance our position to the extent practicable, we cannot assure you that we will be able to maintain our current position in the industry or continue to compete successfully against current and future sources of competition. There is no guarantee that we, together with our Distribution Partners, can increase our client base or that our solutions will attain a degree of market acceptance sufficient for sustained profitable operations. Failure to compete effectively by, among other things, meeting consumer preferences, developing and marketing innovative solutions, maintaining strong client service and distribution relationships, growing market share, and expanding our solutions capabilities could have a material adverse effect on our liquidity, financial condition, or results of operations.
15
Table of Contents
Additionally, the competition for highly skilled technical, research and development, management, sales and other employees is high in our industry. There can be no assurance that we will be able to attract qualified personnel or retain our current personnel. If we are unable to attract and retain appropriate executives and employees, our business, results of operations and liquidity could be materially and adversely affected.
Risks Related to Our Business
Global economic, political and social conditions and financial markets may impact our ability to do business and adversely affect our liquidity, financial condition and results of operations.
Our industry is cyclical and highly sensitive to macroeconomic conditions. We are subject to global economic, political and social conditions that may cause an overall decline or reduction in construction and renovation due to economic downturns, difficulties in the financial services sector and credit markets, geopolitical uncertainties, tariffs and other macroeconomic factors. We face risks that may arise from financial difficulties experienced by our suppliers, Distribution Partners or clients. For example, our Distribution Partners and their clients may face financial difficulties or may become insolvent, which could result in the delay or cancellation of their plans to purchase DIRTT Solutions or lead to our inability to obtain payment of accounts receivable that they may owe. Such clients or potential clients may also be unable to obtain financing for their construction projects, including purchases of DIRTT Solutions. Our suppliers of raw materials, finished products or components may face financial difficulties or may become insolvent, which could lead to disruption in our manufacturing processes. Additionally, our business could be adversely affected by the effects of health epidemics, particularly in regions where we have key suppliers. For example, we rely on suppliers in China for certain of our raw materials and consequences of the coronavirus could include quarantines, labor shortages, and reduced output of these suppliers. Any general economic, political or social conditions that may contribute to financial difficulties experienced by us, our suppliers, Distribution Partners or clients may adversely affect our liquidity, financial condition and results of operations.
We depend heavily on our network of Distribution Partners for distribution and sales, and the loss or inattention of our Distribution Partners could materially and adversely affect our business, financial condition and results of operations.
We currently do not engage in many direct sales projects and rely almost exclusively on our network of Distribution Partners to promote brand awareness, sell and market DIRTT Solutions, and provide design, installation, distribution and other services to clients on each project. While we are not dependent on any single Distribution Partner, sales generated by approximately 10% of our Distribution Partners comprised approximately 32.6% of our total revenues for 2019. The loss of any top performing Distribution Partners, or their failure to adequately penetrate local markets, may negatively affect our sales, financial condition or results of operations. The loss of a Distribution Partner could also impair our ability to maintain a presence in a particular geographic region while we establish another Distribution Partner relationship in that region, which would require significant time and resources.
Our arrangements with our Distribution Partners are generally not exclusive, meaning that our Distribution Partners may market and sell both DIRTT Solutions and the products of our competitors. We may have multiple Distribution Partners in a geographic region depending on the size of the region. We offer our DIRTT Solutions at the same prices to our Distribution Partners, and, while we make recommendations on pricing terms to clients, our Distribution Partners may implement different pricing models that may be in excess of what clients in their territory would be willing to pay for DIRTT Solutions or that may be detrimental to other Distribution Partners who may offer different pricing terms.
We provide training and education to our Distribution Partners covering DIRTT Solutions and installation, sales, client service and experience, and maintenance of client relationships. However, our Distribution Partners may not be able to successfully sell our DIRTT Solutions or manage client experiences and relationships. Additionally, Distribution Partners may not successfully transport, deliver or install DIRTT Solutions, which could damage their relationships with clients and harm our reputation. Our ability to generate revenue in the future will depend in part on our success in maintaining effective working relationships with our Distribution Partners, choosing quality Distribution Partners, assisting our Distribution Partners to independently sell and to correctly install our DIRTT Solutions, and training our Distribution Partners to develop and maintain successful client relationships. If we are unable to maintain successful relationships with our Distribution Partners, or if our Distribution Partners are unable to maintain successful relationships with clients, our business, financial condition and results of operations could be materially and adversely affected.
16
Table of Contents
We may encounter difficulties in managing our growth and expanding our operations successfully.
Our success will depend in part on our ability to maintain and manage growth effectively. We have experienced, and may continue to experience, growth in our headcount and operations, which has placed, and may continue to place, significant demands on our management and operational and financial resources. Additionally, we expect to scale our business for sustainable, profitable growth as part of our overall business strategy. Managing growth of our operations and personnel requires continuous improvement of our internal controls and reporting systems and procedures. Failure to effectively manage growth could result in difficulty in providing current DIRTT Solutions and introducing future solutions, difficulty in securing clients and Distribution Partners, declines in quality or client satisfaction, increases in costs or other operational difficulties. Any of these difficulties could lead to loss of investor confidence and adversely affect our business performance, financial condition and results of operations.
We may not be successful in implementing our strategic plan.
In November 2019, we unveiled a four-year strategic plan for the Company, based on three key pillars of commercial execution, manufacturing excellence and innovation, to scale our business. We began implementing the strategic plan in the fourth quarter of 2019, including through hiring for key positions and the expansion of our Distribution Partner network. Failure to implement our strategic plan could materially and adversely affect our near term sales, commercial activities, and ability to develop and sustain profitable growth. Additionally, while we believe that the strategic plan will result in increased revenue and profitability, there is no guarantee that the strategic plan, even if successfully implemented, will lead to sustainable, profitable growth. Implementing the strategic plan may itself be disruptive to the Company. Any of these difficulties could materially and adversely affect our business performance, financial condition and results of operations.
We may be unsuccessful in designing, introducing or selling new, innovative solutions, solution features or software.
Our future success depends in part on our continuing ability to promote and demonstrate the value proposition of DIRTT Solutions, as well as our ability to develop new, innovative solutions or solution features that differentiate our solutions and achieve market acceptance in a timely and cost-effective manner. We incur significant costs associated with the investment in our research and development in furtherance of our strategy that may not result in increased revenue or demand for DIRTT Solutions and that could negatively affect our results of operations. Rapidly changing technology, evolving regulatory and industry standards, and changing consumer trends, demands and requirements require us to continuously innovate and develop new, high-quality, solutions, solutions features and software. Additionally, such rapid technological changes, standards and preferences could render the complex and proprietary technology of our software and solutions obsolete. We may also be unable to successfully address these developments on a timely basis, or at all. New solutions, solution features or software may also be less successful than we anticipated, and such offerings may fail to achieve market acceptance. If we fail to respond quickly and cost-effectively to a changing market and changing consumer preferences, our competitive position, financial condition and results of operations could be materially and adversely affected.
We have experienced, and may experience in the future, quarterly and yearly fluctuations in results of operations and financial condition.
Our results of operations and financial condition may continue to fluctuate from one quarter or year to another due to a number of factors, some of which are outside of our control. Furthermore, our actual or projected results of operations may fail to match our past performance. These events could in turn cause the market price of our common shares to fluctuate. In particular, if our results of operations do not meet the expectations of securities analysts or investors, who may derive their expectations by extrapolating data from recent historical results of operations, the market price of our common shares will likely decline. Due to our high fixed manufacturing costs and operating expenses, quarterly volatility in sales volumes could result in periods of low operating cash flow and negatively affect our liquidity.
17
Table of Contents
The construction industry has also historically experienced seasonal slowdowns related to winter weather conditions and holiday schedules in the first and fourth quarters of each calendar year. Our business has generally followed this trend with a slight time lag, leading to stronger sales in the second half of the year versus the first half. Weather conditions, such as unseasonably warm, cold or wet weather, which affect, and sometimes delay or accelerate, delivery and installation of some of our products, may significantly affect our results of operations. For example, during the fourth quarter of 2017, the extreme weather conditions experienced in the United States negatively affected the delivery of projects and our financial condition. Sales that we anticipate in one quarter may occur in another quarter, affecting both quarters’ results and potentially the trading price of our common shares. In addition, we typically ship orders within two weeks of when we receive them and maintain inventory levels to allow us to operate with little backlog. The efficiency of our inventory system, and our ability to avoid backlogs and potential loss of clients, is closely tied to our ability to accurately predict seasonal and quarterly variances. Our planned expenditures are also based primarily on sales forecasts. Our sales cycle is generally long, making our sales forecasts more uncertain than in businesses with short sales cycles. When sales do not meet our expectations, our results of operations will be reduced for the relevant quarters, as we will have already incurred expenses based on those expectations. Additionally, while we can adjust our direct labor headcount by virtue of more or fewer shifts, our ability to quickly react to significant swings in revenue may be limited by how quickly we can adjust our headcount. Due to these risk factors, quarter-to-quarter or year-to-year comparisons of our results of operations may not be an indicator of future performance.
Turnover of our key executives, and difficulty of recruiting and retaining key employees, could have a material adverse effect on our business and results of operations.
The performance of key personnel is essential to our business. Our success will depend in part on our ability to attract, develop and retain qualified key personnel as needed. We have experienced executive-level changes since 2017, which could negatively affect our ability to retain other key executives and employees. Between September 2018 and January 2019, two of our three co-founders left the Company, and commenced a competing business. Our third co-founder retired in November 2019. Our business has a long sales cycle, and we believe the distraction from significant management changes since 2017 has adversely affected our sales efforts during 2018, and therefore our 2019 revenues, to a greater extent than we anticipated. While we believe that these management changes will ultimately position the Company for growth, we cannot provide any assurance that we will effectively manage these or any other management transitions. Failure to effectively manage these transitions may affect our ability to retain our new or remaining key executives and employees and could have a material adverse effect on our business and results of operations.
Labor shortages and disruptions in our manufacturing facilities may delay or impede production and could have a material adverse effect on our financial condition, liquidity or results of operations.
Our manufacturing processes and technology development largely depend on human labor, although certain parts are automated or integrated with technology. Our distributed manufacturing approach allows us to shift production among our manufacturing facilities, although not all production can be moved. As a custom manufacturer, we do not carry finished goods inventory that can withstand a labor shortage or disruption for an extended period of time. We may therefore be affected by labor shortages or disruptions, particularly in the United States. Both our profitability and our ability to scale could be adversely affected if we encounter difficulty in attracting and retaining qualified personnel. If we are unable to continue to attract and retain qualified personnel, or if we experience any labor shortages or disruptions, we could incur higher recruiting expenses or a loss of manufacturing capabilities, all of which could have a material adverse effect on our business, financial condition, liquidity or results of operations.
We may be exposed to product liability and warranty claims on DIRTT Solutions, which if successfully asserted, could have a material adverse effect on our financial condition, liquidity or results of operations.
Our DIRTT Solutions are generally backed by warranties, some of which are up to 10 years. We may, from time to time, be involved in product liability and product warranty claims relating to DIRTT Solutions that could adversely affect our financial condition, results of operations, and cash flows. For example, in 2019, we incurred costs in the amount of $2.6 million in connection with remediating deficiencies in our solutions, including in costs related to tile warping, and we provided an incremental $2.5 million to our liability related to potential costs to remediate DIRTT Timber installed on projects between 2016 and 2019 that may not have met fire retardant standards under which they were sold. We are in discussions with our insurance carrier to determine how much, if any, of this liability is covered by insurance. Although we maintain warranty and other reserves in an amount based primarily on production, historical and anticipated warranty claims, future warranty claims may exceed this amount resulting in a need to increase the reserve. An increase in the rate of warranty claims or the occurrence of unexpected warranty claims could also result in clients rejecting our products and damage to our reputation, all of which could materially and adversely affect our financial condition, results of operations and liquidity.
18
Table of Contents
We have also on occasion found flaws and deficiencies in the design, manufacturing, assembling, labeling, product formulations or testing of DIRTT Solutions. DIRTT Timber is occasionally integrated as structural components in projects; therefore, any future flaws and deficiencies in certain DIRTT Timber projects may compromise the structure of the project. Some flaws and deficiencies have not been apparent until after the solutions were installed. If any flaws or deficiencies exist in our products and if such flaws or deficiencies are not discovered and corrected before DIRTT Solutions are installed or otherwise incorporated into the structures, damages could result, including collapse, fire, personal injury or death. Product liability claims can be expensive to defend, could divert the attention of management and other personnel for significant periods, regardless of the ultimate outcome, and could result in negative publicity. Increased costs to address product warranty claims or to defend against product liability claims may result in increased expenses and adversely affect our financial condition and results of operations.
We may be exposed to potential claims arising from the conduct of general contractors and their sub-contractors, which could materially and adversely affect our business, results of operations and financial condition.
Errors in the installation of DIRTT Solutions, even if the products are free of flaws and deficiencies, could also cause personal injury or death. To the extent that such damage or injury is not covered by our product liability insurance and we are held to be liable, we could be required to correct such damage and to compensate persons who might have suffered injury or death, and our reputation, business and financial condition could be materially and adversely affected. Additionally, we may incur additional costs to refund clients or repair or recall DIRTT Solutions, including costs to remedy the affected structures. We also may not be able to maintain insurance on acceptable terms that provide adequate protection against potential liabilities. Any such claims, if asserted, could require us to expend material time and efforts defending or resolving the claim and may materially and adversely affect our business, results of operations and financial condition.
Our software and products may have design defects, deficiencies, or risks, and we may incur additional costs to fix any defects, deficiencies or risks.
Our software and solutions are complex and must meet the technical requirements of our clients and applicable building codes and regulations. Our solutions may contain undetected errors or design and manufacturing defects, and our software may experience quality or reliability problems, or contain bugs or other defects. Software defects may also cause errors in our manufacturing or miscalculations in ordering pricing and could lead us to incur losses and lose market share to competitors. Product or software defects could cause us to incur warranty costs, product liability costs, and repair and remediation costs. Although we maintain commercial general liability and errors and omissions liability insurance, such insurance coverage may not be sufficient to protect us against substantial claims.
Our former co-founders’ competitive behavior against us could have a material adverse effect on our business, financial condition and results of operations.
On September 10, 2018, our co-founder and former Executive Chairman and Chief Executive Officer, Mogens Smed, left the Company. In connection with his departure, Mr. Smed entered into a settlement agreement (the “Settlement Agreement”) with the Company that provided, among other things, for the continued adherence to the non-compete and non-solicit obligations of his employment agreement. Mr. Smed, along with another former founder, Barrie Loberg, who was our former Vice President of Software Development, have started an interior construction and manufacturing company that we believe competes with us. Since January 2019, a number of our employees have departed to join this new company. Mr. Smed, Mr. Loberg and a number of our former employees who have joined their company have in-depth knowledge about our business, such as our customers, employees, Distribution Partners, consultants, products, policies, practices and prospects, and we may be adversely affected by increased competition arising out of this competing business venture. We believe that Messrs. Smed and Loberg are not permitted to solicit our current and former employees, Distribution Partners and customers or otherwise engage in competitive behavior. On May 9, 2019, we filed a lawsuit in the Court of Queen’s Bench of Alberta against Messrs. Smed and Loberg to enforce the terms of the Settlement Agreement and their respective obligations, including non-compete and non-solicit provisions, and they have denied liability and counterclaimed asserting rights to further compensation and damages for defamation. We are engaged in other litigation with Messrs. Smed and Loberg, or entities with which they are involved, relating to similar claims and disputes over alleged misappropriation of proprietary information by them or by us. See Item 3. “Legal Proceedings.” If Messrs. Smed and Loberg further engage in a competitive business against us or if we are not successful in enforcing the Settlement Agreement, our business, financial condition and results of operations may be adversely affected.
19
Table of Contents
We may be unable to protect our intellectual property adequately from infringement by third parties, and we may also be subject to claims that we infringe on intellectual property rights of others.
We expend considerable efforts to protect our intellectual property and to operate without infringing on the intellectual property rights of others. We rely on a combination of contract, copyright, patent, trademark and trade secret laws, confidentiality procedures and other measures to protect our proprietary information. There can be no assurance that our various patents, copyrights or trademarks will offer sufficient protection and prevent misappropriation of our proprietary rights. Additionally, our software copyright and other protections might not be adequate to protect our software and application code. We also may not be granted patents, copyrights or trademarks on our pending or proposed applications, and granted applications may be challenged, invalidated or circumvented in the future.
We will not be able to protect our intellectual property, trade secrets, or other proprietary information if we are unable to enforce our rights or if we do not detect unauthorized use of our intellectual property. Additionally, we may be required to spend significant resources to monitor and protect our intellectual property. Despite our precautions, it may be possible for unauthorized third parties to copy our applications and use information that we regard as proprietary to create products or services that compete with ours. We enforce our intellectual property rights where appropriate, but the cost of doing so may be substantial and could outweigh the potential benefits, and we may be unsuccessful in our enforcement efforts. Failure to protect or maintain the proprietary nature of our intellectual property could adversely affect our ability to sell original products and materially and adversely affect our business, financial condition and results of operations.
Additionally, our competitors, as well as a number of other entities and individuals, may own or claim to own intellectual property in technology areas relating to our technology, including ICE Software, manufacturing processes, and DIRTT Solutions. Although we do not believe that our software or DIRTT Solutions infringe on the proprietary rights of any third parties, claims may arise regarding infringement or invalidity claims (or claims for indemnification resulting from infringement claims). Such assertions or prosecutions, regardless of their merit, may subject us to significant liabilities, require us to enter into royalty and licensing arrangements on unfavorable terms, prevent us from assembling or licensing certain of our products, subject us to injunctions restricting our sale of products, cause severe disruptions to our operations or the marketplaces in which we compete, or require us to satisfy indemnification commitments with our clients, including contractual provisions under various license arrangements. A damages award against us could include an award of royalties or lost profits and, if the court finds willful infringement, treble damages and attorneys’ fees. This may cause us to expend significant costs and resources, and could adversely affect our business, financial condition or results of operations.
If we are unable to protect our information systems against data corruption, cyber-based attacks or network security breaches, our operations could be disrupted and our reputation and profitability could be negatively affected.
In the ordinary course of our business, we generate, collect and store confidential and proprietary information, including intellectual property and business information. While we do not generally collect information from clients and Distribution Partners, we may obtain certain of their information from time to time during the ordinary course of business. The secure storage, maintenance, and transmission of and access to this information is important to our operations and reputation. Various third parties, including computer hackers, who are continually becoming more aggressive and sophisticated, may attempt to penetrate our network security and, if successful, misappropriate confidential client, Distribution Partner, employee or supplier information. In addition, one of our Distribution Partners, employees, or other third parties with whom we do business may attempt to circumvent our security measures in order to obtain such information or may inadvertently cause a breach involving such information. There is no guarantee that our security systems, processes or procedures are adequate to safeguard against all data security breaches, misuse of data, cyber-attacks, acts of vandalism, computer viruses, misplaced or lost data, programming or human errors or other similar events. Any security breach involving the misappropriation, loss or other unauthorized disclosure of confidential information of a client, Distribution Partner, employee, supplier or Company information could result in financial losses, exposure to litigation risks and liability (including regulatory liability), damages to our reputation, and disruptions in our operations, all of which could have a material adverse effect on our business, financial condition and results of operations.
20
Table of Contents
The regulatory environment related to information security, data collection and use, and privacy is increasingly rigorous, with new and frequently changing requirements, and compliance with those requirements could result in additional costs. These costs associated with information security, such as increased investment in technology, the costs of compliance with privacy laws, and costs incurred to prevent or remediate information security breaches, could be substantial and adversely affect our business. A significant compromise of sensitive employee, Distribution Partner, client or supplier data in our possession could result in legal damages and regulatory penalties. In addition, the costs of defending such actions or remediating breaches could be material.
Damage to our information technology and software systems could impair our ability to effectively provide DIRTT Solutions, harm our reputation, and adversely affect our business.
Our information technology and software networks and systems, which include the processing, transmission and storage of information, are integrated with our manufacturing processes and essential to our business operations. These systems are vulnerable to, among other things, damage or interruption from power outages, network failures or natural disasters, loss or corruption of data, human error, employee misconduct and difficulties associated with upgrades, installations of major software or hardware, and integration with new systems. While we maintain retention backups to geo-diverse digital and physical locations and have a recovery data center, the data center and other protective measures we take could prove to be inadequate. Any disruption in our systems or unauthorized disclosure of information could result in delayed manufacturing and delivery of our DIRTT Solutions, legal claims, a loss of intellectual property and a disruption in operations, all of which could adversely affect our reputation, relationships with clients, financial condition and results of operations.
We are subject to fluctuations in the prices of our commodities, including raw materials, which could adversely affect our financial condition and results of operations.
We experience fluctuations in the cost of our raw materials, including aluminum, glass and wood. A variety of factors over which we have no control, such as global demand for aluminum, fluctuations in transportation costs, speculation in commodities futures, changes in laws or regulations, and the creation of new materials or products based on new technologies may affect the purchase and transportation costs and availability of raw materials that we use to manufacture DIRTT Solutions. These factors may also magnify the effect of economic cycles on our business. In addition, we have not historically entered into long-term agreements with vendors and, if we continue to do so, we may be exposed to short-term and long-term price fluctuations as a result.
Aluminum represents the largest component of our raw materials consumption. Substantial, prolonged upward trends in aluminum prices could significantly increase the cost of our aluminum needs and have an adverse effect on our financial condition and results of operations. We have experienced fluctuations in the price of aluminum and anticipate that these fluctuations will continue in the future. In 2018, the U.S. government imposed tariffs on steel and aluminum and limited the amounts of steel and aluminum coming into the United States based on the countries of origin of those imports. In 2018 and 2019, we sourced the majority of our aluminum from North America and sourced under 10% of our raw materials from outside North America. Nonetheless, tariffs and import limitations may increase the prices we pay for aluminum. Increases in the price that we pay for our commodities, including raw materials, could adversely affect our liquidity, operating margins, and financial condition.
We rely on a limited number of outside suppliers for certain key components and materials, and failure or delay in obtaining the necessary components or materials could delay or prevent the manufacturing or distribution of our DIRTT Solutions.
We rely on certain key suppliers for raw materials and components, including aluminum, glass and wood. We maintain multiple suppliers for key materials, although two suppliers accounted for approximately 32% and 21% of our aluminum supply for the year ended December 31, 2019. While we believe there are other vendors for most of our key requirements, certain materials meeting our quality standards are available only through a limited number of vendors. If we are required to obtain another source for these materials or components, we may not be able to obtain pricing on as favorable terms or on terms comparable to our competitors. Any failure or delay in obtaining the necessary raw materials in the quantities and quality required may result in increased costs and delays in manufacturing or distributing our products, which could have a material adverse effect on our liquidity, financial condition, or results of operations. A vendor may also choose, subject to existing contracts, to modify its relationship with us due to general economic concerns or specific concerns relating to that vendor or us, at any time. These modifications might include additional requirements from our suppliers that we provide them additional security in the form of prepayments or with letters of credit. Any significant change in the terms that we have with our key suppliers could materially and adversely affect our liquidity, financial condition, or results of operations.
21
Table of Contents
Our current manufacturing facilities may reach capacity, and we may have difficulty procuring adequate manufacturing space to meet our needs.
We have manufacturing facilities in Calgary, Alberta; Phoenix, Arizona; and Savannah, Georgia. Our wall tiles, millwork and timber solutions are manufactured in Calgary, while aluminum, glass and power components are manufactured in all three locations. We may be constrained by physical capacity in our facilities. While we may address increased short-term demands through the addition of production shifts in our manufacturing facilities, we may need to expand our current manufacturing capabilities and add or expand facilities within the next two to three years. For example, we are in the process of constructing a build-to-suit combined tile and millwork factory in Rock Hill, South Carolina. If we are unable to timely meet increased demands, we could experience delays in production and shipments of product due to both the loss of inventory and materials storage and production capacity, which would materially and adversely affect our financial condition and results of operations.
We may incur significant costs complying with environmental, health and safety laws and related claims, and failure to comply with these laws and regulations could expose us to significant liabilities, which could materially adversely affect our results of operations.
We are subject to laws, regulations, and other requirements with respect to workers’ health and safety and environmental matters in the United States, Canada and other countries in which we operate. The costs of compliance with such laws and regulations could adversely affect our liquidity, financial condition, or results of operations. Environmental laws and regulations impose, among other things, restrictions, liabilities and obligations in connection with the production, processing, preparation, handling, storage, transportation, disposal and management of wastes and other substances, and the prevention and remediation of environmental effects. More stringent laws and regulations relating to climate change and emission of greenhouse gases may be adopted in the future and could impact our facilities, raw material suppliers, the transportation and distribution of our solutions, and our clients, which could reduce demand for our solutions or cause us to incur additional operating costs. Health and safety laws and regulations impose, among other things, requirements designed to ensure the protection of workers. In addition, we are required to obtain numerous governmental permits in order to operate our facilities and in connection with the design, development, manufacture and transport of our products and the storage, use, handling and disposal of hazardous substances, including environmental, health and safety laws, regulations and permits governing air emissions. If we fail to comply with these requirements, we could be subject to civil or criminal liability, damages and fines, and our operations could be curtailed, suspended or shutdown and our reputation, ability to attract employees, and results of operations could be adversely affected. In addition, certain foreign laws and regulations may affect our ability to export products outside of or import into the United States or Canada. Although we handle minimal quantities of hazardous substances, existing environmental, health and safety laws and regulations apply to our operations, new laws and regulations could be adopted or become applicable to us or our products, and future changes in environmental, health and safety laws and regulations could occur. These factors may materially increase the amount we must invest to bring our processes into compliance with legal requirements and impose additional expenses on our operations.
Private lawsuits, including claims for remediation of contamination, personal injury or property damage, or actions by regional, national, state and local regulatory agencies, including enforcement or cost-recovery actions, may materially increase our costs. Certain environmental laws make us potentially liable on a joint and several basis for the remediation of contamination at or emanating from properties or facilities that we currently or formerly owned or operated or properties to which we arranged for the disposal of hazardous substances. Such liability may require us to pay more than our proportionate share based on our contribution to the amount or type of waste we dispose and could require us to address contamination caused by others. Any changes in these laws or regulations or changes in our manufacturing processes may require us to request changes to our existing permits or obtain new permits. Any requests to change our existing permits or obtain new permits may be delayed or denied and may require us to modify our manufacturing processes, which could be costly and time consuming and could adversely affect our business and results of operations.
22
Table of Contents
We may not be able to obtain or maintain, from time to time, all required environmental regulatory approvals. A delay in obtaining any required environmental regulatory approvals or failure to obtain and comply with them could materially adversely affect our business and results of operations.
We are exposed to currency exchange rates, tax rates and other fluctuations, including those resulting from changes in laws.
Our revenues and expenses are collected and paid in different currencies, including the U.S. dollar and Canadian dollar. Fluctuations in the value of any such currency expose us to foreign exchange risk and could have a material and adverse effect on our cash flows, revenues and results of operations. We also have currency exchange exposure to the extent of a mismatch between foreign-currency denominated revenues and expenditures – in particular, where U.S. dollar revenues do not equal U.S. dollar expenditures. We are not currently using exchange rate derivatives to manage currency exchange rate risks. There are currently no significant restrictions on the repatriation of capital and distribution of earnings to foreign entities from any of the jurisdictions in which we operate. There can be no assurance that such restrictions will not be imposed in the future.
Compliance with new or amended tax laws and regulations could have a material adverse effect on our business. We operate in multiple jurisdictions, including the United States and Canada, and may therefore be subject to the tax laws and regulations of such jurisdictions. For instance, the U.S. 2017 Tax Cuts and Jobs Act was enacted on December 22, 2017, and significantly affected U.S. tax law; it also affected our business and financial condition because historically, approximately 80% to 85% of our revenue has been derived from U.S. projects.
We base our tax positions upon our understanding of the tax laws of and applicable tax treaties in the various countries in which we have assets or conduct business activities. However, our tax positions are subject to review and possible challenges by taxing authorities, including allocation of income, transfer pricing and other complex issues. This includes adverse changes to the manner in which Canada, the United States and other countries tax local and foreign corporations and interpret or change their tax laws and applicable tax treaties. We cannot determine in advance the extent to which such jurisdictions may review our positions or assess additional taxes or interest and penalties on such taxes. In addition, our effective tax rate may be increased by changes in the valuation of deferred tax assets and liabilities, our cash management strategies, local tax rates, or interpretations of tax laws.
We may be subject to legal and regulatory proceedings for a variety of claims, which could subject us to significant costs and judgments and divert management’s attention from our business.
From time to time we may become involved in litigation for a variety of claims relating to our operations, solutions, contracts, relationships or other circumstances, or may become involved in regulatory proceedings. We may also be subject to claims arising from personal injuries or workers’ compensation occurring on our properties, including our manufacturing facilities. We are party to potentially material legal proceedings. See Item 3. “Legal Proceedings.” We are not currently party to any material regulatory proceedings against us. The defense of litigation, including fees of legal counsel, expert witnesses and related costs, is expensive and difficult to forecast accurately. In general, such costs are unrecoverable even if we ultimately prevail in litigation and could represent a significant use of our capital resources. To defend lawsuits, it is also necessary for us to divert the attention and resources of officers and other employees from their normal business functions to gather evidence, give testimony and otherwise support litigation efforts.
The outcome of any litigation, regardless of its merits, is inherently uncertain. Given the inherent uncertainties in evaluating certain exposures, actual costs to be incurred in future periods may vary from our estimates for such contingent liabilities. There can be no assurance that we will be able to continue to successfully avoid, manage and defend such matters. If we are unsuccessful in defending any litigation or claims, we could face material judgments or awards against us, which could adversely affect our reputation, business, financial condition, and results of operations.
23
Table of Contents
We may be subject to increased counterparty credit risk resulting from, among other things, an increase in the number of Distribution Partners and clients.
Continued growth of our Distribution Partner network and client base increases our exposure to credit risk related to amounts due from our Distribution Partners and their clients. Our Distribution Partners purchase DIRTT Solutions from us directly. We routinely monitor the financial condition of our Distribution Partners and their clients, and review the credit history of our new Distribution Partners and their clients, to establish credit limits. While we establish an allowance for doubtful accounts that corresponds to our estimate of the credit risk of our Distribution Partners and their clients based on historical trends and economic circumstances, there can be no assurances that our estimates and assumptions regarding allowance for doubtful accounts will prove to be accurate. We could realize additional losses if Distribution Partners or their clients default on their outstanding balance beyond our allowance for doubtful accounts, which would adversely affect our liquidity, financial condition and results of operations.
We may have future capital needs and may not be able to obtain additional capital or financing on acceptable terms.
We plan to continually invest in business growth and may require additional funds to respond to business opportunities. Such investments may relate to expanding sales and marketing activities; developing our Distribution Partner network; developing new software, products or features; enhancing our operating infrastructure; acquiring complementary businesses and technologies; expanding our manufacturing capacity; or investing in innovation and operational capacity ahead of anticipated growth, including commencing factory automation. To the extent that our existing capital is insufficient to meet our requirements, we may need to undertake equity or debt financings to secure additional funds. Further issuances of equity or convertible debt securities may result in significant share dilution. Additional new equity securities issued could have rights, preferences and privileges superior to those of currently issued and outstanding common shares.
Additional debt financings may involve restrictive covenants relating to our capital-raising activities and other financial and operational matters, which may make it more difficult for us to obtain additional capital and to pursue business opportunities. We cannot provide any assurance that sufficient debt or equity financing will be available for necessary or desirable expenditures or acquisitions, or to cover losses, and accordingly, our ability to continue to support our business growth and to respond to business challenges could be significantly limited, and our liquidity could be materially and adversely affected.
The agreements that govern our indebtedness contain a number of covenants that impose significant operating and financial restrictions, including restrictions on our ability to engage in activities that may be in our best long-term interests.
On October 21, 2013, we entered into an Amended and Restated Loan Agreement (as amended, the “Comerica Credit Facility”) with Comerica Bank, as subsequently amended, pursuant to which we had access to a $18.0 million revolving operating facility. The Comerica Credit Facility expired on June 30, 2019.
On July 19, 2019, we entered into a C$50 million senior secured revolving credit facility with the Royal Bank of Canada (the “RBC Credit Facility”). The RBC Credit Facility includes covenants that, among other things, impose significant operating and financial restrictions, including restrictions on our ability to engage in activities that may be in our best long-term interests. These covenants may restrict our ability to (i) make certain acquisitions or dispose of our property; (ii) consolidate, amalgamate, merge, or otherwise permit a material change in our corporate or capital structure; (iii) incur additional debt, other than permitted debt; (iv) permit encumbrances on certain assets to secure debt; and (v) pay dividends on or make other distributions in respect of our common shares or redeem, repurchase or retire our common shares or subordinated debt or make certain other restricted payments.
24
Table of Contents
We are also required to maintain specified financial ratios. Our ability to meet these ratios could be affected by events beyond our control, and we cannot assure you that we will meet them. A breach of any of the restrictive covenants or ratios may result in an event of default, or may limit our ability to borrow, under the RBC Credit Facility. If any such default occurs, the lender under the RBC Credit Facility may be able to elect to declare all outstanding borrowings, together with accrued and unpaid interest and other fees, to be immediately due and payable, or enforce their security interest. The lender may also have the right in these circumstances to terminate commitments to provide further borrowings.
We have experienced a history of losses, and despite certain periods of profitability in recent years, we may not be able to generate sufficient revenue to achieve and sustain profitability.
We have incurred significant losses since commencing business. We incurred net losses of $4.4 million and $7.7 million for the years ended December 31, 2019 and 2017, respectively. At December 31, 2019, we had an accumulated deficit of $46.0 million. These losses and accumulated deficits were due in part to the substantial investments made to grow our business and acquire clients, to further develop our service offerings through product and software development, and to ensure that we have sufficient production capacity and capability to deliver on our commitment of rapid delivery times. Past results may not be indicative of our future performance, and there can be no assurance that we will generate net income in the future.
We may not have insurance adequate in amount or coverage to protect us from all claims that may arise in connection with our business and operations.
While we currently maintain insurance of the types and amounts we consider commercially prudent and consistent with industry practice, including directors and officers, errors and omissions, property, and general liability insurance, we may not be fully insured against all risks incident to our business. There can be no assurance that insurance coverage will be available in the future on commercially reasonable terms or at commercially reasonable rates. There can also be no assurance that the amounts for which we are insured, or the proceeds of such insurance, will fully compensate us for any losses. In addition, the insurance coverage obtained with respect to our business and facilities will be subject to limits and exclusions or limitations on coverage that are considered by management to be reasonable, given the cost of procuring insurance and current operating conditions. If a significant event occurs that is not fully insured, it could adversely affect our financial condition and results of operations.
We may engage in future mergers, acquisitions, agreements, consolidations or other corporate transactions that could adversely affect our business, financial condition, and results of operations.
While we have no specific plans to acquire any businesses, we may, in the future, seek to expand our business and capabilities through acquiring compatible technology, products or businesses. Additionally, we may explore other corporate transactions, including mergers, agreements, consolidations, or joint ventures, that we believe may be beneficial to our business or further specific business goals. Acquisitions involve certain risks and uncertainties, including, among other things, (i) difficulty integrating the newly acquired businesses and operations in an efficient and cost-effective manner; (ii) inability to maintain relationships with key clients, vendors and other business partners of the acquired businesses; (iii) potential loss of key employees of the acquired businesses; (iv) exposure to litigation or other claims in connection with our assumption of certain claims and liabilities of the acquired businesses; (v) diversion of management’s time and focus; and (vi) possible write-offs or impairment charges related to the acquired business. The occurrence of any of these risks could adversely affect our business, results of operations, and financial condition.
To the extent we are successful in identifying suitable businesses or products for acquisition, we may deem it necessary or advisable to finance such acquisitions through issuing common shares, securities convertible into common shares, debt financing, or a combination thereof. In such cases, issuing common shares or convertible securities could result in dilution to our shareholders at the time of such issuance or conversion. We may also pursue issuing debt to finance acquisitions, which may result in, among other things, the encumbrance of certain of our assets, impediment of our ability to obtain bank financing, and a decrease in our liquidity.
25
Table of Contents
Risks Related to Our Common Shares
Our share price has been and may continue to be volatile, which could cause the value of your investment to decline.
Our common shares are currently listed on the TSX under the symbol “DRT” and on Nasdaq under the symbol “DRTT.” The price of our common shares has in the past fluctuated significantly, and may fluctuate significantly in the future, depending upon a number of factors, many of which are beyond our control and may adversely affect the market price of our common shares. These factors include: (i) variations in quarterly results of operations; (ii) deviations in our earnings from publicly disclosed forward-looking guidance; (iii) changes in earnings estimates by analysts; (iv) our announcements or our competitors’ announcements of significant contracts, acquisitions, strategic partnerships or joint ventures; (v) general conditions in the offsite construction and manufacturing industries; (vi) sales of our common shares by our significant shareholders; (vii) fluctuations in stock market price and volume; and (viii) other general economic conditions.
In the past, following periods of volatility in the trading price of a company’s securities, securities class action litigation have been brought against that company. If our share price is volatile, we may become the target of securities litigation in both the United States and Canada. Securities litigation could result in substantial costs and divert management’s attention and resources from our business and could have an adverse effect on our business, financial condition and results of operations.
The requirements of being a public company in the United States and Canada and maintaining a dual listing on both Nasdaq and the TSX, including compliance with the reporting requirements of the Exchange Act, the requirements of the Sarbanes-Oxley Act of 2002 (“Sarbanes-Oxley”) and applicable securities laws of Canada, may strain our resources, increase our costs, and require significant management time and resources.
As a public company in the United States, we need to comply with new laws, regulations and requirements, certain corporate governance provisions of Sarbanes-Oxley, related regulations of the SEC and the requirements of Nasdaq, with which we are not required to comply as a public company in Canada listed on the TSX. Specifically, we may incur significant additional accounting, legal, reporting and other expenses in order to maintain a dual listing on both Nasdaq and the TSX, including the costs of listing on two exchanges. Complying with these statutes, regulations and requirements, as well as any applicable securities laws of Canada, occupies a significant amount of time of our Board of Directors (the “Board”) and management and increases our costs and expenses, including an increased reliance on outside counsel and accountants. We also prepare and distribute periodic public reports in compliance with our obligations under the U.S. federal securities laws, in addition to applicable securities laws of Canada.
Shareholder activism, the current political environment and the current high level of government intervention and regulatory reform may lead to substantial new regulations and disclosure obligations, which could then result in additional compliance costs and affect the manner in which we operate our business. Moreover, any new regulations or disclosure obligations may increase our legal and financial compliance costs and may make some activities more time-consuming and costly.
Furthermore, while we generally must comply with Section 404 of Sarbanes-Oxley for our fiscal year ending December 31, 2019, we are not required to have our independent registered public accounting firm attest to the effectiveness of our internal controls until our first annual report subsequent to our ceasing to be an “emerging growth company” within the meaning of the Exchange Act. Once it is required to do so, our independent registered public accounting firm may issue a report that is adverse in the event it is not satisfied with the level at which our controls are documented, designed, operated or reviewed. Compliance with these requirements may strain our resources, increase our costs and use significant management time and resources, and we may be unable to comply with these requirements in a timely or cost-effective manner.
26
Table of Contents
In addition, we expect that being a public company in the United States subject to these rules and regulations may make it more difficult and more expensive for us to obtain or maintain additional director and officer liability insurance, and we may be required to accept reduced policy limits and coverage or incur substantially higher costs to obtain or maintain the same or similar coverage. As a result, it may be more difficult for us to attract and retain qualified individuals to serve on our Board or as executive officers. We cannot predict or estimate the amount of additional costs we may incur in the future or the timing of such costs in order to maintain the same or similar coverage.
For as long as we are an “emerging growth company,” we will not be required to comply with certain reporting requirements that apply to some other public companies, and such reduced disclosures requirement may make our Common Shares less attractive.
As an “emerging growth company” as defined in the JOBS Act, we may take advantage of exemptions from certain disclosure requirements applicable to other public companies that are not emerging growth companies. We are an emerging growth company until the earliest of (i) the last day of the fiscal year during which we have total annual gross revenues of $1.07 billion or more; (ii) the last day of the fiscal year following the fifth anniversary of the first sale of common equity securities pursuant to an effective registration statement under the Securities Act; (iii) the date on which we have, during the previous three-year period, issued more than $1 billion in non-convertible debt; or (iv) the date on which we are deemed to be a “large accelerated filer” under the rules of the SEC.
For so long as we remain an “emerging growth company,” we will not be required to, among other things:
| • | have an auditor report on our internal control over financial reporting pursuant to Sarbanes-Oxley; |
| • | comply with any new requirements adopted by the Public Company Accounting Oversight Board requiring mandatory audit firm rotation or a supplement to the auditor’s report providing additional information about our audit and our financial statements; |
| • | include detailed compensation discussion and analysis in our filings under the Exchange Act and instead may provide a reduced level of disclosure concerning executive compensation; and |
| • | hold a non-binding stockholder advisory vote on executive compensation and stockholder approval of any golden parachute payments not previously approved. |
Because of these exemptions, some investors may find our common shares less attractive, which may result in a less active trading market for our common shares, and our share price may be more volatile.
We historically have not paid dividends on our common shares.
We have not declared or paid any dividends on common shares to date. The declaration and payment of dividends is at the discretion of the Board, taking into account our earnings, capital requirements and financial condition, restrictions on our ability to pay dividends under our credit facilities, and such other factors as the Board considers relevant. Our RBC Credit Facility generally limits our ability to pay any dividends or make any other distribution on our outstanding capital shares. See Item 7. “Management’s Discussion and Analysis of Financial Condition and Results of Operations – Credit Facility” for more information.
We are governed by the corporate laws of Alberta, Canada, which in some cases have a different effect on shareholders than the corporate laws of the United States.
We are governed by the ABCA and other relevant laws, which may affect the rights of shareholders differently than those of a company governed by the laws of a U.S. jurisdiction, and may, together with our charter documents, have the effect of delaying, deterring or discouraging another party from acquiring control of our company by means of a tender offer, a proxy contest or otherwise, or may affect the price an acquiring party would be willing to offer in such an instance. The material differences between the ABCA and Delaware General Corporation Law (“DGCL”), that may have the greatest such effect include, but are not limited to, the following: (i) for certain extraordinary corporate transactions (such as amalgamations or amendments to our articles), the ABCA generally requires the voting threshold to be a special resolution passed by a majority of not less than two-thirds of the votes cast by the shareholders who voted in respect of the resolution, whereas DGCL generally only requires a majority vote; and (ii) under the ABCA, registered holders or beneficial owners (as defined in the ABCA) of not less than 5% of our common shares in aggregate can requisition our directors to call a special meeting of shareholders, whereas such right does not exist under the DGCL. We cannot predict whether investors will find our company and our common shares less attractive because we are governed by foreign laws.
27
Table of Contents
Because we are a corporation incorporated in Alberta and some of our directors and officers are resident in Canada, it may be difficult for investors in the United States to enforce civil liabilities against us based solely upon the federal securities laws of the United States. Similarly, it may be difficult for Canadian investors to enforce civil liabilities against our directors and officers residing outside of Canada.
We are a corporation amalgamated and existing under the laws of Alberta with our principal place of business in Calgary, Alberta, Canada. Some of our directors and officers are residents of Canada and a substantial portion of our assets and those of such persons are located outside the United States. Consequently, it may be difficult for U.S. investors to effect service of process within the United States upon us or our directors or officers who are not residents of the United States, or to realize in the United States upon judgments of courts of the United States predicated upon civil liabilities under the Securities Act. Investors should not assume that Canadian courts: (1) would enforce judgments of U.S. courts obtained in actions against us or such persons predicated upon the civil liability provisions of the U.S. federal securities laws or the securities or blue sky laws of any state within the United States or (2) would enforce, in original actions, liabilities against us or such persons predicated upon the U.S. federal securities laws or any such state securities or blue sky laws.
Similarly, some of our directors and officers are residents of countries other than Canada and all or a substantial portion of the assets of such persons are located outside Canada. As a result, it may be difficult for Canadian investors to initiate a lawsuit within Canada against these non-Canadian residents. In addition, it may not be possible for Canadian investors to collect from these non-Canadian residents judgments obtained in courts in Canada predicated on the civil liability provisions of securities legislation of certain of the provinces and territories of Canada. It may also be difficult for Canadian investors to succeed in a lawsuit in the United States, based solely on violations of federal, provincial or territorial securities laws.
If securities or industry analysts do not publish research or publish inaccurate or unfavorable research about our business, our share price and trading volume could decline.
The trading market for our common shares depends on the research and reports that securities or industry analysts publish about us, our business, our market or our competitors. We do not have any control over these analysts and cannot assure you that analysts will cover us or provide favorable coverage. If one or more of the analysts who cover us downgrade our stock or change their opinion of our common shares, our share price would likely decline. If one or more of these analysts cease coverage of our company or fail to regularly publish reports on us, we could lose visibility in the financial markets, which could cause our share price or trading volume to decline.
We could be treated as a “passive foreign investment company” for U.S. federal income tax purposes under certain circumstances, which would have adverse U.S. federal income tax consequences to U.S. Holders of our common shares.
A non-U.S. entity treated as a corporation for U.S. federal income tax purposes will be treated as a “passive foreign investment company” (a “PFIC”) for U.S. federal income tax purposes if 75% or more of its gross income for any taxable year consists of passive income or 50% or more of the average value of its assets produce, or are held for the production of, passive income. For purposes of these tests, passive income generally includes dividends, interest, gains from the sale or exchange of investment property, and rents and royalties other than rents and royalties that are received from unrelated parties in connection with the active conduct of a trade or business. We do not believe that we are currently a PFIC, and we do not anticipate becoming a PFIC in the foreseeable future. However, because there are uncertainties in the application of the relevant rules and PFIC status is a factual determination made annually after the close of each taxable year, there can be no assurance that we will not be a PFIC for the current taxable year or any future taxable year.
28
Table of Contents
If we are or have been a PFIC in any taxable year, a U.S. Holder (as defined below) may incur significantly increased U.S. federal income tax on gain recognized on the sale or other disposition of our common shares and on the receipt of distributions on our common shares to the extent such gain or distribution is treated as an “excess distribution” under the U.S. federal income tax rules, and such holder may be subject to burdensome reporting requirements. Further, if we are a PFIC for any year during which a U.S. Holder holds our common shares, we generally will continue to be treated as a PFIC for all succeeding years during which such U.S. Holder holds our common shares. Please see “Certain United States Federal Income Tax Considerations for U.S. Holders – Passive Foreign Investment Company Considerations” for a more detailed discussion of the U.S. federal income tax consequences to U.S. Holders if we are treated as a PFIC.
For purposes of this discussion, a “U.S. Holder” is a beneficial owner of our common shares that is for U.S. federal income tax purposes any of the following: an individual who is a citizen or resident of the United States; a corporation (or other entity treated as a corporation for U.S. federal income tax purposes) created or organized in or under the laws of the United States, any state thereof or the District of Columbia; an estate the income of which is subject to U.S. federal income tax regardless of its source; or a trust (i) the administration of which is subject to the primary supervision of a U.S. court and which has one or more United States persons who have the authority to control all substantial decisions of the trust or (ii) which has made a valid election under applicable U.S. Treasury regulations to be treated as a United States person.
Nasdaq or the TSX may delist our securities from its exchange, which could limit investors’ ability to make transactions in our securities and subject us to additional trading restrictions.
Our securities may fail to meet the continued listing requirements to be listed on the Nasdaq or TSX. If Nasdaq or the TSX delists our common shares from trading on its exchange, we could face significant material adverse consequences, including:
| • | a limited availability of market quotations for our securities; |
| • | reduced liquidity with respect to our securities; |
| • | a determination that our common shares are a “penny stock,” which will require brokers trading in our common shares to adhere to more stringent rules and possibly result in a reduced level of trading activity in the secondary trading market for our common shares; |
| • | a limited amount of news and analyst coverage for our company; and |
| • | a decreased ability to issue additional securities or obtain additional financing in the future. |
| Item 1B. | Unresolved Staff Comments. |
None.
| Item 2. | Properties. |
Our principal executive offices are located in Calgary, Alberta, where we lease approximately 73,000 square feet of office and manufacturing space. Our lease expires in September 2022. Our principal manufacturing facilities are located in Calgary, Alberta; Phoenix, Arizona; and Savannah, Georgia. Our wall tiles, millwork and timber solutions are manufactured in Calgary, while aluminum, glass and power components are manufactured in all three locations. In Calgary, we lease an aggregate of approximately 358,000 square feet of manufacturing space across three facilities (excluding our principal offices), which leases expire in January 2023 and January 2024. In Phoenix, we lease approximately 130,000 square feet of manufacturing space across two facilities, which leases expire in March 2022 and March 2027. In Savannah, we lease approximately 81,000 square feet of manufacturing space, which lease expires in February 2029. In October 2019, we entered into a 15-year lease for a build-to-suit combined tile and millwork factory of approximately 130,000 square feet in Rock Hill, South Carolina. Should the need arise, we have the expansion rights to lease an additional 130,000 square feet of space.
29
Table of Contents
Our ICE development offices are located in Calgary, Alberta and Salt Lake City, Utah. In Calgary, we sublease approximately 8,700 square feet of office space pursuant to a lease that expires on July 31, 2021. In our Salt Lake City development office, which also houses a DXC, we lease approximately 6,600 square feet of office space pursuant to a lease that expires in December 2023. In Chicago, Illinois, we own approximately 6,200 square feet of office space, which we use to operate a DXC.
Through distributed manufacturing we can shift production of some products among our manufacturing sites, reduce transportation times and costs, and meet targeted lead times. We believe that our current and planned facilities are adequate for our current needs and that suitable additional or substitute space would be available if needed.
| Item 3. | Legal Proceedings. |
On November 5, 2019, Falkbuilt Ltd. (“Falkbuilt”) filed a lawsuit against us in the Court of Queen’s Bench of Alberta, Canada. Falkbuilt alleges that we have misappropriated and misused their alleged proprietary information in furtherance of our own product development. Falkbuilt seeks monetary relief, including, among other things, damages of approximately C$30.0 million, disgorgement of profits, punitive damages, and attorneys’ fees, and an interim, interlocutory and permanent injunction of our use of the alleged proprietary information. Falkbuilt is affiliated with certain of our former employees, including Mogens Smed, our co-founder and former Executive Chairman and Chief Executive Officer, and Barrie Loberg, our former Vice President of Software Development. As previously disclosed, on May 9, 2019, we filed a lawsuit in the Court of Queen’s Bench of Alberta against Mr. Smed and Mr. Loberg, to enforce the terms of our Settlement Agreement and their respective obligations, including non-compete and non-solicit provisions, that we entered into in connection with their departure. Subsequently, on June 14, 2019, Falkbuilt filed a counterclaim alleging, among other things, breach of contractual obligations and defamation, and seeking damages in excess of C$2.0 million, plus punitive damages. We believe that Falkbuilt’s lawsuit against us is part of their litigation strategy related to our lawsuit against them, and we believe it is without merit. We intend to defend it vigorously and to continue to pursue our legal remedies against Messrs. Smed and Loberg and their company, Falkbuilt. Consistent with that intent, on December 11, 2019, we filed a federal lawsuit in the U.S. District Court of Utah against Falkbuilt, Falk Mountain States, LLC, Kristy Henderson, and former DIRTT employee Lance Henderson. This action seeks to restrain the defendants from misappropriating DIRTT’s confidential information, trade secrets, business intelligence and customer information, and using that information to advance Falkbuilt’s U.S. businesses to the detriment of DIRTT. On February 5, 2020, Falkbuilt filed its answer to our U.S. claim, together with a counterclaim alleging defamation and intentional interference with economic relations. Falkbuilt is seeking damages in excess of $3.0 million, plus punitive damages. Again, we believe Falkbuilt’s claim is without merit and we intend to defend it vigorously and to continue to pursue our legal remedies against Falkbuilt, Falk Mountain States, LLC, Ms. Henderson and Mr. Henderson.
We may, from time to time, become involved in other legal proceedings or be subject to claims arising in the ordinary course of business, including the initiation and defense of proceedings to protect intellectual property rights, product liability claims and employment claims. Regardless of the outcome, litigation can have an adverse impact on us because of defense and settlement costs, diversion of management resources and other factors. In the opinion of our management, none of the pending litigation, disputes or claims against us will have a material adverse effect on our financial condition, cash flows or results of operations.
| Item 4. | Mine Safety Disclosures. |
Not applicable.
30
Table of Contents
PART II
| Item 5. | Market for Registrant’s Common Equity, Related Stockholder Matters and Issuer Purchases of Equity Securities. |
Market Information; Holders of Record
Our common shares are traded on the TSX under the symbol “DRT” and on Nasdaq under the symbol “DRTT.”
As of February 19, 2020, there were 84,681,364 common shares outstanding and 214 shareholders of record.
Dividends
We have not declared or paid any cash dividends on our common shares to date. The declaration and payment of dividends is at the discretion of the Board, taking into account (i) our earnings, capital requirements and financial condition, (ii) restrictions on our ability to pay dividends under our RBC Credit Facility, and (iii) such other factors as the Board considers relevant. Our RBC Credit Facility generally limits our ability to pay any dividends or make any other distribution on our outstanding capital shares. See Item 7. “Management’s Discussion and Analysis of Financial Condition and Results of Operations – Credit Facility” for more information.
31
Table of Contents
Performance Graph
The following graph illustrates a comparison of the total cumulative shareholder return of our common shares with the cumulative return of the S&P/TSX Composite Index and the S&P 600 Building Products Index for the period commencing December 31, 2014 and ending on December 31, 2019. The graph assumes an initial investment of $100 on December 31, 2014, in our common shares, the shares comprising the S&P/TSX Composite Index, and the shares comprising the S&P 600 Building Products Index. The below shareholder return calculations are based on the exchange rates as reported by the H.10 statistical release of the Board of Governors of the Federal Reserve System as of the year-end exchange rate for the applicable period. The comparisons in the table are required by the SEC and applicable securities laws in Canada and are not intended to forecast or be indicative of possible future performance of our common shares. This graph and related materials shall not be deemed “soliciting material” or be deemed “filed” for purposes of Section 18 of the Exchange Act, or otherwise subject to the liabilities under that section, and shall not be deemed to be incorporated by reference into any of our filings under the Securities Act, whether made before or after the date hereof and irrespective of any general incorporation language in any such filing.
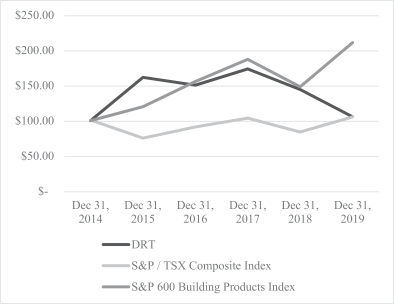
| $100 investment in stock or index |
Ticker | December 31, 2014 |
December 31, 2015 |
December 31, 2016 |
December 31, 2017 |
December 31, 2018 |
December 31, 2019 |
|||||||||||||||||||
| DIRTT Environmental Solutions Ltd. |
DRT | $ | 100.00 | $ | 192.78 | $ | 174.17 | $ | 187.22 | $ | 169.72 | $ | 118.06 | |||||||||||||
| S&P/TSX Composite Index |
SPTSX | $ | 100.00 | $ | 75.28 | $ | 91.18 | $ | 103.70 | $ | 84.06 | $ | 105.41 | |||||||||||||
| S&P 600 Building Products Index |
SML | $ | 100.00 | $ | 119.97 | $ | 155.69 | $ | 187.18 | $ | 148.26 | $ | 210.89 | |||||||||||||
Recent Sales of Unregistered Securities; Issuer’s Purchases of Equity Securities
None.
32
Table of Contents
| Item 6. | Selected Financial Data. |
The selected consolidated financial data set forth below are derived from our audited consolidated financial statements and may not be indicative of future operating results. The following selected consolidated financial data should be read in conjunction with Item 7. “Management’s Discussion and Analysis of Financial Condition and Results of Operations” and the consolidated financial statements and the notes thereto included elsewhere in this Annual Report. The consolidated selected financial data in this section are not intended to replace our consolidated financial statements and the related notes included elsewhere in this Annual Report. Our historical results are not necessarily indicative of our future results.
| Years Ended December 31, | ||||||||||||||||
| 2019 | 2018 | 2017 | 2016 | |||||||||||||
| (in thousands, except per share data) | ||||||||||||||||
| Revenue |
||||||||||||||||
| Product revenue |
$ | 240,659 | $ | 266,434 | $ | 216,216 | $ | 196,482 | ||||||||
| Service revenue |
7,046 | 8,247 | 10,323 | 4,882 | ||||||||||||
|
|
|
|
|
|
|
|
|
|||||||||
| Total revenue |
247,735 | 274,681 | 226,539 | 201,364 | ||||||||||||
|
|
|
|
|
|
|
|
|
|||||||||
| Cost of sales |
||||||||||||||||
| Product cost of sales |
153,128 | 161,844 | 131,326 | 117,600 | ||||||||||||
| Costs of under-utilized capacity |
2,240 | — | — | — | ||||||||||||
| Service cost of sales |
5,943 | 5,828 | 9,724 | 4,620 | ||||||||||||
|
|
|
|
|
|
|
|
|
|||||||||
| Total cost of sales |
161,311 | 167,672 | 141,050 | 122,220 | ||||||||||||
|
|
|
|
|
|
|
|
|
|||||||||
| Gross profit |
86,424 | 107,009 | 85,489 | 79,144 | ||||||||||||
| Total operating expenses(1)(2) |
88,875 | 101,315 | 91,990 | 72,114 | ||||||||||||
|
|
|
|
|
|
|
|
|
|||||||||
| Operating income (loss) |
(2,451 | ) | 5,694 | (6,501 | ) | 7,030 | ||||||||||
| Foreign exchange (gain) loss |
1,324 | (3,214 | ) | 665 | 433 | |||||||||||
| Interest income |
(529 | ) | (425 | ) | (399 | ) | (457 | ) | ||||||||
| Interest expense |
131 | 503 | 500 | 213 | ||||||||||||
|
|
|
|
|
|
|
|
|
|||||||||
| Net income (loss) before tax |
(3,377 | ) | 8,830 | (7,267 | ) | 6,841 | ||||||||||
|
|
|
|
|
|
|
|
|
|||||||||
| Income taxes |
1,019 | 3,280 | 458 | 2,942 | ||||||||||||
|
|
|
|
|
|
|
|
|
|||||||||
| Net income (loss) |
$ | (4,396 | ) | $ | 5,550 | $ | (7,725 | ) | $ | 3,899 | ||||||
|
|
|
|
|
|
|
|
|
|||||||||
| Income (loss) per share |
||||||||||||||||
| Basic |
$ | (0.05 | ) | $ | 0.07 | $ | (0.09 | ) | $ | 0.05 | ||||||
| Diluted |
$ | (0.05 | ) | $ | 0.07 | $ | (0.09 | ) | $ | 0.05 | ||||||
| (1) | In 2019, 2018 and 2017, we incurred $4.6 million, $7.4 million and $1.1 million in reorganization expenses, respectively. See Item 7. “Management’s Discussion and Analysis of Financial Condition and Results of Operations – Results of Operations” for more information. |
| (2) | In 2018, we incurred $8.7 million in impairment expenses. See Item 7. “Management’s Discussion and Analysis of Financial Condition and Result of Operations – Results of Operations” for more information. |
| As of December 31, | ||||||||||||
| 2019 | 2018 | 2017 | ||||||||||
| (in thousands) | ||||||||||||
| Balance Sheet |
||||||||||||
| Cash and cash equivalents |
$ | 47,174 | $ | 53,412 | $ | 63,484 | ||||||
| Total Assets |
$ | 175,563 | $ | 175,911 | $ | 174,438 | ||||||
| Total Liabilities |
$ | 50,576 | $ | 52,397 | $ | 47,919 | ||||||
33
Table of Contents
| ITEM 7. | Management’s Discussion and Analysis of Financial Condition and Results of Operations |
You should read the following discussion and analysis of our financial condition and results of operations for the fiscal years ended December 31, 2019 and 2018 together with our consolidated financial statements and related notes and other financial information appearing in this Annual Report. Some of the information contained in this discussion and analysis or set forth elsewhere in this Annual Report, including information with respect to our plans and strategy for our business, operations, and product candidates, includes forward-looking statements that involve risks and uncertainties. You should review the sections of this Annual Report captioned “Risk Factors” and “Special Note Regarding Forward-Looking Statements” for a discussion of important factors that could cause our actual results to differ materially from the results described in or implied by the forward-looking statements contained in the following discussion and analysis.
We have revised our calculation of Adjusted EBITDA and Adjusted Gross Profit, non-GAAP financial measures, for the presented periods. For additional information, see “– Non-GAAP Financial Measures – EBITDA and Adjusted EBITDA for the Years Ended December 31, 2019, 2018 and 2017.” and “– Non-GAAP Financial Measures – Adjusted Gross Profit and Adjusted Gross Profit Margin for the Years Ended December 31, 2019, 2018 and 2017.”
Overview
We are an innovative manufacturing company featuring a proprietary software and virtual reality visualization platform, coupled with vertically integrated manufacturing that designs, configures and manufactures prefabricated interior solutions used primarily in commercial, healthcare and educational spaces across a wide range of industries and businesses. We combine innovative product design with our industry-leading, proprietary ICE Software, and technology-driven, lean manufacturing practices and sustainable materials to provide end-to-end solutions for the traditionally inefficient and fragmented interior construction industry. We create customized interiors with the aesthetics of conventional construction but with greater schedule and cost certainty, shorter lead times, greater future flexibility, and better environmental sustainability than conventional construction.
Our ICE Software allows us to sell, design, visualize (including 3D virtual reality modeling of interiors), configure, price, communicate, engineer, specify, order and manage projects, thereby reducing challenges associated with traditional construction, including cost overruns, change orders, inconsistent quality, delays and material waste. While other software programs and virtual reality tools are used in the architectural and construction industries, we believe our ICE Software is the only interior construction technology that provides end-to-end integration and management, from design through engineering, manufacturing and installation. Our interior construction solutions include prefabricated, customized interior modular walls, ceilings, and floors; decorative and functional millwork; power infrastructure; network infrastructure; and pre-installed medical gas piping systems. We strive to incorporate environmentally sustainable materials and reusable components into our solutions while creating flexible, functional and well-designed environments for the people who will use them.
We offer our interior construction solutions throughout the United States and Canada, as well as in select international markets, through a network of independent Distribution Partners and an internal sales team. Our Distribution Partners use ICE to work with end users to envision and design their spaces, and orders are electronically routed through ICE to our manufacturing facilities for production, packing and shipping. Our Distribution Partners then coordinate the receipt and installations of our interior solutions at the end users’ locations.
34
Table of Contents
Summary of Financial Results
| • | Revenues for the year ended December 31, 2019 were $247.7 million, a decline of $27.0 million or 10% from $274.7 million for the year ended December 31, 2018. We believe we have been subject to a disruption in sales activity levels particularly as it relates to larger projects, as discussed below, beginning in 2018 and carrying through 2019. This disruption stems from the distraction of significant management changes during 2018 on a long sales cycle combined with the immature and transitional state of our sales and marketing function, which limited our ability to take advantage of growth opportunities in our market for 2019. Our revenue in 2019 was directly affected by this disruption and we experienced a sequential decrease in revenues in the fourth quarter of 2019 from the third quarter of 2019. |
| • | Gross profit for the year ended December 31, 2019 was $86.4 million or 34.9% of revenue, a decline of $20.6 million or 19% from $107.0 million or 39.0% of revenue for the year ended December 31, 2018. This reduction was attributable to our decline in revenues, the impact of fixed costs on lower revenues, $2.5 million of incremental costs to mitigate a previously disclosed tile warping issue, and a $2.5 million increase in our provision because we determined that timber included in certain projects installed between 2016 and 2019 may not meet certain building class fire retardant specifications under which they were sold. We are in the process of notifying customers and are actively testing solutions which, if successful, could significantly reduce this liability. |
| • | Adjusted Gross Profit (see “– Non-GAAP Financial Measures”) for the year ended December 31, 2019 was $97.9 million or 39.5% of revenue, a $18.6 million or 16.0% decline from $116.5 million or 42.4% of revenue for the year ended December 31, 2018 for the above noted reasons. Excluded from Adjusted Gross Profit in 2019 are $2.2 million of costs of overhead associated with operating at lower than normal capacity levels in the fourth quarter, which were charged directly and separately to cost of sales rather than as costs attributable to production. |
| • | Net loss for the year ended December 31, 2019 was $4.4 million, a reduction of $10.0 million from net income of $5.6 million for the year ended December 31, 2018. The decline reflects the above noted reduction in gross profit, $5.7 million of one-time costs, discussed below, $1.3 million of litigation costs and a $4.5 million increase in foreign exchange loss. These cost increases were partially offset by a $3.4 million reduction in commission expenses, a $2.8 million reduction in reorganization expenditures, no impairments in 2019 compared to an $8.7 million impairment in 2018, a $2.3 million reduction in income tax expense, and other operating expenditure reductions. |
| • | Adjusted EBITDA (see “– Non-GAAP Financial Measures”) for the year ended December 31, 2019 was $18.2 million or 7.4%, a decline of $20.9 million or 53% from $39.1 million or 14.2% for the year ended December 31, 2018 for the above noted reasons. In the current period, we changed our calculation of Adjusted EBITDA to exclude the impacts of foreign exchange to improve year-on-year comparability of Adjusted EBITDA. |
Outlook
On November 12, 2019, DIRTT unveiled a four-year strategic plan for the Company, based on three key pillars: commercial execution, manufacturing excellence and innovation. This plan lays out a roadmap to transform a founder-led start-up into a professionally managed operating company. Our objective is to scale our operations to profitably capture the significant market opportunity available from driving conversion from conventional construction to DIRTT’s process of modular, prefabricated interiors.
The strategic plan is designed to create a foundation for sustainable and profitable growth; however, in the interim, we have been subject to a disruption in sales activity levels particularly as it relates to larger projects, as discussed below, beginning in 2018 and carrying through 2019. This disruption stems from the distraction of significant management changes during 2018 on a long sales cycle combined with the immature and transitional state of our sales and marketing function, which limited our ability to take advantage of growth opportunities in our market for 2019. Our revenue in 2019 was directly affected by this disruption and we experienced a sequential decrease in revenues in the fourth quarter of 2019 from the third quarter of 2019. A similar percentage decrease has continued into the first two months of 2020 relative to the first two months of the fourth quarter of 2019.
35
Table of Contents
We have a stable base business of small- to mid-size projects that our distribution partners and sales representatives are well positioned to maintain and grow, but we currently lack a pipeline of larger projects. We consider larger projects as projects or clients greater than $2 million with such projects often spanning multiple reporting periods. We are actively working to build this pipeline with our new strategic accounts and large project teams and an enhanced commercial function. This is a key goal of our strategic plan; however, such projects require a longer sales cycle and, as discussed at our November 12, 2019 Analyst Day, the realization of sales from our activities is not expected until the second half of 2020 at the earliest or into 2021.
Within the commercial function – which encompasses people and organizational structure; strategic marketing; sales excellence and Distribution Partner experience – we have been actively recruiting for the 50 newly-created or open positions we identified as key to building out our sales and marketing organization. As of February 25, 2020, we have hired 11 individuals. These include the key roles of vice president of strategic marketing, who will be critical to creating a strategic marketing capability that has never existed at DIRTT, as well as a vice president of commercial operations, who is expected to significantly enhance our sales analysis and forecasting. Although identifying and recruiting the right mix of experience and talent is a time-consuming process, our goal remains to have all open positions filled by the end of 2020.
Our targeted approach to developing and growing strategic national accounts is showing early promise. In particular, we are actively working on agreements for four new accounts and the expansion of two existing accounts with several other relationships in development. These opportunities often entail a multi-year sales effort and generally start with smaller projects, growing over time as the commercial relationship strengthens. We expect several small projects to commence in the second half of 2020.
Enhancing our Distribution Partner network, an integral part of our go-to-market strategy, remains a priority. As of February 25, 2020, we have increased our regional coverage with seven existing Distribution Partners expanding into new regions, including two in a major commercial real estate market in the Eastern U.S. that was highly underpenetrated and contains substantial growth opportunities. These are strong partners with a demonstrated track record of success and commitment to DIRTT and who appreciate how we can work together to capitalize on market opportunities. In 2019, these partners accounted for approximately 14% of DIRTT’s sales.
In late 2019 and early 2020, we terminated relationships with four underperforming Distribution Partners representing 1.5% of 2019 sales in the aggregate who did not align with our partnership model and strategic growth priorities.
In February 2020, we launched two digital marketing campaigns, a first for our organization, to increase brand awareness. These target general contractors and key decision makers in our healthcare and education market verticals. We also began a full refresh of our Chicago DIRTT Experience Center (“DXC”) which we anticipate being completed in time to host our annual Connext tradeshow in June. In addition, we are exploring the development or refresh of DXCs in other key geographic areas.
Within our manufacturing operation, we achieved a 50% reduction in safety-related total recordable incident frequency (TRIF) rates at year end compared to 2018, and in January of 2020, we had a recordable injury-free month. We believe our goal of having TRIF rates below the Bureau of Labor Statistics standard is achievable in 2020. We are recording improvements in both quality and delivery objectives, a key contributor to achieving sales excellence with our partners and clients, which will continue to be a focus in 2020. In February 2020, we commissioned a new manufacturing line enabling us to bring in-house the priming function that addresses the tile warping issue that occurred in 2018 and 2019. At a total cost of $1.8 million, we anticipate a payback of 18 to 24 months.
In late 2019 and early 2020, we identified and addressed excess labor capacity in our factories. Initiatives undertaken and planned include both planned shutdowns of our production facilities during slower periods and a 14% head count reduction of factory employees. We believe that the productivity and efficiency improvements outlined in our strategic plan will enable us to return to higher revenue levels without reinstating headcount. We will continue to monitor activity levels over the course of the year and adjust as necessary.
36
Table of Contents
Innovation remains at the core of our strategy and we continue to invest accordingly. We are working to bring our newest innovations, the Inspire low profile and Reflect ultra-sleek glass wall systems, into our proprietary ICE software system in the second and third quarters of 2020, respectively. This simplifies the design and specification for the sales function, streamlines the interaction with the factory and speeds up the delivery of new products to meet the strong reception we have received from partners and clients. We are also developing related sales and marketing materials for our Distribution Partners.
We are focused on maintaining a strong balance sheet and are actively managing both operational and capital expenditures even as we continue to make investments that directly support our commercial strategy and innovation efforts. Our capital investments are focused on improving safety and advancing our commercial and innovation strategies. Excluding the South Carolina facility, discussed in more detail below, capital expenditures in 2020 are expected to be between $12 million and $15 million. These expenditures include our Chicago DXC refresh, CRM implementation and software development activities as well as ongoing sustaining activities in our plants and offices.
With respect to our new South Carolina tile and millwork facility, approximately $4.5 million of equipment deposits were paid in 2019. This facility reduces single plant reliance risk and is designed to improve material yield and significantly improved labor efficiency. Construction of the building shell by the developer is underway, and key components of the manufacturing equipment are expected to be delivered to site in the third quarter of 2020, with related 2020 spending of approximately $7.5 million. The $6.5 million balance of the facility’s $18.5 million expected cost relates primarily to commissioning and other activities. We are on schedule and on budget for the commencement of commercial operations in the first quarter of 2021. We have flexibility to defer the $6.5 million of expenditures and amend the commissioning date based on business activity levels.
During 2019, we made substantial progress in our working capital management, finishing the year with net working capital of $58.6 million compared to $69.8 million at December 31, 2018. This included cash balances of $47.2 million with no debt compared to cash, net of debt, at December 31, 2018 of $47.8 million. We will continue this focus on working capital efficiency in 2020.
Looking forward, we see early indications of improvements in activity levels and are encouraged by ongoing discussions with Distribution Partners. We are enthused about the quality of candidates we have hired into the sales and marketing organization and have had strong reception to the new products we introduced in October. It remains too early to quantify the impact that this progress will have on our revenues for 2020. We remain confident in the roadmap we laid out to deliver positive change within the organization; however, given the slower start to the year, 2020 may be a lower revenue year than 2019. We are intently focused on exiting the year with the organizational foundation in place to support our strategic plan and achieve our financial targets for 2023, which call for revenue of $450 million to $550 million and an Adjusted EBITDA Margin of 18% - 22%.
Non-GAAP Financial Measures
Note Regarding Use of Non-GAAP Financial Measures
Our consolidated financial statements are prepared in accordance with GAAP. These GAAP financial statements include non-cash charges and other charges and benefits that we believe are unusual or infrequent in nature or that we believe may make comparisons to our prior or future performance difficult.
As a result, we also provide financial information in this Annual Report that is not prepared in accordance with GAAP and should not be considered as an alternative to the information prepared in accordance with GAAP. Management uses these non-GAAP financial measures in its review and evaluation of the financial performance of the Company. We believe that these non-GAAP financial measures also provide additional insight to investors and securities analysts as supplemental information to our GAAP results and as a basis to compare our financial performance from period-over-period and to compare our financial performance with that of other companies. We believe that these non-GAAP financial measures facilitate comparisons of our core operating results from period to period and to other companies by removing the effects of our capital structure (net interest income on cash deposits, interest expense on outstanding debt, or foreign exchange movements), asset base (depreciation and amortization), the impact of under-utilized capacity on gross profit, tax consequences and stock-based compensation. In addition, management bases certain forward-looking estimates and budgets on non-GAAP financial measures, primarily Adjusted EBITDA.
37
Table of Contents
For the current year, we removed the impact of all foreign exchange from Adjusted EBITDA. Foreign exchange gains and losses can vary significantly period-on-period due to the impact of changes in the U.S. and Canadian dollar exchange rates on foreign currency denominated monetary items on the balance sheet and are not reflective of the underlying operations of the Company. We have presented a reconciliation to our prior calculation of Adjusted EBITDA for all years presented. Additionally, in the current year, we have excluded from Adjusted Gross Profit costs associated with under-utilized capacity. Fixed production overheads are allocated to inventory on the basis of normal capacity of the production facilities. In periods where production levels are abnormally low, unallocated overheads are recognized as an expense in the period in which they are incurred.
Reorganization expenses, impairment expenses, depreciation and amortization, stock-based compensation, and foreign exchange are excluded from our non-GAAP financial measures because management considers them to be outside of the Company’s core operating results, even though some of those expenses may recur, and because management believes that each of these items can distort the trends associated with the Company’s ongoing performance. We believe that excluding these expenses provides investors and management with greater visibility to the underlying performance of the business operations, enhances consistency and comparativeness with results in prior periods that do not, or future periods that may not, include such items, and facilitates comparison with the results of other companies in our industry.
The following non-GAAP financial measures are presented in this Annual Report, and a description of the calculation for each measure is included.
| Adjusted Gross Profit, as previously presented |
Gross profit before deductions for depreciation and amortization | |
| Adjusted Gross Profit |
Gross profit before deductions for costs of under-utilized capacity, depreciation and amortization | |
| Adjusted Gross Profit Margin |
Adjusted Gross Profit divided by revenue | |
| EBITDA |
Net income before interest, taxes, depreciation and amortization | |
| Adjusted EBITDA, as previously presented |
EBITDA adjusted for non-cash foreign exchange gains or losses on debt revaluation; impairment expenses; stock-based compensation expense; reorganization expenses; and any other non-core gains or losses | |
| Adjusted EBITDA |
EBITDA adjusted for foreign exchange gains or losses; impairment expenses; stock-based compensation expense; reorganization expenses; and any other non-core gains or losses | |
| Adjusted EBITDA Margin |
Adjusted EBITDA divided by revenue | |
You should carefully evaluate these non-GAAP financial measures, the adjustments included in them, and the reasons we consider them appropriate for analysis supplemental to our GAAP information. Each of these non-GAAP financial measures has important limitations as an analytical tool due to exclusion of some but not all items that affect the most directly comparable GAAP financial measures. You should not consider any of these non-GAAP financial measures in isolation or as substitutes for an analysis of our results as reported under GAAP. You should also be aware that we may recognize income or incur expenses in the future that are the same as, or similar to, some of the adjustments in these non-GAAP financial measures. Because these non-GAAP financial measures may be defined differently by other companies in our industry, our definitions of these non-GAAP financial measures may not be comparable to similarly titled measures of other companies, thereby diminishing their utility.
38
Table of Contents
EBITDA and Adjusted EBITDA for the Years Ended December 31, 2019, 2018 and 2017
The following table presents a reconciliation for the year-to-date results of 2019, 2018 and 2017 of EBITDA and Adjusted EBITDA to our net income (loss), which is the most directly comparable GAAP measure for the periods presented:
| Year ended December 31, | ||||||||||||
| 2019 | 2018 | 2017 | ||||||||||
| $ (in thousands) | ||||||||||||
| Net income (loss) for the period |
(4,396 | ) | 5,550 | (7,725 | ) | |||||||
| Add back (deduct): |
||||||||||||
| Interest Expense |
131 | 503 | 500 | |||||||||
| Interest Income |
(529 | ) | (425 | ) | (399 | ) | ||||||
| Income Tax Expense |
1,019 | 3,280 | 458 | |||||||||
| Depreciation and Amortization |
12,242 | 13,699 | 12,856 | |||||||||
|
|
|
|
|
|
|
|||||||
| EBITDA |
8,467 | 22,607 | 5,690 | |||||||||
| Stock-based Compensation Expense (Recovery) |
3,876 | 3,661 | 2,738 | |||||||||
| Foreign exchange (Gain) Loss on Debt Revaluation |
(211 | ) | 546 | (731 | ) | |||||||
| Reorganization Expense |
4,560 | 7,380 | 1,143 | |||||||||
| Impairment Expense |
— | 8,680 | — | |||||||||
|
|
|
|
|
|
|
|||||||
| Adjusted EBITDA, as previously presented(1) |
16,692 | 42,874 | 8,840 | |||||||||
| Other Foreign Exchange (Gains) Losses |
1,535 | (3,760 | ) | 1,396 | ||||||||
| Adjusted EBITDA |
18,227 | 39,114 | 10,236 | |||||||||
|
|
|
|
|
|
|
|||||||
| Net Income Margin(2) |
(1.8 | %) | 2.0 | % | (3.4 | %) | ||||||
|
|
|
|
|
|
|
|||||||
| Adjusted EBITDA, Margin as previously presented(1) |
6.7 | % | 15.6 | % | 3.9 | % | ||||||
|
|
|
|
|
|
|
|||||||
| Adjusted EBITDA Margin |
7.4 | % | 14.2 | % | 4.5 | % | ||||||
|
|
|
|
|
|
|
|||||||
| (1) | As discussed previously, in prior filings, only foreign exchange movements on debt revaluation was included in Adjusted EBITDA. |
| (2) | Net income divided by revenue. |
As discussed above, we have removed the impact of all foreign exchange from Adjusted EBITDA and have presented a reconciliation to our prior calculation of Adjusted EBITDA for the periods presented above.
For the year ended December 31, 2019, Adjusted EBITDA and Adjusted EBITDA Margin decreased to $18.2 million or 7.4% from $39.1 million or 14.2% in the same period of 2018. This reflects a $18.6 million decrease in Adjusted Gross Profit as discussed below, the $2.2 million costs of underutilized capacity, the impacts of $5.7 million of one-time costs in operating expenses (which included $2.0 million related to the Sales & Marketing Plan, as defined below, $2.6 million of costs associated with our listing of common shares on Nasdaq (the “U.S. Listing”) and $1.1 million of operations consulting costs) compared to $2.1 million of one-time costs in 2018 related to advisory and other costs associated with activist defense and board, advisor and other costs associated with the work of a special committee of the Board in response to an unsolicited and unsuccessful acquisition bid by a third party. In addition, approximately $1.3 million of litigation costs incurred in 2019 were partially offset by ongoing cost reductions. The change in calculation of Adjusted EBITDA, discussed previously, benefited 2019 with the exclusion of an additional $1.5 million in net foreign exchange losses and 2018 Adjusted EBITDA was reduced by the exclusion of $3.8 million of foreign exchange gains.
Adjusted EBITDA and Adjusted EBITDA Margin increased respectively to $39.1 million or to 14.2% of revenue in 2018 from $10.2 million or 4.5% of revenue in 2017. These increases were due to increased sales activity and associated gross profit and a reduction in operating expenses. Additionally, revenue and associated Adjusted EBITDA for the fourth quarter of 2017 were reduced by construction delays resulting from hurricanes in parts of the United States. These reductions in 2017 partially contributed to the increases to 2018 revenue and Adjusted EBITDA. The change in calculation of Adjusted EBITDA, discussed previously, reduced 2018 Adjusted EBITDA due to the exclusion of $3.8 million of foreign exchange gains, whereas 2017 Adjusted EBITDA benefited from the exclusion of $1.4 million of foreign exchange losses.
39
Table of Contents
Adjusted Gross Profit and Adjusted Gross Profit Margin for the Years Ended December 31, 2019, 2018 and 2017
The following table presents a reconciliation for the years ended December 31, 2019, 2018, and 2017 of Adjusted Gross Profit to our gross profit, which is the most directly comparable GAAP measure for the periods presented:
| Years ended December 31, | ||||||||||||
| 2019 | 2018 | 2017 | ||||||||||
| ($ in thousands) | ||||||||||||
| Gross Profit |
86,424 | 107,009 | 85,489 | |||||||||
|
|
|
|
|
|
|
|||||||
| Gross Profit Margin |
34.9 | % | 39.0 | % | 37.7 | % | ||||||
|
|
|
|
|
|
|
|||||||
| Add: Depreciation and Amortization Expense |
9,195 | 9,528 | 8,705 | |||||||||
|
|
|
|
|
|
|
|||||||
| Adjusted Gross Profit, as previously presented |
95,619 | 116,537 | 94,194 | |||||||||
| Add: Costs of under-utilized capacity |
2,240 | — | — | |||||||||
|
|
|
|
|
|
|
|||||||
| Adjusted Gross Profit |
97,859 | 116,537 | 94,194 | |||||||||
|
|
|
|
|
|
|
|||||||
| Adjusted Gross Profit Margin, as previously presented |
38.6 | % | 42.4 | % | 41.6 | % | ||||||
|
|
|
|
|
|
|
|||||||
| Adjusted Gross Profit Margin |
39.5 | % | 42.4 | % | 41.6 | % | ||||||
|
|
|
|
|
|
|
|||||||
Gross profit and gross profit margin decreased to $86.4 million, or 34.9%, for the year ended December 31, 2019, from $107.0 million or 39.0% for the year ended December 31, 2018. The decrease is largely due to reduced fixed cost leverage due to a $27.0 million decline in revenues. During the year, we incurred $2.5 million of incremental costs (1.1% reduction in gross profit margin) to mitigate further warping of our tiles. Following the completion of third-party testing in 2019, we determined that timber included in certain projects installed between 2016 and 2019 potentially did not meet the fire-retardant specifications that the projects were sold under. As a result, we recorded an additional $2.5 million liability and are in the process of contacting customers to determine appropriate remedial actions, if any. We are also in the process of evaluating solutions which, if successful, could significantly reduce the associated liability. We also experienced a $0.7 million reduction in gross profit due to reductions in second quarter gross profit on installation revenue. During the fourth quarter of 2019, we determined that we were carrying abnormally excess capacity in our manufacturing facilities as a result of the slowdown in sales. Accordingly, we separately classified $2.2 million as costs attributable to our under-utilized capacity (0.9% in gross profit margin) in cost of sales. Subsequent to year end, we took further steps to manage our excess capacity, including the reduction in staffing by 14% and planned factory shutdowns.
40
Table of Contents
Results of Operations
Year Ended December 31, 2019 Compared to the Year Ended December 31, 2018
| Years ended December 31, | ||||||||||||
| 2019 | 2018 | % Change | ||||||||||
| ($ in thousands) | ||||||||||||
| Revenue |
247,735 | 274,681 | (10 | ) | ||||||||
| Gross Profit |
86,424 | 107,009 | (19 | ) | ||||||||
| Gross Profit Margin |
34.9 | % | 39.0 | % | (11 | ) | ||||||
| Operating Expenses(1) |
||||||||||||
| Sales and Marketing |
33,939 | 40,627 | (16 | ) | ||||||||
| General and Administrative |
27,645 | 28,722 | (4 | ) | ||||||||
| Operations Support |
11,037 | 8,069 | 37 | |||||||||
| Technology and Development |
7,818 | 4,176 | 87 | |||||||||
| Stock-based Compensation |
3,876 | 3,661 | 6 | |||||||||
| Reorganization |
4,560 | 7,380 | (38 | ) | ||||||||
| Impairment |
— | 8,680 | (100 | ) | ||||||||
|
|
|
|
|
|
|
|||||||
| Total Operating Expenses |
88,875 | 101,315 | (12 | ) | ||||||||
|
|
|
|
|
|
|
|||||||
| Operating Income (Loss) |
(2,451 | ) | 5,694 | NA | ||||||||
|
|
|
|
|
|
|
|||||||
| Operating Margin |
(1.0 | %) | 2.1 | % | NA | |||||||
|
|
|
|
|
|
|
|||||||
| (1) | Certain comparative figures have been reclassified to conform to the current year presentation. |
Revenue
The following table sets forth the contribution to revenue of our DIRTT Solutions and related offerings.
| Years ended December 31, | ||||||||||||
| 2019 | 2018 | % Change | ||||||||||
| ($ in thousands) | ||||||||||||
| Product |
215,109 | 240,482 | (11 | ) | ||||||||
| Transportation |
23,903 | 24,552 | (3 | ) | ||||||||
| Licenses |
1,647 | 1,400 | 18 | |||||||||
|
|
|
|
|
|
|
|||||||
| Total Product Revenue |
240,659 | 266,434 | (10 | ) | ||||||||
|
|
|
|
|
|
|
|||||||
| Installation and other services |
7,076 | 8,247 | (14 | ) | ||||||||
|
|
|
|
|
|
|
|||||||
| Total |
247,735 | 274,681 | (10 | ) | ||||||||
|
|
|
|
|
|
|
|||||||
Product revenue decreased in the year ended December 31, 2019 by $25.4 million, or 11%, compared to the same period of 2018. Revenue decreased due to several factors as discussed above in “– Summary of Financial Results” and “– Outlook”, including the impact of certain large projects in 2018 that were not replaced in 2019. We have been subject to a disruption in sales activity levels particularly as it relates to larger projects, as discussed below, beginning in 2018 and carrying through 2019. This disruption stems from the distraction of significant management changes during 2018 on a long sales cycle combined with the immature and transitional state of our sales and marketing function, which limited our ability to take advantage of growth opportunities in our market for 2019. Due to the long sales cycle, particularly for larger projects which can be two years or more, this had a corresponding negative effect on our revenue in 2019, especially in the last half of the year and continuing into 2020. The effect of this has lasted longer than we had anticipated. We are in the process of making substantial improvements to our commercial function, including building an appropriate organizational structure, improving the sales effectiveness of our existing sales force and attracting new sales talent, establishing strategic marketing and lead generation functions, as well as expanding and better supporting our Distribution
41
Table of Contents
Partner network. While we believe these actions are critical to driving long-term, sustainable growth, these actions did not have a measurable effect on 2019 revenues.
Installation and other services revenue of $7.1 million for the year ended December 31, 2019 was $1.2 million lower than the same period in 2018. The decrease in installation revenue is primarily due to the timing of projects. Except under certain circumstances, our Distribution Partners perform installation services rather than us; accordingly, we do not anticipate significant growth in this revenue stream.
Our success is partly dependent on our ability to profitably develop our Distribution Partner network to expand our market penetration and ensure best practices are shared across local markets. We had 87 Distribution Partners at December 31, 2019. Our clients, as serviced primarily through our Distribution Partners, exist within a variety of industries, including healthcare, education, financial services, government and military, manufacturing, non-profit, energy, professional services, retail, technology and hospitality.
We periodically analyze our revenue growth by vertical markets in the defined markets of commercial, healthcare, government and education. The following table presents our product and transportation revenue by vertical market.
| Years ended December 31, | ||||||||||||
| 2019 | 2018 | % Change | ||||||||||
| ($ in thousands) | ||||||||||||
| Commercial |
158,256 | 163,199 | (3 | ) | ||||||||
| Healthcare |
44,197 | 60,748 | (27 | ) | ||||||||
| Government |
14,879 | 21,477 | (31 | ) | ||||||||
| Education |
21,680 | 19,610 | 11 | |||||||||
| License fee from Distribution Partners |
1,647 | 1,400 | 18 | |||||||||
|
|
|
|
|
|
|
|||||||
| Total Product Revenue |
240,659 | 266,434 | (10 | ) | ||||||||
|
|
|
|
|
|
|
|||||||
| Installation and other services |
7,076 | 8,247 | (14 | ) | ||||||||
|
|
|
|
|
|
|
|||||||
| Total Revenue |
247,735 | 274,681 | (10 | ) | ||||||||
|
|
|
|
|
|
|
|||||||
| Years ended December 31, | ||||||||||||
| 2019 | 2018 | % Change | ||||||||||
| (in %) | ||||||||||||
| Commercial |
67 | 62 | 8 | |||||||||
| Healthcare |
18 | 23 | (22 | ) | ||||||||
| Government |
6 | 8 | (25 | ) | ||||||||
| Education |
9 | 7 | 29 | |||||||||
|
|
|
|
|
|
|
|||||||
| Total Product Revenue(1) |
100 | 100 | NA | |||||||||
|
|
|
|
|
|
|
|||||||
| (1) | Excludes license fees from Distribution Partners. |
Revenue decreased by 10% for the year ended December 31, 2019 compared to the prior year primarily due to decreased healthcare sales, which reflects the completion of a major healthcare project in 2018 that was not replaced in 2019 and reductions in government sales mainly as a result of the timing of projects and reduced installation activity, partially offset by growth in the education sector.
42
Table of Contents
Revenue continues to be derived almost exclusively from projects in North America and predominantly from the United States, with periodic international projects from North American Distribution Partners. The following table presents our revenue dispersion by geography.
| Years ended December 31, | ||||||||||||
| 2019 | 2018 | % Change | ||||||||||
| ($ in thousands) | ||||||||||||
| Canada |
34,085 | 41,153 | (17 | ) | ||||||||
| United States |
213,650 | 232,035 | (8 | ) | ||||||||
| International |
— | 1,493 | NA | |||||||||
|
|
|
|
|
|
|
|||||||
| Total |
247,735 | 274,681 | (10 | ) | ||||||||
|
|
|
|
|
|
|
|||||||
Sales & Marketing Expenses
Sales and marketing expenses decreased $6.7 million to $33.9 million for the year ended December 31, 2019, from $40.6 million for the year ended December 31, 2018. Included in sales and marketing expenses for the year ended December 31, 2019 were $2.0 million of one-time consulting costs related to the sales and marketing plan developed with the assistance of an internationally recognized consulting firm (“Sales & Marketing Plan”). These costs were offset by a reduction of $3.4 million in commission expense for the year ended December 31, 2019, respectively, on lower revenues. We reduced travel meals and entertainment by $2.6 million due to continued attention to cost reductions. None of these expense reductions are expected to materially affect our future sales revenue. Salaries and benefits declined $1.0 million due to reductions in sales and marketing personnel year on year, of which we are working to appropriately fill open positions as previously discussed. Finally, the current year includes a $0.9 million reduction from 2018 as a result of lower rent and operating costs associated with closure of certain of the Company’s DXC’s at the end of 2018.
Our sales and marketing efforts in 2019 were largely concentrated on commencing the establishment of an appropriate sales organization, significantly improving our marketing approach and driving returns on sales and marketing expenditures. In the second and third quarters of 2019, we developed our Sales & Marketing Plan to evaluate our current sales and marketing approach and assist in the development of action plans necessary to drive accelerated growth. These action plans are a key component of the strategic plan which we presented in November 2019. As we implement this plan, we expect sales and marketing expense to increase as a percentage of revenues, reflecting targeted increases in our commercial organization headcount, establishment of strategic marketing campaigns, and implementation of related systems and tools to improve both the effectiveness of our sales force and our overall Distribution Partner support. Our ongoing focus is to continue to control costs by emphasizing return on investment on our sales and marketing expenditures.
General and Administrative Expenses
General and administrative (“G&A”) expenses decreased $1.1 million to $27.6 million for the year ended December 31, 2019 from $28.7 million for the year ended December 31, 2018. In 2019, personnel costs were lower as a result of reductions in headcount and variable compensation offset by $1.3 million in costs associated with ongoing litigation, as discussed in this Annual Report. In 2018, we incurred $1.4 million in costs associated with activist defense and $0.7 million of board, advisor and other costs associated with the work of a special committee of the Board in response to an unsolicited and unsuccessful acquisition bid by a third party. These reductions were partially offset by $2.6 million of costs related to the U.S. Listing incurred in the year ended December 31, 2019. We anticipate in 2020 that ongoing and incremental non-U.S. Listing related costs as a result of becoming a U.S. registrant will be approximately $1.5 to $2.0 million higher in 2020 than in 2019, driven largely by increased director and officer insurance premiums, the costs of maintaining two listings, and expected increases in audit, legal, and other compliance costs.
43
Table of Contents
Operations Support Expenses
Operations support is comprised primarily of project managers, order entry and other professionals that facilitate the integration of our Distribution Partner project execution and our manufacturing operations. Operations support expenses increased $3.0 million to $11.0 million for the year ended December 31, 2019, from $8.1 million for the year ended December 31, 2018, due to an increase in consulting costs during the year, as well as increases in personnel costs. Consultant costs of $1.1 million were incurred to assist with the evaluation of current operations and to assist with the rectification of the tile warping issue and increases in personnel costs due to increased headcount to better support project execution and support of our Distribution Partners.
Technology and Development Expenses
Technology and development includes our software development teams and our product development activities. Technology and development expenses increased $3.6 million to $7.8 million for the year ended December 31, 2019, compared to $4.2 million for the year ended December 31, 2018. These increases are due to a $1.7 million decrease in capitalized salaries for the year ended December 31, 2019, as the current mix of projects undertaken by us included a higher portion of efforts related to business process improvements that were not eligible for capitalization. Additionally, for the year ended December 31, 2019 we had additional salary and benefit costs of $0.7 million that were classified as cost of sales of technical services during the year ended December 31, 2018.
Stock-Based Compensation
During the third quarter of 2018, we determined that we no longer qualified as a Foreign Private Issuer (“FPI”) under the rules of the SEC. To minimize any undue effects on employees, our Board approved the availability of a cash surrender feature for certain options, including options issued under our Amended and Restated Incentive Stock Option Plan (“Option Plan”), until such time as we requalified as a FPI or we registered our common shares with the SEC, which occurred on October 9, 2019 upon our listing on Nasdaq. Accordingly, we accounted for the fair value of outstanding stock options at the end of the reporting period as a liability, with changes in the liability recorded through net income as a stock-based compensation fair value adjustment. On October 9, 2019, we ceased allowing cash surrender of options and returned to equity accounting under the Option Plan without quarterly fair value adjustments at that date.
Stock-based compensation for the year ended December 31, 2019 was $3.9 million compared to $3.7 million for the same period of 2018. Prior to the return to equity settled accounting, we had a liability of $1.8 million. Stock-based compensation for the year ended December 31, 2018 included a $0.2 million fair value adjustments on cash settled stock options.
Reorganization Expenses
We recorded $4.6 million of reorganization expenses in 2019 compared to $7.4 million for the year ended December 31, 2018. These costs included severance payments, and related legal and consulting costs associated with management and organizational changes.
Impairment Expenses
DIRTT Timber
During 2018, management decided to shift from the early stage development of its DIRTT Timber market to a commercialized approach focused on large, standalone timber projects and as a tie-in to our other DIRTT Solutions. Management concluded that this strategy required significantly less timber capacity than existed and took steps to adjust its timber capacity by the end of 2018. Management determined these decisions to be an indicator of impairment of the assets of the DIRTT Timber solution.
44
Table of Contents
During 2018, management performed an assessment of the carrying values of DIRTT Timber’s property, plant and equipment (“PP&E”). To determine the impairment of the DIRTT Timber assets, the net book value of the assets was evaluated against the fair value of the assets. The fair value of the DIRTT Timber assets reflects current projected sales for timber projects on a standalone basis and the pull-through impact to other DIRTT Solutions. In its evaluation, management determined it was unable to reliably quantify the pull-through impact of timber on other DIRTT Solutions. The equipment related to the timber market was custom built for DIRTT, and there is no active market for resale. Therefore, the fair value was determined to be management’s estimate of scrap value for the specialized assets and an estimated resale value for less specialized assets that cannot be redeployed for other DIRTT Solutions. Management estimated the expected resale values based on the current market and industry knowledge. The fair value of the timber assets was estimated to be $1.1 million. This assessment resulted in an impairment charge of $6.1 million during 2018.
Leasehold and Other Assets
During 2018, management reviewed the facilities used in our operations and the corresponding leases in place to determine whether assets were impaired or whether the costs of meeting lease obligations exceeded the economic benefits expected to be received. The outcome of this review was the consolidation of our production in Kelowna, British Columbia, into other plants, the consolidation of a distribution center in Calgary, Alberta, into an existing facility, and discontinued use of other locations that were not considered necessary in our operations. In 2018, we recognized a lease exit liability of $0.5 million related to these facilities, net of $1.0 million of estimated recoveries from subleases.
The lease exit liability represents the present value of the difference between the minimum future lease payments that we are obligated to make under the non-cancellable operating lease contract and any estimated sublease recoveries. This estimate may vary as a result of changes in estimated sublease recoveries. The lease exit liability is estimated to be settled in periods up to and including the year 2023.
In connection with management’s review of our facilities, certain leasehold assets were identified as no longer having future value. These assets related to leases of locations where activity is being relocated, as well as projects in process that were eliminated. These leasehold and other assets represented assets with a carrying value of $2.0 million in 2018. As these assets cannot be resold and there is no future use for the assets, the entire carrying amount was impaired and a corresponding impairment charge of $2.0 million was recorded.
Income Tax
Alberta’s general provincial tax rate decreased on June 28, 2019 from 11.5% to 11% for the second half of 2019, to 10% for 2020, to 9% for 2021 and to 8% thereafter. As a result of this rate change, we reduced our deferred tax asset by $0.9 million, with a corresponding deferred income tax expense recorded in the second quarter of 2019.
The provision for income taxes is comprised of federal, state, provincial and foreign taxes based on pre-tax income. Income tax expense for the year ended December 31, 2019, inclusive of the previously noted charge associated with the Alberta tax rate change, was $1.0 million, compared to $3.3 million for the year-ended December 31, 2018. The reduction was primarily due to a reduction in current taxes as a result of lower activity. As at December 31, 2019, we had C$38.1 million of loss carry-forwards in Canada and none in the United States, compared to C$43.6 million in Canada and none in the United States on December 31, 2018. These loss carry-forwards will begin to expire in 2030.
Net Income (loss)
On a year-to-date basis, net loss was $4.4 million or $0.05 net loss per share for the year ended December 31, 2019, compared to net income of $5.6 million or $0.07 net income per share for the prior year. The variances are primarily the result of a $20.6 million decrease in gross margin, partially offset by a $12.4 million decrease in operating expenses as described above, as well as a foreign exchange loss of $1.3 million in 2019 compared to a foreign exchange gain of $3.2 million in 2018. Foreign exchange gains or losses are primarily derived from U.S. dollar denominated cash and intercompany account balances in the Canadian parent company.
45
Table of Contents
Year Ended December 31, 2018 Compared to the Year Ended December 31, 2017
Discussion and analysis of our financial condition and results of operations for the fiscal year ended December 31, 2018 compared to the fiscal year ended December 31, 2017 is included under the heading Item 2. “Financial Information – Management’s Discussion and Analysis of Financial Condition and Results of Operations,” in our Registration Statement on Form 10, as filed with the SEC on September 20, 2019.
Seasonality
The construction industry has historically seen seasonal slowdowns related to winter weather conditions and holiday schedules in the fourth and first quarters. Our business has generally, but not always, followed this trend with a slight time lag, leading to stronger sales in the second half of the year versus the first half.
Due to the fixed nature of some of our manufacturing costs, periods of higher revenue volume tend to generate higher gross profit and operating income. Quarters that contain consistent monthly manufacturing volumes tend to generate higher gross profit than those where manufacturing levels vary significantly from month to month. Product and service revenue mix also tends to impact gross profit, as simplistic product and service revenue mix can result in lower gross profit, while “full solution” or comprehensive product and service revenue mixes tend to have higher gross profit.
Liquidity and Capital Resources
Cash and cash equivalents at December 31, 2019 totaled $47.2 million, a decrease of $6.2 million from $53.4 million on December 31, 2018. On January 31, 2019, we repaid $5.6 million of long-term debt outstanding with cash on hand, without penalty. In July 2019, we entered into a C$50.0 million revolving operating facility with the Royal Bank of Canada (“RBC Credit Facility”). Draw-downs under the RBC Credit Facility are available in both Canadian and U.S. dollars. The RBC Credit Facility replaced the $18.0 million revolving operating facility with Comerica Bank (“Comerica Credit Facility”) that expired on June 30, 2019.
Management believes that existing cash and cash equivalents and cash flows from operations will be sufficient to support ongoing working capital and capital expenditure requirements for at least the next 12 months. Our future capital requirements will depend on many factors, including growth rate, the continued expansion of sales and marketing activities and the introduction of new solutions, software and product enhancements. To the extent existing cash and cash equivalents and cash flows from operations are not sufficient to fund future activities, we may seek to raise additional funds through equity or debt financings. If additional funds are raised through the incurrence of indebtedness, such indebtedness may have rights that are senior to holders of our equity securities and could contain covenants that restrict operations. Any additional equity financing may be dilutive to our existing shareholders.
Since inception, we have financed operations primarily through cash flows from operations, long-term debt, and the sale of equity securities. Over the past three years, the we have funded our operations and capital expenditures through a combination of cashflow from operations and cash on hand. We had no amount outstanding under the RBC Credit Facility at December 31, 2019.
46
Table of Contents
The following table summarizes our consolidated cash flows for the years indicated:
| Years ended December 31, | ||||||||||||
| 2019 | 2018 | 2017 | ||||||||||
| ($ in thousands) | ||||||||||||
| Cash flows provided by (used in) operating activities |
13,359 | 10,065 | 19,432 | |||||||||
| Cash provided by (used in) investing activities |
(15,189 | ) | (13,462 | ) | (19,499 | ) | ||||||
| Cash provided by (used in) financing activities |
(5,484 | ) | (3,069 | ) | (9,109 | ) | ||||||
| Effect of foreign exchange on cash and cash equivalents |
1,076 | (3,606 | ) | 2,984 | ||||||||
|
|
|
|
|
|
|
|||||||
| Net decrease in cash and cash equivalents |
(6,238 | ) | (10,072 | ) | (6,192 | ) | ||||||
| Cash and cash equivalents, beginning of period |
53,412 | 63,484 | 69,676 | |||||||||
|
|
|
|
|
|
|
|||||||
| Cash and cash equivalents, end of period |
47,174 | 53,412 | 63,484 | |||||||||
|
|
|
|
|
|
|
|||||||
Operating Activities
Net cash flows provided by operating activities increased to $13.4 million for the year ended December 31, 2019 from $10.1 million for the comparative period in 2018. Net cash flows from operations before changes in operating assets and liabilities was $8.4 million (calculated as $4.4 million of net loss plus $12.8 million of non-cash adjustments) in 2019, compared to $29.1 million (calculated as $5.6 million of net income plus $23.5 million of non-cash adjustments) in 2018, which largely reflects the 2019 reduction in adjusted gross profit discussed above. Non-cash adjustments include, among other things, depreciation and amortization expense, impairment expense, stock-based compensation net of cash paid on surrenders of stock options, and unrealized foreign exchange impacts. The increase in cash flows from operations is largely due to an increase in collections on accounts receivable balances partially offset by a decrease in accounts payable resulting from timing of payments.
Investing Activities
We invested $12.7 million in PP&E during 2019 compared to $8.6 million in 2018. The increase was primarily due to manufacturing equipment purchases for the new tile and millwork facility, of which $4.5 million was incurred in the second half of 2019. We invested $3.5 million on capitalized software and other assets during 2019, as compared to $5.2 million in 2018. The reduction is due to the current mix of projects undertaken by the Company and included a higher portion of efforts related to business process improvements that were not eligible for capitalization.
Financing Activities
Net cash used in financing activities was $5.5 million in 2019. We repaid the balance of $5.6 million on long-term debt outstanding and related interest during the first quarter of 2019. Cash used in financing activities was $3.1 million in 2018.
We currently expect to fund anticipated future investments with available cash. Apart from cash flow from operations, issuing equity and debt has been our primary source of capital to date. Additional debt or equity financing may be pursued in the future as we may deem appropriate. We may also use debt or pursue equity financing depending on the share price at the time, interest rates, and nature of the investment opportunity and economic climate.
Credit Facility
At December 31, 2019, we had no amounts drawn on our RBC Credit Facility, and we were in compliance with all covenants thereunder. In 2018, we did not draw on the Comerica Credit Facility. The Comerica Credit Facility expired on June 30, 2019.
47
Table of Contents
On July 19, 2019, we entered into a C$50.0 million senior secured revolving credit facility with the Royal Bank of Canada. The RBC Credit Facility has a three-year term and can be extended for up to two additional years at our option. Interest is calculated at the Canadian or U.S. prime rate with no adjustment, or the bankers’ acceptance rate plus 125 basis points. We are required to comply with certain financial covenants under the RBC Credit Facility, including maintaining a minimum fixed charge coverage ratio of 1.15:1 and a maximum debt to Adjusted EBITDA ratio of 3.0:1. We are also required to comply with certain non-financial covenants, including, among other things, covenants restricting our ability to (i) dispose of our property, (ii) enter into certain transactions intended to effect or otherwise permit a material change in our corporate or capital structure, (iii) incur any debt, other than permitted debt, and (iv) permit certain encumbrances on our property.
We are generally restricted from making dividends or distributions on our outstanding capital shares (other than any distribution by way of the payment of dividends by the issuance of equity securities). We may also declare and pay dividends to our shareholders provided that such dividends do not exceed 50% of the Free Operating Cash Flow (as defined in the RBC Credit Facility) for the most recently completed fiscal year and meet certain other conditions. We may also make a one-time Permitted Special Distributions (as defined in the RBC Credit Facility) provided that we maintain a minimum balance of at least C$20.0 million in our account and meet certain other conditions.
The RBC Credit Facility is secured by substantially all of our real property located in Canada and the United States.
Contractual Obligations
The following table summarizes DIRTT’s contractual obligations at December 31, 2019:
| Payments due by period | ||||||||||||||||||||
| Less than 1 year |
1 to 3 years | 3 to 5 years | Greater than 5 years |
Total | ||||||||||||||||
| ($ in thousands) | ||||||||||||||||||||
| Accounts payable and accrued liabilities |
20,384 | — | — | — | 20,384 | |||||||||||||||
| Other liabilities |
5,187 | — | — | — | 5,187 | |||||||||||||||
| Current and long-term debt |
— | — | — | — | — | |||||||||||||||
| Customer deposits and deferred revenue |
3,567 | — | — | — | 3,567 | |||||||||||||||
| Lease liabilities (undiscounted) |
5,419 | 10,296 | 4,439 | 4,469 | 24,623 | |||||||||||||||
| Purchase obligations |
6,807 | — | — | — | 6,807 | |||||||||||||||
|
|
|
|
|
|
|
|
|
|
|
|||||||||||
| Total |
41,364 | 10,296 | 4,439 | 4,469 | 60,568 | |||||||||||||||
|
|
|
|
|
|
|
|
|
|
|
|||||||||||
48
Table of Contents
Significant Accounting Policies and Estimates
Our significant accounting policies are described in Note 2 to our Consolidated Financial Statements appearing elsewhere in this Annual Report. Our critical accounting estimates include the areas where we have made what we consider to be particularly difficult, subjective or complex judgements in making estimates, and where these estimates can significantly affect our financial results under different assumptions and conditions. We prepare our financial statements in conformity with GAAP. As a result, we are required to make estimates, judgments and assumptions that we believe are reasonable based upon the information available. These estimates, judgments and assumptions affect the reported amounts of assets and liabilities at the date of the financial statements and reported amounts of revenue and expenses during the periods presented. Actual results could be different from these estimates. Critical estimates and assumptions made by management include:
Estimates of liabilities associated with the potential and amount of warranty, legal claims and other contingencies
We have warranty obligations with respect to manufacturing defects on most of our manufactured products. Warranty periods generally range from 1 to 10 years. We have recorded a reserve for estimated warranty and related costs based on historical experience and periodically adjust these provisions to reflect actual experience. We assess the adequacy of our warranty accrual on a quarterly basis, and adjust the previous amounts recorded, if necessary, to reflect the change in estimate of the future costs of claims yet to be serviced. Typically, product deficiencies requiring our warranty are identified and remediated within a year of production. The following provides information with respect to our warranty accrual. At December 31, 2019 and 2018, we had $4.0 million and $1.5 million, respectively, accrued for warranty and other provisions, and third-party costs associated with remedying deficiencies were $2.6 million during the fiscal 2019, as compared to $2.1 million during fiscal 2018. Following the completion of third-party testing in 2019, we determined that timber included in certain projects installed between 2016 and 2019 potentially did not meet the fire-retardant specifications that the projects were sold under. As a result, we recorded a $2.5 million liability and are in the process of contacting customers to determine appropriate remedial actions, if any. We are in discussions with our insurance carrier to determine how much, if any, of this liability is covered by insurance. We have ceased selling timber to projects with those particular specifications until such time as we have a permanent solution. We are also in the process of evaluating solutions which, if successful, could significantly reduce the associated liability. The current year expenditures primarily relates to the previously noted increase in the incidence of tile warping as a result of a change in the composition of the underlying medium density fiberboard substrate. This issue is currently being addressed, and our warranty provision may change as the assessment of this issue changes.
We establish reserves for estimated legal contingencies when we believe a loss on litigation is probable and the amount of the loss can be reasonably estimated. Revisions to contingent liability reserves are reflected in operations in the period in which there are changes in facts and circumstances that affect our previous assumptions with respect to the likelihood or amount of loss. Reserves for contingent liabilities are based upon our assumptions and estimates regarding the probable outcome of the matter. We estimate the probable cost by evaluating historical precedent as well as the specific facts relating to each contingency (including the opinion of outside advisors). Should the outcome differ from our assumptions and estimates, or other events result in a material adjustment to the accrued estimated reserves, revisions to the estimated reserves for contingent liabilities would be required and would be recognized in the period the new information becomes known. At December 31, 2019 and 2018, we had $0.7 million and $2.0 million, respectively, provided for legal provisions.
Estimates of useful lives of depreciable assets and the fair value of long-term assets used for impairment calculations
We evaluate the recoverability of our PP&E and capitalized software costs when events or changes in circumstances indicate a potential impairment exists. If impairment is indicated, the impairment loss is measured as the amount the assets carrying value exceeds the fair value of the assets.
49
Table of Contents
Our determination of the fair value associated with long-term assets involve significant estimates and assumptions, including those with respect to the determination of asset groups, future cash inflows and outflows, discount rates, and asset lives. These significant estimates require considerable judgment, which could affect our future results if the current estimates of future performance and fair values change.
We estimate the useful lives of PP&E and capitalized software costs based on the period over which the assets are expected to be available for use. The estimated useful lives are reviewed annually and are updated if expectations differ from previous estimates due to physical wear and tear, technical or commercial obsolescence and legal or other limits on the use of the relevant assets. In addition, the estimation of the useful lives of the relevant assets may be based on internal technical evaluation and experience with similar assets. It is possible, however, that future results of operations could be materially affected by changes in the estimates brought about by changes in factors mentioned above. The amounts and timing of recorded expenses for any period would be affected by changes in these factors and circumstances. A reduction in the estimated useful lives of the PP&E and capitalized software assets would increase the recorded expenses and decrease the non-current assets.
Estimates of future taxable earnings used to assess the realizable value of deferred tax assets
We use the asset and liability method of accounting for income taxes. Under this method, deferred income tax assets and liabilities arise from temporary differences between the tax bases of assets and liabilities and their carrying amounts reported in the financial statements. Deferred income tax assets also reflect the benefit of unutilized tax losses that can be carried forward to reduce income taxes in future years. Such method requires the exercise of significant judgment in determining whether or not our deferred tax assets are probable of recovery from taxable income of future years and, therefore, can be recognized in the financial statements. Also, estimates are required to determine the expected timing upon which tax assets will be realized and upon which tax liabilities will be settled. We assess the ability to recover our deferred tax assets every quarter and concluded that deferred tax assets should be recovered in the normal course of operations.
Tax interpretations, regulations and legislations in the various jurisdictions in which the Company and its subsidiaries operate
The determination of our provision for income taxes requires significant judgment, the use of estimates and the interpretation and application of complex tax laws. Our provision for income taxes reflects a combination of income earned and taxed in the various U.S. federal and state, and Canadian federal and provincial jurisdictions. Jurisdictional tax law changes increase or decreases in permanent differences between book and tax items, accruals or adjustments of accruals for tax contingencies or valuation allowances, and the change in the mix of earnings from these taxing jurisdictions all affect the overall effective tax rate.
We have no liability for uncertain tax positions. However, should we accrue for such liabilities, when and if they arise in the future, we will recognize interest and penalties associated with uncertain tax positions as part of our income tax provision.
Estimates of the fair value of stock awards, including whether the performance criteria will be met and measurement of the ultimate payout amount
We use a fair-value based approach for measuring stock-based compensation and record compensation expense over an award’s vesting period based on the award’s fair value at the date of grant. Our awards vest based on service conditions, and compensation expense is recognized on a straight-line basis. Stock-based compensation expense is recognized only for those awards that ultimately vest.
Prior to October 2019, we allowed certain vested share options to be surrendered for cash, resulting in the share options being accounted for as liabilities at fair value every period, which increases the sensitivity of our accounting to share price movements.
50
Table of Contents
Estimates of ability and timeliness of customer payments of accounts receivable
Our allowance for doubtful accounts reflects reserves for customer receivables to reduce receivables to amounts expected to be collected. Management uses significant judgment in estimating uncollectible amounts. In estimating uncollectible accounts, management considers factors such as current overall economic conditions, industry-specific economic conditions, historical customer performance and anticipated customer performance. While we believe these processes effectively address our exposure for doubtful accounts and credit losses have historically been within expectations, changes in the economy, industry, or specific customer conditions may require adjustments to the allowance for doubtful accounts. We have a contract with a trade credit insurance provider, whereby a portion of its trade receivables are insured. The trade credit insurance provider determines the coverage amount, if any, on a customer-by-customer basis. Based on our trade receivables balance as at December 31, 2019 and 2018, nil and 70%, respectively, of that balance was covered by trade credit insurance provider.
At December 31, 2019 and 2018, we had an allowance for doubtful accounts of $0.1 million.
Recent Accounting Pronouncements
Please refer to Note 3 to our Consolidated Financial Statements presented elsewhere in this Annual Report.
51
Table of Contents
| Item 7A. | Quantitative and Qualitative Disclosures About Market Risk. |
Our financial assets and liabilities consist primarily of cash and cash equivalents, trade and other receivables, accounts payable and accrued liabilities, and long-term debt. We are exposed to market, credit and liquidity risks associated with financial assets and liabilities. We currently do not use financial derivatives to reduce exposures from changes in foreign exchange rates, commodity prices, or interest rates. We do not hold or use any derivative instruments for trading or speculative purposes. Our Board has responsibility for the establishment and approval of overall risk management policies, including those related to financial instruments. Management performs continuous assessments to ensure that all significant risks related to financial instruments are reviewed and addressed in light of changes to market conditions and operating activities.
Credit risk
Our principal financial assets are cash and cash equivalents, and trade and other receivables.
Our credit risk is primarily concentrated in our trade receivables as we do not believe that we are exposed to any significant credit risk related to our cash and cash equivalents. The amounts disclosed in the consolidated balance sheet for trade and other receivables are net of allowances for doubtful accounts. Allowances are provided for known and anticipated credit losses and disputed amounts. In order to reduce our risk, management maintains credit policies that include regular review of credit limits of individual Distribution Partners and systematic monitoring of aging of trade receivables. Trade balances are spread over a broad Distribution Partner base, which is geographically dispersed. No Distribution Partner accounts for greater than 10% of revenue. In addition, and where possible, we collect a 50% deposit on sales, excluding government and certain other clients.
Prior to October 1, 2019, we had a contract with a trade credit insurance provider, whereby a portion of our trade receivables were insured. The trade credit insurance provider determined the coverage amount, if any, on an individual Distribution Partner or client basis. We discontinued this insurance before the end of 2019. Based on our trade receivables balance for 2018, 70% of that balance was covered by the trade credit insurance provider. We discontinued trade credit insurance as our sales are typically to our Distribution Partners with whom we have had ongoing relationships and historically we have had limited instances of non-collections.
Market risk
Market risk is the risk that changes in market prices, such as interest rates and foreign currency exchange rates, will affect our income or the value of the financial instruments held.
Foreign exchange risk
Historically, the majority (approximately 80% to 85%) of our revenue is collected in U.S. dollars, and approximately 60% of our costs are also incurred in U.S. dollars. Most other revenue and costs are denominated in Canadian dollars. As a result, we are exposed to fluctuations in the U.S. dollar against the Canadian dollar, which could have a positive or negative impact on our revenue and costs. The recent weakening of the U.S. dollar versus the Canadian dollar has had a negative impact on results because reported cost reductions are less than reported revenue reductions.
52
Table of Contents
Our financial instruments are exposed primarily to fluctuations in the Canadian dollar. The following table details our exposure to currency risk at the reporting dates and a sensitivity analysis to changes in currency. The sensitivity analysis includes Canadian dollar-denominated monetary items and adjusts their translation at period end for their respective change in the Canadian dollar. For the respective weakening of the Canadian dollar, there would be an equal and opposite impact on net income and comprehensive income.
| Amount (C$ in thousands) |
Change in currency (%) |
Effect of net income and comprehensive income for the year ended December 31, 2019 |
||||||||||
| Cash and cash equivalents |
C$ | 880 | 10.0 | % | C$ | 88 | ||||||
| Trade and other receivables |
7,156 | 10.0 | % | 716 | ||||||||
| Inventory |
15,423 | 10.0 | % | 1,542 | ||||||||
| Prepaids and other current assets |
3,326 | 10.0 | % | 333 | ||||||||
| Accounts payable and accrued liabilities |
(16,961 | ) | 10.0 | % | (1,696 | ) | ||||||
| Other liabilities |
(400 | ) | 10.0 | % | (40 | ) | ||||||
| Customer deposits and deferred revenue |
(498 | ) | 10.0 | % | (50 | ) | ||||||
|
|
|
|
|
|||||||||
| Total |
C$ | 8,926 | 10.0 | % | C$ | 893 | ||||||
|
|
|
|
|
|||||||||
Commodity price risk
We consume raw materials such as aluminum, hardware, wood and veneer, timber, plastic, electrical wiring and components, paint and powder, and fabric and vinyl. While aluminum represents the largest component of our raw materials’ expenditures, overall aluminum spend comprises only approximately 11% of product revenues and, therefore, absolute exposure to price fluctuations has a minimal impact on profitability.
Interest rate risk
In July 2019, we entered into a C$50.0 million senior secured revolving credit facility with no amounts outstanding at December 31, 2019. Historically, certain of our financial liabilities are subject to interest charges at floating rates and are exposed to fluctuations in interest rates. Term loans under the previous revolving operating facility were repaid without penalty in January of 2019. At December 31, 2018, $5.6 million was outstanding on the previous revolving operating facility and was subject to floating interest rates. An increase in overall interest rates by 0.5% would have increased interest expense related to these items and decrease net income (loss) and comprehensive income (loss) by $nil for 2019 and $0.1 million for 2018. An equal decrease in rates would generate an equal amount of interest savings.
53
Table of Contents
| Item 8. | Financial Statements and Supplementary Data. |
| INDEX | Page No. | |||
| 55 | ||||
| Consolidated Balance Sheet, as at December 31, 2019 and 2018 |
56 | |||
| 57 | ||||
| 58 | ||||
| Consolidated Statements of Cash Flows for the years ended December 31, 2019, 2018 and 2017 |
59 | |||
| 60 | ||||
| 83 | ||||
54
Table of Contents

Report of Independent Registered Public Accounting Firm
To the Shareholders and Board of Directors of DIRTT Environmental Solutions Ltd.
Opinion on the Financial Statements
We have audited the accompanying consolidated balance sheets of DIRTT Environmental Solutions Ltd. and its subsidiaries (together, the Company) as of December 31, 2019 and 2018, and the related consolidated statements of operations and comprehensive income (loss), changes in shareholders’ equity, and cash flows for each of the three years in the period ended December 31, 2019, including the related notes (collectively referred to as the consolidated financial statements). In our opinion, the consolidated financial statements present fairly, in all material respects, the financial position of the Company as of December 31, 2019 and 2018, and the results of its operations and its cash flows for each of the three years in the period ended December 31, 2019 in conformity with accounting principles generally accepted in the United States of America.
Change in Accounting Principle
As discussed in Note 3 to the consolidated financial statements, the Company changed the manner in which it accounts for leases in 2019 due to the adoption of ASC Topic 842, Leases.
Basis for Opinion
These consolidated financial statements are the responsibility of the Company’s management. Our responsibility is to express an opinion on the Company’s consolidated financial statements based on our audits. We are a public accounting firm registered with the Public Company Accounting Oversight Board (United States) (PCAOB) and are required to be independent with respect to the Company in accordance with the U.S. federal securities laws and the applicable rules and regulations of the Securities and Exchange Commission and the PCAOB.
We conducted our audits of these consolidated financial statements in accordance with the standards of the PCAOB. Those standards require that we plan and perform the audit to obtain reasonable assurance about whether the consolidated financial statements are free of material misstatement, whether due to error or fraud. The Company is not required to have, nor were we engaged to perform, an audit of its internal control over financial reporting. As part of our audits we are required to obtain an understanding of internal control over financial reporting but not for the purpose of expressing an opinion on the effectiveness of the Company’s internal control over financial reporting. Accordingly, we express no such opinion.
Our audits included performing procedures to assess the risks of material misstatement of the consolidated financial statements, whether due to error or fraud, and performing procedures that respond to those risks. Such procedures included examining, on a test basis, evidence regarding the amounts and disclosures in the consolidated financial statements. Our audits also included evaluating the accounting principles used and significant estimates made by management, as well as evaluating the overall presentation of the consolidated financial statements. We believe that our audits provide a reasonable basis for our opinion.
/s/ PricewaterhouseCoopers LLP
Chartered Professional Accountants
Calgary, Canada
February 25, 2020
We have served as the Company’s auditor since 2017.
|
|
PricewaterhouseCoopers LLP | |
| 111-5th Avenue SW, Suite 3100, Calgary, Alberta, Canada T2P 5L3 T: +1 403 509 7500, F: +1 403 781 1825
“PwC” refers to PricewaterhouseCoopers LLP, an Ontario limited liability partnership. |
Table of Contents
DIRTT Environmental Solutions Ltd.
Consolidated Balance Sheets
(Stated in thousands of U.S. dollars)
| As at December 31, | ||||||||
| 2019 | 2018 | |||||||
| ASSETS |
||||||||
| Current Assets |
||||||||
| Cash and cash equivalents |
47,174 | 53,412 | ||||||
| Trade and other receivables, net of allowances for doubtful accounts of $0.1 million at both December 31, 2019 and 2018 |
24,941 | 43,873 | ||||||
| Inventory |
17,566 | 18,650 | ||||||
| Prepaids and other current assets |
3,340 | 2,217 | ||||||
|
|
|
|
|
|||||
| Total Current Assets |
93,021 | 118,152 | ||||||
|
|
|
|
|
|||||
| Property, plant and equipment, net |
41,365 | 36,728 | ||||||
| Capitalized software, net |
8,213 | 8,335 | ||||||
| Operating lease right-of-use assets, net |
20,661 | — | ||||||
| Deferred tax assets, net |
5,364 | 6,083 | ||||||
| Goodwill |
1,421 | 1,353 | ||||||
| Other assets |
5,518 | 5,260 | ||||||
|
|
|
|
|
|||||
| Total Assets |
175,563 | 175,911 | ||||||
|
|
|
|
|
|||||
| LIABILITIES |
||||||||
| Current Liabilities |
||||||||
| Accounts payable and accrued liabilities |
20,384 | 31,283 | ||||||
| Other liabilities |
5,187 | 6,823 | ||||||
| Customer deposits and deferred revenue |
3,567 | 7,701 | ||||||
| Current portion of lease liability |
5,287 | — | ||||||
| Current portion of long-term debt |
— | 2,500 | ||||||
|
|
|
|
|
|||||
| Total Current Liabilities |
34,425 | 48,307 | ||||||
|
|
|
|
|
|||||
| Deferred tax liabilities, net |
— | 965 | ||||||
| Other long-term liabilities |
35 | — | ||||||
| Long-term lease liabilities |
16,116 | — | ||||||
| Long-term debt |
— | 3,125 | ||||||
|
|
|
|
|
|||||
| Total Liabilities |
50,576 | 52,397 | ||||||
|
|
|
|
|
|||||
| SHAREHOLDERS’ EQUITY |
||||||||
| Common shares, unlimited authorized without par value, 84,681,364 issued and outstanding at December 31, 2019 and 84,660,319 issued and outstanding at December 31, 2018 |
180,639 | 180,562 | ||||||
| Additional paid-in capital |
8,343 | 6,615 | ||||||
| Accumulated other comprehensive loss |
(18,028 | ) | (22,092 | ) | ||||
| Accumulated deficit |
(45,967 | ) | (41,571 | ) | ||||
|
|
|
|
|
|||||
| Total Shareholders’ Equity |
124,987 | 123,514 | ||||||
|
|
|
|
|
|||||
| Total Liabilities and Shareholders’ Equity |
175,563 | 175,911 | ||||||
|
|
|
|
|
|||||
The accompanying notes are an integral part of these consolidated financial statements.
56
Table of Contents
DIRTT Environmental Solutions Ltd.
Consolidated Statements of Operations and Comprehensive Income (Loss)
(Stated in thousands of U.S. dollars, except per share data)
| For the year ended December 31, | ||||||||||||
| 2019 | 2018 | 2017 | ||||||||||
| Product revenue |
240,659 | 266,434 | 216,216 | |||||||||
| Service revenue |
7,076 | 8,247 | 10,323 | |||||||||
|
|
|
|
|
|
|
|||||||
| Total revenue1 |
247,735 | 274,681 | 226,539 | |||||||||
|
|
|
|
|
|
|
|||||||
| Product cost of sales |
153,128 | 161,844 | 131,326 | |||||||||
| Costs of under-utilized capacity |
2,240 | — | — | |||||||||
| Service cost of sales |
5,943 | 5,828 | 9,724 | |||||||||
|
|
|
|
|
|
|
|||||||
| Total cost of sales |
161,311 | 167,672 | 141,050 | |||||||||
|
|
|
|
|
|
|
|||||||
| Gross profit |
86,424 | 107,009 | 85,489 | |||||||||
|
|
|
|
|
|
|
|||||||
| Expenses |
||||||||||||
| Sales and marketing |
33,939 | 40,627 | 46,192 | |||||||||
| General and administrative |
27,645 | 28,722 | 28,370 | |||||||||
| Operations support |
11,037 | 8,069 | 7,212 | |||||||||
| Technology and development |
7,818 | 4,176 | 6,335 | |||||||||
| Stock-based compensation |
3,876 | 3,661 | 2,738 | |||||||||
| Reorganization |
4,560 | 7,380 | 1,143 | |||||||||
| Impairment |
— | 8,680 | — | |||||||||
|
|
|
|
|
|
|
|||||||
| Total operating expenses |
88,875 | 101,315 | 91,990 | |||||||||
|
|
|
|
|
|
|
|||||||
| Operating income (loss) |
(2,451 | ) | 5,694 | (6,501 | ) | |||||||
|
|
|
|
|
|
|
|||||||
| Foreign exchange (gain) loss |
1,324 | (3,214 | ) | 665 | ||||||||
| Interest income |
(529 | ) | (425 | ) | (399 | ) | ||||||
| Interest expense |
131 | 503 | 500 | |||||||||
|
|
|
|
|
|
|
|||||||
| 926 | (3,136 | ) | 766 | |||||||||
|
|
|
|
|
|
|
|||||||
| Income (loss) before tax |
(3,377 | ) | 8,830 | (7,267 | ) | |||||||
|
|
|
|
|
|
|
|||||||
| Income taxes |
||||||||||||
| Current tax expense |
1,064 | 2,178 | 3,277 | |||||||||
| Deferred tax expense (recovery) |
(45 | ) | 1,102 | (2,819 | ) | |||||||
|
|
|
|
|
|
|
|||||||
| 1,019 | 3,280 | 458 | ||||||||||
|
|
|
|
|
|
|
|||||||
| Net income (loss) for the year |
(4,396 | ) | 5,550 | (7,725 | ) | |||||||
|
|
|
|
|
|
|
|||||||
| Income (loss) per share |
||||||||||||
| Basic and diluted income (loss) per share |
(0.05 | ) | 0.07 | (0.09 | ) | |||||||
| Weighted average number of shares outstanding (stated in thousands) |
||||||||||||
| Basic |
84,671 | 84,477 | 84,679 | |||||||||
| Diluted |
84,671 | 85,009 | 84,679 | |||||||||
|
|
|
|
|
|
|
|||||||
| 1 | 2019 revenues include $nil from related parties (2018 – $2.9 million, 2017 – $6.7 million) |
Consolidated Statement of Comprehensive Income (Loss)
| For the year ended December 31, | ||||||||||||
| 2019 | 2018 | 2017 | ||||||||||
| Net income (loss) for the year |
(4,396 | ) | 5,550 | (7,725 | ) | |||||||
| Exchange differences on translation of foreign operations, net of tax |
4,064 | (9,980 | ) | 7,417 | ||||||||
|
|
|
|
|
|
|
|||||||
| Comprehensive income (loss) for the year |
(332 | ) | (4,430 | ) | (308 | ) | ||||||
|
|
|
|
|
|
|
|||||||
The accompanying notes are an integral part of these consolidated financial statements.
57
Table of Contents
DIRTT Environmental Solutions Ltd.
Consolidated Statements of Changes in Shareholders’ Equity
(Stated in thousands of U.S. dollars, except for share data)
| Number of Common shares |
Common shares |
Warrants | Additional paid-in capital |
Accumulated other comprehensive income (loss) |
Accumulated deficit |
Total shareholders’ equity |
||||||||||||||||||||||
| As at December 31, 2016 |
84,878,891 | 177,712 | 217 | 5,632 | (19,529 | ) | (34,655 | ) | 129,377 | |||||||||||||||||||
| Shares repurchased |
(1,672,187 | ) | (2,989 | ) | — | — | — | (4,741 | ) | (7,730 | ) | |||||||||||||||||
| Warrant fair value adjustment |
— | — | 34 | — | — | — | 34 | |||||||||||||||||||||
| Issued on exercise of warrants |
50,325 | 251 | (251 | ) | — | — | — | — | ||||||||||||||||||||
| Issued on exercise of stock options |
967,498 | 3,423 | — | (1,015 | ) | — | — | 2,408 | ||||||||||||||||||||
| Stock-based compensation |
— | — | — | 2,738 | — | — | 2,738 | |||||||||||||||||||||
| Foreign currency translation adjustment |
— | — | — | — | 7,417 | — | 7,417 | |||||||||||||||||||||
| Net loss for the year |
— | — | — | — | — | (7,725 | ) | (7,725 | ) | |||||||||||||||||||
|
|
|
|
|
|
|
|
|
|
|
|
|
|
|
|||||||||||||||
| As at December 31, 2017 |
84,224,527 | 178,397 | — | 7,355 | (12,112 | ) | (47,121 | ) | 126,519 | |||||||||||||||||||
|
|
|
|
|
|
|
|
|
|
|
|
|
|
|
|||||||||||||||
| Issued on exercise of stock options |
435,792 | 2,165 | — | (628 | ) | — | — | 1,537 | ||||||||||||||||||||
| Stock-based compensation |
— | — | — | 2,190 | — | — | 2,190 | |||||||||||||||||||||
| Stock option conversion to cash-settled awards |
— | — | — | (2,302 | ) | — | — | (2,302 | ) | |||||||||||||||||||
| Foreign currency translation adjustment |
— | — | — | — | (9,980 | ) | — | (9,980 | ) | |||||||||||||||||||
| Net income for the year |
— | — | — | — | — | 5,550 | 5,550 | |||||||||||||||||||||
|
|
|
|
|
|
|
|
|
|
|
|
|
|
|
|||||||||||||||
| As at December 31, 2018 |
84,660,319 | 180,562 | — | 6,615 | (22,092 | ) | (41,571 | ) | 123,514 | |||||||||||||||||||
|
|
|
|
|
|
|
|
|
|
|
|
|
|
|
|||||||||||||||
| Issued on exercise of stock options |
21,045 | 77 | — | (1 | ) | — | — | 76 | ||||||||||||||||||||
| Stock-based compensation |
— | — | — | 1,729 | — | — | 1,729 | |||||||||||||||||||||
| Foreign currency translation adjustment |
— | — | — | — | 4,064 | — | 4,064 | |||||||||||||||||||||
| Net loss for the year |
— | — | — | — | — | (4,396 | ) | (4,396 | ) | |||||||||||||||||||
|
|
|
|
|
|
|
|
|
|
|
|
|
|
|
|||||||||||||||
| As at December 31, 2019 |
84,681,364 | 180,639 | — | 8,343 | (18,028 | ) | (45,967 | ) | 124,987 | |||||||||||||||||||
|
|
|
|
|
|
|
|
|
|
|
|
|
|
|
|||||||||||||||
The accompanying notes are an integral part of these consolidated financial statements.
58
Table of Contents
DIRTT Environmental Solutions Ltd.
Consolidated Statements of Cash Flows
(Stated in thousands of U.S. dollars)
| For the year ended December 31, | ||||||||||||
| 2019 | 2018 | 2017 | ||||||||||
| Cash flows from operating activities: |
||||||||||||
| Net income (loss) for the year |
(4,396 | ) | 5,550 | (7,725 | ) | |||||||
| Adjustments: |
||||||||||||
| Depreciation and amortization |
12,242 | 13,699 | 12,856 | |||||||||
| Stock-based compensation, net of cash settlements |
202 | 1,870 | 2,738 | |||||||||
| Foreign exchange (gain) loss |
345 | (1,902 | ) | (199 | ) | |||||||
| Loss on disposal of property, plant and equipment |
53 | 67 | 27 | |||||||||
| Deferred income tax expense (recovery) |
(45 | ) | 1,102 | (2,819 | ) | |||||||
| Impairment |
— | 8,680 | — | |||||||||
| Warrant fair value adjustments |
— | — | 34 | |||||||||
| Changes in operating assets and liabilities: |
||||||||||||
| Trade and other receivables |
21,025 | (26,613 | ) | 6,120 | ||||||||
| Inventory |
1,667 | (285 | ) | (2,215 | ) | |||||||
| Prepaid and other current assets |
(1,035 | ) | (319 | ) | (378 | ) | ||||||
| Other assets |
162 | 181 | (60 | ) | ||||||||
| Trade accounts payable and other liabilities |
(12,183 | ) | 6,132 | 8,664 | ||||||||
| Lease liabilities |
(402 | ) | — | — | ||||||||
| Customer deposits |
(4,276 | ) | 1,903 | 2,389 | ||||||||
|
|
|
|
|
|
|
|||||||
| Net cash flows provided by operating activities |
13,359 | 10,065 | 19,432 | |||||||||
|
|
|
|
|
|
|
|||||||
| Cash flows from investing activities: |
||||||||||||
| Purchase of property, plant and equipment |
(12,702 | ) | (8,634 | ) | (14,396 | ) | ||||||
| Capitalized software development and other asset expenditures |
(3,452 | ) | (5,234 | ) | (5,496 | ) | ||||||
| Recovery of software development expenditures |
511 | 178 | 203 | |||||||||
| Proceeds on sale of property, plant and equipment |
55 | 60 | 109 | |||||||||
| Changes in accounts payable related to investing activities |
399 | 168 | 81 | |||||||||
|
|
|
|
|
|
|
|||||||
| Net cash flows used in investing activities |
(15,189 | ) | (13,462 | ) | (19,499 | ) | ||||||
|
|
|
|
|
|
|
|||||||
| Cash flows from financing activities: |
||||||||||||
| Cash received on exercise of stock options |
77 | 1,537 | 2,408 | |||||||||
| Repayment of long-term debt |
(5,561 | ) | (4,606 | ) | (3,787 | ) | ||||||
| Shares repurchased |
— | — | (7,730 | ) | ||||||||
|
|
|
|
|
|
|
|||||||
| Net cash flows used in financing activities |
(5,484 | ) | (3,069 | ) | (9,109 | ) | ||||||
|
|
|
|
|
|
|
|||||||
| Effect of foreign exchange on cash and cash equivalents |
1,076 | (3,606 | ) | 2,984 | ||||||||
|
|
|
|
|
|
|
|||||||
| Net decrease in cash and cash equivalents |
(6,238 | ) | (10,072 | ) | (6,192 | ) | ||||||
| Cash and cash equivalents, beginning of year |
53,412 | 63,484 | 69,676 | |||||||||
|
|
|
|
|
|
|
|||||||
| Cash and cash equivalents, end of year |
47,174 | 53,412 | 63,484 | |||||||||
|
|
|
|
|
|
|
|||||||
| Supplemental disclosure of cash flow information: |
||||||||||||
| Interest paid |
(99 | ) | (503 | ) | (609 | ) | ||||||
| Income taxes paid |
(2,518 | ) | (3,816 | ) | (2,760 | ) | ||||||
|
|
|
|
|
|
|
|||||||
The accompanying notes are an integral part of these consolidated financial statements.
59
Table of Contents
DIRTT Environmental Solutions Ltd.
Notes to the Consolidated Financial Statements
(Amounts stated in thousands of U.S. dollars unless otherwise stated)
1. GENERAL INFORMATION
DIRTT Environmental Solutions Ltd. and its subsidiaries (“DIRTT” or the “Company”) is a leading technology-driven manufacturer of highly customized interiors. DIRTT combines its proprietary 3D design, configuration and manufacturing software (“ICE®” or “ICE Software”) with integrated in-house manufacturing of its innovative prefabricated interior construction solutions and an extensive distribution partners network. ICE provides accurate design, drawing, specification, pricing and manufacturing process information, allowing rapid production of high-quality custom solutions using fewer resources than traditional manufacturing methods. ICE is also licensed to unrelated companies and distribution partners of the Company. DIRTT is incorporated under the laws of the province of Alberta, Canada and its headquarters and registered office is located at 7303 – 30th Street S.E., Calgary, AB, Canada T2C 1N6. DIRTT trades on the Toronto Stock Exchange “TSX” under the symbol “DRT” and, effective October 9, 2019, trades on The Nasdaq Global Select Market under the symbol “DRTT”.
2. SIGNIFICANT ACCOUNTING POLICIES
Basis of presentation
These consolidated financial statements (“Financial Statements”), including comparative figures, have been prepared in accordance with accounting principles generally accepted in the United States of America (“GAAP”).
In these Financial Statements, unless otherwise indicated, all dollar amounts are expressed in United States (“U.S.”) dollars. DIRTT’s financial results are consolidated in Canadian dollars, the Company’s functional currency, and the Company has adopted the U.S. dollar as its reporting currency. All references to US$ or $ are to U.S. dollars and references to C$ are to Canadian dollars.
Reclassification
Certain comparative figures have been reclassified to conform to the current year presentation (see Note 16).
Principles of consolidation
The Financial Statements include the accounts of DIRTT and its subsidiaries. All intercompany balances, income and expenses, unrealized gains and losses and dividends resulting from intercompany transactions have been eliminated upon consolidation.
Basis of measurement
These Financial Statements have been prepared on the historical cost convention except for certain financial instruments and stock-based compensation that are measured at fair value, as explained in the accounting policies below. Historical cost is generally based on the fair value of the consideration given in exchange for assets.
Use of estimates
The preparation of the Financial Statements in conformity with GAAP requires management to make estimates and assumptions that affect the reported amounts of assets, liabilities and the disclosure of contingent liabilities at the date of the financial statements and reported amounts of revenues and expenses during the reporting period. Such estimates primarily relate to unsettled transactions and events as of the date of the Financial Statements. Estimates are based on historical data and experience, as well as various other factors that management considers reasonable under the circumstances. Actual outcomes can differ from these estimates.
60
Table of Contents
Significant estimates and assumptions made by management include:
| • | Estimates of ability and timeliness of customer payments of accounts receivable; |
| • | Estimates of useful lives of depreciable assets and the fair value of long-term assets used for impairment calculations; |
| • | Estimates of future taxable earnings used to assess the realizable value of deferred tax assets; |
| • | Tax interpretations, regulations and legislations in the various jurisdictions in which the Company and its subsidiaries operate; |
| • | Estimates of the fair value of stock awards, including whether the performance criteria will be met and measurement of the ultimate payout amount; and |
| • | Estimates of liabilities associated with the potential and amount of warranty, legal claims and other contingencies. |
Segments
Management has determined that DIRTT has one operating segment. The Company’s chief executive officer, who is DIRTT’s chief operating decision maker, reviews financial information on a consolidated and aggregate basis, together with certain operating metrics principally to make decisions about how to allocate resources and to measure the Company’s performance.
Foreign currency translation
DIRTT Environmental Solutions Ltd is a Canadian Company and its functional currency is the Canadian dollar. DIRTT’s wholly owned subsidiary is domiciled in the United States and its functional currency is the U.S. dollar.
Assets and liabilities denominated in foreign currencies, other than those held through foreign subsidiaries, are translated into the transacting company’s functional currency at the year-end exchange rate for monetary items and at the historical exchange rates for non-monetary items. Foreign currency revenues and expenses are translated at the exchange rates in effect on the dates of the related transactions. Foreign exchange gains and losses, other than those arising from the translation of the Company’s net investments in foreign subsidiaries, are included in income.
The accounts of the Company’s U.S. dollar subsidiary is translated into Canadian dollars, and the Financial Statements are translated into U.S. dollars for financial statement presentation. Assets and liabilities are translated using year-end exchange rates, revenues, expenses, gains and losses are translated using average monthly exchange rates. Foreign exchange gains and losses arising from the translation of the Company’s assets and liabilities are included in “other comprehensive income (loss)”.
Cash and cash equivalents
Cash and cash equivalents include cash on hand held at banks and cash equivalents, which are defined as highly liquid investments with original maturities of three months or less.
Trade and other receivables, net of allowance for doubtful accounts
Accounts receivable are recorded at the invoiced amount, do not require collateral and do not bear interest. The Company estimates its allowance for doubtful accounts by evaluating specific accounts where information indicates the Company’s customers may have an inability to meet financial obligations, such as bankruptcy and significantly aged receivables outstanding.
61
Table of Contents
Inventory
Inventory is comprised of raw materials and work in progress. The Company does not typically carry a significant amount of finished goods inventory. Inventory is valued at the lower of weighted average cost and net realizable value. Net realizable value is based on an item’s usability in the manufacturing of the Company’s products. The Company records an allowance for obsolescence when the net realizable value of inventory items declines below weighted average cost, net realizable value is determined based on current market prices for inventory less the estimated cost to sell. Work in progress is valued at an estimate of cost, including attributable overheads, based on stage of completion.
Fixed production overheads are allocated to inventory on the basis of normal capacity of the production facilities. In periods where production levels are abnormally low, unallocated overheads are separately recognized as an expense in the period in which they are incurred.
Leases
For the year-ended December 31, 2019, the Company’s leases policy was as follows:
The Company categorizes leases at their inception as either operating or finance leases. Leases where the Company assumes substantially all of the rewards or ownership and leases where ownership is transferred at the end of the lease term, or by way of a bargain purchase option, are classified as finance leases. Upon initial recognition, the leased asset is measured at an amount equal to the lower of its fair value and the present value of the minimum lease payments. Lease payments are apportioned between finance charges and reduction of the lease liability, so as to achieve a constant rate of interest on the balance of the liability. Finance charges are recognized in the statement of operations.
For leases categorized as operating, the Company determines if an arrangement is a lease or contains a lease element at inception. The arrangement is a lease if it conveys the right to the Company to control the use of identified property, plant, or equipment for a period of time in exchange for consideration. Operating leases are separately disclosed as operating lease right-of-use (“ROU”) assets, with a corresponding lease liability split between current and long-term components on the balance sheet. Operating leases with an initial term of 12 months or less are not included on the balance sheet.
The Company recognizes lease expense for these leases on a straight-line basis over the lease term. ROU assets represent the right to use an underlying asset for the lease term and operating lease liabilities represent the obligation to make lease payments arising from the lease. Operating lease ROU assets and liabilities are recognized at commencement date based on the present value of lease payments over the lease term.
Prior Accounting Policy
For the year-ended December 31, 2018, the Company’s leases policy was as follows:
The Company categorizes leases at their inception as either operating or capital leases. Leases where the Company assumes substantially all the risks and rewards of ownership are classified as capital leases. Upon initial recognition, the leased asset is measured at an amount equal to the lower of its fair value and the present value of the minimum lease payments. Lease payments are apportioned between finance charges and reduction of the lease liability, so as to achieve a constant rate of interest on the balance of the liability. Finance charges are recognized in the statement of operations. Other leases that qualify as operating leases are not recognized in the Company’s balance sheet.
In certain lease agreements, the Company may receive rent holidays or other incentives. The Company recognizes lease costs on a straight-line basis once control of the asset is achieved, without regard to deferred payment terms such as rent holidays that defer the commencement date of required payments. Additionally, incentives received are treated as a reduction of costs over the term of the agreement.
62
Table of Contents
Property, plant and equipment
Property, plant and equipment are recorded at cost, including direct costs, attributable indirect costs and carrying costs, less accumulated depreciation and any accumulated impairment losses. Expenditures for repairs and maintenance are expensed as incurred, while renewals and betterments are capitalized.
Depreciation is charged to operations on a straight-line basis over the estimated useful lives of the assets. The estimated useful lives of the Company’s property, plant and equipment are as follows:
| Building | 25 years | |
| Manufacturing equipment | 10 years | |
| Leasehold improvements | Over term of lease (1 to 10 years) | |
| Office equipment | 5 years | |
| Tooling and prototypes | 4 years | |
| Computer equipment | 3 years | |
| Vehicles | 3 years |
When assets are disposed of or retired, the cost and accumulated depreciation and amortization are removed from the respective accounts and any resulting loss is reflected in operating expenses.
Capitalized software costs
The Company capitalizes costs related to internally developed software during the application development stage when (i) the preliminary project stage is completed, (ii) management has authorized further funding for the completion of the project, and (iii) it is probable that the project will be completed and performed as intended. Capitalized costs includes costs of personnel and related expenses for employees and third parties directly attributable to the projects. Capitalization of these costs ceases once the project is substantially complete and the software is ready for its intended purpose. Costs incurred for significant upgrades and enhancements are also capitalized. Costs related to preliminary project activities and post implementation activities, including training, maintenance and minor modifications or enhancements are expensed as incurred. Capitalized software costs are amortized on a straight-line basis over the estimated useful life of the developed asset, which is generally three to five years. Management evaluates the useful lives of these assets on an annual basis and tests for impairment whenever events or changes in circumstances occur that could impact the recoverability of the assets.
Software development is considered internal-use as it is used to design and sell the DIRTT products and is not included in the end client’s product. Revenues received from distribution partners for ICE Software are recognized as revenues as they are considered an element of the product sale. Any incidental third-party revenues received for the ICE Software are credited against capitalized software costs.
Impairment of long-lived assets
Management evaluates the recoverability of the Company’s property, plant and equipment and capitalized software costs when events or changes in circumstances indicate a potential impairment exists. Events and changes in circumstances considered by the Company in determining whether the carrying value of long-lived assets may not be recoverable include, but are not limited to, significant changes in performance relative to expected operating results, significant changes in the use of the assets, significant negative industry or economic trends, and changes in the Company’s business strategy. Impairment testing is performed at an asset level that represents the lowest level for which identifiable cash flows are largely independent of the cash flows of other assets and liabilities (an “asset group”). In determining if impairment exists, the Company estimates the undiscounted cash flows to be generated from the use and ultimate disposition of the asset group. If impairment is indicated based on a comparison of the assets’ carrying values and the undiscounted cash flows, the impairment loss is measured as the amount by which the carrying amount of the assets exceeds the fair value of the assets. Except as disclosed, the Company determined that there were no events or changes in circumstances that potentially indicated that the Company’s long-lived assets were impaired during the years ended December 31, 2019, 2018 and 2017.
63
Table of Contents
Goodwill
Goodwill represents the excess of the purchase price over the fair value of net assets acquired and liabilities assumed in a business combination. Goodwill is tested for impairment at the reporting unit level at least annually or whenever changes in circumstances indicate that goodwill might be impaired. The Company early adopted ASU 2017-04, which simplified the subsequent measurement of goodwill by eliminating the second step of the goodwill impairment test.
The carrying value of goodwill, which is not amortized, is assessed for impairment annually in the fourth quarter of each year, or more frequently as economic events dictate. The Company has the option of performing an assessment of certain qualitative factors to determine if it is more likely than not that the fair value of a reporting unit is less than its carrying value. If goodwill is determined to be impaired, the impairment charge that would be recognized is based on the amount by which a reporting unit’s carrying value exceeds its fair value, not to exceed the carrying value of goodwill.
Income taxes
Income tax expense is comprised of current and deferred tax. Income tax is recognized in the consolidated statement of operations and comprehensive (loss) income except to the extent it relates to items recognized directly in equity.
Current tax
Current tax expense is based on the results for the year, adjusted for items that are not taxable or not deductible. Current tax is calculated using tax rates and laws that were enacted at the end of the reporting period. Management periodically evaluates positions taken in tax returns with respect to situations in which applicable tax regulation is subject to interpretation. Provisions are established where appropriate on the basis of amounts expected to be paid to the tax authorities.
Deferred tax
Deferred tax is recognized, using the liability method, on temporary differences arising between the tax bases of assets and liabilities and their carrying amounts in the consolidated balance sheet. Deferred income tax assets and liabilities are determined based on differences between the financial reporting and tax bases of assets and liabilities using enacted tax rates and laws that will be in effect when the differences are expected to reverse.
The effect of a change in income tax rates on deferred income tax assets and liabilities is recognized in income in the period during which the change occurs.
When appropriate, the Company records a valuation allowance against deferred tax assets to reflect that these tax assets may not be realized. In determining whether a valuation allowance is appropriate, the Company considers whether it is more likely than not that all or some portion of the Company’s deferred tax assets will not be realized, based on management’s judgment using available evidence about future events.
At times, tax benefits claims may be challenged by a tax authority. Tax benefits are recognized only for tax positions that are more likely than not sustainable upon examination by tax authorities. The amount recognized is measured as the largest amount of benefit that is greater than 50% likely to be realized upon settlement. A liability for “unrecognized tax benefits” is recorded for any tax benefits claimed in the Company’s tax returns that do not meet these recognition and measurement standards.
64
Table of Contents
Revenue recognition
The Company accounts for revenue in accordance with topic 606, Revenue from Contracts with Customers, (“ASC 606”) and Subtopic 340-40, Other Assets and Deferred Costs – Contracts with Customers. Under ASC 606, an entity recognizes revenue in a manner that reflects the transfer of promised goods or services to customers in an amount which the entity expects to be entitled in exchange for those goods or services.
The Company recognizes revenue upon transfer of control of promised goods or services to customers at transaction price, an amount that reflects the consideration the Company expects to receive in exchange for those goods or services. Transaction price is calculated as selling price net of variable consideration which may include estimates for sales incentives related to current period product revenue. Revenue is measured at the fair value of the consideration received or receivable, after discounts, rebates and sales or income taxes and duties.
Product sales
The Company recognizes revenue upon transfer of control of products to the customer, which typically occurs upon shipment. The Company’s main performance obligation to customers is the delivery of products in accordance with purchase orders. Each purchase order defines the transaction price for the products purchased under the arrangement. Distribution partners typically sell DIRTT product to end clients and issue purchase orders to the Company to manufacture the product. Distribution partners utilize ICE licenses to sell DIRTT products, the ICE licenses sold to distribution partners are not considered a separate performance obligation as they are not distinct, and ICE license revenue is recognized in conjunction with product sales. The distribution partner ICE Software revenue is recognized over the license period.
The Company’s standard sales terms are Free On Board (“FOB”) shipping point, which comprise the majority of sales. The Company usually requires a 50% progress payment on receipt of certain orders, excluding certain government orders or in some special contractual situations. Customer deposits received are recognized as a liability on the balance sheet until revenue recognition criteria is met. At the point of shipment, the customer is required to pay the balance of the sales price within 30 days. The Company’s sales arrangements do not have any material financing components. In addition, the Company’s customer arrangements do not produce contract assets that are material to its consolidated financial statements.
The Company provides sales commissions to internal and external sales representatives which are earned in the period in which revenue is recognized.
The Company accounts for product transportation revenue and costs as fulfillment activities and present the associated costs in costs of goods sold in the period in which the Company sells its product.
Contracts containing multiple performance obligations
The Company offers certain arrangements whereby a customer can purchase products and installation together which are generally capable of being distinct and accounted for as separate performance obligations. Where multiple performance obligations exist, the Company determines revenue recognition by (1) identifying the contract with the customer, (2) identifying the performance obligation in the contract, (3) determining the transaction price, (4) allocating the transaction price to the performance obligations based on the relative standalone selling prices, typically based on cost plus a reasonable margin, and (5) recognizing revenue as the performance obligations are satisfied.
Installation and other services
The Company provides installation and other services for certain customers as a distinct performance obligation. Revenue from installation services is recognized over time as the service is performed.
65
Table of Contents
Principal vs Agent Considerations
The Company evaluates the presentation of revenue on a gross vs. net basis based on whether it acts as a principal by controlling the product or service sales to customers. In certain instances, the Company facilitates contracting of certain sales on behalf of distribution partners. The Company records these revenues gross when the Company is obligated to fulfill the services and has the risk associated with service delivery. The Company records these revenues net when the distribution partner has the obligation to fulfill the services and the associated risk of service delivery.
Distribution partner rebates
Rebates to distribution partners (“Partner Rebates”) are accrued for and recognized as a reduction of revenue at the date of the sale to the customer. Partner Rebates include amounts collected directly by the Company owed to distribution partners in accordance with their distribution partner agreements, being the difference between the price to the end customer and the distribution partners’ price. Other sales discounts, including early pay promotions, are deducted immediately from sales invoices.
Contract balances
Timing of revenue recognition may differ from the timing of invoicing to customers. The Company records an unbilled receivable when revenue is recognized prior to invoicing. As the Company’s contracts are less than one year in duration, the Company has elected to apply the practical expedients to expense costs related to costs to obtain contracts and not disclose unfulfilled performance obligations. As deferred revenue and customer deposits are typically recognized during the year the Company does not account for financing elements.
Warranties
The Company provides a warranty on all products sold to its clients and distribution partner’s clients. Warranties are not sold separately to customers. Provisions for the expected cost of warranty obligations are recognized based on an analysis of historical costs for warranty claims relative to current activity levels and adjusted for factors based on management’s assessment that increase or decrease the provision. Warranty provision is recognized in cost of goods sold. Warranty claims have historically not been material and do not constitute a separate performance obligation.
Stock-based compensation
The Company follows the fair value-based approach to account for stock options. Compensation expense and an increase in “Additional paid-in capital” are recognized for stock options over their vesting period based on their estimated fair values on the grant date, as determined using the Black-Scholes option pricing model for the majority of stock-options. Certain executive stock options have performance conditions and are valued using a Monte Carlo model.
Any consideration paid by employees on exercise of stock options is credited to “Share capital” when the option is exercised, and the recorded fair value of the option is removed from “Additional paid-in capital” and credited to “Share capital”. The Company’s stock options have no rights to vote, receive dividends, or any other rights as a shareholder of the Company.
66
Table of Contents
During 2018 and 2019, the Company provided a cash settlement alternative for certain stock options. The fair value on grants attributable to those awards was reclassified on the balance sheet from shareholders’ equity to other liabilities, and at period end the liability is adjusted to fair value and the excess of fair value over previously recognized stock-based compensation is expensed. The fair value of the awards at the date of modification was greater than the grant date fair value of the previously vested equity awards, therefore the additional fair value was treated as an expense at the date of modification. Increases or decreases in fair value subsequent to the modification date will be recorded in earnings except that the Company shall not recognize a cumulative expense lower than the grant date fair value of the original equity awards. On October 9, 2019, following its listing on The Nasdaq Global Select Market, the Company ceased cash-settlement of stock options and the associated liability accounting for stock options and returned to equity settlement accounting for stock options, as described above.
Stock based compensation expense is also recognized for performance share units (“PSUs”) and deferred share units (“DSUs”) using the fair value method. Compensation expense is recognized over the vesting period and the corresponding amount is recorded as a liability on the balance sheet.
Technology and development expenditures
Technology and development expenses are comprised primarily of salaries and benefits associated with the Company’s product and software development personnel which do not qualify for capitalization. These costs are expensed as incurred and exclude certain information and technology costs used in operations which are classified as general and administrative costs.
Earnings per share (“EPS”)
Basic earnings per share is calculated using the weighted average number of common shares outstanding during the year. Diluted earnings per share is calculated using the treasury stock method for determining the dilutive impact of stock options.
Fair value of financial instruments
ASC 820, “Fair Value Measurements,” requires entities to disclose the fair value of financial instruments, both assets and liabilities recognized and not recognized on the balance sheet, for which it is practicable to estimate fair value. Fair value is defined as the exchange price that would be received for an asset or paid to transfer a liability (an exit price) in the principal or most advantageous market for the asset or liability in an orderly transaction between market participants on the measurement date.
The Company’s fair value analysis is based on the degree to which the fair value is observable and grouped into categories accordingly:
| • | Level 1 financial instruments are those which can be derived from quoted market prices (unadjusted) in active markets for similar financial assets or liabilities. |
| • | Level 2 financial instruments are those which can be derived from inputs that are observable for the asset or liability, either directly (i.e., as prices) or indirectly (i.e., derived from prices). Level 2 financial instruments include current and long-term debt. The carrying amounts of these instruments approximates fair value due to their respective floating interest rates and limited change in the Company’s credit rating since issuance. |
| • | Level 3 financial instruments are those derived from valuation techniques that include inputs for the financial asset or liability which are not based on observable market data (unobservable inputs). The Company does not have any Level 3 financial instruments. |
The carrying amounts of cash and cash equivalents; trade and other receivables; trade accounts payable and other liabilities; and customer deposits approximate fair value due to their short-term nature.
67
Table of Contents
3. ADOPTION OF NEW AND REVISED ACCOUNTING STANDARDS
ASU 2016-02
The Company adopted ASU No. 2016-02, “Leases (Topic 842)” on January 1, 2019 (see Note 5), and elected the modified retrospective method of adoption, which allowed the Company to apply the standard as of the beginning of the period of adoption, the comparative period presented is not adjusted and continues to be reported in accordance with the Company’s historical accounting policy. The Company opted to elect the package of practical expedients to not reassess prior conclusions related to contracts containing leases, lease classification and initial direct costs, and certain other practical expedients, including the use of hindsight to determine the lease term for existing leases and in assessing impairment of the right-of-use asset, and the exception for short-term leases.
This new guidance requires lessees to recognize a liability to make lease payments and a right-of-use asset representing its right to use the underlying asset for the lease term, with limited exceptions. The accounting applied by a lessor is largely unchanged from that applied under existing U.S. GAAP.
In August 2018, the FASB issued ASU 2018-15, “Customer’s Accounting for Implementation Costs Incurred in a Cloud Computing Arrangement that is a Service Contract,” which amends ASC 350-40 Intangibles – Goodwill and Other – Internal-Use Software. The ASU requires implementation costs incurred by customers in cloud computing arrangements to be deferred and recognized over the term of the arrangement, if these costs were capitalized by the customer in a software licensing arrangement. This guidance is effective for fiscal years beginning after December 15, 2019. The Company does not believe adoption will have a material impact on its financial condition or results of operations.
In June 2016, the FASB issued ASU2016-13, “Financial Instruments – Credit Losses (Topic 326): Measurement of Credit Losses in Financial Instruments,” and issued subsequent amendments to the initial guidance in April 2019 within ASU No. 2019-04, and May 2019 within ASU No. 2019-05. The ASU amends the guidance on the impairment of financial instruments and adds an impairment model, known as the current expected credit loss (CECL) model. The CECL model requires an entity to recognize its current estimate of all expected credit losses, rather than incurred losses, and applies to trade receivables and other receivables. The CECL model is designed to capture expected credit losses through the establishment of an allowance account, which will be presented as an offset to the amortized cost basis of the related financial asset. The new guidance is effective for fiscal years beginning after December 15, 2019, including interim periods within those fiscal years, and is applied using the modified-retrospective approach. The Company will adopt the guidance on January 1, 2020. The Company does not believe adoption will have a material impact on its financial condition or results of operations.
Although there are several other new accounting standards issued or proposed by the FASB, which the Company has adopted or will adopt, as applicable, the Company does not believe any of these accounting pronouncements has had or will have a material impact on its Financial Statements.
4. IMPAIRMENT
| For the year ended December 31, | ||||||||||||
| 2019 | 2018 | 2017 | ||||||||||
| DIRTT Timber |
— | 6,098 | — | |||||||||
| Leasehold and other assets |
— | 2,582 | — | |||||||||
|
|
|
|
|
|
|
|||||||
| — | 8,680 | — | ||||||||||
|
|
|
|
|
|
|
|||||||
68
Table of Contents
DIRTT Timber
During 2018, management decided to shift from the early stage development of its DIRTT Timber market to a commercialized approach focused on large, standalone timber projects and as a pull-through for other DIRTT solutions. Management concluded that this strategy required significantly less timber capacity than currently exists and therefore took steps to right-size its timber capacity by the end of 2018. Management determined these decisions to be an indicator of impairment of the assets of the DIRTT Timber solution line. In determining if impairment exists, the Company estimated the undiscounted cash flows to be generated from the use and ultimate disposition of the asset group and determined the undiscounted cash flows were less than the carrying value of the assets.
To determine the impairment of the DIRTT Timber assets, the net book value of the assets was evaluated against the fair value of the assets. The fair value of the DIRTT Timber assets reflects current projected sales for timber projects on a standalone basis and the pull-through impact to other DIRTT solutions. In its evaluation, management determined it was unable to reliably quantify the pull-through impact of timber on other DIRTT solutions. The equipment related to the timber market was custom built for DIRTT and there is no active market for resale. Therefore, the fair value was determined to be management’s estimate of scrap value for the specialized assets and an estimated resale value for less specialized assets that cannot be redeployed for DIRTT’s other solutions. Management estimated the expected resale values based on the current market and on experience of management in the industry. The fair value of the DIRTT Timber assets was estimated to be $1.1 million. This assessment resulted in an impairment charge of $6.1 million during 2018.
Leasehold and other assets
At December 31, 2018, the Company recognized a lease exit liability of $0.6 million related to certain contracts (December 31, 2017 – nil). During 2018, management reviewed its facilities used in operations and the corresponding leases in place. The outcome of this review was the consolidation of the Company’s production in Kelowna, British Columbia, into other plants, and discontinued use of other locations that were not considered necessary in the Company’s current operations.
These leases were considered impaired as the costs of meeting lease obligations exceeded the economic benefits expected to be received. The lease exit liability represents the present value of the difference between the minimum future lease payments the Company is obligated to make under the non-cancellable operating lease contract and any estimated sublease recoveries. This estimate may vary as a result of changes in estimated sublease recoveries. The liability is estimated to be settled in periods up to and including the year 2023. The provision is net of $1.0 million of estimated recoveries from subleases.
In relation to the review noted in the paragraph above, certain assets were identified as no longer having future value to the Company. These assets related to leasehold improvements for locations where activity is being relocated, as well as projects in process that were curtailed. These leasehold and other assets represented assets with a carrying value of $2.0 million at December 31, 2018, of which the entire amount was expensed as there is no future value attributable to these assets or market for resale.
At December 31, 2019, the Company reviewed the above impaired assets and determined that there were no indicators of impairment recovery.
5. LEASES
The Company leases office and factory space under various operating leases. As the Company’s leases do not provide an implicit rate, the Company uses its incremental borrowing rate based on the information available at the commencement date in determining the present value of lease payments. The Company gives consideration to instruments with similar characteristics when calculating its incremental borrowing rate. The Company’s operating leases have remaining lease terms of 1 year to 9 years. Lease terms may include options to extend or terminate the lease when it is reasonably certain that the Company will exercise that option.
69
Table of Contents
For the year ended December 31, 2019, cash paid for amounts included in the measurement of operating lease liabilities was $5.6 million The weighted average remaining lease term and weighted average discount rate at December 31, 2019 were 6 years and 4.8%, respectively.
The following table includes ROU assets included on the balance sheet at December 31, 2019:
| ROU Assets | ||||||||||||
| Cost | Accumulated depreciation |
Net book value |
||||||||||
| At January 1, 2019 |
22,571 | — | 22,571 | |||||||||
| Additions |
1,673 | — | 1,673 | |||||||||
| Depreciation expense |
— | (4,061 | ) | (4,061 | ) | |||||||
| Exchange differences |
534 | (56 | ) | 478 | ||||||||
|
|
|
|
|
|
|
|||||||
| At December 31, 2019 |
24,778 | (4,117 | ) | 20,661 | ||||||||
|
|
|
|
|
|
|
|||||||
The following table includes lease liabilities included on the balance sheet at December 31, 2019:
| At January 1, 2019 |
23,912 | |||
| Additions |
1,673 | |||
| Accretion |
1,092 | |||
| Repayment of lease liabilities |
(5,567 | ) | ||
| Lease cancellation |
(196 | ) | ||
| Exchange differences |
489 | |||
|
|
|
|||
| At December 31, 2019 |
21,403 | |||
|
|
|
|||
| Current lease liabilities |
5,287 | |||
| Long-term lease liabilities |
16,116 | |||
|
|
|
The following table includes maturities of operating lease liabilities at December 31, 2019:
| As at December 31, 2019 |
||||
| 2020 |
5,419 | |||
| 2021 |
5,420 | |||
| 2022 |
4,876 | |||
| 2023 |
3,013 | |||
| 2024 |
1,426 | |||
| Thereafter |
4,469 | |||
|
|
|
|||
| Total |
24,623 | |||
|
|
|
|||
| Total lease liability |
21,403 | |||
|
|
|
|||
| Difference between undiscounted cash flows and lease liability |
3,220 | |||
|
|
|
|||
During 2019, the Company entered into a lease agreement, expected to commence in the second half of 2020, associated with the construction of a new combined tile and millwork facility in Rock Hill, South Carolina. Rent obligations associated with this lease are estimated at $14.4 million using a discount rate of 5.2% ($26.6 million undiscounted).
70
Table of Contents
6. TRADE AND OTHER RECEIVABLES
| As at December 31, |
||||||||
| 2019 | 2018 | |||||||
| Trade receivables |
22,488 | 42,582 | ||||||
| Sales tax receivable |
402 | 482 | ||||||
| Income tax receivable |
2,135 | 892 | ||||||
|
|
|
|
|
|||||
| 25,025 | 43,956 | |||||||
| Allowance for doubtful accounts |
(84 | ) | (83 | ) | ||||
|
|
|
|
|
|||||
| 24,941 | 43,873 | |||||||
|
|
|
|
|
|||||
Prior to October 1, 2019, the Company had a contract with a trade credit insurance provider, whereby a portion of its trade receivables were insured (December 31, 2018 – 70%). The trade credit insurance provider determined the coverage amount, if any, on a customer-by-customer basis. Subsequent to October 1, 2019, DIRTT performed this function internally. The Company usually collects a 50% progress payment on order placements, excluding government and certain other customers.
The Company provides for balances determined to have risk of collection and had a provision of $0.1 million at both December 31, 2019 and 2018. The Company had no customers with receivables in excess of 10% of the total accounts receivable balance at December 31, 2019 and had one customer over this threshold at December 31, 2018 ($4.8 million).
7. INVENTORY
| As at December 31, |
||||||||
| 2019 | 2018 | |||||||
| Raw material |
17,339 | 17,212 | ||||||
| Allowance for obsolescence |
(512 | ) | (365 | ) | ||||
| Work in progress |
739 | 1,803 | ||||||
|
|
|
|
|
|||||
| 17,566 | 18,650 | |||||||
|
|
|
|
|
|||||
During 2019, the Company experienced periods where it was operating below normal capacity levels. During those periods, overheads included in inventory were not increased and $2.2 million was recognized directly and separately in cost of sales. Production overheads capitalized in work in progress were $0.1 million at December 31, 2019 (December 31, 2018: $0.2 million). In 2019, the Company wrote-off $0.4 million of inventory that was determined to be obsolete and the associated expense was recorded to cost of goods sold.
71
Table of Contents
8. PROPERTY, PLANT AND EQUIPMENT, NET
| Office and computer equipment |
Factory equipment |
Leasehold improvements |
Total | |||||||||||||
| Cost |
||||||||||||||||
| At December 31, 2017 |
19,556 | 43,248 | 36,182 | 98,986 | ||||||||||||
| Additions |
2,008 | 4,140 | 2,486 | 8,634 | ||||||||||||
| Disposals |
(45 | ) | — | (174 | ) | (219 | ) | |||||||||
| Exchange differences |
(975 | ) | (2,966 | ) | (2,521 | ) | (6,462 | ) | ||||||||
|
|
|
|
|
|
|
|
|
|||||||||
| At December 31, 2018 |
20,544 | 44,422 | 35,973 | 100,939 | ||||||||||||
|
|
|
|
|
|
|
|
|
|||||||||
| Additions |
1,630 | 8,757 | 2,315 | 12,702 | ||||||||||||
| Disposals |
— | (396 | ) | (298 | ) | (694 | ) | |||||||||
| Exchange differences |
569 | 1,857 | 1,241 | 3,667 | ||||||||||||
|
|
|
|
|
|
|
|
|
|||||||||
| At December 31, 2019 |
22,743 | 54,640 | 39,231 | 116,614 | ||||||||||||
|
|
|
|
|
|
|
|
|
|||||||||
| Accumulated depreciation and impairment |
||||||||||||||||
| At December 31, 2017 |
10,641 | 20,810 | 19,022 | 50,473 | ||||||||||||
| Depreciation expense |
1,795 | 4,032 | 3,909 | 9,736 | ||||||||||||
| Disposals |
(32 | ) | — | (59 | ) | (91 | ) | |||||||||
| Impairments |
— | 5,890 | 2,233 | 8,123 | ||||||||||||
| Exchange differences |
(656 | ) | (1,798 | ) | (1,576 | ) | (4,030 | ) | ||||||||
|
|
|
|
|
|
|
|
|
|||||||||
| At December 31, 2018 |
11,748 | 28,934 | 23,529 | 64,211 | ||||||||||||
|
|
|
|
|
|
|
|
|
|||||||||
| Depreciation expense |
1,643 | 2,297 | 4,929 | 8,869 | ||||||||||||
| Disposals |
— | (293 | ) | (293 | ) | (586 | ) | |||||||||
| Exchange differences |
521 | 1,336 | 898 | 2,755 | ||||||||||||
|
|
|
|
|
|
|
|
|
|||||||||
| At December 31, 2019 |
13,912 | 32,274 | 29,063 | 75,249 | ||||||||||||
|
|
|
|
|
|
|
|
|
|||||||||
| Net book value |
||||||||||||||||
| At December 31, 2018 |
8,796 | 15,488 | 12,444 | 36,728 | ||||||||||||
| At December 31, 2019 |
8,831 | 22,366 | 10,168 | 41,365 | ||||||||||||
|
|
|
|
|
|
|
|
|
|||||||||
As at December 31, 2019, the Company had $8.5 million of assets in progress of completion which were excluded from assets subject to depreciation (December 31, 2018 – $0.9 million).
9. CAPITALIZED SOFTWARE, NET
| For the year ended December 31, |
||||||||
| 2019 | 2018 | |||||||
| Cost |
||||||||
| As at January 1 |
28,831 | 27,195 | ||||||
| Additions |
2,604 | 5,234 | ||||||
| Recovery of software development expenditures |
(511 | ) | (178 | ) | ||||
| Exchange differences |
1,495 | (3,420 | ) | |||||
|
|
|
|
|
|||||
| As at December 31 |
32,419 | 28,831 | ||||||
|
|
|
|
|
|||||
| Accumulated amortization |
||||||||
| As at January 1 |
20,496 | 18,873 | ||||||
| Amortization expense |
2,637 | 3,306 | ||||||
| Exchange differences |
1,073 | (1,683 | ) | |||||
|
|
|
|
|
|||||
| As at December 31 |
24,206 | 20,496 | ||||||
|
|
|
|
|
|||||
| Net book value |
8,213 | 8,335 | ||||||
|
|
|
|
|
|||||
72
Table of Contents
Estimated amortization expense on capitalized software is $2.8 million in 2020, $2.3 million in 2021, $1.6 million in 2022, $0.7 million in 2023, and $0.2 million in 2024.
10. GOODWILL
| 2019 | 2018 | |||||||
| As at January 1 |
1,353 | 1,471 | ||||||
| Exchange differences |
68 | (118 | ) | |||||
|
|
|
|
|
|||||
| As at December 31 |
1,421 | 1,353 | ||||||
|
|
|
|
|
|||||
The Company’s goodwill is assessed at the consolidated company level which represents the Company’s sole operating and reporting segment. The Company tests its goodwill for impairment annually during the fourth quarter of the calendar year. For 2019, and 2018, the Company used the quantitative approach to perform its annual goodwill impairment test. The Company’s fair value exceeded the carrying value of its net assets and, accordingly, goodwill was not impaired.
11. ACCOUNTS PAYABLE AND ACCRUED LIABILITIES AND OTHER LIABILITIES
| As at December 31, |
||||||||
| 2019 | 2018 | |||||||
| Trade accounts payable |
7,620 | 10,272 | ||||||
| Accrued liabilities |
8,193 | 8,714 | ||||||
| Wages and commissions payable |
3,546 | 5,544 | ||||||
| Rebates accrued(1) |
1,025 | 6,305 | ||||||
| Taxes payable |
— | 448 | ||||||
|
|
|
|
|
|||||
| 20,384 | 31,283 | |||||||
|
|
|
|
|
|||||
| (1) | In 2019, $14.2 million of rebates were earned and $19.3 million were paid, in 2018 $13.7 million of rebates were earned and $9.2 million were paid. |
Other liabilities
| As at December 31, |
||||||||
| 2019 | 2018 | |||||||
| Legal provisions(1) |
745 | 1,995 | ||||||
| Stock option liability |
— | 1,649 | ||||||
| Deferred share unit liability |
434 | 116 | ||||||
| Warranty and other provision |
4,008 | 1,493 | ||||||
| Lease exit liability |
— | 820 | ||||||
| Lease inducements |
— | 750 | ||||||
|
|
|
|
|
|||||
| 5,187 | 6,823 | |||||||
|
|
|
|
|
|||||
| (1) | The Company has provided $0.7 million as the estimated amounts likely payable for various claims against the Company. The amount provided for is management’s best estimate of the potential payments for amounts claimed. |
73
Table of Contents
12. LONG-TERM DEBT
In July 2019, the Company entered into a C$50.0 million senior secured revolving credit facility with the Royal Bank of Canada (the “RBC Facility”). The RBC Facility has a three-year term and can be extended for up to two additional years at the Company’s option. Interest is calculated at the Canadian or U.S. prime rate with no adjustment, or the bankers’ acceptance rate plus 125 basis points. The RBC Facility is subject to a minimum fixed charge coverage ratio of 1.15:1 and a maximum debt to earnings before interest, tax, depreciation and amortization, non-cash stock-based compensation, plus or minus extraordinary or unusual non-recurring revenue or expenses (“Adjusted EBITDA”) ratio of 3.0 to 1. As at December 31, 2019, the RBC Facility was undrawn and the Company was in compliance with all covenants of the facility.
The Company had an $18.0 million revolving operating facility which expired on June 30, 2019. Advances of $5.6 million under the revolving operating facility were subject to interest at the lender’s prime rate minus 0.25% for Canadian dollar advances and the U.S. prime rate minus 0.25% for U.S. dollar advances and are repayable at any time. As at December 31, 2018, the Company was in compliance with all of its lender’s covenants. During the first quarter of 2019, the Company repaid the outstanding principal and interest amounts of its long-term debt, totaling $5.6 million.
13. INCOME TAXES
Reconciliation of income taxes
The following reconciles income taxes calculated at the Canadian statutory rate with the actual income tax expense. The Canadian statutory rate includes federal and provincial income taxes. This rate was used as Canada is the domicile of the parent entity of the Company.
| For the year ended December 31, | ||||||||||||
| 2019 | 2018 | 2017 | ||||||||||
| Net income (loss) before tax |
(3,377 | ) | 8,830 | (7,267 | ) | |||||||
| Canadian statutory rate |
26.5 | % | 27.0 | % | 27.0 | % | ||||||
|
|
|
|
|
|
|
|||||||
| Expected income tax |
(895 | ) | 2,384 | (1,962 | ) | |||||||
| Effect on taxes resulting from: |
||||||||||||
| Non-deductible expenses |
550 | 447 | 264 | |||||||||
| Non-deductible stock-based compensation |
674 | 1,080 | 689 | |||||||||
| Tax rate impacts |
999 | (420 | ) | 487 | ||||||||
| U.S. Federal rate reduction from 35% to 21% |
— | — | 722 | |||||||||
| Adjustments related to prior year tax filings |
(205 | ) | (257 | ) | 212 | |||||||
| Other |
(104 | ) | 46 | 46 | ||||||||
|
|
|
|
|
|
|
|||||||
| Income tax expense |
1,019 | 3,280 | 458 | |||||||||
|
|
|
|
|
|
|
|||||||
| Current tax expense |
1,064 | 2,178 | 3,277 | |||||||||
| Deferred tax expense (recovery) |
(45 | ) | 1,102 | (2,819 | ) | |||||||
|
|
|
|
|
|
|
|||||||
| Income tax expense |
1,019 | 3,280 | 458 | |||||||||
|
|
|
|
|
|
|
|||||||
74
Table of Contents
Deferred tax assets and liabilities
Significant components of the Company’s deferred tax assets and liabilities at December 31, 2019 and 2018 were as follows:
| At December 31, 2019 | ||||||||||||
| Assets | Liabilities | Net | ||||||||||
| Operating losses |
6,899 | — | 6,899 | |||||||||
| Research and development expenditures |
353 | — | 353 | |||||||||
| Property and equipment |
— | (1,916 | ) | (1,916 | ) | |||||||
| Capitalized software and other assets |
— | (2,345 | ) | (2,345 | ) | |||||||
| Other |
2,373 | — | 2,373 | |||||||||
|
|
|
|
|
|
|
|||||||
| Net deferred taxes |
9,625 | (4,261 | ) | 5,364 | ||||||||
|
|
|
|
|
|
|
|||||||
| At December 31, 2018 | ||||||||||||
| Assets | Liabilities | Net | ||||||||||
| Operating losses |
8,213 | — | 8,213 | |||||||||
| Research and development expenditures |
389 | — | 389 | |||||||||
| Property and equipment |
— | (2,408 | ) | (2,408 | ) | |||||||
| Capitalized software and other assets |
— | (2,283 | ) | (2,283 | ) | |||||||
| Other |
1,725 | (518 | ) | 1,207 | ||||||||
|
|
|
|
|
|
|
|||||||
| Net deferred taxes |
10,327 | (5,209 | ) | 5,118 | ||||||||
|
|
|
|
|
|
|
|||||||
Summary of temporary difference movements during the year:
| Balance January 1, 2019 |
Recognized in Income |
Foreign Exchange |
Balance December 31, 2019 |
|||||||||||||
| Operating losses |
8,213 | (1,772 | ) | 458 | 6,899 | |||||||||||
| Research and development |
389 | (59 | ) | 23 | 353 | |||||||||||
| Property and equipment |
(2,408 | ) | 652 | (160 | ) | (1,916 | ) | |||||||||
| Intangible assets |
(2,283 | ) | 425 | (487 | ) | (2,345 | ) | |||||||||
| Other |
1,207 | 799 | 367 | 2,373 | ||||||||||||
|
|
|
|
|
|
|
|
|
|||||||||
| Net deferred taxes |
5,118 | 45 | 201 | 5,364 | ||||||||||||
|
|
|
|
|
|
|
|
|
|||||||||
| Balance January 1, 2018 |
Recognized in Income |
Foreign Exchange |
Balance December 31, 2018 |
|||||||||||||
| Operating losses |
9,968 | (1,015 | ) | (740 | ) | 8,213 | ||||||||||
| Research and development |
423 | — | (34 | ) | 389 | |||||||||||
| Property and equipment |
(2,397 | ) | (273 | ) | 262 | (2,408 | ) | |||||||||
| Intangible assets |
(2,301 | ) | (178 | ) | 196 | (2,283 | ) | |||||||||
| Other |
904 | 364 | (61 | ) | 1,207 | |||||||||||
|
|
|
|
|
|
|
|
|
|||||||||
| Net deferred taxes |
6,597 | (1,102 | ) | (377 | ) | 5,118 | ||||||||||
|
|
|
|
|
|
|
|
|
|||||||||
The general provincial tax rate in Alberta, Canada was decreased on June 28, 2019 to 11 percent for the second half of 2019, 10 percent for 2020, 9 percent for 2021 and 8 percent thereafter. As a result of the enacted rate change, DIRTT reduced its deferred tax asset by $0.9 million with a corresponding deferred income tax expense recorded in the second quarter of 2019.
75
Table of Contents
The U.S. Tax Cuts and Jobs Act (the “Act”) became law on December 22, 2017. The Act includes significant changes to the U.S. corporate income tax system, including a federal corporate rate reduction from 35 percent to 21 percent beginning in 2018, changes to capital depreciation, limitations on the deductibility of interest expense and executive compensation, and the transition of U.S. international taxation from a worldwide tax system to a territorial tax system. As a result of the Act, the Company remeasured its U.S. deferred tax liability based upon the new statutory federal rate of 21 percent.
The amount shown on the balance sheet as deferred income tax assets and liabilities represent the net differences between the tax basis and book carrying values on the Company’s balance sheet at enacted tax rates.
On an annual basis the Company and its subsidiaries file tax returns in Canada and various foreign jurisdictions. In Canada the Company’s federal and provincial tax returns for the years 2016 to 2018 remain subject to examination by taxation authorities. In the United States, both the federal and state tax returns filed for the years 2015 to 2018 remain subject to examination by the taxation authorities.
Tax loss carryforwards and other tax pools
The significant components of the Company’s net future income tax deductions in these consolidated financial statements are summarized as follows:
| For the year ended December 31, | ||||||||||||||||
| 2019 | 2018 | 2019 | 2018 | |||||||||||||
| C$ | C$ | $ | $ | |||||||||||||
| Non-capital loss carry-forwards |
38,084 | 43,616 | — | — | ||||||||||||
| Undepreciated capital costs |
23,274 | 25,211 | 11,992 | 12,748 | ||||||||||||
| Share issuance costs |
— | 519 | — | — | ||||||||||||
| Scientific research and experimental development tax incentives |
1,971 | 1,971 | — | — | ||||||||||||
|
|
|
|
|
|
|
|
|
|||||||||
| Total future tax deductions |
63,329 | 71,317 | 11,992 | 12,748 | ||||||||||||
|
|
|
|
|
|
|
|
|
|||||||||
14. STOCK-BASED COMPENSATION
Stock-based compensation expense
| For the year ended December 31, |
||||||||||||
| 2019 | 2018 | 2017 | ||||||||||
| Stock options |
1,729 | 2,076 | 2,738 | |||||||||
| PSUs |
58 | 44 | — | |||||||||
| DSUs |
306 | 120 | — | |||||||||
| Charge on stock option modification |
— | 1,181 | — | |||||||||
| Stock option fair value adjustment |
1,783 | 240 | — | |||||||||
|
|
|
|
|
|
|
|||||||
| 3,876 | 3,661 | 2,738 | ||||||||||
|
|
|
|
|
|
|
|||||||
Stock Options
The Company has a stock option plan which was approved by the Board of Directors (the “Board”) and by its shareholders at the annual and special meeting of shareholders held on May 5, 2016, whereby the aggregate number of shares reserved for issuance shall not exceed 10% of the issued and outstanding common shares as at the time of grant of any stock options. Except as noted below, stock options granted under the plan generally have a term of five years and vest one third every year over a three-year period from the date of grant.
76
Table of Contents
In 2018, the Company allowed certain vested share options to be surrendered for cash. On the date of modification, the fair value of the liability of options eligible for cash surrender of $1.2 million was reclassified on the balance sheet from shareholders’ equity to other liabilities and a $0.2 million was expensed to adjust the liability to the fair value at year-end, and an additional $0.5 million was charged back to additional paid-in capital as, for certain stock options, the cumulative expense calculated was lower than the grant date fair value of the original equity awards. During 2018, $1.8 million of stock options were surrendered for cash and at year end the Company had a liability of $1.8 million in other liabilities for the remaining stock options.
In 2019, $1.8 million was expensed to adjust the liability to fair value, and an additional $0.4 million was charged back to paid-in capital as, for certain stock options, the cumulative expense calculated was lower that the grant date fair value of the original equity awards. During the year, $3.6 million of share options were surrendered for cash. On October 9, 2019, following its listing on The Nasdaq Global Select Market, the Company ceased cash-settlement of stock options and the associated liability accounting for stock options.
The following summarizes options granted, exercised, forfeited and expired during the periods:
| Number of options |
Weighted average exercise price C$ |
|||||||
| Outstanding at December 31, 2017 |
5,553,393 | 5.31 | ||||||
| Granted |
3,327,525 | 6.40 | ||||||
| Exercised |
(435,792 | ) | 4.78 | |||||
| Surrendered for cash |
(1,365,348 | ) | 5.17 | |||||
| Forfeited |
(203,516 | ) | 5.26 | |||||
| Expired |
(17,886 | ) | 6.02 | |||||
|
|
|
|
|
|||||
| Outstanding at December 31, 2018 |
6,858,376 | 5.88 | ||||||
| Granted |
1,382,311 | 7.45 | ||||||
| Exercised |
(21,045 | ) | 4.81 | |||||
| Surrendered for cash |
(1,544,151 | ) | 5.02 | |||||
| Forfeited |
(298,508 | ) | 5.02 | |||||
| Expired |
(220,331 | ) | 6.01 | |||||
|
|
|
|
|
|||||
| Outstanding at December 31, 2019 |
6,156,652 | 6.49 | ||||||
| Exercisable at December 31, 2019 |
2,454,910 | 6.05 | ||||||
Included in the 2018 stock option grant above, 1,725,000 stock options were granted to an executive with performance conditions for vesting. For 825,000 share options, vesting is upon an increase in the Company’s share price to C$13.26, and for 900,000 share options, vesting is upon an increase in the Company’s share price to C$19.89. These options were valued using the Monte Carlo valuation method and determined to have a weighted average grant fair value of C$2.14 on original grant. These awards were accounted for at the fair value attributable to the vesting period until October 9, 2019 when these were reclassified to equity accounted and were re-valued at a weighted average fair value of C$0.83.
Range of exercise prices outstanding at December 31, 2019:
| Options outstanding | Options exercisable | |||||||||||||||||||||||
| Range of exercise prices |
Number outstanding |
Weighted average remaining life |
Weighted average exercise price C$ |
Number exercisable |
Weighted average remaining life |
Weighted average exercise price C$ |
||||||||||||||||||
| C$4.01 – C$5.00 |
22,537 | 4.89 | 4.12 | — | ||||||||||||||||||||
| C$5.01 – C$6.00 |
783,889 | 1.80 | 5.76 | 783,889 | 1.80 | 5.76 | ||||||||||||||||||
| C$6.01 – C$7.00 |
4,339,187 | 3.04 | 6.32 | 1,671,021 | 2.00 | 6.19 | ||||||||||||||||||
| C$7.01 – C$8.00 |
1,011,039 | 3.86 | 7.84 | — | ||||||||||||||||||||
|
|
|
|
|
|||||||||||||||||||||
| Total |
6,156,652 | 2,454,910 | ||||||||||||||||||||||
|
|
|
|
|
|||||||||||||||||||||
77
Table of Contents
Range of exercise prices outstanding at December 31, 2018:
| Options outstanding | Options exercisable | |||||||||||||||||||||||
| Range of exercise prices |
Number outstanding |
Weighted average remaining life |
Weighted average exercise price C$ |
Number exercisable |
Weighted average remaining life |
Weighted average exercise price C$ |
||||||||||||||||||
| C$2.01 – C$3.00 |
31,600 | 0.4 | 2.93 | 31,600 | 0.4 | 2.93 | ||||||||||||||||||
| C$3.01 – C$4.00 |
804,883 | 0.5 | 3.59 | 804,883 | 0.5 | 3.59 | ||||||||||||||||||
| C$5.01 – C$6.00 |
1,162,669 | 2.9 | 5.76 | 746,028 | 2.9 | 5.76 | ||||||||||||||||||
| C$6.01 – C$6.47 |
4,859,224 | 3.7 | 6.31 | 1,540,858 | 1.6 | 6.10 | ||||||||||||||||||
|
|
|
|
|
|||||||||||||||||||||
| Total |
6,858,376 | 3,123,369 | ||||||||||||||||||||||
|
|
|
|
|
|||||||||||||||||||||
The stock options granted had a weighted average grant date fair value of C$2.40 (2018 – C$2.13, 2017 – C$2.11) estimated using the Black-Scholes option-pricing model with the following assumptions for December 31, 2019 and 2018: a 3.5 year expected life for all periods, 1.6% risk-free interest rate (2018 – 2.2% and 2017 – 0.8%); a 4.2% expected forfeitures rate (2018- 3.8% and 2017 – 5%); and 39.2% expected volatility (2018 – 42%, 2017 – 45%). These awards were accounted for using the fair value approach as they were accounted for as liabilities until October 9, 2019 when the Company ceased allowing cash surrenders of stock options. On October 9, 2019, the stock options had a weighted average fair value of C$1.32 estimated using the Black-Scholes option pricing model with the following assumptions: a 2.9 year expected life, 1.4% risk-free interest rate; and 39.2% expected volatility.
Performance share units
The Company has a PSU Plan for certain employees of the Company. Under the terms of the PSU Plan, PSUs granted vest at the end of a three-year term. At the end of a three-year term, employees will be awarded cash at the discretion of the Board, calculated based on certain Adjusted EBITDA, total shareholder return, or revenue growth related performance conditions.
The fair value of the liability and the expense attributable to the vesting period is charged to profit or loss at the grant date. Subsequently, at each reporting date between grant date and settlement date, the fair value of the liability is remeasured with any changes in fair value recognized in profit or loss. As at December 31, 2019, there were 223,052 PSUs outstanding (2018 – 85,728) with a fair value of $0.2 million which is included in other long term liabilities on the balance sheet (2018 – $0.1 million).
Deferred share units
During 2018, the Company initiated a DSU plan for its non-employee directors. Under the terms of the DSU plan, DSUs awarded will vest immediately and will be settled with cash in the amount equal to the closing price of the Company’s common shares on the date the director resigns from the Board.
The fair value of the liability and the corresponding expense is charged to profit or loss at the grant date. Subsequently, at each reporting date between grant date and settlement date, the fair value of the liability is remeasured with any changes in fair value recognized in profit or loss for the year. There were 132,597 DSUs outstanding at December 31, 2019 (2018 – 25,861) with a fair value of $0.4 million which is included in other liabilities on the balance sheet (2018 – $0.1 million).
Dilutive instruments
For the year-ended December 31, 2019, 0.5 million options (2018 – 6.3 million, 2017 – 5.6 million), respectively, were excluded from the diluted weighted average number of common shares calculation as their effect would have been anti-dilutive to the net income (loss) per share.
78
Table of Contents
15. REVENUE
In the following table, revenue is disaggregated by performance obligation and timing of revenue recognition. All revenue comes from contracts with customers. See Note 17 for the disaggregation of revenue by geographic region.
| For the year ended December 31, | ||||||||||||
| 2019 | 2018 | 2017 | ||||||||||
| Product |
215,109 | 240,482 | 195,676 | |||||||||
| Transportation |
23,903 | 24,552 | 19,519 | |||||||||
| Licenses |
1,647 | 1,400 | 1,021 | |||||||||
|
|
|
|
|
|
|
|||||||
| Total product revenue |
240,659 | 266,434 | 216,216 | |||||||||
| Installation and other services |
7,076 | 8,247 | 10,323 | |||||||||
|
|
|
|
|
|
|
|||||||
| 247,735 | 274,681 | 226,539 | ||||||||||
|
|
|
|
|
|
|
|||||||
DIRTT sells its products and services pursuant to fixed-price contracts which generally have a term of one year or less. The transaction price used in determining the amount of revenue to recognize is based upon agreed contractual terms with the customer and is not subject to variability.
| For the year ended December 31, | ||||||||||||
| 2019 | 2018 | 2017 | ||||||||||
| At a point in time |
239,012 | 265,034 | 215,195 | |||||||||
| Over time |
8,723 | 9,647 | 11,344 | |||||||||
|
|
|
|
|
|
|
|||||||
| 247,735 | 274,681 | 226,539 | ||||||||||
|
|
|
|
|
|
|
|||||||
Revenue recognized at a point in time represents the majority of the Company’s sales and revenue is recognized when a customer obtains legal title to the product, which is when ownership of products is transferred to, or services are delivered to the contract counterparty. Revenue recognized over time is limited to installation and ongoing maintenance contracts with customers and is recorded as performance obligations are satisfied over the term of the contract.
Contract Liabilities
| For the year ended December 31, |
||||||||
| 2019 | 2018 | |||||||
| Customer deposits |
2,436 | 6,746 | ||||||
| Deferred revenue |
1,131 | 955 | ||||||
|
|
|
|
|
|||||
| Contract liabilities |
3,567 | 7,701 | ||||||
|
|
|
|
|
|||||
Contract liabilities primarily relate to deposits received from customers and maintenance revenue from license subscriptions. The balance of contract liabilities was lower as at December 31, 2019 compared to the prior year period mainly due to lower 2018 fourth quarter orders and revenues. Contract liabilities as at December 31, 2018 and 2017, respectively, totaling $7.4 million and $5.9 million were recognized as revenue during 2019 and 2018, respectively.
79
Table of Contents
Sales by Industry
The Company periodically reviews the growth or product and transportation revenue by industry vertical market to evaluate the success of industry specific sales initiatives. The nature of products sold to the various industries is consistent and therefore review is focused on sales performance.
| For the year ended December 31, | ||||||||||||
| 2019 | 2018 | 2017 | ||||||||||
| Commercial |
158,256 | 163,199 | 142,494 | |||||||||
| Healthcare |
44,197 | 60,748 | 38,455 | |||||||||
| Government |
14,879 | 21,477 | 18,927 | |||||||||
| Education |
21,680 | 19,610 | 15,319 | |||||||||
| Licenses |
1,647 | 1,400 | 1,021 | |||||||||
|
|
|
|
|
|
|
|||||||
| Total product and transportation revenue |
240,659 | 266,434 | 216,216 | |||||||||
| Installation and other services |
7,076 | 8,247 | 10,323 | |||||||||
|
|
|
|
|
|
|
|||||||
| 247,735 | 274,681 | 226,539 | ||||||||||
|
|
|
|
|
|
|
|||||||
16. OPERATING EXPENSES
The Company changed its presentation of 2018 and 2017 operating expenses to separate stock-based compensation from each function to provide financial statement readers with a better understanding of DIRTT’s operations. The following table provides a reconciliation from last year’s financial statement presentation to current year presentation:
| For the year ended December 31, 2018 | Previously stated |
Adjustment | Currently stated |
|||||||||
| Sales and marketing |
40,731 | (104 | ) | 40,627 | ||||||||
| General and administrative |
30,861 | (2,139 | ) | 28,722 | ||||||||
| Operations support |
8,960 | (891 | ) | 8,069 | ||||||||
| Technology and development |
4,703 | (527 | ) | 4,176 | ||||||||
| Stock-based compensation |
— | 3,661 | 3,661 | |||||||||
| Reorganization |
7,380 | — | 7,380 | |||||||||
| Impairments |
8,680 | — | 8,680 | |||||||||
|
|
|
|
|
|
|
|||||||
| 101,315 | — | 101,315 | ||||||||||
|
|
|
|
|
|
|
|||||||
| For the year ended December 31, 2017 | Previously stated |
Adjustment | Currently stated |
|||||||||
| Sales and marketing |
46,355 | (163 | ) | 46,192 | ||||||||
| General and administrative |
29,383 | (1,013 | ) | 28,370 | ||||||||
| Operations support |
8,234 | (1,022 | ) | 7,212 | ||||||||
| Technology and development |
6,875 | (540 | ) | 6,335 | ||||||||
| Stock-based compensation |
— | 2,738 | 2,738 | |||||||||
| Reorganization |
1,143 | — | 1,143 | |||||||||
| Impairments |
— | — | — | |||||||||
|
|
|
|
|
|
|
|||||||
| 91,990 | — | 91,990 | ||||||||||
|
|
|
|
|
|
|
|||||||
17. SEGMENT REPORTING
The Company has one reportable and operating segment and operates in three principal geographic locations, Canada, the United States and International. Currently, the majority of revenue from international projects are included in the U.S. revenue amount as these projects are sold by U.S.-based distribution partners and are delivered to international locations. The Company’s revenue from operations from external customers, based on location of operations, and information about its non-current assets, are detailed below.
80
Table of Contents
Revenue from external customers
| For the year ended December 31, | ||||||||||||
| 2019 | 2018 | 2017 | ||||||||||
| Canada |
34,085 | 41,153 | 35,035 | |||||||||
| U.S. |
213,650 | 232,035 | 190,245 | |||||||||
| International |
— | 1,493 | 1,259 | |||||||||
|
|
|
|
|
|
|
|||||||
| 247,735 | 274,681 | 226,539 | ||||||||||
|
|
|
|
|
|
|
|||||||
Non-current assets, excluding deferred tax assets
| As at December 31, |
||||||||
| 20191 | 20181 | |||||||
| Canada |
47,892 | 36,323 | ||||||
| U.S. |
29,286 | 15,353 | ||||||
|
|
|
|
|
|||||
| 77,178 | 51,676 | |||||||
|
|
|
|
|
|||||
| (1) | Amounts include property, plant and equipment, capitalized software, operating lease right-of-use assets, goodwill and other assets. |
18. TRANSACTIONS AND BALANCES WITH RELATED PARTIES
During the year ended December 31, 2017, the Company reported revenues of $0.9 million from a former director of the Company (2018 and 2019 – nil). The Company had no accounts receivable balance from this former director for the years ended December 31, 2019 and 2018 as the balance was fully repaid during 2018. The sales to the former director during 2017 were based on price lists in force and terms that would be available to all employees. Effective September 10, 2018, this individual ceased to be a director of the Company.
One of the Company’s distribution partners is owned by a former director of the Company. Effective June 26, 2018, this individual ceased to be a director of the Company. Up until June 26, 2018, the Company reported revenue of $2.9 million and rebates paid of $0.1 million from and to the distribution partner. For the year ended December 31, 2017, the Company reported revenue of $5.8 million and rebates of $0.1 million from and to the distribution partner, respectively.
A director of the Company provided advisory and consulting services to the Company of $0.3 million during the year ended December 31, 2018.
19. COMMITMENTS
As at December 31, 2019, the Company had outstanding purchase obligations of approximately $6.8 million related to inventory and property, plant and equipment purchases (December 31, 2018 – $2.7 million). Refer to Note 5 for lease commitments.
20. LEGAL PROCEEDINGS
On May 9, 2019, the Company commenced an action in the Court of Queen’s Bench of Alberta against two former executives, their company, Falkbuilt Ltd. (“Falkbuilt”), and other individuals, on the basis of, among other things, a breach of non-compete and non-solicit obligations. Falkbuilt filed a response and counterclaim alleging, among other things, breach of contractual obligations and defamation, and is seeking damages of approximately C$2.0 million.
81
Table of Contents
On November 5, 2019, Falkbuilt commenced an action against the Company in the Court of Queen’s Bench of Alberta alleging that the Company has misappropriated and misused their alleged proprietary information in furtherance of the Company’s product development. Falkbuilt seeks monetary relief, including, among other things, damages of approximately C$30.0 million, disgorgement of profits, punitive damages, and attorneys’ fees, and an interim, interlocutory and permanent injunction of the Company’s use of the alleged proprietary information. The Company believes the Claim is without merit. The Company intends to defend itself vigorously and to continue to pursue its legal remedies against the former executives.
On December 11, 2019, the Company commenced an action in U.S. District Court of Utah against Falkbuilt, Falk Mountain States, LLC, and two other individuals. This action seeks to restrain the defendants from misappropriating the Company’s confidential information, trade secrets, business intelligence and customer information, and using that information to advance Falkbuilt’s U.S. businesses to the detriment of the Company. Falkbuilt filed a response and counterclaim alleging, among other things, defamation and interference with economic relations, and is seeking damages of approximately $3.0 million. The Company believes the counterclaim is without merit. The Company intends to defend itself vigorously against these counterclaims.
82
Table of Contents
UNAUDITED SUPPLEMENTARY INFORMATION
Summary of Quarterly Results
| Q4 2019 | Q3 2019 | Q2 2019 | Q1 2019 | Q4 2018 | Q3 2018 | Q2 2018 | Q1 2018 | |||||||||||||||||||||||||
| ($ in thousands) | ||||||||||||||||||||||||||||||||
| Revenue |
53,198 | 65,385 | 64,091 | 65,061 | 74,440 | 73,913 | 62,480 | 63,848 | ||||||||||||||||||||||||
| Gross Profit |
13,465 | 24,934 | 24,421 | 23,604 | 27,619 | 30,085 | 23,331 | 25,974 | ||||||||||||||||||||||||
| Gross Profit Margin |
25.3 | % | 38.1 | % | 38.1 | % | 36.3 | % | 37.1 | % | 40.7 | % | 37.3 | % | 40.7 | % | ||||||||||||||||
| Adjusted Gross Profit Margin(3) |
33.4 | % | 41.8 | % | 42.1 | % | 39.6 | % | 40.2 | % | 43.4 | % | 40.6 | % | 43.7 | % | ||||||||||||||||
| Net income (loss)(1)(2) |
(7,544 | ) | 5,802 | 2,611 | (5,265 | ) | 3,143 | (1,433 | ) | 770 | 3,070 | |||||||||||||||||||||
| Net income (loss) per share – basic and diluted(1)(2) |
(0.09 | ) | 0.07 | 0.03 | (0.06 | ) | 0.04 | (0.02 | ) | 0.01 | 0.04 | |||||||||||||||||||||
| Adjusted EBITDA as previously presented(3)(4) |
(3,971 | ) | 8,072 | 5,605 | 6,986 | 12,809 | 13,062 | 6,612 | 10,391 | |||||||||||||||||||||||
| Other Foreign Exchange (Gains) Losses |
562 | (198 | ) | 441 | 730 | (2,643 | ) | 501 | (629 | ) | (989 | ) | ||||||||||||||||||||
| Adjusted EBITDA(3) |
(3,409 | ) | 7,874 | 6,046 | 7,716 | 10,166 | 13,563 | 5,983 | 9,402 | |||||||||||||||||||||||
| Adjusted EBITDA Margin(3) |
(6.4 | %) | 12.0 | % | 9.4 | % | 11.9 | % | 13.7 | % | 18.3 | % | 9.6 | % | 14.7 | % | ||||||||||||||||
| (1) | Q1 2019 net income includes impact of $6.4 million stock-based compensation charge and Q2 2019 includes a $1.7 million stock-based compensation recovery relating primarily to the impact of fair valuing cash settled stock options. |
| (2) | Impairment expenses included in Q3 2018 and Q4 2018 are $6.1 million and $2.6 million, respectively. |
| (3) | See Item 7. “Management’s Discussion and Analysis of Financial Condition and Results of Operations – Non-GAAP Financial Measures.” |
| (4) | Recalculated from prior periods to exclude the impact of foreign currency gains and losses; previously, only foreign currency impacts on debt revaluation were included in the calculation of Adjusted EBITDA. |
83
Table of Contents
| Item 9. | Changes in and Disagreements With Accountants on Accounting and Financial Disclosure. |
None.
| Item 9A. | Controls and Procedures. |
Evaluation of Disclosure Controls and Procedures
Disclosure controls and procedures are controls and other procedures that are designed to ensure that information required to be disclosed in our reports filed or submitted under the Exchange Act is recorded, processed, summarized and reported within the time periods specified in the SEC’s rules and forms. Disclosure controls and procedures include, without limitation, controls and procedures designed to ensure that information required to be disclosed in the Company’s reports filed or submitted under the Exchange Act is accumulated and communicated to management, including our principal executive officer and principal financial officer, as appropriate to allow timely decisions regarding required disclosure.
As required by Rule 13a-15 under the Exchange Act, our principal executive officer and principal financial officer carried out an evaluation of the effectiveness of the design and operation of our disclosure controls and procedures as of December 31, 2019. Based upon their evaluation, our principal executive officer and principal financial officer concluded that our disclosure controls and procedures (as defined in Rules 13a-15(e) and 15d-15(e) under the Exchange Act) were effective.
Management’s Annual Report on Internal Control Over Financial Reporting; Attestation Report of the Registered Public Accounting Firm
This Annual Report does not include a report of management’s assessment regarding internal control over financial reporting or an attestation report of our independent registered public accounting firm due to a transition period established by the rules of the SEC.
Changes in Internal Control Over Financial Reporting
There have been no changes in our internal control over financial reporting (as defined in Rule 13a-15(f) and 15(d)-15(f) under the Exchange Act) during the quarter ended December 31, 2019, that have materially affected, or are reasonably likely to materially affect, our internal control over financial reporting.
| Item 9B. | Other Information. |
None.
84
Table of Contents
PART III
| Item 10. | Directors, Executive Officers and Corporate Governance. |
The information required by this Item is incorporated herein by reference to the information that will be contained in our information circular and proxy statement (“proxy statement”) related to the 2020 Annual and Special Meeting of Shareholders, which we intend to file with the SEC within 120 days of the end of our fiscal year pursuant to General Instruction G(3) of Form 10-K.
| Item 11. | Executive Compensation. |
The information required by this Item is incorporated herein by reference to the information that will be contained in our proxy statement related to the 2020 Annual and Special Meeting of Shareholders, which we intend to file with the SEC within 120 days of the end of our fiscal year pursuant to General Instruction G(3) of Form 10-K.
| Item 12. | Security Ownership of Certain Beneficial Owners and Management and Related Stockholder Matters. |
The information required by this Item is incorporated herein by reference to the information that will be contained in our proxy statement related to the 2020 Annual and Special Meeting of Shareholders, which we intend to file with the SEC within 120 days of the end of our fiscal year pursuant to General Instruction G(3) of Form 10-K.
| Item 13. | Certain Relationships and Related Transactions, and Director Independence. |
The information required by this Item is incorporated herein by reference to the information that will be contained in our proxy statement related to the 2020 Annual and Special Meeting of Shareholders, which we intend to file with the SEC within 120 days of the end of our fiscal year pursuant to General Instruction G(3) of Form 10-K.
| Item 14. | Principal Accounting Fees and Services. |
The information required by this Item is incorporated herein by reference to the information that will be contained in our proxy statement related to the 2020 Annual and Special Meeting of Shareholders, which we intend to file with the SEC within 120 days of the end of our fiscal year pursuant to General Instruction G(3) of Form 10-K.
85
Table of Contents
PART IV
| Item 15. | Exhibits, Financial Statement Schedules. |
| (a) | The following documents are filed as part of the report: |
| (1) | Financial Statements |
Report of Independent Registered Public Accounting Firm
Consolidated Balance Sheet, as at December 31, 2019 and 2018
Consolidated Statements of Operations and Comprehensive Income (Loss) for the Years Ended December 31, 2019, 2018 and 2017
Consolidated Statements of Changes in Shareholders’ Equity for the Years Ended December 31, 2019, 2018 and 2017
Consolidated Statements of Cash Flows for the Years Ended December 31, 2019, 2018 and 2017
Notes to the Consolidated Financial Statements
| (2) | Financial Statement Schedules |
All schedules have been omitted as they are either not required or not applicable or the required information is included in the Consolidated Financial Statements or notes thereto.
| (3) | See Item 15(b) |
(b) Exhibits:
86
Table of Contents
87
Table of Contents
88
Table of Contents
| * | Filed herewith. |
| ** | Furnished herewith. |
| + | Compensatory plan or agreement. |
| # | Specific terms in this exhibit (indicated therein by asterisks) have been omitted because such terms are both not material and would likely cause competitive harm to the Company it publicly disclosed. |
| Item 16. | Form 10-K Summary |
None.
89
Table of Contents
SIGNATURES
Pursuant to the requirements of Section 13 or 15(d) of the Securities Exchange Act of 1934, as amended, the Registrant has duly caused this Report to be signed on its behalf by the undersigned, thereunto duly authorized.
| DIRTT ENVIRONMENTAL SOLUTIONS LTD. | ||||||
| Date: February 25, 2020 | By: | /s/ Kevin O’Meara | ||||
| Name: Kevin O’Meara | ||||||
| Title: Chief Executive Officer | ||||||
Pursuant to the requirements of the Securities Exchange Act of 1934, as amended, this Report has been signed below by the following persons on behalf of the Registrant in the capacities and on the dates indicated.
| Signature |
Title |
Date | ||
| /s/ Kevin O’Meara Kevin O’Meara |
Chief Executive Officer and Director (Principal Executive Officer) |
February 25, 2020 | ||
| /s/ Geoffrey D. Krause Geoffrey D. Krause |
Chief Financial Officer (Principal Financial Officer and Principal Accounting Officer) |
February 25, 2020 | ||
| /s/ Steven Parry Steven Parry |
Director |
February 25, 2020 | ||
| /s/ Wayne Boulais Wayne Boulais |
Director |
February 25, 2020 | ||
| /s/ John (Jack) Elliott John (Jack) Elliott |
Director |
February 25, 2020 | ||
| /s/ Ronald Kaplan Ronald Kaplan |
Director |
February 25, 2020 | ||
| /s/ Denise Karkkainen Denise Karkkainen |
Director |
February 25, 2020 | ||
| /s/ Todd W. Lillibridge Todd W. Lillibridge |
Director |
February 25, 2020 | ||
| /s/ Christine McGinley Christine McGinley |
Director |
February 25, 2020 | ||
90