Attached files
| file | filename |
|---|---|
| EX-32.4 - EX-32.4 - WisdomTree Continuous Commodity Index Master Fund | d878394dex324.htm |
| EX-32.3 - EX-32.3 - WisdomTree Continuous Commodity Index Master Fund | d878394dex323.htm |
| EX-32.2 - EX-32.2 - WisdomTree Continuous Commodity Index Master Fund | d878394dex322.htm |
| EX-32.1 - EX-32.1 - WisdomTree Continuous Commodity Index Master Fund | d878394dex321.htm |
| EX-31.4 - EX-31.4 - WisdomTree Continuous Commodity Index Master Fund | d878394dex314.htm |
| EX-31.3 - EX-31.3 - WisdomTree Continuous Commodity Index Master Fund | d878394dex313.htm |
| EX-31.2 - EX-31.2 - WisdomTree Continuous Commodity Index Master Fund | d878394dex312.htm |
| EX-31.1 - EX-31.1 - WisdomTree Continuous Commodity Index Master Fund | d878394dex311.htm |
| EX-23.1 - EX-23.1 - WisdomTree Continuous Commodity Index Master Fund | d878394dex231.htm |
| EX-4.1 - EX-4.1 - WisdomTree Continuous Commodity Index Master Fund | d878394dex41.htm |
Table of Contents
UNITED STATES
SECURITIES AND EXCHANGE COMMISSION
Washington, D.C. 20549
FORM 10-K
| ☒ | Annual report pursuant to Section 13 or 15(d) of the Securities Exchange Act of 1934 |
For the fiscal year ended December 31, 2019.
| ☐ | Transition report pursuant to Section 13 or 15(d) of the Securities Exchange Act of 1934 |
For the transition period from to
Commission file numbers: 001-33908, 001-33909
WisdomTree Continuous Commodity Index Fund
(Exact name of registrant as specified in its charter)
WisdomTree Continuous Commodity Index Master Fund
(Exact name of Co-registrant as specified in its charter)
| Delaware | 26-0151234 26-0151301 | |
| (State or Other Jurisdiction of Incorporation or Organization) |
(I.R.S. Employer Identification No.) |
| c/o WisdomTree Commodity Services, LLC 245 Park Avenue, 35th Floor New York, New York |
10167 | |
| (Address of Principal Executive Offices) | (Zip Code) | |
(866) 909-9473
(Registrant’s Telephone Number, Including Area Code)
Securities Registered Pursuant to Section 12(b) of the Act:
| Title of each class |
Trading Symbol(s) |
Name of each exchange on which registered | ||
| Shares | GCC | NYSE Arca, Inc. |
Securities registered pursuant to Section 12(g) of the Act: None
Indicate by check mark if the registrant is a well-known seasoned issuer, as defined in Rule 405 of the Securities Act. Yes ☐ No ☒
Indicate by check mark if the registrant is not required to file reports pursuant to Section 13 or Section 15(d) of the Act. Yes ☐ No ☒
Indicate by check mark whether the registrant (1) has filed all reports required to be filed by Section 13 or 15(d) of the Securities and Exchange Act of 1934 during the preceding twelve months (or for such shorter period that the registrant was required to file such reports) and (2) has been subject to such filing requirements for the past 90 days. Yes ☒ No ☐
Indicate by check mark whether the registrant has submitted electronically every Interactive Data File required to be submitted pursuant to Rule 405 of Regulation S-T (§ 232.405 of this chapter) during the preceding 12 months (or for such shorter period that the registrant was required to submit such files). Yes ☒ No ☐
Indicate by check mark whether the registrant is a large accelerated filer, an accelerated filer, a non-accelerated filer, smaller reporting company or an emerging growth company. See definitions of “large accelerated filer,” “accelerated filer,” “smaller reporting company,” and “emerging growth company” in Rule 12b-2 of the Exchange Act.
| Large accelerated filer | ☐ | Accelerated filer | ☒ | |||
| Non-accelerated filer | ☐ | Smaller reporting company | ☐ | |||
| Emerging growth company | ☐ | |||||
If an emerging growth company, indicate by check mark if the registrant has elected not to use the extended transition period for complying with any new or revised financial accounting standards provided pursuant to Section 13(a) of the Exchange Act. Yes ☐ No ☐
Indicate by check mark whether the registrant is a shell company (as defined in Rule 12b-2 of the Act). Yes ☐ No ☒
The aggregate market value of the shares held by non-affiliates was approximately $129,267,500 as of June 28, 2019, the last business day of the registrant’s most recently completed second fiscal quarter. The aggregate market value was computed using the $17.83 closing price per share for such stock on the NYSE Arca, Inc. on such date.
As of February 20, 2020 there were 6,250,000 limited units and 50 general units outstanding.
DOCUMENTS INCORPORATED BY REFERENCE:
None.
THE FINANCIAL STATEMENT SCHEDULES CONTAINED IN PART IV OF THIS FORM 10-K CONSTITUTE THE ANNUAL REPORT WITH RESPECT TO THE REGISTRANT AND CO-REGISTRANT FOR PURPOSES OF THE U.S. COMMODITY FUTURES TRADING COMMISSION RULE 4.22(C) OF THE COMMODITY EXCHANGE ACT (THE “ANNUAL REPORT”).
Table of Contents
WisdomTree Continuous Commodity Index Fund
WisdomTree Continuous Commodity Index Master Fund
Table of Contents
| Item 1. | Business. |
WisdomTree Continuous Commodity Index Fund (the “Fund”) and WisdomTree Continuous Commodity Index Master Fund (the “Master Fund” and together with the Fund, the “Funds”) are commodity pools that were organized as Delaware statutory trusts on October 27, 2006. WisdomTree Commodity Services, LLC serves as the commodity pool operator and managing owner (the “Managing Owner”) of the Funds, and GreenHaven Advisors LLC serves as the commodity trading advisor (the “Sub-Adviser”).
The Fund continuously offers shares representing common units of fractional undivided beneficial interest in and ownership of the Fund (“Shares”).
The Fund invests substantially all of its assets in the Master Fund in a master-feeder structure. The Master Fund is wholly-owned by the Fund and the Managing Owner. The Master Fund and the Fund each follow the same investment objective. The Fund holds no investment assets other than the Master Fund’s common units of beneficial interest (“Master Fund Units”). Upon inception of the Master Fund, the Master Fund issued 50 of its general units to the Managing Owner in exchange for a capital contribution of $1,500. Each Share issued by the Fund correlates to a Master Fund Unit held by the Fund.
The principal executive offices of the Funds and the Managing Owner are located at 245 Park Avenue, 35th Floor, New York, New York 10167, telephone (866) 909-9473. The Managing Owner currently maintains an Internet website at www.wisdomtree.com, through which the Funds’ annual, quarterly and periodic reports filed with or furnished to the Securities and Exchange Commission (the “SEC”) pursuant to Section 13(a) or 15(d) of the Securities Exchange Act of 1934, as amended (“Exchange Act”), are made available free of charge. Additional information regarding the Funds may also be found on the SEC’s EDGAR database at www.sec.gov.
Investment Objective
The Funds’ investment objective is to provide investors with exposure to the daily change in the price of a portfolio of commodities (the “Index Commodities”) comprising the Thomson Reuters Continuous Commodity Index (the “Index”), before Fund expenses. The Index Commodities consist of corn, soybeans, wheat, live cattle, lean hogs, gold, silver, copper, cocoa, coffee, sugar, cotton, soybean oil, platinum, crude oil, NY Harbor ULSD (formerly known as heating oil), and natural gas.
The Fund pursues its investment objective by investing substantially all of its assets in the Master Fund. The Master Fund pursues its investment objective by actively trading exchange traded futures (“Commodity Futures”) on the Index Commodities, with a view to tracking the performance of the Index over time, regardless of whether the Index is rising, falling or flat over any particular period. The Master Fund’s non-discretionary investment strategy is designed to provide investors with a cost-effective and convenient way to invest in an equal-weight portfolio of Commodity Futures.
The Master Fund’s portfolio (the “Portfolio”) also includes cash, U.S. Treasury obligations and other high credit-quality, short-term fixed income securities (collectively, “U.S. Treasuries”) for deposit with the Fund’s commodity broker as margin or otherwise held to cover the Master Fund’s notional exposure to Commodity Futures.
An investment in the Shares is:
| • | Easily Accessible and Relatively Cost Efficient. As the Shares are listed on the NYSE Arca, investors can indirectly invest in a portfolio comprised of the Index Commodities through a traditional brokerage account. Investors are able to more effectively implement strategic and tactical asset allocation strategies that are affected by changes in the performance of the Index by investing in the Shares as compared to other means of investing in the underlying Index Commodities. |
1
Table of Contents
| • | Exchange-traded and Transparent. The Shares trade on the NYSE Arca, providing investors with an efficient means to implement various investment strategies. Furthermore, the Managing Owner will attempt to cause the composition of the Portfolio to be posted at www.wisdomtree.com daily, providing investors with a clear and timely picture of the Funds’ holdings. |
| • | Competitively Priced. The Managing Owner’s fee and certain other expenses paid by the Funds represent costs to an investor in the Shares. An investor’s decision to purchase Shares may be influenced by such fees and expenses relative to the costs associated with investing in the Index Commodities by other means. |
There can be no assurance that the Funds will achieve their investment objective or avoid substantial losses. The value of the Shares is expected to fluctuate generally in relation to changes in the value of the Master Fund Units.
The Index
Thomson Reuters (Markets) LLC, formerly Thomson Reuters America LLC (the “Index Sponsor”), is the owner, publisher and calculation agent of the Index (sometimes referred to as the “Continuous Commodity Total Return Index” or “Equal Weight Continuous Commodity Total Return Index”) (for purposes of this section, also referred to as the “CCI-TR”). The Index Sponsor is not an affiliate of the Funds or the Managing Owner.
The CCI-TR is an equal weighted index of 17 commodities. It is a “total return” version of the Thomson Reuters Continuous Commodity Index (the “CCI”) because it includes a “roll yield” and adds the yield of 3-month U.S. Treasury bills to the return. Due to its equal weighting, the CCI-TR offers significant exposure to grains, livestock and soft commodities, and a lower energy weighting than many of its peers.
The CCI is an iteration of the original Commodity Research Bureau Index, which is currently known as the Thomson Reuters/CoreCommodity CRB Index (the “CRB Index”). The original CRB Index was widely viewed as a broad measure of overall commodity price trends because of the diverse nature of its constituent commodities. In 2005, the CRB Index was revised for a ninth time, and that ninth version was named the Continuous Commodity Index. On January 7, 2013, the CCI was revised to include CME Soybean oil and remove ICE Frozen Concentrated Orange Juice at an equivalent allocation.
The base year for the CCI-TR is 1982, with a starting value of 100. The base year of the CCI is 1967 with a starting value of 100. The CCI and CCI-TR are materially different from the CRB Index.
Each of the CCI and the CCI-TR reflects the price movement of 17 exchange-traded Commodity Futures: corn, soybeans, wheat, live cattle, lean hogs, gold, silver, copper, cocoa, coffee, sugar, cotton, soybean oil, platinum, crude oil, NY Harbor ULSD (formerly known as heating oil) and natural gas.
The CCI-TR aims to represent the return that an investor should expect to receive if such investor were to attempt to replicate the CCI (by buying the applicable Commodity Futures and collateralizing the investment with U.S. Treasuries). The CCI-TR takes into account the economics of rolling listed Commodity Futures forward to avoid delivery and maintain exposure in liquid contracts. The CCI-TR is notionally composed of Commodity Futures on the physical Index Commodities. Unlike equities, which typically entitle the holder to a continuing stake in a corporation, Commodity Futures normally specify a certain date for the delivery of the underlying physical commodity. To avoid the delivery process and maintain a long futures position, contracts nearing a delivery date must be sold and contracts that have not yet reached delivery must be purchased. This process is known as “rolling” a futures position. An index, such as the CCI-TR, is commonly known as a “rolling index” because it replaces futures contracts as they approach maturity by notionally selling and purchasing offsetting contracts to avoid delivery and maintain exposure in liquid contracts.
2
Table of Contents
Index Methodology
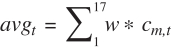
The individual commodity contributions are calculated as follows:
| 1. | Arithmetic averages for each commodity on the relevant business day are calculated. |
where,
| Cm,t | stands for the sum across the included contracts for each of the 17 commodities, so |
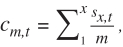
| S | stands for the price of a given contract month. |
[For example: Corn sum (as of 1/7/17) = (3/17 price + 5/17 price + 7/17 price) / 3]
| avgt | stands for the daily average of settlement prices |
| w | is the equal weight of 5.88% (1/17th) for each constituent commodity |
| m | stands for each commodity |
| t | stands for each trading day for which updated settlement prices are available |
| 2. | Today’s value of the average for the 17 components is then used with yesterday’s value to derive the applicable fair value index (“CRBCC”): |
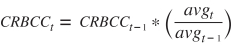
The CRBCC defines the actively considered set of futures contracts for each commodity as defined further in the 6 roll schedules listed in the appendix.
| 3. | Total Return: |
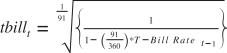
Note: that for example after a weekend, 3 days of returns are due to be added to the Index.
Contract Roll
The roll periods take place during the week leading up to the second Friday of the same six months (Jan, Feb, Apr, June, Aug, and Nov) every year. The roll implies a change from the pre-roll basket of contracts to the post-roll basket according to the following pattern:
| • | At the close of the 1st roll day (a Monday): 20% post-roll basket + 80% pre-roll basket |
| • | Intraday of the 2nd roll day (a Tuesday): 20% post-roll basket + 80% pre-roll basket |
| • | At the close of the 2nd roll day: 40% post-roll basket + 60% pre-roll basket |
3
Table of Contents
| • | Intraday of the 3rd roll day (a Wednesday): 40% post-roll basket + 60% pre-roll basket |
| • | At the close of the 3rd roll day: 60% post-roll basket + 40% pre-roll basket |
| • | Intraday of the 4th roll day (a Thursday): 60% post-roll basket + 40% pre-roll basket |
| • | At the close of the 4th roll day: 80% post-roll basket + 20% pre-roll basket |
| • | Intraday of the 5th roll day (a Friday): 80% post-roll basket + 20% pre-roll basket |
| • | At the close of the 5th roll day: 100% post-roll basket |
Good Friday can fall on the second Friday in April (e.g., 2017). In this case, the open on the following Monday shows the final 40% of the roll rather than the final 20%. If no trading takes place during the roll for other reasons, reallocation between contracts without a price change is implemented for such days.
Real-Time Pricing Considerations
The Index is calculated: 5:00 a.m. – 6:00 p.m. ET (internal), 8:00 a.m. – 8:22 p.m. ET (NYSE Arca).
The Index settles on a final value at around 3:15 p.m. ET. Index outputs start at 5 a.m. ET carrying the previous day close and then the Index will start fluctuating at 8:00 a.m. ET when the underlying contracts begin trading.
Constituent Contracts
| Contract |
Name |
Exchange |
Included contract months | |||
| CL |
Crude Oil | NYMEX | All 12 calendar months | |||
| HO |
Heating Oil | NYMEX | All 12 calendar months | |||
| NG |
Natural Gas | NYMEX | All 12 calendar months | |||
| C |
Corn | CBOT | Mar, May, Jul, Sep, Dec | |||
| S |
Soybeans | CBOT | Jan, Mar, May, Jul, Aug, Nov | |||
| LC |
Live Cattle | CME | Feb, Apr, Jun, Aug, Oct, Dec | |||
| GC |
Gold | COMEX | Feb, Apr, Jun, Aug, Dec | |||
| HG |
Copper | COMEX | Mar, May, Jul, Sep, Dec | |||
| SB |
Sugar | ICE US | Mar, May, July, Oct | |||
| CT |
Cotton | ICE US | Mar, May, July, Dec | |||
| CC |
Cocoa | ICE US | Mar, May, July, Sep, Dec | |||
| KC |
Coffee | ICE US | Mar, May, July, Sep, Dec | |||
| W |
Wheat | CBOT | Mar, May, Jul, Sep, Dec | |||
| LH |
Lean Hogs | CME | Feb, Apr, Jun, Jul, Aug, Oct, Dec | |||
| SI |
Silver | COMEX | Mar, May, Jul, Sep, Dec | |||
| BO |
Soybean Oil | CBOT | Jan, Mar, May, Jul, Aug, Sep, Oct, Dec | |||
| PL |
Platinum | COMEX | Jan, Apr, Jul, Oct |
4
Table of Contents
CCI Total Return Historical Prices (Monthly)
Tabular Performance
| 1982 | 1983 | 1984 | 1985 | 1986 | 1987 | 1988 | 1989 | 1990 | 1991 | |||||||||||||||||||||||||||||||
| January |
101.34 | 103.24 | 110.00 | 103.27 | 102.07 | 107.23 | 124.46 | 141.62 | 155.48 | 151.18 | ||||||||||||||||||||||||||||||
| February |
97.88 | 98.56 | 111.46 | 99.17 | 98.26 | 106.00 | 121.18 | 144.01 | 158.05 | 153.90 | ||||||||||||||||||||||||||||||
| March |
95.25 | 102.16 | 116.15 | 103.90 | 97.97 | 107.87 | 127.08 | 145.51 | 159.10 | 154.35 | ||||||||||||||||||||||||||||||
| April |
96.80 | 104.58 | 114.17 | 101.06 | 100.60 | 115.54 | 128.08 | 146.19 | 162.61 | 153.43 | ||||||||||||||||||||||||||||||
| May |
93.93 | 108.48 | 116.20 | 98.95 | 97.33 | 116.74 | 134.02 | 142.61 | 162.60 | 152.96 | ||||||||||||||||||||||||||||||
| June |
92.81 | 107.15 | 112.18 | 96.93 | 96.02 | 116.95 | 138.37 | 146.79 | 158.82 | 149.72 | ||||||||||||||||||||||||||||||
| July |
93.17 | 111.80 | 103.00 | 97.80 | 96.09 | 119.23 | 132.59 | 142.60 | 160.55 | 154.80 | ||||||||||||||||||||||||||||||
| August |
95.18 | 113.31 | 107.59 | 98.97 | 102.70 | 117.97 | 132.63 | 144.06 | 163.58 | 152.99 | ||||||||||||||||||||||||||||||
| September |
93.88 | 110.20 | 105.27 | 100.66 | 103.82 | 118.36 | 128.43 | 144.97 | 168.59 | 156.77 | ||||||||||||||||||||||||||||||
| October |
96.53 | 106.39 | 106.20 | 103.64 | 104.31 | 119.00 | 134.88 | 144.75 | 161.51 | 160.40 | ||||||||||||||||||||||||||||||
| November |
98.58 | 109.27 | 104.62 | 104.85 | 103.81 | 124.75 | 139.34 | 147.55 | 159.48 | 158.33 | ||||||||||||||||||||||||||||||
| December |
98.44 | 111.16 | 101.03 | 106.03 | 104.80 | 124.41 | 144.35 | 150.98 | 158.64 | 152.25 | ||||||||||||||||||||||||||||||
| 1992 | 1993 | 1994 | 1995 | 1996 | 1997 | 1998 | 1999 | 2000 | 2001 | |||||||||||||||||||||||||||||||
| January |
152.62 | 144.22 | 159.78 | 167.63 | 193.04 | 212.80 | 224.10 | 171.56 | 182.49 | 200.87 | ||||||||||||||||||||||||||||||
| February |
150.99 | 145.81 | 160.80 | 170.77 | 196.45 | 217.12 | 217.32 | 163.26 | 181.60 | 199.37 | ||||||||||||||||||||||||||||||
| March |
151.55 | 151.90 | 162.09 | 173.78 | 201.72 | 221.21 | 218.08 | 170.85 | 186.68 | 189.30 | ||||||||||||||||||||||||||||||
| April |
149.17 | 153.95 | 161.89 | 176.61 | 209.92 | 224.26 | 215.22 | 169.20 | 184.96 | 192.80 | ||||||||||||||||||||||||||||||
| May |
152.77 | 153.73 | 170.00 | 176.38 | 210.32 | 227.67 | 207.33 | 165.19 | 195.03 | 188.39 | ||||||||||||||||||||||||||||||
| June |
153.52 | 152.79 | 169.55 | 174.40 | 208.80 | 220.61 | 203.41 | 167.21 | 195.06 | 183.78 | ||||||||||||||||||||||||||||||
| July |
151.05 | 158.83 | 172.93 | 176.39 | 205.26 | 224.71 | 195.17 | 165.29 | 192.53 | 182.33 | ||||||||||||||||||||||||||||||
| August |
147.35 | 156.42 | 169.51 | 180.43 | 212.64 | 226.65 | 183.20 | 171.44 | 198.89 | 178.58 | ||||||||||||||||||||||||||||||
| September |
147.89 | 154.52 | 169.57 | 181.67 | 209.55 | 227.92 | 188.69 | 177.22 | 200.19 | 170.11 | ||||||||||||||||||||||||||||||
| October |
145.91 | 153.92 | 170.16 | 183.18 | 204.28 | 227.01 | 188.01 | 175.05 | 196.31 | 165.99 | ||||||||||||||||||||||||||||||
| November |
148.41 | 152.67 | 166.41 | 184.92 | 211.48 | 224.59 | 180.37 | 176.49 | 203.55 | 170.96 | ||||||||||||||||||||||||||||||
| December |
147.44 | 156.48 | 172.50 | 187.77 | 210.35 | 219.56 | 174.47 | 178.07 | 203.47 | 168.51 | ||||||||||||||||||||||||||||||
| 2002 | 2003 | 2004 | 2005 | 2006 | 2007 | 2008 | 2009 | 2010 | 2011 | |||||||||||||||||||||||||||||||
| January |
164.83 | 212.14 | 229.67 | 250.91 | 317.12 | 330.62 | 411.13 | 275.21 | 309.71 | 413.98 | ||||||||||||||||||||||||||||||
| February |
167.85 | 210.43 | 241.16 | 269.04 | 307.28 | 342.83 | 459.94 | 262.70 | 316.72 | 427.41 | ||||||||||||||||||||||||||||||
| March |
178.98 | 200.92 | 249.10 | 276.15 | 314.70 | 341.39 | 419.58 | 272.62 | 309.01 | 427.31 | ||||||||||||||||||||||||||||||
| April |
174.76 | 201.16 | 239.12 | 267.03 | 328.57 | 335.77 | 432.82 | 271.52 | 317.08 | 440.35 | ||||||||||||||||||||||||||||||
| May |
177.87 | 204.61 | 243.59 | 264.15 | 328.29 | 339.71 | 436.36 | 302.54 | 301.20 | 421.70 | ||||||||||||||||||||||||||||||
| June |
179.55 | 202.54 | 234.32 | 268.09 | 329.35 | 339.29 | 475.72 | 284.18 | 305.95 | 405.75 | ||||||||||||||||||||||||||||||
| July |
182.26 | 203.40 | 235.75 | 270.29 | 333.17 | 349.84 | 434.38 | 291.59 | 323.85 | 416.20 | ||||||||||||||||||||||||||||||
| August |
188.45 | 210.55 | 243.06 | 276.76 | 330.54 | 339.34 | 407.25 | 288.18 | 321.16 | 424.72 | ||||||||||||||||||||||||||||||
| September |
192.98 | 210.87 | 249.04 | 289.08 | 313.12 | 367.75 | 355.30 | 296.28 | 344.30 | 366.31 | ||||||||||||||||||||||||||||||
| October |
194.72 | 214.61 | 248.86 | 285.12 | 323.59 | 373.06 | 288.96 | 308.74 | 363.59 | 386.60 | ||||||||||||||||||||||||||||||
| November |
195.84 | 215.63 | 253.96 | 289.17 | 342.87 | 369.02 | 279.58 | 322.67 | 361.99 | 372.96 | ||||||||||||||||||||||||||||||
| December |
199.55 | 222.14 | 249.80 | 303.40 | 331.29 | 388.41 | 277.32 | 323.90 | 400.73 | 358.71 | ||||||||||||||||||||||||||||||
5
Table of Contents
| 2012 | 2013 | 2014 | 2015 | 2016 | 2017 | 2018 | 2019 | |||||||||||||||||||||||||
| January |
373.80 | 348.30 | 308.61 | 263.18 | 220.32 | 244.50 | 243.17 | 228.32 | ||||||||||||||||||||||||
| February |
378.37 | 333.29 | 331.93 | 267.87 | 219.04 | 243.31 | 242.82 | 228.27 | ||||||||||||||||||||||||
| March |
361.80 | 334.18 | 336.91 | 255.94 | 228.74 | 237.98 | 240.48 | 227.95 | ||||||||||||||||||||||||
| April |
351.72 | 327.20 | 343.69 | 264.60 | 242.44 | 234.22 | 243.64 | 226.44 | ||||||||||||||||||||||||
| May |
320.53 | 318.42 | 332.52 | 260.10 | 240.03 | 233.44 | 247.01 | 221.89 | ||||||||||||||||||||||||
| June |
337.51 | 305.34 | 334.31 | 267.26 | 250.19 | 231.55 | 236.29 | 226.08 | ||||||||||||||||||||||||
| July |
351.10 | 308.50 | 319.18 | 244.07 | 243.22 | 237.54 | 230.31 | 223.42 | ||||||||||||||||||||||||
| August |
359.43 | 318.70 | 315.06 | 241.28 | 237.34 | 233.90 | 226.28 | 216.89 | ||||||||||||||||||||||||
| September |
361.61 | 314.69 | 297.74 | 236.52 | 239.80 | 233.11 | 227.20 | 222.85 | ||||||||||||||||||||||||
| October |
349.29 | 311.05 | 297.33 | 240.56 | 241.42 | 237.29 | 230.01 | 227.99 | ||||||||||||||||||||||||
| November |
352.37 | 307.63 | 288.44 | 226.78 | 238.81 | 237.89 | 226.14 | 227.05 | ||||||||||||||||||||||||
| December |
340.74 | 306.28 | 274.71 | 225.92 | 238.59 | 239.80 | 220.57 | 239.16 | ||||||||||||||||||||||||
The CCI-TR is an equal weight commodity index. By its very structure an evenly-weighted index will provide broader exposure than one that is not evenly-weighted. To the extent that an index is over-weighted in a particular commodity class, such as energy, that index will reflect the energy sector more than it will the broad commodity universe. The table below indicates the constituent commodities, their index weighting and the sector weighting within the Index.
| Commodity |
Index Weight | Sector Weight | ||||||
| Crude Oil |
5.88 | % | Energy 17.65 | % | ||||
| Heating Oil |
5.88 | % | ||||||
| Natural Gas |
5.88 | % | ||||||
| Corn |
5.88 | % | Grains 23.53 | % | ||||
| Wheat |
5.88 | % | ||||||
| Soybeans |
5.88 | % | ||||||
| Soybean Oil |
5.88 | % | ||||||
| Live Cattle |
5.88 | % | Livestock 11.76 | % | ||||
| Lean Hogs |
5.88 | % | ||||||
| Sugar |
5.88 | % | Softs 23.53 | % | ||||
| Cotton |
5.88 | % | ||||||
| Coffee |
5.88 | % | ||||||
| Cocoa |
5.88 | % | ||||||
| Gold |
5.88 | % | Metals 23.53 | % | ||||
| Silver |
5.88 | % | ||||||
| Platinum |
5.88 | % | ||||||
| Copper |
5.88 | % | ||||||
Interruption of Index Calculation
Calculation of the CCI-TR may not be possible or feasible under certain events or circumstances, including, without limitation, a systems failure, natural or man-made disaster, act of God, armed conflict, act of terrorism, riot or labor disruption or any similar intervening circumstance, that is beyond the reasonable control of Thomson Reuters, the Managing Owner or the Sub-Adviser. Additionally, calculation of the CCI-TR may also be disrupted by an event that would require Thomson Reuters to calculate the closing price in respect of the relevant commodity on an alternative basis.
Investments; Margin
The Fund uses a substantial portion of the proceeds from the sale to investors of baskets (“Baskets”) of 50,000 Shares to purchase Master Fund Units. The Master Fund uses substantially all of the proceeds it receives from
6
Table of Contents
the sale of its Master Fund Units to actively trade exchange-traded Commodity Futures on the Index Commodities, based on the Funds’ investment objective of tracking the performance of the Index over time, less the expenses of the operations of the Funds. The Master Fund’s Portfolio also includes cash, U.S. Treasury obligations and other high credit-quality, short-term fixed income securities for deposit with the Commodity Broker (as defined below) as margin or otherwise held to cover the Master Fund’s notional exposure to Commodity Futures.
All proceeds received from the sale of Baskets are used to achieve the Funds’ investment objective and to pay certain fees and expenses of the Funds.
When the Master Fund trades in Commodity Futures on U.S. exchanges, it is required to deposit a portion of the value of the contract or other interest as security to ensure payment for the underlying obligation. This deposit is known as initial margin. The assets deposited by the Master Fund with its Commodity Broker as margin must be segregated pursuant to the regulations of the U.S. Commodity Futures Trading Commission (the “CFTC”). Such segregated funds may be invested only in a limited range of instruments.
Although the percentages set forth below may vary substantially over time, as of the date of this Annual Report, the Master Fund estimates:
| (i) | approximately 11% of the Net Asset Value (as defined below) of the Master Fund will be held as margin deposits in the form of U.S. Treasuries, cash and/or cash equivalents in segregated accounts with a Commodity Broker (or another eligible financial institution, as applicable), in accordance with the applicable CFTC rules; and |
| (ii) | approximately 89% of the Net Asset Value of the Master Fund will be maintained in segregated accounts in the name of the Master Fund in bank deposits or U.S. Treasuries. |
The Sub-Adviser, a registered commodity trading advisor, is responsible for the cash management activities of the Master Fund, including investing in U.S. Treasuries.
The Master Fund receives 100% of the interest income earned on its interest income assets.
Net Asset Value; Indicative Fund Value
“Net Asset Value” means the total assets of the Master Fund including, but not limited to, all cash and cash equivalents or other debt securities, less total liabilities of the Master Fund, each determined on the basis of generally accepted accounting principles in the U.S., consistently applied under the accrual method of accounting. In particular, Net Asset Value includes any unrealized profit or loss on open Commodity Futures, and any other credit or debit accruing to the Master Fund but unpaid or not received by the Master Fund. All open Commodity Futures traded on a U.S. exchange will be calculated at their then current market value, which will be based upon the settlement price for that particular Commodity Future traded on the applicable U.S. exchange on the date with respect to which Net Asset Value is being determined; provided, that if a Commodity Future traded on a U.S. exchange could not be liquidated on such day, due to the operation of daily limits or other rules of the exchange upon which that position is traded or otherwise, the settlement price on the most recent day on which the position could have been liquidated shall be the basis for determining the market value of such position for such day.
The current market value of all open Commodity Futures traded on a non-U.S. exchange shall be based upon the settlement price for that particular commodity futures contract traded on the applicable non-U.S. exchange on the date with respect to which Net Asset Value is being determined; provided, that if a Commodity Future traded on a non-U.S. exchange could not be liquidated on such day, due to the operation of daily limits (if applicable) or other rules of the exchange upon which that position is traded or otherwise, the settlement price on the most recent day on which the position could have been liquidated shall be the basis for determining the market value of such position for such day.
7
Table of Contents
The Managing Owner may in its discretion (and under extraordinary circumstances, including, but not limited to, periods during which a settlement price of a Commodity Future is not available due to exchange limit orders or force majeure type events such as systems failure, natural or man-made disaster, act of God, armed conflict, act of terrorism, riot or labor disruption or any similar intervening circumstance) value any asset of the Master Fund pursuant to such other principles as the Managing Owner deems fair and equitable so long as such principles are consistent with normal industry standards. Notwithstanding the foregoing, such valuations may differ from valuations of others in the industry. Interest earned on the Master Fund’s commodity brokerage account will be accrued at least monthly. The amount of any distribution will be a liability of the Master Fund from the day when the distribution is declared until it is paid. Because there will be a one-to-one correlation between Shares and Master Fund Units, the Net Asset Value per Share and the Net Asset Value per Master Fund Unit will be equal.
The Fund’s Administrator (as defined below) calculates the Net Asset Value once each NYSE Arca trading day. The Net Asset Value for a particular trading day is released after 5:00 p.m. ET and posted at www.wisdomtree.com.
To provide updated information relating to the Fund for use by investors and market professionals, the NYSE Arca calculates and disseminates throughout the trading day an updated “indicative fund value.” The indicative fund value is calculated by using the prior day’s closing Net Asset Value per Master Fund Unit as a base and updating that value throughout the trading day to reflect changes in the value of the Master Fund’s Commodity Futures during the trading day. Changes in the value of U.S. Treasuries will not be included in the calculation of indicative fund value. The indicative fund value will be disseminated on a per Share basis every 15 seconds during regular NYSE Arca trading hours of 9:30 a.m. ET to 4:00 p.m. ET.
Creation and Redemption of Shares
The Fund creates and redeems Shares from time to time, but only in one or more Baskets of 50,000 Shares. Authorized Participants are the only persons that may place orders to create and redeem Baskets. Each “Authorized Participant” must (i) be a registered broker-dealer or other securities market participant, such as a bank or other financial institution that is not required to register as a broker-dealer to engage in securities transactions, (ii) be a participant in the Depository Trust Company (“DTC”), and (iii) have entered into a “Participant Agreement.” A list of the current Authorized Participants can be obtained from the Managing Owner. Investors not qualified as Authorized Participants will not be able to place orders to create and redeem Baskets directly from the Fund. However, Authorized Participants may sell the Shares included in the Baskets they purchase from the Fund to other investors.
The Participant Agreement sets forth the procedures for the creation and redemption of Baskets and for the payment of cash required for such creations and redemptions. Under the Participant Agreement, the Managing Owner has agreed to indemnify an Authorized Participant against certain liabilities, including liabilities under the Securities Act of 1933, as amended (the “1933 Act”). Authorized Participants are cautioned that some of their activities may result in their being deemed participants in a distribution in a manner that would render them statutory underwriters and subject them to the prospectus delivery and liability provisions of the 1933 Act.
Authorized Participants may act for their own accounts or as agents for broker-dealers, custodians and other securities market participants that wish to create or redeem Baskets.
The times for creation and redemption order cut-off times and/or settlement set forth below are as of the date of this Annual Report and may be revised as designated by the Fund or its agents on the order form or related procedures as communicated to Authorized Participants.
Creation Procedures
General. On any business day, an Authorized Participant may place an order with the Fund’s Distributor (as defined below) (as facilitated by the Fund’s Administrator) to create one or more Baskets. For purposes of
8
Table of Contents
processing both purchase and redemption orders, a “business day” means any day other than a day when banks in New York City are required or permitted to be closed. Purchase orders must be placed by 10:00 a.m. ET. The day on which a valid purchase order is received is the purchase order date. Purchase orders are irrevocable. By placing a purchase order, and prior to delivery of such Baskets, an Authorized Participant’s DTC account will be charged the non-refundable transaction fee due for the purchase order.
Determination of Required Payment. The total payment required to create each Basket is the Net Asset Value of 50,000 Shares as of the closing time of NYSE Arca or the last to close of the exchanges on which the Index Commodities are traded, whichever is later, on the purchase order date. Baskets will be issued as of 12:00 p.m. ET, on the business day immediately following the purchase order date at the Net Asset Value per Share as of the closing time of NYSE Arca or the last to close of the exchanges on which the Index Commodities are traded, whichever is later, on the purchase order date during the continuous offering period, but only if the required payment has been timely received.
Because orders to purchase Baskets must be placed by 10:00 a.m. ET, but the total payment required to create a Basket during the continuous offering period will not be determined until 4:00 p.m. ET, on the date the purchase order is received, Authorized Participants will not know the total amount of the payment required to create a Basket at the time they submit an irrevocable purchase order for the Basket. The Fund’s Net Asset Value and the total amount of the payment required to create a Basket could rise or fall substantially between the time an irrevocable purchase order is submitted and the time the amount of the purchase price in respect thereof is determined.
Rejection of Purchase Orders. The Administrator may reject a purchase order if:
| (i) | it determines that the purchase order is not in proper form; |
| (ii) | the Managing Owner believes that the purchase order would have adverse tax consequences to the Fund or its Shareholders; or |
| (iii) | circumstances outside the control of the Managing Owner or the Distributor make it, for all practical purposes, not feasible to process creations of Baskets. |
The Distributor and the Managing Owner will not be liable for the rejection of any purchase order.
Redemption Procedures
General. The procedures by which an Authorized Participant can redeem one or more Baskets mirror the procedures for the creation of Baskets. On any business day, an Authorized Participant may place an order with the Distributor (as facilitated by the Administrator) to redeem one or more Baskets. Redemption orders must be placed by 10:00 a.m. ET. The day on which a valid redemption order is received in proper form is the redemption order date. Redemption orders are irrevocable. Individual Shareholders may not redeem directly from the Fund.
By placing a redemption order, an Authorized Participant agrees to deliver the Baskets to be redeemed through DTC’s book-entry system to the Fund not later than 12:00 p.m. ET, on the business day immediately following the redemption order date. By placing a redemption order, and prior to receipt of the redemption proceeds, an Authorized Participant’s DTC account will be charged the non-refundable transaction fee due for the redemption order.
Determination of Required Payment. The redemption proceeds from the Fund consist of the cash redemption amount equal to the Net Asset Value of the number of Basket(s) requested in the Authorized Participant’s redemption order as of the closing time of the NYSE Arca or the last to close of the exchanges on which the Index Commodities are traded, whichever is later, on the redemption order date. The Managing Owner will distribute the cash redemption amount at 12:00 p.m. ET, on the business day immediately following the redemption order date through DTC to the account of the Authorized Participant as recorded on DTC’s book entry system.
9
Table of Contents
Delivery of Redemption Proceeds. The redemption proceeds due from the Fund are delivered to the Authorized Participant at 12:00 p.m. ET, on the business day immediately following the redemption order date if, by such time, the Fund’s DTC account has been credited with the Baskets to be redeemed. If the Fund’s DTC account has not been credited with all of the Baskets to be redeemed by such time, the redemption distribution is delivered to the extent of whole Baskets received. Any remainder of the redemption distribution is delivered on the next business day to the extent of remaining whole Baskets received if the Distributor receives the fee applicable to the extension of the redemption distribution date which the Distributor may, from time-to-time, determine and the remaining Baskets to be redeemed are credited to the Fund’s DTC account by 12:00 p.m. ET, on such next business day. Any further outstanding amount of the redemption order shall be cancelled. The Distributor is also authorized to deliver the redemption distribution notwithstanding that the Baskets to be redeemed are not credited to the Fund’s DTC account by 12:00 p.m. ET, on the business day immediately following the redemption order date if the Authorized Participant has collateralized its obligation to deliver the Baskets through DTC’s book entry system on such terms as the Distributor and the Managing Owner may from time-to-time agree upon.
Suspension or Rejection of Redemption Orders. The Managing Owner may suspend the right of redemption, or postpone the redemption settlement date, (1) for any period during which an emergency exists as a result of which the redemption distribution is not reasonably practicable, or (2) for such other period as the Managing Owner determines to be necessary for the protection of the Shareholders. The Managing Owner will not be liable to any person or in any way for any loss or damages that may result from any such suspension or postponement.
A redemption order may be rejected if the order is not in proper form as described in the order form and/or Participant Agreement or if the fulfillment of the order, in the opinion of its counsel, might be unlawful.
Creation and Redemption Transaction Fee. To compensate State Street Bank and Trust Company (referred to herein as “State Street” or the “Administrator”), as Administrator of the Funds, for services in processing the creation and redemption of Baskets, an Authorized Participant is required to pay a transaction fee to the Fund of $200 per order to create or redeem Baskets. An order may include multiple Baskets. The transaction fee may be reduced, increased or otherwise changed by State Street with consent from the Managing Owner. State Street must notify DTC of any agreement to change the transaction fee and will not implement any increase in the fee for the redemption of Baskets until thirty (30) days after the date of the notice.
The times for creation and redemption order cut-off times and/or settlement set forth above may be revised as designated by the Funds or its agents on the order form or related procedures as communicated to Authorized Participants.
Secondary Market Trading
The Net Asset Value per Share will change as fluctuations occur in the market value of the Portfolio. The public trading price per Share may be different from the Net Asset Value per Share. Consequently, an Authorized Participant may be able to create or redeem a Basket at a discount or a premium to the public trading price per Share. This price difference may be due, in large part, to the fact that supply and demand forces at work in the secondary trading market for Shares is closely related, but not identical, to the same forces influencing the price of the underlying commodity at any point in time.
Advisors and Associated Persons
The Trustee
Delaware Trust Company, a Delaware corporation, is the sole Trustee of the Funds (the “Trustee”). The Trustee’s principal offices are located at 2711 Centerville Road, Suite 210, Wilmington, DE 19808. The Trustee is unaffiliated with the Managing Owner.
10
Table of Contents
Under the Declaration of Trust and Trust Agreement, dated as of October 27, 2006 and as amended January 4, 2016, of the Fund (the “Fund Trust Agreement”), and the Declaration of Trust and Trust Agreement, dated as of October 27, 2006 and as amended July 29, 2007 and January 4, 2016, of the Master Fund (the “Master Fund Trust Agreement” and collectively with the Fund Trust Agreement, the “Trust Agreements”), the Trustee has delegated to the Managing Owner the exclusive management and control of all aspects of the business of the Funds.
The Trustee will accept service of legal process on the Funds in the State of Delaware and will make certain filings under the Delaware Statutory Trust Act. The Trustee does not owe any other duties to the Funds, the Managing Owner, the Sub-Adviser or the Shareholders. Under the Trust Agreements, the exclusive management and control of all aspects of the Funds’ business are vested in the Managing Owner. The Trustee has no duty or liability to supervise or monitor the performance of the Managing Owner, nor does the Trustee have any liability for the acts or omissions of the Managing Owner.
The Trustee is permitted to resign upon at least sixty (60) days’ notice to the Fund or the Master Fund, as applicable; provided, that any such resignation will not be effective until a successor Trustee is appointed by the Managing Owner. The Trust Agreements of each of the Funds provides that the Trustee is compensated by the Fund or the Master Fund, as applicable, and is indemnified by the Fund or Master Fund, as applicable, against any expenses it incurs relating to or arising out of the formation, operation or termination of the Fund or Master Fund, as applicable, or the performance of its duties pursuant to the applicable Trust Agreement, except to the extent that such expenses result from the gross negligence or willful misconduct of the Trustee. The Managing Owner has the discretion to replace the Trustee.
Because the Trustee has delegated substantially all of its authority over the operation of the Funds to the Managing Owner, the Trustee itself is not registered in any capacity with the CFTC or the National Futures Association (“NFA”).
Affiliates of the Trustee may from time to time act as Authorized Participants or purchase or sell Shares for their own account, as agent for their customers and for accounts over which they exercise investment discretion.
The Managing Owner
WisdomTree Commodity Services, LLC, a Delaware limited liability company, is the managing owner and commodity pool operator of each of the Funds. The Managing Owner is registered as a commodity pool operator with the CFTC and is a member of the NFA. Its principal place of business is 245 Park Avenue, 35th Floor, New York, New York 10167, and its telephone number is (866) 909-9473. The registration of the Managing Owner with the CFTC and its membership in the NFA must not be taken as an indication that either the CFTC or the NFA has recommended or approved the Managing Owner or the Funds.
The Trustee has delegated to the Managing Owner the exclusive power and authority to manage the business and affairs of the Funds. Specifically, with respect to each Fund, the Managing Owner:
| (i) | selects the Trustee, Administrator, Distributor and each Fund’s auditor; |
| (ii) | negotiates various agreements and fees; and |
| (iii) | performs such other services as the Managing Owner believes that the Funds may from time to time require. |
With respect to the Master Fund, the Managing Owner has also delegated the following responsibilities to the Sub-Adviser:
| (i) | selecting the Commodity Broker; and |
11
Table of Contents
| (ii) | monitoring the performance of the Portfolio and reallocating assets within the Portfolio with a view to tracking the performance of the Index over time. |
In its capacity as a commodity pool operator, the Managing Owner is an organization which operates or solicits funds for a commodity pool; that is, an enterprise in which funds contributed by a number of persons are combined for the purpose of trading futures contracts.
The Sub-Adviser
The Managing Owner, on behalf of the Funds, has appointed GreenHaven Advisors LLC as the sub-adviser (the “Sub-Adviser”) and commodity trading advisor of the Funds. The Sub-Adviser is registered with the CFTC as a commodity trading advisor and is a member of the NFA. Its principal place of business is 3340 Peachtree Road, Suite 1910, Atlanta, Georgia 30326, and its telephone number is (404) 389-9744.
The Sub-Adviser, under authority delegated by the Managing Owner, is responsible for selecting Commodity Brokers and reallocating assets within the Portfolio with a view to achieving the Funds’ investment objective. In its capacity as a commodity trading advisor, the Sub-Adviser is an organization which, for compensation or profit, advises others as to the value of or the advisability of buying or selling futures contracts.
The Commodity Broker
A variety of executing brokers may execute transactions in Commodity Futures on behalf of the Master Fund. The Sub-Adviser, on behalf of the Master Fund and the Managing Owner, has designated Morgan Stanley & Co. LLC (together with its parent Morgan Stanley, Morgan Stanley Wealth Management, and its consolidated subsidiaries, collectively referred to herein as “MS&Co”) as the Master Fund’s Commodity Broker, to which the executing brokers give-up all such transactions. MS&Co is registered as a futures commission merchant with the CFTC and is a member of the NFA in such capacity. MS&Co’s principal place of business is located at 1585 Broadway, New York, New York 10036. In the future, the Managing Owner may designate other entities that are registered with the CFTC as a futures commission merchants and are members of the NFA in such capacity to replace or supplement the current Commodity Broker.
The Administrator
The Managing Owner, on behalf of the Funds, has appointed State Street as the Funds’ Administrator and has entered into an Administration Agreement in connection therewith. State Street serves as custodian of the Funds pursuant to a Master Custodian Agreement, and transfer agent of the Funds pursuant to a Transfer Agency and Service Agreement.
State Street, a state-chartered bank organized under the laws of the Commonwealth of Massachusetts with trust powers, has an office at One Lincoln Street, Boston, Massachusetts 02110. State Street is subject to supervision by the Massachusetts Division of Banks and the Board of Governors of the Federal Reserve System. Information regarding the Net Asset Value, creation and redemption transaction fees and a list of Authorized Participants may be obtained by calling the following number: (866) 909-9473.
As the Administrator, State Street performs certain services necessary for the operation and administration of the Funds (other than making investment decisions), including Net Asset Value calculations, accounting and other fund administrative services. State Street retains certain financial books and records, including: fund accounting records, ledgers with respect to assets, liabilities, capital, income and expenses, the registrar, transfer journals and related details and trading and related documents received from futures commission merchants.
The State Street agreements with the Funds will continue in effect through March 31, 2021 unless terminated earlier as specified in the applicable agreement (e.g., material breach). The agreements generally provide for the
12
Table of Contents
exculpation and indemnification of State Street from and against any costs, expenses, damages, liabilities or claims (other than those resulting from State Street’s own bad faith, negligence or willful misconduct) which may be imposed on, incurred by or asserted against State Street in performing its obligations or duties thereunder.
State Street and any of its affiliates may from time to time purchase or sell Shares for their own account, as agent for their customers and for accounts over which they exercise investment discretion.
State Street also receives a transaction processing fee in connection with orders from Authorized Participants to create or redeem Baskets in the amount of $200 per order. These transaction processing fees are paid directly by the Authorized Participants and not by the Funds.
The Distributor
The Managing Owner, on behalf of the Funds, has appointed Foreside Fund Services LLC (“FFS” or the “Distributor”) pursuant to a Distribution Services Agreement. FFS is a broker-dealer registered with FINRA and a member of the Securities Investor Protection Corporation.
In its capacity as Distributor, FFS assists the Managing Owner and the Administrator with certain functions and duties relating to the creation and redemption of Baskets, including assisting in matters associated with receiving and processing orders from Authorized Participants to create and redeem Baskets, coordinating the processing of such orders and related functions and duties. The Distributor does not open or maintain customer accounts or handle orders for the Funds.
FFS may be contacted at Foreside Fund Services LLC, Three Canal Plaza, Suite 100, Portland, Maine 04101. Investors may obtain information regarding the Distributor by calling toll-free in the U.S. at (866) 909-9473.
Fees and Expenses
Organization and Offering
The Managing Owner and its predecessor have paid and will pay the fees and expenses incurred in connection with the formation, qualification and registration of the Funds and the Shares under applicable U.S. federal and state law, and any other expenses actually incurred and, directly or indirectly, related to the organization of the Funds or the offering of the Shares prior to the time such Shares begin trading or in subsequent offerings, including but not limited to, expenses such as:
| • | registration fees, exchange listing fees, prepaid licensing fees, filing fees, escrow fees and taxes; |
| • | costs of preparing, printing (including typesetting), amending, supplementing, mailing and distributing any prospectus and the exhibits thereto; |
| • | costs of qualifying, printing (including typesetting), amending, supplementing, mailing and distributing sales materials used in connection with the offering and issuance of the Shares; |
| • | travel, telephone and other expenses in connection with the offering and issuance of the Shares; and |
| • | accounting, auditing and legal fees (including disbursements related thereto) incurred in connection therewith. |
The Managing Owner is not reimbursed in connection with the payment of the organizational and offering expenses of the Funds.
13
Table of Contents
Ordinary Fees and Expenses
The Managing Owner pays the following ongoing administrative fees and expenses incurred by the Funds:
| • | fees payable to the Sub-Adviser; |
| • | routine expenses associated with the preparation of monthly, quarterly, annual and other reports required by applicable U.S. federal and state regulatory authorities; |
| • | accounting, auditing and legal fees (including disbursements related thereto); |
| • | printing, mailing and other marketing-related costs; |
| • | exchange listing fees, prepaid licensing fees, filing fees, escrow fees and taxes; |
| • | payment for fees and costs associated with distribution, marketing, custody and transfer agency services to the Fund; and |
| • | SEC and FINRA registration fees. |
The Managing Owner will not be reimbursed in connection with the payment of all routine operational, administrative and other ordinary expenses of the Funds.
The Funds pay the following ongoing administrative fees and expenses incurred by the Funds:
| • | the Funds paid to the Managing Owner a fee (the “Management Fee”), paid monthly in arrears, in an amount equal to 0.75% per annum of the average Net Asset Value during the calendar year after the Managing Owner voluntarily agreed to waive a portion of its Management Fee in the amount of 0.10% per annum; and |
| • | all brokerage commissions, including applicable exchange fees, NFA fees, give-up fees, pit brokerage fees and other transaction related fees and expenses charged in connection with trading activities. |
Extraordinary Fees and Expenses
The Funds pay all of the Funds’ extraordinary fees and expenses generally, if any, as determined by the Managing Owner. Extraordinary fees and expenses are likely to include non-recurring fees such as legal claims and liabilities, litigation costs and any permitted indemnification payments related thereto, if any, but the Managing Owner has discretion to treat other unanticipated expenses as extraordinary fees and expenses. Routine operational, administrative and other ordinary fees and expenses will not be deemed extraordinary fees and expenses.
Upfront Selling Commissions
No upfront selling commissions will be charged to Shareholders, although investors are expected to be charged a customary commission by their brokers in connection with purchases of Shares that will vary from investor to investor. Investors are encouraged to review the terms of their brokerage accounts for details on applicable charges.
14
Table of Contents
Fee Table
The following table describes the Funds’ estimated fees and compensation arrangements with the Managing Owner, the Trustee and certain other non-affiliated service providers. Asset-based fees are calculated on a daily basis (accrued at 1/365 of the applicable percentage of Net Asset Value on that day) and paid on a monthly basis. The Management Fee and other fees and expenses payable by the Funds will be paid first out of interest income from the Funds’ holdings of U.S. Treasuries. It is expected that, at current interest rates, such interest income will be sufficient to cover all or a significant portion of the Management Fee and other fees and expenses payable by the Funds.
| Service Provider |
Annual Compensation | |
| WisdomTree Commodity Services, LLC Managing Owner |
0.75% of the average annual Net Asset Value(1) | |
| Delaware Trust Company Trustee |
$6,000 annually | |
| Morgan Stanley & Co. LLC Commodity Broker |
Based on trading activity(2) | |
| State Street Bank and Trust Company Administrator |
Basis points based on annual Net Asset Value | |
| Foreside Fund Services LLC Distributor |
Basis points based on annual Net Asset Value | |
| GreenHaven Advisors LLC Sub-Adviser |
An annual fee equal to 20% of the Management Fee; subject to a $200,000 annual minimum. | |
| (1) | The Funds are contractually obligated to pay the Managing Owner a Management Fee of 0.85% per annum based on the average daily Net Asset Value of the Master Fund, payable monthly in arrears. The Managing Owner voluntarily agreed to waive a portion of its Management Fee in the amount of 0.10% per annum reducing the Management Fee to 0.75% per annum. From the Management Fee, the Managing Owner will be responsible for paying the fees and expenses of the Administrator, the Distributor and the Trustee, and the routine operational, administrative and other ordinary expenses of the Fund including the fee payable to the Sub-Adviser. |
| (2) | The costs to the Funds for brokerage commissions and trading fees will vary by the broker or brokers involved to execute specific contracts for the Funds’ interest. The Funds expect to pay rates that are commensurate with the going market rate for commissions and brokerage. The costs to the Funds will also be subject to the trading frequency of the Funds. On average, total charges paid to the Commodity Broker are expected to be less than $20 per round-turn trade, although the Commodity Broker’s brokerage commissions and trading fees are determined on a contract-by-contract basis. The Funds pay for their brokerage commissions and fees directly (which were approximately 0.02% of the Net Asset Value per annum in the aggregate for the fiscal year ended December 31, 2019). |
Governance; Shareholder Rights and Protections
Duties of the Managing Owner
As managing owner of the Funds, the Managing Owner effectively is subject to the duties and restrictions imposed on “fiduciaries” under both statutory and common law. The Managing Owner has a fiduciary responsibility to the Shareholders to exercise good faith, fairness and loyalty in all dealings affecting the Funds, consistent with the terms of the Trust Agreements. The general fiduciary duties which would otherwise be imposed on the Managing Owner (which would make the operation of the Funds as described herein impracticable due to the strict prohibition imposed by such duties on, for example, conflicts of interest on behalf
15
Table of Contents
of a fiduciary in its dealings with its beneficiaries), are defined and limited in scope by the disclosure of the business terms of the Funds, as set forth herein and in the Trust Agreements (to which terms all Shareholders, by subscribing to the Shares, are deemed to consent).
The Trust Agreements provide that the Managing Owner and its affiliates shall have no liability to the Funds or to any Shareholder for any loss suffered by the Funds arising out of any action or inaction of the Managing Owner or its affiliates or their respective directors, officers, shareholders, partners, members, managers or employees (the “Managing Owner Indemnified Parties”), if the Managing Owner Indemnified Parties, in good faith, determined that such course of conduct was in the best interests of the Funds, and such course of conduct did not constitute gross negligence or willful misconduct by the Managing Owner Indemnified Parties. The Funds will indemnify the Managing Owner Indemnified Parties against claims, losses or liabilities based on their conduct relating to the applicable Fund, provided that the conduct resulting in the claims, losses or liabilities for which indemnity is sought did not constitute gross negligence or willful misconduct and was done in good faith and in a manner reasonably believed to be in the best interests of the applicable Fund.
In addition, the Trust Agreements specifically do not impose any general fiduciary duties on the Managing Owner. Under the Delaware Statutory Trust Act and the governing documents of the Managing Owner, the sole member of the Managing Owner, WisdomTree Investments, Inc., is not responsible for the debts, obligations and liabilities of the Managing Owner solely by reason of being the sole member of the Managing Owner.
Under Delaware law, a beneficial owner of a statutory trust (such as a Shareholder) may, under certain circumstances and in accordance with the statutory trust’s governing instrument, institute legal action on behalf of himself and all other similarly situated beneficial owners (a “class action”) to recover damages from a managing owner of such statutory trust for violations of fiduciary duties, or on behalf of a statutory trust (a “derivative action”) to recover damages from a third party where a trustee with authority to do so has failed or refused to institute proceedings to recover such damages. In addition, beneficial owners may have the right, subject to certain legal requirements, to bring class actions in federal court to enforce their rights under the federal securities laws and the rules and regulations promulgated thereunder by the SEC. Beneficial owners who have suffered losses in connection with the purchase or sale of their beneficial interests may be able to recover such losses from a managing owner where the losses result from a violation by the managing owner of the anti-fraud provisions of the federal securities laws.
Management; Voting by Shareholders
The Shareholders take no part in the management or control, and have no voice in the operations or the business of the Funds.
The Managing Owner has the right unilaterally to amend the Trust Agreements; provided that the Shareholders have the right to vote only if expressly required under Delaware or federal law or rules or regulations of the NYSE Arca or other applicable national securities exchange, or if submitted to the Shareholders by the Managing Owner in its sole discretion. No amendment affecting the Trustee shall be binding upon or effective against the Trustee unless consented to by the Trustee in writing.
The Shareholders may also amend the Trust Agreement of the Fund, except in certain limited respects, by the affirmative vote of the Shares then owned by Shareholders representing a majority of the Net Asset Value (excluding any Shares held by the Managing Owner and its affiliates). The affirmative vote of the Shares then owned by Shareholders representing at least 75% of the Net Asset Value may also compel dissolution of the Fund. The owners of 10% of the outstanding Shares then owned by Shareholders have the right to bring a matter before a vote of the Shareholders. The Managing Owner has no power under the Fund’s Trust Agreement to restrict any of the Shareholders’ voting rights. Any Shares purchased by the Managing Owner or its affiliates, as well as the Managing Owner’s general interest in the Funds, are non-voting.
16
Table of Contents
Recognition of the Funds in Certain States
A number of states do not have “business trust” statutes such as that under which the Funds have been formed in the State of Delaware. It is possible, although unlikely, that a court in such a state could hold that, due to the absence of any statutory provision to the contrary in such jurisdiction, the Shareholders, although entitled under Delaware law to the same limitation on personal liability as stockholders in a private corporation for profit organized under the laws of the State of Delaware, are not so entitled in such state. To protect the Funds’ shareholders against any loss of limited liability, the Trust Agreements provide that no written obligation may be undertaken by the applicable Fund unless such obligation is explicitly limited so as not to be enforceable against any shareholder personally. Furthermore, each of the Funds themselves indemnify all shareholders against any liability that such shareholders might incur in addition to that of a beneficial owner. The Managing Owner will use its assets to satisfy any such liability before such liability would be enforced against any Fund shareholder individually.
Possible Repayment of Distributions Received by Shareholders; Indemnification by Shareholders
The Shares are limited liability investments, and investors may not lose more than the amount that they invest plus any profits recognized on their investment. However, Shareholders could be required, as a matter of bankruptcy law, to return to the estate of the Fund any distribution received at a time when the Fund was in fact insolvent or in violation of its Trust Agreement. In addition, although the Managing Owner is not aware of this provision ever having been invoked in the case of any public futures fund, Shareholders agree in the Trust Agreement that they will indemnify the Fund for any harm suffered by it as a result of (i) Shareholders’ actions unrelated to the business of the Fund, or (ii) taxes imposed on the Shares by the states or municipalities in which such investors reside.
The foregoing repayment of distributions and indemnity provisions (other than the provision for Shareholders indemnifying the Fund for taxes imposed upon it by the state or municipality in which particular Shareholders reside, which is included to address the unlikely possibility that the tax status of the Fund is challenged in a state with a business trust statute) are commonplace in statutory trusts and limited partnerships.
Shares; Certificates
Individual certificates are not issued for the Shares. Instead, global certificates are deposited by the Trustee with DTC and registered in the name of Cede & Co., as nominee for DTC. The global certificates evidence all of the Shares outstanding at any time. Under the Fund Trust Agreement, Shareholders are limited to (1) participants in DTC such as banks, brokers, dealers and trust companies (“DTC Participants”), (2) those who maintain, either directly or indirectly, a custodial relationship with a DTC Participant (Indirect Participants), and (3) those banks, brokers, dealers, trust companies and others who hold interests in the Shares through DTC Participants or Indirect Participants. The Shares are only transferable through the book-entry system of DTC. Shareholders who are not DTC Participants may transfer their Shares through DTC by instructing the DTC Participant holding their Shares (or by instructing the Indirect Participant or other entity through which their Shares are held) to transfer the Shares. Transfers are made in accordance with standard securities industry practice.
Employees
The Funds have no employees. Management functions are performed by the Managing Owner and requisite administrative services are provided on a contractual basis by various entities.
Conflicts of Interest
General
Investors are dependent on the good faith of the respective parties subject to such conflicts to resolve them equitably. Although the Managing Owner attempts to monitor these conflicts, it is extremely difficult, if not
17
Table of Contents
impossible, for the Managing Owner to ensure that these conflicts do not, in fact, result in adverse consequences to the Fund.
The Managing Owner and Sub-Adviser
The Managing Owner and Sub-Adviser each have a conflict of interest in allocating its own limited resources among different clients and potential future business ventures, to each of which it owes fiduciary duties. Additionally, the directors, officers and/or employees of the Managing Owner and Sub-Adviser also service other affiliates of such parties and their respective clients. Although the Managing Owner and Sub-Adviser and their directors, officers and/or employees cannot and will not devote all of its or their respective time or resources to the management of the business and affairs of the Funds, such parties intend to devote, and to cause its directors, officers and employees to devote, sufficient time and resources to properly manage the business and affairs of the Funds consistent with its or their respective duties to the Funds and others.
The Commodity Broker
The Commodity Broker may act from time to time as a broker for other accounts with which it is affiliated or in which it or one of its affiliates has a financial interest. The compensation received by the Commodity Broker from such accounts may be more or less than the compensation received for brokerage services provided to the Master Fund. In addition, various accounts traded through the Commodity Broker (and over which their personnel may have discretionary trading authority) may take positions in the futures markets opposite to those of the Master Fund or may compete with the Master Fund for the same positions. The Commodity Broker may have a conflict of interest in its execution of trades for the Master Fund and for other customers. The Managing Owner, under delegation to the Sub-Adviser, does not presently intend to retain any commodity broker for the Master Fund which the Sub-Adviser has reason to believe would knowingly or deliberately favor any other customer over the Master Fund with respect to the execution of commodity trades.
The Commodity Broker will benefit from executing orders for other clients, whereas the Master Fund may be harmed to the extent that the Commodity Broker has fewer resources to allocate to the Master Fund’s accounts due to the existence of such other clients.
Certain officers or employees of the Commodity Broker may be members of U.S. commodities exchanges and/or serve on the governing bodies and standing committees of such exchanges, their clearing houses and/or various other industry organizations. In such capacities, these officers or employees may have a fiduciary duty to the exchanges, their clearing houses and/or such various other industry organizations which could compel such employees to act in the best interests of these entities, perhaps to the detriment of the Master Fund.
Proprietary Trading/Other Clients
The Managing Owner, the Sub-Adviser and the Commodity Broker and their respective principals and affiliates may trade in the commodity markets for their own accounts and for the accounts of their clients, and in doing so may take positions opposite to those held by the Master Fund or may compete with the Master Fund for positions in the marketplace. Such trading may create conflicts of interest on behalf of one or more such persons in respect of their obligations to the Master Fund. Records of proprietary trading and trading on behalf of other clients will not be available for inspection by Shareholders.
Because the Managing Owner, the Sub-Adviser and the Commodity Broker and their respective principals and affiliates may trade for their own accounts at the same time that they are managing the account of the Master Fund, prospective investors should be aware that – as a result of a neutral allocation system, testing a new trading system, trading their proprietary accounts more aggressively or other activities not constituting a breach of fiduciary duty – such persons may from time to time take positions in their proprietary accounts which are opposite, or ahead of, the positions taken for the Master Fund.
18
Table of Contents
No Distributions
The Managing Owner has discretionary authority over all distributions made by the Fund. In view of the Fund’s objective of seeking significant capital appreciation, the Managing Owner currently does not intend to make any distributions, but, has the sole discretion to do so from time to time. Greater Management Fees will be generated to the benefit of the Managing Owner if the Fund’s assets are not reduced by distributions to the Shareholders.
Related Party Transactions
There are no material transactions or arrangements between the Funds and any person affiliated with a person providing services to the Funds that require disclosure.
| Item 1A. | Risk Factors. |
These risk factors should be read in connection with the other information included in this Annual Report, including Management’s Discussion and Analysis of Financial Condition and Results of Operations and the Funds’ Financial Statements and the related Notes to the Funds’ Financial Statements.
The value of the Shares relates directly to the value of the Master Fund’s Portfolio.
The Shares are designed to reflect, as closely as possible, the performance of the Index through the Master Fund’s Portfolio of exchange-traded Commodity Futures on the Index Commodities. Accordingly, the value of the Shares relate directly to the value of the Portfolio, less the Funds’ liabilities (including estimated accrued but unpaid expenses). The markets and prices of the Index Commodities may fluctuate widely based on many factors, including:
| • | changing supply and demand relationships; |
| • | general economic activities and conditions; |
| • | weather and other environmental conditions; |
| • | acts of God; |
| • | agricultural, fiscal, monetary and exchange control programs and policies of governments; |
| • | national and international political and economic events and policies; |
| • | changes in rates of inflation; or |
| • | the general emotions and psychology of the marketplace, which at times can be volatile and unrelated to other more tangible factors. |
In addition to the factors set forth above, each commodity has risks that are inherent in the investment in such commodity.
Metals Commodities: Price movements in Commodity Futures held by the Master Fund in metals commodities such as gold, silver, platinum and copper are affected by many specific other factors. Some of these metal specific factors include, but are not limited to:
| • | A change in economic conditions, such as a recession, can adversely affect the price of both industrial and precious metals. An economic downturn may have a negative impact on the usage and demand of metals which may result in a loss for the Master Fund. |
| • | A sudden shift in political conditions of the world’s leading metal producers may have a negative effect on the global pricing of metals. |
| • | An increase in the hedging of precious metals may result in the price of precious metals to decline. |
19
Table of Contents
| • | Changes in global supply and demand for industrial and precious metals. |
| • | The price and quantity of imports and exports of industrial and precious metals. |
| • | Technological advances in the processing and mining of industrial and precious metals. |
Agricultural Commodities: Price movements in Commodity Futures held by the Master Fund in agricultural commodities, such as wheat, corn and soybeans, are affected by many factors. Some of these agricultural specific factors include, but are not limited to:
| • | Farmer planting decisions, general economic, market and regulatory factors all influence the price of agricultural commodities. |
| • | Weather conditions, including hurricanes, tornadoes, storms and droughts, may have a material adverse effect on crops, live cattle, live hogs and lumber, which may result in significant fluctuations in prices in such commodities. |
| • | Changes in global supply and demand for agriculture products. |
| • | The price and quantity of imports and exports of agricultural commodities. |
| • | Political conditions, including embargoes and war, in or affecting agricultural production, imports and exports. |
| • | Technological advances in agricultural production. |
| • | The price and availability of alternative agricultural commodities. |
Energy Commodities: Price movements in Commodity Futures held by the Master Fund in energy commodities, such as crude oil, heating oil and natural gas, are subject to risks due to frequent and often substantial fluctuations in energy commodity prices. In the past, the prices of natural gas and crude oil have been extremely volatile, and the Managing Owner expects this volatility to continue. The markets and prices for energy commodities are affected by many factors. Some of those factors include, but are not limited to:
| • | Changes in global supply and demand for oil and natural gas. |
| • | The price and quantity of imports and exports of oil and natural gas. |
| • | Political conditions, including embargoes and war, in or affecting other oil producing activities. |
| • | The level of global oil and natural gas exploration and production. |
| • | The level of global oil and natural gas inventories, production or pricing. |
| • | Weather conditions. |
| • | Technological advances effecting energy consumption. |
| • | The price and availability of alternative fuels. |
None of these factors can be controlled by the Managing Owner or Sub-Adviser. Even if current and correct information as to substantially all factors are known or thought to be known, prices still will not always react as predicted. The profitability of the Fund and the Master Fund will depend on whether the Master Fund’s Portfolio increases in value over time. If the value increases, the Fund will only be profitable if such increases exceed the fees and expenses of the Funds. If these values do not increase, the Fund will not be profitable and will incur losses.
Net Asset Value may not always correspond to the market price of the Shares.
The Net Asset Value will change as fluctuations occur in the market value of the Master Fund’s Portfolio. Investors should be aware that the public trading price of a Basket of Shares may be different from the Net Asset
20
Table of Contents
Value per Basket of Shares (i.e., Shares may trade at a premium over, or a discount to, the Net Asset Value per Basket of Shares) and similarly the public trading market price per Share may be different from the Net Asset Value per Share. Consequently, an Authorized Participant may be able to create or redeem a Basket of Shares at a discount or a premium to Net Asset Value. This price difference may be due, in large part, to the fact that supply and demand forces are at work in the secondary trading market for Shares that is closely related to, but not identical to, the same forces influencing the prices of the Index Commodities trading individually or in the aggregate at any point in time. Investors also should note that the size of the Fund in terms of total assets held may change substantially over time and from time to time as Baskets are created and redeemed.
Authorized Participants or their clients or customers may have an opportunity to realize a profit if they can purchase a Basket at a discount to the public trading price of the Shares or can redeem a Basket at a premium over the public trading price of the Shares. The Managing Owner expects that the exploitation of such arbitrage opportunities by Authorized Participants and their clients and customers will tend to cause the public trading price to not materially differ from the Net Asset Value per Share over time.
If the Fund issues all of its registered Shares, it could have to cease creating new Baskets until additional shares are registered for sale.
Investors should be aware that if the Fund issues all of its registered Shares, it could have to cease creating new Baskets until additional shares are registered for sale. This could increase the possibility that the trading price of the Fund’s Shares may not accurately reflect the Index or the Net Asset Value of the Fund. As of December 31, 2019, there were 60,950,000 Shares available for issuance.
Moreover, soon after new Baskets are created and sold, there is a possibility that the availability of newly created Shares may (or may not) affect the trading price of the Shares already issued, and both current Shareholders and purchasers of newly created Shares could be adversely affected by falling trading prices.
The License Agreement between the Index Sponsor and the Managing Owner could terminate.
The Index Sponsor entered into a license agreement with the Managing Owner whereby the Managing Owner was granted an exclusive license with respect to the development and creation of certain investment products, including U.S. exchange traded funds. The current license granted to the Managing Owner has a term ending December 31, 2020, which will automatically renew for an additional two years and will renew for successive two year terms thereafter. The term may be terminated under certain circumstances which could cause an investment in the Shares to decline significantly in value. In addition, a different product could be created under the license agreement, which could also cause an investment in the Shares to decline in value. If the license expires and is not renewed or is terminated, or a competitive product is created, then the Managing Owner may seek Shareholder approval to the extent required to either (i) liquidate the Funds or (ii) approve a different index for the Master Fund to track.
The Index Sponsor could change the Index or experience system failures.
The Index Sponsor has the right to make adjustments to the Index without regard to the particular interests of the Funds or the Shareholders. In addition, if the computers or other facilities of the Index Sponsor or any Index calculation agent, data providers and/or relevant stock exchange malfunction for any reason, calculation and dissemination of Index values may be delayed and trading in the Shares may be suspended for a period of time. Errors in Index data, Index computations and/or the construction of the Index may occur from time to time and may not be identified and/or corrected by the Index Sponsor for a period of time or at all, which may have an adverse impact on the Fund and the Shareholders. Any of the foregoing may lead to the errors in the Index, which may lead to a different investment outcome than would have been the case had such events not occurred. The Managing Owner, through the Sub-Adviser, seeks to manage the Funds to correspond to the Index provided by the Index Sponsor. Consequently, losses or costs associated with the Index’s errors or other risks described
21
Table of Contents
above will generally be borne by the Funds and the Shareholders and neither the Managing Owner nor its affiliates or agents make any representations or warranties regarding the foregoing.
Regulatory and exchange position limits and other rules may restrict the creation of Baskets and the operation of the Master Fund.
CFTC and commodity exchange rules impose speculative position limits on market participants, including the Master Fund, trading in certain agricultural commodities. These position limits prohibit any person from holding a position of more than a specific number of such futures contracts. The Managing Owner anticipates that these position limits as well as accountability limits currently in place on exchanges will impact the Master Fund when the Net Asset Value approaches $1.2 billion, at which point the Managing Owner may either prevent the creation of additional Baskets or apply to the CFTC for relief from certain position limits.
If the Master Fund applies and is unable to obtain such relief, the Fund’s ability to issue new Baskets, or the Master Fund’s ability to reinvest income in additional Commodity Futures, may be limited to the extent these activities would cause the Master Fund to exceed applicable position limits. Limiting the size of the Fund may result in Shares trading at a premium or discount to the Net Asset Value.
The Fund may not always be able exactly to replicate the performance of the Index.
It is possible that the Fund may not fully replicate the performance of the Index due to disruptions in the markets for the Index Commodities or due to other extraordinary circumstances, including, without limitation, the inability to create additional Baskets. In addition, the Fund is not able to replicate exactly the performance of the Index because the total return generated by the Master Fund is reduced by expenses and transaction costs, including those incurred in connection with the Master Fund’s trading activities, and increased by interest income from the Master Fund’s holdings of U.S. Treasuries. Tracking the Index requires rebalancing of the Master Fund’s Portfolio and is dependent upon the skills of the Sub-Adviser and its trading principals, among other factors.
The Managing Owner may permit the Master Fund to control commodity positions in excess of the value of the Master Fund’s assets.
Commodity pools’ trading positions in Commodity Futures or other commodity interests are typically required to be secured by the deposit of margin funds that represent only a small percentage of a Commodity Future’s (or other commodity interests’) entire market value. This feature permits commodity pools to increase their exposure to assets by purchasing or selling Commodity Futures (or other commodity interests) with an aggregate value in excess of the commodity pool’s assets. While these actions can increase the pool’s profits, relatively small adverse movements in the price of the pool’s Commodity Futures can cause significant or complete losses to the pool. While the Sub-Adviser is not expected to have exposure to Commodity Futures in excess of the Master Fund’s collateral, the Funds are dependent upon the trading and management skills of the Sub-Adviser to maintain the proper position sizes.
The Master Fund is not actively managed and will track the Index during periods in which the Index is flat or declining as well as when the Index is rising.
The Master Fund is not actively managed by traditional methods. Therefore, if positions in any one or more of the Index Commodities are declining in value, the Master Fund will not close out such positions, except in connection with a change in the composition or weighting of the Index. The Sub-Adviser will seek to cause the Net Asset Value to track the Index during periods in which the Index is flat or declining as well as when the Index is rising.
22
Table of Contents
The NYSE Arca may halt trading in the Shares.
The Shares are listed for trading on NYSE Arca under the market symbol “GCC.” Trading in Shares may be halted due to market conditions or, in light of NYSE Arca rules and procedures, for reasons that, in the view of NYSE Arca, make trading in Shares inadvisable. In addition, trading is subject to trading halts caused by extraordinary market volatility pursuant to “circuit breaker” rules that require trading to be halted for a specified period based on a specified market decline in the equity markets. There can be no assurance that the requirements necessary to maintain the listing of the Shares will continue to be met or will remain unchanged. The Funds will be terminated if the Shares are delisted.
There can be no guarantee that an active trading market for the Shares will be maintained.
Although the Shares are listed and traded on the NYSE Arca, there can be no guarantee that an active trading market for the Shares will be maintained. Investors that are successful in trading their Shares at a time when no active market exists will likely receive a lower price than the price received if an active market did exist.
The Funds and their service providers are subject to cyber security risks.
The Funds and their service providers may be susceptible to operational and information security risks resulting from a breach in cyber security, including cyber-attacks. A breach in cyber security, intentional or unintentional, may adversely impact the Funds in many ways, including, but not limited to, disruption of the Funds’ operational capacity, loss of proprietary information, theft or corruption of data maintained online or digitally, denial-of-service attacks on websites or network resources, and the unauthorized release of confidential information. Cyber-attacks affecting the Funds’ third-party service providers, including the Managing Owner, Sub-Adviser, Administrator, Distributor, Commodity Broker and other parties, may subject the Funds to many of the same risks associated with direct cyber security breaches and adversely impact the Funds. For instance, cyber-attacks may impact the Funds’ ability to calculate Net Asset Value, cause the release of confidential business information, impede trading, cause the Funds to incur additional compliance costs associated with corrective measures, subject the Funds to regulatory fines or other financial losses, and/or cause reputational damage to the Funds. Cyber security breaches of market makers, Authorized Participants, or the issuers of Commodity Futures in which the Funds invest could also have material adverse consequences on the Funds’ business operations and cause financial losses for the Funds and the Shareholders. While the Funds and their service providers have established business continuity plans and risk management systems designed to address cyber security risks, prevent cyber-attacks and mitigate the impact of cyber security breaches, there are inherent limitations on such plans and systems. In addition, the Funds have no control over the cyber security protections put in place by their service providers or any other third parties whose operations may affect the Funds or the Shareholders.
The Funds and their service providers are subject to certain operational risks.
The Funds and their service providers, including the Managing Owner, Sub-Adviser, Administrator, Distributor, and Commodity Broker, may experience disruptions that arise from human error, processing and communications errors, counterparty or third-party errors, or technology or systems failures, any of which may have an adverse impact on the Funds. Although the Funds and their service providers seek to mitigate these operational risks through their internal controls and operational risk management processes, these measures may not identify or may be inadequate to address all such risks.
The Shares are a relatively new securities product.
The mechanisms and procedures governing the creation, redemption and offering of the Shares are recently developed securities products. Consequently, there may be unanticipated problems or issues with respect to the mechanics of the operations and the trading of the Shares that could have a material adverse effect on an
23
Table of Contents
investment in the Shares. In addition, although the Master Fund is not actively “managed” by traditional methods, unanticipated operational or trading problems or issues may not be solvable by the Managing Owner or Sub-Adviser.
Investors should not rely on past performance in deciding whether to buy Shares.
The Funds’ and the Index’s performance history is not necessarily indicative of future results. Therefore, investors should not rely upon the past performance of the Funds or the Index in deciding whether to buy Shares in the Fund. Further, the past performance of the Funds through December 31, 2015, is a reflection of the performance associated with the prior principals of the Managing Owner (who are now principals of the Sub-Adviser) and new principals were installed as a result of the change in ownership of the Managing Owner. Such changes may impact future performance.
Commodity Futures are subject to a high degree of price volatility.
Commodity Futures are subject to a high degree of price variability and therefore may experience rapid and substantial changes in price. These changes cannot be accurately predicted, and could materially and adversely affect the value of the Master Fund’s Portfolio and the Shares.
Fees are charged regardless of profitability.
The Funds are subject to the fees and expenses described in this Annual Report, which are payable irrespective of profitability. Such fees and expenses include asset-based fees of up to 0.85% per annum (which is currently 0.75% per annum after the Managing Owner voluntarily agreed to waive a portion of its Management Fee in the amount of 0.10% per annum) payable to the Manager Owner and brokerage commissions on trading activity equal to approximately 0.02% per annum based on the Funds’ average Net Asset Value and transaction activity for the fiscal year ended December 31, 2019. The Managing Owner assumes all other routine operational, administrative and other ordinary expenses of the Funds, and will not be reimbursed for any such expenses. The Fund is expected to earn interest income at an annual rate of 1.55% per annum, based upon the yield on a three month U.S. Treasury bill as of December 31, 2019. Consequently, interest income exceeded the fees and costs incurred by the Funds for the year ended December 31, 2019, however there can be no assurance that this trend will continue. The expenses of the Funds could, over time, increase or the interest income of the Fund could, over time, decrease and the Fund may need to have positive performance in order to break-even (net of fees and expenses). If expenses increase or interest income decreases, these changes could result in significant losses to an investment in the Shares and a Shareholder may never achieve profits, significant or otherwise.
Possible illiquid markets may exacerbate losses.
Futures positions cannot always be liquidated at the desired price. It is difficult to execute a trade at a specific price when there is a relatively small volume of buy and sell orders in a market. A market disruption, such as when foreign governments may take or be subject to political actions which disrupt the markets in their currency or major exports, can also make it difficult to liquidate a position. Such periods of illiquidity and the events that trigger them are difficult to predict and there can be no assurance that the Managing Owner or Sub-Adviser will be able to do so.
There can be no assurance that market illiquidity will not cause losses for the Fund. The large size of the positions which the Master Fund may acquire on behalf of the Fund increases the risk of illiquidity by both making its positions more difficult to liquidate and increasing the losses incurred while trying to do so.
Redemption orders may be postponed, suspended or rejected under certain circumstances.
The Managing Owner may suspend the right of redemption or postpone the redemption settlement date (1) for any period during which an emergency exists as a result of which the redemption distribution is not reasonably
24
Table of Contents
practicable, or (2) for such other period as the Managing Owner determines to be necessary for the protection of the Shareholders. In addition, the Administrator will reject a redemption order if the order is not in proper form as described in the Participant Agreement or if the fulfillment of the order, in the opinion of its counsel, might be unlawful. Any such postponement, suspension or rejection could adversely affect the redemption of a Basket. For example, the resulting delay may adversely affect the value of the Authorized Participant’s redemption proceeds if the Net Asset Value of the Fund declines during the period of the delay. The Funds, the Administrator, the Managing Owner and the Sub-Adviser disclaim any liability for any loss or damage that may result from any such suspension or postponement.
The positive performance of the Master Fund’s Portfolio is wholly dependent upon an equal and offsetting loss borne by unrelated participants in the futures markets.
Futures trading is a risk transfer economic activity. For every gain there is an equal and offsetting loss rather than an opportunity to participate over time in general economic growth. Unlike most alternative investments, an investment in Shares does not involve acquiring any asset with intrinsic value. Overall stock and bond prices could rise significantly and the economy as a whole prosper while the Shares may trade unprofitably.
Shareholders will not have the protections associated with ownership of shares in an investment company registered under the Investment Company Act of 1940.
Neither the Fund nor the Master Fund is registered as an investment company under the Investment Company Act of 1940 and is not required to register under such act. Consequently, Shareholders will not have the regulatory protections provided to investors in investment companies.
Various actual and potential conflicts of interest may be detrimental to Shareholders.
The Funds are subject to actual and potential conflicts of interest involving the Managing Owner, Sub-Adviser, various commodity futures brokers and Authorized Participants. The Managing Owner, the Sub-Adviser and their respective principals, all of which are engaged in other investment or related activities, are not required to devote substantially all of their time to the business of the Funds, which also presents the potential for numerous conflicts of interest with the Funds. As a result of these and other relationships, parties involved with the Funds have a financial incentive to act in a manner other than in the best interests of the Funds and the Shareholders. Investors will be dependent on the good faith of the respective parties subject to such conflicts to resolve them equitably. Although the respective parties attempt to monitor these conflicts, it is extremely difficult, if not impossible, for such parties to ensure that these conflicts do not, in fact, result in adverse consequences to the Shareholders.
In addition, the Fund may be subject to certain conflicts with respect to its Commodity Broker, including, but not limited to, conflicts that result from receiving greater amounts of compensation from other clients, and purchasing opposite or competing positions on behalf of third-party accounts traded through the Commodity Broker.
The Fund’s tax treatment depends on its status as a partnership for federal income tax purposes, as well as not being subject to a material amount of entity-level taxation by individual states. If the Internal Revenue Service (“IRS”) were to treat the Fund as a corporation for federal income tax purposes or the Fund becomes subject to material additional amounts of entity-level taxation for state tax purposes, then the amount of cash available for distribution would be substantially reduced.
The anticipated after-tax economic benefit of an investment in the Shares depends largely on the Funds being treated as partnerships for federal income tax purposes. No ruling from the IRS on this or any other tax matter affecting the Funds has been requested.
25
Table of Contents
It is possible in certain circumstances an entity that would otherwise be classified as a partnership for U.S. federal income tax purposes, such as the Fund, to be treated as an association or a publicly traded partnership (that does not satisfy the exception set forth in Code Section 7704(c)) taxable as a corporation for U.S. federal income tax purposes. Although the Fund is not believed to be so treated based upon current operations, a change in the Fund’s business or a change in current law could cause the Fund to be treated as a corporation for federal income tax purposes or otherwise subject to taxation as an entity.
If the Fund was treated as a corporation for federal income tax purposes, it would pay federal income tax on taxable income at the corporate tax rate, and would likely pay state and local income tax at varying rates. Distributions would generally be taxed again as corporate dividends (to the extent of the Fund’s current and accumulated earnings and profits), and no income, gains, losses, deductions or credits would flow through to the Shareholders. Because a tax would be imposed upon the Fund as a corporation, the amount of cash available for distribution would be substantially reduced. Therefore, if the Fund was treated as a corporation for federal income tax purposes, there would be a material reduction in the anticipated cash flow and after-tax return to the Shareholders, likely causing a substantial reduction in the value of the Shares.
At the state level, several states are evaluating ways to subject partnerships to entity-level taxation through the imposition of state income, franchise and other forms of taxation. Imposition of such a tax on the Fund by any state will reduce the cash available for distributions to the Shareholders.
Recently enacted U.S. tax legislation, as well as potential legislative, judicial or administrative changes or differing interpretations, may have an adverse impact on the Fund and Shareholders.
On December 22, 2017, Public Law No. 115-97, informally titled the Tax Cuts and Jobs Act (the “Tax Act”), was enacted. The Tax Act significantly changed the U.S. Internal Revenue Code of 1986, as amended (the “Code”), including by (i) introducing a new deduction on certain pass-through income, (ii) repealing the partnership technical termination rule, and (iii) imposing a new limitation on the deductibility of interest expense.
The Tax Act became fully effective in the 2018 fiscal year. The Tax Act is complex and its ultimate impact may differ from this description due to changes in interpretations, as well as additional regulatory guidance that may be issued. Apart from enactment of the Tax Act, tax laws and interpretations thereof are subject to change, possibly on a retroactive basis, and other legislative proposals or administrative or judicial developments could also result in an increase in the amount of U.S. tax payable by the Fund or by Shareholders.
Shareholders will be subject to taxation on their share of the Fund’s taxable income, whether or not they receive cash distributions.
Shareholders will be subject to U.S. federal income taxation and, in some cases, state, local, or foreign income taxation on their share of the Fund’s taxable income, whether or not they receive cash distributions from the Fund. Shareholders may not receive cash distributions equal to their share of the Fund’s taxable income or even the tax liability that results from such income.
Items of income, gain, deduction, loss and credit with respect to the Shares could be reallocated if the IRS does not accept the assumptions or conventions used by the Funds in allocating either Fund’s tax items.
U.S. federal income tax rules applicable to partnerships are complex and often difficult to apply to publicly traded partnerships. The Funds will apply certain assumptions and conventions in an attempt to comply with applicable rules and to report income, gain, deduction, loss and credit to the Shareholders in a manner that reflects the Shareholders’ beneficial shares of partnership items, but these assumptions and conventions may not be in compliance with all aspects of applicable tax requirements. It is possible that the IRS will successfully assert that the conventions and assumptions used by the Funds do not satisfy the requirements of the Code, and/or the Treasury Regulations promulgated thereunder and could require that items of income, gain, deduction, loss or credit be adjusted or reallocated in a manner that adversely affects Shareholders.
26
Table of Contents
If the IRS contests the U.S. federal income tax positions the Fund takes, the market for the Shares may be adversely impacted and the cost of any IRS contest will reduce the amount of cash available for distribution to the Shareholders.
No ruling from the IRS with respect to the Fund’s treatment as a partnership for U.S. federal income tax purposes or any other matter has been requested. The IRS may adopt positions that differ from the positions the Fund takes, and the IRS’s positions may ultimately be sustained. It may be necessary to resort to administrative or court proceedings to sustain some or all of the positions the Fund takes. A court may not agree with some or all of the positions the Fund takes. Any contest with the IRS, and the outcome of any IRS contest, may have a materially adverse impact on the market for the Shares and the price at which they trade. In addition, the costs of any contest with the IRS will be borne indirectly by the Shareholders because the costs will reduce the amount of cash available for distribution.
Tax gain or loss on the disposition of Shares could be more or less than expected.
If Shareholders sell Shares, they will recognize a gain or loss for federal income tax purposes equal to the difference between the amount realized and their tax basis in those Shares. Because distributions in excess of their allocable share of net taxable income decrease their tax basis in their Shares, the amount, if any, of such prior excess distributions with respect to the Shares a Shareholder sells will, in effect, become taxable income to the Shareholder if it sells such Shares at a price greater than its tax basis in those Shares, even if the price received is less than its original cost. In addition, because the amount realized includes a Shareholder’s share of nonrecourse liabilities, a Shareholder that sells common units may incur a tax liability in excess of the amount of cash received from the sale.
New rules regarding U.S. federal income tax liability arising from IRS audits could adversely affect Shareholders.
If the IRS makes audit adjustments to the Funds’ income tax returns, the IRS (and some states) may assess and collect any taxes (including any applicable penalties and interest) resulting from such audit adjustments directly from the Fund. To the extent possible under the new rules, the Managing Owner may elect to either pay the taxes (including any applicable penalties and interest) directly to the IRS or, if the Fund is eligible, issue a revised information statement to each Shareholder and former Shareholder with respect to an audited and adjusted return. Although the Managing Owner may elect to have Shareholders and former Shareholders take such audit adjustment into account and pay any resulting taxes (including applicable penalties or interest) in accordance with their interests in the Fund during the tax year under audit, there can be no assurance that such election will be practical, permissible or effective in all circumstances. As a result, current Shareholders may bear some or all of the tax liability resulting from such audit adjustment, even if such Shareholders did not own Shares during the tax year under audit. If, as a result of any such audit adjustment, the Fund is required to make payments of taxes, penalties and interest, the amount of cash available for distribution to Shareholders might be reduced.
Tax-exempt entities face unique tax issues from owning Shares that may result in adverse tax consequences to them.
Investment in the Shares by tax-exempt entities, such as employee benefit plans and individual retirement accounts (known as IRAs) raises issues unique to them. For example, some or all of the Fund’s income allocated to organizations that are exempt from U.S. federal income tax, including IRAs and other retirement plans, may be unrelated business taxable income that is taxable to them. Tax-exempt entities should consult a tax advisor before investing in the Shares.
Non-U.S. Shareholders may be subject to U.S. taxes and withholding with respect to their income and gain from owning Shares.
Non-U.S. Shareholders are generally required to file U.S. income tax returns and pay tax on income effectively connected with a U.S. trade or business. Income allocated to Shareholders and any gain from the sale of Shares
27
Table of Contents
may be considered to be effectively connected income. As a result, distributions to a Non-U.S. Shareholder may be subject to withholding at the highest applicable effective tax rate and a Non-U.S. Shareholder who sells or otherwise disposes of a Share may also be subject to U.S. federal income tax on the gain realized from the sale or disposition of that Share.
The Tax Act imposes a withholding obligation of 10% of the amount realized upon a Non-U.S. Shareholder’s sale or exchange of an interest in a partnership that is engaged in a U.S. trade or business. However, due to challenges of administering a withholding obligation applicable to open market trading and other complications, the IRS has temporarily suspended the application of this withholding rule to open market transfers of interests in publicly traded partnerships pending promulgation of regulations or other guidance. The Fund believes that it is a publicly traded partnership for purposes of these rules and is eligible for the temporary suspension of these withholding provisions. It is not clear if or when such regulations or other guidance will be issued.
PROSPECTIVE INVESTORS ARE STRONGLY URGED TO CONSULT THEIR OWN TAX ADVISERS AND COUNSEL WITH RESPECT TO THE POSSIBLE TAX CONSEQUENCES TO THEM OF AN INVESTMENT IN ANY SHARES; SUCH TAX CONSEQUENCES MAY DIFFER IN RESPECT OF DIFFERENT INVESTORS.
Failure of lack of segregation of assets may increase losses.
The Commodity Exchange Act requires a clearing broker to segregate all funds received from customers from such broker’s proprietary assets. If a Commodity Broker fails to do so, the assets of the Master Fund might not be fully protected in the event of the Commodity Broker’s bankruptcy. Furthermore, in the event of a Commodity Broker’s bankruptcy, any Master Fund Units could be limited to recovering only a pro rata share of all available funds segregated on behalf of the Commodity Broker’s combined customer accounts, even though certain property specifically traceable to the Master Fund was held by the Commodity Broker. In addition, it is possible that in the event of a clearing broker’s bankruptcy, investors could experience a loss of all of their funds and assets held by the clearing broker.
In the event of a bankruptcy or insolvency of any exchange or clearing house, the Master Fund could experience a loss of the funds deposited through its Commodity Broker as margin with the exchange or clearing house, a loss of any unrealized profits on its open positions on the exchange, and the loss of realized profits on its closed positions on the exchange.
Regulatory changes or actions may alter the nature of an investment in the Fund.
Considerable regulatory attention has been focused on non-traditional investment pools which are publicly distributed in the U.S.. There is a possibility of future regulatory changes altering, perhaps to a material extent, the nature of an investment in the Fund or the ability of the Fund to continue to implement its investment strategy.
The futures markets are subject to comprehensive statutes, regulations and margin requirements. In addition, the CFTC and the exchanges are authorized to take extraordinary actions in the event of a market emergency, including, for example, the retroactive implementation of speculative position limits or higher margin requirements, the establishment of daily price limits and the suspension of trading. The regulation of futures transactions in the U.S. is a rapidly changing area of law and is subject to modification by government and judicial action. The effect of any future regulatory change on the Fund is impossible to predict, but could be substantial and adverse.
Termination of the Fund may adversely affect a Shareholder’s portfolio.
The Managing Owner may withdraw from the Fund upon one hundred and twenty (120) days’ notice, which would cause the Fund to terminate unless a substitute managing owner is identified and instituted. Shareholders
28
Table of Contents
cannot be assured that the Managing Owner will be willing or able to continue to service the Funds for any length of time. In addition, owners of seventy-five percent (75%) of the Shares have the power to terminate the Fund. If the Managing Owner discontinues its activities on behalf of the Funds, or the Shareholders terminate the Fund, an investment in the Shares could be adversely affected.
Shareholders do not have the rights enjoyed by investors in certain other vehicles.
As interests in an investment trust, the Shares have none of the statutory rights normally associated with the ownership of common stock of a corporation (including, for example, the right to bring “oppression” or “derivative” actions). In addition, the Shares have limited voting and distribution rights (for example, Shareholders do not have the right to elect directors and the Fund is not required to pay regular dividends, although the Fund may pay dividends at the discretion of the Managing Owner).
An investment in the Shares may be adversely affected by competition from other methods of investing in commodities.
The Funds compete with other financial vehicles, including other commodity pools, hedge funds, traditional debt and equity securities issued by companies in the commodities industry, other securities backed by or linked to such commodities, and direct investments in the underlying commodities or commodity futures contracts. Market and financial conditions, and other conditions that are beyond the Managing Owner’s control, may make it more attractive to invest in other financial vehicles or to invest in such commodities directly, which could limit the market for the Shares and reduce the liquidity of the Shares.
Competing claims over ownership of intellectual property rights related to the Funds could adversely affect the Funds and an investment in the Shares.
Third parties may allege or assert ownership of intellectual property rights which may be related to the design, structure and operations of the Funds. To the extent any claims of such ownership are brought or any proceedings are instituted to assert such claims, the negotiation, litigation or settlement of such claims, or the ultimate disposition of such claims in a court of law if a suit is brought, may adversely affect the Funds and an investment in the Shares.
The prices of Index Commodities may experience “Backwardation” or “Contango.”
As the Master Fund’s futures contracts near expiration, they are replaced by contracts that have a later expiration. Thus, for example, a contract purchased and held in April 2020 may specify a June 2020 expiration. As that contract nears expiration, it may be replaced by selling the June 2020 contract and purchasing the contract expiring in August 2020. This process is referred to as “rolling.” Historically, the prices of crude oil and heating oil have frequently been higher for contracts with shorter-term expirations than for contracts with longer-term expirations, which is referred to as “backwardation.” In these circumstances, absent other factors, the sale of the June 2020 contract would take place at a price that is higher than the price at which the August 2020 contract is purchased, thereby creating a gain in connection with rolling. While crude oil and heating oil have historically exhibited consistent periods of backwardation, backwardation will likely not exist in these markets at all times. The absence of backwardation in crude oil and heating oil could adversely affect the value of the Index and the Shares.
Conversely, gold, corn, soybeans and wheat historically exhibit “contango” markets rather than backwardation. Contango markets are those in which the prices of contracts are higher in the distant delivery months than in the nearer delivery months due to the costs of long-term storage of a physical commodity prior to delivery or other factors. Although gold, corn, soybeans and wheat have historically exhibited consistent periods of contango, contango will likely not exist in these markets at all times. The persistence of contango in gold, corn, soybeans and wheat could adversely affect the value of the Index and the Shares.
29
Table of Contents
The Funds may be required to indemnify the Trustee or the Managing Owner.
Under the Trust Agreements, the Trustee and the Managing Owner have the right to be indemnified for any liability or expense they incur without negligence or misconduct. Accordingly, the Managing Owner may require the assets of the Funds to be sold in order to cover losses or liability suffered by it or by the Trustee. Any such sale would reduce the Net Asset Value and the value of the Shares.
The Funds are subject to extensive regulatory reporting and compliance.
The Funds are subject to changing regulation of corporate governance and public disclosure that could increase the Funds’ costs and risk of noncompliance.
Because the Shares are publicly traded, the Funds are subject to certain rules and regulations of federal, state and financial market exchange entities charged with the protection of investors and the oversight of companies whose securities are publicly traded. These entities, including the Public Company Accounting Oversight Board, the SEC and NYSE Arca, have in recent years issued new requirements and regulations, most notably the Sarbanes-Oxley Act of 2002. From time to time, since the adoption of the Sarbanes-Oxley Act of 2002, these authorities have continued to develop additional regulations or interpretations of existing regulations. The Funds’ ongoing efforts to comply with these regulations and interpretations have resulted in, and are likely to continue resulting in, increased general and administrative expenses and diversion of management time and attention from revenue-generating activities to compliance activities.
The Funds are responsible for establishing and maintaining adequate internal control over financial reporting. The Funds’ internal control system is designed to provide reasonable assurance to its management regarding the preparation and fair presentation of published financial statements. All internal control systems, no matter how well designed, have inherent limitations. Therefore, even those systems determined to be effective can provide only reasonable assurance with respect to financial statement preparation and presentation.
The Funds have assessed the effectiveness of their internal control over financial reporting as of December 31, 2019. Based on its assessment, the Funds believes that, as of December 31, 2019, their internal control over financial reporting is effective.
The Net Asset Value calculation may be overstated or understated due to the valuation method employed when a settlement price is not available on the date of such calculation.
Calculating the Net Asset Value includes, in part, any unrealized profits or losses on open Commodity Futures. Under normal circumstances, the Net Asset Value reflects the settlement price of open Commodity Futures on the date when the Net Asset Value is being calculated. However, if a Commodity Futures traded on an exchange (both U.S. and non-U.S. exchanges) could not be liquidated on such day (due to the operation of daily limits or other rules of the exchange upon which that position is traded or otherwise), the settlement price on the most recent day on which the position could have been liquidated shall be the basis for determining the market value of such position for such day. In such a situation, there is a risk that the calculation of the Net Asset Value on such day will not accurately reflect the realizable market value of such Commodity Futures. For example, daily limits are generally triggered in the event of a significant change in market price of a Commodity Future. Therefore, as a result of the daily limit, the current settlement price is unavailable. Because the settlement price on the most recent day on which the position could have been liquidated would be used in lieu of the actual settlement price on the date of determination, there is a risk that the resulting calculation of the Net Asset Value could be understated or overstated, perhaps to a significant degree.
| Item 1B. | Unresolved Staff Comments. |
None.
30
Table of Contents
Table of Contents
| Item 5. | Market for Registrant’s Common Equity, Related Stockholder Matters and Issuer Purchases of Equity Securities. |
Market Information
The Shares began trading on the American Stock Exchange on January 24, 2008 and have been traded on the NYSE Arca since November 25, 2008.
Shares Outstanding
As of December 31, 2019, the Fund had 6,800,000 of its Limited Shares outstanding.
As of December 31, 2018, the Fund had 8,850,000 of its Limited Shares outstanding.
Holders
As of December 31, 2019, there were approximately 6,984 Shareholders.
Sales and Redemptions
There have been no unregistered sales of the Fund’s securities. No Fund securities are authorized for issuance by the Fund under equity compensation plans.
The Fund currently has on file a Registration Statement on Form S-3 (Registration No.: 333-233919), which was declared effective by the SEC on October 22, 2019, pursuant to which the Fund registered 61,000,000 Shares (the “Registration Statement”). The Fund filed a prospectus under Rule 424b of the Exchange Act on October 25, 2019 to update certain information contained in the Registration Statement. As of December 31, 2019 there were 60,950,000 Shares available for issuance under this Registration Statement.
The proceeds from the sale of the Shares are used to purchase Master Fund Limited Units. The Master Fund uses the proceeds from the sale of the Master Fund Limited Units for general corporate purposes in accordance with its investment objectives and policies.
During the year ended December 31, 2019, 1,050,000 Limited Shares were created for $18,530,911 and 3,100,000 Limited Shares were redeemed for $55,131,710. For the three months ended December 31, 2019, 450,000 Limited Shares were created for $8,021,089 and 150,000 Limited Shares were redeemed for $2,650,329. On December 31, 2019, 6,800,000 Limited Shares of the Fund were outstanding for a market capitalization of $127,772,000 based on the December 31, 2019 closing price of $18.79 on the NYSE Arca.
During the year ended December 31, 2018, 2,750,000 Limited Shares were created for $51,769,691 and 1,950,000 Limited Shares were redeemed for $35,928,021. For the three months ended December 31, 2018, 500,000 Limited Shares were created for $8,748,821 and 450,000 Limited Shares were redeemed for $8,215,748. On December 31, 2018, 8,850,000 Limited Shares of the Fund were outstanding for a market capitalization of $155,317,500 based on the December 31, 2018 closing price of $17.55 on the NYSE Arca.
32
Table of Contents
The following table shows the number of Shares redeemed (purchased back by the Fund, or “Issuer”) from Authorized Participants for each month during the quarter ended December 31, 2019:
| Issuer Purchases of Equity Securities |
||||||||||||||||
| Period |
Total Number of Shares Redeemed |
Average Price Paid per Share |
Total Number of Shares Purchased as Part of Publicly Announced Plans or Programs |
Maximum Number (or Approximate Dollar Value) of Shares That May Yet Be Purchased Under the Plans or Programs |
||||||||||||
| October 1, 2019 to October 31, 2019 |
100,000 | $ | 17.55 | N/A | N/A | |||||||||||
| November 1, 2019 to November 30, 2019 |
— | N/A | N/A | N/A | ||||||||||||
| December 1, 2019 to December 31, 2019 |
50,000 | $ | 17.91 | N/A | N/A | |||||||||||
|
|
|
|
|
|
|
|
|
|||||||||
| Total |
150,000 | $ | 17.67 | N/A | N/A | |||||||||||
|
|
|
|
|
|
|
|
|
|||||||||
| Item 6. | Selected Financial Data. |
|
FINANCIAL HIGHLIGHTS (FOR THE YEARS ENDED DECEMBER 31, 2019, 2018, 2017, 2016, AND 2015)
|
||||||||||||||||||||
| Year Ended December 31, 2019 |
Year Ended December 31, 2018 |
Year Ended December 31, 2017 |
Year Ended December 31, 2016 |
Year Ended December 31, 2015 |
||||||||||||||||
| Revenues (interest income) |
$ | 2,753,909 | $ | 2,850,715 | $ | 1,356,236 | $ | 476,315 | $ | 45,979 | ||||||||||
| Total assets |
127,915,504 | 162,510,996 | 155,053,392 | 221,416,935 | 233,420,007 | |||||||||||||||
| Net realized and unrealized gain (loss) on investments and futures contracts |
7,833,724 | (17,526,575 | ) | (1,473,140 | ) | 10,687,283 | (49,361,047 | ) | ||||||||||||
| Net gain (loss) |
9,581,641 | (15,942,978 | ) | (1,452,058 | ) | 8,864,877 | (51,936,150 | ) | ||||||||||||
33
Table of Contents
The Fund is presenting the following Net Asset Value and financial highlights related to investment performance and operations for a Share outstanding for the years ended December 31, 2019, 2018, 2017, 2016, and 2015.
| 2019 | 2018 | 2017 | 2016 | 2015 | ||||||||||||||||
| Net Asset Value |
||||||||||||||||||||
| Net asset value per Limited Share, beginning of year |
$ | 17.50 | $ | 19.25 | $ | 19.35 | $ | 18.56 | $ | 22.81 | ||||||||||
| Investment operations: |
||||||||||||||||||||
| Net realized and unrealized gain (loss) |
1.07 | (1) | (1.93 | )(1) | (0.10 | )(1) | 0.95 | (4.04 | ) | |||||||||||
| Net investment income (loss)(2) |
0.23 | 0.18 | 0.00 | (3) | (0.16 | )(4) | (0.21 | )(4) | ||||||||||||
|
|
|
|
|
|
|
|
|
|
|
|||||||||||
| Net increase (decrease) in net assets from operations |
1.30 | (1.75 | ) | (0.10 | ) | 0.79 | (4.25 | ) | ||||||||||||
|
|
|
|
|
|
|
|
|
|
|
|||||||||||
| Net asset value per Limited Share, end of year |
$ | 18.80 | $ | 17.50 | $ | 19.25 | $ | 19.35 | $ | 18.56 | ||||||||||
|
|
|
|
|
|
|
|
|
|
|
|||||||||||
| Total Return, at net asset value |
7.43 | %(5) | (9.09 | )%(5) | (0.52 | )%(5) | 4.26 | % | (18.63 | )% | ||||||||||
| Ratios/Supplemental Data: |
| |||||||||||||||||||
| Net assets, end of year (000’s omitted) |
$ | 127,836 | $ | 154,855 | $ | 154,956 | $ | 219,661 | $ | 224,519 | ||||||||||
| Ratios to average net assets of: |
||||||||||||||||||||
| Net investment income (loss) |
1.30 | % | 0.94 | % | 0.01 | % | (0.83 | )%(6) | (1.03 | )%(6) | ||||||||||
|
|
|
|
|
|
|
|
|
|
|
|||||||||||
| Expense, prior to expense waivers |
0.85 | % | 0.85 | % | 0.85 | % | 1.05 | %(6) | 1.05 | %(6) | ||||||||||
|
|
|
|
|
|
|
|
|
|
|
|||||||||||
| Expenses, net of expense waivers |
0.75 | % | 0.75 | % | 0.75 | % | 1.05 | %(6) | 1.05 | %(6) | ||||||||||
|
|
|
|
|
|
|
|
|
|
|
|||||||||||
| (1) | Includes brokerage commissions of approximately $(0.02) per share for the years ended December 31, 2019, 2018 and 2017, respectively. |
| (2) | Based on average shares outstanding. |
| (3) | Amount represents less than $0.01 per share. |
| (4) | Includes brokerage commissions of approximately $(0.03) per share for the years ended December 31, 2016 and 2015, respectively. |
| (5) | For the years ended December 31, 2019, 2018 and 2017, in which the Managing Owner waived a portion of its Management Fee, the total return would have been lower if such expenses had not been waived. |
| (6) | Includes brokerage commissions of approximately 0.13% and 0.14% (as a percentage of average net assets) for the years ended December 31, 2016 and 2015, respectively. |
The Fund did not pay any cash dividends in the years ended December 31, 2019, 2018, 2017, 2016 and 2015.
| 2019 SELECTED QUARTERLY DATA (UNAUDITED) | ||||||||||||||||
| For the Three Months Ended March 31, 2019 |
For the Three Months Ended June 30, 2019 |
For the Three Months Ended September 30, 2019 |
For the Three Months Ended December 31, 2019 |
|||||||||||||
| Interest income |
$ | 876,181 | $ | 744,029 | $ | 627,458 | $ | 506,241 | ||||||||
| Net investment income |
581,686 | 491,305 | 399,209 | 275,717 | ||||||||||||
| Net realized and unrealized gain (loss) on investments and futures contracts |
4,601,401 | (2,057,225 | ) | (2,789,557 | ) | 8,079,105 | ||||||||||
| Net gain (loss) |
5,183,087 | (1,565,920 | ) | (2,390,348 | ) | 8,354,822 | ||||||||||
| Increase (decrease) in Net Asset Value |
(11,447,196 | ) | (14,012,622 | ) | (15,284,922 | ) | 13,725,582 | |||||||||
34
Table of Contents
| 2018 SELECTED QUARTERLY DATA (UNAUDITED) | ||||||||||||||||
| For the Three Months Ended March 31, 2018 |
For the Three Months Ended June 30, 2018 |
For the Three Months Ended September 30, 2018 |
For the Three Months Ended December 31, 2018 |
|||||||||||||
| Interest income |
$ | 537,926 | $ | 713,571 | $ | 779,412 | $ | 819,806 | ||||||||
| Net investment income |
220,741 | 374,556 | 463,232 | 525,068 | ||||||||||||
| Net realized and unrealized loss on investments and futures contracts |
(432,611 | ) | (4,028,591 | ) | (7,760,155 | ) | (5,305,218 | ) | ||||||||
| Net loss |
(211,870 | ) | (3,654,035 | ) | (7,296,923 | ) | (4,780,150 | ) | ||||||||
| Increase (decrease) in Net Asset Value |
25,981,982 | (8,405,126 | ) | (13,431,087 | ) | (4,247,077 | ) | |||||||||
| Item 7. | Management’s Discussion and Analysis of Financial Condition and Results of Operations. |
The following discussion should be read in conjunction with the Funds’ Financial Statements and the related Notes to the Funds’ Financial Statements included elsewhere in this Annual Report.
This Annual Report, including this “Management’s Discussion and Analysis of Financial Condition and Results of Operations,” contains forward-looking statements regarding the plans and objectives of management for future operations. This information may involve known and unknown risks, uncertainties and other factors that may cause the Funds’ actual results, performance or achievements to be materially different from future results, performance or achievements expressed or implied by any forward-looking statements. Forward-looking statements, which involve assumptions and describe the Funds’ future plans, strategies and expectations, are generally identifiable by use of the words “may,” “will,” “should,” “expect,” “anticipate,” “estimate,” “believe,” “intend” or “project,” the negative of these words, other variations on these words or comparable terminology. These forward-looking statements are based on assumptions that may be incorrect, and the Funds cannot assure investors that these projections included in these forward-looking statements will come to pass. The Funds’ actual results could differ materially from those expressed or implied by the forward-looking statements as a result of various factors.
The Funds have based the forward-looking statements included in this Annual Report on information available to it as close to the filing date of this Annual Report as reasonably practicable, and the Funds assume no obligation to update any such forward-looking statements except as required by the federal securities laws. Investors are advised to review any additional disclosures that the Funds may make directly to them or through reports that the Funds file in the future with the SEC, including Annual Reports on Form 10-K, Quarterly Reports on Form 10-Q and Current Reports on Form 8-K.
Introduction
As described in Part I above, the Fund and the Master Fund seek to track changes, whether positive or negative, in the level of the Index over time, plus the excess, if any, of the Master Fund’s interest income from its holdings of U.S. Treasuries. The Shares are designed for investors who want a cost-effective and convenient way to invest in an equal-weight portfolio of Commodity Futures.
The Fund pursues its investment objective by investing substantially all of its assets in the Master Fund. The Master Fund pursues its investment objective by investing in a Portfolio of Commodity Futures on the Index Commodities. Through January 6, 2013, the Index Commodities were wheat, corn, soybeans, live cattle, lean hogs, gold, silver, platinum, copper, cotton, coffee, cocoa, orange juice, sugar, crude oil, heating oil, and natural gas. Following the tenth revision on January 7, 2013, orange juice was removed and soybean oil was added at an equivalent allocation.
The Index is composed of notional amounts of each of the Index Commodities. The notional amounts of each Index Commodity included in the Index are in equal weight proportion to the Index Commodities or 1/17
35
Table of Contents
weighting per index commodity rebalanced daily. The Master Fund’s Portfolio also includes U.S. Treasuries for deposit with the Master Fund’s Commodity Broker. The Commodity Broker currently applies part of the total value of the cash and/or U.S. Treasuries on deposit towards satisfying any margin requirements related to the Commodity Futures in the Master Fund’s futures account. Thomson Reuters (Markets) LLC, formerly Thomson Reuters America LLC, is the owner, publisher and calculation agent of the Index. The Index Sponsor is not an affiliate of the Funds or the Managing Owner.
Under the Trust Agreements, Delaware Trust Company, the Trustee of the Funds, has delegated to the Managing Owner the exclusive management and control of all aspects of the business of the Funds. The Trustee has no duty or liability to supervise or monitor the performance of the Managing Owner, nor does the Trustee have any liability for the acts or omissions of the Managing Owner.
The Shares are intended to provide investment results that generally correspond to the changes, positive or negative, in the levels of the Index over time. The value of the Shares is expected to fluctuate in relation to changes in the value of the Master Fund’s Portfolio. The market price of the Shares may not be identical to the Net Asset Value per Share, but these two valuations are expected to be very close.
The Fund is listed on the NYSE Arca under the symbol “GCC.”
Management’s Discussion of Results of Operations
As of December 31, 2019, the net unrealized appreciation on futures contracts owned or held on that day was $6,162,155 and the Fund had total assets of $127,915,504. The ending Net Asset Value per Share on December 31, 2019 was $18.80.
As of December 31, 2018, the net unrealized depreciation on futures contracts owned or held on that day was $7,560,832 and the Fund had total assets of $162,510,996. The ending Net Asset Value per Share on December 31, 2018 was $17.50.
Portfolio Expenses
Prior to January 1, 2017, the Funds’ brokerage commissions and fees as well as routine operational, administrative and other ordinary expenses, including, but not limited to, the fees and expenses of the Trustee, legal and accounting fees and expenses, tax preparation expenses, filing fees, and printing, mailing and duplication costs, were accrued at a rate of 0.20% of the Net Asset Value per annum in the aggregate. Of the amounts so accrued, the Funds first paid brokerage commissions and fees, and secondly, from the remainder of the amounts so accrued, reimbursed the Managing Owner for the Funds’ routine operational, administrative and other ordinary expenses paid by the Managing Owner.
Effective January 1, 2017, the Managing Owner has voluntarily agreed to assume all routine operational, administrative and other ordinary expenses of the Funds, and will not be reimbursed for any such expenses. As a result, the Funds will no longer accrue for such expenses. In addition, effective January 1, 2017, the Master Fund will pay its brokerage commissions and fees directly. As a result, the Funds will no longer accrue for such commissions and fees as an expense accrual, but will be included as a component of Net Realized Gain (Loss) on the Consolidated Statements of Income and Expenses. Accordingly, effective January 1, 2017, the Fund’s expense accrual of 0.20% of the Fund’s Net Asset Value for (i) brokerage commissions and fees, and (ii) routine operational, administrative and other ordinary expenses, was eliminated.
Brokerage commissions were charged against the Fund’s assets on a per transaction basis. The brokerage commissions incurred for the years ended December 31, 2019, 2018, and 2017 were $142,775, $175,786 and $178,822, respectively.
36
Table of Contents
The Funds pay all of their respective extraordinary fees and expenses generally, if any, as determined by the Managing Owner. Extraordinary fees and expenses are likely to include non-recurring fees such as legal claims and liabilities, litigation costs and any permitted indemnification payments related thereto, if any; but the Managing Owner has discretion to treat other unanticipated expenses as extraordinary fees and expenses.
For the years ended December 31, 2019, 2018 and 2017, the Funds paid the Managing Owner, monthly in arrears, a net Management Fee equal to 0.75% of the average annual Net Asset Value after deducting a 0.10% per annum voluntary Management Fee waiver. For the years ended December 31, 2019, 2018 and 2017, the net Management Fee paid to the Managing Owner by the Funds was $1,005,992, $1,267,118 and $1,335,154, respectively, after deducting the voluntary Management Fee waiver of $134,132, $168,949 and $178,022, respectively.
Interest Income
The Fund does not borrow money in order to obtain leverage, therefore the Fund does not incur any interest expense. Rather, the Fund’s margin deposits are maintained in United States Treasury Obligations and short term investments that earn interest income. For the years ended December 31, 2019, 2018 and 2017, the Fund earned total interest income of $2,753,909, $2,850,715, and $1,356,236, respectively.
Fund Performance
The following table provides summary performance information for the Fund for the five years ended December 31, 2019.
37
Table of Contents
PAST PERFORMANCE IS NOT NECESSARILY INDICATIVE OF FUTURE RESULTS
5 Year Performance Summary
| Date |
Net Asset Value Per Share |
Total Shares | Net Assets | 1 Month | 3 Months | Year to Date | Cumulative Return Since Inception |
|||||||||||||||||||||
| 1/31/2015 |
$ | 21.83 | 11,600,050 | $ | 253,276,499 | -4.30 | % | -11.73 | % | -4.30 | % | -27.23 | % | |||||||||||||||
| 2/28/2015 |
$ | 22.21 | 11,400,050 | $ | 253,156,514 | 1.74 | % | -7.34 | % | -2.63 | % | -25.97 | % | |||||||||||||||
| 3/31/2015 |
$ | 21.20 | 11,500,050 | $ | 243,765,407 | -4.55 | % | -7.06 | % | -7.06 | % | -29.33 | % | |||||||||||||||
| 4/30/2015 |
$ | 21.90 | 11,450,050 | $ | 250,728,635 | 3.30 | % | 0.32 | % | -3.99 | % | -27.00 | % | |||||||||||||||
| 5/31/2015 |
$ | 21.51 | 11,550,050 | $ | 248,405,407 | -1.78 | % | -3.15 | % | -5.70 | % | -28.30 | % | |||||||||||||||
| 6/30/2015 |
$ | 22.08 | 12,650,050 | $ | 279,283,550 | 2.65 | % | 4.15 | % | -3.20 | % | -26.40 | % | |||||||||||||||
| 7/31/2015 |
$ | 20.14 | 12,350,050 | $ | 248,781,672 | -8.79 | % | -8.04 | % | -11.71 | % | -32.87 | % | |||||||||||||||
| 8/31/2015 |
$ | 19.89 | 12,250,050 | $ | 243,701,247 | -1.24 | % | -7.53 | % | -12.80 | % | -33.70 | % | |||||||||||||||
| 9/30/2015 |
$ | 19.48 | 12,350,050 | $ | 240,610,264 | -2.06 | % | -11.78 | % | -14.60 | % | -35.07 | % | |||||||||||||||
| 10/31/2015 |
$ | 19.80 | 12,450,050 | $ | 246,482,902 | 1.64 | % | -1.69 | % | -13.20 | % | -34.00 | % | |||||||||||||||
| 11/30/2015 |
$ | 18.65 | 12,600,050 | $ | 234,930,303 | -5.81 | % | -6.23 | % | -18.24 | % | -37.83 | % | |||||||||||||||
| 12/31/2015 |
$ | 18.56 | 12,100,050 | $ | 224,518,525 | -0.48 | % | -4.72 | % | -18.63 | % | -38.13 | % | |||||||||||||||
| 1/31/2016 |
$ | 18.08 | 11,800,050 | $ | 213,290,323 | -2.59 | % | -8.69 | % | -2.59 | % | -39.73 | % | |||||||||||||||
| 2/29/2016 |
$ | 17.95 | 11,500,050 | $ | 206,423,399 | -0.72 | % | -3.75 | % | -3.29 | % | -40.17 | % | |||||||||||||||
| 3/31/2016 |
$ | 18.73 | 11,350,050 | $ | 212,556,966 | 4.35 | % | 0.92 | % | 0.92 | % | -37.57 | % | |||||||||||||||
| 4/30/2016 |
$ | 19.83 | 11,400,050 | $ | 226,055,159 | 5.87 | % | 9.68 | % | 6.84 | % | -33.90 | % | |||||||||||||||
| 5/31/2016 |
$ | 19.61 | 11,450,050 | $ | 224,548,529 | -1.11 | % | 9.25 | % | 5.66 | % | -34.63 | % | |||||||||||||||
| 6/30/2016 |
$ | 20.42 | 11,100,050 | $ | 226,681,895 | 4.13 | % | 9.02 | % | 10.02 | % | -31.93 | % | |||||||||||||||
| 7/31/2016 |
$ | 19.83 | 11,350,050 | $ | 225,092,558 | -2.89 | % | 0.00 | % | 6.84 | % | -33.90 | % | |||||||||||||||
| 8/31/2016 |
$ | 19.33 | 11,450,050 | $ | 221,349,718 | -2.52 | % | -1.43 | % | 4.15 | % | -35.57 | % | |||||||||||||||
| 9/30/2016 |
$ | 19.51 | 10,950,050 | $ | 213,673,816 | 0.93 | % | -4.46 | % | 5.12 | % | -34.97 | % | |||||||||||||||
| 10/31/2016 |
$ | 19.62 | 10,950,050 | $ | 214,888,405 | 0.56 | % | -1.06 | % | 5.71 | % | -34.60 | % | |||||||||||||||
| 11/30/2016 |
$ | 19.39 | 11,300,050 | $ | 219,111,876 | -1.17 | % | 0.31 | % | 4.47 | % | -35.37 | % | |||||||||||||||
| 12/31/2016 |
$ | 19.35 | 11,350,050 | $ | 219,660,595 | -0.21 | % | -0.82 | % | 4.26 | % | -35.50 | % | |||||||||||||||
| 1/31/2017 |
$ | 19.82 | 11,350,050 | $ | 224,901,754 | 2.43 | % | 1.02 | % | 2.43 | % | -33.93 | % | |||||||||||||||
| 2/28/2017 |
$ | 19.70 | 10,750,050 | $ | 211,819,623 | -0.61 | % | 1.60 | % | 1.81 | % | -34.33 | % | |||||||||||||||
| 3/31/2017 |
$ | 19.25 | 10,150,050 | $ | 195,428,354 | -2.28 | % | -0.52 | % | -0.52 | % | -35.83 | % | |||||||||||||||
| 4/30/2017 |
$ | 18.93 | 9,450,050 | $ | 178,936,038 | -1.66 | % | -4.49 | % | -2.17 | % | -36.90 | % | |||||||||||||||
| 5/31/2017 |
$ | 18.85 | 8,900,050 | $ | 167,788,181 | -0.42 | % | -4.31 | % | -2.58 | % | -37.17 | % | |||||||||||||||
| 6/30/2017 |
$ | 18.68 | 8,850,050 | $ | 165,359,886 | -0.90 | % | -2.96 | % | -3.46 | % | -37.73 | % | |||||||||||||||
| 7/31/2017 |
$ | 19.15 | 8,750,050 | $ | 167,534,220 | 2.52 | % | 1.16 | % | -1.03 | % | -36.17 | % | |||||||||||||||
| 8/31/2017 |
$ | 18.84 | 8,750,050 | $ | 164,834,840 | -1.62 | % | -0.05 | % | -2.64 | % | -37.20 | % | |||||||||||||||
| 9/30/2017 |
$ | 18.76 | 8,550,050 | $ | 160,409,438 | -0.42 | % | 0.43 | % | -3.05 | % | -37.47 | % | |||||||||||||||
| 10/31/2017 |
$ | 19.08 | 8,400,050 | $ | 160,283,921 | 1.71 | % | -0.37 | % | -1.40 | % | -36.40 | % | |||||||||||||||
| 11/30/2017 |
$ | 19.11 | 8,200,050 | $ | 156,718,600 | 0.16 | % | 1.43 | % | -1.24 | % | -36.30 | % | |||||||||||||||
| 12/31/2017 |
$ | 19.25 | 8,050,050 | $ | 154,956,309 | 0.73 | % | 2.61 | % | -0.52 | % | -35.83 | % | |||||||||||||||
| 1/31/2018 |
$ | 19.50 | 8,800,050 | $ | 171,590,704 | 1.30 | % | 2.20 | % | 1.30 | % | -35.00 | % | |||||||||||||||
| 2/28/2018 |
$ | 19.45 | 9,150,050 | $ | 177,987,164 | -0.26 | % | 1.78 | % | 1.04 | % | -35.17 | % | |||||||||||||||
| 3/31/2018 |
$ | 19.25 | 9,400,050 | $ | 180,938,291 | -1.03 | % | 0.00 | % | 0.00 | % | -35.83 | % | |||||||||||||||
| 4/30/2018 |
$ | 19.48 | 9,300,050 | $ | 181,169,802 | 1.19 | % | -0.10 | % | 1.19 | % | -35.07 | % | |||||||||||||||
| 5/31/2018 |
$ | 19.73 | 9,400,050 | $ | 185,447,260 | 1.28 | % | 1.44 | % | 2.49 | % | -34.23 | % | |||||||||||||||
| 6/30/2018 |
$ | 18.86 | 9,150,050 | $ | 172,533,165 | -4.41 | % | -2.03 | % | -2.03 | % | -37.13 | % | |||||||||||||||
| 7/31/2018 |
$ | 18.36 | 9,400,050 | $ | 172,579,285 | -2.65 | % | -5.75 | % | -4.62 | % | -38.80 | % | |||||||||||||||
| 8/31/2018 |
$ | 18.02 | 9,000,050 | $ | 162,207,008 | -1.85 | % | -8.67 | % | -6.39 | % | -39.93 | % | |||||||||||||||
| 9/30/2018 |
$ | 18.08 | 8,800,050 | $ | 159,102,078 | 0.33 | % | -4.14 | % | -6.08 | % | -39.73 | % | |||||||||||||||
| 10/31/2018 |
$ | 18.28 | 8,650,050 | $ | 158,160,214 | 1.11 | % | -0.44 | % | -5.04 | % | -39.07 | % | |||||||||||||||
38
Table of Contents
PAST PERFORMANCE IS NOT NECESSARILY INDICATIVE OF FUTURE RESULTS
| Date |
Net Asset Value Per Share |
Total Shares | Net Assets | 1 Month | 3 Months | Year to Date | Cumulative Return Since Inception |
|||||||||||||||||||||
| 11/30/2018 |
$ | 17.96 | 8,350,050 | $ | 149,939,026 | -1.75 | % | -0.33 | % | -6.70 | % | -40.13 | % | |||||||||||||||
| 12/31/2018 |
$ | 17.50 | 8,850,050 | $ | 154,855,001 | -2.56 | % | -3.21 | % | -9.09 | % | -41.67 | % | |||||||||||||||
| 1/31/2019 |
$ | 18.09 | 9,000,050 | $ | 162,845,090 | 3.37 | % | -1.04 | % | 3.37 | % | -39.70 | % | |||||||||||||||
| 2/28/2019 |
$ | 18.07 | 8,700,050 | $ | 157,241,808 | -0.11 | % | 0.61 | % | 3.26 | % | -39.77 | % | |||||||||||||||
| 3/31/2019 |
$ | 18.04 | 7,950,050 | $ | 143,407,805 | -0.17 | % | 3.09 | % | 3.09 | % | -39.87 | % | |||||||||||||||
| 4/30/2019 |
$ | 17.90 | 7,700,050 | $ | 137,843,116 | -0.78 | % | -1.05 | % | 2.29 | % | -40.33 | % | |||||||||||||||
| 5/31/2019 |
$ | 17.53 | 7,450,050 | $ | 130,608,270 | -2.07 | % | -2.99 | % | 0.17 | % | -41.57 | % | |||||||||||||||
| 6/30/2019 |
$ | 17.85 | 7,250,050 | $ | 129,395,183 | 1.83 | % | -1.05 | % | 2.00 | % | -40.50 | % | |||||||||||||||
| 7/31/2019 |
$ | 17.62 | 7,250,050 | $ | 127,772,592 | -1.29 | % | -1.56 | % | 0.69 | % | -41.27 | % | |||||||||||||||
| 8/31/2019 |
$ | 17.10 | 6,700,050 | $ | 114,556,679 | -2.95 | % | -2.45 | % | -2.29 | % | -43.00 | % | |||||||||||||||
| 9/30/2019 |
$ | 17.56 | 6,500,050 | $ | 114,110,261 | 2.69 | % | -1.62 | % | 0.34 | % | -41.47 | % | |||||||||||||||
| 10/31/2019 |
$ | 17.95 | 6,850,050 | $ | 122,956,931 | 2.22 | % | 1.87 | % | 2.57 | % | -40.17 | % | |||||||||||||||
| 11/30/2019 |
$ | 17.86 | 6,850,050 | $ | 122,348,578 | -0.50 | % | 4.44 | % | 2.06 | % | -40.47 | % | |||||||||||||||
| 12/31/2019 |
$ | 18.80 | 6,800,050 | $ | 127,835,843 | 5.26 | % | 7.06 | % | 7.43 | % | -37.33 | % | |||||||||||||||
The following charts present a comparison of the CCI-TR Index and the WisdomTree Continuous Commodity Index Fund Net Asset Value (“GCC NAV”) for the years ended December 31, 2019, 2018 and 2017, for the three months ended December 31, 2019, 2018 and 2017 and a comparison of the Fund’s market price performance and the CCI-TR Index performance since the commencement of trading on January 24, 2008 to December 31, 2019.
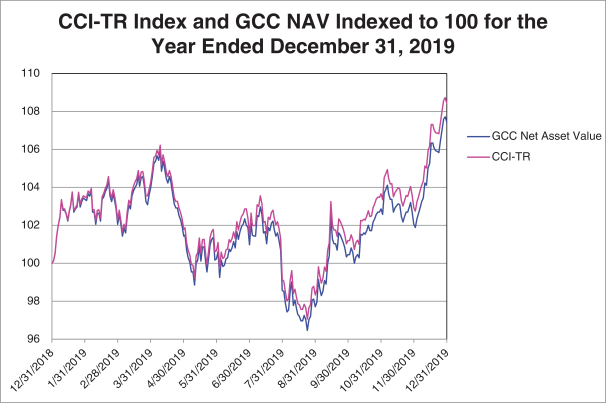
39
Table of Contents
PAST PERFORMANCE IS NOT NECESSARILY INDICATIVE OF FUTURE RESULTS
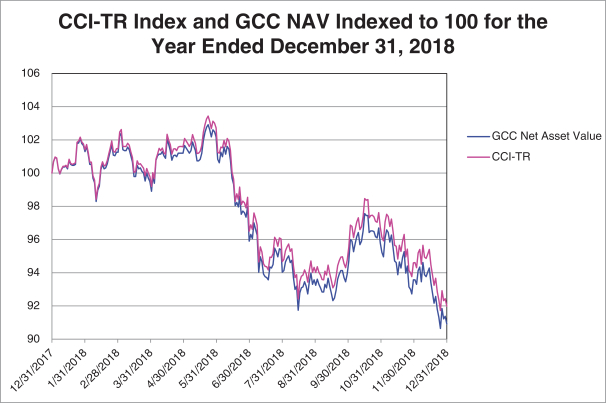
40
Table of Contents
PAST PERFORMANCE IS NOT NECESSARILY INDICATIVE OF FUTURE RESULTS
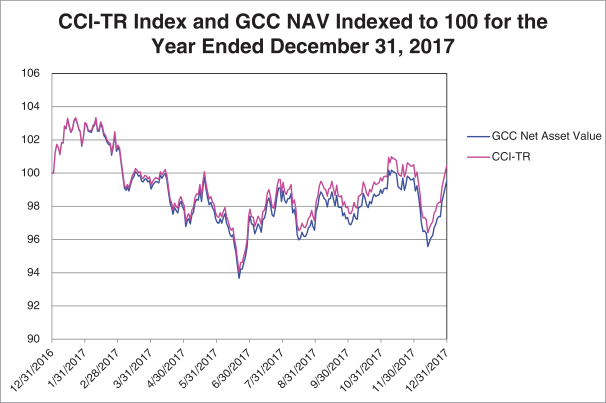
41
Table of Contents
PAST PERFORMANCE IS NOT NECESSARILY INDICATIVE OF FUTURE RESULTS
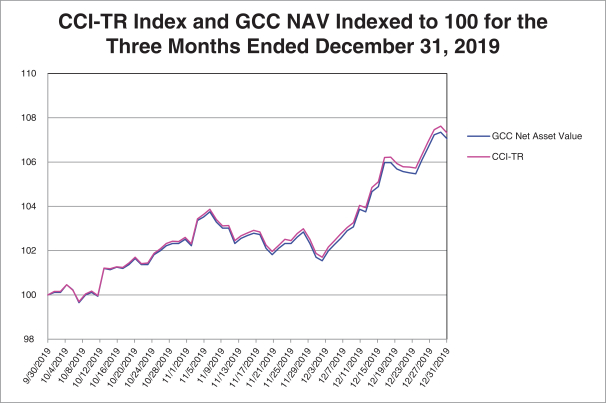
42
Table of Contents
PAST PERFORMANCE IS NOT NECESSARILY INDICATIVE OF FUTURE RESULTS
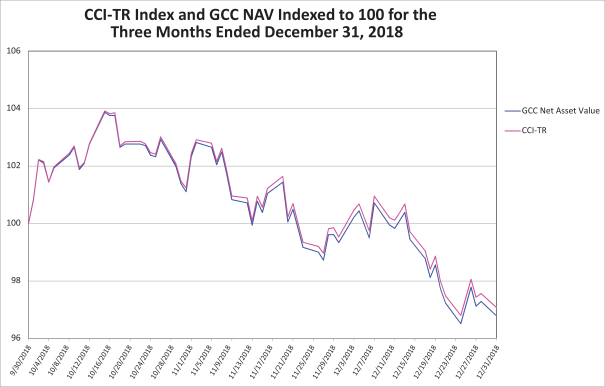
43
Table of Contents
PAST PERFORMANCE IS NOT NECESSARILY INDICATIVE OF FUTURE RESULTS
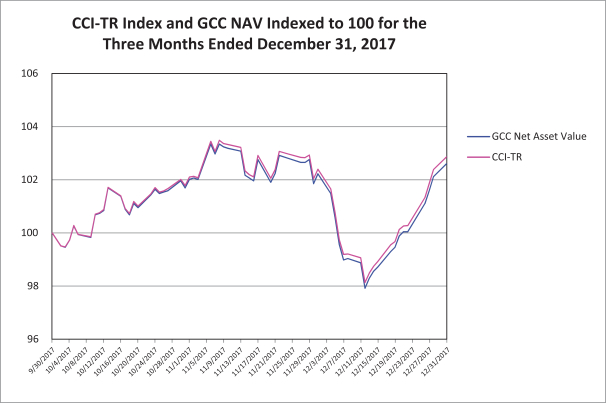
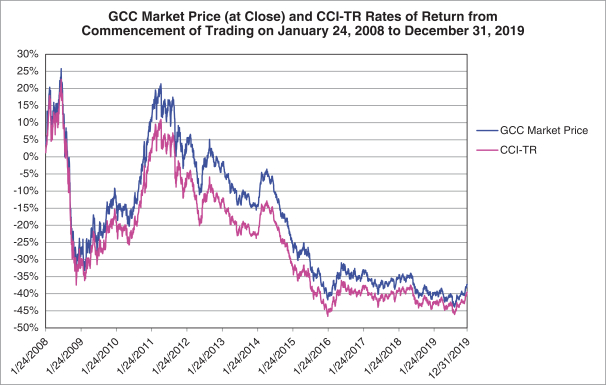
44
Table of Contents
PAST PERFORMANCE IS NOT NECESSARILY INDICATIVE OF FUTURE RESULTS
The Fund and the Master Fund seek to track changes in the Index over time. The Fund’s Net Asset Value relative performance versus the Index was -1.00%, -1.07%, and -1.03%, net of fees for the years ended December 31, 2019, 2018, and 2017, respectively. The Fund’s Net Asset Value relative performance versus the Index was -0.26%, -0.29%, and -0.26% for the three months ended December 31, 2019, 2018, and 2017, respectively. Since the Fund commenced trading on January 24, 2008 through December 31, 2019, the Fund has returned -37.37%, as measured by its daily closing stock price on the NYSE Arca, and the Index has returned -39.73% for the same period.
On October 22, 2019, the Fund registered 61,000,000 Shares. On October 25, 2019, the Fund filed a prospectus under Rule 424b of the Exchange to update certain information contained in the Registration Statement. As of December 31, 2019, there were 60,950,000 Shares available for issuance under this Registration Statement.
As of December 31, 2019, the Fund had 6,800,000 Limited Shares outstanding.
Net Asset Value
The Administrator calculates a Net Asset Value per Share of the Fund daily, based on closing prices of the underlying futures contracts. The first such calculation was as of market close on January 24, 2008, the first day of trading. Values of the underlying Index are computed by the Index Sponsor and disseminated by the NYSE Arca every 15 seconds during the trading day. Only settlement and last-sale prices are used in the Index’s calculation, bids and offers are not recognized – including limit-bid and limit-offer price quotes. Where no last-sale price exists, typically in the more deferred contract months, the previous days’ settlement price is used. This means that the underlying Index may lag its theoretical value. This tendency to lag is evident at the end of the day when the Index value is based on the settlement prices of the component commodities, and explains why the underlying Index often closes at or near the high or low for the day.
Critical Accounting Policies and Estimates
Critical accounting policies for the Funds are as follows:
Preparation of the financial statements and related disclosures in conformity with U.S. generally accepted accounting principles requires the application of appropriate accounting rules and guidance, as well as the use of estimates, and requires the Managing Owner to make estimates and assumptions that affect the reported amounts of assets and liabilities, revenue and expense and related disclosure of contingent assets and liabilities during the reporting period of the consolidated financial statements and accompanying notes. Both the Fund and the Master Fund apply these policies that involve judgments and actual results may differ from the estimates used.
The Master Fund holds a significant portion of its assets in Commodity Futures and U.S. Treasuries, both of which are recorded on a trade date basis and at fair value in the consolidated financial statements, with changes in fair value reported in the consolidated statements of income and expenses. The use of fair value to measure financial instruments, with related unrealized gains or losses recognized in earnings in each period is fundamental to the Fund’s consolidated financial statements. The fair value of a financial instrument is the amount that would be received to sell an asset or paid to transfer a liability in an orderly transaction between market participants at the measurement date (the exit price).
When market closing prices are not available, the Managing Owner may value an asset of the Master Fund pursuant to policies the Managing Owner has adopted, which are consistent with normal industry standards.
Interest income on U.S. Treasuries is recognized on an accrual basis when earned. Discounts and premiums are amortized or accreted over the life of the U.S. Treasuries.
45
Table of Contents
PAST PERFORMANCE IS NOT NECESSARILY INDICATIVE OF FUTURE RESULTS
Realized gains (losses) and changes in unrealized gain (loss) on open positions are determined on a specific identification basis and recognized in the consolidated statements of income and expenses in the period in which the contract is closed or the changes occur, respectively.
Asset Valuation
The Fund records its Commodity Futures and U.S. Treasuries on a trade date basis and at fair value in the consolidated financial statements, with changes in fair value reported in the consolidated statement of income and expenses.
In determining fair value of U.S. Treasuries and Commodity Futures, the Fund uses unadjusted quoted market prices in active markets and a fair value hierarchy that prioritizes the inputs to valuation techniques used to measure fair value. The hierarchy gives the highest priority to unadjusted quoted prices for identical assets or liabilities (Level 1 measurements) and the lowest priority to unobservable inputs (Level 3 measurements). Assets and liabilities are classified in their entirety based on the lowest level of input that is significant to the fair value measurement. See Note 4 to the financial statements for further information regarding this accounting policy.
Market Risk
See Item 1A – Risk Factors and Item 7A – Quantitative and Qualitative Disclosures about Market Risk for a complete discussion of market risk.
Credit Risk
The Master Fund holds two types of investments. The first is long positions in Commodity Futures on the 17 Index Commodities. Since the Index allocates equally among the components and is rebalanced daily, performance risk of the Commodity Futures is divided equally among the components. Each of the component Index Commodities is traded on the CME Group or ICE exchanges.
The CME Group and ICE exchanges guarantee the performance of its outstanding futures contracts. Each exchange is also publicly traded and, in management’s opinion, well-capitalized. Each uses a system of margining and daily cash settlement of unrealized gains and losses in open positions, which reduces counterparty risk for market participants. Hence, management believes that the Fund faces minimal credit or counterparty risk in its futures trading and contract positions.
The Master Fund will also hold significant cash balances representing the excess of invested funds above the margin requirements for its futures positions. To the extent practical, the Fund will hold this excess cash in U.S. Treasuries. Hence, management assigns no counterparty risk to such holdings.
Liquidity and Capital Resources
The Funds do not anticipate making use of borrowings or other lines of credit to meet their obligations. The Master Fund meets liquidity needs in the normal course of from cash, cash equivalents, and/or the sale of U.S. Treasuries it holds. The Funds’ liquidity needs include: redeeming Shares, providing margin deposits for existing Commodity Futures, the purchase of additional Commodity Futures and paying expenses.
The Funds generate cash primarily from (i) the sale of creation Baskets and (ii) interest earned on cash, cash equivalents and investments in collateralizing U.S. Treasuries. Substantially all of the net assets of the Master Fund are allocated to trading in Commodity Futures. Most of the assets of the Master Fund are held in U.S. Treasuries, cash and/or cash equivalents that could or are used as margin or collateral for trading in Commodity
46
Table of Contents
PAST PERFORMANCE IS NOT NECESSARILY INDICATIVE OF FUTURE RESULTS
Futures. The percentage that such assets bear to the total net assets will vary from period to period as the market values of the Commodity Futures change. Interest earned on interest-bearing assets of the Master Fund is paid to the Master Fund.
The investments of the Master Fund in Commodity Futures could be subject to periods of illiquidity because of market conditions, regulatory considerations and other reasons. Such conditions could prevent the Master Fund from promptly liquidating a position in Commodity Futures.
Contractual Obligations
The Funds’ contractual obligations are with the Managing Owner and the Commodity Broker. Management Fee payments made to the Managing Owner are calculated as a fixed percentage of Net Asset Value. Commissions paid by the Funds to the Commodity Broker are on a per contract half-turn basis. As such, the Managing Owner cannot anticipate the amount of payments and commissions related to half-turns or round-turns that will be required under these arrangements for future periods as the amount and level of future trading activity is unknown.
Off-Balance Sheet Risk
In the normal course of business, the Funds are party to financial instruments with off-balance sheet risk. The term “off-balance sheet risk” refers to an unrecorded potential liability that, even though it does not appear on the balance sheet, may result in a future obligation or loss. The financial instruments used by the Funds are standardized commodity futures contracts traded on regulated exchanges and are recognized on the balance sheet at fair value pursuant to the accounting standards for derivatives and hedging activities, “Accounting for Derivative Instruments and Hedging Activities.” As of the balance sheet date, therefore, the Funds have no unrecorded liabilities relating to futures contracts. However, until these contracts are closed, they will fluctuate in value with changing commodity prices.
| Item 7A. | Quantitative and Qualitative Disclosures about Market Risk. |
Introduction
The Funds are designed to replicate a commodity index. The market-sensitive instruments held by the Master Fund are subject to the risk of trading loss. Unlike an operating company, the risk of market-sensitive instruments is integral, not incidental, to the Funds’ main line of business.
Market movements can produce frequent changes in the fair market value of the Master Fund’s open positions and, consequently, in its earnings and cash flows. The Funds’ market risk is primarily influenced by changes in the price of commodities.
Qualitative Disclosures Regarding Non-Trading Risk Exposure
The Funds are unaware of any (i) anticipated known demands, commitments or capital expenditures; (ii) material trends, favorable or unfavorable, in its capital resources; or (iii) trends or uncertainties that will have a material effect on operations.
Qualitative Disclosures Regarding Means of Managing Risk Exposure
Under ordinary circumstances, the Managing Owner’s discretionary power is limited to determining whether the Fund will make a distribution. Under emergency or extraordinary circumstances, the Managing Owner’s discretionary powers increase, but remain circumscribed. These special circumstances, for example, include the
47
Table of Contents
PAST PERFORMANCE IS NOT NECESSARILY INDICATIVE OF FUTURE RESULTS
unavailability of the Index or certain natural or man-made disasters. The Managing Owner does not apply risk management techniques. The Master Fund initiates positions only on the “long” side of the market and does not employ “stop-loss” techniques.
Quantitative Disclosures
Market Risk by Sector
The following were the primary trading risk exposures of the Fund as of December 31, 2019 by market sector. The table below indicates the sector weighting of the Commodity Futures held within the Master Fund.
| Sector |
Sector Weight |
Commodity | ||||
| Grains |
23.55 | % | Corn, Soybean, Soybean Oil, Wheat | |||
| Livestock |
11.76 | % | Lean Hogs, Live Cattle | |||
| Metals |
23.49 | % | Copper, Gold 100 Ounce, Platinum, Silver | |||
| Energy |
17.63 | % | Natural Gas, NY Harbor ULSD, WTI Crude Oil | |||
| Softs |
23.57 | % | Cocoa, Coffee “C”, Cotton No. 2, Sugar No. 11 | |||
Commodity Price Sensitivity and Interest Rate Sensitivity
The Fund is exposed to commodity price risk through its holdings of commodity futures contracts and interest rate risk through its holdings of short-term U.S. Treasury bills. The following tables provide information about the Fund’s investments, which were sensitive to both commodity price and interest rate risk.
48
Table of Contents
PAST PERFORMANCE IS NOT NECESSARILY INDICATIVE OF FUTURE RESULTS
As of December 31, 2019, the Master Fund’s long exposure futures contract positions subject to commodity price risk were as follows:
| Description |
Range of |
Number of Contracts |
Weighted- Average Price per Contract |
Contract Multiplier |
Notional Value |
Unrealized Appreciation/ (Depreciation) |
||||||||||||||||
| Energy |
||||||||||||||||||||||
| Natural Gas |
January 2020 – May 2020 | 345 | $ | 2.19 | 10,000 | $ | 7,541,700 | $ | (666,800 | ) | ||||||||||||
| NY Harbor ULSD |
January 2020 – May 2020 | 89 | 2.00 | 42,000 | 7,473,047 | 579,453 | ||||||||||||||||
| WTI Crude Oil |
January 2020 – May 2020 | 124 | 60.34 | 1,000 | 7,481,810 | 782,720 | ||||||||||||||||
| Grains |
||||||||||||||||||||||
| Corn |
March 2020 – July 2020 | 381 | 3.95 | 5,000 | 7,515,225 | (275,037 | ) | |||||||||||||||
| Soybean |
March 2020 – July 2020 | 155 | 9.68 | 5,000 | 7,501,413 | 280,438 | ||||||||||||||||
| Soybean Oil |
March 2020 – July 2020 | 357 | 0.35 | 60,000 | 7,510,566 | 765,816 | ||||||||||||||||
| Wheat |
March 2020 – July 2020 | 268 | 5.61 | 5,000 | 7,521,738 | 626,012 | ||||||||||||||||
| Livestock |
||||||||||||||||||||||
| Lean Hogs |
February 2020 – July 2020 | 229 | 0.82 | 40,000 | 7,510,710 | (106,550 | ) | |||||||||||||||
| Live Cattle |
February 2020 – June 2020 | 151 | 1.24 | 40,000 | 7,490,370 | 422,880 | ||||||||||||||||
| Metals |
||||||||||||||||||||||
| Copper |
March 2020 – July 2020 | 107 | 2.81 | 25,000 | 7,506,738 | 402,876 | ||||||||||||||||
| Gold 100 Ounce |
February 2020 – June 2020 | 49 | 1,529.04 | 100 | 7,492,310 | 234,200 | ||||||||||||||||
| Platinum |
April 2020 – July 2020 | 153 | 980.68 | 50 | 7,502,210 | 514,760 | ||||||||||||||||
| Silver |
March 2020 – July 2020 | 83 | 18.01 | 5,000 | 7,472,215 | 228,095 | ||||||||||||||||
| Softs |
||||||||||||||||||||||
| Cocoa |
March 2020 – July 2020 | 296 | 2,539.00 | 10 | 7,515,430 | 360,930 | ||||||||||||||||
| Coffee “C” |
March 2020 – July 2020 | 152 | 1.32 | 37,500 | 7,514,662 | 1,065,018 | ||||||||||||||||
| Cotton No. 2 |
March 2020 – July 2020 | 215 | 0.70 | 50,000 | 7,531,005 | 542,565 | ||||||||||||||||
| Sugar No. 11 |
February 2020 –June 2020 | 496 | 0.14 | 112,000 | 7,521,606 | 404,779 | ||||||||||||||||
|
|
|
|
|
|||||||||||||||||||
| Total |
$ | 127,602,755 | $ | 6,162,155 | ||||||||||||||||||
|
|
|
|
|
|||||||||||||||||||
As of December 31, 2019, the Master Fund’s aggregate position in short-term U.S. Treasuries subject to interest rate risk were as follows:
| Description |
Range of Yields to Maturity |
Range of Maturity Dates |
Face Amount | Fair Value | Unrealized Appreciation/ (Depreciation) |
|||||||||||||||
| U.S. Treasury Obligations |
||||||||||||||||||||
| U.S. Treasury Bills |
1.55% – 1.69% | January 2020 – March 2020 | $ | 116,000,000 | $ | 115,831,172 | $ | 10,304 | ||||||||||||
| Item 8. | Financial Statements and Supplementary Data. |
See the Index to Financial Statements on page F-1 for a list of the financial statements being filed as part of this Annual Report. Those Financial Statements, and the notes and schedules related thereto, are incorporated by reference into this Item 8.
| Item 9. | Changes in and Disagreements with Accountants on Accounting and Financial Disclosure. |
None.
49
Table of Contents
| Item 9A. | Controls and Procedures. |
Disclosure Controls and Procedures
For purposes of this Item 9A, references to the “Fund” and “our” include both the Fund and the Master Fund. Under the supervision and with the participation of the management of the Managing Owner, including its chief executive officer and principal financial officer, the Fund carried out an evaluation of the effectiveness of the design and operation of its disclosure controls and procedures (as defined in Rule 13a-15(f)) of the Securities Exchange Act of 1934. Based upon that evaluation, the chief executive officer and principal financial officer concluded that the Fund’s disclosure controls and procedures with respect to the Fund were effective as of the end of the period covered by this Annual Report.
Internal Control over Management’s Financial Reporting
The Managing Owner is responsible for establishing and maintaining adequate internal control over financial reporting. The Managing Owner’s internal control system is designed to provide reasonable assurance to the Fund’s management regarding the preparation and fair presentation of published financial statements. All internal control systems, no matter how well designed, have inherent limitations. Therefore, even those systems determined to be effective can provide only reasonable assurance with respect to financial statement preparation and presentation.
The Managing Owner assessed the effectiveness of the Fund’s internal control over financial reporting as of December 31, 2019. In making this assessment, the Managing Owner used the criteria set forth in the 2013 Internal Controls – Integrated Framework by the Committee of Sponsoring Organizations of the Treadway Commission. Based on their assessment, the Managing Owner believes that, as of December 31, 2019, its internal control over financial reporting is effective.
Ernst & Young LLP (“EY”), the independent registered public accounting firm that audited the Fund’s consolidated financial statements included in this Annual Report, has issued attestation reports on the Fund’s internal control over financial reporting, which accompany this Annual Report.
The Managing Owner evaluated whether there was a change in the Fund’s internal control over financial reporting during the three months ended December 31, 2019 that has materially affected, or is reasonably likely to materially affect, the Fund’s internal control over financial reporting. Based on this evaluation, Management believes that there was no such change during the three months ended December 31, 2019.
| Item 9B. | Other Information. |
Not applicable.
50
Table of Contents
| Item 10. | Managers and Executive Officers of the Registrant. |
The Managing Owner and the Sub-Adviser; Management
WisdomTree Commodity Services, LLC serves as the commodity pool operator and Managing Owner of the Funds, and GreenHaven Advisors LLC serves as the commodity trading advisor and Sub-Adviser of the Funds. The Funds have no officers or directors. The Funds do not directly compensate any of the executive officers noted below. Such individuals are compensated by the Managing Owner or the Sub-Adviser, as applicable, for the work they perform on behalf of the Funds. The Funds do not reimburse the Managing Owner or Sub-Adviser for, and the Funds do not set the amount or form of any portion of, the compensation paid to such individuals by the Managing Owner or Sub-Adviser, as applicable. However, a portion of the fee that is received for the services provided by the Managing Owner and the Sub-Adviser, as applicable, may be used for payment of compensation to such individuals.
Officers of the Managing Owner are subject to a Code of Conduct which is designed to, among other things, promote honest and ethical conduct and promote compliance with applicable laws and regulations.
Set forth below is a description of the officers and key decision-makers of the Managing Owner and the Sub-Adviser as of the date of this Annual Report.
Executive Officers of the Managing Owner
| Name |
Position | |
| Jeremy Schwartz |
President and Chief Executive Officer | |
| David Castano |
Chief Financial Officer and Treasurer | |
| Terry Feld |
Chief Compliance Officer | |
| Peter Ziemba |
Executive Vice President, Chief Legal Officer and Secretary |
The following is a biographical summary of the business experience of the executive officers of the Managing Owner as of the date of this Annual Report.
Jeremy Schwartz – President and Chief Executive Officer. Mr. Schwartz has served as the Chief Executive Officer of the Managing Owner in charge of managing its business since March 2019. He became a registered Associated Person and Principal of the Managing Owner in March 2019. Mr. Schwartz has served as WisdomTree Investment Inc.’s Executive Vice President – Global Head of Research overseeing research since November 2018 and Director of Research from October 2008 through October 2018. Mr. Schwartz became a registered Associated Person and Principal of WisdomTree Asset Management, Inc. (overseeing research matters), in February 2013 and January 2013, respectively. WisdomTree Asset Management, Inc. serves an investment adviser primarily to exchange traded funds. Mr. Schwartz is 38 years old.
David Castano – Chief Financial Officer and Treasurer. Mr. Castano has served as the Chief Financial Officer and Treasurer of the Managing Owner in charge of financial reporting and recording since January 2016. Mr. Castano became a Principal of the Managing Owner in March 2016. Mr. Castano has served as Director of Fund Accounting & Administration of WisdomTree Asset Management, Inc. (overseeing accounting and administration matters) since June 2011 and Treasurer/Principal Financial Officer of the WisdomTree Trust (overseeing accounting and administration matters) since January 2013. Mr. Castano was also registered as a Principal of WisdomTree Coal Services, LLC from March 2016 through June 2017. Mr. Castano is 48 years old.
Terry Feld – Chief Compliance Officer. Ms. Feld has served as the Chief Compliance Officer of the Managing Owner since March 2017, overseeing regulatory compliance matters. Ms. Feld was registered as a Principal of
51
Table of Contents
the Managing Owner from January 2016 to February 2016. She again became a Principal of the Managing Owner in March 2017. Ms. Feld served as a Senior Compliance Officer of WisdomTree Asset Management from October 2011 to October 2012 (assisting in oversight of compliance matters) and has served as Head of Compliance and Chief Compliance Officer of WisdomTree Asset Management, Inc. since October 2012 (overseeing compliance matters). Ms. Field has served as a Principal of WisdomTree Asset Management, Inc. since January 2013. Ms. Feld was also registered as a Principal of WisdomTree Coal Services, LLC from January 2016 through February 2016. Ms. Feld is 59 years old.
Peter Ziemba – Executive Vice President, Chief Legal Officer and Secretary. Mr. Ziemba has served as the Executive Vice President, Chief Legal Officer and Secretary of the Managing Owner in charge of legal affairs since January 2016. Mr. Ziemba has served as WisdomTree Investments, Inc.’s Executive Vice President-Chief Administrative Officer overseeing administrative affairs since January 2018 and Executive Vice President – Business and Legal Affairs from January 2008 through December 2017 and Chief Legal Officer from March 2011 through December 2017 (overseeing legal matters). Mr. Ziemba has served as a Principal of WisdomTree Asset Management, Inc. since April 2016. Mr. Ziemba is 62 years old.
Executive Officers and Significant Employees of the Sub-Adviser
| Name |
Position | |
| Ashmead Pringle |
Chief Executive Officer | |
| Cooper Anderson |
Partner | |
| Scott Glasing |
Trader | |
| Tom Fernandes |
Chief Operating Officer |
The following is a biographical summary of the business experience of the executive officers and significant employees of the Sub-Adviser as of the date of this Annual Report.
Ashmead Pringle – Chief Executive Officer. Mr. Pringle founded the Sub-Adviser and has served as its Chief Executive Officer and managing member in charge of managing its business since November 2015. He became a registered Associated Person and Principal of the Sub-Adviser in November 2015. Mr. Pringle also founded Grain Service Corporation (“GSC”), a commodity research and trading company, and has served as its President since October 1984. He became a Principal of GSC in June of 1985 and a registered Associated Person of GSC in October 1985. Mr. Pringle also founded the Managing Owner and served as its Chief Executive Officer in charge of managing its business from November 2006 to January 2016. He was a registered Associated Person and Principal of the Managing Owner from November 2006 to January 2016. Mr. Pringle also founded GreenHaven LLC, the former holding company of the Managing Owner, and managed its business operations from September 2006 to February 2011. Mr. Pringle was a registered Associated Person of GreenHaven LLC from September 2006 to February 2011 and was a Principal from November 2006 to February 2011. Mr. Pringle also founded the WisdomTree Coal Services, LLC (formerly known as GreenHaven Coal Services, LLC), and served as its President in charge of managing its business from August 2012 to January 2016. He was a registered Associated Person and Principal of WisdomTree Coal Services, LLC from August 2012 to January 2016. Mr. Pringle is 73 years old.
Cooper Anderson – Partner. Mr. Anderson is a founding member of the Sub-Adviser. He became a registered Associated Person and Principal of the Sub-Adviser in November 2015. From May 2007 to February 2011, Mr. Anderson was a managing partner and registered Associated Person of GreenHaven LLC, the former holding company of the Managing Owner. From November 2009 to January 2016, Mr. Anderson was a trader and Chief Financial Officer, and registered Associated Person and Principal of the Managing Owner. From May 2012 to January 2016, Mr. Anderson was the Chief Financial Officer of WisdomTree Coal Services, LLC, and a Principal of WisdomTree Coal Services, LLC. Mr. Anderson was registered as an Associated Person of WisdomTree Coal Services, LLC from June 2012 to January 2016. Mr. Anderson is 40 years old.
52
Table of Contents
Scott Glasing – Trader. Mr. Glasing is a trader for the Sub-Adviser and is responsible for daily futures trading, cash flow management, and treasury portfolio management for the Fund. He became a registered Associated Person and Principal of the Sub-Adviser in November 2015. Since February 1998, Mr. Glasing has worked for GSC as a trader responsible for daily futures trading. He became a registered Associated Person of GSC in April 1998 and a Principal of GSC in March 1998. From September 2006 to February 2011, Mr. Glasing was a trader responsible for daily futures trading and a registered Associated Person of GreenHaven LLC. From November 2006 to January 2016, Mr. Glasing was a trader responsible for daily futures trading and a registered Associated Person of the Managing Owner and was a Principal from November 2009 to January 2016. From August 2012 to January 2016, Mr. Glasing was a trader responsible for daily futures trading and a registered Associated Person and Principal of WisdomTree Coal Services, LLC. Mr. Glasing is 57 years old.
Tom Fernandes – Chief Operating Officer. Mr. Fernandes is the Chief Operating Officer of the Sub-Adviser and in charge of quantitative analysis for the Fund. He became a registered Associated Person and Principal of the Sub-Adviser in November 2015. From October 2006 to August 2012, Mr. Fernandes served as Chief Financial Officer of the Managing Owner and was responsible for managing regulatory compliance, financial reporting, and risk management. Mr. Fernandes was a registered Associated Person of the Managing Owner from November 2006 until February 2016 and was a registered Principal of the Managing Owner from October 2006 until August 2012. From August 2006 to February 2011, Mr. Fernandes was a managing partner and Principal of GreenHaven LLC in charge of managing its business and was a registered Associated Person from September 2006 to February 2011. From August 2012 to October 2014, Mr. Fernandes was Chief Operating Officer and a registered Associated Person and Principal of WisdomTree Coal Services, LLC and was responsible for general corporate strategy and regulatory compliance. Since August 2012, Mr. Fernandes has served as Chief Executive Officer of GSC Agribusiness in charge of managing its business. GSC Agribusiness is a livestock producer. Mr. Fernandes has been a registered Associated Person of Grain Services Corporation, Inc. since June 2005. Mr. Fernandes is 46 years old.
| Item 11. | Executive Compensation. |
The Fund has no employees, officers or directors and is managed by the Managing Owner. None of the directors or officers of the Managing Owner receive compensation from the Fund. The Managing Owner receives a monthly management fee of 1/12 of 0.85% (0.85% annually) of the average daily net assets of the Fund during the preceding month. During the fiscal years ended December 31, 2019, 2018, and 2017, the Fund incurred management fees (before fee waivers) of $1,140,124, $1,436,067, and $1,513,176, respectively. The Managing Owner voluntarily agreed to waive a portion of its Management Fee in the amount of 0.10% per annum reducing the Management Fee to 0.75% per annum based on the average daily Net Asset Value of the Fund. During the fiscal years ended December 31, 2019, 2018 and 2017, the waivers amounted to $134,132, $168,949 and $178,022, respectively.
| Item 12. | Security Ownership of Certain Beneficial Owners and Management and Related Stockholder Matters. |
The Fund has no officers or directors. The following table sets forth certain information regarding beneficial ownership of the Fund’s General Shares and Limited Shares as of December 31, 2019, by the Managing Owner.
| Title of Class |
Name/Address of Beneficial Owner |
Amount/Nature of Beneficial Ownership | ||
| General Shares |
WisdomTree Commodity Services, LLC 245 Park Avenue, 35th Floor New York, New York 10167 |
50 Shares |
As of December 31, 2019, there were no beneficial holders of the Fund’s Limited Shares in excess of 5% of the outstanding shares of such class.
53
Table of Contents
| Item 13. | Certain Relationships and Related Transactions and Director Independence. |
None.
| Item 14. | Principal Accountant Fees and Services. |
Audit and Non-Audit Fees
Fees for services performed by EY for the years ended December 31, 2019 and 2018 are set forth in the chart
below.
| 2019 | 2018 | |||||||
| Audit fees |
$ | 198,000 | $ | 220,000 | ||||
| Audit-related fees |
— | — | ||||||
| Tax fees |
— | — | ||||||
| All other fees |
— | — | ||||||
|
|
|
|
|
|||||
| Total |
$ | 198,000 | $ | 220,000 | ||||
|
|
|
|
|
|||||
Approval of Independent Registered Public Accounting Firm Services and Fees
The Managing Owner approved 100% of the services provided by the Funds’ independent registered public accounting firm described above. For the year ended December 31, 2019, the Managing Owner pre-approved all audit and allowed non-audit services of the Fund’s independent registered public accounting firm, including all engagement fees and terms.
54
Table of Contents
| Item 15. | Exhibits, Financial Statement Schedules. |
See Index to Financial Statements on Page F-1 for a list of the financial statements being filed as part of this Annual Report. Schedules may have been omitted since they are either not required, not applicable, or the information has otherwise been included.
55
Table of Contents
| Exhibit |
Description of Document | |
| 32.3 | Certification by Principal Executive Officer Pursuant to 18 U.S.C. Section 1350, as Adopted Pursuant to Section 906 of the Sarbanes-Oxley Act of 2002(14) | |
| 32.4 | Certification by Principal Financial Officer Pursuant to 18 U.S.C. Section 1350, as Adopted Pursuant to Section 906 of the Sarbanes-Oxley Act of 2002(14) | |
| 101.INS | XBRL Instance Document | |
| 101.SCH | XBRL Taxonomy Extension Schema Document | |
| 101.CAL | XBRL Taxonomy Extension Calculation Linkbase Document | |
| 101.DEF | XBRL Taxonomy Extension Definition Linkbase Document | |
| 101.LAB | XBRL Taxonomy Extension Label Linkbase Document | |
| 101.PRE | XBRL Taxonomy Extension Presentation Linkbase Document | |
| (1) | Incorporated by reference to Exhibit 3.1 of the Fund’s Current Report on Form 8-K filed January 4, 2016. |
| (2) | Incorporated by reference to Exhibit 3.3 of the Fund’s Current Report on Form 8-K filed January 4, 2016. |
| (3) | Incorporated by reference to Exhibit A-2 of the Fund’s pre-effective Registration Statement on Form S-1 filed November 3, 2006. |
| (4) | Incorporated by reference to Exhibit 3.2 of the Fund’s Current Report on Form 8-K filed January 4, 2016. |
| (5) | Incorporated by reference to Exhibit A-1 of the Fund’s pre-effective Registration Statement on Form S-1 filed November 3, 2006. |
| (6) | Incorporated by reference to Exhibit 3.4 of the Fund’s Current Report on Form 8-K filed January 4, 2016. |
| (7) | Incorporated by reference to Exhibit 10.1 of the Fund’s Current Report on Form 8-K filed January 4, 2016. |
| (8) | Incorporated by reference to Exhibit 10.2 of the Fund’s Current Report on Form 8-K filed January 4, 2016. |
| (9) | Incorporated by reference to Exhibit 10.3 of the Fund’s Current Report on Form 8-K filed January 4, 2016. |
| (10) | Incorporated by reference to Exhibit 10.4 of the Fund’s Current Report on Form 8-K filed January 4, 2016. |
| (11) | Incorporated by reference to Exhibit 10.5 of the Fund’s Current Report on Form 8-K filed January 4, 2016. |
| (12) | Incorporated by reference to Exhibit 10.6 of the Fund’s Current Report on Form 8-K filed January 4, 2016. |
| (13) | Incorporated by reference to Exhibit 10.7 of the Fund’s Current Report on Form 8-K filed January 4, 2016. |
| (14) | Filed herewith. |
| Item 16. | Summary. |
The Funds have elected not to include a summary of information required by Form 10-K.
56
Table of Contents
WisdomTree Continuous Commodity Index Fund
WisdomTree Continuous Commodity Index Master Fund
F-1
Table of Contents
Report of Independent Registered Public Accounting Firm
To the Managing Owner and Shareholders of WisdomTree Continuous Commodity Index Fund
Opinion on the Financial Statements
We have audited the accompanying consolidated statements of financial condition, including the consolidated schedules of investments, of WisdomTree Continuous Commodity Index Fund (the “Fund”) as of December 31, 2019 and 2018, and the related consolidated statements of income and expenses, changes in shareholders’ equity and cash flows for each of the three years in the period ended December 31, 2019, and the related notes (collectively referred to as the “financial statements”). In our opinion, the financial statements present fairly, in all material respects, the financial position of the Fund at December 31, 2019 and 2018, and the results of its operations and its cash flows for each of the three years in the period ended December 31, 2019, in conformity with U.S. generally accepted accounting principles.
We also have audited, in accordance with the standards of the Public Company Accounting Oversight Board (United States) (PCAOB), the Fund’s internal control over financial reporting as of December 31, 2019, based on criteria established in Internal Control-Integrated Framework issued by the Committee of Sponsoring Organizations of the Treadway Commission (2013 framework), and our report dated February 21, 2020 expressed an unqualified opinion thereon.
Basis for Opinion
These financial statements are the responsibility of the Fund’s management. Our responsibility is to express an opinion on the Fund’s financial statements based on our audits. We are a public accounting firm registered with the PCAOB and are required to be independent with respect to the Fund in accordance with the U.S. federal securities laws and the applicable rules and regulations of the Securities and Exchange Commission and the PCAOB.
We conducted our audits in accordance with the standards of the PCAOB. Those standards require that we plan and perform the audit to obtain reasonable assurance about whether the financial statements are free of material misstatement, whether due to error or fraud. Our audits included performing procedures to assess the risks of material misstatement of the financial statements, whether due to error or fraud, and performing procedures that respond to those risks. Such procedures included examining, on a test basis, evidence regarding the amounts and disclosures in the financial statements. Our audits also included evaluating the accounting principles used and significant estimates made by management, as well as evaluating the overall presentation of the financial statements. We believe that our audits provide a reasonable basis for our opinion.
/s/ ERNST & YOUNG LLP
We have served as the Fund’s auditor since 2016.
New York, NY
February 21, 2020
F-2
Table of Contents
Report of Independent Registered Public Accounting Firm
To the Managing Owner and Shareholders of WisdomTree Continuous Commodity Index Master Fund
Opinion on the Financial Statements
We have audited the accompanying statements of financial condition, including the schedules of investments, of WisdomTree Continuous Commodity Index Master Fund (the “Master Fund”) as of December 31, 2019 and 2018, the related statements of income and expenses, changes in shareholders’ equity and cash flows for each of the three years in the period ended December 31, 2019, and the related notes (collectively referred to as the “financial statements”). In our opinion, the financial statements present fairly, in all material respects, the financial position of the Master Fund at December 31, 2019 and 2018, and the results of its operations and its cash flows for each of the three years in the period ended December 31, 2019, in conformity with U.S. generally accepted accounting principles.
We also have audited, in accordance with the standards of the Public Company Accounting Oversight Board (United States) (PCAOB), the Master Fund’s internal control over financial reporting as of December 31, 2019, based on criteria established in Internal Control-Integrated Framework issued by the Committee of Sponsoring Organizations of the Treadway Commission (2013 framework), and our report dated February 21, 2020 expressed an unqualified opinion thereon.
Basis for Opinion
These financial statements are the responsibility of the Master Fund’s management. Our responsibility is to express an opinion on the Master Fund’s financial statements based on our audits. We are a public accounting firm registered with the PCAOB and are required to be independent with respect to the Master Fund in accordance with the U.S. federal securities laws and the applicable rules and regulations of the Securities and Exchange Commission and the PCAOB.
We conducted our audits in accordance with the standards of the PCAOB. Those standards require that we plan and perform the audit to obtain reasonable assurance about whether the financial statements are free of material misstatement, whether due to error or fraud. Our audits included performing procedures to assess the risks of material misstatement of the financial statements, whether due to error or fraud, and performing procedures that respond to those risks. Such procedures included examining, on a test basis, evidence regarding the amounts and disclosures in the financial statements. Our audits also included evaluating the accounting principles used and significant estimates made by management, as well as evaluating the overall presentation of the financial statements. We believe that our audits provide a reasonable basis for our opinion.
/s/ ERNST & YOUNG LLP
We have served as the Master Fund’s auditor since 2016.
New York, NY
February 21, 2020
F-3
Table of Contents
Report of Independent Registered Public Accounting Firm
To the Managing Owner and Shareholders of WisdomTree Continuous Commodity Index Fund
Opinion on Internal Control over Financial Reporting
We have audited WisdomTree Continuous Commodity Index Fund’s internal control over financial reporting as of December 31, 2019, based on criteria established in Internal Control—Integrated Framework issued by the Committee of Sponsoring Organizations of the Treadway Commission (2013 framework) (the COSO criteria). In our opinion, WisdomTree Continuous Commodity Index Fund (the “Fund”) maintained, in all material respects, effective internal control over financial reporting as of December 31, 2019, based on the COSO criteria.
We also have audited, in accordance with the standards of the Public Company Accounting Oversight Board (United States) (PCAOB), the accompanying consolidated statements of financial condition, including the consolidated schedules of investments as of December 31, 2019 and 2018, the related consolidated statements of income and expenses, changes in shareholders’ equity and cash flows for each of the three years in the period ended December 31, 2019, and the related notes of the Fund and our report dated February 21, 2020 expressed an unqualified opinion thereon.
Basis for Opinion
The Fund’s management is responsible for maintaining effective internal control over financial reporting and for its assessment of the effectiveness of internal control over financial reporting included in the accompanying Management’s Report on Internal Control over Management’s Financial Reporting. Our responsibility is to express an opinion on the Fund’s internal control over financial reporting based on our audit. We are a public accounting firm registered with the PCAOB and are required to be independent with respect to the Fund in accordance with the U.S. federal securities laws and the applicable rules and regulations of the Securities and Exchange Commission and the PCAOB.
We conducted our audit in accordance with the standards of the PCAOB. Those standards require that we plan and perform the audit to obtain reasonable assurance about whether effective internal control over financial reporting was maintained in all material respects.
Our audit included obtaining an understanding of internal control over financial reporting, assessing the risk that a material weakness exists, testing and evaluating the design and operating effectiveness of internal control based on the assessed risk, and performing such other procedures as we considered necessary in the circumstances. We believe that our audit provides a reasonable basis for our opinion.
Definition and Limitations of Internal Control Over Financial Reporting
A company’s internal control over financial reporting is a process designed to provide reasonable assurance regarding the reliability of financial reporting and the preparation of financial statements for external purposes in accordance with generally accepted accounting principles. A company’s internal control over financial reporting includes those policies and procedures that (1) pertain to the maintenance of records that, in reasonable detail, accurately and fairly reflect the transactions and dispositions of the assets of the company; (2) provide reasonable assurance that transactions are recorded as necessary to permit preparation of financial statements in accordance with generally accepted accounting principles, and that receipts and expenditures of the company are being made only in accordance with authorizations of management and directors of the company; and (3) provide reasonable assurance regarding prevention or timely detection of unauthorized acquisition, use, or disposition of the company’s assets that could have a material effect on the financial statements.
F-4
Table of Contents
Because of its inherent limitations, internal control over financial reporting may not prevent or detect misstatements. Also, projections of any evaluation of effectiveness to future periods are subject to the risk that controls may become inadequate because of changes in conditions, or that the degree of compliance with the policies or procedures may deteriorate.
/s/ ERNST & YOUNG LLP
New York, NY
February 21, 2020
F-5
Table of Contents
Report of Independent Registered Public Accounting Firm
To the Managing Owner and Shareholders of WisdomTree Continuous Commodity Index Master Fund
Opinion on Internal Control over Financial Reporting
We have audited WisdomTree Continuous Commodity Index Master Fund’s internal control over financial reporting as of December 31, 2019, based on criteria established in Internal Control—Integrated Framework issued by the Committee of Sponsoring Organizations of the Treadway Commission (2013 framework) (the COSO criteria). In our opinion, WisdomTree Continuous Commodity Index Master Fund (the “Master Fund”) maintained, in all material respects, effective internal control over financial reporting as of December 31, 2019, based on the COSO criteria.
We also have audited, in accordance with the standards of the Public Company Accounting Oversight Board (United States) (PCAOB), the accompanying statements of financial condition, including the schedules of investments as of December 31, 2019 and 2018, the related statements of income and expenses, changes in shareholders’ equity and cash flows for each of the three years in the period ended December 31, 2019, and the related notes of the Master Fund and our report dated February 21, 2020 expressed an unqualified opinion thereon.
Basis for Opinion
The Master Fund’s management is responsible for maintaining effective internal control over financial reporting and for its assessment of the effectiveness of internal control over financial reporting included in the accompanying Management’s Report on Internal Control over Management’s Financial Reporting. Our responsibility is to express an opinion on the Master Fund’s internal control over financial reporting based on our audit. We are a public accounting firm registered with the PCAOB and are required to be independent with respect to the Master Fund in accordance with the U.S. federal securities laws and the applicable rules and regulations of the Securities and Exchange Commission and the PCAOB.
We conducted our audit in accordance with the standards of the PCAOB. Those standards require that we plan and perform the audit to obtain reasonable assurance about whether effective internal control over financial reporting was maintained in all material respects.
Our audit included obtaining an understanding of internal control over financial reporting, assessing the risk that a material weakness exists, testing and evaluating the design and operating effectiveness of internal control based on the assessed risk, and performing such other procedures as we considered necessary in the circumstances. We believe that our audit provides a reasonable basis for our opinion.
Definition and Limitations of Internal Control Over Financial Reporting
A company’s internal control over financial reporting is a process designed to provide reasonable assurance regarding the reliability of financial reporting and the preparation of financial statements for external purposes in accordance with generally accepted accounting principles. A company’s internal control over financial reporting includes those policies and procedures that (1) pertain to the maintenance of records that, in reasonable detail, accurately and fairly reflect the transactions and dispositions of the assets of the company; (2) provide reasonable assurance that transactions are recorded as necessary to permit preparation of financial statements in accordance with generally accepted accounting principles, and that receipts and expenditures of the company are being made only in accordance with authorizations of management and directors of the company; and (3) provide reasonable assurance regarding prevention or timely detection of unauthorized acquisition, use, or disposition of the company’s assets that could have a material effect on the financial statements.
F-6
Table of Contents
Because of its inherent limitations, internal control over financial reporting may not prevent or detect misstatements. Also, projections of any evaluation of effectiveness to future periods are subject to the risk that controls may become inadequate because of changes in conditions, or that the degree of compliance with the policies or procedures may deteriorate.
/s/ ERNST & YOUNG LLP
New York, NY
February 21, 2020
F-7
Table of Contents
WisdomTree Continuous Commodity Index Fund
Consolidated Statements of Financial Condition
December 31, 2019 and 2018
| December 31, 2019 |
December 31, 2018 |
|||||||
| Assets: |
||||||||
| Cash |
$ | 1,730,680 | $ | 1,542,378 | ||||
| Cash held by broker for futures contracts (Note 3) |
4,191,497 | 8,651,045 | ||||||
| Short-term investments (cost $115,820,868 and $143,563,956 as of December 31, 2019 and December 31, 2018, respectively) |
115,831,172 | 143,568,752 | ||||||
| Net unrealized appreciation on futures contracts |
6,162,155 | — | ||||||
| Receivable for capital shares sold |
— | 8,748,821 | ||||||
|
|
|
|
|
|||||
| Total Assets |
127,915,504 | 162,510,996 | ||||||
|
|
|
|
|
|||||
| Liabilities and shareholders’ equity: |
||||||||
| Net unrealized depreciation on futures contracts |
— | 7,560,832 | ||||||
| Net management fee payable to related party (Note 8) |
79,661 | 95,163 | ||||||
|
|
|
|
|
|||||
| Total Liabilities |
79,661 | 7,655,995 | ||||||
|
|
|
|
|
|||||
| Shareholders’ equity: |
||||||||
| General Units: |
||||||||
| Paid in capital – 50 units issued and outstanding (unlimited authorized) |
1,500 | 1,500 | ||||||
| Accumulated deficit |
(560 | ) | (625 | ) | ||||
|
|
|
|
|
|||||
| Total General Units |
940 | 875 | ||||||
|
|
|
|
|
|||||
| Limited Units: |
||||||||
| Paid in capital – 6,800,000 and 8,850,000 redeemable shares issued and outstanding (unlimited authorized) as of December 31, 2019 and December 31, 2018, respectively |
262,345,685 | 298,946,484 | ||||||
| Accumulated deficit |
(134,510,782 | ) | (144,092,358 | ) | ||||
|
|
|
|
|
|||||
| Total Limited Units |
127,834,903 | 154,854,126 | ||||||
|
|
|
|
|
|||||
| Total shareholders’ equity |
127,835,843 | 154,855,001 | ||||||
|
|
|
|
|
|||||
| Total liabilities and shareholders’ equity |
$ | 127,915,504 | $ | 162,510,996 | ||||
|
|
|
|
|
|||||
| Net asset value per share |
||||||||
| General Units |
$ | 18.80 | $ | 17.50 | ||||
|
|
|
|
|
|||||
| Limited Units |
$ | 18.80 | $ | 17.50 | ||||
|
|
|
|
|
|||||
See accompanying notes to consolidated financial statements
F-8
Table of Contents
WisdomTree Continuous Commodity Index Fund
Consolidated Schedule of Investments
December 31, 2019
| Description |
Percentage of Net Assets |
Fair Value |
Face Amount |
|||||||||
| U.S. Treasury Obligations |
||||||||||||
| U.S. Treasury Bills |
||||||||||||
| 1.69%, 1/2/20* |
22.68 | % | $ | 29,000,000 | $ | 29,000,000 | ||||||
| 1.65%, 1/23/20* |
22.67 | 28,975,217 | 29,000,000 | |||||||||
| 1.55%, 2/20/20* (a) |
22.64 | 28,940,397 | 29,000,000 | |||||||||
| 1.57%, 3/12/20* |
22.62 | 28,915,558 | 29,000,000 | |||||||||
|
|
|
|
|
|
|
|||||||
| Total U.S. Treasury Obligations (Cost: $115,820,868) |
90.61 | % | $ | 115,831,172 | $ | 116,000,000 | ||||||
|
|
|
|
|
|
|
|||||||
| Description |
Contracts | Unrealized Appreciation/ (Depreciation) Percentage of Net Assets |
Unrealized Appreciation/ (Depreciation) |
Notional Value |
||||||||||||
| Futures Contracts Long Exposure (Exchange-Traded) |
||||||||||||||||
| Cocoa |
||||||||||||||||
| expiration date 3/16/20 |
98 | 0.12 | % | $155,530 | $2,489,200 | |||||||||||
| expiration date 5/13/20 |
99 | 0.12 | 159,550 | 2,515,590 | ||||||||||||
| expiration date 7/16/20 |
99 | 0.04 | 45,850 | 2,510,640 | ||||||||||||
| Coffee “C” |
||||||||||||||||
| expiration date 3/19/20 |
51 | 0.31 | 399,787 | 2,480,513 | ||||||||||||
| expiration date 5/18/20 |
51 | 0.31 | 394,162 | 2,522,587 | ||||||||||||
| expiration date 7/21/20 |
50 | 0.21 | 271,069 | 2,511,562 | ||||||||||||
| Copper |
||||||||||||||||
| expiration date 3/27/20 |
36 | 0.12 | 153,663 | 2,517,300 | ||||||||||||
| expiration date 5/27/20 |
36 | 0.13 | 164,163 | 2,526,750 | ||||||||||||
| expiration date 7/29/20 |
35 | 0.07 | 85,050 | 2,462,688 | ||||||||||||
| Corn |
||||||||||||||||
| expiration date 3/13/20 |
127 | (0.11 | ) | (143,788 | ) | 2,462,213 | ||||||||||
| expiration date 5/14/20 |
127 | (0.11 | ) | (135,112 | ) | 2,506,662 | ||||||||||
| expiration date 7/14/20 |
127 | 0.00 | 3,863 | 2,546,350 | ||||||||||||
| Cotton No. 2 |
||||||||||||||||
| expiration date 3/9/20 |
72 | 0.13 | 160,700 | 2,485,800 | ||||||||||||
| expiration date 5/6/20 |
72 | 0.22 | 275,285 | 2,526,480 | ||||||||||||
| expiration date 7/9/20 |
71 | 0.08 | 106,580 | 2,518,725 | ||||||||||||
| Gold 100 Ounce |
||||||||||||||||
| expiration date 2/26/20 |
17 | 0.12 | 153,660 | 2,589,270 | ||||||||||||
| expiration date 4/28/20 |
16 | 0.02 | 23,480 | 2,446,880 | ||||||||||||
| expiration date 6/26/20 |
16 | 0.04 | 57,060 | 2,456,160 | ||||||||||||
| Lean Hogs |
||||||||||||||||
| expiration date 2/14/20 |
57 | (0.00 | ) | (4,330 | ) | 1,628,490 | ||||||||||
| expiration date 4/15/20 |
58 | (0.02 | ) | (23,410 | ) | 1,807,860 | ||||||||||
| expiration date 6/12/20 |
57 | (0.03 | ) | (32,640 | ) | 2,038,890 | ||||||||||
| expiration date 7/15/20 |
57 | (0.04 | ) | (46,170 | ) | 2,035,470 | ||||||||||
| Live Cattle |
||||||||||||||||
| expiration date 2/28/20 |
51 | 0.17 | 214,010 | 2,568,870 | ||||||||||||
| expiration date 4/30/20 |
50 | 0.15 | 187,730 | 2,543,500 | ||||||||||||
| expiration date 6/30/20 |
50 | 0.02 | 21,140 | 2,378,000 | ||||||||||||
See accompanying notes to consolidated financial statements
F-9
Table of Contents
WisdomTree Continuous Commodity Index Fund
Consolidated Schedule of Investments
December 31, 2019
(continued)
| Description |
Contracts | Unrealized Appreciation/ (Depreciation) Percentage of Net Assets |
Unrealized Appreciation/ (Depreciation) |
Notional Value |
||||||||||||
| Natural Gas |
||||||||||||||||
| expiration date 1/29/20 |
69 | (0.17 | )% | $(217,420 | ) | $1,510,410 | ||||||||||
| expiration date 2/26/20 |
69 | (0.14 | ) | (181,710 | ) | 1,489,020 | ||||||||||
| expiration date 3/27/20 |
69 | (0.06 | ) | (75,920 | ) | 1,482,810 | ||||||||||
| expiration date 4/28/20 |
69 | (0.08 | ) | (99,440 | ) | 1,509,720 | ||||||||||
| expiration date 5/27/20 |
69 | (0.07 | ) | (92,310 | ) | 1,549,740 | ||||||||||
| NY Harbor ULSD |
||||||||||||||||
| expiration date 1/31/20 |
18 | 0.11 | 135,677 | 1,529,237 | ||||||||||||
| expiration date 2/28/20 |
18 | 0.11 | 137,264 | 1,524,474 | ||||||||||||
| expiration date 3/31/20 |
18 | 0.11 | 145,618 | 1,511,773 | ||||||||||||
| expiration date 4/30/20 |
18 | 0.06 | 82,820 | 1,500,055 | ||||||||||||
| expiration date 5/29/20 |
17 | 0.06 | 78,074 | 1,407,508 | ||||||||||||
| Platinum |
||||||||||||||||
| expiration date 4/28/20 |
77 | 0.19 | 244,550 | 3,764,530 | ||||||||||||
| expiration date 7/29/20 |
76 | 0.21 | 270,210 | 3,737,680 | ||||||||||||
| Silver |
||||||||||||||||
| expiration date 3/27/20 |
28 | 0.06 | 78,295 | 2,508,940 | ||||||||||||
| expiration date 5/27/20 |
28 | 0.06 | 74,040 | 2,521,260 | ||||||||||||
| expiration date 7/29/20 |
27 | 0.06 | 75,760 | 2,442,015 | ||||||||||||
| Soybean |
||||||||||||||||
| expiration date 3/13/20 |
52 | 0.09 | 118,475 | 2,484,300 | ||||||||||||
| expiration date 5/14/20 |
52 | 0.10 | 127,738 | 2,518,750 | ||||||||||||
| expiration date 7/14/20 |
51 | 0.03 | 34,225 | 2,498,363 | ||||||||||||
| Soybean Oil |
||||||||||||||||
| expiration date 3/13/20 |
119 | 0.22 | 280,872 | 2,482,578 | ||||||||||||
| expiration date 5/14/20 |
119 | 0.23 | 290,004 | 2,503,284 | ||||||||||||
| expiration date 7/14/20 |
119 | 0.15 | 194,940 | 2,524,704 | ||||||||||||
| Sugar No. 11 |
||||||||||||||||
| expiration date 2/28/20 |
166 | 0.08 | 102,984 | 2,495,046 | ||||||||||||
| expiration date 4/30/20 |
165 | 0.12 | 148,053 | 2,502,192 | ||||||||||||
| expiration date 6/30/20 |
165 | 0.12 | 153,742 | 2,524,368 | ||||||||||||
| Wheat |
||||||||||||||||
| expiration date 3/13/20 |
90 | 0.19 | 237,137 | 2,514,375 | ||||||||||||
| expiration date 5/14/20 |
89 | 0.18 | 229,225 | 2,499,788 | ||||||||||||
| expiration date 7/14/20 |
89 | 0.12 | 159,650 | 2,507,575 | ||||||||||||
| WTI Crude Oil |
||||||||||||||||
| expiration date 1/21/20 |
25 | 0.13 | 164,900 | 1,526,500 | ||||||||||||
| expiration date 2/20/20 |
25 | 0.16 | 209,410 | 1,519,250 | ||||||||||||
| expiration date 3/20/20 |
25 | 0.16 | 208,020 | 1,510,250 | ||||||||||||
| expiration date 4/21/20 |
25 | 0.08 | 99,900 | 1,499,250 | ||||||||||||
| expiration date 5/19/20 |
24 | 0.08 | 100,490 | 1,426,560 | ||||||||||||
|
|
|
|
|
|
|
|||||||||||
| Total Futures Contracts Long Exposure (Exchange-Traded) |
4.82 | % | $6,162,155 | $127,602,755 | ||||||||||||
|
|
|
|
|
|
|
|||||||||||
| * | Interest rate shown reflects the yield to maturity at time of purchase. |
| (a) | All or a portion of this security is held by the broker as collateral for open futures contracts. The securities collateral posted was comprised entirely of U.S. Treasury securities having a market value of $9,979,447 as of December 31, 2019. |
See accompanying notes to consolidated financial statements
F-10
Table of Contents
WisdomTree Continuous Commodity Index Fund
Consolidated Schedule of Investments
December 31, 2018
| Description |
Percentage of Net Assets |
Fair Value |
Face Amount |
|||||||||
| U.S. Treasury Obligations |
||||||||||||
| U.S. Treasury Bills |
||||||||||||
| 2.29%, 1/17/19* |
27.10 | % | $ | 41,960,100 | $ | 42,000,000 | ||||||
| 2.33%, 2/7/19* |
17.39 | 26,936,314 | 27,000,000 | |||||||||
| 2.38%, 2/28/19*(a) |
25.73 | 39,849,504 | 40,000,000 | |||||||||
| 2.39%, 3/21/19* |
22.49 | 34,822,834 | 35,000,000 | |||||||||
|
|
|
|
|
|
|
|||||||
| Total U.S. Treasury Obligations (Cost: $143,563,956) |
92.71 | % | $ | 143,568,752 | $ | 144,000,000 | ||||||
|
|
|
|
|
|
|
|||||||
| Description |
Contracts | Unrealized Appreciation/ (Depreciation) Percentage of Net Assets |
Unrealized Appreciation/ (Depreciation) |
Notional Value |
||||||||||||
| Futures Contracts Long Exposure (Exchange-Traded) |
||||||||||||||||
| Cocoa |
||||||||||||||||
| expiration date 3/14/19 |
125 | 0.19 | % | $294,300 | $3,020,000 | |||||||||||
| expiration date 5/15/19 |
124 | 0.21 | 319,790 | 3,036,760 | ||||||||||||
| expiration date 7/16/19 |
124 | 0.10 | 155,170 | 3,050,400 | ||||||||||||
| Coffee “C” |
||||||||||||||||
| expiration date 3/19/19 |
77 | (0.13 | ) | (205,594 | ) | 2,940,919 | ||||||||||
| expiration date 5/20/19 |
77 | (0.13 | ) | (195,150 | ) | 3,030,431 | ||||||||||
| expiration date 7/19/19 |
78 | (0.22 | ) | (333,431 | ) | 3,153,150 | ||||||||||
| Copper |
||||||||||||||||
| expiration date 3/27/19 |
46 | (0.10 | ) | (148,663 | ) | 3,025,650 | ||||||||||
| expiration date 5/29/19 |
46 | (0.10 | ) | (152,875 | ) | 3,032,550 | ||||||||||
| expiration date 7/29/19 |
46 | (0.08 | ) | (126,363 | ) | 3,037,150 | ||||||||||
| Corn |
||||||||||||||||
| expiration date 3/14/19 |
159 | (0.04 | ) | (67,262 | ) | 2,981,250 | ||||||||||
| expiration date 5/14/19 |
159 | (0.04 | ) | (55,612 | ) | 3,044,850 | ||||||||||
| expiration date 7/12/19 |
158 | (0.03 | ) | (48,875 | ) | 3,086,925 | ||||||||||
| Cotton No. 2 |
||||||||||||||||
| expiration date 3/7/19 |
83 | (0.31 | ) | (479,230 | ) | 2,996,300 | ||||||||||
| expiration date 5/8/19 |
83 | (0.27 | ) | (410,890 | ) | 3,050,250 | ||||||||||
| expiration date 7/9/19 |
82 | (0.19 | ) | (293,870 | ) | 3,059,830 | ||||||||||
| Gold 100 Ounce |
||||||||||||||||
| expiration date 2/26/19 |
24 | (0.02 | ) | (33,380 | ) | 3,075,120 | ||||||||||
| expiration date 4/26/19 |
24 | 0.08 | 123,000 | 3,090,480 | ||||||||||||
| expiration date 6/26/19 |
23 | 0.07 | 111,220 | 2,976,660 | ||||||||||||
| Lean Hogs |
||||||||||||||||
| expiration date 2/14/19 |
78 | (0.01 | ) | (22,640 | ) | 1,902,420 | ||||||||||
| expiration date 4/12/19 |
78 | (0.01 | ) | (23,290 | ) | 2,092,740 | ||||||||||
| expiration date 6/14/19 |
78 | 0.00 | 2,400 | 2,541,240 | ||||||||||||
| expiration date 7/15/19 |
78 | (0.00 | ) | (6,130 | ) | 2,573,220 | ||||||||||
| Live Cattle |
||||||||||||||||
| expiration date 2/28/19 |
62 | 0.10 | 158,940 | 3,072,100 | ||||||||||||
| expiration date 4/30/19 |
62 | 0.11 | 173,850 | 3,131,000 | ||||||||||||
| expiration date 6/28/19 |
62 | 0.05 | 76,750 | 2,903,460 | ||||||||||||
See accompanying notes to consolidated financial statements
F-11
Table of Contents
WisdomTree Continuous Commodity Index Fund
Consolidated Schedule of Investments
December 31, 2018
(continued)
| Description |
Contracts | Unrealized Appreciation/ (Depreciation) Percentage of Net Assets |
Unrealized Appreciation/ (Depreciation) |
Notional Value |
||||||||||||
| Natural Gas |
||||||||||||||||
| expiration date 1/29/19 |
65 | (0.17 | )% | $(258,970 | ) | $1,911,000 | ||||||||||
| expiration date 2/26/19 |
65 | (0.16 | ) | (247,080 | ) | 1,853,150 | ||||||||||
| expiration date 3/27/19 |
65 | (0.03 | ) | (41,290 | ) | 1,743,950 | ||||||||||
| expiration date 4/26/19 |
66 | (0.02 | ) | (30,210 | ) | 1,763,520 | ||||||||||
| expiration date 5/29/19 |
66 | (0.01 | ) | (17,480 | ) | 1,793,220 | ||||||||||
| NY Harbor ULSD |
||||||||||||||||
| expiration date 1/31/19 |
26 | (0.25 | ) | (388,950 | ) | 1,833,905 | ||||||||||
| expiration date 2/28/19 |
26 | (0.26 | ) | (401,738 | ) | 1,823,531 | ||||||||||
| expiration date 3/29/19 |
26 | (0.27 | ) | (416,829 | ) | 1,808,461 | ||||||||||
| expiration date 4/30/19 |
26 | (0.27 | ) | (421,235 | ) | 1,807,151 | ||||||||||
| expiration date 5/31/19 |
26 | (0.25 | ) | (394,498 | ) | 1,815,778 | ||||||||||
| Platinum |
||||||||||||||||
| expiration date 4/26/19 |
113 | (0.11 | ) | (169,965 | ) | 4,523,390 | ||||||||||
| expiration date 7/29/19 |
113 | (0.22 | ) | (343,140 | ) | 4,551,640 | ||||||||||
| Silver |
||||||||||||||||
| expiration date 3/27/19 |
39 | 0.04 | 55,325 | 3,030,300 | ||||||||||||
| expiration date 5/29/19 |
39 | 0.03 | 40,710 | 3,047,070 | ||||||||||||
| expiration date 7/29/19 |
38 | 0.12 | 184,335 | 2,985,090 | ||||||||||||
| Soybean |
||||||||||||||||
| expiration date 3/14/19 |
66 | (0.01 | ) | (12,886 | ) | 2,953,500 | ||||||||||
| expiration date 5/14/19 |
67 | (0.01 | ) | (19,312 | ) | 3,040,962 | ||||||||||
| expiration date 7/12/19 |
67 | (0.00 | ) | (1,050 | ) | 3,082,837 | ||||||||||
| Soybean Oil |
||||||||||||||||
| expiration date 3/14/19 |
180 | (0.07 | ) | (108,978 | ) | 3,007,800 | ||||||||||
| expiration date 5/14/19 |
180 | (0.08 | ) | (116,226 | ) | 3,036,960 | ||||||||||
| expiration date 7/12/19 |
180 | (0.04 | ) | (59,586 | ) | 3,065,040 | ||||||||||
| Sugar No. 11 |
||||||||||||||||
| expiration date 2/28/19 |
224 | (0.00 | ) | (7,101 | ) | 3,018,086 | ||||||||||
| expiration date 4/30/19 |
223 | 0.01 | 19,432 | 3,022,096 | ||||||||||||
| expiration date 6/28/19 |
223 | (0.13 | ) | (200,749 | ) | 3,057,062 | ||||||||||
| Wheat |
||||||||||||||||
| expiration date 3/14/19 |
119 | (0.20 | ) | (315,438 | ) | 2,994,338 | ||||||||||
| expiration date 5/14/19 |
119 | (0.22 | ) | (342,700 | ) | 3,037,475 | ||||||||||
| expiration date 7/12/19 |
118 | (0.07 | ) | (109,488 | ) | 3,059,150 | ||||||||||
| WTI Crude Oil |
||||||||||||||||
| expiration date 1/22/19 |
40 | (0.32 | ) | (488,260 | ) | 1,816,400 | ||||||||||
| expiration date 2/20/19 |
40 | (0.33 | ) | (504,050 | ) | 1,828,800 | ||||||||||
| expiration date 3/20/19 |
39 | (0.30 | ) | (471,160 | ) | 1,797,120 | ||||||||||
| expiration date 4/22/19 |
39 | (0.25 | ) | (383,110 | ) | 1,813,890 | ||||||||||
| expiration date 5/21/19 |
39 | (0.26 | ) | (401,320 | ) | 1,830,270 | ||||||||||
|
|
|
|
|
|
|
|||||||||||
| Total Futures Contracts Long Exposure (Exchange-Traded) |
(4.88 | )% | $(7,560,832 | ) | $154,657,797 | |||||||||||
|
|
|
|
|
|
|
|||||||||||
| * | Interest rate shown reflects the yield to maturity at the time of purchase. |
| (a) | All or a portion of this security is held by the broker as collateral for open futures contracts. The securities collateral posted was comprised entirely of U.S. Treasury securities having a market value of $12,951,089 as of December 31, 2018. |
See accompanying notes to consolidated financial statements
F-12
Table of Contents
WisdomTree Continuous Commodity Index Fund
Consolidated Statements of Income and Expenses
For the Years Ended December 31, 2019, 2018 and 2017
| 2019 | 2018 | 2017 | ||||||||||
| Income: |
||||||||||||
| Interest income |
$ | 2,753,909 | $ | 2,850,715 | $ | 1,356,236 | ||||||
|
|
|
|
|
|
|
|||||||
| Expenses: |
||||||||||||
| Management fee to related party (Note 8) |
1,140,124 | 1,436,067 | 1,513,176 | |||||||||
|
|
|
|
|
|
|
|||||||
| Total expenses |
1,140,124 | 1,436,067 | 1,513,176 | |||||||||
|
|
|
|
|
|
|
|||||||
| Expense waivers (Note 8) |
(134,132 | ) | (168,949 | ) | (178,022 | ) | ||||||
|
|
|
|
|
|
|
|||||||
| Net expenses |
1,005,992 | 1,267,118 | 1,335,154 | |||||||||
|
|
|
|
|
|
|
|||||||
| Net investment gain |
1,747,917 | 1,583,597 | 21,082 | |||||||||
|
|
|
|
|
|
|
|||||||
| Net Realized and Unrealized Gain (Loss) on Investments and Futures Contracts: |
||||||||||||
| Net Realized Gain (Loss) from: |
||||||||||||
| Investments |
1,961 | (150 | ) | (11,445 | ) | |||||||
| Futures Contracts* |
(5,896,732 | ) | (8,933,189 | ) | (3,917,989 | ) | ||||||
|
|
|
|
|
|
|
|||||||
| Net Realized Loss |
(5,894,771 | ) | (8,933,339 | ) | (3,929,434 | ) | ||||||
|
|
|
|
|
|
|
|||||||
| Net Increase (Decrease) in Unrealized Appreciation/Depreciation from: |
||||||||||||
| Investments |
5,508 | 4,361 | (5,186 | ) | ||||||||
| Futures Contracts |
13,722,987 | (8,597,597 | ) | 2,461,480 | ||||||||
|
|
|
|
|
|
|
|||||||
| Net Increase (Decrease) in Unrealized Appreciation/Depreciation |
13,728,495 | (8,593,236 | ) | 2,456,294 | ||||||||
|
|
|
|
|
|
|
|||||||
| Net Realized and Unrealized Gain (Loss) on Investments and Futures Contracts |
7,833,724 | (17,526,575 | ) | (1,473,140 | ) | |||||||
|
|
|
|
|
|
|
|||||||
| Net Gain (Loss) |
$ | 9,581,641 | $ | (15,942,978 | ) | $ | (1,452,058 | ) | ||||
|
|
|
|
|
|
|
|||||||
| * Includes brokerage commissions of: |
$ | (142,775 | ) | $ | (175,786 | ) | $ | (178,822 | ) | |||
|
|
|
|
|
|
|
|||||||
See accompanying notes to consolidated financial statements
F-13
Table of Contents
WisdomTree Continuous Commodity Index Fund
Consolidated Statement of Changes in Shareholders’ Equity
For the Three Months Ended December 31, 2019
| General Units | Limited Units | Total | ||||||||||||||||||||||||||||||||||
|
General Units |
Accumulated Deficit |
Total General Shareholders’ Equity |
Limited Units |
Accumulated Deficit |
Total Limited Shareholders’ Equity |
Total Shareholders’ Equity |
||||||||||||||||||||||||||||||
| Units | Amount | Units | Amount | |||||||||||||||||||||||||||||||||
| Balance at September 30, 2019 |
50 | $ | 1,500 | $ | (622 | ) | $ | 878 | 6,500,000 | $ | 256,974,925 | $ | (142,865,542 | ) | $ | 114,109,383 | $ | 114,110,261 | ||||||||||||||||||
| Creation of Units |
— | — | — | — | 450,000 | 8,021,089 | — | 8,021,089 | 8,021,089 | |||||||||||||||||||||||||||
| Redemption of Units |
— | — | — | — | (150,000 | ) | (2,650,329 | ) | — | (2,650,329 | ) | (2,650,329 | ) | |||||||||||||||||||||||
| Net Gain (Loss): |
||||||||||||||||||||||||||||||||||||
| Net Investment Income |
— | — | 3 | 3 | — | — | 275,714 | 275,714 | 275,717 | |||||||||||||||||||||||||||
| Net Realized Gain from Investments and Futures Contracts |
— | — | 16 | 16 | — | — | 2,416,150 | 2,416,150 | 2,416,166 | |||||||||||||||||||||||||||
| Net Increase in Unrealized Appreciation/Depreciation from Investments and Futures Contracts |
— | — | 43 | 43 | — | — | 5,662,896 | 5,662,896 | 5,662,939 | |||||||||||||||||||||||||||
|
|
|
|
|
|
|
|
|
|
|
|
|
|
|
|
|
|
|
|||||||||||||||||||
| Net Gain |
— | — | 62 | 62 | — | — | 8,354,760 | 8,354,760 | 8,354,822 | |||||||||||||||||||||||||||
|
|
|
|
|
|
|
|
|
|
|
|
|
|
|
|
|
|
|
|||||||||||||||||||
| Balance at December 31, 2019 |
50 | $ | 1,500 | $ | (560 | ) | $ | 940 | 6,800,000 | $ | 262,345,685 | $ | (134,510,782 | ) | $ | 127,834,903 | $ | 127,835,843 | ||||||||||||||||||
|
|
|
|
|
|
|
|
|
|
|
|
|
|
|
|
|
|
|
|||||||||||||||||||
For the Year Ended December 31, 2019
| General Units | Limited Units | Total | ||||||||||||||||||||||||||||||||||
|
General Units |
Accumulated Deficit |
Total General Shareholders’ Equity |
Limited Units |
Accumulated Deficit |
Total Limited Shareholders’ Equity |
Total Shareholders’ Equity |
||||||||||||||||||||||||||||||
| Units | Amount | Units | Amount | |||||||||||||||||||||||||||||||||
| Balance at December 31, 2018 |
50 | $ | 1,500 | $ | (625 | ) | $ | 875 | 8,850,000 | $ | 298,946,484 | $ | (144,092,358 | ) | $ | 154,854,126 | $ | 154,855,001 | ||||||||||||||||||
| Creation of Units |
— | — | — | — | 1,050,000 | 18,530,911 | — | 18,530,911 | 18,530,911 | |||||||||||||||||||||||||||
| Redemption of Units |
— | — | — | — | (3,100,000 | ) | (55,131,710 | ) | — | (55,131,710 | ) | (55,131,710 | ) | |||||||||||||||||||||||
| Net Gain (Loss): |
||||||||||||||||||||||||||||||||||||
| Net Investment Income |
— | — | 12 | 12 | — | — | 1,747,905 | 1,747,905 | 1,747,917 | |||||||||||||||||||||||||||
| Net Realized Loss from Investments and Futures Contracts |
— | — | (41 | ) | (41 | ) | — | — | (5,894,730 | ) | (5,894,730 | ) | (5,894,771 | ) | ||||||||||||||||||||||
| Net Increase in Unrealized Appreciation/ Depreciation from Investments and Futures Contracts |
— | — | 94 | 94 | — | — | 13,728,401 | 13,728,401 | 13,728,495 | |||||||||||||||||||||||||||
|
|
|
|
|
|
|
|
|
|
|
|
|
|
|
|
|
|
|
|||||||||||||||||||
| Net Gain |
— | — | 65 | 65 | — | — | 9,581,576 | 9,581,576 | 9,581,641 | |||||||||||||||||||||||||||
|
|
|
|
|
|
|
|
|
|
|
|
|
|
|
|
|
|
|
|||||||||||||||||||
| Balance at December 31, 2019 |
50 | $ | 1,500 | $ | (560 | ) | $ | 940 | 6,800,000 | $ | 262,345,685 | $ | (134,510,782 | ) | $ | 127,834,903 | $ | 127,835,843 | ||||||||||||||||||
|
|
|
|
|
|
|
|
|
|
|
|
|
|
|
|
|
|
|
|||||||||||||||||||
See accompanying notes to consolidated financial statements
F-14
Table of Contents
WisdomTree Continuous Commodity Index Fund
Consolidated Statement of Changes in Shareholders’ Equity
For the Three Months Ended December 31, 2018
| General Units | Limited Units | Total | ||||||||||||||||||||||||||||||||||
|
General Units |
Accumulated Deficit |
Total General Shareholders’ Equity |
Limited Units |
Accumulated Deficit |
Total Limited Shareholders’ Equity |
Total Shareholders’ Equity |
||||||||||||||||||||||||||||||
| Units | Amount | Units | Amount | |||||||||||||||||||||||||||||||||
| Balance at September 30, 2018 |
50 | $ | 1,500 | $ | (596 | ) | $ | 904 | 8,800,000 | $ | 298,413,411 | $ | (139,312,237 | ) | $ | 159,101,174 | $ | 159,102,078 | ||||||||||||||||||
| Creation of Units |
— | — | — | — | 500,000 | 8,748,821 | — | 8,748,821 | 8,748,821 | |||||||||||||||||||||||||||
| Redemption of Units |
— | — | — | — | (450,000 | ) | (8,215,748 | ) | — | (8,215,748 | ) | (8,215,748 | ) | |||||||||||||||||||||||
| Net Gain (Loss): |
||||||||||||||||||||||||||||||||||||
| Net Investment Income |
— | — | 3 | 3 | — | — | 525,065 | 525,065 | 525,068 | |||||||||||||||||||||||||||
| Net Realized Loss from Investments and Futures Contracts |
— | — | (11 | ) | (11 | ) | — | — | (1,595,570 | ) | (1,595,570 | ) | (1,595,581 | ) | ||||||||||||||||||||||
| Net Decrease in Unrealized Appreciation/Depreciation from Investments and Futures Contracts |
— | — | (21 | ) | (21 | ) | — | — | (3,709,616 | ) | (3,709,616 | ) | (3,709,637 | ) | ||||||||||||||||||||||
|
|
|
|
|
|
|
|
|
|
|
|
|
|
|
|
|
|
|
|||||||||||||||||||
| Net Loss |
— | — | (29 | ) | (29 | ) | — | — | (4,780,121 | ) | (4,780,121 | ) | (4,780,150 | ) | ||||||||||||||||||||||
|
|
|
|
|
|
|
|
|
|
|
|
|
|
|
|
|
|
|
|||||||||||||||||||
| Balance at December 31, 2018 |
50 | $ | 1,500 | $ | (625 | ) | $ | 875 | 8,850,000 | $ | 298,946,484 | $ | (144,092,358 | ) | $ | 154,854,126 | $ | 154,855,001 | ||||||||||||||||||
|
|
|
|
|
|
|
|
|
|
|
|
|
|
|
|
|
|
|
|||||||||||||||||||
For the Year Ended December 31, 2018
| General Units | Limited Units | Total | ||||||||||||||||||||||||||||||||||
|
General Units |
Accumulated Deficit |
Total General Shareholders’ Equity |
Limited Units |
Accumulated Deficit |
Total Limited Shareholders’ Equity |
Total Shareholders’ Equity |
||||||||||||||||||||||||||||||
| Units | Amount | Units | Amount | |||||||||||||||||||||||||||||||||
| Balance at December 31, 2017 |
50 | $ | 1,500 | $ | (538 | ) | $ | 962 | 8,050,000 | $ | 283,104,814 | $ | (128,149,467 | ) | $ | 154,955,347 | $ | 154,956,309 | ||||||||||||||||||
| Creation of Units |
— | — | — | — | 2,750,000 | 51,769,691 | — | 51,769,691 | 51,769,691 | |||||||||||||||||||||||||||
| Redemption of Units |
— | — | — | — | (1,950,000 | ) | (35,928,021 | ) | — | (35,928,021 | ) | (35,928,021 | ) | |||||||||||||||||||||||
| Net Gain (Loss): |
||||||||||||||||||||||||||||||||||||
| Net Investment Income |
— | — | 9 | 9 | — | — | 1,583,588 | 1,583,588 | 1,583,597 | |||||||||||||||||||||||||||
| Net Realized Loss from Investments and Futures Contracts |
— | — | (55 | ) | (55 | ) | — | — | (8,933,284 | ) | (8,933,284 | ) | (8,933,339 | ) | ||||||||||||||||||||||
| Net Decrease in Unrealized Appreciation/Depreciation from Investments and Futures Contracts |
— | — | (41 | ) | (41 | ) | — | — | (8,593,195 | ) | (8,593,195 | ) | (8,593,236 | ) | ||||||||||||||||||||||
|
|
|
|
|
|
|
|
|
|
|
|
|
|
|
|
|
|
|
|||||||||||||||||||
| Net Loss |
— | — | (87 | ) | (87 | ) | — | — | (15,942,891 | ) | (15,942,891 | ) | (15,942,978 | ) | ||||||||||||||||||||||
|
|
|
|
|
|
|
|
|
|
|
|
|
|
|
|
|
|
|
|||||||||||||||||||
| Balance at December 31, 2018 |
50 | $ | 1,500 | $ | (625 | ) | $ | 875 | 8,850,000 | $ | 298,946,484 | $ | (144,092,358 | ) | $ | 154,854,126 | $ | 154,855,001 | ||||||||||||||||||
|
|
|
|
|
|
|
|
|
|
|
|
|
|
|
|
|
|
|
|||||||||||||||||||
See accompanying notes to consolidated financial statements
F-15
Table of Contents
WisdomTree Continuous Commodity Index Fund
Consolidated Statement of Changes in Shareholders’ Equity
For the Three Months Ended December 31, 2017
| General Units | Limited Units | Total | ||||||||||||||||||||||||||||||||||
|
General Units |
Accumulated Deficit |
Total General Shareholders’ Equity |
Limited Units |
Accumulated Deficit |
Total Limited Shareholders’ Equity |
Total Shareholders’ Equity |
||||||||||||||||||||||||||||||
| Units | Amount | Units | Amount | |||||||||||||||||||||||||||||||||
| Balance at September 30, 2017 |
50 | $ | 1,500 | $ | (562 | ) | $ | 938 | 8,550,000 | $ | 292,540,700 | $ | (132,132,200 | ) | $ | 160,408,500 | $ | 160,409,438 | ||||||||||||||||||
| Creation of Units |
— | — | — | — | — | — | — | — | — | |||||||||||||||||||||||||||
| Redemption of Units |
— | — | — | — | (500,000 | ) | (9,435,886 | ) | — | (9,435,886 | ) | (9,435,886 | ) | |||||||||||||||||||||||
| Net Gain (Loss): |
||||||||||||||||||||||||||||||||||||
| Net Investment Income |
— | — | 0 | * | 0 | * | — | — | 118,482 | 118,482 | 118,482 | |||||||||||||||||||||||||
| Net Realized Gain from Investments and Futures Contracts |
— | — | 11 | 11 | — | — | 1,853,766 | 1,853,766 | 1,853,777 | |||||||||||||||||||||||||||
| Net Increase in Unrealized Appreciation/Depreciation from Investments and Futures Contracts |
— | — | 13 | 13 | — | — | 2,010,485 | 2,010,485 | 2,010,498 | |||||||||||||||||||||||||||
|
|
|
|
|
|
|
|
|
|
|
|
|
|
|
|
|
|
|
|||||||||||||||||||
| Net Gain |
— | — | 24 | 24 | — | — | 3,982,733 | 3,982,733 | 3,982,757 | |||||||||||||||||||||||||||
|
|
|
|
|
|
|
|
|
|
|
|
|
|
|
|
|
|
|
|||||||||||||||||||
| Balance at December 31, 2017 |
50 | $ | 1,500 | $ | (538 | ) | $ | 962 | 8,050,000 | $ | 283,104,814 | $ | (128,149,467 | ) | $ | 154,955,347 | $ | 154,956,309 | ||||||||||||||||||
|
|
|
|
|
|
|
|
|
|
|
|
|
|
|
|
|
|
|
|||||||||||||||||||
For the Year Ended December 31, 2017
| General Units | Limited Units | Total | ||||||||||||||||||||||||||||||||||
|
General Units |
Accumulated Deficit |
Total General Shareholders’ Equity |
Limited Units |
Accumulated Deficit |
Total Limited Shareholders’ Equity |
Total Shareholders’ Equity |
||||||||||||||||||||||||||||||
| Units | Amount | Units | Amount | |||||||||||||||||||||||||||||||||
| Balance at December 31, 2016 |
50 | $ | 1,500 | $ | (533 | ) | $ | 967 | 11,350,000 | $ | 346,357,042 | $ | (126,697,414 | ) | $ | 219,659,628 | $ | 219,660,595 | ||||||||||||||||||
| Creation of Units |
— | — | — | — | 150,000 | 2,942,102 | — | 2,942,102 | 2,942,102 | |||||||||||||||||||||||||||
| Redemption of Units |
— | — | — | — | (3,450,000 | ) | (66,194,330 | ) | — | (66,194,330 | ) | (66,194,330 | ) | |||||||||||||||||||||||
| Net Gain (Loss): |
||||||||||||||||||||||||||||||||||||
| Net Investment Income |
— | — | 0 | * | 0 | * | — | — | 21,082 | 21,082 | 21,082 | |||||||||||||||||||||||||
| Net Realized Loss from Investments and Futures Contracts |
— | — | (24 | ) | (24 | ) | — | — | (3,929,410 | ) | (3,929,410 | ) | (3,929,434 | ) | ||||||||||||||||||||||
| Net Increase in Unrealized Appreciation/Depreciation from Investments and Futures Contracts |
— | — | 19 | 19 | — | — | 2,456,275 | 2,456,275 | 2,456,294 | |||||||||||||||||||||||||||
|
|
|
|
|
|
|
|
|
|
|
|
|
|
|
|
|
|
|
|||||||||||||||||||
| Net Loss |
— | — | (5 | ) | (5 | ) | — | — | (1,452,053 | ) | (1,452,053 | ) | (1,452,058 | ) | ||||||||||||||||||||||
|
|
|
|
|
|
|
|
|
|
|
|
|
|
|
|
|
|
|
|||||||||||||||||||
| Balance at December 31, 2017 |
50 | $ | 1,500 | $ | (538 | ) | $ | 962 | 8,050,000 | $ | 283,104,814 | $ | (128,149,467 | ) | $ | 154,955,347 | $ | 154,956,309 | ||||||||||||||||||
|
|
|
|
|
|
|
|
|
|
|
|
|
|
|
|
|
|
|
|||||||||||||||||||
| * | Amount represents less than $1. |
See accompanying notes to consolidated financial statements
F-16
Table of Contents
WisdomTree Continuous Commodity Index Fund
Consolidated Statements of Cash Flows
For the Years Ended December 31, 2019, 2018 and 2017
| 2019 | 2018 | 2017 | ||||||||||
| Cash flows from operating activities |
||||||||||||
| Net Gain (Loss) |
$ | 9,581,641 | $ | (15,942,978 | ) | $ | (1,452,058 | ) | ||||
| Adjustments to reconcile net gain (loss) to net cash provided by (used for) operating activities: |
||||||||||||
| Purchases of investment securities |
(525,965,574 | ) | (691,967,507 | ) | (656,510,527 | ) | ||||||
| Proceeds from sales/maturities of investment securities |
556,408,294 | 693,984,170 | 714,898,283 | |||||||||
| Net accretion of discount |
(2,697,671 | ) | (2,797,569 | ) | (1,349,302 | ) | ||||||
| Net realized gain (loss) on investment securities |
(1,961 | ) | 150 | 11,445 | ||||||||
| Net change in unrealized appreciation/depreciation from investments |
(5,508 | ) | (4,361 | ) | 5,186 | |||||||
| Net change in unrealized appreciation/depreciation from futures contracts |
(13,722,987 | ) | 8,597,597 | (2,461,480 | ) | |||||||
| Changes in assets and liabilities |
||||||||||||
| Increase/(Decrease) in liabilities: |
||||||||||||
| Net management fee payable to related party |
(15,502 | ) | (1,920 | ) | (61,360 | ) | ||||||
| Accrued brokerage fees and expenses payable |
— | — | (173,182 | ) | ||||||||
|
|
|
|
|
|
|
|||||||
| Net cash provided by (used for) operating activities |
23,580,732 | (8,132,418 | ) | 52,907,005 | ||||||||
|
|
|
|
|
|
|
|||||||
| Cash flows from financing activities |
||||||||||||
| Proceeds from creation of Limited Units |
27,279,732 | 43,020,870 | 2,942,102 | |||||||||
| Redemption of Limited Units |
(55,131,710 | ) | (35,928,021 | ) | (66,194,330 | ) | ||||||
|
|
|
|
|
|
|
|||||||
| Net cash provided by (used for) financing activities |
(27,851,978 | ) | 7,092,849 | (63,252,228 | ) | |||||||
|
|
|
|
|
|
|
|||||||
| Net decrease in cash |
(4,271,246 | ) | (1,039,569 | ) | (10,345,223 | ) | ||||||
| Cash* at beginning of year |
10,193,423 | 11,232,992 | 21,578,215 | |||||||||
|
|
|
|
|
|
|
|||||||
| Cash* at end of year |
$ | 5,922,177 | $ | 10,193,423 | $ | 11,232,992 | ||||||
|
|
|
|
|
|
|
|||||||
| * | Includes cash held by the broker for futures contracts. |
See accompanying notes to consolidated financial statements
F-17
Table of Contents
WisdomTree Continuous Commodity Index Master Fund
Statements of Financial Condition
December 31, 2019 and 2018
| December 31, 2019 |
December 31, 2018 |
|||||||
| Assets: |
||||||||
| Cash |
$ | 1,730,680 | $ | 1,542,378 | ||||
| Cash held by broker for futures contracts (Note 3) |
4,191,497 | 8,651,045 | ||||||
| Short-term investments (cost $115,820,868 and $143,563,956 as of December 31, 2019 and December 31, 2018, respectively) |
115,831,172 | 143,568,752 | ||||||
| Net unrealized appreciation on futures contracts |
6,162,155 | — | ||||||
| Receivable for capital shares sold |
— | 8,748,821 | ||||||
|
|
|
|
|
|||||
| Total Assets |
127,915,504 | 162,510,996 | ||||||
|
|
|
|
|
|||||
| Liabilities and shareholders’ equity: |
||||||||
| Net unrealized depreciation on futures contracts |
— | 7,560,832 | ||||||
| Net management fee payable to related party (Note 8) |
79,661 | 95,163 | ||||||
|
|
|
|
|
|||||
| Total Liabilities |
79,661 | 7,655,995 | ||||||
|
|
|
|
|
|||||
| Shareholders’ equity: |
||||||||
| General Units: |
||||||||
| Paid in capital – 50 units issued and outstanding (unlimited authorized) |
1,500 | 1,500 | ||||||
| Accumulated deficit |
(560 | ) | (625 | ) | ||||
|
|
|
|
|
|||||
| Total General Units |
940 | 875 | ||||||
|
|
|
|
|
|||||
| Limited Units: |
||||||||
| Paid in capital – 6,800,000 and 8,850,000 redeemable shares issued and outstanding (unlimited authorized) as of December 31, 2019 and December 31, 2018, respectively |
262,345,685 | 298,946,484 | ||||||
| Accumulated deficit |
(134,510,782 | ) | (144,092,358 | ) | ||||
|
|
|
|
|
|||||
| Total Limited Units |
127,834,903 | 154,854,126 | ||||||
|
|
|
|
|
|||||
| Total shareholders’ equity |
127,835,843 | 154,855,001 | ||||||
|
|
|
|
|
|||||
| Total liabilities and shareholders’ equity |
$ | 127,915,504 | $ | 162,510,996 | ||||
|
|
|
|
|
|||||
| Net asset value per share |
||||||||
| General Units |
$ | 18.80 | $ | 17.50 | ||||
|
|
|
|
|
|||||
| Limited Units |
$ | 18.80 | $ | 17.50 | ||||
|
|
|
|
|
|||||
See accompanying notes to consolidated financial statements
F-18
Table of Contents
WisdomTree Continuous Commodity Index Master Fund
December 31, 2019
| Description |
Percentage of Net Assets |
Fair Value |
Face Amount |
|||||||||||
| U.S. Treasury Obligations |
||||||||||||||
| U.S. Treasury Bills |
||||||||||||||
| 1.69%, 1/2/20* |
22.68 | % | $ | 29,000,000 | $ | 29,000,000 | ||||||||
| 1.65%, 1/23/20* |
22.67 | 28,975,217 | 29,000,000 | |||||||||||
| 1.55%, 2/20/20* (a) |
22.64 | 28,940,397 | 29,000,000 | |||||||||||
| 1.57%, 3/12/20* |
22.62 | 28,915,558 | 29,000,000 | |||||||||||
|
|
|
|
|
|
|
|||||||||
| Total U.S. Treasury Obligations (Cost: $115,820,868) |
90.61 | % | $ | 115,831,172 | $ | 116,000,000 | ||||||||
|
|
|
|
|
|
|
|||||||||
| Description |
Contracts | Unrealized Appreciation/ (Depreciation) Percentage of Net Assets |
Unrealized Appreciation/ (Depreciation) |
Notional Value |
||||||||||||
| Futures Contracts Long Exposure (Exchange-Traded) |
||||||||||||||||
| Cocoa |
||||||||||||||||
| expiration date 3/16/20 |
98 | 0.12 | % | $ | 155,530 | $ | 2,489,200 | |||||||||
| expiration date 5/13/20 |
99 | 0.12 | 159,550 | 2,515,590 | ||||||||||||
| expiration date 7/16/20 |
99 | 0.04 | 45,850 | 2,510,640 | ||||||||||||
| Coffee “C” |
||||||||||||||||
| expiration date 3/19/20 |
51 | 0.31 | 399,787 | 2,480,513 | ||||||||||||
| expiration date 5/18/20 |
51 | 0.31 | 394,162 | 2,522,587 | ||||||||||||
| expiration date 7/21/20 |
50 | 0.21 | 271,069 | 2,511,562 | ||||||||||||
| Copper |
||||||||||||||||
| expiration date 3/27/20 |
36 | 0.12 | 153,663 | 2,517,300 | ||||||||||||
| expiration date 5/27/20 |
36 | 0.13 | 164,163 | 2,526,750 | ||||||||||||
| expiration date 7/29/20 |
35 | 0.07 | 85,050 | 2,462,688 | ||||||||||||
| Corn |
||||||||||||||||
| expiration date 3/13/20 |
127 | (0.11 | ) | (143,788 | ) | 2,462,213 | ||||||||||
| expiration date 5/14/20 |
127 | (0.11 | ) | (135,112 | ) | 2,506,662 | ||||||||||
| expiration date 7/14/20 |
127 | 0.00 | 3,863 | 2,546,350 | ||||||||||||
| Cotton No. 2 |
||||||||||||||||
| expiration date 3/9/20 |
72 | 0.13 | 160,700 | 2,485,800 | ||||||||||||
| expiration date 5/6/20 |
72 | 0.22 | 275,285 | 2,526,480 | ||||||||||||
| expiration date 7/9/20 |
71 | 0.08 | 106,580 | 2,518,725 | ||||||||||||
| Gold 100 Ounce |
||||||||||||||||
| expiration date 2/26/20 |
17 | 0.12 | 153,660 | 2,589,270 | ||||||||||||
| expiration date 4/28/20 |
16 | 0.02 | 23,480 | 2,446,880 | ||||||||||||
| expiration date 6/26/20 |
16 | 0.04 | 57,060 | 2,456,160 | ||||||||||||
| Lean Hogs |
||||||||||||||||
| expiration date 2/14/20 |
57 | (0.00 | ) | (4,330 | ) | 1,628,490 | ||||||||||
| expiration date 4/15/20 |
58 | (0.02 | ) | (23,410 | ) | 1,807,860 | ||||||||||
| expiration date 6/12/20 |
57 | (0.03 | ) | (32,640 | ) | 2,038,890 | ||||||||||
| expiration date 7/15/20 |
57 | (0.04 | ) | (46,170 | ) | 2,035,470 | ||||||||||
| Live Cattle |
||||||||||||||||
| expiration date 2/28/20 |
51 | 0.17 | 214,010 | 2,568,870 | ||||||||||||
| expiration date 4/30/20 |
50 | 0.15 | 187,730 | 2,543,500 | ||||||||||||
| expiration date 6/30/20 |
50 | 0.02 | 21,140 | 2,378,000 | ||||||||||||
See accompanying notes to consolidated financial statements
F-19
Table of Contents
WisdomTree Continuous Commodity Index Master Fund
Schedule of Investments
December 31, 2019
(continued)
| Description |
Contracts | Unrealized Appreciation/ (Depreciation) Percentage of Net Assets |
Unrealized Appreciation/ (Depreciation) |
Notional Value |
||||||||||||
| Natural Gas |
||||||||||||||||
| expiration date 1/29/20 |
69 | (0.17 | )% | $ | (217,420 | ) | $ | 1,510,410 | ||||||||
| expiration date 2/26/20 |
69 | (0.14 | ) | (181,710 | ) | 1,489,020 | ||||||||||
| expiration date 3/27/20 |
69 | (0.06 | ) | (75,920 | ) | 1,482,810 | ||||||||||
| expiration date 4/28/20 |
69 | (0.08 | ) | (99,440 | ) | 1,509,720 | ||||||||||
| expiration date 5/27/20 |
69 | (0.07 | ) | (92,310 | ) | 1,549,740 | ||||||||||
| NY Harbor ULSD |
||||||||||||||||
| expiration date 1/31/20 |
18 | 0.11 | 135,677 | 1,529,237 | ||||||||||||
| expiration date 2/28/20 |
18 | 0.11 | 137,264 | 1,524,474 | ||||||||||||
| expiration date 3/31/20 |
18 | 0.11 | 145,618 | 1,511,773 | ||||||||||||
| expiration date 4/30/20 |
18 | 0.06 | 82,820 | 1,500,055 | ||||||||||||
| expiration date 5/29/20 |
17 | 0.06 | 78,074 | 1,407,508 | ||||||||||||
| Platinum |
||||||||||||||||
| expiration date 4/28/20 |
77 | 0.19 | 244,550 | 3,764,530 | ||||||||||||
| expiration date 7/29/20 |
76 | 0.21 | 270,210 | 3,737,680 | ||||||||||||
| Silver |
||||||||||||||||
| expiration date 3/27/20 |
28 | 0.06 | 78,295 | 2,508,940 | ||||||||||||
| expiration date 5/27/20 |
28 | 0.06 | 74,040 | 2,521,260 | ||||||||||||
| expiration date 7/29/20 |
27 | 0.06 | 75,760 | 2,442,015 | ||||||||||||
| Soybean |
||||||||||||||||
| expiration date 3/13/20 |
52 | 0.09 | 118,475 | 2,484,300 | ||||||||||||
| expiration date 5/14/20 |
52 | 0.10 | 127,738 | 2,518,750 | ||||||||||||
| expiration date 7/14/20 |
51 | 0.03 | 34,225 | 2,498,363 | ||||||||||||
| Soybean Oil |
||||||||||||||||
| expiration date 3/13/20 |
119 | 0.22 | 280,872 | 2,482,578 | ||||||||||||
| expiration date 5/14/20 |
119 | 0.23 | 290,004 | 2,503,284 | ||||||||||||
| expiration date 7/14/20 |
119 | 0.15 | 194,940 | 2,524,704 | ||||||||||||
| Sugar No. 11 |
||||||||||||||||
| expiration date 2/28/20 |
166 | 0.08 | 102,984 | 2,495,046 | ||||||||||||
| expiration date 4/30/20 |
165 | 0.12 | 148,053 | 2,502,192 | ||||||||||||
| expiration date 6/30/20 |
165 | 0.12 | 153,742 | 2,524,368 | ||||||||||||
| Wheat |
||||||||||||||||
| expiration date 3/13/20 |
90 | 0.19 | 237,137 | 2,514,375 | ||||||||||||
| expiration date 5/14/20 |
89 | 0.18 | 229,225 | 2,499,788 | ||||||||||||
| expiration date 7/14/20 |
89 | 0.12 | 159,650 | 2,507,575 | ||||||||||||
| WTI Crude Oil |
||||||||||||||||
| expiration date 1/21/20 |
25 | 0.13 | 164,900 | 1,526,500 | ||||||||||||
| expiration date 2/20/20 |
25 | 0.16 | 209,410 | 1,519,250 | ||||||||||||
| expiration date 3/20/20 |
25 | 0.16 | 208,020 | 1,510,250 | ||||||||||||
| expiration date 4/21/20 |
25 | 0.08 | 99,900 | 1,499,250 | ||||||||||||
| expiration date 5/19/20 |
24 | 0.08 | 100,490 | 1,426,560 | ||||||||||||
|
|
|
|
|
|
|
|||||||||||
| Total Futures Contracts Long Exposure (Exchange-Traded) |
4.82 | % | $ | 6,162,155 | $ | 127,602,755 | ||||||||||
|
|
|
|
|
|
|
|||||||||||
| * | Interest rate shown reflects the yield to maturity at time of purchase. |
| (a) | All or a portion of this security is held by the broker as collateral for open futures contracts. The securities collateral posted was comprised entirely of U.S. Treasury securities having a market value of $9,979,447 as of December 31, 2019. |
See accompanying notes to consolidated financial statements
F-20
Table of Contents
WisdomTree Continuous Commodity Index Master Fund
December 31, 2018
| Description |
Percentage of Net Assets |
Fair Value |
Face Amount |
|||||||||||
| U.S. Treasury Obligations |
||||||||||||||
| U.S. Treasury Bills |
||||||||||||||
| 2.29%, 1/17/19* |
27.10 | % | $ | 41,960,100 | $ | 42,000,000 | ||||||||
| 2.33%, 2/7/19* |
17.39 | 26,936,314 | 27,000,000 | |||||||||||
| 2.38%, 2/28/19* (a) |
25.73 | 39,849,504 | 40,000,000 | |||||||||||
| 2.39%, 3/21/19* |
22.49 | 34,822,834 | 35,000,000 | |||||||||||
|
|
|
|
|
|
|
|||||||||
| Total U.S. Treasury Obligations (Cost: $143,563,956) |
92.71 | % | $ | 143,568,752 | $ | 144,000,000 | ||||||||
|
|
|
|
|
|
|
|||||||||
| Description |
Contracts | Unrealized Appreciation/ (Depreciation) Percentage of Net Assets |
Unrealized Appreciation/ (Depreciation) |
Notional Value |
||||||||||||
| Futures Contracts Long Exposure (Exchange-Traded) |
||||||||||||||||
| Cocoa |
||||||||||||||||
| expiration date 3/14/19 |
125 | 0.19 | % | $ | 294,300 | $ | 3,020,000 | |||||||||
| expiration date 5/15/19 |
124 | 0.21 | 319,790 | 3,036,760 | ||||||||||||
| expiration date 7/16/19 |
124 | 0.10 | 155,170 | 3,050,400 | ||||||||||||
| Coffee “C” |
||||||||||||||||
| expiration date 3/19/19 |
77 | (0.13 | ) | (205,594 | ) | 2,940,919 | ||||||||||
| expiration date 5/20/19 |
77 | (0.13 | ) | (195,150 | ) | 3,030,431 | ||||||||||
| expiration date 7/19/19 |
78 | (0.22 | ) | (333,431 | ) | 3,153,150 | ||||||||||
| Copper |
||||||||||||||||
| expiration date 3/27/19 |
46 | (0.10 | ) | (148,663 | ) | 3,025,650 | ||||||||||
| expiration date 5/29/19 |
46 | (0.10 | ) | (152,875 | ) | 3,032,550 | ||||||||||
| expiration date 7/29/19 |
46 | (0.08 | ) | (126,363 | ) | 3,037,150 | ||||||||||
| Corn |
||||||||||||||||
| expiration date 3/14/19 |
159 | (0.04 | ) | (67,262 | ) | 2,981,250 | ||||||||||
| expiration date 5/14/19 |
159 | (0.04 | ) | (55,612 | ) | 3,044,850 | ||||||||||
| expiration date 7/12/19 |
158 | (0.03 | ) | (48,875 | ) | 3,086,925 | ||||||||||
| Cotton No. 2 |
||||||||||||||||
| expiration date 3/7/19 |
83 | (0.31 | ) | (479,230 | ) | 2,996,300 | ||||||||||
| expiration date 5/8/19 |
83 | (0.27 | ) | (410,890 | ) | 3,050,250 | ||||||||||
| expiration date 7/9/19 |
82 | (0.19 | ) | (293,870 | ) | 3,059,830 | ||||||||||
| Gold 100 Ounce |
||||||||||||||||
| expiration date 2/26/19 |
24 | (0.02 | ) | (33,380 | ) | 3,075,120 | ||||||||||
| expiration date 4/26/19 |
24 | 0.08 | 123,000 | 3,090,480 | ||||||||||||
| expiration date 6/26/19 |
23 | 0.07 | 111,220 | 2,976,660 | ||||||||||||
| Lean Hogs |
||||||||||||||||
| expiration date 2/14/19 |
78 | (0.01 | ) | (22,640 | ) | 1,902,420 | ||||||||||
| expiration date 4/12/19 |
78 | (0.01 | ) | (23,290 | ) | 2,092,740 | ||||||||||
| expiration date 6/14/19 |
78 | 0.00 | 2,400 | 2,541,240 | ||||||||||||
| expiration date 7/15/19 |
78 | (0.00 | ) | (6,130 | ) | 2,573,220 | ||||||||||
| Live Cattle |
||||||||||||||||
| expiration date 2/28/19 |
62 | 0.10 | 158,940 | 3,072,100 | ||||||||||||
| expiration date 4/30/19 |
62 | 0.11 | 173,850 | 3,131,000 | ||||||||||||
| expiration date 6/28/19 |
62 | 0.05 | 76,750 | 2,903,460 | ||||||||||||
See accompanying notes to consolidated financial statements
F-21
Table of Contents
WisdomTree Continuous Commodity Index Master Fund
Schedule of Investments
December 31, 2018
(continued)
| Description |
Contracts | Unrealized Appreciation/ (Depreciation) Percentage of Net Assets |
Unrealized Appreciation/ (Depreciation) |
Notional Value |
||||||||||||
| Natural Gas |
||||||||||||||||
| expiration date 1/29/19 |
65 | (0.17 | )% | $ | (258,970 | ) | $ | 1,911,000 | ||||||||
| expiration date 2/26/19 |
65 | (0.16 | ) | (247,080 | ) | 1,853,150 | ||||||||||
| expiration date 3/27/19 |
65 | (0.03 | ) | (41,290 | ) | 1,743,950 | ||||||||||
| expiration date 4/26/19 |
66 | (0.02 | ) | (30,210 | ) | 1,763,520 | ||||||||||
| expiration date 5/29/19 |
66 | (0.01 | ) | (17,480 | ) | 1,793,220 | ||||||||||
| NY Harbor ULSD |
||||||||||||||||
| expiration date 1/31/19 |
26 | (0.25 | ) | (388,950 | ) | 1,833,905 | ||||||||||
| expiration date 2/28/19 |
26 | (0.26 | ) | (401,738 | ) | 1,823,531 | ||||||||||
| expiration date 3/29/19 |
26 | (0.27 | ) | (416,829 | ) | 1,808,461 | ||||||||||
| expiration date 4/30/19 |
26 | (0.27 | ) | (421,235 | ) | 1,807,151 | ||||||||||
| expiration date 5/31/19 |
26 | (0.25 | ) | (394,498 | ) | 1,815,778 | ||||||||||
| Platinum |
||||||||||||||||
| expiration date 4/26/19 |
113 | (0.11 | ) | (169,965 | ) | 4,523,390 | ||||||||||
| expiration date 7/29/19 |
113 | (0.22 | ) | (343,140 | ) | 4,551,640 | ||||||||||
| Silver |
||||||||||||||||
| expiration date 3/27/19 |
39 | 0.04 | 55,325 | 3,030,300 | ||||||||||||
| expiration date 5/29/19 |
39 | 0.03 | 40,710 | 3,047,070 | ||||||||||||
| expiration date 7/29/19 |
38 | 0.12 | 184,335 | 2,985,090 | ||||||||||||
| Soybean |
||||||||||||||||
| expiration date 3/14/19 |
66 | (0.01 | ) | (12,886 | ) | 2,953,500 | ||||||||||
| expiration date 5/14/19 |
67 | (0.01 | ) | (19,312 | ) | 3,040,962 | ||||||||||
| expiration date 7/12/19 |
67 | (0.00 | ) | (1,050 | ) | 3,082,837 | ||||||||||
| Soybean Oil |
||||||||||||||||
| expiration date 3/14/19 |
180 | (0.07 | ) | (108,978 | ) | 3,007,800 | ||||||||||
| expiration date 5/14/19 |
180 | (0.08 | ) | (116,226 | ) | 3,036,960 | ||||||||||
| expiration date 7/12/19 |
180 | (0.04 | ) | (59,586 | ) | 3,065,040 | ||||||||||
| Sugar No. 11 |
||||||||||||||||
| expiration date 2/28/19 |
224 | (0.00 | ) | (7,101 | ) | 3,018,086 | ||||||||||
| expiration date 4/30/19 |
223 | 0.01 | 19,432 | 3,022,096 | ||||||||||||
| expiration date 6/28/19 |
223 | (0.13 | ) | (200,749 | ) | 3,057,062 | ||||||||||
| Wheat |
||||||||||||||||
| expiration date 3/14/19 |
119 | (0.20 | ) | (315,438 | ) | 2,994,338 | ||||||||||
| expiration date 5/14/19 |
119 | (0.22 | ) | (342,700 | ) | 3,037,475 | ||||||||||
| expiration date 7/12/19 |
118 | (0.07 | ) | (109,488 | ) | 3,059,150 | ||||||||||
| WTI Crude Oil |
||||||||||||||||
| expiration date 1/22/19 |
40 | (0.32 | ) | (488,260 | ) | 1,816,400 | ||||||||||
| expiration date 2/20/19 |
40 | (0.33 | ) | (504,050 | ) | 1,828,800 | ||||||||||
| expiration date 3/20/19 |
39 | (0.30 | ) | (471,160 | ) | 1,797,120 | ||||||||||
| expiration date 4/22/19 |
39 | (0.25 | ) | (383,110 | ) | 1,813,890 | ||||||||||
| expiration date 5/21/19 |
39 | (0.26 | ) | (401,320 | ) | 1,830,270 | ||||||||||
|
|
|
|
|
|
|
|||||||||||
| Total Futures Contracts Long Exposure (Exchange-Traded) |
(4.88 | )% | $ | (7,560,832 | ) | $ | 154,657,797 | |||||||||
|
|
|
|
|
|
|
|||||||||||
| * | Interest rate shown reflects the yield to maturity at the time of purchase. |
| (a) | All or a portion of this security is held by the broker as collateral for open futures contracts. The securities collateral posted was comprised entirely of U.S. Treasury securities having a market value of $12,951,089 as of December 31, 2018. |
See accompanying notes to consolidated financial statements
F-22
Table of Contents
WisdomTree Continuous Commodity Index Master Fund
Statements of Income and Expenses
For the Years Ended December 31, 2019, 2018 and 2017
| 2019 | 2018 | 2017 | ||||||||||
| Income: |
||||||||||||
| Interest income |
$ | 2,753,909 | $ | 2,850,715 | $ | 1,356,236 | ||||||
|
|
|
|
|
|
|
|||||||
| Expenses: |
||||||||||||
| Management fee to related party (Note 8) |
1,140,124 | 1,436,067 | 1,513,176 | |||||||||
|
|
|
|
|
|
|
|||||||
| Total expenses |
1,140,124 | 1,436,067 | 1,513,176 | |||||||||
|
|
|
|
|
|
|
|||||||
| Expense waivers (Note 8) |
(134,132 | ) | (168,949 | ) | (178,022 | ) | ||||||
|
|
|
|
|
|
|
|||||||
| Net expenses |
1,005,992 | 1,267,118 | 1,335,154 | |||||||||
|
|
|
|
|
|
|
|||||||
| Net investment gain |
1,747,917 | 1,583,597 | 21,082 | |||||||||
|
|
|
|
|
|
|
|||||||
| Net Realized and Unrealized Gain (Loss) on Investments and Futures Contracts: |
||||||||||||
| Net Realized Gain (Loss) from: |
||||||||||||
| Investments |
1,961 | (150 | ) | (11,445 | ) | |||||||
| Futures Contracts* |
(5,896,732 | ) | (8,933,189 | ) | (3,917,989 | ) | ||||||
|
|
|
|
|
|
|
|||||||
| Net Realized Loss |
(5,894,771 | ) | (8,933,339 | ) | (3,929,434 | ) | ||||||
|
|
|
|
|
|
|
|||||||
| Net Increase (Decrease) in Unrealized Appreciation/Depreciation from: |
||||||||||||
| Investments |
5,508 | 4,361 | (5,186 | ) | ||||||||
| Futures Contracts |
13,722,987 | (8,597,597 | ) | 2,461,480 | ||||||||
|
|
|
|
|
|
|
|||||||
| Net Increase (Decrease) in Unrealized Appreciation/Depreciation |
13,728,495 | (8,593,236 | ) | 2,456,294 | ||||||||
|
|
|
|
|
|
|
|||||||
| Net Realized and Unrealized Gain (Loss) on Investments and Futures Contracts |
7,833,724 | (17,526,575 | ) | (1,473,140 | ) | |||||||
|
|
|
|
|
|
|
|||||||
| Net Gain (Loss) |
$ | 9,581,641 | $ | (15,942,978 | ) | $ | (1,452,058 | ) | ||||
|
|
|
|
|
|
|
|||||||
| * Includes brokerage commissions of: |
$ | (142,775 | ) | $ | (175,786 | ) | $ | (178,822 | ) | |||
|
|
|
|
|
|
|
|||||||
See accompanying notes to consolidated financial statements
F-23
Table of Contents
WisdomTree Continuous Commodity Index Master Fund
Statement of Changes in Shareholders’ Equity
For the Three Months Ended December 31, 2019
| General Units | Limited Units | Total | ||||||||||||||||||||||||||||||||||
|
General Units |
Accumulated Deficit |
Total General Shareholders’ Equity |
Limited Units |
Accumulated Deficit |
Total Limited Shareholders’ Equity |
Total Shareholders’ Equity |
||||||||||||||||||||||||||||||
| Units | Amount | Units | Amount | |||||||||||||||||||||||||||||||||
| Balance at September 30, 2019 |
50 | $ | 1,500 | $ | (622 | ) | $ | 878 | 6,500,000 | $ | 256,974,925 | $ | (142,865,542 | ) | $ | 114,109,383 | $ | 114,110,261 | ||||||||||||||||||
| Creation of Units |
— | — | — | — | 450,000 | 8,021,089 | — | 8,021,089 | 8,021,089 | |||||||||||||||||||||||||||
| Redemption of Units |
— | — | — | — | (150,000 | ) | (2,650,329 | ) | — | (2,650,329 | ) | (2,650,329 | ) | |||||||||||||||||||||||
| Net Gain (Loss): |
||||||||||||||||||||||||||||||||||||
| Net Investment Income |
— | — | 3 | 3 | — | — | 275,714 | 275,714 | 275,717 | |||||||||||||||||||||||||||
| Net Realized Gain from Investments and Futures Contracts |
— | — | 16 | 16 | — | — | 2,416,150 | 2,416,150 | 2,416,166 | |||||||||||||||||||||||||||
| Net Increase in Unrealized Appreciation/Depreciation from Investments and Futures Contracts |
— | — | 43 | 43 | — | — | 5,662,896 | 5,662,896 | 5,662,939 | |||||||||||||||||||||||||||
|
|
|
|
|
|
|
|
|
|
|
|
|
|
|
|
|
|
|
|||||||||||||||||||
| Net Gain |
— | — | 62 | 62 | — | — | 8,354,760 | 8,354,760 | 8,354,822 | |||||||||||||||||||||||||||
|
|
|
|
|
|
|
|
|
|
|
|
|
|
|
|
|
|
|
|||||||||||||||||||
| Balance at December 31, 2019 |
50 | $ | 1,500 | $ | (560 | ) | $ | 940 | 6,800,000 | $ | 262,345,685 | $ | (134,510,782 | ) | $ | 127,834,903 | $ | 127,835,843 | ||||||||||||||||||
|
|
|
|
|
|
|
|
|
|
|
|
|
|
|
|
|
|
|
|||||||||||||||||||
For the Year Ended December 31, 2019
| General Units | Limited Units | Total | ||||||||||||||||||||||||||||||||||
|
General Units |
Accumulated Deficit |
Total General Shareholders’ Equity |
Limited Units |
Accumulated Deficit |
Total Limited Shareholders’ Equity |
Total Shareholders’ Equity |
||||||||||||||||||||||||||||||
| Units | Amount | Units | Amount | |||||||||||||||||||||||||||||||||
| Balance at December 31, 2018 |
50 | $ | 1,500 | $ | (625 | ) | $ | 875 | 8,850,000 | $ | 298,946,484 | $ | (144,092,358 | ) | $ | 154,854,126 | $ | 154,855,001 | ||||||||||||||||||
| Creation of Units |
— | — | — | — | 1,050,000 | 18,530,911 | — | 18,530,911 | 18,530,911 | |||||||||||||||||||||||||||
| Redemption of Units |
— | — | — | — | (3,100,000 | ) | (55,131,710 | ) | — | (55,131,710 | ) | (55,131,710 | ) | |||||||||||||||||||||||
| Net Gain (Loss): |
||||||||||||||||||||||||||||||||||||
| Net Investment Income |
— | — | 12 | 12 | — | — | 1,747,905 | 1,747,905 | 1,747,917 | |||||||||||||||||||||||||||
| Net Realized Loss from Investments and Futures Contracts |
— | — | (41 | ) | (41 | ) | — | — | (5,894,730 | ) | (5,894,730 | ) | (5,894,771 | ) | ||||||||||||||||||||||
| Net Increase in Unrealized Appreciation/Depreciation from Investments and Futures Contracts |
— | — | 94 | 94 | — | — | 13,728,401 | 13,728,401 | 13,728,495 | |||||||||||||||||||||||||||
|
|
|
|
|
|
|
|
|
|
|
|
|
|
|
|
|
|
|
|||||||||||||||||||
| Net Gain |
— | — | 65 | 65 | — | — | 9,581,576 | 9,581,576 | 9,581,641 | |||||||||||||||||||||||||||
|
|
|
|
|
|
|
|
|
|
|
|
|
|
|
|
|
|
|
|||||||||||||||||||
| Balance at December 31, 2019 |
50 | $ | 1,500 | $ | (560 | ) | $ | 940 | 6,800,000 | $ | 262,345,685 | $ | (134,510,782 | ) | $ | 127,834,903 | $ | 127,835,843 | ||||||||||||||||||
|
|
|
|
|
|
|
|
|
|
|
|
|
|
|
|
|
|
|
|||||||||||||||||||
See accompanying notes to consolidated financial statements
F-24
Table of Contents
WisdomTree Continuous Commodity Index Master Fund
Statement of Changes in Shareholders’ Equity
For the Three Months Ended December 31, 2018
| General Units | Limited Units | Total | ||||||||||||||||||||||||||||||||||
|
General Units |
Accumulated Deficit |
Total General Shareholders’ Equity |
Limited Units |
Accumulated Deficit |
Total Limited Shareholders’ Equity |
Total Shareholders’ Equity |
||||||||||||||||||||||||||||||
| Units | Amount | Units | Amount | |||||||||||||||||||||||||||||||||
| Balance at September 30, 2018 |
50 | $ | 1,500 | $ | (596 | ) | $ | 904 | 8,800,000 | $ | 298,413,411 | $ | (139,312,237 | ) | $ | 159,101,174 | $ | 159,102,078 | ||||||||||||||||||
| Creation of Units |
— | — | — | — | 500,000 | 8,748,821 | — | 8,748,821 | 8,748,821 | |||||||||||||||||||||||||||
| Redemption of Units |
— | — | — | — | (450,000 | ) | (8,215,748 | ) | — | (8,215,748 | ) | (8,215,748 | ) | |||||||||||||||||||||||
| Net Gain (Loss): |
||||||||||||||||||||||||||||||||||||
| Net Investment Income |
— | — | 3 | 3 | — | — | 525,065 | 525,065 | 525,068 | |||||||||||||||||||||||||||
| Net Realized Loss from Investments and Futures Contracts |
— | — | (11 | ) | (11 | ) | — | — | (1,595,570 | ) | (1,595,570 | ) | (1,595,581 | ) | ||||||||||||||||||||||
| Net Decrease in Unrealized Appreciation/Depreciation from Investments and Futures Contracts |
— | — | (21 | ) | (21 | ) | — | — | (3,709,616 | ) | (3,709,616 | ) | (3,709,637 | ) | ||||||||||||||||||||||
|
|
|
|
|
|
|
|
|
|
|
|
|
|
|
|
|
|
|
|||||||||||||||||||
| Net Loss |
— | — | (29 | ) | (29 | ) | — | — | (4,780,121 | ) | (4,780,121 | ) | (4,780,150 | ) | ||||||||||||||||||||||
|
|
|
|
|
|
|
|
|
|
|
|
|
|
|
|
|
|
|
|||||||||||||||||||
| Balance at December 31, 2018 |
50 | $ | 1,500 | $ | (625 | ) | $ | 875 | 8,850,000 | $ | 298,946,484 | $ | (144,092,358 | ) | $ | 154,854,126 | $ | 154,855,001 | ||||||||||||||||||
|
|
|
|
|
|
|
|
|
|
|
|
|
|
|
|
|
|
|
|||||||||||||||||||
For the Year Ended December 31, 2018
| General Units | Limited Units | Total | ||||||||||||||||||||||||||||||||||
|
General Units |
Accumulated Deficit |
Total General Shareholders’ Equity |
Limited Units |
Accumulated Deficit |
Total Limited Shareholders’ Equity |
Total Shareholders’ Equity |
||||||||||||||||||||||||||||||
| Units | Amount | Units | Amount | |||||||||||||||||||||||||||||||||
| Balance at December 31, 2017 |
50 | $ | 1,500 | $ | (538 | ) | $ | 962 | 8,050,000 | $ | 283,104,814 | $ | (128,149,467 | ) | $ | 154,955,347 | $ | 154,956,309 | ||||||||||||||||||
| Creation of Units |
— | — | — | — | 2,750,000 | 51,769,691 | — | 51,769,691 | 51,769,691 | |||||||||||||||||||||||||||
| Redemption of Units |
— | — | — | — | (1,950,000 | ) | (35,928,021 | ) | — | (35,928,021 | ) | (35,928,021 | ) | |||||||||||||||||||||||
| Net Gain (Loss): |
||||||||||||||||||||||||||||||||||||
| Net Investment Income |
— | — | 9 | 9 | — | — | 1,583,588 | 1,583,588 | 1,583,597 | |||||||||||||||||||||||||||
| Net Realized Loss from Investments and Futures Contracts |
— | — | (55 | ) | (55 | ) | — | — | (8,933,284 | ) | (8,933,284 | ) | (8,933,339 | ) | ||||||||||||||||||||||
| Net Decrease in Unrealized Appreciation/Depreciation from Investments and Futures Contracts |
— | — | (41 | ) | (41 | ) | — | — | (8,593,195 | ) | (8,593,195 | ) | (8,593,236 | ) | ||||||||||||||||||||||
|
|
|
|
|
|
|
|
|
|
|
|
|
|
|
|
|
|
|
|||||||||||||||||||
| Net Loss |
— | — | (87 | ) | (87 | ) | — | — | (15,942,891 | ) | (15,942,891 | ) | (15,942,978 | ) | ||||||||||||||||||||||
|
|
|
|
|
|
|
|
|
|
|
|
|
|
|
|
|
|
|
|||||||||||||||||||
| Balance at December 31, 2018 |
50 | $ | 1,500 | $ | (625 | ) | $ | 875 | 8,850,000 | $ | 298,946,484 | $ | (144,092,358 | ) | $ | 154,854,126 | $ | 154,855,001 | ||||||||||||||||||
|
|
|
|
|
|
|
|
|
|
|
|
|
|
|
|
|
|
|
|||||||||||||||||||
See accompanying notes to consolidated financial statements
F-25
Table of Contents
WisdomTree Continuous Commodity Index Master Fund
Statement of Changes in Shareholders’ Equity
For the Three Months Ended December 31, 2017
| General Units | Limited Units | Total | ||||||||||||||||||||||||||||||||||
|
General Units |
Accumulated Deficit |
Total General Shareholders’ Equity |
Limited Units |
Accumulated Deficit |
Total Limited Shareholders’ Equity |
Total Shareholders’ Equity |
||||||||||||||||||||||||||||||
| Units | Amount | Units | Amount | |||||||||||||||||||||||||||||||||
| Balance at September 30, 2017 |
50 | $ | 1,500 | $ | (562 | ) | $ | 938 | 8,550,000 | $ | 292,540,700 | $ | (132,132,200 | ) | $ | 160,408,500 | $ | 160,409,438 | ||||||||||||||||||
| Creation of Units |
— | — | — | — | — | — | — | — | — | |||||||||||||||||||||||||||
| Redemption of Units |
— | — | — | — | (500,000 | ) | (9,435,886 | ) | — | (9,435,886 | ) | (9,435,886 | ) | |||||||||||||||||||||||
| Net Gain (Loss): |
||||||||||||||||||||||||||||||||||||
| Net Investment Income |
— | — | 0 | * | 0 | * | — | — | 118,482 | 118,482 | 118,482 | |||||||||||||||||||||||||
| Net Realized Gain from Investments and Futures Contracts |
— | — | 11 | 11 | — | — | 1,853,766 | 1,853,766 | 1,853,777 | |||||||||||||||||||||||||||
| Net Increase in Unrealized Appreciation/Depreciation from Investments and Futures Contracts |
— | — | 13 | 13 | — | — | 2,010,485 | 2,010,485 | 2,010,498 | |||||||||||||||||||||||||||
|
|
|
|
|
|
|
|
|
|
|
|
|
|
|
|
|
|
|
|||||||||||||||||||
| Net Gain |
— | — | 24 | 24 | — | — | 3,982,733 | 3,982,733 | 3,982,757 | |||||||||||||||||||||||||||
|
|
|
|
|
|
|
|
|
|
|
|
|
|
|
|
|
|
|
|||||||||||||||||||
| Balance at December 31, 2017 |
50 | $ | 1,500 | $ | (538 | ) | $ | 962 | 8,050,000 | $ | 283,104,814 | $ | (128,149,467 | ) | $ | 154,955,347 | $ | 154,956,309 | ||||||||||||||||||
|
|
|
|
|
|
|
|
|
|
|
|
|
|
|
|
|
|
|
|||||||||||||||||||
For the Year Ended December 31, 2017
| General Units | Limited Units | Total | ||||||||||||||||||||||||||||||||||
|
General Units |
Accumulated Deficit |
Total General Shareholders’ Equity |
Limited Units |
Accumulated Deficit |
Total Limited Shareholders’ Equity |
Total Shareholders’ Equity |
||||||||||||||||||||||||||||||
| Units | Amount | Units | Amount | |||||||||||||||||||||||||||||||||
| Balance at December 31, 2016 |
50 | $ | 1,500 | $ | (533 | ) | $ | 967 | 11,350,000 | $ | 346,357,042 | $ | (126,697,414 | ) | $ | 219,659,628 | $ | 219,660,595 | ||||||||||||||||||
| Creation of Units |
— | — | — | — | 150,000 | 2,942,102 | — | 2,942,102 | 2,942,102 | |||||||||||||||||||||||||||
| Redemption of Units |
— | — | — | — | (3,450,000 | ) | (66,194,330 | ) | — | (66,194,330 | ) | (66,194,330 | ) | |||||||||||||||||||||||
| Net Gain (Loss): |
||||||||||||||||||||||||||||||||||||
| Net Investment Income |
— | — | 0 | * | 0 | * | — | — | 21,082 | 21,082 | 21,082 | |||||||||||||||||||||||||
| Net Realized Loss from Investments and Futures Contracts |
— | — | (24 | ) | (24 | ) | — | — | (3,929,410 | ) | (3,929,410 | ) | (3,929,434 | ) | ||||||||||||||||||||||
| Net Increase in Unrealized Appreciation/Depreciation from Investments and Futures Contracts |
— | — | 19 | 19 | — | — | 2,456,275 | 2,456,275 | 2,456,294 | |||||||||||||||||||||||||||
|
|
|
|
|
|
|
|
|
|
|
|
|
|
|
|
|
|
|
|||||||||||||||||||
| Net Loss |
— | — | (5 | ) | (5 | ) | — | — | (1,452,053 | ) | (1,452,053 | ) | (1,452,058 | ) | ||||||||||||||||||||||
|
|
|
|
|
|
|
|
|
|
|
|
|
|
|
|
|
|
|
|||||||||||||||||||
| Balance at December 31, 2017 |
50 | $ | 1,500 | $ | (538 | ) | $ | 962 | 8,050,000 | $ | 283,104,814 | $ | (128,149,467 | ) | $ | 154,955,347 | $ | 154,956,309 | ||||||||||||||||||
|
|
|
|
|
|
|
|
|
|
|
|
|
|
|
|
|
|
|
|||||||||||||||||||
| * | Amount represents less than $1. |
See accompanying notes to consolidated financial statements
F-26
Table of Contents
WisdomTree Continuous Commodity Index Master Fund
For the Years Ended December 31, 2019, 2018 and 2017
| 2019 | 2018 | 2017 | ||||||||||
| Cash flows from operating activities |
||||||||||||
| Net Gain (Loss) |
$ | 9,581,641 | $ | (15,942,978 | ) | $ | (1,452,058 | ) | ||||
| Adjustments to reconcile net gain (loss) to net cash provided by (used for) operating activities: |
||||||||||||
| Purchases of investment securities |
(525,965,574 | ) | (691,967,507 | ) | (656,510,527 | ) | ||||||
| Proceeds from sales/maturities of investment securities |
556,408,294 | 693,984,170 | 714,898,283 | |||||||||
| Net accretion of discount |
(2,697,671 | ) | (2,797,569 | ) | (1,349,302 | ) | ||||||
| Net realized gain (loss) on investment securities |
(1,961 | ) | 150 | 11,445 | ||||||||
| Net change in unrealized appreciation/depreciation from investments |
(5,508 | ) | (4,361 | ) | 5,186 | |||||||
| Net change in unrealized appreciation/depreciation from futures contracts |
(13,722,987 | ) | 8,597,597 | (2,461,480 | ) | |||||||
| Changes in assets and liabilities |
||||||||||||
| Increase/(Decrease) in liabilities: |
||||||||||||
| Net management fee payable to related party |
(15,502 | ) | (1,920 | ) | (61,360 | ) | ||||||
| Accrued brokerage fees and expenses payable |
— | — | (173,182 | ) | ||||||||
|
|
|
|
|
|
|
|||||||
| Net cash provided by (used for) operating activities |
23,580,732 | (8,132,418 | ) | 52,907,005 | ||||||||
|
|
|
|
|
|
|
|||||||
| Cash flows from financing activities |
||||||||||||
| Proceeds from creation of Limited Units |
27,279,732 | 43,020,870 | 2,942,102 | |||||||||
| Redemption of Limited Units |
(55,131,710 | ) | (35,928,021 | ) | (66,194,330 | ) | ||||||
|
|
|
|
|
|
|
|||||||
| Net cash provided by (used for) financing activities |
(27,851,978 | ) | 7,092,849 | (63,252,228 | ) | |||||||
|
|
|
|
|
|
|
|||||||
| Net decrease in cash |
(4,271,246 | ) | (1,039,569 | ) | (10,345,223 | ) | ||||||
| Cash* at beginning of year |
10,193,423 | 11,232,992 | 21,578,215 | |||||||||
|
|
|
|
|
|
|
|||||||
| Cash* at end of year |
$ | 5,922,177 | $ | 10,193,423 | $ | 11,232,992 | ||||||
|
|
|
|
|
|
|
|||||||
| * | Includes cash held by the broker for futures contracts. |
See accompanying notes to consolidated financial statements
F-27
Table of Contents
WisdomTree Continuous Commodity Index Fund
WisdomTree Continuous Commodity Index Master Fund
Notes to Consolidated Financial Statements
Years Ended December 31, 2019, 2018, 2017
(1) Organization
The WisdomTree Continuous Commodity Index Fund (the “Fund”) and the WisdomTree Continuous Commodity Index Master Fund (the “Master Fund” and together with the Fund, the “Funds”) are commodity pools that were organized as Delaware statutory trusts on October 27, 2006. For each of the Funds, WisdomTree Commodity Services, LLC serves as the commodity pool operator and managing owner (the “Managing Owner”), and GreenHaven Advisors LLC serves as the commodity trading advisor (the “Sub-Adviser”).
Shares representing units of fractional undivided beneficial interest in and ownership of the Fund (“Limited Units” or “Shares”) are listed on the NYSE Arca under the symbol “GCC.” Upon inception of the Fund, 50 general units of the Fund (“General Units” or “General Shares”) were issued to the Managing Owner in exchange for a capital contribution of $1,500. We refer to the General Shares and Shares collectively as “Total Shares,” and the holders of the Shares as the “Shareholders.”
The Master Fund is wholly-owned by the Fund and the Managing Owner. The Fund holds no investment assets other than the Master Fund’s common units of beneficial interest (“Master Fund Units”). Each Share issued by the Fund correlates to a Master Fund Unit held by the Fund.
The Fund and Master Fund commenced investment operations on January 23, 2008, with the offering of 350,000 Shares in exchange for $10,500,000. The Fund commenced trading on the American Stock Exchange (now known as the NYSE Arca) on January 24, 2008 under the symbol “GCC.” The term of the Fund is perpetual, unless terminated earlier in certain circumstances as defined in the Trust Agreements (as defined in Note 2 – Service Providers and Related Party Agreements).
The Funds’ collective investment objective is to provide investors with exposure to the daily change in the price of a portfolio of commodities (the “Index Commodities”) comprising the Thomson Reuters Continuous Commodity Index, also known as the Continuous Commodity Total Return Index or Equal Weight Continuous Commodity Total Return Index (the “Index”), before the Funds’ expenses. The Index Commodities consist of corn, soybean, wheat, live cattle, lean hogs, gold, silver, copper, cocoa, coffee, sugar, cotton, soybean oil, platinum, crude oil, NY Harbor ULSD (formerly known as heating oil) and natural gas. Thomson Reuters (Markets) LLC, formerly Thomson Reuters America LLC (the “Index Sponsor”), is the owner, publisher and calculation agent of the Index. The Index Sponsor is not an affiliate of the Funds or the Managing Owner.
The Fund pursues its investment objective by investing substantially all of its assets in the Master Fund. The Master Fund pursues its investment objective by actively trading exchange traded futures (“Commodity Futures”) on the Index Commodities, with a view to tracking the performance of the Index over time, regardless of whether the Index is rising, falling or flat over any particular period.
The Master Fund’s portfolio (its “Portfolio”) also includes cash, U.S. Treasury obligations and other high credit-quality, short-term fixed income securities (collectively, “U.S. Treasuries”) for deposit with the Commodity Broker (as defined below) as margin or otherwise held to cover the Master Fund’s notional exposure to Commodity Futures.
The Fund continuously offers and redeems baskets of 50,000 Shares (“Baskets”) to authorized participants (“Authorized Participants”) at a price based on the Master Fund’s Net Asset Value (as defined in Note 7 – Share Creations and Redemptions) per Share. Authorized Participants, in turn, may offer such Shares to the public at a per Share offering price that varies, depending on, among other factors, the trading price of the Shares, the Master Fund’s Net Asset Value, and the supply of and demand for the Shares at the time of the offer.
F-28
Table of Contents
The Managing Owner and the Shareholders share in any profits and losses attributable to the Fund in proportion to the percentage interest owned by each.
The Managing Owner and the Funds retain the services of third party service providers for the ongoing operations of the Funds. See Note 2 – Service Providers and Related Party Agreements.
(2) Service Providers and Related Party Agreements
(a) Trustee. Delaware Trust Company, a Delaware corporation, is the sole trustee of each of the Funds (the “Trustee”). The Trustee is unaffiliated with the Managing Owner. Under the Fund’s Declaration of Trust and Trust Agreement, dated as of October 27, 2006 and as amended January 4, 2016 (as amended, the “Fund Trust Agreement”), and the Master Fund’s Declaration of Trust and Trust Agreement, dated as of October 27, 2006 and as amended July 29, 2007 and January 4, 2016 (as amended, the “Master Fund Trust Agreement” and collectively with the Fund Trust Agreement, the “Trust Agreements”), the Trustee has delegated to the Managing Owner the exclusive management and control of all aspects of the business of each of the Funds. The Trustee will accept service of legal process on the Funds in the State of Delaware and will make certain filings under the Delaware Statutory Trust Act. The Trustee does not owe any other duties to the Funds, the Managing Owner or the Shareholders. The Trustee’s principal offices are located in Wilmington, Delaware.
(b) Managing Owner. WisdomTree Commodity Services, LLC, a Delaware limited liability company, is the managing owner and commodity pool operator of each of the Funds. The Trustee has delegated to the Managing Owner the exclusive power and authority to manage the business and affairs of each of the Funds. The Managing Owner’s principal offices are located in New York, New York.
(c) Sub-Adviser. Greenhaven Advisors LLC is the sub-adviser and commodity trading adviser of each of the Funds. The Sub-Adviser, under authority delegated by the Managing Owner, is responsible for selecting Commodity Brokers and reallocating assets within the Portfolio with a view to achieving the Funds’ investment objective. The Sub-Adviser’s principal offices are located in Atlanta, Georgia.
(d) Commodity Broker. A variety of executing brokers may execute transactions in Commodity Futures on behalf of the Master Fund. Morgan Stanley & Co. LLC (the “Commodity Broker”) is the Master Fund’s commodity broker to which the executing brokers give-up all such transactions. In its capacity as the clearing broker, the Commodity Broker may execute and clear each of the Master Fund’s futures transactions. The Commodity Broker’s principal offices are located in New York, New York.
(e) Administrator. State Street Bank and Trust Company (the “Administrator”) is the administrator of the Funds and has entered into an Administration Agreement in connection therewith. The Administrator also serves as custodian of the Funds pursuant to a Master Custodian Agreement, and transfer agent of the Funds pursuant to a Transfer Agency and Service Agreement. The Administrator performs certain services necessary for the operation and administration of the Funds (other than making investment decisions), including calculations of the Master Fund’s Net Asset Value and accounting and other administrative services. The Administrator retains certain financial books and records, including: fund accounting records, ledgers with respect to assets, liabilities, capital, income and expenses, the registrar, transfer journals and related details and trading and related documents received from futures commission merchants. The Administrator has an office in Boston, Massachusetts.
(f) Distributor. Foreside Fund Services LLC is the Funds’ distributor (the “Distributor”) pursuant to a Distribution Services Agreement. The Distributor assists the Managing Owner and the Administrator with certain functions and duties relating to the creation and redemption of Baskets, including assisting in matters associated with receiving and processing orders from Authorized Participants to create and redeem Baskets, coordinating the processing of such orders and related functions and duties. The Distributor has an office in Portland, Maine.
F-29
Table of Contents
(g) Authorized Participant. The Fund creates and redeems Shares from time to time, but only in one or more Baskets of 50,000 Shares. Authorized Participants are the only persons that may place orders to create and redeem Baskets. Each Authorized Participant must (i) be a registered broker-dealer or other securities market participant, such as a bank or other financial institution that is not required to register as a broker-dealer to engage in securities transactions, (ii) be a participant in the Depository Trust Company (“DTC”), and (iii) have entered into a “Participant Agreement.” The Participant Agreement sets forth the procedures for the creation and redemption of Baskets and for the delivery of cash required for such creations or redemptions. The current Authorized Participants are J.P. Morgan Securities LLC, Merrill Lynch Professional Clearing Corporation, and Morgan Stanley & Co. Incorporated.
(3) Summary of Significant Accounting Policies
(a) Basis of Presentation and Consolidation
The financial statements of the Fund and the Master Fund have been prepared using U.S. generally accepted accounting principles (“GAAP”). The Financial Accounting Standards Board (“FASB”) Accounting Standards Codification (“ASC”) is the exclusive reference of authoritative GAAP recognized by the FASB to be applied by nongovernmental entities. Rules and interpretive releases of the Securities and Exchange Commission (“SEC”) under the authority of federal laws are also sources of authoritative GAAP for SEC registrants.
In accordance with Accounting Standards Update (‘‘ASU’’) 2013-08, Financial Services-Investment Companies (‘‘ASU Topic 946’’), the Funds each qualify as an investment company and are applying ASC Topic 946 accounting and reporting guidance for investment companies.
All of the capital raised by the Fund from the offering of its Shares is used to purchase Master Fund Units. The financial statements of the Fund include the balances of the Master Fund on a consolidated basis and all inter-company balances and transactions have been eliminated in the consolidation. Separate financial statements of the Master Fund are presented to comply with reporting requirements of the SEC as both the Fund and the Master Fund are SEC registrants.
(b) Use of Estimates
The preparation of the financial statements in conformity with GAAP requires the Managing Owner to make estimates and assumptions that affect the reported amounts of assets and liabilities, disclosure of contingent assets and liabilities at the date of the financial statements, and the amounts of reported income and expenses during the period. Actual results could differ from those estimates.
(c) Cash Held by Broker
A portion of the Master Fund’s cash is held by the Commodity Broker and is applied towards the daily variation margin movements on the Master Fund’s open Commodity Futures. The Commodity Broker allows the Master Fund to apply its U.S. Treasuries positions towards its initial margin requirement for the Master Fund’s futures positions, hence all cash held by broker is unrestricted cash. The cash and U.S. Treasuries positions are held in segregated accounts at the Commodity Broker and are not insured by the Federal Deposit Insurance Corporation.
(d) U. S. Treasury Obligations
The Master Fund records purchases and sales of U.S. Treasuries on a trade date basis. These holdings are marked to market based on quotations from broker-dealers or independent service providers. The Master Fund may hold U.S. Treasuries for deposit with the Commodity Broker as margin for trading and holding against initial margin of the open Commodity Futures. Interest income is recognized on an accrual basis when earned. Premiums and discounts are amortized or accreted over the life of the U.S. Treasuries.
F-30
Table of Contents
(e) Futures Contracts
The Master Fund utilizes futures contracts to obtain long exposure to Commodity Futures consistent with its investment objective. These contracts are recorded on a trade date basis and open contracts are valued daily at settlement prices provided by the relevant exchanges. In the Schedules of Investments, Commodity Futures are presented at their published settlement prices on the last business day of the period, in accordance with the fair value accounting standard. Since these contracts are actively traded in markets that are directly observable and which provide readily available price quotes, their market value is deemed to be their fair value under the fair value accounting standard. See Note 4 – Fair Value Measurements. However, when market closing prices are not available, the Managing Owner may value an asset of the Master Fund pursuant to such other principles as the Managing Owner deems fair and equitable. Realized gains (losses) and changes in unrealized appreciation (depreciation) on open positions are determined on a specific identification basis and recognized in the Statements of Income and Expenses in the period in which the contract is closed or the changes occur, respectively.
(f) Income Taxes
The Fund and Master Fund are treated as partnerships for U.S. federal income tax purposes. Accordingly, the Fund and Master Fund are not subject to U.S. federal income tax and may not be subject to state or local income taxes. As a result, no provision for federal, state or local income taxes has been made in the accompanying consolidated financial statements, as investors are individually liable for income taxes, if any, on their allocable share of the Fund’s income, gain, loss, deductions and other items.
The Fund accounts for uncertainty in income taxes pursuant to the applicable accounting standard, which provides measurement, presentation and disclosure guidance related to uncertain tax positions. The guidance addresses how tax benefits claimed or expected to be claimed on a tax return should be recorded in the financial statements. Under this topic, the Fund may recognize the tax benefit from an uncertain tax position only if it is more likely than not that the tax position will be sustained on examination by the taxing authorities based on the technical merits of the position. The tax benefits recognized in the financial statements from such a position are measured based on the largest benefit that has a greater than fifty percent likelihood of being realized upon ultimate resolution.
(g) Subsequent Events
For purposes of disclosure in the consolidated financial statements, the Funds have evaluated events occurring between the period ended December 31, 2019 and when the financial statements were issued on February 21, 2020.
During that period, no Shares were created and 550,000 Shares were redeemed for $10,139,270, resulting in 6,250,050 Total Shares outstanding.
Other than these events, the evaluation did not result in any subsequent events that necessitated disclosures and/or adjustments.
(4) Fair Value Measurements
The existing guidance for fair value measurements establishes the authoritative definition for fair value, sets out a framework for measuring fair value and outlines the required disclosures regarding fair value measurements. Fair value is the price that would be received to sell an asset or paid to transfer a liability (an exit price) in the principal or most advantageous market for the asset or liability in an orderly transaction between market participants at the measurement date. The Master Fund uses a three-tier fair value hierarchy based upon observable and unobservable inputs as follows:
Level 1 – Quoted prices (unadjusted) in active markets for identical assets or liabilities that the reporting entity can access at the measurement date.
F-31
Table of Contents
Level 2 – Inputs other than quoted prices included within Level 1 that are observable for the asset or liability, either directly or indirectly.
Level 3 – Unobservable inputs for the asset or liability.
The inputs or methodology used for valuing securities are not necessarily an indication of the risk associated with investing in those securities. The assets of the Master Fund are either exchange-traded securities that are valued at the official closing price on the exchange where they are principally traded or U.S. government securities that are valued using dealer and broker quotations or other inputs that are observable or can be corroborated by observable market data. A summary of the Master Fund’s assets and liabilities at fair value as of December 31, 2019, classified according to the levels used to value them, is as follows:
| Assets |
Quoted Prices in Active Market (Level 1) |
Other Significant Observable Inputs (Level 2) |
Significant Unobservable Inputs (Level 3) |
Totals | ||||||||||||
| U.S. Treasury Obligations |
$ | — | $ | 115,831,172 | $ | — | $ | 115,831,172 | ||||||||
| Unrealized appreciation on futures contracts |
6,162,155 | — | — | 6,162,155 | ||||||||||||
|
|
|
|
|
|
|
|
|
|||||||||
| Total |
$ | 6,162,155 | $ | 115,831,172 | $ | — | $ | 121,993,327 | ||||||||
|
|
|
|
|
|
|
|
|
|||||||||
The Master Fund did not hold any Level 3 securities during the year ended December 31, 2019.
A summary of the Master Fund’s assets and liabilities at fair value as of December 31, 2018, classified according to the levels used to value them, is as follows:
| Assets |
Quoted Prices in Active Market (Level 1) |
Other Significant Observable Inputs (Level 2) |
Significant Unobservable Inputs (Level 3) |
Totals | ||||||||||||
| U.S. Treasury Obligations |
$ | — | $ | 143,568,752 | $ | — | $ | 143,568,752 | ||||||||
| Liabilities |
||||||||||||||||
| Unrealized depreciation on futures contracts |
(7,560,832 | ) | — | — | (7,560,832 | ) | ||||||||||
|
|
|
|
|
|
|
|
|
|||||||||
| Total |
$ | (7,560,832 | ) | $ | 143,568,752 | $ | — | $ | 136,007,920 | |||||||
|
|
|
|
|
|
|
|
|
|||||||||
The Master Fund did not hold any Level 3 securities during the year ended December 31, 2018.
(5) Derivative Instruments and Hedging Activities
The Master Fund uses derivative instruments as part of its principal investment strategy to achieve its investment objective. As of December 31, 2019, the Master Fund was invested in Commodity Futures. For the years ended December 31, 2019 and 2018, the volumes of derivative activity (based on average month-end notional amounts) were $134,094,833 and $167,547,151, respectively.
The fair value of derivative instruments at December 31, 2019 and 2018, were as follows:
| As of: |
Derivative Instruments |
Asset Derivatives(i) |
Liability Derivatives(ii) |
|||||||||
| December 31, 2019 |
Commodity Futures | $ | 6,162,155 | $ | — | |||||||
| December 31, 2018 |
Commodity Futures | $ | — | $ | 7,560,832 | |||||||
| (i) | Values are disclosed on the Statements of Financial Condition under Net unrealized appreciation on futures contracts. |
| (ii) | Values are disclosed on the Statements of Financial Condition under Net unrealized depreciation on futures contracts. |
F-32
Table of Contents
The following is a summary of the realized and unrealized gains and losses of the derivative instruments utilized by the Master Fund for the years ended December 31, 2019, 2018 and 2017:
| Period |
Derivative Instruments |
Realized Gain (Loss) on Derivative Instruments(i) |
Net Change in Unrealized Gain (Loss) on Derivative Instruments(ii) |
|||||||||
| Year ended December 31, 2019 |
Commodity Futures | $ | (5,896,732 | ) | $ | 13,722,987 | ||||||
| Year ended December 31, 2018 |
Commodity Futures | $ | (8,933,189 | ) | $ | (8,597,597 | ) | |||||
| Year ended December 31, 2017 |
Commodity Futures | $ | (3,917,989 | ) | $ | 2,461,480 | ||||||
| (i) | Values are disclosed on the Statements of Income and Expenses under Net realized gain (loss) from futures contracts. |
| (ii) | Values are disclosed on the Statements of Income and Expenses under Net increase (decrease) in unrealized appreciation/depreciation from futures contracts. |
(6) Financial Instrument Risk
In the normal course of its business, the Master Fund may be party to financial instruments with off-balance sheet risk. The term “off-balance sheet risk” refers to an unrecorded potential liability that, even though it does not appear on the balance sheet, may result in a future obligation or loss. The financial instruments used by the Master Fund are Commodity Futures, whose values are based upon an underlying asset and generally represent future commitments which have a reasonable possibility to be settled in cash or through physical delivery. These instruments are traded on an exchange and are standardized contracts.
Market risk is the potential for changes in the value of the financial instruments traded by the Master Fund due to market changes, including fluctuations in commodity prices. In entering into these contracts, there exists a market risk that such contracts may be significantly influenced by conditions, resulting in such contracts being less valuable. If the markets should move against all of the futures interest positions at the same time, and the Managing Owner is unable to offset such positions, the Master Fund could experience substantial losses.
Credit risk is the possibility that a loss may occur due to the failure of an exchange clearinghouse to perform according to the terms of a contract. Credit risk with respect to exchange-traded instruments is reduced to the extent that an exchange or clearing organization acts as counterparty to the transactions. The Master Fund’s risk of loss in the event of counterparty default is typically limited to the amounts recognized in the Statement of Financial Condition and not represented by the contract or notional amounts of the instruments.
The Fund and the Master Fund have not utilized, nor do they expect to utilize in the future, special purpose entities to facilitate off-balance sheet financing arrangements and have no loan guarantee arrangements or off-balance sheet arrangements of any kind other than agreements entered into in the normal course of business.
(7) Share Creations and Redemptions
The Fund creates and redeems Shares from time to time, but only in one or more Baskets of 50,000 Shares. Authorized Participants are the only persons that may place orders to create and redeem Baskets. To compensate the Administrator for services in processing the creation and redemption of Baskets, an Authorized Participant is required to pay a transaction fee of $200 per order.
“Net Asset Value” means the total assets of the Master Fund including, but not limited to, all cash and cash equivalents or other debt securities, less total liabilities of the Master Fund, each determined on the basis of generally accepted accounting principles in the United States, consistently applied under the accrual method of accounting. In particular, Net Asset Value includes any unrealized profit or loss on open Commodity Futures, and any other credit or debit accruing to the Master Fund but unpaid or not received by the Master Fund.
F-33
Table of Contents
(a) Creation of Shares
General. On any business day, an Authorized Participant may place an order with the Distributor (as facilitated by the Administrator) to create one or more Baskets. For purposes of processing both purchase and redemption orders, a “business day” means any day other than a day when banks in New York City are required or permitted to be closed. Purchase orders must be placed by 10:00 a.m. ET. The day on which a valid purchase order is received is the purchase order date. Purchase orders are irrevocable. By placing a purchase order, and prior to delivery of such Baskets, an Authorized Participant’s DTC account will be charged the non-refundable transaction fee due for the purchase order.
Determination of Required Payment. The total payment required to create each Basket is the Net Asset Value of 50,000 Shares as of the closing time of the NYSE Arca or the last to close of the exchanges on which the Index Commodities are traded, whichever is later, on the purchase order date. Baskets will be issued as of 12:00 p.m. ET, on the business day immediately following the purchase order date at the Net Asset Value per Share as of the closing time of the NYSE Arca or the last to close of the exchanges on which the Index Commodities are traded, whichever is later, on the purchase order date during the continuous offering period, but only if the required payment has been timely received.
Because orders to create Baskets must be placed by 10:00 a.m. ET, but the total payment required to create a Basket during the continuous offering period will not be determined until 4:00 p.m. ET, on the date the purchase order is received, Authorized Participants will not know the total amount of the payment required to create a Basket at the time they submit an irrevocable purchase order for the Basket. The Fund’s Net Asset Value and the total amount of the payment required to create a Basket could rise or fall substantially between the time an irrevocable purchase order is submitted and the time the amount of the purchase price in respect thereof is determined.
Rejection of Purchase Orders. The Administrator may reject a creation order if:
(i) it determines that the creation order is not in proper form;
(ii) the Managing Owner believes that the purchase order would have adverse tax consequences to the Fund
or its Shareholders; or
(iii) circumstances outside the control of the Managing Owner or the Distributor make it, for all practical
purposes, not feasible to process creations of Baskets.
The Distributor and the Managing Owner will not be liable for the rejection of any purchase order.
(b) Redemption of Shares
General. The procedures by which an Authorized Participant can redeem one or more Baskets mirror the procedures for the creation of Baskets. On any business day, an Authorized Participant may place an order with the Distributor (as facilitated by the Administrator) to redeem one or more Baskets. Redemption orders must be placed by 10:00 a.m. ET. The day on which a valid redemption order is received in proper form is the redemption order date. Redemption orders are irrevocable. Shareholders may not redeem directly from the Fund. By placing a redemption order, an Authorized Participant agrees to deliver the Baskets to be redeemed through DTC’s book-entry system to the Fund not later than 12:00 p.m. ET, on the business day immediately following the redemption order date. By placing a redemption order, and prior to receipt of the redemption proceeds, an Authorized Participant’s DTC account will be charged the non-refundable transaction fee due for the redemption order.
Determination of Required Payment. The redemption proceeds from the Fund consists of the cash redemption amount equal to the Net Asset Value of the number of Basket(s) requested in the Authorized Participant’s redemption order as of the closing time of the NYSE Arca or the last to close of the exchanges on which the
F-34
Table of Contents
Index Commodities are traded, whichever is later, on the redemption order date. The Managing Owner will distribute the cash redemption amount at 12:00 p.m. ET, on the business day immediately following the redemption order date through DTC to the account of the Authorized Participant as recorded on DTC’s book entry system.
Delivery of Redemption Proceeds. The redemption proceeds due from the Fund are delivered to the Authorized Participant at 12:00 p.m. ET, on the business day immediately following the redemption order date if, by such time, the Fund’s DTC account has been credited with the Baskets to be redeemed. If the Fund’s DTC account has not been credited with all of the Baskets to be redeemed by such time, the redemption distribution is delivered to the extent of whole Baskets received. Any remainder of the redemption distribution is delivered on the next business day to the extent of remaining whole Baskets received if the Distributor receives the fee applicable to the extension of the redemption distribution date which the Distributor may, from time-to-time, determine and the remaining Baskets to be redeemed are credited to the Fund’s DTC account by 12:00 p.m. ET, on such next business day. Any further outstanding amount of the redemption order shall be cancelled. The Distributor is also authorized to deliver the redemption distribution notwithstanding that the Baskets to be redeemed are not credited to the Fund’s DTC account by 12:00 p.m. ET, on the business day immediately following the redemption order date if the Authorized Participant has collateralized its obligation to deliver the Baskets through DTC’s book entry system on such terms as the Distributor and the Managing Owner may from time-to-time agree.
Suspension or Rejection of Redemption Orders. The Managing Owner may suspend the right of redemption, or postpone the redemption settlement date, (1) for any period during which an emergency exists as a result of which the redemption distribution is not reasonably practicable, or (2) for such other period as the Managing Owner determines to be necessary for the protection of the Shareholders. The Managing Owner will not be liable to any person or in any way for any loss or damages that may result from any such suspension or postponement.
A redemption order may be rejected if the order is not in proper form as described in the order form and/or Participant Agreement or if the fulfillment of the order, in the opinion of its counsel, might be unlawful.
(8) Operating Expenses
(a) Management Fee
The Master Fund pays the Managing Owner, monthly in arrears, a fee (the “Management Fee”) equal to 0.85% per annum based on the average daily Net Asset Value of the Master Fund. The Managing Owner voluntarily agreed to waive a portion of its Management Fee in the amount of 0.10% per annum reducing the Management Fee to 0.75% per annum based on the average daily Net Asset Value of the Master Fund. For the years ended December 31, 2019, 2018 and 2017, the Management Fee paid by the Master Fund was as follows:
| Period |
Management Fee |
Voluntary Fee Waiver |
Net Management Fee |
|||||||||
| Year ended December 31, 2019 |
$ | 1,140,124 | $ | (134,132 | ) | $ | 1,005,992 | |||||
| Year ended December 31, 2018 |
$ | 1,436,067 | $ | (168,949 | ) | $ | 1,267,118 | |||||
| Year ended December 31, 2017 |
$ | 1,513,176 | $ | (178,022 | ) | $ | 1,335,154 | |||||
(b) Brokerage Commissions
Brokerage commissions are charged against the Fund’s assets on a per transaction basis. Brokerage commissions incurred for the years ended December 31, 2019, 2018 and 2017 were $142,775, $175,786 and $178,822, respectively.
(9) Profit and Loss Allocations and Distributions
The Managing Owner and the Shareholders share in any profits and losses of the Fund attributable to the Fund in proportion to the percentage interest owned by each. Distributions may be made at the sole discretion of the
F-35
Table of Contents
Managing Owner on a pro-rata basis in accordance with the respective capital balances of the Shareholders, but the Fund is under no obligation to make periodic distributions to Shareholders. The Fund has made no distributions to its Shareholders since the Fund commenced operations.
(10) Commitments and Contingencies
The Managing Owner, either in its own capacity or in its capacity as the Managing Owner and on behalf of the Funds, has entered into various service agreements that contain indemnification and exculpation provisions with respect to costs, expenses, damages, liabilities and/or claims that may be incurred by a service provider in connection with the provision of its services to the Funds. As of December 31, 2019, no party to any such service agreement has made a claim against the Funds, and it is therefore not possible to estimate the Funds’ potential future exposure under such indemnification and exculpation provisions.
(11) Net Asset Value and Financial Highlights
The Fund is presenting the following Net Asset Value and financial highlights related to investment performance and operations for a Share outstanding for the years ended December 31, 2019, 2018 and 2017.
| 2019 | 2018 | 2017 | ||||||||||
| Net Asset Value |
||||||||||||
| Net asset value per Limited Share, beginning of year |
$ | 17.50 | $ | 19.25 | $ | 19.35 | ||||||
| Investment operations: |
||||||||||||
| Net realized and unrealized gain (loss)(1) |
1.07 | (1.93 | ) | (0.10 | ) | |||||||
| Net investment income(2) |
0.23 | 0.18 | 0.00 | (3) | ||||||||
|
|
|
|
|
|
|
|||||||
| Net increase (decrease) in net assets from operations |
1.30 | (1.75 | ) | (0.10 | ) | |||||||
|
|
|
|
|
|
|
|||||||
| Net asset value per Limited Share, end of year |
$ | 18.80 | $ | 17.50 | $ | 19.25 | ||||||
|
|
|
|
|
|
|
|||||||
| Total Return, at net asset value(4) |
7.43 | % | (9.09 | )% | (0.52 | )% | ||||||
|
|
|
|
|
|
|
|||||||
| Ratios/ Supplemental Data: |
||||||||||||
| Net assets, end of year (000’s omitted) |
$ | 127,836 | $ | 154,855 | $ | 154,956 | ||||||
| Ratios to average net assets of: |
||||||||||||
| Net investment income |
1.30 | % | 0.94 | % | 0.01 | % | ||||||
|
|
|
|
|
|
|
|||||||
| Expenses, prior to expense waivers |
0.85 | % | 0.85 | % | 0.85 | % | ||||||
|
|
|
|
|
|
|
|||||||
| Expenses, net of expense waivers |
0.75 | % | 0.75 | % | 0.75 | % | ||||||
|
|
|
|
|
|
|
|||||||
| (1) | Includes brokerage commissions of approximately $(0.02) per share for the years ended December 31, 2019, 2018 and 2017, respectively. See Note 8(b) on page F-35. |
| (2) | Based on average shares outstanding. |
| (3) | Amount represents less than $0.01. |
| (4) | For the periods in which the Managing Owner waived a portion of its Management Fee, the total return would have been lower if such expenses had not been waived. See Note 8(a) on page F-35. |
F-36
Table of Contents
SIGNATURES
Pursuant to the requirements of the Securities Exchange Act of 1934, the registrant and co-registrant have duly caused this Annual report to be signed on its behalf by the undersigned, thereunto duly authorized.
Pursuant to section 4.22(h) under the Commodity Exchange Act, the undersigned represents that, to the best of their knowledge and belief, the information contained in this Annual Report is accurate and complete.
| WisdomTree Commodity Services, LLC, Managing Owner of the WisdomTree Continuous | ||||||
| By: | /s/ Jeremy Schwartz | |||||
| Jeremy Schwartz | ||||||
| President and Chief Executive Officer | ||||||
| (Principal Executive Officer) | ||||||
| Date: February 21, 2020 | ||||||
| By: | /s/ David Castano | |||||
| David Castano | ||||||
| Chief Financial Officer and Treasurer | ||||||
| (Principal Financial Officer) | ||||||
| Date: February 21, 2020 | ||||||