Attached files
| file | filename |
|---|---|
| 8-K - 8-K - VERIZON COMMUNICATIONS INC | a21320208-k.htm |
2020 Verizon Investor Day February 13, 2020 © 2020 Verizon
Safe harbor statement NOTE: In this presentation we have made forward-looking statements. in technology or technology substitution; disruption of our key suppliers’ These statements are based on our estimates and assumptions and are provisioning of products or services; changes in the regulatory environment subject to risks and uncertainties. Forward-looking statements include the in which we operate, including any increase in restrictions on our ability to information concerning our possible or assumed future results of operate our networks; breaches of network or information technology operations. Forward-looking statements also include those preceded or security, natural disasters, terrorist attacks or acts of war or significant followed by the words “anticipates,” “believes,” “estimates,” “expects,” litigation and any resulting financial impact not covered by insurance; our “hopes” or similar expressions. For those statements, we claim the high level of indebtedness; an adverse change in the ratings afforded our protection of the safe harbor for forward-looking statements contained in debt securities by nationally accredited ratings organizations or adverse the Private Securities Litigation Reform Act of 1995. We undertake no conditions in the credit markets affecting the cost, including interest rates, obligation to revise or publicly release the results of any revision to these and/or availability of further financing; material adverse changes in labor forward-looking statements, except as required by law. Given these risks matters, including labor negotiations, and any resulting financial and/or and uncertainties, readers are cautioned not to place undue reliance on operational impact; significant increases in benefit plan costs or lower such forward-looking statements. The following important factors, along investment returns on plan assets; changes in tax laws or treaties, or in their with those discussed in our filings with the Securities and Exchange interpretation; changes in accounting assumptions that regulatory agencies, Commission (the “SEC”), could affect future results and could cause those including the SEC, may require or that result from changes in the results to differ materially from those expressed in the forward-looking accounting rules or their application, which could result in an impact on statements: adverse conditions in the U.S. and international economies; the earnings; the inability to implement our business strategies; and the inability effects of competition in the markets in which we operate; material changes to realize the expected benefits of strategic transactions. As required by SEC rules, we have provided a reconciliation of the non-GAAP financial measures included in this presentation to the most directly comparable GAAP measures in materials on our website at www.verizon.com/about/investors © 2020 Verizon 2

© 2020 Verizon 3
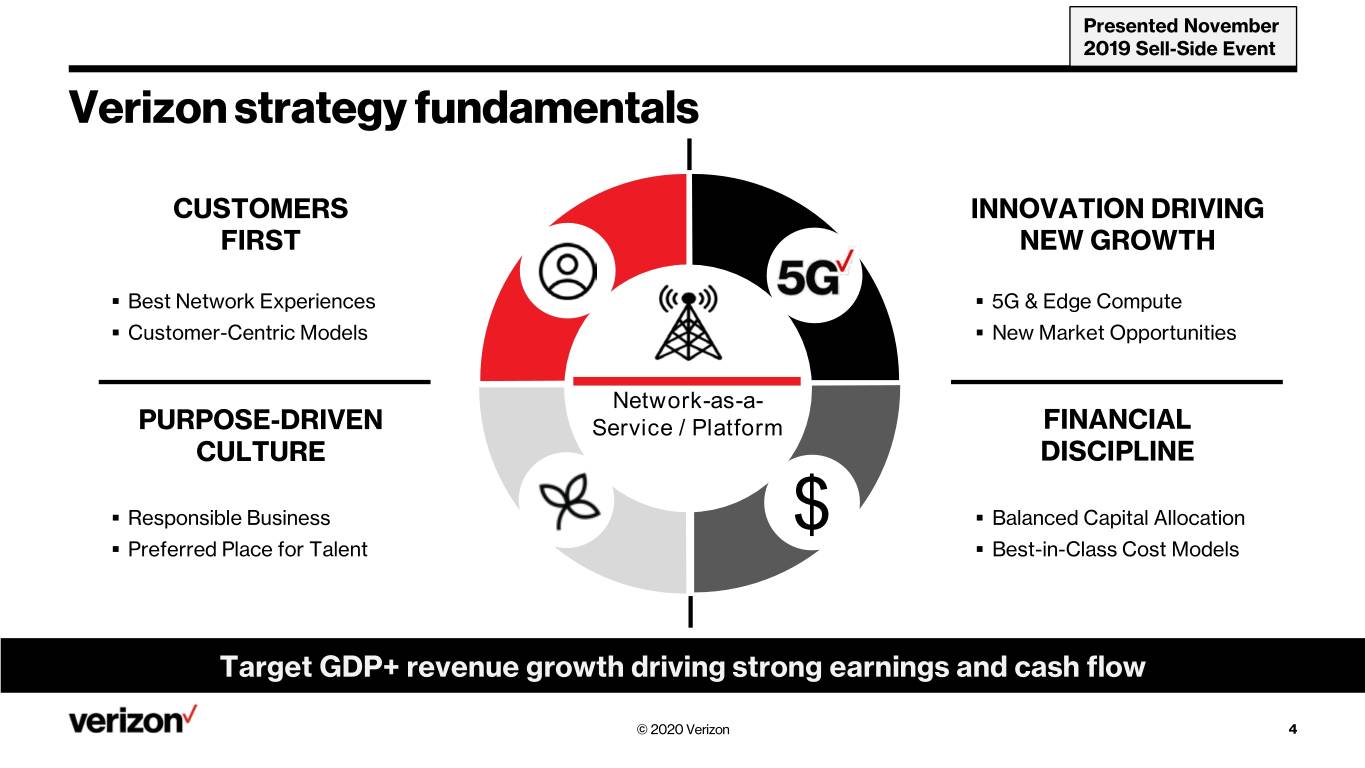
Presented November 2019 Sell-Side Event Verizon strategy fundamentals CUSTOMERS INNOVATION DRIVING FIRST NEW GROWTH . Best Network Experiences . 5G & Edge Compute . Customer-Centric Models . New Market Opportunities Network000-as-a- PURPOSE-DRIVEN Service / Platform FINANCIAL CULTURE DISCIPLINE . Responsible Business $ . Balanced Capital Allocation . Preferred Place for Talent . Best-in-Class Cost Models Target GDP+ revenue growth driving strong earnings and cash flow © 2020 Verizon 4
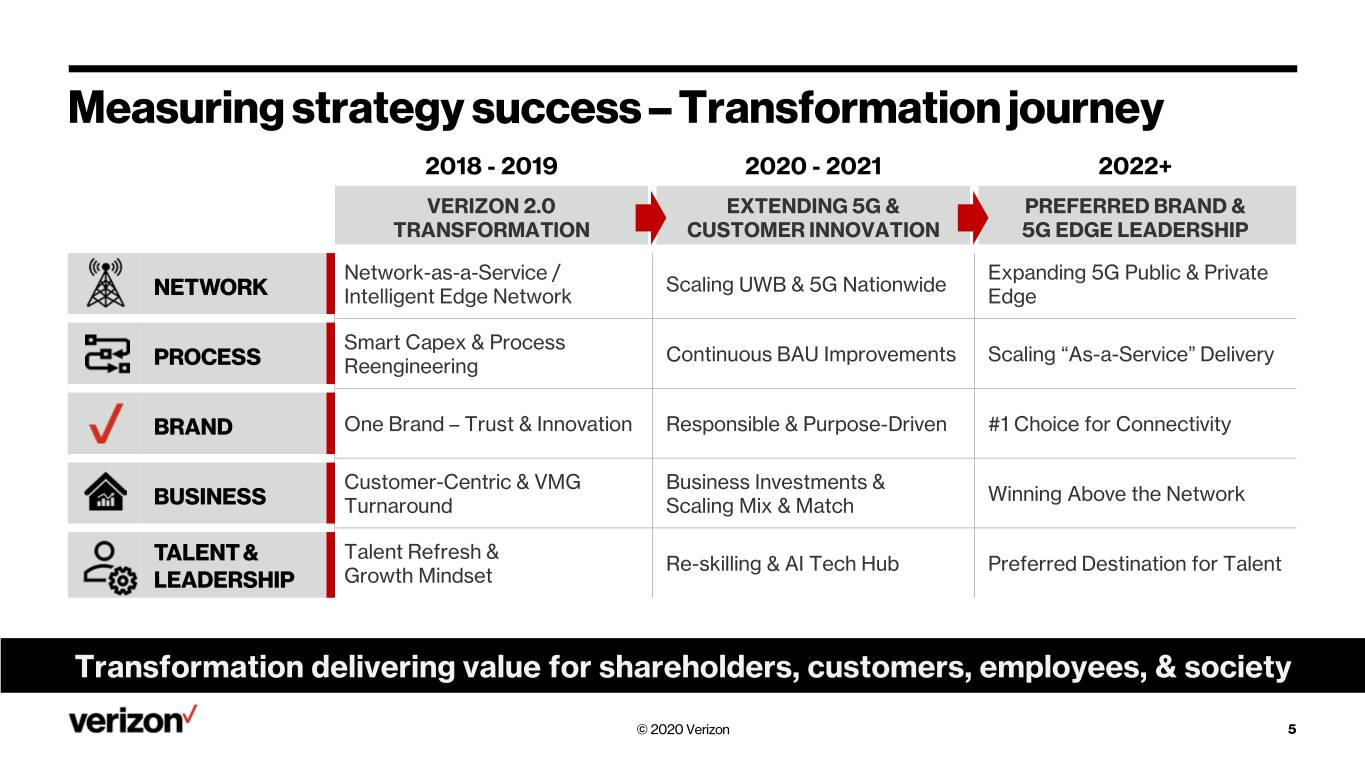
Measuring strategy success – Transformation journey 2018 - 2019 2020 - 2021 2022+ VERIZON 2.0 EXTENDING 5G & PREFERRED BRAND & TRANSFORMATION CUSTOMER INNOVATION 5G EDGE LEADERSHIP Network-as-a-Service / Expanding 5G Public & Private Scaling UWB & 5G Nationwide NETWORK Intelligent Edge Network Edge Smart Capex & Process Continuous BAU Improvements Scaling “As-a-Service” Delivery PROCESS Reengineering BRAND One Brand – Trust & Innovation Responsible & Purpose-Driven #1 Choice for Connectivity Customer-Centric & VMG Business Investments & Winning Above the Network BUSINESS Turnaround Scaling Mix & Match Talent Refresh & TALENT & Re-skilling & AI Tech Hub Preferred Destination for Talent LEADERSHIP Growth Mindset Transformation delivering value for shareholders, customers, employees, & society © 2020 Verizon 5
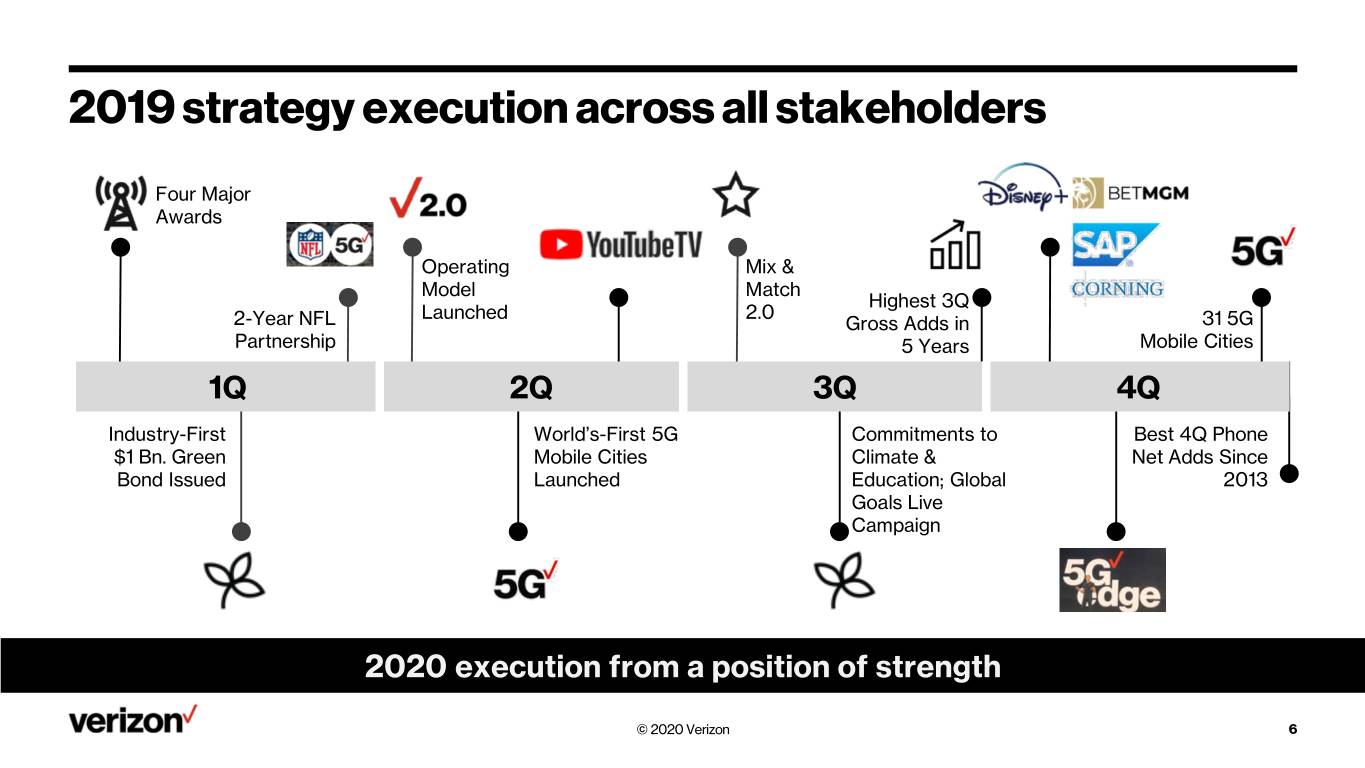
2019 strategy execution across all stakeholders Four Major Awards Operating Mix & Model Match Highest 3Q Launched 2.0 2-Year NFL Gross Adds in 31 5G Partnership 5 Years Mobile Cities 1Q 2Q 3Q 4Q Industry-First World’s-First 5G Commitments to Best 4Q Phone $1 Bn. Green Mobile Cities Climate & Net Adds Since Bond Issued Launched Education; Global 2013 Goals Live Campaign 2020 execution from a position of strength © 2020 Verizon 6
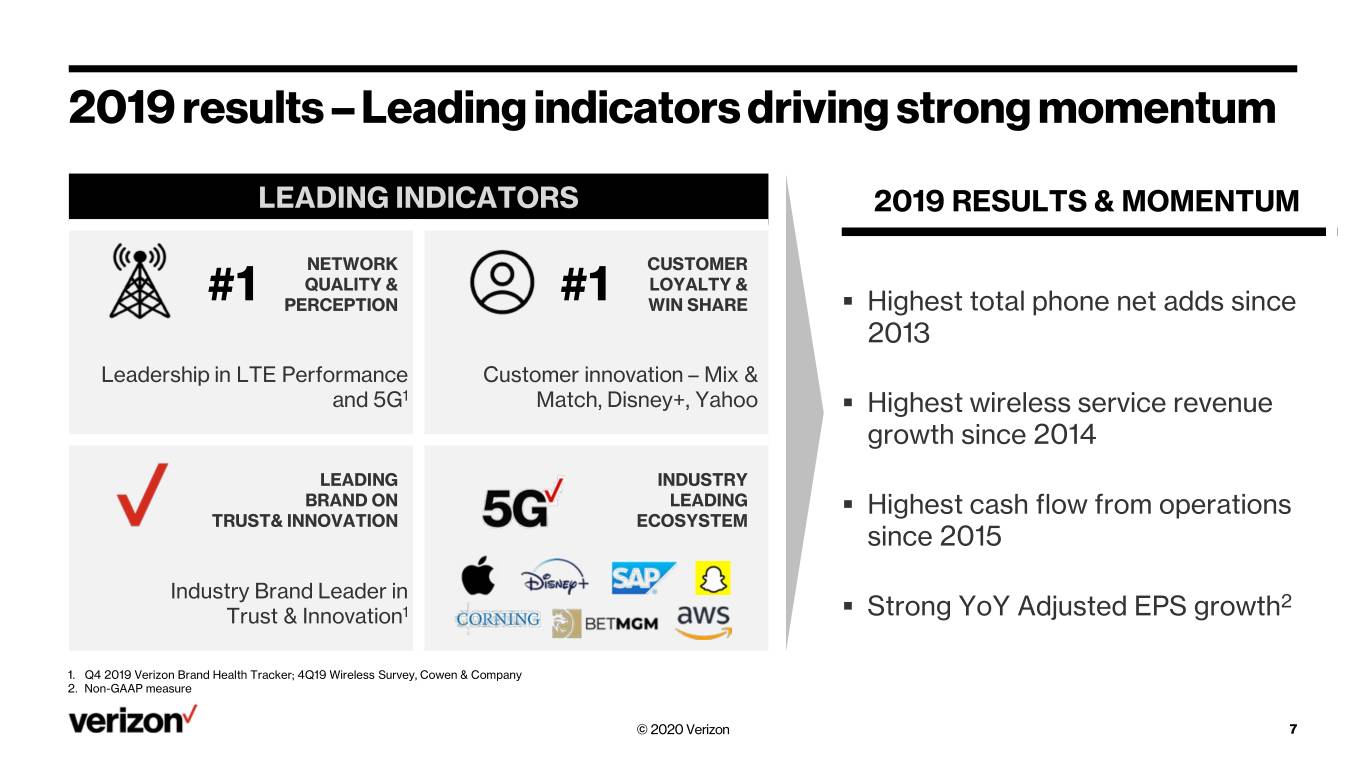
2019 results – Leading indicators driving strong momentum LEADING INDICATORS 2019 RESULTS & MOMENTUM NETWORK CUSTOMER QUALITY & LOYALTY & #1 PERCEPTION #1 WIN SHARE . Highest total phone net adds since 2013 Leadership in LTE Performance Customer innovation – Mix & and 5G1 Match, Disney+, Yahoo . Highest wireless service revenue growth since 2014 LEADING INDUSTRY BRAND ON LEADING . Highest cash flow from operations TRUST& INNOVATION ECOSYSTEM since 2015 Industry Brand Leader in 2 Trust & Innovation1 . Strong YoY Adjusted EPS growth 1. Q4 2019 Verizon Brand Health Tracker; 4Q19 Wireless Survey, Cowen & Company 2. Non-GAAP measure © 2020 Verizon 7
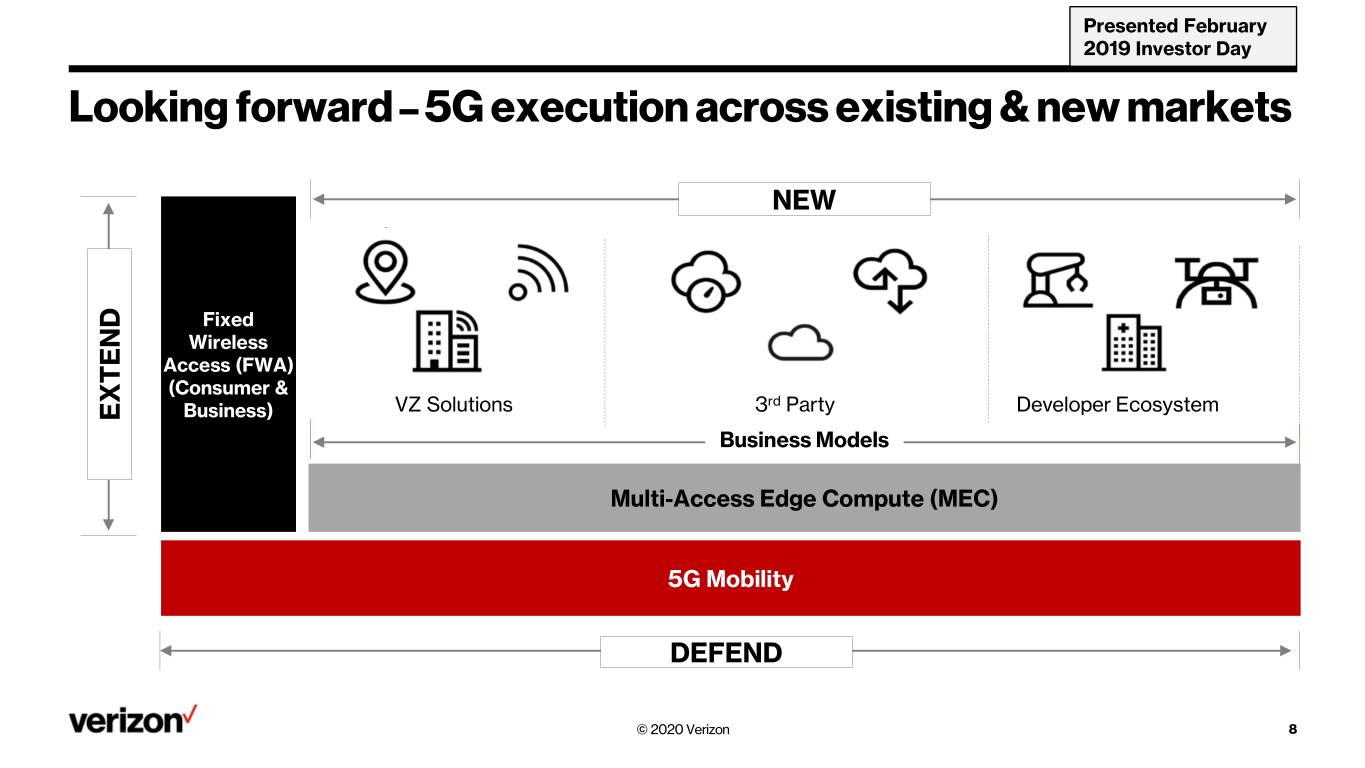
Presented February 2019 Investor Day Looking forward – 5G execution across existing & new markets NEW Fixed Wireless Access (FWA) (Consumer & VZ Solutions 3rd Party Developer Ecosystem EXTEND Business) Business Models Manufacturing Multi-Access Edge Compute (MEC) 5G Mobility DEFEND © 2020 Verizon 8
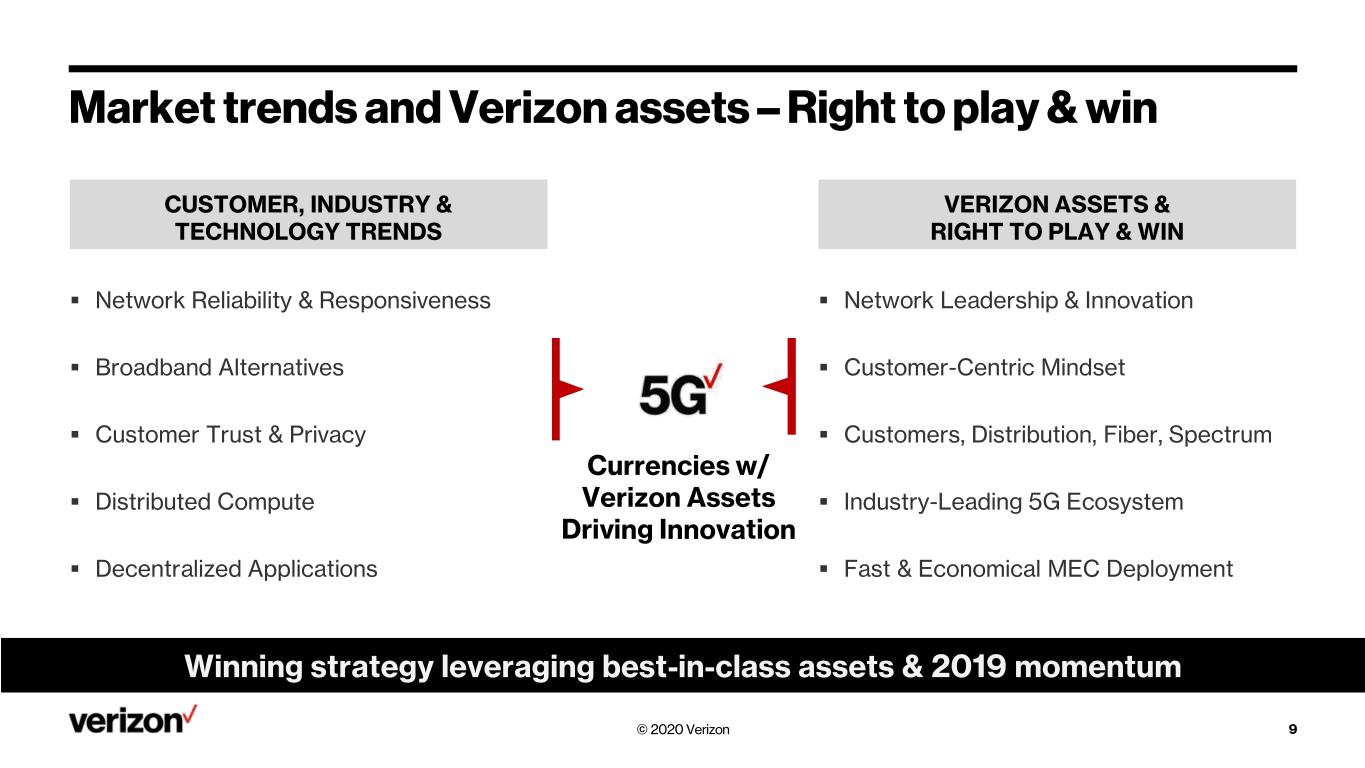
Market trends and Verizon assets – Right to play & win CUSTOMER, INDUSTRY & VERIZON ASSETS & TECHNOLOGY TRENDS RIGHT TO PLAY & WIN . Network Reliability & Responsiveness . Network Leadership & Innovation . Broadband Alternatives . Customer-Centric Mindset . Customer Trust & Privacy . Customers, Distribution, Fiber, Spectrum Currencies w/ . Distributed Compute Verizon Assets . Industry-Leading 5G Ecosystem Driving Innovation . Decentralized Applications . Fast & Economical MEC Deployment Winning strategy leveraging best-in-class assets & 2019 momentum © 2020 Verizon 9
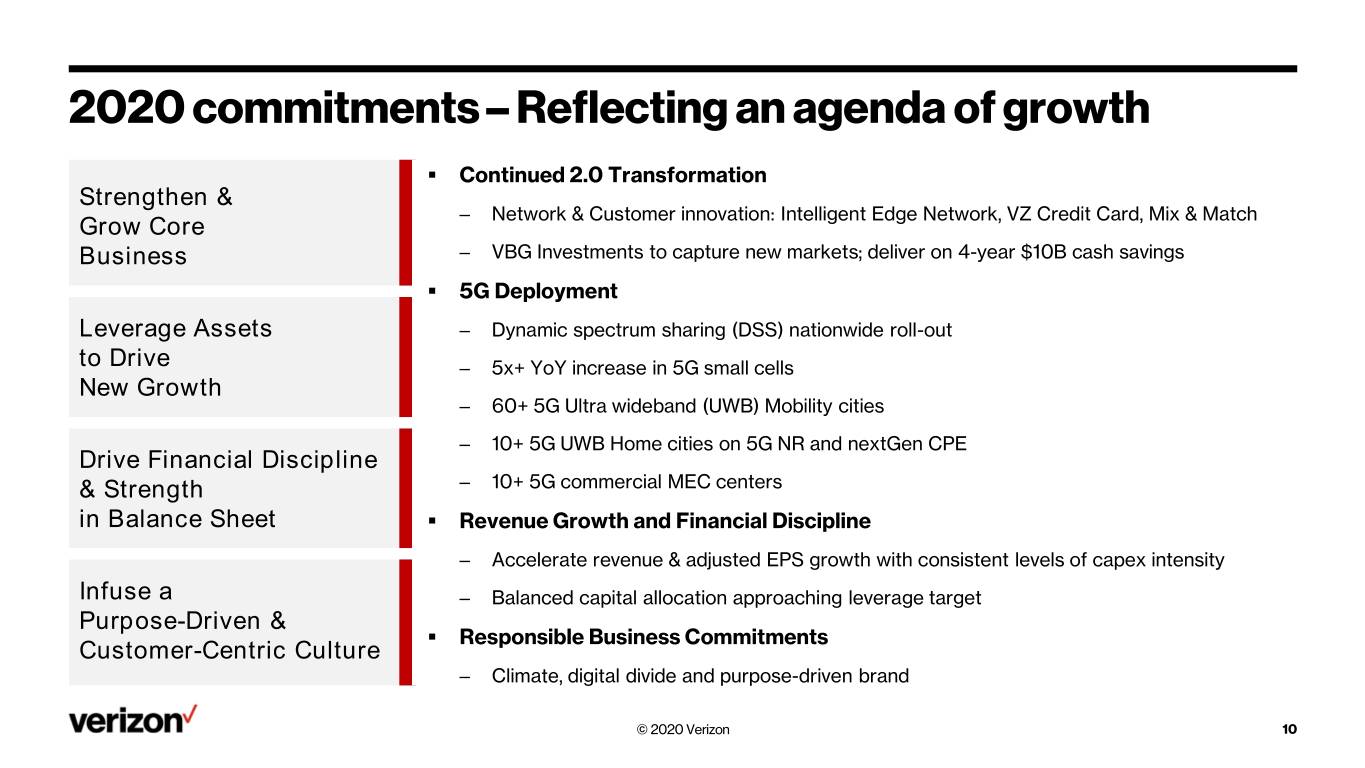
2020 commitments – Reflecting an agenda of growth . Continued 2.0 Transformation Strengthen & ‒ Network & Customer innovation: Intelligent Edge Network, VZ Credit Card, Mix & Match Grow Core Business ‒ VBG Investments to capture new markets; deliver on 4-year $10B cash savings . 5G Deployment Leverage Assets ‒ Dynamic spectrum sharing (DSS) nationwide roll-out to Drive ‒ 5x+ YoY increase in 5G small cells New Growth ‒ 60+ 5G Ultra wideband (UWB) Mobility cities ‒ 10+ 5G UWB Home cities on 5G NR and nextGen CPE Drive Financial Discipline & Strength ‒ 10+ 5G commercial MEC centers in Balance Sheet . Revenue Growth and Financial Discipline ‒ Accelerate revenue & adjusted EPS growth with consistent levels of capex intensity Infuse a ‒ Balanced capital allocation approaching leverage target Purpose-Driven & . Responsible Business Commitments Customer-Centric Culture ‒ Climate, digital divide and purpose-driven brand © 2020 Verizon 10
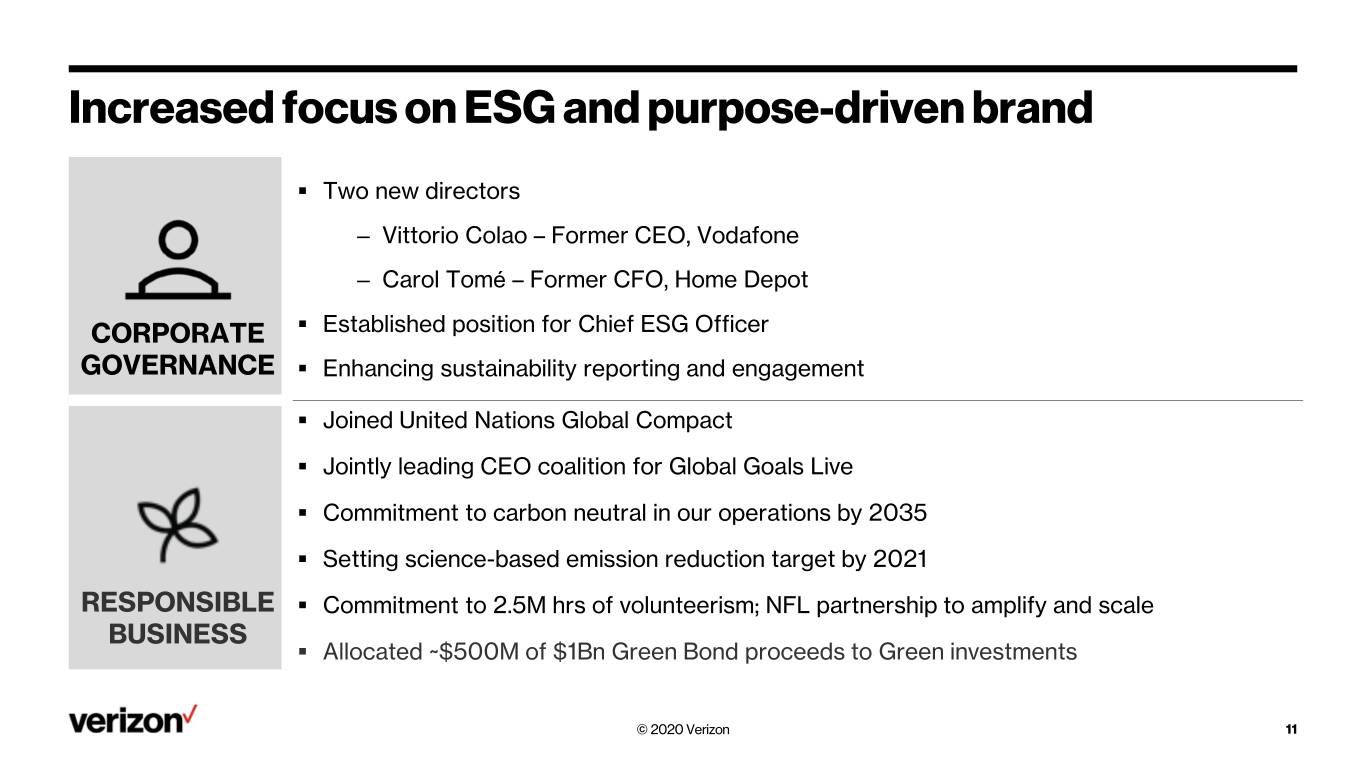
Increased focus on ESG and purpose-driven brand . Two new directors – Vittorio Colao – Former CEO, Vodafone – Carol Tomé – Former CFO, Home Depot CORPORATE . Established position for Chief ESG Officer GOVERNANCE . Enhancing sustainability reporting and engagement . Joined United Nations Global Compact . Jointly leading CEO coalition for Global Goals Live . Commitment to carbon neutral in our operations by 2035 . Setting science-based emission reduction target by 2021 RESPONSIBLE . Commitment to 2.5M hrs of volunteerism; NFL partnership to amplify and scale BUSINESS . Allocated ~$500M of $1Bn Green Bond proceeds to Green investments © 2020 Verizon 11

© 2020 Verizon 12
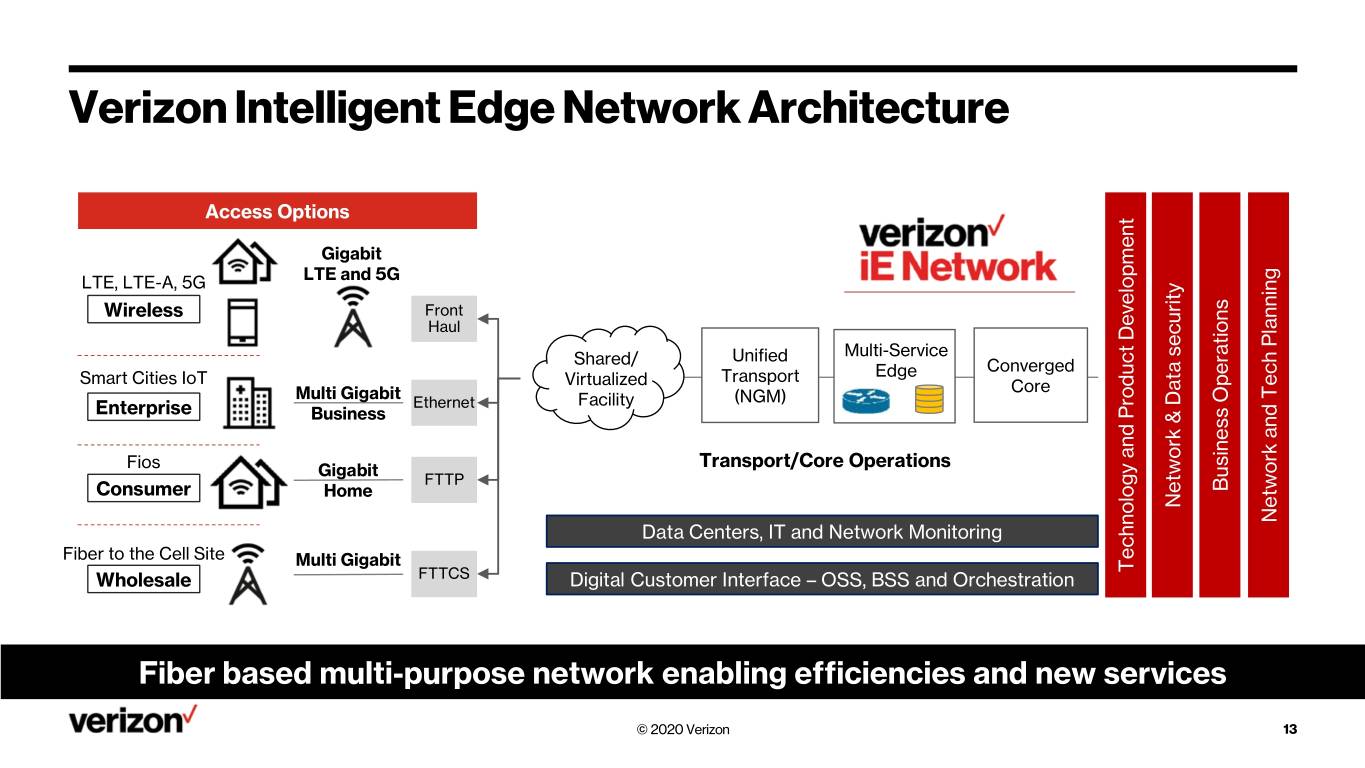
Verizon Intelligent Edge Network Architecture Access Options Gigabit LTE, LTE-A, 5G LTE and 5G Wireless Front Haul Unified Multi-Service Shared/ Converged Smart Cities IoT Virtualized Transport Edge Multi Gigabit Core Ethernet Facility (NGM) Enterprise Business Transport/Core Operations and Product Development Fios Gigabit FTTP Consumer Home Business Operations Network& Data security Network and Data Security Network and Tech Planning Data Centers, IT and Network Monitoring Fiber to the Cell Site Multi Gigabit Wholesale FTTCS Digital Customer Interface – OSS, BSS and Orchestration Technology Fiber based multi-purpose network enabling efficiencies and new services © 2020 Verizon 13
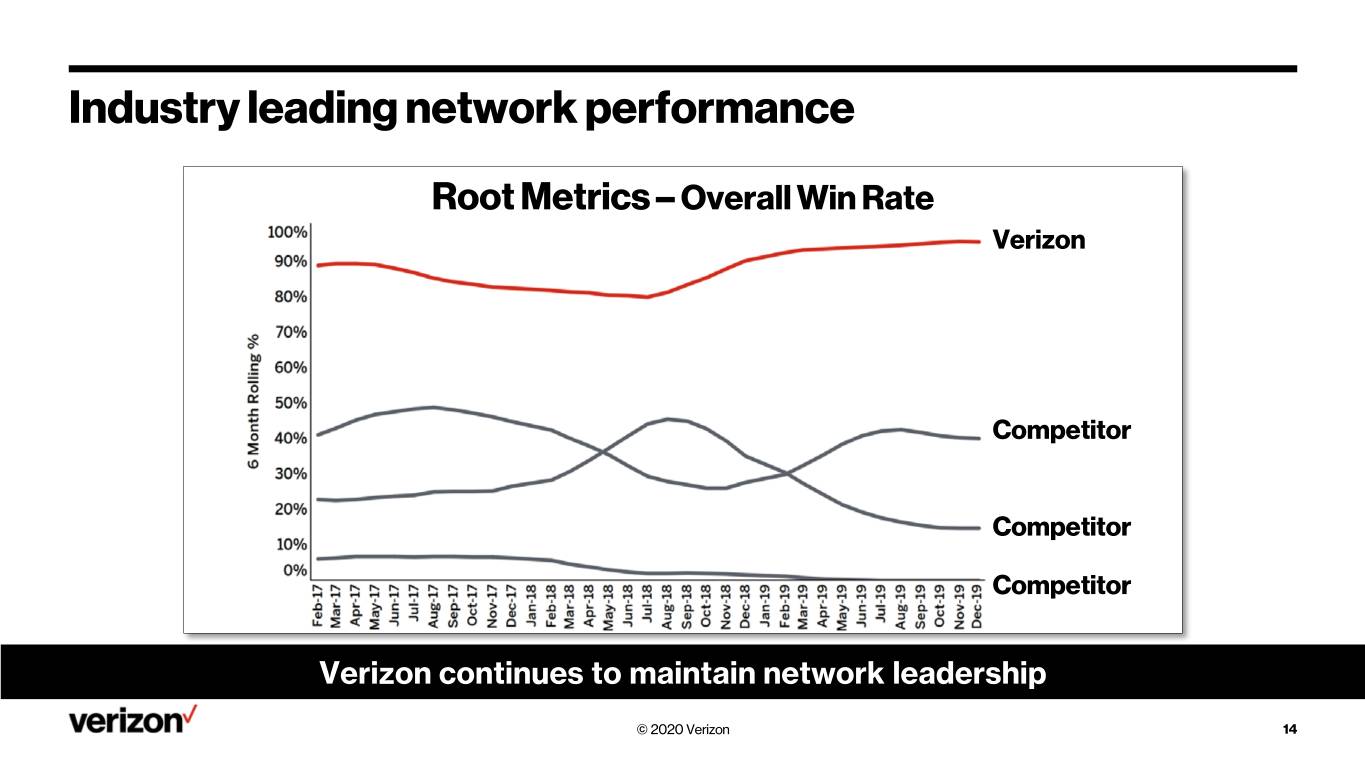
Industry leading network performance Root Metrics – Overall Win Rate Verizon Competitor Competitor Competitor Verizon continues to maintain network leadership © 2020 Verizon 14
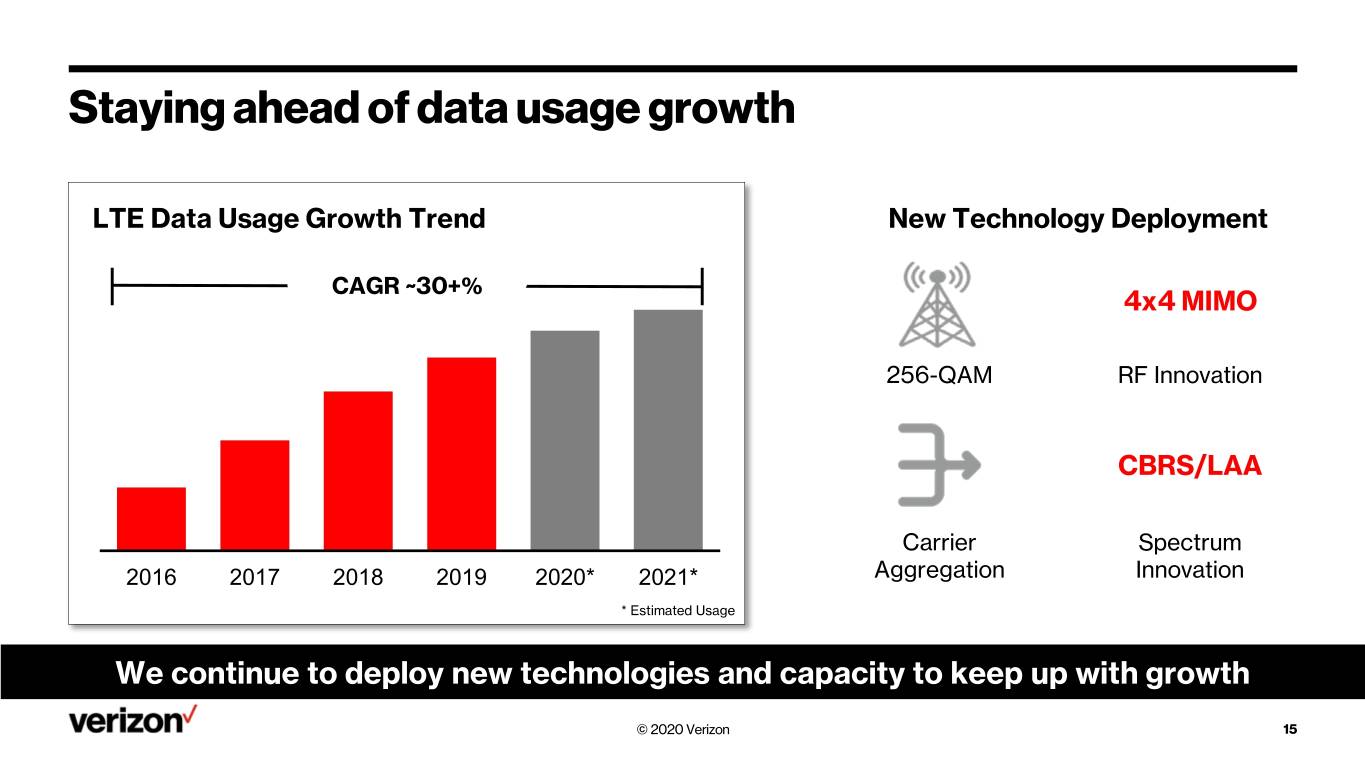
Staying ahead of data usage growth LTE Data Usage Growth Trend New Technology Deployment CAGR ~30+% 4x4 MIMO 256-QAM RF Innovation CBRS/LAA Carrier Spectrum 2016 2017 2018 2019 2020* 2021* Aggregation Innovation * Estimated Usage We continue to deploy new technologies and capacity to keep up with growth © 2020 Verizon 15
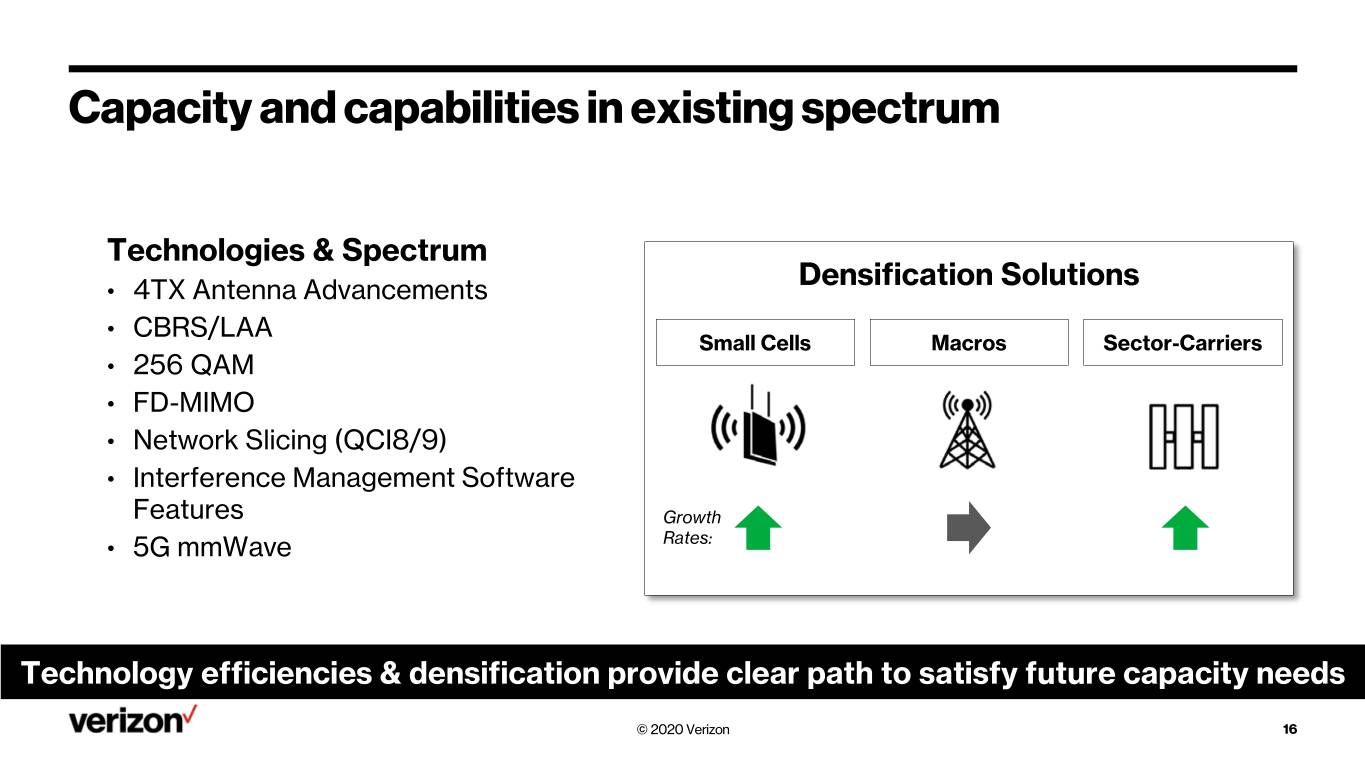
Capacity and capabilities in existing spectrum Technologies & Spectrum Densification Solutions • 4TX Antenna Advancements • CBRS/LAA Small Cells Macros Sector-Carriers • 256 QAM • FD-MIMO • Network Slicing (QCI8/9) • Interference Management Software Features Growth Rates: • 5G mmWave Technology efficiencies & densification provide clear path to satisfy future capacity needs © 2020 Verizon 16
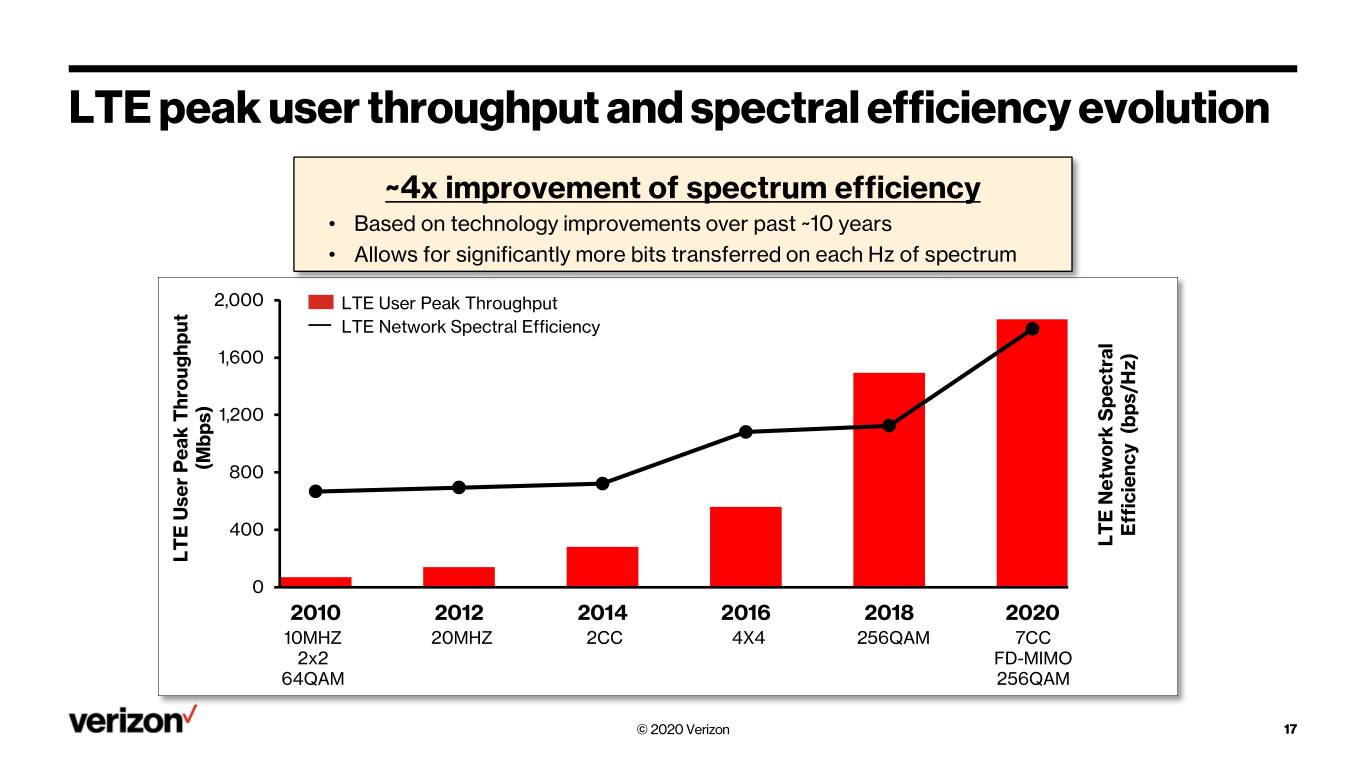
LTE peak user throughput and spectral efficiency evolution ~4x improvement of spectrum efficiency • Based on technology improvements over past ~10 years • Allows for significantly more bits transferred on each Hz of spectrum 2,000 LTE User Peak Throughput LTE Network Spectral Efficiency 1,600 1,200 (Mbps) 800 400 (bps/Hz) Efficiency LTE Network Spectral LTE User Peak Throughput 0 2010 2012 2014 2016 2018 2020 10MHZ 20MHZ 2CC 4X4 256QAM 7CC 2x2 FD-MIMO 64QAM 256QAM © 2020 Verizon 17
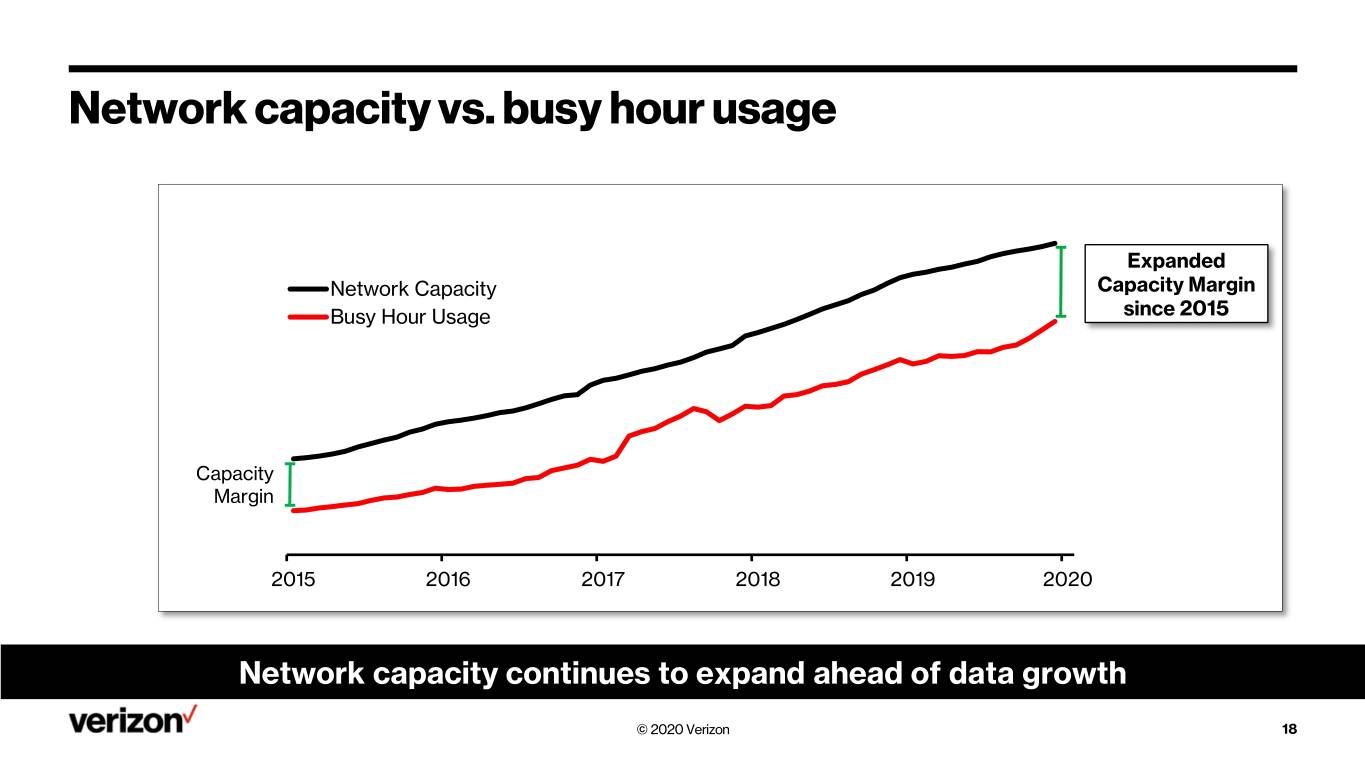
Network capacity vs. busy hour usage Expanded Network Capacity Capacity Margin Busy Hour Usage since 2015 Capacity Margin 2015 2016 2017 2018 2019 2020 Network capacity continues to expand ahead of data growth © 2020 Verizon 18
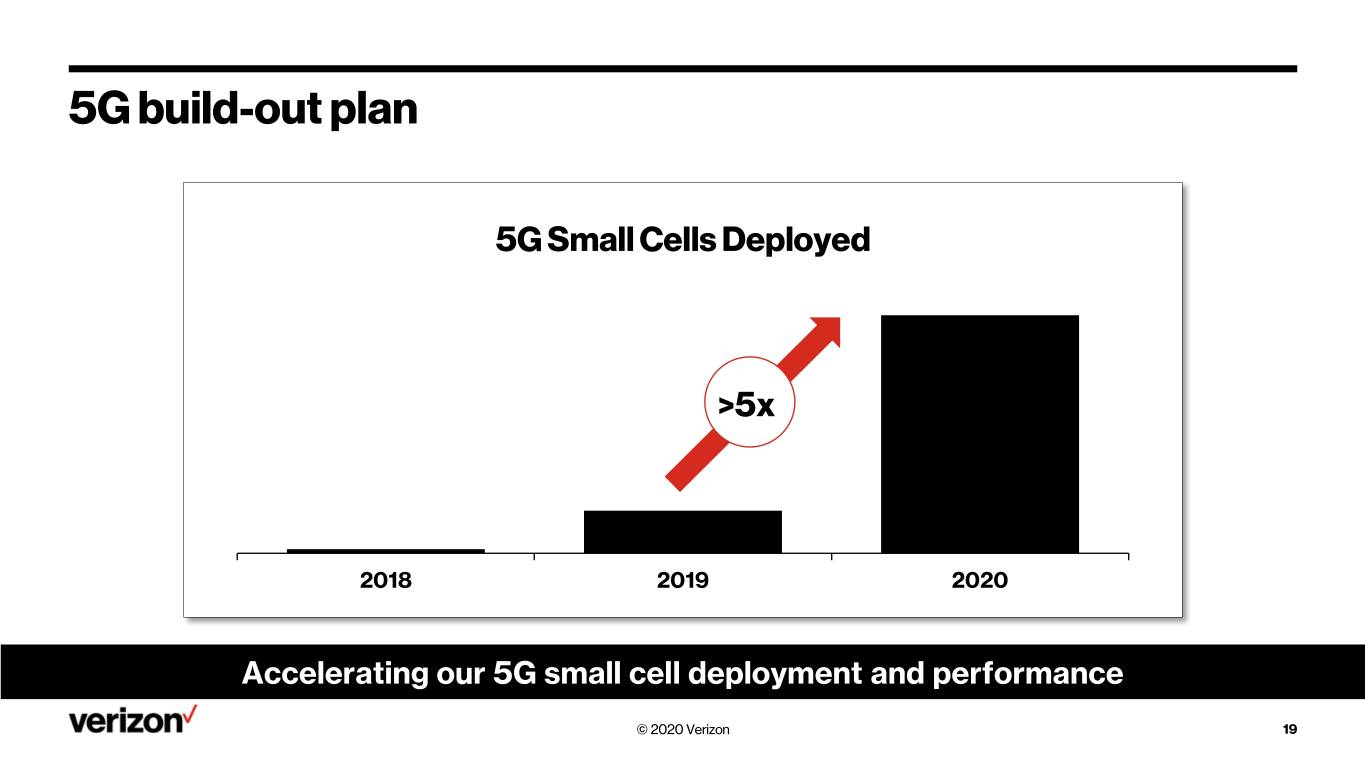
5G build-out plan 5G Small Cells Deployed >5x 2018 2019 2020 Accelerating our 5G small cell deployment and performance © 2020 Verizon 19

Dynamic Spectrum Sharing (DSS) • DSS allows for the deployment of 4G and 5G in the same spectrum at the same time • Lab testing on track • Field testing in progress • Network providers, chip manufacturers, OEMs delivering • Network preparations underway for nationwide rollout Commercially driven launch © 2020 Verizon 20
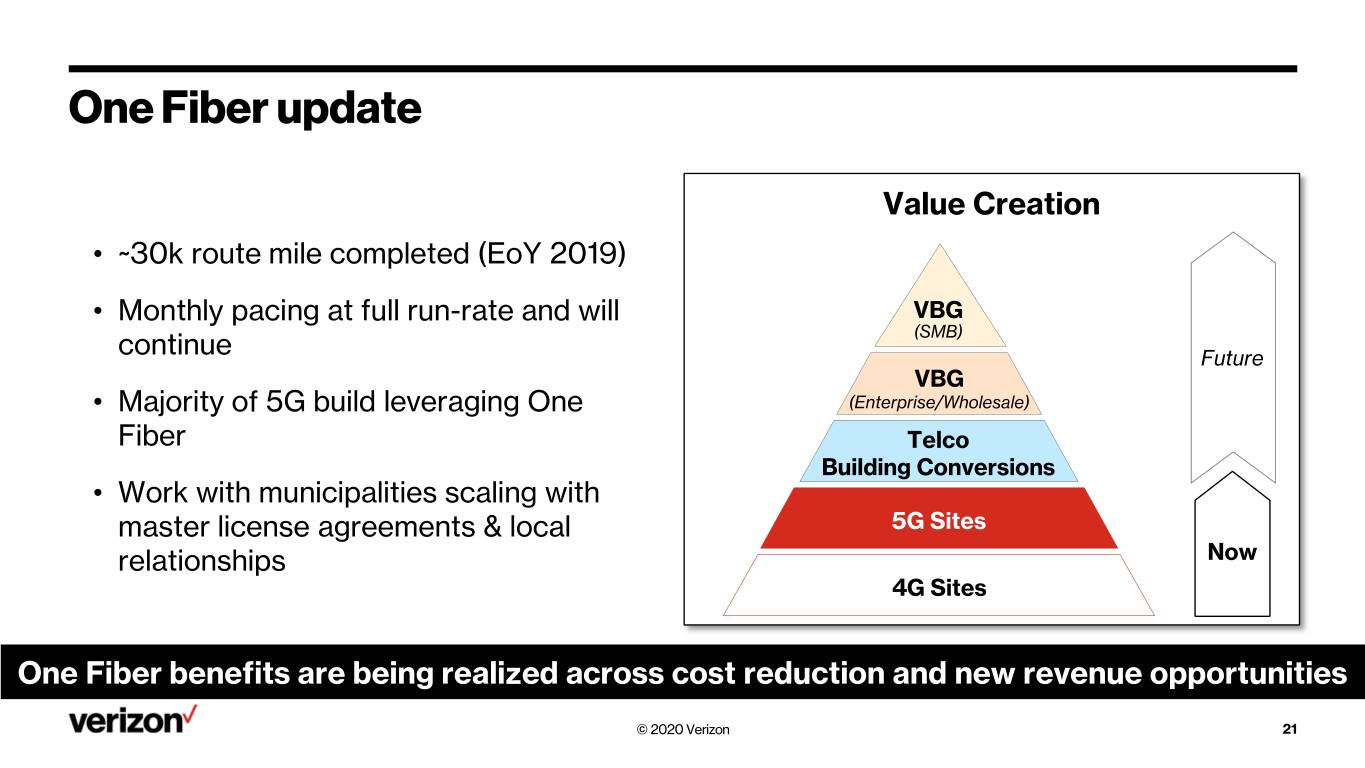
One Fiber update Value Creation • ~30k route mile completed (EoY 2019) • Monthly pacing at full run-rate and will VBG (SMB) continue Future VBG • Majority of 5G build leveraging One (Enterprise/Wholesale) Fiber Telco Building Conversions • Work with municipalities scaling with master license agreements & local 5G Sites relationships Now 4G Sites One Fiber benefits are being realized across cost reduction and new revenue opportunities © 2020 Verizon 21
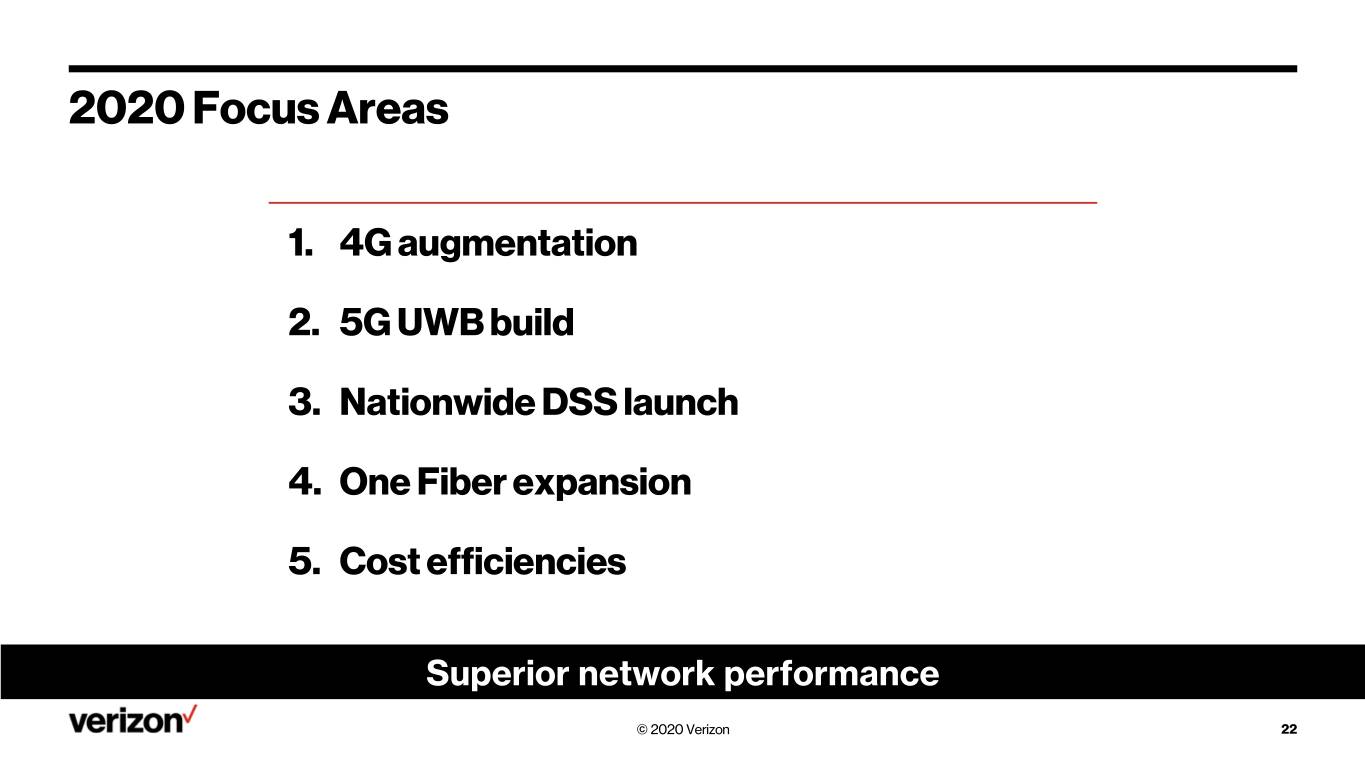
2020 Focus Areas 1. 4G augmentation 2. 5G UWB build 3. Nationwide DSS launch 4. One Fiber expansion 5. Cost efficiencies Superior network performance © 2020 Verizon 22

© 2020 Verizon
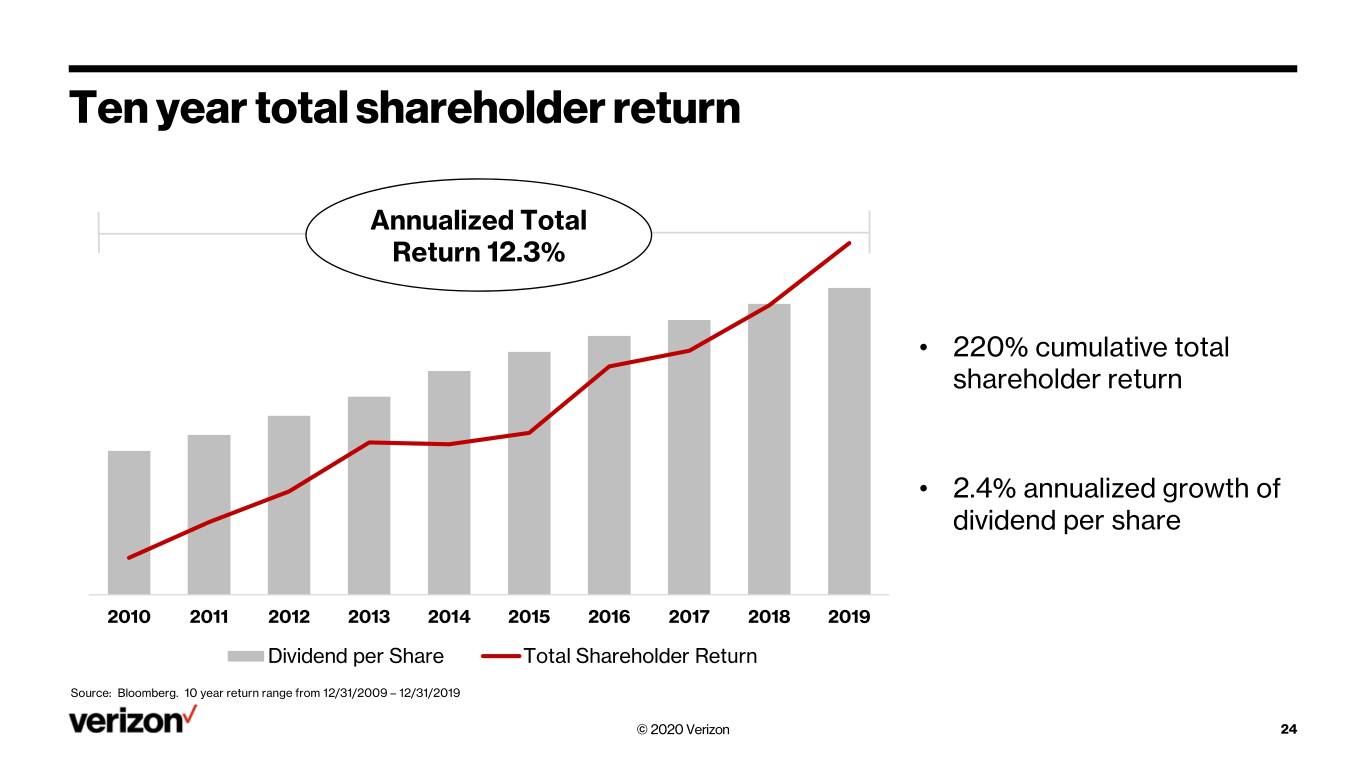
Ten year total shareholder return Annualized Total Return 12.3% • 220% cumulative total shareholder return • 2.4% annualized growth of dividend per share 2010 2011 2012 2013 2014 2015 2016 2017 2018 2019 Dividend per Share Total Shareholder Return Source: Bloomberg. 10 year return range from 12/31/2009 – 12/31/2019 © 2020 Verizon 24
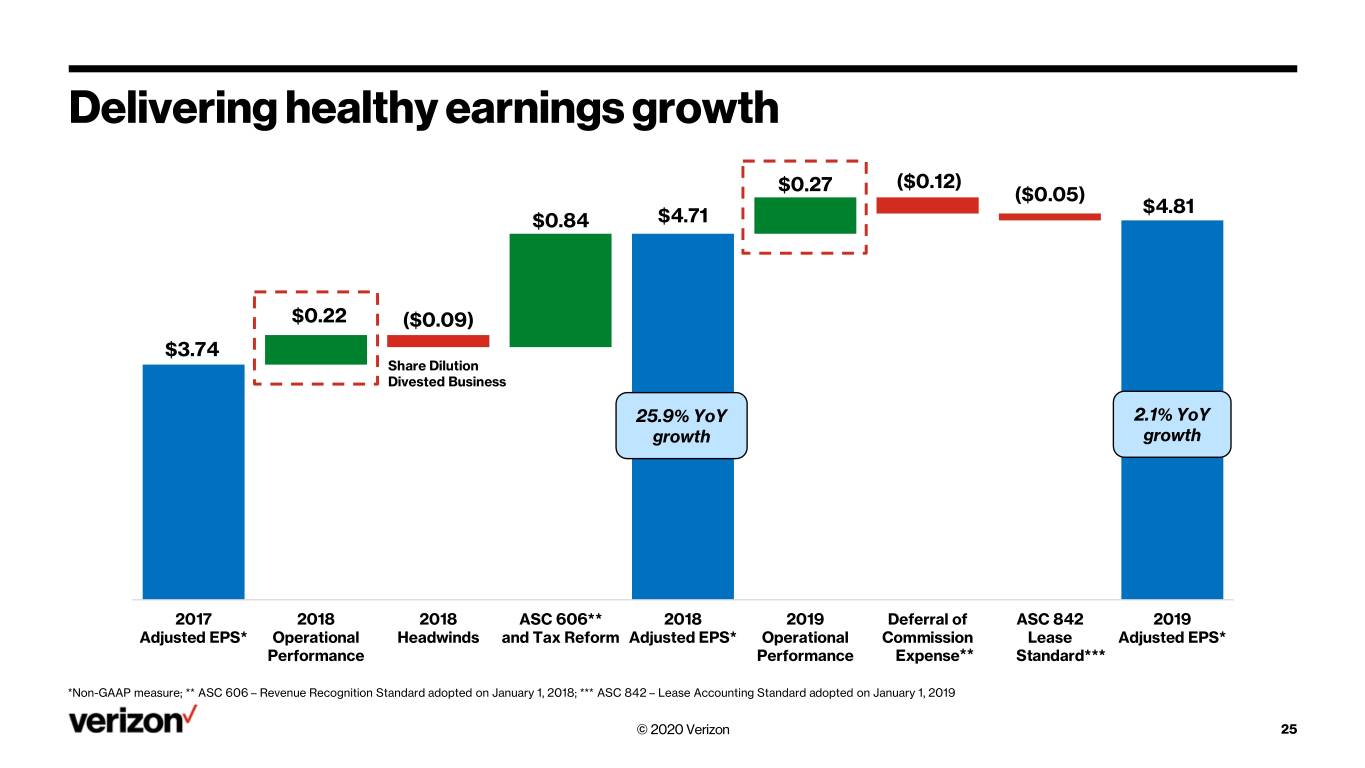
Delivering healthy earnings growth $0.27 ($0.12) ($0.05) $4.81 $0.84 $4.71 $0.22 ($0.09) $3.74 Share Dilution Divested Business 25.9% YoY 2.1% YoY growth growth 2017 2018 2018 ASC 606** 2018 2019 Deferral of ASC 842 2019 Adjusted EPS* Operational Headwinds and Tax Reform Adjusted EPS* Operational Commission Lease Adjusted EPS* Performance Performance Expense** Standard*** *Non-GAAP measure; ** ASC 606 – Revenue Recognition Standard adopted on January 1, 2018; *** ASC 842 – Lease Accounting Standard adopted on January 1, 2019 © 2020 Verizon 25
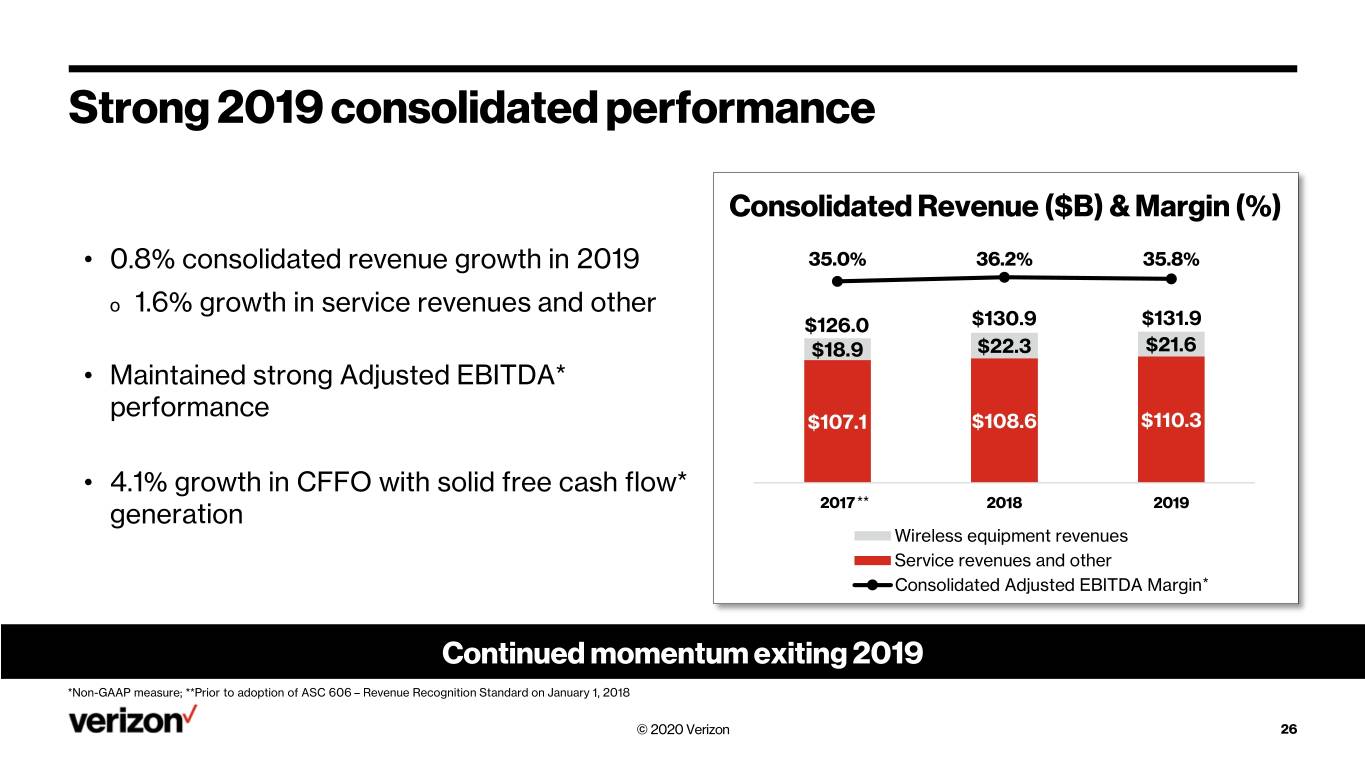
Strong 2019 consolidated performance Consolidated Revenue ($B) & Margin (%) • 0.8% consolidated revenue growth in 2019 35.0% 36.2% 35.8% o 1.6% growth in service revenues and other $126.0 $130.9 $131.9 $18.9 $22.3 $21.6 • Maintained strong Adjusted EBITDA* performance $107.1 $108.6 $110.3 • 4.1% growth in CFFO with solid free cash flow* generation 2017 ** 2018 2019 Wireless equipment revenues Service revenues and other Consolidated Adjusted EBITDA Margin* Continued momentum exiting 2019 *Non-GAAP measure; **Prior to adoption of ASC 606 – Revenue Recognition Standard on January 1, 2018 © 2020 Verizon 26
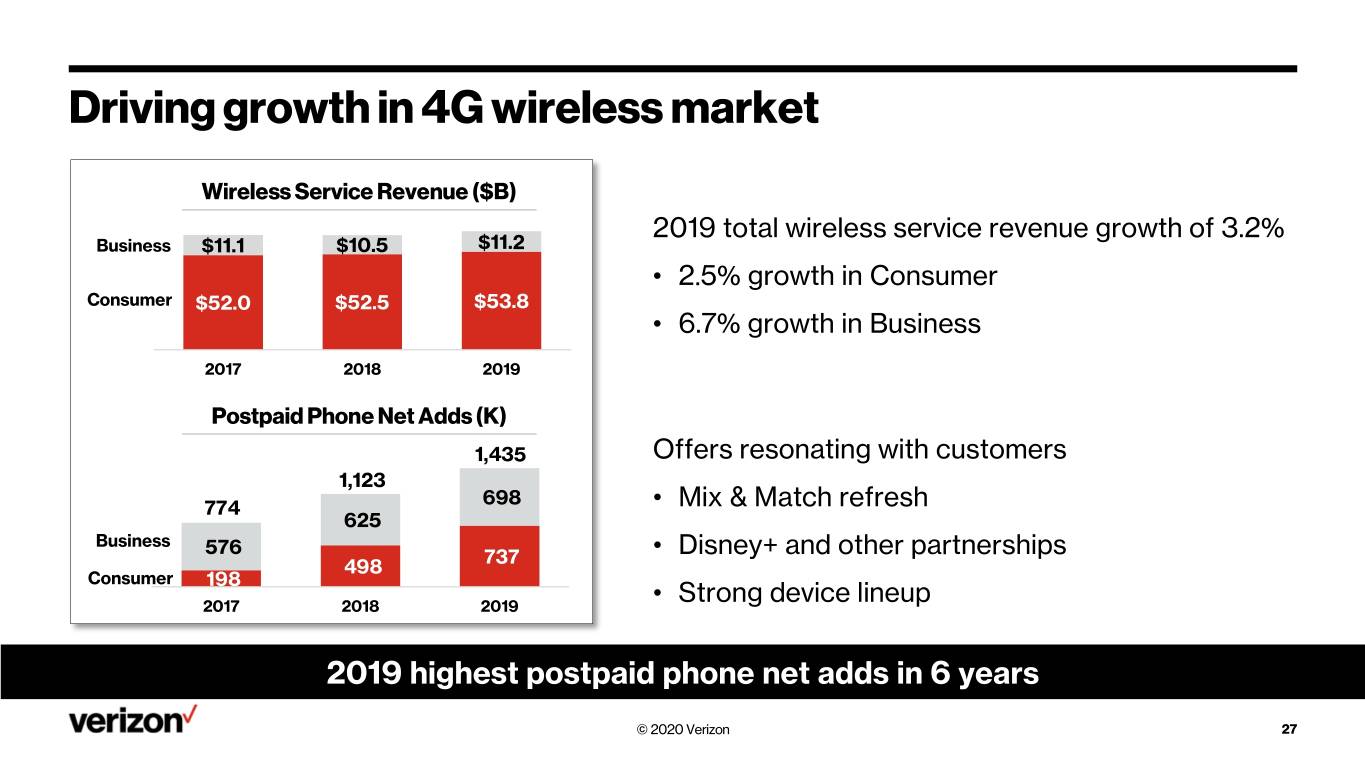
Driving growth in 4G wireless market Wireless Service Revenue ($B) 2019 total wireless service revenue growth of 3.2% Business $11.1 $10.5 $11.2 • 2.5% growth in Consumer Consumer $52.0 $52.5 $53.8 • 6.7% growth in Business 2017 2018 2019 Postpaid Phone Net Adds (K) 1,435 Offers resonating with customers 1,123 698 774 • Mix & Match refresh 625 Business 576 737 • Disney+ and other partnerships 498 Consumer 198 2017 2018 2019 • Strong device lineup 2019 highest postpaid phone net adds in 6 years © 2020 Verizon 27
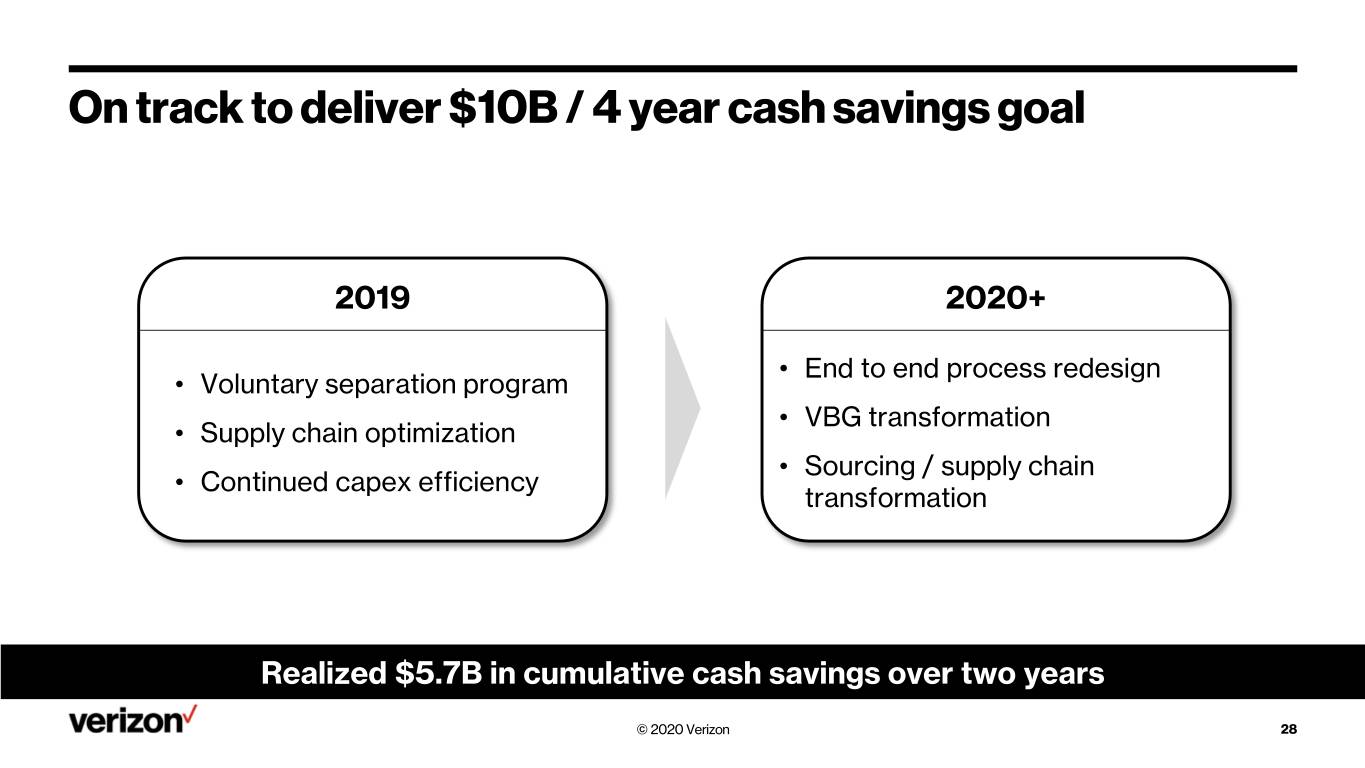
On track to deliver $10B / 4 year cash savings goal 2019 2020+ • End to end process redesign • Voluntary separation program • VBG transformation • Supply chain optimization Sourcing / supply chain Continued capex efficiency • • transformation Realized $5.7B in cumulative cash savings over two years © 2020 Verizon 28
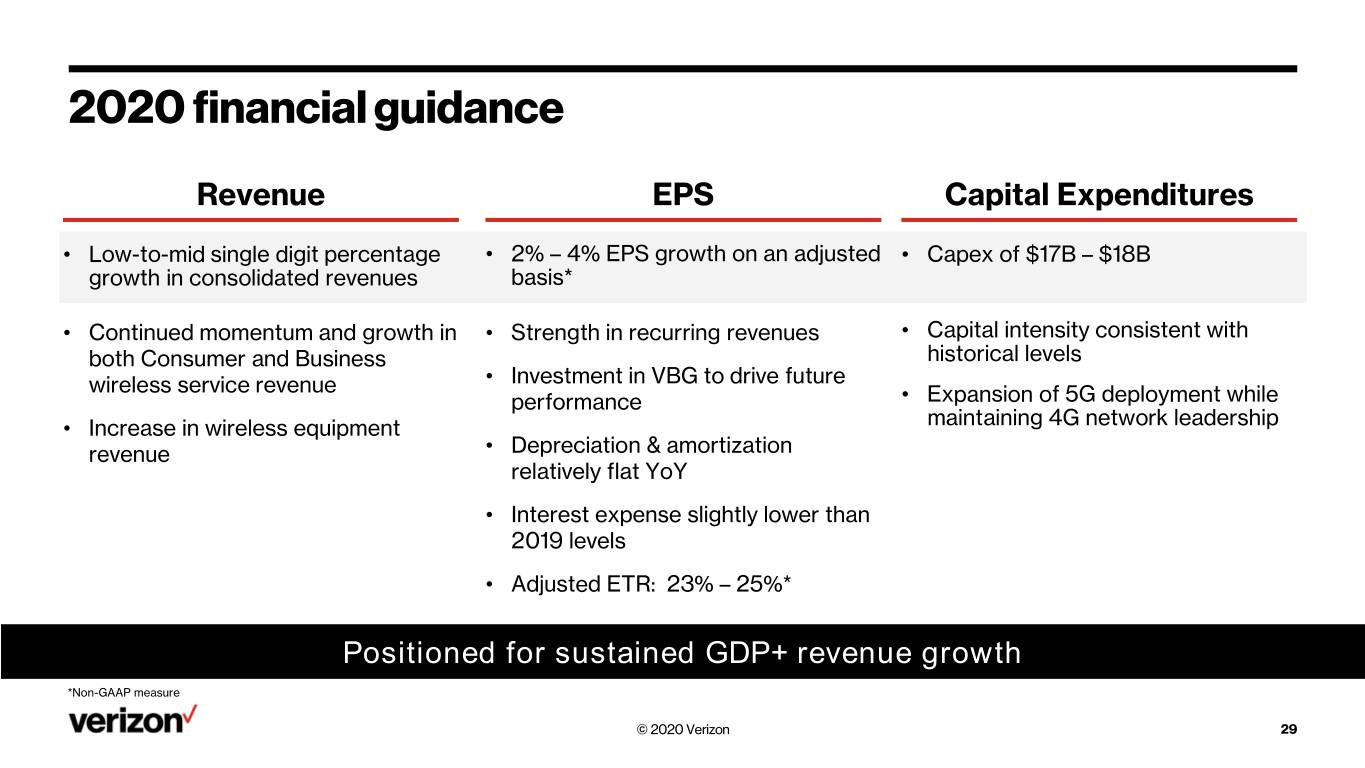
2020 financial guidance Revenue EPS Capital Expenditures • Low-to-mid single digit percentage • 2% – 4% EPS growth on an adjusted • Capex of $17B – $18B growth in consolidated revenues basis* • Continued momentum and growth in • Strength in recurring revenues • Capital intensity consistent with both Consumer and Business historical levels wireless service revenue • Investment in VBG to drive future performance • Expansion of 5G deployment while maintaining 4G network leadership • Increase in wireless equipment revenue • Depreciation & amortization relatively flat YoY • Interest expense slightly lower than 2019 levels • Adjusted ETR: 23% – 25%* Positioned for sustained GDP+ revenue growth *Non-GAAP measure © 2020 Verizon 29
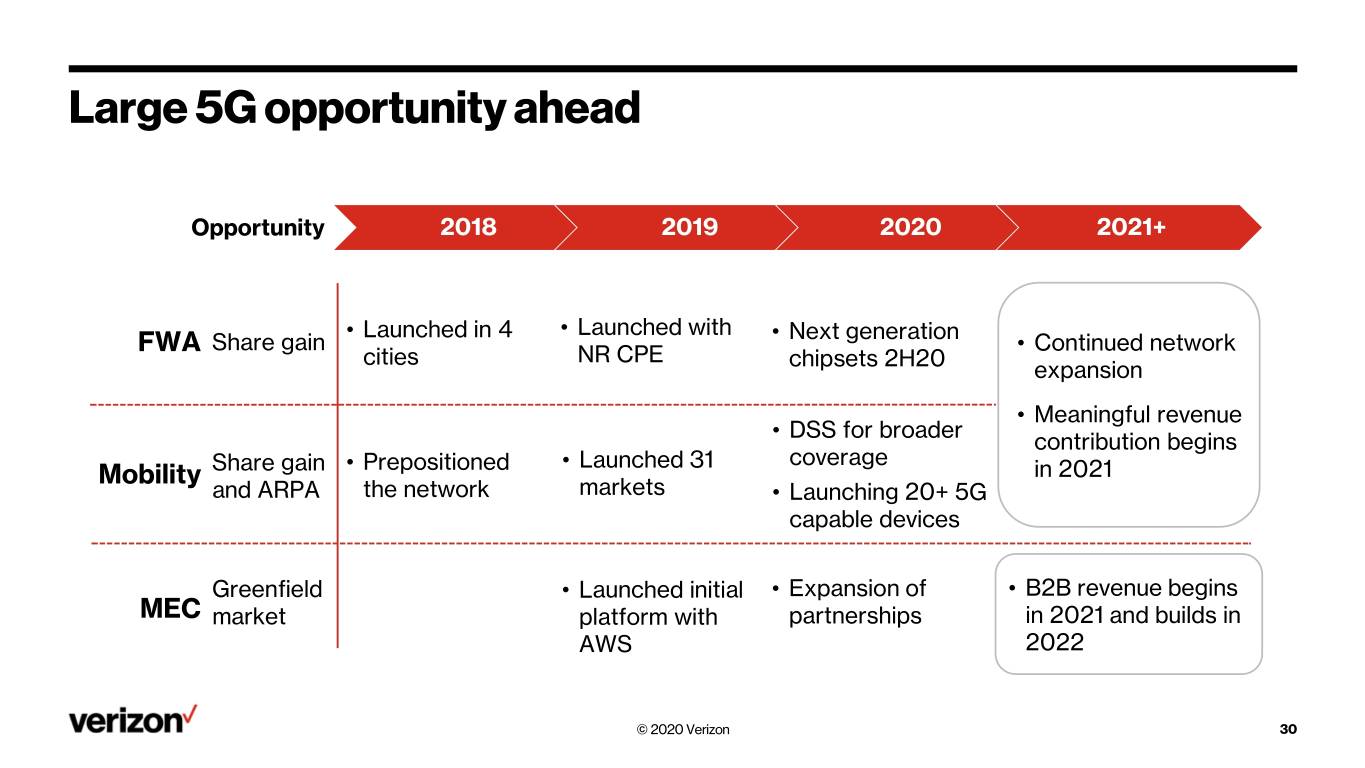
Large 5G opportunity ahead Opportunity 2018 2019 2020 2021+ • Launched in 4 • Launched with • Next generation FWA Share gain • Continued network cities NR CPE chipsets 2H20 expansion • Meaningful revenue DSS for broader • contribution begins Launched 31 coverage Mobility Share gain • Prepositioned • in 2021 and ARPA the network markets • Launching 20+ 5G capable devices Greenfield • Launched initial • Expansion of • B2B revenue begins MEC market platform with partnerships in 2021 and builds in AWS 2022 © 2020 Verizon 30
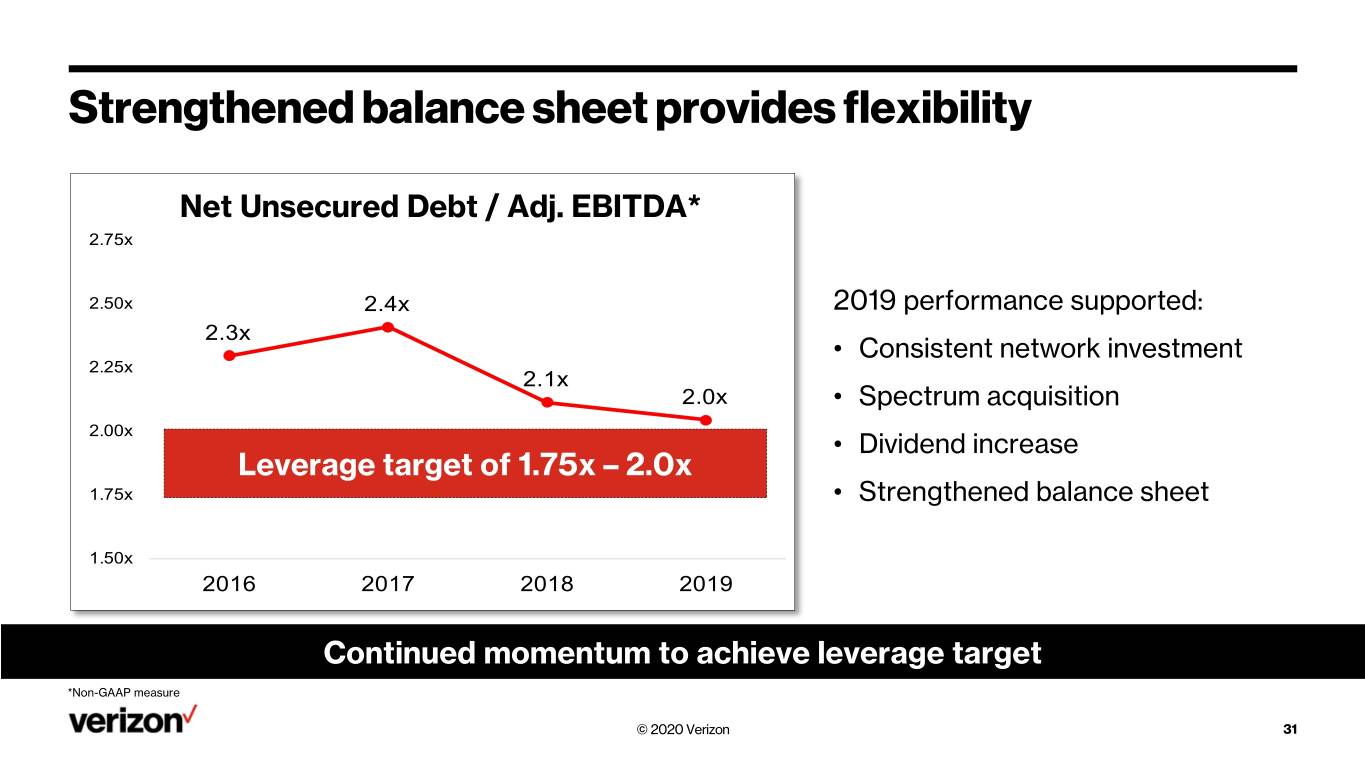
Strengthened balance sheet provides flexibility Net Unsecured Debt / Adj. EBITDA* 2.75x 2.50x 2.4x 2019 performance supported: 2.3x • Consistent network investment 2.25x 2.1x 2.0x • Spectrum acquisition 2.00x • Dividend increase Leverage target of 1.75x – 2.0x 1.75x • Strengthened balance sheet 1.50x 2016 2017 2018 2019 Continued momentum to achieve leverage target *Non-GAAP measure © 2020 Verizon 31
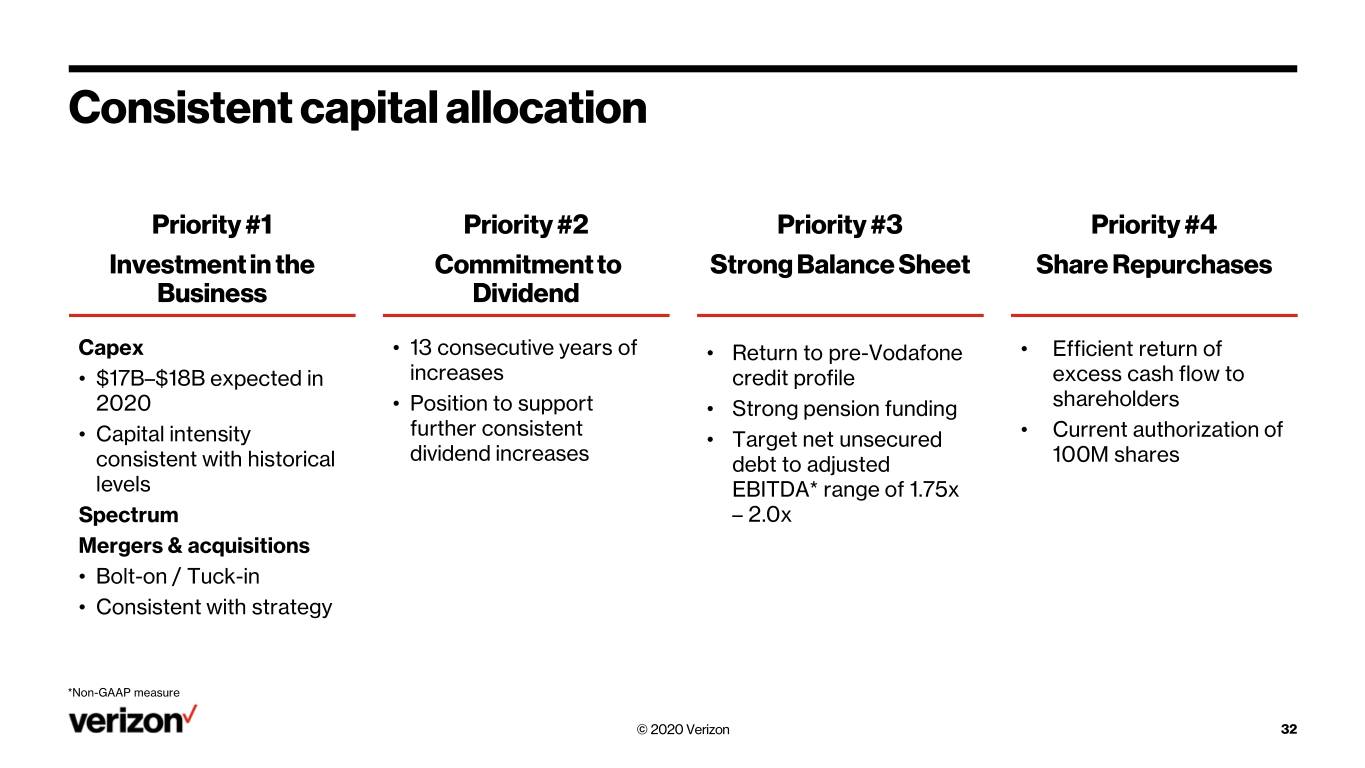
Consistent capital allocation Priority #1 Priority #2 Priority #3 Priority #4 Investment in the Commitment to Strong Balance Sheet Share Repurchases Business Dividend Capex • 13 consecutive years of • Return to pre-Vodafone • Efficient return of • $17B–$18B expected in increases credit profile excess cash flow to shareholders 2020 • Position to support • Strong pension funding further consistent Current authorization of • Capital intensity • Target net unsecured • dividend increases consistent with historical debt to adjusted 100M shares levels EBITDA* range of 1.75x Spectrum – 2.0x Mergers & acquisitions • Bolt-on / Tuck-in • Consistent with strategy *Non-GAAP measure © 2020 Verizon 32
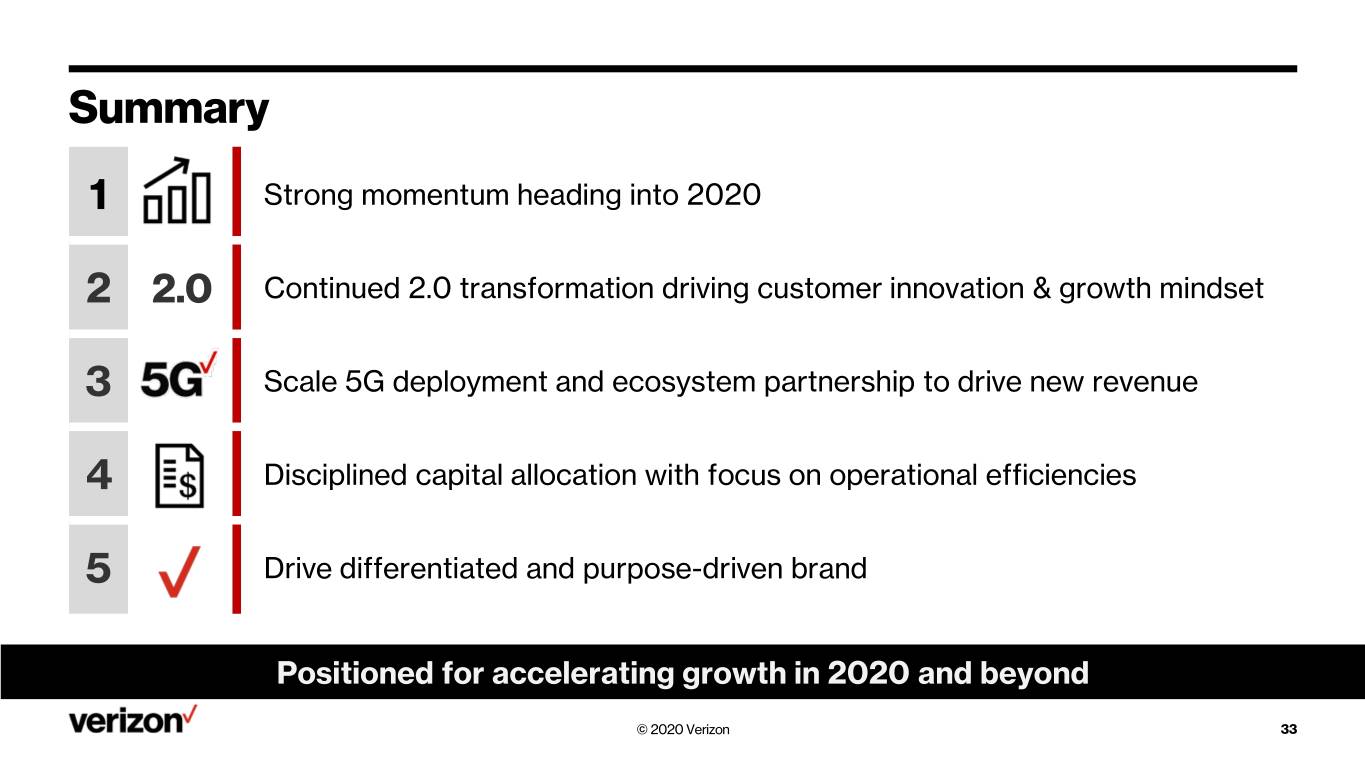
Summary 1 Strong momentum heading into 2020 2 2.0 Continued 2.0 transformation driving customer innovation & growth mindset 3 Scale 5G deployment and ecosystem partnership to drive new revenue 4 Disciplined capital allocation with focus on operational efficiencies 5 Drive differentiated and purpose-driven brand Positioned for accelerating growth in 2020 and beyond © 2020 Verizon 33

© 2020 Verizon 34
Verizon Business Group & Partnerships Tami Erwin & Rima Qureshi © 2020 Verizon
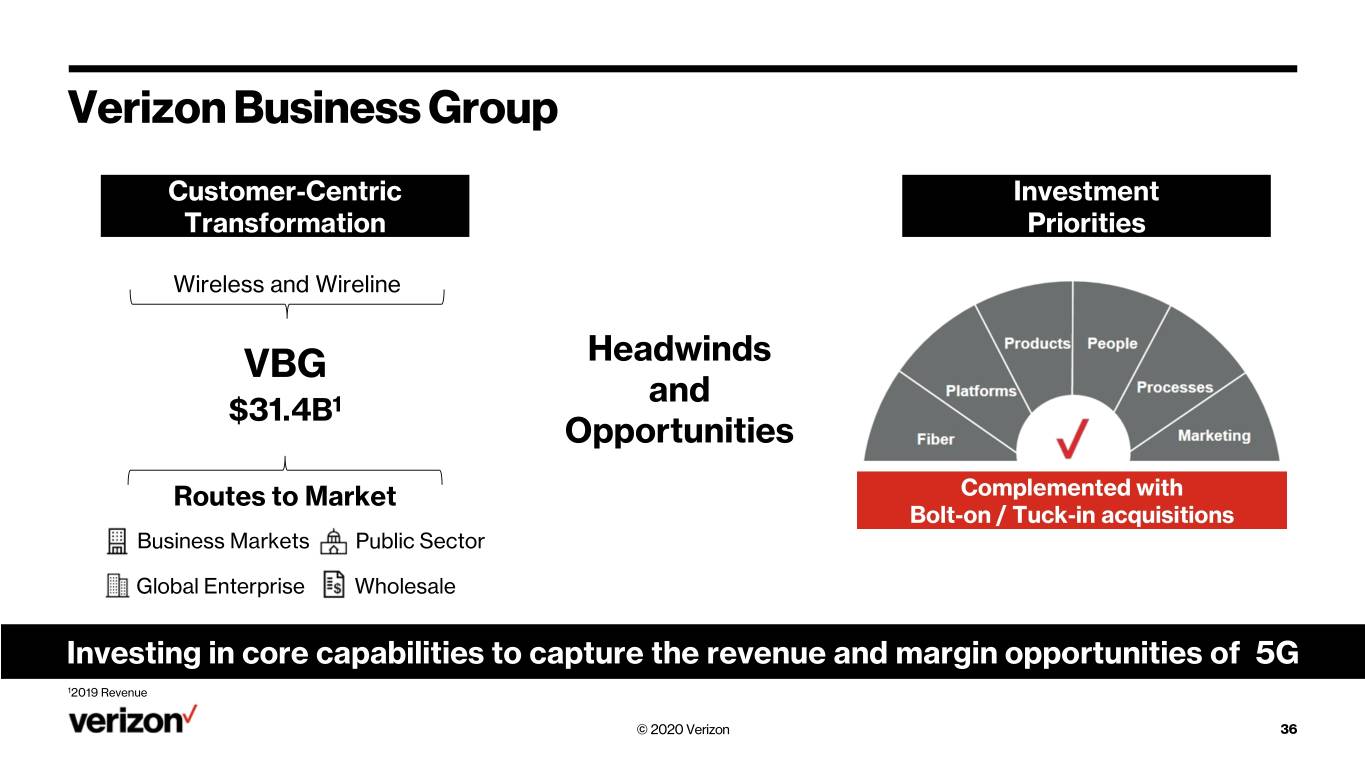
Verizon Business Group Customer-Centric Investment Transformation Priorities Wireless and Wireline VBG Headwinds and $31.4B1 Opportunities Routes to Market Complemented with Bolt-on / Tuck-in acquisitions Business Markets Public Sector Global Enterprise Wholesale Investing in core capabilities to capture the revenue and margin opportunities of 5G 12019 Revenue © 2020 Verizon 36
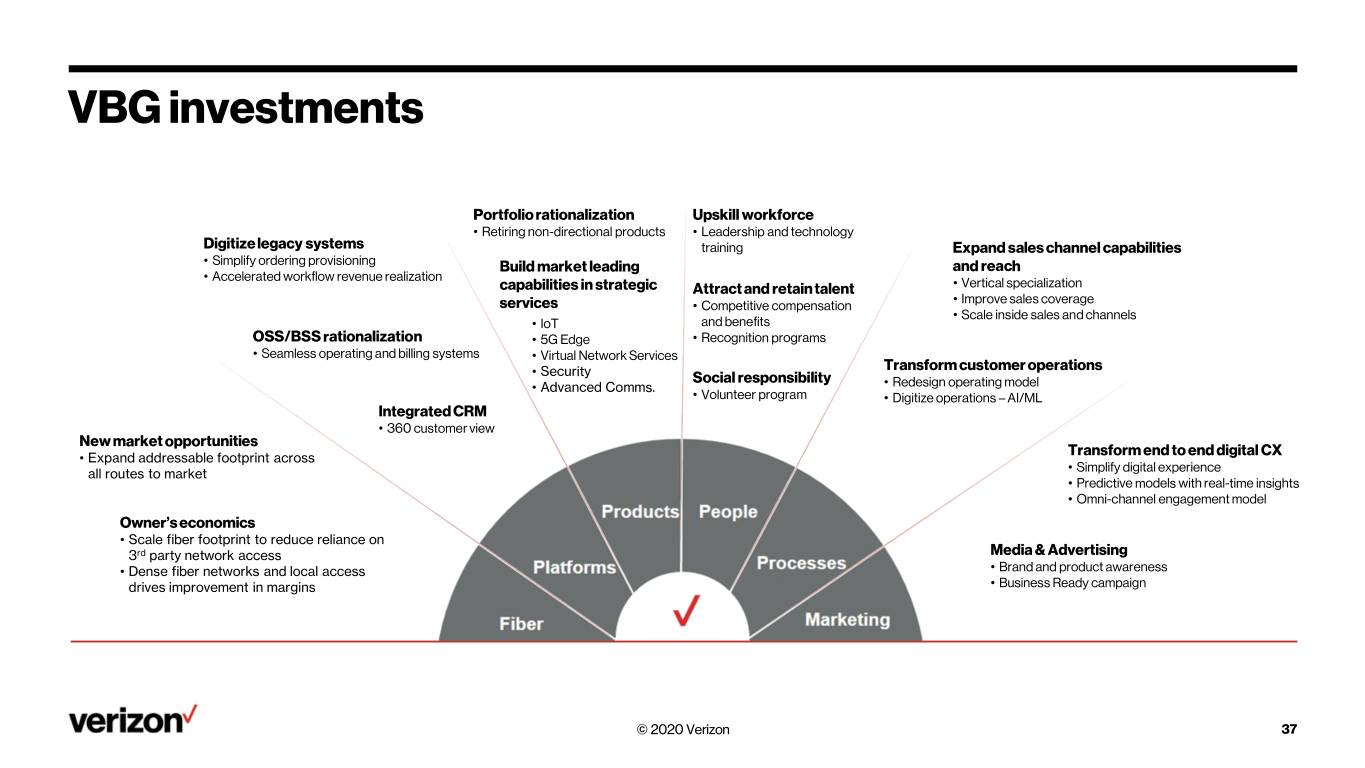
VBG investments Portfolio rationalization Upskill workforce • Retiring non-directional products • Leadership and technology Digitize legacy systems training Expand sales channel capabilities • Simplify ordering provisioning Build market leading and reach • Accelerated workflow revenue realization capabilities in strategic Attract and retain talent • Vertical specialization • Improve sales coverage services • Competitive compensation • Scale inside sales and channels • IoT and benefits OSS/BSS rationalization • 5G Edge • Recognition programs • Seamless operating and billing systems • Virtual Network Services Transform customer operations • Security Social responsibility Redesign operating model • Advanced Comms. • • Volunteer program • Digitize operations – AI/ML Integrated CRM • 360 customer view New market opportunities Transform end to end digital CX • Expand addressable footprint across Simplify digital experience all routes to market • • Predictive models with real-time insights • Omni-channel engagement model Owner’s economics • Scale fiber footprint to reduce reliance on 3rd party network access Media & Advertising • Dense fiber networks and local access • Brand and product awareness drives improvement in margins • Business Ready campaign © 2020 Verizon 37
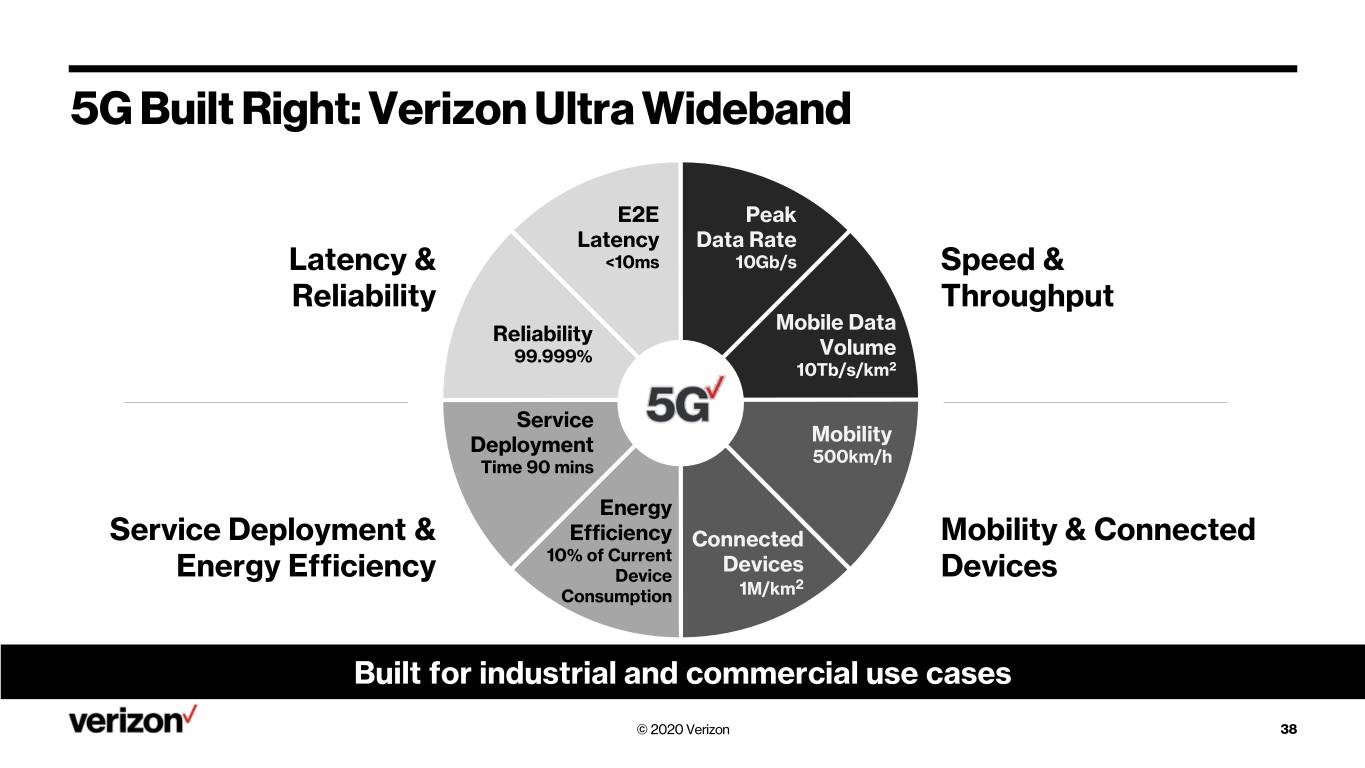
5G Built Right: Verizon Ultra Wideband E2E Peak Latency Data Rate Latency & <10ms 10Gb/s Speed & Reliability Throughput Mobile Data Reliability 99.999% Volume 10Tb/s/km2 Service Mobility Deployment 500km/h Time 90 mins Energy Service Deployment & Efficiency Connected Mobility & Connected Energy Efficiency 10% of Current Devices Devices Device 2 Consumption 1M/km Built for industrial and commercial use cases © 2020 Verizon 38
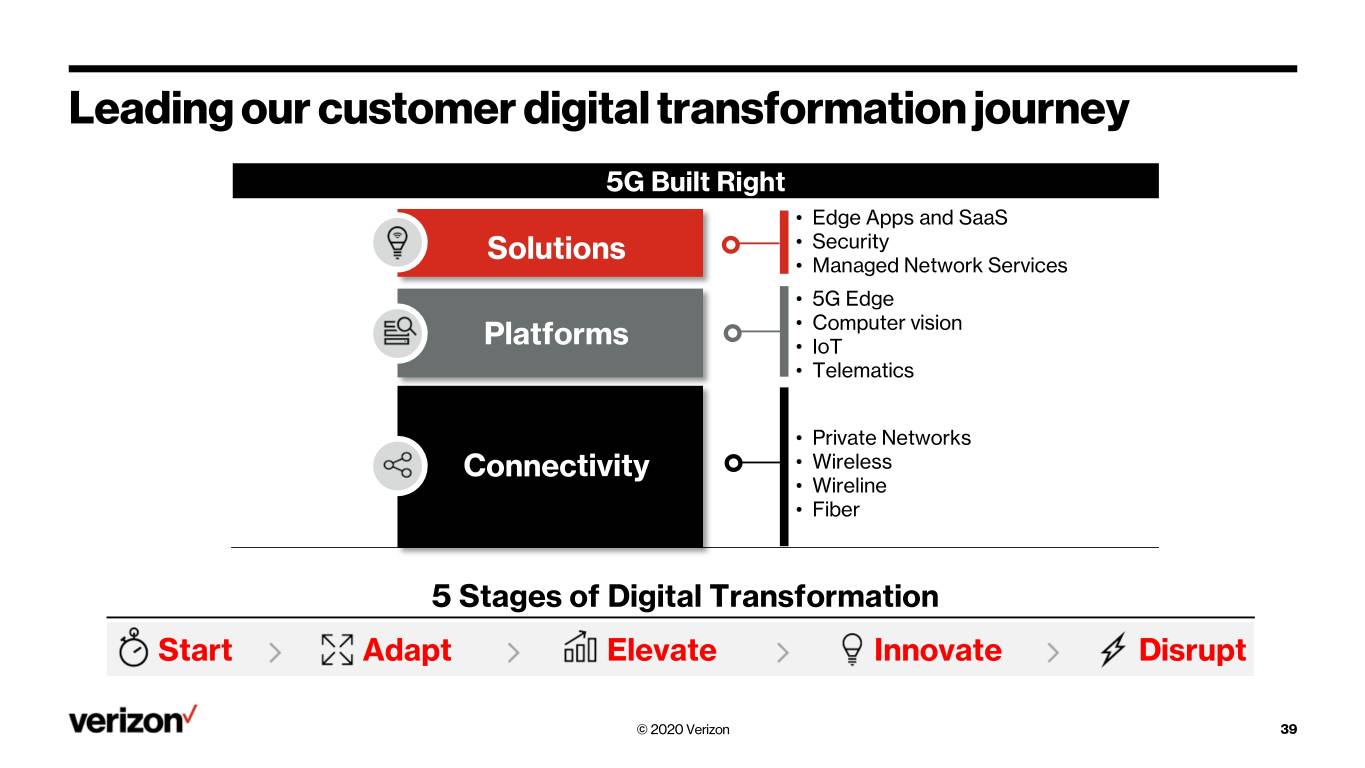
Leading our customer digital transformation journey 5G Built Right • Edge Apps and SaaS Solutions • Security • Managed Network Services • 5G Edge • Computer vision Platforms • IoT • Telematics • Private Networks Connectivity • Wireless • Wireline • Fiber 5 Stages of Digital Transformation Start Adapt Elevate Innovate Disrupt © 2020 Verizon 39
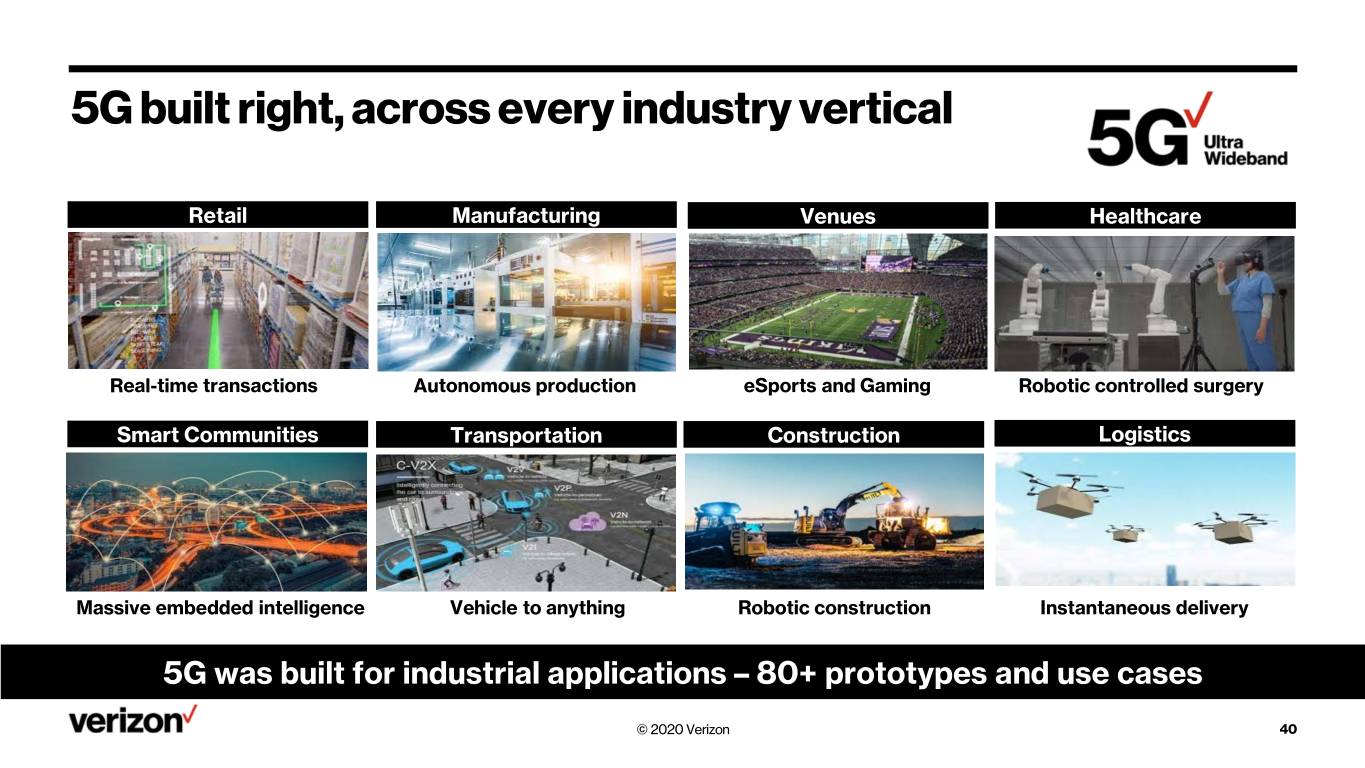
5G built right, across every industry vertical Retail Manufacturing Venues Healthcare Real-time transactions Autonomous production eSports and Gaming Robotic controlled surgery Smart Communities Transportation Construction Logistics Massive embedded intelligence Vehicle to anything Robotic construction Instantaneous delivery 5G was built for industrial applications – 80+ prototypes and use cases © 2020 Verizon 40
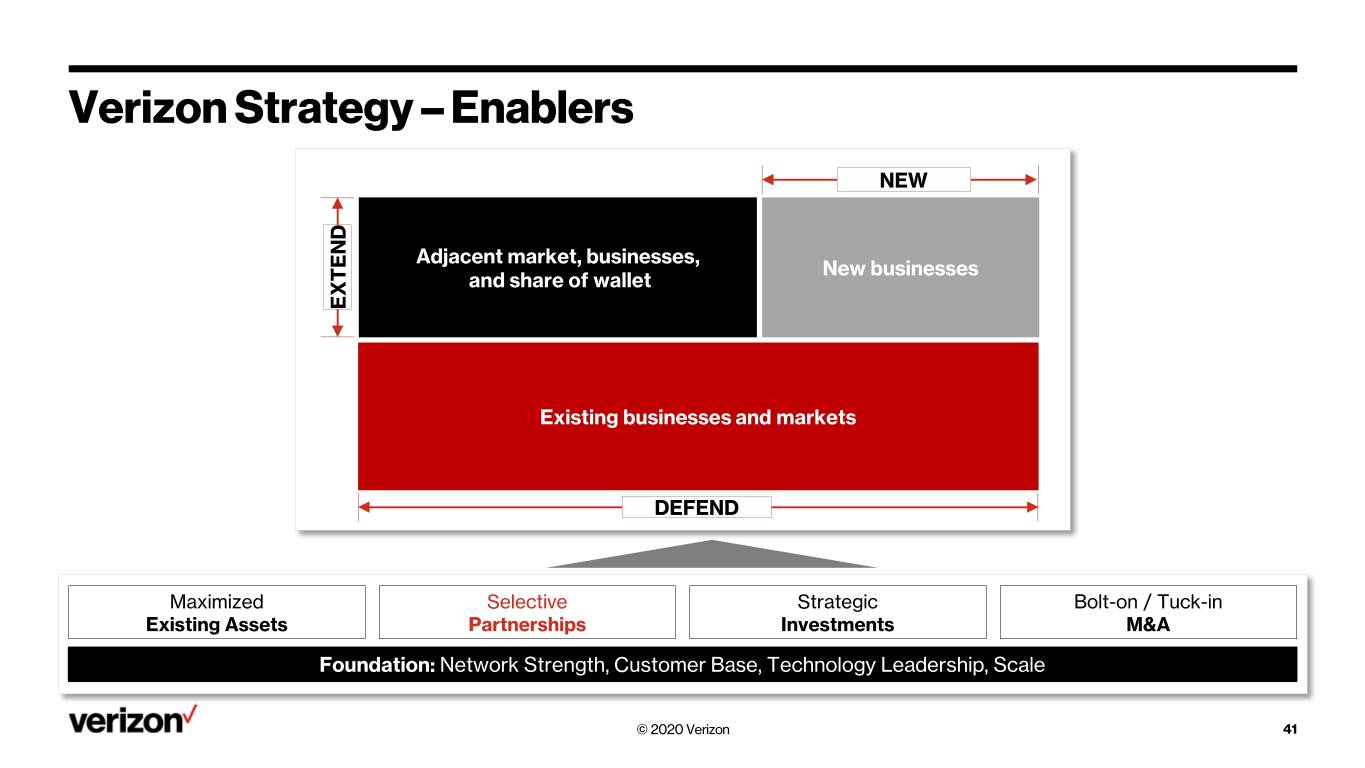
Verizon Strategy – Enablers NEW Adjacent market, businesses, New businesses and share of wallet EXTEND Existing businesses and markets DEFEND Maximized Selective Strategic Bolt-on / Tuck-in Existing Assets Partnerships Investments M&A Foundation: Network Strength, Customer Base, Technology Leadership, Scale © 2020 Verizon 41
Strategic partnerships Consumer Business Media Additional partnerships in 2020 © 2020 Verizon 42
Verizon Consumer & Verizon Media Groups Ronan Dunne & Guru Gowrappan © 2020 Verizon
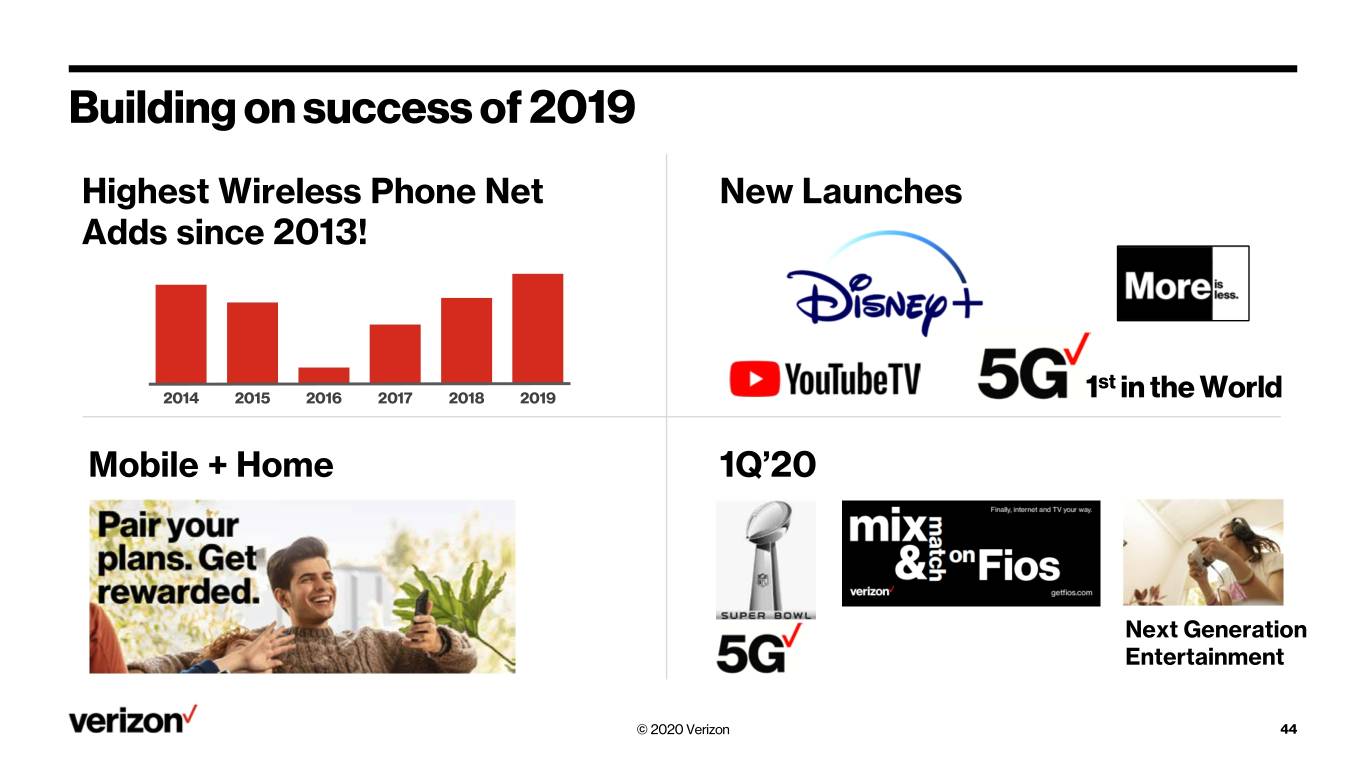
Building on success of 2019 Highest Wireless Phone Net New Launches Adds since 2013! st 2014 2015 2016 2017 2018 2019 1 in the World Mobile + Home 1Q’20 Next Generation Entertainment © 2020 Verizon 44
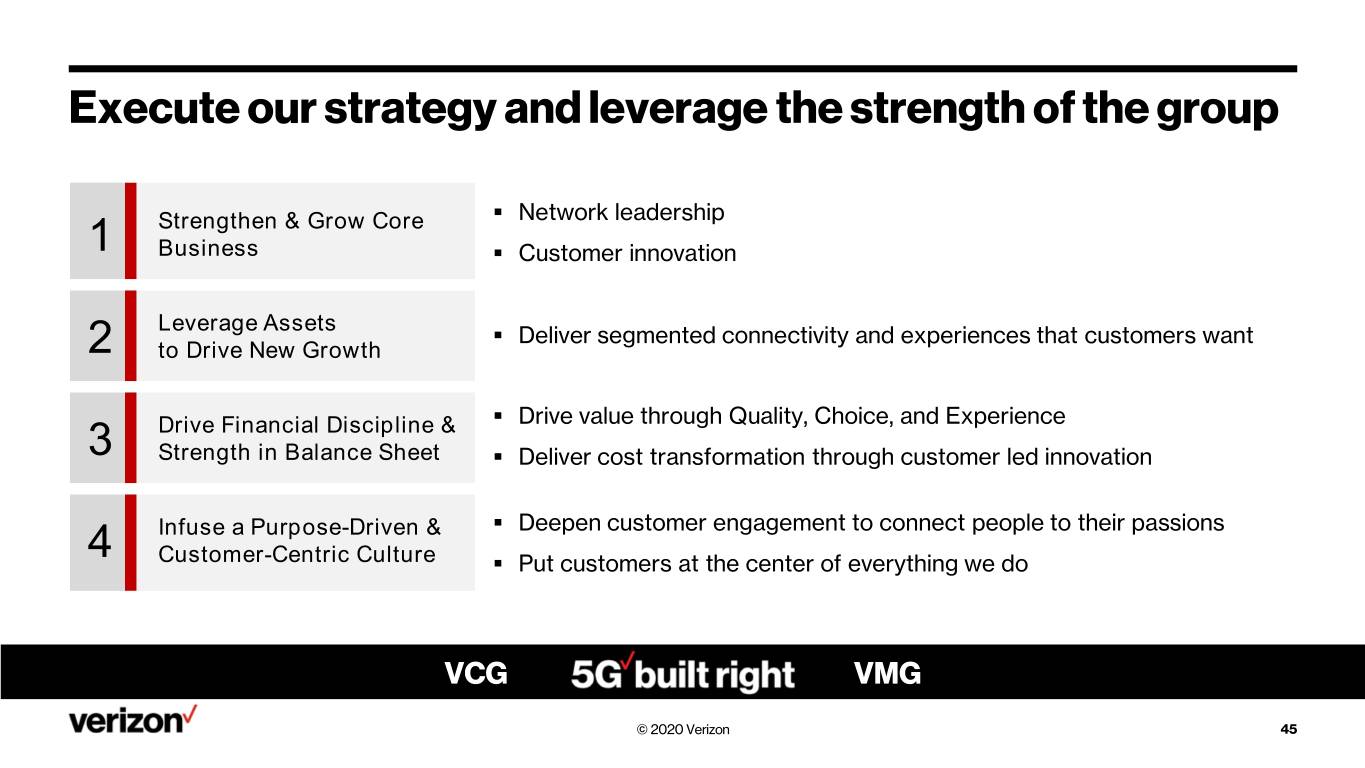
Execute our strategy and leverage the strength of the group . Network leadership Strengthen & Grow Core 1 Business . Customer innovation Leverage Assets . Deliver segmented connectivity and experiences that customers want 2 to Drive New Growth . Drive value through Quality, Choice, and Experience Drive Financial Discipline & 3 Strength in Balance Sheet . Deliver cost transformation through customer led innovation Infuse a Purpose-Driven & . Deepen customer engagement to connect people to their passions 4 Customer-Centric Culture . Put customers at the center of everything we do VCG VMG © 2020 Verizon 45
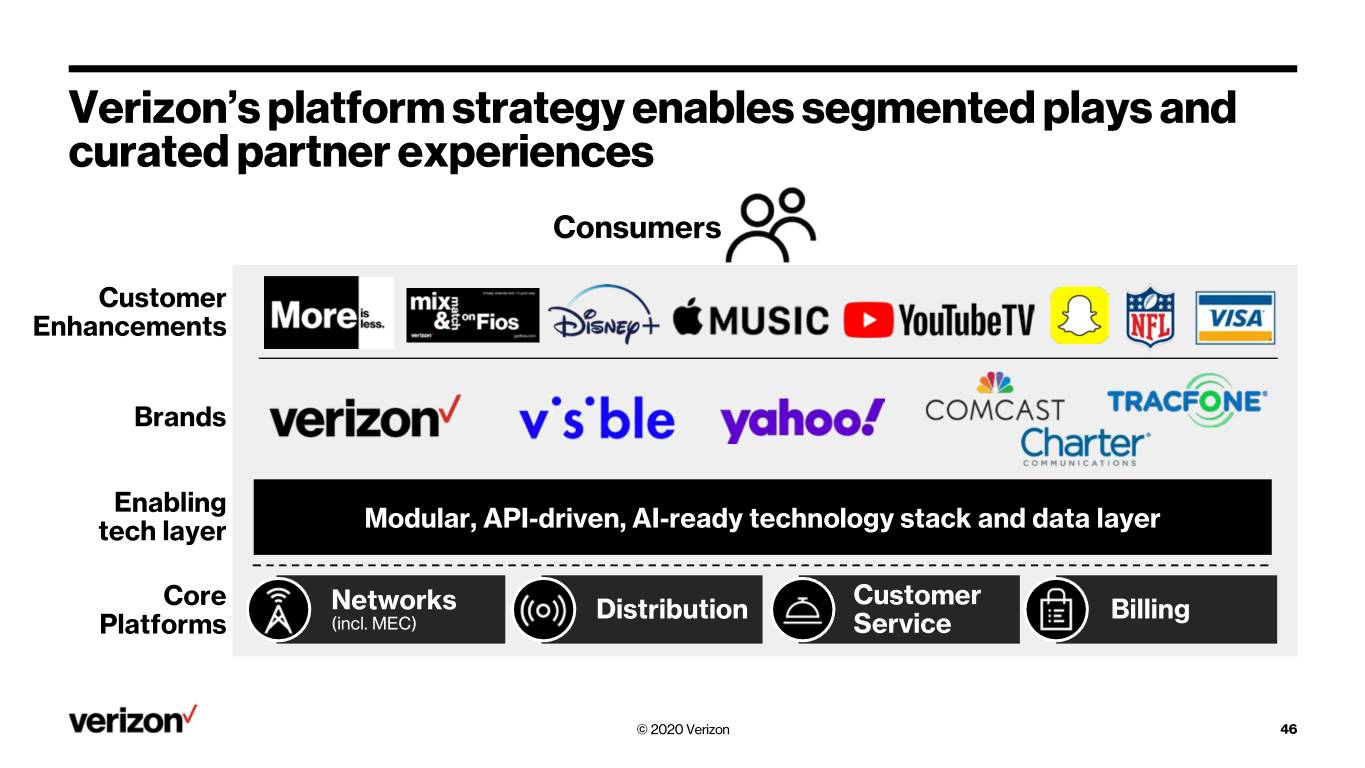
Verizon’s platform strategy enables segmented plays and curated partner experiences Consumers Customer Enhancements Brands Enabling tech layer Modular, API-driven, AI-ready technology stack and data layer Core Customer Networks Distribution Billing Platforms (incl. MEC) Service © 2020 Verizon 46
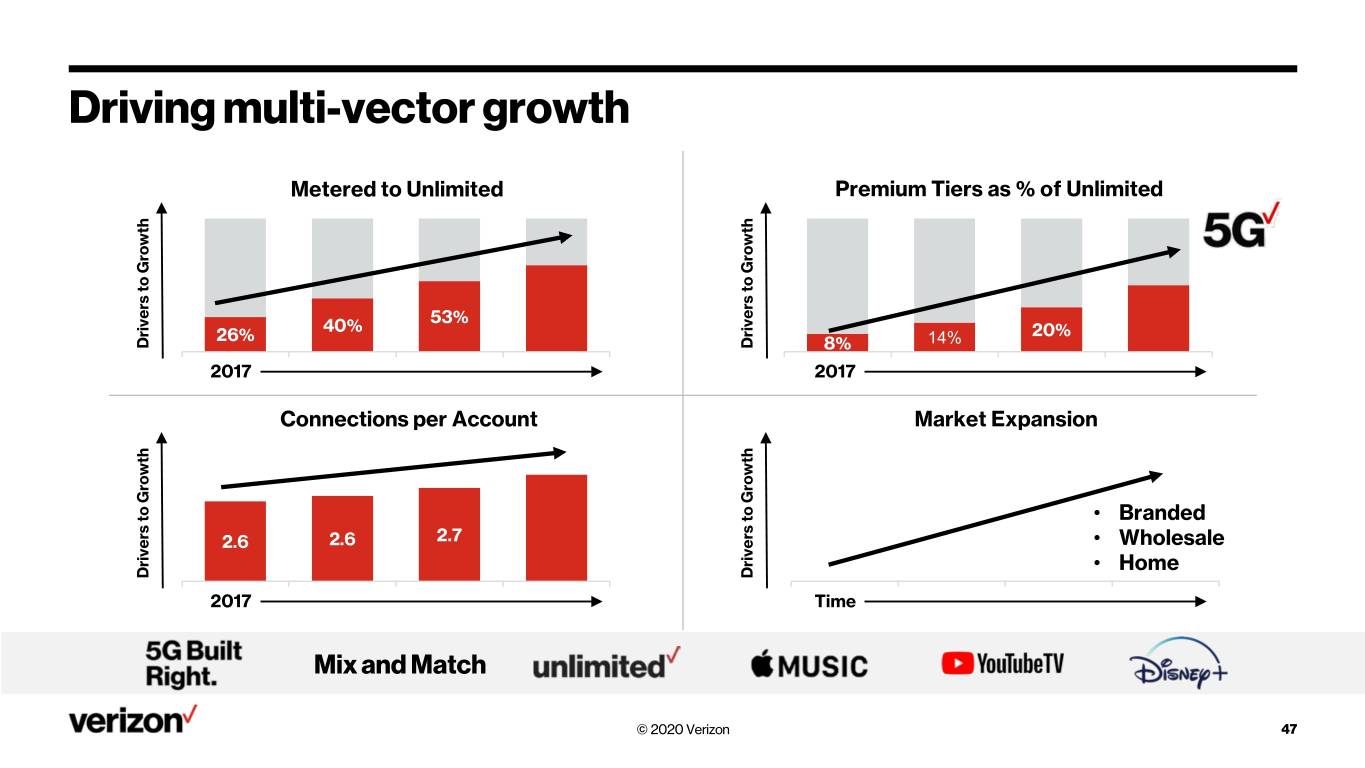
Driving multi-vector growth Metered to Unlimited Premium Tiers as % of Unlimited 53% 40% 26% 20% Drivers to Growth Drivers to Growth 8% 14% 20171 2 3 4 20171 2 3 4 Connections per Account Market Expansion • Branded 2.6 2.6 2.7 • Wholesale • Home Drivers to Growth Drivers to Growth 20171 2 3 4 Time1 2 3 4 Mix and Match © 2020 Verizon 47
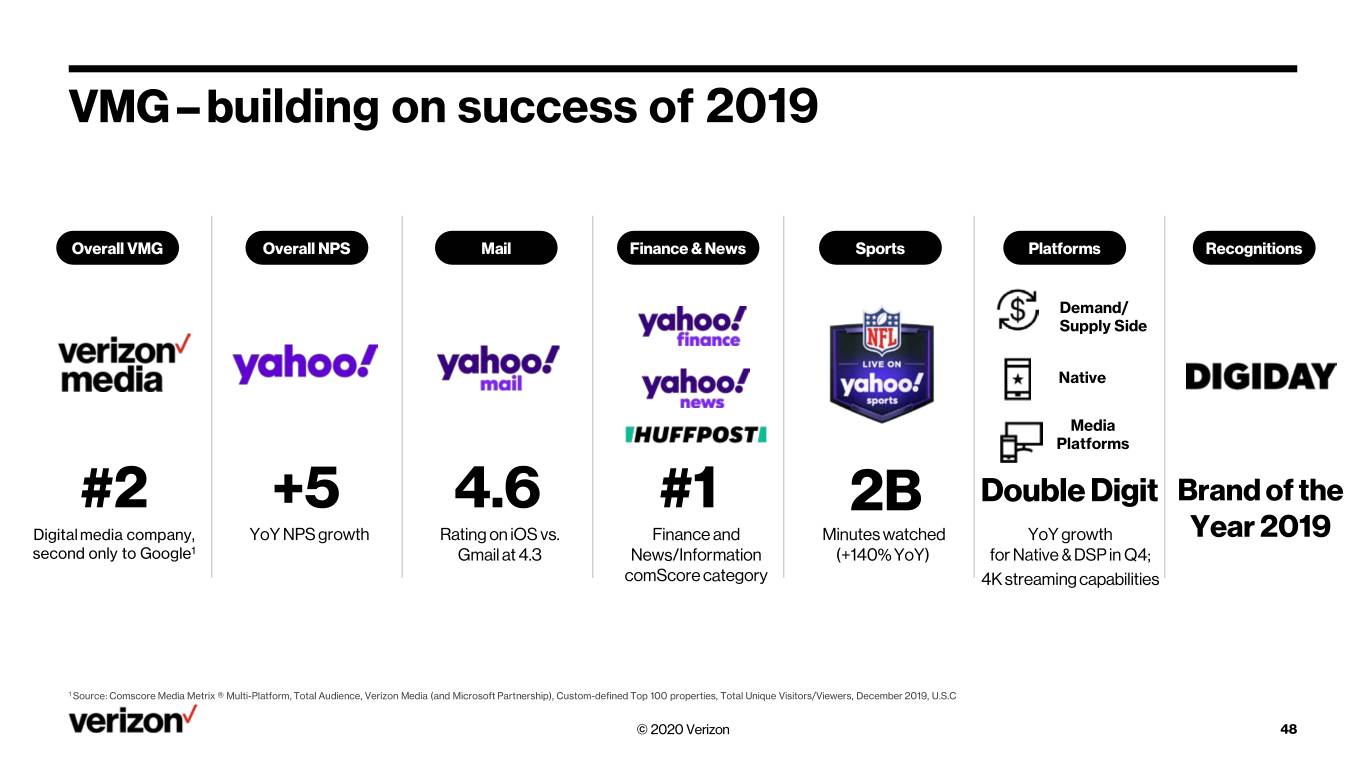
VMG – building on success of 2019 Overall VMG Overall NPS Mail Finance & News Sports Platforms Recognitions Demand/ Supply Side Native Media Platforms #2 +5 4.6 #1 2B Double Digit Brand of the Digitalmedia company, YoY NPS growth Rating on iOS vs. Finance and Minutes watched YoY growth Year 2019 second only to Google1 Gmail at 4.3 News/Information (+140% YoY) for Native & DSP in Q4; comScore category 4K streaming capabilities 1 Source: Comscore Media Metrix ® Multi-Platform, Total Audience, Verizon Media (and Microsoft Partnership), Custom-defined Top 100 properties, Total Unique Visitors/Viewers, December 2019, U.S.C © 2020 Verizon 48
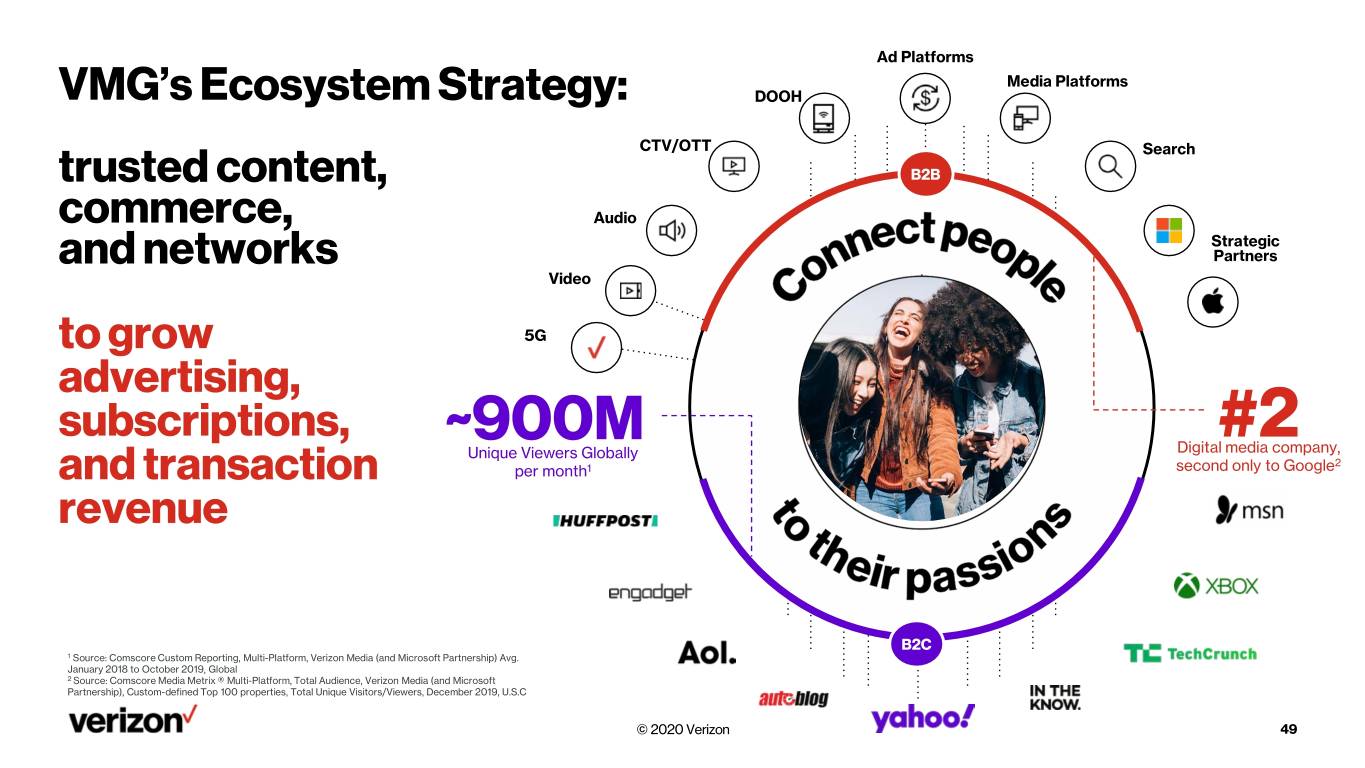
Ad Platforms Media Platforms VMG’s Ecosystem Strategy: DOOH CTV/OTT Search trusted content, B2B commerce, Audio Strategic and networks Partners Video to grow 5G advertising, subscriptions, ~900M #2 Unique Viewers Globally Digital media company, 2 and transaction per month1 second only to Google revenue B2C 1 Source: Comscore Custom Reporting, Multi-Platform, Verizon Media (and Microsoft Partnership) Avg. January 2018 to October 2019, Global 2 Source: Comscore Media Metrix ® Multi-Platform, Total Audience, Verizon Media (and Microsoft Partnership), Custom-defined Top 100 properties, Total Unique Visitors/Viewers, December 2019, U.S.C © 2020 Verizon 49
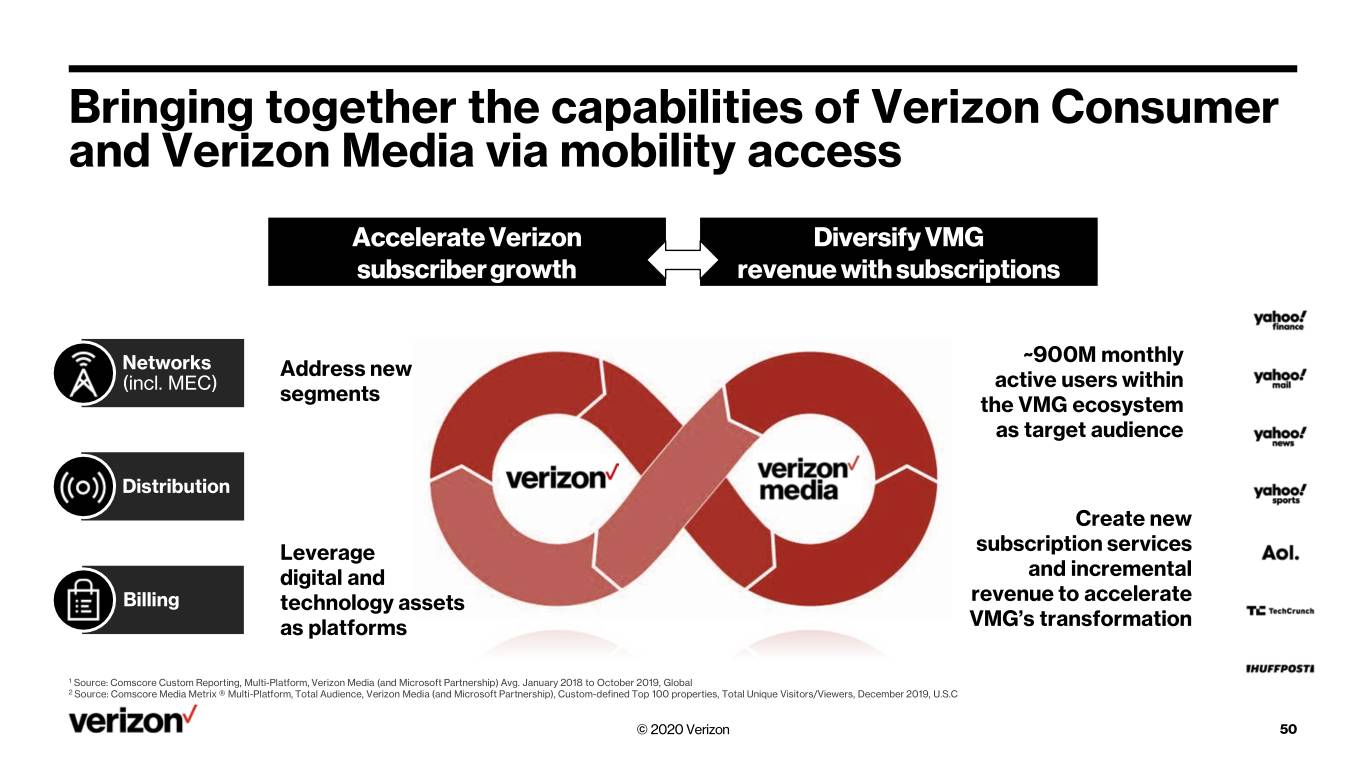
Bringing together the capabilities of Verizon Consumer and Verizon Media via mobility access Accelerate Verizon Diversify VMG subscriber growth revenue with subscriptions ~900M monthly Networks Address new (incl. MEC) active users within segments the VMG ecosystem as target audience Distribution Create new Leverage subscription services digital and and incremental Billing technology assets revenue to accelerate as platforms VMG’s transformation 1 Source: Comscore Custom Reporting, Multi-Platform, Verizon Media (and Microsoft Partnership) Avg. January 2018 to October 2019, Global 2 Source: Comscore Media Metrix ® Multi-Platform, Total Audience, Verizon Media (and Microsoft Partnership), Custom-defined Top 100 properties, Total Unique Visitors/Viewers, December 2019, U.S.C © 2020 Verizon 50
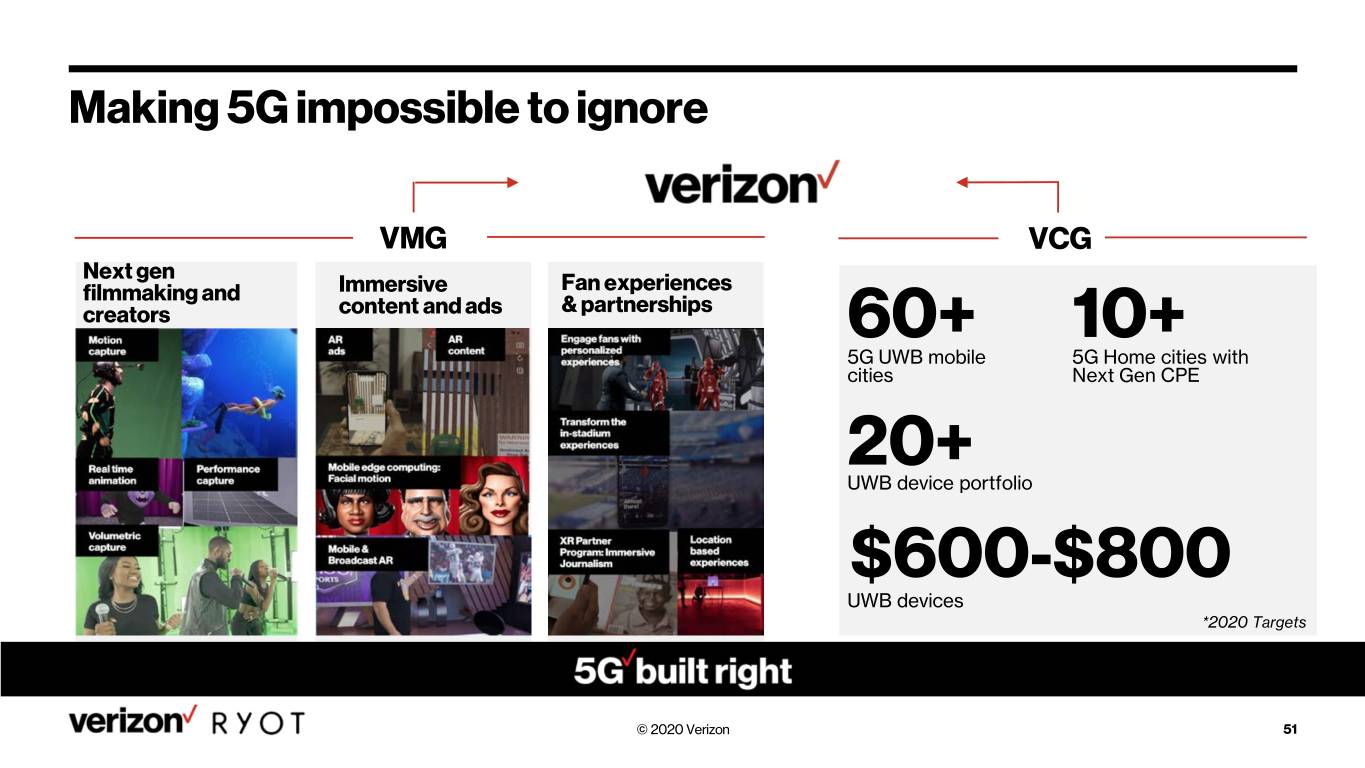
Making 5G impossible to ignore VMG VCG Next gen filmmaking and Immersive Fan experiences creators content and ads & partnerships 60+ 10+ 5G UWB mobile 5G Home cities with cities Next Gen CPE 20+ UWB device portfolio $600-$800 UWB devices *2020 Targets © 2020 Verizon 51

© 2020 Verizon 52
