Attached files
| file | filename |
|---|---|
| 8-K - FORM 8-K - Q4 AND FULL YEAR 2019 EARNINGS RELEASE - CatchMark Timber Trust, Inc. | a8-kq42019earningsrelease.htm |
Exhibit 99.1

FOR IMMEDIATE RELEASE
CatchMark Announces Fourth Quarter and Full-Year 2019 Results, Declares First Quarter 2020 Dividend and Provides 2020 Guidance
ATLANTA — February 13, 2020 — Fueled by increased year-over-year timber sales from higher harvest volumes and sawtimber mix, CatchMark Timber Trust, Inc. (NYSE: CTT) today reported a significant increase in total revenues, a sharply lower net loss, and a substantial increase in Adjusted EBITDA for fourth quarter 2019 compared to fourth quarter 2018.
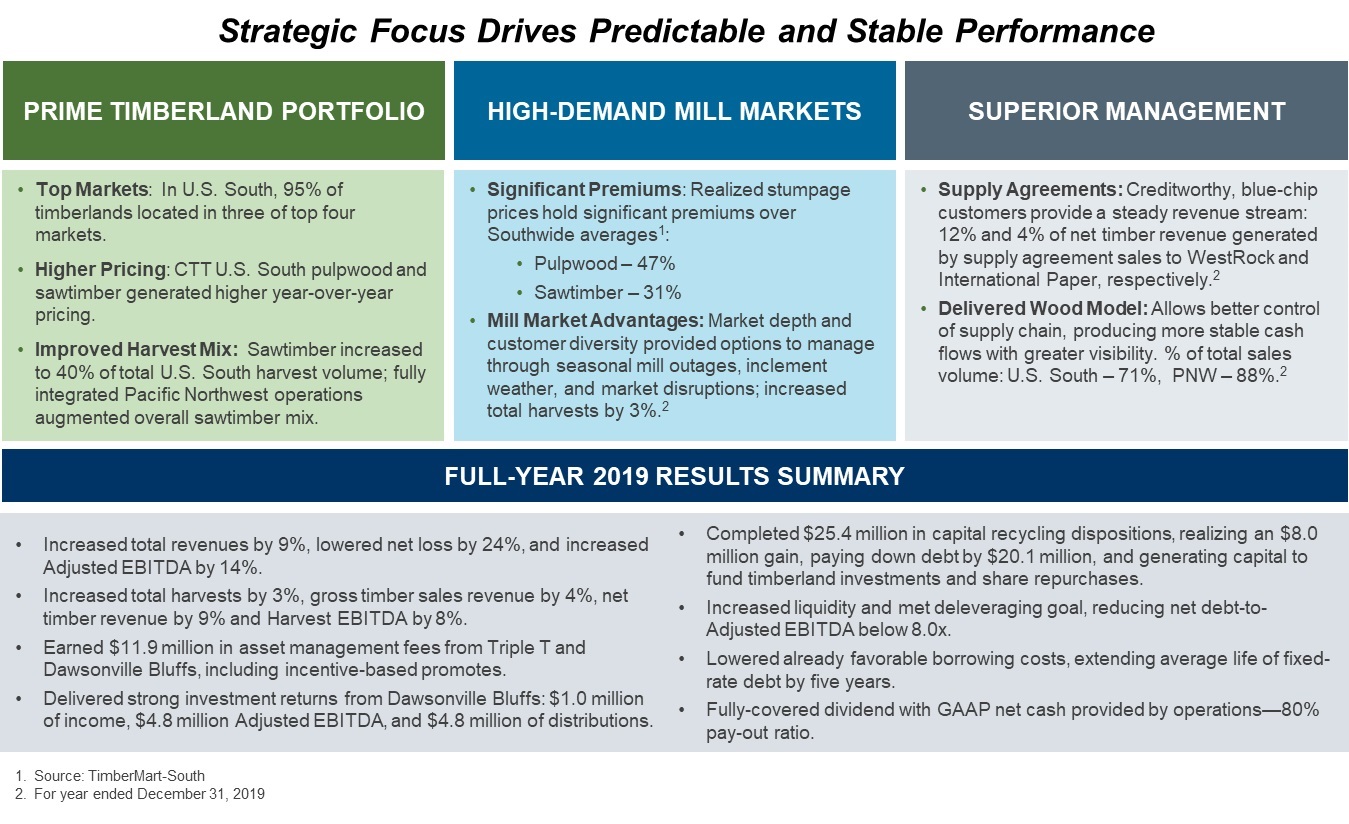
For full-year 2019 compared to 2018, CatchMark also registered markedly increased revenues, a sizeable decrease in net loss, and significantly higher Adjusted EBITDA, meeting company guidance. These gains were driven by higher timber sales revenue from higher harvest volumes, sawtimber mix and pricing, as well as higher asset management fees.
In addition, CatchMark declared a cash dividend of $0.135 per share for its common stockholders of record on February 28, 2020, payable on March 16, 2020.
Exhibit 99.1
Brian M. Davis, CatchMark’s Chief Executive Officer, said: "Again in 2019, our consistently applied strategic approach continued to pay off in delivering excellent operating results. We remain focused on acquiring the highest-quality timberlands, accessing high-demand mill markets with leading lumber and pulp and paper producers and creditworthy customers, and employing rigorous management practices to deliver sustainable harvest yields. In meeting our guidance for the year, we realized increased timber sales, superior pricing in the U.S. South timber basket and a significant increase in net timber revenue. These results were driven by higher harvest volumes, an increased sawtimber mix, and the successful integration of the Bandon Property in the Pacific Northwest. Asset management fees earned from Triple T also provided a solid contribution. In addition, the Dawsonville Bluffs joint venture met investment objectives and generated excellent returns, including an incentive-based promote, and we also met our timberland sales targets. The capital recycling strategy, employing targeted large dispositions, continues to improve the overall quality of our timber assets, strengthen our balance sheet and enable future investments in prime timberlands, furthering our growth strategy. Taken together, these initiatives have enabled us to provide a consistent dividend supported by predictable operating cash flows for our shareholders."
Fourth Quarter 2019 and Full Year 2019 Performance Highlights
For fourth quarter 2019, CatchMark reported the following year-over-year operating results:
• | Increased revenues by 27% to $29.1 million, compared to $22.9 million in fourth quarter 2018. |
• | Lowered net loss by 69% to $11.8 million, primarily due to lower losses allocated from the Triple T joint venture. |
• | Increased Adjusted EBITDA by 61% to $15.1 million, compared to $9.4 million in fourth quarter 2018, driven by increases in net timber revenue and timberland sales. |
• | Increased total harvest volumes by 119,000 tons to 628,000 tons compared to fourth quarter 2018. |
• | Increased gross timber sales revenue by 23% to $20.0 million, net timber revenues by 30% to $11.7 million and Harvest EBITDA by 42% to $9.7 million, driven by higher harvest volumes, a higher sawtimber mix and fully-integrated Pacific Northwest operations. |
• | Acquired 900 acres of well-stocked, pine timberlands located near existing prime holdings in South Carolina for $1.9 million of cash on-hand generated from capital recycling. |
• | Sold 3,200 acres of timberlands for $5.0 million, increasing Real Estate EBITDA by $2.3 million from the same period 2018. |
• | Entered into a $21.3 million contract for a large disposition of 14,400 acres of Georgia timberlands, which closed in January 2020, as part of the company’s capital recycling strategy. |
• | Paid a dividend of $0.135 per share to stockholders of record on December 13, 2019. |
For full-year 2019, CatchMark reported the following year-over-year operating results:
• | Increased total revenues by 9% to $106.7 million, compared to $97.9 million for full-year 2018. |
Exhibit 99.1
• | Lowered net loss by 24% to $93.3 million, primarily due to lower allocated losses and higher earned asset management fees from Triple T. |
• | Increased Adjusted EBITDA by 14% to $56.9 million due to higher net timber revenues and asset management fees. |
• | Increased total harvest volumes by 3% to 2.24 million tons from 2.17 million tons. |
• | Increased gross timber sale revenue by 4% to $72.6 million, net timber revenue by 9% to $41.4 million and Harvest EBITDA by 8% to $33.7 million, driven by higher harvest volumes, a higher sawtimber mix, increased pricing in the U.S. South, and integration of Pacific Northwest operations. |
• | Increased asset management fee revenue by 113% to $11.9 million from $5.6 million due primarily to a full year of Triple T operations. |
• | Recognized $1.0 million of income, $4.8 million of Adjusted EBITDA and received $4.8 million of distributions from the Dawsonville Bluffs joint venture. |
• | Increased Investment Management EBITDA by 35% to $16.7 million due to the increased asset management fees from Triple T and strong results of Dawsonville Bluffs. |
• | Realized timberland sales of $17.6 million, comprising 9,200 acres, consistent with prior year sales proceeds and in line with company guidance. |
• | Completed large dispositions of 14,400 acres for $25.4 million, recognizing a gain of $8.0 million and paying down debt by $20.1 million with a portion of the proceeds. The remaining net proceeds were used to fund acquisitions of prime timberland and opportunistically repurchase shares. |
• | Paid fully-covered dividends of $26.3 million, or $0.54 per share. |
Meeting Strategic Objectives
Notable 2019 CatchMark initiatives that contributed to year-over-year results, strengthened capital structure and supported long-term growth objectives were:
• | Fully integrating the 2018 Bandon acquisition in the Pacific Northwest which will continue to improve sawtimber mix on a consolidated basis. |
• | Realizing increased asset management fees from a full year of Triple T joint venture operations and strategically making progress to unlock further value through greater operating efficiencies and new tactical strategies. |
• | Delivering on objectives from Dawsonville Bluffs, which provided strong investment returns, asset management fees and incentive-based promotes over its term. Since inception in April 2017 through December 31, 2019, CatchMark received $13.3 million in cash distributions from its $10.5 million investment in the joint venture and $0.9 million in asset management fee revenue and incentive-based promotes. |
Exhibit 99.1
• | Profitably recycling capital with the sale of 14,400 acres for $25.4 million and a significant gain of $8.0 million to optimize the company’s timberland portfolio, strengthen its balance sheet and provide capital for future acquisitions and investments. |
• | Improving liquidity at year-end to $196.6 million comprised of $185.1 million of debt capacity - $150.1 million under the multi-draw term facility and $35.0 million under the revolving credit facility - and $11.5 million of cash on-hand. At year-end 2018, total liquidity was $170.6 million. |
• | Meeting a deleveraging goal to reduce net debt to Adjusted EBITDA to below 8.0x. |
• | Lowering borrowing costs and extending the average life of fixed-rate debt. During the fourth quarter, CatchMark entered into hedging transactions to blend and extend existing interest rate swaps to fix rates on $275.0 million of debt for an average term of nine years at a weighted-average interest rate of 2.17%, before the applicable spread and expected patronage dividends, compared to an average term of four years at 2.44% under previous swaps. |
• | Repurchasing company shares opportunistically under its share repurchase program. |
CatchMark’s Chief Resources Officer Todd Reitz said: “A very strong fourth quarter met plan on volumes and pricing, including a favorable sawtimber mix. Our strategic mill market presence, fiber supply agreements, the delivered wood model and opportunistic stumpage sales continued as primary performance drivers, helping maintain pricing levels for all our pine products substantially above TimberMart-South South-wide averages.”
Ursula Godoy-Arbelaez, Chief Financial Officer, said: “We continue to set the stage for future timberland acquisitions and growth through disciplined capital allocation and further deleveraging, highlighted most recently by last month’s profitable $21.3 million capital recycling transaction, involving the sale of Georgia timberlands. Other favorable impacts derive from executing our active interest rate management strategy, including lowering our already favorable borrowing costs and extending the average life of our fixed-rate debt."
Share Repurchases
CatchMark did not make any share repurchases during fourth quarter 2019 under its $30 million share repurchase program. For full-year 2019, the company repurchased approximately 329,000 shares for $3.0 million and $15.7 million remained available under the program at year-end.
Results for Fourth Quarter 2019 and Full-Year 2019
Fourth Quarter 2019 Results
Revenues increased to $29.1 million for the three months ended December 31, 2019 from $22.9 million for the three months ended December 31, 2018 due primarily to a $3.7 million increase in timber sales and a $2.4 million increase in timberland sales.
Exhibit 99.1
Gross timber sales revenue increased by $3.7 million, or 23%, as a result of a 23% increase in total harvest volumes, including a 19% increase in the U.S. South region, contributions from the successful integration of the Bandon Property in the Pacific Northwest, and a 7% increase in U.S. South sawtimber mix. Those increases were offset by a 11% decrease in delivered sales as a percentage of total volume. Net timber revenues, calculated as gross timber sales revenue less contract logging and hauling costs, increased by $2.7 million, or 30%, as a result of higher harvest volumes and increased sawtimber mix.
For the Three Months Ended December 31, 2018 | Changes attributable to: | For the Three Months Ended December 31, 2019 | |||||||||||||
(in thousands) | Price/Mix | Volume (3) | |||||||||||||
Timber sales (1) | |||||||||||||||
Pulpwood | $ | 9,015 | $ | (44) | $ | 399 | $ | 9,370 | |||||||
Sawtimber (2) | 7,300 | (344) | 3,701 | 10,657 | |||||||||||
$ | 16,315 | $ | (388) | $ | 4,100 | $ | 20,027 | ||||||||
(1) | Timber sales are presented on a gross basis. |
(2) | Includes chip-n-saw and sawtimber. |
(3) | Changes in timber sales revenue related to properties acquired or disposed within the last 12 months are attributed to volume changes. |
Timberland sales increased to $5.0 million in fourth quarter 2019 from $2.6 million in the same period 2018 primarily due to selling more acres.
Net loss decreased to $11.8 million for the three months ended December 31, 2019 from $38.2 million for the three months ended December 31, 2018 primarily due to a $24.1 million decrease in HLBV losses from Triple T, a $6.2 million increase in total revenues and a $1.1 million income tax benefit, offset by a $5.8 million increase in total expenses. Total expenses increased primarily due to a $2.6 million increase in cost of timberland sales due to selling more acres and a $2.5 million increase in depletion and a $1.0 million increase in logging and hauling costs driven by higher harvest volumes, including from the Pacific Northwest region. Net loss per share for the three months ended December 31, 2019 and 2018 was $0.24 and $0.78, respectively.
Full-Year 2019 Results
Revenues increased to $106.7 million for the year ended December 31, 2019 from $97.9 million for the year ended December 31, 2018 due to a $3.1 million increase in timber sales and a $6.3 million increase in asset management fee revenue.
Gross timber sales revenue increased by $3.1 million as a result of a $5.2 million increase in the Pacific Northwest region from the successful integration of the Bandon Property, offset by a $2.1 million decrease in the U.S. South region due to a 9% decrease in delivered sales as a percentage of total volume. Total harvest volume in the U.S. South remained comparable year-over-year and pulpwood and sawtimber pricing increased by 2% and 1%, respectively. Net timber revenues increased by $3.4 million, or 9%, as a result of higher harvest volumes, an increased sawtimber mix and higher U.S. South pricing.
Exhibit 99.1
For the Year Ended December 31, 2018 | Changes attributable to: | For the Year Ended December 31, 2019 | ||||||||||||||
(in thousands) | Price/Mix | Volume (3) | ||||||||||||||
Timber sales (1) | ||||||||||||||||
Pulpwood | $ | 38,309 | $ | 896 | $ | (3,107 | ) | $ | 36,098 | |||||||
Sawtimber (2) | 31,146 | 86 | 5,227 | 36,459 | ||||||||||||
$ | 69,455 | $ | 982 | $ | 2,120 | $ | 72,557 | |||||||||
(1) | Timber sales are presented on a gross basis. |
(2) | Includes chip-n-saw and sawtimber. |
(3) | Changes in timber sales revenue related to properties acquired or disposed within the last 12 months are attributed to volume changes. |
Asset management fees increased to $11.9 million in 2019 from $5.6 million in 2018 primarily due to a $5.8 million increase from Triple T and a $0.6 million increase from Dawsonville Bluffs. Higher management fees earned from Triple T resulted from managing the joint venture for a full year in 2019 compared to two quarters in 2018. The majority of asset management fees earned from Dawsonville Bluffs in 2019 represented an incentive-based promote earned for exceeding investment hurdles.
Net loss decreased to $93.3 million for the year ended December 31, 2019 from $122.0 million for the year ended December 31, 2018 primarily due to a $19.1 million decrease in losses from Triple T, a $8.9 million increase in total revenues, a $8.4 million increase in gains on large dispositions and a $1.1 million income tax benefit, offset by a $4.7 million increase in total expenses, a $2.4 million increase in interest expense and a $1.7 million decrease in income recognized from the Dawsonville Bluffs joint venture. Total expenses increased by $4.7 million primarily due to a $2.2 million increase in depletion from higher harvest volumes and a $1.6 million increase in cost of timberland sales due to selling more acres. Net loss per share for the years ended December 31, 2019 and 2018 was $1.90 and $2.55, respectively.
2020 Outlook and Guidance
For full-year 2020, CatchMark projects a GAAP net loss of between $8.5 million and $14.5 million, with a substantial reduction in losses allocated from Triple T. The company anticipates its Adjusted EBITDA will be between $48 million and $56 million. Harvest volumes are forecast between 2.3 million and 2.5 million tons with approximately 95% derived from the U.S. South region and a sawtimber mix of approximately 40% from the U.S. South and approximately 80% from the Pacific Northwest. Asset management fee revenue is projected to be between $11 million and $12 million, primarily from the Triple T joint venture. Timberland sales targets of $15 million to $17 million remain in the range of 1% to 2% of fee acreage.
Davis said: “Our outlook does not include potential contributions from future acquisitions and investments and does not include any additional potential capital recycling which we continue to pursue as part of our ongoing growth strategy and capital allocation model. We project higher Harvest EBITDA in 2020 primarily driven by increased harvest volumes and steady pricing, while Investment Management EBITDA will decrease due to decreased contributions from Dawsonville Bluffs, which effectively wrapped up in 2019.”
Adjusted EBITDA
Exhibit 99.1
The discussion below is intended to enhance the reader’s understanding of our operating performance and ability to satisfy lender requirements. EBITDA is a non-GAAP financial measure of operating performance. EBITDA is defined by the SEC as earnings before interest, taxes, depreciation and amortization; however, we have excluded certain other expenses which we believe are not indicative of the ongoing operating results of our timberland portfolio, and we refer to this measure as Adjusted EBITDA (see the reconciliation table below). As such, our Adjusted EBITDA may not be comparable to similarly titled measures reported by other companies. Due to the significant amount of timber assets subject to depletion, significant income (losses) from unconsolidated joint ventures based on hypothetical liquidation book value, or HLBV, and the significant amount of financing subject to interest and amortization expense, management considers Adjusted EBITDA to be an important measure of our financial performance. By providing this non-GAAP financial measure, together with the reconciliation below, we believe we are enhancing investors’ understanding of our business and our ongoing results of operations, as well as assisting investors in evaluating how well we are executing our strategic initiatives. Items excluded from Adjusted EBITDA are significant components in understanding and assessing financial performance. Adjusted EBITDA is a supplemental measure of operating performance that does not represent and should not be considered in isolation or as an alternative to, or substitute for net income, cash flow from operations, or other financial statement data presented in accordance with GAAP in our consolidated financial statements as indicators of our operating performance. Adjusted EBITDA has limitations as an analytical tool and should not be considered in isolation or as a substitute for analysis of our results as reported under GAAP. Some of the limitations are:
• | Adjusted EBITDA does not reflect our capital expenditures, or our future requirements for capital expenditures; |
• | Adjusted EBITDA does not reflect changes in, or our interest expense or the cash requirements necessary to service interest or principal payments on, our debt; |
• | Although depletion is a non-cash charge, we will incur expenses to replace the timber being depleted in the future, and Adjusted EBITDA does not reflect all cash requirements for such expenses; |
• | Although HLBV income and losses are primarily hypothetical and non-cash in nature, Adjusted EBITDA does not reflect cash income or losses from unconsolidated joint ventures for which we use the HLBV method of accounting to determine our equity in earnings; and |
• | Adjusted EBITDA does not reflect the cash requirements necessary to fund post-employment benefits or transaction costs related to acquisitions, investments, joint ventures or new business initiatives, which may be substantial. |
Due to these limitations, Adjusted EBITDA should not be considered as a measure of discretionary cash available to us to invest in the growth of our business. Our credit agreement contains a minimum debt service
Exhibit 99.1
coverage ratio based, in part, on Adjusted EBITDA since this measure is representative of adjusted income available for interest payments. We further believe that our presentation of this non-GAAP financial measurement provides information that is useful to analysts and investors because they are important indicators of the strength of our operations and the performance of our business.
For the three months ended December 31, 2019, Adjusted EBITDA was $15.1 million, a $5.7 million increase from the three months ended December 31, 2018, primarily due to a $2.7 million increase in net timber revenue, a $2.4 million increase in timberland sales and a $0.5 million decrease in corporate expenses.
For the year ended December 31, 2019, Adjusted EBITDA was $56.9 million, a $7.1 million increase from the year ended December 31, 2018, primarily due to a $6.3 million increase in asset management fee revenue and a $3.4 million increase in net timber revenues, offset by a $2.0 million decrease in Adjusted EBITDA generated by Dawsonville Bluffs and a $0.6 million decrease in other revenues.
Reconciliation of net loss to Adjusted EBITDA for 2020 guidance, the fourth quarters and full years ended December 31, 2019 and 2018 follow:
2020 Guidance | Three Months Ended December 31, | Years Ended December 31, | |||||||||||||||||
(in thousands) | 2019 | 2018 | 2019 | 2018 | |||||||||||||||
Net loss | $ (8,500) - (14,500) | $ | (11,804 | ) | $ | (38,218 | ) | $ | (93,321 | ) | $ | (122,007 | ) | ||||||
Add: | |||||||||||||||||||
Depletion | 30,000 - 33,000 | 8,531 | 6,028 | 28,064 | 25,912 | ||||||||||||||
Interest expense (1) | 16,000 | 4,071 | 4,889 | 17,058 | 13,643 | ||||||||||||||
Amortization (1) | — | 800 | 289 | 1,786 | 2,821 | ||||||||||||||
Income tax benefit | — | (1,127 | ) | — | (1,127 | ) | — | ||||||||||||
Depletion, amortization, and basis of timberland and mitigation credits sold included in loss from unconsolidated joint venture (2) | — | 276 | 310 | 3,823 | 4,195 | ||||||||||||||
Basis of timberland sold, lease terminations and other (3) | 11,000 | 4,635 | 2,282 | 14,964 | 13,053 | ||||||||||||||
Stock-based compensation expense | 3,000 | 838 | 518 | 2,790 | 2,689 | ||||||||||||||
(Gain) loss from large dispositions (4) | (500) - (1,500) | — | 390 | (7,961 | ) | 390 | |||||||||||||
HLBV loss from unconsolidated joint venture (5) | — | 8,650 | 32,795 | 90,450 | 109,550 | ||||||||||||||
Other (6) | 3,000 | 265 | 137 | 380 | (460 | ) | |||||||||||||
Adjusted EBITDA | $ 48,000 - 56,000 | $ | 15,135 | $ | 9,420 | $ | 56,906 | $ | 49,786 | ||||||||||
(1) | For the purpose of the above reconciliation, amortization includes amortization of deferred financing costs, amortization of operating lease assets and liabilities, amortization of intangible lease assets, and amortization of mainline road costs, which are included in either interest expense, land rent expense, or other operating expenses in the consolidated statements of operations. |
(2) | Reflects our share of depletion, amortization, and basis of timberland and mitigation credits sold of the unconsolidated Dawsonville Bluffs joint venture. |
(3) | Includes non-cash basis of timber and timberland assets written-off related to timberland sold, terminations of timberland leases and casualty losses. |
(4) | Large dispositions are sales of blocks of timberland properties in one or several transactions with the objective to generate proceeds to fund capital allocation priorities. Large dispositions may or may not have a higher or better use than timber production or result in a price premium above the land’s timber production value. Such dispositions are infrequent in nature, are not part of core operations, and would cause material variances in comparative results if not reported separately. |
Exhibit 99.1
(5) | Reflects HLBV (income) losses from the Triple T joint venture, which is determined based on a hypothetical liquidation of the underlying joint venture at book value as of the reporting date. |
(6) | Includes certain cash expenses paid, or reimbursement received, that management believes do not directly reflect the core business operations of our timberland portfolio on an on-going basis, including post-employment benefits and costs required to be expensed by GAAP related to acquisitions, transactions, joint ventures or new business initiatives. |
Conference Call
The company will host a conference call and live webcast at 10 a.m. ET on Friday, February 14, 2020 to discuss these results. Investors may listen to the conference call by dialing 1-888-347-1165 for U.S/Canada and 1-412-902-4276 for international callers. Participants should ask to be joined into the CatchMark call. Access to the live webcast will be available at www.catchmark.com. A replay of this webcast will be archived on the company's website shortly after the call.
About CatchMark
CatchMark (NYSE: CTT) seeks to deliver consistent and growing per share cash flow from disciplined acquisitions and superior management of prime timberlands located in high demand U.S. mill markets. Concentrating on maximizing cash flows throughout business cycles, the company strategically harvests its high-quality timberlands to produce durable revenue growth and takes advantage of proximate mill markets, which provide a reliable outlet for merchantable inventory. Headquartered in Atlanta and focused exclusively on timberland ownership and management, CatchMark began operations in 2007 and owns interests in 1.5 million acres* of timberlands located in Alabama, Florida, Georgia, North Carolina, Oregon, South Carolina, Tennessee and Texas. For more information, visit www.catchmark.com.
* As of December 31, 2019
Forward-Looking Statements
This press release contains forward-looking statements within the meaning of Section 27A of the Securities Act of 1933 and Section 21E of the Securities Exchange Act of 1934, as amended. Such forward-looking statements can generally be identified by our use of forward-looking terminology such as "may," "will," "expect," "intend," "anticipate," "estimate," "believe," "continue," or other similar words. However, the absence of these or similar words or expressions does not mean that a statement is not forward-looking. Forward-looking statements are not guarantees of performance and are based on certain assumptions, discuss future expectations, describe plans and strategies, contain projections of results of operations or of financial condition or state other forward-looking information. Forward-looking statements in this press release include, but are not limited to, that our capital recycling strategy will enable future investments in prime timberlands furthering our growth strategy, that we will be able to unlock further value in our Triple T joint venture through greater operating efficiencies and new tactical strategies, and our financial outlook and guidance for full-year 2020. Risks and uncertainties that could cause our actual results to differ from these forward-looking statements include, but are not limited to, that (i) we may not generate the harvest volumes from our timberlands that we currently anticipate; (ii) the demand for our timber may not increase at the rate we currently anticipate or at all due to changes in general economic and business conditions in the geographic regions where our timberlands are located; (iii) the cyclical nature of the real estate market generally, including fluctuations in demand and valuations, may adversely impact our ability to generate income and cash flow from sales of higher-and-better use properties; (iv) timber prices may not increase at the rate we currently anticipate or could decline, which would negatively impact our revenues; (v)
Exhibit 99.1
the supply of timberlands available for acquisition that meet our investment criteria may be less than we currently anticipate; (vi) we may be unsuccessful in winning bids for timberland that are sold through an auction process; (vii) we may not be able sell large dispositions of timberland in capital recycling transactions at prices that are attractive to us or at all; (viii) we may not be able to access external sources of capital at attractive rates or at all; (ix) potential increases in interest rates could have a negative impact on our business; (x) our share repurchase program may not be successful in improving stockholder value over the long-term; (xi) our joint venture strategy may not enable us to access non-dilutive capital and enhance our ability to make acquisitions; (xii) we may not be successful in effectively managing the Triple T joint venture and the anticipated benefits of the joint venture may not be realized, including that our asset management fee could be deferred or decreased, we may not earn an incentive-based promote and our investment in the joint venture may lose value; and (xiii) the factors described in Part I, Item 1A. Risk Factors of our Annual Report on Form 10-K for the fiscal year ended December 31, 2018 and our other filings with the Securities and Exchange Commission. Accordingly, readers are cautioned not to place undue reliance on these forward-looking statements, which speak only as of the date of this press release. We undertake no obligation to update our forward-looking statements, except as required by law.
###
Contacts
Investors: Media:
Brian Davis Mary Beth Ryan, Miller Ryan LLC
(855) 858-9794 (203) 268-0158
info@catchmark.com marybeth@millerryanllc.com
Exhibit 99.1
CATCHMARK TIMBER TRUST, INC. AND SUBSIDIARIES
CONSOLIDATED STATEMENTS OF OPERATIONS (UNAUDITED)
(in thousands, except for per-share amounts)
Three Months Ended December 31, | Years Ended December 31, | ||||||||||||||
2019 | 2018 | 2019 | 2018 | ||||||||||||
Revenues: | |||||||||||||||
Timber sales | $ | 20,027 | $ | 16,315 | $ | 72,557 | $ | 69,455 | |||||||
Timberland sales | 4,994 | 2,616 | 17,572 | 17,520 | |||||||||||
Asset management fees | 2,829 | 2,844 | 11,948 | 5,603 | |||||||||||
Other revenues | 1,246 | 1,152 | 4,632 | 5,279 | |||||||||||
29,096 | 22,927 | 106,709 | 97,857 | ||||||||||||
Expenses: | |||||||||||||||
Contract logging and hauling costs | 8,351 | 7,315 | 31,129 | 31,469 | |||||||||||
Depletion | 8,531 | 6,028 | 28,064 | 25,912 | |||||||||||
Cost of timberland sales | 4,505 | 1,922 | 15,067 | 13,512 | |||||||||||
Forestry management expenses | 1,709 | 1,661 | 6,691 | 6,283 | |||||||||||
General and administrative expenses | 3,750 | 3,823 | 13,300 | 12,425 | |||||||||||
Land rent expense | 124 | 170 | 524 | 660 | |||||||||||
Other operating expenses | 1,846 | 2,106 | 6,460 | 6,303 | |||||||||||
28,816 | 23,025 | 101,235 | 96,564 | ||||||||||||
Other income (expense): | |||||||||||||||
Interest income | 62 | 82 | 204 | 262 | |||||||||||
Interest expense | (4,813 | ) | (5,130 | ) | (18,616 | ) | (16,255 | ) | |||||||
Gain (loss) on large dispositions | — | (390 | ) | 7,961 | (390 | ) | |||||||||
(4,751 | ) | (5,438 | ) | (10,451 | ) | (16,383 | ) | ||||||||
Loss before unconsolidated joint ventures and income taxes | (4,471 | ) | (5,536 | ) | (4,977 | ) | (15,090 | ) | |||||||
Income (loss) from unconsolidated joint ventures: | |||||||||||||||
Triple T | (8,650 | ) | (32,796 | ) | (90,450 | ) | (109,551 | ) | |||||||
Dawsonville Bluffs | 190 | 114 | 979 | 2,634 | |||||||||||
(8,460 | ) | (32,682 | ) | (89,471 | ) | (106,917 | ) | ||||||||
Net loss before income taxes | (12,931 | ) | (38,218 | ) | (94,448 | ) | (122,007 | ) | |||||||
Income tax benefit | 1,127 | — | 1,127 | — | |||||||||||
Net loss | $ | (11,804 | ) | $ | (38,218 | ) | $ | (93,321 | ) | $ | (122,007 | ) | |||
Weighted-average shares outstanding - basic and diluted | 49,007 | 49,082 | 49,038 | 47,937 | |||||||||||
Net loss per-share - basic and diluted | $ | (0.24 | ) | $ | (0.78 | ) | $ | (1.90 | ) | $ | (2.55 | ) | |||
Exhibit 99.1
CATCHMARK TIMBER TRUST, INC. AND SUBSIDIARIES
CONSOLIDATED BALANCE SHEETS (UNAUDITED)
(in thousands, except for per-share amounts)
December 31, 2019 | December 31, 2018 | ||||||
Assets: | |||||||
Cash and cash equivalents | $ | 11,487 | $ | 5,614 | |||
Accounts receivable | 7,998 | 7,355 | |||||
Prepaid expenses and other assets | 5,459 | 7,369 | |||||
Operating lease right-of-use asset, less accumulated amortization of $280 as of December 31, 2019 | 3,120 | — | |||||
Deferred financing costs | 246 | 327 | |||||
Timber assets: | |||||||
Timber and timberlands, net | 633,581 | 687,851 | |||||
Intangible lease assets, less accumulated amortization of $948 and $945 as of December 31, 2019 and December 31, 2018, respectively | 9 | 12 | |||||
Investments in unconsolidated joint ventures | 1,965 | 96,244 | |||||
Total assets | $ | 663,865 | $ | 804,772 | |||
Liabilities: | |||||||
Accounts payable and accrued expenses | $ | 3,580 | $ | 4,936 | |||
Operating lease liability | 3,242 | — | |||||
Other liabilities | 10,853 | 5,940 | |||||
Notes payable and lines of credit, net of deferred financing costs | 452,987 | 472,240 | |||||
Total liabilities | 470,662 | 483,116 | |||||
Commitments and Contingencies | — | — | |||||
Stockholders’ Equity: | |||||||
Class A common stock, $0.01 par value; 900,000 shares authorized; 49,008 and 49,127 shares issued and outstanding as of December 31, 2019 and December 31, 2018, respectively | 490 | 492 | |||||
Additional paid-in capital | 729,274 | 730,416 | |||||
Accumulated deficit and distributions | (528,847 | ) | (409,260 | ) | |||
Accumulated other comprehensive income (loss) | (8,276 | ) | 8 | ||||
Total stockholders’ equity | 192,641 | 321,656 | |||||
Non-controlling interests | 562 | — | |||||
Total equity | 193,203 | 321,656 | |||||
Total liabilities and equity | $ | 663,865 | $ | 804,772 | |||
Exhibit 99.1
CATCHMARK TIMBER TRUST, INC. AND SUBSIDIARIES
CONSOLIDATED STATEMENTS OF CASH FLOWS (UNAUDITED)
(in thousands)
Three Months Ended December 31, | Years Ended December 31, | ||||||||||||||
2019 | 2018 | 2019 | 2018 | ||||||||||||
Cash Flows from Operating Activities: | |||||||||||||||
Net loss | $ | (11,804 | ) | $ | (38,218 | ) | $ | (93,321 | ) | $ | (122,007 | ) | |||
Adjustments to reconcile net loss to net cash provided by operating activities: | |||||||||||||||
Depletion | 8,531 | 6,028 | 28,064 | 25,912 | |||||||||||
Basis of timberland sold, lease terminations and other | 4,635 | 2,282 | 14,964 | 13,053 | |||||||||||
Stock-based compensation expense | 838 | 518 | 2,790 | 2,689 | |||||||||||
Noncash interest expense | 743 | 241 | 1,559 | 2,612 | |||||||||||
Other amortization | 57 | 50 | 227 | 210 | |||||||||||
Gain (loss) from large dispositions | — | 390 | (7,961 | ) | 390 | ||||||||||
Loss from unconsolidated joint ventures | 8,460 | 32,682 | 89,471 | 106,917 | |||||||||||
Operating distributions from unconsolidated joint ventures | 189 | 113 | 978 | 3,771 | |||||||||||
Income tax benefit | (1,127 | ) | — | (1,127 | ) | — | |||||||||
Interest paid under new interest rate swaps | 115 | — | 115 | — | |||||||||||
Changes in assets and liabilities: | |||||||||||||||
Accounts receivable | (3,480 | ) | (806 | ) | (1,473 | ) | (3,449 | ) | |||||||
Prepaid expenses and other assets | 35 | 35 | 256 | (260 | ) | ||||||||||
Accounts payable and accrued expenses | (1,447 | ) | (1,505 | ) | (1,309 | ) | 122 | ||||||||
Other liabilities | (1,316 | ) | (1,285 | ) | (291 | ) | (164 | ) | |||||||
Net cash provided by operating activities | 4,429 | 525 | 32,942 | 29,796 | |||||||||||
Cash Flows from Investing Activities: | |||||||||||||||
Timberland acquisitions and earnest money paid | (1,973 | ) | (397 | ) | (1,973 | ) | (91,821 | ) | |||||||
Capital expenditures (excluding timberland acquisitions) | (1,147 | ) | (1,750 | ) | (4,178 | ) | (4,571 | ) | |||||||
Investment in unconsolidated joint ventures | — | — | — | (200,000 | ) | ||||||||||
Distributions from unconsolidated joint ventures | (189 | ) | (114 | ) | 3,830 | 4,744 | |||||||||
Net proceeds from large dispositions | — | 79,134 | 25,151 | 79,134 | |||||||||||
Net cash provided by (used in) investing activities | (3,309 | ) | 76,873 | 22,830 | (212,514 | ) | |||||||||
Cash Flows from Financing Activities: | |||||||||||||||
Proceeds from note payable | — | — | — | 289,000 | |||||||||||
Repayments of note payable | — | (79,000 | ) | (20,064 | ) | (148,000 | ) | ||||||||
Financing costs paid | (34 | ) | (602 | ) | (82 | ) | (1,434 | ) | |||||||
Issuance of common stock | — | — | — | 72,450 | |||||||||||
Interest paid under new interest rate swaps | (115 | ) | — | (115 | ) | — | |||||||||
Dividends paid to common stockholders | (6,558 | ) | (6,588 | ) | (26,269 | ) | (25,601 | ) | |||||||
Repurchases of common shares under the share repurchase | — | (1,003 | ) | (3,004 | ) | (1,003 | ) | ||||||||
Repurchase of common shares for minimum tax withholdings | — | — | (365 | ) | (1,348 | ) | |||||||||
Other offering costs paid | — | 86 | — | (3,537 | ) | ||||||||||
Net cash provided by (used in) financing activities | (6,707 | ) | (87,107 | ) | (49,899 | ) | 180,527 | ||||||||
Net change in cash and cash equivalents | (5,587 | ) | (9,709 | ) | 5,873 | (2,191 | ) | ||||||||
Cash and cash equivalents, beginning of period | 17,074 | 15,323 | 5,614 | 7,805 | |||||||||||
Cash and cash equivalents, end of period | $ | 11,487 | $ | 5,614 | $ | 11,487 | $ | 5,614 | |||||||
Exhibit 99.1
CATCHMARK TIMBER TRUST, INC. AND SUBSIDIARIES
SELECTED DATA (UNAUDITED)
2019 | 2018 | ||||||||||||||||||||||||||||||||||||||
(in thousands, except for per-ton, per-acre amounts) | Q1 | Q2 | Q3 | Q4 | YTD | Q1 | Q2 | Q3 | Q4 | YTD | |||||||||||||||||||||||||||||
Consolidated | |||||||||||||||||||||||||||||||||||||||
Timber Sales Volume (tons) | |||||||||||||||||||||||||||||||||||||||
Pulpwood | 294 | 304 | 376 | 336 | 1,310 | 354 | 342 | 343 | 317 | 1,356 | |||||||||||||||||||||||||||||
Sawtimber (1) | 193 | 190 | 258 | 292 | 933 | 221 | 219 | 187 | 192 | 819 | |||||||||||||||||||||||||||||
Total | 487 | 494 | 634 | 628 | 2,243 | 575 | 561 | 530 | 509 | 2,175 | |||||||||||||||||||||||||||||
Harvest Mix | |||||||||||||||||||||||||||||||||||||||
Pulpwood | 60 | % | 62 | % | 59 | % | 54 | % | 58 | % | 62 | % | 61 | % | 65 | % | 62 | % | 62 | % | |||||||||||||||||||
Sawtimber (1) | 40 | % | 38 | % | 41 | % | 46 | % | 42 | % | 38 | % | 39 | % | 35 | % | 38 | % | 38 | % | |||||||||||||||||||
Direct Timberland Acquisitions, Exclusive of Transaction Costs | |||||||||||||||||||||||||||||||||||||||
Gross Acquisitions | $ | — | $ | — | $ | — | $ | 1,925 | $ | 1,925 | $ | — | $ | — | $ | 89,700 | $ | — | $ | 89,700 | |||||||||||||||||||
Acres Acquired | — | — | — | 900 | 900 | — | — | 18,100 | — | 18,100 | |||||||||||||||||||||||||||||
Price per acre (3) | $ | — | $ | — | $ | — | $ | 2,185 | $ | 2,185 | $ | — | $ | — | $ | 4,956 | $ | — | $ | 4,956 | |||||||||||||||||||
Joint Ventures' Timberland Acquisitions, Exclusive of Transaction Costs (6) | |||||||||||||||||||||||||||||||||||||||
Gross Acquisitions | $ | — | $ | — | $ | — | $ | — | $ | — | $ | — | $ | — | $ | 1,389,500 | $ | — | $ | 1,389,500 | |||||||||||||||||||
Acres Acquired | — | — | — | — | — | — | — | 1,099,800 | — | 1,099,800 | |||||||||||||||||||||||||||||
Price per acre | $ | — | $ | — | $ | — | $ | — | $ | — | $ | — | $ | — | $ | 1,263 | $ | — | $ | 1,263 | |||||||||||||||||||
Period-end acres | |||||||||||||||||||||||||||||||||||||||
Fee | 432 | 424 | 413 | 410 | 410 | 477 | 474 | 490 | 433 | 433 | |||||||||||||||||||||||||||||
Lease | 27 | 26 | 26 | 25 | 25 | 31 | 30 | 30 | 30 | 30 | |||||||||||||||||||||||||||||
Wholly-Owned Total | 459 | 450 | 439 | 435 | 435 | 508 | 504 | 520 | 463 | 463 | |||||||||||||||||||||||||||||
Joint Venture Interest (6) | 1,100 | 1,100 | 1,094 | 1,092 | 1,092 | 6 | 6 | 1,106 | 1,105 | 1,105 | |||||||||||||||||||||||||||||
Total | 1,559 | 1,550 | 1,533 | 1,527 | 1,527 | 514 | 510 | 1,626 | 1,568 | 1,568 | |||||||||||||||||||||||||||||
U.S. South | |||||||||||||||||||||||||||||||||||||||
U.S. South | |||||||||||||||||||||||||||||||||||||||
Timber Sales Volume (tons) | |||||||||||||||||||||||||||||||||||||||
Pulpwood | 294 | 303 | 373 | 332 | 1,302 | 354 | 342 | 343 | 317 | 1,356 | |||||||||||||||||||||||||||||
Sawtimber (1) | 188 | 177 | 237 | 271 | 873 | 221 | 219 | 185 | 192 | 817 | |||||||||||||||||||||||||||||
Total | 482 | 480 | 610 | 603 | 2,175 | 575 | 561 | 528 | 509 | 2,173 | |||||||||||||||||||||||||||||
Harvest Mix | |||||||||||||||||||||||||||||||||||||||
Pulpwood | 61 | % | 63 | % | 61 | % | 55 | % | 60 | % | 62 | % | 61 | % | 65 | % | 62 | % | 62 | % | |||||||||||||||||||
Sawtimber (1) | 39 | % | 37 | % | 39 | % | 45 | % | 40 | % | 38 | % | 39 | % | 35 | % | 38 | % | 38 | % | |||||||||||||||||||
Delivered % as of total volume | 79 | % | 74 | % | 64 | % | 67 | % | 71 | % | 83 | % | 80 | % | 78 | % | 78 | % | 80 | % | |||||||||||||||||||
Stumpage % as of total volume (5) | 21 | % | 26 | % | 36 | % | 33 | % | 29 | % | 17 | % | 20 | % | 22 | % | 22 | % | 20 | % | |||||||||||||||||||
Net Timber Sales Price ($ per ton) (2) | |||||||||||||||||||||||||||||||||||||||
Pulpwood | $ | 15 | $ | 14 | $ | 14 | $ | 13 | $ | 14 | $ | 14 | $ | 13 | $ | 13 | $ | 14 | $ | 14 | |||||||||||||||||||
Sawtimber (1) | $ | 24 | $ | 24 | $ | 24 | $ | 23 | $ | 24 | $ | 23 | $ | 24 | $ | 24 | $ | 25 | $ | 24 | |||||||||||||||||||
Timberland Sales | |||||||||||||||||||||||||||||||||||||||
Gross Sales | $ | 2,090 | $ | 8,224 | $ | 2,264 | $ | 4,994 | $ | 17,572 | $ | 4,252 | $ | 6,834 | $ | 3,818 | $ | 2,616 | $ | 17,520 | |||||||||||||||||||
Acres Sold | 900 | 4,000 | 1,100 | 3,200 | 9,200 | 2,200 | 3,100 | 1,900 | 1,300 | 8,500 | |||||||||||||||||||||||||||||
% of fee acres | 0.2 | % | 0.9 | % | 0.2 | % | 0.9 | % | 2.2 | % | 0.5 | % | 0.7 | % | 0.4 | % | 0.3 | % | 1.8 | % | |||||||||||||||||||
Price per acre (3) | $ | 2,236 | $ | 2,072 | $ | 2,166 | $ | 1,588 | $ | 1,920 | $ | 1,955 | $ | 2,199 | $ | 1,967 | $ | 2,064 | $ | 2,064 | |||||||||||||||||||
Large Dispositions (4) | |||||||||||||||||||||||||||||||||||||||
Gross Sales | $ | — | $ | 5,475 | $ | 19,920 | $ | — | $ | 25,395 | $ | — | $ | — | $ | — | $ | 79,301 | $ | 79,301 | |||||||||||||||||||
Acres Sold | — | 3,600 | 10,800 | — | 14,400 | — | — | — | 56,100 | 56,100 | |||||||||||||||||||||||||||||
Price per acre (3) | $ | — | $ | 1,500 | $ | 1,845 | $ | — | $ | 1,758 | $ | — | $ | — | $ | — | $ | 1,414 | $ | 1,414 | |||||||||||||||||||
Gain (loss) | $ | — | $ | 764 | $ | 7,197 | $ | — | $ | 7,961 | $ | — | $ | — | $ | — | $ | (390 | ) | $ | (390 | ) | |||||||||||||||||
Pacific Northwest | |||||||||||||||||||||||||||||||||||||||
Timber Sales Volume (tons) | |||||||||||||||||||||||||||||||||||||||
Exhibit 99.1
Pulpwood | — | 1 | 3 | 4 | 8 | — | — | — | — | — | |||||||||||||||||||||||||||||
Sawtimber | 5 | 13 | 21 | 21 | 60 | — | — | 2 | — | 2 | |||||||||||||||||||||||||||||
Total | 5 | 14 | 24 | 25 | 68 | — | — | 2 | — | 2 | |||||||||||||||||||||||||||||
Harvest Mix | |||||||||||||||||||||||||||||||||||||||
Pulpwood | — | % | 9 | % | 13 | % | 15 | % | 12 | % | — | % | — | % | — | % | — | % | — | % | |||||||||||||||||||
Sawtimber | 100 | % | 91 | % | 87 | % | 85 | % | 88 | % | — | % | — | % | 100 | % | — | % | 100 | % | |||||||||||||||||||
Delivered % as of total volume | 100 | % | 87 | % | 100 | % | 74 | % | 88 | % | — | % | — | % | — | % | — | % | — | % | |||||||||||||||||||
Stumpage % as of total volume | — | % | 13 | % | — | % | 26 | % | 12 | % | — | % | — | % | 100 | % | — | % | 100 | % | |||||||||||||||||||
Delivered Timber Sales Price ($ per ton) (2) | |||||||||||||||||||||||||||||||||||||||
Pulpwood | $ | 40 | $ | 37 | $ | 30 | $ | 31 | $ | 32 | $ | — | $ | — | $ | — | $ | — | $ | — | |||||||||||||||||||
Sawtimber | $ | 101 | $ | 94 | $ | 83 | $ | 85 | $ | 88 | $ | — | $ | — | $ | — | $ | — | $ | — | |||||||||||||||||||
(1) Includes chip-n-saw and sawtimber. (2) Prices per ton are rounded to the nearest dollar. Delivered timber sales price includes contract logging and hauling costs. The Bandon Property in the Pacific Northwest was acquired at the end of August 2018 and did not have any delivered timber sales in 2018. (3) Excludes value of timber reservations. (4) Large dispositions are sales of blocks of timberland properties in one or several transactions with the objective to generate proceeds to fund capital allocation priorities. Large dispositions may or may not have a higher or better use than timber production or result in a price premium above the land’s timber production value. Such dispositions are infrequent in nature, are not part of core operations, and would cause material variances in comparative results if not reported separately. (5) Current year percentage includes 4% from lump-sum sales. (6) Represents properties owned by Triple T Joint Venture in which CatchMark owns a 21.6% equity interest; and Dawsonville Bluffs, LLC, a joint venture in which CatchMark owns a 50% membership interest. CatchMark serves as the manager for both of these joint ventures. | |||||||||||||||||||||||||||||||||||||||
Exhibit 99.1
CATCHMARK TIMBER TRUST, INC. AND SUBSIDIARIES
ADJUSTED EBITDA BY SEGMENT (UNAUDITED)
(in thousands)
Three Months Ended December 31, | Years Ended December 31, | ||||||||||||||
2019 | 2018 | 2019 | 2018 | ||||||||||||
Timber sales | $ | 20,027 | $ | 16,315 | $ | 72,557 | $ | 69,455 | |||||||
Other revenue | 1,246 | 1,152 | 4,632 | 5,279 | |||||||||||
(-) Contract logging and hauling costs | (8,351 | ) | (7,315 | ) | (31,129 | ) | (31,469 | ) | |||||||
(-) Forestry management expenses | (1,709 | ) | (1,661 | ) | (6,691 | ) | (6,283 | ) | |||||||
(-) Land rent expense | (124 | ) | (170 | ) | (524 | ) | (660 | ) | |||||||
(-) Other operating expenses | (1,846 | ) | (2,106 | ) | (6,460 | ) | (6,303 | ) | |||||||
(+) Stock-based compensation | 74 | 23 | 263 | 333 | |||||||||||
(+/-) Other | 418 | 613 | 1,022 | 839 | |||||||||||
Harvest EBITDA | 9,735 | 6,851 | 33,670 | 31,191 | |||||||||||
Timberland sales | 4,994 | 2,616 | 17,572 | 17,520 | |||||||||||
(-) Cost of timberland sales | (4,505 | ) | (1,922 | ) | (15,067 | ) | (13,512 | ) | |||||||
(+) Basis of timberland sold | 4,249 | 1,707 | 14,054 | 12,380 | |||||||||||
Real estate EBITDA | 4,738 | 2,401 | 16,559 | 16,388 | |||||||||||
Asset management fees | 2,829 | 2,844 | 11,948 | 5,603 | |||||||||||
Unconsolidated Dawsonville Bluffs joint venture EBITDA | 465 | 423 | 4,801 | 6,828 | |||||||||||
Investment management EBITDA | 3,294 | 3,267 | 16,749 | 12,431 | |||||||||||
Total operating EBITDA | 17,767 | 12,519 | 66,978 | 60,010 | |||||||||||
(-) General and administrative expenses | (3,750 | ) | (3,823 | ) | (13,300 | ) | (12,425 | ) | |||||||
(+) Stock-based compensation | 764 | 495 | 2,527 | 2,356 | |||||||||||
(+) Interest income | 62 | 82 | 204 | 262 | |||||||||||
(+/-) Other | 292 | 147 | 497 | (417 | ) | ||||||||||
Corporate EBITDA | (2,632 | ) | (3,099 | ) | (10,072 | ) | (10,224 | ) | |||||||
Adjusted EBITDA | $ | 15,135 | $ | 9,420 | $ | 56,906 | $ | 49,786 | |||||||