Attached files
| file | filename |
|---|---|
| 8-K - FORM 8-K - SIMMONS FIRST NATIONAL CORP | f8k_021120.htm |
Exhibit 99.1

NASDAQ: SFNC Investor Presentation

Forward - Looking Statements and Non - GAAP Financial Measures 2 Certain statements contained in this presentation may not be based on historical facts and should be considered "forward - looking statements" within the meaning of the Private Securities Litigation Reform Act of 1995 . These forward - looking statements may be identified by reference to a future period(s) or by the use of forward - looking terminology, such as "anticipate," "estimate," "expect," "foresee," "may," "might," "will," "would," "could" or "intend," future or conditional verb tenses, and variations or negatives of such terms . These forward - looking statements include, without limitation, those relating to Simmons First National Corporation’s (“Company”) future growth, revenue, assets, asset quality, profitability and earnings, critical accounting policies, accretion, net interest margin, non - interest revenue, market conditions related to the Company's common stock repurchase program, adequacy of the allowance for loan losses, as well as the expected effects of certain new accounting standards on the Company's financial statements, income tax deductions, credit quality, the level of credit losses from lending commitments, net interest revenue, interest rate sensitivity, loan loss experience, liquidity, capital resources, market risk, earnings, and the expected benefits, milestones or costs associated with the Company’s acquisition strategy and Next Generation Bank Program, and legal and regulatory limitations and compliance and competition . Readers are cautioned not to place undue reliance on the forward - looking statements contained in this presentation in that actual results could differ materially from those indicated in such forward - looking statements, due to a variety of factors . These factors include, but are not limited to, changes in the Company's operating or expansion strategy, availability of and costs associated with obtaining adequate and timely sources of liquidity, the ability to maintain credit quality, possible adverse rulings, judgments, settlements and other outcomes of pending litigation, the ability of the Company to collect amounts due under loan agreements, changes in consumer preferences, effectiveness of the Company's interest rate risk management strategies, laws and regulations affecting financial institutions in general or relating to taxes, the effect of pending or future legislation, the ability of the Company to repurchase its common stock on favorable terms, the ability of the Company to successfully implement its acquisition strategy (including, without limitation, the ability of the Company to successfully integrate Landmark Bank with and into Simmons Bank and achieve the associated cost savings), changes in interest rates and capital markets, inflation, customer acceptance of the Company's products and services, changes or disruptions in technology and IT systems (including cyber threats, attacks and events) and other risk factors . Other relevant risk factors may be detailed from time to time in the Company's press releases and filings with the Securities and Exchange Commission, including, without limitation, the Company’s Form 10 - K for the year ended December 31 , 2018 . Any forward - looking statement speaks only as of the date of this Report, and we undertake no obligation to update these forward - looking statements to reflect events or circumstances that occur after the date of this Report . Annualized, pro forma, projected and estimated numbers are used for illustrative purpose only, are not forecasts and may not reflect actual results . Non - GAAP Financial Measures This document contains financial information determined by methods other than in accordance with generally accepted accounting principles (GAAP) . The Company's management uses these non - GAAP financial measures in their analysis of the company's performance . These measures adjust GAAP performance measures to, among other things, include the tax benefit associated with revenue items that are tax - exempt, as well as exclude from income available to common shareholders certain expenses related to significant non - core activities, such as merger - related expenses, expenses related to the Company’s early retirement program, and branch right - sizing expenses . In addition, the Company also presents certain figures based on tangible common stockholders’ equity and tangible book value, which exclude goodwill and other intangible assets . The Company’s management believes that these non - GAAP financial measure are useful to investors because they, among other things, present the results of the Company’s ongoing operations without the effect of mergers or other items not central to the Company’s ongoing business, as well as normalizing for tax effects . Management, therefore, believes presentations of these non - GAAP financial measures provide useful supplemental information that is essential to a proper understanding of the operating results of the Company's core businesses . These non - GAAP disclosures should not be viewed as a substitute for operating results determined in accordance with GAAP, nor are they necessarily comparable to non - GAAP performance measures that may be presented by other companies . Where non - GAAP financial measures are used, the comparable GAAP financial measure, as well as the reconciliation to the comparable GAAP financial measure, can be found in the appendix to this presentation .
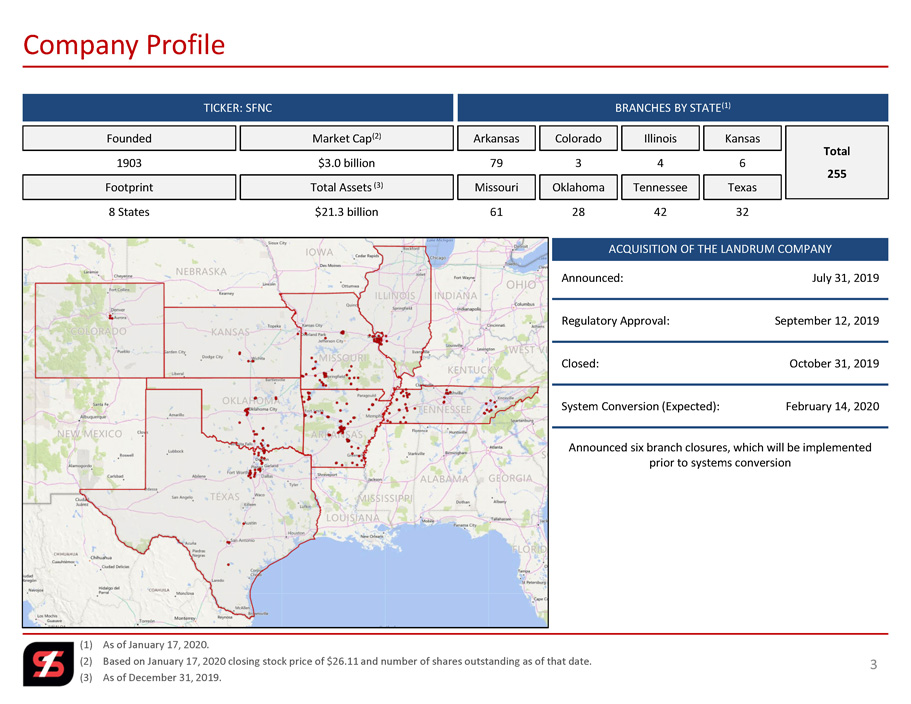
(1) As of January 17, 2020. (2) Based on January 17, 2020 closing stock price of $26.11 and number of shares outstanding as of that date. (3) As of December 31, 2019. Company Profile BRANCHES BY STATE (1) TICKER: SFNC Founded Footprint Total Assets (3) Market Cap (2) 1903 $3.0 billion $21.3 billion 8 States Texas Oklahoma Tennessee Arkansas Colorado Missouri Kansas 79 32 3 6 61 28 42 Total 255 Illinois 4 ACQUISITION OF THE LANDRUM COMPANY Announced: Regulatory Approval: Closed: System Conversion (Expected): Announced six branch closures, which will be implemented prior to systems conversion July 31, 2019 September 12, 2019 February 14, 2020 October 31, 2019 3

As of and for the year ended December 31, 2019 Selected Business Units 4 ▪ $205 million nationwide credit card portfolio ▪ Loan yield (including fees): 14.5% ▪ History of excellent credit quality (1.86% YTD net charge - off ratio) TRUST ▪ Total Assets: $5.6 billion – Managed Assets: $3.2 billion – Non - managed / Custodial Assets: $2.4 billion ▪ Profit Margin: 30.6% ▪ Growing investment management business ROYALTY TRUST ▪ Revenue: $2.3 million ▪ Profit Margin: 39.4% INVESTMENTS ▪ Beginning March 2019, retail investments services provided through networking arrangement with LPL Financial – LPL platform, among other things, provides customers with online self - service trade option – Retail Group: $1.3 billion AUM • $198.5 million in fee - based / advisory assets INSURANCE (EMPLOYEE BENEFITS & LIFE) ▪ Revenue: $1.6 million ▪ Profit Margin: 37% ▪ Mortgage Originations (YTD): $773 million ▪ 64% Purchase vs. 36% Refinance (YTD)
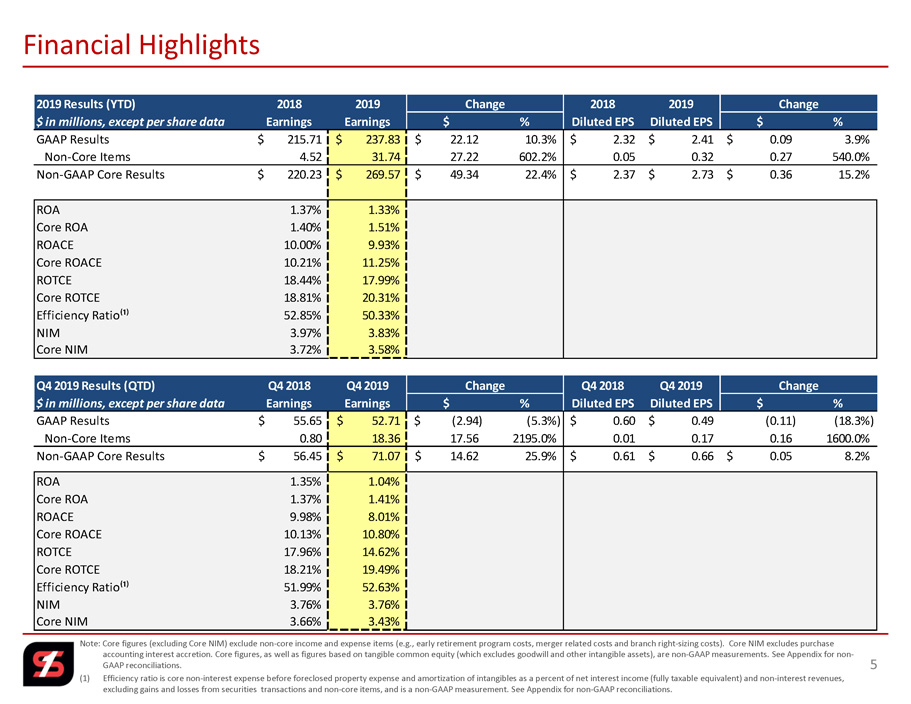
Note: Core figures (excluding Core NIM) exclude non - core income and expense items (e.g., early retirement program costs, merger related costs and branch right - sizing costs). Core NIM excludes purchase accounting interest accretion. Core figures, as well as figures based on tangible common equity (which excludes goodwill and oth er intangible assets), are non - GAAP measurements. See Appendix for non - GAAP reconciliations. (1) Efficiency ratio is core non - interest expense before foreclosed property expense and amortization of intangibles as a percent of net interest income (fully taxable equivalent) and non - interest revenues, excluding gains and losses from securities transactions and non - core items, and is a non - GAAP measurement. See Appendix for non - GAAP reconciliations. Financial Highlights 5 2019 Results (YTD) 2018 2019 Change 2018 2019 Change $ in millions, except per share data Earnings Earnings $ % Diluted EPS Diluted EPS $ % GAAP Results 215.71$ 237.83$ 22.12$ 10.3% 2.32$ 2.41$ 0.09$ 3.9% Non-Core Items 4.52 31.74 27.22 602.2% 0.05 0.32 0.27 540.0% Non-GAAP Core Results 220.23$ 269.57$ 49.34$ 22.4% 2.37$ 2.73$ 0.36$ 15.2% ROA 1.37% 1.33% Core ROA 1.40% 1.51% ROACE 10.00% 9.93% Core ROACE 10.21% 11.25% ROTCE 18.44% 17.99% Core ROTCE 18.81% 20.31% Efficiency Ratio⁽¹⁾ 52.85% 50.33% NIM 3.97% 3.83% Core NIM 3.72% 3.58% Q4 2019 Results (QTD) Q4 2018 Q4 2019 Change Q4 2018 Q4 2019 Change $ in millions, except per share data Earnings Earnings $ % Diluted EPS Diluted EPS $ % GAAP Results 55.65$ 52.71$ (2.94)$ (5.3%) 0.60$ 0.49$ (0.11) (18.3%) Non-Core Items 0.80 18.36 17.56 2195.0% 0.01 0.17 0.16 1600.0% Non-GAAP Core Results 56.45$ 71.07$ 14.62$ 25.9% 0.61$ 0.66$ 0.05$ 8.2% ROA 1.35% 1.04% Core ROA 1.37% 1.41% ROACE 9.98% 8.01% Core ROACE 10.13% 10.80% ROTCE 17.96% 14.62% Core ROTCE 18.21% 19.49% Efficiency Ratio⁽¹⁾ 51.99% 52.63% NIM 3.76% 3.76% Core NIM 3.66% 3.43%

(1) Core figures (excluding Core NIM) exclude non - core income and expense items (e.g., merger related costs, early retirement progra m costs and branch right - sizing costs). Core NIM excludes purchase accounting interest accretion. Core figures, as well as figures based on tangible common equity and tangible book va lue (which exclude goodwill and other intangible assets), are non - GAAP measurements. See Appendix for non - GAAP reconciliations. (2) Efficiency ratio is core non - interest expense before foreclosed property expense and amortization of intangibles as a percent of net interest income (fully taxable equivalent) and non - interest revenues, excluding gains and losses from securities transactions and non - core items, and is a non - GAAP measurement. See Append ix for non - GAAP reconciliations. 2019 Financial Highlights 6 NON - CORE ITEMS SELECTED HIGHLIGHTS (1)(2) ▪ Merger - related, early retirement and branch right - sizing costs of $43.0 million pre - tax and $31.7 million after - tax ▪ Total assets were $21.3 billion, Loans were $14.4 billion and Deposits were $16.1 billion ▪ ROAA of 1.33% and Core ROAA of 1.51% ▪ Efficiency Ratio of 50.33% ▪ ROACE of 9.93% and Core ROACE of 11.25% ▪ ROTCE of 17.99% and Core ROTCE of 20.31% ▪ NIM of 3.83% and Core NIM of 3.58% ▪ Diluted EPS of $2.41 and Core Diluted EPS of $2.73 As of and for the year ended December 31, 2019 ▪ Equity to asset ratio of 14.06% and tangible common equity to tangible asset ratio of 8.99% ▪ Book value per share of $26.30, an increase of 8.1% compared to the same date in 2018 ▪ Tangible book value per share of $15.89, an increase of 12.1% compared to the same date in 2018 ▪ During the fourth quarter of 2019, the Company repurchased approximately 390,000 shares at an average price of $25.95 ▪ Book value and tangible book value increased during a time we completed two acquisitions totaling $4.9 billion in assets and repurchased $10 million of stock ▪ Construction & Development concentration was 98% ▪ CRE concentration was 293%, down from a high of 333% at the end of the second quarter
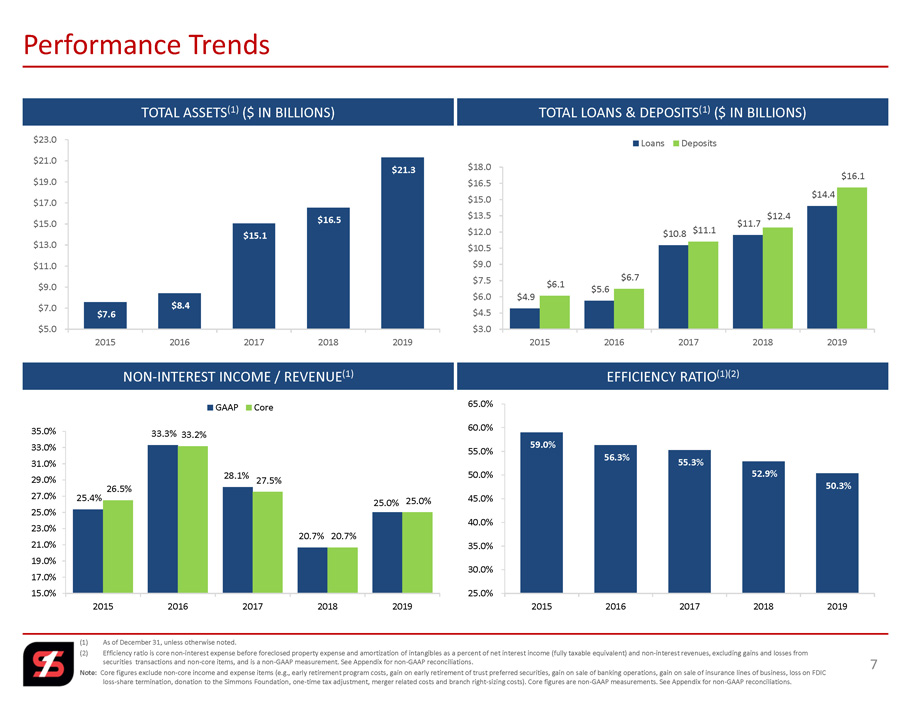
(1) As of December 31, unless otherwise noted. (2) Efficiency ratio is core non - interest expense before foreclosed property expense and amortization of intangibles as a percent of net interest income (fully taxable equivalent) and non - interest revenues, excluding gains and losses from securities transactions and non - core items, and is a non - GAAP measurement. See Appendix for non - GAAP reconciliations. Note: Core figures exclude non - core income and expense items (e.g., early retirement program costs, gain on early retirement of trus t preferred securities, gain on sale of banking operations, gain on sale of insurance lines of business, loss on FDIC loss - share termination, donation to the Simmons Foundation, one - time tax adjustment, merger related costs and branch right - sizin g costs). Core figures are non - GAAP measurements. See Appendix for non - GAAP reconciliations. Performance Trends 7 TOTAL ASSETS (1) ($ IN BILLIONS) EFFICIENCY RATIO (1)(2) NON - INTEREST INCOME / REVENUE (1) TOTAL LOANS & DEPOSITS (1) ($ IN BILLIONS) $7.6 $8.4 $15.1 $16.5 $21.3 $5.0 $7.0 $9.0 $11.0 $13.0 $15.0 $17.0 $19.0 $21.0 $23.0 2015 2016 2017 2018 2019 25.4% 33.3% 28.1% 20.7% 25.0% 26.5% 33.2% 27.5% 20.7% 25.0% 15.0% 17.0% 19.0% 21.0% 23.0% 25.0% 27.0% 29.0% 31.0% 33.0% 35.0% 2015 2016 2017 2018 2019 GAAP Core 59.0% 56.3% 55.3% 52.9% 50.3% 25.0% 30.0% 35.0% 40.0% 45.0% 50.0% 55.0% 60.0% 65.0% 2015 2016 2017 2018 2019 $4.9 $5.6 $10.8 $11.7 $14.4 $6.1 $6.7 $11.1 $12.4 $16.1 $3.0 $4.5 $6.0 $7.5 $9.0 $10.5 $12.0 $13.5 $15.0 $16.5 $18.0 2015 2016 2017 2018 2019 Loans Deposits

(1) Per share information has been adjusted to reflect the effects of the Company’s two - for - one stock split, which occurred on Febr uary 8, 2018. Note: Core figures exclude non - core income and expense items (e.g., early retirement program costs, gain on early retirement of trust preferred securities, gain on sale of banking operations, gain on sale of insurance lines of business, loss on FDIC loss - share termination, donation to the Simmons Foundation, one - time tax adjus tment, merger related costs and branch right - sizing costs). Core figures, as well as figures based on tangible common equity (which excludes goodwill and other intangible assets), are non - GAAP measurements. See Appendix for non - GAAP reconciliations. Performance Trends 8 ROA DILUTED EPS (1) NET INCOME ($ IN MILLIONS) ROTCE 1.03% 1.25% 0.92% 1.37% 1.33% 1.25% 1.31% 1.18% 1.40% 1.51% 0.40% 0.60% 0.80% 1.00% 1.20% 1.40% 1.60% 2015 2016 2017 2018 2019 GAAP Core $1.31 $1.56 $1.33 $2.32 $2.41 $1.59 $1.64 $1.70 $2.37 $2.73 $- $0.50 $1.00 $1.50 $2.00 $2.50 $3.00 2015 2016 2017 2018 2019 GAAP Core $74 $97 $93 $216 $238 $90 $101 $119 $220 $270 $50 $100 $150 $200 $250 $300 2015 2016 2017 2018 2019 GAAP Core 12.53% 13.92% 11.26% 18.44% 17.99% 15.05% 14.56% 14.28% 18.81% 20.31% 5.00% 7.00% 9.00% 11.00% 13.00% 15.00% 17.00% 19.00% 21.00% 23.00% 2015 2016 2017 2018 2019 ROTCE Core

14.2% 13.5% 9.8% 10.2% 10.8% 4.0% 5.0% 6.0% 7.0% 8.0% 9.0% 10.0% 11.0% 12.0% 13.0% 14.0% 15.0% 2015 2016 2017 2018 2019 16.0% 14.5% 9.8% 10.2% 10.8% 3.0% 5.0% 7.0% 9.0% 11.0% 13.0% 15.0% 17.0% 2015 2016 2017 2018 2019 16.7% 15.1% 11.4% 13.3% 13.6% 9.0% 10.0% 11.0% 12.0% 13.0% 14.0% 15.0% 16.0% 17.0% 18.0% 2015 2016 2017 2018 2019 11.2% 11.0% 9.2% 8.8% 9.6% 4.0% 5.0% 6.0% 7.0% 8.0% 9.0% 10.0% 11.0% 12.0% 2015 2016 2017 2018 2019 (1) As of December 31, unless otherwise noted. Regulatory Capital Ratios 9 TIER 1 LEVERAGE RATIO (1) TOTAL RISK - BASED CAPITAL RATIO (1) TIER 1 RISK - BASED CAPITAL RATIO (1) CET1 CAPITAL RATIO (1) Well Cap. 5.0% Well Cap. 8.0% Well Cap. 6.5% Well Cap. 10.0%
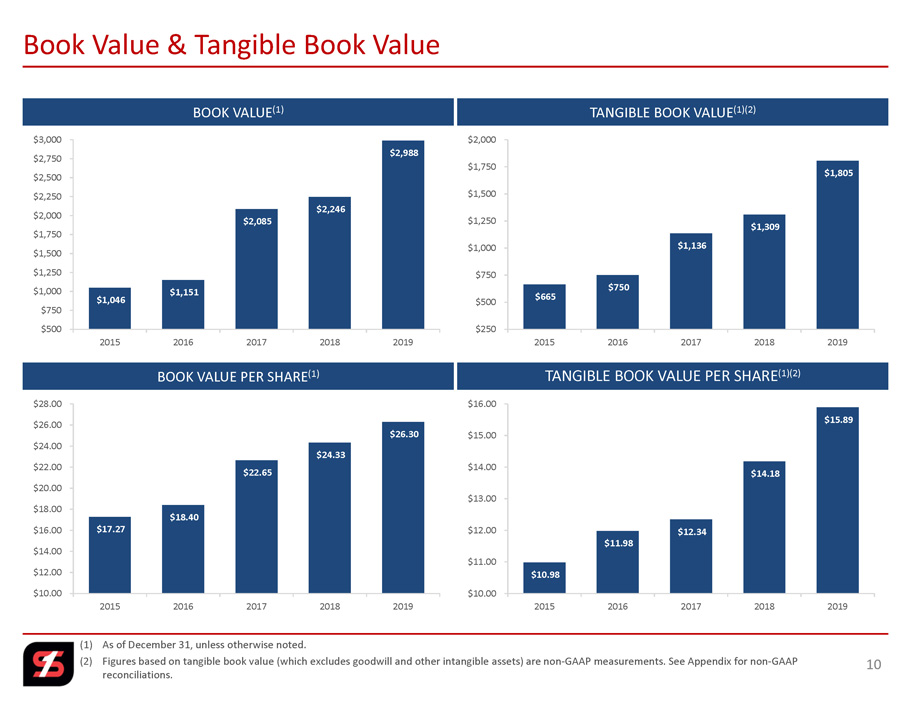
(1) As of December 31, unless otherwise noted. (2) Figures based on tangible book value (which excludes goodwill and other intangible assets) are non - GAAP measurements. See Append ix for non - GAAP reconciliations. Book Value & Tangible Book Value 10 BOOK VALUE (1) TANGIBLE BOOK VALUE PER SHARE (1)(2) BOOK VALUE PER SHARE (1) TANGIBLE BOOK VALUE (1)(2) $1,046 $1,151 $2,085 $2,246 $2,988 $500 $750 $1,000 $1,250 $1,500 $1,750 $2,000 $2,250 $2,500 $2,750 $3,000 2015 2016 2017 2018 2019 $17.27 $18.40 $22.65 $24.33 $26.30 $10.00 $12.00 $14.00 $16.00 $18.00 $20.00 $22.00 $24.00 $26.00 $28.00 2015 2016 2017 2018 2019 $665 $750 $1,136 $1,309 $1,805 $250 $500 $750 $1,000 $1,250 $1,500 $1,750 $2,000 2015 2016 2017 2018 2019 $10.98 $11.98 $12.34 $14.18 $15.89 $10.00 $11.00 $12.00 $13.00 $14.00 $15.00 $16.00 2015 2016 2017 2018 2019

(1) As of December 31, 2019. (2) Includes credit card, indirect lending, and equipment finance (nationwide). (3) 47% tied to Prime; 33% tied to LIBOR; 21% tied to other indices. Loan Portfolio (1) 11 TOTAL LOAN PORTFOLIO $14.4 billion Agriculture 1.3% Credit Card 1.4% Consumer 1.7% Construction 15.6% Single Family Residential 16.7% Commercial Real Estate 44.1% Commercial 17.0% Other 2.1% Total % of $ in billions Loans Total Arkansas Division 1.4$ 9.7% Central Arkansas Division 0.7 4.7% Western Division 1.9 13.2% Tennessee Division 1.5 10.4% Texas Division 3.8 26.4% Colorado Division 0.1 0.8% Missouri Division 3.2 22.3% Other⁽²⁾ 1.8 12.5% % of Re-Pricing Total Variable, Adj. or Fixed < 1 Year Maturity⁽³⁾ 55% Fixed Rate 45% % of CRE-Loans Total Owner Occupied 24% Non-Owner Occupied 76% % of Loan Concentration Total Capital C&D 98% CRE 293%

Loan Growth 12 Linked Quarter Growth On a linked - quarter basis (December 31, 2019 compared to September 30, 2019), total loans increased $1.4 billion, or 10.9%, from the fourth quarter merger with The Landrum Company. The increase was partially offset by the reclassification of $260 million in loan balances associated with south Texas branches held for sale. Quarter-over-Quarter Growth Linked Quarter GrowthQ4 Q4 Change Change Q3 Q4 Change Change $ in millions 2018 2019 $ % 2019 2019 $ % Legacy Loans, including acquired migrated 8,430$ 9,630$ 1,200$ 14.23% 9,643$ 9,630$ (13)$ (0.13%) Acquired Loans, net of discounts 3,293 4,796 1,503 45.64% 3,360 4,796 1,436 42.73% Total Loans, net of discounts 11,723$ 14,426$ 2,703$ 23.06% 13,003$ 14,426$ 1,423$ 10.94%
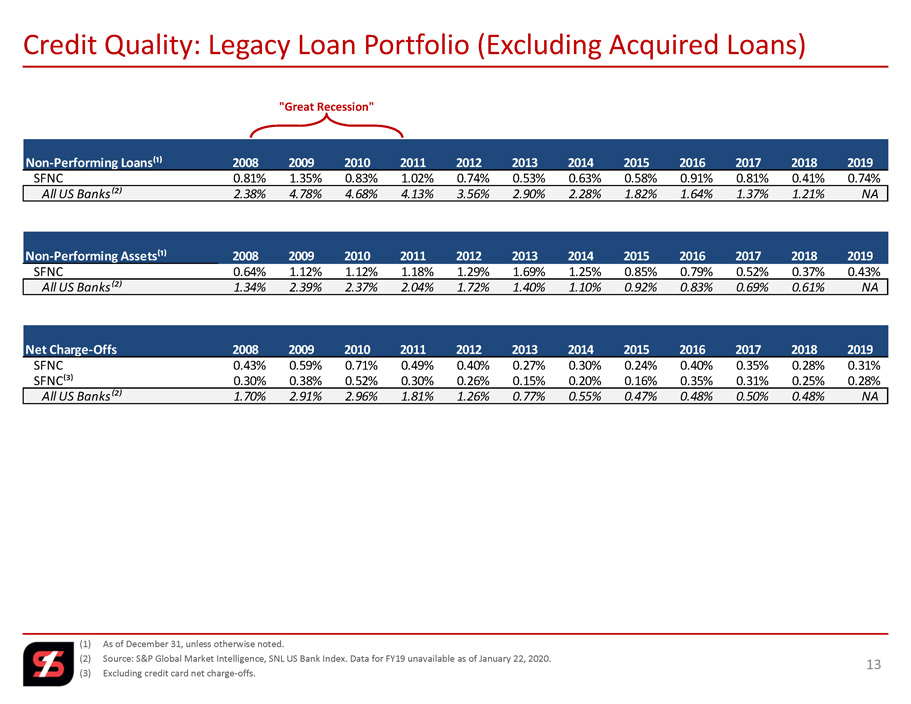
(1) As of December 31, unless otherwise noted. (2) Source: S&P Global Market Intelligence, SNL US Bank Index. Data for FY19 unavailable as of January 22, 2020. (3) Excluding credit card net charge - offs. Credit Quality: Legacy Loan Portfolio (Excluding Acquired Loans) 13 "Great Recession" Non-Performing Loans⁽¹⁾ 2008 2009 2010 2011 2012 2013 2014 2015 2016 2017 2018 2019 SFNC 0.81% 1.35% 0.83% 1.02% 0.74% 0.53% 0.63% 0.58% 0.91% 0.81% 0.41% 0.74% All US Banks⁽²⁾ 2.38% 4.78% 4.68% 4.13% 3.56% 2.90% 2.28% 1.82% 1.64% 1.37% 1.21% NA Non-Performing Assets⁽¹⁾ 2008 2009 2010 2011 2012 2013 2014 2015 2016 2017 2018 2019 SFNC 0.64% 1.12% 1.12% 1.18% 1.29% 1.69% 1.25% 0.85% 0.79% 0.52% 0.37% 0.43% All US Banks⁽²⁾ 1.34% 2.39% 2.37% 2.04% 1.72% 1.40% 1.10% 0.92% 0.83% 0.69% 0.61% NA Net Charge-Offs 2008 2009 2010 2011 2012 2013 2014 2015 2016 2017 2018 2019 SFNC 0.43% 0.59% 0.71% 0.49% 0.40% 0.27% 0.30% 0.24% 0.40% 0.35% 0.28% 0.31% SFNC⁽³⁾ 0.30% 0.38% 0.52% 0.30% 0.26% 0.15% 0.20% 0.16% 0.35% 0.31% 0.25% 0.28% All US Banks⁽²⁾ 1.70% 2.91% 2.96% 1.81% 1.26% 0.77% 0.55% 0.47% 0.48% 0.50% 0.48% NA

Credit Quality: Loan & Credit Coverage 14 Upon acquisition of a portfolio, all loans are considered acquired and have a credit mark (loan discount) in place to cover potential exposure . When an acquired, non - impaired loan is renewed or otherwise is re - underwritten for a formal modification or change in terms, the loan is then considered a legacy credit (migrated loan) and is expected to conform to current policy guidelines . Acquired, impaired loans remain in the acquired pools for the life of the loan regardless of renewal or modification status . Migrated loans that convert to the legacy portfolio are considered to be of acceptable risk to the bank and are subject to ALLL methodology . As with newly originated loans, acceptable credit risk loans require a lower ALLL allocation than those with a higher level of risk . Therefore, our ALLL to total loans ratio has declined, as the quality of loans subject to our ALLL methodology has improved . When acquired loan credit mark is included, our total coverage ratio remains 1 . 07 % . Acquired Loan Migration Actual $ in millions Dec 31, '19 Coverage Legacy Loan Portfolio 9,630$ Allowance for Loan Loss (67.8) 0.70% Loans acquired 4,883$ Loan discount / acquired ALLL (87.7) 1.80% Total Loans, before discounts 14,513$ Total allowance for loan loss and loan discount (155.5) 1.07%
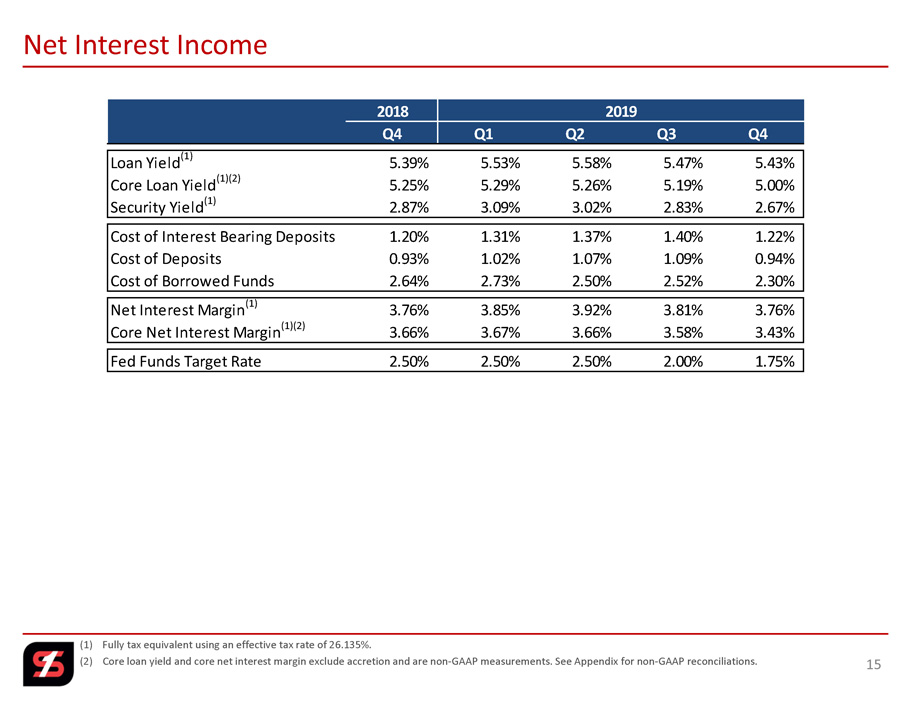
(1) Fully tax equivalent using an effective tax rate of 26.135%. (2) Core loan yield and core net interest margin exclude accretion and are non - GAAP measurements. See Appendix for non - GAAP reconcil iations. Net Interest Income 15 2018 2019 Q4 Q1 Q2 Q3 Q4 Loan Yield (1) 5.39% 5.53% 5.58% 5.47% 5.43% Core Loan Yield (1)(2) 5.25% 5.29% 5.26% 5.19% 5.00% Security Yield (1) 2.87% 3.09% 3.02% 2.83% 2.67% Cost of Interest Bearing Deposits 1.20% 1.31% 1.37% 1.40% 1.22% Cost of Deposits 0.93% 1.02% 1.07% 1.09% 0.94% Cost of Borrowed Funds 2.64% 2.73% 2.50% 2.52% 2.30% Net Interest Margin (1) 3.76% 3.85% 3.92% 3.81% 3.76% Core Net Interest Margin (1)(2) 3.66% 3.67% 3.66% 3.58% 3.43% Fed Funds Target Rate 2.50% 2.50% 2.50% 2.00% 1.75%

($ in Millions) Purchase Accounting Accretion & Loan Discount 16 HISTORICAL LOAN DISCOUNT BALANCE & ACCRETION INCOME 2020 SCHEDULED ACCRETION $7.3 $10.1 $5.9 $8.8 Q1 (Estimated) Q2 (Estimated) Q4 (Estimated) Q3 (Estimated) FY20 (Estimated) $32.1 $112.0 $114.1 $77.2 $55.7 $35.5 $89.3 $49.3 $87.3 $17.3 $39.6 $37.5 $46.1 $24.3 $27.8 $35.3 $41.2 $- $10.0 $20.0 $30.0 $40.0 $50.0 $- $20.0 $40.0 $60.0 $80.0 $100.0 $120.0 2012 2013 2014 2015 2016 2017 2018 2019 Loan Discount Balance Accretion Income

(1) Purchase price and ratios as of closed date. Source: S&P Global Market Intelligence. (2) Metropolitan was acquired from Section 363 Bankruptcy. (3) Expected conversion date. Acquisitions Since 2013 17 2013 – 2014 Consolidated eight charters to one National to State Charter Conversion (Fed Member Bank) 2015 2016 2017 2019 $ in millions System Total Trust Purchase Price / Estimated Bank Announced Closed Conversion Assets AUM Price⁽¹⁾ Earnings⁽¹⁾ Book Value⁽¹⁾ TBV⁽¹⁾ Cost Savings Metropolitan National Bank⁽²⁾ Sep-13 Nov-13 Mar-14 973$ 370$ 54$ 12.5 x 88% 89% 40% Delta Trust & Bank Mar-14 Aug-14 Oct-14 422 815 67 14.9 x 153% 157% 35% First State Bank May-14 Feb-15 Sep-15 1,934 - 272 12.2 x 167% 170% 20% Liberty Bank May-14 Feb-15 Apr-15 1,081 - 213 12.1 x 191% 198% 25% Trust Company of the Ozarks Apr-15 Oct-15 Jan-16 15 1,100 24 NA NA NA 15% Citizens National Bank May-16 Sep-16 Oct-16 557 200 82 18.0 x 130% 130% 25% Hardeman County Investments Nov-16 May-17 Sep-17 476 - 71 17.4 x 138% 179% 30% Southwest Bancorp, Inc (OKSB) Dec-16 Oct-17 May-18 2,621 - 532 24.7 x 180% 190% 35% First Texas BHC, Inc. Jan-17 Oct-17 Feb-18 2,379 430 461 23.2 x 192% 228% 32% Reliance Bancshares, Inc. Nov-18 Apr-19 Apr-19 1,534 - 166 NA 169% 169% 30% The Landrum Company Jul-19 Oct-19 Feb-20⁽³⁾ 3,407 - 416 12.9 x 165% 165% 35%

(1) The ratings provided by KBRA are subject to revision or withdrawal by KBRA at any time and are not recommendations to buy, se ll or hold these securities. Each rating should be evaluated independently of any other rating. Subordinated Debt Offering & Kroll Rating 18 SENIOR UNSECURED DEBT SHORT - TERM DEBT SUBORDINATED DEBT SENIOR UNSECURED DEBT SHORT - TERM DEBT SUBORDINATED DEBT SHORT - TERM DEPOSIT DEPOSIT BBB+ BBB K2 SIMMONS FIRST NATIONAL CORPORATION SIMMONS BANK A - A - BBB+ K2 K2 SUBORDINATED DEBT OFFERING ▪ On March 21, 2018, SFNC announced pricing of $330 million aggregate principal amount of 5.00% Fixed - to - Floating Rate Subordinated Notes due 2028 ▪ $232.3 million of net proceeds from sale of the Notes to repay outstanding indebtedness and the remainder for general corpora te purposes ▪ On March 15, 2019, Kroll Bond Rating Agency (“KBRA”) reaffirmed its ratings of the Company's debt securities as follows: (1) KROLL BOND RATING AGENCY
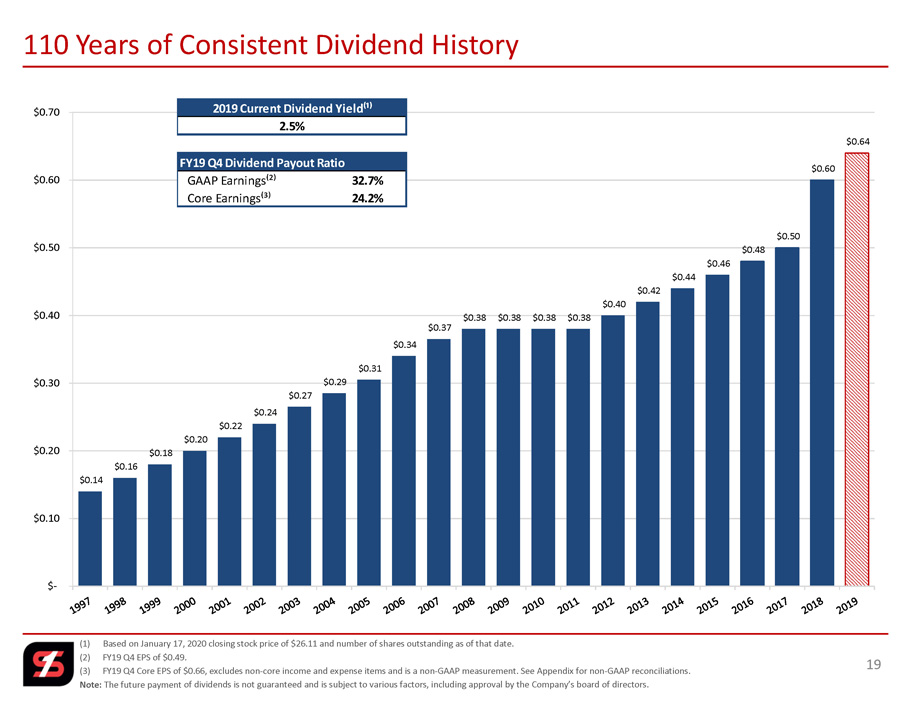
$0.14 $0.16 $0.18 $0.20 $0.22 $0.24 $0.27 $0.29 $0.31 $0.34 $0.37 $0.38 $0.38 $0.38 $0.38 $0.40 $0.42 $0.44 $0.46 $0.48 $0.50 $0.60 $0.64 $- $0.10 $0.20 $0.30 $0.40 $0.50 $0.60 $0.70 (1) Based on January 17, 2020 closing stock price of $26.11 and number of shares outstanding as of that date. (2) FY19 Q4 EPS of $0.49. (3) FY19 Q4 Core EPS of $0.66, excludes non - core income and expense items and is a non - GAAP measurement. See Appendix for non - GAAP r econciliations. Note: The future payment of dividends is not guaranteed and is subject to various factors, including approval by the Company’s boar d of directors. 110 Years of Consistent Dividend History 19 2019 Current Dividend Yield⁽¹⁾ 2.5% FY19 Q4 Dividend Payout Ratio GAAP Earnings⁽²⁾ 32.7% Core Earnings⁽³⁾ 24.2%

(15.0%) (10.0%) (5.0%) 0.0% 5.0% 10.0% 15.0% 20.0% 25.0% 30.0% 35.0% 40.0% 45.0% 50.0% 55.0% 60.0% 65.0% 70.0% 75.0% 80.0% Dividend + Stock Appreciation (12/31/14 – 12/31/19) Note: Based on December 31, 2019 closing stock price of $26.79. Source: S&P Global Market Intelligence 5 Year Total Shareholder Return 20 SFNC 46.1% SNL Mid Cap Bank 51.7%

(100.0%) (80.0%) (60.0%) (40.0%) (20.0%) 0.0% 20.0% 40.0% 60.0% 80.0% 100.0% 120.0% 140.0% 160.0% 180.0% 200.0% 220.0% 240.0% 260.0% Dividend + Stock Appreciation (12/31/07 – 12/31/19) Note: Based on December 31, 2019 closing stock price of $26.79. Source: S&P Global Market Intelligence Long - term Shareholder Return 21 SFNC 173.0% SNL Mid Cap Bank 16.5%

(1) LTM Core EPS excludes non - core income and expense items and is a non - GAAP measurement. See Appendix for non - GAAP reconciliations . (2) Based upon the Company’s average six analyst consensus EPS of $2.34 for 2019 and $2.39 for 2020. (3) Tangible book value (which excludes goodwill and other intangible assets) is a non - GAAP measurement. See Appendix for non - GAAP reconciliations. Source: S&P Global Market Intelligence Investment Profile 22 Market Data as of January 17, 2020 SFNC Stock Price 26.11$ 52-Week High 27.87$ 52-Week Low 22.08$ Common Shares Outstanding (millions) 114 Market Capitalization (millions) 2,967 % Institutional Ownership 57% Valuation & Per Share Data Price / LTM EPS 10.8 x Price / LTM Core EPS⁽¹⁾ 9.6 x Price / 2019 Consensus EPS⁽²⁾ 11.2 x Price / 2020 Consensus EPS⁽²⁾ 10.9 x Price / Book Value 1.0 x Price / Tangible Book Value⁽³⁾ 1.6 x

Next Generation Bank Program 23 WHY WHAT ▪ Allows better identification of opportunities for our customers and offer them proactively vs. waiting for our customer to ask for help ▪ Enhanced customer engagement and interaction across all channels, including digital ▪ Data will be more efficiently entered, accurate and accessible ▪ Many processes will be simplified and automated ▪ Intuitive access to information supporting quick, customer centric, profitable decisions ▪ Associates will have rewarding professional opportunities and internal support to grow along - side Simmons Bank ▪ Business - led, comprehensive IT initiative that will provide new systems and improved processes to help achieve Simmons’ position as a banking leader ▪ NGB will occur primarily during 2019 and 2020 EXPECTED BENEFITS ▪ To remain competitive, we must enhance what our current systems and processes can provide – to our customers and our associates COSTS ▪ Approximately $38 million in capitalized costs anticipated in 2019 ▪ Approximately $11.4 million incremental non - interest expense impact for 2019

2020 Strategy 24

Appendix 25

Non - GAAP Reconciliations 26 Q4 Q4 $ in thousands 2015 2016 2017 2018 2019 2018 2019 Calculation of Core Return on Average Assets Net income available to common stockholders 74,107$ 96,790$ 92,940$ 215,713$ 237,828$ 55,646$ 52,709$ Net non-core items, net of taxes, adjustment 15,515 4,619 26,109 4,520 31,738 805 18,365 Core earnings 89,622$ 101,409$ 119,049$ 220,233$ 269,566$ 56,451$ 71,074$ Average total assets 7,164,788$ 7,760,233$ 10,074,951$ 15,771,362$ 17,871,748$ 16,357,753$ 20,041,890$ Return on average assets 1.03% 1.25% 0.92% 1.37% 1.33% 1.35% 1.04% Core return on average assets 1.25% 1.31% 1.18% 1.40% 1.51% 1.37% 1.41% Calculation of Return on Tangible Common Equity Net income available to common stockholders 74,107$ 96,790$ 92,940$ 215,713$ 237,828$ 55,646$ 52,709$ Amortization of intangibles, net of taxes 2,972 3,611 4,659 8,132 8,720 1,952 2,416 Total income available to common stockholders 77,079$ 100,401$ 97,599$ 223,845$ 246,548$ 57,598$ 55,125$ Net non-core items, net of taxes 15,515 4,619 26,109 4,520 31,738 805 18,365 Core earnings 89,622 101,409 119,049 220,233 269,566 56,451 71,074 Amortization of intangibles, net of taxes 2,972 3,611 4,659 8,132 8,720 1,952 2,416 Total core income available to common stockholders 92,594$ 105,020$ 123,708$ 228,365$ 278,286$ 58,403$ 73,490$ Average common stockholders' equity 938,521$ 1,105,775$ 1,390,815$ 2,157,097$ 2,396,024$ 2,211,217$ 2,611,143$ Total average intangibles (323,237) (384,684) (524,349) (943,128) (1,025,635) (938,677) (1,115,315) Average tangible common stockholders' equity 615,284$ 721,091$ 866,466$ 1,213,969$ 1,370,389$ 1,272,540$ 1,495,828$ Return on average common equity 7.90% 8.75% 6.68% 10.00% 9.93% 9.98% 8.01% Return on tangible common equity (non-GAAP) 12.53% 13.92% 11.26% 18.44% 17.99% 17.96% 14.62% Core return on average common equity (non-GAAP) 9.55% 9.17% 8.56% 10.21% 11.25% 10.13% 10.80% Core return on tangible common equity (non-GAAP) 15.05% 14.56% 14.28% 18.81% 20.31% 18.21% 19.49%

(1) Effective tax rate of 26.135% for 2018/2019 and 39.225% for prior periods, adjusted for non - deductible merger - related costs and deferred tax items on P&C insurance sale. (2) Tax adjustment to revalue deferred tax assets and liabilities to account for the future impact of lower corporate tax. Non - GAAP Reconciliations 27 Q4 Q4 $ in thousands 2015 2016 2017 2018 2019 2018 2019 Calculation of Core Earnings Net Income 74,107$ 96,790$ 92,940$ 215,713$ 237,828$ 55,646$ 52,709$ Non-core items Early termination agreements (temp) 2,209 - - - - - - Gain on sale of banking operations (2,110) - - - - - - Gain from early retirement of TRUPS - (594) - - - - - Gain on sale of P&C insurance business - - (3,708) - - - - Loss on FDIC LS termination/Gain on FDIC-assisted transactions 7,476 - - - - - - Donation to Simmons Foundation - - 5,000 - - - - Merger related costs 13,760 4,835 21,923 4,777 36,379 797 24,831 Early Retirement Program - - - - 3,464 - - Branch right sizing 3,144 3,359 169 1,341 3,129 292 37 Tax Effect⁽¹⁾ (8,964) (2,981) (8,746) (1,598) (11,234) (284) (6,503) Net non-core items (before SAB 118 adjustment) 15,515 4,619 14,638 4,520 31,738 805 18,365 SAB 118 adjustment⁽²⁾ - - 11,471 - - - - Core earnings (non-GAAP) 89,622$ 101,409$ 119,049$ 220,233$ 269,566$ 56,451$ 71,074$

(1) Effective tax rate of 26.135% for 2018/2019 and 39.225% for prior periods, adjusted for non - deductible merger - related costs and deferred tax items on P&C insurance sale. (2) Tax adjustment to revalue deferred tax assets and liabilities to account for the future impact of lower corporate tax. Non - GAAP Reconciliations 28 Q4 Q4 $ per Share 2015 2016 2017 2018 2019 2018 2019 Calculation of Diluted Earnings per Share (EPS) Diluted earnings per share 1.31$ 1.56$ 1.33$ 2.32$ 2.41$ 0.60$ 0.49$ Non-core items Early termination agreements (temp) 0.04 - - - - - - Gain on sale of banking operations (0.04) - - - - - - Gain from early retirement of TRUPS - (0.01) - - - - - Gain on sale of P&C insurance business - - (0.04) - - - - Loss on FDIC LS termination/Gain on FDIC-assisted transactions 0.14 - - - - - - Donation to Simmons Foundation - - 0.07 - - - Merger related costs 0.25 0.08 0.31 0.05 0.37 0.01 0.23 Early Retirement Program - - - - 0.03 - - Branch right sizing 0.06 0.06 - 0.02 0.03 - - Tax effect⁽¹⁾ (0.17) (0.05) (0.13) (0.02) (0.11) - (0.06) Net non-core items (before SAB 118 adjustment) 0.28 0.08 0.21 0.05 0.32 0.01 0.17 SAB 118 adjustment⁽²⁾ - - 0.16 - - - - Diluted core earnings per share (non-GAAP) 1.59$ 1.64$ 1.70$ 2.37$ 2.73$ 0.61$ 0.66$

(1) Efficiency ratio is core non - interest expense before foreclosed property expense and amortization of intangibles as a percent of net interest income (fully taxable equivalent) and noninterest revenues, excluding gains and losses from securities transactions and non - core items. Non - GAAP Reconciliations 29 Q4 Q4 $ in thousands 2015 2016 2017 2018 2019 2018 2019 Calculation of Efficiency Ratio Non-interest expense 256,970$ 255,085$ 312,379$ 392,229$ 461,112$ 95,396$ 142,095$ Non-core non-interest expense adjustment (18,747) (8,435) (27,357) (6,118) (42,972) (1,089) (24,868) Other real estate and foreclosure expense adjustment (4,861) (4,389) (3,042) (4,240) (3,282) (1,300) (1,063) Amortization of intangibles adjustment (4,889) (5,942) (7,666) (11,009) (11,805) (2,642) (3,270) Efficiency ratio numerator 228,473$ 236,319$ 274,314$ 370,862$ 403,053$ 90,365$ 112,894$ Net-interest income 278,595$ 279,206$ 354,930$ 552,552$ 605,275$ 137,781$ 167,729$ Non-interest income 94,661 139,382 138,765 143,896 201,509 34,588 44,967 Non-core non-interest income adjustment 5,731 (835) (3,972) - - - - Fully tax-equivalent adjustment 8,517 7,722 7,723 5,297 7,322 1,466 2,172 (Gain) loss on sale of securities (307) (5,848) (1,059) (61) (13,314) (8) (377) Efficiency ratio denominator 387,197$ 419,627$ 496,387$ 701,684$ 800,792$ 173,827$ 214,491$ Efficiency ratio⁽¹⁾ 59.01% 56.32% 55.27% 52.85% 50.33% 51.99% 52.63%
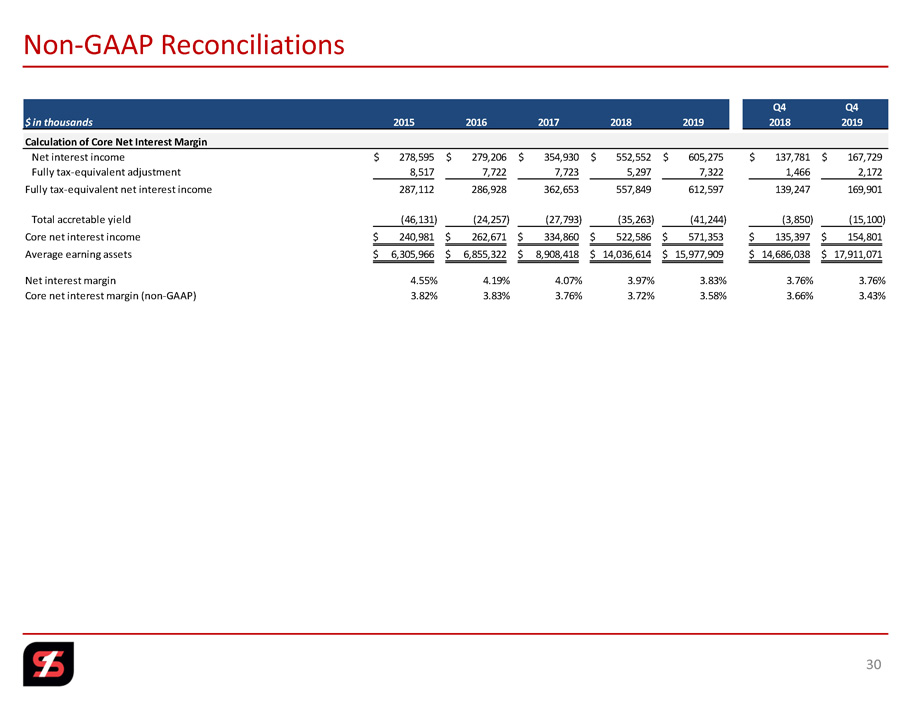
Non - GAAP Reconciliations 30 Q4 Q4 $ in thousands 2015 2016 2017 2018 2019 2018 2019 Calculation of Core Net Interest Margin Net interest income 278,595$ 279,206$ 354,930$ 552,552$ 605,275$ 137,781$ 167,729$ Fully tax-equivalent adjustment 8,517 7,722 7,723 5,297 7,322 1,466 2,172 Fully tax-equivalent net interest income 287,112 286,928 362,653 557,849 612,597 139,247 169,901 Total accretable yield (46,131) (24,257) (27,793) (35,263) (41,244) (3,850) (15,100) Core net interest income 240,981$ 262,671$ 334,860$ 522,586$ 571,353$ 135,397$ 154,801$ Average earning assets 6,305,966$ 6,855,322$ 8,908,418$ 14,036,614$ 15,977,909$ 14,686,038$ 17,911,071$ Net interest margin 4.55% 4.19% 4.07% 3.97% 3.83% 3.76% 3.76% Core net interest margin (non-GAAP) 3.82% 3.83% 3.76% 3.72% 3.58% 3.66% 3.43%

Non - GAAP Reconciliations 31 $ in thousands, except per share and share count 2015 2016 2017 2018 2019 Calculation of Book Value and Tangible Book Value per Share Total common stockholders' equity 1,046,003$ 1,151,111$ 2,084,564$ 2,246,434$ 2,988,157$ Intangible assets: Goodwill (327,686) (348,505) (842,651) (845,687) (1,055,520) Other intangible assets (53,237) (52,959) (106,071) (91,334) (127,340) Total intangibles (380,923) (401,464) (948,722) (937,021) (1,182,860) Tangible common stockholders' equity 665,080$ 749,647$ 1,135,842$ 1,309,413$ 1,805,297$ Shares of common stock outstanding 60,556,864 62,555,446 92,029,118 92,347,643 113,628,601 Book value per common share 17.27$ 18.40$ 22.65$ 24.33$ 26.30$ Tangible book value per common share (non-GAAP) 10.98$ 11.98$ 12.34$ 14.18$ 15.89$ Stock Price as of January 17, 2020 26.11$ Price / Book Value per Share 0.99 x Price / Tangible Book Value per Share 1.64 x

Non - GAAP Reconciliations 32 $ in thousands 2015 2016 2017 2018 2019 Calculation of Non-interest Income to Revenue Net Interest Income 278,595 279,206 354,930 552,552 605,275 Non-interest income 94,661 139,382 138,765 143,896 201,509 Total Revenue (GAAP) 373,256 418,588 493,695 696,448 806,784 Non-interest Income (GAAP) 94,661 139,382 138,765 143,896 201,509 Non-core Items 5,731 (835) (3,972) - - Core Non-interest Income (non-GAAP) 100,392 138,547 134,793 143,896 201,509 Net Interest Income 278,595 279,206 354,930 552,552 605,275 Core Non-interest Income (non-GAAP) 100,392 138,547 134,793 143,896 201,509 Core Total Revenue (non-GAAP) 378,987 417,753 489,723 696,448 806,784 Non-interest Income / Revenue (GAAP) 25.36% 33.30% 28.11% 20.66% 24.98% Core Non-interest Income / Revenue (non-GAAP) 26.49% 33.16% 27.52% 20.66% 24.98%

Non - GAAP Reconciliations 33 Q4 Q1 Q2 Q3 Q4 $ in thousands 2018 2019 2019 2019 2019 Calculation of Core Loan Yield Loan Interest Income 159,996$ 159,440$ 178,122$ 179,971$ 193,402$ Total Accretable Yield (3,850) (6,660) (10,162) (9,322) (15,100) Core Loan Interest Income 156,146 152,780 167,960 170,649 178,302 Average Loan Balance 11,788,838 11,710,075 12,813,274 13,052,943 14,144,259 Core Loan Yield 5.25% 5.29% 5.26% 5.19% 5.00%

34