Attached files
| file | filename |
|---|---|
| EX-99.1 - EXHIBIT 99.1 - Fidelity National Financial, Inc. | tm207083d1_ex99-1.htm |
| EX-2.1 - EXHIBIT 2.1 - Fidelity National Financial, Inc. | tm207083d1_ex2-1.htm |
| 8-K - FORM 8-K - Fidelity National Financial, Inc. | tm207083d1_8k.htm |
Exhibit 99.2

Investor Presentation Fidelity National Financial February 7 th 2020 Acquisition of FGL Holdings

2 Key Transaction Terms Transaction ▪ Fidelity National Financial, Inc. (NYSE: FNF) (“FNF”) to acquire FGL Holdings (NYSE: FG) (“F&G”) for $12.50 per common share representing a diluted equity value of $2.7 billion for 100% of F&G ▪ FNF already owns 7.9% of F&G primary shares ▪ 40% of the transaction, before estimated transaction expenses, is financed through issuance of FNF shares ▪ FNF to purchase all the outstanding F&G Series A preferred stock held by Blackstone GSO for cash ($334mm as of 6/30/20E) and all of the outstanding F&G Series B preferred stock held by FNF subsidiaries for stock ($121mm as of 6/30/20E) ▪ Total financing requirement of $3.3bn, including all outstanding F&G preferred stock as well as estimated fees and expenses, will be funded with $1.3 billion (1) in FNF stock, cash on hand and/or debt Merger Consideration ▪ $12.50 per share of F&G common stock in cash or FNF common stock, subject to an aggregate approximately 60% / 40% cash / stock mix ▪ Fixed exchange ratio of 0.2558x Deal Value ▪ Aggregate fully diluted common equity value of $2.7bn Ownership ▪ ~7.0% of the pro forma company by F&G shareholders Management ▪ F&G executives and senior management to continue in current roles Shareholder Approval ▪ Transaction subject to approval of F&G shareholders ▪ No approval of FNF shareholders required Expected Closing ▪ Q3 2020 ____________________ (1) Approximately $1bn of common stock issued to non - FNF shareholders .

3 Investment Highlights ____________________ (1) Adjusted operating return on common shareholders’ equity, excluding AOCI . In acquiring F&G, FNF gains: • Diversification of FNF's cash and income streams and capitalization away from solely title insurance, in a transaction that is immediately accretive to earnings and cash flow, reduces borrowing cost, and increases the overall value of FNF through risk diversification without integration time or having to rely on synergies • Reduction of risk and volatility thanks to countercyclical F&G income that performs best in a rising long term rate environment versus FNF's income that performs best in falling or low rate environments. F&G thus serves as a counterbalance or hedge to FNF's earnings sensitivity to mortgage rates. This reduces volatility by leveling earnings and ca sh flow and makes them more predictable • Attractive retirement solutions business with strong growth tailwinds: Adjusted operating income to common shareholders for 3Q 2019 increased by 27% over the year ago quarter, while delivering an attractive 19.3% return on equity (1) • An opportunity to participate in a boom in demand for retirement savings and income products propelled by an aging demographic and accommodative government policy • An opportunity to leverage FNF’s strong capital allocation skills and M&A expertise in an adjacent, consolidating insurance industry for sustained, outsized ROI on FCF directed towards acquisitions • A superior management team and a unique relationship with Blackstone which provides meaningful differentiation from competitors FNF will be able to accelerate F&G’s growth by: • Accelerate improvement in financial strength ratings which in turn will open new broker/dealer and bank channels for distribution of its retirement insurance products • Potential for cross - selling opportunities through FNF’s bank channel • Enhancing F&G's capacities to serve as a consolidator in an industry rich with attractive targets

4 Estimated Sources & Uses Uses Cash to F&G shareholders (ex FNF) $1,505 Stock to F&G shareholders (ex FNF) 1,003 Acquisition price of F&G currently not owned by FNF $2,509 Purchase of F&G preferred and common stock from FNF subsidiaries 333 Purchase of F&G preferred stock from GSO (cash) (3) 334 Subtotal $3,175 Estimated transaction expenses 100 Total uses $3,275 Sources Cash consideration (on-hand) $1,000 Cash consideration (debt) 1,003 Common stock issued to F&G shareholders and FNF subsidiaries 1,272 Total sources $3,275 ____________________ Note: Estimated sources & uses based on $12.50 per common share consideration and may vary based on exchange ratio. (1) Approximately $1bn of common stock issued to non - FNF shareholders. (2) Projected preferred stock values as of 6/30/20E including accrued PIK. (3) Represents par value as of 6/30/20E including accrued PIK. ($ in millions) Overview: • FNF to acquire F&G for $12.50 per share representing a diluted equity value of $2.7 billion for 100% of F&G ▪ FNF already owns 7.9% of F&G basic shares ▪ Approximately 40 % of the transaction, before estimated transaction expenses, is financed through issuance of FNF shares • Total financing requirement of $3.3bn, which also includes all outstanding F&G preferred stock as well as estimated fees and expenses, will be funded with $1.3 billion (1) in FNF stock, cash on hand and/or debt • FNF to purchase 100% of the $455mm of preferred stock issued by F&G (2 ) • Estimated Debt / total capitalization at 6/30/2020 ▪ Pre transaction: 12.5% ▪ Post transaction: 26.1%

5 Transaction Impact Earnings ▪ 2020E adjusted EPS: >10% accretion (1) ▪ 2021E adjusted EPS: >20% accretion Leverage ▪ Estimated debt as a % of total capitalization at close: ~26% Dividend s / Buybacks ▪ No change to FNF’s current dividend or buyback policies Financial Strength Ratings (Moody’s / S&P) Current At Announcement FNF A2 / A A2 / A Affirm F&G Baa2 / BBB+ Review for upgrade at announcement with upgrade to Baa1 with a stable outlook at close / CreditWatch placement with positive implications at announcement and likely to raise ratings by one notch at completion ____________________ Source: Moody’s and S&P. (1) Assumes 6/30/20 close. Senior Unsecured Notes Ratings (Moody’s / S&P) Current At Announcement FNF Baa2 / BBB Baa2 / BBB Affirm F&G Ba2 / BB+ NA / CreditWatch placement with positive implications at announcement and likely to raise ratings by one notch at completion
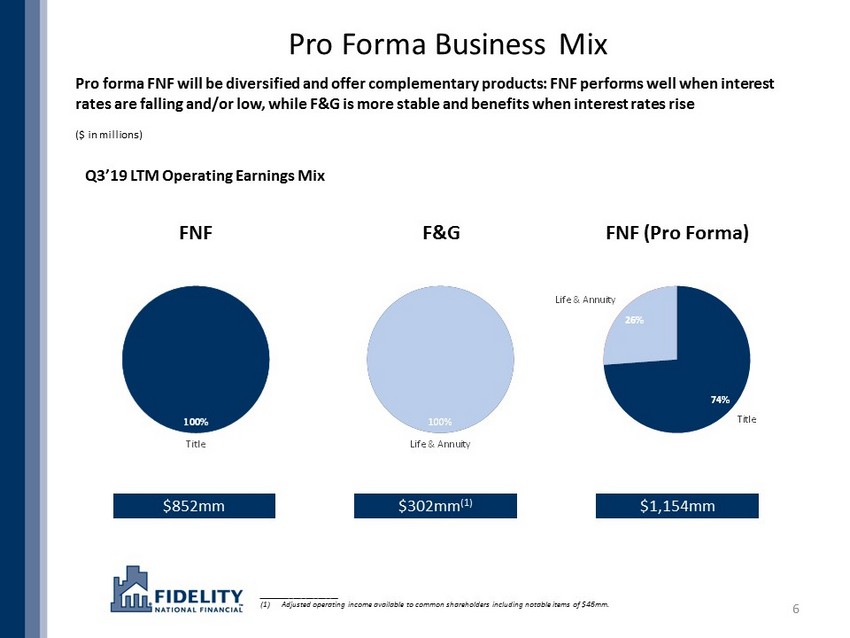
6 Pro Forma Business Mix Pro forma FNF will be diversified and offer complementary products: FNF performs well when interest rates are falling and/or low, while F&G is more stable and benefits when interest rates rise Q3’19 LTM Operating Earnings Mix ($ in millions) ____________________ (1) Adjusted operating income available to common shareholders including notable items of $46mm. FNF F&G FNF (Pro Forma) $852mm $302mm (1) $1,154mm 100% Title 100% Life & Annuity 74% 26% Title Life & Annuity

7 F&G Highlights O v erview (1) Highlights (1) 23% Adjusted Operating Income ( " AOI " ) ( 3 ) CAGR since 2016 19.3% Return on Equity ( " ROE " ) ( 4 ) Approximately 475 % Risk - Based Capital ( " RBC " ) Ratio (1) • F&G is a life and annuity insurance company with a 50+ year history – Operations in Des Moines, IA; Baltimore, MD; Hamilton , Bermuda – Investment portfolio management by The Blackstone Group • Provides retirement & life insurance solutions to nearly 700,000 customers – Fixed Indexed Annuities ( " FIA " ) – Multi - Year Guarantee Annuities ( " MYGA " ) – Indexed Universal Life ( " IUL " ) • Distributes products through an established network of 37,000 licensed agents • Employs ~345 associates dedicated to serving policyholders, distribution partners and shareholders #2 Multiyear Guarantee Annuity ( " MYGA " ) writer in Independent Channel #5 Fixed Indexed Annuity ( " FIA " ) w riter in Independent Channel (2) $2 7.4 bn Investment Portfolio (1) ____________________ (1) As of 3Q19. (2) Source: Wink’s Sales and Market Report, 3 rd Quarter, 2019. (3) Based on AOI available to common shareholders . (4) LTM adjusted operating income return on common equity, excluding AOCI.
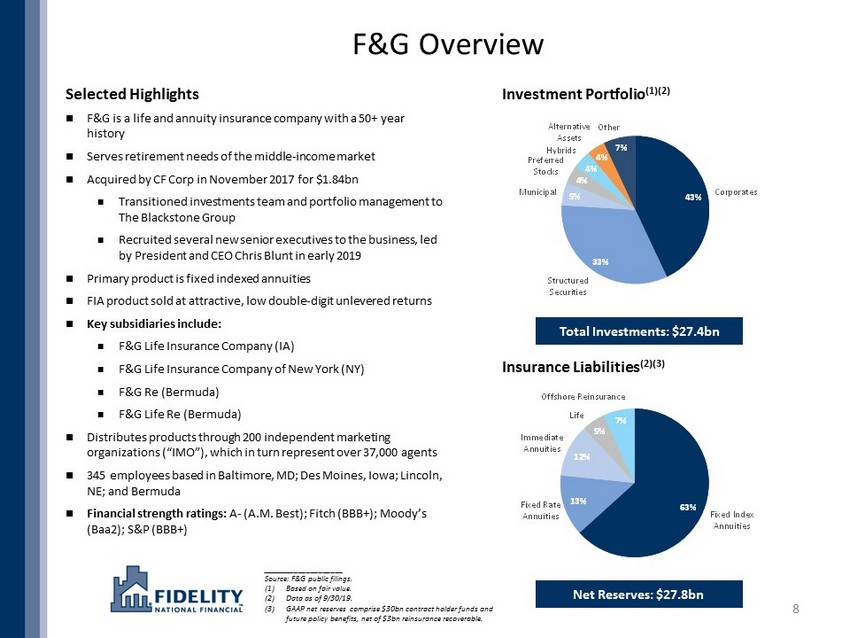
8 Selected Highlights F&G is a life and annuity inssurance company with a 50+ year history Serves retirement needs of the middle - income market Acquired by CF Corp in November 2017 for $1.84bn Transitioned investments team and portfolio management to T he Blackstone Group Recruited several new senior executives to the business, led by President and CEO Chris Blunt in early 2019 Primary product is fixed indexed annuities FIA product sold at attractive, low double - digit unlevered returns Key subsidiaries include: F&G Life Insurance Company (IA) F&G Life Insurance Company of New York (NY) F&G Re (Bermuda) F&G Life Re (Bermuda) Distributes products through 200 independent marketing organizations (“IMO”), which in turn represent over 37,000 agents 345 employees based in Baltimore, MD; Des Moines, Iowa; Lincoln, NE; and Bermuda Financial strength ratings: A - (A.M. Best); Fitch (BBB +); Moody’s (Baa2); S&P (BBB+) ____________________ Source: F&G public filings. (1) Based on fair value. (2) Data as of 9/30/19. (3) GAAP net reserves comprise $30bn contract holder funds and future policy benefits, net of $3bn reinsurance recoverable. Net Reserves: $27.8bn Total Investments: $27.4bn Investment Portfolio (1 )(2) Insurance Liabilities (2)( 3 ) 43% 33% 5% 4% 4% 4% 7% Corporates Structured Securities Municipal Preferred Stocks Hybrids Alternative Assets Other 63% 13% 12% 5% 7% Fixed Index Annuities Fixed Rate Annuities Immediate Annuities Life Offshore Reinsurance F&G Overview
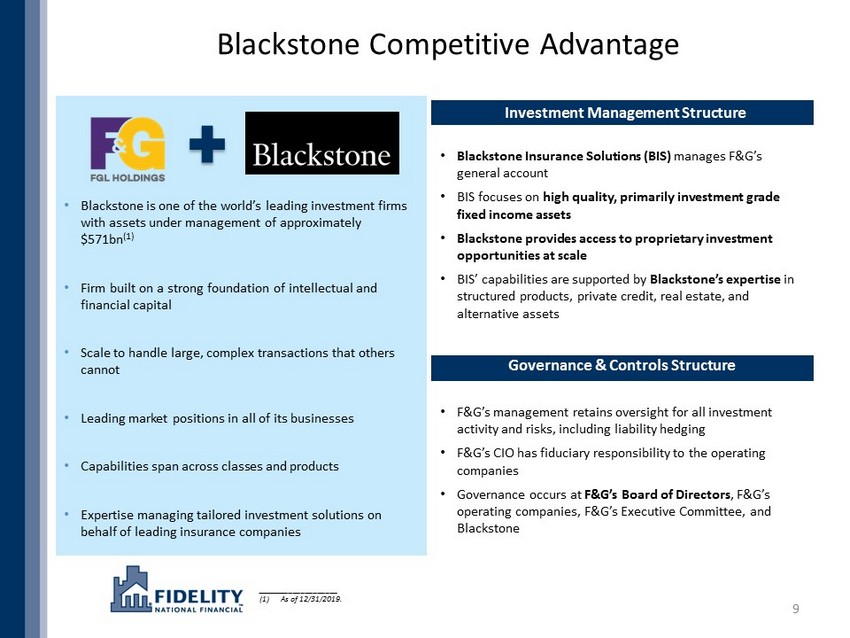
9 Blackstone Competitive Advantage • Blackstone is one of the world’s leading investment firms with assets under management of approximately $ 5 71 bn (1) • Firm built on a strong foundation of intellectual and financial capital • Scale to handle large, complex transactions that others cannot • Leading market positions in all of its businesses • Capabilities span across classes and products • Expertise managing tailored investment solutions on behalf of leading insurance companies • Blackstone Insurance Solutions (BIS) manage s F&G’s general account • BIS focuses on high quality, primarily investment grade fixed income assets • Blackstone provides access to proprietary investment opportunities at scale • BIS ’ capabilities are supported by Blackstone’s expertise in structured products, private credit, real estate, and alternative assets • F&G ’s management retains oversight for all investment activity and risks, including liability hedging • F&G’s CIO has fiduciary responsibility to the operating companies • Governance occurs at F&G ’s Board of Directors , F&G ’s operating companies, F&G ’s Executive Committee , and Blackstone Investment Management Structure Governance & Controls Structure ____________________ (1) As of 12/31/2019.

Premium and other fees $7,541 $216 $7,757 Net investment income 216 1,200 1,416 Total revenue 7,800 1,339 9,139 After-tax adjusted operating income 852 302 1,154 Cash and invested assets 5,432 28,362 33,794 Total assets 10,419 36,117 46,536 Reserves 1,494 31,132 32,626 Market value (2/5/20) 13,790 2,208 15,997 10 Contribution Analysis ($ in millions, as of or for the twelve months ended 9/30/19) ____________________ Source: FactSet, SNL Financial and public company filings. (1) Excludes purchase accounting adjustments. (2) AOI available to common shareholders and includes notable items of $ 46mm. (3) Based on 9/30/19 diluted shares outstanding per public filings. (1) (3) (2)

11 Investment Highlights ____________________ (1) Adjusted operating return on common shareholders’ equity, excluding AOCI . In acquiring F&G, FNF gains: • Diversification of FNF's cash and income streams and capitalization away from solely title insurance, in a transaction that is immediately accretive to earnings and cash flow, reduces borrowing cost, and increases the overall value of FNF through risk diversification without integration time or having to rely on synergies • Reduction of risk and volatility thanks to countercyclical F&G income that performs best in a rising long term rate environment versus FNF's income that performs best in falling or low rate environments. F&G thus serves as a counterbalance or hedge to FNF's earnings sensitivity to mortgage rates. This reduces volatility by leveling earnings and ca sh flow and makes them more predictable • Attractive retirement solutions business with strong growth tailwinds: Adjusted operating income to common shareholders for 3Q 2019 increased by 27% over the year ago quarter, while delivering an attractive 19.3% return on equity (1) • An opportunity to participate in a boom in demand for retirement savings and income products propelled by an aging demographic and accommodative government policy • An opportunity to leverage FNF’s strong capital allocation skills and M&A expertise in an adjacent, consolidating insurance industry for sustained, outsized ROI on FCF directed towards acquisitions • A superior management team and a unique relationship with Blackstone which provides meaningful differentiation from competitors FNF will be able to accelerate F&G’s growth by: • Accelerate improvement in financial strength ratings which in turn will open new broker/dealer and bank channels for distribution of its retirement insurance products • Potential for cross - selling opportunities through FNF’s bank channel • Enhancing F&G's capacities to serve as a consolidator in an industry rich with attractive targets
12 Appendix

13 F&G Product Overview F&G’s diverse product offering leverages the company’s core competencies Fixed Indexed Annuities ("FIAs") • Type of deferred annuity product that is linked to the performance of a specific market index (predominantly S&P 500) • Flagship product with consumer value, risk mitigation and profitability in all economic environments • F&G has a well - established franchise and effectively manages sales volumes within its capital & profit targets $2.7bn Multi - Year Guaranteed Annuities ("MYGA") • Type of deferred annuity product in which the initial crediting rate is guaranteed for a specified number of years • Strong sales without episodic volume of the past • Competitive MYGA initiatives are supported by proprietary asset sourcing relationships $0.8bn Indexed Universal Life ("IUL") • Life Insurance policy for which earned returns are credited to policyholder’s cash value account • Ongoing efforts to grow IUL through network of core middle market focused IMOs • Core Network Marketing Groups continue to grow as anticipated $0.04bn Q3 19 LTM Sales

14 F&G In - Force Book F&G’s attractive liability profile reflects prudent in - force management GAAP Net Reserves ( 1 )( 2) • Primarily FIAs and FAs; with growing indexed life book • Asset and liability cash flows are well matched • Surrender charges and market value adjustments protect against disintermediation in rising interest rate environment • During accumulation, customer’s money credited with interest linked to an index strategy (i.e. S&P 500 ) • New business and in - force actively managed to maintain pricing IRR targets • Distance between current and guaranteed crediting cost allows flexibility to maintain spreads as needed Liability Profile Annuity Metrics ( 1) Fixed Annuities Weighted - average life (3) 6 years % Surrender charge protected 86% Average remaining surrender charge (% of account value) 8% % Subject to Market Value Adjustment ( " MVA " ) 55% Average cost of option cost/interest credited 2.1% Distance to guaranteed minimum crediting rates 87 bps $17.6 $3.7 $3.2 $1.4 $1.9 Fixed Index Annuities Fixed Rate Annuities Immediate Annuities Life Offshore Reinsurance ~$28bn ____________________ (1) 3Q19 ended 9/30/19 and where applicable, crediting costs and distance consider the spot costs of index and fixed credit . (2) GAAP net reserves comprised $30bn contract holder funds and future policy benefits, net of $3bn reinsurance recoverable. (3) Reflects effective duration of liabilities.

15 F&G Investment Portfolio Overview ____________________ Note : GAAP Fair Values as of 3Q19 on a consolidated basis. 43% 33% 5% 4% 4% 4% 7% Corporates Structured Securities Municipal Preferred Stocks Hybrids Alternative Assets Other 54% 40% 5% 1% < 1% NAIC 1 NAIC 2 NAIC 3 NAIC 4 NAIC 5 & 6 Investment Portfolio by Asset Class Fixed Maturity Securities by NAIC Designation ~$24bn ~$27bn Portfolio remains conservatively positioned and well matched to F&G’s liability profile • Portfolio remains high quality and well diversified – Fixed - income portfolio 94% investment grade – LTM GAAP yield (annualized): 4.47% • ALM profile remains conservative – Asset / liability duration well - balanced – Floating rate exposure offers flexibility for rising rates • Portfolio diversification is designed to offer downside protection while seeking to improve capital efficiency/earned yield – Private credit = covenant protection/structural seniority – EMD = geographic diversification/superior Portfolio Strategy / Investment Philosophy F&G is leveraging the Blackstone partnership to improve portfolio yield and asset diversification • Since 12/31/17, net portfolio yield has increased by 26 bps ; corporate credit exposure has decreased by 12% • Reliance on corporate credit assets to drive overall yield has declined ; structured assets now reflect 33% of total portfolio mix • Inclusion of well - underwritten structured credit has strengthened stress test results Blackstone Partnership • Achieved significant yield uplift while maintaining credit quality • Prudent portfolio repositioning and product enhancements Results

16 Sustained Spread Margins F&G has shown a consistent ability to generate margins despite challenging environments Despite volatility in interest rates , F&G has a long track record of consistently managing FIA core spread • Ability to continuously re - price in - force annually by managing cost of crediting and caps • New business can be re - priced monthly , further mitigating interest rate impact on spread • Maintaining pricing discipline to achieve or exceed targeted lifetime returns • Partnership with Blackstone enhances investment yield while maintaining credit quality and broadening asset diversification FIA Core Spread (1 ) vs . 10 - Year UST Yield 298 299 307 304 290 325 2014 2015 2016 2017 2018 2019YTD 100 150 200 250 300 350 -- 0.5% 1.0% 1.5% 2.0% 2.5% 3.0% 3.5% bps FIA Core Spread 10 - Year UST Yield ____________________ (1) FIA Core Investment Spread excludes PGAAP amortization and expenses as well as bond prepayment and other income; 2019 YTD as of 3Q19 .