Attached files
Washington, D.C. 20549
Form 10-K
(Mark One) | |
R | ANNUAL REPORT PURSUANT TO SECTION 13 OR 15(d) OF THE SECURITIES EXCHANGE ACT OF 1934 |
For the Fiscal Year Ended December 31, 2015 | |
or
o | TRANSITION REPORT PURSUANT TO SECTION 13 OR 15(d) OF THE SECURITIES EXCHANGE ACT OF 1934 |
Commission File No. 1-32630
_________________________________
Fidelity National Financial, Inc.
(Exact name of registrant as specified in its charter)
Delaware | 16-1725106 | |
(State or other jurisdiction of incorporation or organization) | (I.R.S. Employer Identification No.) | |
601 Riverside Avenue Jacksonville, Florida 32204 (Address of principal executive offices, including zip code) | (904) 854-8100 (Registrant’s telephone number, including area code) | |
Securities registered pursuant to Section 12(b) of the Act:
Title of Each Class | Name of Each Exchange on Which Registered | |
Common Stock, $0.0001 par value | New York Stock Exchange | |
Securities registered pursuant to Section 12(g) of the Act: None
Indicate by check mark if the registrant is a well-known seasoned issuer, as defined in Rule 405 of the Securities Act. Yes þ No o
Indicate by check mark if the registrant is not required to file reports pursuant to Section 13 or Section 15(d) of the Act. Yes o No þ
Indicate by check mark whether the registrant (1) has filed all reports required to be filed by Section 13 or 15(d) of the Securities Exchange Act of 1934 during the preceding 12 months (or for such shorter period that the registrant was required to file such reports), and (2) has been subject to such filing requirements for the past 90 days. Yes þ No o
Indicate by check mark whether the registrant has submitted electronically and posted on its corporate Web site, if any, every Interactive Data File required to be submitted and posted pursuant to Rule 405 of Regulation S-T (§ 232.405 of this chapter) during the preceding 12 months (or for such shorter period that the registrant was required to submit and post such files). Yes þ No o
Indicate by check mark if disclosure of delinquent filers pursuant to Item 405 of Regulation S-K (§ 229.405) is not contained herein, and will not be contained, to the best of registrant’s knowledge, in definitive proxy or information statements incorporated by reference in Part III of this Form 10-K, or any amendment to this Form 10-K. þ
Indicate by check mark whether the registrant is a large accelerated filer, an accelerated filer, a non-accelerated filer, or a smaller reporting company. See the definitions of “large accelerated filer,” “accelerated filer” and “smaller reporting company” in Rule 12b-2 of the Exchange Act. (Check one):
Large accelerated filer þ | Accelerated filer o | Non-accelerated filer o (Do not check if a smaller reporting company) | Smaller reporting company o | |||
Indicate by check mark whether the registrant is a shell company (as defined in Rule 12b-2 of the Exchange Act). Yes o No þ
The aggregate market value of the shares of the FNF Group and FNFV Group common stock held by non-affiliates of the registrant as of June 30, 2015 was $9,851,084,436 and $1,109,029,038, respectively, based on the closing price of $36.99 and $15.38, respectively, as reported by The New York Stock Exchange.
As of January 31, 2016 there were 275,555,941 shares of FNF Group common stock outstanding and 71,842,882 shares of FNFV Group common stock outstanding.
The information in Part III hereof for the fiscal year ended December 31, 2015, will be filed within 120 days after the close of the fiscal year that is the subject of this Report.
FIDELITY NATIONAL FINANCIAL, INC.
FORM 10-K
TABLE OF CONTENTS
Page Number | ||
i
PART I
Item 1. | Business |
We have organized our business into two groups, FNF Core Operations and FNF Ventures ("FNFV").
Through our Core Operations, FNF is a leading provider of (i) title insurance, escrow and other title related services, including collection and trust activities, trustee sales guarantees, recordings and reconveyances and home warranty insurance and (ii) technology and transaction services to the real estate and mortgage industries. FNF is the nation’s largest title insurance company operating through its title insurance underwriters - Fidelity National Title Insurance Company, Chicago Title Insurance Company, Commonwealth Land Title Insurance Company, Alamo Title Insurance and National Title Insurance of New York Inc. - that collectively issue more title insurance policies than any other title company in the United States. Through our subsidiary ServiceLink Holdings, LLC ("ServiceLink"), we provide mortgage transaction services including title-related services and facilitation of production and management of mortgage loans. FNF also provides industry-leading mortgage technology solutions, including MSP®, the leading residential mortgage servicing technology platform in the U.S., through its majority-owned subsidiary, Black Knight Financial Services, Inc. ("Black Knight").
Through our FNFV group, we own majority and minority equity investment stakes in a number of entities, including American Blue Ribbon Holdings, LLC ("ABRH"), Ceridian HCM, Inc. and Fleetcor Technologies, Inc. (collectively "Ceridian") and Digital Insurance, Inc. ("Digital Insurance").
As of December 31, 2015, we had the following reporting segments:
FNF Core Operations
• | Title. This segment consists of the operations of our title insurance underwriters and related businesses. This segment provides core title insurance and escrow and other title related services including collection and trust activities, trustee sales guarantees, recordings and reconveyances, and home warranty insurance. This segment also includes the transaction services business acquired from Lender Processing Services, Inc. ("LPS"), now combined with our ServiceLink business. Transaction services include other title-related services used in the production and management of mortgage loans, including mortgage loans that experience default. |
• | Black Knight. This segment consists of the operations of Black Knight, which, through leading software systems and information solutions, provides mission critical technology and data and analytics services that facilitate and automate many of the business processes across the life cycle of a mortgage. |
• | FNF Core Corporate and Other. This segment consists of the operations of the parent holding company, certain other unallocated corporate overhead expenses, and other smaller real estate and insurance-related operations. |
FNFV
• | Restaurant Group. This segment consists of the operations of ABRH, in which we have a 55% ownership interest. ABRH and its affiliates are the owners and operators of the O'Charley's, Ninety Nine Restaurants, Max & Erma's, Village Inn, Bakers Square, and Legendary Baking concepts. This segment also includes the results of J. Alexander's, Inc. ("J. Alexander's") through September 28, 2015, the date it was distributed to FNFV shareholders. See the Recent Developments section in Item 7 for further discussion of the distribution of J. Alexander's. On January 25, 2016, substantially all of the assets of the Max & Erma's restaurant concept were sold pursuant to an Asset Purchase Agreement. |
• | FNFV Corporate and Other. This segment primarily consists of our share in the operations of certain equity investments, including Ceridian, as well as consolidated investments, including Digital Insurance, in which we own 96%, and other smaller operations which are not title related. |
Competitive Strengths
We believe that our competitive strengths include the following:
Corporate principles. A cornerstone of our management philosophy and operating success is the six fundamental precepts upon which we were founded, which are:
• | Autonomy and entrepreneurship; |
• | Bias for action; |
• | Customer-oriented and motivated; |
• | Minimize bureaucracy; |
• | Employee ownership; and |
• | Highest standard of conduct. |
1
These six precepts are emphasized to our employees from the first day of employment and are integral to many of our strategies described below.
Competitive cost structure. We have been able to maintain competitive operating margins in part by monitoring our businesses in a disciplined manner through continual evaluation of title order activity and management of our cost structure. When compared to our industry competitors, we also believe that our structure is more efficiently designed, which allows us to operate with lower overhead costs.
We believe that our competitive strengths position us well to take advantage of future changes to the real estate market.
Title
Leading title insurance company. We are the largest title insurance company in the United States and a leading provider of title insurance and escrow and other title-related services for real estate transactions. Through the third quarter of 2015, our insurance companies had a 32.9% share of the U.S. title insurance market, according to the American Land Title Association ("ALTA").
Established relationships with our customers. We have strong relationships with the customers who use our title services. Our distribution network, which includes approximately 1,200 direct residential title offices and approximately 5,000 agents, is among the largest in the United States. We also benefit from strong brand recognition in our multiple title brands that allows us to access a broader client base than if we operated under a single consolidated brand and provides our customers with a choice among brands.
Strong value proposition for our customers. We provide our customers with title insurance and escrow and other title-related services that support their ability to effectively close real estate transactions. We help make the real estate closing more efficient for our customers by offering a single point of access to a broad platform of title-related products and resources necessary to close real estate transactions.
Proven management team. The managers of our operating businesses have successfully built our title business over an extended period of time, resulting in our business attaining the size, scope and presence in the industry that it has today. Our managers have demonstrated their leadership ability during numerous acquisitions through which we have grown and throughout a number of business cycles and significant periods of industry change.
Commercial title insurance. While residential title insurance comprises the majority of our business, we are also a significant provider of commercial real estate title insurance in the United States. Our network of agents, attorneys, underwriters and closers that service the commercial real estate markets is one of the largest in the industry. Our commercial network combined with our financial strength makes our title insurance operations attractive to large national lenders that require the underwriting and issuing of larger commercial title policies.
Black Knight
Market leadership with comprehensive and integrated solutions. We are a leading provider of comprehensive and integrated solutions to the mortgage industry. Our solutions are utilized to service approximately 59% of all U.S. first lien mortgages as of December 31, 2015 according to the Black Knight Mortgage Monitor Report and operate one of the industry’s largest exchanges connecting originators, agents, settlement services providers and investors. We believe our leadership position is, in part, the result of our unique expertise and insight developed from over 50 years serving the needs of customers in the mortgage industry. We have used this insight to develop an integrated and comprehensive suite of proprietary technology, data, and analytics solutions to automate many of the mission-critical business processes across the entire mortgage loan life cycle. These integrated solutions are designed to reduce manual processes, assist in improving organizational compliance and mitigating risk, and ultimately deliver significant cost savings to our clients.
Broad and deep client relationships with significant recurring revenue. We have deep and long-standing relationships with our largest clients. We frequently enter into long-term contracts with our mortgage servicing and loan origination clients that contain volume minimums and provide for annual increases. Our products are typically embedded within our clients’ mission-critical workflow and decision processes across various parts of their organizations.
Extensive data assets and analytics capabilities. We develop and maintain large, accurate and comprehensive data sets on the mortgage and housing industry that we believe are competitively differentiated. Our data sets represent metropolitan statistical areas that cover 99.99% of the U.S. population and 96% of all mortgage transactions according to 2012 U.S. census data. Our unique data sets provide a combination of public and proprietary data in real-time and each of our data records feature a large number of attributes. Our data scientists utilize our data sets, subject to any applicable use restrictions, and comprehensive analytical capabilities to create highly customized reports, including models of customer behavior for originators and servicers, portfolio analytics for capital markets and government agencies and proprietary market insights for real estate agencies. Our data and analytics capabilities are also embedded into our technology platform and workflow products, providing our clients with integrated and comprehensive solutions.
2
Scalable and cost effective operating model. We believe we have a highly attractive and scalable operating model derived from our market leadership, hosted technology platforms and the large number of clients we serve across the mortgage industry. Our scalable operating model provides us with significant benefits. Our scale and operating leverage allows us to add incremental clients to our existing platforms with limited incremental cost. As a result, our operating model drives attractive margins and generates significant cash flow. Also, by leveraging our scale and leading market position, we are able to make cost effective investments in our technology platform to meet evolving regulatory and compliance requirements, further increasing our value proposition to clients.
World class management team with depth of experience and track record of success. Our management team has an average of over 20 years of experience in the banking technology and mortgage processing industries and a proven track record of strong execution capabilities. Over the past two years we have significantly improved our operations and enhanced our go-to-market strategy, further integrated our technology platforms, expanded our data and analytics capabilities and introduced several new innovative products. We executed all of these projects while delivering attractive revenue growth and strong profitability.
Strategy
Title
Our strategy in the title business is to maximize operating profits by increasing our market share and managing operating expenses throughout the real estate business cycle. To accomplish our goals, we intend to do the following:
• | Continue to operate multiple title brands independently. We believe that in order to maintain and strengthen our title insurance customer base, we must operate our strongest brands in a given marketplace independently of each other. Our national and regional brands include Fidelity National Title, Chicago Title, Commonwealth Land Title, Lawyers Title, Ticor Title, Alamo Title, and National Title of New York. In our largest markets, we operate multiple brands. This approach allows us to continue to attract customers who identify with a particular brand and allows us to utilize a broader base of local agents and local operations than we would have with a single consolidated brand. |
• | Consistently deliver superior customer service. We believe customer service and consistent product delivery are the most important factors in attracting and retaining customers. Our ability to provide superior customer service and consistent product delivery requires continued focus on providing high quality service and products at competitive prices. Our goal is to continue to improve the experience of our customers, in all aspects of our business. |
• | Manage our operations successfully through business cycles. We operate in a cyclical industry and our ability to diversify our revenue base within our core title insurance business and manage the duration of our investments may allow us to better operate in this cyclical business. Maintaining a broad geographic revenue base, utilizing both direct and independent agency operations and pursuing both residential and commercial title insurance business help diversify our title insurance revenues. We continue to monitor, evaluate and execute upon the consolidation of administrative functions, legal entity structure, and office consolidation, as necessary, to respond to the continually changing marketplace. We maintain shorter durations on our investment portfolio to mitigate our interest rate risk. A more detailed discussion of our investment strategies is included in “Investment Policies and Investment Portfolio.” |
• | Continue to improve our products and technology. As a national provider of real estate transaction products and services, we participate in an industry that is subject to significant change, frequent new product and service introductions and evolving industry standards. We believe that our future success will depend in part on our ability to anticipate industry changes and offer products and services that meet evolving industry standards. In connection with our service offerings, we are continuing to deploy new information system technologies to our direct and agency operations. We expect to improve the process of ordering title and escrow services and improve the delivery of our products to our customers. |
• | Maintain values supporting our strategy. We believe that our continued focus on and support of our long-established corporate culture will reinforce and support our business strategy. Our goal is to foster and support a corporate culture where our employees and agents seek to operate independently and maintain profitability at the local level while forming close customer relationships by meeting customer needs and improving customer service. Utilizing a relatively flat managerial structure and providing our employees with a sense of individual ownership support this goal. |
• | Effectively manage costs based on economic factors. We believe that our focus on our operating margins is essential to our continued success in the title insurance business. Regardless of the business cycle in which we may be operating, we seek to continue to evaluate and manage our cost structure and make appropriate adjustments where economic conditions dictate. This continual focus on our cost structure helps us to better maintain our operating margins. |
Black Knight
Black Knight's comprehensive and integrated technology platforms, robust data and analytic capabilities, differentiated business model, broad and deep client relationships and other competitive strengths enable it to pursue multiple growth opportunities. Black Knight intends to continue to expand its business and grow through the following key strategies:
3
• | Further penetration of our solutions with existing clients. We believe our established client base presents a substantial opportunity for growth. We seek to capitalize on the trend of standardization and increased adoption of leading third-party solutions and increase the number of solutions provided to our existing client base. We intend to broaden and deepen our client relationships by cross-selling our suite of end-to-end technology solutions, as well as our robust data and analytics. We have established incentives within our sales force, as well as a core team of account managers, to encourage cross-selling of our full range of solutions to our existing clients. By helping our clients understand the full extent of our comprehensive solutions and the value of leveraging the multiple solutions that we offer, we believe we can expand our existing relationships by freeing our clients to focus on their core businesses and their customers. |
• | Win new clients in existing markets. We intend to attract new clients in the mortgage industry by leveraging the value proposition provided by our technology platform and comprehensive solutions offering. In particular, we believe there is a significant opportunity to penetrate the underserved mid-tier mortgage originators and servicers market. We believe that these institutions can benefit from our proven solutions suite in order to address increasingly complex regulatory requirements and compete more effectively in the evolving mortgage market. We intend to continue to pursue this channel and benefit from the low incremental cost of adding new customers to our scaled technology infrastructure. |
• | Continue to innovate and introduce new solutions. Our long-term vision is to be the industry-leading provider for participants of the mortgage industry for their platform, data, and analytic needs. We intend to enhance what we believe is a leadership position in the industry by continuing to innovate our solutions and refine the insight we provide to our clients. We have a strong track record of introducing and developing new solutions that span the mortgage loan life cycle, are tailored to specific industry trends and that enhance our clients’ core operating functions. By working in partnership with key clients, we have been able to develop and market new and advanced solutions to our client base that meet the evolving demands of the mortgage industry. In addition, we will continue to develop and leverage insights from our large public and proprietary data assets to further improve our customer value proposition. |
• | Powerful focus and dedication to staying up-to-date with regulatory requirements. We have dedicated significant technological and management resources to build and maintain a regulatory infrastructure and human capital base to assist our clients with increased regulatory oversight and requirements. We are able to leverage our consistent investment in this area through our SaaS technology solutions and our market-leading scale. We intend to continue our strategy of building and investing in solutions that help our clients with the regulatory environment. |
• | Selectively pursue strategic acquisitions. The core focus of our strategy is to grow organically. However, we may selectively evaluate strategic acquisition opportunities that may allow us to expand our footprint, broaden our client base and deepen our product and service offerings. We believe that there are meaningful synergies that result from acquiring small companies that provide best-of-breed single point solutions. The potential revenue synergies would result from integrating and cross-selling these point solutions into our broader client base and cost synergies would result from integrating acquisitions into our efficient operating environment. |
FNFV
Through FNFV we actively manage a group of companies and investments with a net asset value of approximately $969 million as of December 31, 2015. The businesses within FNFV primarily consist of our majority ownership positions in ABRH and Digital Insurance and our 32% minority investment in Ceridian. Our strategy for the Group is to continue our activities with respect to such business investments to achieve superior financial performance, maximize and ultimately monetize the value of those assets and to continue to pursue similar investments in businesses and to grow and achieve superior financial performance with respect to such newly acquired businesses.
Restaurant Group
Our restaurant operations are focused in the family dining and casual dining segments. The Restaurant Group's strategy is to achieve long-term profit growth and drive increases in same store sales and guest counts. We have a highly experienced management team that is focused on enhancing the guest experience at our restaurants and building team member engagement. We also utilize a shared service platform that takes advantage of the combined synergies of our operating companies to provide purchasing power and other shared service functions. We expect to continue to maintain a strong balance sheet for our Restaurant Group to support future acquisitions and to provide stability in all operating environments.
FNFV Corporate and Other
Acquisitions, Dispositions, Minority Owned Operating Subsidiaries and Financings
Acquisitions have been an important part of our growth strategy. Dispositions have been an important aspect of our strategy of returning value to shareholders. On an ongoing basis, with assistance from our advisors, we actively evaluate possible transactions, such as acquisitions and dispositions of business units and operating assets and business combination transactions.
4
In the future, we may seek to sell certain investments or other assets to increase our liquidity. Further, our management has stated that we may make acquisitions in lines of business that are not directly tied to, or synergistic with, our core operating segments. In the past we have obtained majority and minority investments in entities and securities where we see the potential to achieve above market returns. Fundamentally our goal is to acquire quality companies that are well-positioned in their respective industries, run by best in class management teams in industries that have attractive organic and acquired growth opportunities. We leverage our operational expertise and track record of growing industry leading companies and also our active interaction with the acquired company's management directly or through our board of directors, to ultimately provide value for our shareholders.
There can be no assurance that any suitable opportunities will arise or that any particular transaction will be completed. We have made a number of acquisitions and dispositions over the past several years to strengthen and expand our service offerings and customer base in our various businesses, to expand into other businesses or where we otherwise saw value, and to monetize investments in assets and businesses.
Title Insurance
Market for title insurance. According to Demotech Performance of Title Insurance Companies 2015 Edition, an annual compilation of financial information from the title insurance industry that is published by Demotech Inc., an independent firm ("Demotech"), total operating income for the entire U.S. title insurance industry has increased over the last 5 years from approximately $10.3 billion in 2010 to $12.2 billion in 2014, which is a $1.2 billion decrease from 2013. The size of the industry is closely tied to various macroeconomic factors, including, but not limited to, growth in the gross domestic product, inflation, unemployment, the availability of credit, consumer confidence, interest rates, and sales volumes and prices for new and existing homes, as well as the volume of refinancing of previously issued mortgages.
Most real estate transactions consummated in the U.S. require the use of title insurance by a lending institution before the transaction can be completed. Generally, revenues from title insurance policies are directly correlated with the value of the property underlying the title policy, and appreciation or depreciation in the overall value of the real estate market are major factors in total industry revenues. Industry revenues are also driven by factors affecting the volume of real estate closings, such as the state of the economy, the availability of mortgage funding, and changes in interest rates, which affect demand for new mortgage loans and refinancing transactions. Both the volume and the average price of residential real estate transactions declined from 2007-2011. Beginning in 2008 and continuing through 2011, the mortgage delinquency and default rates caused negative operating results at a number of banks and financial institutions. Multiple banks failed during this time, reducing the capacity of the mortgage industry to make loans. Since this time, lenders have tightened their underwriting standards which has made it more difficult for buyers to qualify for new loans. However, during this same period, interest rates declined to historically low levels, which spurred higher refinance activity in the period 2009 through 2012. During 2013 and continuing through 2015, refinance activity declined due to rising interest rates which followed a period of historically low interest rates experienced from 2008 through 2012. However, over the same period from 2013 through 2015, we experienced an increase in the purchase volume and average price of residential real estate. Overall, our title premiums increased in 2015 compared to 2014. Our revenues in future periods will continue to be subject to these and other factors which are beyond our control and, as a result, are likely to fluctuate.
The U.S. title insurance industry is concentrated among a handful of industry participants. According to Demotech, the top four title insurance groups accounted for 87% of net premiums written in 2014. Approximately 32 independent title insurance companies accounted for the remaining 13% of net premiums written in 2014. Consolidation has created opportunities for increased financial and operating efficiencies for the industry’s largest participants and should continue to drive profitability and market share in the industry.
Title Insurance Policies. Generally, real estate buyers and mortgage lenders purchase title insurance to insure good and marketable title to real estate and priority of lien. A brief generalized description of the process of issuing a title insurance policy is as follows:
• | The customer, typically a real estate salesperson or broker, escrow agent, attorney or lender, places an order for a title policy. |
• | Company personnel note the specifics of the title policy order and place a request with the title company or its agents for a preliminary report or commitment. |
• | After the relevant historical data on the property is compiled, the title officer prepares a preliminary report that documents the current status of title to the property, any exclusions, exceptions and/or limitations that the title company might include in the policy, and specific issues that need to be addressed and resolved by the parties to the transaction before the title policy will be issued. |
• | The preliminary report is circulated to all the parties for satisfaction of any specific issues. |
• | After the specific issues identified in the preliminary report are satisfied, an escrow agent closes the transaction in accordance with the instructions of the parties and the title company’s conditions. |
• | Once the transaction is closed and all monies have been released, the title company issues a title insurance policy. |
5
In real estate transactions financed with a mortgage, virtually all real property mortgage lenders require their borrowers to obtain a title insurance policy at the time a mortgage loan is made. This lender’s policy insures the lender against any defect affecting the priority of the mortgage in an amount equal to the outstanding balance of the related mortgage loan. An owner’s policy is typically also issued, insuring the buyer against defects in title in an amount equal to the purchase price. In a refinancing transaction, only a lender’s policy is generally purchased because ownership of the property has not changed. In the case of an all-cash real estate purchase, no lender’s policy is issued but typically an owner’s title policy is issued.
Title insurance premiums paid in connection with a title insurance policy are based on (and typically are a percentage of) either the amount of the mortgage loan or the purchase price of the property insured. Applicable state insurance regulations or regulatory practices may limit the maximum, or in some cases the minimum, premium that can be charged on a policy. Title insurance premiums are due in full at the closing of the real estate transaction. A lender’s policy generally terminates upon the refinancing or resale of the property.
The amount of the insured risk or “face amount” of insurance under a title insurance policy is generally equal to either the amount of the loan secured by the property or the purchase price of the property. The title insurer is also responsible for the cost of defending the insured title against covered claims. The insurer’s actual exposure at any given time, however, generally is less than the total face amount of policies outstanding because the coverage of a lender’s policy is reduced and eventually terminated as a result of payments on the mortgage loan. A title insurer also generally does not know when a property has been sold or refinanced except when it issues the replacement coverage. Because of these factors, the total liability of a title underwriter on outstanding policies cannot be precisely determined.
Title insurance companies typically issue title insurance policies directly through branch offices or through affiliated title agencies, or indirectly through independent third party agencies unaffiliated with the title insurance company. Where the policy is issued through a branch or wholly-owned subsidiary agency operation, the title insurance company typically performs or directs the title search, and the premiums collected are retained by the title company. Where the policy is issued through an independent agent, the agent generally performs the title search (in some areas searches are performed by approved attorneys), examines the title, collects the premium and retains a majority of the premium. The remainder of the premium is remitted to the title insurance company as compensation, part of which is for bearing the risk of loss in the event a claim is made under the policy. The percentage of the premium retained by an agent varies from region to region and is sometimes regulated by the states. The title insurance company is obligated to pay title claims in accordance with the terms of its policies, regardless of whether the title insurance company issues policies through its direct operations or through independent agents.
Prior to issuing policies, title insurers and their agents attempt to reduce the risk of future claim losses by accurately performing title searches and examinations. A title insurance company’s predominant expense relates to such searches and examinations, the preparation of preliminary title reports, policies or commitments, the maintenance of "title plants,” which are indexed compilations of public records, maps and other relevant historical documents, and the facilitation and closing of real estate transactions. Claim losses generally result from errors made in the title search and examination process, from hidden defects such as fraud, forgery, incapacity, or missing heirs of the property, and from closing related errors.
Residential real estate business results from the construction, sale, resale and refinancing of residential properties, while commercial real estate business results from similar activities with respect to properties with a business or commercial use. Commercial real estate title insurance policies insure title to commercial real property, and generally involve higher coverage amounts and yield higher premiums. Residential real estate transaction volume is primarily affected by macroeconomic and seasonal factors while commercial real estate transaction volume is affected primarily by fluctuations in local supply and demand conditions for commercial space.
Direct and Agency Operations. We provide title insurance services through our direct operations and through independent title insurance agents who issue title policies on behalf of our title insurance companies. Our title insurance companies determine the terms and conditions upon which they will insure title to the real property according to our underwriting standards, policies and procedures.
Direct Operations. In our direct operations, the title insurer issues the title insurance policy and retains the entire premium paid in connection with the transaction. Our direct operations provide the following benefits:
• | higher margins because we retain the entire premium from each transaction instead of paying a commission to an independent agent; |
• | continuity of service levels to a broad range of customers; and |
• | additional sources of income through escrow and closing services. |
We have approximately 1,200 offices throughout the U.S. primarily providing residential real estate title insurance. We continuously monitor the number of direct offices to make sure that it remains in line with our strategy and the current economic environment. Our commercial real estate title insurance business is operated almost exclusively through our direct operations. We maintain direct operations for our commercial title insurance business in all the major real estate markets including Atlanta, Boston, Chicago, Dallas, Houston, Los Angeles, New York, Philadelphia, Phoenix, Seattle and Washington D.C.
6
Agency Operations. In our agency operations, the search and examination function is performed by an independent agent or the agent may purchase the search and examination from us. In either case, the agent is responsible to ensure that the search and examination is completed. The agent thus retains the majority of the title premium collected, with the balance remitted to the title underwriter for bearing the risk of loss in the event that a claim is made under the title insurance policy. Independent agents may select among several title underwriters based upon their relationship with the underwriter, the amount of the premium “split” offered by the underwriter, the overall terms and conditions of the agency agreement and the scope of services offered to the agent. Premium splits vary by geographic region, and in some states are fixed by insurance regulatory requirements. Our relationship with each agent is governed by an agency agreement defining how the agent issues a title insurance policy on our behalf. The agency agreement also sets forth the agent’s liability to us for policy losses attributable to the agent’s errors. An agency agreement is usually terminable without cause upon 30 days notice or immediately for cause. In determining whether to engage or retain an independent agent, we consider the agent’s experience, financial condition and loss history. For each agent with whom we enter into an agency agreement, we maintain financial and loss experience records. We also conduct periodic audits of our agents and strategically manage the number of agents with which we transact business in an effort to reduce future expenses and manage risks. As of December 31, 2015, we transact business with approximately 5,000 agents.
Fees and Premiums. One method of analyzing our business is to examine the level of premiums generated by direct and agency operations.
The following table presents the percentages of our title insurance premiums generated by direct and agency operations:
Year Ended December 31, | ||||||||||||||||||||
2015 | 2014 | 2013 | ||||||||||||||||||
Amount | % | Amount | % | Amount | % | |||||||||||||||
(Dollars in millions) | ||||||||||||||||||||
Direct | $ | 2,009 | 46.9 | % | $ | 1,727 | 47.0 | % | $ | 1,800 | 43.4 | % | ||||||||
Agency | 2,277 | 53.1 | 1,944 | 53.0 | 2,352 | 56.6 | ||||||||||||||
Total title insurance premiums | $ | 4,286 | 100.0 | % | $ | 3,671 | 100.0 | % | $ | 4,152 | 100.0 | % | ||||||||
The premium for title insurance is due in full when the real estate transaction is closed. We recognize title insurance premium revenues from direct operations upon the closing of the transaction, whereas premium revenues from agency operations include an accrual based on estimates of the volume of transactions that have closed in a particular period for which premiums have not yet been reported to us. The accrual for agency premiums is necessary because of the lag between the closing of these transactions and the reporting of these policies to us by the agent, and is based on estimates utilizing historical information.
Escrow, Title-Related and Other Fees. In addition to fees for underwriting title insurance policies, we derive a significant amount of our revenues from escrow and other title-related services including collection and trust activities, trustee sales guarantees, recordings and reconveyances, and home warranty services. The escrow and other services provided by us include all of those typically required in connection with residential and commercial real estate purchases and refinance activities. Escrow, title-related and other fees included in our Title segment represented approximately 31.2%, 32.8%, and 27.1% of our revenues in 2015, 2014, and 2013, respectively.
Sales and Marketing. We market and distribute our title and escrow products and services to customers in the residential and commercial market sectors of the real estate industry through customer solicitation by sales personnel. Although in many instances the individual homeowner is the beneficiary of a title insurance policy, we do not focus our marketing efforts on the homeowner. We actively encourage our sales personnel to develop new business relationships with persons in the real estate community, such as real estate sales agents and brokers, financial institutions, independent escrow companies and title agents, real estate developers, mortgage brokers and attorneys who order title insurance policies for their clients. While our smaller, local clients remain important, large customers, such as national residential mortgage lenders, real estate investment trusts and developers are an important part of our business. The buying criteria of locally based clients differ from those of large, geographically diverse customers in that the former tend to emphasize personal relationships and ease of transaction execution, while the latter generally place more emphasis on consistent product delivery across diverse geographical regions and the ability of service providers to meet their information systems requirements for electronic product delivery.
Claims. An important part of our operations is the handling of title and escrow claims. We employ a large staff of attorneys in our claims department. Our claims processing centers are located in Omaha, Nebraska and Jacksonville, Florida. In-house claims counsel are also located in other parts of the country.
Claims result from a wide range of causes. These causes generally include, but are not limited to, search and exam errors, forgeries, incorrect legal descriptions, signature and notary errors, unrecorded liens, mechanics’ liens, the failure to pay off existing liens, mortgage lending fraud, mishandling or theft of settlement funds (including independent agency theft), and mistakes in the escrow process. Under our policies, we are required to defend insureds when covered claims are filed against their interest in the property. Some claimants seek damages in excess of policy limits. Those claims are based on various legal theories, including in
7
some cases allegations of negligence or an intentional tort. We occasionally incur losses in excess of policy limits. Experience shows that most policy claims and claim payments are made in the first five years after the policy has been issued, although claims may also be reported and paid many years later.
Title losses due to independent agency defalcations typically occur when the independent agency misappropriates funds from escrow accounts under its control. Such losses are usually discovered when the independent agency fails to pay off an outstanding mortgage loan at closing (or immediately thereafter) from the proceeds of the new loan. Once the previous lender determines that its loan has not been paid off timely, it will file a claim against the title insurer.
Claims can be complex, vary greatly in dollar amounts and are affected by economic and market conditions and the legal environment existing at the time claims are processed. In our commercial title business, we may issue polices with face amounts well in excess of $100 million, and from time to time claims are submitted with respect to large policies. We believe we are appropriately reserved with respect to all claims (large and small) that we currently face. Occasionally we experience large losses from title policies that have been issued or from our escrow operations, or overall worsening loss payment experience, which require us to increase our title loss reserves. These events are unpredictable and adversely affect our earnings. Claims can result in litigation in which we may represent our insured and/or ourselves. We consider this type of litigation to be an ordinary course aspect of the conduct of our business.
Reinsurance and Coinsurance. We limit our maximum loss exposure by reinsuring risks with other insurers under excess of loss and case-by-case (“facultative”) reinsurance agreements. Reinsurance agreements generally provide that the reinsurer is liable for loss and loss adjustment expense payments exceeding the amount retained by the ceding company. However, the ceding company remains primarily liable to the insured whether or not the reinsurer is able to meet its contractual obligations. Facultative reinsurance agreements are entered into with other title insurers when the transaction to be insured will exceed state statutory or self-imposed limits. Excess of loss reinsurance coverage protects us from a large loss from a single loss occurrence. Through February 23, 2016, our excess of loss reinsurance coverage is split into two tiers. The first tier provides coverage for residential and commercial transactions up to $100 million per loss occurrence, subject to a $20 million retention per loss occurrence. The second tier provides additional coverage for commercial transactions in excess of $100 million of loss per occurrence up to $400 million per loss occurrence, with the Company participating at approximately 10%. We have not yet finalized the terms and conditions of our 2016 - 2017 coverages, but do not expect there to be substantial changes in the terms and conditions.
In addition to reinsurance, we carry errors and omissions insurance and fidelity bond coverage, each of which can provide protection to us in the event of certain types of losses that can occur in our businesses.
Our policy is to be selective in choosing our reinsurers, seeking only those companies that we consider to be financially stable and adequately capitalized. In an effort to minimize exposure to the insolvency of a reinsurer, we periodically review the financial condition of our reinsurers.
We also use coinsurance in our commercial title business to provide coverage in amounts greater than we would be willing or able to provide individually. In coinsurance transactions, each individual underwriting company issues a separate policy and assumes a portion of the overall total risk. As a coinsurer we are only liable for the portion of the risk we assume.
We also earn a small amount of additional income, which is reflected in our direct premiums, by assuming reinsurance for certain risks of other title insurers.
Competition. Competition in the title insurance industry is based primarily on expertise, service and price. In addition, the financial strength of the insurer has become an increasingly important factor in decisions relating to the purchase of title insurance, particularly in multi-state transactions and in situations involving real estate-related investment vehicles such as real estate investment trusts and real estate mortgage investment conduits. The number and size of competing companies varies in the different geographic areas in which we conduct our business. In our principal markets, competitors include other major title underwriters such as First American Financial Corporation, Old Republic International Corporation and Stewart Information Services Corporation, as well as numerous smaller title insurance companies, underwritten title companies and independent agency operations at the regional and local level. As a result of the significant decrease in the real estate market from 2008 through 2012, several of our smaller competitors closed their operations. The addition or removal of regulatory barriers might result in changes to competition in the title insurance business. New competitors may include diversified financial services companies that have greater financial resources than we do and possess other competitive advantages. Competition among the major title insurance companies, expansion by smaller regional companies and any new entrants with alternative products could affect our business operations and financial condition.
Regulation. Our insurance subsidiaries, including title insurers, underwritten title companies and insurance agencies, are subject to extensive regulation under applicable state laws. Each of the insurers is subject to a holding company act in its state of domicile, which regulates, among other matters, the ability to pay dividends and enter into transactions with affiliates. The laws of most states in which we transact business establish supervisory agencies with broad administrative powers relating to issuing and revoking licenses to transact business, regulating trade practices, licensing agents, approving policy forms, accounting practices, financial practices, establishing reserve and capital and surplus as regards policyholders (“capital and surplus”) requirements,
8
defining suitable investments for reserves and capital and surplus and approving rate schedules. The process of state regulation of changes in rates ranges from states which set rates, to states where individual companies or associations of companies prepare rate filings which are submitted for approval, to a few states in which rate changes do not need to be filed for approval.
Since we are governed by both state and federal governments and the applicable insurance laws and regulations are constantly subject to change, it is not possible to predict the potential effects on our insurance operations of any laws or regulations that may become more restrictive in the future or if new restrictive laws will be enacted.
Pursuant to statutory accounting requirements of the various states in which our title insurers are domiciled, these insurers must defer a portion of premiums as an unearned premium reserve for the protection of policyholders (in addition to their reserves for known claims) and must maintain qualified assets in an amount equal to the statutory requirements. The level of unearned premium reserve required to be maintained at any time is determined by a statutory formula based upon either the age, number of policies, and dollar amount of policy liabilities underwritten, or the age and dollar amount of statutory premiums written. As of December 31, 2015, the combined statutory unearned premium reserve required and reported for our title insurers was $1,728 million. In addition to statutory unearned premium reserves and reserves for known claims, each of our insurers maintains surplus funds for policyholder protection and business operations.
Each of our insurance subsidiaries is regulated by the insurance regulatory authority in its respective state of domicile, as well as that of each state in which it is licensed. The insurance commissioners of their respective states of domicile are the primary regulators of our insurance subsidiaries. Each of the insurers is subject to periodic regulatory financial examination by regulatory authorities.
Under the statutes governing insurance holding companies in most states, insurers may not enter into certain transactions, including sales, reinsurance agreements and service or management contracts, with their affiliates unless the regulatory authority of the insurer’s state of domicile has received notice at least 30 days prior to the intended effective date of such transaction and has not objected to, or has approved, the transaction within the 30-day period.
In addition to state-level regulation, segments of our FNF core businesses are subject to regulation by federal agencies, including the Consumer Financial Protection Bureau (“CFPB”). The CFPB was established under the Dodd-Frank Wall Street Reform and Consumer Protection Act of 2010 ("Dodd-Frank") which also included regulation over financial services and other lending related businesses including Black Knight. The CFPB has been given broad authority to regulate, among other areas, the mortgage and real estate markets in matters pertaining to consumers. This authority includes the enforcement of the Real Estate Settlement Procedures Act formerly placed with the Department of Housing and Urban Development. On July 9, 2012, the CFPB introduced a number of proposed rules related to the enforcement of the Real Estate Settlement Procedures Act and the Truth in Lending Act, including, among others, measures designed to (i) simplify financing documentation and (ii) require lenders to deliver to consumers a statement of final financing charges (and the related annual percentage rate) at least three business days prior to the closing. These rules became effective on January 10, 2014.
On November 20, 2013, the CFPB issued additional rules regarding mortgage forms and other mortgage related disclosures with the intent to provide "easier-to-use" mortgage disclosure forms for the consumer. The additional disclosure requirements require participants in the mortgage market, including us, to make significant changes to the manner in which they create, process, and deliver certain disclosures to consumers in connection with mortgage loan applications. The additional disclosures are effective for mortgage loan applications made on or after October 3, 2015. The main provisions of the additional disclosures include amending Regulation Z (the Truth in Lending Act) and Regulation X (Real Estate Settlement Procedures Act) (collectively, the “TILA-RESPA Integrated Disclosure" or "TRID”) to consolidate existing loan disclosures under TILA and RESPA for closed-end credit transactions secured by real property. TRID will require (i) timely delivery of a loan estimate upon receipt a consumer’s application and (ii) timely delivery of a closing disclosure prior to consummation. TRID will also impose certain restrictions, including the prohibition of imposing fees prior to provision of an estimate and the prohibition of providing estimates prior to a consumer’s submission of verifying documents. These changes could lead to lower mortgage volumes and/or delays in mortgage processing, particularly in the early stages of implementation. We do not believe the changes will have a significant effect on long term mortgage volumes, but could have the effect of delaying mortgage closings to 2016 that absent the rule may have closed in 2015. We do not anticipate this having a material impact on our current year results from operations.
Readiness for and compliance with TRID required extensive planning; changes to systems, forms and processes; as well as heightened coordination among market participants. Although there can be no assurance that FNF, its agents or other market participants will be successful in their implementation efforts, we have reviewed the new requirements, and reviewed and updated our policies, procedures and technology resources as appropriate. It is our experience that mortgage lenders have become more focused on the risk of non-compliance with these evolving regulations and are focused on technologies and solutions that help them to comply with the increased regulatory oversight and burdens. Black Knight has developed solutions that target this need, which has resulted in additional revenue at Black Knight.
As a holding company with no significant business operations of our own, we depend on dividends or other distributions from our subsidiaries as the principal source of cash to meet our obligations, including the payment of interest on and repayment of
9
principal of any debt obligations, and to pay any dividends to our shareholders. The payment of dividends or other distributions to us by our insurers is regulated by the insurance laws and regulations of their respective states of domicile. In general, an insurance company subsidiary may not pay an “extraordinary” dividend or distribution unless the applicable insurance regulator has received notice of the intended payment at least 30 days prior to payment and has not objected to or has approved the payment within the 30-day period. In general, an “extraordinary” dividend or distribution is statutorily defined as a dividend or distribution that, together with other dividends and distributions made within the preceding 12 months, exceeds the greater of:
• | 10% of the insurer’s statutory surplus as of the immediately prior year end; or |
• | the statutory net income of the insurer during the prior calendar year. |
The laws and regulations of some jurisdictions also prohibit an insurer from declaring or paying a dividend except out of its earned surplus or require the insurer to obtain prior regulatory approval. During 2016, our directly owned title insurers can pay dividends or make distributions to us of approximately $334 million; however, insurance regulators have the authority to prohibit the payment of ordinary dividends or other payments by our title insurers to us (such as a payment under a tax sharing agreement or for other services) if they determine that such payment could be adverse to our policyholders. There are no restrictions on our retained earnings regarding our ability to pay dividends to shareholders.
The combined statutory capital and surplus of our title insurers was approximately $1,412 million and $1,472 million as of December 31, 2015 and 2014, respectively. The combined statutory earnings of our title insurers were $381 million, $276 million, and $352 million for the years ended December 31, 2015, 2014, and 2013, respectively.
As a condition to continued authority to underwrite policies in the states in which our insurers conduct their business, they are required to pay certain fees and file information regarding their officers, directors and financial condition.
Pursuant to statutory requirements of the various states in which our insurers are domiciled, such insurers must maintain certain levels of minimum capital and surplus. Required levels of minimum capital and surplus are not significant to the insurers individually or in the aggregate. Each of our insurers has complied with the minimum statutory requirements as of December 31, 2015.
Our underwritten title companies are also subject to certain regulation by insurance regulatory or banking authorities, primarily relating to minimum net worth. Minimum net worth requirements for each underwritten title company is less than $1 million. These companies were in compliance with their respective minimum net worth requirements at December 31, 2015.
From time to time we receive inquiries and requests for information from state insurance departments, attorneys general and other regulatory agencies about various matters relating to our business. Sometimes these take the form of civil investigative demands or subpoenas. We cooperate with all such inquiries and we have responded to or are currently responding to inquiries from multiple governmental agencies. Also, regulators and courts have been dealing with issues arising from foreclosures and related processes and documentation. Various governmental entities are studying the title insurance product, market, pricing, and business practices, and potential regulatory and legislative changes, which may materially affect our business and operations. From time to time, we are assessed fines for violations of regulations or other matters or enter into settlements with such authorities which may require us to pay fines or claims or take other actions. For further discussion, see item 3, Legal Proceedings.
Before a person can acquire control of a U.S. insurance company, prior written approval must be obtained from the insurance commissioner of the state in which the insurer is domiciled. Prior to granting approval of an application to acquire control of a domestic insurer, the state insurance commissioner will consider such factors as the financial strength of the applicant, the integrity and management of the applicant’s Board of Directors and executive officers, the acquirer’s plans for the insurer’s Board of Directors and executive officers, the acquirer’s plans for the future operations of the domestic insurer and any anti-competitive results that may arise from the consummation of the acquisition of control. Generally, state statutes provide that control over a domestic insurer is presumed to exist if any person, directly or indirectly, owns, controls, holds with the power to vote, or holds proxies representing 10% or more of the voting securities of the domestic insurer. Because a person acquiring 10% or more of our common shares would indirectly control the same percentage of the stock of our insurers, the insurance change of control laws would likely apply to such a transaction.
The National Association of Insurance Commissioners ("NAIC") has adopted an instruction requiring an annual certification of reserve adequacy by a qualified actuary. Because all of the states in which our title insurers are domiciled require adherence to NAIC filing procedures, each such insurer, unless it qualifies for an exemption, must file an actuarial opinion with respect to the adequacy of its reserves.
10
Title Insurance Ratings
Our title insurance underwriters are regularly assigned ratings by independent agencies designed to indicate their financial condition and/or claims paying ability. The rating agencies determine ratings by quantitatively and qualitatively analyzing financial data and other information. Our title subsidiaries include Alamo Title, Chicago Title, Commonwealth Land Title, Fidelity National Title and National Title of New York. Standard & Poor’s Ratings Group (“S&P”), Moody’s Investors Service (“Moody’s”), and A. M. Best Company ("A.M. Best") provide ratings for the entire FNF family of companies as a whole as follows:
S&P | Moody’s | A.M. Best | |||
FNF family of companies | A | A3 | A | ||
The relative position of each of our ratings among the ratings scale assigned by each rating agency is as follows:
• | An S&P "A" rating is the third highest rating of 11 ratings for S&P. S&P states that an “A” rating means that, in its opinion, the insurer has strong financial security characteristics. |
• | A Moody's "A3" rating is the third highest rating of 9 ratings for Moody's. Moody's states that insurance companies rated “A3” offer good financial security. |
• | An A.M. Best "A" rating is the third highest rating of 18 ratings for A.M. Best. A.M. Best states that its “A (Excellent)” rating is assigned to those companies that have, in its opinion, an excellent ability to meet their ongoing obligations to policyholders. |
Demotech provides financial strength/stability ratings for each of our principal title insurance underwriters individually, as follows:
Alamo Title Insurance | A' |
Chicago Title Insurance Company | A'' |
Commonwealth Land Title Insurance Company | A' |
Fidelity National Title Insurance Company | A' |
National Title Insurance of New York | A' |
Demotech states that its ratings of "A"(A double prime)" and "A' (A prime)" reflect its opinion that, regardless of the severity of a general economic downturn or deterioration in the insurance cycle, the insurers assigned either of those ratings possess "Unsurpassed" financial stability related to maintaining positive surplus as regards policyholders. The "A'' (A double prime)" and "A' (A prime)" ratings are the two highest ratings of Demotech's five ratings.
The ratings of S&P, Moody’s, A.M. Best, and Demotech described above are not designed to be, and do not serve as, measures of protection or valuation offered to investors. These financial strength ratings should not be relied on with respect to making an investment in our securities. See “Item 1A. Risk Factors — If the rating agencies downgrade our Company, our results of operations and competitive position in the title insurance industry may suffer” for further information.
Black Knight
Our Black Knight segment offers technology and data and analytics services through leading software systems and information solutions that facilitate and automate many of the business processes across the life cycle of a mortgage. Our customers use our technology and services to reduce their operating costs, improve their customer service and enhance the quality and consistency of various aspects of their mortgage servicing. We continually work with our customers to customize and integrate our software and services in order to assist them in achieving the value proposition that we offer to them.
Our principal technology solutions are software applications provided to mortgage lenders and other lending institutions, together with related support and services. Our technology solutions primarily consist of mortgage processing and workflow management software applications. The long term nature of most of our contracts in this business provides us with substantial recurring revenues. Our revenues from servicing technology are generally based on the number of active mortgages on our mortgage servicing platform in a given period. Our other technology solutions include our origination and default technology, from which we generally earn revenues on a per transaction basis. Our data and analytics offerings primarily consist of our alternative valuation services, real estate and mortgage data, modeling and forecasting and analytical tools.
The U.S. mortgage market has seen significant change over the past few years and is expected to continue to evolve going forward. Increased origination volatility and key regulatory actions arising from the recent financial crisis, such as the Dodd-Frank Act and the establishment of the Consumer Financial Protection Bureau (the "CFPB"), impose new and evolving standards for market participants. These regulatory changes have spurred lenders and servicers to seek technology solutions that facilitate compliance obligations in the face of a changing regulatory environment while remaining efficient and profitable.
11
The current market conditions for Black Knight's services include the following:
Increased regulation. Most U.S. mortgage market participants have become subject to increasing regulatory oversight and regulatory requirements as federal and state governments have enacted various new laws, rules and regulations. One example of such legislation is the Dodd-Frank Act, which contains broad changes for many sectors of the financial services and lending industries and established the CFPB, a new federal regulatory agency responsible for regulating consumer financial protection within the United States. It is our experience that mortgage lenders have become more focused on minimizing the risk of non-compliance with these evolving regulations and are looking towards technologies and solutions that help them to comply with the increased regulatory oversight and burdens.
Lenders increasingly focused on core operations. As a result of greater regulatory scrutiny and the higher cost of doing business, we believe lenders have become more focused on their core operations and customers. We believe lenders are increasingly shifting from in-house technologies to solutions with third-party providers who can provide better technology and services more efficiently. Lenders require these vendors to provide best-in-class technology and deep domain expertise and to assist them in maintaining regulatory compliance.
Growing role of technology in the U.S. mortgage industry. Banks and other lenders and servicers have become increasingly focused on technology automation and workflow management to operate more efficiently and meet their regulatory guidelines. We believe that vendors must be able to support the complexity in the market, display extensive industry knowledge and possess the financial resources to make the necessary investments in technology to support lenders.
Increased demand for enhanced transparency and analytic insight. As U.S. mortgage market participants work to minimize the risk in lending, servicing and capital markets, they increasingly rely on data and analytics to integrate with technologies that enhance the decision making process. These industry participants rely on large comprehensive third party databases coupled with enhanced analytics to achieve these goals.
Intellectual Property
We rely on a combination of contractual restrictions, internal security practices, and copyright and trade secret law to establish and protect our software, technology, and expertise across our businesses. Further, we have developed a number of brands that have accumulated substantial goodwill in the marketplace, and we rely on trademark law to protect our rights in that area. We intend to continue our policy of taking all measures we deem necessary to protect our copyright, trade secret, and trademark rights. These legal protections and arrangements afford only limited protection of our proprietary rights, and there is no assurance that our competitors will not independently develop or license products, services, or capabilities that are substantially equivalent or superior to ours.
Technology and Research and Development
Title Business
As a national provider of real estate transaction products and services, we participate in an industry that is subject to significant regulatory requirements, frequent new product and service introductions, and evolving industry standards. We believe that our future success depends in part on our ability to anticipate industry changes and offer products and services that meet evolving industry standards. In connection with our title segment service offerings, we are continuing to deploy new information system technologies to our direct and agency operations. We continue to improve the process of ordering title and escrow services and improve the delivery of our products to our customers. In order to meet new regulatory requirements, we also continue to expand our data collection and reporting abilities. We have made enhancements to certain of our systems to comply with the CFPB’s Integrated Mortgage Disclosure rules that went into effect on October 3, 2015. See further discussion of the new rules in Item 7. Management’s Discussion and Analysis of Financial Condition and Results of Operations - Business Trends and Conditions.
Black Knight
Black Knight's technology and research and development activities relate primarily to the design, development and enhancement of our processing systems and related software applications. We expect to continue our practice of investing an appropriate level of resources to maintain, enhance and extend the functionality of our proprietary systems and existing software applications, to develop new and innovative software applications and systems in response to the needs of our clients, and to enhance the capabilities surrounding our infrastructure. We work with our clients to determine the appropriate timing and approach to introducing technology or infrastructure changes to our applications and services. We have made enhancements to certain of our systems to comply with the CFPB's Integrated Mortgage Disclosure rules that went into effect on October 3, 2015. See further discussion of the new rules in Item 7. Management’s Discussion and Analysis of Financial Condition and Results of Operations - Business Trends and Conditions.
Investment Policies and Investment Portfolio
Our investment policy is designed to maximize total return through investment income and capital appreciation consistent with moderate risk of principal, while providing adequate liquidity. Our insurance subsidiaries, including title insurers, underwritten
12
title companies and insurance agencies, are subject to extensive regulation under applicable state laws. The various states in which we operate our underwriters regulate the types of assets that qualify for purposes of capital, surplus, and statutory unearned premium reserves. Our investment policy specifically limits duration and non-investment grade allocations in the FNF core fixed-income portfolio. Maintaining shorter durations on the investment portfolio allows for the mitigation of interest rate risk. Equity securities and preferred stock are utilized to take advantage of perceived value or for strategic purposes. Due to the magnitude of the investment portfolio in relation to our claims loss reserves, durations of investments are not specifically matched to the cash outflows required to pay claims.
As of December 31, 2015 and 2014, the carrying amount of total investments, which approximates the fair value, excluding investments in unconsolidated affiliates, was $4.3 billion and $3.9 billion, respectively.
We purchase investment grade fixed maturity securities, selected non-investment grade fixed maturity securities, preferred stock and equity securities. The securities in our portfolio are subject to economic conditions and normal market risks and uncertainties.
The following table presents certain information regarding the investment ratings of our fixed maturity securities and preferred stock portfolio at December 31, 2015 and 2014:
December 31, | |||||||||||||||||||||||||||
2015 | 2014 | ||||||||||||||||||||||||||
Amortized | % of | Fair | % of | Amortized | % of | Fair | % of | ||||||||||||||||||||
Rating(1) | Cost | Total | Value | Total | Cost | Total | Value | Total | |||||||||||||||||||
(Dollars in millions) | |||||||||||||||||||||||||||
Aaa/AAA | $ | 439 | 15.4 | % | $ | 430 | 15.1 | % | $ | 373 | 11.7 | % | $ | 379 | 11.7 | % | |||||||||||
Aa/AA | 553 | 19.4 | 565 | 19.9 | 701 | 22.0 | 721 | 22.2 | |||||||||||||||||||
A | 930 | 32.6 | 943 | 33.1 | 1,061 | 33.3 | 1,085 | 33.4 | |||||||||||||||||||
Baa/BBB | 744 | 26.1 | 744 | 26.1 | 764 | 24.0 | 778 | 24.0 | |||||||||||||||||||
Ba/BB/B | 84 | 3.0 | 80 | 2.8 | 186 | 5.8 | 184 | 5.7 | |||||||||||||||||||
Lower | 58 | 2.0 | 39 | 1.4 | 60 | 1.9 | 60 | 1.8 | |||||||||||||||||||
Other (2) | 44 | 1.5 | 46 | 1.6 | 41 | 1.3 | 41 | 1.2 | |||||||||||||||||||
$ | 2,852 | 100.0 | % | $ | 2,847 | 100.0 | % | $ | 3,186 | 100.0 | % | $ | 3,248 | 100.0 | % | ||||||||||||
______________________________________
(1) | Ratings as assigned by Moody’s Investors Service or Standard & Poor’s Ratings Group if a Moody's rating is unavailable. |
(2) | This category is composed of unrated securities. |
The following table presents certain information regarding contractual maturities of our fixed maturity securities:
December 31, 2015 | |||||||||||||
Amortized | % of | Fair | % of | ||||||||||
Maturity | Cost | Total | Value | Total | |||||||||
(Dollars in millions) | |||||||||||||
One year or less | $ | 405 | 15.8 | % | $ | 404 | 15.8 | % | |||||
After one year through five years | 1,829 | 71.4 | 1,828 | 71.5 | |||||||||
After five years through ten years | 232 | 9.1 | 229 | 9.0 | |||||||||
After ten years | 26 | 1.0 | 26 | 1.0 | |||||||||
Mortgage-backed/asset-backed securities | 68 | 2.7 | 71 | 2.8 | |||||||||
$ | 2,560 | 100 | % | $ | 2,558 | 100 | % | ||||||
At December 31, 2015, all of our mortgage-backed and asset-backed securities are rated AAA by Moody's. The mortgage-backed and asset-backed securities are made up of $49 million of agency-backed mortgage-backed securities, $8 million of agency-backed collateralized mortgage obligations, and $14 million in asset-backed securities.
Expected maturities may differ from contractual maturities because certain borrowers have the right to call or prepay obligations with or without call or prepayment penalties. Because of the potential for prepayment on mortgage-backed and asset-backed securities, they are not categorized by contractual maturity.
Our equity securities at December 31, 2015 and 2014 consisted of investments with a cost basis of $276 million and $72 million, respectively, and fair value of $345 million and $145 million, respectively.
13
At December 31, 2015 and 2014, we also held $521 million and $770 million, respectively, in investments that are accounted for using the equity method of accounting, principally our ownership interests in Ceridian.
As of December 31, 2015 and 2014, other long-term investments included investments accounted for using the cost method of accounting of $74 million and $144 million, as of December 31, 2015 and 2014, respectively.
Short-term investments, which consist primarily of commercial paper and money market instruments which have an original maturity of one year or less, are carried at amortized cost, which approximates fair value. As of December 31, 2015 and 2014, short-term investments amounted to $1,034 million and $334 million, respectively.
Our investment results for the years ended December 31, 2015, 2014 and 2013 were as follows:
December 31, | ||||||||||||
2015 | 2014 | 2013 | ||||||||||
(Dollars in millions) | ||||||||||||
Net investment income (1) | $ | 137 | $ | 139 | $ | 147 | ||||||
Average invested assets | $ | 4,020 | $ | 3,819 | $ | 3,627 | ||||||
Effective return on average invested assets | 3.4 | % | 3.6 | % | 4.1 | % | ||||||
______________________________________
(1) | Net investment income as reported in our Consolidated Statements of Earnings has been adjusted in the presentation above to provide the tax equivalent yield on tax exempt investments. |
Loss Reserves
For information about our loss reserves, see Item 7. Management’s Discussion and Analysis of Financial Condition and Results of Operations — Critical Accounting Estimates.
Geographic Operations
Our direct title operations are divided into approximately 150 profit centers. Each profit center processes title insurance transactions within its geographical area, which is usually identified by a county, a group of counties forming a region, or a state, depending on the management structure in that part of the country. We also transact title insurance business through a network of approximately 5,000 agents, primarily in those areas in which agents are the more prevalent title insurance provider. Substantially all of our revenues are generated in the United States.
The following table sets forth the approximate dollar and percentage volumes of our title insurance premium revenue by state:
Year Ended December 31, | ||||||||||||||||||||
2015 | 2014 | 2013 | ||||||||||||||||||
Amount | % | Amount | % | Amount | % | |||||||||||||||
(Dollars in millions) | ||||||||||||||||||||
California | $ | 649 | 15.1 | % | $ | 552 | 15.0 | % | $ | 632 | 15.2 | % | ||||||||
Texas | 616 | 14.4 | 567 | 15.4 | 597 | 14.4 | ||||||||||||||
New York | 349 | 8.1 | 289 | 7.9 | 305 | 7.4 | ||||||||||||||
Florida | 349 | 8.1 | 286 | 7.8 | 316 | 7.6 | ||||||||||||||
Illinois | 243 | 5.7 | 214 | 5.8 | 222 | 5.3 | ||||||||||||||
All others | 2,080 | 48.6 | 1,763 | 48.1 | 2,080 | 50.1 | ||||||||||||||
Totals | $ | 4,286 | 100.0 | % | $ | 3,671 | 100.0 | % | $ | 4,152 | 100.0 | % | ||||||||
Our Restaurant Group operates and franchises restaurants in 42 states throughout the United States. All of our Restaurant Group's revenues are generated in those states.
Employees
As of January 22, 2016, we had 54,091 full-time equivalent employees, which includes 20,681 in our Title segment, 28,414 in our Restaurant Group segment, 4,099 in the Black Knight segment and 897 in our remaining businesses. We monitor our staffing levels based on current economic activity. None of our employees are subject to collective bargaining agreements. We believe that our relations with employees are generally good.
Financial Information by Operating Segment
For financial information by operating segment, see Note R of the Notes to Consolidated Financial Statements.
14
Statement Regarding Forward-Looking Information
The statements contained in this Form 10-K or in our other documents or in oral presentations or other statements made by our management that are not purely historical are forward-looking statements within the meaning of Section 27A of the Securities Act of 1933 and Section 21E of the Securities Exchange Act of 1934, including statements regarding our expectations, hopes, intentions, or strategies regarding the future. These statements relate to, among other things, future financial and operating results of the Company. In many cases, you can identify forward-looking statements by terminology such as “may,” “will,” “should,” “expect,” “plan,” “anticipate,” “believe,” “estimate,” “predict,” “potential,” or “continue,” or the negative of these terms and other comparable terminology. Actual results could differ materially from those anticipated in these statements as a result of a number of factors, including, but not limited to the following:
• | changes in general economic, business, and political conditions, including changes in the financial markets; |
• | the severity of our title insurance claims; |
• | downgrade of our credit rating by rating agencies; |
• | adverse changes in the level of real estate activity, which may be caused by, among other things, high or increasing interest rates, a limited supply of mortgage funding, increased mortgage defaults, or a weak U.S. economy; |
• | compliance with extensive government regulation of our operating subsidiaries and adverse changes in applicable laws or regulations or in their application by regulators; |
• | regulatory investigations of the title insurance industry; |
• | loss of key personnel that could negatively affect our financial results and impair our operating abilities; |
• | our business concentration in the States of California and Texas are the source of approximately 15.1% and14.4%, respectively, of our title insurance premiums; |
• | our potential inability to find suitable acquisition candidates, as well as the risks associated with acquisitions in lines of business that will not necessarily be limited to our traditional areas of focus, or difficulties integrating acquisitions; |
• | our dependence on distributions from our title insurance underwriters as our main source of cash flow; |
• | competition from other title insurance companies; and |
• | other risks detailed in "Risk Factors" below and elsewhere in this document and in our other filings with the SEC. |
We are not under any obligation (and expressly disclaim any such obligation) to update or alter our forward-looking statements, whether as a result of new information, future events or otherwise. You should carefully consider the possibility that actual results may differ materially from our forward-looking statements.
Additional Information
Our website address is www.fnf.com. We make available free of charge on or through our website our Annual Report on Form 10-K, Quarterly Reports on Form 10-Q, Current Reports on Form 8-K and all amendments to those reports filed or furnished pursuant to Section 13(a) or 15(d) of the Securities Exchange Act of 1934, as amended, as soon as reasonably practicable after such material is electronically filed with or furnished to the Securities and Exchange Commission. However, the information found on our website is not part of this or any other report.
Item 1A. Risk Factors
In addition to the normal risks of business, we are subject to significant risks and uncertainties, including those listed below and others described elsewhere in this Annual Report on Form 10-K. Any of the risks described herein could result in a significant or material adverse effect on our results of operations or financial condition.
General
We have recorded goodwill as a result of prior acquisitions, and an economic downturn could cause these balances to become impaired, requiring write-downs that would reduce our operating income.
Goodwill aggregated approximately $4,760 million, or 34.2% of our total assets, as of December 31, 2015. Current accounting rules require that goodwill be assessed for impairment at least annually or whenever changes in circumstances indicate that the carrying amount may not be recoverable from estimated future cash flows. Factors that may be considered a change in circumstance indicating the carrying value of our intangible assets, including goodwill, may not be recoverable include, but are not limited to, significant underperformance relative to historical or projected future operating results, a significant decline in our stock price and market capitalization, and negative industry or economic trends. No goodwill impairment charge was recorded in 2015. However, if there is an economic downturn in the future, the carrying amount of our goodwill may no longer be recoverable, and we may be required to record an impairment charge, which would have a negative impact on our results of operations and financial condition. We will continue to monitor our market capitalization and the impact of the economy to determine if there is an impairment of goodwill in future periods.
Our management has articulated a willingness to seek growth through acquisitions in lines of business that will not necessarily be limited to our traditional areas of focus or geographic areas. This expansion of our business subjects us to associated
15
risks, such as the diversion of management’s attention and lack of experience in operating such businesses, and may affect our credit and ability to repay our debt.
Our management has stated that we may make acquisitions in lines of business that are not directly tied to or synergistic with our core operations. Accordingly, we have in the past acquired, and may in the future acquire, businesses in industries or geographic areas with which management is less familiar than we are with our core businesses. These activities involve risks that could adversely affect our operating results, such as diversion of management’s attention and lack of substantial experience in operating such businesses. There can be no guarantee that we will not enter into transactions or make acquisitions that will cause us to incur additional debt, increase our exposure to market and other risks and cause our credit or financial strength ratings to decline.
We are a holding company and depend on distributions from our subsidiaries for cash.
We are a holding company whose primary assets are the securities of our operating subsidiaries. Our ability to pay interest on our outstanding debt and our other obligations and to pay dividends is dependent on the ability of our subsidiaries to pay dividends or make other distributions or payments to us. If our operating subsidiaries are not able to pay dividends to us, we may not be able to meet our obligations or pay dividends on our common stock.
Our title insurance subsidiaries must comply with state laws which require them to maintain minimum amounts of working capital, surplus and reserves, and place restrictions on the amount of dividends that they can distribute to us. Compliance with these laws will limit the amounts our regulated subsidiaries can dividend to us. During 2016, our title insurers may pay dividends or make distributions to us of approximately $334 million, however, insurance regulators have the authority to prohibit the payment of ordinary dividends or other payments by our title insurers to us if they determine that such payment could be adverse to our policyholders.
The maximum dividend permitted by law is not necessarily indicative of an insurer’s actual ability to pay dividends, which may be constrained by business and regulatory considerations, such as the impact of dividends on surplus, which could affect an insurer’s ratings or competitive position, the amount of premiums that can be written and the ability to pay future dividends. Further, depending on business and regulatory conditions, we may in the future need to retain cash in our underwriters or even contribute cash to one or more of them in order to maintain their ratings or their statutory capital position. Such a requirement could be the result of investment losses, reserve charges, adverse operating conditions in the current economic environment or changes in interpretation of statutory accounting requirements by regulators.
The loss of key personnel could negatively affect our financial results and impair our operating abilities.
Our success substantially depends on our ability to attract and retain key members of our senior management team and officers. If we lose one or more of these key employees, our operating results and in turn the value of our common stock could be materially adversely affected. Although we have employment agreements with many of our officers, there can be no assurance that the entire term of the employment agreement will be served or that the employment agreement will be renewed upon expiration.
Failure of our information security systems or processes could result in a loss or disclosure of confidential information, damage to our reputation, monetary losses, additional costs and impairment of our ability to conduct business effectively.
Our core operations are highly dependent upon the effective operation of our computer systems. As part of our core operations, we electronically receive, process, store and transmit sensitive personal consumer data (such as names and addresses, social security numbers, driver's license numbers, credit card and bank account information) and important business information of our customers. We also electronically manage substantial cash, investment asset and escrow account balances on behalf of ourselves and our customers, as well as financial information about our businesses generally. The integrity of our information systems and the protection of the information that resides on such systems are important to our successful operation. If we fail to maintain an adequate security infrastructure, adapt to emerging security threats or follow our internal business processes with respect to security, the information or assets we hold could be compromised. Further, even if we (or third parties to which we outsource certain IT services) maintain a reasonable, industry standard information security infrastructure, it is possible that unauthorized persons still could obtain access to information or assets we hold. These risks are increased when we transmit information over the internet and due to increasing security risks posed by organized crime. While, to date, we believe that we have not experienced a material breach of our information security systems, the existence or scope of such events is not always apparent. If additional information regarding an incident previously considered immaterial is discovered, or a new event were to occur, it could potentially have a material adverse effect on us. In addition, some laws and certain of our contracts require notification of various parties, including consumers or customers, in the event that confidential or personal information has or may have been taken or accessed by unauthorized third parties. Such notifications can result, among other things, in adverse publicity, distraction of management's time and energy, the attention of regulatory authorities, and fines and disruptions in sales, the effects of which may be material.
Further, our financial institution customers have obligations to safeguard their information technology systems and information. In certain of our businesses, we are bound contractually and/or by regulation to comply with the same requirements. If we fail to comply with these regulations and requirements, we could be exposed to suits for breach of contract, governmental proceedings or the imposition of fines. In addition, if more restrictive privacy laws, rules or industry security requirements are
16
adopted in the future on the federal or state level or by a specific industry in which we do business, that could have an adverse impact on us through increased costs or restrictions on business processes. Any inability to prevent security or privacy breaches, or the perception that such breaches may occur, could inhibit our ability to retain existing customers or attract new customers and/or result in financial losses, litigation, increased costs or other adverse consequences to our business.
If economic and credit market conditions deteriorate, it could have a material adverse impact on our investment portfolio.
Our investment portfolio is exposed to economic and financial market risks, including changes in interest rates, credit markets and prices of marketable equity and fixed-income securities. Our investment policy is designed to maximize total return through investment income and capital appreciation consistent with moderate risk of principal, while providing adequate liquidity and complying with internal and regulatory guidelines. To achieve this objective, our marketable debt investments are primarily investment grade, liquid, fixed-income securities and money market instruments denominated in U.S. dollars. We make investments in certain equity securities and preferred stock in order to take advantage of perceived value and for strategic purposes. In the past, economic and credit market conditions have adversely affected the ability of some issuers of investment securities to repay their obligations and have affected the values of investment securities. If the carrying value of our investments exceeds the fair value, and the decline in fair value is deemed to be other-than-temporary, we will be required to write down the value of our investments, which could have a material negative impact on our results of operations and financial condition.
We own a minority interest in Ceridian, a leading provider of global human capital management and payment solutions. If the fair value of this company were to decline below book value, we would be required to write down the value of our investment, which could have a material negative impact on our results of operations and financial condition. If this company were to experience significant negative volatility in its results of operations it would have a material adverse effect on our own results of operations due to our inclusion of our portion of its earnings in our results of operations.
Our substantial indebtedness could adversely affect our ability to raise additional capital to fund our operations, limit our ability to react to changes in the economy or our industry, expose us to interest rate risk to the extent of our variable rate debt and prevent us from meeting our obligations under our indebtedness.
As of December 31, 2015, our outstanding debt was $2,793 million, including $1,403 million in variable rate debt. Our high degree of leverage could have important consequences, including the following: (i) a substantial portion of our cash flow from operations is dedicated to the payment of principal and interest on indebtedness, thereby reducing the funds available for operations, future business opportunities and capital expenditures; (ii) our ability to obtain additional financing for working capital, capital expenditures, debt service requirements, acquisitions and general corporate purposes in the future may be limited; (iii) certain of the borrowings are at variable rates of interest, which will increase our vulnerability to increases in interest rates; (iv) we may be unable to adjust rapidly to changing market conditions; (v) the debt service requirements of our other indebtedness could make it more difficult for us to satisfy our financial obligations; and (vi) we may be vulnerable in a downturn in general economic conditions or in our business and we may be unable to carry out activities that are important to our growth.
Our ability to make scheduled payments of the principal of, or to pay interest on, or to refinance indebtedness depends on and is subject to our financial and operating performance, which in turn is affected by general and regional economic, financial, competitive, business and other factors beyond our control. If we are unable to generate sufficient cash flow to service our debt or to fund our other liquidity needs, we will need to restructure or refinance all or a portion of our debt, which could cause us to default on our obligations and impair our liquidity. Any refinancing of our indebtedness could be at higher interest rates and may require us to comply with more stringent covenants that could further restrict our business operations. We from time to time may increase the amount of our indebtedness, modify the terms of our financing arrangements, issue dividends, make capital expenditures and take other actions that may substantially increase our leverage.
Title
If adverse changes in the levels of real estate activity occur, our revenues may decline.
Title insurance revenue is closely related to the level of real estate activity which includes sales, mortgage financing and mortgage refinancing. The levels of real estate activity are primarily affected by the average price of real estate sales, the availability of funds to finance purchases and mortgage interest rates.
We have found that residential real estate activity generally decreases in the following situations:
• | when mortgage interest rates are high or increasing; |
• | when the mortgage funding supply is limited; and |
• | when the United States economy is weak, including high unemployment levels. |
Declines in the level of real estate activity or the average price of real estate sales are likely to adversely affect our title insurance revenues. The Mortgage Bankers Association's ("MBA") Mortgage Finance Forecast as of February 18, 2016 estimates an approximately $1.5 trillion mortgage origination market for 2016, which would be a decrease of 6.3% from 2015. The MBA forecasts that the 6.3% decrease will result from a decrease in refinance activity, offset by a slight increase in forecast purchase
17
transactions. Our revenues in future periods will continue to be subject to these and other factors which are beyond our control and, as a result, are likely to fluctuate.
If financial institutions at which we hold escrow funds fail, it could have a material adverse impact on our company.
We hold customers' assets in escrow at various financial institutions, pending completion of real estate transactions. These assets are maintained in segregated bank accounts and have not been included in the accompanying Consolidated Balance Sheets. We have a contingent liability relating to proper disposition of these balances for our customers, which amounted to $14.3 billion at December 31, 2015. Failure of one or more of these financial institutions may lead us to become liable for the funds owed to third parties and there is no guarantee that we would recover the funds deposited, whether through Federal Deposit Insurance Corporation coverage or otherwise.
If we experience changes in the rate or severity of title insurance claims, it may be necessary for us to record additional charges to our claim loss reserve. This may result in lower net earnings and the potential for earnings volatility.
By their nature, claims are often complex, vary greatly in dollar amounts and are affected by economic and market conditions and the legal environment existing at the time of settlement of the claims. Estimating future title loss payments is difficult because of the complex nature of title claims, the long periods of time over which claims are paid, significantly varying dollar amounts of individual claims and other factors. From time to time, we experience large losses or an overall worsening of our loss payment experience in regard to the frequency or severity of claims that require us to record additional charges to our claims loss reserve. There are currently pending several large claims which we believe can be defended successfully without material loss payments. However, if unanticipated material payments are required to settle these claims, it could result in or contribute to additional charges to our claim loss reserves. These loss events are unpredictable and adversely affect our earnings.
At each quarter end, our recorded reserve for claim losses is initially the result of taking the prior recorded reserve for claim losses, adding the current provision to that balance and subtracting actual paid claims from that balance, resulting in an amount that management then compares to our actuary's central estimate provided in the actuarial calculation. Due to the uncertainty and judgment used by both management and our actuary, our ultimate liability may be greater or less than our current reserves and/or our actuary’s calculation. If the recorded amount is within a reasonable range of the actuary’s central estimate, but not at the central estimate, management assesses other factors in order to determine our best estimate. These factors, which are both qualitative and quantitative, can change from period to period and include items such as current trends in the real estate industry (which management can assess, but for which there is a time lag in the development of the data used by our actuary), any adjustments from the actuarial estimates needed for the effects of unusually large or small claims, improvements in our claims management processes, and other cost saving measures. Depending upon our assessment of these factors, we may or may not adjust the recorded reserve. If the recorded amount is not within a reasonable range of the actuary’s central estimate, we would record a charge or credit and reassess the provision rate on a go forward basis.
Our average provision for claim losses was 5.7% of title premiums in 2015. We will reassess the provision to be recorded in future periods consistent with this methodology and can make no assurance that we will not need to record additional charges in the future to increase reserves in respect of prior periods.
Our insurance subsidiaries must comply with extensive regulations. These regulations may increase our costs or impede or impose burdensome conditions on actions that we might seek to take to increase the revenues of those subsidiaries.
Our insurance businesses are subject to extensive regulation by state insurance authorities in each state in which they operate. These agencies have broad administrative and supervisory power relating to the following, among other matters:
• | licensing requirements; |
• | trade and marketing practices; |
• | accounting and financing practices; |
• | disclosure requirements on key terms of mortgage loans; |
• | capital and surplus requirements; |
• | the amount of dividends and other payments made by insurance subsidiaries; |
• | investment practices; |
• | rate schedules; |
• | deposits of securities for the benefit of policyholders; |
• | establishing reserves; and |
• | regulation of reinsurance. |
Most states also regulate insurance holding companies like us with respect to acquisitions, changes of control and the terms of transactions with our affiliates. State regulations may impede or impose burdensome conditions on our ability to increase or maintain rate levels or on other actions that we may want to take to enhance our operating results. In addition, we may incur significant costs in the course of complying with regulatory requirements. Further, various state legislatures have in the past considered offering a public alternative to the title industry in their states, as a means to increase state government revenues.
18
Although we think this situation is unlikely, if one or more such takeovers were to occur they could adversely affect our business. We cannot be assured that future legislative or regulatory changes will not adversely affect our business operations. See “Item 1. Business — Regulation.”
State regulation of the rates we charge for title insurance could adversely affect our results of operations.
Our title insurance subsidiaries are subject to extensive rate regulation by the applicable state agencies in the jurisdictions in which they operate. Title insurance rates are regulated differently in various states, with some states requiring the subsidiaries to file and receive approval of rates before such rates become effective and some states promulgating the rates that can be charged. In almost all states in which our title subsidiaries operate, our rates must not be excessive, inadequate or unfairly discriminatory.
Regulatory investigations of the insurance industry may lead to fines, settlements, new regulation or legal uncertainty, which could negatively affect our results of operations.
From time to time we receive inquiries and requests for information from state insurance departments, attorneys general and other regulatory agencies about various matters relating to our business. Sometimes these take the form of civil investigative demands or subpoenas. We cooperate with all such inquiries and we have responded to or are currently responding to inquiries from multiple governmental agencies. Also, regulators and courts have been dealing with issues arising from foreclosures and related processes and documentation. Various governmental entities are studying the title insurance product, market, pricing, and business practices, and potential regulatory and legislative changes, which may materially affect our business and operations. From time to time, we are assessed fines for violations of regulations or other matters or enter into settlements with such authorities which may require us to pay fines or claims or take other actions.
Because we are dependent upon California and Texas for approximately 15.1% and 14.4% and of our title insurance premiums, respectively, our business may be adversely affected by regulatory conditions in Texas and/or California.
California and Texas are the two largest sources of revenue for our title segment and, in 2015, California-based premiums accounted for 29.0% of premiums earned by our direct operations and 1.1% of our agency premium revenues. Texas-based premiums accounted for 17.7% of premiums earned by our direct operations and 11.0% of our agency premium revenues. In the aggregate, California and Texas accounted for approximately 15.1% and 14.4%, respectively, of our total title insurance premiums for 2015. A significant part of our revenues and profitability are therefore subject to our operations in California and Texas and to the prevailing regulatory conditions in California and Texas. Adverse regulatory developments in Texas and California, which could include reductions in the maximum rates permitted to be charged, inadequate rate increases or more fundamental changes in the design or implementation of the Texas and California title insurance regulatory framework, could have a material adverse effect on our results of operations and financial condition.
If the rating agencies downgrade our insurance companies, our results of operations and competitive position in the title insurance industry may suffer.
Ratings have always been an important factor in establishing the competitive position of insurance companies. Our title insurance subsidiaries are rated by S&P, Moody’s, A.M. Best, and Demotech. Ratings reflect the opinion of a rating agency with regard to an insurance company’s or insurance holding company’s financial strength, operating performance and ability to meet its obligations to policyholders and are not evaluations directed to investors. Our ratings are subject to continued periodic review by rating agencies and the continued retention of those ratings cannot be assured. If our ratings are reduced from their current levels by those entities, our results of operations could be adversely affected.
Black Knight
Black Knight's clients and Black Knight are subject to various governmental regulations, and a failure to comply with government regulations or changes in these regulations could result in penalties, restrict or limit it or its clients’ operations or make it more burdensome to conduct such operations, any of which could have a material adverse effect on its business, financial condition and results of operations.
Many of Black Knight's clients and its businesses are subject to various federal, state, local and foreign laws and regulations. Black Knight's failure to comply with applicable laws and regulations could restrict its ability to provide certain services or result in imposition of civil fines and criminal penalties, substantial regulatory and compliance costs, litigation expense, adverse publicity and loss of revenue.
As a provider of electronic data processing to financial institutions, such as banks and credit unions, Black Knight is subject to regulatory oversight and examination by the Federal Financial Institutions Examination Council, an interagency body of the Federal Reserve Board, the Office of the Comptroller of the Currency, or the OCC, the Federal Deposit Insurance Corporation, or the FDIC, and various other federal and state regulatory authorities. In addition, independent auditors annually review several of the Black Knight operations to provide reports on internal controls for its clients’ auditors and regulators. Black Knight may be subject to review by state agencies that regulate banks in each state in which it conducts its electronic processing activities.
19
In addition, Black Knight is subject to an increasing degree of compliance oversight by regulators and by its clients. Specifically, the CFPB has authority to write rules affecting the business of, supervise, conduct examinations of, and enforce compliance as to federal consumer financial protection laws and regulations with respect to certain “non-depository covered persons” determined by the CFPB to be “larger participants” that offer consumer financial products and services. The CFPB and other financial institution regulators such as the OCC also have the authority to examine Black Knight in its role as a service provider to large financial institutions, although it is yet unclear how broadly they will apply this authority going forward. In addition, some of Black Knight's largest bank clients are subject to consent orders with the OCC and/or are parties to the National Mortgage Settlement, both of which require them to exercise greater oversight and perform more rigorous audits of their key vendors such as Black Knight.
The Real Estate Settlement Procedures Act, or RESPA, and related regulations generally prohibit the payment or receipt of fees or any other item of value for the referral of real estate-related settlement services. RESPA also prohibits fee shares or splits or unearned fees in connection with the provision of residential real estate settlement services, such as mortgage brokerage and real estate brokerage. Notwithstanding these prohibitions, RESPA permits payments for goods furnished or for services actually performed, so long as those payments bear a reasonable relationship to the market value of the goods or services provided. RESPA and related regulations may to some extent restrict our real estate-related businesses from entering into certain preferred alliance arrangements. The CFPB is responsible for enforcing RESPA.
Changes to laws and regulations and enhanced regulatory oversight of our clients and us may compel us to increase our prices in certain situations or decrease our prices in other situations, may restrict our ability to implement price increases, or otherwise limit the manner in which Black Knight conducts its business. In addition, in response to increased regulatory oversight, participants in the mortgage lending industry may develop policies pursuant to which they limit the extent to which they can rely on any one vendor or service provider. If we are unable to adapt our products and services to conform to the new laws and regulations, or if these laws and regulations have a negative impact on our clients, we may experience client losses or increased operating costs, which could have a material adverse effect on our business, financial condition and results of operations.
Black Knight relies on its top clients for a significant portion of its revenue and profit, which makes it susceptible to the same macro-economic and regulatory factors that impact its clients. If these clients are negatively impacted by current economic or regulatory conditions or otherwise experience financial hardship or stress, or if the terms of its relationships with these clients change, it could have a material adverse effect on its business, financial condition and results of operations.
Black Knight operates in a consolidated industry and as a result, a small number of its clients have accounted for a significant portion of its revenues. We expect that a limited number of Black Knight's clients will continue to represent a significant portion of its revenues for the foreseeable future. During the year ended December 31, 2015, Black Knight's largest client, Wells Fargo, N.A., or Wells Fargo, accounted for approximately 12% of its consolidated revenues. During the year ended December 31, 2015, Black Knight's five largest clients accounted for approximately 37% of its consolidated revenues.
Black Knight's clients face continued pressure in the current economic and regulatory climate. Many of Black Knight's relationships with these clients are long-standing and are important to its business and results of operations, but there is no guarantee that Black Knight will be able to retain or renew existing agreements or maintain its relationships on acceptable terms or at all. Additionally, Black Knight relies on cross-selling its products and services to its existing clients as a source of growth. The deterioration in or termination of any of these relationships could significantly reduce its revenue and could have a material adverse effect on its business, financial condition and results of operations. As a result, Black Knight may be disproportionately affected by declining revenue from, or loss of, a significant Black Knight client. In addition, by virtue of their significant relationships with us, these clients may be able to exert pressure on Black Knight with respect to the pricing of their services.
There may be consolidation in Black Knight's end client market, which would reduce the use of its services by its clients and could have a material adverse effect on its business, financial condition and results of operations.
Mergers or consolidations among existing or potential clients could reduce the number of Black Knight's clients and potential clients. If Black Knight's clients merge with or are acquired by other entities that are not Black Knight's clients, or that use fewer of Black Knight's services, they may discontinue or reduce their use of Black Knight's services. In addition, if potential clients merge, Black Knight's ability to increase its client base may be adversely affected and the ability of Black Knight's customers to exert pressure on Black Knight's pricing may increase. Any of these developments could have a material adverse effect on Black Knight's business, financial condition and results of operations.
If Black Knight fails to adapt its solutions to technological changes or evolving industry standards, or if Black Knight's ongoing efforts to upgrade its technology are not successful, Black Knight could lose clients and have difficulty attracting new clients for its solutions, which could have a material adverse effect on its business, financial condition and results of operations.
The markets for Black Knight's solutions are characterized by constant technological changes, frequent introductions of new products and services and evolving industry standards. Black Knight's future success will be significantly affected by Black Knight's ability to successfully enhance Black Knight's current solutions, and develop and introduce new solutions and services that address the increasingly sophisticated needs of Black Knight's clients and their customers. These initiatives carry the risks associated with
20
any new product or service development effort, including cost overruns, delays in delivery and performance issues. There can be no assurance that Black Knight will be successful in developing, marketing and selling new solutions and services that meet these changing demands, that Black Knight will not experience difficulties that could delay or prevent the successful development, introduction, and marketing of these solutions and services, or that Black Knight's new solutions and services and their enhancements will adequately meet the demands of the marketplace and achieve market acceptance. If Black Knight's efforts are unsuccessful, it could have a material adverse effect on Black Knight's business, financial condition and results of operations.
Black Knight operates in a competitive business environment and, if Black Knight is unable to compete effectively, it could have a material adverse effect on its business, financial condition and results of operations.
The markets for Black Knight's solutions are intensely competitive. Black Knight's competitors vary in size and in the scope and breadth of the services they offer. Some of Black Knight's competitors have substantial resources. In addition, Black Knight expects that the markets in which Black Knight competes will continue to attract new competitors and new technologies. There can be no assurance that Black Knight will be able to compete successfully against current or future competitors or that competitive pressures Black Knight faces in the markets in which Black Knight operates will not have a material adverse effect on its business, financial condition and results of operations.
Further, because many of Black Knight's larger potential clients have historically developed their key processing applications in-house and therefore view their system requirements from a make-versus-buy perspective, Black Knight often competes against Black Knight's potential clients’ in-house capacities. There can be no assurance that Black Knight's strategies for overcoming potential clients’ reluctance to change will be successful, and if Black Knight is unsuccessful, it could have a material adverse effect on Black Knight's business, financial condition and results of operations.
Black Knight relies on proprietary technology and information rights, and if Black Knight is unable to protect its rights, it could have a material adverse effect on Black Knight's business, financial condition and results of operations.
Black Knight's success depends, in part, upon its intellectual property rights. Black Knight relies primarily on a combination of patents, copyrights, trade secrets, and trademark laws and nondisclosure and other contractual restrictions on copying, distribution and creation of derivative products to protect Black Knight's proprietary technology and information. This protection is limited, and Black Knight's intellectual property could be used by others without their consent. In addition, patents may not be issued with respect to Black Knight's pending or future patent applications, and Black Knight's patents may not be upheld as valid or may not prevent the development of competitive products. Any infringement, disclosure, loss, invalidity of, or failure to protect Black Knight's intellectual property could have a material adverse effect on its business, financial condition and results of operations. Moreover, litigation may be necessary to enforce or protect its intellectual property rights, to protect its trade secrets, or to determine the validity and scope of the proprietary rights of others. Such litigation could be time-consuming, result in substantial costs and diversion of resources and could have a material adverse effect on its business, financial condition and results of operations.
Because Black Knight's revenue from clients in the mortgage lending industry is affected by the strength of the economy and the housing market generally, including the volume of real estate transactions, a change in any of these conditions could have a material adverse effect on its business, financial condition and results of operations.
Black Knight's revenue is primarily generated from technology, data and analytics Black Knight provides to the mortgage lending industry and, as a result, a weak economy or housing market may have a material adverse effect on Black Knight's business, financial condition and results of operations. The volume of mortgage origination and residential real estate transactions is highly variable and reductions in these transaction volumes could have a direct impact on the revenues Black Knight generates.
The revenues Black Knight generates from its servicing technology depend upon the total number of mortgage loans processed on its MSP platform, which tends to be comparatively consistent regardless of economic conditions. However, in the event that a difficult economy or other factors lead to a decline in levels of home ownership and a reduction in the number of mortgage loans outstanding and Black Knight is not able to counter the impact of those events with increased market share or higher fees, Black Knight's mortgage processing revenues could be adversely affected. Moreover, negative economic conditions, including increased unemployment or interest rates or a downturn in other general economic factors, among other things, could adversely affect the performance and financial condition of some of Black Knight's clients in many of its businesses, which may have a material adverse effect on its business, financial condition and results of operations if these clients exit certain businesses.
A weaker economy and housing market tend to increase the volume of consumer mortgage defaults, which can increase revenues from Black Knight's applications focused on supporting default management functions. However, government regulation of the mortgage industry in general, and the default and foreclosure process in particular, has greatly slowed the processing of defaulted mortgages in recent years and has changed the way many of its clients address mortgage loans in default. A downturn in the origination market and a concurrent slowdown or change in the way mortgage loans in default are addressed could have a material adverse effect on its business, financial condition and results of operations.
21
FNFV
Our operations could be adversely affected by the results of our acquired restaurant companies due to the risks inherent in that segment.
Our acquired restaurant companies face certain risks that could negatively impact their results of operations. These risks include such things as the risks of unfavorable economic conditions, changing consumer preferences, unfavorable publicity, increasing food and labor costs, effectiveness of marketing campaigns, and the ability to compete successfully with other restaurants. In addition, risks related to supply chain, food quality, and protecting guests' personal information are inherent to the restaurant business. These companies are also subject to compliance with extensive government laws and regulations related to employment practices and policies and the manufacture, preparation, and sale of food and alcohol. If our restaurant companies are not able to respond effectively to one or more of these risks, it could have a material adverse impact on the results of operations of those businesses.
Risks Relating to the Ownership of Our FNFV Group Common Stock due to our Tracking Stock Capitalization
Holders of FNF Group common stock and FNFV Group common stock are common shareholders of FNF and are, therefore, subject to risks associated with an investment in FNF as a whole, even if a holder does not own shares of common stock of both of our groups.
Even though we have attributed, for financial reporting purposes, all of our consolidated assets, liabilities, revenue, expenses to either the FNF Group or the FNFV Group in order to prepare separate financial results for each of these groups included herein, we retain legal title to all of our assets and our capitalization does not limit our legal responsibility, or that of our subsidiaries, for the liabilities included in any disclosed financial results. Holders of FNF Group common stock and FNFV Group common stock do not have any legal rights related to specific assets attributed to the FNF Group or the FNFV Group and, in any liquidation, holders of FNF Group common stock and holders of FNFV Group common stock will be entitled to receive a pro rata share of our available net assets based on their respective numbers of liquidation units as specified in our certificate of incorporation (our "Corporate Charter").
Our Board of Directors’ ability to reattribute businesses, assets and expenses between tracking stock groups may make it difficult to assess the future prospects of either tracking stock group based on its past performance.
Our Board of Directors is vested with discretion to reattribute businesses, assets and liabilities that are attributed to one tracking stock group to the other tracking stock group, without the approval of any of our shareholders, in accordance with our management and allocation policies and our Corporate Charter. Any such reattribution made by our Board of Directors, as well as the existence of the right in and of itself to effect a reattribution, may impact the ability of investors to assess the future prospects of either tracking stock group, including its liquidity and capital resource needs, based on its past performance. Shareholders may also have difficulty evaluating the liquidity and capital resources of each group based on past performance, as our Board of Directors may use one group’s liquidity to fund the other group’s liquidity and capital expenditure requirements through the use of inter-group loans and inter-group interests.
We could be required to use assets attributed to one group to pay liabilities attributed to the other group.
The assets attributed to one group are potentially subject to the liabilities attributed to the other group, even if those liabilities arise from lawsuits, contracts or indebtedness that are attributed to such other group. While our current management and allocation policies provide that reattributions of assets between groups will result in the creation of an inter-group loan or an inter-group interest or an offsetting reattribution of cash or other assets, no provision of our Corporate Charter prevents us from satisfying liabilities of one group with assets of the other group, and our creditors will not in any way be limited by our tracking stock capitalization from proceeding against any assets they could have proceeded against if we did not have a tracking stock capitalization.
The market price of FNF Group common stock and FNFV Group common stock may not reflect the performance of the FNF Group and the FNFV Group, respectively, as we intend.
We cannot assure you that the market price of the common stock of a group will, in fact, reflect the performance of the group of businesses, assets and liabilities attributed to that group. Holders of FNF Group common stock and FNFV Group common stock are common shareholders of FNF as a whole and, as such, will be subject to all risks associated with an investment in FNF and all of our businesses, assets and liabilities. As a result, the market price of each class of stock of a group may simply reflect the performance of FNF as a whole or may more independently reflect the performance of some or all of the group of assets attributed to such group. In addition, investors may discount the value of the stock of a group because it is part of a common enterprise rather than a stand-alone entity.
22
The market price of FNF Group common stock and FNFV Group common stock may be volatile, could fluctuate substantially and could be affected by factors that do not affect traditional common stock.
To the extent the market prices of FNF Group common stock and FNFV Group common stock track the performance of more focused groups of businesses, assets and liabilities than the historic FNF Class A common stock did, the market prices of these new tracking stocks may be more volatile than the market price of FNF Class A common stock was historically. The market prices of FNF Group common stock and FNFV Group common stock may be materially affected by, among other things:
• | actual or anticipated fluctuations in a group’s operating results or in the operating results of particular companies attributable to such group; |
• | potential acquisition activity by FNF or the companies in which we invest; |
• | issuances of debt or equity securities to raise capital by FNF or the companies in which we invest and the manner in which that debt or the proceeds of an equity issuance are attributed to each of the groups; |
• | changes in financial estimates by securities analysts regarding FNF Group common stock or FNFV Group common stock or the companies attributable to either of our tracking stock groups; |
• | the complex nature and the potential difficulties investors may have in understanding the terms of both of our tracking stocks, as well as concerns regarding the possible effect of certain of those terms on an investment in our stock; and |
• | general market conditions. |
The market value of FNF Group common stock and FNFV Group common stock could be adversely affected by events involving the assets and businesses attributed to either of the groups.
Because we are the issuer of FNF Group common stock and FNFV Group common stock, an adverse market reaction to events relating to the assets and businesses attributed to either of our groups, such as earnings announcements or announcements of new products or services, acquisitions or dispositions that the market does not view favorably, may cause an adverse reaction to the common stock of the other group. This could occur even if the triggering event is not material to us as a whole. A certain triggering event may also have a greater impact on one group than the same triggering event would have on the other group due to the asset composition of the affected group. In addition, the incurrence of significant indebtedness by us or any of our subsidiaries on behalf of one group, including indebtedness incurred or assumed in connection with acquisitions of or investments in businesses, could affect our credit rating and that of our subsidiaries and, therefore, could increase the borrowing costs of businesses attributable to our other group or the borrowing costs of FNF as a whole.
We may not pay dividends equally or at all on FNF Group common stock or FNFV Group common stock.
FNF has historically paid quarterly dividends to its shareholders. We have the right to pay dividends on the shares of common stock of each group in equal or unequal amounts, and we may pay dividends on the shares of common stock of one group and not pay dividends on shares of common stock of the other group. In addition, any dividends or distributions on, or repurchases of, shares relating to either group will reduce our assets legally available to be paid as dividends on the shares relating to the other group.
Our tracking stock capital structure could create conflicts of interest, and our Board of Directors may make decisions that could adversely affect only some holders of our common stock.
Our tracking stock capital structure could give rise to occasions when the interests of holders of stock of one group might diverge or appear to diverge from the interests of holders of stock of the other group. In addition, given the nature of their businesses, there may be inherent conflicts of interests between the FNF Group and the FNFV Group. Our tracking stock groups are not separate entities and thus holders of FNF Group common stock and FNFV Group common stock do not have the right to elect separate Boards of Directors. As a result, our FNF’s officers and directors owe fiduciary duties to FNF as a whole and all of our shareholders as opposed to only holders of a particular group. Decisions deemed to be in the best interest of our Company and all of our shareholders may not be in the best interest of a particular group when considered independently. Examples include:
• | decisions as to the terms of any business relationships that may be created between the FNF Group and the FNFV Group or the terms of any reattributions of assets between the groups; |
• | decisions as to the allocation of consideration among the holders of FNF Group common stock and FNFV Group common stock to be received in connection with a merger involving FNF; |
• | decisions as to the allocation of corporate opportunities between the groups, especially where the opportunities might meet the strategic business objectives of both groups; |
• | decisions as to operational and financial matters that could be considered detrimental to one group but beneficial to the other; |
• | decisions as to the conversion of shares of common stock of one group into shares of common stock of the other, which the Board of Directors may make in its sole discretion, so long as the shares are converted (other than in connection with the disposition of all or substantially all of a group’s assets) at a ratio that provides the shareholders of the converted stock with a premium based on the following requirements: |
23
(i) a 10% premium to such stock’s market price for the first year following the recapitalization,
(ii) an 8% premium to such stock’s market price for the second year following the recapitalization,
(iii) a 6% premium to such stock’s market price for the third year following the recapitalization,
(iv) a 4% premium to such stock’s market price for fourth year following the recapitalization,
(v) a 2% premium to such stock’s market price for the fifth year following the recapitalization, and
(vi) no premium to such stock’s market price thereafter, with such premium to be based on, in each case, the market price of such stock over the 10 day trading period preceding the date on the which the Board of Directors determines to effect any such conversion; no conversion premium is available for a conversion in connection with the disposition of all or substantially all of the assets of either group;
▪ | decisions regarding the creation of, and, if created, the subsequent increase or decrease of any intergroup interest that one group may own in the other group; |
• | decisions as to the internal or external financing attributable to businesses or assets attributed to either of our groups; |
• | decisions as to the dispositions of assets of either of our groups; and |
• | decisions as to the payment of dividends on the stock relating to either of our groups. |
Our directors’ or officers’ ownership of FNF Group common stock and FNFV Group common stock may create or appear to create conflicts of interest.
If directors or officers own disproportionate interests (in percentage or value terms) in FNF Group common stock or FNFV Group common stock, that disparity could create or appear to create conflicts of interest when they are faced with decisions that could have different implications for the holders of FNF Group common stock or FNFV Group common stock.
We have not adopted any specific procedures for consideration of matters involving a divergence of interests among holders of shares of stock relating to our two groups.
Rather than develop additional specific procedures in advance, our Board of Directors intends to exercise its judgment from time to time, depending on the circumstances, as to how best to:
• | obtain information regarding the divergence (or potential divergence) of interests; |
• | determine under what circumstances to seek the assistance of outside advisers; |
• | determine whether a committee of our Board of Directors should be appointed to address a specific matter and the appropriate members of that committee; and |
• | assess what is in our best interest and the best interest of all of our shareholders. |
Our Board of Directors believes the advantage of retaining flexibility in determining how to fulfill its responsibilities in any such circumstances as they may arise outweighs any perceived advantages of adopting additional specific procedures in advance.
Our Board of Directors may change the management and allocation policies following their implementation to the detriment of either group without shareholder approval.
Our Board of Directors intends to adopt certain management and allocation policies as guidelines in making decisions regarding the relationships between the FNF Group and the FNFV Group with respect to matters such as tax liabilities and benefits, inter-group loans, inter-group interests, attribution of assets, financing alternatives, corporate opportunities and similar items. These policies also set forth the initial focuses and strategies of these groups and the initial attribution of our businesses, assets and liabilities between them. Our Board of Directors may at any time change or make exceptions to these policies. Because these policies relate to matters concerning the day-to-day management of FNF as opposed to significant corporate actions, such as a merger involving FNF or a sale of substantially all of our assets, no shareholder approval is required with respect to policy adoption or amendment. A decision to change, or make exceptions to, these policies or adopt additional policies could disadvantage one group while advantaging the other.
Holders of shares of stock relating to a particular group may not have any remedies if any action by our Directors or Officers has an adverse effect on only that stock.
Principles of Delaware law and the provisions of our Corporate Charter may protect decisions of our Board of Directors that have a disparate impact upon holders of shares of stock relating to a particular group. Under Delaware law, the Board of Directors has a duty to act with due care and in the best interests of all shareholders, regardless of the stock held. Principles of Delaware law established in cases involving differing treatment of multiple classes or series of stock provide that a Board of Directors owes an equal duty to all shareholders and does not have separate or additional duties to any subset of shareholders. Judicial opinions in Delaware involving tracking stocks have established that decisions by directors or officers involving differing treatment of holders of tracking stocks may be judged under the business judgment rule. In some circumstances, our directors or officers may be required to make a decision that is viewed as adverse to the holders of shares relating to a particular group. Under the principles of Delaware law and the business judgment rule referred to above, you may not be able to successfully challenge decisions that you believe have a disparate impact upon the shareholders of one of our groups if a majority of our Board of Directors is disinterested
24
and independent with respect to the action taken, is adequately informed with respect to the action taken and acts in good faith and in the honest belief that the Board of Directors is acting in the best interest of FNF and our shareholders as a whole.
Shareholders will not vote on how to attribute consideration received in connection with a merger involving FNF among holders of FNF Group common stock and FNFV Group common stock.
Our Corporate Charter does not contain any provisions governing how consideration received in connection with a merger or consolidation involving FNF is to be attributed to the holders of FNF Group common stock and holders of FNFV Group common stock, and none of the holders of FNF Group common stock or FNFV Group common stock will have a separate class vote in the event of such a merger or consolidation. Consistent with applicable principles of Delaware law, our Board of Directors will seek to divide the type and amount of consideration received in a merger or consolidation involving FNF among holders of FNF Group common stock and FNFV Group common stock in a fair manner. As the different ways our Board of Directors may divide the consideration between holders of stock relating to the different groups might have materially different results, the consideration to be received by holders of FNF Group common stock and FNFV Group common stock in any such merger or consolidation may be materially less valuable than the consideration they would have received if they had a separate class vote on such merger or consolidation.
We may dispose of assets of the FNF Group or the FNFV Group without your approval.
Delaware law requires shareholder approval only for a sale or other disposition of all or substantially all of the assets of FNF taken as a whole, and our Corporate Charter does not require a separate class vote in the case of a sale of a significant amount of assets of any of our groups. As long as the assets attributed to the FNF Group or the FNFV Group proposed to be disposed of represent less than substantially all of our assets, we may approve sales and other dispositions of any amount of the assets of such group without any shareholder approval. If we dispose of all or substantially all of the assets attributed to any group (which means, for this purpose, assets representing 80% of the fair market value of the total assets of the disposing group, as determined by our Board of Directors), we would be required, if the disposition is not an exempt disposition under the terms of our Corporate Charter, to choose one or more of the following three alternatives:
• | declare and pay a dividend on the disposing group’s common stock; |
• | redeem shares of the disposing group’s common stock in exchange for cash, securities or other property; and/or |
• | convert all or a portion of the disposing group’s outstanding common stock into common stock of the other group. |
In this type of a transaction, holders of the disposing group’s common stock may receive less value than the value that a third-party buyer might pay for all or substantially all of the assets of the disposing group. Our Board of Directors will decide, in its sole discretion, how to proceed and is not required to select the option that would result in the highest value to holders of any group of our common stock.
Holders of FNF Group common stock or FNFV Group common stock may receive less consideration upon a sale of the assets attributed to that group than if that group were a separate company.
If the FNF Group or the FNFV Group were a separate, independent company and its shares were acquired by another person, certain costs of that sale, including corporate level taxes, might not be payable in connection with that acquisition. As a result, shareholders of a separate, independent company with the same assets might receive a greater amount of proceeds than the holders of FNF Group common stock or FNFV Group common stock would receive upon a sale of all or substantially all of the assets of the group to which their shares relate. In addition, we cannot assure you that in the event of such a sale the per share consideration to be paid to holders of FNF Group common stock or FNFV Group common stock, as the case may be, will be equal to or more than the per share value of that share of stock prior to or after the announcement of a sale of all or substantially all of the assets of the applicable group. Further, there is no requirement that the consideration paid be tax-free to the holders of the shares of common stock of that group. Accordingly, if we sell all or substantially all of the assets attributed to the FNF Group or the FNFV Group, our shareholders could suffer a loss in the value of their investment in FNF.
In the event of a liquidation of FNF, holders of FNF Group common stock and FNFV Group common stock will not have a priority with respect to the assets attributed to the related tracking stock group remaining for distribution to shareholders.
Under the Corporate Charter, upon FNF’s liquidation, dissolution or winding up, holders of the FNF Group common stock and the FNFV Group common stock will be entitled to receive, in respect of their shares of such stock, their proportionate interest in all of FNF’s assets, if any, remaining for distribution to holders of common stock in proportion to their respective number of “liquidation units” per share. Relative liquidation units will be based on the volume weighted average prices of the FNF Group common stock and the FNFV Group common stock over the 10 trading day period commencing shortly after the initial filing of the Corporate Charter. Hence, the assets to be distributed to a holder of either tracking stock upon a liquidation, dissolution or winding up of FNF will have nothing to do with the value of the assets attributed to the related tracking stock group or to changes in the relative value of the FNF Group common stock and the FNFV Group common stock over time.
25
Our Board of Directors may in its sole discretion elect to convert the common stock relating to one group into common stock relating to the other group, thereby changing the nature of your investment and possibly diluting your economic interest in FNF, which could result in a loss in value to you.
Our Corporate Charter permits our Board of Directors, in its sole discretion, to convert all of the outstanding shares of common stock relating to either of our groups into shares of common stock of the other group so long as the shares are converted at a ratio that provides the shareholders of the converted stock with the applicable Conversion Premium (if any) to which they are entitled. A conversion would preclude the holders of stock in each group involved in such conversion from retaining their investment in a security that is intended to reflect separately the performance of the relevant group. We cannot predict the impact on the market value of our stock of (1) our Board of Directors’ ability to effect any such conversion or (2) the exercise of this conversion right by FNF. In addition, our Board of Directors may effect such a conversion at a time when the market value of our stock could cause the shareholders of one group to be disadvantaged.
Holders of FNF Group common stock and FNFV Group common stock vote together and have limited separate voting rights.
Holders of FNF Group common stock and FNFV Group common stock vote together as a single class, except in certain limited circumstances prescribed by our Corporate Charter and under Delaware law. Each share of common stock of each group has one vote per share. When holders of FNF Group common stock and FNFV Group common stock vote together as a single class, holders having a majority of the votes are in a position to control the outcome of the vote even if the matter involves a conflict of interest among our shareholders or has a greater impact on one group than the other.
Our capital structure, as well as the fact that the FNF Group and the FNFV Group are not independent companies may inhibit or prevent acquisition bids for the FNF Group or the FNFV Group and may make it difficult for a third party to acquire us, even if doing so may be beneficial to our shareholders.
If the FNF Group and the FNFV Group were separate independent companies, any person interested in acquiring the FNF Group or the FNFV Group without negotiating with management could seek control of that group by obtaining control of its outstanding voting stock, by means of a tender offer, or by means of a proxy contest. Although we intend FNF Group common stock and FNFV Group common stock to reflect the separate economic performance of the FNF Group and the FNFV Group, respectively, those groups are not separate entities and a person interested in acquiring only one group without negotiation with our management could obtain control of that group only by obtaining control of a majority in voting power of all of the outstanding shares of common stock of FNF. The existence of shares of common stock relating to different groups could present complexities and in certain circumstances pose obstacles, financial and otherwise, to an acquiring person that are not present in companies that do not have capital structures similar to ours. Certain provisions of our Corporate Charter and bylaws may discourage, delay or prevent a change in control of FNF that a shareholder may consider favorable. These provisions include:
• | classifying our Board of Directors with staggered three-year terms, which may lengthen the time required to gain control of our Board of Directors; |
• | limiting who may call special meetings of shareholders; |
• | establishing advance notice requirements for nominations of candidates for election to our board of directors; and |
• | the existence of authorized and unissued stock, including “blank check” preferred stock, which could be issued by our Board of Directors to persons friendly to our then current management, thereby protecting the continuity of our management, or which could be used to dilute the stock ownership of persons seeking to obtain control of FNF. |
Item 1B. | Unresolved Staff Comments |
None.
Item 2. | Properties |
Our corporate headquarters are on our campus in Jacksonville, Florida in owned facilities.
Title
The majority of our branch offices are leased from third parties. See Note M to the Notes to Consolidated Financial Statements included in Item 8 of Part II of this report for further information on our outstanding leases. Our subsidiaries conduct their business operations primarily in leased office space in 44 states, Washington, DC, Puerto Rico, Canada and India.
Black Knight
Black Knight is headquartered in Jacksonville, Florida in an owned facility. It also owns one facility in Sharon, Pennsylvania, and leases office space in 13 states and India.
Restaurant Group
The Restaurant Group's headquarters are located in Nashville, Tennessee with other office locations in Woburn, Massachusetts and Denver, Colorado. The majority of the restaurants are leased from third parties, and are located in 42 states.
26
Item 3. | Legal Proceedings |
For a description of our legal proceedings see discussion of Legal and Regulatory Contingencies in Note M to the Consolidated Financial Statements included in Item 8 of Part II of this Report, which is incorporated by reference into this Part I, Item 3.
PART II
Item 5. | Market for Registrant's Common Equity, Related Stockholder Matters and Issuer Purchases of Equity Securities |
On June 30, 2014, we completed the approved recapitalization of FNF common stock into two tracking stocks, FNF Group common stock and FNFV Group common stock. Each share of the previously outstanding FNF Class A common stock ("Old FNF common stock") was converted into one share of FNF Group common stock, which continues to trade under the trading symbol "FNF," and 0.3333 of a share of FNFV Group common stock, which trades under the trading symbol "FNFV." Both FNF and FNFV began regular trading on July 1, 2014. Both classes of our common stock trade on the New York Stock Exchange.
The following tables provide the high and low closing sales prices of each class of our common stock and cash dividends declared per share of common stock for each quarter during 2015 and 2014.
FNF Group | Stock Price High | Stock Price Low | Cash Dividends Declared | ||||||||
Year ended December 31, 2015 | |||||||||||
First quarter | $ | 38.41 | $ | 34.29 | $ | 0.19 | |||||
Second quarter | 38.50 | 35.91 | 0.19 | ||||||||
Third quarter | 39.99 | 34.75 | 0.21 | ||||||||
Fourth quarter | 36.99 | 32.49 | 0.21 | ||||||||
Year ended December 31, 2014 | |||||||||||
Third quarter | $ | 28.59 | $ | 26.59 | $ | 0.18 | |||||
Fourth quarter | 36.02 | 26.21 | 0.19 | ||||||||
FNFV Group | Stock Price High | Stock Price Low | Cash Dividends Declared | ||||||||
Year ended December 31, 2015 | |||||||||||
First quarter | $ | 15.04 | $ | 11.61 | $ | — | |||||
Second quarter | 15.80 | 14.17 | — | ||||||||
Third quarter | 15.62 | 11.66 | — | ||||||||
Fourth quarter | 12.06 | 9.88 | — | ||||||||
Year ended December 31, 2014 | |||||||||||
Third quarter | $ | 16.94 | $ | 13.76 | $ | — | |||||
Fourth quarter | 15.74 | 13.00 | — | ||||||||
Old FNF | Stock Price High | Stock Price Low | Cash Dividends Declared | ||||||||
Year ended December 31, 2014 (1) | |||||||||||
First quarter | $ | 33.22 | $ | 29.78 | $ | 0.18 | |||||
Second quarter | 34.45 | 31.11 | 0.18 | ||||||||
(1) Prices listed for Old FNF are unadjusted prices which do not give effect to the recapitalization and tracking stock formation on June 30, 2014.
27
Information concerning securities authorized for issuance under our equity compensation plans will be included in Item 12 of Part III of this report.
28
PERFORMANCE GRAPH
Set forth below is a graph comparing cumulative total shareholder return on our FNF Group common stock against the cumulative total return on the S & P 500 Index and against the cumulative total return of a peer group index consisting of certain companies in the primary industry in which we compete (SIC code 6361 — Title Insurance) for the period ending December 31, 2015. This peer group consists of the following companies: First American Financial Corporation and Stewart Information Services Corp. The peer group comparison has been weighted based on their stock market capitalization. The graph assumes an initial investment of $100.00 on December 31, 2010, with dividends reinvested over the periods indicated.
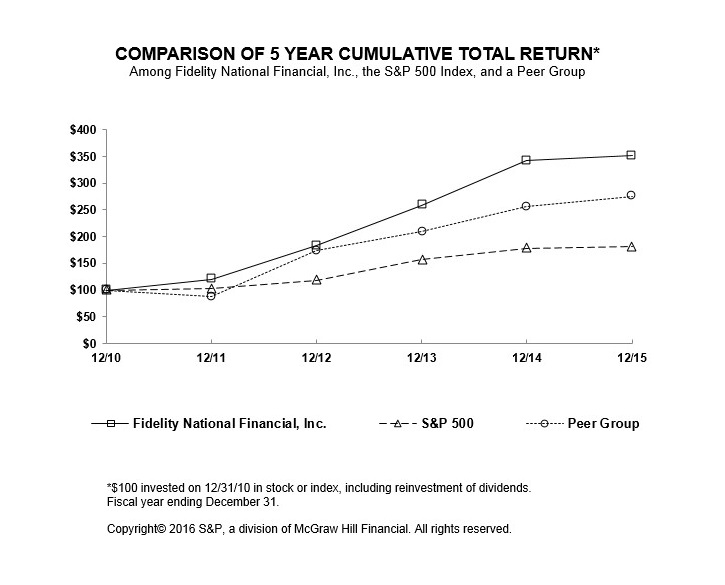
12/31/2010 | 12/31/2011 | 12/31/2012 | 12/31/2013 | 12/31/2014 | 12/31/2015 | ||||||||
Fidelity National Financial, Inc. | 100.00 | 120.19 | 182.94 | 258.66 | 342.03 | 352.02 | |||||||
S&P 500 | 100.00 | 102.11 | 118.45 | 156.82 | 178.29 | 180.75 | |||||||
Peer Group | 100.00 | 87.88 | 174.24 | 209.57 | 255.78 | 275.46 | |||||||
29
Set forth below is a graph comparing cumulative total shareholder return on our FNFV Group common stock against the cumulative total return on the S & P 500 Index and against the cumulative total return of a peer group index consisting of certain companies against which we compete for the period ending December 31, 2015. The peer group comparison has been weighted based on their stock market capitalization. The graph assumes an initial investment of $100.00 on July 1, 2014, with dividends reinvested over the periods indicated.
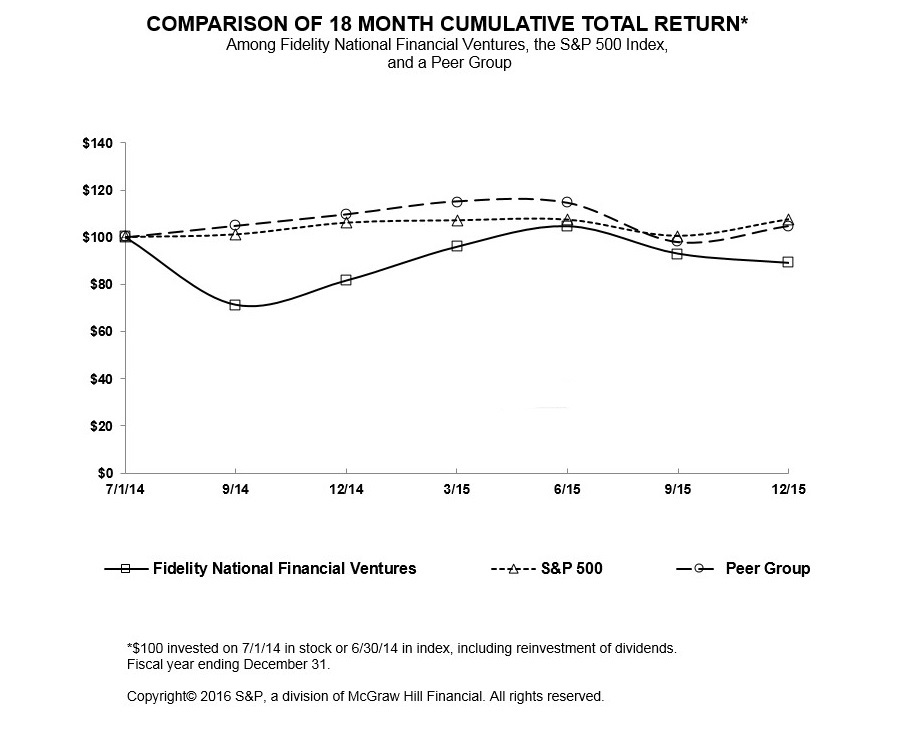
7/1/2014 | 12/31/2014 | 12/31/2015 | |||||
Fidelity National Financial Ventures | 100.00 | 81.60 | 89.06 | ||||
S&P 500 | 100.00 | 106.12 | 107.58 | ||||
Peer Group (1) | 100.00 | 109.66 | 104.83 | ||||
(1) This peer group consists of the following companies: American Capital, Ltd., Apollo Global Management, LLC, BlackRock, Inc., The Blackstone Group L.P., The Carlyle Group, Compass Diversified Holdings, Fortress Investment Group, LLC, KKR & Co. L.P., Leucadia National Corporation, Liberty Interactive Corporation, and Liberty Media Corporation.
On January 31, 2016, the last reported sale price of our FNF Group common stock and FNFV Group common stock on the New York Stock Exchange was $32.38 and $9.38 per share, respectively. We had approximately 7,200 shareholders of record of FNF Group common stock and 5,500 shareholders of record of FNFV Group common stock.
On February 3, 2016, our Board of Directors formally declared a $0.21 per FNF Group share cash dividend that is payable on March 31, 2016 to FNF Group shareholders of record as of March 17, 2016.
No dividends were declared on our FNFV Group common stock.
Our current FNF Group dividend policy anticipates the payment of quarterly dividends in the future. The declaration and payment of dividends will be at the discretion of our Board of Directors and will be dependent upon our future earnings, financial
30
condition and capital requirements. There are no restrictions on our retained earnings regarding our ability to pay dividends to shareholders, although there are limits on the ability of certain subsidiaries to pay dividends to us, as described below. Our ability to declare dividends is subject to restrictions under our existing credit agreement. We do not believe the restrictions contained in our credit agreement will, in the foreseeable future, adversely affect our ability to pay cash dividends at the current dividend rate.
Since we are a holding company, our ability to pay dividends will depend largely on the ability of our subsidiaries to pay dividends to us, and the ability of our title insurance subsidiaries to do so is subject to, among other factors, their compliance with applicable insurance regulations. As of December 31, 2015, $2,049 million of our net assets are restricted from dividend payments without prior approval from the Departments of Insurance in the states where our title insurance subsidiaries are domiciled. During 2016, our directly owned title insurance subsidiaries can pay dividends or make distributions to us of approximately $334 million without prior approval. The limits placed on such subsidiaries’ abilities to pay dividends affect our ability to pay dividends.
We have not paid any dividends on our FNFV Group common stock, and our current FNFV Group dividend policy does not presently anticipate the payment of dividends. Payment of dividends, if any, in the future will be determined by our Board of Directors in light of our earnings, financial condition and other relevant considerations.
On September 16, 2015, J. Alexander's and FNF entered into a Separation and Distribution Agreement, pursuant to which FNF agreed to distribute one hundred percent (100%) of its shares of J. Alexander's common stock, on a pro rata basis, to the holders of FNFV common stock. Holders of FNFV common stock received, as a distribution from FNF, approximately 0.17272 shares of J. Alexander’s common stock for every one share of FNFV common stock held at the close of business on September 22, 2015, the record date for the distribution (the “Distribution”). The Distribution was made on September 28, 2015. As a result of the Distribution, J. Alexander's is now an independent public company and its common stock is listed under the symbol “JAX” on the New York Stock Exchange. The Distribution was generally tax-free to FNFV shareholders for U.S. federal income tax purposes, except to the extent of any cash received in lieu of J. Alexander's fractional shares.
On March 20, 2015, we completed our tender offer to purchase shares of FNFV stock. As a result of the offer, we accepted for purchase 12,333,333 shares of FNFV Group Common Stock for a purchase price of $15.00 per common share, for a total aggregate cost of $185 million, excluding fees and expenses related to the tender offer.
On October 28, 2014, our Board of Directors approved a three-year stock purchase program, effective November 6, 2014, under which we can repurchase up to 10 million shares of our FNFV Group common stock through November 30, 2017. We may make repurchases from time to time in the open market, in block purchases or in privately negotiated transactions, depending on market conditions and other factors. In the year ended December 31, 2015, we repurchased a total of 8,187,382 shares for $106 million, or an average of $12.95 per share under this program. Subsequent to year-end we repurchased a total of 1,143,900 shares for $11 million, or an average of $9.71 per share under this program through market close on February 19, 2016. Since the original commencement of the plan adopted November 6, 2014, we have repurchased a total of 9,447,382 shares for $119 million, or an average of $12.57 per share, and there are 552,618 shares available to be repurchased under this program. On February 18, 2016, our Board of Directors approved a new FNFV Group three-year stock repurchase program, effective March 1, 2016, under which we may repurchase up to 15 million shares of FNFV Group common stock. Purchases may be made from time to time by us in the open market at prevailing market prices or in privately negotiated transactions through February 28, 2019. For more information, see “Liquidity and Capital Resources” in Item 7 of this Form 10-K.
On June 30, 2014, we completed the recapitalization of Old FNF common stock into two tracking stocks, FNF Group common stock and FNFV Group common stock. We issued 277,462,875 shares of FNF Group common stock and 91,711,237 shares of FNFV Group common stock. See Note A for further discussion on the recapitalization of FNF common stock.
On January 2, 2014 as part of the LPS Acquisition, we issued $839 million or 25,920,078 shares of Old FNF common stock as consideration for the LPS Acquisition to the former shareholders of LPS.
On July 21, 2012, our Board of Directors approved a three-year stock repurchase program, effective August 1, 2012, under which we can repurchase up to 15 million shares of FNF Group common stock through July 31, 2015. On July 20, 2015, our Board of Directors approved a new three-year stock repurchase program under which we can purchase up to 25 million shares through July 30, 2018. We may make repurchases from time to time in the open market, in block purchases or in privately negotiated transactions, depending on market conditions and other factors. In the year ended December 31, 2015, we repurchased a total 5,875,000 FNF Group shares under these programs for $214 million, or an average price of $36.41 per share. Subsequent to year-end we repurchased a total of 500,000 shares for $17 million, or an average of $33.19 per share under this program through market close on February 19, 2016. Since the original commencement of the plan adopted July 21, 2012, we have repurchased a total of 3,380,000 FNF common shares for $98 million, or an average of $28.97 per share, and there are no shares available to be repurchased under this program. Since the original commencement of the plan adopted July 20, 2015, we have repurchased a total of 5,075,000 FNF common shares for $182 million, or an average of $35.92 per share, and there are 19,925,000 shares available to be repurchased under this program. For more information, see “Liquidity and Capital Resources” in Item 7 of this Form 10-K.
31
The following table summarizes repurchases of equity securities by FNF during the year ending December 31, 2015:
Period | Total Number of Shares Purchased | Average Price Paid per Share | Total Number of Shares Purchased as Part of Publicly Announced Plans or Programs (1) | Maximum Number of Shares that May Yet Be Purchased Under the Plans or Programs (2) | |||||||||
6/1/2015 - 6/30/2015 | 1,100,000 | $ | 36.93 | 1,100,000 | 11,820,000 | ||||||||
7/1/2015 - 7/31/2015 | 250,000 | 38.12 | 250,000 | 24,950,000 | |||||||||
8/1/2015 - 8/31/2015 | 1,050,000 | 38.53 | 1,050,000 | 23,900,000 | |||||||||
9/1/2015 - 9/30/2015 | 1,050,000 | 36.35 | 1,050,000 | 22,850,000 | |||||||||
10/1/2015 - 10/31/2015 | 350,000 | 35.89 | 350,000 | 22,500,000 | |||||||||
11/1/2015 - 11/30/2015 | 1,000,000 | 35.30 | 1,000,000 | 21,500,000 | |||||||||
12/1/2015 - 12/31/2015 | 1,075,000 | 34.65 | 1,075,000 | 20,425,000 | |||||||||
Total | 5,875,000 | $ | 36.41 | 5,875,000 | |||||||||
(1) | On July 21, 2012, our Board of Directors approved a three-year stock purchase program, effective August 1, 2012, under which we can repurchase up to 15 million shares of our FNF Group common stock through July 31, 2015. On July 20, 2015, our Board of Directors approved a new three-year stock repurchase program. Under the new stock repurchase program, we can repurchase up to 25 million shares of our common stock through July 30, 2018. |
(2) | As of the last day of the applicable month. |
The following table summarizes repurchases of equity securities by FNFV during the year ending December 31, 2015:
Period | Total Number of Shares Purchased (3) | Average Price Paid per Share | Total Number of Shares Purchased as Part of Publicly Announced Plans or Programs (1) | Maximum Number of Shares that May Yet Be Purchased Under the Plans or Programs (2) | |||||||||
1/1/2015 - 1/31/2015 | 423,350 | $ | 12.34 | 423,350 | 9,460,550 | ||||||||
3/1/2015 - 3/31/2015 | 12,333,333 | 15.00 | — | 9,460,550 | |||||||||
4/1/2015 - 4/30/2015 | 50,000 | 14.62 | 50,000 | 9,410,550 | |||||||||
5/1/2015 - 5/31/2015 | 850,000 | 15.07 | 850,000 | 8,560,550 | |||||||||
6/1/2015 - 6/30/2015 | 1,000,000 | 15.23 | 1,000,000 | 7,560,550 | |||||||||
7/1/2015 - 7/31/2015 | 204,000 | 15.08 | 204,000 | 7,356,550 | |||||||||
8/1/2015 - 8/31/2015 | 1,393,000 | 14.49 | 1,393,000 | 5,963,550 | |||||||||
9/1/2015 - 9/30/2015 | 679,532 | 13.73 | 679,532 | 5,284,018 | |||||||||
10/1/2015 - 10/31/2015 | 530,000 | 11.66 | 530,000 | 4,754,018 | |||||||||
11/1/2015 - 11/30/2015 | 1,462,500 | 11.09 | 1,462,500 | 3,291,518 | |||||||||
12/1/2015 - 12/31/2015 | 1,595,000 | 10.68 | 1,595,000 | 1,696,518 | |||||||||
Total | 20,520,715 | $ | 14.18 | 8,187,382 | |||||||||
(1) | On October 28, 2014, our Board of Directors approved a three-year stock purchase program, effective November 6, 2014, under which we can repurchase up to 10 million shares of our FNFV Group common stock through November 30, 2017. |
(2) | As of the last day of the applicable month. |
(3) | On March 20, 2015 we completed our tender offer to purchase 12,333,333 shares of FNFV stock at a price of $15.00 per share. |
32
Item 6. Selected Financial Data
The information set forth below should be read in conjunction with the consolidated financial statements and related notes and “Management’s Discussion and Analysis of Financial Condition and Results of Operations” included elsewhere in this Form 10-K. Certain reclassifications have been made to the prior year amounts to conform with the 2015 presentation.
On September 28, 2015, we completed the distribution of J. Alexander's to FNFV shareholders. The results of J. Alexander's operations are included through the distribution date.
On December 31, 2014, we completed the distribution of Remy International, Inc. to our FNFV shareholders. The operations of Remy are included in discontinued operations for the years ended December 31, 2014, 2013, and 2012.
On January 2, 2014, we completed the purchase of LPS and consolidated the operations of LPS beginning on January 3, 2014.
On April 9, 2012, we successfully closed a tender offer for the outstanding common stock of O'Charley's Inc. We have consolidated the results of O'Charley's as of April 9, 2012. On May 11, 2012, we merged O'Charley's with our investment in ABRH in exchange for an increase in our ownership position in ABRH from 45% to 55%. We have consolidated the operations of ABRH with the O'Charley's group of companies, beginning on May 11, 2012.
Year Ended December 31, | |||||||||||||||||||
2015 | 2014 | 2013 | 2012 | 2011 | |||||||||||||||
(Dollars in millions, except share data) | |||||||||||||||||||
Operating Data: | |||||||||||||||||||
Revenue | $ | 9,132 | $ | 8,024 | $ | 7,440 | $ | 6,668 | $ | 4,800 | |||||||||
Expenses: | |||||||||||||||||||
Personnel costs | 2,671 | 2,540 | 2,061 | 1,834 | 1,568 | ||||||||||||||
Agent commissions | 1,731 | 1,471 | 1,789 | 1,600 | 1,411 | ||||||||||||||
Other operating expenses | 1,881 | 1,643 | 1,273 | 1,269 | 1,064 | ||||||||||||||
Cost of restaurant revenues | 1,195 | 1,220 | 1,204 | 773 | — | ||||||||||||||
Depreciation and amortization | 410 | 403 | 133 | 103 | 73 | ||||||||||||||
Provision for title claim losses | 246 | 228 | 291 | 279 | 222 | ||||||||||||||
Interest expense | 131 | 127 | 73 | 64 | 57 | ||||||||||||||
8,265 | 7,632 | 6,824 | 5,922 | 4,395 | |||||||||||||||
Earnings before income taxes, equity in (loss) earnings of unconsolidated affiliates, and noncontrolling interest | 867 | 392 | 616 | 746 | 405 | ||||||||||||||
Income tax expense | 290 | 312 | 195 | 242 | 131 | ||||||||||||||
Earnings before equity in (loss) earnings of unconsolidated affiliates | 577 | 80 | 421 | 504 | 274 | ||||||||||||||
Equity in (loss) earnings of unconsolidated affiliates | (16 | ) | 432 | (26 | ) | 10 | 10 | ||||||||||||
Earnings from continuing operations, net of tax | 561 | 512 | 395 | 514 | 284 | ||||||||||||||
Earnings from discontinued operations, net of tax | — | 7 | 16 | 98 | 95 | ||||||||||||||
Net earnings | 561 | 519 | 411 | 612 | 379 | ||||||||||||||
Less: net earnings (loss) attributable to noncontrolling interests | 34 | (64 | ) | 17 | 5 | 10 | |||||||||||||
Net earnings attributable to FNF common shareholders | $ | 527 | $ | 583 | $ | 394 | $ | 607 | $ | 369 | |||||||||
33
Year Ended December 31, | |||||||||||||||||||
2015 | 2014 | 2013 | 2012 | 2011 | |||||||||||||||
(Dollars in millions, except share data) | |||||||||||||||||||
Per Share Data: | |||||||||||||||||||
Basic net earnings per share attributable to Old FNF common shareholders | $ | 0.33 | $ | 1.71 | $ | 2.75 | $ | 1.68 | |||||||||||
Basic net earnings per share attributable to FNF Group common shareholders | $ | 1.95 | $ | 0.77 | |||||||||||||||
Basic net (loss) earnings per share attributable to FNFV Group common shareholders | $ | (0.16 | ) | $ | 3.04 | ||||||||||||||
Weighted average shares outstanding Old FNF, basic basis (1) | 138 | 230 | 221 | 219 | |||||||||||||||
Weighted average shares outstanding FNF Group, basic basis (1) | 277 | 138 | |||||||||||||||||
Weighted average shares outstanding FNFV Group, basic basis (1) | 79 | 46 | |||||||||||||||||
Diluted net earnings per share attributable to Old FNF common shareholders | $ | 0.32 | $ | 1.68 | $ | 2.69 | $ | 1.65 | |||||||||||
Diluted net earnings per share attributable to FNF Group common shareholders | $ | 1.89 | $ | 0.75 | |||||||||||||||
Diluted net (loss) earnings per share attributable to FNFV Group common shareholders | $ | (0.16 | ) | $ | 3.01 | ||||||||||||||
Weighted average shares outstanding Old FNF, diluted basis (1) | 142 | 235 | 226 | 223 | |||||||||||||||
Weighted average shares outstanding FNF Group, diluted basis (1) | 286 | 142 | |||||||||||||||||
Weighted average shares outstanding FNFV Group, diluted basis (1) | 82 | 47 | |||||||||||||||||
Dividends declared per share of Old FNF common stock | $ | 0.36 | $ | 0.66 | $ | 0.58 | $ | 0.48 | |||||||||||
Dividends declared per share of FNF Group common stock | $ | 0.80 | $ | 0.37 | |||||||||||||||
Balance Sheet Data: | |||||||||||||||||||
Investments (2) | $ | 4,853 | $ | 4,669 | $ | 3,791 | $ | 4,053 | $ | 4,052 | |||||||||
Cash and cash equivalents (3) | 780 | 700 | 1,969 | 1,132 | 665 | ||||||||||||||
Total assets | 13,931 | 13,845 | 10,508 | 9,886 | 7,850 | ||||||||||||||
Notes payable | 2,793 | 2,803 | 1,303 | 1,327 | 904 | ||||||||||||||
Reserve for title claim losses | 1,583 | 1,621 | 1,636 | 1,748 | 1,913 | ||||||||||||||
Redeemable NCI | 344 | 715 | — | — | — | ||||||||||||||
Equity | 6,588 | 6,073 | 5,535 | 4,749 | 3,655 | ||||||||||||||
Book value per share Old FNF | $ | 22.14 | $ | 20.78 | $ | 16.57 | |||||||||||||
Book value per share FNF Group (4) | $ | 21.21 | $ | 18.87 | |||||||||||||||
Book value per share FNFV Group (4) | $ | 15.05 | $ | 16.31 | |||||||||||||||
Other Data: | |||||||||||||||||||
Orders opened by direct title operations (in 000's) | 2,092 | 1,914 | 2,181 | 2,702 | 2,140 | ||||||||||||||
Orders closed by direct title operations (in 000's) | 1,472 | 1,319 | 1,708 | 1,867 | 1,514 | ||||||||||||||
Provision for title insurance claim losses as a percent of title insurance premiums | 5.7 | % | 6.2 | % | 7.0 | % | 7.0 | % | 6.8 | % | |||||||||
Title related revenue (5): | |||||||||||||||||||
Percentage direct operations | 70.1 | % | 70.0 | % | 60.1 | % | 61.9 | % | 60.6 | % | |||||||||
Percentage agency operations | 29.9 | % | 30.0 | % | 39.9 | % | 38.1 | % | 39.4 | % | |||||||||
______________________________________
(1) | Weighted average shares outstanding as of December 31, 2014 includes 25,920,078 FNF shares that were issued as part of the acquisition of LPS on January 2, 2014 and 91,711,237 FNFV shares that were issued as part of the recapitalization completed on June 30, 2014. Weighted average shares outstanding as of December 31, 2013 includes 19,837,500 shares that were issued as part of an equity offering by FNF on October 31, 2013. |
34
(2) | Investments as of December 31, 2015, 2014, 2013, 2012, and 2011, include securities pledged to secured trust deposits of $608 million, $499 million, $261 million, $278 million, and $280 million, respectively. |
(3) | Cash and cash equivalents as of December 31, 2015, 2014, 2013, 2012, and 2011 include cash pledged to secured trust deposits of $108 million, $136 million, $339 million, $266 million, and $162 million, respectively. |
(4) | Book value per share is calculated as equity at December 31 of each year presented divided by actual shares outstanding at December 31 of each year presented. |
(5) | Includes title insurance premiums and escrow, title-related and other fees. |
Selected Quarterly Financial Data (Unaudited)
Selected quarterly financial data is as follows:
Quarter Ended | |||||||||||||||
March 31, | June 30, | September 30, | December 31, | ||||||||||||
(Dollars in millions, except per share data) | |||||||||||||||
2015 | |||||||||||||||
Revenue | $ | 2,061 | $ | 2,395 | $ | 2,392 | $ | 2,284 | |||||||
Earnings from continuing operations before income taxes, equity in (loss) earnings of unconsolidated affiliates, and noncontrolling interest | 151 | 254 | 238 | 224 | |||||||||||
Net earnings attributable to FNF Group common shareholders | 86 | 160 | 150 | 144 | |||||||||||
Net earnings (loss) attributable to FNFV Group common shareholders | — | 10 | (18 | ) | (5 | ) | |||||||||
Basic earnings per share attributable to FNF Group common shareholders | 0.31 | 0.57 | 0.54 | 0.52 | |||||||||||
Basic earnings (loss) per share attributable to FNFV Group common shareholders | — | 0.12 | (0.24 | ) | (0.07 | ) | |||||||||
Diluted earnings per share attributable to FNF Group common shareholders | 0.30 | 0.56 | 0.53 | 0.51 | |||||||||||
Diluted earnings (loss) per share attributable to FNFV Group common shareholders | — | 0.12 | (0.24 | ) | (0.07 | ) | |||||||||
Dividends paid per share FNF Group common stock | 0.19 | 0.19 | 0.21 | 0.21 | |||||||||||
2014 | |||||||||||||||
Revenue | $ | 1,786 | $ | 2,059 | $ | 2,093 | $ | 2,086 | |||||||
(Loss) earnings from continuing operations before income taxes, equity in earnings of unconsolidated affiliates, and noncontrolling interest | (89 | ) | 156 | 172 | 153 | ||||||||||
Net (loss) earnings attributable to Old FNF common shareholders | (22 | ) | 111 | — | — | ||||||||||
Net earnings attributable to FNF Group common shareholders | 114 | 100 | |||||||||||||
Net (loss) earnings attributable to FNFV Group common shareholders | (12 | ) | 292 | ||||||||||||
Basic (loss) earnings per share attributable to Old FNF common shareholders | (0.08 | ) | 0.41 | ||||||||||||
Basic earnings per share attributable to FNF Group common shareholders | 0.40 | 0.37 | |||||||||||||
Basic (loss) earnings per share attributable to FNFV Group common shareholders | (0.14 | ) | 3.18 | ||||||||||||
Diluted (loss) earnings per share attributable to Old FNF common shareholders | (0.08 | ) | 0.40 | ||||||||||||
Diluted earnings per share attributable to FNF Group common shareholders | 0.40 | 0.35 | |||||||||||||
Diluted (loss) earnings per share attributable to FNFV Group common shareholders | (0.14 | ) | 3.15 | ||||||||||||
Dividends paid per share of Old FNF Common Stock | 0.18 | 0.18 | |||||||||||||
Dividends paid per share FNF Group common stock | 0.18 | 0.19 | |||||||||||||
35
Item 7. | Management's Discussion and Analysis of Financial Condition and Results of Operations |
The following discussion should be read in conjunction with the Consolidated Financial Statements and the Notes thereto and Selected Financial Data included elsewhere in this Form 10-K.
Overview
We have organized our business into two groups, FNF Core Operations and FNF Ventures ("FNFV").
Through our Core Operations, FNF is a leading provider of (i) title insurance, escrow and other title related services, including collection and trust activities, trustee sales guarantees, recordings and reconveyances and home warranty insurance and (ii) technology and transaction services to the real estate and mortgage industries. FNF is the nation’s largest title insurance company operating through its title insurance underwriters Fidelity National Title Insurance Company, Chicago Title Insurance Company, Commonwealth Land Title Insurance Company, Alamo Title Insurance and National Title Insurance of New York Inc. - that collectively issue more title insurance policies than any other title company in the United States. Through our subsidiary ServiceLink Holdings, LLC ("ServiceLink"), we provide mortgage transaction services including title-related services and facilitation of production and management of mortgage loans. FNF also provides industry-leading mortgage technology solutions, including MSP®, the leading residential mortgage servicing technology platform in the U.S., through its majority-owned subsidiary, Black Knight Financial Services, Inc. ("Black Knight").
Through our FNFV group, we own majority and minority equity investment stakes in a number of entities, including American Blue Ribbon Holdings, LLC ("ABRH"), Ceridian HCM, Inc. and Fleetcor Technologies, Inc. (collectively "Ceridian") and Digital Insurance, Inc. ("Digital Insurance").
As of December 31, 2015, we had the following reporting segments:
FNF Core Operations
• | Title. This segment consists of the operations of our title insurance underwriters and related businesses. This segment provides core title insurance and escrow and other title-related services including collection and trust activities, trustee sales guarantees, recordings and reconveyances, and home warranty insurance. This segment also includes the transaction services business acquired from Lender Processing Services, Inc. ("LPS"), now combined with our ServiceLink business. Transaction services include other title related services used in the production and management of mortgage loans, including mortgage loans that experience default. |
• | Black Knight. This segment consists of the operations of Black Knight, which, through leading software systems and information solutions, provides mission critical technology and data and analytics services that facilitate and automate many of the business processes across the life cycle of a mortgage. |
• | FNF Core Corporate and Other. This segment consists of the operations of the parent holding company, certain other unallocated corporate overhead expenses, and other smaller real estate and insurance-related operations. |
FNFV
• | Restaurant Group. This segment consists of the operations of ABRH, in which we have a 55% ownership interest. ABRH and its affiliates are the owners and operators of the O'Charley's, Ninety Nine Restaurants, Max & Erma's, Village Inn, Bakers Square, and Legendary Baking concepts. This segment also includes the results of J. Alexander's, Inc. ("J. Alexander's") through September 28, 2015, the date it was distributed to FNFV shareholders. See the Recent Developments section below for further discussion of the distribution of J. Alexander's. On January 25, 2016, substantially all of the assets of the Max & Erma's restaurant concept were sold pursuant to an Asset Purchase Agreement. |
• | FNFV Corporate and Other. This segment primarily consists of our share in the operations of certain equity investments, including Ceridian, as well as consolidated investments, including Digital Insurance in which we own 96%, and other smaller operations which are not title related. |
Recent Developments
On February 18, 2016, our Board of Directors approved a new FNFV Group three-year stock repurchase program, effective March 1, 2016, under which we may repurchase up to 15 million shares of FNFV Group common stock. Purchases may be made from time to time by us in the open market at prevailing market prices or in privately negotiated transactions through February 28, 2019.
On February 11, 2016, we announced that we are considering alternatives to the spin-off of ABRH to FNFV shareholders previously announced on July 30, 2015.
36
On January 20, 2016, we entered into two interest rate swap agreements to hedge forecasted monthly interest rate payments on $400.0 million of our floating rate debt ($200.0 million notional value each) (the “Swap Agreements”). The Swap Agreements have been designated as cash flow hedging instruments. Under the terms of the Swap Agreements, we receive payments based on the 1-month LIBOR rate and pay a weighted average fixed rate of 1.01%. The effective term for the Swap Agreements is February 1, 2016 through January 31, 2019.
Beginning in October 2015 through December 31, 2015, we purchased approximately 2.2 million shares of Del Frisco Restaurant Group ("Del Frisco's", NASDAQ: DFRG) common stock for a total investment of $32 million. Subsequent to year-end through February 19, 2016, we purchased approximately 0.8 million shares of Del Frisco's common stock for $12 million. We currently own approximately 13% of the outstanding common stock of Del Frisco's.
On September 16, 2015, J. Alexander's and FNF entered into a Separation and Distribution Agreement, pursuant to which FNF agreed to distribute one hundred percent (100%) of its shares of J. Alexander's common stock, on a pro rata basis, to the holders of FNFV common stock. Holders of FNFV common stock received, as a distribution from FNF, approximately 0.17272 shares of J. Alexander’s common stock for every one share of FNFV common stock held at the close of business on September 22, 2015, the record date for the distribution (the “Distribution”). The Distribution was made on September 28, 2015. As a result of the Distribution, J. Alexander's is now an independent public company and its common stock is listed under the symbol “JAX” on the New York Stock Exchange. The Distribution was generally tax-free to FNFV shareholders for U.S. federal income tax purposes, except to the extent of any cash received in lieu of J. Alexander's fractional shares.
On July 20, 2015, we completed the recapitalization of ServiceLink Holdings, LLC through a conversion (the "ServiceLink Conversion") of $505 million of the $566 million aggregate preference amount associated with its Class A1 participating preferred units into slightly more than 67.3 million Class A common units. As a result of the ServiceLink Conversion, our ownership percentage in ServiceLink Holdings, LLC increased from 65% to 79%.
On July 20, 2015, our Board of Directors approved a new FNF Group three-year stock repurchase program, effective August 1, 2015, under which we may repurchase up to 25 million shares of FNF Group common stock. Purchases may be made from time to time by us in the open market at prevailing market prices or in privately negotiated transactions through July 31, 2018.
On May 29, 2015, Black Knight completed a redemption (the "Redemption") of $205 million in aggregate principal of its senior notes ("Black Knight Senior Notes") at a price of 105.750%. Black Knight incurred a charge on the Redemption of $12 million and also reduced the bond premium by $7 million for the portion of the premium that relates to the redeemed Black Knight Senior Notes, resulting in a net charge on the Redemption of $5 million. Following the Redemption, $390 million in aggregate principal of Black Knight Senior Notes remained outstanding.
On May 27, 2015, Black Knight InfoServ, LLC (“BKIS”), a subsidiary of Black Knight, entered into a credit and guaranty agreement (the “BKIS Credit Agreement”) with an aggregate borrowing capacity of $1.6 billion, dated as of May 27, 2015, with JPMorgan Chase Bank, N.A. as administrative agent, the guarantors party thereto, the other agents party thereto and the lenders party thereto. FNF does not provide any guaranty or stock pledge under the BKIS Credit Agreement.
On May 27, 2015, we entered into an amendment to our existing $800 million third amended and restated credit agreement (as previously amended, the “Existing Revolving Credit Agreement”), dated as of June 25, 2013, with Bank of America, N.A., as administrative agent, the other agents party thereto and the financial institutions party thereto as lenders (the “FNF Amended Revolving Credit Agreement”). Among other changes, the FNF Amended Revolving Credit Agreement amends the Existing Revolving Credit Agreement to permit FNF and its subsidiaries to incur the indebtedness and liens in connection with the BKIS Credit Agreement.
On May 26, 2015, Black Knight closed its initial public offering ("IPO") of 20,700,000 shares of Class A common stock at a price to the public of $24.50 per share, which included 2,700,000 shares of Class A common stock issued upon the exercise in full of the underwriters' option to purchase additional shares. Black Knight received net proceeds of $475 million from the offering, after deduction of underwriter discount and expenses. In connection with the IPO, Black Knight amended and restated its certificate of incorporation to authorize the issuance of two classes of common stock, Class A common stock and Class B common stock, which will generally vote together as a single class on all matters submitted for a vote to stockholders. As a result, Black Knight issued shares of Class B common stock to us, and certain Thomas H. Lee Partners affiliates, as the holders of membership interests in Black Knight Financial Services, LLC ("BKFS, LLC") prior to the IPO. Class B common stock is not publicly traded and does not entitle the holders thereof to any of the economic rights, including rights to dividends and distributions upon liquidation that would be provided to holders of Class A common stock. Prior to the IPO, we owned 67% of the membership interests in BKFS, LLC. Following the IPO, we owned 55% of the outstanding shares of Black Knight in the form of Class B common stock, with a corresponding ownership interest in BKFS, LLC.
On March 20, 2015, we completed our tender offer to purchase shares of FNFV stock. As a result of the offer, we accepted for purchase 12,333,333 shares of FNFV Group Common Stock for a purchase price of $15.00 per common share, for a total aggregate cost of $185 million, excluding fees and expenses related to the tender offer.
37
On February 18, 2015, we closed the sale of substantially all of the assets of Cascade Timberlands, LLC ("Cascade") which grows and sells timber and in which we owned a 70.2% interest, for $85 million less a replanting allowance of $1 million and an indemnity holdback of $1 million. The revenue from the sale was recorded in Escrow, title related and other fees and the cost of the land sold was in Other operating expenses in the Consolidated Statement of Operations in the twelve months ended December 31, 2015. The effect of the sale on FNFV's net earnings was income of approximately $12 million. There was no effect on net earnings attributable to FNFV Group common shareholders due to offsetting amounts attributable to noncontrolling interests.
Acquisitions
The results of operations and financial position of the entities acquired during any year are included in the Consolidated Financial Statements from and after the date of acquisition.
On February 12, 2015, we closed the purchase of Buyers Protection Group Holdings, LLC ("BPG"), pursuant to a certain Membership Interest Purchase Agreement, for $46 million. We first consolidated the results of BPG as of March 31, 2015. BPG is a recognized leader in home warranty, home inspection services and commercial inspections.
Discontinued Operations
On December 31, 2014, we completed the distribution (the "Remy Spin-off") of all of the outstanding shares of common stock of our previously owned subsidiary Remy International, Inc. ("New Remy", NASDAQ: REMY), a manufacturer and distributer of auto parts, to FNFV shareholders. We have no continuing involvement in New Remy as of December 31, 2015. As a result of the Remy Spin-off, the results of New Remy are reflected in the Consolidated Statements of Earnings as discontinued operations for the the years ended December 31, 2014 and 2013. Total revenue included in discontinued operations was $1,173 million and $1,125 million for the years ended December 31, 2014, and 2013, respectively. Pre-tax earnings included in discontinued operations were $6 million and $22 million for the years ended December 31, 2014, and 2013, respectively.
The results from a small software company, which we acquired with LPS and which was sold during the second quarter of 2014, are included in the Consolidated Statements of Earnings as discontinued operations for all periods presented. Total revenues included in discontinued operations were $2 million for the year ending December 31, 2014. Pre-tax earnings included in discontinued operations are $1 million for the year ending December 31, 2014.
The results from two closed J. Alexander's locations in the second quarter of 2013 are reflected in the Consolidated Statements of Earnings as discontinued operations for all periods presented. Total net revenue included in discontinued operations was $3 million for the year ended December 31, 2013. Pre-tax loss included in discontinued operations was $3 million for the year ended December 31, 2013.
The results from a settlement services company closed in the second quarter of 2013 are reflected in the Consolidated Statements of Earnings as discontinued operations for all periods presented. Total revenues included in discontinued operations were $9 million for the year ended December 31, 2013. Pre-tax earnings included in discontinued operations were $2 million for the year ended December 31, 2013.
Related Party Transactions
Our financial statements for the year ended December 31, 2013 reflect transactions with Fidelity National Information Services ("FIS"), which was considered a related party until December 31, 2013. See Note A of the Notes to Consolidated Financial Statements.
Business Trends and Conditions
Title
Our Title segment revenue is closely related to the level of real estate activity which includes sales, mortgage financing and mortgage refinancing. The levels of real estate activity are primarily affected by the average price of real estate sales, the availability of funds to finance purchases, mortgage interest rates and the strength of the United States economy, including employment levels. Declines in the level of real estate activity or the average price of real estate sales will adversely affect our title insurance revenues.
We have found that residential real estate activity is generally dependent on the following:
• | mortgage interest rates; |
• | the mortgage funding supply; and |
• | the strength of the United States economy, including employment levels. |
From December 2008 through December 2015, the Federal Reserve held the federal funds rate at 0.0%-0.25%. In December 2015, the Federal Reserve raised the target federal funds rate to 0.25%-0.50%. Mortgage interest rates were at historically low levels through the beginning of 2013. During the last half of 2013, however, interest rates rose to their highest level since 2011. Through 2014, mortgage interest rates declined moderately. In the fourth quarter of 2014, interest rates dropped below 4.00% and have remained between 3.50% and 4.25% through the year ended December 31, 2015.
38
As of February 18, 2016, the Mortgage Banker's Association ("MBA") estimated the size of the U.S. mortgage originations market as shown in the following table for 2014 - 2017 in its "Mortgage Finance Forecast" (in trillions):
2018 | 2017 | 2016 | 2015 | |||||||||||||
Purchase transactions | $ | 1.0 | $ | 1.0 | $ | 1.0 | $ | 0.9 | ||||||||
Refinance transactions | 0.3 | 0.4 | 0.5 | 0.7 | ||||||||||||
Total U.S. mortgage originations | $ | 1.3 | $ | 1.4 | $ | 1.5 | $ | 1.6 | ||||||||
In 2014 the mix of mortgage originations between purchase and refinance transactions returned closer to historical norms. Driven by the decrease in refinance activity following an extended period of low interest rates, the ratio of refinances to total originations was approximately 40%. In 2015, the ratio of refinances to total originations was closer to 50% as anticipation of increased mortgage rates resulting from projected increases in the target federal funds rate weighed on the market. The MBA predicts the ratio will return to historical norms and decrease through 2018. The MBA predicts mortgage originations in 2016 through 2018 to decrease slightly compared to the 2015 period with a slight increase in purchase transactions expected to be offset by a decrease in refinance transactions. We expect the predicted change in mix, if it materializes, to have a positive effect on our earnings because purchase transactions involve the issuance of both a lender’s policy and an owner’s policy, resulting in higher fees, whereas refinance transactions only require a lender’s policy, resulting in lower fees.
Because commercial real estate transactions tend to be driven more by supply and demand for commercial space and occupancy rates in a particular area rather than by interest rate fluctuations, we believe that our commercial real estate title insurance business is less dependent on the industry cycles discussed above than our residential real estate title business. Commercial real estate transaction volume is also often linked to the availability of financing. For the past several years, including the year ended December 31, 2015, we have experienced an increase in volume and fee per file of commercial transactions from the previous years, indicating strong commercial markets.
In addition to state-level regulation, segments of our FNF core businesses are subject to regulation by federal agencies, including the Consumer Financial Protection Bureau (“CFPB”). The CFPB was established under the Dodd-Frank Wall Street Reform and Consumer Protection Act of 2010 ("Dodd-Frank") which also included regulation over financial services and other lending related businesses including Black Knight. The CFPB has been given broad authority to regulate, among other areas, the mortgage and real estate markets in matters pertaining to consumers. This authority includes the enforcement of the Real Estate Settlement Procedures Act formerly placed with the Department of Housing and Urban Development. On July 9, 2012, the CFPB introduced a number of proposed rules related to the enforcement of the Real Estate Settlement Procedures Act and the Truth in Lending Act, including, among others, measures designed to (i) simplify financing documentation and (ii) require lenders to deliver to consumers a statement of final financing charges (and the related annual percentage rate) at least three business days prior to the closing. These rules became effective on January 10, 2014.
On November 20, 2013, the CFPB issued additional rules regarding mortgage forms and other mortgage related disclosures with the intent to provide "easier-to-use" mortgage disclosure forms for the consumer. The additional disclosure requirements require participants in the mortgage market, including us, to make significant changes to the manner in which they create, process, and deliver certain disclosures to consumers in connection with mortgage loan applications. The additional disclosures are effective for mortgage loan applications made on or after October 3, 2015. The main provisions of the additional disclosures include amending Regulation Z (the Truth in Lending Act) and Regulation X (Real Estate Settlement Procedures Act) (collectively, the “TILA-RESPA Integrated Disclosure" or "TRID”) to consolidate existing loan disclosures under TILA and RESPA for closed-end credit transactions secured by real property. TRID requires (i) timely delivery of a loan estimate upon receipt a consumer’s application and (ii) timely delivery of a closing disclosure prior to consummation. TRID also imposes certain restrictions, including the prohibition of imposing fees prior to provision of an estimate and the prohibition of providing estimates prior to a consumer’s submission of verifying documents. These changes could lead to lower mortgage volumes and/or delays in mortgage processing, particularly in the early stages of implementation. We do not believe the changes will have a significant effect on long term mortgage volumes and do not believe this had a material impact on our current year results from operations.
Readiness for and compliance with TRID required extensive planning; changes to systems, forms and processes; as well as heightened coordination among market participants. We believe that FNF, its agents or other market participants have generally been successful in their implementation efforts. It is our experience that mortgage lenders have become more focused on the risk of non-compliance with these evolving regulations and are focused on technologies and solutions that help them to comply with the increased regulatory oversight and burdens. Black Knight has developed solutions that target this need, which has resulted in additional revenue.
Historically, real estate transactions have produced seasonal revenue levels for the real estate industry including title insurers. The first calendar quarter is typically the weakest quarter in terms of revenue due to the generally low volume of home sales during January and February. The third calendar quarter has been typically the strongest in terms of revenue primarily due to a higher volume of home sales in the summer months and the fourth quarter is usually also strong due to commercial entities desiring to
39
complete transactions by year-end. We have noted short term fluctuations through recent years in resale and refinance transactions as a result of changes in interest rates and the implementation and subsequent expiration of government programs designed to stimulate the real estate market. In 2014 and 2013, we saw seasonality trends return to historical patterns. During 2015, we experienced a moderate increase in existing home sales and we have also seen a decline in total housing inventory. However, we have experienced significant declines in refinance activity starting in the fourth quarter of 2013.
Black Knight
Underlying the mortgage loan life cycle is the technology and data and analytics support behind each process, which has become increasingly critical to industry participants due to the complexity of regulatory requirements. As the industry has grown in complexity, participants have responded by outsourcing to large scale specialty providers, automating manual processes and seeking end-to-end solutions that support the processes required to manage the entire mortgage loan life cycle.
Black Knight's various businesses are impacted differently by the level of mortgage originations, including refinancing transactions. Black Knight's mortgage servicing platform is generally less affected by varying levels of mortgage originations because it earns revenues based on the total number of mortgage loans it processes, which tend to stay more constant than the market for originations. Black Knight's origination technology and some of their data businesses are directly affected by the volume of real estate transactions and mortgage originations, but many of their client contracts for origination technology contain minimum charges.
Black Knight's various businesses are also impacted by general economic conditions. For example, in the event that a difficult economy or other factors lead to a decline in levels of home ownership and a reduction in the number of mortgage loans outstanding and Black Knight is not able to counter the impact of those events with increased market share or higher fees, it could have a material adverse effect on our mortgage processing revenues. In contrast, we believe that a weaker economy tends to increase the volume of consumer mortgage defaults, which can increase the revenues in Black Knight's specialty servicing technology business that is used to service residential mortgage loans in default. Also, interest rates tend to decline in a weaker economy driving higher than normal refinance transactions that provide potential volume increases to Black Knight's origination technology offerings, most specifically the RealEC Exchange platform.
FNFV
Restaurant Group
The restaurant industry is highly competitive and is often affected by changes in consumer tastes and discretionary spending patterns; changes in general economic conditions; public safety conditions or concerns; demographic trends; weather conditions; the cost of food products, labor, energy and other operating costs; and governmental regulations. The restaurant industry is also characterized by high capital investments for new restaurants and relatively high fixed or semi-variable restaurant operating expenses. Because of the high fixed and semi-variable expenses, changes in sales in existing restaurants are generally expected to significantly affect restaurant profitability because many restaurant costs and expenses are not expected to change at the same rate as sales. Restaurant profitability can also be negatively affected by inflationary and regulatory increases in operating costs and other factors. The most significant commodities that may affect our cost of food and beverage are beef, seafood, poultry, and dairy, which accounted for approximately half of our overall cost of food and beverage in the past. Generally, temporary increases in these costs are not passed on to guests; however, in the past, we have adjusted menu prices to compensate for increased costs of a more permanent nature.
Average weekly sales per restaurant are typically higher in the first and fourth quarters than in other quarters, and we typically generate a disproportionate share of our earnings from operations in the first and fourth quarters. Holidays, severe weather and other disruptive conditions may impact sales volumes seasonally in some operating regions.
Our revenues in future periods will continue to be subject to these and other factors that are beyond our control and, as a result, are likely to fluctuate.
Critical Accounting Estimates
The accounting estimates described below are those we consider critical in preparing our Consolidated Financial Statements. Management is required to make estimates and assumptions that can affect the reported amounts of assets and liabilities and disclosures with respect to contingent assets and liabilities at the date of the Consolidated Financial Statements and the reported amounts of revenues and expenses during the reporting period. Actual amounts could differ from those estimates. See Note A of Notes to the Consolidated Financial Statements for additional description of the significant accounting policies that have been followed in preparing our Consolidated Financial Statements.
Reserve for Title Claim Losses. Title companies issue two types of policies, owner's and lender's policies, since both the new owner and the lender in real estate transactions want to know that their interest in the property is insured against certain title defects outlined in the policy. An owner's policy insures the buyer against such defects for as long as he or she owns the property (as well as against warranty claims arising out of the sale of the property by such owner). A lender's policy insures the priority of the
40
lender's security interest over the claims that other parties may have in the property. The maximum amount of liability under a title insurance policy is generally the face amount of the policy plus the cost of defending the insured's title against an adverse claim, however, occasionally we do incur losses in excess of policy limits. While most non-title forms of insurance, including property and casualty, provide for the assumption of risk of loss arising out of unforeseen future events, title insurance serves to protect the policyholder from risk of loss for events that predate the issuance of the policy.
Unlike many other forms of insurance, title insurance requires only a one-time premium for continuous coverage until another policy is warranted due to changes in property circumstances arising from refinance, resale, additional liens, or other events. Unless we issue the subsequent policy, we receive no notice that our exposure under our policy has ended and, as a result, we are unable to track the actual terminations of our exposures.
Our reserve for title claim losses includes reserves for known claims as well as for losses that have been incurred but not yet reported to us (“IBNR”), net of recoupments. We reserve for each known claim based on our review of the estimated amount of the claim and the costs required to settle the claim. Reserves for IBNR claims are estimates that are established at the time the premium revenue is recognized and are based upon historical experience and other factors, including industry trends, claim loss history, legal environment, geographic considerations, and the types of policies written. We also reserve for losses arising from closing and disbursement functions due to fraud or operational error.
The table below summarizes our reserves for known claims and incurred but not reported claims related to title insurance:
December 31, 2015 | % | December 31, 2014 | % | |||||||||||
(in millions) | ||||||||||||||
Known claims | $ | 202 | 12.8 | % | $ | 231 | 14.3 | % | ||||||
IBNR | 1,381 | 87.2 | 1,390 | 85.7 | ||||||||||
Total Reserve for Title Claim Losses | $ | 1,583 | 100.0 | % | $ | 1,621 | 100.0 | % | ||||||
Although claims against title insurance policies can be reported relatively soon after the policy has been issued, claims may be reported many years later. Historically, approximately 60% of claims are paid within approximately five years of the policy being written. By their nature, claims are often complex, vary greatly in dollar amounts and are affected by economic and market conditions, as well as the legal environment existing at the time of settlement of the claims. Estimating future title loss payments is difficult because of the complex nature of title claims, the long periods of time over which claims are paid, significantly varying dollar amounts of individual claims and other factors.
Our process for recording our reserves for title claim losses begins with analysis of our loss provision rate. We forecast ultimate losses for each policy year based upon historical policy year loss emergence and development patterns and adjust these to reflect policy year and policy type differences which affect the timing, frequency and severity of claims. We also use a technique that relies on historical loss emergence and on a premium-based exposure measurement. The latter technique is particularly applicable to the most recent policy years, which have few reported claims relative to an expected ultimate claim volume. After considering historical claim losses, reporting patterns and current market information, and analyzing quantitative and qualitative data provided by our legal, claims and underwriting departments, we determine a loss provision rate, which is recorded as a percentage of current title premiums. This loss provision rate is set to provide for losses on current year policies, but due to development of prior years and our long claim duration, it periodically includes amounts of estimated adverse or positive development on prior years' policies. Any significant adjustments to strengthen or release loss reserves resulting from the comparison with our actuarial analysis are made in addition to this loss provision rate. At each quarter end, our recorded reserve for claim losses is initially the result of taking the prior recorded reserve for claim losses, adding the current provision and subtracting actual paid claims, resulting in an amount that management then compares to the range of reasonable estimates provided by the actuarial calculation. We recorded our loss provision rate at 5.5% for the last two quarters of 2015 and at 6.0% in the first two quarters of 2015 resulting in an average provision rate of 5.7% for the entire 2015 period. Our average loss provision rate was 6.2% and 7% for the years ended December 31, 2014 and 2013, respectively. Of such annual amounts, 5.2%, 5.5% and 5.3% related to losses on policies written in the current year, and the remainder relates to developments on prior year policies. The decrease in the loss provision rate during 2015 was primarily driven by positive development in the more recent policy years. In 2015, 2014, and 2013 adverse development of prior year losses of $22 million or 0.5% of 2015 premium, $26 million or 0.7% of 2014 premium and $71 million or 1.7% of 2013 premium was accounted for in the loss provision rate.
Due to the uncertainty inherent in the process and due to the judgment used by both management and our actuary, our ultimate liability may be greater or less than our carried reserves. If the recorded amount is within the actuarial range but not at the central estimate, we assess the position within the actuarial range by analysis of other factors in order to determine that the recorded amount is our best estimate. These factors, which are both qualitative and quantitative, can change from period to period, and include items such as current trends in the real estate industry (which we can assess, but for which there is a time lag in the development of the data), any adjustments from the actuarial estimates needed for the effects of unusually large or small claims, improvements in our claims management processes, and other cost saving measures. If the recorded amount is not within a
41
reasonable range of our actuary's central estimate, we may have to record a charge or credit and reassess the loss provision rate on a go forward basis. We will continue to reassess the provision to be recorded in future periods consistent with this methodology.
The table below presents our title insurance loss development experience for the past three years:
2015 | 2014 | 2013 | |||||||||
(In millions) | |||||||||||
Beginning balance | $ | 1,621 | $ | 1,636 | $ | 1,748 | |||||
Reserve assumed, net (1) | — | 52 | — | ||||||||
Reinsurance recoverable | 1 | 7 | — | ||||||||
Claims loss provision related to: | |||||||||||
Current year | 224 | 202 | 220 | ||||||||
Prior years | 22 | 26 | 71 | ||||||||
Total title claims loss provision | 246 | 228 | 291 | ||||||||
Claims paid, net of recoupments related to: | |||||||||||
Current year | (7 | ) | (5 | ) | (9 | ) | |||||
Prior years | (278 | ) | (297 | ) | (394 | ) | |||||
Total title claims paid, net of recoupments | (285 | ) | (302 | ) | (403 | ) | |||||
Ending balance | $ | 1,583 | $ | 1,621 | $ | 1,636 | |||||
Title premiums | $ | 4,286 | $ | 3,671 | $ | 4,152 | |||||
_____________________
(1) | Reserve of $54 million was recorded as part of the acquisition of LPS on January 2, 2014, and a reserve of $2 million was released as part of the sale of a small title operation. |
2015 | 2014 | 2013 | ||||||
Provision for claim losses as a percentage of title insurance premiums: | ||||||||
Current year | 5.2 | % | 5.5 | % | 5.3 | % | ||
Prior years | 0.5 | 0.7 | 1.7 | |||||
Total provision | 5.7 | % | 6.2 | % | 7.0 | % | ||
Actual claims payments are made up of loss payments and claims management expenses offset by recoupments and were as follows (in millions):
Loss Payments | Claims Management Expenses | Recoupments | Net Loss Payments | |||||||||||||
Year ended December 31, 2015 | $ | 211 | $ | 137 | $ | (63 | ) | $ | 285 | |||||||
Year ended December 31, 2014 | 207 | 151 | (56 | ) | 302 | |||||||||||
Year ended December 31, 2013 | 323 | 162 | (82 | ) | 403 | |||||||||||
As of December 31, 2015 and 2014, our recorded reserves were $1,583 million and $1,621 million, respectively, which we determined were reasonable and represented our best estimate and these recorded amounts were within a reasonable range of the central estimates provided by our actuaries. Our recorded reserves were approximately $86 million above the mid-point of the range of our actuarial estimates as of December 31, 2015, but within the provided actuarial range of $1.3 billion and $1.7 billion, and were $20 million above the mid-point of the range of our actuarial estimates as of December 31, 2014.
During 2015 and 2014, payment patterns were consistent with our actuaries and management's expectations. Also, we continued to see positive development relating to the 2009 through 2014 policy years, which we believe is indicative of more stringent underwriting standards by us and the lending industry. In addition we have seen significant positive development in residential owners policies due to increased payments on residential lenders policies which inherently limit the potential loss on the related owners policy to the differential in coverage amount between the amount insured under the owner's policy and the amount paid under the residential lender's policy. Also, any residential lender policy claim paid relating to a property that is in foreclosure negates any potential loss under an owner's policy previously issued on the property as the owner has no equity in the property. Along with the positive development on claims management expenses, our ending open claim inventory decreased from approximately 21,000 claims at December 31, 2014 to approximately 17,000 claims at December 31, 2015. If actual claims loss
42
development varies from what is currently expected and is not offset by other factors, it is possible that our recorded reserves may fall outside a reasonable range of our actuary's central estimate, which may require additional reserve adjustments in future periods.
An approximate $43 million increase (decrease) in our annualized provision for title claim losses would occur if our loss provision rate were 1% higher (lower), based on 2015 title premiums of $4,286 million. A 10% increase (decrease) in our reserve for title claim losses, as of December 31, 2015, would result in an increase (decrease) in our provision for title claim losses of approximately $158 million.
Valuation of Investments. We regularly review our investment portfolio for factors that may indicate that a decline in fair value of an investment is other-than-temporary. Some factors considered in evaluating whether or not a decline in fair value is other-than-temporary include: (i) our intent and need to sell the investment prior to a period of time sufficient to allow for a recovery in value; (ii) the duration and extent to which the fair value has been less than cost; and (iii) the financial condition and prospects of the issuer. Such reviews are inherently uncertain and the value of the investment may not fully recover or may decline in future periods resulting in a realized loss. Investments are selected for analysis whenever an unrealized loss is greater than a certain threshold that we determine based on the size of our portfolio or by using other qualitative factors. Fixed maturity investments that have unrealized losses caused by interest rate movements are not at risk as we do not anticipate having the need or intent to sell prior to maturity. Unrealized losses on investments in equity securities, preferred stock and fixed maturity instruments that are susceptible to credit related declines are evaluated based on the aforementioned factors. Currently available market data is considered and estimates are made as to the duration and prospects for recovery, and the intent or ability to retain the investment until such recovery takes place. These estimates are revisited quarterly and any material degradation in the prospect for recovery will be considered in the other-than-temporary impairment analysis. We believe that our monitoring and analysis has provided for the proper recognition of other-than-temporary impairments over the past three-year period. Any change in estimate in this area will have an impact on the results of operations of the period in which a charge is taken.
The fair value hierarchy established by the standard on fair value includes three levels, which are based on the priority of the inputs to the valuation technique. The fair value hierarchy gives the highest priority to quoted prices in active markets for identical assets or liabilities (Level 1) and the lowest priority to unobservable inputs (Level 3). If the inputs used to measure the financial instruments fall within different levels of the hierarchy, the categorization is based on the lowest level input that is significant to the fair value measurement of the instrument.
In accordance with the standard on fair value, our financial assets and liabilities that are recorded in the Consolidated Balance Sheets are categorized based on the inputs to the valuation techniques as follows:
Level 1. Financial assets and liabilities whose values are based on unadjusted quoted prices for identical assets or liabilities in an active market that we have the ability to access.
Level 2. Financial assets and liabilities whose values are based on quoted prices in markets that are not active or model inputs that are observable either directly or indirectly for substantially the full term of the asset or liability.
Level 3. Financial assets and liabilities whose values are based on model inputs that are unobservable.
The following table presents our fair value hierarchy for those assets and liabilities measured at fair value on a recurring basis as of December 31, 2015 and 2014, respectively:
December 31, 2015 | |||||||||||||||
Level 1 | Level 2 | Level 3 | Total | ||||||||||||
(In millions) | |||||||||||||||
Assets: | |||||||||||||||
Fixed-maturity securities available for sale: | |||||||||||||||
U.S. government and agencies | $ | — | $ | 117 | $ | — | $ | 117 | |||||||
State and political subdivisions | — | 768 | — | 768 | |||||||||||
Corporate debt securities | — | 1,495 | — | 1,495 | |||||||||||
Foreign government bonds | — | 107 | — | 107 | |||||||||||
Mortgage-backed/asset-backed securities | — | 71 | — | 71 | |||||||||||
Preferred stock available for sale | 42 | 247 | — | 289 | |||||||||||
Equity securities available for sale | 334 | 11 | — | 345 | |||||||||||
Total assets | $ | 376 | $ | 2,816 | $ | — | $ | 3,192 | |||||||
43
December 31, 2014 | |||||||||||||||
Level 1 | Level 2 | Level 3 | Total | ||||||||||||
(In millions) | |||||||||||||||
Assets: | |||||||||||||||
Fixed-maturity securities available for sale: | |||||||||||||||
U.S. government and agencies | $ | — | $ | 115 | $ | — | $ | 115 | |||||||
State and political subdivisions | — | 948 | — | 948 | |||||||||||
Corporate debt securities | — | 1,820 | — | 1,820 | |||||||||||
Foreign government bonds | — | 37 | — | 37 | |||||||||||
Mortgage-backed/asset-backed securities | — | 105 | — | 105 | |||||||||||
Preferred stock available for sale | 50 | 173 | — | 223 | |||||||||||
Equity securities available for sale | 145 | — | — | 145 | |||||||||||
Total assets | $ | 195 | $ | 3,198 | $ | — | $ | 3,393 | |||||||
Our Level 2 fair value measures for fixed-maturities available for sale are provided by third-party pricing services. We utilize one firm for our taxable bond and preferred stock portfolios and another for our tax-exempt bond portfolio. These pricing services are leading global providers of financial market data, analytics and related services to financial institutions. We rely on one price for each instrument to determine the carrying amount of the assets on our balance sheet. The inputs utilized in these pricing methodologies include observable measures such as benchmark yields, reported trades, broker dealer quotes, issuer spreads, two sided markets, benchmark securities, bids, offers and reference data including market research publications. We review the pricing methodologies for all of our Level 2 securities by obtaining an understanding of the valuation models and assumptions used by the third-party as well as independently comparing the resulting prices to other publicly available measures of fair value and internally developed models. The pricing methodologies used by the relevant third party pricing services are:
• | U.S. government and agencies: These securities are valued based on data obtained for similar securities in active markets and from inter-dealer brokers. |
• | State and political subdivisions: These securities are valued based on data obtained for similar securities in active markets and from inter-dealer brokers. Factors considered include relevant trade information, dealer quotes and other relevant market data. |
• | Corporate debt securities: These securities are valued based on dealer quotes and related market trading activity. Factors considered include the bond's yield, its terms and conditions, and any other feature which may influence its risk and thus marketability, as well as relative credit information and relevant sector news. |
• | Foreign government bonds: These securities are valued based on a discounted cash flow model incorporating observable market inputs such as available broker quotes and yields of comparable securities. |
• | Mortgage-backed/asset-backed securities: These securities are comprised of agency mortgage-backed securities, collateralized mortgage obligations, and asset-backed securities. They are valued based on available trade information, dealer quotes, cash flows, relevant indices and market data for similar assets in active markets. |
• | Preferred stocks: Preferred stocks are valued by calculating the appropriate spread over a comparable U.S. Treasury security. Inputs include benchmark quotes and other relevant market data. |
• | Equity securities available for sale: This security is valued using a blending of two models, a discounted cash flow model and a comparable company model utilizing earnings and multiples of similar publicly-traded companies. |
Prior to December 31, 2014 our Level 2 financial assets and liabilities included our interest rate swap, foreign exchange contracts, and commodity contracts which were valued using the income approach. This approach uses techniques to convert future amounts to a single present value amount based upon market expectations (including present value techniques, option-pricing and excess earnings models). As of December 31, 2015 and December 31, 2014 we no longer hold these Level 2 financial assets and liabilities.
As of December 31, 2015 and December 31, 2014 we held no assets nor liabilities measured at fair value using Level 3 inputs.
During the years ended December 31, 2015, 2014 and 2013, we incurred impairment charges relating to investments that were determined to be other-than-temporarily impaired of $14 million, $6 million, and $1 million, respectively. Impairment charges during all three years related to fixed maturity securities primarily related to our conclusion that the credit risk of these holdings was high and the ability of the issuer to pay the full amount of the principal outstanding was unlikely. Impairment charges in the 2015 period also included an immaterial portion related to equity securities.
44
Included in our Investments as of December 31, 2015 are various holdings in Foreign securities as follows (in millions):
Carrying Value | Cost Basis | Unrealized Gains | Unrealized Losses | Market Value | |||||||||||||||
(In millions) | |||||||||||||||||||
Available for sale securities: | |||||||||||||||||||
Australia | $ | 18 | $ | 19 | — | $ | (1 | ) | $ | 18 | |||||||||
Belgium | 18 | 18 | — | — | 18 | ||||||||||||||
Cayman Islands | 3 | 3 | — | — | 3 | ||||||||||||||
Canada | 52 | 59 | — | (7 | ) | 52 | |||||||||||||
China | 12 | 12 | — | — | 12 | ||||||||||||||
Curacao | 13 | 13 | — | — | 13 | ||||||||||||||
France | 12 | 12 | — | — | 12 | ||||||||||||||
Germany | 35 | 36 | — | (1 | ) | 35 | |||||||||||||
Ireland | 21 | 21 | — | — | 21 | ||||||||||||||
Japan | 58 | 58 | — | — | 58 | ||||||||||||||
Korea | 13 | 13 | — | — | 13 | ||||||||||||||
Netherlands | 13 | 13 | — | — | 13 | ||||||||||||||
Norway | 13 | 13 | — | — | 13 | ||||||||||||||
New Zealand | 73 | 79 | — | (6 | ) | 73 | |||||||||||||
Switzerland | 9 | 9 | — | — | 9 | ||||||||||||||
United Kingdom | 64 | 64 | 1 | (1 | ) | 64 | |||||||||||||
Total | $ | 427 | $ | 442 | $ | 1 | $ | (16 | ) | $ | 427 | ||||||||
We have reviewed all of these securities as of December 31, 2015 and do not believe that there is a risk of significant credit loss as these securities are in a gross unrealized gain position of $1 million and a gross unrealized loss position of $16 million. We held no European sovereign debt at December 31, 2015.
Goodwill. We have made acquisitions in the past that have resulted in a significant amount of goodwill. As of December 31, 2015 and 2014, goodwill aggregated was $4,760 million and $4,721 million, respectively. The majority of our goodwill as of December 31, 2015 relates to goodwill recorded in connection with the LPS acquisition on January 2, 2014, as well as the Chicago Title merger in 2000. In evaluating the recoverability of goodwill, we perform a qualitative analysis to determine whether it is more likely than not that our fair value exceeds our carrying value. Based on the results of this analysis, an annual goodwill impairment test may be completed based on an analysis of the discounted future cash flows generated by the underlying assets. The process of determining whether or not goodwill is impaired or recoverable relies on projections of future cash flows, operating results and market conditions. Future cash flow estimates are based partly on projections of market conditions such as the volume and mix of refinance and purchase transactions and interest rates, which are beyond our control and are likely to fluctuate. While we believe that our estimates of future cash flows are reasonable, these estimates are not guarantees of future performance and are subject to risks and uncertainties that may cause actual results to differ from what is assumed in our impairment tests. Such analyses are particularly sensitive to changes in estimates of future cash flows and discount rates. Changes to these estimates might result in material changes in fair value and determination of the recoverability of goodwill, which may result in charges against earnings and a reduction in the carrying value of our goodwill in the future.We have completed our annual goodwill impairment analysis in each of the past three years and as a result, no impairment charges were recorded to goodwill in 2015, 2014, or 2013. As of December 31, 2015, we have determined that our goodwill has a fair value which substantially exceeds our carrying value.
Other Intangible Assets. We have other intangible assets, not including goodwill, which consist primarily of customer relationships and contracts and trademarks which are generally recorded in connection with acquisitions at their fair value. Intangible assets with estimable lives are amortized over their respective estimated useful lives to their estimated residual values and reviewed for impairment whenever events or changes in circumstances indicate that the carrying amount may not be recoverable. In general, customer relationships are amortized over their estimated useful lives using an accelerated method which takes into consideration expected customer attrition rates. Contractual relationships are generally amortized over their contractual life. Trademarks are generally considered intangible assets with indefinite lives and are reviewed for impairment at least annually. Debt issuance costs are amortized on a straight line basis over the contractual life of the related debt instrument.
45
We recorded a $11 million impairment expense to Tradenames in our Restaurant Group segment during the year ended December 31, 2014. We recorded no impairment expense related to other intangible assets in the years ended December 31, 2015 or 2013.
Title Revenue Recognition. Our direct title insurance premiums and escrow, title-related and other fees are recognized as revenue at the time of closing of the related transaction as the earnings process is then considered complete. Premium revenues from agency operations and agency commissions include an accrual based on estimates using historical information of the volume of transactions that have closed in a particular period for which premiums have not yet been reported to us. The accrual for agency premiums is necessary because of the lag between the closing of these transactions and the reporting of these policies to us by the agent. Historically, the time lag between the closing of these transactions by our agents and the reporting of these policies, or premiums, to us has been up to 15 months, with 86-89% reported within three months following closing, an additional 9-11% reported within the next three months and the remainder within seven to fifteen months. In addition to accruing these earned but unreported agency premiums, we also accrue agent commission expense, which was 76.0% of agent premiums earned in 2015, 75.7% of agent premiums earned in 2014 and 76.1% of agent premiums earned in 2013. We also record provision for claim losses at our average provision rate at the time we record the accrual for the premiums, which was 5.7% for 2015, 6.2% for 2014 and 7.0% for 2013, and accruals for premium taxes and other expenses relating to our premium accrual. The resulting impact to pretax earnings in any period is less than 10% of the accrued premium amount. The impact of the change in the accrual for agency premiums and related expenses on our pretax earnings was a decrease of $5 million for the year ended December 31, 2015, a decrease of $9 million for the year ended 2014 and a decrease of $7 million for the year ended 2013. The amount due from our agents relating to this accrual, i.e., the agent premium less their contractual retained commission, was approximately $45 million and $55 million at December 31, 2015 and 2014, respectively, which represents agency premiums of approximately $230 million and $276 million at December 31, 2015 and 2014, respectively, and agent commissions of $185 million and $221 million at December 31, 2015 and 2014, respectively. We may have changes in our accrual for agency revenue in the future if additional relevant information becomes available.
Black Knight Revenue Recognition. Within our Black Knight segment, our primary types of revenues and our revenue recognition policies as they pertain to the types of contractual arrangements we enter into with our customers to provide services, software licenses, and software-related services either individually or as part of an integrated offering of multiple services. These arrangements occasionally include offerings from more than one segment to the same customer. We recognize revenues relating to mortgage processing, outsourced business processing services, data and analytics services, along with software licensing and software-related services. In some cases, these services are offered in combination with one another, and in other cases we offer them individually. Revenues from processing services are typically volume-based depending on factors such as the number of accounts processed, transactions processed and computer resources utilized.
The majority of our revenues are from outsourced data processing and application hosting, data, analytic and valuation related services, and outsourced business processing services. Revenue is realized or realizable and earned when all of the following criteria are met: (1) persuasive evidence of an arrangement exists; (2) delivery has occurred or services have been rendered; (3) the seller’s price to the buyer is fixed or determinable; and (4) collectibility is reasonably assured. For hosting arrangements, revenues and costs related to implementation, conversion and programming services are deferred and subsequently recognized using the straight-line method over the term of the related services agreement. We evaluate these deferred contract costs for impairment in the event any indications of impairment exist.
In the event that our arrangements with our customers include more than one element, we determine whether the individual revenue elements can be recognized separately. In arrangements with multiple deliverables, the delivered items are considered separate units of accounting if (1) they have value on a standalone basis and (2) performance of the undelivered items is considered probable and within our control. Arrangement consideration is then allocated to the separate units of accounting based on relative selling price. If it exists, vendor-specific objective evidence is used to determine relative selling price, otherwise third-party evidence of selling price is used. If neither exists, the best estimate of selling price is used for the deliverable.
For multiple element software arrangements, we determine the appropriate units of accounting and how the arrangement consideration should be measured and allocated to the separate units. Initial license fees are recognized when a contract exists, the fee is fixed or determinable, software delivery has occurred and collection of the receivable is deemed probable, provided that vendor-specific objective evidence (“VSOE”) has been established for each element or for any undelivered elements. We determine the fair value of each element or the undelivered elements in multi-element software arrangements based on VSOE. VSOE for each element is based on the price charged when the same element is sold separately, or in the case of post-contract customer support, when a stated renewal rate is provided to the customer. If evidence of fair value of all undelivered elements exists but evidence does not exist for one or more delivered elements, then revenue is recognized using the residual method. Under the residual method, the fair value of the undelivered elements is deferred and the remaining portion of the arrangement fee is recognized as revenue. If evidence of fair value does not exist for one or more undelivered elements of a contract, then all revenue is deferred until all elements are delivered or fair value is determined for all remaining undelivered elements. Revenue from post-contract customer support is recognized ratably over the term of the agreement. We record deferred revenue for all billings invoiced prior to revenue recognition.
46
Accounting for Income Taxes. As part of the process of preparing the consolidated financial statements, we are required to determine income taxes in each of the jurisdictions in which we operate. This process involves estimating actual current tax expense together with assessing temporary differences resulting from differing recognition of items for income tax and accounting purposes. These differences result in deferred income tax assets and liabilities, which are included within the Consolidated Balance Sheets. We must then assess the likelihood that deferred income tax assets will be recovered from future taxable income and, to the extent we believe that recovery is not likely, establish a valuation allowance. To the extent we establish a valuation allowance or increase this allowance in a period, we must reflect this increase as expense within Income tax expense in the Consolidated Statement of Earnings. Determination of income tax expense requires estimates and can involve complex issues that may require an extended period to resolve. Further, the estimated level of annual pre-tax income can cause the overall effective income tax rate to vary from period to period. We believe that our tax positions comply with applicable tax law and that we adequately provide for any known tax contingencies. We believe the estimates and assumptions used to support our evaluation of tax benefit realization are reasonable. Final determination of prior-year tax liabilities, either by settlement with tax authorities or expiration of statutes of limitations, could be materially different than estimates reflected in assets and liabilities and historical income tax provisions. The outcome of these final determinations could have a material effect on our income tax provision, net income or cash flows in the period that determination is made.
Capitalized Software. Capitalized software includes the fair value of software acquired in business combinations, purchased software and capitalized software development costs. Purchased software is recorded at cost and amortized using the straight-line method over its estimated useful life. Software acquired in business combinations is recorded at its fair value and amortized using straight-line or accelerated methods over its estimated useful life, ranging from 5 to 10 years. In our Black Knight segment we have significant internally developed software. These costs are amortized using the straight-line or an accelerated method over the estimated useful life. Useful lives of computer software range from 3 to 10 years. For software products to be sold, leased, or otherwise marketed, all costs incurred to establish the technological feasibility are research and development costs, and are expensed as they are incurred. Costs incurred subsequent to establishing technological feasibility, such as programmers' salaries and related payroll costs and costs of independent contractors, are capitalized and amortized on a product by product basis commencing on the date of general release to customers. We do not capitalize any costs once the product is available for general release to customers. For internal-use computer software products, internal and external costs incurred during the preliminary project stage are expensed as they are incurred. Internal and external costs incurred during the application development stage are capitalized and amortized on a product by product basis commencing on the date the software is ready for its intended use. We do not capitalize any costs once the software is ready for its intended use.
We also assess the recorded value of computer software for impairment on a regular basis by comparing the carrying value to the estimated future cash flows to be generated by the underlying software asset. There is an inherent uncertainty in determining the expected useful life of or cash flows to be generated from computer software. We recorded impairment charges of $1 million and $5 million in the years ended December 31, 2015 and 2014, respectively, for abandoned software development projects. We did not record any impairments for software in the year ended December 31, 2013.
Certain Factors Affecting Comparability
Year ended December 31, 2015. On September 28, 2015 we distributed all of our shares of J. Alexander's to the holders of FNFV Group Common Stock. As a result of this distribution, the results of operations for the year-ended December 31, 2015 include the results from J. Alexander's through the date of the distribution.
Year ended December 31, 2014. On January 2, 2014, we completed the purchase of LPS. As a result of this acquisition we began to consolidate the results of LPS effective January 3, 2014. On December 31, 2014, we distributed all of our shares in Remy to the holders of FNFV Group Common Stock. As a result of this distribution, the operations for Remy are presented as discontinued operations for all periods presented.
47
Results of Operations
Consolidated Results of Operations
Net earnings. The following table presents certain financial data for the years indicated:
Year Ended December 31, | |||||||||||
2015 | 2014 | 2013 | |||||||||
(Dollars in millions) | |||||||||||
Revenue: | |||||||||||
Direct title insurance premiums | $ | 2,009 | $ | 1,727 | $ | 1,800 | |||||
Agency title insurance premiums | 2,277 | 1,944 | 2,352 | ||||||||
Escrow, title-related and other fees | 3,324 | 2,804 | 1,737 | ||||||||
Restaurant revenue | 1,412 | 1,436 | 1,408 | ||||||||
Interest and investment income | 123 | 126 | 127 | ||||||||
Realized gains and losses, net | (13 | ) | (13 | ) | 16 | ||||||
Total revenue | 9,132 | 8,024 | 7,440 | ||||||||
Expenses: | |||||||||||
Personnel costs | 2,671 | 2,540 | 2,061 | ||||||||
Agent commissions | 1,731 | 1,471 | 1,789 | ||||||||
Other operating expenses | 1,881 | 1,643 | 1,273 | ||||||||
Cost of restaurant revenue | 1,195 | 1,220 | 1,204 | ||||||||
Depreciation and amortization | 410 | 403 | 133 | ||||||||
Provision for title claim losses | 246 | 228 | 291 | ||||||||
Interest expense | 131 | 127 | 73 | ||||||||
Total expenses | 8,265 | 7,632 | 6,824 | ||||||||
Earnings from continuing operations before income taxes and equity in (loss) earnings of unconsolidated affiliates | 867 | 392 | 616 | ||||||||
Income tax expense | 290 | 312 | 195 | ||||||||
Equity in (loss) earnings of unconsolidated affiliates | (16 | ) | 432 | (26 | ) | ||||||
Net earnings from continuing operations | $ | 561 | $ | 512 | $ | 395 | |||||
Revenues.
Total revenue in 2015 increased $1,108 million compared to 2014, primarily due to an increase in closed order volumes in our direct business, increases in agent remittances, an increase in revenue in our Black Knight segment, and increases related to businesses acquired in the current year and late 2014. Total revenue in 2014 increased $584 million compared to 2013, primarily due to the addition of revenue from the acquisition of LPS on January 2, 2014, as well as an increase in the Restaurant Group segment and the FNFV Corporate and Other segment, offset by a decrease in the Title segment and FNF Core Corporate and Other segments.
Total net earnings from continuing operations increased $49 million in the year ended December 31, 2015, compared to the 2014 period. The increase consisted of a $310 million increase at FNF Core and $261 million decrease at FNFV. Total net earnings from continuing operations increased $117 million in the year ended December 31, 2014, compared to the 2013 period. The increase consisted of a $175 million decrease at FNF Core and $292 million increase at FNFV.
The change in revenue and net earnings from the FNF Core segments and FNFV segments is discussed in further detail at the segment level below.
Interest and investment income levels are primarily a function of securities markets, interest rates and the amount of cash available for investment. Interest and investment income was $123 million, $126 million, and $127 million for the years ended December 31, 2015, 2014, and 2013, respectively. The decrease in 2015 as compared to 2014 is primarily attributable to decreased bond yields and a change in portfolio mix. The decrease in 2014 as compared to 2013 is due to decreased bond yield and decreased total holdings. The effective return on average invested assets, excluding realized gains and losses, was 3.4%, 3.6%, and 4.1% for the years ended December 31, 2015, 2014, and 2013, respectively.
Net realized (losses) and gains totaled $(13) million, $(13) million, and $16 million for the years ended December 31, 2015, 2014, and 2013, respectively. The net realized loss for the year ended December 31, 2015 includes a net realized gain of $1 million on our investment portfolio, net realized gains of $16 million due to favorable settlement of litigation, net realized losses of $19 million due to impairment of long-lived assets at our Restaurant Group, net realized losses of $5 million on early redemption of
48
Black Knight corporate bonds, and $6 million of miscellaneous other net realized losses. The net realized loss for the year ended December 31, 2014 includes net realized gains of $9 million on the sales of various investments and gains of $11 million on consolidation of previously owned minority interests. These gains were offset by a $6 million impairment write down on bonds, asset impairments of $25 million, and $2 million in losses on other individually insignificant items. The net realized gain for the year ended December 31, 2013 includes an $11 million gain on the sale of FIS stock, a $10 million gain on individually insignificant portfolio sales, a $5 million net gain on sales of preferred stock, and a $3 million gain on the settlement of a mortgage loan at J. Alexander's. These gains were offset by a $3 million loss on the structured notes, $4 million in title plant impairments and $6 million in other individually insignificant impairments and net losses.
Expenses.
Our operating expenses consist primarily of personnel costs; other operating expenses, which in our title business are incurred as orders are received and processed and at Black Knight are incurred for data processing; agent commissions, which are incurred as revenue is recognized; and cost of restaurant revenue. Title insurance premiums, escrow and title-related fees are generally recognized as income at the time the underlying transaction closes or other service is provided. Direct title operations revenue often lags approximately 45-60 days behind expenses and therefore gross margins may fluctuate. The changes in the market environment, mix of business between direct and agency operations and the contributions from our various business units have historically impacted margins and net earnings. We have implemented programs and have taken necessary actions to maintain expense levels consistent with revenue streams. However, a short time lag exists in reducing variable costs and certain fixed costs are incurred regardless of revenue levels.
Personnel costs include base salaries, commissions, benefits, stock-based compensation and bonuses paid to employees, and are one of our most significant operating expenses. Personnel costs that are directly attributable to the operations of the Restaurant Group are included in Cost of restaurant revenue.
Agent commissions represent the portion of premiums retained by our third-party agents pursuant to the terms of their respective agency contracts.
Other operating expenses consist primarily of facilities expenses, title plant maintenance, premium taxes (which insurance underwriters are required to pay on title premiums in lieu of franchise and other state taxes), appraisal fees and other cost of sales on ServiceLink product offerings and other title related products, postage and courier services, computer services, professional services, travel expenses, general insurance, and bad debt expense on our trade and notes receivable.
Cost of restaurant revenue includes cost of food and beverage, primarily the costs of beef, groceries, produce, seafood, poultry and alcoholic and non-alcoholic beverages, net of vendor discounts and rebates, payroll and related costs and expenses directly relating to restaurant level activities, and restaurant operating costs including occupancy and other operating expenses at the restaurant level.
The provision for title claim losses includes an estimate of anticipated title and title-related claims, and escrow losses.
The change in expenses from the FNF Core segments and FNFV segments is discussed in further detail at the segment level below.
Income tax expense was $290 million, $312 million, and $195 million for the years ended December 31, 2015, 2014, and 2013, respectively. Income tax expense as a percentage of earnings from continuing operations before income taxes for the years ended December 31, 2015, 2014, and 2013 was 33.4%, 79.6%, and 31.7%, respectively. The decrease in the effective tax rate in 2015 from 2014 is primarily related to reduced taxes associated with the reduction in Equity in (loss) earnings of unconsolidated affiliates. The increase in the effective tax rate in 2014 from 2013 is due mainly to the $495 million pre-tax gain of the Ceridian sale of Comdata to FleetCor, which was 43.2% of the effective tax rate; excluding the gain, the effective tax rate for 2014 was 36.5%. Apart from the Comdata sale gain, the fluctuation in income tax expense as a percentage of earnings from continuing operations before income taxes is attributable to our estimate of ultimate income tax liability and changes in the characteristics of net earnings year to year, such as the weighting of operating income versus investment income.
Equity in (loss) earnings of unconsolidated affiliates was $(16) million, $432 million, and $(26) million for the years ended December 31, 2015, 2014, and 2013, respectively, and consisted of our equity in the net (loss) earnings of Ceridian and other investments in unconsolidated affiliates. The decrease in 2015 and the increase in 2014 are primarily due to our $495 million portion of the Ceridian gain on the sale of Comdata to Fleetcor in 2014.
49
Segment Results of Operations
FNF Core Operations
Title
Beginning January 2, 2014, the Title segment includes the results of the transaction services business acquired with LPS.
The following table presents certain financial data for the years indicated:
Year Ended December 31, | |||||||||||
2015 | 2014 | 2013 | |||||||||
(In millions) | |||||||||||
Revenues: | |||||||||||
Direct title insurance premiums | $ | 2,009 | $ | 1,727 | $ | 1,800 | |||||
Agency title insurance premiums | 2,277 | 1,944 | 2,352 | ||||||||
Escrow, title-related and other fees | 2,005 | 1,855 | 1,597 | ||||||||
Interest and investment income | 123 | 122 | 127 | ||||||||
Realized gains and losses, net | 14 | (4 | ) | 18 | |||||||
Total revenue | 6,428 | 5,644 | 5,894 | ||||||||
Expenses: | |||||||||||
Personnel costs | 2,090 | 1,896 | 1,845 | ||||||||
Other operating expenses | 1,381 | 1,370 | 1,096 | ||||||||
Agent commissions | 1,731 | 1,471 | 1,789 | ||||||||
Depreciation and amortization | 144 | 145 | 65 | ||||||||
Provision for title claim losses | 246 | 228 | 291 | ||||||||
Total expenses | 5,592 | 5,110 | 5,086 | ||||||||
Earnings before income taxes | $ | 836 | $ | 534 | $ | 808 | |||||
Orders opened by direct title operations (in 000's) | 2,092 | 1,914 | 2,181 | ||||||||
Orders closed by direct title operations (in 000's) | 1,472 | 1,319 | 1,708 | ||||||||
Total revenues in 2015 increased $784 million or 13.9% compared to 2014. Total revenues in 2014 decreased $250 million or 4.2% compared to 2013. The increase in the year ended December 31, 2015 is primarily attributable to improvements in the overall real estate markets driving increases in closed order volumes as well as current year acquisitions. The decrease in revenue in the year ended December 31, 2014 was primarily driven by decreased closed order volume.
During the year ended December 31, 2015 the results of Title included increased Personnel costs, Agent commissions, and Provision for title claim losses associated with the increased title premium revenue. During the year ended December 31, 2014, the results of Title contained $35 million of transaction expenses related to the LPS acquisition and $1 million for merger related litigation, which were included in other operating expenses. Included within personnel costs in the year ended December 31, 2014 were $20 million in severance expenses related to the LPS acquisition and $30 million expense to accrue for bonuses under our synergy bonus program. Depreciation and amortization for the year ended December 31, 2014 included $88 million related to assets acquired with LPS and marked to fair value in purchase accounting.
The following table presents the percentages of title insurance premiums generated by our direct and agency operations:
Year Ended December 31, | ||||||||||||||||||||
2015 | 2014 | 2013 | ||||||||||||||||||
Amount | % | Amount | % | Amount | % | |||||||||||||||
(Dollars in millions) | ||||||||||||||||||||
Title premiums from direct operations | $ | 2,009 | 46.9 | % | $ | 1,727 | 47.0 | % | $ | 1,800 | 43.4 | % | ||||||||
Title premiums from agency operations | 2,277 | 53.1 | 1,944 | 53.0 | 2,352 | 56.6 | ||||||||||||||
Total title premiums | $ | 4,286 | 100.0 | % | $ | 3,671 | 100.0 | % | $ | 4,152 | 100.0 | % | ||||||||
50
Title premiums increased 16.8% in the year ended December 31, 2015 as compared to the 2014 period. The increase was made up of an increase in premiums from direct operations of $282 million, or 16.3% and an increase in premiums from agency operations of $333 million, or 17.1%. Title premiums decreased 12% in the year ended December 31, 2014 as compared to the 2013 period. The decrease was made up of a decrease in premiums from direct operations of $73 million, or 4%, and a decrease in premiums from agency operations of $408 million, or 17%.
The following table presents the percentages of opened and closed title insurance orders generated by purchase and refinance transactions by our direct operations: | |||||||||
Year ended December 31, | |||||||||
2015 | 2014 | 2013 | |||||||
Opened title insurance orders from purchase transactions (1) | 54.0 | % | 57.4 | % | 46.1 | % | |||
Opened title insurance orders from refinance transactions (1) | 46.0 | 42.6 | 53.9 | ||||||
100.0 | % | 100.0 | % | 100.0 | % | ||||
Closed title insurance orders from purchase transactions (1) | 54.5 | % | 58.6 | % | 42.6 | % | |||
Closed title insurance orders from refinance transactions (1) | 45.5 | 41.4 | 57.4 | ||||||
100.0 | % | 100.0 | % | 100.0 | % | ||||
_______________________________________
(1) Percentages exclude consideration of an immaterial number of non-purchase and non-refinance orders.
Title premiums from direct operations increased in 2015, primarily due to an increase in closed order volumes as compared to the prior year. Closed order volumes were 1,472,000 in the year ended December 31, 2015 compared with 1,319,000 in the year ended December 31, 2014. This represented an increase of 11.6%. The increase in closed order volumes was primarily related to a significant increase in purchase and refinance transactions in the year ended December 31, 2015 compared to the 2014 period. Open title orders increased consistently with closed orders in the 2015 period.
The average fee per file in our direct operations was $2,065 in the year ended December 31, 2015, compared to $2,014 in the year ended December 31, 2014. The increase in average fee per file reflects an increase in commercial transactions which have a higher fee per file and an increase in residential purchase transactions overall, offset by a higher proportion of refinance to purchase transactions from our residential title revenue. The fee per file tends to change as the mix of refinance and purchase transactions changes, because purchase transactions involve the issuance of both a lender’s policy and an owner’s policy, resulting in higher fees, whereas refinance transactions only require a lender’s policy, resulting in lower fees.
The increase in title premiums from agency operations is primarily the result of the overall increase in real estate activity since the prior year. The increase was consistent with the aforementioned increase in direct operations.
Escrow, title related and other fees increased by $150 million, or 8.1%, in the year ended December 31, 2015 from the 2014 period. Escrow fees, which are more directly related to our direct operations, increased $111 million, or 19%, in the year ended December 31, 2015 compared to the 2014 period. The increase is consistent with the increase in direct title premiums. Other fees in the Title segment, excluding escrow fees, increased $39 million, or 3.0%, in the year ended December 31, 2015 compared to the 2014 period. The increase in other fees was primarily attributable to revenue associated with BPG acquired in the current year. Escrow, title related and other fees increased by $258 million, or 16%, in the year ended December 31, 2014 from the 2013 period. Escrow fees, which are more directly related to our direct operations, decreased $107 million, or 16%, in the year ended December 31, 2014 compared to the 2013 period. The decrease is consistent with the decrease in direct title premiums. Other fees in the Title segment, excluding escrow fees, increased $364 million, or 40%, in the year ended December 31, 2014 compared to the 2013 period. The increase in other fees was primarily due to the addition of $233 million in the year ended December 31, 2014 related to the transaction services business acquired from LPS on January 2, 2014.
Interest and investment income levels are primarily a function of securities markets, interest rates and the amount of cash available for investment. Interest and investment income increased $1 million in the year ended December 31, 2015 compared to the 2014 period and decreased $5 million in the year ended December 31, 2014 compared to the 2013 period. The increase in 2015 is attributable to a change in portfolio mix and market conditions. The decrease in 2014 is attributable primarily to decreases in market interest rates and in turn lower bond yields.
Personnel costs include base salaries, commissions, benefits, stock-based compensation and bonuses paid to employees, and are one of our most significant operating expenses. The $194 million, or 10.2% increase in the year ended December 31, 2015 compared to the 2014 period is primarily related to additional expense associated with the increased order volumes, acquisitions in the current year, and increased costs associated with the implementation of TRID. Personnel costs as a percentage
51
of total revenues from direct title premiums and escrow, title-related and other fees was 52.1% and 53% for the years ended December 31, 2015 and December 31, 2014, respectively. Average employee count in the Title segment was 20,819 and 19,470 in the years ended December 31, 2015 and 2014, respectively. The increase in the 2015 period is attributable to the aforementioned increase in order volumes and implementation of TRID.
Other operating expenses consist primarily of facilities expenses, title plant maintenance, premium taxes (which insurance underwriters are required to pay on title premiums in lieu of franchise and other state taxes), postage and courier services, computer services, professional services, travel expenses, general insurance, and bad debt expense on our trade and notes receivable. Other operating expenses increased $11 million, or 0.8% in the year ended December 31, 2015 from the 2014 period. Other operating expenses increased consistent with the increase in direct title premiums and escrow, title-related and other fee income offset by other miscellaneous cost reductions.
Agent commissions represent the portion of premiums retained by agents pursuant to the terms of their respective agency contracts. Agent commissions and the resulting percentage of agent premiums we retain vary according to regional differences in real estate closing practices and state regulations.
The following table illustrates the relationship of agent title premiums and agent commissions:
Year Ended December 31, | ||||||||||||||||||||
2015 | 2014 | 2013 | ||||||||||||||||||
Amount | % | Amount | % | Amount | % | |||||||||||||||
(Dollars in millions) | ||||||||||||||||||||
Agent title premiums | $ | 2,277 | 100.0 | % | $ | 1,944 | 100.0 | % | $ | 2,352 | 100.0 | % | ||||||||
Agent commissions | 1,731 | 76.0 | 1,471 | 75.7 | 1,789 | 76.1 | ||||||||||||||
Net retained agent premiums | $ | 546 | 24.0 | % | $ | 473 | 24.3 | % | $ | 563 | 23.9 | % | ||||||||
Net margin from agency title insurance premiums retained as a percentage of total agency premiums in the year ended December 31, 2015 remained consistent with the 2014 and 2013 periods.
The provision for title claim losses includes an estimate of anticipated title and title-related claims and escrow losses. The estimate of anticipated title and title-related claims is accrued as a percentage of title premium revenue based on our historical loss experience and other relevant factors. Any significant adjustments to strengthen or release loss reserves resulting from the comparison with our actuarial analysis are made in addition to this loss provision rate. After considering historical claim losses, reporting patterns and current market information, and analyzing quantitative and qualitative data provided by our legal, claims and underwriting departments, we determine a loss provision rate, which is recorded as a percentage of current title premiums. This loss provision rate is set to provide for losses on current year policies, but due to development of prior years and our long claim duration, it periodically includes amounts of estimated adverse or positive development on prior years' policies. Effective July 1, 2015, we revised our loss provision rate to 5.5% from 6% primarily due to favorable development on more recent policy year claims.
The claim loss provision for title insurance was $246 million, $228 million, and $291 million for the years ended December 31, 2015, 2014, and 2013, respectively. These amounts reflected average claim loss provision rates of 5.7% for 2015, 6.2% for 2014, and 7.0% of title premiums for 2013. We will continue to monitor and evaluate our loss provision level, actual claims paid, and the loss reserve position each quarter.
52
Black Knight
The results of this segment for the years ended December 31, 2015 and December 31, 2014, include the results of Black Knight and subsidiaries, which were initially consolidated on January 2, 2014, the date on which we acquired LPS.
Year Ended December 31, | |||||||
2015 | 2014 | ||||||
Revenues: | |||||||
Escrow, title related and other fees | $ | 931 | $ | 852 | |||
Realized gains and losses, net | (5 | ) | — | ||||
Total revenues | 926 | 852 | |||||
Expenses: | |||||||
Personnel costs | 382 | 449 | |||||
Other operating expenses | 161 | 199 | |||||
Depreciation and amortization | 194 | 188 | |||||
Interest expense | 50 | 31 | |||||
Total expenses | 787 | 867 | |||||
Earnings (loss) from continuing operations before income taxes | $ | 139 | $ | (15 | ) | ||
Total revenues for Black Knight segment increased $74 million in the year ended December 31, 2015 compared to the 2014 period. The increase was driven by higher loan counts as well as increased usage and communication fees in their servicing technology business; by increased professional services and processing revenues from loan origination systems clients and revenues from Closing Insight clients in their origination technology business; and by additional revenue from long-term strategic license deals in its data and analytics segment.
The results of the Black Knight segment were also improved by the reduction in costs related to the acquisition and integration of LPS by FNF on January 2, 2014. Transition and integration costs were $119 million in the year ended December 31, 2014 compared to $8 million in the 2015 period. The reduction related to transition and integration costs was offset by an increase in interest expense of $19 million related to the addition of third-party debt in the current year.
Earnings from continuing operations before income taxes increased $154 million in the year ended December 31, 2015 compared to the 2014 period. The increase is primarily attributable to the increased revenue and decreased costs discussed above.
FNF Core Corporate and Other
The FNF Core Corporate and Other segment consists of the operations of the parent holding company, certain other unallocated corporate overhead expenses, and other smaller real estate and insurance related operations. Also included in this segment are eliminations of revenues and expenses between our other core segments.
The FNF Core Corporate and Other segment generated revenues of $180 million, $(6) million and $49 million for the years ended December 31, 2015, 2014 and 2013, respectively. The revenue in the 2014 and 2015 periods includes the elimination of revenues between our Black Knight segment and our Title segment offset by revenue at other subsidiaries within the segment. The increase in the year ended December 31, 2015 is primarily driven by revenue of $183 million from Pacific Union, a luxury real estate broker based in California in which we acquired a controlling stake in December 2014. The decrease in the 2014 period from the 2013 period is due to inclusion of an elimination of revenues between our BKFS segment and our Title segment, which we began eliminating upon the acquisition of LPS in 2014.
Other operating expenses in the FNF Core Corporate and Other segment were $172 million, $(12) million and $93 million for the years ended December 31, 2015, 2014 and 2013, respectively. The expense in the 2014 and 2015 periods includes the elimination of expenses between our Black Knight segment and our Title segment offset by expense at other subsidiaries within the segment. The increase in the 2015 period from the 2014 period is primarily due to expenses of $162 million from Pacific Union. The decrease in the 2014 period from the 2013 period is due to a $29 million allocation of transaction costs from the FNF Core Corporate segment to BKFS in 2014 and the 2013 period including a $20 million accrual related to an employment litigation matter and $3 million in transaction costs related to the LPS acquisition.
Interest expense was $72 million, $91 million and $68 million for the years ended December 31, 2015, 2014 and 2013, respectively. The decrease in the 2015 period from the 2014 period is due to the payoff of our FNF term loan offset by interest on additional notes entered into by Black Knight. The increase in the 2014 period from the 2013 period is due to additional borrowings in January 2014 to finance the acquisition of LPS.
53
This segment generated pretax losses of $113 million, $113 million and $152 million for the years ended December 31, 2015, 2014 and 2013, respectively.
FNFV
Restaurant Group
The results of operations for the Restaurant Group for the year ended December 31, 2015 include the results of J. Alexander's through September 29, 2015, the date it was distributed to common shareholders of FNFV. All other periods include the results of operations for J. Alexander's for the full year indicated.
The following table presents the results from operations of our Restaurant Group segment:
Year Ended December 31, | |||||||||||
2015 | 2014 | 2013 | |||||||||
(In millions) | |||||||||||
Revenues: | |||||||||||
Restaurant revenue | $ | 1,412 | $ | 1,436 | $ | 1,408 | |||||
Realized gains and losses, net | (19 | ) | (13 | ) | (1 | ) | |||||
Total revenues | 1,393 | 1,423 | 1,407 | ||||||||
Expenses: | |||||||||||
Personnel costs | 65 | 69 | 65 | ||||||||
Cost of restaurant revenue | 1,195 | 1,220 | 1,204 | ||||||||
Other operating expenses | 71 | 61 | 65 | ||||||||
Depreciation and amortization | 49 | 52 | 53 | ||||||||
Interest expense | 6 | 8 | 8 | ||||||||
Total expenses | 1,386 | 1,410 | 1,395 | ||||||||
Earnings from continuing operations before income taxes | $ | 7 | $ | 13 | $ | 12 | |||||
Total revenues for the Restaurant group segment decreased $30 million, or 2.1% in the year ended December 31, 2015 from the 2014 period primarily due to the inclusion of the results of J. Alexander's through September 29, 2015 compared to the full calendar year 2014. Total revenues for the Restaurant group segment increased $16 million, or 1.1% in the year ended December 31, 2014 from the 2013 period primarily due to increased same store sales at ABRH and J. Alexander's.
Cost of restaurant revenue decreased $25 million or 2.0% in the year ended December 31, 2015 from the 2014 period. Cost of restaurant revenue increased $16 million or 1.3% in the year ended December 31, 2014 from the 2013 period. The change in both periods is consistent with the change in total revenue.
Earnings from continuing operations before income taxes decreased $6 million in the year ended December 31, 2015 from the 2014 period. Earnings from continuing operations before income taxes increased $1 million in the year ended December 31, 2014 from the 2013 period.
FNFV Corporate and Other
The FNFV Core Corporate and Other segment consists of the operations of the parent holding company including Digital Insurance, operations of our unconsolidated investment in Ceridian, certain other unallocated corporate overhead expenses, and other smaller real estate and insurance related operations.
The FNFV Corporate and Other segment generated revenues of $205 million, $111 million, and $90 million for the years ended December 31, 2015, 2014, and 2013, respectively. Revenues increased $94 million in 2015 compared to 2014 primarily due to $85 million of revenue recorded related to the sale of Cascade Timberlands in January 2015 and increased revenue at Digital Insurance resulting from current period acquisitions.
Personnel costs were $92 million, $101 million, and $114 million in the years ended December 31, 2015, 2014, and 2013, respectively. The decrease in the 2015 period of $9 million is primarily due to the inclusion of $19 million of expense related to our Investment Success Incentive Program in the 2014 period, offset by increased costs related to current period acquisitions. The decrease in the 2014 period from the 2013 period is due to the inclusion of an accrual related to our Long Term Incentive Plan, offset by the aforementioned additional expense in 2014.
Other operating expenses for the FNFV Corporate and Other segment were $96 million, $25 million, and $19 million in the years ended December 31, 2015, 2014 and 2013, respectively. The increase of $72 million in the current year is primarily attributable to $73 million in expense recorded related to the sale of Cascade Timberlands.
54
This segment generated pretax losses of $2 million, $27 million, and $52 million for the years ended December 31, 2015, 2014, and 2013, respectively. The increase in the 2015 period is attributable to the aforementioned changes in revenues and other operating expenses.
Liquidity and Capital Resources
Cash Requirements. Our current cash requirements include personnel costs, operating expenses, claim payments, taxes, payments of interest and principal on our debt, capital expenditures, business acquisitions, stock repurchases and dividends on our common stock. We paid dividends of $0.80 per share during 2015, or approximately $220 million. On February 3, 2016, our Board of Directors formally declared a $0.21 per share cash dividend that is payable on March 31, 2016 to FNF Group shareholders of record as of March 17, 2016. There are no restrictions on our retained earnings regarding our ability to pay dividends to shareholders, although there are limits on the ability of certain subsidiaries to pay dividends to us, as described below. The declaration of any future dividends is at the discretion of our Board of Directors. Additional uses of cash flow are expected to include stock repurchases, acquisitions, and debt repayments.
We continually assess our capital allocation strategy, including decisions relating to the amount of our dividend, reducing debt, repurchasing our stock, and/or conserving cash. We believe that all anticipated cash requirements for current operations will be met from internally generated funds, through cash dividends from subsidiaries, cash generated by investment securities, potential sales of non-strategic assets, and borrowings on existing credit facilities. Our short-term and long-term liquidity requirements are monitored regularly to ensure that we can meet our cash requirements. We forecast the needs of all of our subsidiaries and periodically review their short-term and long-term projected sources and uses of funds, as well as the asset, liability, investment and cash flow assumptions underlying such forecasts.
Our insurance subsidiaries generate cash from premiums earned and their respective investment portfolios and these funds are adequate to satisfy the payments of claims and other liabilities. Due to the magnitude of our investment portfolio in relation to our claims loss reserves, we do not specifically match durations of our investments to the cash outflows required to pay claims, but do manage outflows on a shorter time frame.
Our two significant sources of internally generated funds are dividends and other payments from our subsidiaries. As a holding company, we receive cash from our subsidiaries in the form of dividends and as reimbursement for operating and other administrative expenses we incur. The reimbursements are paid within the guidelines of management agreements among us and our subsidiaries. Our insurance subsidiaries are restricted by state regulation in their ability to pay dividends and make distributions. Each state of domicile regulates the extent to which our title underwriters can pay dividends or make distributions. As of December 31, 2015, $2,049 million of our net assets were restricted from dividend payments without prior approval from the relevant departments of insurance. During 2016, our title insurance subsidiaries can pay or make distributions to us of approximately $334 million. Our underwritten title companies and non-title insurance subsidiaries collect revenue and pay operating expenses. However, they are not regulated to the same extent as our insurance subsidiaries.
The maximum dividend permitted by law is not necessarily indicative of an insurer’s actual ability to pay dividends, which may be constrained by business and regulatory considerations, such as the impact of dividends on surplus, which could affect an insurer’s ratings or competitive position, the amount of premiums that can be written and the ability to pay future dividends. Further, depending on business and regulatory conditions, we may in the future need to retain cash in our underwriters or even contribute cash to one or more of them in order to maintain their ratings or their statutory capital position. Such a requirement could be the result of investment losses, reserve charges, adverse operating conditions in the current economic environment or changes in interpretation of statutory accounting requirements by regulators.
On June 30, 2014, we completed the creation of a tracking stock for our portfolio company investments, now known as FNFV. The primary FNFV investments included our equity interests in Remy, ABRH, J. Alexander's, Ceridian, and Digital Insurance. We provided $200 million in financial support to FNFV comprised of $100 million in cash and $100 million in a line of credit, upon formation of the tracking stock. The $100 million in cash and the $100 million line of credit will be used for investment purposes, repurchasing FNFV stock or other general corporate purposes. From time to time, we may also provide additional loans to FNFV to cover corporate expenses and working capital. All additional investments in existing FNFV owned companies and any new FNFV company investments will be funded and managed by FNFV.
Cash flow from FNF's core operations is expected to be used for general corporate purposes including to reinvest in core operations, repay debt, pay dividends, repurchase stock, other strategic initiatives or conserving cash.
We are focused on evaluating our FNFV assets and investments as potential vehicles for creating liquidity. Our intent is to use that liquidity for general corporate purposes, including payment of dividends as declared by the Board of Directors and potentially reducing debt, repurchasing shares of our stock, other strategic initiatives and/or conserving cash.
55
Our cash flows provided by operations for the years ended December 31, 2015, 2014, and 2013 were $917 million, $567 million and $484 million, respectively. The increase in cash provided by operations of $350 million from 2015 to 2014 is primarily due to increased earnings from operations before equity in earnings of unconsolidated affiliates of $497 million and lower claims payments of $17 million, offset by increased payments for income taxes in 2015 compared to 2014 of $175 million. The change in 2015 from 2014 is also driven by $39 million of operating cash flows for Remy included in the 2014 period. The remaining change from the 2014 period to the 2015 period is primarily attributable to timing of receivables and payables. The increase in cash provided by operations of $83 million from 2014 to 2013 is primarily due to increased earnings from operations, lower claims payments of $98 million, and a tax refund of $62 million on LPS acquisition costs. These increases were offset by payments of $54 million in transaction costs and $47 million in severance payments both relating to the acquisition of LPS and bonus payments of $124 million relating to our Long Term Incentive Plan, Investment Success Incentive Program, and synergy plans associated with the LPS acquisition.
Capital Expenditures. Total capital expenditures for property and equipment and capitalized software were $241 million, $210 million and $145 million for the years ended December 31, 2015, 2014, and 2013, respectively. The 2015 period consists of capital expenditures of $92 million in our Title segment, $87 million in our Black Knight segment, $55 million in Restaurant Group segment, and $7 million in other FNFV Group expenditures. The increase in the 2015 period from the 2014 period is primarily due to increased investments in property and equipment in our Title segment and increased expenditures on property and equipment and software at Black Knight. The increase in the 2014 period from the 2013 period is primarily due to increased expenditures on property and equipment and capitalized software at Black Knight and continued remodeling efforts in our Restaurant Group.
Financing. For a description of our financing arrangements see Note J to the Consolidated Financial Statements included in Item 8 of Part II of this Report, which is incorporated by reference into this Part II, Item 7.
Seasonality. Historically, real estate transactions have produced seasonal revenue levels for the real estate industry including title insurers. The first calendar quarter is typically the weakest quarter in terms of revenue due to the generally low volume of home sales during January and February. The third calendar quarter has been typically the strongest in terms of revenue primarily due to a higher volume of home sales in the summer months and the fourth quarter is usually also strong due to commercial entities desiring to complete transactions by year-end. We have noted short term fluctuations through recent years in resale and refinance transactions as a result of changes in interest rates and the implementation and subsequent expiration of government programs designed to stimulate the real estate market. In 2014 and 2013, we saw seasonality trends return to historical patterns. During 2015, we experienced a moderate increase in existing home sales and we have also seen a decline in total housing inventory. However, we have experienced significant declines in refinance activity starting in the fourth quarter of 2013.
In our Restaurant Group, average weekly sales per restaurant are typically higher in the first and fourth quarters, and we typically generate a disproportionate share of our earnings from operations in the first and fourth quarters. Holidays, severe weather and other disruptive conditions may impact sales volumes seasonally in some operating regions.
Contractual Obligations. Our long term contractual obligations generally include our loss reserves, our credit agreements and other debt facilities, operating lease payments on certain of our premises and equipment and purchase obligations of the Restaurant Group.
As of December 31, 2015, our required annual payments relating to these contractual obligations were as follows:
2016 | 2017 | 2018 | 2019 | 2020 | Thereafter | Total | |||||||||||||||||||||
(In millions) | |||||||||||||||||||||||||||
Notes payable | $ | 53 | $ | 372 | $ | 395 | $ | 179 | $ | 704 | $ | 1,118 | $ | 2,821 | |||||||||||||
Operating lease payments | 272 | 176 | 145 | 115 | 83 | 251 | 1,042 | ||||||||||||||||||||
Pension and other benefit payments | 18 | 17 | 16 | 15 | 15 | 106 | 187 | ||||||||||||||||||||
Title claim losses | 260 | 224 | 183 | 147 | 102 | 667 | 1,583 | ||||||||||||||||||||
Unconditional purchase obligations | 182 | 31 | 21 | 14 | 6 | — | 254 | ||||||||||||||||||||
Other | 78 | 64 | 53 | 45 | 45 | 139 | 424 | ||||||||||||||||||||
Total | $ | 863 | $ | 884 | $ | 813 | $ | 515 | $ | 955 | $ | 2,281 | $ | 6,311 | |||||||||||||
56
As of December 31, 2015, we had title insurance reserves of $1,583 million. The amounts and timing of these obligations are estimated and are not set contractually. While we believe that historical loss payments are a reasonable source for projecting future claim payments, there is significant inherent uncertainty in this payment pattern estimate because of the potential impact of changes in:
• | future mortgage interest rates, which will affect the number of real estate and refinancing transactions and, therefore, the rate at which title insurance claims will emerge; |
• | the legal environment whereby court decisions and reinterpretations of title insurance policy language to broaden coverage could increase total obligations and influence claim payout patterns; |
• | events such as fraud, escrow theft, multiple property title defects, foreclosure rates and individual large loss events that can substantially and unexpectedly cause increases in both the amount and timing of estimated title insurance loss payments; and |
• | loss cost trends whereby increases or decreases in inflationary factors (including the value of real estate) will influence the ultimate amount of title insurance loss payments. |
Based on historical title insurance claim experience, we anticipate the above payment patterns. The uncertainty and variation in the timing and amount of claim payments could have a material impact on our cash flows from operations in a particular period.
The Restaurant Group has unconditional purchase obligations with various vendors. These purchase obligations are primarily food and beverage obligations with fixed commitments in regards to the time period of the contract and the quantities purchased with annual price adjustments that can fluctuate. We used both historical and projected volume and pricing as of December 31, 2015 to determine the amount of the obligations.
Black Knight has data processing and maintenance commitments with various vendors. We used current outstanding contracts with the vendors to determine the amount of the obligations.
We sponsor multiple pension plans and other post-retirement benefit plans. See Note O of the Notes to Consolidated Financial Statements included in Item 8 of Part II of this report for further information.
Other contractual obligations include estimated future interest payments on our outstanding fixed rate debt and investment commitments entered into in 2015 for $50 million.
Capital Stock Transactions. On September 16, 2015, J. Alexander's and FNF entered into a Separation and Distribution Agreement, pursuant to which FNF agreed to distribute one hundred percent (100%) of its shares of J. Alexander's common stock, on a pro rata basis, to the holders of FNFV common stock. Holders of FNFV common stock received, as a distribution from FNF, approximately 0.17272 shares of J. Alexander’s common stock for every one share of FNFV common stock held at the close of business on September 22, 2015, the record date for the distribution (the “Distribution”). The Distribution was made on September 28, 2015. As a result of the Distribution, J. Alexander's is now an independent public company and its common stock is listed under the symbol “JAX” on the New York Stock Exchange. The Distribution was generally tax-free to FNFV shareholders for U.S. federal income tax purposes, except to the extent of any cash received in lieu of J. Alexander's fractional shares.
On May 26, 2015, Black Knight closed its initial public offering ("IPO") of 20,700,000 shares of Class A common stock at a price to the public of $24.50 per share, which included 2,700,000 shares of Class A common stock issued upon the exercise in full of the underwriters' option to purchase additional shares. Black Knight received net proceeds of $475 million from the offering, after deduction of underwriter discount and expenses. In connection with the IPO, Black Knight amended and restated its certificate of incorporation to authorize the issuance of two classes of common stock, Class A common stock and Class B common stock, which will generally vote together as a single class on all matters submitted for a vote to stockholders. As a result, Black Knight issued shares of Class B common stock to us, and certain Thomas H. Lee Partners affiliates, as the holders of membership interests in Black Knight Financial Services, LLC ("BKFS, LLC") prior to the IPO. Class B common stock is not publicly traded and does not entitle the holders thereof to any of the economic rights, including rights to dividends and distributions upon liquidation that would be provided to holders of Class A common stock. Prior to the IPO, we owned 67% of the membership interests in BKFS, LLC. Following the IPO, we owned 55% of the outstanding shares of Black Knight in the form of Class B common stock, with a corresponding ownership interest in BKFS, LLC.
On March 20, 2015, we completed our tender offer to purchase shares of FNFV stock. As a result of the offer, we accepted for purchase 12,333,333 shares of FNFV Group Common Stock for a purchase price of $15.00 per common share, for a total aggregate cost of $185 million, excluding fees and expenses related to the tender offer.
On October 28, 2014, our Board of Directors approved a three-year stock purchase program, effective November 6, 2014, under which we can repurchase up to 10 million shares of our FNFV Group common stock through November 30, 2017. We may make repurchases from time to time in the open market, in block purchases or in privately negotiated transactions, depending on market conditions and other factors. In the year ended December 31, 2015, we repurchased a total of 8,187,382 shares for $106 million, or an average of $12.95 per share under this program. Subsequent to year-end we repurchased a total of 1,143,900 shares
57
for $11 million, or an average of $9.71 per share, under this program through market close on February 19, 2016. Since the original commencement of the plan adopted November 6, 2014, we have repurchased a total of 9,447,382 shares for $119 million, or an average of $12.57 per share, and there are 552,618 shares available to be repurchased under this program through market close on February 19, 2016. On February 18, 2016, our Board of Directors approved a new FNFV Group three-year stock repurchase program, effective March 1, 2016, under which we may repurchase up to 15 million shares of FNFV Group common stock. Purchases may be made from time to time by us in the open market at prevailing market prices or in privately negotiated transactions through February 28, 2019.
On June 30, 2014, we completed the recapitalization of Old FNF common stock into two tracking stocks, FNF Group common stock and FNFV Group common stock. We issued 277,462,875 shares of FNF Group common stock and 91,711,237 shares of FNFV Group common stock. See Note A for further discussion on the recapitalization of FNF common stock.
On January 2, 2014, we completed the purchase of LPS. As part of the consideration, $839 million or 25,920,078 shares of Old FNF common stock was issued to LPS shareholders. See Note B of the Notes to Consolidated Financial Statements for further information on the acquisition of LPS.
On July 21, 2012, our Board of Directors approved a three-year stock repurchase program, effective August 1, 2012, under which we can repurchase up to 15 million shares of our common stock through July 31, 2015. On July 20, 2015, our Board of Directors approved a new three-year stock repurchase program under which we can purchase up to 25 million shares through July 30, 2018. We may make repurchases from time to time in the open market, in block purchases or in privately negotiated transactions, depending on market conditions and other factors. In the year ended December 31, 2015, we repurchased a total 5,875,000 FNF Group shares under these programs for $214 million, or an average price of $36.41 per share. Subsequent to year-end we repurchased a total of 500,000 shares for $17 million, or an average of $33.19 per share under this program through market close on February 19, 2016. Since the original commencement of the plan adopted July 21, 2012, we have repurchased a total of 3,380,000 FNF common shares for $98 million, or an average of $28.97 per share, and there are no shares available to be repurchased under this program. Since the original commencement of the plan adopted July 20, 2015, we have repurchased a total of 5,075,000 FNF Group common shares for $182 million, or an average of $35.92 per share, and there are 19,925,000 shares available to be repurchased under this program.
Equity Security and Preferred Stock Investments. Our equity security and preferred stock investments may be subject to significant volatility. Should the fair value of these investments fall below our cost basis and/or the financial condition or prospects of these companies deteriorate, we may determine in a future period that this decline in fair value is other-than-temporary, requiring that an impairment loss be recognized in the period such a determination is made.
Off-Balance Sheet Arrangements. We do not engage in off-balance sheet activities other than facility and equipment leasing arrangements. On June 29, 2004 we entered into an off-balance sheet financing arrangement (commonly referred to as a “synthetic lease”). The owner/lessor in this arrangement acquired land and various real property improvements associated with new construction of an office building in Jacksonville, Florida, at our corporate campus and headquarters. The lessor financed the acquisition of the facilities through funding provided by third-party financial institutions. On June 27, 2011, we renewed and amended the synthetic lease for the facilities. The amended synthetic lease provides for a five year term ending June 27, 2016 and had an outstanding balance as of December 31, 2015 of $71 million. The amended lease includes guarantees by us of up to 83.0% of the outstanding lease balance, and options to purchase the facilities at the outstanding lease balance. The guarantee becomes effective if we decline to purchase the facilities at the end of the lease and also decline to renew the lease. We are currently in the process of exploring our options for purchasing the facilities or renewing the lease, but have not finalized our plans. The lessor is a third-party company and we have no affiliation or relationship with the lessor or any of its employees, directors or affiliates, and transactions with the lessor are limited to the operating lease agreements and the associated rent expense that have been included in other operating expenses in the Consolidated Statements of Earnings. We do not believe the lessor is a variable interest entity, as defined in the FASB standard on consolidation of variable interest entities.
Recent Accounting Pronouncements
For a description of recent accounting pronouncements, see Note S of Notes to Consolidated Financial Statements included in Item 8 of Part II of this report.
Item 7A. | Quantitative and Qualitative Disclosure about Market Risk |
In the normal course of business, we are routinely subject to a variety of risks, as described in Item 1A. Risk Factors of this Annual Report on Form 10-K and in our other filings with the Securities and Exchange Commission. For example, we are exposed to the risk that decreased real estate activity, which depends in part on the level of interest rates, may reduce our Core revenues.
The risks related to our business also include certain market risks that may affect our debt and other financial instruments. At present, we face the market risks associated with our marketable equity securities subject to equity price volatility and with interest rate movements on our outstanding debt and fixed income investments.
58
We regularly assess these market risks and have established policies and business practices designed to protect against the adverse effects of these exposures.
At December 31, 2015, we had $2,793 million in long-term debt, of which $1,403 million bears interest at a floating rate. Our fixed maturity investments, certain preferred stocks and our floating rate debt are subject to an element of market risk from changes in interest rates. Increases and decreases in prevailing interest rates generally translate into decreases and increases in fair values of those instruments. Additionally, fair values of interest rate sensitive instruments may be affected by the creditworthiness of the issuer, prepayment options, relative values of alternative investments, the liquidity of the instrument and other general market conditions. We manage interest rate risk through a variety of measures. We monitor our interest rate risk and make investment decisions to manage the perceived risk. As of December 31, 2015 we did not use derivative financial instruments to hedge these risks.
Equity price risk is the risk that we will incur economic losses due to adverse changes in equity prices. In the past, our exposure to changes in equity prices primarily resulted from our holdings of equity securities. At December 31, 2015, we held $345 million in marketable equity securities (not including our investments in preferred stock of $289 million at December 31, 2015 and our Investments in unconsolidated affiliates, which amounted to $521 million at December 31, 2015). The carrying values of investments subject to equity price risks are based on quoted market prices as of the balance sheet date. Market prices are subject to fluctuation and, consequently, the amount realized in the subsequent sale of an investment may significantly differ from the reported market value. Fluctuation in the market price of a security may result from perceived changes in the underlying economic characteristics of the investee, the relative price of alternative investments and general market conditions. Furthermore, amounts realized in the sale of a particular security may be affected by the relative quantity of the security being sold.
Financial instruments, which potentially subject us to concentrations of credit risk, consist primarily of accounts receivable and cash investments. We require placement of cash in financial institutions evaluated as highly creditworthy.
For purposes of this Annual Report on Form 10-K, we perform a sensitivity analysis to determine the effects that market risk exposures may have on the fair values of our debt and other financial instruments.
The financial instruments that are included in the sensitivity analysis with respect to interest rate risk include fixed maturity investments, preferred stock and notes payable. The financial instruments that are included in the sensitivity analysis with respect to equity price risk include marketable equity securities. With the exception of our equity method investments, it is not anticipated that there would be a significant change in the fair value of other long-term investments or short-term investments if there were a change in market conditions, based on the nature and duration of the financial instruments involved.
To perform the sensitivity analysis, we assess the risk of loss in fair values from the effect of hypothetical changes in interest rates and equity prices on market-sensitive instruments. The changes in fair values for interest rate risks are determined by estimating the present value of future cash flows using various models, primarily duration modeling. The changes in fair values for equity price risk are determined by comparing the market price of investments against their reported values as of the balance sheet date.
Information provided by the sensitivity analysis does not necessarily represent the actual changes in fair value that we would incur under normal market conditions because, due to practical limitations, all variables other than the specific market risk factor are held constant. For example, our reserve for title claim losses (representing 22.6% of total liabilities at December 31, 2015) is not included in the hypothetical effects.
We have no market risk sensitive instruments entered into for trading purposes; therefore, all of our market risk sensitive instruments were entered into for purposes other than trading. The results of the sensitivity analysis at December 31, 2015 and December 31, 2014, are as follows:
Interest Rate Risk
At December 31, 2015, an increase (decrease) in the levels of interest rates of 100 basis points, with all other variables held constant, would result in a (decrease) increase in the fair value of our fixed maturity securities and certain of our investments in preferred stock which are tied to interest rates of $72 million as compared with a (decrease) increase of $82 million at December 31, 2014.
For the years ended December 31, 2015 and 2014, a decrease of 100 basis points in the levels of interest rates, with all other variables held constant, would result in a decrease in the interest expense on our average outstanding floating rate debt of $6 million, as the current LIBOR rate is less than 1%. An increase of 100 basis points in the levels of interest rates, with all other variables held constant, would result in an increase in the interest expense on our average outstanding floating rate debt of $14 million for the year ended December 31, 2015. See Note J of the Notes to Consolidated Financial Statements included in Item 8 of Part II of this report for further details of our notes payable.
59
Equity Price Risk
At December 31, 2015, a 20% increase (decrease) in market prices, with all other variables held constant, would result in an increase (decrease) in the fair value of our equity securities portfolio of $69 million, as compared with an increase (decrease) of $29 million at December 31, 2014.
60
Item 8. Financial Statements and Supplementary Data
FIDELITY NATIONAL FINANCIAL, INC. AND SUBSIDIARIES
INDEX TO FINANCIAL INFORMATION
Page Number | |
61
REPORT OF INDEPENDENT REGISTERED PUBLIC ACCOUNTING FIRM
The Board of Directors and Stockholders
Fidelity National Financial, Inc.:
We have audited Fidelity National Financial, Inc.’s internal control over financial reporting as of December 31, 2015, based on criteria established in Internal Control - Integrated Framework (2013) issued by the Committee of Sponsoring Organizations of the Treadway Commission (COSO). Fidelity National Financial, Inc.’s management is responsible for maintaining effective internal control over financial reporting and for its assessment of the effectiveness of internal control over financial reporting, included in the accompanying Management’s Report on Internal Control over Financial Reporting. Our responsibility is to express an opinion on the Company’s internal control over financial reporting based on our audit.
We conducted our audit in accordance with the standards of the Public Company Accounting Oversight Board (United States). Those standards require that we plan and perform the audit to obtain reasonable assurance about whether effective internal control over financial reporting was maintained in all material respects. Our audit included obtaining an understanding of internal control over financial reporting, assessing the risk that a material weakness exists, and testing and evaluating the design and operating effectiveness of internal control based on the assessed risk. Our audit also included performing such other procedures as we considered necessary in the circumstances. We believe that our audit provides a reasonable basis for our opinion.
A company’s internal control over financial reporting is a process designed to provide reasonable assurance regarding the reliability of financial reporting and the preparation of financial statements for external purposes in accordance with generally accepted accounting principles. A company’s internal control over financial reporting includes those policies and procedures that (1) pertain to the maintenance of records that, in reasonable detail, accurately and fairly reflect the transactions and dispositions of the assets of the company; (2) provide reasonable assurance that transactions are recorded as necessary to permit preparation of financial statements in accordance with generally accepted accounting principles, and that receipts and expenditures of the company are being made only in accordance with authorizations of management and directors of the company; and (3) provide reasonable assurance regarding prevention or timely detection of unauthorized acquisition, use, or disposition of the company’s assets that could have a material effect on the financial statements.
Because of its inherent limitations, internal control over financial reporting may not prevent or detect misstatements. Also, projections of any evaluation of effectiveness to future periods are subject to the risk that controls may become inadequate because of changes in conditions, or that the degree of compliance with the policies or procedures may deteriorate.
In our opinion, Fidelity National Financial, Inc. maintained, in all material respects, effective internal control over financial reporting as of December 31, 2015, based on criteria established in Internal Control - Integrated Framework (2013) issued by the Committee of Sponsoring Organizations of the Treadway Commission (COSO).
We also have audited, in accordance with the standards of the Public Company Accounting Oversight Board (United States), the Consolidated Balance Sheets of Fidelity National Financial, Inc. and subsidiaries as of December 31, 2015 and 2014, and the related Consolidated Statements of Earnings, Comprehensive Earnings, Equity and Cash Flows for each of the years in the three-year period ended December 31, 2015, and our report dated February 23, 2016 expressed an unqualified opinion on those Consolidated Financial Statements.
/s/ KPMG LLP
Jacksonville, Florida
February 23, 2016
Certified Public Accountants
62
REPORT OF INDEPENDENT REGISTERED PUBLIC ACCOUNTING FIRM
The Board of Directors and Stockholders
Fidelity National Financial, Inc.:
We have audited the accompanying Consolidated Balance Sheets of Fidelity National Financial, Inc. and subsidiaries as of December 31, 2015 and 2014, and the related Consolidated Statements of Earnings, Comprehensive Earnings, Equity and Cash Flows for each of the years in the three-year period ended December 31, 2015. These Consolidated Financial Statements are the responsibility of the Company’s management. Our responsibility is to express an opinion on these Consolidated Financial Statements based on our audits.
We conducted our audits in accordance with the standards of the Public Company Accounting Oversight Board (United States). Those standards require that we plan and perform the audit to obtain reasonable assurance about whether the financial statements are free of material misstatement. An audit includes examining, on a test basis, evidence supporting the amounts and disclosures in the financial statements. An audit also includes assessing the accounting principles used and significant estimates made by management, as well as evaluating the overall financial statement presentation. We believe that our audits provide a reasonable basis for our opinion.
In our opinion, the Consolidated Financial Statements referred to above present fairly, in all material respects, the financial position of Fidelity National Financial, Inc. and subsidiaries as of December 31, 2015 and 2014, and the results of their operations and their cash flows for each of the years in the three-year period ended December 31, 2015, in conformity with U.S. generally accepted accounting principles.
We also have audited, in accordance with the standards of the Public Company Accounting Oversight Board (United States), Fidelity National Financial, Inc.’s internal control over financial reporting as of December 31, 2015, based on criteria established in Internal Control — Integrated Framework (2013) issued by the Committee of Sponsoring Organizations of the Treadway Commission (COSO), and our report dated February 23, 2016 expressed an unqualified opinion on the effectiveness of the Company’s internal control over financial reporting.
////s/ KPMG LLP
Jacksonville, Florida
February 23, 2016
Certified Public Accountants
63
FIDELITY NATIONAL FINANCIAL, INC. AND SUBSIDIARIES
CONSOLIDATED BALANCE SHEETS
December 31, | |||||||
2015 | 2014 | ||||||
(In millions, except share data) | |||||||
ASSETS | |||||||
Investments: | |||||||
Fixed maturities available for sale, at fair value, at December 31, 2015 and 2014, includes pledged fixed maturities of $342 and $353, respectively, related to secured trust deposits | $ | 2,558 | $ | 3,025 | |||
Preferred stock available for sale, at fair value | 289 | 223 | |||||
Equity securities available for sale, at fair value | 345 | 145 | |||||
Investments in unconsolidated affiliates | 521 | 770 | |||||
Other long-term investments | 106 | 172 | |||||
Short-term investments, includes pledged short term investments of $266 and $146 at December 31, 2015 and 2014, respectively, related to secured trust deposits | 1,034 | 334 | |||||
Total investments | 4,853 | 4,669 | |||||
Cash and cash equivalents, at December 31, 2015 and 2014, includes pledged cash of $108 and $136, respectively, related to secured trust deposits | 780 | 700 | |||||
Trade and notes receivables, net of allowance of $32 at December 31, 2015 and 2014 | 496 | 504 | |||||
Goodwill | 4,760 | 4,721 | |||||
Prepaid expenses and other assets | 615 | 484 | |||||
Capitalized software, net | 553 | 570 | |||||
Other intangible assets, net | 969 | 1,110 | |||||
Title plants | 395 | 393 | |||||
Property and equipment, net | 510 | 635 | |||||
Income taxes receivable | — | 59 | |||||
Total assets | $ | 13,931 | $ | 13,845 | |||
LIABILITIES AND EQUITY | |||||||
Liabilities: | |||||||
Accounts payable and other accrued liabilities | $ | 1,283 | $ | 1,308 | |||
Income taxes payable | 45 | — | |||||
Notes payable | 2,793 | 2,803 | |||||
Reserve for title claim losses | 1,583 | 1,621 | |||||
Secured trust deposits | 701 | 622 | |||||
Deferred tax liability | 594 | 703 | |||||
Total liabilities | 6,999 | 7,057 | |||||
Commitments and Contingencies: | |||||||
Redeemable non-controlling interest by 21% minority holder of ServiceLink Holdings, LLC as of December 31, 2015 and 33% minority holder of Black Knight Financial Services, LLC and 35% minority holder of ServiceLink Holdings, LLC as of December 31, 2014 | 344 | 715 | |||||
Equity: | |||||||
FNF Group common stock, $0.0001 par value; authorized 487,000,000 shares as of December 31, 2015 and 2014; outstanding of 275,781,160 and 279,443,239 as of December 31, 2015 and 2014, respectively; and issued of 282,394,970 and 279,824,125 as of December 31, 2015 and 2014, respectively | — | — | |||||
FNFV Group common stock, $0.0001 par value; authorized 113,000,000 shares as of December 31, 2015 and 2014; outstanding of 72,217,882 and 92,828,470 as of December 31, 2015 and 2014, respectively; and issued of 80,581,466 and 92,946,545 as of December 31, 2015 and 2014, respectively | — | — | |||||
Preferred stock, $0.0001 par value; authorized, 50,000,000 shares; issued and outstanding, none | — | — | |||||
Additional paid-in capital | 4,795 | 4,855 | |||||
Retained earnings | 1,374 | 1,150 | |||||
Accumulated other comprehensive (loss) earnings | (69 | ) | 2 | ||||
Less: Treasury stock, 14,977,394 shares and 493,737 shares as of December 31, 2015 and 2014, respectively, at cost | (346 | ) | (13 | ) | |||
Total Fidelity National Financial, Inc. shareholders’ equity | 5,754 | 5,994 | |||||
Noncontrolling interests | 834 | 79 | |||||
Total equity | 6,588 | 6,073 | |||||
Total liabilities, redeemable non-controlling interest and equity | $ | 13,931 | $ | 13,845 | |||
See Notes to Consolidated Financial Statements.
64
FIDELITY NATIONAL FINANCIAL, INC. AND SUBSIDIARIES
CONSOLIDATED STATEMENTS OF EARNINGS
Year Ended December 31, | |||||||||||
2015 | 2014 | 2013 | |||||||||
(In millions, except share data) | |||||||||||
Revenues: | |||||||||||
Direct title insurance premiums | $ | 2,009 | $ | 1,727 | $ | 1,800 | |||||
Agency title insurance premiums | 2,277 | 1,944 | 2,352 | ||||||||
Escrow, title-related and other fees | 3,324 | 2,804 | 1,737 | ||||||||
Restaurant revenue | 1,412 | 1,436 | 1,408 | ||||||||
Interest and investment income | 123 | 126 | 127 | ||||||||
Realized gains and losses, net | (13 | ) | (13 | ) | 16 | ||||||
Total revenues | 9,132 | 8,024 | 7,440 | ||||||||
Expenses: | |||||||||||
Personnel costs | 2,671 | 2,540 | 2,061 | ||||||||
Agent commissions | 1,731 | 1,471 | 1,789 | ||||||||
Other operating expenses | 1,881 | 1,643 | 1,273 | ||||||||
Cost of restaurant revenue | 1,195 | 1,220 | 1,204 | ||||||||
Depreciation and amortization | 410 | 403 | 133 | ||||||||
Provision for title claim losses | 246 | 228 | 291 | ||||||||
Interest expense | 131 | 127 | 73 | ||||||||
Total expenses | 8,265 | 7,632 | 6,824 | ||||||||
Earnings from continuing operations before income taxes and equity in (loss) earnings of unconsolidated affiliates | 867 | 392 | 616 | ||||||||
Income tax expense on continuing operations | 290 | 312 | 195 | ||||||||
Earnings from continuing operations before equity in (loss) earnings of unconsolidated affiliates | 577 | 80 | 421 | ||||||||
Equity in (loss) earnings of unconsolidated affiliates | (16 | ) | 432 | (26 | ) | ||||||
Net earnings from continuing operations | 561 | 512 | 395 | ||||||||
Earnings from discontinued operations, net of tax | — | 7 | 16 | ||||||||
Net earnings | 561 | 519 | 411 | ||||||||
Less: Net earnings (loss) attributable to non-controlling interests | 34 | (64 | ) | 17 | |||||||
Net earnings attributable to Fidelity National Financial, Inc. common shareholders | $ | 527 | $ | 583 | $ | 394 | |||||
Amounts attributable to Fidelity National Financial, Inc., common shareholders: | |||||||||||
Net earnings from continuing operations, attributable to Old FNF common shareholders | $ | 83 | $ | 388 | |||||||
Net earnings from discontinued operations, attributable to Old FNF common shareholders | 6 | 6 | |||||||||
Net earnings attributable to Old FNF common shareholders | $ | 89 | $ | 394 | |||||||
Net earnings attributable to FNF Group common shareholders | $ | 540 | $ | 214 | |||||||
Net (loss) earnings from continuing operations, attributable to FNFV Group common shareholders | $ | (13 | ) | $ | 283 | ||||||
Net loss from discontinued operations, attributable to FNFV Group common shareholders | — | (3 | ) | ||||||||
Net (loss) earnings attributable to FNFV Group common shareholders | $ | (13 | ) | $ | 280 | ||||||
See Notes to Consolidated Financial Statements.
65
FIDELITY NATIONAL FINANCIAL, INC. AND SUBSIDIARIES
CONSOLIDATED STATEMENTS OF EARNINGS - (continued)
Year Ended December 31, | |||||||||||
2015 | 2014 | 2013 | |||||||||
Earnings per share | |||||||||||
Basic | |||||||||||
Net earnings per share from continuing operations attributable to Old FNF common shareholders | $ | 0.31 | $ | 1.67 | |||||||
Net earnings per share from discontinued operations attributable to Old FNF common shareholders | 0.02 | 0.04 | |||||||||
Net earnings per share attributable to Old FNF common shareholders | $ | 0.33 | $ | 1.71 | |||||||
Net earnings per share attributable to FNF Group common shareholders | $ | 1.95 | $ | 0.77 | $ | — | |||||
Net (loss) earnings from continuing operations attributable to FNFV Group common shareholders | $ | (0.16 | ) | $ | 3.08 | ||||||
Net earnings (loss) from discontinued operations attributable to FNFV Group common shareholders | — | (0.04 | ) | ||||||||
Net (loss) earnings per share attributable to FNFV Group common shareholders | $ | (0.16 | ) | $ | 3.04 | ||||||
Diluted | |||||||||||
Net earnings per share from continuing operations attributable to Old FNF common shareholders | $ | 0.30 | $ | 1.64 | |||||||
Net loss per share from discontinued operations attributable to Old FNF common shareholders | 0.02 | 0.04 | |||||||||
Net earnings per share attributable to Old FNF common shareholders | $ | 0.32 | $ | 1.68 | |||||||
Net earnings per share attributable to FNF Group common shareholders | $ | 1.89 | $ | 0.75 | $ | — | |||||
Net (loss) earnings from continuing operations attributable to FNFV Group common shareholders | (0.16 | ) | 3.05 | ||||||||
Net loss from discontinued operations attributable to FNFV Group common shareholders | — | (0.04 | ) | ||||||||
Net (loss) earnings per share attributable to FNFV Group common shareholders | $ | (0.16 | ) | $ | 3.01 | ||||||
Weighted average shares outstanding Old FNF common stock, basic basis | 138 | 230 | |||||||||
Weighted average shares outstanding Old FNF common stock, diluted basis | 142 | 235 | |||||||||
Cash dividends paid per share Old FNF common stock | $ | 0.36 | $ | 0.66 | |||||||
Weighted average shares outstanding FNF Group common stock, basic basis | 277 | 138 | |||||||||
Weighted average shares outstanding FNF Group common stock, diluted basis | 286 | 142 | |||||||||
Cash dividends paid per share FNF Group common stock | $ | 0.80 | $ | 0.37 | |||||||
Weighted average shares outstanding FNFV Group common stock, basic basis | 79 | 46 | |||||||||
Weighted average shares outstanding FNFV Group common stock, diluted basis | 82 | 47 | |||||||||
See Notes to Consolidated Financial Statements.
66
FIDELITY NATIONAL FINANCIAL, INC. AND SUBSIDIARIES
CONSOLIDATED STATEMENTS OF COMPREHENSIVE EARNINGS
Year Ended December 31, | |||||||||||
2015 | 2014 | 2013 | |||||||||
(In millions) | |||||||||||
Net earnings | $ | 561 | $ | 519 | $ | 411 | |||||
Other comprehensive (loss) earnings (net of tax): | |||||||||||
Unrealized loss on investments and other financial instruments, net (excluding investments in unconsolidated affiliates) | (38 | ) | (1 | ) | (33 | ) | |||||
Unrealized loss relating to investments in unconsolidated affiliates | (27 | ) | (10 | ) | (15 | ) | |||||
Unrealized loss on foreign currency translation and cash flow hedging | (8 | ) | (17 | ) | (2 | ) | |||||
Reclassification adjustments for change in unrealized gains and losses included in net earnings | — | — | 4 | ||||||||
Minimum pension liability adjustment | 2 | (12 | ) | 24 | |||||||
Other comprehensive loss | (71 | ) | (40 | ) | (22 | ) | |||||
Comprehensive earnings | 490 | 479 | 389 | ||||||||
Less: Comprehensive earnings (loss) attributable to noncontrolling interests | 34 | (64 | ) | 17 | |||||||
Comprehensive earnings attributable to Fidelity National Financial Inc. common shareholders | $ | 456 | $ | 543 | $ | 372 | |||||
Comprehensive earnings attributable to Old FNF common shareholders | $ | 111 | $ | 372 | |||||||
Comprehensive earnings attributable to FNF Group common shareholders | $ | 494 | $ | 184 | |||||||
Comprehensive (loss) earnings attributable to FNFV Group common shareholders | $ | (38 | ) | $ | 241 | ||||||
See Notes to Consolidated Financial Statements.
67
FIDELITY NATIONAL FINANCIAL, INC. AND SUBSIDIARIES
CONSOLIDATED STATEMENTS OF EQUITY
Fidelity National Financial, Inc. Common Shareholders | |||||||||||||||||||||||||||||||||||||||||||||||||||
FNF Class A Common Stock | FNF Group Common Stock | FNFV Group Common Stock | Additional Paid-In Capital | Retained Earnings | Accumulated Other Comprehensive Earnings (Loss) | Treasury Stock | Non-controlling Interests | Total Equity | Redeemable Non-controlling Interests | ||||||||||||||||||||||||||||||||||||||||||
Shares | $ | Shares | $ | Shares | $ | Shares | $ | ||||||||||||||||||||||||||||||||||||||||||||
(In millions) | |||||||||||||||||||||||||||||||||||||||||||||||||||
Balance, December 31, 2012 | 268 | $ | — | — | $ | — | — | $ | — | $ | 4,018 | $ | 849 | $ | 59 | 40 | $ | (658 | ) | $ | 481 | $ | 4,749 | $ | — | ||||||||||||||||||||||||||
Equity offering | 20 | — | — | — | — | — | 511 | — | — | — | — | — | 511 | — | |||||||||||||||||||||||||||||||||||||
Exercise of stock options | 3 | — | — | — | — | — | 61 | — | — | — | — | — | 61 | — | |||||||||||||||||||||||||||||||||||||
Treasury stock repurchased | — | — | — | — | — | — | — | — | — | 1 | (34 | ) | — | (34 | ) | — | |||||||||||||||||||||||||||||||||||
Tax benefit associated with the exercise of stock-based compensation | — | — | — | — | — | — | 17 | — | — | — | — | — | 17 | — | |||||||||||||||||||||||||||||||||||||
Issuance of restricted stock | 1 | — | — | — | — | — | — | — | — | — | — | — | — | — | |||||||||||||||||||||||||||||||||||||
Other comprehensive earnings — unrealized (loss) on investments and other financial instruments | — | — | — | — | — | — | — | — | (29 | ) | — | — | — | (29 | ) | — | |||||||||||||||||||||||||||||||||||
Other comprehensive earnings — unrealized (loss) on investments in unconsolidated affiliates | — | — | — | — | — | — | — | — | (15 | ) | — | — | — | (15 | ) | — | |||||||||||||||||||||||||||||||||||
Other comprehensive earnings — unrealized (loss) on foreign currency | — | — | — | — | — | — | — | — | (2 | ) | — | — | 2 | — | — | ||||||||||||||||||||||||||||||||||||
Other comprehensive earnings — minimum pension liability adjustment | — | — | — | — | — | — | — | — | 24 | — | — | 2 | 26 | — | |||||||||||||||||||||||||||||||||||||
Stock-based compensation | — | — | — | — | — | — | 30 | — | — | — | — | 5 | 35 | — | |||||||||||||||||||||||||||||||||||||
Shares withheld for taxes and in treasury | — | — | — | — | — | — | — | — | — | 1 | (15 | ) | — | (15 | ) | — | |||||||||||||||||||||||||||||||||||
Contributions to noncontrolling interests | — | — | — | — | — | — | (4 | ) | — | — | — | — | 7 | 3 | — | ||||||||||||||||||||||||||||||||||||
Consolidation of previous minority-owned subsidiary | — | — | — | — | — | — | 9 | — | — | — | — | (23 | ) | (14 | ) | — | |||||||||||||||||||||||||||||||||||
Dividends declared | — | — | — | — | — | — | — | (154 | ) | — | — | — | — | (154 | ) | — | |||||||||||||||||||||||||||||||||||
Subsidiary dividends paid to noncontrolling interests | — | — | — | — | — | — | — | — | — | — | — | (17 | ) | (17 | ) | — | |||||||||||||||||||||||||||||||||||
Net earnings | — | — | — | — | — | — | — | 394 | — | — | — | 17 | 411 | — | |||||||||||||||||||||||||||||||||||||
Balance, December 31, 2013 | 292 | $ | — | — | $ | — | — | $ | — | $ | 4,642 | $ | 1,089 | $ | 37 | 42 | $ | (707 | ) | $ | 474 | $ | 5,535 | $ | — | ||||||||||||||||||||||||||
Acquisition of LPS | 26 | — | — | — | — | — | 839 | — | — | — | — | — | 839 | — | |||||||||||||||||||||||||||||||||||||
Exercise of stock options | 1 | — | 1 | — | — | — | 40 | — | — | — | — | — | 40 | — | |||||||||||||||||||||||||||||||||||||
Recapitalization of FNF stock | (277 | ) | — | 277 | — | 92 | — | (6 | ) | — | — | — | — | — | (6 | ) | — | ||||||||||||||||||||||||||||||||||
Tax benefit associated with the exercise of stock-based compensation | — | — | — | — | — | — | 16 | — | — | — | — | — | 16 | — | |||||||||||||||||||||||||||||||||||||
Issuance of restricted stock | — | — | 1 | — | 1 | — | — | — | — | — | — | — | — | — | |||||||||||||||||||||||||||||||||||||
Other comprehensive earnings — unrealized (loss) on investments and other financial instruments | — | — | — | — | — | — | — | — | (1 | ) | — | — | — | (1 | ) | — | |||||||||||||||||||||||||||||||||||
Other comprehensive earnings — unrealized (loss) on investments in unconsolidated affiliates | — | — | — | — | — | — | — | — | (10 | ) | — | — | — | (10 | ) | — | |||||||||||||||||||||||||||||||||||
Other comprehensive earnings — unrealized (loss) on foreign currency and cash flow hedging | — | — | — | — | — | — | — | — | (17 | ) | — | — | (8 | ) | (25 | ) | — | ||||||||||||||||||||||||||||||||||
Other comprehensive earnings — minimum pension liability adjustment | — | — | — | — | — | — | — | — | (12 | ) | — | — | (6 | ) | (18 | ) | — | ||||||||||||||||||||||||||||||||||
Stock-based compensation | — | — | — | — | — | — | 32 | — | — | — | — | (9 | ) | 23 | 28 | ||||||||||||||||||||||||||||||||||||
Shares withheld for taxes and in treasury | — | — | — | — | — | — | — | — | — | — | (11 | ) | — | (11 | ) | — | |||||||||||||||||||||||||||||||||||
Purchases of treasury stock | — | — | — | — | — | — | — | — | — | — | (2 | ) | — | (2 | ) | — | |||||||||||||||||||||||||||||||||||
Contributions to noncontrolling interests | — | — | — | — | — | — | (1 | ) | — | — | — | — | 22 | 21 | — | ||||||||||||||||||||||||||||||||||||
Contribution by minority owner to acquire minority interest in Black Knight Financial Services, LLC and ServiceLink Holdings, LLC | — | — | — | — | — | — | — | — | — | — | — | (1 | ) | (1 | ) | 687 | |||||||||||||||||||||||||||||||||||
Retirement of treasury shares | (42 | ) | — | — | — | — | (707 | ) | — | — | (42 | ) | 707 | — | — | — | |||||||||||||||||||||||||||||||||||
Distribution of Remy to FNFV Group Shareholders | — | — | — | — | — | — | — | (319 | ) | 5 | — | — | (279 | ) | (593 | ) | — | ||||||||||||||||||||||||||||||||||
Dividends declared | — | — | — | — | — | — | — | (203 | ) | — | — | — | — | (203 | ) | — | |||||||||||||||||||||||||||||||||||
Subsidiary dividends paid to noncontrolling interests | — | — | — | — | — | — | — | — | — | — | — | (50 | ) | (50 | ) | — | |||||||||||||||||||||||||||||||||||
Net earnings | — | — | — | — | — | — | — | 583 | — | — | — | (64 | ) | 519 | — | ||||||||||||||||||||||||||||||||||||
Balance, December 31, 2014 | — | — | 279 | $ | — | 93 | $ | — | $ | 4,855 | $ | 1,150 | $ | 2 | — | $ | (13 | ) | $ | 79 | $ | 6,073 | $ | 715 | |||||||||||||||||||||||||||
See Notes to Consolidated Financial Statements. | |||||||||||||||||||||||||||||||||||||||||||||||||||
68
FIDELITY NATIONAL FINANCIAL, INC. AND SUBSIDIARIES
CONSOLIDATED STATEMENTS OF EQUITY - Continued
Fidelity National Financial, Inc. Common Shareholders | ||||||||||||||||||||||||||||||||||||||||||||
FNF Group Common Stock | FNFV Group Common Stock | Additional Paid-In Capital | Retained Earnings | Accumulated Other Comprehensive Earnings (Loss) | Treasury Stock | Non-controlling Interests | Total Equity | Redeemable Non-controlling Interests | ||||||||||||||||||||||||||||||||||||
Shares | $ | Shares | $ | Shares | $ | |||||||||||||||||||||||||||||||||||||||
(In millions) | ||||||||||||||||||||||||||||||||||||||||||||
Balance, December 31, 2014 | 279 | $ | — | 93 | $ | — | $ | 4,855 | $ | 1,150 | $ | 2 | — | $ | (13 | ) | $ | 79 | $ | 6,073 | $ | 715 | ||||||||||||||||||||||
Gain on Black Knight IPO | — | — | — | — | 53 | — | — | — | — | (96 | ) | (43 | ) | — | ||||||||||||||||||||||||||||||
Proceeds Black Knight IPO | — | — | — | — | — | — | — | — | — | 475 | 475 | — | ||||||||||||||||||||||||||||||||
Exercise of stock options | 2 | — | — | — | 26 | — | — | — | — | — | 26 | — | ||||||||||||||||||||||||||||||||
Purchase of additional share in consolidated subsidiaries | — | — | — | — | (6 | ) | — | — | — | — | — | (6 | ) | — | ||||||||||||||||||||||||||||||
Tax benefit associated with the exercise of stock-based compensation | — | — | — | — | 21 | — | — | — | — | — | 21 | — | ||||||||||||||||||||||||||||||||
Issuance of restricted stock | 1 | — | — | — | — | — | — | — | — | — | — | — | ||||||||||||||||||||||||||||||||
Equity offering costs | — | — | — | — | (1 | ) | — | — | — | — | — | (1 | ) | — | ||||||||||||||||||||||||||||||
Other comprehensive earnings — unrealized (loss) on investments and other financial instruments | — | — | — | — | — | — | (38 | ) | — | — | — | (38 | ) | — | ||||||||||||||||||||||||||||||
Other comprehensive earnings — unrealized (loss) on investments in unconsolidated affiliates | — | — | — | — | — | — | (27 | ) | — | — | — | (27 | ) | — | ||||||||||||||||||||||||||||||
Other comprehensive earnings — unrealized (loss) on foreign currency and cash flow hedging | — | — | — | — | — | — | (8 | ) | — | — | — | (8 | ) | — | ||||||||||||||||||||||||||||||
Other comprehensive earnings — minimum pension liability adjustment | — | — | — | — | — | — | 2 | — | — | — | 2 | — | ||||||||||||||||||||||||||||||||
Stock-based compensation | — | — | — | — | 38 | — | — | — | — | (41 | ) | (3 | ) | 59 | ||||||||||||||||||||||||||||||
Shares withheld for taxes and in treasury | — | — | — | — | — | — | — | — | (14 | ) | — | (14 | ) | — | ||||||||||||||||||||||||||||||
Purchases of treasury stock | — | — | — | — | — | — | — | 27 | (505 | ) | — | (505 | ) | — | ||||||||||||||||||||||||||||||
Contributions to noncontrolling interests | — | — | — | — | — | — | — | — | — | (1 | ) | (1 | ) | — | ||||||||||||||||||||||||||||||
Sale of noncontrolling interest | — | — | — | — | — | — | — | — | — | (27 | ) | (27 | ) | — | ||||||||||||||||||||||||||||||
Reclassification of redeemable NCI resulting from IPO/share conversion | — | — | — | — | — | — | — | — | — | 430 | 430 | (430 | ) | |||||||||||||||||||||||||||||||
Retirement of treasury shares | — | — | (12 | ) | — | (186 | ) | — | — | (12 | ) | 186 | — | — | — | |||||||||||||||||||||||||||||
Distribution of J. Alexander's to FNFV Shareholders | — | — | — | — | — | (81 | ) | — | — | — | (13 | ) | (94 | ) | — | |||||||||||||||||||||||||||||
Dilution of ownership in affiliates | — | — | — | — | (5 | ) | — | — | — | — | — | (5 | ) | — | ||||||||||||||||||||||||||||||
Dividends declared | — | — | — | — | — | (222 | ) | — | — | — | — | (222 | ) | — | ||||||||||||||||||||||||||||||
Subsidiary dividends paid to noncontrolling interests | — | — | — | — | — | — | — | — | — | (6 | ) | (6 | ) | — | ||||||||||||||||||||||||||||||
Net earnings | — | — | — | — | — | 527 | — | — | — | 34 | 561 | — | ||||||||||||||||||||||||||||||||
Balance, December 31, 2015 | 282 | $ | — | 81 | $ | — | $ | 4,795 | $ | 1,374 | $ | (69 | ) | 15 | $ | (346 | ) | $ | 834 | $ | 6,588 | $ | 344 | |||||||||||||||||||||
See Notes to Consolidated Financial Statements. | ||||||||||||||||||||||||||||||||||||||||||||
69
FIDELITY NATIONAL FINANCIAL, INC. AND SUBSIDIARIES
CONSOLIDATED STATEMENTS OF CASH FLOWS
Year Ended December 31, | |||||||||||
2015 | 2014 | 2013 | |||||||||
(In millions) | |||||||||||
Cash Flows From Operating Activities: | |||||||||||
Net earnings | $ | 561 | $ | 519 | $ | 411 | |||||
Adjustments to reconcile net earnings to net cash provided by operating activities: | |||||||||||
Depreciation and amortization | 410 | 476 | 209 | ||||||||
Equity in losses (earnings) of unconsolidated affiliates | 16 | (432 | ) | 26 | |||||||
Net loss (gain) on sales of investments and other assets, net | 13 | 13 | (12 | ) | |||||||
Gain on sale of Cascade Timberlands | (12 | ) | — | — | |||||||
Stock-based compensation cost | 56 | 51 | 35 | ||||||||
Tax benefit associated with the exercise of stock-based compensation | (21 | ) | (16 | ) | (17 | ) | |||||
Changes in assets and liabilities, net of effects from acquisitions: | |||||||||||
Net (increase) decrease in pledged cash, pledged investments and secured trust deposits | (2 | ) | — | 2 | |||||||
Net (increase) decrease in trade receivables | 7 | (22 | ) | — | |||||||
Net increase in prepaid expenses and other assets | (95 | ) | (23 | ) | (3 | ) | |||||
Net (decrease) increase in accounts payable, accrued liabilities, deferred revenue and other | (15 | ) | (130 | ) | 7 | ||||||
Net decrease in reserve for title claim losses | (38 | ) | (67 | ) | (112 | ) | |||||
Net change in income taxes | 37 | 198 | (62 | ) | |||||||
Net cash provided by operating activities | 917 | 567 | 484 | ||||||||
Cash Flows From Investing Activities: | |||||||||||
Proceeds from sales of investment securities available for sale | 775 | 778 | 745 | ||||||||
Proceeds from calls and maturities of investment securities available for sale | 383 | 458 | 306 | ||||||||
Proceeds from sales of other assets | 2 | 5 | 1 | ||||||||
Additions to property and equipment and capitalized software | (241 | ) | (210 | ) | (145 | ) | |||||
Purchases of investment securities available for sale | (1,102 | ) | (1,196 | ) | (882 | ) | |||||
Purchases of other long-term investments | (27 | ) | (71 | ) | (97 | ) | |||||
Net (purchases of) proceeds from short-term investment activities | (565 | ) | (161 | ) | 36 | ||||||
Contributions to investments in unconsolidated affiliates | (97 | ) | — | (20 | ) | ||||||
Distributions from unconsolidated affiliates | 353 | 49 | 25 | ||||||||
Net other investing activities | 3 | (10 | ) | (4 | ) | ||||||
Acquisition of Lender Processing Services, Inc., net of cash acquired | — | (2,253 | ) | — | |||||||
Acquisition of USA Industries, Inc., net of cash acquired | — | (40 | ) | — | |||||||
Acquisition of BPG Holdings, LLC, net of cash acquired | (43 | ) | — | — | |||||||
Proceeds from sale of Cascade Timberlands | 56 | — | — | ||||||||
Other acquisitions/disposals of businesses, net of cash acquired | (68 | ) | (69 | ) | (25 | ) | |||||
Net cash used in investing activities | (571 | ) | (2,720 | ) | (60 | ) | |||||
Cash Flows From Financing Activities: | |||||||||||
Equity offering | — | — | 511 | ||||||||
Borrowings | 1,360 | 1,764 | 341 | ||||||||
Debt service payments | (1,359 | ) | (1,073 | ) | (359 | ) | |||||
Additional investment in non-controlling interest | — | (1 | ) | (14 | ) | ||||||
Additional investment in consolidated subsidiary | (6 | ) | — | — | |||||||
Proceeds from sale of 4% ownership interest of Digital Insurance | — | — | 3 | ||||||||
Proceeds from Black Knight IPO | 475 | — | — | ||||||||
Distributions by Black Knight to member | (17 | ) | |||||||||
Debt and equity issuance costs | (1 | ) | (5 | ) | (16 | ) | |||||
Proceeds from sale of 35% of Black Knight Financial Services, LLC and ServiceLink, LLC to minority interest holder | — | 687 | — | ||||||||
Cash transferred in Remy spin-off | — | (86 | ) | — | |||||||
Cash transferred in J. Alexander's spin-off | (13 | ) | — | — | |||||||
Dividends paid | (220 | ) | (203 | ) | (153 | ) | |||||
Subsidiary dividends paid to noncontrolling interest shareholders | (6 | ) | (50 | ) | (17 | ) | |||||
Exercise of stock options | 26 | 40 | 61 | ||||||||
Tax benefit associated with the exercise of stock-based compensation | 21 | 16 | 17 | ||||||||
Purchases of treasury stock | (498 | ) | (2 | ) | (34 | ) | |||||
Net cash (used in) provided by financing activities | (238 | ) | 1,087 | 340 | |||||||
Net increase (decrease) in cash and cash equivalents, excluding pledged cash related to secured trust deposits | 108 | (1,066 | ) | 764 | |||||||
Cash and cash equivalents, excluding pledged cash related to secured trust deposits, at beginning of year | 564 | 1,630 | 866 | ||||||||
Cash and cash equivalents, excluding pledged cash related to secured trust deposits, at end of year | $ | 672 | $ | 564 | $ | 1,630 | |||||
See Notes to Consolidated Financial Statements.
70
FIDELITY NATIONAL FINANCIAL, INC. AND SUBSIDIARIES
NOTES TO CONSOLIDATED FINANCIAL STATEMENTS
Note A. | Summary of Significant Accounting Policies |
The following describes the significant accounting policies of Fidelity National Financial, Inc. and its subsidiaries (collectively, “we,” “us,” “our,” or “FNF”) which have been followed in preparing the accompanying Consolidated Financial Statements.
Description of Business
Overview
We have organized our business into two groups, FNF Core Operations and FNF Ventures ("FNFV").
Through our Core Operations, FNF is a leading provider of (i) title insurance, escrow and other title related services, including collection and trust activities, trustee sales guarantees, recordings and reconveyances and home warranty insurance and (ii) technology and transaction services to the real estate and mortgage industries. FNF is the nation’s largest title insurance company operating through its title insurance underwriters - Fidelity National Title Insurance Company, Chicago Title Insurance Company, Commonwealth Land Title Insurance Company, Alamo Title Insurance and National Title Insurance of New York Inc. - that collectively issue more title insurance policies than any other title company in the United States. Through our subsidiary ServiceLink Holdings, LLC ("ServiceLink"), we provide mortgage transaction services including title-related services and facilitation of production and management of mortgage loans. FNF also provides industry-leading mortgage technology solutions, including MSP®, the leading residential mortgage servicing technology platform in the U.S., through its majority-owned subsidiary, Black Knight Financial Services, Inc. ("Black Knight").
Through our FNFV group, we own majority and minority equity investment stakes in a number of entities, including American Blue Ribbon Holdings, LLC ("ABRH"), Ceridian HCM, Inc. and Fleetcor Technologies, Inc. (collectively "Ceridian") and Digital Insurance, Inc. ("Digital Insurance").
As of December 31, 2015, we had the following reporting segments:
FNF Core Operations
• | Title. This segment consists of the operations of our title insurance underwriters and related businesses. This segment provides core title insurance and escrow and other title related services including collection and trust activities, trustee sales guarantees, recordings and reconveyances, and home warranty insurance. This segment also includes the transaction services business acquired from Lender Processing Services, Inc. ("LPS"), now combined with our ServiceLink business. Transaction services include other title-related services used in the production and management of mortgage loans, including mortgage loans that experience default. |
• | Black Knight. This segment consists of the operations of Black Knight, which, through leading software systems and information solutions, provides mission critical technology and data and analytics services that facilitate and automate many of the business processes across the life cycle of a mortgage. |
• | FNF Core Corporate and Other. This segment consists of the operations of the parent holding company, certain other unallocated corporate overhead expenses, and other smaller real estate and insurance-related operations. |
FNFV
• | Restaurant Group. This segment consists of the operations of ABRH, in which we have a 55% ownership interest. ABRH and its affiliates are the owners and operators of the O'Charley's, Ninety Nine Restaurants, Max & Erma's, Village Inn, Bakers Square, and Legendary Baking concepts. This segment also includes the results of J. Alexander's, Inc. ("J. Alexander's") through September 28, 2015, the date it was distributed to FNFV shareholders. See the Recent Developments section below for further discussion of the distribution of J. Alexander's. On January 25, 2016, substantially all of the assets of the Max & Erma's restaurant concept were sold pursuant to an Asset Purchase Agreement. |
• | FNFV Corporate and Other. This segment primarily consists of our share in the operations of certain equity investments, including Ceridian, as well as consolidated investments, including Digital Insurance in which we own 96%, and other smaller operations which are not title related. |
Principles of Consolidation and Basis of Presentation
The accompanying Consolidated Financial Statements are prepared in accordance with generally accepted accounting principles in the United States ("GAAP") and include our accounts as well as our wholly-owned and majority-owned subsidiaries. All intercompany profits, transactions and balances have been eliminated. Our investments in non-majority-owned partnerships
71
FIDELITY NATIONAL FINANCIAL, INC. AND SUBSIDIARIES
NOTES TO CONSOLIDATED FINANCIAL STATEMENTS — (continued)
and affiliates are accounted for using the equity method until such time that they become wholly or majority-owned. Earnings attributable to noncontrolling interests are recorded on the Consolidated Statements of Earnings relating to majority-owned subsidiaries with the appropriate noncontrolling interest that represents the portion of equity not related to our ownership interest recorded on the Consolidated Balance Sheets in each period.
Recent Developments
In addition to the below Recent Developments, we have made several acquisitions which are discussed in more detail in Note B.
On February 18, 2016, our Board of Directors approved a new FNFV Group three-year stock repurchase program, effective March 1, 2016, under which we may repurchase up to 15 million shares of FNFV Group common stock. Purchases may be made from time to time by us in the open market at prevailing market prices or in privately negotiated transactions through February 28, 2019.
On February 11, 2016, we announced that we are considering alternatives to the spin-off of ABRH to FNFV shareholders previously announced on July 30, 2015.
On January 20, 2016, we entered into two interest rate swap agreements to hedge forecasted monthly interest rate payments on $400.0 million of our floating rate debt ($200.0 million notional value each) (the “Swap Agreements”). The Swap Agreements have been designated as cash flow hedging instruments. Under the terms of the Swap Agreements, we receive payments based on the 1-month LIBOR rate and pay a weighted average fixed rate of 1.01%. The effective term for the Swap Agreements is February 1, 2016 through January 31, 2019.
Beginning in October 2015 through December 31, 2015, we purchased approximately 2.2 million shares of Del Frisco Restaurant Group ("Del Frisco's", NASDAQ: DFRG) common stock for a total investment of $32 million. Subsequent to year-end through February 19, 2016, we purchased approximately 0.8 million shares of Del Frisco's common stock for $12 million. We currently own approximately 13% of the outstanding common stock of Del Frisco's.
On September 16, 2015, J. Alexander's and FNF entered into a Separation and Distribution Agreement, pursuant to which FNF agreed to distribute one hundred percent (100%) of its shares of J. Alexander's common stock, on a pro rata basis, to the holders of FNFV common stock. Holders of FNFV common stock received, as a distribution from FNF, approximately 0.17272 shares of J. Alexander’s common stock for every one share of FNFV common stock held at the close of business on September 22, 2015, the record date for the distribution (the “Distribution”). The Distribution was made on September 28, 2015. As a result of the Distribution, J. Alexander's is now an independent public company and its common stock is listed under the symbol “JAX” on the New York Stock Exchange. The Distribution was generally tax-free to FNFV shareholders for U.S. federal income tax purposes, except to the extent of any cash received in lieu of J. Alexander's fractional shares.
On July 20, 2015, we completed the recapitalization of ServiceLink Holdings, LLC through a conversion (the "ServiceLink Conversion") of $505 million of the $566 million aggregate preference amount associated with its Class A1 participating preferred units into slightly more than 67.3 million Class A common units. As a result of the ServiceLink Conversion, our ownership percentage in ServiceLink Holdings, LLC increased from 65% to 79%.
On July 20, 2015, our Board of Directors approved a new FNF Group three-year stock repurchase program, effective August 1, 2015, under which we may repurchase up to 25 million shares of FNF Group common stock. Purchases may be made from time to time by us in the open market at prevailing market prices or in privately negotiated transactions through July 31, 2018.
On May 29, 2015, Black Knight completed a redemption (the "Redemption") of $205 million in aggregate principal of its senior notes ("Black Knight Senior Notes") at a price of 105.750%. Black Knight incurred a charge on the Redemption of $12 million and also reduced the bond premium by $7 million for the portion of the premium that relates to the redeemed Black Knight Senior Notes, resulting in a net charge on the Redemption of $5 million. Following the Redemption, $390 million in aggregate principal of Black Knight Senior Notes remained outstanding.
On May 27, 2015, Black Knight InfoServ, LLC (“BKIS”), a subsidiary of Black Knight, entered into a credit and guaranty agreement (the “BKIS Credit Agreement”) with an aggregate borrowing capacity of $1.6 billion, dated as of May 27, 2015, with JPMorgan Chase Bank, N.A. as administrative agent, the guarantors party thereto, the other agents party thereto and the lenders party thereto. FNF does not provide any guaranty or stock pledge under the BKIS Credit Agreement.
On May 27, 2015, we entered into an amendment to our existing $800 million third amended and restated credit agreement (as previously amended, the “Existing Revolving Credit Agreement”), dated as of June 25, 2013, with Bank of America, N.A., as administrative agent, the other agents party thereto and the financial institutions party thereto as lenders (the “FNF Amended Revolving Credit Agreement”). Among other changes, the FNF Amended Revolving Credit Agreement amends the Existing Revolving Credit Agreement to permit FNF and its subsidiaries to incur the indebtedness and liens in connection with the BKIS Credit Agreement.
72
FIDELITY NATIONAL FINANCIAL, INC. AND SUBSIDIARIES
NOTES TO CONSOLIDATED FINANCIAL STATEMENTS — (continued)
On May 26, 2015, Black Knight closed its initial public offering ("IPO") of 20,700,000 shares of Class A common stock at a price to the public of $24.50 per share, which included 2,700,000 shares of Class A common stock issued upon the exercise in full of the underwriters' option to purchase additional shares. Black Knight received net proceeds of $475 million from the offering, after deduction of underwriter discount and expenses. In connection with the IPO, Black Knight amended and restated its certificate of incorporation to authorize the issuance of two classes of common stock, Class A common stock and Class B common stock, which will generally vote together as a single class on all matters submitted for a vote to stockholders. As a result, Black Knight issued shares of Class B common stock to us, and certain Thomas H. Lee Partners affiliates, as the holders of membership interests in Black Knight Financial Services, LLC ("BKFS, LLC") prior to the IPO. Class B common stock is not publicly traded and does not entitle the holders thereof to any of the economic rights, including rights to dividends and distributions upon liquidation that would be provided to holders of Class A common stock. Prior to the IPO, we owned 67% of the membership interests in BKFS, LLC. Following the IPO, we owned 55% of the outstanding shares of Black Knight in the form of Class B common stock, with a corresponding ownership interest in BKFS, LLC.
On March 20, 2015, we completed our tender offer to purchase shares of FNFV stock. As a result of the offer, we accepted for purchase 12,333,333 shares of FNFV Group Common Stock for a purchase price of $15.00 per common share, for a total aggregate cost of $185 million, excluding fees and expenses related to the tender offer.
On February 18, 2015, we closed the sale of substantially all of the assets of Cascade Timberlands, LLC ("Cascade") which grows and sells timber and in which we owned a 70.2% interest, for $85 million less a replanting allowance of $1 million and an indemnity holdback of $1 million. The revenue from the sale was recorded in Escrow, title related and other fees and the cost of the land sold was in other operating expenses in the Consolidated Statement of Operations in the twelve months ended December 31, 2015. The effect of the sale on FNFV's net earnings was income of approximately $12 million. There was no effect on net earnings attributable to FNFV Group common shareholders due to offsetting amounts attributable to noncontrolling interests.
Discontinued Operations
Remy
On December 31, 2014, we completed the distribution (the "Remy Spin-off") of all of the outstanding shares of common stock of our previously owned subsidiary Remy International, Inc. ("New Remy", NASDAQ: REMY), a manufacturer and distributer of auto parts, to FNFV shareholders. We have no continuing involvement in New Remy as of December 31, 2015. As a result of the Remy Spin-off, the results of New Remy are reflected in the Consolidated Statements of Earnings as discontinued operations for the years ended December 31, 2014 and 2013. Total revenue included in discontinued operations was $1,173 million and $1,125 million for the years ended December 31, 2014, and 2013, respectively. Pre-tax earnings included in discontinued operations were $6 million and $22 million for the years ended December 31, 2014, and 2013, respectively.
73
FIDELITY NATIONAL FINANCIAL, INC. AND SUBSIDIARIES
NOTES TO CONSOLIDATED FINANCIAL STATEMENTS — (continued)
A reconciliation of the operations of Remy to the Statement of Earnings is shown below:
Year Ended December 31, | |||||||
2014 | 2013 | ||||||
(In millions) | |||||||
Revenues: | |||||||
Auto parts revenues | $ | 1,172 | $ | 1,127 | |||
Other revenues | 1 | (2 | ) | ||||
Total | 1,173 | 1,125 | |||||
Expenses: | |||||||
Personnel costs | 81 | 86 | |||||
Other operating expenses | 52 | 46 | |||||
Cost of auto parts revenues | 1,009 | 947 | |||||
Depreciation & amortization | 4 | 4 | |||||
Interest expense | 21 | 20 | |||||
Total expenses | 1,167 | 1,103 | |||||
Earnings from discontinued operations before income taxes | 6 | 22 | |||||
Income tax (benefit) expense | (1 | ) | 5 | ||||
Net earnings from discontinued operations | 7 | 17 | |||||
Less: Net earnings attributable to non-controlling interests | 3 | 10 | |||||
Net earnings from discontinued operations attributable to Fidelity National Financial, Inc. common shareholders | $ | 4 | $ | 7 | |||
Cash flow from discontinued operations data: | |||||||
Net cash provided by operations | $ | 39 | $ | 61 | |||
Net cash used in investing activities | (50 | ) | (21 | ) | |||
Other Discontinued Operations
The results from a small software company, which we acquired with LPS and which was sold during the second quarter of 2014, are included in the Consolidated Statements of Earnings as discontinued operations for all periods presented. Total revenues included in discontinued operations were $2 million for the year ending December 31, 2014. Pre-tax earnings included in discontinued operations are $1 million for the year ending December 31, 2014.
The results from two closed J. Alexander's locations in the second quarter of 2013 are reflected in the Consolidated Statements of Earnings as discontinued operations for all periods presented. Total net revenue included in discontinued operations was $3 million for the year ended December 31, 2013. Pre-tax loss included in discontinued operations was $3 million for the year ended December 31, 2013.
The results from a settlement services company closed in the second quarter of 2013 are reflected in the Consolidated Statements of Earnings as discontinued operations for all periods presented. Total revenues included in discontinued operations were $9 million for the year ended December 31, 2013. Pre-tax earnings included in discontinued operations were $2 million for the year ended December 31, 2013.
Investments
Fixed maturity securities are purchased to support our investment strategies, which are developed based on factors including rate of return, maturity, credit risk, duration, tax considerations and regulatory requirements. Fixed maturity securities which may be sold prior to maturity to support our investment strategies are carried at fair value and are classified as available for sale as of the balance sheet dates. Fair values for fixed maturity securities are principally a function of current market conditions and are valued based on quoted prices in markets that are not active or model inputs that are observable either directly or indirectly. Discount or premium is recorded for the difference between the purchase price and the principal amount. The discount or premium is amortized or accrued using the interest method and is recorded as an adjustment to interest and investment income. The interest method results in the recognition of a constant rate of return on the investment equal to the prevailing rate at the time of purchase or at the time of subsequent adjustments of book value. Changes in prepayment assumptions are accounted for retrospectively.
74
FIDELITY NATIONAL FINANCIAL, INC. AND SUBSIDIARIES
NOTES TO CONSOLIDATED FINANCIAL STATEMENTS — (continued)
Equity securities and preferred stocks held are considered to be available for sale and carried at fair value as of the balance sheet dates. Our equity securities and certain preferred stocks are Level 1 financial assets and fair values are based on quoted prices in active markets. Other preferred stock holdings are Level 2 financial assets and are valued based on quoted prices in markets that are not active or model inputs that are observable either directly or indirectly.
Investments in unconsolidated affiliates are recorded using the equity method of accounting.
Other long-term investments consist of various cost-method investments. The cost-method investments are carried at historical cost.
Short-term investments, which consist primarily of commercial paper and money market instruments, which have an original maturity of one year or less, are carried at amortized cost, which approximates fair value.
Realized gains and losses on the sale of investments are determined on the basis of the cost of the specific investments sold and are credited or charged to income on a trade date basis. Unrealized gains or losses on securities which are classified as available for sale, net of applicable deferred income tax expenses (benefits), are excluded from earnings and credited or charged directly to a separate component of equity. If any unrealized losses on available for sale securities are determined to be other-than-temporary, such unrealized losses are recognized as realized losses. Unrealized losses are considered other-than-temporary if factors exist that cause us to believe that the value will not increase to a level sufficient to recover our cost basis. Some factors considered in evaluating whether or not a decline in fair value is other-than-temporary include: (i) our need and intent to sell the investment prior to a period of time sufficient to allow for a recovery in value; (ii) the duration and extent to which the fair value has been less than cost; and (iii) the financial condition and prospects of the issuer. Such reviews are inherently uncertain and the value of the investment may not fully recover or may decline in future periods resulting in a realized loss.
Cash and Cash Equivalents
Highly liquid instruments purchased as part of cash management with original maturities of three months or less are considered cash equivalents. The carrying amounts reported in the Consolidated Balance Sheets for these instruments approximate their fair value.
Fair Value of Financial Instruments
The fair values of financial instruments presented in the Consolidated Financial Statements are estimates of the fair values at a specific point in time using available market information and appropriate valuation methodologies. These estimates are subjective in nature and involve uncertainties and significant judgment in the interpretation of current market data. We do not necessarily intend to dispose of or liquidate such instruments prior to maturity.
Trade and Notes Receivables
The carrying values reported in the Consolidated Balance Sheets for trade and notes receivables approximate their fair value.
Goodwill
Goodwill represents the excess of cost over fair value of identifiable net assets acquired and assumed in a business combination. Goodwill and other intangible assets with indefinite useful lives are reviewed for impairment annually or more frequently if circumstances indicate potential impairment, through a comparison of fair value to the carrying amount. In evaluating the recoverability of goodwill, we perform an annual goodwill impairment analysis based on a review of qualitative factors to determine if events and circumstances exist which will lead to a determination that the fair value of a reporting unit is greater than its carrying amount, prior to performing a full fair-value assessment.
We completed annual goodwill impairment analyses in the fourth quarter of each respective year using a September 30 measurement date and as a result no goodwill impairments have been recorded. For the years ended December 31, 2015 and 2014, we determined there were no events or circumstances which indicated that the carrying value exceeded the fair value.
Other Intangible Assets
We have other intangible assets, not including goodwill, which consist primarily of customer relationships and contracts and trademarks which are generally recorded in connection with acquisitions at their fair value, and debt issuance costs relating to the issuance of our long-term notes payable. Intangible assets with estimable lives are amortized over their respective estimated useful lives to their estimated residual values and reviewed for impairment whenever events or changes in circumstances indicate that the carrying amount may not be recoverable. In general, customer relationships are amortized over their estimated useful lives using an accelerated method which takes into consideration expected customer attrition rates. Contractual relationships are generally amortized over their contractual life. Trademarks are generally considered intangible assets with indefinite lives and are reviewed for impairment at least annually. Debt issuance costs are amortized on a straight line basis over the contractual life of the related debt instrument.
75
FIDELITY NATIONAL FINANCIAL, INC. AND SUBSIDIARIES
NOTES TO CONSOLIDATED FINANCIAL STATEMENTS — (continued)
We recorded $11 million in impairment expense to Tradenames in our Restaurant Group segment during the year ended December 31, 2014, respectively. We recorded no impairment expense related to other intangible assets in the years ended December 31, 2015 and 2013.
Title Plants
Title plants are recorded at the cost incurred to construct or obtain and organize historical title information to the point it can be used to perform title searches. Costs incurred to maintain, update and operate title plants are expensed as incurred. Title plants are not amortized as they are considered to have an indefinite life if maintained. Sales of title plants are reported at the amount received net of the adjusted costs of the title plant sold. Sales of title plant copies are reported at the amount received. No cost is allocated to the sale of copies of title plants unless the carrying value of the title plant is diminished or impaired. Title plants are reviewed for impairment whenever events or circumstances indicate that the carrying amounts may not be recoverable. We reviewed title plants for impairment in the years ended December 31, 2015, 2014 and 2013 and identified and recorded impairment expense of $1 million, $1 million and $4 million, respectively.
Property and Equipment
Property and equipment are recorded at cost, less accumulated depreciation. Depreciation is computed primarily using the straight-line method based on the estimated useful lives of the related assets: twenty to thirty years for buildings and three to twenty-five years for furniture, fixtures and equipment. Leasehold improvements are amortized on a straight-line basis over the lesser of the term of the applicable lease or the estimated useful lives of such assets. Equipment under capitalized leases is amortized on a straight-line basis to its expected residual value at the end of the lease term. Property and equipment are reviewed for impairment whenever events or circumstances indicate that the carrying amounts may not be recoverable.
In our Restaurant Group, all direct external costs associated with obtaining the land, building and equipment for each new restaurant, as well as construction period interest are capitalized. Direct external costs associated with obtaining the dining room and kitchen equipment, signage and other assets and equipment are also capitalized. In addition, for each new restaurant and re-branded restaurant, a portion of the internal direct costs of its real estate and construction department are also capitalized.
Reserve for Title Claim Losses
Our reserve for title claim losses includes known claims as well as losses we expect to incur, net of recoupments. Each known claim is reserved based on our review as to the estimated amount of the claim and the costs required to settle the claim. Reserves for claims which are incurred but not reported are established at the time premium revenue is recognized based on historical loss experience and also take into consideration other factors, including industry trends, claim loss history, current legal environment, geographic considerations and the type of policy written.
The reserve for title claim losses also includes reserves for losses arising from closing and disbursement functions due to fraud or operational error.
If a loss is related to a policy issued by an independent agent, we may proceed against the independent agent pursuant to the terms of the agency agreement. In any event, we may proceed against third parties who are responsible for any loss under the title insurance policy under rights of subrogation.
Secured Trust Deposits
In the state of Illinois, a trust company is permitted to commingle and invest customers’ assets with its own assets, pending completion of real estate transactions. Accordingly, our Consolidated Balance Sheets reflect a secured trust deposit liability of $701 million and $622 million at December 31, 2015 and 2014, respectively, representing customers’ assets held by us and corresponding assets including cash and investments pledged as security for those trust balances.
Income Taxes
We recognize deferred tax assets and liabilities for temporary differences between the financial reporting basis and the tax basis of our assets and liabilities and expected benefits of utilizing net operating loss and credit carryforwards. Deferred tax assets and liabilities are measured using enacted tax rates expected to apply to taxable income in the years in which those temporary differences are expected to be recovered or settled. The impact on deferred taxes of changes in tax rates and laws, if any, is applied to the years during which temporary differences are expected to be settled and reflected in the financial statements in the period enacted.
Reinsurance
In a limited number of situations, we limit our maximum loss exposure by reinsuring certain risks with other insurers. We also earn a small amount of additional income, which is reflected in our direct premiums, by assuming reinsurance for certain risks of other insurers. We cede a portion of certain policy and other liabilities under agent fidelity, excess of loss and case-by-case reinsurance agreements. Reinsurance agreements provide that in the event of a loss (including costs, attorneys’ fees and
76
FIDELITY NATIONAL FINANCIAL, INC. AND SUBSIDIARIES
NOTES TO CONSOLIDATED FINANCIAL STATEMENTS — (continued)
expenses) exceeding the retained amounts, the reinsurer is liable for the excess amount assumed. However, the ceding company remains primarily liable in the event the reinsurer does not meet its contractual obligations.
Revenue Recognition
Title. Our direct title insurance premiums and escrow, title-related and other fees are recognized as revenue at the time of closing of the related transaction as the earnings process is then considered complete. Premium revenues from agency operations and agency commissions include an accrual based on estimates using historical information of the volume of transactions that have closed in a particular period for which premiums have not yet been reported to us. The accrual for agency premiums is necessary because of the lag between the closing of these transactions and the reporting of these policies to us by the agent. Historically, the time lag between the closing of these transactions by our agents and the reporting of these policies, or premiums, to us has been up to 15 months, with 86 - 89% reported within three months following closing, an additional 9 - 11% reported within the next three months and the remainder within seven to fifteen months. In addition to accruing these earned but unreported agency premiums, we also accrue agent commission expense, which was 76.0%, of agent premiums earned in 2015, 75.7% of agent premiums earned in 2014 and 76.1% of agent premiums earned in 2013. We also record a provision for claim losses at our average provision rate at the time we record the accrual for the premiums, which was 5.7% for 2015, 6.2% for 2014 and 7% for 2013, and accruals for premium taxes and other expenses relating to our premium accrual. The resulting impact to pretax earnings in any period is approximately 11% of the accrued premium amount. The impact of the change in the accrual for agency premiums and related expenses on our pretax earnings was a decrease of $5 million for the year ended December 31, 2015, $9 million for the year ended 2014 and $7 million for the year ended 2013. The amount due from our agents relating to this accrual, i.e., the agent premium less their contractual retained commission, was approximately $45 million and $55 million at December 31, 2015 and 2014, respectively, which represents agency premiums of approximately $230 million and $276 million at December 31, 2015 and 2014, respectively, and agent commissions of $185 million and $221 million at December 31, 2015 and 2014, respectively.
Revenues from home warranty insurance policies are recognized over the life of the policy, which is one year. The unrecognized portion is recorded as deferred revenue in Accounts payable and other accrued liabilities in the Consolidated Balance Sheets.
Black Knight. Within our Black Knight segment, our primary types of revenues and our revenue recognition policies as they pertain to the types of contractual arrangements we enter into with our customers to provide services, software licenses, and software-related services either individually or as part of an integrated offering of multiple services. These arrangements occasionally include offerings from more than one segment to the same customer. We recognize revenues relating to mortgage processing, outsourced business processing services, data and analytics services, along with software licensing and software-related services. In some cases, these services are offered in combination with one another, and in other cases we offer them individually. Revenues from processing services are typically volume-based depending on factors such as the number of accounts processed, transactions processed and computer resources utilized.
The majority of our revenues are from outsourced data processing and application hosting, data, analytic and valuation related services, and outsourced business processing services. Revenue is realized or realizable and earned when all of the following criteria are met: (1) persuasive evidence of an arrangement exists; (2) delivery has occurred or services have been rendered; (3) the seller’s price to the buyer is fixed or determinable; and (4) collectibility is reasonably assured. For hosting arrangements, revenues and costs related to implementation, conversion and programming services are deferred and subsequently recognized using the straight-line method over the term of the related services agreement. We evaluate these deferred contract costs for impairment in the event any indications of impairment exist.
In the event that our arrangements with our customers include more than one element, we determine whether the individual revenue elements can be recognized separately. In arrangements with multiple deliverables, the delivered items are considered separate units of accounting if (1) they have value on a standalone basis and (2) performance of the undelivered items is considered probable and within our control. Arrangement consideration is then allocated to the separate units of accounting based on relative selling price. If it exists, vendor-specific objective evidence is used to determine relative selling price, otherwise third-party evidence of selling price is used. If neither exists, the best estimate of selling price is used for the deliverable.
For multiple element software arrangements, we determine the appropriate units of accounting and how the arrangement consideration should be measured and allocated to the separate units. Initial license fees are recognized when a contract exists, the fee is fixed or determinable, software delivery has occurred and collection of the receivable is deemed probable, provided that vendor-specific objective evidence (“VSOE”) has been established for each element or for any undelivered elements. We determine the fair value of each element or the undelivered elements in multi-element software arrangements based on VSOE. VSOE for each element is based on the price charged when the same element is sold separately, or in the case of post-contract customer support, when a stated renewal rate is provided to the customer. If evidence of fair value of all undelivered elements exists but evidence does not exist for one or more delivered elements, then revenue is recognized using the residual method. Under the residual method, the fair value of the undelivered elements is deferred and the remaining portion of the arrangement fee is recognized as revenue. If evidence of fair value does not exist for one or more undelivered elements of a contract, then all revenue is deferred
77
FIDELITY NATIONAL FINANCIAL, INC. AND SUBSIDIARIES
NOTES TO CONSOLIDATED FINANCIAL STATEMENTS — (continued)
until all elements are delivered or fair value is determined for all remaining undelivered elements. Revenue from post-contract customer support is recognized ratably over the term of the agreement. We record deferred revenue for all billings invoiced prior to revenue recognition.
Black Knight is often party to multiple concurrent contracts with the same client. These situations require judgment to determine whether the individual contracts should be aggregated or evaluated separately for purposes of revenue recognition. In making this determination we consider the timing of negotiating and executing the contracts, whether the different elements of the contracts are interdependent and whether any of the payment terms of the contracts are interrelated.
Restaurant Group. Restaurant revenue on the Consolidated Statements of Earnings consists of restaurant sales and, to a lesser extent, franchise revenue and other revenue. Restaurant sales include food and beverage sales and are net of applicable state and local sales taxes and discounts.
Capitalized Software
Capitalized software includes the fair value of software acquired in business combinations, purchased software and capitalized software development costs. Purchased software is recorded at cost and amortized using the straight-line method over its estimated useful life. Software acquired in business combinations is recorded at its fair value and amortized using straight-line or accelerated methods over its estimated useful life, ranging from 5 to 10 years. In our Black Knight segment we have significant internally developed software. These costs are amortized using the straight-line method or accelerated over the estimated useful life. Useful lives of computer software range from 3 to 10 years. For software products to be sold, leased, or otherwise marketed (ASC 985-20 software), all costs incurred to establish the technological feasibility are research and development costs, and are expensed as they are incurred. Costs incurred subsequent to establishing technological feasibility, such as programmers' salaries and related payroll costs and costs of independent contractors, are capitalized and amortized on a product by product basis commencing on the date of general release to customers. We do not capitalize any costs once the product is available for general release to customers. For internal-use computer software products, internal and external costs incurred during the preliminary project stage are expensed as they are incurred. Internal and external costs incurred during the application development stage are capitalized and amortized on a product by product basis commencing on the date the software is ready for its intended use. We do not capitalize any costs once the software is ready for its intended use.
We also assess the recorded value of computer software for impairment on a regular basis by comparing the carrying value to the estimated future cash flows to be generated by the underlying software asset. There is an inherent uncertainty in determining the expected useful life of or cash flows to be generated from computer software. We recorded impairment charges of $1 million and $5 million in the years ended December 31, 2015 and 2014, respectively, for abandoned software development projects. We recorded no impairment expense related to capitalized software in the year ended December 31, 2013.
Comprehensive Earnings (Loss)
We report Comprehensive earnings (loss) in accordance with GAAP on the Consolidated Statements of Comprehensive Earnings. Total comprehensive earnings are defined as all changes in shareholders' equity during a period, other than those resulting from investments by and distributions to shareholders. While total comprehensive earnings is the activity in a period and is largely driven by net earnings in that period, accumulated other comprehensive earnings or loss represents the cumulative balance of other comprehensive earnings, net of tax, as of the balance sheet date. Amounts reclassified to net earnings relate to the realized gains (losses) on our investments and other financial instruments, excluding investments in unconsolidated affiliates, and are included in Realized gains and losses, net on the Consolidated Statements of Earnings.
78
FIDELITY NATIONAL FINANCIAL, INC. AND SUBSIDIARIES
NOTES TO CONSOLIDATED FINANCIAL STATEMENTS — (continued)
Changes in the balance of Other comprehensive earnings by component are as follows:
Unrealized gain (loss) on investments and other financial instruments, net (excluding investments in unconsolidated affiliates) | Unrealized (loss) gain relating to investments in unconsolidated affiliates | Unrealized (loss) gain on foreign currency translation and cash flow hedging | Minimum pension liability adjustment | Total Accumulated Other Comprehensive Earnings | |||||||||||||||
(In millions) | |||||||||||||||||||
Balance December 31, 2013 | $ | 87 | $ | (41 | ) | $ | 7 | $ | (16 | ) | $ | 37 | |||||||
Other comprehensive (losses) earnings | (1 | ) | (10 | ) | (17 | ) | (12 | ) | (40 | ) | |||||||||
Distribution of Remy to FNFV Group Shareholders | — | — | 3 | 2 | 5 | ||||||||||||||
Balance December 31, 2014 | 86 | (51 | ) | (7 | ) | (26 | ) | 2 | |||||||||||
Other comprehensive (losses) earnings | (38 | ) | (27 | ) | (8 | ) | 2 | (71 | ) | ||||||||||
Balance December 31, 2015 | $ | 48 | $ | (78 | ) | $ | (15 | ) | $ | (24 | ) | $ | (69 | ) | |||||
Redeemable Non-controlling Interest
Subsequent to the acquisition of LPS we issued 35% ownership interests in each of Black Knight and ServiceLink to funds affiliated with Thomas H. Lee Partners ("THL" or "the minority interest holder"). THL had an option to put its ownership interests of either or both of Black Knight and ServiceLink to us if no public offering of the corresponding business was consummated after four years from the date of FNF's purchase of LPS. The units owned by THL ("redeemable noncontrolling interests") may be settled in cash or common stock of FNF or a combination of both at our election. The redeemable noncontrolling interests will be settled at the current fair value at the time we receive notice of THL's put election as determined by the parties or by a third party appraisal under the terms of the Unit Purchase Agreement. As a result of Black Knight's IPO, discussed in the Recent Developments section above, THL's option to put its ownership interest in Black Knight expired. As a result of the ServiceLink Recapitalization, also discussed in the Recent Developments section above, the ownership interest by the minority interest holder was reduced from 35% to 21%. As of December 31, 2015, we do not believe the exercise of their remaining put right in ServiceLink to be probable.
As these redeemable noncontrolling interests provide for redemption features not solely within our control, we classify the redeemable noncontrolling interests outside of permanent equity. Redeemable noncontrolling interests held by third parties in subsidiaries owned or controlled by FNF is reported on the Consolidated Balance Sheet outside permanent of equity; and the Consolidated Statement of Earnings reflects the respective redeemable noncontrolling interests in Net earnings (loss) attributable to non-controlling interests, the effect of which is removed from the net earnings attributable to Fidelity National Financial, Inc. common shareholders.
Earnings Per Share
Basic earnings per share, as presented on the Consolidated Statement of Earnings, is computed by dividing net earnings available to common shareholders by the weighted average number of common shares outstanding during the period. In periods when earnings are positive, diluted earnings per share is calculated by dividing net earnings available to common shareholders by the weighted average number of common shares outstanding plus the impact of assumed conversions of potentially dilutive securities. For periods when we recognize a net loss, diluted earnings per share is equal to basic earnings per share as the impact of assumed conversions of potentially dilutive securities is considered to be antidilutive. We have granted certain stock options, shares of restricted stock, convertible debt instruments and certain other convertible share based payments which have been treated as common share equivalents for purposes of calculating diluted earnings per share for periods in which positive earnings have been reported.
The net earnings of Black Knight in our calculation of diluted earnings per share is adjusted for dilution related to certain Black Knight restricted stock granted to employees in accordance with ASC 260-10-55-20. We calculate the ratio of the Class B shares we own to the total weighted average diluted shares of Black Knight outstanding and multiply the ratio by their net earnings. The result is used as a substitution for Black Knight's net earnings attributable to FNF included in our consolidated net earnings in the numerator for our diluted EPS calculation. As the effect was antidilutive for the year-ended December 31, 2015 there were no adjustments made to net earnings attributable to FNF in our calculation of diluted EPS. There are no adjustments to earnings attributable to FNF in our calculation of basic EPS. There are no adjustments made to net earnings attributable to FNFV in our
79
FIDELITY NATIONAL FINANCIAL, INC. AND SUBSIDIARIES
NOTES TO CONSOLIDATED FINANCIAL STATEMENTS — (continued)
calculation of basic or diluted EPS.
Options or other instruments which provide the ability to purchase shares of our common stock that are antidilutive are excluded from the computation of diluted earnings per share. For the years ended December 31, 2015, 2014, and 2013, options to purchase 1 million shares, 2 million shares and 1 million shares, respectively, of our common stock were excluded from the computation of diluted earnings per share.
As of the close of business on June 30, 2014, we completed the recapitalization of Old FNF common stock into two tracking stocks, FNF Group common stock and FNFV Group common stock. As a result of the recapitalization, the weighted average shares outstanding presented on the Consolidated Statements of Earnings includes shares of Old FNF common stock, FNF Group common stock and FNFV Group common stock weighted over the 12 month period ended December 31, 2014. However, earnings per share attributable to Old FNF common shareholders are computed by dividing net earnings of FNF from January 1, 2014 through June 30, 2014 by the weighted average number of Old FNF common shares outstanding during the corresponding period (273 million basic shares and 282 million diluted shares). Earnings per share attributable to FNF Group common shareholders and to FNFV Group common shareholders are computed by dividing net earnings attributable to the FNF Group common shareholders and to the FNFV Group common shareholders from July 1, 2014 through December 31, 2014 by the weighted average number of common shares outstanding for each class of common stock during the corresponding period (276 million basic shares, 285 million diluted shares and 92 million basic shares, 93 million diluted shares, respectively).
Transactions with Related Parties
As we no longer have any officers in common with Fidelity National Information Services, Inc. ("FIS"), effective January 1, 2014, we no longer consider FIS a related party. We have described below transactions with FIS through December 31, 2013.
Agreements with FIS
A summary of the agreements that were in effect with FIS through December 31, 2013 is as follows:
• | Information Technology (“IT”) and data processing services from FIS. This agreement governs IT support services provided to us by FIS, primarily consisting of infrastructure support and data center management. Certain subsidiaries of FIS also provided technology consulting services to FNF during 2013. |
• | Administrative aviation corporate support and cost-sharing services to FIS. |
A detail of net revenues and expenses between us and FIS that were included in our results of operations for the periods presented is as follows:
Year Ended December 31, | |||
2013 | |||
(In millions) | |||
Corporate services and cost-sharing revenue | $ | 7 | |
Data processing expense | (34 | ) | |
Net expense | $ | (27 | ) |
We believe the amounts we earned or were charged under each of the foregoing arrangements are fair and reasonable. The information technology infrastructure support and data center management services provided to us are priced within the range of prices that FIS offers to its unaffiliated third party customers for the same types of services. However, the amounts FNF earned or was charged under these arrangements were not negotiated at arm’s-length, and may not represent the terms that we might have obtained from an unrelated third party.
Stock-Based Compensation Plans
We account for stock-based compensation plans using the fair value method. Using the fair value method of accounting, compensation cost is measured based on the fair value of the award at the grant date, using the Black-Scholes Model, and recognized over the service period.
Management Estimates
The preparation of these Consolidated Financial Statements in conformity with GAAP requires us to make estimates and assumptions that affect the reported amounts of assets and liabilities and disclosure of contingent assets and liabilities at the date of the Consolidated Financial Statements and the reported amounts of revenues and expenses during the reporting period. Actual results could differ from those estimates.
80
FIDELITY NATIONAL FINANCIAL, INC. AND SUBSIDIARIES
NOTES TO CONSOLIDATED FINANCIAL STATEMENTS — (continued)
Certain Reclassifications
Certain reclassifications have been made in the 2014 and 2013 Consolidated Financial Statements to conform to classifications used in 2015. These reclassifications have not changed net earnings or total equity, as previously reported.
Note B. Acquisitions
The results of operations and financial position of the entities acquired during any year are included in the Consolidated Financial Statements from and after the date of acquisition.
Acquisition and Merger with Lender Processing Services
On January 2, 2014, we completed the purchase of LPS. The purchase consideration paid was $37.14 per share of LPS common stock, of which $28.10 per share was paid in cash and the remaining $9.04 was paid in Old FNF common shares. The purchase consideration represented an exchange ratio of 0.28742 of Old FNF common shares per share of LPS common stock. Total consideration paid for LPS was $3.4 billion, which consisted of $2,535 million in cash and $839 million in Old FNF common stock. In order to pay the stock component of the consideration, we issued 25,920,078 Old FNF shares to the former LPS shareholders. Goodwill has been recorded based on the amount that the purchase price exceeded the fair value of the net assets acquired.
The purchase price was as follows (in millions):
Cash paid for LPS outstanding shares | $ | 2,535 | |
Less: cash acquired from LPS | (282 | ) | |
Net cash paid for LPS | 2,253 | ||
FNF common stock issued (25,920,078 shares) | 839 | ||
Total net consideration paid | $ | 3,092 | |
The purchase price has been allocated to the LPS assets acquired and liabilities assumed based on our best estimates of their fair values as of the acquisition date.
The purchase price allocation was completed in 2014. The purchase price allocation is as follows (in millions):
Trade and notes receivable | $ | 184 | |
Investments | 77 | ||
Prepaid expenses and other assets | 59 | ||
Property and equipment | 149 | ||
Capitalized software | 536 | ||
Intangible assets including title plants | 1,010 | ||
Income tax receivable | 59 | ||
Goodwill | 3,011 | ||
Total assets | 5,085 | ||
Notes payable | 1,093 | ||
Reserve for title claims | 54 | ||
Deferred tax liabilities | 405 | ||
Other liabilities assumed | 441 | ||
Total liabilities | 1,993 | ||
Net assets acquired | $ | 3,092 | |
81
FIDELITY NATIONAL FINANCIAL, INC. AND SUBSIDIARIES
NOTES TO CONSOLIDATED FINANCIAL STATEMENTS — (continued)
Pro-forma Financial Results
For comparative purposes, selected unaudited pro-forma consolidated results of operations of FNF for the years ended December 31, 2014 and 2013 are presented below. Pro-forma results presented assume the consolidation of LPS occurred as of the beginning of the 2013 period.
Amounts reflect our 65% ownership interest in BKFS, LLC and our 65% ownership interest in ServiceLink at the acquisition date and were adjusted to exclude costs directly attributable to the acquisition of LPS including transaction costs, severance costs and costs related to our synergy bonus program associated with the acquisition (in millions).
Year Ended December 31, | |||||||
2014 | 2013 | ||||||
Total revenues | $ | 8,024 | $ | 9,164 | |||
Net earnings attributable to Fidelity National Financial, Inc. common shareholders | 723 | 497 | |||||
In connection with the LPS acquisition, we formed a wholly-owned subsidiary, Black Knight Financial Services, Inc. (now known as Black Knight Holdings, Inc. "BKHI"). After acquiring LPS, we retained a 65% ownership interest in each of the subsidiaries (BKFS, LLC and ServiceLink) and the subsidiaries each issued 35% minority ownership interest to THL and certain related entities on January 3, 2014. BKFS, LLC and ServiceLink now own and operate the former LPS businesses and our legacy ServiceLink business.
Effective June 1, 2014, we completed an internal reorganization to contribute our subsidiary Property Insight, a company which provides information used by title insurance underwriters, title agents and closing attorneys to underwrite title insurance policies for real property sales and transfer, from our Title segment to BKFS, LLC. As a result of this transfer, our ownership percentage in BKFS, LLC increased to 67%. Our results for periods since June 1, 2014, reflect our now 67% ownership interest in BKFS, LLC.
As a result of the Black Knight IPO and ServiceLink Reorganization discussed in Note A, our ownership interest in BKFS, LLC and ServiceLink changed to 55% and 79%, respectively, as of May 26, 2015 and June 20, 2015, respectively. Our results for periods subsequent to these dates reflect the new ownership percentages in BKFS, LLC and ServiceLink.
Other Acquisitions
On February 12, 2015, we closed the purchase of all of the membership interest in Buyers Protection Group Holdings, LLC ("BPG"), pursuant to a certain Membership Interest Purchase Agreement, for $46 million. We first consolidated the results of BPG as of March 31, 2015. BPG is a recognized leader in home warranty, home inspection services and commercial inspections.
Note C. | Fair Value Measurements |
The fair value hierarchy established by the accounting standards on fair value measurements includes three levels which are based on the priority of the inputs to the valuation technique. The fair value hierarchy gives the highest priority to quoted prices in active markets for identical assets or liabilities (Level 1) and the lowest priority to unobservable inputs (Level 3). If the inputs used to measure the financial instruments fall within different levels of the hierarchy, the categorization is based on the lowest level input that is significant to the fair value measurement of the instrument. Financial assets and liabilities that are recorded in the Consolidated Balance Sheets are categorized based on the inputs to the valuation techniques as follows:
Level 1. Financial assets and liabilities whose values are based on unadjusted quoted prices for identical assets or liabilities in an active market that we have the ability to access.
Level 2. Financial assets and liabilities whose values are based on quoted prices in markets that are not active or model inputs that are observable either directly or indirectly for substantially the full term of the asset or liability.
Level 3. Financial assets and liabilities whose values are based on model inputs that are unobservable.
82
FIDELITY NATIONAL FINANCIAL, INC. AND SUBSIDIARIES
NOTES TO CONSOLIDATED FINANCIAL STATEMENTS — (continued)
The following table presents our fair value hierarchy for those assets measured at fair value on a recurring basis as of December 31, 2015 and 2014, respectively:
December 31, 2015 | |||||||||||||||
Level 1 | Level 2 | Level 3 | Total | ||||||||||||
(In millions) | |||||||||||||||
Assets: | |||||||||||||||
Fixed-maturity securities available for sale: | |||||||||||||||
U.S. government and agencies | $ | — | $ | 117 | $ | — | $ | 117 | |||||||
State and political subdivisions | — | 768 | — | 768 | |||||||||||
Corporate debt securities | — | 1,495 | — | 1,495 | |||||||||||
Foreign government bonds | — | 107 | — | 107 | |||||||||||
Mortgage-backed/asset-backed securities | — | 71 | — | 71 | |||||||||||
Preferred stock available for sale | 42 | 247 | — | 289 | |||||||||||
Equity securities available for sale | 334 | 11 | — | 345 | |||||||||||
Total | $ | 376 | $ | 2,816 | $ | — | $ | 3,192 | |||||||
December 31, 2014 | |||||||||||||||
Level 1 | Level 2 | Level 3 | Total | ||||||||||||
(In millions) | |||||||||||||||
Fixed-maturity securities available for sale: | |||||||||||||||
U.S. government and agencies | $ | — | $ | 115 | $ | — | $ | 115 | |||||||
State and political subdivisions | — | 948 | — | 948 | |||||||||||
Corporate debt securities | — | 1,820 | — | 1,820 | |||||||||||
Foreign government bonds | — | 37 | — | 37 | |||||||||||
Mortgage-backed/asset-backed securities | — | 105 | — | 105 | |||||||||||
Preferred stock available for sale | 50 | 173 | — | 223 | |||||||||||
Equity securities available for sale | 145 | — | — | 145 | |||||||||||
Total | $ | 195 | $ | 3,198 | $ | — | $ | 3,393 | |||||||
Our Level 2 fair value measures for fixed-maturities available for sale are provided by third-party pricing services. We utilize one firm for our taxable bond and preferred stock portfolios and another for our tax-exempt bond portfolios. These pricing services are leading global providers of financial market data, analytics and related services to financial institutions. We rely on one price for each instrument to determine the carrying amount of the assets on our balance sheet. The inputs utilized in these pricing methodologies include observable measures such as benchmark yields, reported trades, broker dealer quotes, issuer spreads, two sided markets, benchmark securities, bids, offers and reference data including market research publications. We review the pricing methodologies for all of our Level 2 securities by obtaining an understanding of the valuation models and assumptions used by the third-party as well as independently comparing the resulting prices to other publicly available measures of fair value and internally developed models. The pricing methodologies used by the relevant third party pricing services are:
• | U.S. government and agencies: These securities are valued based on data obtained for similar securities in active markets and from inter-dealer brokers. |
• | State and political subdivisions: These securities are valued based on data obtained for similar securities in active markets and from inter-dealer brokers. Factors considered include relevant trade information, dealer quotes and other relevant market data. |
• | Corporate debt securities: These securities are valued based on dealer quotes and related market trading activity. Factors considered include the bond's yield, its terms and conditions, or any other feature which may influence its risk and thus marketability, as well as relative credit information and relevant sector news. |
• | Foreign government bonds: These securities are valued based on a discounted cash flow model incorporating observable market inputs such as available broker quotes and yields of comparable securities. |
• | Mortgage-backed/asset-backed securities: These securities are comprised of commercial mortgage-backed securities, agency mortgage-backed securities, collateralized mortgage obligations, and asset-backed securities. They are valued |
83
FIDELITY NATIONAL FINANCIAL, INC. AND SUBSIDIARIES
NOTES TO CONSOLIDATED FINANCIAL STATEMENTS — (continued)
based on available trade information, dealer quotes, cash flows, relevant indices and market data for similar assets in active markets.
• | Preferred stock: Preferred stocks are valued by calculating the appropriate spread over a comparable US Treasury security. Inputs include benchmark quotes and other relevant market data. |
• | Equity securities available for sale: This security is valued using a blending of two models, a discounted cash flow model and a comparable company model utilizing earnings and multiples of similar publicly-traded companies. |
Prior to December 31, 2014 our Level 2 financial assets and liabilities included our interest rate swap, foreign exchange contracts, and commodity contracts which were valued using the income approach. This approach uses techniques to convert future amounts to a single present value amount based upon market expectations (including present value techniques, option-pricing and excess earnings models). As of December 31, 2015 and December 31, 2014 we no longer hold these Level 2 financial assets and liabilities.
In 2014, our Level 3 investments consisted of structured notes that were purchased in 2009. During the third quarter of 2014, all of our outstanding structured notes matured and we received $39 million in cash upon maturity, resulting in a net realized gain of $1 million for the year ended December 31, 2014. We held no structured notes or other Level 3 investments at December 31, 2015 or December 31, 2014.
The following table presents the changes in our investments that are classified as Level 3 for the year ended December 31, 2014 (in millions):
Balance, December 31, 2013 | $ | 38 | |
Proceeds received upon maturity | (39 | ) | |
Realized gain (loss) | 1 | ||
Balance, December 31, 2014 | $ | — | |
The carrying amounts of short-term investments, accounts receivable and notes receivable approximate fair value due to their short-term nature. The fair value of our notes payable is included in Note J.
Additional information regarding the fair value of our investment portfolio is included in Note D.
84
FIDELITY NATIONAL FINANCIAL, INC. AND SUBSIDIARIES
NOTES TO CONSOLIDATED FINANCIAL STATEMENTS — (continued)
Note D. Investments
The carrying amounts and fair values of our available for sale securities at December 31, 2015 and 2014 are as follows:
December 31, 2015 | |||||||||||||||||||
Carrying Value | Cost Basis | Unrealized Gains | Unrealized Losses | Fair Value | |||||||||||||||
(In millions) | |||||||||||||||||||
Fixed maturity investments available for sale: | |||||||||||||||||||
U.S. government and agencies | $ | 117 | $ | 115 | $ | 2 | $ | — | $ | 117 | |||||||||
States and political subdivisions | 768 | 748 | 20 | — | 768 | ||||||||||||||
Corporate debt securities | 1,495 | 1,509 | 14 | (28 | ) | 1,495 | |||||||||||||
Foreign government bonds | 107 | 120 | — | (13 | ) | 107 | |||||||||||||
Mortgage-backed/asset-backed securities | 71 | 68 | 3 | — | 71 | ||||||||||||||
Preferred stock available for sale | 289 | 290 | 5 | (6 | ) | 289 | |||||||||||||
Equity securities available for sale | 345 | 276 | 81 | (12 | ) | 345 | |||||||||||||
Total | $ | 3,192 | $ | 3,126 | $ | 125 | $ | (59 | ) | $ | 3,192 | ||||||||
December 31, 2014 | |||||||||||||||||||
Carrying Value | Cost Basis | Unrealized Gains | Unrealized Losses | Fair Value | |||||||||||||||
(In millions) | |||||||||||||||||||
Fixed maturity investments available for sale: | |||||||||||||||||||
U.S. government and agencies | $ | 115 | $ | 112 | $ | 3 | $ | — | $ | 115 | |||||||||
States and political subdivisions | 948 | 917 | 31 | — | 948 | ||||||||||||||
Corporate debt securities | 1,820 | 1,793 | 37 | (10 | ) | 1,820 | |||||||||||||
Foreign government bonds | 37 | 40 | — | (3 | ) | 37 | |||||||||||||
Mortgage-backed/asset-backed securities | 105 | 101 | 4 | — | 105 | ||||||||||||||
Preferred stock available for sale | 223 | 223 | 3 | (3 | ) | 223 | |||||||||||||
Equity securities available for sale | 145 | 72 | 79 | (6 | ) | 145 | |||||||||||||
Total | $ | 3,393 | $ | 3,258 | $ | 157 | $ | (22 | ) | $ | 3,393 | ||||||||
The cost basis of fixed maturity securities available for sale includes an adjustment for amortized premium or discount since the date of purchase. At December 31, 2015 all of our mortgage-backed and asset-backed securities are rated AAA by Moody's Investors Service which is the highest rating available by Moody's. The mortgage-backed and asset-backed securities are made up of $49 million of agency mortgage-backed securities, $8 million of collateralized mortgage obligations, and $14 million in asset-backed securities.
The change in net unrealized gains and (losses) on fixed maturities for the years ended December 31, 2015, 2014, and 2013 was $(64) million, $(20) million, and $(58) million, respectively.
85
FIDELITY NATIONAL FINANCIAL, INC. AND SUBSIDIARIES
NOTES TO CONSOLIDATED FINANCIAL STATEMENTS — (continued)
The following table presents certain information regarding contractual maturities of our fixed maturity securities at December 31, 2015:
December 31, 2015 | |||||||||||||
Maturity | Amortized Cost | % of Total | Fair Value | % of Total | |||||||||
(Dollars in millions) | |||||||||||||
One year or less | $ | 405 | 15.8 | % | $ | 404 | 15.8 | % | |||||
After one year through five years | 1,829 | 71.4 | 1,828 | 71.5 | |||||||||
After five years through ten years | 232 | 9.1 | 229 | 8.9 | |||||||||
After ten years | 26 | 1.0 | 26 | 1.0 | |||||||||
Mortgage-backed/asset-backed securities | 68 | 2.7 | 71 | 2.8 | |||||||||
$ | 2,560 | 100.0 | % | $ | 2,558 | 100.0 | % | ||||||
Expected maturities may differ from contractual maturities because certain borrowers have the right to call or prepay obligations with or without call or prepayment penalties. Because of the potential for prepayment on mortgage-backed and asset-backed securities, they are not categorized by contractual maturity.
Fixed maturity securities valued at approximately $136 million and $141 million were on deposit with various governmental authorities at December 31, 2015 and 2014, respectively, as required by law.
Equity securities are carried at fair value. The change in unrealized gains on equity securities for the years ended December 31, 2015, 2014 and 2013 was a net (decrease) increase of $(4) million, $8 million, and $30 million, respectively.
Our investments at December 31, 2015 and 2014 included investments in banks at a cost basis of $382 million and $372 million, respectively, and a fair value of $382 million and $380 million, respectively. Our investments at December 31, 2015 and 2014 included investments in insurance companies at a cost basis of $9 million and $52 million, respectively, and a fair value of $10 million and $53 million, respectively.
Net unrealized losses on investment securities and the fair value of the related securities, aggregated by investment category and length of time that individual securities have been in a continuous unrealized loss position at December 31, 2015 and 2014 are as follows (in millions):
December 31, 2015 | |||||||||||||||||||||||
Less than 12 Months | 12 Months or Longer | Total | |||||||||||||||||||||
Fair Value | Unrealized Losses | Fair Value | Unrealized Losses | Fair Value | Unrealized Losses | ||||||||||||||||||
Corporate debt securities | 747 | (24 | ) | 20 | (4 | ) | 767 | (28 | ) | ||||||||||||||
Foreign government bonds | 106 | (13 | ) | — | — | 106 | (13 | ) | |||||||||||||||
Preferred stock available for sale | 140 | (4 | ) | 24 | (2 | ) | 164 | (6 | ) | ||||||||||||||
Equity securities available for sale | 92 | (12 | ) | — | — | 92 | (12 | ) | |||||||||||||||
Total temporarily impaired securities | $ | 1,085 | $ | (53 | ) | $ | 44 | $ | (6 | ) | $ | 1,129 | $ | (59 | ) | ||||||||
December 31, 2014 | |||||||||||||||||||||||
Less than 12 Months | 12 Months or Longer | Total | |||||||||||||||||||||
Fair Value | Unrealized Losses | Fair Value | Unrealized Losses | Fair Value | Unrealized Losses | ||||||||||||||||||
Corporate debt securities | 682 | (9 | ) | 17 | (1 | ) | 699 | (10 | ) | ||||||||||||||
Foreign government bonds | 21 | (1 | ) | 16 | (2 | ) | 37 | (3 | ) | ||||||||||||||
Preferred stock available for sale | 59 | (1 | ) | 19 | (2 | ) | 78 | (3 | ) | ||||||||||||||
Equity securities available for sale | 8 | (6 | ) | — | — | 8 | (6 | ) | |||||||||||||||
Total temporarily impaired securities | $ | 770 | $ | (17 | ) | $ | 52 | $ | (5 | ) | $ | 822 | $ | (22 | ) | ||||||||
86
FIDELITY NATIONAL FINANCIAL, INC. AND SUBSIDIARIES
NOTES TO CONSOLIDATED FINANCIAL STATEMENTS — (continued)
The unrealized losses for the corporate debt securities were primarily caused by widening credit spreads that we consider to be temporary rather than changes in credit quality. We expect to recover the entire amortized cost basis of our temporarily impaired fixed maturity securities as we do not intend to sell these securities and we do not believe that we will be required to sell the fixed maturity securities before recovery of the cost basis. For these reasons, we do not consider these securities other-than-temporarily impaired at December 31, 2015. It is reasonably possible that declines in fair value below cost not considered other-than-temporary in the current period could be considered to be other-than-temporary in a future period and earnings would be reduced to the extent of the impairment.
The unrealized losses for the equity securities available for sale were primarily caused by market volatility. We expect to recover the entire cost basis of our temporarily impaired equity securities available for sale as we do not intend to sell these securities and we do not believe that we will be required to sell the equity securities available for sale before recovery of the cost basis. For these reasons, we do not consider these securities other-than-temporarily impaired at December 31, 2015. It is reasonably possible that declines in fair value below cost not considered other-than-temporary in the current period could be considered to be other-than-temporary in a future period and earnings would be reduced to the extent of the impairment.
During the years ended December 31, 2015, 2014 and 2013 we incurred impairment charges relating to investments that were determined to be other-than-temporarily impaired, which resulted in impairment charges of $14 million, $6 million and $1 million, respectively. Impairment charges during all three years were for fixed maturity securities that we determined the credit risk of these holdings was high and the ability of the issuer to pay the full amount of the principal outstanding was unlikely. Impairment charges in the 2015 period also included an immaterial portion related to equity securities.
As of December 31, 2015, we held $2 million in securities for which other-than-temporary impairments had been previously recognized. As of December 31, 2014, we held $5 million investments for which an other-than-temporary impairment had been previously recognized. It is possible that future events may lead us to recognize potential future impairment losses related to our investment portfolio and that unanticipated future events may lead us to dispose of certain investment holdings and recognize the effects of any market movements in our consolidated financial statements.
87
FIDELITY NATIONAL FINANCIAL, INC. AND SUBSIDIARIES
NOTES TO CONSOLIDATED FINANCIAL STATEMENTS — (continued)
The following table presents realized gains and losses on investments and other assets and proceeds from the sale or maturity of investments and other assets for the years ended December 31, 2015, 2014, and 2013, respectively:
Year ended December 31, 2015 | ||||||||||||||||
Gross Realized Gains | Gross Realized Losses | Net Realized Gains (Losses) | Gross Proceeds from Sale/Maturity | |||||||||||||
(In millions) | ||||||||||||||||
Fixed maturity securities available for sale | $ | 14 | $ | (17 | ) | $ | (3 | ) | $ | 1,076 | ||||||
Preferred stock available for sale | 1 | — | 1 | 58 | ||||||||||||
Equity securities available for sale | 13 | (11 | ) | 2 | 51 | |||||||||||
Other assets | (13 | ) | — | |||||||||||||
Total | $ | (13 | ) | $ | 1,185 | |||||||||||
Year ended December 31, 2014 | ||||||||||||||||
Gross Realized Gains | Gross Realized Losses | Net Realized Gains (Losses) | Gross Proceeds from Sale/Maturity | |||||||||||||
(In millions) | ||||||||||||||||
Fixed maturity securities available for sale | $ | 6 | $ | (6 | ) | $ | — | $ | 1,152 | |||||||
Preferred stock available for sale | — | (2 | ) | (2 | ) | 73 | ||||||||||
Equity securities available for sale | 4 | — | 4 | 11 | ||||||||||||
Other long-term investments | — | — | ||||||||||||||
Other assets | (15 | ) | 5 | |||||||||||||
Total | $ | (13 | ) | $ | 1,241 | |||||||||||
Year ended December 31, 2013 | ||||||||||||||||
Gross Realized Gains | Gross Realized Losses | Net Realized Gains (Losses) | Gross Proceeds from Sale/Maturity | |||||||||||||
(In millions) | ||||||||||||||||
Fixed maturity securities available for sale | $ | 10 | $ | (4 | ) | $ | 6 | $ | 887 | |||||||
Preferred stock available for sale | 7 | (2 | ) | 5 | 121 | |||||||||||
Equity securities available for sale | 15 | (1 | ) | 14 | 43 | |||||||||||
Other long-term investments | (3 | ) | — | |||||||||||||
Other assets | (6 | ) | 1 | |||||||||||||
Total | $ | 16 | $ | 1,052 | ||||||||||||
Interest and investment income consists of the following:
Year Ended December 31, | |||||||||||
2015 | 2014 | 2013 | |||||||||
(In millions) | |||||||||||
Cash and cash equivalents | $ | — | $ | — | $ | 1 | |||||
Fixed maturity securities available for sale | 82 | 89 | 99 | ||||||||
Equity securities and preferred stock available for sale | 24 | 14 | 16 | ||||||||
Other | 16 | 23 | 11 | ||||||||
Total | $ | 123 | $ | 126 | $ | 127 | |||||
88
FIDELITY NATIONAL FINANCIAL, INC. AND SUBSIDIARIES
NOTES TO CONSOLIDATED FINANCIAL STATEMENTS — (continued)
Included in our other long-term investments in 2013 and into 2014 were fixed-maturity structured notes. The structured notes were carried at fair value (see Note C) and changes in the fair value of these structured notes are recorded as Realized gains and losses in the Consolidated Statements of Earnings. During the third quarter of 2014, all of our outstanding structured notes matured and we received $39 million in cash upon maturity. We held no structured notes as of December 31, 2015 or December 31, 2014. We recorded a gain of $1 million related to the structured notes in the year ended December 31, 2014, and a loss of $3 million related to the structured notes in 2013.
Investments in unconsolidated affiliates are recorded using the equity method of accounting and as of December 31, 2015 and 2014 consisted of the following (in millions):
Ownership at December 31, 2015 | 2015 | 2014 | ||||||||
Ceridian | 32 | % | $ | 358 | $ | 725 | ||||
Other | various | 163 | 45 | |||||||
Total | $ | 521 | $ | 770 | ||||||
On November 17, 2014, Ceridian completed the exchange of its subsidiary Comdata to FleetCor in a transaction valued at approximately $3.5 billion. We recognized $495 million in equity in earnings of unconsolidated affiliates in the twelve months ended December 31, 2014 as a result of the transaction.
During the year ended December 31, 2015, Ceridian sold a portion of its holdings of Fleetcor common stock. The sale resulted in increased distributions to us from Ceridian. During the year ended December 31, 2015 we received distributions from Ceridian of approximately $292 million. The distributions resulted in a corresponding decrease in our associated balance of Investments in unconsolidated affiliates.
During the year ended December 31, 2014, we sold $2 million of Ceridian bonds. We did not sell any Ceridian bonds in the year ended December 31, 2015. Our investment in Ceridian bonds had a fair value of $23 million and $32 million as of December 31, 2015 and 2014.
Prior to 2014 we accounted for our equity in Ceridian on a three-month lag. However, during the first quarter of 2014, we began to account for our equity in Ceridian on a real-time basis. The year ended December 31, 2014 includes results for the 15 months ended December 31, 2014. The Ceridian results from October 1, 2013 to December 31, 2013 resulted in recording $4 million in Equity in losses of unconsolidated affiliates. The year ended December 31, 2015 includes Ceridian's results for the 12 months ended December 31, 2015 and the year ended December 31, 2013 includes Ceridian's results for the 12 months ended September 30, 2013.
During the fourth quarter of 2013, Ceridian entered into a memorandum of understanding to resolve claims brought by a putative class of U.S. Fueling Merchants. Under the terms of the memorandum of understanding, which will need to be finalized in a definitive settlement agreement and approved by the Court, Ceridian has agreed to make a one-time cash payment of $100 million as part of a $130 million global settlement with other defendants in the lawsuit, and to provide certain prospective relief with respect to specific provisions in its merchant agreements. This settlement will provide Ceridian and affiliated companies with a broad release of claims and will limit their exposure to legal claims by merchants. Our portion of the settlement of $32 million was recorded by us in the first quarter of 2014, as at that time we reported the results of Ceridian on a three-month lag.
89
FIDELITY NATIONAL FINANCIAL, INC. AND SUBSIDIARIES
NOTES TO CONSOLIDATED FINANCIAL STATEMENTS — (continued)
Summarized financial information for the periods included in our Consolidated Financial Statements for Ceridian is presented below:
December 31, 2015 | December 31, 2014 | ||||||
(In millions) | |||||||
Total current assets before customer funds | $ | 442 | $ | 1,417 | |||
Customer funds | 4,333 | 4,957 | |||||
Goodwill and other intangible assets, net | 2,297 | 2,509 | |||||
Other assets | 135 | 92 | |||||
Total assets | $ | 7,207 | $ | 8,975 | |||
Current liabilities before customer obligations | $ | 243 | $ | 205 | |||
Customer obligations | 4,312 | 4,931 | |||||
Long-term obligations, less current portion | 1,162 | 1,168 | |||||
Other long-term liabilities | 351 | 391 | |||||
Total liabilities | 6,068 | 6,695 | |||||
Equity | 1,139 | 2,280 | |||||
Total liabilities and equity | $ | 7,207 | $ | 8,975 | |||
12 Months Ending December 31, 2015 | 15 Months Ending December 31, 2014 | ||||||
(In millions) | |||||||
Total revenues | $ | 773 | $ | 1,042 | |||
Loss before income taxes | (53 | ) | (76 | ) | |||
Gain on sale of Comdata | — | 1,526 | |||||
Net (loss) earnings | (88 | ) | 1,354 | ||||
Note E. | Property and Equipment |
Property and equipment consists of the following: | |||||||
Year Ended December 31, | |||||||
2015 | 2014 | ||||||
(In millions) | |||||||
Land | $ | 55 | $ | 132 | |||
Buildings | 147 | 158 | |||||
Leasehold improvements | 234 | 244 | |||||
Data processing equipment | 277 | 315 | |||||
Furniture, fixtures and equipment | 399 | 389 | |||||
1,112 | 1,238 | ||||||
Accumulated depreciation and amortization | (602 | ) | (603 | ) | |||
$ | 510 | $ | 635 | ||||
Depreciation expense on property and equipment was $120 million, $122 million, and $97 million for the years ended December 31, 2015, 2014, and 2013, respectively.
90
FIDELITY NATIONAL FINANCIAL, INC. AND SUBSIDIARIES
NOTES TO CONSOLIDATED FINANCIAL STATEMENTS — (continued)
Note F. | Goodwill |
Goodwill consists of the following:
Title | Black Knight | FNF Core Corporate and Other | Remy | Restaurant Group | FNFV Corporate and Other | Total | |||||||||||||||||||||
(In millions) | |||||||||||||||||||||||||||
Balance, December 31, 2013 | $ | 1,435 | $ | — | $ | 4 | $ | 248 | $ | 119 | $ | 95 | $ | 1,901 | |||||||||||||
Goodwill acquired during the year (1) | 854 | 2,223 | — | 14 | — | 6 | 3,097 | ||||||||||||||||||||
Adjustments to prior year acquisitions | — | — | (1 | ) | — | — | 1 | — | |||||||||||||||||||
Spin-off of Remy and Imaging | — | — | — | (262 | ) | — | (15 | ) | (277 | ) | |||||||||||||||||
Segment changes (2) | (40 | ) | — | 40 | — | — | — | — | |||||||||||||||||||
Balance, December 31, 2014 | $ | 2,249 | $ | 2,223 | $ | 43 | $ | — | $ | 119 | $ | 87 | $ | 4,721 | |||||||||||||
Goodwill acquired during the year | 66 | — | 5 | — | — | 9 | 80 | ||||||||||||||||||||
Adjustments to prior year acquisitions | (12 | ) | 1 | (3 | ) | — | — | 1 | (13 | ) | |||||||||||||||||
Sale of Cascade Timberlands | — | — | — | — | — | (12 | ) | (12 | ) | ||||||||||||||||||
Spin-off of J. Alexander's | — | — | — | — | (16 | ) | — | (16 | ) | ||||||||||||||||||
Balance, December 31, 2015 | $ | 2,303 | $ | 2,224 | $ | 45 | $ | — | $ | 103 | $ | 85 | $ | 4,760 | |||||||||||||
_____________________________________
(1) During 2014, we acquired LPS and subsequently completed an internal reorganization in which the assets of LPS were divided between the Title and Black Knight segments and Property Insight was contributed from the Title segment to Black Knight.
(2) During 2015, we reclassified Pacific Union International and other similar but smaller real estate service providers from the Title segment and into FNF Core Corporate & Other. See Note R for further discussion.
Note G. | Capitalized Software |
Capitalized software consists of the following:
Year Ended December 31, | |||||||
2015 | 2014 | ||||||
(In millions) | |||||||
Capitalized software | $ | 900 | $ | 841 | |||
Accumulated amortization | (347 | ) | (271 | ) | |||
$ | 553 | $ | 570 | ||||
Amortization expense on software was $83 million, $84 million, and $14 million for the years ended December 31, 2015, 2014, and 2013, respectively.
Note H. | Other Intangible Assets |
Other intangible assets consist of the following:
December 31, | |||||||
2015 | 2014 | ||||||
(In millions) | |||||||
Customer relationships and contracts | $ | 1,260 | $ | 1,200 | |||
Trademarks and tradenames | 135 | 154 | |||||
Other | 67 | 63 | |||||
1,462 | 1,417 | ||||||
Accumulated amortization | (493 | ) | (307 | ) | |||
$ | 969 | $ | 1,110 | ||||
Amortization expense for amortizable intangible assets, which consist primarily of customer relationships, was $193 million, $193 million, and $23 million for the years ended December 31, 2015, 2014 and 2013, respectively. Other intangible assets
91
FIDELITY NATIONAL FINANCIAL, INC. AND SUBSIDIARIES
NOTES TO CONSOLIDATED FINANCIAL STATEMENTS — (continued)
primarily represent non-amortizable intangible assets such as trademarks and licenses. Estimated amortization expense for the next five years for assets owned at December 31, 2015, is $163 million in 2016, $159 million in 2017, $156 million in 2018, $153 million in 2019 and $117 million in 2020.
Note I. | Accounts Payable and Other Accrued Liabilities |
Accounts payable and other accrued liabilities consist of the following:
December 31, | |||||||
2015 | 2014 | ||||||
(In millions) | |||||||
Accrued benefits | $ | 252 | $ | 264 | |||
Salaries and incentives | 319 | 292 | |||||
Accrued rent | 34 | 36 | |||||
Trade accounts payable | 68 | 81 | |||||
Accrued recording fees and transfer taxes | 12 | 50 | |||||
Accrued premium taxes | 21 | 11 | |||||
Deferred revenue | 215 | 164 | |||||
Other accrued liabilities | 362 | 410 | |||||
$ | 1,283 | $ | 1,308 | ||||
Note J. | Notes Payable |
Notes payable consists of the following:
December 31, | ||||||||
2015 | 2014 | |||||||
(In millions) | ||||||||
Unsecured notes, net of discount, interest payable semi-annually at 5.50%, due September 2022 | $ | 397 | $ | 395 | ||||
Unsecured convertible notes, net of discount, interest payable semi-annually at 4.25%, due August 2018 | 288 | 284 | ||||||
Unsecured notes, net of discount, interest payable semi-annually at 6.60%, due May 2017 | 300 | 299 | ||||||
FNF Term Loan, interest payable monthly at LIBOR + 1.63% | — | 1,094 | ||||||
Revolving Credit Facility, unsecured, unused portion of $800 at December 31, 2015, due July 2018 with interest payable monthly at LIBOR + 1.45% | (5 | ) | (7 | ) | ||||
Unsecured Black Knight Infoserv notes, including premium, interest payable semi-annually at 5.75%, due April 2023 | 402 | 616 | ||||||
Black Knight Term A Facility, due May 27, 2020 with interest currently payable monthly at LIBOR + 2.00% (2.44% at December 31, 2015) | 771 | — | ||||||
Black Knight Term B Facility, due May 27, 2022 with interest currently payable quarterly at LIBOR + 3.00% (3.75% at December 31, 2015) | 343 | — | ||||||
Black Knight Revolving Credit Facility, unused portion of $300, due May 27, 2020 with interest currently payable monthly at LIBOR + 2.00% (2.44% at December 31, 2015) | 95 | — | ||||||
ABRH Term Loan, interest payable monthly at LIBOR + 2.50% (2.92% at December 31, 2015), due August 2019 | 100 | 106 | ||||||
ABRH Revolving Credit Facility, unused portion of $85 at December 31, 2015, due August 2019 with interest payable monthly at LIBOR + 2.50% | — | — | ||||||
Digital Insurance Revolving Credit Facility, unused portion $26 at December 31, 2015, due March 31, 2020 with interest payable monthly at LIBOR + 2.50% - 3.50% (3.80% at December 31, 2015) | 99 | — | ||||||
Other | 3 | 16 | ||||||
$ | 2,793 | $ | 2,803 | |||||
92
FIDELITY NATIONAL FINANCIAL, INC. AND SUBSIDIARIES
NOTES TO CONSOLIDATED FINANCIAL STATEMENTS — (continued)
At December 31, 2015, the estimated fair value of our long-term debt was approximately $3,162 million or $337 million higher than its carrying value, excluding unamortized debt issuance costs. The fair value of our unsecured notes payable was $1,728 million as of December 31, 2015. The fair values of our unsecured notes payable are based on established market prices for the securities on December 31, 2015 and are considered Level 2 financial liabilities. The carrying value of the Black Knight Term A, Term B, and Revolving Credit facilities; the ABRH term loan; and the Digital Insurance revolving credit facility approximate fair value at December 31, 2015, as they are variable rate instruments with short reset periods (either monthly or quarterly) which reflect current market rates. The revolving credit facilities are considered Level 2 financial liabilities.
On May 27, 2015, BKIS entered into a credit and guaranty agreement (the “BKIS Credit Agreement”) with an aggregate borrowing capacity of $1.6 billion with JPMorgan Chase Bank, N.A. as administrative agent, the guarantors party thereto, the other agent's party thereto and the lenders party thereto. The BKIS Credit Agreement provides for (i) an $800 million term loan A facility (the “Term A Facility”), (ii) a $400 million term loan B facility (the “Term B Facility”) and (iii) a $400 million revolving credit facility (the “Revolving Credit Facility”, and collectively with the Term A Facility and Term B Facility, the “Facilities”). The loans under the Term A Facility and the Revolving Credit Facility mature on May 27, 2020 and the loans under the Term B Facility mature on May 27, 2022. The Facilities are guaranteed by substantially all of BKIS’s wholly-owned domestic restricted subsidiaries and Black Knight Financial Services, LLC, a Delaware limited liability company and the direct parent company of BKIS (“Holdings”), and are secured by associated collateral agreements which pledge a lien on virtually all of the BKIS’s assets, including fixed assets and intangibles, and the assets of the guarantors. The Term A Facility and the Revolving Credit Facility bear interest at rates based upon, at the option of BKIS, either (i) the base rate plus a margin of between 50 and 125 basis points depending on the total leverage ratio of Holdings and its restricted subsidiaries on a consolidated basis (the “Consolidated Leverage Ratio”) and (ii) the Eurodollar rate plus a margin of between 150 and 225 basis points depending on the Consolidated Leverage Ratio. Until the delivery of the initial financial statements under the BKIS Credit Agreement, the Term A Facility and the Revolving Credit Facility bear interest, at the option of BKIS, at either (i) the base rate plus a margin of 125 basis points or (ii) the Eurodollar rate plus a margin of 225 basis points. The Term B Facility bears interest at rates based upon, at the option of BKIS, either (i) the base rate plus a margin of 175 or 200 basis points depending on the Consolidated Leverage Ratio and (ii) the Eurodollar rate plus a margin of 275 or 300 basis points depending on the Consolidated Leverage Ratio; subject to a Eurodollar rate floor of 75 basis points. Until the delivery of the initial financial statements under the BKIS Credit Agreement, the Term B Facility bears interest, at the option of BKIS, at either (i) the base rate plus a margin of 200 basis points or (ii) the Eurodollar rate plus a margin of 300 basis points. In addition, BKIS will pay an unused commitment fee of between 25 and 35 basis points on the undrawn commitments under the Revolving Credit Facility, also depending on the Consolidated Leverage Ratio. As of December 31, 2015 BKIS had aggregate outstanding debt of $1,259 million under the BKIS Credit Agreement, net of debt issuance costs. As of December 31, 2015 we hold approximately$50 million of the outstanding Term B notes which eliminate in consolidation.
On March 31, 2015, Digital Insurance, entered into a senior secured credit facility (the “Digital Insurance Facility”) with Bank of America, N.A. (“Bank of America”) as Administrative Agent, JPMorgan Chase Bank, N.A. as Syndication Agent, and the other financial institutions party thereto. The Digital Insurance Facility provides for a maximum revolving loan of up to$120 million with a maturity date of March 31, 2020. The Digital Insurance Facility is guaranteed by Digital Insurance Holdings, Inc. (“DIH”) and each subsidiary of Digital Insurance (together with DIH, the “Loan Parties”) and secured by (i) a lien on all equity interests in Digital Insurance and each of its present and future subsidiaries, (ii) all property and assets of Digital Insurance and (iii) all proceeds and products of the property described in (i) and (ii) above. Pricing under the Digital Insurance Facility is based on an applicable margin between 250 and 350 basis points over LIBOR and between 150 and 250 basis points over the Base Rate (which is the highest of (a) 50 basis points in excess of the federal funds rate, (b) the Bank of America “prime rate” and (c) 100 basis points in excess of the one month LIBOR adjusted daily rate). A commitment fee amount is also due at a rate per annum equal to between 25 and 40 basis points on the actual daily unused portions of the Digital Insurance Facility. The Digital Insurance Facility also allows Digital Insurance to request up to $15 million in letters of credit commitments and $10 million in swingline debt from Bank of America. The Digital Insurance Facility allows Digital Insurance to elect to increase the amount of revolving commitments by up to $40 million so long as (i) no default or event of default exists under the Digital Insurance Facility at the time of such request and (ii) Digital Insurance is in compliance with its financial covenants on a pro forma basis after giving effect to such request. The Digital Insurance facility is subject to affirmative, negative and financial covenants customary for financings of this type, including, among other things, limits on Digital Insurance’s creation of liens, incurrence of indebtedness, dispositions of assets, restricted payments and transactions with affiliates. The Digital Insurance Facility includes customary events of default for facilities of this type, which include a cross-default provision whereby an event of default will be deemed to have occurred if any Loan Party fails to make any payment when due in respect of any indebtedness having a principal amount of $7.5 million or more or otherwise defaults under such indebtedness and such default results in a right by the lender to accelerate such Loan Party’s obligations. As of December 31, 2015, Digital Insurance had outstanding debt of $99 million under the Digital Insurance Facility, net of debt issuance costs.
On August 19, 2014, ABRH entered into a credit agreement (the “ABRH Credit Facility”) with Wells Fargo Bank, National Association as Administrative Agent, Swingline Lender and Issuing Lender (the “ABRH Administrative Agent”), Bank of America,
93
FIDELITY NATIONAL FINANCIAL, INC. AND SUBSIDIARIES
NOTES TO CONSOLIDATED FINANCIAL STATEMENTS — (continued)
N.A. as Syndication Agent and the other financial institutions party thereto. The ABRH Credit Facility provides for a maximum revolving loan of $100 million (the “ABRH Revolver") with a maturity date of August 19, 2019. As of December 31, 2014, ABRH has nothing outstanding on this revolver. Additionally, the ABRH Credit Facility provides for a maximum term loan (the "ABRH Term Loan") of $110 million with quarterly installment repayments through June 30, 2019 and a maturity date of August 19, 2019 for the outstanding unpaid principal balance and all accrued and unpaid interest. ABRH has borrowed the entire $110 million under this term loan. Pricing for the ABRH Credit Facility is based on an applicable margin between 225 basis points to 300 basis points over LIBOR and between 125 basis points and 200 basis points over the Base Rate (which is the highest of (a) 50 basis points in excess of the federal funds rate, (b) the ABRH Administrative Agent “prime rate,” or (c) the sum of 100 basis points plus one-month LIBOR). A commitment fee amount is also due at a rate per annum equal to between 325 and 400 basis points on the average daily unused portion of the commitments under the ABRH Revolver. The ABRH Credit Facility also allows for ABRH to request up to $40 million of letters of credit commitments and $20 million in swingline debt from the ABRH Administrative Agent. The ABRH Credit Facility allows for ABRH to elect to enter into incremental term loans or request incremental revolving commitments (the “ABRH Incremental Loans”) under this facility so long as, (i) the total outstanding balance of the ABRH Revolver, the ABRH Term Loan and any ABRH Incremental Loans does not exceed $250 million , (ii) ABRH is in compliance with its financial covenants, (iii) no default or event of default exists under the ABRH Credit Facility on the day of such request either before or after giving effect to the request, (iv) the representations and warranties made under the ABRH Credit Facility are correct and (v) certain other conditions are satisfied. The ABRH Credit Facility is subject to affirmative, negative and financial covenants customary for financings of this type, including, among other things, limits on ABRH's creation of liens, sales of assets, incurrence of indebtedness, restricted payments and transactions with affiliates. The covenants addressing restricted payments include certain limitations on the declaration or payment of dividends by ABRH to its parent, Fidelity Newport Holdings, LLC (“FNH”), and by FNH to its members. One such limitation restricts the amount of dividends that ABRH can pay to its parent (and that FNH can in turn pay to its members) up to $2 million in the aggregate (outside of certain other permitted dividend payments) in a fiscal year (with some carryover rights for undeclared dividends for subsequent years). Another limitation allows that, so long as ABRH satisfies certain leverage and liquidity requirements to the satisfaction of the ABRH Administrative Agent, ABRH may declare a special one-time dividend to Newport Global Opportunities Fund LP, and Fidelity National Financial Ventures, LLC or one of the entities under their control (other than portfolio companies) in an amount up to $75 million if such dividend occurs on or before November 17, 2014, or up to $1.5 million if such dividend occurs on or before June 15, 2016. The ABRH Credit Facility includes customary events of default for facilities of this type (with customary grace periods, as applicable), which include a cross-default provision whereby an event of default will be deemed to have occurred if ABRH or any of its guarantors, which consists of FNH and certain of its subsidiaries (together, the “Loan Parties”) or any of their subsidiaries default on any agreement with a third party of $10 million or more related to their indebtedness and such default results in a right by such third party to accelerate such Loan Party's or its subsidiary's obligations. The ABRH Credit Facility provides that, upon the occurrence of an event of default, the ABRH Administrative Lender may (i) declare the principal of, and any and all accrued and unpaid interest and all other amounts owed in respect of, the loans immediately due and payable, (ii) terminate loan commitments and (iii) exercise all other rights and remedies available to the ABRH Administrative Lender or the lenders under the loan documents. ABRH had $15 million of outstanding letters of credit and $85 million of remaining borrowing capacity under its revolving credit facility as of December 31, 2015.
On January 2, 2014, as a result of the LPS acquisition, FNF acquired $600 million aggregate principal amount of 5.75% Senior Notes due in 2023, initially issued by BKIS on October 12, 2012 (the "Black Knight Senior Notes"). The Black Knight Senior Notes were registered under the Securities Act of 1933, as amended, carry an interest rate of 5.75% and will mature on April 15, 2023. Interest is payable semi-annually on the 15th day of April and October. The Black Knight Senior Notes are senior unsecured obligations and were guaranteed by us as of January 2, 2014. Prior to October 15, 2017, BKIS may redeem some or all of the Black Knight Senior Notes by paying a “make-whole” premium based on U.S. Treasury rates. On or after October 15, 2017, BKIS may redeem some or all of the Black Knight Senior Notes at the redemption prices described in the Black Knight Senior Notes indenture, plus accrued and unpaid interest. In addition, if a change of control occurs, BKIS is required to offer to purchase all outstanding Black Knight Senior Notes at a price equal to 101% of the principal amount plus accrued and unpaid interest, if any, to the date of purchase (subject to the right of holders of record on the relevant record date to receive interest due on the relevant interest payment date).The Black Knight Senior Notes contain covenants that, among other things, limit BKIS's ability and the ability of certain of its subsidiaries (a) to incur or guarantee additional indebtedness or issue preferred stock, (b) to make certain restricted payments, including dividends or distributions on equity interests held by persons other than BKIS or certain subsidiaries, in excess of an amount generally equal to 50% of consolidated net income generated since July 1, 2008, (c) to create or incur certain liens, (d) to engage in sale and leaseback transactions, (e) to create restrictions that would prevent or limit the ability of certain subsidiaries to (i) pay dividends or other distributions to BKIS or certain other subsidiaries, (ii) repay any debt or make any loans or advances to BKIS or certain other subsidiaries or (iii) transfer any property or assets to BKIS or certain other subsidiaries, (f) to sell or dispose of assets of BKIS or any restricted subsidiary or enter into merger or consolidation transactions and (g) to engage in certain transactions with affiliates. As a result of our guarantee of the Black Knight Senior Notes on January
94
FIDELITY NATIONAL FINANCIAL, INC. AND SUBSIDIARIES
NOTES TO CONSOLIDATED FINANCIAL STATEMENTS — (continued)
2, 2014, the notes became rated investment grade. The indenture provides that certain covenants are suspended while the Black Knight Senior Notes are rated investment grade. Currently covenants (a), (b), (e), certain provisions of (f) and (g) outlined above are suspended. These covenants will continue to be suspended as long as the notes are rated investment grade, as defined in the indenture. These covenants are subject to a number of exceptions, limitations and qualifications in the Black Knight Senior Notes indenture. The Black Knight Senior Notes contain customary events of default, including failure of BKIS (i) to pay principal and interest when due and payable and breach of certain other covenants and (ii) to make an offer to purchase and pay for the Black Knight Senior Notes tendered as required by the Black Knight Senior Notes. Events of default also include defaults with respect to any other debt of BKIS or debt of certain subsidiaries having an outstanding principal amount of $80 million or more in the aggregate for all such debt, arising from (i) failure to make a principal payment when due and such defaulted payment is not made, waived or extended within the applicable grace period or (ii) the occurrence of an event which results in such debt being due and payable prior to its scheduled maturity. Upon the occurrence of an event of default (other than a bankruptcy default with respect to BKIS or certain subsidiaries), the trustee or holders of at least 25% of the Black Knight Senior Notes then outstanding may accelerate the Black Knight Senior Notes by giving us appropriate notice. If, however, a bankruptcy default occurs with respect to BKIS or certain subsidiaries, then the principal of and accrued interest on the Black Knight Senior Notes then outstanding will accelerate immediately without any declaration or other act on the part of the trustee or any holder. On January 16, 2014, we issued an offer to purchase the Black Knight Senior Notes pursuant to the change of control provisions above at a purchase price of 101% of the principal amount plus accrued interest to the purchase date. The offer expired on February 18, 2014. As a result of the offer, bondholders tendered $5 million in principal of the Black Knight Senior Notes, which were subsequently purchased by us on February 24, 2014. On May 29, 2015, Black Knight completed a redemption of $205 million in aggregate principal of its Black Knight Senior Notes at a price of 105.75% under the note feature allowing redemption using proceeds from an equity offering.
On October 24, 2013, we entered into a bridge loan commitment letter (the “Bridge Loan Commitment Letter”) with Merrill Lynch, Pierce, Fenner & Smith Incorporated, Bank of America, N.A. (“Bank of America”), J.P. Morgan Securities LLC and JP Morgan Chase Bank, N.A. The Bridge Loan Commitment Letter provides for up to an $800 million short-term loan facility (the “Bridge Facility”). The proceeds of the loans under the Bridge Facility were used to fund, in part, the cash consideration for the acquisition of LPS and pay certain costs, fees and expenses in connection with the LPS merger. Pursuant to the Bridge Loan Commitment Letter, we executed a promissory note in favor of the Bridge Facility lenders on the closing date of the Merger that evidenced the terms of the Bridge Facility. The Bridge Facility matured on the second business day following the funding thereof and required scheduled amortization payments. Borrowings under the Bridge Facility bear interest at a rate equal to the highest of (i) the Bank of America prime rate, (ii) the federal fund effective rate from time to time plus 0.5% and (iii) the one month adjusted London interbank offered rate ("LIBOR") plus 1.0%. Other than as set forth in this paragraph, the terms of the Bridge Facility are substantially the same as the terms of the Amended Term Loan Agreement discussed below. As part of the acquisition of LPS on January 2, 2014, the Bridge Facility was funded and subsequently repaid the following day.
On July 11, 2013, FNF entered into a term loan credit agreement with Bank of America, N.A., as administrative agent (in such capacity, the “TL Administrative Agent”), the lenders party thereto and the other agents party thereto (the “Term Loan Agreement”). The Term Loan Agreement permits us to borrow up to $1.1 billion to fund the acquisition of LPS. The term loans under the Term Loan Agreement mature on the date that is five years from the funding date of the term loans under the Term Loan Agreement. Term loans under the Term Loan Agreement generally bear interest at a variable rate based on either (i) the base rate (which is the highest of (a) 0.5% in excess of the federal funds rate, (b) the TL Administrative Agent’s “prime rate”, or (c) the sum of 1.0% plus one-month LIBOR) plus a margin of between 50 basis points and 100 basis points depending on the senior unsecured long-term debt ratings of FNF or (ii) LIBOR plus a margin of between 150 basis points and 200 basis points depending on the senior unsecured long-term debt ratings of FNF. Based on our current Moody’s and Standard & Poor’s senior unsecured long-term debt ratings of Baa3/BBB-, respectively, the applicable margin for term loans subject to LIBOR is 175 basis points over LIBOR. In addition, we will pay an unused commitment fee of 25 basis points on the entire term loan facility until the earlier of the termination of the term loan commitments or the funding of the term loans. Under the Term Loan Agreement, we are subject to customary affirmative, negative and financial covenants, including, among other things, limits on the creation of liens, limits on the incurrence of indebtedness, restrictions on investments, dispositions and transactions with affiliates, limitations on dividends and other restricted payments, a minimum net worth and a maximum debt to capitalization ratio. The Term Loan Agreement also includes customary events of default for facilities of this type (with customary grace periods, as applicable) and provides that, if an event of default occurs and is continuing, the interest rate on all outstanding obligations may be increased, payments of all outstanding term loans may be accelerated and/or the lenders’ commitments may be terminated. In addition, upon the occurrence of certain insolvency or bankruptcy related events of default, all amounts payable under the Term Loan Agreement shall automatically become immediately due and payable, and the lenders’ commitments will automatically terminate. Under the Term Loan Agreement the financial covenants are the same as under the Restated Credit Agreement. On October 27, 2013, we amended the Term Loan Agreement to permit us to incur the indebtedness in respect of the Bridge Facility and incorporate other technical changes to describe the structure of the LPS merger. As part of the acquisition of LPS on January 2, 2014, the Term Loan Agreement
95
FIDELITY NATIONAL FINANCIAL, INC. AND SUBSIDIARIES
NOTES TO CONSOLIDATED FINANCIAL STATEMENTS — (continued)
was fully funded. In May 2015 we repaid the entire $1.1 billion outstanding balance of the term loans outstanding under the Term Loan Agreement.
On June 25, 2013, we entered into an agreement to amend and restate our existing $800 million Second Amended and Restated Credit Agreement (the “Existing Credit Agreement”), dated as of April 16, 2012 with Bank of America, N.A., as administrative agent (in such capacity, the “Administrative Agent”) and the other agents party thereto (the “Revolving Credit Facility”). Among other changes, the Revolving Credit Facility amended the Existing Credit Agreement to permit us to make a borrowing under the Revolving Credit Facility to finance a portion of the acquisition of LPS on a “limited conditionality” basis, incorporates other technical changes to permit us to enter into the Acquisition and extends the maturity of the Existing Credit Agreement. The lenders under the Existing Credit Agreement have agreed to extend the maturity date of their commitments under the credit facility from April 16, 2016 to July 15, 2018 under the Revolving Credit Facility. Revolving loans under the credit facility generally bear interest at a variable rate based on either (i) the base rate (which is the highest of (a) 0.5% in excess of the federal funds rate, (b) the Administrative Agent's “prime rate”, or (c) the sum of 1% plus one-month LIBOR) plus a margin of between 32.5 and 60 basis points depending on the senior unsecured long-term debt ratings of FNF or (ii) LIBOR plus a margin of between 132.5 and 160 basis points depending on the senior unsecured long-term debt ratings of FNF. Based on our current Moody’s and Standard & Poor’s senior unsecured long-term debt ratings of Baa3/BBB-, respectively, the applicable margin for revolving loans subject to LIBOR is 145 basis points. In addition, we pay a facility fee of between 17.5 and 40 basis points on the entire facility, also depending on our senior unsecured long-term debt ratings. Under the Revolving Credit Facility, we are subject to customary affirmative, negative and financial covenants, including, among other things, limits on the creation of liens, limits on the incurrence of indebtedness, restrictions on investments, dispositions and transactions with affiliates, limitations on dividends and other restricted payments, a minimum net worth and a maximum debt to capitalization ratio. The Revolving Credit Facility also includes customary events of default for facilities of this type (with customary grace periods, as applicable) and provides that, if an event of default occurs and is continuing, the interest rate on all outstanding obligations may be increased, payments of all outstanding loans may be accelerated and/or the lenders' commitments may be terminated. These events of default include a cross-default provision that, subject to limited exceptions, permits the lenders to declare the Revolving Credit Facility in default if: (i) (a) we fail to make any payment after the applicable grace period under any indebtedness with a principal amount (including undrawn committed amounts) in excess of 3.0% of our net worth, as defined in the Revolving Credit Facility, or (b) we fail to perform any other term under any such indebtedness, or any other event occurs, as a result of which the holders thereof may cause it to become due and payable prior to its maturity; or (ii) certain termination events occur under significant interest rate, equity or other swap contracts. In addition, upon the occurrence of certain insolvency or bankruptcy related events of default, all amounts payable under the Revolving Credit Facility shall automatically become immediately due and payable, and the lenders' commitments will automatically terminate. Under the Revolving Credit Facility the financial covenants remain essentially the same as under the Old Credit Agreement, except that the total debt to total capitalization ratio limit of 35% increased to 37.5% for a period of one year after the closing of the LPS acquisition and the net worth test was reset. As of December 31, 2015 and 2014, there was no outstanding balance under the Revolving Credit Facility and $5 million and $7 million, respectively, in unamortized debt issuance costs.
On August 28, 2012, we completed an offering of $400 million in aggregate principal amount of 5.50% notes due September 2022 (the "5.50% notes"), pursuant to an effective registration statement previously filed with the Securities and Exchange Commission. The notes were priced at 99.513% of par to yield 5.564% annual interest. As such we recorded a discount of $2 million, which is netted against the $400 million aggregate principal amount of the 5.50% notes. The discount is amortized to September 2022 when the 5.50% notes mature. The 5.50% notes will pay interest semi-annually on the 1st of March and September, beginning March 1, 2013. We received net proceeds of $396 million, after expenses, which were used to repay the $237 million aggregate principal amount outstanding of our 5.25% unsecured notes maturing in March 2013, the $50 million outstanding on our revolving credit facility, and the remainder is being held for general corporate purposes. These notes contain customary covenants and events of default for investment grade public debt. These events of default include a cross default provision, with respect to any other debt of the Company in an aggregate amount exceeding $100 million for all such debt, arising from (i) failure to make a principal payment when due or (ii) the occurrence of an event which results in such debt being due and payable prior to its scheduled maturity.
On August 2, 2011, we completed an offering of $300 million in aggregate principal amount of 4.25% convertible senior notes due August 2018 (the "Notes") in an offering conducted in accordance with Rule 144A under the Securities Act of 1933, as amended. The Notes contain customary event-of-default provisions which, subject to certain notice and cure-period conditions, can result in the acceleration of the principal amount of, and accrued interest on, all outstanding Notes if we breach the terms of the Notes or the indenture pursuant to which the Notes were issued. The Notes are unsecured and unsubordinated obligations and (i) rank senior in right of payment to any of our existing or future unsecured indebtedness that is expressly subordinated in right of payment to the Notes; (ii) rank equal in right of payment to our existing and future unsecured indebtedness that is not so subordinated; (iii) are effectively subordinated in right of payment to any of our secured indebtedness to the extent of the value of the assets securing such indebtedness; and (iv) are structurally subordinated to all existing and future indebtedness and liabilities
96
FIDELITY NATIONAL FINANCIAL, INC. AND SUBSIDIARIES
NOTES TO CONSOLIDATED FINANCIAL STATEMENTS — (continued)
of our subsidiaries. Interest is payable on the principal amount of the Notes, semi-annually in arrears in cash on February 15 and August 15 of each year, commencing February 15, 2012. The Notes mature on August 15, 2018, unless earlier purchased by us or converted. The Notes were issued for cash at 100% of their principal amount. However, for financial reporting purposes, the notes were deemed to have been issued at 92.818% of par value, and as such we recorded a discount of $22 million to be amortized to August 2018, when the Notes mature. The Notes will be convertible into cash, shares of common stock, or a combination of cash and shares of common stock, at our election, based on an initial conversion rate, subject to adjustment, of 46.387 shares per $1,000 principal amount of the Notes (which represents an initial conversion price of approximately $21.56 per share), only in the following circumstances and to the following extent: (i) during any calendar quarter commencing after December 31, 2011, if, for each of at least 20 trading days (whether or not consecutive) during the 30 consecutive trading day period ending on, and including, the last trading day of the immediately preceding calendar quarter, the last reported sale price per share of our common stock on such trading day is greater than or equal to 130% of the applicable conversion price on such trading day; (ii) during the five consecutive business day period immediately following any ten consecutive trading day period (the “measurement period”) in which, for each trading day of the measurement period, the trading price per $1,000 principal amount of notes was less than 98% of the product of the last reported sale price per share of our common stock on such trading day and the applicable conversion rate on such trading day; (iii) upon the occurrence of specified corporate transactions; or (iv) at any time on and after May 15, 2018. However, in all cases, the Notes will cease to be convertible at the close of business on the second scheduled trading day immediately preceding the maturity date. It is our intent and policy to settle conversions through “net-share settlement”. Generally, under “net-share settlement,” the conversion value is settled in cash, up to the principal amount being converted, and the conversion value in excess of the principal amount is settled in shares of our common stock. As of October 1, 2013, these notes were convertible under the 130% Sale Price Condition described above. On March 28, 2014, $42 thousand in principal of these bonds were converted at the election of the bondholder. These bonds had a fair value of $65 thousand. The conversion was completed in the second quarter of 2014.
On May 5, 2010, we completed an offering of $300 million in aggregate principal amount of our 6.60% notes due May 2017 (the "6.60% Notes"), pursuant to an effective registration statement previously filed with the Securities and Exchange Commission. The 6.60% Notes were priced at 99.897% of par to yield 6.61% annual interest. We received net proceeds of $297 million, after expenses, which were used to repay outstanding borrowings under our credit agreement. Interest is payable semi-annually. These notes contain customary covenants and events of default for investment grade public debt. These events of default include a cross default provision, with respect to any other debt of FNF in an aggregate amount exceeding $100 million for all such debt, arising from (i) failure to make a principal payment when due or (ii) the occurrence of an event which results in such debt being due and payable prior to its scheduled maturity.
Gross principal maturities of notes payable at December 31, 2015 are as follows (in millions): | |||
2016 | $ | 53 | |
2017 | 372 | ||
2018 | 395 | ||
2019 | 179 | ||
2020 | 704 | ||
Thereafter | 1,118 | ||
$ | 2,821 | ||
97
FIDELITY NATIONAL FINANCIAL, INC. AND SUBSIDIARIES
NOTES TO CONSOLIDATED FINANCIAL STATEMENTS — (continued)
Note K. | Income Taxes |
Income tax expense on continuing operations consists of the following:
Year Ended December 31, | |||||||||||
2015 | 2014 | 2013 | |||||||||
(In millions) | |||||||||||
Current | $ | 374 | $ | 113 | $ | 128 | |||||
Deferred | (84 | ) | 199 | 67 | |||||||
$ | 290 | $ | 312 | $ | 195 | ||||||
Total income tax expense (benefit) was allocated as follows (in millions):
Year Ended December 31, | |||||||||||
2015 | 2014 | 2013 | |||||||||
Net earnings from continuing operations | $ | 290 | $ | 312 | $ | 195 | |||||
Tax expense (benefit) attributable to net earnings from discontinued operations | — | (1 | ) | 4 | |||||||
Other comprehensive earnings (loss): | |||||||||||
Unrealized loss on investments and other financial instruments | (40 | ) | (6 | ) | (30 | ) | |||||
Unrealized loss on foreign currency translation and cash flow hedging | (7 | ) | (3 | ) | (2 | ) | |||||
Reclassification adjustment for change in unrealized gains and losses included in net earnings | — | — | 3 | ||||||||
Minimum pension liability adjustment | 3 | (6 | ) | 13 | |||||||
Total income tax benefit allocated to other comprehensive earnings | (44 | ) | (15 | ) | (16 | ) | |||||
Additional paid-in capital, stock-based compensation | (21 | ) | (16 | ) | (17 | ) | |||||
Total income taxes | $ | 225 | $ | 280 | $ | 166 | |||||
A reconciliation of the federal statutory rate to our effective tax rate is as follows:
Year Ended December 31, | ||||||||
2015 | 2014 | 2013 | ||||||
Federal statutory rate | 35.0 | % | 35.0 | % | 35.0 | % | ||
State income taxes, net of federal benefit | 3.0 | 3.5 | 2.9 | |||||
Deductible dividends paid to FNF 401(k) plan | (0.2 | ) | (0.4 | ) | (0.2 | ) | ||
Tax exempt interest income | (0.7 | ) | (2.0 | ) | (1.4 | ) | ||
Tax Credits | (1.0 | ) | (2.5 | ) | (1.4 | ) | ||
Consolidated Partnerships | (0.5 | ) | 5.8 | (0.4 | ) | |||
Non-deductible expenses and other, net | (1.1 | ) | (2.9 | ) | (1.0 | ) | ||
Effective tax rate excluding equity investments | 34.5 | % | 36.5 | % | 33.5 | % | ||
Equity Investments | (1.1 | ) | 43.2 | (1.8 | ) | |||
Effective tax rate | 33.4 | % | 79.7 | % | 31.7 | % | ||
98
FIDELITY NATIONAL FINANCIAL, INC. AND SUBSIDIARIES
NOTES TO CONSOLIDATED FINANCIAL STATEMENTS — (continued)
The significant components of deferred tax assets and liabilities at December 31, 2015 and 2014 consist of the following:
December 31, | |||||||
2015 | 2014 | ||||||
(In millions) | |||||||
Deferred Tax Assets: | |||||||
Employee benefit accruals | $ | 37 | $ | 35 | |||
Other investments | 14 | — | |||||
Net operating loss carryforwards | 30 | 29 | |||||
Insurance reserve discounting | — | 17 | |||||
Accrued liabilities | 20 | 11 | |||||
Allowance for uncollectible accounts received | 2 | — | |||||
Pension plan | 7 | 7 | |||||
Tax credits | 43 | 44 | |||||
State income taxes | 17 | 7 | |||||
Other | 3 | — | |||||
Total gross deferred tax asset | 173 | 150 | |||||
Less: valuation allowance | 12 | 11 | |||||
Total deferred tax asset | $ | 161 | $ | 139 | |||
Deferred Tax Liabilities: | |||||||
Title plant | $ | (84 | ) | $ | (83 | ) | |
Amortization of goodwill and intangible assets | (118 | ) | (108 | ) | |||
Other investments | — | (83 | ) | ||||
Other | (17 | ) | (29 | ) | |||
Investment securities | (29 | ) | (53 | ) | |||
Depreciation | (11 | ) | (5 | ) | |||
Partnerships | (459 | ) | (474 | ) | |||
Insurance reserve discounting | (37 | ) | — | ||||
Allowance for uncollectible accounts received | — | (7 | ) | ||||
Total deferred tax liability | $ | (755 | ) | $ | (842 | ) | |
Net deferred tax liability | $ | (594 | ) | $ | (703 | ) | |
Our net deferred tax liability was $594 million and $703 million at December 31, 2015, and 2014, respectively. The significant changes in the deferred taxes are as follows: The deferred tax asset related to Other Investments increased by $97 million mainly due to recognition of tax gains recorded on our investment in Ceridian. The deferred tax liability for insurance reserve discounting increased by $54 million largely due to a reclassification of $28 million between other of $(18) million and allowance for uncollected accounts received of $(10) million. The $26 million increase in other related to current year activity in the claims reserves. The deferred tax liability for investment securities decreased by $24 million due to book changes in unrealized gains. The deferred tax liability relating to partnerships decreased by $11 million primarily due Black Knight and ServiceLink activity. The deferred tax liability on amortization increased by $10 million partially due to the Pacific Union acquisition.
As of December 31, 2015 and 2014 we had a valuation allowance of $12 million and $11 million, respectively. The increase of $1 million relates to net operating losses associated with the BPG acquisition.
At December 31, 2015, we have net operating losses on a pretax basis of $79 million available to carryforward and offset future federal taxable income. The net operating losses are US federal net operating losses arising from LandAmerica, Digital Insurance, NextAce, LPS, BPG and Black Knight Financial Services, Inc. acquisitions made since 2008 and are subject to an annual Internal Revenue Code Section 382 limitation. These losses will begin to expire in year 2023 and we fully anticipate utilizing these losses prior to expiration with the exception of $3 million of gross net operating losses at BPG that are offset by a $1 million valuation allowance. Digital Insurance has a deferred tax asset for state net operating losses; however, it is largely offset by a $1 million valuation allowance.
99
FIDELITY NATIONAL FINANCIAL, INC. AND SUBSIDIARIES
NOTES TO CONSOLIDATED FINANCIAL STATEMENTS — (continued)
At December 31, 2015 and 2014, we had $43 million and $44 million of tax credits, respectively. The credits primarily consist of general business credits from acquisitions in the Restaurant Group. We anticipate that these credits will be utilized prior to expiration after a valuation allowance of $10 million on the general business credits.
Tax benefits of $21 million, $16 million, and $17 million associated with the exercise of employee stock options and the vesting of restricted stock grants were allocated to equity for the years ended December 31, 2015, 2014, and 2013, respectively.
As of December 31, 2015 and 2014, we had approximately $3 million (including interest of less than $1 million) and $5 million (including interest of $1 million), respectively, of total gross unrecognized tax benefits that, if recognized, would favorably affect our income tax rate. These amounts are reported on a gross basis and do not reflect a federal tax benefit on state income taxes. We record interest and penalties related to income taxes as a component of income tax expense.
The Internal Revenue Service (“IRS”) has selected us to participate in the Compliance Assurance Program that is a real-time audit. We are currently under audit by the Internal Revenue Service for the 2013, 2014, 2015 and 2016 tax years. We file income tax returns in various foreign and US state jurisdictions.
Note L. | Summary of Reserve for Claim Losses |
A summary of the reserve for claim losses follows:
Year Ended December 31, | |||||||||||
2015 | 2014 | 2013 | |||||||||
(Dollars in millions) | |||||||||||
Beginning balance | $ | 1,621 | $ | 1,636 | $ | 1,748 | |||||
Reserve assumed, net (1) | — | 52 | — | ||||||||
Reinsurance recoverable | 1 | 7 | — | ||||||||
Claim loss provision related to: | |||||||||||
Current year | 224 | 202 | 220 | ||||||||
Prior years | 22 | 26 | 71 | ||||||||
Total title claim loss provision | 246 | 228 | 291 | ||||||||
Claims paid, net of recoupments related to: | |||||||||||
Current year | (7 | ) | (5 | ) | (9 | ) | |||||
Prior years | (278 | ) | (297 | ) | (394 | ) | |||||
Total title claims paid, net of recoupments | (285 | ) | (302 | ) | (403 | ) | |||||
Ending balance of claim loss reserve for title insurance | $ | 1,583 | $ | 1,621 | $ | 1,636 | |||||
Provision for title insurance claim losses as a percentage of title insurance premiums | 5.7 | % | 6.2 | % | 7.0 | % | |||||
_____________________________________
(1) | Reserves of $54 million were acquired in the acquisition of LPS on January 2, 2014, and a reserve of $2 million was released due to the sale of a small title operation in 2014. |
We continually update loss reserve estimates as new information becomes known, new loss patterns emerge, or as other contributing factors are considered and incorporated into the analysis of reserve for claim losses. Estimating future title loss payments is difficult because of the complex nature of title claims, the long periods of time over which claims are paid, significantly varying dollar amounts of individual claims and other factors. Due to the uncertainty inherent in the process and to the judgment used by management, the ultimate liability may be greater or less than our current reserves. As a result of continued volatility experienced in claim development on policy years 2005 - 2008, we believe there is an increased level of uncertainty attributable to these policy years. If actual claims loss development varies from what is currently expected and is not offset by other factors, it is possible that our recorded reserves may fall outside a reasonable range of our actuary's central estimate, which may require additional reserve adjustments in future periods.
Note M. | Commitments and Contingencies |
Legal and Regulatory Contingencies
In the ordinary course of business, we are involved in various pending and threatened litigation matters related to our title operations, some of which include claims for punitive or exemplary damages. This customary litigation includes but is not limited to a wide variety of cases arising out of or related to title and escrow claims, for which we make provisions through our loss reserves. Additionally, like other insurance companies, our ordinary course litigation includes a number of class action and purported
100
FIDELITY NATIONAL FINANCIAL, INC. AND SUBSIDIARIES
NOTES TO CONSOLIDATED FINANCIAL STATEMENTS — (continued)
class action lawsuits, which make allegations related to aspects of our insurance operations. We believe that no actions, other than the matters discussed below, depart from customary litigation incidental to our insurance business.
Our Restaurant Group companies are a defendant from time to time in various legal proceedings arising in the ordinary course of business, including claims relating to injury or wrongful death under “dram shop” laws that allow a person to sue us based on any injury caused by an intoxicated person who was wrongfully served alcoholic beverages at one of the restaurants; individual and purported class or collective action claims alleging violation of federal and state employment, franchise and other laws; and claims from guests or employees alleging illness, injury or other food quality, health or operational concerns. These companies are also subject to compliance with extensive government laws and regulations related to employment practices and policies and the manufacture, preparation, and sale of food and alcohol.
We review lawsuits and other legal and regulatory matters (collectively “legal proceedings”) on an ongoing basis when making accrual and disclosure decisions. When assessing reasonably possible and probable outcomes, management bases its decision on its assessment of the ultimate outcome assuming all appeals have been exhausted. For legal proceedings where it has been determined that a loss is both probable and reasonably estimable, a liability based on known facts and which represents our best estimate has been recorded. Our accrual for legal and regulatory matters was $75 million and $95 million as of December 31, 2015 and December 31, 2014. Of this accrual, $67 million and $84 million relates to historical LPS matters as of December 31, 2015 and 2014, respectively. As discussed elsewhere, LPS was acquired on January 2, 2014. None of the amounts we have currently recorded are considered to be individually or in the aggregate material to our financial condition. Actual losses may materially differ from the amounts recorded and the ultimate outcome of our pending cases is generally not yet determinable. While some of these matters could be material to our operating results or cash flows for any particular period if an unfavorable outcome results, at present we do not believe that the ultimate resolution of currently pending legal proceedings, either individually or in the aggregate, will have a material adverse effect on our financial condition.
Following a review by the Board of Governors of the Federal Reserve System, the Federal Deposit Insurance Corporation, the Office of the Comptroller of the Currency and the Office of Thrift Supervision (collectively, the “banking agencies”), Lender Processing Services, Inc. (“LPS”) entered into a consent order (the “Order”) dated April 13, 2011 with the banking agencies. The banking agencies’ review of LPS’s services included the services provided by LPS’s default operations to mortgage servicers regulated by the banking agencies, including document execution services. The Order does not make any findings of fact or conclusions of wrongdoing, nor did LPS admit any fault or liability. Under the Order, LPS agreed to further study the issues identified in the review and to enhance LPS’s compliance, internal audit, risk management and board oversight plans with respect to those businesses. LPS also agreed to engage an independent third party to conduct a risk assessment and review of LPS’s default management businesses and the document execution services it provided to mortgage servicers from January 1, 2008 through December 31, 2010.
The document execution review by the independent third party has been on indefinite hold since June 30, 2013 while the banking agencies consider what, if any, additional review work they would like the independent third party to undertake. Accordingly, the document execution review has taken and will continue to take longer to complete than the Company originally anticipated. In addition, the LPS default operations that were subject to the Order were contributed to ServiceLink Holdings, LLC (“ServiceLink”) in connection with the LPS Acquisition and Reorganization. To the extent such review, once completed, requires additional remediation of mortgage documents or identifies any financial injury from the document execution services LPS provided, ServiceLink (as a result of the contribution of the underlying LPS business) has agreed to implement an appropriate plan to address the issues. The Order contains various deadlines to accomplish the undertakings set forth therein, including the preparation of a remediation plan following the completion of the document execution review. ServiceLink will continue to make periodic reports to the banking agencies on the progress with respect to each of the undertakings in the Order. Although the Order does not include any fine or other monetary penalty, the banking agencies reserved their right to impose civil monetary penalties at any time. Based on discussions with the banking agencies and actions taken by the banking agencies with respect to other companies, the Company believes the likelihood that the banking agencies will assess a civil monetary penalty is both probable and reasonably estimable, and ServiceLink Holdings, LLC has included an estimate of such loss in its accrual for loss contingencies. The banking agencies notified ServiceLink in December 2015 that they wish to discuss terminating the Order through a possible agreed civil monetary penalty amount in lieu of requiring any additional document execution review by the independent third party. At this time, the parties have not agreed on a possible civil monetary penalty amount. The Company does not believe an adjustment to the amount already accrued in loss contingencies is warranted based upon discussions thus far. The parties have entered into a tolling agreement to allow the parties to engage in these discussions. This matter is subject to a Cross-Indemnity Agreement dated December 22, 2014, between Black Knight Financial Services, LLC and ServiceLink Holdings, LLC.
From time to time we receive inquiries and requests for information from state insurance departments, attorneys general and other regulatory agencies about various matters relating to our business. Sometimes these take the form of civil investigative demands or subpoenas. We cooperate with all such inquiries and we have responded to or are currently responding to inquiries from multiple governmental agencies. Also, regulators and courts have been dealing with issues arising from foreclosures and
101
FIDELITY NATIONAL FINANCIAL, INC. AND SUBSIDIARIES
NOTES TO CONSOLIDATED FINANCIAL STATEMENTS — (continued)
related processes and documentation. Various governmental entities are studying the title insurance product, market, pricing, and business practices, and potential regulatory and legislative changes, which may materially affect our business and operations. From time to time, we are assessed fines for violations of regulations or other matters or enter into settlements with such authorities which may require us to pay fines or claims or take other actions.
Escrow Balances
In conducting our operations, we routinely hold customers’ assets in escrow, pending completion of real estate transactions. Certain of these amounts are maintained in segregated bank accounts and have not been included in the accompanying Consolidated Balance Sheets. We have a contingent liability relating to proper disposition of these balances for our customers, which amounted to $14.3 billion at December 31, 2015. As a result of holding these customers’ assets in escrow, we have ongoing programs for realizing economic benefits during the year through favorable borrowing and vendor arrangements with various banks. There were no investments or loans outstanding as of December 31, 2015 and 2014 related to these arrangements.
Operating Leases
Future minimum operating lease payments are as follows (in millions): | |||
2016 | $ | 272 | |
2017 | 176 | ||
2018 | 145 | ||
2019 | 115 | ||
2020 | 83 | ||
Thereafter | 251 | ||
Total future minimum operating lease payments | $ | 1,042 | |
Rent expense incurred under operating leases during the years ended December 31, 2015, 2014 and 2013 was $136 million, $130 million, and $194 million, respectively. Rent expense in 2015, 2014, and 2013 includes abandoned lease charges related to office closures of $1 million, $4 million, and $1 million, respectively.
On June 29, 2004 we entered into an off-balance sheet financing arrangement (commonly referred to as a “synthetic lease”). The owner/lessor in this arrangement acquired land and various real property improvements associated with new construction of an office building in Jacksonville, Florida, that are part of FNF’s corporate campus and headquarters. The lessor financed the acquisition of the facilities through funding provided by third-party financial institutions. On June 27, 2011, we renewed and amended the synthetic lease for the facilities. The amended lease provides for a five year term ending June 27, 2016 and had an outstanding balance as of December 31, 2015 of $71 million. The amended lease includes guarantees by us of up to 83.0% of the outstanding lease balance, and options to purchase the facilities at the outstanding lease balance. The guarantee becomes effective if we decline to purchase the facilities at the end of the lease and also decline to renew the lease. We are currently in the process of exploring our options for purchasing the facilities or renewing the lease, but have not finalized our plans. The lessor is a third-party company and we have no affiliation or relationship with the lessor or any of its employees, directors or affiliates, and transactions with the lessor are limited to the operating lease agreements and the associated rent expense that have been included in Other operating expenses in the Consolidated Statements of Earnings. We do not believe the lessor is a variable interest entity, as defined in the FASB standard on consolidation of variable interest entities.
Unconditional Purchase Obligations
The Restaurant Group has unconditional purchase obligations with various vendors. These purchase obligations are primarily food and beverage obligations with fixed commitments in regards to the time period of the contract and the quantities purchased with annual price adjustments that can fluctuate. We used both historical and projected volume and pricing as of December 31, 2015 to determine the amount of the obligations. Black Knight has data processing and maintenance commitments with various vendors. We used current outstanding contracts with the vendors to determine the amount of the obligations.
102
FIDELITY NATIONAL FINANCIAL, INC. AND SUBSIDIARIES
NOTES TO CONSOLIDATED FINANCIAL STATEMENTS — (continued)
Purchase obligations as of December 31, 2015 are as follows (in millions):
2016 | $ | 215 | |
2017 | 60 | ||
2018 | 44 | ||
2019 | 14 | ||
2020 | 6 | ||
Thereafter | — | ||
Total purchase commitments | $ | 339 | |
Note N. Regulation and Equity
Regulation
Our insurance subsidiaries, including title insurers, underwritten title companies and insurance agencies, are subject to extensive regulation under applicable state laws. Each of the insurance underwriters is subject to a holding company act in its state of domicile which regulates, among other matters, the ability to pay dividends and enter into transactions with affiliates. The laws of most states in which we transact business establish supervisory agencies with broad administrative powers relating to issuing and revoking licenses to transact business, regulating trade practices, licensing agents, approving policy forms, accounting practices, financial practices, establishing reserve and capital and surplus as regards policyholders (“capital and surplus”) requirements, defining suitable investments for reserves and capital and surplus and approving rate schedules. The process of state regulation of changes in rates ranges from states which set rates, to states where individual companies or associations of companies prepare rate filings which are submitted for approval, to a few states in which rate changes do not need to be filed for approval.
Since we are governed by both state and federal governments and the applicable insurance laws and regulations are constantly subject to change, it is not possible to predict the potential effects on our insurance operations, particularly the Title segment, of any laws or regulations that may become more restrictive in the future or if new restrictive laws will be enacted.
Pursuant to statutory accounting requirements of the various states in which our insurers are domiciled, these insurers must defer a portion of premiums earned as an unearned premium reserve for the protection of policyholders and must maintain qualified assets in an amount equal to the statutory requirements. The level of unearned premium reserve required to be maintained at any time is determined by statutory formula based upon either the age, number of policies and dollar amount of policy liabilities underwritten, or the age and dollar amount of statutory premiums written. As of December 31, 2015, the combined statutory unearned premium reserve required and reported for our title insurers was $1,728 million. In addition to statutory unearned premium reserves, each of our insurers maintains reserves for known claims and surplus funds for policyholder protection and business operations.
Each of our insurance subsidiaries is regulated by the insurance regulatory authority in its respective state of domicile, as well as that of each state in which it is licensed. The insurance commissioners of their respective states of domicile are the primary regulators of our title insurance subsidiaries. Each of the insurers is subject to periodic regulatory financial examination by regulatory authorities.
Our insurance subsidiaries are subject to regulations that restrict their ability to pay dividends or make other distributions of cash or property to their immediate parent company without prior approval from the Department of Insurance of their respective states of domicile. As of December 31, 2015, $2,049 million of our net assets are restricted from dividend payments without prior approval from the Departments of Insurance. During 2016, our title insurers can pay or make distributions to us of approximately $334 million, without prior approval.
The combined statutory capital and surplus of our title insurers was approximately $1,412 million and $1,472 million as of December 31, 2015 and 2014, respectively. The combined statutory net earnings (losses) of our title insurance subsidiaries were $381 million, $276 million, and $352 million for the years ended December 31, 2015, 2014, and 2013, respectively.
Statutory-basis financial statements are prepared in accordance with accounting practices prescribed or permitted by the various state insurance regulatory authorities. The National Association of Insurance Commissioners' (“NAIC”) Accounting Practices and Procedures manual (“NAIC SAP”) has been adopted as a component of prescribed or permitted practices by each of the states that regulate us. Each of our states of domicile for our title insurance underwriter subsidiaries have adopted a material prescribed accounting practice that differs from that found in NAIC SAP. Specifically, in both years the timing of amounts released from the statutory unearned premium reserve under NAIC SAP differs from the states' required practice. Statutory surplus at December 31, 2015 and 2014, respectively, was lower by approximately $206 million and $212 million than if we had reported such amounts in accordance with NAIC SAP.
103
As a condition to continued authority to underwrite policies in the states in which our insurers conduct their business, the insurers are required to pay certain fees and file information regarding their officers, directors and financial condition. In addition, our escrow and trust business is subject to regulation by various state banking authorities.
Pursuant to statutory requirements of the various states in which our insurers are domiciled, such insurers must maintain certain levels of minimum capital and surplus. Required levels of minimum capital and surplus are not significant to the insurers individually or in the aggregate. Each of our insurers has complied with the minimum statutory requirements as of December 31, 2015.
Our underwritten title companies are also subject to certain regulation by insurance regulatory or banking authorities, primarily relating to minimum net worth. Minimum net worth requirements for each underwritten title company is less than $1 million. These companies were in compliance with their respective minimum net worth requirements at December 31, 2015.
There are no restrictions on our retained earnings regarding our ability to pay dividends to shareholders although there are limits on the ability of certain subsidiaries to pay dividends to us, as described above.
Equity
On September 16, 2015, J. Alexander's and FNF entered into a Separation and Distribution Agreement, pursuant to which FNF agreed to distribute one hundred percent (100%) of its shares of J. Alexander's common stock, on a pro rata basis, to the holders of FNFV common stock. Holders of FNFV common stock received, as a distribution from FNF, approximately 0.17272 shares of J. Alexander’s common stock for every one share of FNFV common stock held at the close of business on September 22, 2015, the record date for the distribution (the “Distribution”). The Distribution was made on September 28, 2015. As a result of the Distribution, J. Alexander's is now an independent public company and its common stock is listed under the symbol “JAX” on the New York Stock Exchange. The Distribution was generally tax-free to FNFV shareholders for U.S. federal income tax purposes, except to the extent of any cash received in lieu of J. Alexander's fractional shares.
On May 26, 2015, Black Knight closed its initial public offering ("IPO") of 20,700,000 shares of Class A common stock at a price to the public of $24.50 per share, which included 2,700,000 shares of Class A common stock issued upon the exercise in full of the underwriters' option to purchase additional shares. Black Knight received net proceeds of $475 million from the offering, after deduction of underwriter discount and expenses. In connection with the IPO, Black Knight amended and restated its certificate of incorporation to authorize the issuance of two classes of common stock, Class A common stock and Class B common stock, which will generally vote together as a single class on all matters submitted for a vote to stockholders. As a result, Black Knight issued shares of Class B common stock to us, and certain Thomas H. Lee Partners affiliates, as the holders of membership interests in Black Knight Financial Services, LLC ("BKFS, LLC") prior to the IPO. Class B common stock is not publicly traded and does not entitle the holders thereof to any of the economic rights, including rights to dividends and distributions upon liquidation that would be provided to holders of Class A common stock. Prior to the IPO, we owned 67% of the membership interests in BKFS, LLC. Following the IPO, we owned 55% of the outstanding shares of Black Knight in the form of Class B common stock, with a corresponding ownership interest in BKFS, LLC.
On March 20, 2015, we completed our tender offer to purchase shares of FNFV stock. As a result of the offer, we accepted for purchase 12,333,333 shares of FNFV Group Common Stock for a purchase price of $15.00 per common share, for a total aggregate cost of $185 million, excluding fees and expenses related to the tender offer.
On October 28, 2014, our Board of Directors approved a three-year stock purchase program, effective November 6, 2014, under which we can repurchase up to 10 million shares of our FNFV Group common stock through November 30, 2017. We may make repurchases from time to time in the open market, in block purchases or in privately negotiated transactions, depending on market conditions and other factors. In the year ended December 31, 2015, we repurchased a total of 8,187,382 shares for $106 million, or an average of $12.95 per share under this program. Subsequent to year-end we repurchased a total of 1,143,900 shares for $11 million, or an average of $9.71 per share under this program through market close on February 19, 2016. Since the original commencement of the plan adopted November 6, 2014, we have repurchased a total of 9,447,382 shares for $119 million, or an average of $12.57 per share, and there are 552,618 shares available to be repurchased under this program through market close on February 19, 2016. On February 18, 2016, our Board of Directors approved a new FNFV Group three-year stock repurchase program, effective March 1, 2016, under which we may repurchase up to 15 million shares of FNFV Group common stock. Purchases may be made from time to time by us in the open market at prevailing market prices or in privately negotiated transactions through February 28, 2019.
On June 30, 2014, we completed the recapitalization of Old FNF common stock into two tracking stocks, FNF Group common stock and FNFV Group common stock. We issued 277,462,875 shares of FNF Group common stock and 91,711,237 shares of FNFV Group common stock. See Note A for further discussion on the recapitalization of FNF common stock.
104
On January 2, 2014, we completed the purchase of LPS. As part of the consideration, $839 million or 25,920,078 shares of Old FNF common stock was issued to LPS shareholders. See Note B of the Notes to Consolidated Financial Statements for further information on the acquisition of LPS.
On July 21, 2012, our Board of Directors approved a three-year stock repurchase program, effective August 1, 2012, under which we can repurchase up to 15 million shares of our FNF Group common stock through July 31, 2015. On July 20, 2015, our Board of Directors approved a new three-year stock repurchase program under which we can purchase up to 25 million shares through July 30, 2018. We may make repurchases from time to time in the open market, in block purchases or in privately negotiated transactions, depending on market conditions and other factors. In the year ended December 31, 2015, we repurchased a total 5,875,000 FNF Group shares under these programs for $214 million, or an average price of $36.41 per share. Subsequent to year-end we repurchased a total of 500,000 shares for $17 million, or an average of $33.19 per share under this program through market on February 19, 2016. Since the original commencement of the plan adopted July 21, 2012, we have repurchased a total of 3,380,000 FNF common shares for $98 million, or an average of $28.97 per share, and there are no shares available to be repurchased under this program. Since the original commencement of the plan adopted July 20, 2015, we have repurchased a total of 5,075,000 FNF common shares for $182 million, or an average of $35.92 per share, and there are 19,925,000 shares available to be repurchased under this program.
Note O. | Employee Benefit Plans |
Stock Purchase Plan
During the three-year period ended December 31, 2015, our eligible employees could voluntarily participate in employee stock purchase plans (“ESPPs”) sponsored by us and our subsidiaries. Pursuant to the ESPPs, employees may contribute an amount between 3% and 15% of their base salary and certain commissions. We contribute varying amounts as specified in the ESPPs.
We contributed $21 million, $18 million, and $17 million to the ESPPs in the years ended December 31, 2015, 2014, and 2013, respectively, in accordance with the employer’s matching contribution.
401(k) Profit Sharing Plan
During the three-year period ended December 31, 2015, we have offered our employees the opportunity to participate in our 401(k) profit sharing plans (the “401(k) Plan”), qualified voluntary contributory savings plans which are available to substantially all of our employees. Eligible employees may contribute up to 40% of their pretax annual compensation, up to the amount allowed pursuant to the Internal Revenue Code. Beginning in 2012, we initiated an employer match on the 401(k) Plan whereby we matched $0.25 on each $1.00 contributed up to the first 6% of eligible earnings contributed to the 401(k) Plan. Effective April 1, 2013, we increased the employer match from $0.25 to $0.375 on each $1.00 contributed up to the first 6% of eligible earnings contributed to the 401 (k) Plan. On June 30, 2014, we completed the recapitalization of Old FNF common stock into two tracking stocks, FNF Group common stock and FNFV Group common stock. Participants in the FNF 401(k) Plan received one share of FNF Group Common Stock and 0.3333 of a share of FNFV Group Common Stock for each share of Old FNF common stock that they held at the close of business on June 30, 2014. The employer match for the years ended December 31, 2015, 2014 and 2013 was $28 million, $25 million and $17 million, respectively, that was credited to the FNF Stock Fund in the FNF 401(k) Plan, through July 1, 2014. Subsequent to July 1, 2014, the employer match has been credited based on the participant's individual investment elections.
Stock Option Plans
In 2005, we established the FNT 2005 Omnibus Incentive Plan (the “Omnibus Plan”) authorizing the issuance of up to 8 million shares of common stock, subject to the terms of the Omnibus Plan. On October 23, 2006, the shareholders of FNF approved an amendment to increase the number of shares available for issuance under the Omnibus Plan by 16 million shares. The increase was in part to provide capacity for options and restricted stock to be issued to replace Old FNF options and restricted stock. On May 29, 2008, May 25, 2011 and May 22, 2013, the shareholders of FNF approved amendments to increase the number of shares for issuance under the Omnibus Plan by 11 million, 6 million, and 6 million shares, respectively. The primary purpose of the increase was to assure that we had adequate means to provide equity incentive compensation to our employees on a going-forward basis. The Omnibus Plan provides for the grant of stock options, stock appreciation rights, restricted stock, restricted stock units and performance shares, performance units, other cash and stock-based awards and dividend equivalents. As of December 31, 2015, there were 1,391,874 shares of restricted stock and 9,300,509 stock options outstanding under this plan. Awards granted are approved by the Compensation Committee of the Board of Directors. Options vest over a 3 year period and have a contractual life of 7 years. The exercise price for options granted equals the market price of the underlying stock on the grant date. Stock option grants vest according to certain time based and operating performance criteria. Option exercises by participants are settled on the open market.
On June 30, 2014, we completed the recapitalization of FNF common stock into two tracking stocks, FNF Group common stock and FNFV Group common stock. Each share of the previously outstanding FNF Class A common stock ("Old FNF common stock") was converted into one share of FNF Group common stock, which now trades on the New York Stock Exchange under
105
the current trading symbol "FNF," and 0.3333 of a share of FNFV Group common stock. All participants in the stock option and restricted stock plans at the time of the recapitalization were granted a one-time grant of additional FNF Group options and restricted shares. The grant was made in order for each participant to maintain their current intrinsic value in the plan. This one-time grant did not result in any additional compensation for the employees participating in the plan. Awards granted are determined and approved by the Compensation Committee of the Board of Directors.
FNF Group stock option transactions under the Omnibus Plan for 2013, 2014, and 2015 are as follows:
Options | Weighted Average Exercise Price | Exercisable | |||||||
Balance, December 31, 2012 | 8,967,074 | $ | 16.27 | 8,147,381 | |||||
Granted | 3,712,416 | 27.90 | |||||||
Exercised | (3,267,937 | ) | 18.28 | ||||||
Canceled | (52,813 | ) | 22.59 | ||||||
Balance, December 31, 2013 | 9,358,740 | $ | 20.15 | 5,180,504 | |||||
Granted | 1,112,133 | 29.80 | |||||||
Options granted for FNFV recapitalization | 1,346,302 | 17.86 | |||||||
Exercised | (2,418,713 | ) | 15.80 | ||||||
Canceled | (5,251 | ) | 23.85 | ||||||
Balance, December 31, 2014 | 9,393,211 | $ | 19.43 | 5,173,802 | |||||
Granted | 1,886,320 | 34.84 | |||||||
Exercised | (1,966,937 | ) | 12.96 | ||||||
Canceled | (12,085 | ) | 26.62 | ||||||
Balance, December 31, 2015 | 9,300,509 | $ | 23.92 | 5,256,426 | |||||
FNF Group restricted stock transactions under the Omnibus Plan in 2013, 2014, and 2015 are as follows:
Shares | Weighted Average Grant Date Fair Value | |||||
Balance, December 31, 2012 | 2,924,738 | $ | 18.46 | |||
Granted | 650,728 | 27.90 | ||||
Canceled | (8,116 | ) | 17.44 | |||
Vested | (1,654,278 | ) | 17.30 | |||
Balance, December 31, 2013 | 1,913,072 | $ | 22.68 | |||
Granted | 785,705 | 29.80 | ||||
Restricted shares granted for FNFV recapitalization | 363,392 | 28.46 | ||||
Canceled | (4,656 | ) | 21.29 | |||
Vested | (1,286,732 | ) | 17.33 | |||
Balance, December 31, 2014 | 1,770,781 | $ | 25.08 | |||
Granted | 613,960 | 34.84 | ||||
Canceled | (10,105 | ) | 26.14 | |||
Vested | (982,762 | ) | 23.00 | |||
Balance, December 31, 2015 | 1,391,874 | $ | 30.85 | |||
106
FNFV restricted stock transactions under the Omnibus Plan in 2014 and 2015 are as follows:
Shares | Weighted Average Grant Date Fair Value | |||||
Balance, December 31, 2013 | — | $ | — | |||
Granted | 1,233,333 | 14.69 | ||||
Canceled | — | — | ||||
Vested | — | — | ||||
Balance, December 31, 2014 | 1,233,333 | $ | 14.69 | |||
Granted | — | — | ||||
Canceled | (31,746 | ) | 14.69 | |||
Vested | (411,109 | ) | 14.69 | |||
Balance, December 31, 2015 | 790,478 | $ | 14.69 | |||
The following table summarizes information related to stock options outstanding and exercisable as of December 31, 2015:
Options Outstanding | Options Exercisable | ||||||||||||||||||||||||
Weighted | Weighted | ||||||||||||||||||||||||
Average | Weighted | Average | Weighted | ||||||||||||||||||||||
Remaining | Average | Remaining | Average | ||||||||||||||||||||||
Range of | Number of | Contractual | Exercise | Intrinsic | Number of | Contractual | Exercise | Intrinsic | |||||||||||||||||
Exercise Prices | Options | Life | Price | Value | Options | Life | Price | Value | |||||||||||||||||
(In millions) | (In millions) | ||||||||||||||||||||||||
$0.00 — $6.16 | 1,100,006 | 0.82 | $ | 6.16 | $ | 31 | 1,100,006 | 0.82 | $ | 6.16 | $ | 31 | |||||||||||||
$6.17 — $12.22 | 453,856 | 0.90 | 12.22 | 10 | 453,856 | 0.90 | 12.22 | 10 | |||||||||||||||||
$12.23 — $15.76 | 28,537 | 0.20 | 15.76 | 1 | 28,537 | 0.20 | 15.76 | 1 | |||||||||||||||||
$15.77 — $18.17 | 28,547 | 0.42 | 18.17 | — | 28,547 | 0.42 | 18.17 | — | |||||||||||||||||
$18.18 — $21.90 | 705,212 | 3.86 | 19.62 | 11 | 705,212 | 3.86 | 19.62 | 11 | |||||||||||||||||
$21.91 — $24.24 | 4,009,334 | 4.90 | 24.24 | 42 | 2,589,192 | 4.90 | 24.24 | 27 | |||||||||||||||||
$24.25 — $34.84 | 2,975,017 | 6.47 | 33.00 | 5 | 351,076 | 5.85 | 29.80 | 2 | |||||||||||||||||
9,300,509 | $ | 100 | 5,256,426 | $ | 82 | ||||||||||||||||||||
We account for stock-based compensation plans in accordance with GAAP on share-based payments, which requires that compensation cost relating to share-based payments be recognized in the consolidated financial statements based on the fair value of each award. Using the fair value method of accounting, compensation cost is measured based on the fair value of the award at the grant date and recognized over the service period. Net earnings attributable to FNF Shareholders reflects stock-based compensation expense amounts of $56 million for the year ended December 31, 2015, $51 million for the year ended December 31, 2014, and $35 million for the year ended December 31, 2013, which are included in personnel costs in the reported financial results of each period.
The risk free interest rates used in the calculation of compensation cost on stock options are the rates that correspond to the weighted average expected life of an option. The volatility was estimated based on the historical volatility of FNF’s stock price over a term equal to the weighted average expected life of the options. For options granted in the years ended December 31, 2015, 2014, and 2013, we used risk free interest rates of 1.4%, 1.5%, and 1.1%, respectively; volatility factors for the expected market price of the common stock of 22%, 24%, and 26%, respectively; expected dividend yields of 2.4%, 2.6%, and 2.6%, respectively; and weighted average expected lives of 4.6 years, 4.6 years, and 4.4 years, respectively. The weighted average fair value of each option granted in the years ended December 31, 2015, 2014, and 2013, were $5.15, $4.81, and $4.67, respectively.
At December 31, 2015, the total unrecognized compensation cost related to non-vested stock option grants and restricted stock grants is $67 million, which is expected to be recognized in pre-tax income over a weighted average period of 1.59 years.
107
Profits Interests Plan
As of December 31, 2015 there were 11 million profits interests outstanding in ServiceLink and no profits interest outstanding in Black Knight. As of December 31, 2014, there were 11 million profits interest outstanding in both ServiceLink and Black Knight. The profits interests were issued to certain members of management, directors, and certain employees, and vest over 3 years, with 50% vesting after the second year and 50% vesting after the third year. The terms of the profits interest grants provide for the grantees to participate in any incremental value of Black Knight and ServiceLink in excess of its fair value at the date of grant in proportion to the Class A member unit holders participation in the same. The fair values of Black Knight and ServiceLink at the date of grant is otherwise known as the hurdle amount. Profits interests granted are determined and approved by the Compensation Committee of the Board of Directors. Once vested, Class B units are not subject to expiration. The Class B units may be settled under various scenarios. According to the terms of the Profits Interest Plan (or the “Plan”) and depending on the scenario, the Class B units may be settled in shares of FNF Group common stock or cash at our election. The profits interest in Black Knight were converted to restricted stock units upon their IPO in the current year.
The profits interest holders have an option to put their profits interests to us if no public offering of the corresponding businesses has been consummated after four years from the date of grant. The units may be settled in cash or FNF Group common stock or a combination of both at our election and will be settled at the current fair value at the time we receive notice of the put election. The fair value will be determined by the parties or by a third party appraisal under the terms of the Plan. As the profits interests provide for redemption features not solely within our control, we classify the redemption value outside of permanent equity in redeemable noncontrolling interests. The redemption value is equal to the difference in the per unit fair value of the underlying member units and the hurdle amount, based upon the proportionate required service period rendered to date.
We account for the profits interests granted to employees and directors in accordance with GAAP on share-based payments, which requires that compensation cost relating to share-based payments made to employees and directors be recognized in the consolidated financial statements based on the fair value of each award. Using the fair value method of accounting, compensation cost is measured based on the fair value of the award at the grant date and recognized over the service period. We utilized the Black-Scholes model to calculate the fair value of the profits interests’ awards on the date of grant (“Calculation”).
The hurdle rate as of the date of grant was used to determine the per unit strike price for the Calculation. The risk free interest rates used in the calculation of the fair value of profits interests are the rates that correspond to the weighted average expected life of the profits interests. The volatility was estimated based on the historical volatility of Black Knight and ServiceLink peers and of the historical LPS stock price over a term equal to the weighted average expected life of the profits interests. We used a weighted average risk free interest rate of 1.06%, a volatility factor for the expected market price of the member units of 33.3% and a weighted average expected life of 3.5 years with a discount of 22.0% for lack of marketability, resulting in a weighted average fair value of $2.04 per profits interests unit granted. There was no redemption value of the outstanding profits interests as of December 31, 2015 as the fair value of ServiceLink was less than the hurdle rate.
Profits interest expense is included in Personnel costs in the Consolidated Statements of Earnings and Non-controlling interest in the Consolidated Statements of Equity. Net earnings from continuing operations reflect profits interest expense of $13 million and $14 million for the years ended December 31, 2015 and December 31, 2014, respectively.
As of December 31, 2015, the total unrecognized compensation cost related to non-vested profits interests grants is $8 million which is expected to be recognized in pre-tax income over a weighted average period of 1 year.
Pension Plans
In 2000, FNF merged with Chicago Title Corporation ("Chicago Title"). In connection with the merger, we assumed Chicago Title’s noncontributory defined contribution plan and noncontributory defined benefit pension plan (the “Pension Plan”). The Pension Plan covers certain Chicago Title employees. The benefits are based on years of service and the employee’s average monthly compensation in the highest 60 consecutive calendar months during the 120 months ending at retirement or termination. Effective December 31, 2000, the Pension Plan was frozen and there will be no future credit given for years of service or changes in salary. The accumulated benefit obligation is the same as the projected benefit obligation due to the pension plan being frozen as of December 31, 2000. Pursuant to GAAP on employers’ accounting for defined benefit pension and other post retirement plans, the measurement date is December 31.
The net pension liability included in Accounts payable and other accrued liabilities as of December 31, 2015, and 2014 was $13 million and $14 million, respectively. The discount rate used to determine the benefit obligation as of the years ended December 31, 2015 and 2014 was 3.72% and 3.37%, respectively. As of the years ended December 31, 2015 and 2014 the projected benefit obligation was $172 million and $185 million, respectively, and the fair value of plan assets was $159 million and $171 million, respectively. The net periodic expense included in the results of operations relating to these plans was $8 million, $6 million, and $9 million for the years ended December 31, 2015, 2014, and 2013, respectively.
108
FIDELITY NATIONAL FINANCIAL, INC. AND SUBSIDIARIES
NOTES TO CONSOLIDATED FINANCIAL STATEMENTS — (continued)
Postretirement and Other Nonqualified Employee Benefit Plans
We assumed certain health care and life insurance benefits for retired Chicago Title employees in connection with the FNF merger with Chicago Title. Beginning on January 1, 2001, these benefits were offered to all employees who met specific eligibility requirements. Additionally, in connection with the acquisition of LandAmerica Financial Group's two principal title insurance underwriters, Commonwealth Land Title Insurance Company and Lawyers Title Insurance Corporation, as well as United Capital Title Insurance Company (collectively, the "LFG Underwriters"), we assumed certain of the LFG Underwriters' nonqualified benefit plans, which provide various postretirement benefits to certain executives and retirees. The costs of these benefit plans are accrued during the periods the employees render service. We are both self-insured and fully insured for postretirement health care and life insurance benefit plans, and the plans are not funded. The health care plans provide for insurance benefits after retirement and are generally contributory, with contributions adjusted annually. Postretirement life insurance benefits are primarily contributory, with coverage amounts declining with increases in a retiree’s age. The aggregate benefit obligation for these plans was $17 million at December 31, 2015 and $20 million at December 31, 2014. The net costs relating to these plans were immaterial for the years ended December 31, 2015, 2014, and 2013.
109
FIDELITY NATIONAL FINANCIAL, INC. AND SUBSIDIARIES
NOTES TO CONSOLIDATED FINANCIAL STATEMENTS — (continued)
Note P. | Supplementary Cash Flow Information |
The following supplemental cash flow information is provided with respect to interest and tax payments, as well as certain non-cash investing and financing activities.
Year Ended December 31, | ||||||||||||
2015 | 2014 | 2013 | ||||||||||
(In millions) | ||||||||||||
Cash paid during the year: | ||||||||||||
Interest | $ | 124 | $ | 140 | $ | 87 | ||||||
Income taxes | 250 | 75 | 242 | |||||||||
Non-cash investing and financing activities: | ||||||||||||
Investing activities: | ||||||||||||
Change in proceeds of sales of investments available for sale receivable in period | $ | (25 | ) | $ | 3 | $ | (3 | ) | ||||
Change in purchases of investments available for sale payable in period | (2 | ) | 5 | (3 | ) | |||||||
Financing activities: | ||||||||||||
Liabilities assumed in connection with acquisitions: | ||||||||||||
Fair value of net assets acquired | $ | 155 | $ | 5,250 | $ | 30 | ||||||
Less: Total purchase price | 111 | 2,363 | 25 | |||||||||
Liabilities assumed | $ | 44 | $ | 2,887 | $ | 5 | ||||||
Treasury stock purchases payable at period end | $ | (7 | ) | $ | — | $ | — | |||||
Note Q. Financial Instruments with Off-Balance Sheet Risk and Concentration of Risk
Title
In the normal course of business we and certain of our subsidiaries enter into off-balance sheet credit arrangements associated with certain aspects of the title insurance business and other activities.
We generate a significant amount of title insurance premiums in California, Texas, New York and Florida. Title insurance premiums as a percentage of the total title insurance premiums written from those four states are detailed as follows:
2015 | 2014 | 2013 | ||||||
California | 15.1 | % | 15.0 | % | 15.2 | % | ||
Texas | 14.4 | % | 15.4 | % | 14.4 | % | ||
New York | 8.1 | % | 7.9 | % | 7.4 | % | ||
Florida | 8.1 | % | 7.8 | % | 7.6 | % | ||
Black Knight generates a significant amount of revenue from large customers, including a large customer that accounted for 12.0% of total revenue in the year ended December 31, 2015 and two large customers that accounted for 13.5% and 11.8% of total revenue, respectively, in the year ended December 31, 2014.
Financial instruments that potentially subject us to concentrations of credit risk consist primarily of cash equivalents, short-term investments, and trade receivables.
We place cash equivalents and short-term investments with high credit quality financial institutions and, by policy, limit the amount of credit exposure with any one financial institution. Investments in commercial paper of industrial firms and financial institutions are rated investment grade by nationally recognized rating agencies.
Concentrations of credit risk with respect to trade receivables are limited because a large number of geographically diverse customers make up our customer base, thus spreading the trade receivables credit risk. We control credit risk through monitoring procedures.
Financial instruments that potentially subject us to concentrations of credit risk consist primarily of cash equivalents and trade receivables.
110
FIDELITY NATIONAL FINANCIAL, INC. AND SUBSIDIARIES
NOTES TO CONSOLIDATED FINANCIAL STATEMENTS — (continued)
Note R. Segment Information
During the fourth quarter of 2013, we determined that the Corporate and Other segment would be split in order to differentiate operations and costs related to our FNF Core businesses from those associated with FNFV. As a result, we reorganized our reporting segments to reflect this change.
On January 2, 2014, we acquired LPS. As a result we created a new segment in 2014, Black Knight, which contains the technology, data and analytics operations of the former LPS company. We have combined the acquired transaction services business of LPS with our existing ServiceLink operations which reside in the Title segment.
During the fourth quarter of 2015, we determined that Pacific Union International, Inc. ("Pacific Union"), a luxury real estate broker based in California in which we acquired a controlling stake in December 2014, better aligned with the businesses within our FNF Core Corporate and Other segment. Because of the timing of the acquisition, we did not record any of the results of the operations of Pacific Union in 2014. Pacific Union's Total assets of $48 million and Goodwill of $40 million as of December 31, 2014 were previously included in the Title segment, but have been reclassified to the FNF Core Corporate and Other segment in the tables below.
Summarized financial information concerning our reportable segments is shown in the following tables. There are several intercompany corporate related arrangements between our various FNF Core businesses. The effects of these arrangements including intercompany notes and related interest and any other non-operational intercompany revenues and expenses have been eliminated in the segment presentations below.
As of and for the year ended December 31, 2015:
Title | Black Knight | FNF Core Corporate and Other | Total FNF Core | Restaurant Group | FNFV Corporate and Other | Total FNFV | Total | ||||||||||||||||||||||||
(In millions) | |||||||||||||||||||||||||||||||
Title premiums | $ | 4,286 | $ | — | $ | — | $ | 4,286 | $ | — | $ | — | $ | — | $ | 4,286 | |||||||||||||||
Other revenues | 2,005 | 931 | 185 | 3,121 | — | 203 | 203 | 3,324 | |||||||||||||||||||||||
Restaurant revenues | — | — | — | — | 1,412 | — | 1,412 | 1,412 | |||||||||||||||||||||||
Revenues from external customers | 6,291 | 931 | 185 | 7,407 | 1,412 | 203 | 1,615 | 9,022 | |||||||||||||||||||||||
Interest and investment income (loss), including realized gains and losses | 137 | (5 | ) | (5 | ) | 127 | (19 | ) | 2 | (17 | ) | 110 | |||||||||||||||||||
Total revenues | 6,428 | 926 | 180 | 7,534 | 1,393 | 205 | 1,598 | 9,132 | |||||||||||||||||||||||
Depreciation and amortization | 144 | 194 | 7 | 345 | 49 | 16 | 65 | 410 | |||||||||||||||||||||||
Interest expense | — | 50 | 72 | 122 | 6 | 3 | 9 | 131 | |||||||||||||||||||||||
Earnings (loss) from continuing operations, before income taxes and equity in earnings (loss) of unconsolidated affiliates | 836 | 139 | (113 | ) | 862 | 7 | (2 | ) | 5 | 867 | |||||||||||||||||||||
Income tax expense (benefit) | 305 | 35 | (30 | ) | 310 | (2 | ) | (18 | ) | (20 | ) | 290 | |||||||||||||||||||
Earnings (loss) from continuing operations, before equity in earnings (loss) of unconsolidated affiliates | 531 | 104 | (83 | ) | 552 | 9 | 16 | 25 | 577 | ||||||||||||||||||||||
Equity in earnings (loss) of unconsolidated affiliates | 6 | — | — | 6 | — | (22 | ) | (22 | ) | (16 | ) | ||||||||||||||||||||
Earnings (loss) from continuing operations | $ | 537 | $ | 104 | $ | (83 | ) | $ | 558 | $ | 9 | $ | (6 | ) | $ | 3 | $ | 561 | |||||||||||||
Assets | $ | 8,533 | $ | 3,703 | $ | 266 | $ | 12,502 | $ | 508 | $ | 921 | $ | 1,429 | $ | 13,931 | |||||||||||||||
Goodwill | 2,303 | 2,224 | 45 | 4,572 | 103 | 85 | 188 | 4,760 | |||||||||||||||||||||||
111
FIDELITY NATIONAL FINANCIAL, INC. AND SUBSIDIARIES
NOTES TO CONSOLIDATED FINANCIAL STATEMENTS — (continued)
As of and for the year ended December 31, 2014:
Title | Black Knight | FNF Core Corporate and Other | Total FNF Core | Restaurant Group | FNFV Corporate and Other | Total FNFV | Total | ||||||||||||||||||||||||
(In millions) | |||||||||||||||||||||||||||||||
Title premiums | $ | 3,671 | $ | — | $ | — | $ | 3,671 | $ | — | $ | — | $ | — | $ | 3,671 | |||||||||||||||
Other revenues | 1,855 | 852 | (13 | ) | 2,694 | — | 110 | 110 | 2,804 | ||||||||||||||||||||||
Restaurant revenues | — | — | — | — | 1,436 | — | 1,436 | 1,436 | |||||||||||||||||||||||
Revenues from external customers | 5,526 | 852 | (13 | ) | 6,365 | 1,436 | 110 | 1,546 | 7,911 | ||||||||||||||||||||||
Interest and investment income (loss), including realized gains and losses | 118 | — | 7 | 125 | (13 | ) | 1 | (12 | ) | 113 | |||||||||||||||||||||
Total revenues | 5,644 | 852 | (6 | ) | 6,490 | 1,423 | 111 | 1,534 | 8,024 | ||||||||||||||||||||||
Depreciation and amortization | 145 | 188 | 3 | 336 | 52 | 15 | 67 | 403 | |||||||||||||||||||||||
Interest expense | — | 31 | 91 | 122 | 8 | (3 | ) | 5 | 127 | ||||||||||||||||||||||
Earnings (loss) from continuing operations, before income taxes and equity in earnings (loss) of unconsolidated affiliates | 534 | (15 | ) | (113 | ) | 406 | 13 | (27 | ) | (14 | ) | 392 | |||||||||||||||||||
Income tax expense (benefit) | 192 | (7 | ) | (23 | ) | 162 | 1 | 149 | 150 | 312 | |||||||||||||||||||||
Earnings (loss) from continuing operations, before equity in earnings (loss) of unconsolidated affiliates | 342 | (8 | ) | (90 | ) | 244 | 12 | (176 | ) | (164 | ) | 80 | |||||||||||||||||||
Equity in earnings (loss) of unconsolidated affiliates | 4 | — | — | 4 | — | 428 | 428 | 432 | |||||||||||||||||||||||
Earnings (loss) from continuing operations | $ | 346 | $ | (8 | ) | $ | (90 | ) | $ | 248 | $ | 12 | $ | 252 | $ | 264 | $ | 512 | |||||||||||||
Assets | $ | 8,250 | $ | 3,598 | $ | 78 | $ | 11,926 | $ | 658 | $ | 1,261 | $ | 1,919 | $ | 13,845 | |||||||||||||||
Goodwill | 2,249 | 2,223 | 43 | 4,515 | 119 | 87 | 206 | 4,721 | |||||||||||||||||||||||
As of and for the year ended December 31, 2013:
Title | FNF Core Corporate and Other | Total FNF Core | Restaurant Group | FNFV Corporate and Other (1), (2) | Total FNFV | Total | |||||||||||||||||||||
(In millions) | |||||||||||||||||||||||||||
Title premiums | $ | 4,152 | $ | — | $ | 4,152 | $ | — | $ | — | $ | — | $ | 4,152 | |||||||||||||
Other revenues | 1,597 | 53 | 1,650 | — | 87 | 87 | 1,737 | ||||||||||||||||||||
Restaurant revenues | — | — | — | 1,408 | — | 1,408 | 1,408 | ||||||||||||||||||||
Revenues from external customers | 5,749 | 53 | 5,802 | 1,408 | 87 | 1,495 | 7,297 | ||||||||||||||||||||
Interest and investment income (loss), including realized gains and losses | 145 | (4 | ) | 141 | (1 | ) | 3 | 2 | 143 | ||||||||||||||||||
Total revenues | 5,894 | 49 | 5,943 | 1,407 | 90 | 1,497 | 7,440 | ||||||||||||||||||||
Depreciation and amortization | 65 | 3 | 68 | 53 | 12 | 65 | 133 | ||||||||||||||||||||
Interest expense | — | 68 | 68 | 8 | (3 | ) | 5 | 73 | |||||||||||||||||||
Earnings (loss) from continuing operations, before income taxes and equity in earnings of unconsolidated affiliates | 808 | (152 | ) | 656 | 12 | (52 | ) | (40 | ) | 616 | |||||||||||||||||
Income tax expense (benefit) | 297 | (60 | ) | 237 | (4 | ) | (38 | ) | (42 | ) | 195 | ||||||||||||||||
Earnings (loss) from continuing operations, before equity in earnings of unconsolidated affiliates | 511 | (92 | ) | 419 | 16 | (14 | ) | 2 | 421 | ||||||||||||||||||
Equity in earnings (loss) of unconsolidated affiliates | 5 | (1 | ) | 4 | — | (30 | ) | (30 | ) | (26 | ) | ||||||||||||||||
Earnings (loss) from continuing operations | $ | 516 | $ | (93 | ) | $ | 423 | $ | 16 | $ | (44 | ) | $ | (28 | ) | $ | 395 | ||||||||||
Assets | $ | 6,762 | $ | 1,130 | $ | 7,892 | $ | 670 | $ | 1,946 | $ | 2,616 | $ | 10,508 | |||||||||||||
Goodwill | 1,435 | 4 | 1,439 | 119 | 343 | 462 | 1,901 | ||||||||||||||||||||
______________
(1) Assets in 2013 also included $1,255 million for Remy, which is now presented as discontinued operations.
112
FIDELITY NATIONAL FINANCIAL, INC. AND SUBSIDIARIES
NOTES TO CONSOLIDATED FINANCIAL STATEMENTS — (continued)
(2) Goodwill in 2013 also included $248 million or Remy, which is now presented as discontinued operations.
The activities in our segments include the following:
FNF Core Operations
Title
This segment consists of the operations of our title insurance underwriters and related businesses. This segment provides core title insurance and escrow and other title related services including collection and trust activities, trustee sales guarantees, recordings and reconveyances, and home warranty insurance. This segment also includes the transaction services business acquired from Lender Processing Services, Inc. ("LPS"), now combined with our ServiceLink business. Transaction services include other title-related services used in the production and management of mortgage loans, including mortgage loans that experience default.
Black Knight
This segment consists of the operations of Black Knight, which, through leading software systems and information solutions, provides mission critical technology and data and analytics services that facilitate and automate many of the business processes across the life cycle of a mortgage.
FNF Core Corporate and Other
This segment consists of the operations of the parent holding company, certain other unallocated corporate overhead expenses, and other smaller real estate and insurance-related operations.
FNFV
Restaurant Group
This segment consists of the operations of ABRH, in which we have a 55% ownership interest. ABRH and its affiliates are the owners and operators of the O'Charley's, Ninety Nine Restaurants, Max & Erma's, Village Inn, Bakers Square, and Legendary Baking concepts. This segment also includes the results of J. Alexander's, Inc. ("J. Alexander's") through September 28, 2015, the date it was distributed to FNFV shareholders. On January 25, 2016, substantially all of the assets of the Max & Erma's restaurant concept were sold pursuant to an Asset Purchase Agreement.
FNFV Corporate and Other
This segment primarily consists of our share in the operations of certain equity investments, including Ceridian, as well as consolidated investments, including Digital Insurance in which we own 96%, and other smaller operations which are not title related.
Note S. | Recent Accounting Pronouncements |
In May 2014, the FASB issued ASU No. 2014-09, Revenue from Contracts with Customers (Topic 606). This ASU provides a new comprehensive revenue recognition model that requires companies to recognize revenue to depict the transfer of goods or services to a customer at an amount that reflects the consideration it expects to receive in exchange for those goods or services. This update also requires additional disclosure about the nature, amount, timing and uncertainty of revenue and cash flows arising from customer contracts. This update permits the use of either the retrospective or cumulative effect transition method. We are evaluating the effect this new guidance will have on our consolidated financial statements and related disclosures. We have not yet selected a transition method nor have we determined the effect of the standard on our ongoing financial reporting. Upon issuance of ASU 2015-14, the effective date of ASU 2014-09 was deferred to annual and interim periods beginning on or after December 15, 2017.
In February 2015, the Financial Accounting Standards Board ("FASB") issued Accounting Standards Update ("ASU") No. 2015-02 Consolidation (Topic 810). This ASU changes the way reporting enterprises evaluate whether (a) they should consolidate limited partnerships and similar entities, (b) fees paid to a decision maker or service provider are variable interests in a variable interest entity (VIE), and (c) variable interests in a VIE held by related parties of the reporting enterprise require the reporting enterprise to consolidate the VIE. The ASU eliminates the ASU 2010-10 deferral of the ASU 2009-17 VIE consolidation requirements for certain investment companies and similar entities. In addition, the ASU excludes money market funds that are required to comply with Rule 2a-7 of the Investment Company Act of 1940 or that operate under requirements similar to those in Rule 2a-7 from the GAAP consolidation requirements. The ASU also significantly changes how to evaluate voting rights for entities that are not similar to limited partnerships when determining whether the entity is a VIE, which may affect entities for which the decision making rights are conveyed though a contractual arrangement. The update allows for the application of the amendments using a modified retrospective approach by recording a cumulative-effect adjustment to equity as of the beginning of the fiscal year of adoption or retrospective application prior periods. This update is effective for annual and interim periods beginning on or after December 15, 2015, with early application permitted. We are currently evaluating this ASU and do not expect this update to have a material impact on our results of operations or our financial position.
In April 2015, FASB issued ASU No. 2015-03 Interest - Presentation of Debt Issuance Costs (Subtopic 835-30). The ASU was issued as part of FASB's current plan to simplify overly complex standards. To simplify presentation of debt issuance costs, the amendments in this ASU require that debt issuance costs related to a recognized debt liability be presented in the balance sheet as a direct deduction from the carrying amount of that debt liability, consistent with debt discounts. The recognition and measurement guidance for debt issuance costs are not affected by this ASU. The update requires retrospective application to all prior period amounts presented. This update is effective for annual and interim periods beginning on or after December 15, 2015, with early application permitted. We early adopted the standard as of June 30, 2015 and have retrospectively applied the standard to all periods presented. Accordingly, unamortized debt issuance costs of $32 million and $23 million have been reclassified from Other intangible assets to offset Notes payable in the Consolidated Balance Sheets as of December 31, 2015 and December 31, 2014, respectively.
In May 2015, FASB issued ASU No. 2015-09 Financial Services - Insurance (Topic 944): Disclosures about Short-Duration Contracts. The amendments in this ASU require insurance entities to disclose for annual reporting periods additional information about the liability for unpaid claims and claim adjustment expenses related to short-duration contracts. The amendments also require insurance entities to disclose information about significant changes in methodologies and assumptions used to calculate the liability for unpaid claims and claim adjustment expenses. This update is effective for annual and interim periods beginning after December 15, 2015, and interim periods within annual periods beginning after December 15, 2016, with early application permitted. We do not expect this update to have a significant effect on our ongoing financial reporting as our primary insurance products are not short-duration contracts. However, we are still evaluating the totality of the effects the update will have on our disclosures.
In September 2015, the FASB issued ASU No. 2015-16 Business Combinations (Topic 805): Simplifying the Accounting for Measurement-Period Adjustments. The amendments in this ASU require that an acquirer recognize adjustments to provisional amounts that are identified during the measurement period in the reporting period in which the adjustment amounts are determined. The acquirer will be required to record, in the same period’s financial statements, the effect on earnings of changes in depreciation, amortization, or other income effects, if any, as a result of the change to the provisional amounts, calculated as if the accounting had been completed at the acquisition date. Entities will also be required to present separately on the face of the income statement or disclose in the notes the portion of the amount recorded in current-period earnings by line item that would have been recorded
113
FIDELITY NATIONAL FINANCIAL, INC. AND SUBSIDIARIES
NOTES TO CONSOLIDATED FINANCIAL STATEMENTS — (continued)
in previous reporting periods if the adjustment to the provisional amounts had been recognized as of the acquisition date. The amendments in this ASU are effective for fiscal years beginning after December 15, 2015, including interim periods within those fiscal years. The ASU requires the prospective application of the amendments for adjustments to provisional amounts that occur after its effective date. While we are currently evaluating the effect this new guidance will have on our consolidated financial statements and related disclosures, the ASU would potentially have a material effect in future periods on large acquisitions with significant measurement period adjustments.
In January 2016, the FASB issued ASU No. 2016-01 Financial Instruments - Overall (Subtopic 825-10): Recognition and Measurement of Financial Assets and Financial Liabilities. The primary amendments required by the ASU include: requiring equity investments with readily determinable fair values to be measured at fair value through net income rather than through other comprehensive income; allowing entities with equity investments without readily determinable fair values to report the investments at cost, adjusted for changes in observable prices, less impairment; requiring entities that elect the fair value option for financial liabilities to report the change in fair value attributable to instrument-specific credit risk in other comprehensive income; and clarifying that entities should assess the need for a valuation allowance on a deferred tax asset related to available-for-sale debt securities in combination with other deferred tax assets. The amendments in this ASU are effective for fiscal years beginning after December 15, 2017, including interim periods within those fiscal years. The ASU requires a cumulative-effect adjustment of the balance sheet as of the beginning of the year of adoption. Early adoption of the ASU is not permitted, except for the provision related to financial liabilities for which the fair value option has been elected. We are currently evaluating the effect this new guidance will have on our consolidated financial statements and related disclosures. We have not yet determined the effect of the standard on our consolidated financial statements and related disclosures.
Note T. | Net Income Attributable to FNF Group Shareholders and Change in Total Equity |
The following table presents the effect of the change in our ownership percentage in Black Knight Financial Services, LLC on equity attributable to FNF.
Year Ended December 31, | ||||||||||||
2015 | 2014 | 2013 | ||||||||||
Net earnings attributable to Fidelity National Financial, Inc. common shareholders | $ | 527 | $ | 583 | $ | 394 | ||||||
Increase in FNF's additional paid in capital for reduction in ownership percentage in Black Knight Financial Services, LLC | 53 | — | — | |||||||||
Decrease in noncontrolling interests resulting from decreased ownership percentage | (96 | ) | — | — | ||||||||
Net decrease in total equity | $ | (43 | ) | $ | — | $ | — | |||||
Change from net earnings attributable to Fidelity National Financial, Inc. common shareholders and change in total equity | $ | 484 | $ | 583 | $ | 394 | ||||||
Item 9. | Changes in and Disagreements with Accountants on Accounting and Financial Disclosure |
None.
Item 9A. | Controls and Procedures |
As of the end of the year covered by this report, we carried out an evaluation, under the supervision and with the participation of our principal executive officer and principal financial officer, of the effectiveness of the design and operation of our disclosure controls and procedures as such term is defined in Rule 13a-15(e) or 15d-15(e) under the Exchange Act. Based on this evaluation, our principal executive officer and principal financial officer concluded that our disclosure controls and procedures are effective to ensure that information required to be disclosed by the Company in the reports that we file or submit under the Act is: (a) recorded, processed, summarized and reported, within the time periods specified in the Commission’s rules and forms; and (b) accumulated and communicated to management, including our principal executive and principal financial officers, as appropriate to allow timely decisions regarding required disclosure.
There were no changes in our internal control over financial reporting that occurred during the quarter ended December 31, 2015 that have materially affected, or are reasonably likely to materially affect, our internal control over financial reporting.
MANAGEMENT’S REPORT ON INTERNAL CONTROL OVER FINANCIAL REPORTING
Management is responsible for establishing and maintaining adequate internal control over financial reporting, as such term is defined in Exchange Act Rule 13a-15(f) or 15d-15(f). Under the supervision and with the participation of our management, including our principal executive officer and principal financial officer, we conducted an evaluation of the effectiveness of our
114
internal control over financial reporting. Management has adopted the framework in Internal Control-Integrated Framework (2013) issued by the Committee of Sponsoring Organizations of the Treadway Commission (COSO). Based on our evaluation under this framework, our management concluded that our internal control over financial reporting was effective as of December 31, 2015. The effectiveness of our internal control over financial reporting as of December 31, 2015 has been audited by KPMG LLP, an independent registered public accounting firm, as stated in their report which is included herein.
Item 9B. | Other Information |
None.
PART III
Items 10-14.
Within 120 days after the close of our fiscal year, we intend to file with the Securities and Exchange Commission the matters required by these items.
115
PART IV
Item 15. | Exhibits, Financial Statement Schedules and Reports on Form 8-K |
(a) (1) Financial Statements. The following is a list of the Consolidated Financial Statements of Fidelity National Financial, Inc. and its subsidiaries included in Item 8 of Part II:
(a) (2) Financial Statement Schedules. The following is a list of financial statement schedules filed as part of this annual report on Form 10-K:
All other schedules are omitted because they are not applicable or not required, or because the required information is included in the Consolidated Financial Statements or notes thereto.
116
(a) (3) The following exhibits are incorporated by reference or are set forth on pages to this Form 10-K:
Exhibit Number | Description |
2.1 | Securities Exchange and Distribution Agreement between Old FNF and the Registrant, dated as of June 25, 2006, as amended and restated as of September 18, 2006 (incorporated by reference to Annex A to the Registrant’s Schedule 14C filed on September 19, 2006 |
2.2 | Agreement and Plan of Merger, dated as of May 28, 2013, among Fidelity National Financial, Inc., Lion Merger Sub, Inc. and Lender Processing Services, Inc. (incorporated by reference to Exhibit 2.1 to Fidelity National Financial, Inc.’s Current Report on Form 8-K, filed on May 28, 2013) |
3.1 | Fourth Amended and Restated Certificate of Incorporation (incorporated by reference to Exhibit 3.1 to the company's Current Report on Form 8-K filed on June 30, 2014) |
3.2 | Third Amended and Restated Bylaws of Fidelity National Financial, Inc., February 3, 2016 (incorporated by reference to Exhibit 3.1 to Fidelity National Financial, Inc.’s Current Report on Form 8-K, dated February 9, 2016) |
4.1 | Supplemental Indenture, dated as of January 2, 2014, among Lender Processing Services, Inc., Fidelity National Financial, Inc., Black Knight Lending Solutions, Inc. and U.S. Bank National Association, as trustee (incorporated by reference to Exhibit 3.2 to the Registrant’s Quarterly Report on Form 10-Q for the quarter ended September 30, 2013) |
4.2 | Indenture between the Registrant and The Bank of New York Trust Company, N.A., dated December 8, 2005 (incorporated by reference to Exhibit 4.1 to the Registrant’s Annual Report on Form 10-K for the year ended December 31, 2005) |
4.3 | First Supplemental Indenture between the Registrant and the Bank of New York Trust Company, N.A., dated as of January 6, 2006 (incorporated by reference to Exhibit 4.1 to the Registrant’s Current Report on Form 8-K filed on January 24, 2006) |
4.4 | Second Supplemental Indenture, dated May 5, 2010, between the Registrant and The Bank of New York Mellon Trust Company, N.A., dated as of May 5, 2010 (incorporated by reference to Exhibit 4.1 to the Registrant's Current Report on Form 8-K filed on May 5, 2010) |
4.5 | Third Supplemental Indenture, dated as of June 30, 2014, between the Registrant and The Bank of New York Mellon Trust Company, N.A. (incorporated by reference to Exhibit 4.1 to the Registrant's Current Report on Form 8-K filed on June 30, 2014) |
4.6 | Form of Subordinated Indenture between the Registrant and the Bank of New York Trust Company, N.A. (incorporated by reference to Exhibit 4.2 (A) to the Registrant’s Registration Statement on Form S-3 filed on November 14, 2007) |
4.7 | Form of 6.60% Note due 2017 (incorporated by reference to Exhibit 4.3 to the Registrant's Current Report on Form 8-K filed on May 5, 2010) |
4.8 | Form of 4.25% Convertible Note due August 2018 (incorporated by reference to Exhibit 4.5 to the Registrant's Current Report on Form 8-K filed on August 2, 2011) |
4.9 | Specimen certificate for shares of the Registrant’s FNF Group common stock, par value $0.0001 per Share (incorporated by reference to Exhibit 4.1 to the Registrant’s Registration Statement on Form S-4/A filed on May 5, 2014) |
4.10 | Specimen certificate for shares of the Registrant’s FNFV Group common stock, par value $0.0001 per Share (incorporated by reference to Exhibit 4.2 to the Registrant’s Registration Statement on Form S-4/A filed on May 5, 2014) |
10.1 | First Amendment, dated as of October 24, 2013, to the Third Amended and Restated Credit Agreement, dated as of June 25, 2013, among the Registrant, Bank of American, N.A., as administrative agent, and the other agents parties thereto (incorporated by reference to the Current Report on Form 8-K filed on October 25, 2013) |
10.2 | Amendment, dated as of June 25, 2013, to the Second Amended and Restated Credit Agreement, dated as of April 16, 2012, among Fidelity National Financial, Inc., the lenders party thereto, Bank of America, N.A., as administrative agent, and the other agents party thereto, including the Third Amended and Restated Credit Agreement among the parties dated as of June 25, 2013, which is included as Exhibit A thereto (incorporated by reference to Exhibit 10.1 to the Current Report on Form 8-K filed on June 26, 2013) |
10.3 | Amended and Restated Fidelity National Financial, Inc. 2005 Omnibus Incentive Plan, effective as of September 26, 2005 (incorporated by reference to Appendix A to the Registrant’s Schedule 14A filed on April 12, 2013) (1) |
10.4 | Term Loan Credit Agreement, dated as of August 19, 2013, among ABRH ,LLC, the lenders party thereto, Wells Fargo Bank N.A., as administrative agent, and the other agents party thereto (incorporated by reference to Exhibit 10.3 to the Registrant's Quarterly Report on Form 10-Q filed on November 10, 2014) |
10.5 | Term Loan Credit Agreement, dated as of July 11, 2013, among Fidelity National Financial, Inc., the lenders party thereto, Bank of America, N.A., as administrative agent, and the other agents party thereto (incorporated by reference to Registrant’s Current Report on Form 8-K filed on July 12, 2013) |
10.6 | First Amendment, dated as of October 24, 2013, to the Term Loan Credit Agreement, dated as of July 11, 2013, among the Registrant, Bank of American, N.A., as administrative agent, and the other agents parties thereto (incorporated by reference to the Current Report on Form 8-K filed on October 25, 2013) |
117
Exhibit Number | Description |
10.7 | Credit Agreement, dated as of March 31, 2015, among Digital Insurance, Inc., Bank of America, N.A., as administrative agent, and the other lenders party thereto (incorporated by reference to Exhibit 10.1 to the Registrant's Quarterly Report on Form 10-Q for the quarter ended March 31, 2015) |
10.8 | Credit and Guaranty Agreement, dated as of May 27, 2015, by and among Black Knight InfoServ, LLC, a Delaware limited liability company, as the borrower, JPMorgan Chase Bank, N.A. as administrative agent, the guarantors party thereto, the other agents party thereto and the lenders party thereto (incorporated by reference to Exhibit 10.1 to the Registrant's Current Report on Form 8-K filed on May 27, 2015) |
10.9 | Second Amendment, dated as of May 27, 2015, to Third Amended and Restated Credit Agreement, dated as of June 25, 2013, by and among Fidelity National Financial, Inc., a Delaware corporation, as the borrower, Bank of America, N.A., as administrative agent, the other agents party thereto and the financial institutions party thereto as lenders (incorporated by reference to Exhibit 10.1 to the Registrant's Current Report on Form 8-K filed on May 27, 2015) |
10.10 | Fidelity National Financial, Inc. 2013 Employee Stock Purchase Plan (incorporated by reference to Annex D to the Registrant’s Schedule 14A filed on May 9, 2014)(1) |
10.11 | Form of Notice of FNF Group Restricted Stock Grant and FNF Group Restricted Stock Award Agreement under Amended and Restated Fidelity National Financial, Inc. 2005 Omnibus Incentive Plan for October 2015 Awards (1) |
10.12 | Form of Notice of FNF Group Stock Option Award and FNF Group Stock Option Award Agreement under Amended and Restated Fidelity National Financial, Inc. 2005 Omnibus Incentive Plan for October 2015 Awards (1) |
10.13 | Form of Notice of FNFV Group Restricted Stock Grant and FNFV Group Restricted Stock Award Agreement under Amended and Restated Fidelity National Financial, Inc. 2005 Omnibus Incentive Plan for September 2014 Awards (incorporated by reference to Exhibit 10.1 to the Registrant’s Quarterly Report on Form 10-Q for the quarter ended September 30, 2014) (1) |
10.14 | Form of Notice of Restricted Stock Grant and FNF Group Restricted Stock Award Agreement under Amended and Restated Fidelity National Financial, Inc. 2005 Omnibus Incentive Plan for November 2013 Awards (incorporated by reference to Exhibit 10.11 to the Registrant’s Annual Report on Form 10-K for the year ended December 31, 2013)(1) |
10.15 | Form of Notice of Stock Option Award and Stock Option Award Agreement under Amended and Restated Fidelity National Financial, Inc. 2005 Omnibus Incentive Plan for November 2013 Awards (incorporated by reference to Exhibit 10.12 to the Registrant’s Annual Report on Form 10-K for the year ended December 31, 2013)(1) |
10.16 | Form of Notice of Stock Option Grant and Stock Option Award Agreement under Amended and Restated Fidelity National Financial, Inc. 2005 Omnibus Incentive Plan (incorporated by reference to Exhibit 10.10 to the Registrant's Annual Report on Form 10-K for the year ended December 31, 2012) (1) |
10.17 | Form of Notice of Stock Option Grant and Stock Option Award Agreement under Amended and Restated Fidelity National Financial, Inc. 2005 Omnibus Incentive Plan (incorporated by reference to Exhibit 10.6 to the Registrant’s Annual Report on Form 10-K for the year ended December 31, 2008) (1) |
10.18 | Tax Disaffiliation Agreement by and among Old FNF, the Registrant and FIS, dated as of October 23, 2006 (incorporated by reference to Exhibit 99.1 to Old FNF’s Form 8-K, filed on October 27, 2006) |
10.19 | Cross-Indemnity Agreement by and between the Registrant and FIS, dated as of October 23, 2006 (incorporated by reference to Exhibit 99.2 to FIS’s Form 8-K, filed on October 27, 2006) |
10.20 | Amended and Restated Employment Agreement between the Registrant and Anthony J. Park, effective as of October 10, 2008 (incorporated by reference to Exhibit 10.11 to Registrant’s Annual Report on Form 10-K for the year ended December 31, 2008) (1) |
10.21 | Amendment effective February 4, 2010 to Amended and Restated Employment Agreement between the Registrant and Anthony J. Park, effective as of October 10, 2008 (incorporated by reference to Exhibit 10.13 to the Registrant's Annual Report on Form 10-K for the year ended December 31, 2009) (1) |
10.22 | Amendment effective as of July 1, 2012 to Amended and Restated Employment Agreement between the Registrant and Brent B. Bickett (incorporated by reference to Exhibit 10.11 to the Registrant’s Quarterly Report on Form 10-Q for the quarter ended June 30, 2012)(1) |
10.23 | Amendment effective as of January 2, 2012 to Amended and Restated Employment Agreement between the Registrant and Brent B. Bickett (incorporated by reference to Exhibit 10.16 to the Registrant’s Annual Report on Form 10-K for the year ended December 31, 2011)(1) |
10.24 | Amendment effective February 4, 2010 to Amended and Restated Employment Agreement between the Registrant and Brent B. Bickett (incorporated by reference to Exhibit 10.15 to the Registrant’s Annual Report on Form 10-K for the year ended December 31, 2009) |
10.25 | Amended and Restated Employment Agreement between Fidelity National Financial, Inc. and Brent B. Bickett, effective as of July 2, 2008 (incorporated by reference to Exhibit 10.14 to the Registrant’s Annual Report on Form 10-K for the year ended December 31, 2008)(1) |
118
Exhibit Number | Description |
10.26 | Amended and Restated Employment Agreement between BKFS I Management and William P. Foley, II, effective as of January 8, 2016 (1) |
10.27 | Director Services Agreement between Fidelity National Financial, Inc. and William P. Foley, II, effective as of January 8, 2016 (1) |
10.28 | Amended and Restated Employment Agreement between the Registrant and Raymond R. Quirk, effective as of October 10, 2008 (1) (incorporated by reference to Exhibit 10.16 to Registrant’s Annual Report on Form 10-K for the year ended December 31, 2008) |
10.29 | Amendment effective February 4, 2010 to Amended and Restated Employment Agreement between the Registrant and Raymond R. Quirk, effective as of October 10, 2008 (incorporated by reference to Exhibit 10.21 to the Registrant's Annual Report on Form 10-K for the year ended December 31, 2009) (1) |
10.30 | Amended and Restated Employment Agreement between the Registrant and Michael L. Gravelle, effective as of January 30, 2013 (incorporated by reference to Exhibit 10.6 to the Registrant's Annual Report on Form 10-K for the year ended December 31, 2012) (1) |
10.31 | Amendment No. 2 to Amended and Restated Employment Agreement between the Registrant and Michael L. Gravelle, effective as of March 1, 2015 (incorporated by reference to Exhibit 10.3 to the Registrant’s Quarterly Report on Form 10-Q for the quarter ended March 31, 2015) (1) |
10.32 | Employment Agreement by and between BKFS I Management, Inc. and Michael L. Gravelle, effective as of March 1, 2015 (incorporated by reference to Exhibit 10.3 to the Registrant’s Quarterly Report on Form 10-Q for the quarter ended March 31, 2015) (1) |
10.33 | Fidelity National Title Group, Inc. Annual Incentive Plan (incorporated by reference to Annex B to the Registrant's Schedule 14A filed on April 11, 2011) (1) |
10.34 | Fidelity National Financial, Inc. Deferred Compensation Plan, as amended and restated, effective January 1, 2009 (incorporated by reference to Exhibit 10.18 to the Registrant’s Annual Report on Form 10-K for the year ended December 31, 2008) (1) |
10.35 | Amended and Restated Employment Agreement between the Registrant and Peter T. Sadowski, effective as of February 4, 2010 (incorporated by reference to Exhibit 10.25 to the Registrant's Annual Report on Form 10-K for the year ended December 31, 2012) (1) |
10.36 | Form of Notice of Long-Term Investment Success Performance Award Agreement - Tier 1 under Amended and Restated Fidelity National Financial, Inc. 2005 Omnibus Incentive Plan (incorporated by reference to Exhibit 10.3 to the Registrant's Quarterly Report on Form 10-Q for the quarter ended March 31, 2013) (1) |
10.37 | Form of Notice of Long-Term Investment Success Performance Award Agreement - Tier 2 under Amended and Restated Fidelity National Financial, Inc. 2005 Omnibus Incentive Plan (incorporated by reference to Exhibit 10.3 to the Registrant's Quarterly Report on Form 10-Q for the quarter ended March 31, 2013) (1) |
10.38 | Black Knight Financial Services, LLC 2013 Management Incentive Plan (incorporated by reference to Exhibit 10.1 to the Registrant’s Current Report on Form 8-K filed on January 9, 2014)(1) |
10.39 | ServiceLink Holdings, LLC 2013 Management Incentive Plan (incorporated by reference to Exhibit 10.2 to the to the Registrant’s Current Report on Form 8-K filed on January 9, 2014)(1) |
10.40 | Form of Black Knight Financial Services, LLC Unit Grant Agreement (incorporated by reference to Exhibit 10.3 to the Registrant's Current Report on Form 8-K filed on January 9, 2014)(1) |
10.41 | Form of ServiceLink Holdings, LLC Unit Grant Agreement (incorporated by reference to Exhibit 10.4 to the Registrant's Current Report on Form 8-K filed on January 9, 2014)(1) |
10.42 | Black Knight Financial Services, LLC Incentive Plan (incorporated by reference to Exhibit 10.5 to the to the Registrant’s Current Report on Form 8-K filed on January 9, 2014)(1) |
10.43 | Black Knight 2015 Omnibus Incentive Plan (incorporated by reference to to Exhibit 10.19 to Amendment No. 3 to the Form S-1 Registration Statement filed by Black Knight Financial Services, Inc. on March 30, 2015)(1) |
10.44 | Form of Grant Agreement for Restricted Stock Awards under the Black Knight Knight Financial Services, Inc. 2015 Omnibus Incentive Plan to be issued upon Exchange of Grant Units (incorporated by reference to Exhibit 10.31 to Amendment No. 4 to the Form S-1Registration Statement filed y Black Knight Financial Services, Inc. on May 4, 2015)(1) |
10.45 | Form of Restricted Stock Agreement for February 2016 Restricted Stock Awards with a three year vesting period under the Black Knight Financial Services, Inc. 2015 Omnibus Incentive Plan (1) |
10.46 | Form of Restricted Stock Agreement for February 2016 Restricted Stock Awards with a four year vesting period under the Black Knight Financial Services, Inc. 2015 Omnibus Incentive Plan (1) |
10.47 | ServiceLink Holdings, LLC Incentive Plan (incorporated by reference to Exhibit 10.6 to the to the Registrant’s Current Report on Form 8-K filed on January 9, 2014)(1) |
119
Exhibit Number | Description |
21.1 | Subsidiaries of the Registrant |
23.1 | Consent of KPMG LLP, Independent Registered Public Accounting Firm |
31.1 | Certification of Chief Executive Officer pursuant to Section 302 of the Sarbanes-Oxley Act of 2002 |
31.2 | Certification of Chief Financial Officer pursuant to Section 302 of the Sarbanes-Oxley Act of 2002 |
32.1 | Certification by Chief Executive Officer of Periodic Financial Reports pursuant to Section 906 of the Sarbanes-Oxley Act of 2002, 18 U.S.C. Section 1350 |
32.2 | Certification by Chief Financial Officer of Periodic Financial Reports pursuant to Section 906 of the Sarbanes-Oxley Act of 2002, 18 U.S.C. Section 1350 |
99.1 | Unaudited Attributed Financial Information for FNF Group Tracking Stock |
99.2 | Unaudited Attributed Financial Information for FNFV Group Tracking Stock |
101 | The following materials from Fidelity National Financial, Inc.'s Annual Report on Form 10-K for the year ended December 31, 2015, formatted in Extensible Business Reporting Language (XBRL): (i) the Consolidated Balance Sheets, (ii) the Consolidated Statements of Earnings, (iii) the Consolidated Statements of Comprehensive Earnings, (iv) the Consolidated Statements of Stockholders' Equity, (v) the Consolidated Statements of Cash Flows, and (vi) the Notes to the Consolidated Financial Statements. |
(1) | A management or compensatory plan or arrangement required to be filed as an exhibit to this report pursuant to Item 15(c) of Form 10-K |
120
SIGNATURES
Pursuant to the requirements of Section 13 or 15(d) of the Securities Exchange Act of 1934, the Registrant has duly caused this report to be signed on its behalf by the undersigned, thereunto duly authorized.
Fidelity National Financial, Inc. | |||
By: | /s/ Raymond R. Quirk | ||
Raymond R. Quirk | |||
Chief Executive Officer | |||
Date: February 23, 2016
Pursuant to the requirements of the Securities Exchange Act of 1934, this report has been signed below by the following persons on behalf of the Registrant and in the capacities and on the dates indicated. | ||||
Signature | Title | Date | ||
/s/ Raymond R. Quirk | Chief Executive Officer | February 23, 2016 | ||
Raymond R. Quirk | (Principal Executive Officer) | |||
/s/ Anthony J. Park | Chief Financial Officer | February 23, 2016 | ||
Anthony J. Park | (Principal Financial and Accounting Officer) | |||
/s/ William P. Foley, II | Director and Chairman of the Board | February 23, 2016 | ||
William P. Foley, II | ||||
/s/ Douglas K. Ammerman | Director | February 23, 2016 | ||
Douglas K. Ammerman | ||||
/s/ Willie D. Davis | Director | February 23, 2016 | ||
Willie D. Davis | ||||
/s/ Thomas M. Hagerty | Director | February 23, 2016 | ||
Thomas M. Hagerty | ||||
/s/ Daniel D. (Ron) Lane | Director | February 23, 2016 | ||
Daniel D. (Ron) Lane | ||||
/s/ Richard N. Massey | Director | February 23, 2016 | ||
Richard N. Massey | ||||
/s/ John D. Rood | Director | February 23, 2016 | ||
John D. Rood | ||||
/s/ Peter O. Shea, Jr. | Director | February 23, 2016 | ||
Peter O. Shea, Jr. | ||||
/s/ Cary H. Thompson | Director | February 23, 2016 | ||
Cary H. Thompson | ||||
/s/ Frank P. Willey | Director | February 23, 2016 | ||
Frank P. Willey | ||||
121
REPORT OF INDEPENDENT REGISTERED PUBLIC ACCOUNTING FIRM
The Board of Directors and Stockholders
Fidelity National Financial, Inc.:
Under date of February 23, 2016, we reported on the Consolidated Balance Sheets of Fidelity National Financial, Inc. and subsidiaries as of December 31, 2015 and 2014, and the related Consolidated Statements of Earnings, Comprehensive Earnings, Equity and Cash Flows for each of the years in the three-year period ended December 31, 2015, as contained in the Annual Report on Form 10-K for the year 2015. In connection with our audits of the aforementioned Consolidated Financial Statements, we also audited the related financial statement schedules as listed under Item 15(a)(2). These financial statement schedules are the responsibility of the Company’s management. Our responsibility is to express an opinion on these financial statement schedules based on our audits.
In our opinion, such financial statement schedules, when considered in relation to the basic Consolidated Financial Statements taken as a whole, present fairly, in all material respects, the information set forth therein.
/s/ KPMG LLP
Jacksonville, Florida
February 23, 2016
Certified Public Accountants
122
SCHEDULE II
FIDELITY NATIONAL FINANCIAL, INC.
(Parent Company)
BALANCE SHEETS
December 31, | |||||||
2015 | 2014 | ||||||
(In millions, except share data) | |||||||
ASSETS | |||||||
Cash | $ | 293 | $ | 151 | |||
Short term investments | 163 | — | |||||
Notes receivable | 621 | 2,635 | |||||
Investments in and amounts due from subsidiaries | 6,326 | 5,962 | |||||
Property and equipment, net | 4 | 6 | |||||
Prepaid expenses and other assets | 21 | — | |||||
Income taxes receivable | — | 60 | |||||
Total assets | $ | 7,428 | $ | 8,814 | |||
LIABILITIES AND EQUITY | |||||||
Liabilities: | |||||||
Accounts payable and other accrued liabilities | $ | 55 | $ | 52 | |||
Income taxes payable | 45 | — | |||||
Deferred tax liability | 594 | 703 | |||||
Notes payable | 980 | 2,065 | |||||
Total liabilities | 1,674 | 2,820 | |||||
Equity: | |||||||
FNF Group common stock, $0.0001 par value; authorized 487,000,000 shares as of December 31, 2015 and 2014; outstanding of 275,781,160 and 279,443,239 as of December 31, 2015 and 2014, respectively; and issued of 282,394,970 and 279,824,125 as of December 31, 2015 and 2014, respectively | — | — | |||||
FNFV Group common stock, $0.0001 par value; authorized 113,000,000 shares as of December 31, 2015 and 2014; outstanding of 72,217,882 and 92,828,470 as of December 31, 2015 and 2014, respectively; and issued of 80,581,466 and 92,946,545 as of December 31, 2015 and 2014, respectively | — | — | |||||
Additional paid-in capital | 4,795 | 4,855 | |||||
Retained earnings | 1,374 | 1,150 | |||||
Accumulated other comprehensive earnings | (69 | ) | 2 | ||||
Less: Treasury stock, 14,977,394 shares and 493,737 shares as of December 31, 2015 and 2014, respectively, at cost | (346 | ) | (13 | ) | |||
Total equity of Fidelity National Financial, Inc. common shareholders | 5,754 | 5,994 | |||||
Total liabilities and equity | $ | 7,428 | $ | 8,814 | |||
See Notes to Financial Statements and
Accompanying Report of Independent Registered Public Accounting Firm
123
SCHEDULE II
FIDELITY NATIONAL FINANCIAL, INC.
(Parent Company)
STATEMENTS OF EARNINGS AND RETAINED EARNINGS
Year Ended December 31, | |||||||||||
2015 | 2014 | 2013 | |||||||||
(In millions, except per share data) | |||||||||||
Revenues: | |||||||||||
Other fees and revenue | $ | 3 | $ | 1 | $ | 3 | |||||
Interest and investment income and realized gains | 86 | 168 | 15 | ||||||||
Total revenues | 89 | 169 | 18 | ||||||||
Expenses: | |||||||||||
Personnel expenses | 28 | 35 | 93 | ||||||||
Other operating expenses | 1 | (20 | ) | 50 | |||||||
Interest expense | 74 | 93 | 70 | ||||||||
Total expenses | 103 | 108 | 213 | ||||||||
(Losses) earnings before income tax (benefit) expense and equity in earnings of subsidiaries | (14 | ) | 61 | (195 | ) | ||||||
Income tax (benefit) expense | (5 | ) | 22 | (61 | ) | ||||||
(Losses) earnings before equity in earnings of subsidiaries | (9 | ) | 39 | (134 | ) | ||||||
Equity in earnings of subsidiaries | 536 | 544 | 528 | ||||||||
Net earnings attributable to Fidelity National Financial, Inc. common shareholders | $ | 527 | $ | 583 | $ | 394 | |||||
Basic earnings per share Old FNF common shareholders | $ | 0.33 | $ | 1.71 | |||||||
Weighted average shares outstanding Old FNF common shareholders, basic basis | 138 | 230 | |||||||||
Diluted earnings per share Old FNF Common shareholders | $ | 0.32 | $ | 1.68 | |||||||
Weighted average shares outstanding Old FNF common shareholders, diluted basis | 142 | 235 | |||||||||
Basic earnings per share FNF Group common shareholders | $ | 1.95 | $ | 0.77 | |||||||
Weighted average shares outstanding FNF Group common shareholders, basic basis | 277 | 138 | |||||||||
Diluted earnings per share FNF Group Common shareholders | $ | 1.89 | $ | 0.75 | |||||||
Weighted average shares outstanding FNF Group common shareholders, diluted basis | 286 | 142 | |||||||||
Basic earnings per share FNFV Group common shareholders | $ | (0.16 | ) | $ | 3.04 | ||||||
Weighted average shares outstanding FNFV Group common shareholders, basic basis | 79 | 46 | |||||||||
Diluted earnings per share FNFV Group Common shareholders | $ | (0.16 | ) | $ | 3.01 | ||||||
Weighted average shares outstanding FNFV Group common shareholders, diluted basis | 82 | 47 | |||||||||
Retained earnings, beginning of year | $ | 1,150 | $ | 1,089 | $ | 849 | |||||
Dividends declared | (222 | ) | (203 | ) | (154 | ) | |||||
Distribution of Remy to FNFV Group common shareholders | — | (319 | ) | — | |||||||
Distribution of J. Alexander's to FNFV Group common shareholders | (81 | ) | — | — | |||||||
Net earnings attributable to Fidelity National Financial, Inc. common shareholders | 527 | 583 | 394 | ||||||||
Retained earnings, end of year | $ | 1,374 | $ | 1,150 | $ | 1,089 | |||||
See Notes to Financial Statements and
Accompanying Report of Independent Registered Public Accounting Firm
124
SCHEDULE II
FIDELITY NATIONAL FINANCIAL, INC.
(Parent Company)
STATEMENTS OF CASH FLOWS
Year Ended December 31, | |||||||||||
2015 | 2014 | 2013 | |||||||||
(In millions) | |||||||||||
Cash Flows From Operating Activities: | |||||||||||
Net earnings | $ | 527 | $ | 583 | $ | 394 | |||||
Adjustments to reconcile net earnings to net cash provided by operating activities: | |||||||||||
Equity in earnings of subsidiaries | (536 | ) | (544 | ) | (528 | ) | |||||
Depreciation and amortization | 2 | 2 | 1 | ||||||||
Stock-based compensation | 38 | 32 | 30 | ||||||||
Tax benefit associated with the exercise of stock-based compensation | (21 | ) | (16 | ) | (17 | ) | |||||
Net change in income taxes | 17 | 540 | (96 | ) | |||||||
Net (increase) decrease in prepaid expenses and other assets | (25 | ) | 62 | (29 | ) | ||||||
Net (decrease) increase in accounts payable and other accrued liabilities | (11 | ) | (91 | ) | 101 | ||||||
Net cash (used in) provided operating activities | (9 | ) | 568 | (144 | ) | ||||||
Cash Flows From Investing Activities: | |||||||||||
Net purchases of short-term investment activities | (163 | ) | — | — | |||||||
Additions to notes receivable | (28 | ) | (3,025 | ) | (30 | ) | |||||
Collection of notes receivable | 1,542 | 390 | — | ||||||||
Net additions to investments in subsidiaries | — | — | 8 | ||||||||
Net cash provided by (used in) investing activities | 1,351 | (2,635 | ) | (22 | ) | ||||||
Cash Flows From Financing Activities: | |||||||||||
Equity offering | — | — | 511 | ||||||||
Borrowings | — | 1,500 | — | ||||||||
Debt service payments | (1,100 | ) | (400 | ) | (7 | ) | |||||
Debt issuance costs | — | — | (16 | ) | |||||||
Dividends paid | (220 | ) | (203 | ) | (153 | ) | |||||
Purchases of treasury stock | (506 | ) | — | (34 | ) | ||||||
Exercise of stock options | 26 | 40 | 60 | ||||||||
Tax benefit associated with the exercise of stock-based compensation | 21 | 16 | 17 | ||||||||
Distribution to FNFV | — | (100 | ) | — | |||||||
Other financing activity | (15 | ) | (8 | ) | — | ||||||
Net dividends from subsidiaries | 594 | 268 | 571 | ||||||||
Net cash (used in) provided by financing activities | (1,200 | ) | 1,113 | 949 | |||||||
Net change in cash and cash equivalents | 142 | (954 | ) | 783 | |||||||
Cash at beginning of year | 151 | 1,105 | 322 | ||||||||
Cash at end of year | $ | 293 | $ | 151 | $ | 1,105 | |||||
See Notes to Financial Statements and
See Accompanying Report of Independent Registered Public Accounting Firm
125
SCHEDULE II
FIDELITY NATIONAL FINANCIAL, INC.
(Parent Company)
NOTES TO FINANCIAL STATEMENTS
A. Summary of Significant Accounting Policies
Fidelity National Financial, Inc. transacts substantially all of its business through its subsidiaries. The Parent Company Financial Statements should be read in connection with the aforementioned Consolidated Financial Statements and Notes thereto included elsewhere herein. Certain reclassifications have been made in the 2014 presentation to conform to the classifications used in 2015.
In 2014 we began reporting our Investments in subsidiaries net of non-controlling interest on the Balance Sheets and similarly on the Statement of Earnings, we report Equity in earnings of subsidiaries net of (Losses) earnings attributable to non-controlling interest. The amount of Non-controlling interest reflected in Investments in subsidiaries was $834 million and $79 million as of December 31, 2015 and 2014, respectively. The amount of Earnings (losses) attributable to non-controlling interest reflected in Equity in earnings of subsidiaries on the Statements of Earnings was $34 million, $(64) million and $17 million for the years ending December 31, 2015, 2014 and 2013, respectively.
B. | Notes Payable |
Notes payable consist of the following:
December 31, | ||||||||
2015 | 2014 | |||||||
(In millions) | ||||||||
Unsecured notes, net of discount, interest payable semi-annually at 5.50%, due September 2022 | $ | 397 | $ | 395 | ||||
Unsecured convertible notes, net of discount, interest payable semi-annually at 4.25%, due August 2018 | 288 | 284 | ||||||
Unsecured notes, net of discount, interest payable semi-annually at 6.60%, due May 2017 | 300 | 299 | ||||||
FNF Term Loan, interest payable monthly at LIBOR + 1.63% | — | 1,094 | ||||||
Revolving Credit Facility, unsecured, unused portion of $800 at December 31, 2015, due July 2018 with interest payable monthly at LIBOR + 1.45% | (5 | ) | (7 | ) | ||||
$ | 980 | $ | 2,065 | |||||
C. | Supplemental Cash Flow Information |
Year Ended December 31, | |||||||||||
2015 | 2014 | 2013 | |||||||||
(In millions) | |||||||||||
Cash paid during the year: | |||||||||||
Interest paid | $ | 72 | $ | 103 | $ | 61 | |||||
Income tax payments | 250 | 75 | 242 | ||||||||
D. | Cash Dividends Received |
We have received cash dividends from subsidiaries and affiliates of $0.2 billion, $0.4 billion, and $0.1 billion during the years ended December 31, 2015, 2014, and 2013, respectively.
See Accompanying Report of Independent Registered Public Accounting Firm
126
SCHEDULE V
FIDELITY NATIONAL FINANCIAL, INC. AND SUBSIDIARIES
VALUATION AND QUALIFYING ACCOUNTS
Years Ended December 31, 2015, 2014 and 2013
Column C | ||||||||||||||||||||||
Column B | Additions | Column D | Column E | |||||||||||||||||||
Balance at | Charge to | Balance at | ||||||||||||||||||||
Column A | Beginning of | Costs and | Other | Deduction | End of | |||||||||||||||||
Description | Period | Expenses | (Described) | (Described) | Period | |||||||||||||||||
(In millions) | ||||||||||||||||||||||
Year ended December 31, 2015: | ||||||||||||||||||||||
Reserve for claim losses | $ | 1,621 | $ | 246 | $ | 1 | (2) | $ | 285 | (1) | $ | 1,583 | ||||||||||
Year ended December 31, 2014: | ||||||||||||||||||||||
Reserve for claim losses | $ | 1,636 | $ | 228 | $ | 59 | (3) | $ | 302 | (1) | $ | 1,621 | ||||||||||
Year ended December 31, 2013: | ||||||||||||||||||||||
Reserve for claim losses | $ | 1,748 | $ | 291 | $ | — | $ | 403 | (1) | $ | 1,636 | |||||||||||
____________________________
(1) | Represents payments of claim losses, net of recoupments. |
(2) | Represents recording a reinsurance recoverable. |
(3) | Represents an increase of $54 million to the reserve for claim losses as a result of the acquisition of LPS (See Note B), a $2 million decrease to the reserve due to the sale of a small title operation and recording $7 million increase to the claims reserve for a reinsurance recoverable. |
See Accompanying Report of Independent Registered Public Accounting Firm
127
EXHIBIT INDEX
Exhibit Number | Description |
2.1 | Securities Exchange and Distribution Agreement between Old FNF and the Registrant, dated as of June 25, 2006, as amended and restated as of September 18, 2006 (incorporated by reference to Annex A to the Registrant’s Schedule 14C filed on September 19, 2006 |
2.2 | Agreement and Plan of Merger, dated as of May 28, 2013, among Fidelity National Financial, Inc., Lion Merger Sub, Inc. and Lender Processing Services, Inc. (incorporated by reference to Exhibit 2.1 to Fidelity National Financial, Inc.’s Current Report on Form 8-K, filed on May 28, 2013) |
3.1 | Fourth Amended and Restated Certificate of Incorporation (incorporated by reference to Exhibit 3.1 to the company's Current Report on Form 8-K filed on June 30, 2014) |
3.2 | Third Amended and Restated Bylaws of Fidelity National Financial, Inc., February 3, 2016 (incorporated by reference to Exhibit 3.1 to Fidelity National Financial, Inc.’s Current Report on Form 8-K, dated February 9, 2016) |
4.1 | Supplemental Indenture, dated as of January 2, 2014, among Lender Processing Services, Inc., Fidelity National Financial, Inc., Black Knight Lending Solutions, Inc. and U.S. Bank National Association, as trustee (incorporated by reference to Exhibit 3.2 to the Registrant’s Quarterly Report on Form 10-Q for the quarter ended September 30, 2013) |
4.2 | Indenture between the Registrant and The Bank of New York Trust Company, N.A., dated December 8, 2005 (incorporated by reference to Exhibit 4.1 to the Registrant’s Annual Report on Form 10-K for the year ended December 31, 2005) |
4.3 | First Supplemental Indenture between the Registrant and the Bank of New York Trust Company, N.A., dated as of January 6, 2006 (incorporated by reference to Exhibit 4.1 to the Registrant’s Current Report on Form 8-K filed on January 24, 2006) |
4.4 | Second Supplemental Indenture, dated May 5, 2010, between the Registrant and The Bank of New York Mellon Trust Company, N.A., dated as of May 5, 2010 (incorporated by reference to Exhibit 4.1 to the Registrant's Current Report on Form 8-K filed on May 5, 2010) |
4.5 | Third Supplemental Indenture, dated as of June 30, 2014, between the Registrant and The Bank of New York Mellon Trust Company, N.A. (incorporated by reference to Exhibit 4.1 to the Registrant's Current Report on Form 8-K filed on June 30, 2014) |
4.6 | Form of Subordinated Indenture between the Registrant and the Bank of New York Trust Company, N.A. (incorporated by reference to Exhibit 4.2 (A) to the Registrant’s Registration Statement on Form S-3 filed on November 14, 2007) |
4.7 | Form of 6.60% Note due 2017 (incorporated by reference to Exhibit 4.3 to the Registrant's Current Report on Form 8-K filed on May 5, 2010) |
4.8 | Form of 4.25% Convertible Note due August 2018 (incorporated by reference to Exhibit 4.5 to the Registrant's Current Report on Form 8-K filed on August 2, 2011) |
4.9 | Specimen certificate for shares of the Registrant’s FNF Group common stock, par value $0.0001 per Share (incorporated by reference to Exhibit 4.1 to the Registrant’s Registration Statement on Form S-4/A filed on May 5, 2014) |
4.10 | Specimen certificate for shares of the Registrant’s FNFV Group common stock, par value $0.0001 per Share (incorporated by reference to Exhibit 4.2 to the Registrant’s Registration Statement on Form S-4/A filed on May 5, 2014) |
10.1 | First Amendment, dated as of October 24, 2013, to the Third Amended and Restated Credit Agreement, dated as of June 25, 2013, among the Registrant, Bank of American, N.A., as administrative agent, and the other agents parties thereto (incorporated by refrence to the Current Report on Form 8-K filed on October 25, 2013) |
10.2 | Amendment, dated as of June 25, 2013, to the Second Amended and Restated Credit Agreement, dated as of April 16, 2012, among Fidelity National Financial, Inc., the lenders party thereto, Bank of America, N.A., as administrative agent, and the other agents party thereto, including the Third Amended and Restated Credit Agreement among the parties dated as of June 25, 2013, which is included as Exhibit A thereto (incorporated by reference to Exhibit 10.1 to the Current Report on Form 8-K filed on June 26, 2013) |
10.3 | Amended and Restated Fidelity National Financial, Inc. 2005 Omnibus Incentive Plan, effective as of September 26, 2005 (incorporated by reference to Appendix A to the Registrant’s Schedule 14A filed on April 12, 2013) (1) |
10.4 | Term Loan Credit Agreement, dated as of August 19, 2013, among ABRH ,LLC, the lenders party thereto, Wells Fargo Bank N.A., as administrative agent, and the other agents party thereto (incorporated by reference to Exhibit 10.3 to the Registrant's Quarterly Report on Form 10-Q filed on November 10, 2014) |
10.5 | Term Loan Credit Agreement, dated as of July 11, 2013, among Fidelity National Financial, Inc., the lenders party thereto, Bank of America, N.A., as administrative agent, and the other agents party thereto (incorporated by reference to Registrant’s Current Report on Form 8-K filed on July 12, 2013) |
10.6 | First Amendment, dated as of October 24, 2013, to the Term Loan Credit Agreement, dated as of July 11, 2013, among the Registrant, Bank of American, N.A., as administrative agent, and the other agents parties thereto (incorporated by reference to the Current Report on Form 8-K filed on October 25, 2013) |
128
Exhibit Number | Description |
10.7 | Credit Agreement, dated as of March 31, 2015, among Digital Insurance, Inc., Bank of America, N.A., as administrative agent, and the other lenders party thereto (incorporated by reference to Exhibit 10.1 to the Registrant's Quarterly Report on Form 10-Q for the quarter ended March 31, 2015) |
10.8 | Credit and Guaranty Agreement, dated as of May 27, 2015, by and among Black Knight InfoServ, LLC, a Delaware limited liability company, as the borrower, JPMorgan Chase Bank, N.A. as administrative agent, the guarantors party thereto, the other agents party thereto and the lenders party thereto (incorporated by reference to Exhibit 10.1 to the Registrant's Current Report on Form 8-K filed on May 27, 2015) |
10.9 | Second Amendment, dated as of May 27, 2015, to Third Amended and Restated Credit Agreement, dated as of June 25, 2013, by and among Fidelity National Financial, Inc., a Delaware corporation, as the borrower, Bank of America, N.A., as administrative agent, the other agents party thereto and the financial institutions party thereto as lenders (incorporated by reference to Exhibit 10.1 to the Registrant's Current Report on Form 8-K filed on May 27, 2015) |
10.10 | Fidelity National Financial, Inc. 2013 Employee Stock Purchase Plan (incorporated by reference to Annex D to the Registrant’s Schedule 14A filed on May 9, 2014)(1) |
10.11 | Form of Notice of FNF Group Restricted Stock Grant and FNF Group Restricted Stock Award Agreement under Amended and Restated Fidelity National Financial, Inc. 2005 Omnibus Incentive Plan for October 2015 Awards (1) |
10.12 | Form of Notice of FNF Group Stock Option Award and FNF Group Stock Option Award Agreement under Amended and Restated Fidelity National Financial, Inc. 2005 Omnibus Incentive Plan for October 2015 Awards (1) |
10.13 | Form of Notice of FNFV Group Restricted Stock Grant and FNFV Group Restricted Stock Award Agreement under Amended and Restated Fidelity National Financial, Inc. 2005 Omnibus Incentive Plan for September 2014 Awards (incorporated by reference to Exhibit 10.1 to the Registrant’s Quarterly Report on Form 10-Q for the quarter ended September 30, 2014) (1) |
10.14 | Form of Notice of Restricted Stock Grant and FNF Group Restricted Stock Award Agreement under Amended and Restated Fidelity National Financial, Inc. 2005 Omnibus Incentive Plan for November 2013 Awards (incorporated by reference to Exhibit 10.11 to the Registrant’s Annual Report on Form 10-K for the year ended December 31, 2013)(1) |
10.15 | Form of Notice of Stock Option Award and Stock Option Award Agreement under Amended and Restated Fidelity National Financial, Inc. 2005 Omnibus Incentive Plan for November 2013 Awards (incorporated by reference to Exhibit 10.12 to the Registrant’s Annual Report on Form 10-K for the year ended December 31, 2013)(1) |
10.16 | Form of Notice of Stock Option Grant and Stock Option Award Agreement under Amended and Restated Fidelity National Financial, Inc. 2005 Omnibus Incentive Plan (incorporated by reference to Exhibit 10.10 to the Registrant's Annual Report on Form 10-K for the year ended December 31, 2012) (1) |
10.17 | Form of Notice of Stock Option Grant and Stock Option Award Agreement under Amended and Restated Fidelity National Financial, Inc. 2005 Omnibus Incentive Plan (incorporated by reference to Exhibit 10.6 to the Registrant’s Annual Report on Form 10-K for the year ended December 31, 2008) (1) |
10.18 | Tax Disaffiliation Agreement by and among Old FNF, the Registrant and FIS, dated as of October 23, 2006 (incorporated by reference to Exhibit 99.1 to Old FNF’s Form 8-K, filed on October 27, 2006) |
10.19 | Cross-Indemnity Agreement by and between the Registrant and FIS, dated as of October 23, 2006 (incorporated by reference to Exhibit 99.2 to FIS’s Form 8-K, filed on October 27, 2006) |
10.20 | Amended and Restated Employment Agreement between the Registrant and Anthony J. Park, effective as of October 10, 2008 (incorporated by reference to Exhibit 10.11 to Registrant’s Annual Report on Form 10-K for the year ended December 31, 2008) (1) |
10.21 | Amendment effective February 4, 2010 to Amended and Restated Employment Agreement between the Registrant and Anthony J. Park, effective as of October 10, 2008 (incorporated by reference to Exhibit 10.13 to the Registrant's Annual Report on Form 10-K for the year ended December 31, 2009) (1) |
10.22 | Amendment effective as of July 1, 2012 to Amended and Restated Employment Agreement between the Registrant and Brent B. Bickett (incorporated by reference to Exhibit 10.11 to the Registrant’s Quarterly Report on Form 10-Q for the quarter ended June 30, 2012)(1) |
10.23 | Amendment effective as of January 2, 2012 to Amended and Restated Employment Agreement between the Registrant and Brent B. Bickett (incorporated by reference to Exhibit 10.16 to the Registrant’s Annual Report on Form 10-K for the year ended December 31, 2011)(1) |
10.24 | Amendment effective February 4, 2010 to Amended and Restated Employment Agreement between the Registrant and Brent B. Bickett (incorporated by reference to Exhibit 10.15 to the Registrant’s Annual Report on Form 10-K for the year ended December 31, 2009) |
10.25 | Amended and Restated Employment Agreement between Fidelity National Financial, Inc. and Brent B. Bickett, effective as of July 2, 2008 (incorporated by reference to Exhibit 10.14 to the Registrant’s Annual Report on Form 10-K for the year ended December 31, 2008)(1) |
129
Exhibit Number | Description |
10.26 | Amended and Restated Employment Agreement between BKFS I Management and William P. Foley, II, effective as of January 8, 2016 (1) |
10.27 | Director Services Agreement between Fidelity National Financial, Inc. and William P. Foley, II, effective as of January 8, 2016 (1) |
10.28 | Amended and Restated Employment Agreement between the Registrant and Raymond R. Quirk, effective as of October 10, 2008 (1) (incorporated by reference to Exhibit 10.16 to Registrant’s Annual Report on Form 10-K for the year ended December 31, 2008) |
10.29 | Amendment effective February 4, 2010 to Amended and Restated Employment Agreement between the Registrant and Raymond R. Quirk, effective as of October 10, 2008 (incorporated by reference to Exhibit 10.21 to the Registrant's Annual Report on Form 10-K for the year ended December 31, 2009) (1) |
10.30 | Amended and Restated Employment Agreement between the Registrant and Michael L. Gravelle, effective as of January 30, 2013 (incorporated by reference to Exhibit 10.6 to the Registrant's Annual Report on Form 10-K for the year ended December 31, 2012) (1) |
10.31 | Amendment No. 2 to Amended and Restated Employment Agreement between the Registrant and Michael L. Gravelle, effective as of March 1, 2015 (incorporated by reference to Exhibit 10.3 to the Registrant’s Quarterly Report on Form 10-Q for the quarter ended March 31, 2015) (1) |
10.32 | Employment Agreement by and between BKFS I Management, Inc. and Michael L. Gravelle, effective as of March 1, 2015 (incorporated by reference to Exhibit 10.3 to the Registrant’s Quarterly Report on Form 10-Q for the quarter ended March 31, 2015) (1) |
10.33 | Fidelity National Title Group, Inc. Annual Incentive Plan (incorporated by reference to Annex B to the Registrant's Schedule 14A filed on April 11, 2011) (1) |
10.34 | Fidelity National Financial, Inc. Deferred Compensation Plan, as amended and restated, effective January 1, 2009 (incorporated by reference to Exhibit 10.18 to the Registrant’s Annual Report on Form 10-K for the year ended December 31, 2008) (1) |
10.35 | Amended and Restated Employment Agreement between the Registrant and Peter T. Sadowski, effective as of February 4, 2010 (incorporated by reference to Exhibit 10.25 to the Registrant's Annual Report on Form 10-K for the year ended December 31, 2012) (1) |
10.36 | Form of Notice of Long-Term Investment Success Performance Award Agreement - Tier 1 under Amended and Restated Fidelity National Financial, Inc. 2005 Omnibus Incentive Plan (incorporated by reference to Exhibit 10.3 to the Registrant's Quarterly Report on Form 10-Q for the quarter ended March 31, 2013) (1) |
10.37 | Form of Notice of Long-Term Investment Success Performance Award Agreement - Tier 2 under Amended and Restated Fidelity National Financial, Inc. 2005 Omnibus Incentive Plan (incorporated by reference to Exhibit 10.3 to the Registrant's Quarterly Report on Form 10-Q for the quarter ended March 31, 2013) (1) |
10.38 | Black Knight Financial Services, LLC 2013 Management Incentive Plan (incorporated by reference to Exhibit 10.1 to the to the Registrant’s Current Report on Form 8-K filed on January 9, 2014)(1) |
10.39 | ServiceLink Holdings, LLC 2013 Management Incentive Plan (incorporated by reference to Exhibit 10.2 to the to the Registrant’s Current Report on Form 8-K filed on January 9, 2014)(1) |
10.40 | Form of Black Knight Financial Services, LLC Unit Grant Agreement (incorporated by reference to Exhibit 10.3 to the Registrant's Current Report on Form 8-K filed on January 9, 2014)(1) |
10.41 | Form of ServiceLink Holdings, LLC Unit Grant Agreement (incorporated by reference to Exhibit 10.4 to the Registrant's Current Report on Form 8-K filed on January 9, 2014)(1) |
10.42 | Black Knight Financial Services, LLC Incentive Plan (incorporated by reference to Exhibit 10.5 to the to the Registrant’s Current Report on Form 8-K filed on January 9, 2014)(1) |
10.43 | Black Knight 2015 Omnibus Incentive Plan (incorporated by reference to to Exhibit 10.19 to Amendment No. 3 to the Form S-1 Registration Statement filed by Black Knight Financial Services, Inc. on March 30, 2015)(1) |
10.44 | Form of Grant Agreement for Restricted Stock Awards under the Black Knight Knight Financial Services, Inc. 2015 Omnibus Incentive Plan to be issued upon Exchange of Grant Units (incorporated by reference to Exhibit 10.31 to Amendment No. 4 to the Form S-1 Registration Statement filed by Black Knight Financial Services, Inc. on May 4, 2015)(1) |
10.45 | Form of Restricted Stock Agreement for February 2016 Restricted Stock Awards with a three year vesting period under the Black Knight Financial Services, Inc. 2015 Omnibus Incentive Plan (1) |
10.46 | Form of Restricted Stock Agreement for February 2016 Restricted Stock Awards with a four year vesting period under the Black Knight Financial Services, Inc. 2015 Omnibus Incentive Plan (1) |
10.47 | ServiceLink Holdings, LLC Incentive Plan (incorporated by reference to Exhibit 10.6 to the to the Registrant’s Current Report on Form 8-K filed on January 9, 2014)(1) |
130
Exhibit Number | Description |
21.1 | Subsidiaries of the Registrant |
23.1 | Consent of KPMG LLP, Independent Registered Public Accounting Firm |
31.1 | Certification of Chief Executive Officer pursuant to Section 302 of the Sarbanes-Oxley Act of 2002 |
31.2 | Certification of Chief Financial Officer pursuant to Section 302 of the Sarbanes-Oxley Act of 2002 |
32.1 | Certification by Chief Executive Officer of Periodic Financial Reports pursuant to Section 906 of the Sarbanes-Oxley Act of 2002, 18 U.S.C. Section 1350 |
32.2 | Certification by Chief Financial Officer of Periodic Financial Reports pursuant to Section 906 of the Sarbanes-Oxley Act of 2002, 18 U.S.C. Section 1350 |
99.1 | Unaudited Attributed Financial Information for FNF Group Tracking Stock |
99.2 | Unaudited Attributed Financial Information for FNFV Group Tracking Stock |
101 | The following materials from Fidelity National Financial, Inc.'s Annual Report on Form 10-K for the year ended December 31, 2015, formatted in Extensible Business Reporting Language (XBRL): (i) the Consolidated Balance Sheets, (ii) the Consolidated Statements of Earnings, (iii) the Consolidated Statements of Comprehensive Earnings, (iv) the Consolidated Statements of Stockholders' Equity, (v) the Consolidated Statements of Cash Flows, and (vi) the Notes to the Consolidated Financial Statements. |
(1) | A management or compensatory plan or arrangement required to be filed as an exhibit to this report pursuant to Item 15(c) of Form 10-K |
131