Attached files
| file | filename |
|---|---|
| EX-99.1 - EX-99.1 - Prestige Consumer Healthcare Inc. | exhibit991fy20-q3earni.htm |
| 8-K - 8-K - Prestige Consumer Healthcare Inc. | pbh-20200206.htm |

Exhibit 99.2 Prestige Consume; HEALTHCARE Third �uorter FY 2020 Results February 6th, 2020 a>== :' #,' NON-O'IIOWSY "� ,· i>rmnarnine'; --OROltSY Dramam1ne----CD - tDi·i!iii"·/llirnam'frii�e

This presentation contains certain “forward-looking” statements within the meaning of the Private Securities Litigation Reform Act of 1995, such as statements regarding the Company’s expected financial performance, including Revenues, Organic Revenue, Adjusted EPS, and Adjusted Free Cash Flow; the market share, expected growth and consumption trends for the Company’s brands; the expected cost of transition to a new logistics provider; the impact of brand-building and product innovation and the related impact on the Company’s revenues; the Company’s disciplined capital allocation; the Company’s use of cash to pay down debt and expected Leverage Ratio; the Company’s international performance; and the impact and continuation of retailer destocking. Words such as “trend,” “continue,” “will,” “expect,” “project,” “anticipate,” “likely,” “estimate,” “may,” “should,” “could,” “would,” and similar expressions identify forward-looking statements. Such forward-looking statements represent the Company’s expectations and beliefs and involve a number of known and unknown risks, uncertainties and other factors that may cause actual results to differ materially from those expressed or implied by such forward-looking statements. These factors include, among others, general economic and business conditions, regulatory matters, competitive pressures, consumer trends, retail inventory management initiatives, supplier issues, the impact of the transition to a new third party logistics provider, unexpected costs or liabilities, and other risks set forth in Part I, Item 1A. Risk Factors in the Company’s Annual Report on Form 10-K for the year ended March 31, 2019. You are cautioned not to place undue reliance on these forward-looking statements, which speak only as of the date this presentation. Except to the extent required by applicable law, the Company undertakes no obligation to update any forward-looking statement contained in this presentation, whether as a result of new information, future events, or otherwise. All adjusted GAAP numbers presented are footnoted and reconciled to their closest GAAP measurement in the attached reconciliation schedule or in our February 6, 2020 earnings release in the “About Non-GAAP Financial Measures” section.

Agenda for Today's Discussion I. Performance Highlights II. Financial Oueruiew Ill. FY 20 Outloo� p� Third Qu arter FY 20 Results H£ALTHCAR£ 3

I. Performance Highlights 4SBM#ISW Fleet® Summers£ve· Dramamine· C·•e�a··, L:T:I eyes®Ii I.Ev· t§thAW MONISTAT�

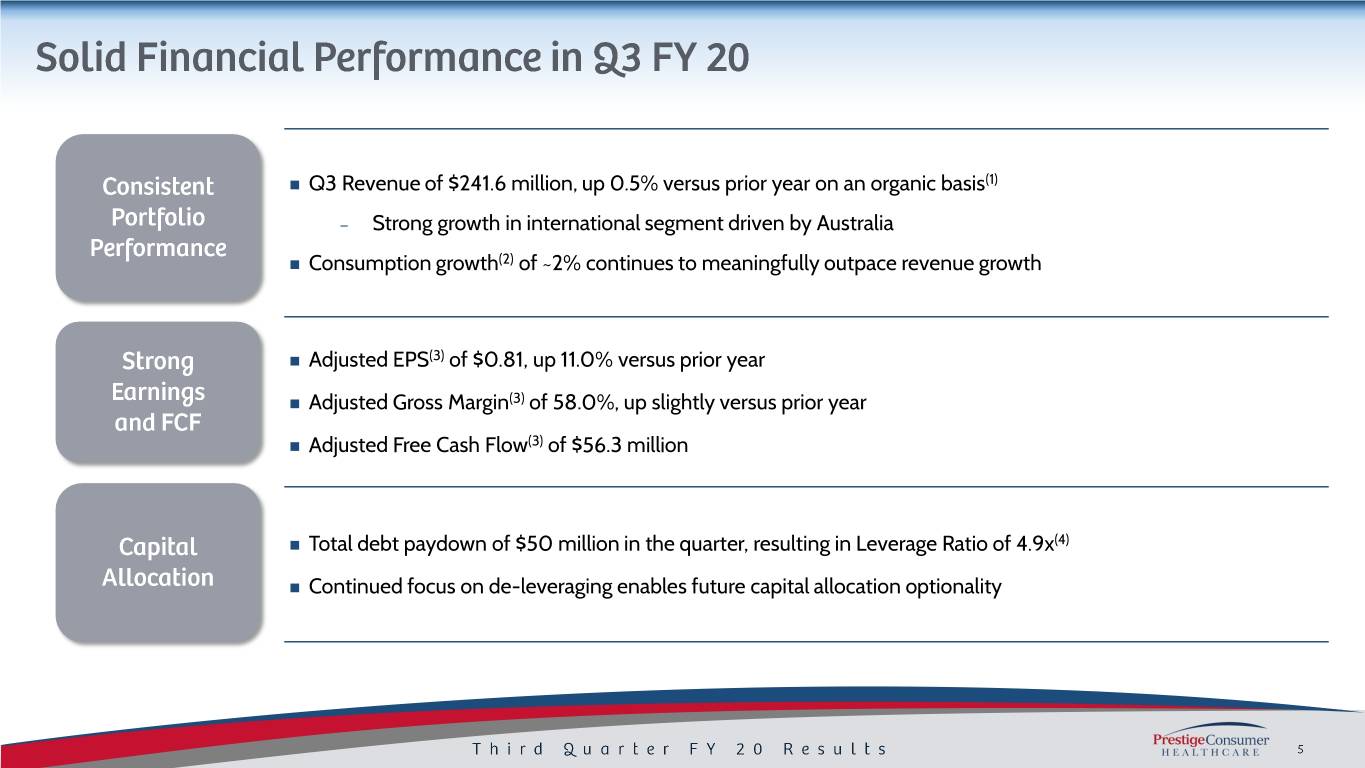
Q3 Revenue of $241.6 million, up 0.5% versus prior year on an organic basis(1) – Strong growth in international segment driven by Australia Consumption growth(2) of ~2% continues to meaningfully outpace revenue growth Adjusted EPS(3) of $0.81, up 11.0% versus prior year Adjusted Gross Margin(3) of 58.0%, up slightly versus prior year Adjusted Free Cash Flow(3) of $56.3 million Total debt paydown of $50 million in the quarter, resulting in Leverage Ratio of 4.9x(4) Continued focus on de-leveraging enables future capital allocation optionality

Strong Financial Performance YTD g_3 FY 20 Raising FY 20 AdjustedEPS(s) Guidance p� Third �u arter FY 20 Results H£ALTHCAR£ 6

Growing International Presence Key Brands in Key Geographies Sustained Growth % of YTD Revenue International All Other Australia 57% 17% Singapore & ROW Core 29% 9% Power Core Europe 14% (1%) Note: All growth figures exclude the effect of currency fluctuations

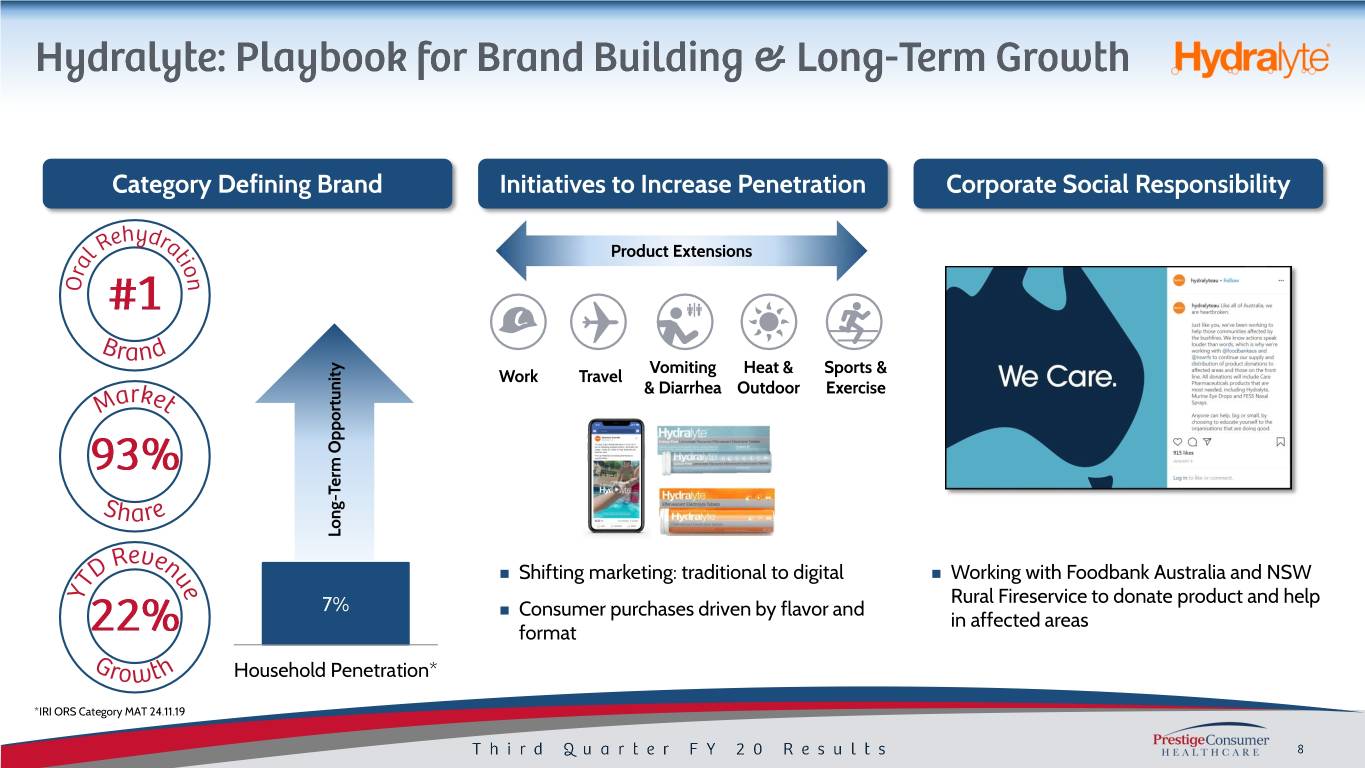
Category Defining Brand Initiatives to Increase Penetration Corporate Social Responsibility Product Extensions Vomiting Heat & Sports & Work Travel & Diarrhea Outdoor Exercise Long-Term Opportunity Opportunity Long-Term Shifting marketing: traditional to digital Working with Foodbank Australia and NSW Rural Fireservice to donate product and help 7% Consumer purchases driven by flavor and in affected areas format Household Penetration* *IRI ORS Category MAT 24.11.19

II. Financial Oueruiew 4SBM#ISW Fleet® Summers£ve· Dramamine· C·•e�a··, L:T:I eyes®Ii I.Ev· t§thAW MONISTAT�

Overall financial performance as expected in the quarter: − Q3 Revenue of $241.6 million, up 0.5% organically(1) versus prior year − Q3 Adjusted EBITDA(3) of $86.9 million, up 2.0% versus prior year − Q3 Adjusted EPS(3) of $0.81, an increase of 11.0% versus prior year, and YTD FY 20 Adjusted EPS(3) of $2.14 Q3 FY 20 Q3 FY 19 YTD Q3 FY 20 YTD Q3 FY 19 0.1% $711.8 $710.7 0.5% (2.2%) $241.6 $240.4 3.9% 2.0% 11.0% $242.2 $247.7 $2.14 $2.06 $86.9 $85.2 $0.81 $0.73 Organic Revenue (1) Adjusted EBITDA(3) Adjusted EPS (3) Organic Revenue (1) Adjusted EBITDA(3) Adjusted EPS(3) Dollar values in millions, except per share data.

Organic Revenue growth Q3 FY 20 Q3 FY 19 % Chg Q3 FY 20 Q3 FY 19 % Chg approximately flat versus prior Total Revenue $ 241.6 $ 241.4 0.1% $ 711.8 $ 734.8 (3.1%) year(1) Adjusted Gross Margin(3) 140.1 139.2 0.6% 412.3 417.5 (1.3%) % Margin 58.0% 57.7% 57.9% 56.8% – Consumption growth continues to meaningfully A&P 33.6 34.5 (2.7%) 107.0 108.7 (1.5%) % Total Revenue 13.9% 14.3% 15.0% 14.8% outpace revenue growth (3) Adjusted G&A 21.3 20.5 4.0% 65.5 64.2 2.1% Adjusted Gross Margin(3) of % Total Revenue 8.8% 8.5% 9.2% 8.7% 58.0% in Q3, flat sequentially D&A (ex. COGS D&A) 6.2 6.7 (7.2%) 18.5 20.5 (9.9%) and up ~30 bps versus prior year % Total Revenue 2.6% 2.8% 2.6% 2.8% A&P was 15.0% of YTD Revenue, Adjusted Operating Income(3) $ 79.0 $ 77.5 1.8% $ 221.2 $ 224.1 (1.3%) lower in second half as expected % Margin 32.7% 32.1% 31.1% 30.5% (3) (3) Adjusted Earnings Per Share $ 0.81 $ 0.73 11.0% $ 2.14 $ 2.06 3.9% Adjusted EBITDA was 34.0% YTD Revenue, in-line with Adjusted EBITDA(3) $ 86.9 $ 85.2 2.0% $ 242.2 $ 247.7 (2.2%) expectations and prior year % Margin 36.0% 35.3% 34.0% 33.7% Dollar values in millions, except per share data.

Net Debt(3) at December 31 of $1.7 billion; Leverage (4) Q3 FY 20 Q3 FY 19 YTD Q3 FY 20 YTD Q3 FY 19 Ratio of 4.9x at end of Q3 – Successfully repriced and extended maturity for (0.4%) $400 million Senior Notes $154.3 $154.9 $50 million debt paydown in Q3 and ~$100 million YTD (1.6%) Significant progress made in transitioning to new $56.3 $57.2 warehouse – Still anticipate ~$10 million in one-time transition costs Continue to expect $200 million+ Adjusted Free Cash Flow(6) for FY 20 Adjusted Free Cash Flow (3) Adjusted Free Cash Flow (3) Dollar values in millions.

Ill. FY 20 Outloo� Dramamine· 4SBM#ISW Fleet® Summers£ve· C·•e�a··, L:T:I eyes®Ii I.Ev· t§thAW MONISTAT�

Continuing to gain market share with consumers and grow categories for retailers Portfolio of need-based brands continues to be well positioned for long-term growth, offsetting inventory reductions at retail Expect no change to retailer de-stocking trends in medium term, particularly in the drug channel Reported Revenue of $947 to $957 million, Organic Revenue(1) expected to be approximately flat – Expect full-year consumption growth in excess of shipment growth – Expect continued strong international performance Increasing FY 20 Adjusted EPS(5) guidance to $2.85-$2.87 from $2.76-$2.83 previously Adjusted Free Cash Flow(6) of $200 million or more Continue to execute disciplined capital allocation strategy Target Leverage Ratio(4) of approximately 4.7x by fiscal year end

p� rd �u arter FY 20 Results H£ALTHCAR£ 1 5

(1) Organic Revenue is a Non-GAAP financial measure and is reconciled to the most closely related GAAP financial measure in the attached Reconciliation Schedules and / or our earnings release in the “About Non-GAAP Financial Measures” section. (2) Total company consumption is based on domestic IRI multi-outlet + C-Store retail sales for the period ending 12-29-19, direct point of sale consumption for certain untracked channels in North America for leading retailers, Australia consumption based on IMS data, and other international net revenues as a proxy for consumption. (3) Adjusted Gross Margin, Adjusted G&A, EBITDA, Adjusted EBITDA, Adjusted EBITDA Margin, Adjusted Operating Income, Adjusted Net Income, Adjusted EPS, Free Cash Flow, Adjusted Free Cash Flow and Net Debt are Non-GAAP financial measures and are reconciled to their most closely related GAAP financial measures in the attached Reconciliation Schedules and / or in our earnings release in the “About Non-GAAP Financial Measures” section. (4) Leverage Ratio reflects net debt / covenant defined EBITDA. (5) Adjusted EPS for FY 20 is a projected Non-GAAP financial measure, is reconciled to projected GAAP EPS in the attached Reconciliation Schedules and / or in our earnings release in the “About Non-GAAP Financial Measures” section and is calculated based on projected GAAP EPS plus adjustments relating to the integration of our new logistics provider and loss on extinguishment of debt. (6) Adjusted Free Cash Flow for FY 20 is a projected Non-GAAP financial measure, is reconciled to projected GAAP Net Cash Provided by Operating Activities in the attached Reconciliation Schedules and / or in our earnings release in the “About Non- GAAP Financial Measures” section and is calculated based on projected Net Cash Provided by Operating Activities less projected capital expenditures plus payments associated with the integration of our new logistics provider.

Three Months Ended Dec. 31, Nine Months Ended Dec. 31, 2019 2018 2019 2018 (In Thousands) GAAP Total Revenues $ 241,552 $ 241,414 $ 711,775 $ 734,751 Revenue Growth 0.1% (3.1%) Adjustments: Revenue associated with divestiture - - - (19,811) Allocated costs that remain after divestiture - - - (659) Impact of foreign currency exchange rates - (977) - (3,534) Total Adjustments $ - $ (977) $- $ (24,004) Non-GAAP Organic Revenues $ 241,552 $ 240,437 $ 711,775 $ 710,747 Non-GAAP Organic Revenues Growth 0.5% 0.1%

Three Months Ended Dec. 31, Nine Months Ended Dec. 31, Three Months Ended Dec. 31, Nine Months Ended Dec. 31, 2019 2018 2019 2018 2019 2018 2019 2018 (In Thousands) (In Thousands) GAAP Total Revenues $ 241,552 $ 241,414 $ 711,775 $ 734,751 GAAP General and Administrative Expense $ 21,308 $ 20,485 $ 65,528 $ 68,460 GAAP General and Administrative Expense as a Percentage of GAAP GAAP Gross Profit $ 137,495 $ 139,235 $ 408,313 $ 417,330 Total Revenue 8.8% 8.5% 9.2% 9.3% GAAP Gross Profit as a Percentage of GAAP Total Revenue 56.9% 57.7% 57.4% 56.8% Adjustments: Adjustments: (a) Transition and other costs associated with new warehouse and Transition and other costs associated with divestiture - - - 4,272 divestiture (a) 2,555 - 3,962 170 Total adjustments - - - 4,272 Total adjustments 2,555 - 3,962 170 Non-GAAP Adjusted General and Administrative Expense $ 21,308 $ 20,485 $ 65,528 $ 64,188 Non-GAAP Adjusted Gross Margin $ 140,050 $ 139,235 $ 412,275 $ 417,500 Non-GAAP Adjusted General and Administrative Expense Non-GAAP Adjusted Gross Margin as a Percentage of GAAP Total Percentage as a Percentage of GAAP Total Revenues 8.8% 8.5% 9.2% 8.7% Revenues 58.0% 57.7% 57.9% 56.8% a) Items related to new warehouse represent costs to transition to the new warehouse and duplicate costs incurred during a) Items related to divestiture represent costs related to divesting of assets sold including (but not limited to), costs to exit the transition. Items related to divestiture represent costs related to divesting of assets sold. or convert contractual obligations, severance and consulting costs; and certain costs related to the consummation of the divestiture process such as insurance costs, legal and other related professional fees.

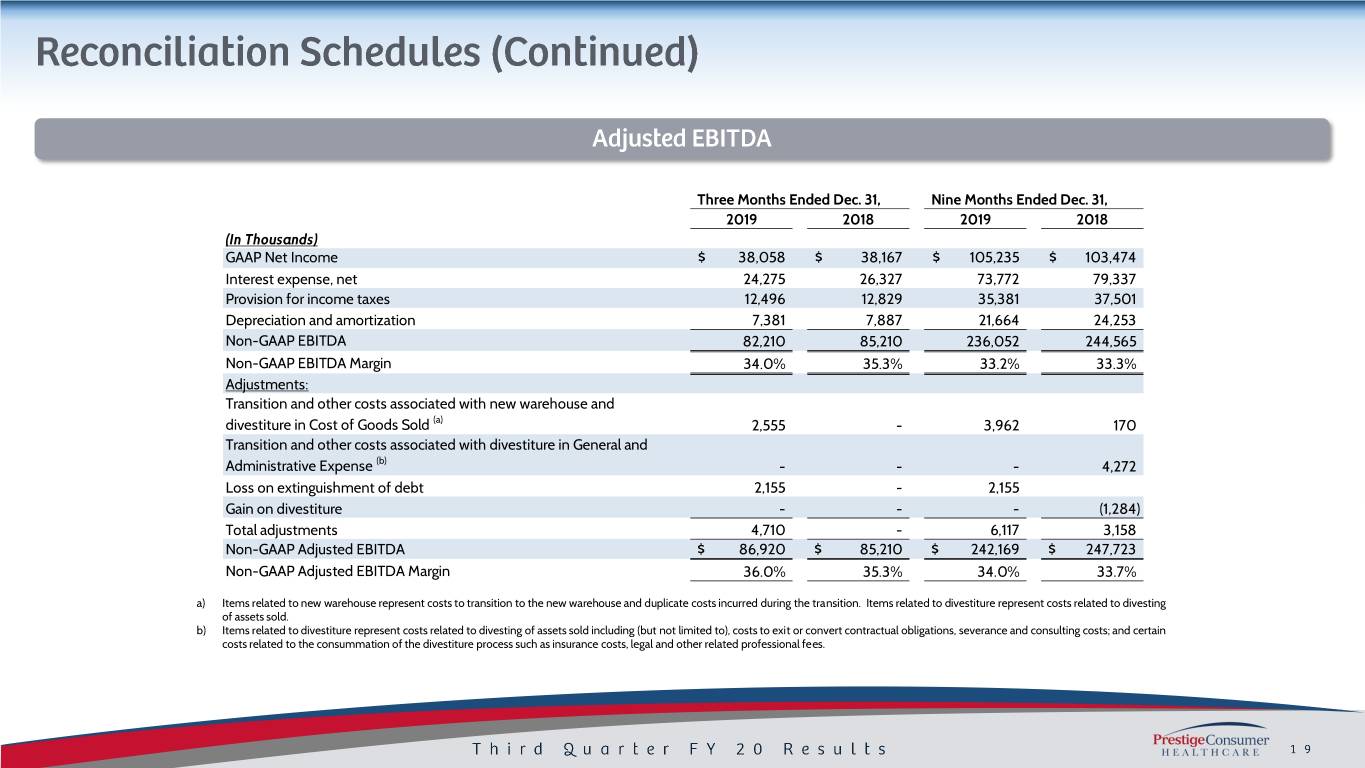
Three Months Ended Dec. 31, Nine Months Ended Dec. 31, 2019 2018 2019 2018 (In Thousands) GAAP Net Income $ 38,058 $ 38,167 $ 105,235 $ 103,474 Interest expense, net 24,275 26,327 73,772 79,337 Provision for income taxes 12,496 12,829 35,381 37,501 Depreciation and amortization 7,381 7,887 21,664 24,253 Non-GAAP EBITDA 82,210 85,210 236,052 244,565 Non-GAAP EBITDA Margin 34.0% 35.3% 33.2% 33.3% Adjustments: Transition and other costs associated with new warehouse and divestiture in Cost of Goods Sold (a) 2,555 - 3,962 170 Transition and other costs associated with divestiture in General and Administrative Expense (b) - - - 4,272 Loss on extinguishment of debt 2,155 - 2,155 Gain on divestiture - - - (1,284) Total adjustments 4,710 - 6,117 3,158 Non-GAAP Adjusted EBITDA $ 86,920 $ 85,210 $ 242,169 $ 247,723 Non-GAAP Adjusted EBITDA Margin 36.0% 35.3% 34.0% 33.7% a) Items related to new warehouse represent costs to transition to the new warehouse and duplicate costs incurred during the transition. Items related to divestiture represent costs related to divesting of assets sold. b) Items related to divestiture represent costs related to divesting of assets sold including (but not limited to), costs to exit or convert contractual obligations, severance and consulting costs; and certain costs related to the consummation of the divestiture process such as insurance costs, legal and other related professional fees.

Three Months Ended Dec. 31, Nine Months Ended Dec. 31, 2019 2018 2019 2018 Net Income EPS Net Income EPS Net Income EPS Net Income EPS (In Thousands, except per share data) GAAP Net Income $ 38,058 $ 0.75 $ 38,167 $ 0.73 $ 105,235 $ 2.05 $ 103,474 $ 1.97 Adjustments: Transition and other costs associated with new warehouse and divestiture in Cost of Goods Sold (a) 2,555 0.05 - - 3,962 0.08 170 - Transition and other costs associated with divestiture in General and Administrative Expense (b) - - - - - - 4,272 0.08 Loss on extinguishment of debt 2,155 0.04 - - 2,155 0.04 - - Gain on divestiture - - - - - - (1,284) (0.02) Accelerated amortization of debt origination costs - - - - - - 706 0.01 Tax impact of adjustments (c) (1,196) (0.02) - - (1,554) (0.03) 420 0.01 Normalized tax rate adjustment (d) (345) (0.01) - - (335) (0.01) 415 0.01 Total Adjustments 3,169 0.06 - - 4,228 0.08 4,699 0.09 Non-GAAP Adjusted Net Income and Adjusted EPS $ 41,227 $ 0.81 $ 3 8,167 $ 0.73 $ 109,463 $ 2.14 $ 108,173 $ 2.06 Note: Amounts may not add due to rounding. a) Items related to new warehouse represent costs to transition to the new warehouse and duplicate costs incurred during the transition. Items related to divestiture represent costs related to divesting of assets sold. b) Items related to divestiture represent costs related to divesting of assets sold including (but not limited to), costs to exit or convert contractual obligations, severance and consulting costs; and certain costs related to the consummation of the divestiture process such as insurance costs, legal and other related professional fees. c) The income tax adjustments are determined using applicable rates in the taxing jurisdictions in which the above adjustments relate and includes both current and deferred income tax expense (benefit) based on the specific nature of the specific Non-GAAP performance measure. d) Income tax adjustment to adjust for discrete income tax items.

Three Months Ended Dec. 31, Nine Months Ended Dec. 31, 2019 2018 2019 2018 (In Thousands) GAAP Net Income $ 38,058 $ 38,167 $ 105,235 $ 103,474 Adjustments: Adjustments to reconcile net income to net cash provided by operating activities as shown in the Statement of Cash Flows 17,089 14,371 45,985 37,425 Changes in operating assets and liabilities as shown in the Statement of Cash Flows 2,851 (9,208) 9,778 (2,462) Total Adjustments 19,940 5,163 55,763 34,963 GAAP Net cash provided by operating activities 57,998 43,330 160,998 138,437 Purchase of property and equipment (3,233) (2,065) (9,055) (7,139) Non-GAAP Free Cash Flow 54,765 41,265 151,943 131,298 Transition and other payments associated with new warehouse and divestiture (a) 1,517 3,284 2,327 10,902 Additional income tax payments associated with divestiture - 12,656 - 12,656 Non-GAAP Adjusted Free Cash Flow $ 56,282 $ 57,205 $ 154,270 $ 154,856 a) Payments related to new warehouse represent costs to transition to the new warehouse and duplicate costs incurred during the transition. Payments related to divestiture represent costs related to divesting of assets sold, including (but not limited to) costs to exit or convert contractual obligations, severance and consulting costs; and certain costs related to the consummation of the divestiture process such as legal and other related professional fees.

2020 Projected 2020 Projected EPS Free Cash Low High Flow Projected FY'20 GAAP EPS $ 2.67 $ 2.69 (In millions) Adjustments: Projected FY'20 GAAP Net Cash provided by operating activities $ 205 Integration of new logistics provider (a) 0.15 0.15 Additions to property and equipment for cash (15) Loss on extinguishment of debt 0.03 0.03 Projected Non-GAAP Free Cash Flow 190 Total Adjustments 0.18 0.18 Payments associated with integration of new logistics provider 10 Projected Non-GAAP Adjusted EPS $ 2.85 $ 2.87 Projected Non-GAAP Adjusted Free Cash Flow $ 200 a) Represents costs to integrate our new logistics provider into our operations.
