Attached files
| file | filename |
|---|---|
| 10-K - 10-K - FASTENAL CO | fast1231201910-k.htm |
| EX-32 - CERTIFICATIONS UNDER SECTION 906 OF THE SARBANES-OXLEY ACT OF 2002 - FASTENAL CO | fast1231201910-kexhibit32.htm |
| EX-31 - CERTIFICATIONS UNDER SECTION 302 OF THE SARBANES-OXLEY ACT OF 2002 - FASTENAL CO | fast1231201910-kexhibit31.htm |
| EX-23 - CONSENT OF INDEPENDENT REGISTERED PUBLIC ACCOUNTING FIRM - FASTENAL CO | fast1231201910-kexhibit23.htm |
| EX-21 - SUBSIDIARIES OF FASTENAL COMPANY - FASTENAL CO | fast1231201910-kexhibit21.htm |
| EX-10.1 - BONUS PROGRAM FOR EXECUTIVE OFFICERS - FASTENAL CO | fast1231201910-kexhibit101.htm |
| EX-4.4 - DESCRIPTION OF CAPITAL STOCK - FASTENAL CO | fast1231201910kexhibit44.htm |
2019 REPORT ANNUAL 2019 Annual Report
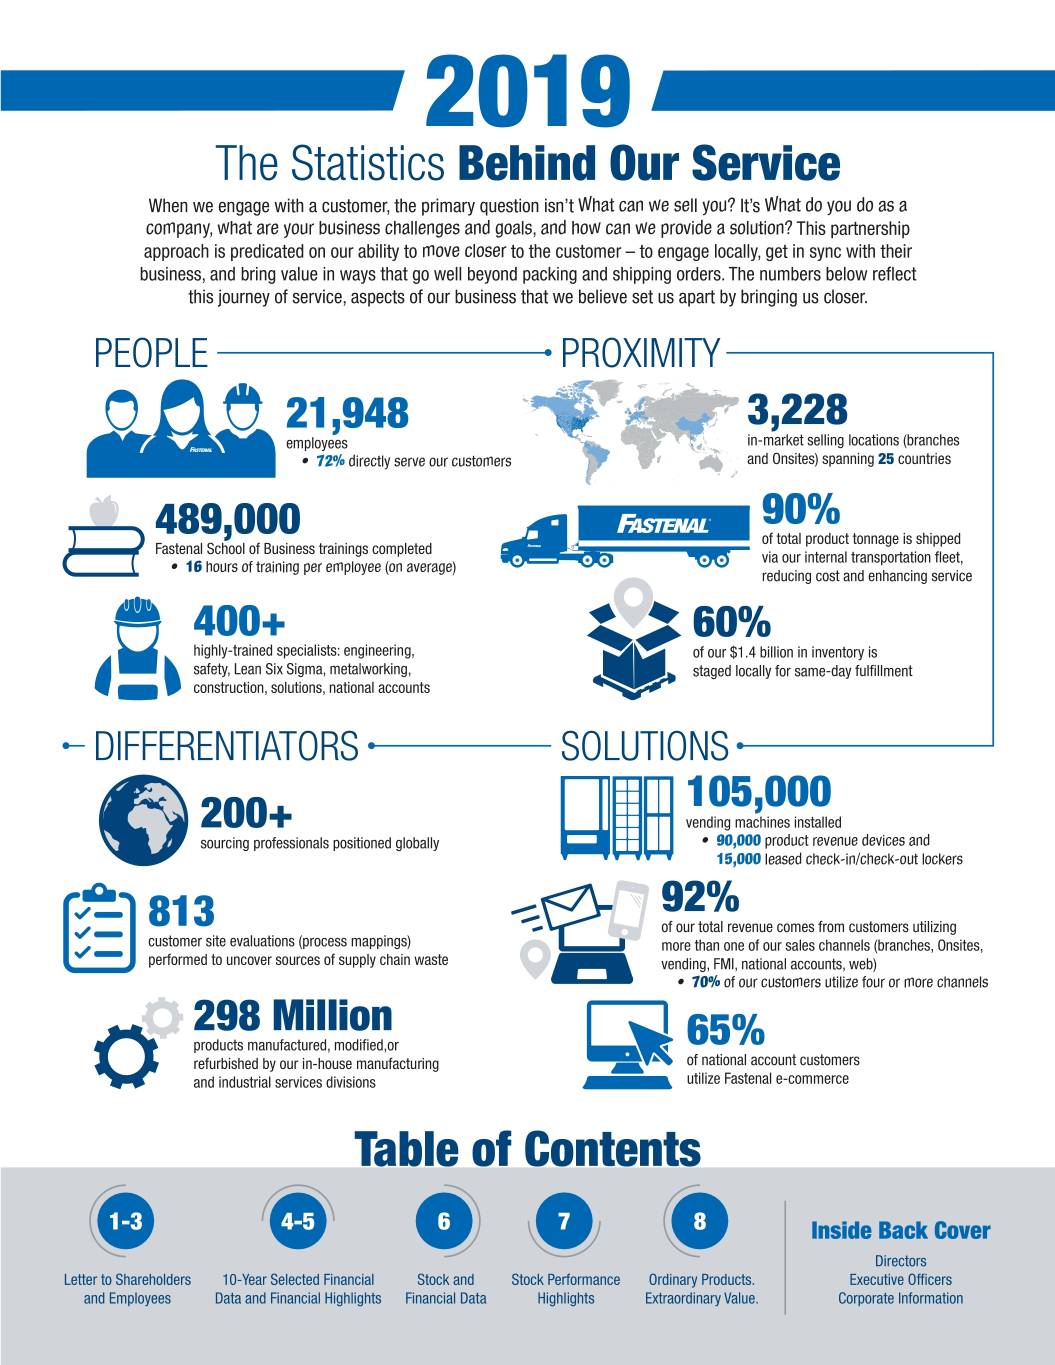
2019 The Statistics Behind Our Service When we engage with a customer, the primary question isn’t What can we sell you? It’s What do you do as a company, what are your business challenges and goals, and how can we provide a solution? This partnership approach is predicated on our ability to move closer to the customer – to engage locally, get in sync with their business, and bring value in ways that go well beyond packing and shipping orders. The numbers below reflect this journey of service, aspects of our business that we believe set us apart by bringing us closer. PEOPLE PROXIMITY 21,948 3,228 employees in-market selling locations (branches • 72% directly serve our customers and Onsites) spanning 25 countries 90% 489,000 of total product tonnage is shipped Fastenal School of Business trainings completed via our internal transportation fleet, • 16 hours of training per employee (on average) reducing cost and enhancing service 400+ 60% highly-trained specialists: engineering, of our $1.4 billion in inventory is safety, Lean Six Sigma, metalworking, staged locally for same-day fulfillment construction, solutions, national accounts DIFFERENTIATORS SOLUTIONS 105,000 200+ vending machines installed sourcing professionals positioned globally • 90,000 product revenue devices and 15,000 leased check-in/check-out lockers 92% 813 of our total revenue comes from customers utilizing customer site evaluations (process mappings) more than one of our sales channels (branches, Onsites, performed to uncover sources of supply chain waste vending, FMI, national accounts, web) • 70% of our customers utilize four or more channels 298 Million products manufactured, modified,or 65% refurbished by our in-house manufacturing of national account customers and industrial services divisions utilize Fastenal e-commerce Table of Contents 1-3 4-5 6 7 8 Inside Back Cover Directors Letter to Shareholders 10-Year Selected Financial Stock and Stock Performance Ordinary Products. Executive Officers and Employees Data and Financial Highlights Financial Data Highlights Extraordinary Value. Corporate Information 2 I 2019 ANNUAL REPORT
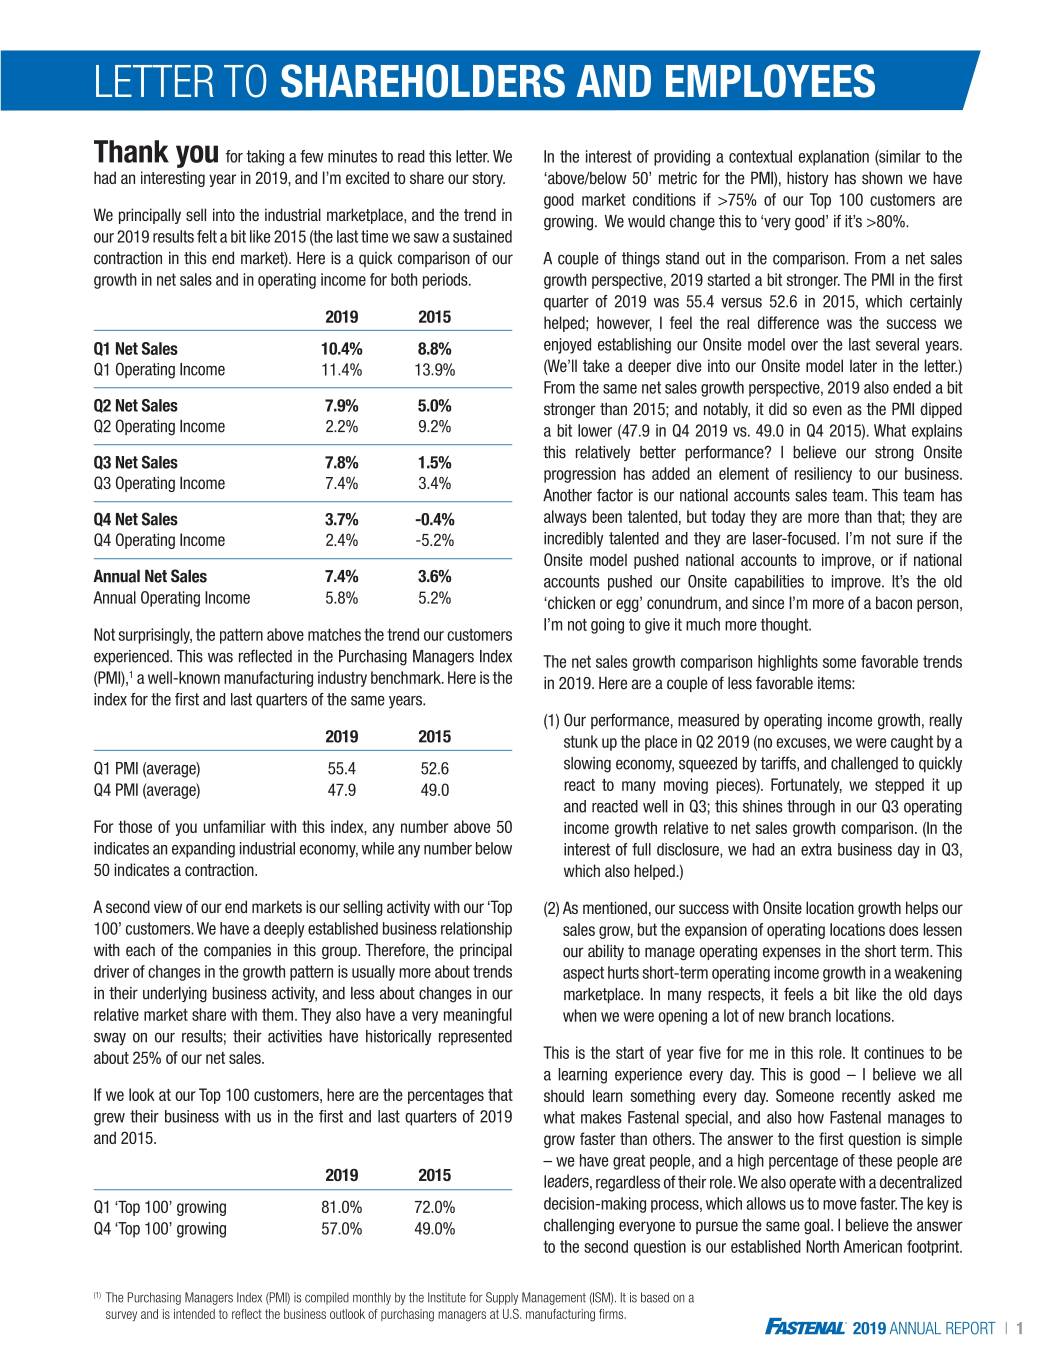
LETTER TO SHAREHOLDERS AND EMPLOYEES Thank you for taking a few minutes to read this letter. We In the interest of providing a contextual explanation (similar to the had an interesting year in 2019, and I’m excited to share our story. ‘above/below 50’ metric for the PMI), history has shown we have good market conditions if >75% of our Top 100 customers are We principally sell into the industrial marketplace, and the trend in growing. We would change this to ‘very good’ if it’s >80%. our 2019 results felt a bit like 2015 (the last time we saw a sustained contraction in this end market). Here is a quick comparison of our A couple of things stand out in the comparison. From a net sales growth in net sales and in operating income for both periods. growth perspective, 2019 started a bit stronger. The PMI in the first quarter of 2019 was 55.4 versus 52.6 in 2015, which certainly 2019 2015 helped; however, I feel the real difference was the success we Q1 Net Sales 10.4% 8.8% enjoyed establishing our Onsite model over the last several years. Q1 Operating Income 11.4% 13.9% (We’ll take a deeper dive into our Onsite model later in the letter.) From the same net sales growth perspective, 2019 also ended a bit Q2 Net Sales 7.9% 5.0% stronger than 2015; and notably, it did so even as the PMI dipped Q2 Operating Income 2.2% 9.2% a bit lower (47.9 in Q4 2019 vs. 49.0 in Q4 2015). What explains this relatively better performance? I believe our strong Onsite Q3 Net Sales 7.8% 1.5% progression has added an element of resiliency to our business. Q3 Operating Income 7.4% 3.4% Another factor is our national accounts sales team. This team has Q4 Net Sales 3.7% -0.4% always been talented, but today they are more than that; they are Q4 Operating Income 2.4% -5.2% incredibly talented and they are laser-focused. I’m not sure if the Onsite model pushed national accounts to improve, or if national Annual Net Sales 7.4% 3.6% accounts pushed our Onsite capabilities to improve. It’s the old Annual Operating Income 5.8% 5.2% ‘chicken or egg’ conundrum, and since I’m more of a bacon person, I’m not going to give it much more thought. Not surprisingly, the pattern above matches the trend our customers experienced. This was reflected in the Purchasing Managers Index The net sales growth comparison highlights some favorable trends 1 (PMI), a well-known manufacturing industry benchmark. Here is the in 2019. Here are a couple of less favorable items: index for the first and last quarters of the same years. (1) Our performance, measured by operating income growth, really 2019 2015 stunk up the place in Q2 2019 (no excuses, we were caught by a Q1 PMI (average) 55.4 52.6 slowing economy, squeezed by tariffs, and challenged to quickly Q4 PMI (average) 47.9 49.0 react to many moving pieces). Fortunately, we stepped it up and reacted well in Q3; this shines through in our Q3 operating For those of you unfamiliar with this index, any number above 50 income growth relative to net sales growth comparison. (In the indicates an expanding industrial economy, while any number below interest of full disclosure, we had an extra business day in Q3, 50 indicates a contraction. which also helped.) A second view of our end markets is our selling activity with our ‘Top (2) As mentioned, our success with Onsite location growth helps our 100’ customers. We have a deeply established business relationship sales grow, but the expansion of operating locations does lessen with each of the companies in this group. Therefore, the principal our ability to manage operating expenses in the short term. This driver of changes in the growth pattern is usually more about trends aspect hurts short-term operating income growth in a weakening in their underlying business activity, and less about changes in our marketplace. In many respects, it feels a bit like the old days relative market share with them. They also have a very meaningful when we were opening a lot of new branch locations. sway on our results; their activities have historically represented about 25% of our net sales. This is the start of year five for me in this role. It continues to be a learning experience every day. This is good – I believe we all If we look at our Top 100 customers, here are the percentages that should learn something every day. Someone recently asked me grew their business with us in the first and last quarters of 2019 what makes Fastenal special, and also how Fastenal manages to and 2015. grow faster than others. The answer to the first question is simple – we have great people, and a high percentage of these people are 2019 2015 leaders, regardless of their role. We also operate with a decentralized Q1 ‘Top 100’ growing 81.0% 72.0% decision-making process, which allows us to move faster. The key is Q4 ‘Top 100’ growing 57.0% 49.0% challenging everyone to pursue the same goal. I believe the answer to the second question is our established North American footprint. (1) The Purchasing Managers Index (PMI) is compiled monthly by the Institute for Supply Management (ISM). It is based on a survey and is intended to reflect the business outlook of purchasing managers at U.S. manufacturing firms. 2019 ANNUAL REPORT I 1
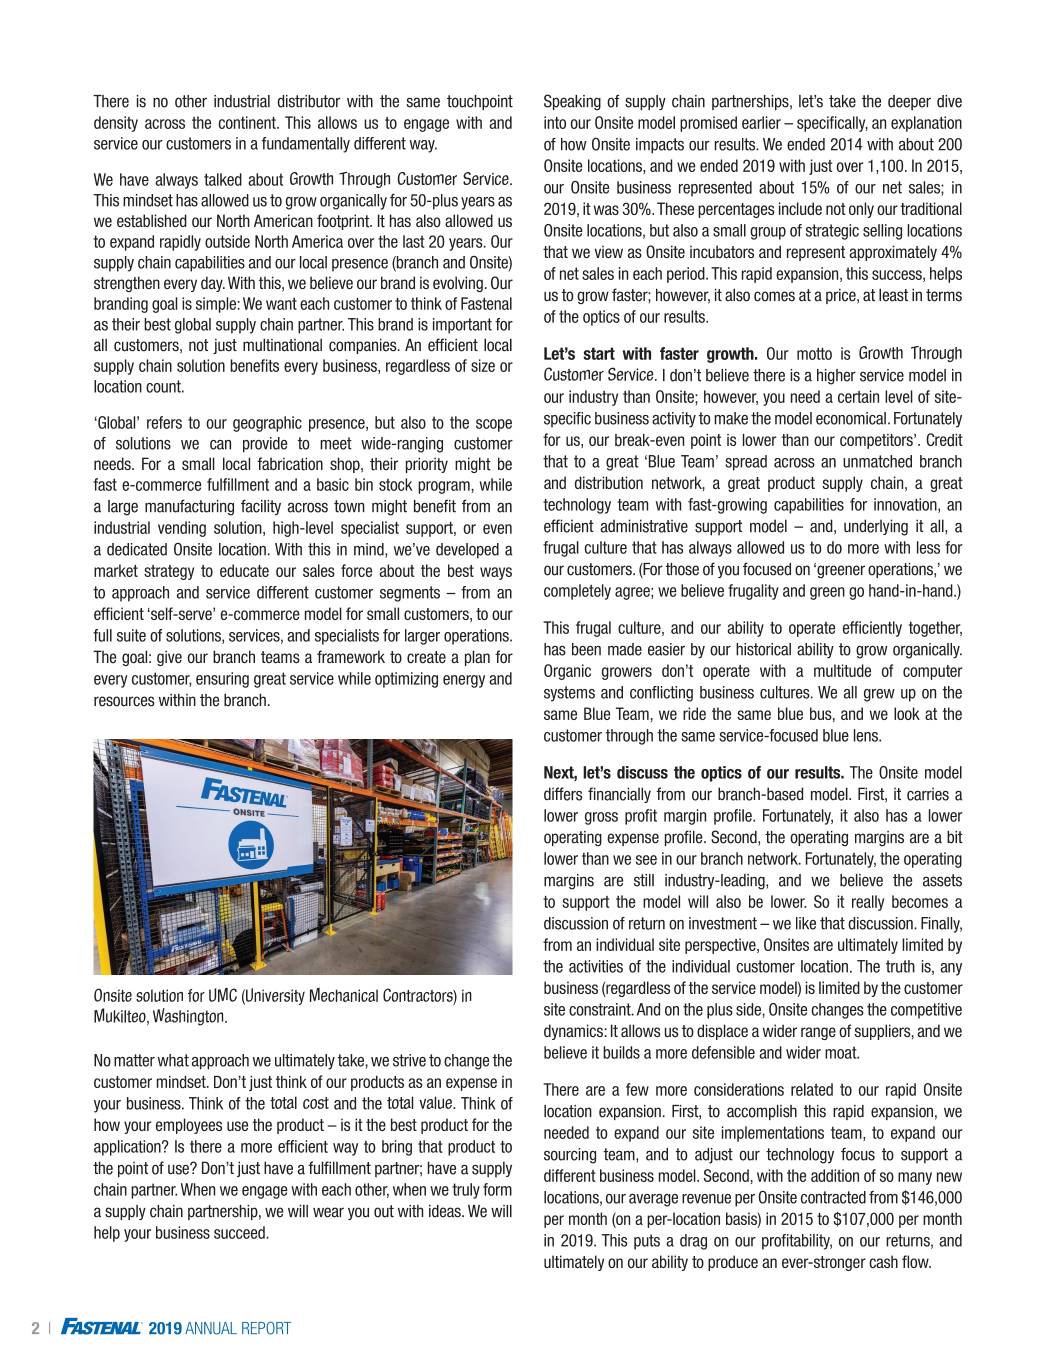
There is no other industrial distributor with the same touchpoint Speaking of supply chain partnerships, let’s take the deeper dive density across the continent. This allows us to engage with and into our Onsite model promised earlier – specifically, an explanation service our customers in a fundamentally different way. of how Onsite impacts our results. We ended 2014 with about 200 Onsite locations, and we ended 2019 with just over 1,100. In 2015, We have always talked about Growth Through Customer Service. our Onsite business represented about 15% of our net sales; in This mindset has allowed us to grow organically for 50-plus years as 2019, it was 30%. These percentages include not only our traditional we established our North American footprint. It has also allowed us Onsite locations, but also a small group of strategic selling locations to expand rapidly outside North America over the last 20 years. Our that we view as Onsite incubators and represent approximately 4% supply chain capabilities and our local presence (branch and Onsite) of net sales in each period. This rapid expansion, this success, helps strengthen every day. With this, we believe our brand is evolving. Our branding goal is simple: We want each customer to think of Fastenal us to grow faster; however, it also comes at a price, at least in terms as their best global supply chain partner. This brand is important for of the optics of our results. all customers, not just multinational companies. An efficient local Let’s start with faster growth. Our motto is Growth Through supply chain solution benefits every business, regardless of size or Customer Service. I don’t believe there is a higher service model in location count. our industry than Onsite; however, you need a certain level of site- ‘Global’ refers to our geographic presence, but also to the scope specific business activity to make the model economical. Fortunately of solutions we can provide to meet wide-ranging customer for us, our break-even point is lower than our competitors’. Credit needs. For a small local fabrication shop, their priority might be that to a great ‘Blue Team’ spread across an unmatched branch fast e-commerce fulfillment and a basic bin stock program, while and distribution network, a great product supply chain, a great a large manufacturing facility across town might benefit from an technology team with fast-growing capabilities for innovation, an industrial vending solution, high-level specialist support, or even efficient administrative support model – and, underlying it all, a a dedicated Onsite location. With this in mind, we’ve developed a frugal culture that has always allowed us to do more with less for market strategy to educate our sales force about the best ways our customers. (For those of you focused on ‘greener operations,’ we to approach and service different customer segments – from an completely agree; we believe frugality and green go hand-in-hand.) efficient ‘self-serve’ e-commerce model for small customers, to our full suite of solutions, services, and specialists for larger operations. This frugal culture, and our ability to operate efficiently together, The goal: give our branch teams a framework to create a plan for has been made easier by our historical ability to grow organically. every customer, ensuring great service while optimizing energy and Organic growers don’t operate with a multitude of computer resources within the branch. systems and conflicting business cultures. We all grew up on the same Blue Team, we ride the same blue bus, and we look at the customer through the same service-focused blue lens. Next, let’s discuss the optics of our results. The Onsite model differs financially from our branch-based model. First, it carries a lower gross profit margin profile. Fortunately, it also has a lower operating expense profile. Second, the operating margins are a bit lower than we see in our branch network. Fortunately, the operating margins are still industry-leading, and we believe the assets to support the model will also be lower. So it really becomes a discussion of return on investment – we like that discussion. Finally, from an individual site perspective, Onsites are ultimately limited by the activities of the individual customer location. The truth is, any Onsite solution for UMC (University Mechanical Contractors) in business (regardless of the service model) is limited by the customer Mukilteo, Washington. site constraint. And on the plus side, Onsite changes the competitive dynamics: It allows us to displace a wider range of suppliers, and we No matter what approach we ultimately take, we strive to change the believe it builds a more defensible and wider moat. customer mindset. Don’t just think of our products as an expense in There are a few more considerations related to our rapid Onsite your business. Think of the total cost and the total value. Think of location expansion. First, to accomplish this rapid expansion, we how your employees use the product – is it the best product for the needed to expand our site implementations team, to expand our application? Is there a more efficient way to bring that product to sourcing team, and to adjust our technology focus to support a the point of use? Don’t just have a fulfillment partner; have a supply different business model. Second, with the addition of so many new chain partner. When we engage with each other, when we truly form locations, our average revenue per Onsite contracted from $146,000 a supply chain partnership, we will wear you out with ideas. We will per month (on a per-location basis) in 2015 to $107,000 per month help your business succeed. in 2019. This puts a drag on our profitability, on our returns, and ultimately on our ability to produce an ever-stronger cash flow. 2 I 2019 ANNUAL REPORT

Understanding Our For those of you with a longer Fastenal time horizon, think of this as a short-term ‘Pathway to Profit’ in reverse. We believe our rate of change will stabilize late in 2020/early in 2021. This will allow our GROWTH DRIVERS revenue per Onsite location to stabilize and then begin to expand. It will also stabilize our ‘branch economic drag.’ Every time we pull a customer out of a branch and move Onsite (whether we are in their facility or nearby), we temporarily lessen the financial performance of the original branch. The trade-off: We ignite the customer relationship, unlock selling energy in the branch, and grow the market faster overall. As you can appreciate, we like the trade-off. To learn more about Onsite and the rest of our growth drivers, please read the sidebar to the right (also featured in last year’s letter). Leadership is critical to our success at Fastenal, and I don’t mean leadership in terms of a person, but rather in terms of a mindset. Every person can be a leader through their actions. If you look inside the back cover of this annual report, you will see two groups of people. The first set of photos is our board of directors. This group represents you every day. They take their governance seriously, but equally important, they challenge the Blue Team with Onsite solution for the School Board of Sarasota County, their varying perspectives on the world, on business, and on people. Sarasota, Florida. The second set of photos is our leadership team. Unfortunately, there There’s a term used repeatedly in this letter and in our isn’t enough space to show the entire group. We have just under other conversations; the term is growth driver. For a bit of 22,000 employees at Fastenal. Everyone exercises daily leadership. perspective, here is how we think of this concept. Historically, They demonstrate this through problem-solving and by embodying our primary growth driver was opening new branch locations. our cultural values: Ambition, Innovation, Integrity, and Teamwork. This expanded our reach, and we added people into these new locations and into existing locations as they grew. We A person you won’t see on the back cover, but whose influence also added people behind the scenes to provide deeper is always present, is our founder, Bob Kierlin. Since Fastenal’s support. Beginning in the late 1990s, the rate of openings founding in 1967, Bob has always demonstrated the wisdom of began to slow. By 2007, we had an established footprint in humble leadership – a willingness to trust others to make great the United States and in Canada; therefore, we slowed our decisions, along with the courage to challenge everyone to pursue openings further. The pattern further decelerated to the point a common goal. Our commitment to challenge one another (and where we had minimal net openings in 2009, and we began to ourselves) can cause some constructive friction, but we’ve found it contract the network in the 2011 time frame. This maturation creates an atmosphere that attracts and retains talent. This ability to of our branch network gave us an opportunity to develop and retain talent is showcased every December when we celebrate our fund new growth drivers (plural), adding new dimensions to latest class of 25-year employees. Our 2019 class consisted of 60 our service. employees, an impressive number given the size of our organization when they joined us back in 1994. We’re proud (and fortunate) they Today, these growth drivers include an expanded national chose to spend their careers with Fastenal. accounts team (focused on larger customers with operations around the planet), our Onsite service model (customer- Perhaps you noticed the change to the name of this year’s letter. The specific locations, preferably inside the customer’s facility, or at inclusion of ‘employees’ in the name is a reflection of how we have least very nearby), vending (point-of-use dispensing, storage, operated for 52 years and the comments we made in last year’s delivery, and reporting technology within the customer’s letter regarding our four priorities: our customers, our employees, facility and at our Fastenal facilities), international expansion our suppliers, and our shareholders. (like branch openings of the past, a means to extend our reach of resources closer to the customer), construction (we are a Thank you for your belief in our Blue Team. And thank you for great multi-location source for these transient customers, and being a shareholder and/or an employee of Fastenal. we’re making strides to serve them better), and e-commerce (making it easier for customers to source products and gain visibility into their supply chain, while introducing productivity gains for both the customer and for Fastenal in the process). We’re excited about the evolution of our growth strategy and DANIEL L. FLORNESS will continually evaluate new ideas and directions to best President and Chief Executive Officer serve our customers in a fast-changing world. 2019 ANNUAL REPORT I 3
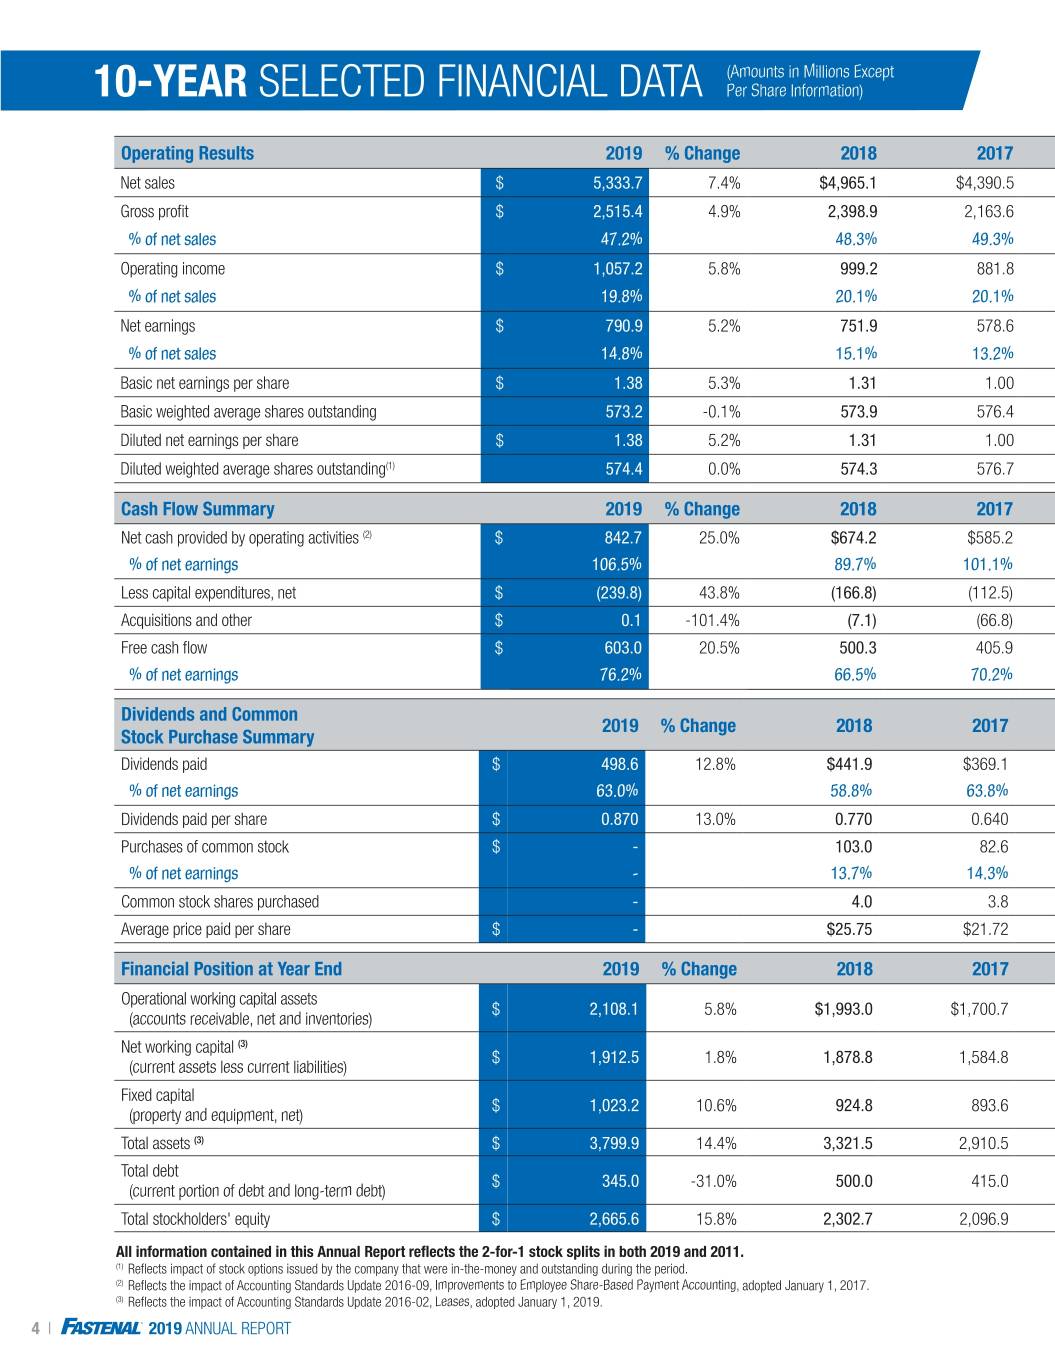
(Amounts in Millions Except 10-YEAR SELECTED FINANCIAL DATA Per Share Information) Operating Results 2019 % Change 2018 2017 2016 2015 2014 2013 2012 2011 2010 Net sales $ 5,333.7 7.4% $4,965.1 $4,390.5 $3,962.0 $3,869.2 $3,733.5 $3,326.1 $3,133.6 $2,766.9 $2,269.5 Gross profit $ 2,515.4 4.9% 2,398.9 2,163.6 1,964.8 1,948.9 1,897.4 1,719.4 1,614.5 1,434.2 1,174.8 % of net sales 47.2% 48.3% 49.3% 49.6% 50.4% 50.8% 51.7% 51.5% 51.8% 51.8% Operating income $ 1,057.2 5.8% 999.2 881.8 795.8 828.8 787.6 712.7 673.7 574.6 429.7 % of net sales 19.8% 20.1% 20.1% 20.1% 21.4% 21.1% 21.4% 21.5% 20.8% 19.0% Net earnings $ 790.9 5.2% 751.9 578.6 499.4 516.4 494.2 448.6 420.5 357.9 265.4 % of net sales 14.8% 15.1% 13.2% 12.6% 13.3% 13.2% 13.5% 13.4% 12.9% 11.7% Basic net earnings per share $ 1.38 5.3% 1.31 1.00 0.86 0.89 0.83 0.76 0.71 0.61 0.45 Basic weighted average shares outstanding 573.2 -0.1% 573.9 576.4 577.9 582.9 593.0 593.5 592.2 590.1 589.7 Diluted net earnings per share $ 1.38 5.2% 1.31 1.00 0.86 0.88 0.83 0.75 0.71 0.60 0.45 Diluted weighted average shares outstanding(1) 574.4 0.0% 574.3 576.7 578.3 584.1 594.6 595.4 594.3 591.7 589.7 Cash Flow Summary 2019 % Change 2018 2017 2016 2015 2014 2013 2012 2011 2010 Net cash provided by operating activities (2) $ 842.7 25.0% $674.2 $585.2 $519.9 $550.3 $501.5 $418.9 $406.4 $268.5 $240.4 % of net earnings 106.5% 89.7% 101.1% 104.1% 106.6% 101.5% 93.4% 96.6% 75.0% 90.6% Less capital expenditures, net $ (239.8) 43.8% (166.8) (112.5) (183.0) (145.3) (183.7) (201.6) (133.9) (116.5) (69.1) Acquisitions and other $ 0.1 -101.4% (7.1) (66.8) (5.1) (35.3) (5.6) (0.1) (0.1) 0.2 (10.3) Free cash flow $ 603.0 20.5% 500.3 405.9 331.8 369.7 312.2 217.2 272.4 152.2 161.0 % of net earnings 76.2% 66.5% 70.2% 66.4% 71.6% 63.2% 48.4% 64.8% 42.5% 60.7% Dividends and Common 2019 % Change 2018 2017 2016 2015 2014 2013 2012 2011 2010 Stock Purchase Summary Dividends paid $ 498.6 12.8% $441.9 $369.1 $346.6 $327.1 $296.6 $237.5 $367.3 $191.7 $182.8 % of net earnings 63.0% 58.8% 63.8% 69.4% 63.3% 60.0% 52.9% 87.3% 53.6% 68.9% Dividends paid per share $ 0.870 13.0% 0.770 0.640 0.600 0.560 0.500 0.400 0.620 0.325 0.310 Purchases of common stock $ - - 103.0 82.6 59.5 292.9 52.9 9.1 - - - % of net earnings - 13.7% 14.3% 11.9% 56.7% 10.7% 2.0% - - - Common stock shares purchased - - 4.0 3.8 3.2 14.2 2.4 0.4 - - - Average price paid per share $ - - $25.75 $21.72 $18.58 $20.63 $22.06 $22.70 - - - Financial Position at Year End 2019 % Change 2018 2017 2016 2015 2014 2013 2012 2011 2010 Operational working capital assets $ 2,108.1 5.8% $1,993.0 $1,700.7 $1,492.7 $1,381.6 $1,331.3 $1,198.4 $1,087.5 $984.7 $827.5 (accounts receivable, net and inventories) Net working capital (3) $ 1,912.5 1.8% 1,878.8 1,584.8 1,445.1 1,291.6 1,207.9 1,168.6 1,082.5 1,048.3 923.5 (current assets less current liabilities) Fixed capital $ 1,023.2 10.6% 924.8 893.6 899.7 818.9 763.9 654.9 516.4 435.6 363.4 (property and equipment, net) Total assets (3) $ 3,799.9 14.4% 3,321.5 2,910.5 2,668.9 2,532.5 2,359.1 2,075.8 1,815.8 1,684.9 1,468.3 Total debt $ 345.0 -31.0% 500.0 415.0 390.0 365.0 90.0 - - - - (current portion of debt and long-term debt) Total stockholders' equity $ 2,665.6 15.8% 2,302.7 2,096.9 1,933.1 1,801.3 1,915.2 1,772.7 1,560.4 1,459.0 1,282.5 All information contained in this Annual Report reflects the 2-for-1 stock splits in both 2019 and 2011. (1) Reflects impact of stock options issued by the company that were in-the-money and outstanding during the period. (2) Reflects the impact of Accounting Standards Update 2016-09, Improvements to Employee Share-Based Payment Accounting, adopted January 1, 2017. (3) Reflects the impact of Accounting Standards Update 2016-02, Leases, adopted January 1, 2019. 4 I 2019 ANNUAL REPORT
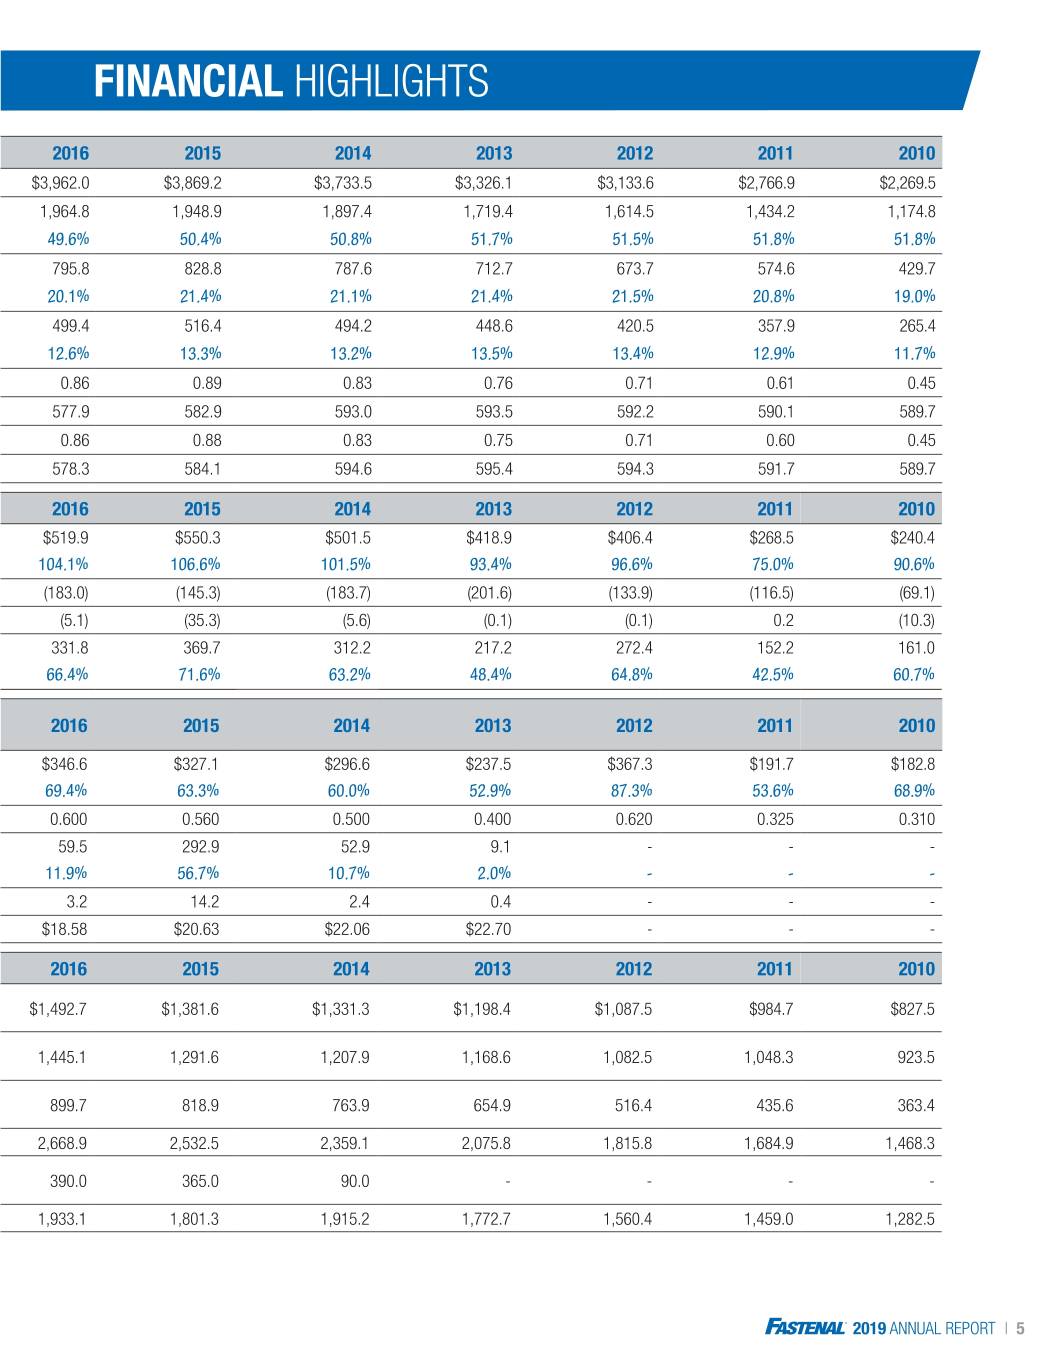
FINANCIAL HIGHLIGHTS Operating Results 2019 % Change 2018 2017 2016 2015 2014 2013 2012 2011 2010 Net sales $ 5,333.7 7.4% $4,965.1 $4,390.5 $3,962.0 $3,869.2 $3,733.5 $3,326.1 $3,133.6 $2,766.9 $2,269.5 Gross profit $ 2,515.4 4.9% 2,398.9 2,163.6 1,964.8 1,948.9 1,897.4 1,719.4 1,614.5 1,434.2 1,174.8 % of net sales 47.2% 48.3% 49.3% 49.6% 50.4% 50.8% 51.7% 51.5% 51.8% 51.8% Operating income $ 1,057.2 5.8% 999.2 881.8 795.8 828.8 787.6 712.7 673.7 574.6 429.7 % of net sales 19.8% 20.1% 20.1% 20.1% 21.4% 21.1% 21.4% 21.5% 20.8% 19.0% Net earnings $ 790.9 5.2% 751.9 578.6 499.4 516.4 494.2 448.6 420.5 357.9 265.4 % of net sales 14.8% 15.1% 13.2% 12.6% 13.3% 13.2% 13.5% 13.4% 12.9% 11.7% Basic net earnings per share $ 1.38 5.3% 1.31 1.00 0.86 0.89 0.83 0.76 0.71 0.61 0.45 Basic weighted average shares outstanding 573.2 -0.1% 573.9 576.4 577.9 582.9 593.0 593.5 592.2 590.1 589.7 Diluted net earnings per share $ 1.38 5.2% 1.31 1.00 0.86 0.88 0.83 0.75 0.71 0.60 0.45 Diluted weighted average shares outstanding(1) 574.4 0.0% 574.3 576.7 578.3 584.1 594.6 595.4 594.3 591.7 589.7 Cash Flow Summary 2019 % Change 2018 2017 2016 2015 2014 2013 2012 2011 2010 Net cash provided by operating activities (2) $ 842.7 25.0% $674.2 $585.2 $519.9 $550.3 $501.5 $418.9 $406.4 $268.5 $240.4 % of net earnings 106.5% 89.7% 101.1% 104.1% 106.6% 101.5% 93.4% 96.6% 75.0% 90.6% Less capital expenditures, net $ (239.8) 43.8% (166.8) (112.5) (183.0) (145.3) (183.7) (201.6) (133.9) (116.5) (69.1) Acquisitions and other $ 0.1 -101.4% (7.1) (66.8) (5.1) (35.3) (5.6) (0.1) (0.1) 0.2 (10.3) Free cash flow $ 603.0 20.5% 500.3 405.9 331.8 369.7 312.2 217.2 272.4 152.2 161.0 % of net earnings 76.2% 66.5% 70.2% 66.4% 71.6% 63.2% 48.4% 64.8% 42.5% 60.7% Dividends and Common 2019 % Change 2018 2017 2016 2015 2014 2013 2012 2011 2010 Stock Purchase Summary Dividends paid $ 498.6 12.8% $441.9 $369.1 $346.6 $327.1 $296.6 $237.5 $367.3 $191.7 $182.8 % of net earnings 63.0% 58.8% 63.8% 69.4% 63.3% 60.0% 52.9% 87.3% 53.6% 68.9% Dividends paid per share $ 0.870 13.0% 0.770 0.640 0.600 0.560 0.500 0.400 0.620 0.325 0.310 Purchases of common stock $ - - 103.0 82.6 59.5 292.9 52.9 9.1 - - - % of net earnings - 13.7% 14.3% 11.9% 56.7% 10.7% 2.0% - - - Common stock shares purchased - - 4.0 3.8 3.2 14.2 2.4 0.4 - - - Average price paid per share $ - - $25.75 $21.72 $18.58 $20.63 $22.06 $22.70 - - - Financial Position at Year End 2019 % Change 2018 2017 2016 2015 2014 2013 2012 2011 2010 Operational working capital assets $ 2,108.1 5.8% $1,993.0 $1,700.7 $1,492.7 $1,381.6 $1,331.3 $1,198.4 $1,087.5 $984.7 $827.5 (accounts receivable, net and inventories) Net working capital (3) $ 1,912.5 1.8% 1,878.8 1,584.8 1,445.1 1,291.6 1,207.9 1,168.6 1,082.5 1,048.3 923.5 (current assets less current liabilities) Fixed capital $ 1,023.2 10.6% 924.8 893.6 899.7 818.9 763.9 654.9 516.4 435.6 363.4 (property and equipment, net) Total assets (3) $ 3,799.9 14.4% 3,321.5 2,910.5 2,668.9 2,532.5 2,359.1 2,075.8 1,815.8 1,684.9 1,468.3 Total debt $ 345.0 -31.0% 500.0 415.0 390.0 365.0 90.0 - - - - (current portion of debt and long-term debt) Total stockholders' equity $ 2,665.6 15.8% 2,302.7 2,096.9 1,933.1 1,801.3 1,915.2 1,772.7 1,560.4 1,459.0 1,282.5 All information contained in this Annual Report reflects the 2-for-1 stock splits in both 2019 and 2011. (1) Reflects impact of stock options issued by the company that were in-the-money and outstanding during the period. (2) Reflects the impact of Accounting Standards Update 2016-09, Improvements to Employee Share-Based Payment Accounting, adopted January 1, 2017. (3) Reflects the impact of Accounting Standards Update 2016-02, Leases, adopted January 1, 2019. 2019 ANNUAL REPORT I 5
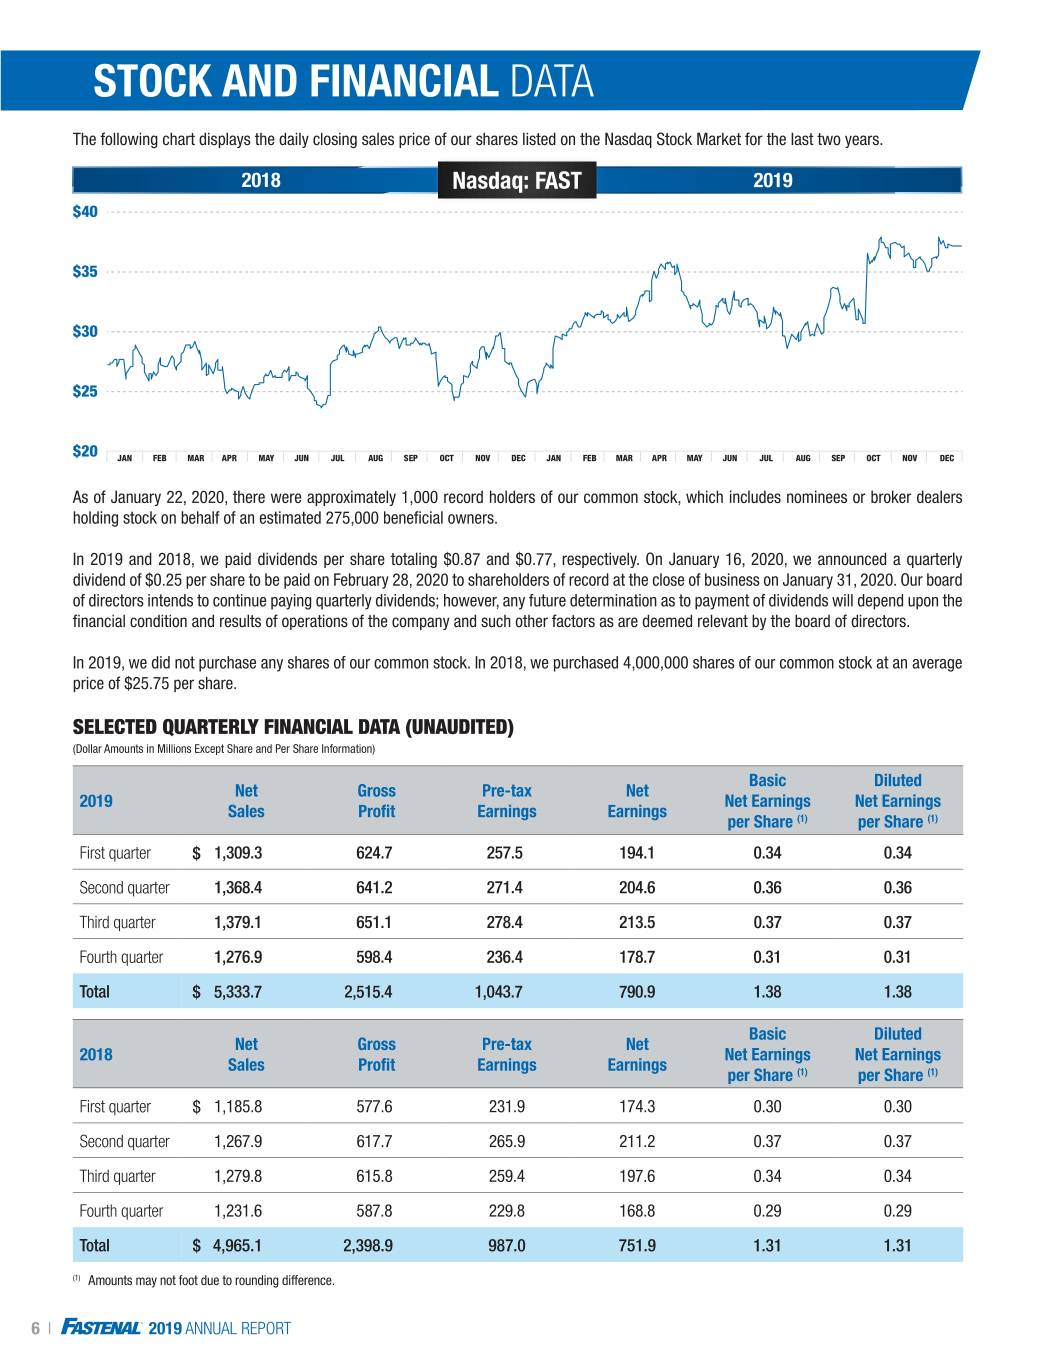
STOCK AND FINANCIAL DATA The following chart displays the daily closing sales price of our shares listed on the Nasdaq Stock Market for the last two years. 2018 Nasdaq: FAST 2019 As of January 22, 2020, there were approximately 1,000 record holders of our common stock, which includes nominees or broker dealers holding stock on behalf of an estimated 275,000 beneficial owners. In 2019 and 2018, we paid dividends per share totaling $0.87 and $0.77, respectively. On January 16, 2020, we announced a quarterly dividend of $0.25 per share to be paid on February 28, 2020 to shareholders of record at the close of business on January 31, 2020. Our board of directors intends to continue paying quarterly dividends; however, any future determination as to payment of dividends will depend upon the financial condition and results of operations of the company and such other factors as are deemed relevant by the board of directors. In 2019, we did not purchase any shares of our common stock. In 2018, we purchased 4,000,000 shares of our common stock at an average price of $25.75 per share. SELECTED QUARTERLY FINANCIAL DATA (UNAUDITED) (Dollar Amounts in Millions Except Share and Per Share Information) Basic Diluted Net Gross Pre-tax Net 2019 Net Earnings Net Earnings Sales Profit Earnings Earnings per Share (1) per Share (1) First quarter $ 1,309.3 624.7 257.5 194.1 0.34 0.34 Second quarter 1,368.4 641.2 271.4 204.6 0.36 0.36 Third quarter 1,379.1 651.1 278.4 213.5 0.37 0.37 Fourth quarter 1,276.9 598.4 236.4 178.7 0.31 0.31 $ Total $ 5,333.7 2,515.4 1,043.7 790.9 1.38 1.38 Basic Diluted Net Gross Pre-tax Net 2018 Net Earnings Net Earnings Sales Profit Earnings Earnings per Share (1) per Share (1) First quarter $ 1,185.8 577.6 231.9 174.3 0.30 0.30 Second quarter 1,267.9 617.7 265.9 211.2 0.37 0.37 Third quarter 1,279.8 615.8 259.4 197.6 0.34 0.34 Fourth quarter 1,231.6 587.8 229.8 168.8 0.29 0.29 Total $ 4,965.1 2,398.9 987.0 751.9 1.31 1.31 (1) Amounts may not foot due to rounding difference. 6 I 2019 ANNUAL REPORT
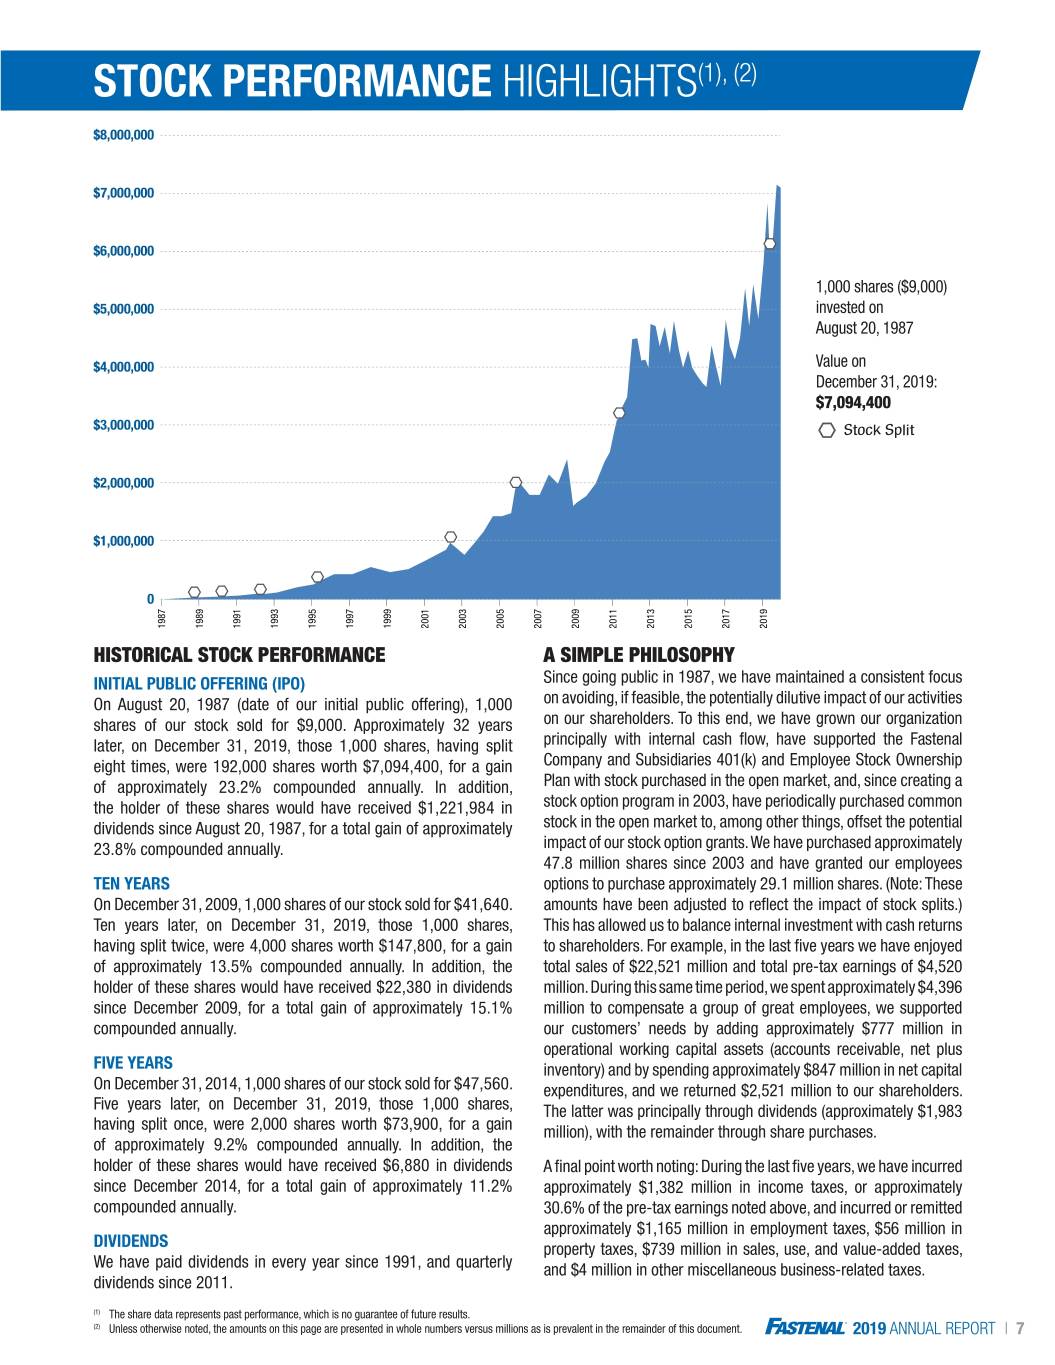
STOCK PERFORMANCE HIGHLIGHTS(1), (2) 1,000 shares ($9,000) invested on August 20, 1987 Value on December 31, 2019: $7,094,400 Stock Split HISTORICAL STOCK PERFORMANCE A SIMPLE PHILOSOPHY INITIAL PUBLIC OFFERING (IPO) Since going public in 1987, we have maintained a consistent focus On August 20, 1987 (date of our initial public offering), 1,000 on avoiding, if feasible, the potentially dilutive impact of our activities shares of our stock sold for $9,000. Approximately 32 years on our shareholders. To this end, we have grown our organization later, on December 31, 2019, those 1,000 shares, having split principally with internal cash flow, have supported the Fastenal eight times, were 192,000 shares worth $7,094,400, for a gain Company and Subsidiaries 401(k) and Employee Stock Ownership of approximately 23.2% compounded annually. In addition, Plan with stock purchased in the open market, and, since creating a the holder of these shares would have received $1,221,984 in stock option program in 2003, have periodically purchased common dividends since August 20, 1987, for a total gain of approximately stock in the open market to, among other things, offset the potential 23.8% compounded annually. impact of our stock option grants. We have purchased approximately 47.8 million shares since 2003 and have granted our employees TEN YEARS options to purchase approximately 29.1 million shares. (Note: These On December 31, 2009, 1,000 shares of our stock sold for $41,640. amounts have been adjusted to reflect the impact of stock splits.) Ten years later, on December 31, 2019, those 1,000 shares, This has allowed us to balance internal investment with cash returns having split twice, were 4,000 shares worth $147,800, for a gain to shareholders. For example, in the last five years we have enjoyed of approximately 13.5% compounded annually. In addition, the total sales of $22,521 million and total pre-tax earnings of $4,520 holder of these shares would have received $22,380 in dividends million. During this same time period, we spent approximately $4,396 since December 2009, for a total gain of approximately 15.1% million to compensate a group of great employees, we supported compounded annually. our customers’ needs by adding approximately $777 million in operational working capital assets (accounts receivable, net plus FIVE YEARS inventory) and by spending approximately $847 million in net capital On December 31, 2014, 1,000 shares of our stock sold for $47,560. expenditures, and we returned $2,521 million to our shareholders. Five years later, on December 31, 2019, those 1,000 shares, The latter was principally through dividends (approximately $1,983 having split once, were 2,000 shares worth $73,900, for a gain million), with the remainder through share purchases. of approximately 9.2% compounded annually. In addition, the holder of these shares would have received $6,880 in dividends A final point worth noting: During the last five years, we have incurred since December 2014, for a total gain of approximately 11.2% approximately $1,382 million in income taxes, or approximately compounded annually. 30.6% of the pre-tax earnings noted above, and incurred or remitted approximately $1,165 million in employment taxes, $56 million in DIVIDENDS property taxes, $739 million in sales, use, and value-added taxes, We have paid dividends in every year since 1991, and quarterly and $4 million in other miscellaneous business-related taxes. dividends since 2011. (1) The share data represents past performance, which is no guarantee of future results. (2) Unless otherwise noted, the amounts on this page are presented in whole numbers versus millions as is prevalent in the remainder of this document. 2019 ANNUAL REPORT I 7
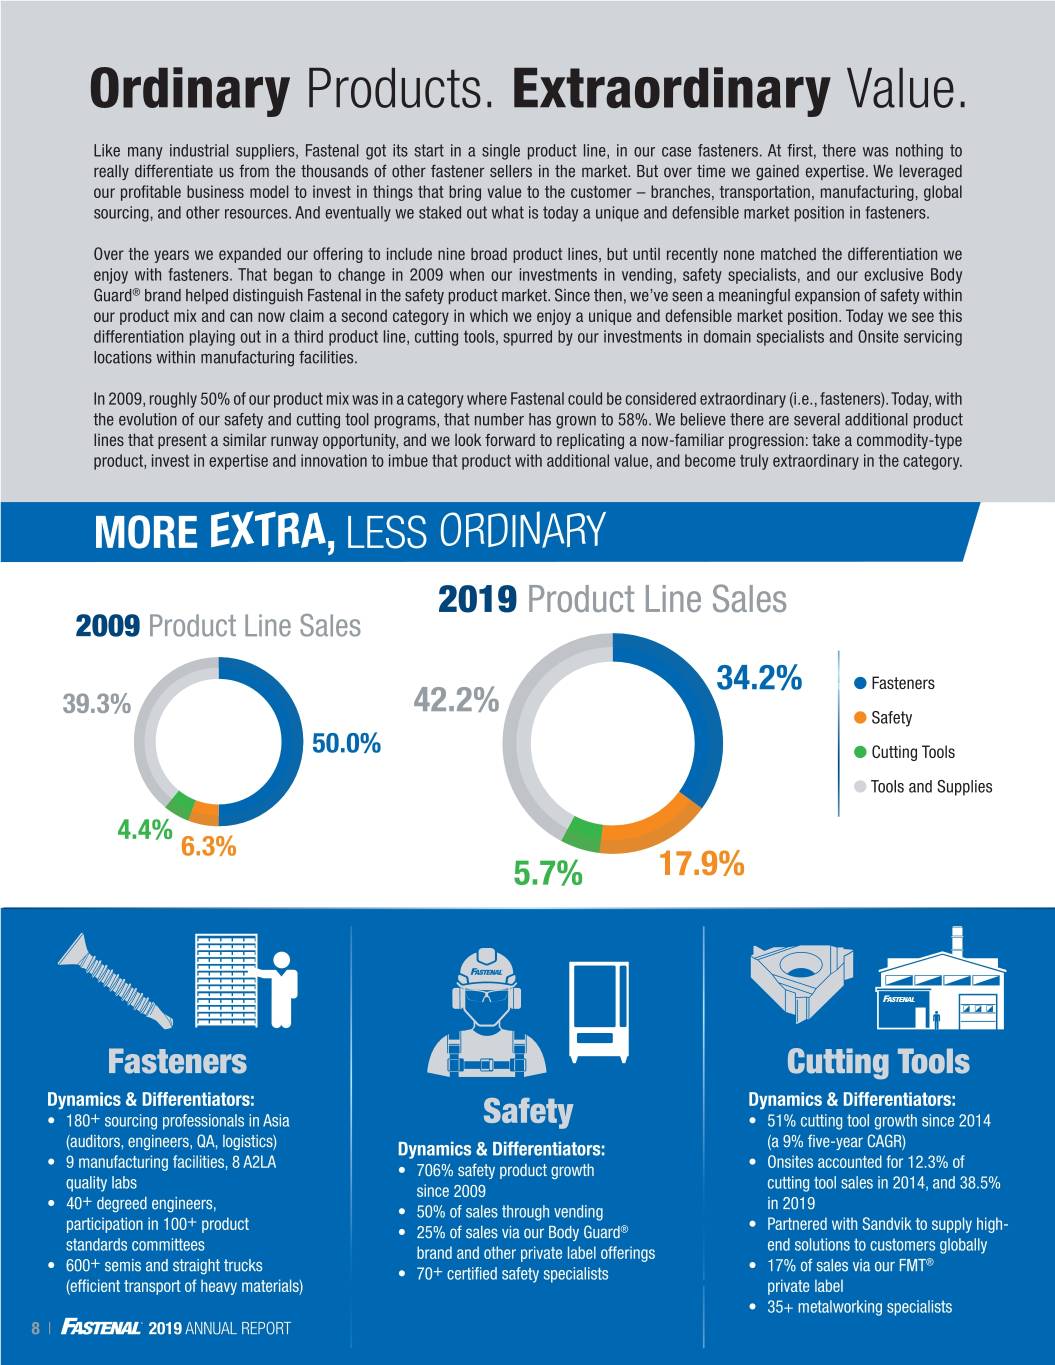
Ordinary Products. Extraordinary Value. Like many industrial suppliers, Fastenal got its start in a single product line, in our case fasteners. At first, there was nothing to really differentiate us from the thousands of other fastener sellers in the market. But over time we gained expertise. We leveraged our profitable business model to invest in things that bring value to the customer – branches, transportation, manufacturing, global sourcing, and other resources. And eventually we staked out what is today a unique and defensible market position in fasteners. Over the years we expanded our offering to include nine broad product lines, but until recently none matched the differentiation we enjoy with fasteners. That began to change in 2009 when our investments in vending, safety specialists, and our exclusive Body Guard® brand helped distinguish Fastenal in the safety product market. Since then, we’ve seen a meaningful expansion of safety within our product mix and can now claim a second category in which we enjoy a unique and defensible market position. Today we see this differentiation playing out in a third product line, cutting tools, spurred by our investments in domain specialists and Onsite servicing locations within manufacturing facilities. In 2009, roughly 50% of our product mix was in a category where Fastenal could be considered extraordinary (i.e., fasteners). Today, with the evolution of our safety and cutting tool programs, that number has grown to 58%. We believe there are several additional product lines that present a similar runway opportunity, and we look forward to replicating a now-familiar progression: take a commodity-type product, invest in expertise and innovation to imbue that product with additional value, and become truly extraordinary in the category. MORE EXTRA, LESS ORDINARY 2019 Product Line Sales 2009 Product Line Sales 34.2% l Fasteners 39.3% 42.2% l Safety 50.0% l Cutting Tools l Tools and Supplies 4.4% 6.3% 5.7% 17.9% Fasteners Cutting Tools Dynamics & Differentiators: Dynamics & Differentiators: • 180+ sourcing professionals in Asia Safety • 51% cutting tool growth since 2014 (auditors, engineers, QA, logistics) Dynamics & Differentiators: (a 9% five-year CAGR) • 9 manufacturing facilities, 8 A2LA • 706% safety product growth • Onsites accounted for 12.3% of quality labs since 2009 cutting tool sales in 2014, and 38.5% + • 40 degreed engineers, • 50% of sales through vending in 2019 + participation in 100 product • 25% of sales via our Body Guard® • Partnered with Sandvik to supply high- standards committees brand and other private label offerings end solutions to customers globally + ® • 600 semis and straight trucks • 70+ certified safety specialists • 17% of sales via our FMT (efficient transport of heavy materials) private label • 35+ metalworking specialists 8 I 2019 ANNUAL REPORT
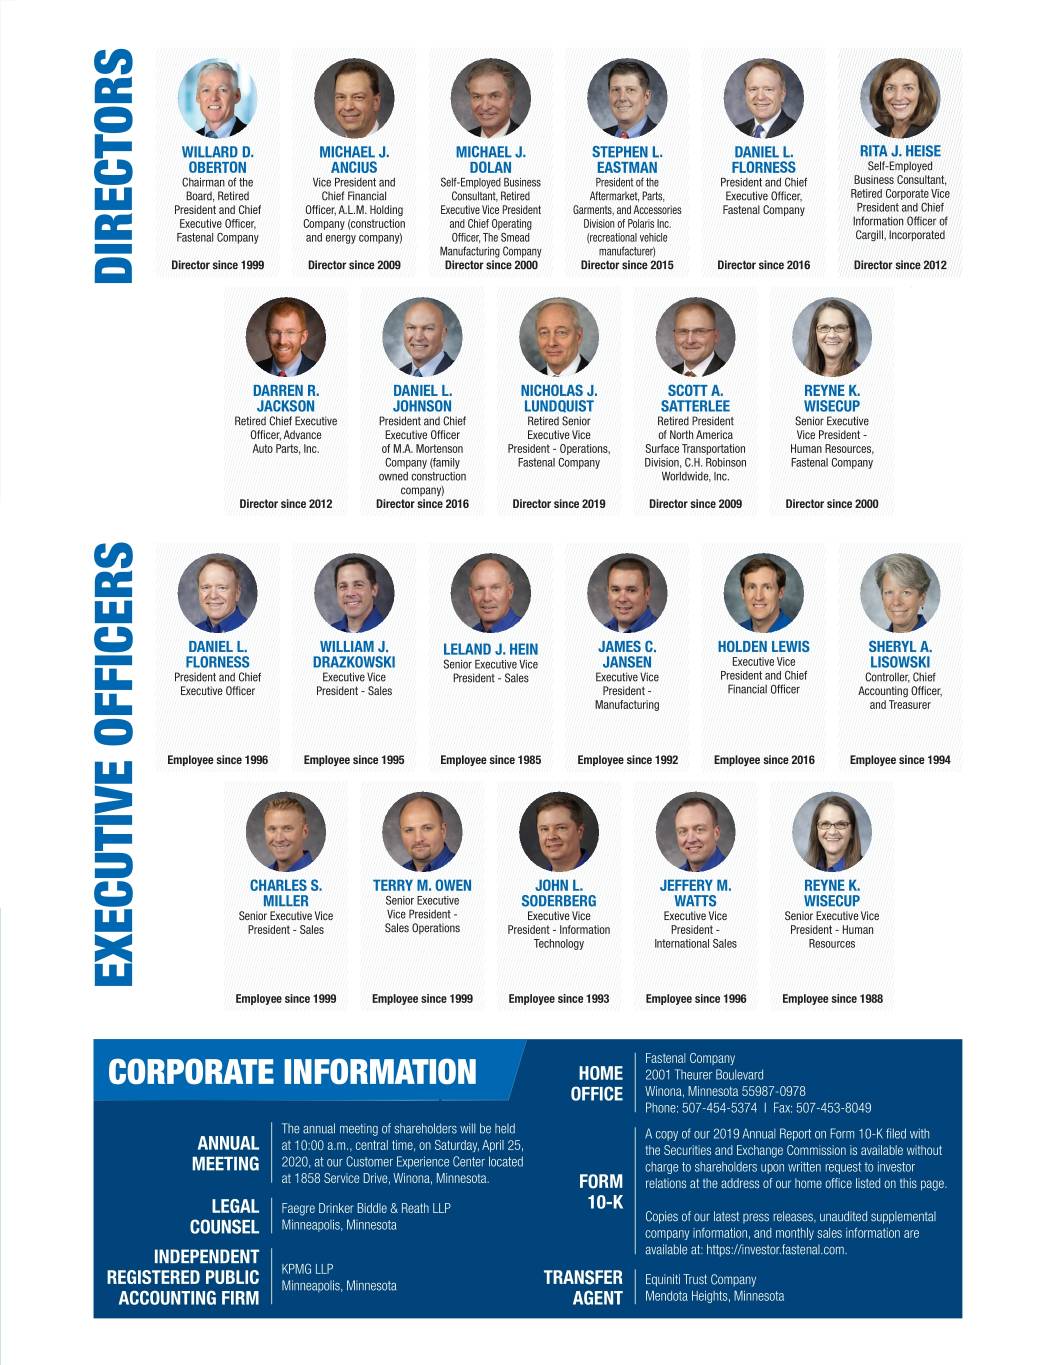
REGISTERED PUBLIC CORPORATE INFORMATION ACCOUNTING FIRM EXECUTIVE OFFICERS DIRECTORS INDEPENDENT Employee since1996 Director since1999 President andChief President andChief Fastenal Company Executive Officer, Executive Officer WILLARD D. Chairman ofthe FLORNESS Board, Retired DANIEL L. OBERTON COUNSEL MEETING ANNUAL LEGAL Retired ChiefExecutive Employee since1999 Senior Executive Vice Senior Director since2012 President -Sales CHARLES S. Officer, Advance Auto Parts, Inc. DARREN R. JACKSON MILLER Minneapolis, Minnesota KPMG LLP Minneapolis, Minnesota LLP DrinkerBiddle&Reath Faegre Drive, 1858Service at Winona, Minnesota. 2020, ourCustomer ExperienceCenterlocated at 10:00a.m.,at centraltime, onSaturday, April 25, The annualmeetingofshareholderswillbeheld Company (construction Company Employee since1995 Officer, Holding A.L.M. and energy company) and energy Director since2009 DRAZKOWSKI Vice Presidentand President -Sales MICHAEL J. WILLIAM J. Chief Financial Executive Vice ANCIUS Employee since1999 TERRY M. OWEN Director since2016 owned construction owned President andChief of M.A. Mortenson Sales Operations Executive Officer Company (family Company Senior Executive Vice President- JOHNSON DANIEL L. company) Manufacturing Company Employee since1985 Executive Vice President Executive Vice Self-Employed Business Self-Employed LELAND J. HEIN Senior Executive Vice Senior Director since2000 and Chief Operating and ChiefOperating Consultant, Retired Officer, Smead The President -Sales MICHAEL J. DOLAN President - Information President -Information President -Operations, Employee since1993 Director since2019 Fastenal Company NICHOLAS J. SODERBERG LUNDQUIST Executive Vice Executive Vice Retired Senior Technology JOHN L. TRANSFER OFFICE AGENT Garments, and Accessories Garments, Employee since1992 HOME FORM Director since2015 Division ofPolaris Inc. (recreational vehicle(recreational 10-K Aftermarket, Parts, STEPHEN L. Manufacturing Executive Vice President ofthe EASTMAN JAMES C. manufacturer) JANSEN President - Division, C.H. Robinson Mendota Heights, Minnesota Equiniti TrustCompany at:available https://investor.fastenal.com. information,company are salesinformation and monthly pressreleases,Copies ofourlatest unauditedsupplemental theaddressofourhomeofficelisted on thispage. at relations charge toshareholdersuponwrittenrequest toinvestor without the SecuritiesandExchangeCommission isavailable of our 2019 A copy Annual ReportonForm10-Kfiledwith Phone: 507-454-5374IFax: 507-453-8049 Winona, Minnesota55987-0978 Boulevard 2001 Theurer Fastenal Company Surface Transportation Employee since1996 Director since2009 International Sales International Retired President of North America of JEFFERY M. SATTERLEE Worldwide, Inc. Executive Vice SCOTT A. President - WATTS Employee since2016 Director since2016 HOLDEN LEWIS President andChief President andChief Fastenal Company Executive Officer, Financial Officer FLORNESS Executive Vice DANIEL L. Employee since1988 Senior Executive Vice Senior Director since2000 Human Resources, President -Human Fastenal Company Senior Executive Vice President- WISECUP WISECUP REYNE K. REYNE K. Resources Employee since1994 Retired Corporate Vice Corporate Retired Information Officerof Information Director since2012 Business Consultant, Cargill, Incorporated President andChief Accounting Officer, RITA J. HEISE Controller, Chief Self-Employed Self-Employed SHERYL A. and Treasurer LISOWSKI

109706563 I 2019 Annual Report 2019| 2.20 JP ANNUAL | Printed in the REPORT USA
