Attached files
| file | filename |
|---|---|
| EX-99.1 - EXHIBIT 99.1 - Nuance Communications, Inc. | ex991pressreleasedecem.htm |
| 8-K - 8-K - Nuance Communications, Inc. | nuan8-kpressrelease123.htm |
Exhibit 99.2
1 | 2020 First Quarter Results |
Prepared Remarks | |
February 5, 2020 | |
Prepared Remarks
Nuance First Quarter of Fiscal Year 2020
Prepared Remarks and Earnings Conference Call
We are providing these prepared remarks, in combination with the press release, to provide additional detail in advance of the quarterly conference call. These prepared remarks will not be read on the call.
The conference call will begin at 5:00 p.m. ET today. To participate, please access the live webcast at http://investors.nuance.com, or by dial (877) 273-6124 (US and Canada) or (647) 689-5393 (international) and reference code 4753319.
Both these and the quarterly conference call remarks include certain forward-looking statements and non-GAAP financial measures. Please reference the “Safe Harbor and Forward-Looking Statements” section for important caveats with respect to forward-looking information, and the “Discussion of non-GAAP Financial Measures” and related Supplemental Financial Information for more details on our non-GAAP financial measures.
Q1 2020 Summary
The first quarter demonstrated our continued ability to execute on our financial commitments and strategic initiatives. In Q1, we generated revenue and earnings per share above the high end of our guidance, with strong performance in Enterprise and Dragon Medical cloud. We generated 2% organic revenue growth on our strategic businesses, which represent 98% of total revenue (excluding Other). Our Enterprise business segment ended the quarter with record revenue performance, growing 7% compared to the prior year period. Within Healthcare, we continue to see very strong growth in our cloud businesses, particularly Dragon Medical cloud, which grew 51% compared to Q1 2019. Despite this growth, overall Healthcare revenue declined 1% with expected declines in our low margin HIM transcription and EHR implementation services businesses, as well as Dragon Medical maintenance and license revenue as we migrate our on-premise installed base to the cloud.
Our profit margins were in line with our guidance expectation as we continue to increase investments in our strategic priorities within R&D and Sales. As a reminder, 2019 produced an excellent operating margin that exceeded our initial guidance expectations. This was in part due to the success and acceleration of our cost savings initiatives early in 2019, which outpaced the growing spend for our strategic investments. During Q1, we executed as planned on these initiatives, and the ramping of our priority investments remains on track and contemplated in our 2020 margin guidance.
We repurchased 6.8 million shares from October 1, 2020 through January 31, 2020 at an average price of $16.68. We also paid down $300 million in high-yield bonds and today, announced our plans to retire $47 million of convertible debentures. As discussed during our Investor Day in December, our capital allocation continues to focus on share repurchase and debt retirement.
Q1 2020 Reporting and Presentation Resulting from the Automotive Spin
With the completion of the Automotive spin on October 1, 2020, we are presenting historical results on a continuing and discontinued operations basis, giving effect to the transaction and excluding historical Automotive results from continuing operations. Unless otherwise stated in this document, financial results and relevant metrics, guidance, year-over-year financial comparisons, and trends are presented for continuing operations only.
 | © 2020 Nuance Communications, Inc. All rights reserved | |
Exhibit 99.2
2 | 2020 First Quarter Results |
Prepared Remarks | |
February 5, 2020 | |
The net results of the discontinued operations are presented as a single line item on our consolidated statements of operations and cash flows. The assets and liabilities of the discontinued operations have been combined into assets or liabilities held for sale line items in each of the current and long-term sections of the consolidated balance sheets. These financial statements enable investors to clearly distinguish the profits, cash flows, assets and liabilities of continuing operations from activities that have ceased.
Q1 2020 Summary of GAAP and Non-GAAP Financial Results
Q1 2020 Detailed Financial Results
Table: Q1 Results for Continuing Operations
($ in millions except earnings per share) | Continuing Operations | ||
Q1 2019 | Q1 2020 | Change* | |
GAAP Revenue | $419.7 | $418.2 | -$1.5 |
Non-GAAP Revenue | $420.0 | $418.3 | -$1.7 |
GAAP Gross Profit | $235.6 | $233.8 | -$1.8 |
Gross Margin % | 56.1% | 55.9% | -20 bps |
Non-GAAP Gross Profit | $250.7 | $246.7 | -$4.0 |
Gross Margin % | 59.7% | 59.0% | -70 bps |
GAAP Operating Income | $46.8 | $52.1 | $5.3 |
GAAP Operating Margin | 11.1% | 12.5% | 140 bps |
Non-GAAP Operating Income | $119.8 | $110.7 | -$9.1 |
Non-GAAP Operating Margin | 28.5% | 26.5% | -200 bps |
GAAP Net Income | $13.9 | $54.9 | $41.0 |
Non-GAAP Net Income | $78.5 | $78.6 | $0.1 |
GAAP Diluted EPS | $0.05 | $0.19 | $0.14 |
Non-GAAP Diluted EPS | $0.27 | $0.27 | $0.00 |
* Change in dollars, percentage and basis points calculated using actual results. May not add due to rounding for table presentation purposes.
Revenue
• | Q1 20 GAAP revenue decreased $1.5 million year over year to $418.2 million. |
• | Q1 20 non-GAAP revenue of $418.3 million was approximately flat year over year on an as reported basis and grew 1% on an organic basis. This was due to strong growth and a record quarter in Enterprise and Dragon Medical cloud, offset in part by the continued wind-down of our Other segment, as well as expected declines in our non-strategic HIM transcription and EHR implementation services businesses. |
• | Q1 20 organic revenue adjusted for currency grew 1% as revenues were negatively impacted by approximately 40 basis points due to currency fluctuations. |
| © 2020 Nuance Communications, Inc. All rights reserved | |
Exhibit 99.2
3 | 2020 First Quarter Results |
Prepared Remarks | |
February 5, 2020 | |
Revenue by Type
Table: Non-GAAP Revenue by Type and as a Percentage of Total Non-GAAP Revenue
($ in millions) | Q1 | Q2 | Q3 | Q4 | FY | Q1 |
2019 | 2019 | 2019 | 2019 | 2019 | 2020 | |
Hosting | $186.8 | $179.5 | $188.2 | $194.9 | $749.4 | $195.0 |
% of Revenue | 44% | 53% | 50% | 50% | 49% | 47% |
Maintenance & Support | $76.2 | $60.9 | $66.4 | $65.7 | $269.3 | $62.6 |
% of Revenue | 18% | 18% | 18% | 17% | 18% | 15% |
Product and Licensing | $115.9 | $58.3 | $78.7 | $86.4 | $339.4 | $125.2 |
% of Revenue | 28% | 17% | 21% | 22% | 22% | 30% |
Professional Services | $41.1 | $38.2 | $44.8 | $40.7 | $164.8 | $35.5 |
% of Revenue | 10% | 11% | 12% | 11% | 11% | 8% |
Total Non-GAAP Revenue | $420.0 | $336.9 | $378.1 | $387.8 | $1,522.8 | $418.3 |
In Q1 2020, we saw the following year-over-year trends in revenue types:
• | Hosting revenue grew $8.2 million, representing 47% of total revenue, driven by growth in Dragon Medical cloud and Enterprise, offset in part by continued declines in our HIM transcription business and the wind-down activities in our Other segment. |
• | Maintenance and Support revenue declined $13.6 million as we continue to migrate our Dragon Medical on-premise customers to the cloud. |
• | Product and Licensing revenue increased $9.3 million, primarily due to a strong Enterprise license revenue quarter. |
• | Professional Services revenue was down $5.6 million primarily due to expected declines in our non-strategic EHR implementation services business, as well as declines in Dragon Medical services as we continue to migrate our Dragon Medical on-premise customers to the cloud. |
Gross Margin
Table: Non-GAAP Gross Profit and Gross Margin
($ in millions) | Q1 | Q2 | Q3 | Q4 | FY | Q1 |
2019 | 2019 | 2019 | 2019 | 2019 | 2020 | |
Gross Profit | $250.7 | $189.6 | $220.6 | $235.0 | $895.9 | $246.7 |
Gross Profit Margin | 59.7% | 56.3% | 58.4% | 60.6% | 58.8% | 59.0% |
• | In Q1 20, GAAP gross margin was 55.9%, a decrease of -20 basis points year over year. |
• | In Q1 20, non-GAAP gross margin was 59.0%, a decrease of 70 basis points year over year, primarily due to a decline in high margin Dragon Medical maintenance and support revenue as our on-premise customers migrate to the cloud. |
| © 2020 Nuance Communications, Inc. All rights reserved | |
Exhibit 99.2
4 | 2020 First Quarter Results |
Prepared Remarks | |
February 5, 2020 | |
Operating Expenses and Operating Margin
Table: Non-GAAP Operating Profit and Operating Margin
($ in millions) | Q1 | Q2 | Q3 | Q4 | FY | Q1 |
2019 | 2019 | 2019 | 2019 | 2019 | 2020 | |
Continuing Operations Operating Profit | $119.8 | $57.3 | $91.8 | $94.1 | $363.0 | $110.7 |
Operating Profit Margin | 28.5% | 17.0% | 24.3% | 24.3% | 23.8% | 26.5% |
• | In Q1 20, GAAP operating expenses were $181.7 million, compared to $188.8 million one year ago. GAAP operating margin was 12.5%, compared to 11.1% one year ago. |
• | In Q1 20, non-GAAP operating expenses were $136.0 million, up from $130.9 million one year ago primarily due to the ramping of strategic R&D and Sales expenses. Non-GAAP operating margin was 26.5%, a decrease of 200 basis points year over year due to the operating expense investments and gross margin dynamics noted above. |
Interest Expense
• | In Q1 20, GAAP net interest expense was $21.6 million, down $8.1 million year over year. |
• | In Q1 20, non-GAAP net interest expense was $8.9 million, down $8.5 million year over year. The decrease reflects lower interest expense due to the repayment activity of our high yield bonds, including the repayment of $300 million in March 2019 related to proceeds from the Imaging sale and another $300 million in October 2019 related to proceeds from the Automotive spin. |
Provision for Income Taxes
• | In Q1 20, GAAP provision/(benefit) for income taxes was ($36.4) million, compared to $2.0 million provision one year ago. The Q1 20 taxes include a $36.4 million tax benefit related to a valuation allowance adjustment on deferred tax assets that transferred as part of the Automotive spin. |
• | In Q1 20, non-GAAP provision for income taxes was $25.7 million, representing a non-GAAP effective tax rate of 24.7%, compared to $23.1 million one year ago, representing a non-GAAP effective tax rate of 22.7%. |
• | In Q1 20, cash taxes were $0.8 million, compared to $4.3 million one year ago. The cash tax for Q1 20 includes a $5.2 million benefit related to the finalization of tax reform legislation regarding 2019 tax rates. |
Earnings Performance
• | Q1 20 GAAP earnings per share from continuing operations were $0.19, compared to $0.05 per share one year ago. |
• | Q1 20 non-GAAP earnings per share from continuing operations were $0.27, flat compared to one year ago despite the ramp of strategic R&D and Sales investments due to reduced interest expense from paying down debt and lower share count. |
| © 2020 Nuance Communications, Inc. All rights reserved | |
Exhibit 99.2
5 | 2020 First Quarter Results |
Prepared Remarks | |
February 5, 2020 | |
Cash Flow from Operations (CFFO)
Table: Cash Flow from Operations
($ in millions) | Q1 | Q2 | Q3 | Q4 | FY | Q1 |
2019 | 2019 | 2019 | 2019 | 2019 | 2020 | |
Cash Flow from Continuing Operations | $72.7 | $79.5 | $73.2 | $79.2 | $304.6 | $66.9 |
Cash Flow from Discontinued Operations | $27.2 | $24.1 | $20.5 | $24.9 | $96.8 | ($13.3) |
Total Cash Flow from Operations | $99.9 | $103.7 | $93.6 | $104.2 | $401.4 | $53.6 |
* May not add due to rounding for table presentation purposes.
As of December 31, 2019, our balance of cash, cash equivalents and marketable securities was $510.0 million.
Share Repurchase
In the first quarter of 2020, we repurchased approximately 5.7 million shares of common stock at an average price of $16.24 and an additional 1.1 million shares from January 1, 2020 through January 31, 2020. There is $316.9 million still available under our existing authorization for share repurchases.
Days Sales Outstanding (DSO)
Table: Days Sales Outstanding (DSO)
Q1 | Q2 | Q3 | Q4 | Q1 | |
2019 | 2019 | 2019 | 2019 | 2020 | |
DSO for Continuing Operations | 57 | 60 | 58 | 56 | 56 |
| © 2020 Nuance Communications, Inc. All rights reserved | |
Exhibit 99.2
6 | 2020 First Quarter Results |
Prepared Remarks | |
February 5, 2020 | |
Discussion of Segments
Table: Non-GAAP Segment Revenue
($ in millions) | Q1 | Q2 | Q3 | Q4 | FY | Q1 |
2019 | 2019 | 2019 | 2019 | 2019 | 2020 | |
Healthcare | $272.0 | $204.5 | $228.4 | $245.7 | $950.6 | $270.5 |
Yr/yr Organic Growth | -1% | |||||
% of Total Revenue | 65% | 61% | 60% | 63% | 62% | 65% |
Enterprise | $129.7 | $115.6 | $137.9 | $127.5 | $510.8 | $138.5 |
Yr/yr Organic Growth | 7% | |||||
% of Total Revenue | 31% | 34% | 36% | 33% | 34% | 33% |
Sub-Total Strategic | $401.7 | $320.2 | $366.3 | $373.2 | $1,461.3 | $409.0 |
Yr/yr Organic Growth | 2% | |||||
% of Total Revenue | 96% | 95% | 97% | 96% | 96% | 98% |
Other | $18.4 | $16.7 | $11.8 | $14.6 | $61.5 | $9.3 |
Yr/yr Organic Growth | -33% | |||||
% of Total Revenue | 4% | 5% | 3% | 4% | 4% | 2% |
Total | $420.0 | $336.9 | $378.1 | $387.8 | $1,522.8 | $418.3 |
Yr/yr Organic Growth | 1% | |||||
% of Total Revenue | 100% | 100% | 100% | 100% | 100% | 100% |
* Change in dollars, percentage and basis points calculated using actual results. May not add due to rounding for table presentation purposes.
** 2019 organic growth data is not available due to the transition from ASC 605 to ASC 606, as 2018 is only provided on an ASC 605 basis, and therefore not comparable. Under the modified retrospective adoption approach, we did not restate historical results prior to fiscal year 2019. Please refer to our Investor Relations website for supplemental tables showing 2019 growth rates under ASC 605.
| © 2020 Nuance Communications, Inc. All rights reserved | |
Exhibit 99.2
7 | 2020 First Quarter Results |
Prepared Remarks | |
February 5, 2020 | |
Table: Non-GAAP Segment Profit and Margin
($ in millions) | Q1 | Q2 | Q3 | Q4 | FY | Q1 |
2019 | 2019 | 2019 | 2019 | 2019 | 2020 | |
Healthcare | ||||||
Non-GAAP Segment Profit | $102.6 | $62.3 | $79.3 | $89.3 | $333.5 | $93.3 |
Segment Profit Margin % | 37.7% | 30.5% | 34.7% | 36.3% | 35.1% | 34.5% |
Enterprise | ||||||
Non-GAAP Segment Profit | $42.3 | $20.3 | $38.7 | $29.8 | $131.2 | $42.5 |
Segment Profit Margin % | 32.6% | 17.6% | 28.1% | 23.4% | 25.7% | 30.7% |
Sub-Total Strategic | ||||||
Non-GAAP Segment Profit | $144.8 | $82.6 | $118.1 | $119.1 | $464.7 | $135.8 |
Segment Profit Margin % | 36.1% | 25.8% | 32.2% | 31.9% | 31.8% | 33.2% |
Other | ||||||
Non-GAAP Segment Profit | $5.3 | $5.0 | $3.0 | $6.1 | $19.6 | $5.1 |
Segment Profit Margin % | 29.1% | 30.1% | 25.8% | 42.1% | 31.8% | 55.1% |
Total Continuing Operations | ||||||
Non-GAAP Segment Profit | $150.2 | $87.7 | $121.1 | $125.3 | $484.2 | $140.9 |
Segment Profit Margin % | 35.8% | 26.0% | 32.0% | 32.3% | 31.8% | 33.7% |
Healthcare
In Healthcare, we continue to see very strong growth in our cloud businesses, particularly Dragon Medical cloud, which grew 51% compared to Q1 2019. Overall Healthcare non-GAAP revenue declined 1% year over year on both an as-reported and organic basis to $270.5 million. This was due to declines in our low margin HIM transcription and EHR implementation services businesses, as well as Dragon Medical maintenance and license revenue as we migrate our on-premise installed base to the cloud. See the line item details of the Healthcare revenue composition in the following table.
| © 2020 Nuance Communications, Inc. All rights reserved | |
Exhibit 99.2
8 | 2020 First Quarter Results |
Prepared Remarks | |
February 5, 2020 | |
Table: Healthcare Non-GAAP Revenue Detail
($ in millions) | Q1 2019 | Q2 2019 | Q3 2019 | Q4 2019 | FY 2019 | Q1 2020 |
Clinical Documentation Capture | $133.6 | $124.3 | $126.9 | $151.2 | $535.9 | $134.3 |
Year-over-year | 1% | |||||
Dragon Medical Cloud | $43.5 | $46.4 | $53.3 | $59.8 | $202.9 | $65.8 |
Year-over-year | 51% | |||||
Dragon Medical Maintenance & Support | $14.4 | $10.9 | $12.1 | $12.1 | $49.5 | $6.8 |
Year-over-year | -53% | |||||
Dragon Medical Product & Licensing | $18.6 | $12.7 | $10.2 | $26.7 | $68.2 | $13.0 |
Year-over-year | -30% | |||||
HIM (Hosting and Maintenance & Support) | $57.1 | $54.3 | $51.2 | $52.7 | $215.2 | $48.8 |
Year-over-year | -15% | |||||
Radiology & Other | $91.4 | $37.2 | $55.7 | $49.7 | $234.1 | $93.8 |
Year-over-year | 3% | |||||
Professional Services | $16.4 | $17.3 | $20.9 | $19.1 | $73.8 | $15.6 |
Year-over-year | -5% | |||||
Other Maintenance & Support | $30.6 | $25.7 | $24.9 | $25.7 | $106.8 | $26.8 |
Year-over-year | -12% | |||||
Total Healthcare Revenues | $272.0 | $204.5 | $228.4 | $245.7 | $950.6 | $270.5 |
Year-over-year (As-Reported) | -1% | |||||
Year-over-year (Organic) | -1% | |||||
* Change in dollars, percentage and basis points calculated using actual results. May not add due to rounding.
** 2019 organic growth data is not available due to the transition from ASC 605 to ASC 606, as 2018 is only provided on an ASC 605 basis, and therefore not comparable. Under the modified retrospective adoption approach, we did not restate historical results prior to fiscal year 2019. Please refer to our Investor Relations website for supplemental tables showing 2019 growth rates under ASC 605.
In Q1 20, Clinical Documentation Capture non-GAAP revenue grew slightly, led by Dragon Medical cloud, which represents high-margin recurring revenue. This was offset by continued erosion in our HIM transcription business, as well as declines in Dragon Medical maintenance and license, as we continue to migrate our installed based from on-premise to the cloud and discontinue on-premise sales to new customers in certain markets. The sequential maintenance and support decline is particularly pronounced in Q1 20 due to incremental revenue of approximately $2.0 million from a large government contract in Q4 19, and certain credits in Q1 20 which reduced revenue by approximately $2.0 million.
We experienced overall strength in our Radiology & Other solutions driven by continued growth in our Radiology and CDI offerings, but as a reminder we expect 2020 growth rates to be lower than 2019 as we migrate certain products to the cloud. Additionally, Radiology & Other results will vary from quarter to quarter due to the timing of large term license renewals, which under ASC 606, are recognized at the time of renewal. The sequential variance is significant this quarter due to a large Healthcare renewal in our Radiology & Other business that has historically occurred annually in our first fiscal quarter.
| © 2020 Nuance Communications, Inc. All rights reserved | |
Exhibit 99.2
9 | 2020 First Quarter Results |
Prepared Remarks | |
February 5, 2020 | |
Total Healthcare segment profit margin for Q1 20 was 34.5%, down 320 basis points from the same period last year, primarily due to the ramp up of strategic R&D and Sales investments.
Enterprise
In Q1 20, Enterprise segment non-GAAP revenue grew 7% year over year, on both an as-reported and organic basis, resulting in record revenue of $138.5 million. Non-GAAP revenue grew primarily due to strength in license revenue across both Voice IVR and Security & Biometrics. We continue to expand our footprint and market share across our Voice IVR, Digital and Security product portfolio with each business line contributing growth in Q1 20.
Total Enterprise segment profit margin for Q1 20 was 30.7%, a decrease of 190 basis points from the same period last year driven by the ramp up of strategic R&D and sales investments.
Other
In Q1 20, non-GAAP revenue for our Other segment was $9.3 million, a decrease of 49% year over year, on an as reported basis and 33% on an organic basis, primarily due to our planned wind-down strategy related to our Devices business and the accelerated exit in late 2019 from the SRS business. Our Other segment includes results of our Voicemail-to-Text, SRS and Devices businesses.
Total Other segment profit margin was 55.1% in the quarter, up 2,600 basis points from the prior year, driven by the exit from the SRS business and cost optimization within our Devices and Voice-to-Text businesses.
Fiscal 2020 Guidance
We are providing the following updates to our fiscal year 2020 guidance
• | Reaffirming full year non-GAAP consolidated revenue, margins and cash flow guidance |
• | Reaffirming full year segment revenue and margin guidance |
• | Reducing non-GAAP tax rate range to reflect updated domestic and foreign profit mix expectations |
• | Decreasing share count to reflect recent share repurchase activity |
• | Increasing non-GAAP EPS to reflect the tax rate and share count adjustments |
• | Increasing GAAP EPS to reflect a GAAP tax benefit related to a valuation allowance adjustment on deferred tax assets as part of the Automotive spin |
• | Lowering cash tax to reflect a benefit related to the finalization of tax reform legislation regarding 2019 tax rates |
• | Updating ending 2020 cash and marketable securities guidance to reflect the upcoming retirement of $47 million of our 2.75% convertible debenture and recent share repurchase activity |
• | Reaffirming full year 2020 ARR guidance |
Fiscal 2020 Revenue Guidance
As noted in November, we expect a continuation of the favorable business trends we experienced in 2019. Within Enterprise, we are guiding a fifth straight year of organic growth as we expand our footprint and market share across the Enterprise portfolio of products. Within Healthcare, transitioning our solutions from on-premise licensing to the cloud and shifting our revenue mix to higher-value subscription models, remains a top priority. Several of the trends we experienced in 2019 should repeat with very strong growth in our Healthcare cloud business, offset by declines in both our on-premise license offerings and lower-margin
| © 2020 Nuance Communications, Inc. All rights reserved | |
Exhibit 99.2
10 | 2020 First Quarter Results |
Prepared Remarks | |
February 5, 2020 | |
HIM transcription services. With these trends in Enterprise and Healthcare, and taking into account the continued wind-down of our Other segment, we expect total non-GAAP revenue between $1,495 million and $1,535 million, representing organic growth between (1)% and 1%. For our strategic Enterprise and Healthcare segments, we expect combined non-GAAP revenue between $1,468 million and $1,502 million, representing organic growth between 0% and 3%.
Table: Fiscal 2020 Segment Revenue Guidance
FY2020 Segment Revenue Guidance ($ in millions) | FY 2019 Continuing Operations | FY 2020 LOW | FY 2020 HIGH | Organic Growth % | |
Healthcare | $950.6 | $947.0 | $963.0 | (1%) - 1% | |
Enterprise | $510.8 | $521.0 | $539.0 | 2% - 6% | |
Strategic | $1,461.4 | $1,468.0 | $1,502.0 | 0% - 3% | |
Other | $61.5 | $27.0 | $33.0 | (45%) - (32%) | |
Total Nuance Guidance | $1,522.9 | $1,495.0 | $1,535.0 | (1%) - 1% | |
Table: Fiscal 2020 Revenue Guidance - Healthcare Detail
($ in millions) | FY 2019 Actual | FY 2020 LOW | FY 2020 HIGH | ||
Clinical Documentation Capture | $536 | $528 | $544 | ||
Year-over-year | -1% | 2% | |||
Dragon Medical Cloud | $203 | $271 | $277 | ||
Year-over-year | 34% | 36% | |||
Dragon Medical Maintenance & Support | $50 | $29 | $31 | ||
Year-over-year | -42% | -38% | |||
Dragon Medical Product & Licensing | $68 | $45 | $49 | ||
Year-over-year | -34% | -28% | |||
HIM (Hosting and Maintenance & Support) | $215 | $183 | $187 | ||
Year-over-year | -15% | -13% | |||
Radiology & Other | $234 | $238 | $244 | ||
Year-over-year | 2% | 4% | |||
Professional Services | $74 | $73 | $77 | ||
Year-over-year | -1% | 4% | |||
Other Maintenance & Support | $107 | $100 | $104 | ||
Year-over-year | -6% | -2% | |||
Total Healthcare Revenues | $951 | $947 | $963 | ||
Year-over-year | 0% | 1% | |||
| © 2020 Nuance Communications, Inc. All rights reserved | |
Exhibit 99.2
11 | 2020 First Quarter Results |
Prepared Remarks | |
February 5, 2020 | |
Table: Fiscal 2020 P&L and Cash Flow Guidance
($ in millions except earnings per share) | Prior 2020 Guidance | Operational Updates | Current 2020 Guidance | |||||
LOW | HIGH | LOW | HIGH | LOW | HIGH | |||
Total GAAP Revenue | $1,495 | $1,535 | $1,495 | $1,535 | ||||
Total Non-GAAP Revenue | $1,495 | $1,535 | $1,495 | $1,535 | ||||
Non-GAAP Gross Margin | 60% | 60% | 60% | 60% | ||||
Non-GAAP Operating Margin | 23.50% | 24.50% | 23.50% | 24.50% | ||||
Non-GAAP Net Interests & Other | $33 | $35 | $33 | $35 | ||||
Non-GAAP Tax Rate | 25.0% | 26.0% | -1.00% | -1.00% | 24.0% | 25.0% | ||
Cash Taxes | $28 | $28 | -$5 | -$2 | $23 | $26 | ||
Diluted Share Count | 292.5 | 292.5 | -2.5 | -2.5 | 290.0 | 290.0 | ||
GAAP EPS | ($0.14) | ($0.04) | $0.35 | $0.33 | $0.21 | $0.29 | ||
Non-GAAP Diluted EPS | $0.80 | $0.88 | $0.02 | $0.02 | $0.82 | $0.90 | ||
Depreciation | $40 | $40 | $40 | $40 | ||||
Cash Flow From Operations (CFFO) | $300 | $340 | $300 | $340 | ||||
Capital Expenditures | $50 | $50 | $50 | $50 | ||||
Free Cash Flow (FCF) | $250 | $290 | $250 | $290 | ||||
Fiscal 2020 Cash Balance Roll Forward
The following table has been updated to account for the share repurchases made to through January 31, 2020, as well as the announced pay down of the $47 million of our 2.75% convertible debentures planned for Q2 2020.
Table: 2020 Cash Balance Roll Forward
($ in millions) | Low | High | |
9/30/19 Cash & Marketable Securities | $765 | $765 | |
+ Cerence Cash Distribution to Nuance | $139 | $139 | |
- Redemption of 6% Senior Notes | ($314) | ($314) | |
+ 2020 Cash Flow from Operations | $300 | $340 | |
- Capital Expenditures | ($50) | ($50) | |
- Other Investing & Financing Activities | ($16) | ($16) | |
- Retirement of 2.75% Convertible Debenture | ($47) | ($47) | |
- Share Repurchases through 1/31/20 | ($113) | ($113) | |
Projected 9/30/20 Cash & Marketable Securities | $664 | $704 | |
| © 2020 Nuance Communications, Inc. All rights reserved | |
Exhibit 99.2
12 | 2020 First Quarter Results |
Prepared Remarks | |
February 5, 2020 | |
Fiscal 2020 Segment Margin Guidance
Table: 2020 Segment Margin Guidance
Segment | FY 2019 Actual | FY 2020 Guidance |
Healthcare | 35.1% | ~ 32% |
Enterprise | 25.7% | ~ 29% |
Other | 31.8% | 36% - 40% |
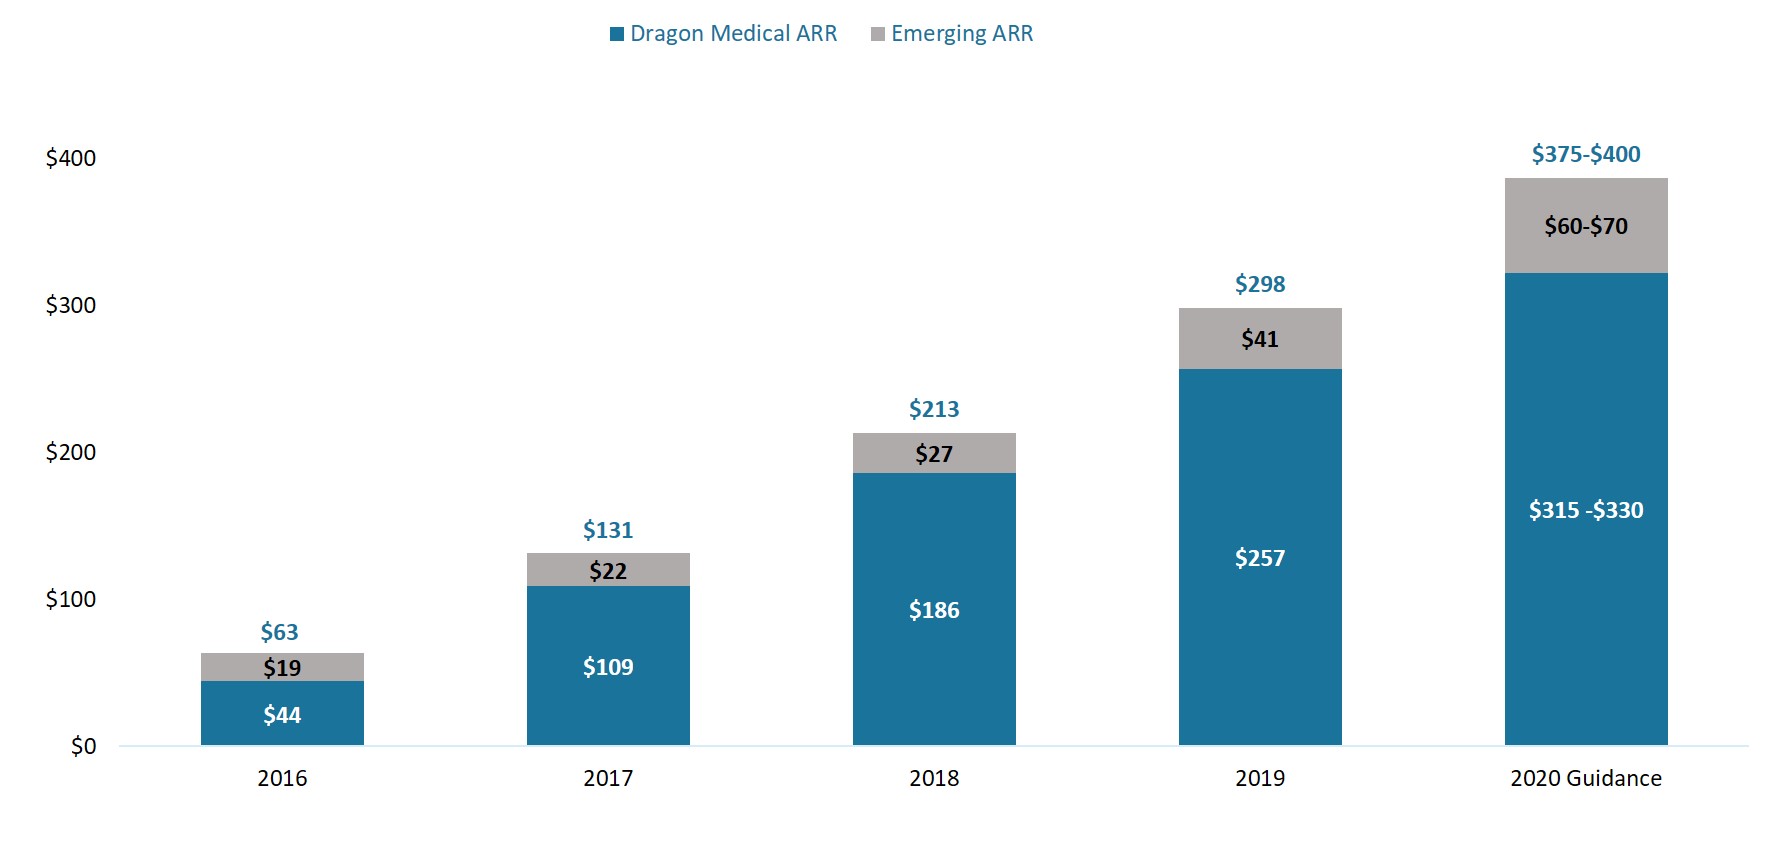
2020 Healthcare Annual Recurring Revenue (ARR) Guidance
We introduced this metric at the beginning of 2019 and reported it for our Dragon Medical cloud solutions, then expanded it in 2020 to include Emerging ARR, which includes our PowerScribe One radiology workflow and reporting product, our new cloud based CDE One workflow management and documentation guidance for CDI teams and other previously available Healthcare offerings that fit the definition of cloud-based subscriptions. As a reminder, ARR represents the annualized value of transactions under contract at any given point in time and serves as an important metric to assess future cloud revenue growth potential. We will continue to report and guide this metric on an annual basis.
Chart: Healthcare Annual Recurring Revenue Trend and Guidance
| © 2020 Nuance Communications, Inc. All rights reserved | |
Exhibit 99.2
13 | 2020 First Quarter Results |
Prepared Remarks | |
February 5, 2020 | |
Q2 2020 Guidance
We are providing the following guidance for our second quarter of fiscal year 2020:
Table: Q2 2020 Guidance
($ in millions except earnings per share) | Q2 2020 LOW Guidance | Q2 2020 HIGH Guidance | |
GAAP Revenue | $353 | $367 | |
Non-GAAP Revenue | $353 | $367 | |
GAAP EPS | ($0.04) | $0.00 | |
Non-GAAP Diluted EPS | $0.15 | $0.19 | |
| © 2020 Nuance Communications, Inc. All rights reserved | |
Exhibit 99.2
14 | 2020 First Quarter Results |
Prepared Remarks | |
February 5, 2020 | |
About Nuance Communications, Inc.
Nuance Communications (NASDAQ: NUAN) is the pioneer and leader in conversational AI innovations that bring intelligence to everyday work and life. The company delivers solutions that understand, analyze, and respond to people - amplifying human intelligence to increase productivity and security. With decades of domain and AI expertise, Nuance works with thousands of organizations globally across healthcare, financial services, telecommunications, government, and retail - to create stronger relationships and better experiences for their customers and workforce. For more information, please visit www.nuance.com.
Trademark reference: Nuance and the Nuance logo are registered trademarks or trademarks of Nuance Communications, Inc. or its affiliates in the United States and/or other countries. All other trademarks referenced herein are the property of their respective owners.
Safe Harbor and Forward-Looking Statements
Statements in this document regarding future performance and our management’s future expectations, beliefs, goals, plans or prospects constitute forward-looking statements within the meaning of the Private Securities Litigation Reform Act of 1995. Any statements that are not statements of historical fact (including statements containing the words “believes,” “plans,” “anticipates,” “expects,” "intends" or “estimates” or similar expressions) should also be considered to be forward-looking statements. There are a number of important factors that could cause actual results or events to differ materially from those indicated by such forward-looking statements, including but not limited to: the effects of competition, including pricing pressure, and changing business models in the markets and industries in which we operate; fluctuations in demand for our existing and future products; changes to economic, political, and regulatory conditions in the United States and internationally; our ability to attract and retain key personnel; further unanticipated costs resulting from our FY17 malware incident including potential costs associated with governmental investigations that may result from the incident; our ability to control and successfully manage our expenses and cash position; potential future cybersecurity and data privacy incidents or breaches; our ability to comply with applicable domestic and international laws and policies; fluctuating currency rates; possible quality issues in our products and technologies; our ability to realize anticipated synergies from acquired businesses, to cut stranded costs related to divested businesses, and to capture the expected value from strategic transactions including the spin-off of our Automotive business; and the other factors described in our most recent Form 10-K, Form 10-Q and other filings with the Securities and Exchange Commission. We disclaim any obligation to update any forward- looking statements as a result of developments occurring after the date of this document.
Definitions
Certain supplemental data provided in the prepared call remarks above are based upon internal Nuance definitions that are important for the reader to understand.
Non-GAAP Organic Revenue Growth. Organic revenue growth is calculated by comparing current period non-GAAP (“Generally Accepted Accounting Principles”) revenue to non-GAAP revenue from the corresponding prior-year period. For purposes of this calculation, prior period non-GAAP revenue is adjusted to include revenue from companies acquired as if we had owned the business in all periods presented, and similarly exclude revenue from business dispositions as if we had not owned the disposed business in all periods presented. Non-GAAP organic revenue growth on a constant currency basis is calculated using current period non-GAAP revenue for entities reporting in currencies other than United States dollars, excluding United States dollar-denominated transactions recorded in those entities, converted into United States dollars using the average exchange rates from the prior-year period rather than the actual exchange rates in effect during the current period.
| © 2020 Nuance Communications, Inc. All rights reserved | |
Exhibit 99.2
15 | 2020 First Quarter Results |
Prepared Remarks | |
February 5, 2020 | |
Segment profit. Segment profit reflects the direct controllable costs of each Segment together with an allocation of sales and corporate marketing expenses, and certain research and development project costs that benefit multiple product offerings. Segment profit represents income from operations excluding stock-based compensation, amortization of intangible assets, acquisition-related costs, net, restructuring and other charges, net, costs associated with intellectual property collaboration agreements, other income (expense), net and certain unallocated corporate expenses.
Discussion of non-GAAP Financial Measures
We believe that providing the non-GAAP ("Generally Accepted Accounting Principles") information to investors, in addition to the GAAP presentation, allows investors to view the financial results in the way management views the operating results. We further believe that providing this information allows investors to not only better understand our financial performance, but more importantly, to evaluate the efficacy of the methodology and information used by management to evaluate and measure such performance. The non- GAAP information included in this press release should not be considered superior to, or a substitute for, financial statements prepared in accordance with GAAP.
We utilize a number of different financial measures, both GAAP and non-GAAP, in analyzing and assessing the overall performance of the business, for making operating decisions and for forecasting and planning for future periods. Our annual financial plan is prepared both on a GAAP and non-GAAP basis, and the non- GAAP annual financial plan is approved by our board of directors. Continuous budgeting and forecasting for revenue and expenses are conducted on a consistent non-GAAP basis (in addition to GAAP) and actual results on a non-GAAP basis are assessed against the non-GAAP annual financial plan. The board of directors and management utilize these non-GAAP measures and results (in addition to the GAAP results) to determine our allocation of resources. In addition, and as a consequence of the importance of these measures in managing the business, we use non-GAAP measures and results in the evaluation process to establish management’s compensation. For example, our annual bonus program payments are based upon the achievement of consolidated non-GAAP revenue and consolidated non-GAAP earnings per share financial targets. We consider the use of non-GAAP revenue helpful in understanding the performance of our business, as it excludes the purchase accounting impact on acquired deferred revenue and other acquisition- related adjustments to revenue. We also consider the use of non-GAAP earnings per share helpful in assessing the organic performance of the continuing operations of our business. By organic performance we mean performance as if we had owned an acquired business in the same period a year ago. By constant currency organic performance, we mean performance excluding the effect of current foreign currency rate fluctuations. By continuing operations, we mean the ongoing results of the business excluding certain unplanned costs. While our management uses these non-GAAP financial measures as a tool to enhance their understanding of certain aspects of our financial performance, our management does not consider these measures to be a substitute for, or superior to, the information provided by GAAP financial statements.
Consistent with this approach, we believe that disclosing non-GAAP financial measures to the readers of our financial statements provides such readers with useful supplemental data that, while not a substitute for GAAP financial statements, allows for greater transparency in the review of our financial and operational performance. In assessing the overall health of the business during the three months ended December 31, 2019 and 2018, our management has either included or excluded items in seven general categories, each of which is described below.
Acquisition-related revenue and cost of revenue.
We provide supplementary non-GAAP financial measures of revenue that include revenue that we would have recognized but for the purchase accounting treatment of acquisition transactions. Non-GAAP revenue also includes revenue that we would have recognized had we not acquired intellectual property and other
| © 2020 Nuance Communications, Inc. All rights reserved | |
Exhibit 99.2
16 | 2020 First Quarter Results |
Prepared Remarks | |
February 5, 2020 | |
assets from the same customer. Because GAAP accounting requires the elimination of this revenue, GAAP results alone do not fully capture all of our economic activities. These non-GAAP adjustments are intended to reflect the full amount of such revenue. We include non-GAAP revenue and cost of revenue to allow for more complete comparisons to the financial results of historical operations, forward-looking guidance and the financial results of peer companies. We believe these adjustments are useful to management and investors as a measure of the ongoing performance of the business because, although we cannot be certain that customers will renew their contracts, we have historically experienced high renewal rates on maintenance and support agreements and other customer contracts. Additionally, although acquisition-related revenue adjustments are non-recurring with respect to past acquisitions, we generally will incur these adjustments in connection with any future acquisitions.
Acquisition-related costs, net.
In recent years, we have completed a number of acquisitions, which result in operating expenses, which would not otherwise have been incurred. We provide supplementary non-GAAP financial measures, which exclude certain transition, integration and other acquisition-related expense items resulting from acquisitions, to allow more accurate comparisons of the financial results to historical operations, forward looking guidance and the financial results of less acquisitive peer companies. We consider these types of costs and adjustments, to a great extent, to be unpredictable and dependent on a significant number of factors that are outside of our control. Furthermore, we do not consider these acquisition-related costs and adjustments to be related to the organic continuing operations of the acquired businesses and are generally not relevant to assessing or estimating the long-term performance of the acquired assets. In addition, the size, complexity and/or volume of past acquisitions, which often drives the magnitude of acquisition related costs, may not be indicative of the size, complexity and/or volume of future acquisitions. By excluding acquisition-related costs and adjustments from our non-GAAP measures, management is better able to evaluate our ability to utilize our existing assets and estimate the long-term value that acquired assets will generate for us. We believe that providing a supplemental non-GAAP measure, which excludes these items allows management and investors to consider the ongoing operations of the business both with, and without, such expenses.
These acquisition-related costs fall into the following categories: (i) transition and integration costs; (ii) professional service fees and expenses; and (iii) acquisition-related adjustments. Although these expenses are not recurring with respect to past acquisitions, we generally will incur these expenses in connection with any future acquisitions. These categories are further discussed as follows:
(i) | Transition and integration costs. Transition and integration costs include retention payments, transitional employee costs, and earn-out payments treated as compensation expense, as well as the costs of integration-related activities, including services provided by third-parties. |
(ii) | Professional service fees and expenses. Professional service fees and expenses include financial advisory, legal, accounting and other outside services incurred in connection with acquisition activities, and disputes and regulatory matters related to acquired entities. |
(iii) | Acquisition-related adjustments. Acquisition-related adjustments include adjustments to acquisition-related items that are required to be marked to fair value each reporting period, such as contingent consideration, and other items related to acquisitions for which the measurement period has ended, such as gains or losses on settlements of pre-acquisition contingencies. |
Amortization of acquired intangible assets.
We exclude the amortization of acquired intangible assets from non-GAAP expense and income measures. These amounts are inconsistent in amount and frequency and are significantly impacted by the timing and size of acquisitions. Providing a supplemental measure which excludes these charges allows management and investors to evaluate results “as-if” the acquired intangible assets had been developed internally rather than acquired and, therefore, provides a supplemental measure of performance in which our acquired
| © 2020 Nuance Communications, Inc. All rights reserved | |
Exhibit 99.2
17 | 2020 First Quarter Results |
Prepared Remarks | |
February 5, 2020 | |
intellectual property is treated in a comparable manner to our internally developed intellectual property. Although we exclude amortization of acquired intangible assets from our non-GAAP expenses, we believe that it is important for investors to understand that such intangible assets contribute to revenue generation. Amortization of intangible assets that relate to past acquisitions will recur in future periods until such intangible assets have been fully amortized. Future acquisitions may result in the amortization of additional intangible assets.
Non-cash expenses.
We provide non-GAAP information relative to the following non-cash expenses: (i) stock-based compensation; and (ii) non-cash interest. These items are further discussed as follows:
(i) | Stock-based compensation. Because of varying valuation methodologies, subjective assumptions and the variety of award types, we believe that excluding stock-based compensation allows for more accurate comparisons of operating results to peer companies, as well as to times in our history when stock-based compensation was more or less significant as a portion of overall compensation than in the current period. We evaluate performance both with and without these measures because compensation expense related to stock-based compensation is typically non-cash and the options and restricted awards granted are influenced by the Company’s stock price and other factors such as volatility that are beyond our control. The expense related to stock-based awards is generally not controllable in the short-term and can vary significantly based on the timing, size and nature of awards granted. As such, we do not include such charges in operating plans. Stock-based compensation will continue in future periods. |
(ii) | Non-cash interest. We exclude non-cash interest because we believe that excluding this expense provides senior management, as well as other users of the financial statements, with a valuable perspective on the cash-based performance and health of the business, including the current near-term projected liquidity. Non-cash interest expense will continue in future periods. |
Other expenses.
We exclude certain other expenses that result from unplanned events outside the ordinary course of continuing operations, in order to measure operating performance and current and future liquidity both with and without these expenses. By providing this information, we believe management and the users of the financial statements are better able to understand the financial results of what we consider to be our organic, continuing operations. Included in these expenses are items such as restructuring charges, asset impairments and other charges (credits), net, and losses from extinguishing our convertible debt. Other items such as consulting and professional services fees related to assessing strategic alternatives and our transformation programs, implementation of the new revenue recognition standard (ASC 606), and expenses associated with the malware incident and remediation thereof are also excluded.
Non-GAAP income tax provision.
Our non-GAAP income tax provision is determined based on our non-GAAP pre-tax income. The tax effect of each non-GAAP adjustment, if applicable, is computed based on the statutory tax rate of the jurisdiction to which the adjustment relates. Additionally, as our non-GAAP profitability is higher based on the non-GAAP adjustments, we adjust the GAAP tax provision to remove valuation allowances and related effects based on the higher level of reported non-GAAP profitability. We also exclude from our non-GAAP tax provision certain discrete tax items as they occur.
| © 2020 Nuance Communications, Inc. All rights reserved | |
Exhibit 99.2
18 | 2020 First Quarter Results |
Prepared Remarks | |
February 5, 2020 | |
Financial Tables Follow
| © 2020 Nuance Communications, Inc. All rights reserved | |
Exhibit 99.2
19 | 2020 First Quarter Results |
Prepared Remarks | |
February 5, 2020 | |
Nuance Communications, Inc.
Condensed Consolidated Statements of Operations
(in thousands, except per share amounts)
Unaudited
Three Months Ended December 31, | ||||||||
2019 | 2018 | |||||||
Revenues: | ||||||||
Hosting and professional services | $ | 230,477 | $ | 227,717 | ||||
Product and licensing | 125,180 | 115,889 | ||||||
Maintenance and support | 62,576 | 76,069 | ||||||
Total revenues | 418,233 | 419,675 | ||||||
Cost of revenues: | ||||||||
Hosting and professional services | 135,790 | 136,598 | ||||||
Product and licensing | 34,178 | 32,405 | ||||||
Maintenance and support | 7,794 | 7,761 | ||||||
Amortization of intangible assets | 6,627 | 7,356 | ||||||
Total cost of revenues | 184,389 | 184,120 | ||||||
Gross profit | 233,844 | 235,555 | ||||||
Operating expenses: | ||||||||
Research and development | 56,553 | 46,866 | ||||||
Sales and marketing | 66,472 | 67,370 | ||||||
General and administrative | 38,314 | 43,466 | ||||||
Amortization of intangible assets | 12,549 | 13,842 | ||||||
Acquisition-related costs, net | 1,167 | 2,601 | ||||||
Restructuring and other charges, net | 6,683 | 14,641 | ||||||
Total operating expenses | 181,738 | 188,786 | ||||||
Income from operations | 52,106 | 46,769 | ||||||
Other expenses, net | (33,669 | ) | (30,888 | ) | ||||
Income before income taxes | 18,437 | 15,881 | ||||||
(Benefit) provision for income taxes | (36,440 | ) | 2,000 | |||||
Net income from continuing operations | 54,877 | 13,881 | ||||||
Net (loss) income from discontinued operations | (6,192 | ) | 5,209 | |||||
Net income | $ | 48,685 | $ | 19,090 | ||||
Net income (loss) per common share - basic: | ||||||||
Continuing operations | $ | 0.19 | $ | 0.05 | ||||
Discontinued operations | (0.02 | ) | 0.02 | |||||
Total net income per basic common share | $ | 0.17 | $ | 0.07 | ||||
Net income (loss) per common share - diluted: | ||||||||
Continuing operations | $ | 0.19 | $ | 0.05 | ||||
Discontinued operations | (0.02 | ) | 0.02 | |||||
Total net income per diluted common share | $ | 0.17 | $ | 0.07 | ||||
Weighted average common shares outstanding: | ||||||||
Basic | 284,130 | 287,796 | ||||||
Diluted | 289,453 | 292,359 | ||||||
| © 2020 Nuance Communications, Inc. All rights reserved | |
Exhibit 99.2
20 | 2020 First Quarter Results |
Prepared Remarks | |
February 5, 2020 | |
Nuance Communications, Inc.
Condensed Consolidated Balance Sheets
(in thousands)
December 31, 2019 | September 30, 2019 | |||||||
Unaudited | ||||||||
ASSETS | ||||||||
Current assets: | ||||||||
Cash and cash equivalents | $ | 301,458 | $ | 560,961 | ||||
Marketable securities | 201,304 | 186,555 | ||||||
Accounts receivable, net | 262,411 | 240,673 | ||||||
Prepaid expenses and other current assets | 145,062 | 175,166 | ||||||
Current assets of discontinued operations | — | 91,858 | ||||||
Total current assets | 910,235 | 1,255,213 | ||||||
Marketable securities | 7,272 | 17,287 | ||||||
Land, building and equipment, net | 125,163 | 121,203 | ||||||
Goodwill | 2,132,249 | 2,127,896 | ||||||
Intangible assets, net | 272,859 | 291,371 | ||||||
Right-of-use assets | 112,167 | — | ||||||
Other assets | 225,792 | 316,215 | ||||||
Long-term assets of discontinued operations | — | 1,236,608 | ||||||
Total assets | $ | 3,785,737 | $ | 5,365,793 | ||||
LIABILITIES AND STOCKHOLDERS' EQUITY | ||||||||
Current liabilities: | ||||||||
Current portion of long-term debt | $ | — | $ | 1,142,870 | ||||
Contingent and deferred acquisition payments | 18,719 | 17,470 | ||||||
Accounts payable | 86,331 | 90,826 | ||||||
Accrued expenses and other current liabilities | 186,328 | 249,570 | ||||||
Deferred revenue | 242,877 | 214,223 | ||||||
Current liabilities of discontinued operations | — | 130,117 | ||||||
Total current liabilities | 534,255 | 1,845,076 | ||||||
Long-term debt | 1,650,650 | 793,536 | ||||||
Deferred revenue, net of current portion | 131,032 | 133,783 | ||||||
Deferred tax liability | 62,885 | 54,216 | ||||||
Operating lease liabilities | 97,973 | — | ||||||
Other liabilities | 68,423 | 79,378 | ||||||
Long-term liabilities of discontinued operations | — | 286,654 | ||||||
Total liabilities | 2,545,218 | 3,192,643 | ||||||
Stockholders' equity | 1,240,519 | 2,173,150 | ||||||
Total liabilities and stockholders' equity | $ | 3,785,737 | $ | 5,365,793 | ||||
| © 2020 Nuance Communications, Inc. All rights reserved | |
Exhibit 99.2
21 | 2020 First Quarter Results |
Prepared Remarks | |
February 5, 2020 | |
Nuance Communications, Inc.
Consolidated Statements of Cash Flows
(in thousands)
Unaudited
Three Months Ended December 31, | ||||||||
2019 | 2018 | |||||||
Cash flows from operating activities: | ||||||||
Net income from continuing operations | $ | 54,877 | $ | 13,881 | ||||
Adjustments to reconcile net income to net cash provided by operating activities: | ||||||||
Depreciation | 10,183 | 13,679 | ||||||
Amortization | 19,176 | 21,198 | ||||||
Stock-based compensation | 31,233 | 29,497 | ||||||
Non-cash interest expense | 12,744 | 12,298 | ||||||
Deferred tax (benefit) | (40,288 | ) | (2,089 | ) | ||||
Loss on extinguishment of debt | 15,000 | — | ||||||
Other | (749 | ) | 312 | |||||
Changes in operating assets and liabilities, excluding effects of acquisitions: | ||||||||
Accounts receivable | (19,242 | ) | (15,254 | ) | ||||
Prepaid expenses and other assets | 30,118 | (25,926 | ) | |||||
Accounts payable | (1,346 | ) | 12,503 | |||||
Accrued expenses and other liabilities | (71,741 | ) | (19,317 | ) | ||||
Deferred revenue | 26,895 | 31,881 | ||||||
Net cash provided by operating activities - continuing operations | 66,860 | 72,663 | ||||||
Net cash (used in) provided by operating activities - discontinued operations | (13,307 | ) | 27,228 | |||||
Net cash provided by operating activities | 53,553 | 99,891 | ||||||
Cash flows from investing activities: | ||||||||
Capital expenditures | (14,204 | ) | (12,220 | ) | ||||
Net contribution from Cerence upon the spin-off | 139,090 | — | ||||||
Purchases of marketable securities and other investments | (86,699 | ) | (47,502 | ) | ||||
Proceeds from sales and maturities of marketable securities and other investments | 82,588 | 45,678 | ||||||
Other | 1,272 | (1,447 | ) | |||||
Net cash provided by (used in) investing activities | 122,047 | (15,491 | ) | |||||
Cash flows from financing activities: | ||||||||
Repayment and redemption of debt | (313,500 | ) | — | |||||
Payments for repurchase of common stock | (92,444 | ) | (75,156 | ) | ||||
Payments for taxes related to net share settlement of equity awards | (29,958 | ) | (31,651 | ) | ||||
Other financing activities | (725 | ) | (696 | ) | ||||
Net cash used in financing activities | (436,627 | ) | (107,503 | ) | ||||
Effects of exchange rate changes on cash and cash equivalents | 1,524 | 391 | ||||||
Net decrease in cash and cash equivalents | (259,503 | ) | (22,712 | ) | ||||
Cash and cash equivalents at beginning of period | 560,961 | 315,963 | ||||||
Cash and cash equivalents at end of period | $ | 301,458 | $ | 293,251 | ||||
| © 2020 Nuance Communications, Inc. All rights reserved | |
Exhibit 99.2
22 | 2020 First Quarter Results |
Prepared Remarks | |
February 5, 2020 | |
Nuance Communications, Inc.
Supplemental Financial Information - GAAP to Non-GAAP Reconciliations
(in thousands)
Unaudited
Three Months Ended December 31, | ||||||||
2019 | 2018 | |||||||
GAAP revenues | $ | 418,233 | $ | 419,675 | ||||
Acquisition-related revenue adjustments: hosting and professional services | 89 | 141 | ||||||
Acquisition-related revenue adjustments: product and licensing | — | 47 | ||||||
Acquisition-related revenue adjustments: maintenance and support | — | 165 | ||||||
Non-GAAP revenues | $ | 418,322 | $ | 420,028 | ||||
GAAP cost of revenues | $ | 184,389 | $ | 184,120 | ||||
Cost of revenues from amortization of intangible assets | (6,627 | ) | (7,356 | ) | ||||
Cost of revenues adjustments: hosting and professional services (1) | (5,541 | ) | (6,957 | ) | ||||
Cost of revenues adjustments: product and licensing (1) | (129 | ) | (264 | ) | ||||
Cost of revenues adjustments: maintenance and support (1) | (393 | ) | 234 | |||||
Cost of revenues adjustments: other | (66 | ) | (436 | ) | ||||
Non-GAAP cost of revenues | $ | 171,633 | $ | 169,341 | ||||
GAAP gross profit | $ | 233,844 | $ | 235,555 | ||||
Gross profit adjustments | 12,845 | 15,132 | ||||||
Non-GAAP gross profit | $ | 246,689 | $ | 250,687 | ||||
GAAP income from operations | $ | 52,106 | $ | 46,769 | ||||
Gross profit adjustments | 12,845 | 15,132 | ||||||
Research and development (1) | 8,704 | 5,376 | ||||||
Sales and marketing (1) | 7,028 | 8,252 | ||||||
General and administrative (1) | 9,438 | 8,882 | ||||||
Acquisition-related costs, net | 1,167 | 2,601 | ||||||
Amortization of intangible assets | 12,549 | 13,842 | ||||||
Restructuring and other charges, net | 6,683 | 14,641 | ||||||
Other | 192 | 4,278 | ||||||
Non-GAAP income from operations | $ | 110,712 | $ | 119,773 | ||||
GAAP income before income taxes | $ | 18,437 | $ | 15,881 | ||||
Gross profit adjustments | 12,845 | 15,132 | ||||||
Research and development (1) | 8,704 | 5,376 | ||||||
Sales and marketing (1) | 7,028 | 8,252 | ||||||
General and administrative (1) | 9,438 | 8,882 | ||||||
Acquisition-related costs, net | 1,167 | 2,601 | ||||||
Amortization of intangible assets | 12,549 | 13,842 | ||||||
Restructuring and other charges, net | 6,683 | 14,641 | ||||||
Non-cash interest expense | 12,744 | 12,298 | ||||||
Loss on extinguishment of debt | 15,000 | — | ||||||
Other | (304 | ) | 4,696 | |||||
Non-GAAP income before income taxes | $ | 104,291 | $ | 101,601 | ||||
| © 2020 Nuance Communications, Inc. All rights reserved | |
Exhibit 99.2
23 | 2020 First Quarter Results |
Prepared Remarks | |
February 5, 2020 | |
Nuance Communications, Inc.
Supplemental Financial Information - GAAP to Non-GAAP Reconciliations, continued
(in thousands, except per share amounts)
Unaudited
Three Months Ended December 31, | ||||||||
2019 | 2018 | |||||||
GAAP (benefit) provision for income taxes | $ | (36,440 | ) | $ | 2,000 | |||
Income tax effect of non-GAAP adjustments | 20,672 | 25,820 | ||||||
Removal of valuation allowance and other items | 41,502 | (5,983 | ) | |||||
Removal of discrete items | — | 1,253 | ||||||
Non-GAAP provision for income taxes | $ | 25,734 | $ | 23,090 | ||||
GAAP net income from continuing operations | $ | 54,877 | $ | 13,881 | ||||
Acquisition-related adjustment - revenues (2) | 89 | 353 | ||||||
Acquisition-related costs, net | 1,167 | 2,601 | ||||||
Cost of revenue from amortization of intangible assets | 6,627 | 7,356 | ||||||
Amortization of intangible assets | 12,549 | 13,842 | ||||||
Restructuring and other charges, net | 6,683 | 14,641 | ||||||
Stock-based compensation (1) | 31,233 | 29,497 | ||||||
Non-cash interest expense | 12,744 | 12,298 | ||||||
Loss on extinguish of debt | 15,000 | — | ||||||
Adjustment to income tax expense | (62,174 | ) | (21,090 | ) | ||||
Other | (238 | ) | 5,132 | |||||
Non-GAAP net income | $ | 78,557 | $ | 78,511 | ||||
Non-GAAP diluted net income per share | $ | 0.27 | $ | 0.27 | ||||
Diluted weighted average common shares outstanding | 289,453 | 292,359 | ||||||
| © 2020 Nuance Communications, Inc. All rights reserved | |
Exhibit 99.2
24 | 2020 First Quarter Results |
Prepared Remarks | |
February 5, 2020 | |
Nuance Communications, Inc.
Supplemental Financial Information - GAAP to Non-GAAP Reconciliations, continued
(in thousands)
Unaudited
Three Months Ended December 31, | ||||||||
2019 | 2018 | |||||||
GAAP operating expenses | $ | 181,738 | $ | 188,786 | ||||
Research and development (1) | (8,704 | ) | (5,376 | ) | ||||
Sales and marketing (1) | (7,028 | ) | (8,252 | ) | ||||
General and administrative (1) | (9,438 | ) | (8,882 | ) | ||||
Acquisition-related costs, net | (1,167 | ) | (2,601 | ) | ||||
Amortization of intangible assets | (12,549 | ) | (13,842 | ) | ||||
Restructuring and other charges, net | (6,683 | ) | (14,641 | ) | ||||
Other | (191 | ) | (4,276 | ) | ||||
Non-GAAP operating expenses | $ | 135,978 | $ | 130,916 | ||||
GAAP research and development expense | $ | 56,553 | $ | 46,866 | ||||
Stock-based compensation (1) | (8,704 | ) | (5,376 | ) | ||||
Other | 22 | 234 | ||||||
Non-GAAP research and development expense | $ | 47,871 | $ | 41,724 | ||||
GAAP sales and marketing expense | $ | 66,472 | $ | 67,370 | ||||
Stock-based compensation (1) | (7,028 | ) | (8,252 | ) | ||||
Other | 13 | 23 | ||||||
Non-GAAP sales and marketing expense | $ | 59,457 | $ | 59,141 | ||||
GAAP general and administrative expense | $ | 38,314 | $ | 43,466 | ||||
Stock-based compensation (1) | (9,438 | ) | (8,882 | ) | ||||
Other | (226 | ) | (4,533 | ) | ||||
Non-GAAP general and administrative expense | $ | 28,650 | $ | 30,051 | ||||
| © 2020 Nuance Communications, Inc. All rights reserved | |
Exhibit 99.2
25 | 2020 First Quarter Results |
Prepared Remarks | |
February 5, 2020 | |
Nuance Communications, Inc.
Supplemental Financial Information - GAAP to Non-GAAP Reconciliations, continued
(in thousands)
Unaudited
Three Months Ended September 30, | ||||||||
2019 | 2018 | |||||||
(1) Stock-based compensation | ||||||||
Cost of hosting and professional services | $ | 5,541 | $ | 6,957 | ||||
Cost of product and licensing | 129 | 264 | ||||||
Cost of maintenance and support | 393 | (234 | ) | |||||
Research and development | 8,704 | 5,376 | ||||||
Sales and marketing | 7,028 | 8,252 | ||||||
General and administrative | 9,438 | 8,882 | ||||||
Total | $ | 31,233 | $ | 29,497 | ||||
(2) Acquisition-related revenue | ||||||||
Acquisition related revenue adjustments | $ | 89 | $ | 353 | ||||
Total | $ | 89 | $ | 353 | ||||
| © 2020 Nuance Communications, Inc. All rights reserved | |
Exhibit 99.2
26 | 2020 First Quarter Results |
Prepared Remarks | |
February 5, 2020 | |
Nuance Communications, Inc.
Supplemental Financial Information – GAAP to Non-GAAP Reconciliations, continued
(in millions)
Unaudited
Total Revenues from Continuing Operations | Q1 | Q2 | Q3 | Q4 | FY | Q1 | ||||||||||||||||||
2019 | 2019 | 2019 | 2019 | 2019 | 2020 | |||||||||||||||||||
GAAP Revenues | $ | 419.7 | $ | 336.6 | $ | 377.4 | $ | 387.6 | $ | 1,521.3 | $ | 418.2 | ||||||||||||
Adjustment | 0.4 | 0.4 | 0.6 | 0.2 | 1.5 | 0.1 | ||||||||||||||||||
Non-GAAP Revenues | $ | 420.0 | $ | 336.9 | $ | 378.1 | $ | 387.8 | $ | 1,522.8 | $ | 418.3 | ||||||||||||
Healthcare | Q1 | Q2 | Q3 | Q4 | FY | Q1 | ||||||||||||||||||
2019 | 2019 | 2019 | 2019 | 2019 | 2020 | |||||||||||||||||||
GAAP Revenues | $ | 271.9 | $ | 204.4 | $ | 227.9 | $ | 245.6 | $ | 949.7 | $ | 270.5 | ||||||||||||
Adjustment | 0.1 | 0.2 | 0.5 | 0.1 | 0.9 | — | ||||||||||||||||||
Non-GAAP Revenues | $ | 272.0 | $ | 204.6 | $ | 228.4 | $ | 245.7 | $ | 950.6 | $ | 270.5 | ||||||||||||
Enterprise | Q1 | Q2 | Q3 | Q4 | FY | Q1 | ||||||||||||||||||
2019 | 2019 | 2019 | 2019 | 2019 | 2020 | |||||||||||||||||||
GAAP Revenues | $ | 129.5 | $ | 115.4 | $ | 137.8 | $ | 127.4 | $ | 510.2 | $ | 138.4 | ||||||||||||
Adjustment | 0.2 | 0.2 | 0.1 | 0.1 | 0.6 | 0.1 | ||||||||||||||||||
Non-GAAP Revenues | $ | 129.7 | $ | 115.6 | $ | 137.9 | $ | 127.5 | $ | 510.8 | $ | 138.5 | ||||||||||||
Other | Q1 | Q2 | Q3 | Q4 | FY | Q1 | ||||||||||||||||||
2019 | 2019 | 2019 | 2019 | 2019 | 2020 | |||||||||||||||||||
GAAP Revenues | $ | 18.4 | $ | 16.7 | $ | 11.8 | $ | 14.6 | $ | 61.5 | $ | 9.3 | ||||||||||||
Adjustment | — | — | — | — | — | — | ||||||||||||||||||
Non-GAAP Revenues | $ | 18.4 | $ | 16.7 | $ | 11.8 | $ | 14.6 | $ | 61.5 | $ | 9.3 | ||||||||||||
Schedules may not add due to rounding.
| © 2020 Nuance Communications, Inc. All rights reserved | |
Exhibit 99.2
27 | 2020 First Quarter Results |
Prepared Remarks | |
February 5, 2020 | |
Nuance Communications, Inc.
Supplemental Financial Information - GAAP to Non-GAAP Reconciliations, continued
(in millions)
Unaudited
Q1 | Q2 | Q3 | Q4 | FY | Q1 | |||||||||||||||||||
2019 | 2019 | 2019 | 2019 | 2019 | 2020 | |||||||||||||||||||
Total segment revenues | $ | 420.0 | $ | 336.9 | $ | 378.1 | $ | 387.8 | $ | 1,522.8 | $ | 418.3 | ||||||||||||
Acquisition-related revenue adjustments | (0.4 | ) | (0.4 | ) | (0.6 | ) | (0.2 | ) | (1.5 | ) | (0.1 | ) | ||||||||||||
Total consolidated revenues | $ | 419.7 | $ | 336.6 | $ | 377.4 | $ | 387.6 | $ | 1,521.3 | $ | 418.2 | ||||||||||||
Total segment profit | $ | 150.2 | $ | 87.7 | $ | 121.1 | $ | 125.3 | $ | 484.3 | $ | 140.9 | ||||||||||||
Corporate expenses and other, net | (35.1 | ) | (31.8 | ) | (36.3 | ) | (34.3 | ) | (137.6 | ) | (30.5 | ) | ||||||||||||
Acquisition-related revenues | (0.4 | ) | (0.4 | ) | (0.6 | ) | (0.2 | ) | (1.5 | ) | (0.1 | ) | ||||||||||||
Stock-based compensation | (29.5 | ) | (24.8 | ) | (30.2 | ) | (34.8 | ) | (119.3 | ) | (31.2 | ) | ||||||||||||
Amortization of intangible assets | (21.2 | ) | (20.5 | ) | (19.9 | ) | (20.0 | ) | (81.6 | ) | (19.2 | ) | ||||||||||||
Acquisition-related costs, net | (2.6 | ) | (2.1 | ) | (0.8 | ) | (2.5 | ) | (8.0 | ) | (1.2 | ) | ||||||||||||
Restructuring and other charges, net | (14.6 | ) | (9.9 | ) | (2.0 | ) | (2.7 | ) | (29.1 | ) | (6.7 | ) | ||||||||||||
Other expenses, net | (30.9 | ) | (27.3 | ) | (21.3 | ) | (27.8 | ) | (107.3 | ) | (33.7 | ) | ||||||||||||
Income (loss) before income taxes | $ | 15.9 | $ | (29.0 | ) | $ | 10.0 | $ | 3.0 | $ | (0.1 | ) | $ | 18.4 | ||||||||||
Schedules may not add due to rounding.
| © 2020 Nuance Communications, Inc. All rights reserved | |
Exhibit 99.2
28 | 2020 First Quarter Results |
Prepared Remarks | |
February 5, 2020 | |
Nuance Communications, Inc.
Reconciliation of Supplemental Financial Information
GAAP and non-GAAP Revenue and Net Income per Share Guidance
(in thousands, except per share amounts)
Unaudited
Three Months Ended March 31, 2020 | ||||||||
Low | High | |||||||
GAAP revenue | $ | 353,000 | $ | 367,000 | ||||
Acquisition-related adjustment - revenue | — | — | ||||||
Non-GAAP revenue | $ | 353,000 | $ | 367,000 | ||||
GAAP net income per share | $ | (0.04 | ) | $ | — | |||
Acquisition-related adjustment - revenue | — | — | ||||||
Acquisition-related costs, net | 0.01 | 0.01 | ||||||
Cost of revenue from amortization of intangible assets | 0.02 | 0.02 | ||||||
Amortization of intangible assets | 0.04 | 0.04 | ||||||
Non-cash stock-based compensation | 0.12 | 0.12 | ||||||
Non-cash interest expense | 0.04 | 0.04 | ||||||
Adjustment to income tax expense | (0.05 | ) | (0.05 | ) | ||||
Restructuring and other charges, net | 0.01 | 0.01 | ||||||
Loss on debt extinguishment | — | — | ||||||
Non-GAAP net income per share | $ | 0.15 | $ | 0.19 | ||||
Shares used in computing GAAP and non-GAAP net income per share: | ||||||||
Weighted average common shares: basic | 283,000 | 283,000 | ||||||
Weighted average common shares: diluted | 288,000 | 288,000 | ||||||
| © 2020 Nuance Communications, Inc. All rights reserved | |
Exhibit 99.2
29 | 2020 First Quarter Results |
Prepared Remarks | |
February 5, 2020 | |
Nuance Communications, Inc.
Reconciliation of Supplemental Financial Information
GAAP and non-GAAP Revenue and Net Income per Share Guidance
(in thousands, except per share amounts)
Unaudited
Twelve Months Ended September 30, 2020 | ||||||||
Low | High | |||||||
GAAP revenue | $ | 1,495,000 | $ | 1,535,000 | ||||
Acquisition-related adjustment - revenue | — | — | ||||||
Non-GAAP revenue | $ | 1,495,000 | $ | 1,535,000 | ||||
GAAP net income per share | $ | 0.21 | $ | 0.29 | ||||
Acquisition-related adjustment - revenue | — | — | ||||||
Acquisition-related costs, net | 0.01 | 0.01 | ||||||
Cost of revenue from amortization of intangible assets | 0.09 | 0.09 | ||||||
Amortization of intangible assets | 0.17 | 0.17 | ||||||
Non-cash stock-based compensation | 0.46 | 0.46 | ||||||
Non-cash interest expense | 0.18 | 0.18 | ||||||
Adjustment to income tax expense | (0.38 | ) | (0.38 | ) | ||||
Restructuring and other charges, net | 0.03 | 0.03 | ||||||
Loss on debt extinguishment | 0.05 | 0.05 | ||||||
Other | — | — | ||||||
Non-GAAP net income per share | $ | 0.82 | $ | 0.90 | ||||
Shares used in computing GAAP and non-GAAP net income per share: | ||||||||
Weighted average common shares: basic | 284,000 | 284,000 | ||||||
Weighted average common shares: diluted | 290,000 | 290,000 | ||||||
| © 2020 Nuance Communications, Inc. All rights reserved | |