Attached files
| file | filename |
|---|---|
| EX-32.1 - EXHIBIT 32.1 - Nuance Communications, Inc. | nuan09302018ex321.htm |
| EX-31.2 - EXHIBIT 31.2 - Nuance Communications, Inc. | nuan09302018ex312.htm |
| EX-31.1 - EXHIBIT 31.1 - Nuance Communications, Inc. | nuan09302018ex311.htm |
| EX-23.1 - EXHIBIT 23.1 - Nuance Communications, Inc. | nuan09302018ex23110-k.htm |
| EX-21.1 - EXHIBIT 21.1 - Nuance Communications, Inc. | nuan09302018ex21110-k.htm |
| EX-14.1 - EXHIBIT 14.1 - Nuance Communications, Inc. | nuan09302018ex141.htm |
| EX-10.16 - EXHIBIT 10.16 - Nuance Communications, Inc. | nuan09302018ex1016.htm |
| EX-3.4 - EXHIBIT 3.4 - Nuance Communications, Inc. | nuan09302018ex34.htm |
UNITED STATES SECURITIES AND EXCHANGE COMMISSION
Washington, D.C. 20549
_______________________________
Form 10-K
(Mark One) | |
þ | ANNUAL REPORT PURSUANT TO SECTION 13 OR 15(d) OF THE SECURITIES EXCHANGE ACT OF 1934 |
For the fiscal year ended September 30, 2018 | |
OR | |
o | TRANSITION REPORT PURSUANT TO SECTION 13 OR 15(d) OF THE SECURITIES EXCHANGE ACT OF 1934 |
For the transition period from to | |
Commission file number 001-27038
NUANCE COMMUNICATIONS, INC.
(Exact name of Registrant as Specified in its Charter)
Delaware | 94-3156479 | |
(State or Other Jurisdiction of | (I.R.S. Employer | |
Incorporation or Organization) | Identification No.) | |
1 Wayside Road Burlington, Massachusetts | 01803 | |
(Address of Principal Executive Offices) | (Zip Code) | |
Registrant’s telephone number, including area code: (781) 565-5000
SECURITIES REGISTERED PURSUANT TO SECTION 12(b) OF THE ACT:
Title of Each Class | Name of Each Exchange on Which Registered | |
Common stock, $0.001 par value | Nasdaq Stock Market LLC | |
Preferred share purchase rights | Nasdaq Stock Market LLC | |
SECURITIES REGISTERED PURSUANT TO SECTION 12(g) OF THE ACT: None
Indicate by check mark if the registrant is a well-known seasoned issuer, as defined in Rule 405 of the Securities Act. Yes þ No o
Indicate by check mark if the registrant is not required to file reports pursuant to Section 13 or Section 15(d) of the Act. Yes o No þ
Indicate by check mark whether the registrant: (1) has filed all reports required to be filed by Section 13 or 15(d) of the Securities Exchange Act of 1934 during the preceding 12 months (or for such shorter period that the registrant was required to file such reports), and (2) has been subject to such filing requirements for the past 90 days. Yes þ No o
Indicate by check mark whether the registrant has submitted electronically and every Interactive Data File required to be submitted and posted pursuant to Rule 405 of Regulation S-T (§ 232.405 of this chapter) during the preceding 12 months (or for such shorter period that the registrant was required to submit such files). Yes þ No o
Indicate by check mark if disclosure of delinquent filers pursuant to Item 405 of Regulation S-K is not contained herein, and will not be contained, to the best of registrant’s knowledge, in definitive proxy or information statements incorporated by reference in Part III of this Form 10-K or any amendment to this Form 10-K. þ
Indicate by check mark whether the registrant is a large accelerated filer, an accelerated filer, a non-accelerated filer, a smaller reporting company, or an emerging growth company. See the definitions of “large accelerated filer,” “accelerated filer,” “smaller reporting company,” and "emerging growth company" in Rule 12b-2 of the Exchange Act. (Check one):
Large accelerated filer þ | Accelerated filer o | Smaller reporting company o | ||
Non-accelerated filer o | Emerging growth company o | |||
If an emerging growth company, indicate by check mark if the registrant has elected not to use the extended transition period for complying with any new or revised financial accounting standards provided pursuant to Section 13(a) of the Exchange Act. o
Indicate by check mark whether the registrant is a shell company (as defined in Rule 12b-2 of the Exchange Act). Yes o No þ
As of March 31, 2018, the aggregate market value of the registrant's common stock held by non-affiliates of the registrant was $3.5 billion based on the closing sale price as reported on the Nasdaq Global Select Market for such date.
The number of shares of the registrant’s common stock, outstanding as of October 31, 2018, was 287,581,197.
DOCUMENTS INCORPORATED BY REFERENCE
Portions of the registrant’s definitive Proxy Statement to be delivered to stockholders in connection with the registrant’s 2019 Annual Meeting of Stockholders are incorporated by reference into Part III of this Form 10-K.
NUANCE COMMUNICATIONS, INC.
TABLE OF CONTENTS
Page | ||
PART I | ||
Item 1. | ||
Item 1A. | ||
Item 1B. | ||
Item 2. | ||
Item 3. | ||
Item 4. | ||
PART II | ||
Item 5. | ||
Item 6. | ||
Item 7. | ||
Item 7A. | ||
Item 8. | ||
Item 9. | ||
Item 9A. | ||
Item 9B. | ||
PART III | ||
Item 10. | ||
Item 11. | ||
Item 12. | ||
Item 13. | ||
Item 14. | ||
PART IV | ||
Item 15. | ||
PART I
This Annual Report on Form 10-K contains forward-looking statements within the meaning of the Private Securities Litigation Reform Act of 1995 that involve risks, uncertainties and assumptions that, if they never materialize or if they prove incorrect, could cause our consolidated results to differ materially from those expressed or implied by such forward-looking statements. All statements other than statements of historical fact are statements that could be deemed forward-looking, including statements pertaining to: our future revenue, cost of revenue, research and development expense, selling, general and administrative expenses, amortization of intangible assets and gross margin, earnings, cash flows and liquidity; our strategy relating to our segments; the potential of future product releases; our product development plans and investments in research and development; future acquisitions and anticipated benefits from acquisitions; international operations and localized versions of our products; our contractual commitments; our fiscal year 2019 revenue and expense expectations and legal proceedings and litigation matters. You can identify these and other forward-looking statements by the use of words such as “may,” “will,” “should,” “expects,” “plans,” “anticipates,” “believes,” “estimates,” “predicts,” “intends,” “potential,” “continue” or the negative of such terms, or other comparable terminology. Forward-looking statements also include the assumptions underlying or relating to any of the foregoing statements. Our actual results could differ materially from those anticipated in these forward-looking statements as a result of various factors, including those set forth in Item 1A of this Annual Report under the heading “Risk Factors.” All forward-looking statements included in this document are based on information available to us on the date hereof. The forward-looking statements do not include the potential impact of any mergers, acquisitions, divestitures, securities offerings or business combinations that may be announced or closed after the date hereof. We will not undertake and specifically decline any obligation to update any forward-looking statements, except to the extent required by law.
Item 1.Business
Overview
We are a leading provider of voice recognition and natural language understanding solutions. We work with companies around the world, from banks and hospitals to airlines, telecommunications carriers, and automotive manufacturers and suppliers, who use our solutions and technologies to create better experiences for their customers and their users by enhancing the users' interaction and increasing productivity and customer satisfaction. We offer our customers high accuracy in automated speech recognition ("ASR"), natural language understanding("NLU") capabilities, dialog and information management, biometric speaker authentication, text-to-speech ("TTS"), optical character recognition ("OCR") capabilities, and domain knowledge, along with professional services and implementation support. In addition, our solutions increasingly utilize our innovations in artificial intelligence ("AI"), including cognitive sciences and machine learning to create smarter, more natural experiences with technology. Using advanced analytics and algorithms, our technologies create personalized experiences and transform the way people interact with information and the technology around them. We market and sell our solutions and technologies around the world directly through a dedicated sales force, and also through a global network of resellers, including system integrators, independent software vendors, value-added resellers, distributors, hardware vendors, telecommunications carriers and e-commerce websites.
We are a global organization steeped in research and development. We have approximately 2,100 language scientists, developers, and engineers dedicated to continually refining our technologies and advancing our portfolio to better meet our customers’ diverse and changing needs. We have more than 60 international operating locations and a sales presence in more than 81 countries. Our corporate headquarters is located in Burlington, Massachusetts, with international headquarter in Dublin, Ireland. In fiscal year 2018, our revenue was $2.1 billion.
Our Strategy
We have large addressable vertical markets, and we focus on growth by providing industry-leading, value-add solutions for our customers and partners through a broad set of flexible technologies, solutions, and service offerings available directly and through our channel partners. The key elements of our strategy include:
• | Focus on opportunities that leverage our core strengths in key vertical markets. During the third quarter of fiscal year 2018, we commenced a comprehensive portfolio and business review with the goal to improve long-term shareholder return and operational efficiency. We are moving toward a goal of a simplified and more efficient operational structure, capable of sustainable, long-term revenue and earnings growth, with resources keenly focused on opportunities that leverage our core strengths in key vertical markets. We plan to focus our resources and R&D capabilities on our core capabilities and shift our focus away from non-core businesses and solutions. |
1
• | Maintain global leadership in all of our major markets and solutions areas. We have historically targeted markets where we benefit from strong technology, sales and vertical market differentiation. Today, we are one of the leading providers of voice recognition and NLU. We invest considerable time and resources to ensure that we maintain this position through customer satisfaction, technology leadership, deep domain experience and market specialization. |
• | Maintain depth in technology, solutions, and intellectual property portfolio. We have built a world-class portfolio of technologies, applications, solutions and intellectual property through both internal development and acquisitions. We expect to continue to pursue opportunities to expand our assets, geographic presence, distribution network and customer base through organic growth and strategic transactions. We continue to strengthen our core technologies in voice and language, and expand our offerings through research and innovations in AI, including cognitive computing and machine learning. |
• | Continue to expand our extensive network of global operations, distribution and services networks. We market and sell our solutions and technologies directly through a dedicated sales force and through a global network of resellers, including system integrators, independent software vendors, value-added resellers, distributors, hardware vendors, and telecommunications carriers and e-commerce websites. In addition, we continue to expand our presence within our markets, such as ambulatory markets in our Healthcare segment and omni-channel customer services in our Enterprise segment, and we have expanded initiatives in geographic markets such as China, Latin America and Southeast Asia. |
• | Continue to expand hosting and transaction-based offerings. We remain focused on increasing our hosting and transaction-based offerings. We generate hosting revenues through on-demand models that typically have multi-year terms with pricing based on volume of usage, number of transactions, number of seats or number of devices. This pricing structure allows customers to use our products at a lower initial cost when compared to the sale of a perpetual license. This will enable us to deliver applications that our customers use, and pay for, on a recurring basis, providing us with the opportunity to benefit from recurring revenue streams. |
• | Maintain significant presence and customer preference in our markets. We specialize in creating large, enterprise-class solutions that are used by many of the world’s largest companies. By combining our core technology, professional services, local presence and deep domain experience, we are able to deliver these specialized offerings for our customers and partners. We have established a trusted position in numerous markets and today work with a majority of the Fortune 100 companies. |
• | Strengthen financial profile with improvement in revenue, earnings per share, margin, and cash flow. We are focused on improving our financial performance by executing upon identified strategic initiatives and further evolving our business toward recurring revenue models, which are positioning us for increased future revenue and profitability growth. Recurring revenue represented 71.4%, 72.5% and 69.6% of total revenue in fiscal years 2018, 2017 and 2016, respectively. |
Segments
We are organized into five segments: Healthcare, Enterprise, Automotive, Imaging and Other. See Note 20 to the consolidated financial statements for additional information about our reportable segments. We offer our solutions and technologies to our customers in a variety of ways, including via hosted cloud-based solutions, perpetual and term software licenses, implementation and custom solution development services and maintenance and support. Our product revenues include embedded original equipment manufacturer ("OEM") royalties, traditional perpetual licensing, term-based licensing and consumer sales. Our hosting, royalty, term license and maintenance and support revenues are recurring in nature as our customers use our products on an ongoing basis to handle their needs in medical transcription, medical coding and compliance, enterprise customer service and automotive connected services. Our professional services offer a continuing revenue stream, whether it is provided in connection with our software solutions or on a standalone basis, as we have a backlog of engagements that take time to complete.
2
Healthcare
Our Healthcare segment is a leading provider in clinical speech and clinical language understanding solutions that drive smart, efficient decisions and increase productivity across the healthcare industry. Our solutions and services improve the clinical documentation process - from capturing the complete patient record to improving clinical documentation and quality measures for reimbursement. We support clinical documentation work flows and electronic health record ("EHR") adoption through our flexible offerings, including transcription services, dictation software for the EHR, diagnostics work flows, and mobile applications. These solutions increasingly leverage ASR, clinical language understanding ("CLU") and AI innovations to help physicians deliver better outcomes. In addition, we continue to extend our strong hospital customer franchise into the automation and management of healthcare coding and billing processes in order to ensure timely and appropriate reimbursement. These solutions are designed to help healthcare organizations derive additional value from EHR investments and are driven by industry trends such as value-based care, Meaningful Use requirements, which is a program that awards incentives for using EHR technology to improve patient care, and government regulations related to medical codes.
Today, more than 500,000 clinicians and 10,000 healthcare facilities worldwide leverage our solutions to improve patient care and support the physician in clinical work flows from many devices. Our Healthcare segment revenues were $984.8 million, $899.3 million, and $973.3 million in fiscal years 2018, 2017 and 2016, respectively. Healthcare segment revenues represented 47.6%, 45.5% and 49.2% of total segment revenue in fiscal years 2018, 2017 and 2016, respectively.
Our principal solutions for the Healthcare segment include the following:
• | Dragon Medical: Provide dictation capabilities that empower physicians to accurately capture and document patient care in real-time from many devices and without disrupting existing work flows. We have expanded this solution to provide clinical language understanding and cognitive intelligence that delivers real-time queries to physicians at the point of care, producing measurable clinical, financial and compliance outcomes. |
• | Transcription solutions: Enable physicians in larger and mid-sized healthcare enterprises to streamline clinical documentation with an on-demand, enterprise-wide medical transcription platforms, and allow healthcare organizations to outsource transcription services. Our transcription solutions are generally offered as an on-demand model. |
• | Clinical document improvement and coding solutions: Ensure patient health information is properly documented, coded, and evaluated to provide more complete and accurate clinical documentation. These services and offerings assist organizations with regulatory compliance and coding efficiency to receive appropriate and timely reimbursement and improve quality reporting. The solutions are generally sold under a term licensing model. |
• | Diagnostic solutions: Allow radiologists to easily document, collaborate, and share medical images and reports in order to optimize patient care. These solutions are generally sold under a traditional perpetual license model, but they are transitioning rapidly to term licensing and transaction based models. |
• | Dragon solutions: Provide professional and personal productivity solutions to business users and consumers with the ability to use their voice to create content, reports and other documents, as well as control their computers and laptops without the use of a keyboard or mouse. This dictation capability is similar to Dragon Medical and is used in markets such as law, public safety, social services, education and accessibility. Dragon solutions are sold generally through a traditional perpetual software license model, and we have recently introduced an on-demand model. |
The channels for distribution in the Healthcare segment utilize our direct sales force to address the market and our professional services organization to support the implementation requirements of the healthcare industry. Direct distribution is supplemented by distributors, resellers and partnerships with a variety of healthcare IT providers. Our Healthcare customers and partners include UPMC, Cleveland Clinic, Mayo Clinic and UK National Trust. Our partners include Cerner, Epic, McKesson, and Siemens.
Areas of expansion and focus for our Healthcare segment include providing customers deeper integration with our clinical documentation solutions, investing in our cloud-based offerings, operations and network security, entering new and adjacent markets such as ambulatory care, and expanding our international capabilities.
Automotive
Our Automotive segment provides automotive manufacturers and their suppliers intuitive, personalized, branded, virtual assistants and connected services for cars that are safer, easier, and more enjoyable. Our ASR, NLU and TTS technologies and deep domain experience, integration capabilities and independence make us a preferred vendor to the world’s largest automotive manufacturers
3
and suppliers. Our automotive solutions are generally sold as on-demand models that are typically priced on a per-unit basis for multi-year service terms. We have a worldwide professional services team to provide custom solution development services and sell our technologies through a traditional perpetual software license model, including a royalty-based model. Our Automotive customers include major automotive OEMs, such as Ford, Daimler, BMW, Toyota, Fiat Chrysler, Volkswagen, and Geely.
Automotive segment revenues were $279.4 million, $252.2 million, and $214.3 million in fiscal years 2018, 2017 and 2016, respectively. Automotive segment revenues represented 13.5%, 12.8% and 10.8% of total segment revenue in fiscal years 2018, 2017 and 2016, respectively.
On November 19, 2018, we announced our intent to spin off our Automotive business into an independent publicly-traded company through a pro rata distribution to our common stock holders. Completion of the proposed spin-off is subject to certain conditions, including final approval by our Board of Directors. We are targeting to compete the separation of the business by the end of fiscal year 2019.
Enterprise
Our Enterprise segment is a leading provider of automated customer solutions and services worldwide to aid enterprises with their customer service and engagement. Differentiated by our ASR, NLU and AI technologies, and complemented by our large professional services organization, our solutions help enterprises reduce or replace human contact center agents with conversational systems, across voice, mobile, web and messaging channels. Our intelligent self-service solutions are highly accurate and dependable, resulting in increased customer satisfaction levels while simultaneously reducing the costs associated with delivering customer service for the enterprise. We are continuing to evolve this business, leveraging our presence in on-premise interactive voice response ("IVR") solutions and services, and expanding into multichannel, self-service cloud solutions. Our solutions and services portfolio now span voice, mobile, web and messaging channels, with inbound and outbound customer service and engagement, voice biometrics, and digital virtual assistant capabilities.
Enterprise segment revenues were $483.2 million, $474.3 million, and $396.0 million in fiscal years 2018, 2017 and 2016, respectively. Enterprise segment revenues represented 23.3%, 24.0% and 20.0% of total segment revenue in fiscal years 2018, 2017 and 2016, respectively.
Our principal solutions for the Enterprise segment include the following:
• | On-Premise solutions and services: Provide software that is leveraged to implement automated customer service solutions that are integrated with a wide range of on-premise third-party IVR and contact center platforms. Our products and technologies include ASR, voice biometrics, transcription, TTS, dialog and analytics. Our global professional services team leverages domain expertise to provide end-to-end services to customers and partners, including business consulting, design, development, and deployment of integrated solutions. Our on-premise licensed products are primarily sold through a traditional perpetual software license model, and our on-premise professional services are sold under project-based and multi-year managed services contracts. |
• | On-Demand multichannel cloud: Deliver a platform that provides enterprises with the ability to implement automatic customer service across inbound, outbound, and digital customer service channels in the cloud. Our on-demand multichannel cloud leverages our ASR, voice biometrics, TTS, and virtual assistant technologies, to implement intelligent, conversational self-service applications, including voice call steering and self-service, automated verification, account access, virtual chat, proactive SMS, messaging and email, and customer service for mobile device customers. In addition, our acquisition of TouchCommerce, Inc. in fiscal year 2016 allows us to provide an end-to-end engagement platform that merges intelligent self-service with assisted service to increase customer satisfaction, strengthen customer loyalty and improve business results. Our on-demand multichannel cloud is sold through sales models that typically have multi-year terms with pricing based on the channel provided and/or volume of usage. |
The selling models in the Enterprise segment utilize both direct and channel sales, which includes a network of partners such as Avaya, BT, Cisco, DiData, Genesys, Huawei, MoshiMoshi, NICE, Telstra, and Verint. Our customers include, American Airlines, Amtrak, Bank of America, Barclays, Dominos, Delta, Deutsche Telekom, e*trade, ING Bank, Lloyds Banking Group, T-Mobile, Telefonica, Telstra, and Vodafone.
Areas of focus and expansion for our Enterprise segment include extending our technology capabilities with intelligent self-service and AI for customer service, expansion of our on-demand multichannel cloud to international markets, sales and solution expansion for our voice biometrics suite, and expanding our on-premise product and services portfolio.
4
Imaging
Our Imaging segment provides software solutions and expertise that help professionals and organizations gain optimal control of their document and information processes by enabling customers to achieve measurable business and productivity benefits as they securely create, use and share documents. Our portfolio of products and services helps business customers achieve compliance with information security policies and regulations while enabling organizations to streamline and eliminate gaps across their document work flows.
We have built on our position in MFP OEM channels and the managed print services space by accelerating the integration of capture and print management technologies. Our intelligent document capture and work flow solutions transform manual, disconnected processes into dynamic, streamlined, and automated work flows. When combined with print management technologies, organizations are also able to control, manage, and monitor their entire print environment. Our business has seen strong commitments from key OEMs, a broad number of OEM partners who embed multiple products, and strong end-user demand in key verticals like healthcare, legal, and financial services.
Imaging segment revenues were $212.9 million, $217.7 million, and $241.6 million in fiscal years 2018, 2017 and 2016, respectively. Imaging segment revenues represented 10.3%, 11.0% and 12.2% of total segment revenue in fiscal years 2018, 2017 and 2016, respectively.
Our principal solutions for the Imaging segment include the following:
• | MFP Scan and capture automation solutions: Deliver scanning and document management solutions that improve productivity, drive efficiency and assist in enhancing security. |
• | MFP Print management and automation solutions: Offer printing and document management solutions to capture and automate paper to digital work flows to increase efficiency. |
• | PDF and OCR software: Provide intuitive technologies that enable the efficient capture, creation, and management of document work flows. |
The channels for distribution in the Imaging segment include a combination of a global reseller network and direct sales. Our Imaging solutions are generally sold under a traditional perpetual software license model with a subset of our offerings sold as term licenses. Our Imaging customers and partners include Ricoh, Xerox, HP, Canon, and Samsung.
On November 11, 2018, we entered into a definitive stock purchase agreement, pursuant to which we agreed to sell our Imaging business and associated assets for a total cash consideration of approximately $400 million. The transaction, which is subject to regulatory review and other customary closing conditions, is expected to close by the end of the second quarter of fiscal year 2019.
Other
Other segment includes our SRS and Devices businesses. Our SRS business provides value-added services to mobile operators in India and Brazil (“Mobile Operator Services”) and voicemail transcription services to mobile operators in the rest of the world (“Voicemail-to-Text”). Our Devices business provides speech recognition solutions and predictive text technologies for handset devices. Our Mobile Operator Services has experienced dramatic market disruptions during fiscal year 2018. Our Devices revenue has been declining due to the ongoing consolidation of our handset manufacturer customer base and continued erosion of our penetration of the remaining market. During the fourth quarter of fiscal 2018, in connection with our comprehensive portfolio and business review efforts, we commenced a wind-down of our Devices and Mobile Operator Services businesses.
Other segment revenues were $109.1 million, $133.8 million, and 154.4 million in fiscal years 2018, 2017 and 2016, respectively. As a percentage of total segment revenue, Other segment revenues represented 5.3%, 6.8% and 7.8% in fiscal years 2018, 2017 and 2016, respectively.
5
Research and Development/Intellectual Property
Over our history we have developed and acquired extensive technology assets, intellectual property, and industry expertise in ASR, NLU and imaging technologies that provide us with a competitive advantage in our markets. Our technologies are based on complex algorithms that require extensive amounts of acoustic and language models, and recognition and understanding techniques. A significant investment in capital and time would be necessary to replicate our current capabilities.
We continue to invest in technologies to maintain our market-leading position and to develop new applications. We rely on a portfolio of patents, copyrights, trademarks, services marks, trade secrets, confidentiality provisions and licensing arrangements to establish and protect our intellectual property and proprietary rights. As of September 30, 2018, we held approximately 4,070 patents and 575 patent applications. Our intellectual property is critical to our success and competitive position.
Competition
The markets in which we compete are highly competitive and are subject to rapid technology changes. There are a number of companies that develop or may develop solutions and technologies that compete in our target markets; however, currently no company directly competes with us across all of our solutions and technologies. While we expect competition to continue to increase both from existing competitors and new market entrants, we believe that we will compete effectively based on many factors, including:
• | Specialized Professional Services. Our superior technology, when coupled with the high quality and domain knowledge of our professional services organization, allows our customers and partners to place a high degree of confidence and trust in our ability to deliver results. We support our customers in designing and building powerful innovative solutions that specifically address their needs and requirements. |
• | International Coverage. The international reach of our solutions and technologies is due to the broad language coverage of our offerings, including our ASR and NLU solutions, which provide recognition for approximately 70 languages and dialects and natural-sounding synthesized speech in over 160 voices, and support a broad range of hardware platforms and operating systems. Our imaging technology supports more than 120 languages for OCR and document handling, with up to 20 screen language choices, including Asian languages. |
• | Technological Superiority. Our ASR, NLU and imaging technologies, applications and solutions are often recognized as the most innovative and proficient in their respective categories. Our ASR and NLU solutions have industry-leading recognition accuracy and provide a natural, voice-enabled interaction with systems, devices and applications. Our OCR technology in our Imaging segment is viewed as the most accurate in the industry. Technology publications, analyst research and independent benchmarks have consistently indicated that our solutions and technologies rank at or above performance levels of alternative solutions. |
• | Broad Distribution Channels. Our ability to address the needs of specific markets, such as financial, law, healthcare and government, and to introduce new solutions and technologies quickly and effectively is provided by our direct sales force, our extensive global network of resellers, comprising system integrators, independent software vendors, value-added resellers, hardware vendors, telecommunications carriers and distributors, and our e-commerce website. |
In our Healthcare business, we compete primarily with M*Modal, Optum, 3M and other smaller providers. In our Automotive business we compete, or may in the future compete, with Amazon, Google, iFlyTek and Microsoft as well as with other, smaller vendors, particularly in China. In our Imaging business we compete primarily with ABBYY and Adobe. Also, some of our partners such as Avaya, Cisco, and Genesys develop and market products that might be considered substitutes for our Enterprise solutions. Additionally, a number of smaller companies in voice recognition, natural language understanding, text input and imaging offer technologies or products that are competitive with our solutions.
Current and potential competitors have established, or may establish, cooperative relationships among themselves or with third parties to increase the ability of their technologies to address the needs of our prospective customers.
Some of our competitors or potential competitors, such as Adobe, Google, and 3M, have significantly greater financial, technical and marketing resources than we do. These competitors may be able to respond more rapidly than we can to new or emerging technologies or changes in customer requirements. They may also devote greater resources to the development, promotion and sale of their products than we do.
6
Employees
As of September 30, 2018, we had approximately 10,400 full-time employees, including approximately 1,200 in sales and marketing, approximately 2,700 in professional services, approximately 2,100 in research and development, approximately 800 in general and administrative, and approximately 3,600 who provide transcription and editing services. Approximately 66% of our employees are based outside of the United States, approximately 45% of whom provide transcription and editing services and are based in India. None of our employees in the United States is represented by a labor union. Employees of certain of our foreign subsidiaries are presented by labor unions or workers’ councils. We believe that our relationships with our employees are satisfactory.
Information About Geographic Areas
We have offices in a number of international locations including Australia, Austria, Belgium, Brazil, Canada, China, Germany, Hungary, India, Ireland, Italy, Japan, and the United Kingdom. The responsibilities of our international operations include research and development, healthcare transcription and editing, customer support, sales and marketing and general and administrative. Additionally, we maintain smaller sales, services and support offices throughout the world to support our international customers and to expand international revenue opportunities.
Geographic revenue classification is based on the geographic areas in which our customers are located. For fiscal years 2018, 2017 and 2016, 72%, 70% and 71% of revenue was generated in the United States and 28%, 30% and 29% of revenue was generated by our international customers, respectively.
Corporate Information and Website
We were incorporated under the laws of the State of Delaware in 1992. Our website is located at www.nuance.com and we trade under the ticker symbol NUAN. We are not including the information contained in our website as part of, or incorporating it by reference into, this annual report on Form 10-K. We make available free of charge through our website our annual reports on Form 10-K, quarterly reports on Form 10-Q, current reports on Form 8-K and amendments to these reports, as soon as reasonably practicable after we electronically file these materials with, or otherwise furnish them to, the Securities and Exchange Commission ("SEC").
Item 1A.Risk Factors
You should carefully consider the risks and uncertainties described below when evaluating the company and when deciding whether to invest in the company. The risks and uncertainties described below are not the only ones we face. Additional risks and uncertainties not presently known to us or that we do not currently believe are important to an investor may also harm our business operations. If any of the events, contingencies, circumstances or conditions described below actually occurs, our business, financial condition or our results of operations could be seriously harmed. If that happens, the trading price of our common stock could decline.
Risks Related to Our Business
The markets in which we operate are highly competitive and rapidly changing and we may be unable to compete successfully.
There are a number of companies that develop or may develop products that compete in our targeted markets. The markets for our products and services are characterized by intense competition, evolving industry and regulatory standards, emerging business and distribution models, disruptive software and hardware technology developments, short product and service life cycles, price sensitivity on the part of customers, and frequent new product introductions, including alternatives for certain of our products that offer limited functionality at significantly lower costs or free of charge. Current and potential competitors have established, or may establish, cooperative relationships among themselves or with third parties to increase the ability of their technologies to address the needs of our prospective customers. Furthermore, there has been a trend toward industry consolidation in our markets for several years. We expect this trend to continue as companies attempt to strengthen or hold their market positions.
The competition in our targeted markets could adversely affect our operating results by reducing the volume of the products and solutions we license or sell or the prices we can charge. Some of our current or potential competitors have significantly greater financial, technical and marketing resources than we do. These competitors may be able to respond more rapidly than we can to new or emerging technologies or changes in customer requirements. They may also devote greater resources to the development, promotion and sale of their products than we do, and in certain cases may be able to include or combine their competitive products or technologies with other of their products or technologies in a manner whereby the competitive functionality is available at
7
lower cost or free of charge within the larger offering. To the extent they do so, market acceptance and penetration of our products, and therefore our revenue and bookings, may be adversely affected. Our success depends substantially upon our ability to enhance our products and technologies and to develop and introduce, on a timely and cost-effective basis, new products and features that meet changing customer requirements and incorporate technological enhancements. If we are unable to develop or acquire new products and enhance functionalities or technologies to adapt to these changes our business will suffer.
Our operating results may fluctuate significantly from period to period, and this may cause our stock price to decline.
Our revenue, bookings and operating results have fluctuated materially in the past and we expect such fluctuations to continue in the future. These fluctuations may cause our results of operations to not meet the expectations of securities analysts or investors which would likely cause the price of our stock to decline. Factors that may contribute to fluctuations in operating results include:
• | volume, timing and fulfillment of customer orders and receipt of royalty reports; |
• | fluctuating sales by our channel partners to their customers; |
• | customers delaying their purchasing decisions in anticipation of new versions of our products; |
• | contractual counterparties failing to meet their contractual commitments to us; |
• | introduction of new products by us or our competitors; |
• | cybersecurity or data breaches; |
• | seasonality in purchasing patterns of our customers; |
• | reduction in the prices of our products in response to competition, market conditions or contractual obligations; |
• | returns and allowance charges in excess of accrued amounts; |
• | timing of significant marketing and sales promotions; |
• | impairment of goodwill or intangible assets; |
• | the pace of the transition to an on-demand and transactional revenue model; |
• | delayed realization of synergies resulting from our acquisitions; |
• | accounts receivable that are not collectible and write-offs of excess or obsolete inventory; |
• | increased expenditures incurred pursuing new product or market opportunities; |
• | higher than anticipated costs related to fixed-price contracts with our customers; |
• | change in costs due to regulatory or trade restrictions; |
• | expenses incurred in litigation matters, whether initiated by us or brought by third-parties against us, and settlements or judgments we are required to pay in connection with disputes; and |
• | general economic trends as they affect the customer bases into which we sell. |
Due to the foregoing factors, among others, our revenue, bookings and operating results are difficult to forecast. Our expense levels are based in significant part on our expectations of future revenue, and we may not be able to reduce our expenses quickly to respond to near-term shortfalls in projected revenue. Therefore, our failure to meet revenue expectations would seriously harm our operating results, financial condition and cash flows.
A significant portion of our revenue and bookings are derived, and a significant portion of our research and development activities are based, outside the United States. Our results could be harmed by economic, political, regulatory, foreign currency fluctuations and other risks associated with these international regions.
Because we operate worldwide, our business is subject to risks associated with doing business internationally. We generate most of our international revenue and bookings in Europe and Asia, and we anticipate that revenue and bookings from international operations could increase in the future. In addition, some of our products are developed outside the United States and we have a large number of employees in India who provide transcription and development services, and we also have a large number of employees in Canada, Germany and the United Kingdom who provide professional services. We conduct a significant portion of the development of our voice recognition and natural language understanding solutions in Canada and Germany, and a significant portion of our imaging research and development in Hungary and Canada. We also have significant research and development resources in Austria, Belgium, China, Italy, and the United Kingdom. We are exposed to fluctuating exchange rates of foreign currencies including the euro, British pound, Brazilian real, Canadian dollar, Japanese yen, Indian rupee and Hungarian forint. Accordingly, our future results could be harmed by a variety of factors associated with international sales and operations, including:
• | adverse political and economic conditions, or changes to such conditions, in a specific region or country; |
• | trade protection measures, including tariffs and import/export controls, imposed by the United States and/or by other countries or regional authorities such as China, Canada or the European Union; |
8
• | the impact on local and global economies of the United Kingdom leaving the European Union; |
• | changes in foreign currency exchange rates or the lack of ability to hedge certain foreign currencies; |
• | compliance with laws and regulations in many countries and any subsequent changes in such laws and regulations; |
• | geopolitical turmoil, including terrorism and war; |
• | changing data privacy regulations and customer requirements to locate data centers in certain jurisdictions; |
• | evolving restrictions on cross-border investment, including recent enhancements to the oversight by the Committee on Foreign Investment in the United States pursuant to the Foreign Investment Risk Preview Modernization Act and substantial restrictions on investment from China; |
• | changes in applicable tax laws; |
• | difficulties in staffing and managing operations in multiple locations in many countries; |
• | longer payment cycles of foreign customers and timing of collections in foreign jurisdictions; and |
• | less effective protection of intellectual property than in the United States. |
We hired a new Chief Executive Officer in April 2018. If we encounter difficulties in the transition, our business could be negatively impacted.
Mark D. Benjamin became our Chief Executive Officer and a member of our Board of Directors in April 2018. Our future success will partly depend upon Mr. Benjamin’s ability, along with the ability of other senior management and key employees, to effectively implement our business strategies. In addition, Mr. Benjamin may pursue changes in our strategy or business focus. Mr. Benjamin may require transition time to fully understand all aspects of our business as would be typical with any executive transition. If we have failures in any aspects of this transition, or new strategies implemented by our management team are not successful, our business could be harmed.
If we are unable to attract and retain key personnel, our business could be harmed.
If any of our key employees were to leave, we could face substantial difficulty in hiring qualified successors and could experience a loss in productivity while any successor obtains the necessary training and experience. Although we have arrangements with some of our executive officers designed to promote retention, our employment relationships are generally at-will and we have had key employees leave in the past. We cannot assure you that one or more key employees will not leave in the future. We intend to continue to hire additional highly qualified personnel, including research and development and operational personnel, but may not be able to attract, assimilate or retain qualified personnel in the future. Any failure to attract, integrate, motivate and retain these employees could harm our business.
We recently added a number of new directors to our Board of Directors and a number of long-serving directors retired from our Board of Directors. If the transition to these new directors is not effective, our business could be harmed.
In June 2018 three long-serving directors retired from our Board and seven of the nine members of our Board of Directors have joined since December 2017, including four in September 2018. We have also recently reconstituted the membership of Board Committees to take advantage of the experience the new members bring to our Board of Directors. There can be no assurances that the Board of Directors or its committees will function effectively and that there will not be any adverse effects on the business as a result of the significant changes on our Board of Directors.
We experienced a significant malware incident in the third quarter of fiscal 2017, the residual impact of which will continue to impact our future results of operation and financial condition.
On June 27, 2017, Nuance was a victim of the global NotPetya malware incident (the “2017 Malware Incident”). The NotPetya malware affected certain Nuance systems, including systems used by our healthcare customers, primarily for transcription services, as well as systems used by our imaging division to receive and process orders. Our revenue and our operating results for fiscal year 2017 were negatively impacted by the 2017 Malware Incident. For fiscal year 2017, we estimate that we lost approximately $68.0 million in revenues, primarily in our Healthcare segment, due to the service disruption and the reserves we established for customer refund credits. Additionally, we incurred incremental costs of approximately $24.0 million for fiscal year 2017 as a result of our remediation and restoration efforts, as well as incremental amortization expenses. Although the direct effects of the 2017 Malware Incident were remediated during fiscal year 2017, the 2017 Malware Incident had a continued effect on our results of operations in fiscal year 2018. Our outlook for fiscal year 2019 reflects both the residual effects of the incident and ongoing costs we will incur to continuously enhance information security.
9
Cybersecurity and data privacy incidents or breaches may damage client relations and inhibit our growth.
The confidentiality and security of our information, and that of third parties, is critical to our business. Our services involve the transmission, use, and storage of customers’ and their customer’s confidential information. We were the victim of a cybercrime in 2017, and future cybersecurity or data privacy incidents could have a material adverse effect on our results of operations and financial condition. While we maintain a broad array of information security and privacy measures, policies and practices, our networks may be breached through a variety of means, resulting in someone obtaining unauthorized access to our information, to information of our customers or their customers, or to our intellectual property; disabling or degrading service; or sabotaging systems or information. In addition, hardware, software, or applications we develop or procure from third parties may contain defects in design or manufacture or other problems that could unexpectedly compromise information security. Unauthorized parties may also attempt to gain access to our systems or facilities, or those of third parties with whom we do business, through fraud or other forms of deceiving our employees, contractors, and vendors. Because the techniques used to obtain unauthorized access, or to sabotage systems, change frequently and generally are not recognized until launched against a target, we may be unable to anticipate these techniques or to implement adequate preventative measures. We will continue to incur significant costs to continuously enhance our information security measures to defend against the threat of cybercrime. Any cybersecurity or data privacy incident or breach may result in:
• | loss of revenue resulting from the operational disruption; |
• | loss of revenue or increased bad debt expense due to the inability to invoice properly or to customer dissatisfaction resulting in collection issues; |
• | loss of revenue due to loss of customers; |
• | material remediation costs to restore systems; |
• | material investments in new or enhanced systems in order to enhance our information security posture; |
• | cost of incentives offered to customers to restore confidence and maintain business relationships; |
• | reputational damage resulting in the failure to retain or attract customers; |
• | costs associated with potential litigation or governmental investigations; |
• | costs associated with any required notices of a data breach; |
• | costs associated with the potential loss of critical business data; and |
• | other consequences of which we are not currently aware but will discover through the remediation process. |
Our business is subject to a variety of domestic and international laws, rules, policies and other obligations including data protection and anticorruption.
We are subject to US and international laws and regulations in multiple areas, including data protection, anticorruption, labor relations, tax, foreign currency, anti-competition, import, export and trade regulations, and we are subject to a complex array of federal, state and international laws relating to the collection, use, retention, disclosure, security and transfer of personally identifiable information and personal health information, with additional laws applicable in some jurisdictions where the information is collected from children. In many cases, these laws apply not only to transfers between unrelated third-parties but also to transfers between us and our subsidiaries. Many jurisdictions have passed laws in this area, and other jurisdictions are considering imposing additional restrictions. The European Commission adopted the European General Data Protection Regulation (the “GDPR”), which went into effect on May 25, 2018. China adopted a new cybersecurity law as of June 2017, and there is an increase in regulation of biometric data globally, which may include voiceprints. In addition, California adopted significant new consumer privacy laws in June 2018 that will be effective beginning in January 2020. Complying with the GDPR, the Health Insurance Portability and Accountability Act of 1966 ("HIPPA"), the Health Information Technology for Economic and Clinical Health ("HITECH"), and other requirements may cause us to incur substantial costs and may require us to change our business practices.
Any failure by us, our customers, suppliers or other parties with whom we do business to comply with our privacy policy or with federal, state or international privacy-related or data protection laws and regulations could result in proceedings against us by governmental entities or others. Any alleged or actual failure to comply with applicable privacy laws and regulations may:
• | cause our customers to lose confidence in our solutions; |
• | harm our reputation; |
• | expose us to litigation, regulatory investigations and to resulting liabilities including reimbursement of customer costs, damages penalties or fines imposed by regulatory agencies; and |
• | require us to incur significant expenses for remediation. |
10
We are also subject to a variety of anticorruption laws in respect of our international operations, including the U.S. Foreign Corrupt Practices Act, the U.K. Bribery Act and the Canadian Corruption of Foreign Public Officials Act, and regulations issued by the U.S. Customs and Border Protection, the U.S Bureau of Industry and Security, the U.S Treasury Department’s Office of Foreign Assets Control, and various other foreign governmental agencies. We cannot predict the nature, scope or effect of future regulatory requirements to which our international operations might be subject or the manner in which existing laws might be administered or interpreted. Actual or alleged violations of these laws and regulations could lead to enforcement actions and financial penalties that could result in substantial costs.
Interruptions or delays in our services could impair the delivery of our services and harm our business
Because our services are complex and incorporate a variety of third-party hardware and software, our services may have errors or defects that could result in unanticipated downtime for our customers and harm to our reputation and our business. We have from time to time, found defects in our services, and new errors in our services may be detected in the future. Any damage to, or failure of, the systems that serve our customers in whole or in part could result in interruptions in our service. Interruptions in our service may reduce our revenue, cause us to issue credits or pay service-level agreement penalties, cause customers to terminate their on-demand services, and adversely affect our renewal rates and our ability to attract new customers.
Interruptions or delays in service from data center hosting facilities could impair the delivery of our services and harm our business.
We currently serve our customers from data center hosting facilities we directly manage and from third-party public cloud facilities. Any damage to, or failure of, the systems that serve our customers could result in interruptions in our service. Interruptions in our service may reduce our revenue, cause us to issue credits or pay service level agreement penalties, cause customers to terminate their on-demand services and adversely affect our renewal rates and our ability to attract new customers.
We may be unable to fully capture the expected value from strategic transactions.
As part of our business strategy, we have in the past acquired, and expect to continue to acquire, other businesses and technologies. We also expect to from time to time pursue other strategic transactions including divestitures, joint ventures, minority stakes and strategic alliances. Our acquisitions have required substantial integration and management efforts, and we expect future acquisitions, divestitures and other strategic transactions to require similar efforts. Successfully realizing the benefits of acquisitions, divestitures and other strategic transactions involves a number of risks, including:
• | difficulty in transitioning and integrating the operations and personnel of the acquired businesses; |
• | difficulty in separating the operations, personnel and systems of divested businesses: |
• | potential disruption of our ongoing business and distraction of management; |
• | difficulty in incorporating acquired products and technologies into our products and technologies; |
• | potential difficulties in completing projects associated with in-process research and development; |
• | unanticipated expenses and delays in completing acquired development projects and technology integration and upgrades; |
• | challenges associated with managing additional, geographically remote businesses; |
• | impairment of relationships with partners and customers; |
• | assumption of unknown material liabilities of acquired companies; |
• | the accuracy of revenue and bookings projections of acquired companies; |
• | customers delaying purchases of our products pending resolution of product integration between our existing and our newly acquired products; |
• | entering markets or types of businesses in which we have limited experience; and |
• | potential loss of key employees of the acquired business. |
As a result of these and other risks, we may not realize the anticipated benefits from our acquisitions, divestitures, and other strategic transactions. Any failure to achieve these benefits or failure to successfully integrate acquired businesses and technologies or disaggregate divested businesses and technologies could seriously harm our business.
11
Our plans to wind down or divest certain businesses are subject to various risks and uncertainties and may not be completed in accordance with the expected plans or anticipated timeline, or at all, and will involve significant time and expense, which could disrupt or adversely affect our business.
In connection with our comprehensive business review, we have announced our intent to wind down or divest, including spin-out, certain of our businesses, including our Imaging, Automotive, Devices and Mobile Operating Services businesses.
Winding down or divesting businesses involve risks and uncertainties, such as difficulty separating assets related to such businesses from the businesses we retain, distracting employees, the need to obtain regulatory approvals and other third party consents, potentially disrupting customer and vendor relationships, and we may be subject to additional tax obligations or loss of certain tax benefits. Such actions also involve significant costs and require time and attention of our management, which may divert attention from other business operations. As a result of these challenges, as well as market conditions or other factors, the anticipated wind downs and divestitures may take longer or be more costly than expected, and may not be completed at all. If we are unable to complete the wind downs or divestitures or to successfully transition divested businesses, our business and financial results could be negatively impacted.
After we dispose of a business, we may retain exposure on financial guarantee leases, real estate and other contractual, employment, pension and severance obligations, and potential liabilities that may arise under law as a result of the disposition or the subsequent failure of an acquirer. As a result, performance by the divested businesses or other conditions outside of our control could have a material adverse impact on our results of operations.
In addition, the wind down or divestiture of any business could negatively impact our profitability as a result of losses that may result from such a sale, the loss of sales and operating income, or a decrease in cash flows as a result of such actions and we may also experience greater dissynergies than expected.
Charges to earnings as a result of our acquisitions may adversely affect our operating results in the foreseeable future, which could have a material and adverse effect on the market value of our common stock.
Under accounting principles generally accepted in the United States, we record the market value of our common stock and other forms of consideration issued in connection with an acquisition as the cost of acquiring the company or business. We allocate that cost to the individual assets acquired and liabilities assumed, including various identifiable intangible assets such as acquired technology, acquired trade names and acquired customer relationships, based on their respective fair values. We base our estimates of fair value upon assumptions believed to be reasonable, but which are inherently uncertain. After we complete an acquisition, the following factors could result in material charges and may adversely affect our operating results and cash flows:
• | costs incurred to integrate the operations of businesses we acquire, such as transitional employee expenses and employee retention, redeployment or relocation expenses; |
• | impairment of goodwill or intangible assets; |
• | amortization of intangible assets acquired; |
• | a reduction in the useful lives of intangible assets acquired; |
• | identification of or changes to assumed contingent liabilities, both income tax and non-income tax related, after our final determination of the amounts for these contingencies or the conclusion of the measurement period (generally up to one year from the acquisition date), whichever comes first; |
• | charges to our operating results to eliminate certain duplicative pre-merger activities, to restructure our operations or to reduce our cost structure; |
• | charges to our operating results arising from expenses incurred to effect the acquisition; and |
• | charges to our operating results due to the expensing of stock awards assumed in acquisitions. |
Intangible assets are generally amortized over three to ten years. Goodwill is not subject to amortization but is subject to an impairment analysis, at least annually, which may result in an impairment charge if the carrying value exceeds its implied fair value. As of September 30, 2018, we had recorded goodwill of $3,504.5 million and intangible assets of $549.5 million, net of accumulated amortization and impairment charges. In addition, purchase accounting limits our ability to recognize certain revenue that otherwise would have been recognized by the acquired company as an independent business. As a result, the combined company may delay revenue recognition or recognize less revenue than we and the acquired company would have recognized as independent companies.
12
Impairment of our intangible assets could result in significant charges that would adversely impact our future operating results.
We have significant intangible assets, including goodwill and other intangible assets, which are susceptible to valuation adjustments as a result of changes in various factors or conditions. The most significant intangible assets are customer relationships, patents and core technologies, technologies and trademarks. Customer relationships are amortized on an accelerated basis based upon the pattern in which the economic benefits of customer relationships are being utilized. Other identifiable intangible assets are amortized on a straight-line basis over their estimated useful lives. We assess the potential impairment of intangible assets on an annual basis, as well as whenever events or changes in circumstances indicate that the carrying value may not be recoverable. Factors that could trigger an impairment of such assets include the following:
• | significant adjustments to our multi year operating plans, in connection of our ongoing portfolio review; |
• | changes in our organization or management reporting structure that could result in additional reporting units, which may require alternative methods of estimating fair values or greater disaggregation or aggregation in our analysis by reporting unit; |
• | significant under performance relative to historical or projected future operating results; |
• | significant changes in the manner of or use of the acquired assets or the strategy for our overall business; |
• | significant negative industry or economic trends; |
• | significant decline in our stock price for a sustained period; and |
• | our market capitalization declining to below net book value. |
For example, as more fully described in Note 4 to the accompanying consolidated financial statements, during the second quarter of fiscal year 2018, we reorganized our former Mobile business into three discrete lines of business - Automotive, Dragon TV, and Devices. In connection with this reorganization, and the review of goodwill and indefinite-lived intangible assets for impairment that was triggered by recent financial results and rapidly changing business conditions for our Subscriber Revenue Services (“SRS”), we recorded a total of $137.9 million of goodwill impairment charge related to Devices and SRS for the second quarter of fiscal 2018. Additionally, in connection with our comprehensive portfolio and business review efforts, management decided to commence a wind-down of our Mobile Operator Services and Devices businesses during the fourth quarter of fiscal 2018. As a result, we recorded additional impairment charges of goodwill and other intangible assets of approximately $33.0 million. For more information, please see Note 4 of the accompanying consolidated financial statements. Future adverse changes in these or other unforeseeable factors could result in an impairment charge that would impact our results of operations and financial position in the reporting period identified.
We have grown, and may continue to grow, through acquisitions, which could dilute our existing stockholders and/or increase our debt levels.
In connection with past acquisitions, we have in the past issued a substantial number of shares of our common stock as transaction consideration, including contingent consideration, and also incurred significant debt to finance the cash consideration used for our acquisitions. We may continue to issue equity securities for future acquisitions, which would dilute existing stockholders, perhaps significantly, depending on the terms of such acquisitions. We may also incur additional debt in connection with future acquisitions, which, if available at all, may place additional restrictions on our ability to operate our business.
Our strategy to increase cloud services, term licensing and transaction-based recurring revenue may adversely affect our near-term revenue growth and results of operations.
We expect our ongoing shift from a perpetual software license model to cloud services, term licensing and transaction-based recurring revenue models to create a recurring revenue stream that is more predictable. The transition, however, creates risks related to the timing of revenue recognition. We also incur certain expenses associated with the infrastructures and selling efforts of our hosting offerings in advance of our ability to recognize the revenues associated with these offerings, which may adversely affect our near-term reported revenues, results of operations and cash flows. A decline in renewals of recurring revenue offerings in any period may not be immediately reflected in our results for that period but may result in a decline in our revenue and results of operations in future quarters.
13
We have a history of operating losses, and may incur losses in the future, which may require us to raise additional capital on unfavorable terms.
We reported net losses of $159.9 million, $151.0 million and $12.5 million in fiscal years 2018, 2017 and 2016, respectively, and have a total accumulated deficit of $740.8 million as of September 30, 2018. If we are unable to return to profitability, the market price for our stock may decline, perhaps substantially. We cannot assure you that our revenue or bookings will grow or that we will return to profitability in the future. If we do not achieve profitability, we may be required to raise additional capital to maintain or grow our operations. Additional capital, if available at all, may be highly dilutive to existing investors or contain other unfavorable terms, such as a high interest rate and restrictive covenants.
If our efforts to execute our formal transformation program are not successful, our business could be harmed.
We have been executing a formal transformation program to focus our product investments on our growth opportunities, increase our operating efficiencies, reduce costs, and further enhance stockholder value through share buybacks. There can be no assurance that we will be successful in executing this transformation program or be able to fully realize the anticipated benefits of this program, within the expected time frames, or at all. Additionally, if we are not successful in strategically aligning our product portfolio, we may not be able to achieve the anticipated benefits of this program. A failure to successfully reduce and re-align our costs could have an adverse effect on our revenue and on our expenses and profitability. As a result, our financial results may not meet our or the expectations of securities analysts or investors in the future and our business could be harmed.
Tax matters may cause significant variability in our financial results.
Our businesses are subject to income taxation in the United States, as well as in many tax jurisdictions throughout the world. Tax rates in these jurisdictions may be subject to significant change. If our effective tax rate increases, our operating results and cash flow could be adversely affected. Our effective income tax rate can vary significantly between periods due to a number of complex factors including:
• | projected levels of taxable income; |
• | pre-tax income being lower than anticipated in countries with lower statutory rates or higher than anticipated in countries with higher statutory rates; |
• | increases or decreases to valuation allowances recorded against deferred tax assets; |
• | tax audits conducted and settled by various tax authorities; |
• | adjustments to income taxes upon finalization of income tax returns; |
• | the ability to claim foreign tax credits; |
• | the repatriation of non-U.S. earnings for which we have not previously provided for income taxes; and |
• | changes in tax laws and their interpretations in countries in which we are subject to taxation. |
During 2014, Ireland enacted changes to the taxation of certain Irish incorporated companies effective as of January 2021. On October 5, 2015, the Organization for Economic Cooperation and Development released the Final Reports for its Action Plan on Base Erosion and Profit Shifting. The implementation of one or more of these reports in jurisdictions in which we operate, together with the 2014 enactment by Ireland, could result in an increase to our effective tax rate. In addition, in December 2017, the United States enacted the Tax Cut and Jobs Act of 2017. We expect this to continue having a material impact on our GAAP tax financial results. Future changes in U.S. and non-U.S. tax laws and regulations could have a material effect on our results of operations in the periods in which such laws and regulations become effective as well as in future periods.
The failure to successfully maintain the adequacy of our system of internal control over financial reporting could have a material adverse impact on our ability to report our financial results in an accurate and timely manner.
Under the Sarbanes-Oxley Act of 2002, we were required to develop and are required to maintain an effective system of disclosure controls and internal control over financial reporting to provide reasonable assurance regarding the reliability of financial reporting and the preparation of financial statements. In addition, our management is required to assess and certify the adequacy of our controls on a quarterly basis, and our independent auditors must attest and report on the effectiveness of our internal control over financial reporting on an annual basis. Any failure in the effectiveness of our system of internal control over financial reporting could have a material adverse impact on our ability to report our financial statements in an accurate and timely manner. Inaccurate and/or untimely financial statements could subject us to regulatory actions, civil or criminal penalties, stockholder litigation, or loss of customer confidence, which could result in an adverse reaction in the financial marketplace and ultimately could negatively impact our stock price due to a loss of investor confidence in the reliability of our financial statements.
14
Our sales to government clients subject us to risks, including early termination, audits, investigations, sanctions and penalties.
We derive a portion of our revenues and bookings from arrangements with governmental users in the U.S. and U.K., and contracts with the government in the U.S. and the U.K., as well as various state and local governments, and their respective agencies. Government contracts are generally subject to oversight, including audits and investigations which could identify violations of these agreements. Government contract violations could result in a range of consequences including, but not limited to, contract price adjustments, civil and criminal penalties, contract termination, forfeiture of profit and/or suspension of payment, and suspension or debarment from future government contracts. We could also suffer serious harm to our reputation if we were found to have violated the terms of our government contracts.
Risks Related to Our Intellectual Property and Technology
Third parties have claimed and may claim in the future that we are infringing their intellectual property, and we could be exposed to significant litigation or licensing expenses or be prevented from selling our products if such claims are successful.
From time to time, we are subject to claims and law actions alleging that we or our customers may be infringing or contributing to the infringement of the intellectual property rights of others. We may be unaware of intellectual property rights of others that may cover some of our technologies and products. If it appears necessary or desirable, we may seek licenses for these intellectual property rights. However, we may not be able to obtain licenses from some or all claimants, the terms of any offered licenses may not be acceptable to us, and we may not be able to resolve disputes without litigation. Any litigation regarding intellectual property could be costly and time-consuming and could divert the attention of our management and key personnel from our business operations. Intellectual property disputes could subject us to significant liabilities, require us to enter into royalty and licensing arrangements on unfavorable terms, prevent us from manufacturing or licensing certain of our products, cause severe disruptions to our operations or the markets in which we compete, or require us to satisfy indemnification commitments with our customers including contractual provisions under various arrangements. Any of these could seriously harm our business.
Unauthorized use of our proprietary technology and intellectual property could adversely affect our business and results of operations.
Our success and competitive position depend in large part on our ability to obtain and maintain intellectual property rights protecting our products and services. We rely on a combination of patents, copyrights, trademarks, service marks, trade secrets, confidentiality provisions and licensing arrangements to establish and protect our intellectual property and proprietary rights. Unauthorized parties may attempt to copy or discover aspects of our products or to obtain, license, sell or otherwise use information that we regard as proprietary. Policing unauthorized use of our products is difficult and we may not be able to protect our technology from unauthorized use. Additionally, our competitors may independently develop technologies that are substantially the same or superior to our technologies and that do not infringe our rights. In these cases, we would be unable to prevent our competitors from selling or licensing these similar or superior technologies. In addition, the laws of some foreign countries do not protect our proprietary rights to the same extent as the laws of the United States. Although the source code for our proprietary software is protected both as a trade secret and as a copyrighted work, litigation may be necessary to enforce our intellectual property rights, to protect our trade secrets, to determine the validity and scope of the proprietary rights of others, or to defend against claims of infringement or invalidity. Litigation, regardless of the outcome, can be very expensive and can divert management efforts.
Our software products may have bugs, which could result in delayed or lost revenue and bookings, expensive correction, liability to our customers and claims against us.
Complex software products such as ours may contain errors, defects or bugs. Defects in the solutions or products that we develop and sell to our customers could require expensive corrections and result in delayed or lost revenue and bookings, adverse customer reaction and negative publicity about us or our products and services. Customers who are not satisfied with any of our products may also bring claims against us for damages, which, even if unsuccessful, would likely be time-consuming to defend, and could result in costly litigation and payment of damages. Such claims could harm our reputation, financial results and competitive position.
15
Risks Related to our Corporate Structure, Organization and Common Stock
Our debt agreements contain covenant restrictions that may limit our ability to operate our business.
Our debt agreements contain, and any of our other future debt agreements or arrangements may contain, covenant restrictions that limit our ability to operate our business, including restrictions on our ability to:
• | incur additional debt or issue guarantees; |
• | create liens; |
• | make certain investments; |
• | enter into transactions with our affiliates; |
• | sell certain assets; |
• | repurchase capital stock or make other restricted payments; |
• | declare or pay dividends or make other distributions to stockholders; and |
• | merge or consolidate with any entity. |
Our ability to comply with these limitations is dependent on our future performance, which will be subject to many factors, some of which are beyond our control, including prevailing economic conditions. As a result of these limitations, our ability to respond to changes in business and economic conditions and to obtain additional financing, if needed, may be significantly restricted, and we may be prevented from engaging in transactions that might otherwise be beneficial to us. In addition, our failure to comply with our debt covenants could result in a default under our debt agreements, which could permit the holders to accelerate our obligation to repay the debt. If any of our debt is accelerated, we may not have sufficient funds available to repay the accelerated debt.
Our significant debt could adversely affect our financial health and prevent us from fulfilling our obligations under our credit facility and our convertible debentures.
We have a significant amount of debt. As of September 30, 2018, we had $2,437.0 million outstanding principal of debt, including $300.0 million of senior note due in 2020, $300.0 million of senior note due in 2024, and $500.0 million of senior note due in 2026, $46.6 million of 2.75% 2031 Debentures redeemable in November 2021, $263.9 million of 1.5% 2035 Debentures redeemable in November 2021, $676.5 million of 1.0% 2035 Debentures redeemable in December 2022, and $350.0 million of 1.25% 2025 Debentures redeemable in April 2025. Investors may require us to redeem these debentures earlier than the dates indicated if the closing sale price of our common stock is more than 130% of the then current conversion price of the respective debentures for certain specified periods. If a holder elects to convert, we will be required to pay the principal amount in cash and any amounts payable in excess of the principal amount in cash or shares of our common stock, at our election. For example, on November 1, 2017, holders of $331.2 million of our 2.75% 2031 Debentures exercised their rights to require us to repurchase such debentures. We also have a $242.5 million Revolving Credit Facility under which $6.9 million was committed to backing outstanding letters of credit issued and $235.6 million was available for borrowing at September 30, 2018. Our debt level could have important consequences, for example it could:
• | require us to use a large portion of our cash flow to pay principal and interest on debt, including the convertible debentures and the credit facility, which will reduce the availability of our cash flow to fund working capital, capital expenditures, acquisitions, research and development, exploiting business opportunities, and other business activities; |
• | place us at a competitive disadvantage compared to our competitors that have less debt; and |
• | limit, along with the financial and other restrictive covenants related to our debt, our ability to borrow additional funds, dispose of assets or pay cash dividends. |
Our ability to meet our payment and other obligations under our debt instruments depends on our ability to generate significant cash flow in the future. This, to some extent, is subject to general economic, financial, competitive, legislative and regulatory factors as well as other factors that are beyond our control. We cannot assure you that our business will generate cash flow from operations, or that additional capital will be available to us, in an amount sufficient to enable us to meet our payment obligations under the convertible debentures and our other debt and to fund other liquidity needs. If we are not able to generate sufficient cash flow to service our debt obligations, we may need to refinance or restructure our debt, including the convertible debentures, sell assets, reduce or delay capital investments, or seek to raise additional capital. If we are unable to implement one or more of these alternatives, we may not be able to meet our payment obligations under the convertible debentures and our other debt.
16
The market price of our common stock has been and may continue to be subject to wide fluctuations, and this may make it difficult for you to resell the common stock when you want or at prices you find attractive.
Our stock price historically has been, and may continue to be, volatile. Various factors contribute to the volatility of our stock price, including, for example, quarterly variations in our financial results, new product introductions by us or our competitors and general economic and market conditions. Sales of a substantial number of shares of our common stock by our largest stockholders, or the perception that such sales could occur, could also contribute to the volatility or our stock price. While we cannot predict the individual effect that any of these factors may have on the market price of our common stock, these factors, either individually or in the aggregate, could result in significant volatility in our stock price. Moreover, companies that have experienced volatility in the market price of their stock may be
subject to securities class action litigation. Any such litigation could result in substantial costs and divert management's attention and resources.
Current uncertainty in the global financial markets and the global economy may negatively affect the value of our investment portfolio.
Our investment portfolios, which include investments in money market funds, bank deposits and separately managed investment portfolios, are generally subject to credit, liquidity, counterparty, market and interest rate risks that may be exacerbated by a global financial crisis or by uncertainty surrounding the United Kingdom's exit from the European Union or recent changes in tariffs and trade agreements. If the banking system or the fixed income, credit or equity markets deteriorate or remain volatile, our investment portfolio may be impacted, and the values and liquidity of our investments could be adversely affected
Future issuances of our common stock could adversely affect the trading price of our common stock and our ability to raise funds in new stock offerings.
Future issuances of substantial amounts of our common stock, whether in the public market or through private placements, including issuances in connection with acquisition activities, or the perception that such issuances could occur, could adversely affect prevailing trading prices of our common stock and could impair our ability to raise capital through future offerings of equity or equity-related securities. In connection with past acquisitions, we issued a substantial number of shares of our common stock as transaction consideration or contingent consideration. We may continue to issue equity securities for future acquisitions, which would dilute existing stockholders, perhaps significantly depending on the terms of such acquisitions. No prediction can be made as to the effect, if any, that future sales of shares of common stock, or the availability of shares of common stock for future sale, will have on the trading price of our common stock.
Our business could be negatively affected by the actions of activist stockholders.
In the past, certain stockholders have publicly and privately expressed concerns with our performance and with certain governance matters. Responding to actions by activist stockholders can be costly and time-consuming, disrupting our operations and diverting the attention of management and our employees. Furthermore, any perceived uncertainties as to our future direction could result in the loss of potential business opportunities, and may make it more difficult to attract and retain qualified personnel and business partners. In addition, we have enacted certain changes to our bylaws in the past year that may weaken our ability to prevent an unsolicited takeover.
Item 1B. | Unresolved Staff Comments |
None.
17
Item 2. | Properties |
Our corporate headquarters are located in Burlington, Massachusetts. As of September 30, 2018, we leased approximately 1.5 million square feet of building space, primarily in the United States, and to a lesser extent, in Asia-Pacific regions, Europe and Canada. Larger leased sites include properties located in: Montreal, Canada; Sunnyvale, California; and Bangalore, India. In addition, we own 130,000 square feet of building space located in Melbourne, Florida.
We also include in the total square feet leased space leased in specialized data centers in Massachusetts, Washington, Texas, China and smaller facilities around the world.
We believe our existing facilities and equipment, which are used by all of our operating segments, are in good operating condition and are suitable for the conduct of our business.
Item 3. | Legal Proceedings |
Similar to many companies in the software industry, we are involved in a variety of claims, demands, suits, investigations and proceedings that arise from time to time relating to matters incidental to the ordinary course of our business, including actions with respect to contracts, intellectual property, employment, benefits and securities matters. We evaluate the probability of adverse outcomes and, as applicable, estimate the amount of probable losses that may result from pending matters. Probable losses that can be reasonably estimated are reflected in our consolidated financial statements. These recorded amounts are not material to our consolidated financial statements for any of the periods presented in the accompanying consolidated financial statements. While it is not possible to predict the outcome of these matters with certainty, we do not expect the results of any of these actions to have a material adverse effect on our results of operations or financial position. However, each of these matters is subject to uncertainties, the actual losses may prove to be larger or smaller than the accruals reflected in our consolidated financial statements, and we could incur judgments or enter into settlements of claims that could adversely affect our financial position, results of operations or cash flows.
Item 4. | Mine Safety Disclosures |
Not applicable.
PART II
Item 5.Market for the Registrant's Common Equity, Related Stockholder Matters and Issuer Purchases of Equity Securities
Market Information
Our common stock is traded on the Nasdaq Global Select Market under the symbol “NUAN”. The following table sets forth, for our fiscal quarters indicated, the high and low sales prices of our common stock, in each case as reported on the Nasdaq Global Select Market.
Low | High | ||||||
Fiscal Year 2017: | |||||||
First quarter | $ | 13.44 | $ | 17.47 | |||
Second quarter | $ | 14.85 | $ | 17.43 | |||
Third quarter | $ | 16.36 | $ | 19.93 | |||
Fourth quarter | $ | 15.38 | $ | 17.97 | |||
Fiscal Year 2018: | |||||||
First quarter | $ | 14.02 | $ | 17.72 | |||
Second quarter | $ | 15.23 | $ | 18.75 | |||
Third quarter | $ | 12.18 | $ | 15.75 | |||
Fourth quarter | $ | 13.70 | $ | 17.42 | |||
18
Holders
As of October 31, 2018, there were 605 stockholders of record of our common stock. Because many of our shares of common stock are held by brokers and other institutions on behalf of stockholders, we are unable to estimate the total number of beneficial owners represented by these record holders.
Dividend Policy
We have never declared or paid any cash dividends on our common stock. We currently expect to retain future earnings, if any, to finance the growth and development of our business, or to purchase common stock under our share repurchase program and do not anticipate paying any cash dividends in the foreseeable future. Furthermore, the terms of our debt agreements place restrictions on our ability to pay dividends, except for stock dividends.
Stock Performance Graph
The following performance graph compares the Company’s cumulative total return on its common stock between September 30, 2013 and September 30, 2018 to the cumulative total return of the Russell 2000, and to the S&P Information Technology indices assuming $100 was invested in the Company’s common stock and each of the indices upon the closing of trading on September 30, 2013 and assuming the reinvestment of dividends, if any. The Company has have never declared or paid any cash dividends on its common stock and does not anticipate paying any cash dividends in the foreseeable future.
The comparisons shown in the graph below are based upon historical data. We caution that the stock price performance shown in the graph below is not necessarily indicative of, nor is it intended to forecast, the potential future performance of our common stock.
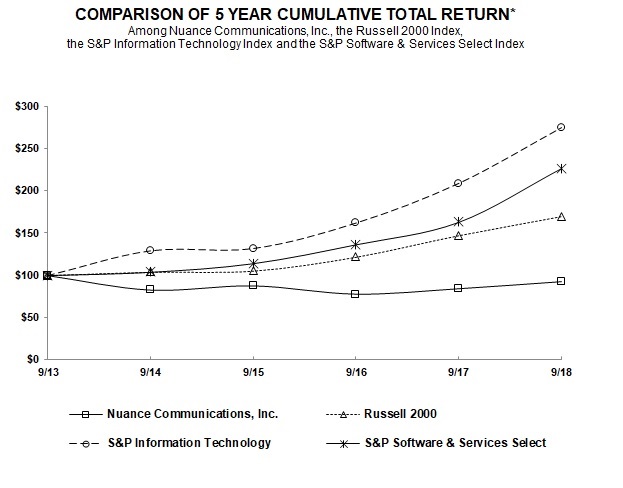
* $100 invested on September 30, 2013 in stock or index, including reinvestment of dividends, for each of the fiscal years below.
9/13 | 9/14 | 9/15 | 9/16 | 9/17 | 9/18 | ||
Nuance Communications, Inc. | 100.00 | 82.52 | 87.63 | 77.62 | 84.15 | 92.72 | |
Russell 2000 | 100.00 | 103.93 | 105.23 | 121.50 | 146.70 | 169.06 | |
S&P Information Technology | 100.00 | 129.27 | 132.00 | 162.13 | 208.96 | 274.76 | |
S&P Software & Services Select | 100.00 | 103.86 | 114.06 | 136.40 | 162.94 | 226.49 | |
19
Issuer Purchases of Equity Securities
The following is a summary of our share repurchases for the three months ended September 30, 2018:
Period | Total Number of Shares Purchased | Average Price Paid per Share | Total Number of Shares Purchased as Part of Publicly Announced Program (1) | Approximate Dollar Value of Shares that May Yet Be Purchased Under the Program(1) | ||||||||||
July 1, 2018 - July 31, 2018 | 907,286 | $ | 14.45 | 907,286 | $ | 68,324,001 | ||||||||
August 1, 2018 - August 31, 2018 | 402,897 | $ | 15.78 | 402,897 | $ | 561,968,153 | ||||||||
September 1, 2018 - September 30, 2018 | 280,213 | $ | 16.59 | 280,213 | $ | 557,318,776 | ||||||||
Total | 1,590,396 | 1,590,396 | ||||||||||||
(1) On April 29, 2013, our Board of Directors approved a share repurchase program for up to $500.0 million, which was increased by $500.0 million on April 29, 2015. On August 1, 2018, our Board of Directors approved an additional $500.0 million under our share repurchase program. The program has no expiration date. As of September 30, 2018, approximately $557.3 million remained available for future repurchases under the program.
For the majority of restricted stock units granted to employees, the number of shares issued on the date the restricted stock units vest is net of the minimum statutory income withholding tax requirements that we pay in cash to the applicable taxing authorities on behalf of our employees. We do not consider these transactions to be common stock repurchases.
Unregistered Sales of Equity Securities and Use of Proceeds
None.
20
Item 6.Selected Consolidated Financial Data
The following selected consolidated financial data is not necessarily indicative of the results of future operations and should be read in conjunction with “Management’s Discussion and Analysis of Financial Condition and Results of Operations” and our consolidated financial statements and related notes included elsewhere in this Annual Report on Form 10-K.
Fiscal Year Ended September 30, | |||||||||||||||||||
(In millions, except per share amounts) | 2018 | 2017 | 2016 | 2015 | 2014 | ||||||||||||||
Operations: | |||||||||||||||||||
Total revenues | $ | 2,051.7 | $ | 1,939.4 | $ | 1,948.9 | $ | 1,931.1 | $ | 1,923.5 | |||||||||
Gross profit | $ | 1,178.1 | $ | 1,085.6 | $ | 1,119.4 | $ | 1,102.6 | $ | 1,080.9 | |||||||||
(Loss) income from operations | $ | (86.9 | ) | $ | 52.0 | $ | 138.5 | $ | 54.9 | $ | (21.4 | ) | |||||||
(Benefit) provision for income taxes | $ | (56.8 | ) | $ | 32.0 | $ | 14.2 | $ | 34.5 | $ | (4.7 | ) | |||||||
Net loss | $ | (159.9 | ) | $ | (151.0 | ) | $ | (12.5 | ) | $ | (115.0 | ) | $ | (150.3 | ) | ||||
Net Loss Per Share Data: | |||||||||||||||||||
Basic | $ | (0.55 | ) | $ | (0.52 | ) | $ | (0.04 | ) | $ | (0.36 | ) | $ | (0.47 | ) | ||||
Diluted | $ | (0.55 | ) | $ | (0.52 | ) | $ | (0.04 | ) | $ | (0.36 | ) | $ | (0.47 | ) | ||||
Weighted average common shares outstanding: | |||||||||||||||||||
Basic | 291.3 | 289.3 | 292.1 | 317.0 | 316.9 | ||||||||||||||
Diluted | 291.3 | 289.3 | 292.1 | 317.0 | 316.9 | ||||||||||||||
Financial Position: | |||||||||||||||||||
Cash and cash equivalents and marketable securities | $ | 473.5 | $ | 874.1 | $ | 608.1 | $ | 568.8 | $ | 588.2 | |||||||||
Total assets | $ | 5,302.4 | $ | 5,931.9 | $ | 5,661.5 | $ | 5,511.9 | $ | 5,738.2 | |||||||||
Long-term debt | $ | 2,185.4 | $ | 2,617.4 | $ | 2,433.2 | $ | 2,103.1 | $ | 2,108.4 | |||||||||
Total deferred revenue | $ | 873.0 | $ | 790.0 | $ | 736.2 | $ | 668.2 | $ | 548.1 | |||||||||
Total stockholders’ equity | $ | 1,717.5 | $ | 1,931.4 | $ | 1,931.3 | $ | 2,265.3 | $ | 2,582.0 | |||||||||
Selected Data and Ratios: | |||||||||||||||||||
Working capital | $ | 164.5 | $ | 216.4 | $ | 347.7 | $ | 360.2 | $ | 466.5 | |||||||||
Depreciation of property and equipment | $ | 62.4 | $ | 55.7 | $ | 60.6 | $ | 62.4 | $ | 51.7 | |||||||||
Amortization of intangible assets | $ | 148.0 | $ | 178.7 | $ | 170.9 | $ | 168.3 | $ | 170.1 | |||||||||
Gross margin percentage | 57.4 | % | 56.0 | % | 57.4 | % | 57.1 | % | 56.2 | % | |||||||||
21
Item 7.Management's Discussion and Analysis of Financial Condition and Results of Operations
The following Management’s Discussion and Analysis is intended to help the reader understand the results of operations and financial condition of our business. The Management’s Discussion and Analysis is provided as a supplement to, and should be read in conjunction with, our consolidated financial statements and the accompanying notes to the consolidated financial statements.
Overview
Business Overview
We are a pioneer and leader in conversational and cognitive artificial intelligence ("AI") innovations that bring intelligence to everyday work and life. Our solutions and technologies can understand, analyze and respond to human language to increase productivity and amplify human intelligence. Our solutions are used by businesses in the healthcare, automotive, financial services, telecommunication and travel industries, among others. We see several trends in our markets, including (i) the growing adoption of cloud-based, connected services and highly interactive mobile applications, (ii) deeper integration of virtual assistant capabilities and services, and (iii) the continued expansion of our core technology portfolio including ASR, natural NLU, semantic processing, domain-specific reasoning, dialog management capabilities, AI, and voice biometric speaker authentication. We report our business in five segments, Healthcare, Enterprise, Automotive, Imaging and Other.
Trends in Our Businesses
• | Healthcare. Customers in our healthcare segment are broadly implementing EHR systems and are working to improve clinical documentation, improve quality of care, minimize physician burnout integrate quality measures and aid reimbursement. These trends are driving a shift towards more integrated solutions that combine both Dragon Medical and transcription services, and increasingly use only Dragon Medical. Recently, higher demand for more integrated solutions have offset declines in legacy, hosted transcription services. Additionally, we have been able to capitalize on healthcare providers’ shift towards hosted, or cloud-based solutions, and away from perpetual licenses, by adding new innovations to our Dragon Medical cloud solutions including new clinical language understanding and AI capabilities designed to increase productivity and improve clinical documentation at the point of care and within existing electronic medical work flow. |
• | Enterprise. Consumer demand for 24/7, multi-channel access to customer service from the businesses they interact with is driving demand for our AI-powered omni-channel engagement solutions. We continue to enhance our technology capabilities with intelligent self-service and AI for customer service, and to extend the market for our on-demand omni-channel enterprise solutions into international markets, expand our sales and solutions for biometrics, and expand our core products and services portfolio. |
• | Automotive. Demand for our embedded and cloud-based automotive solutions is being driven by the growth in personalized, automotive virtual assistants and connected services for cars and by auto manufacturers' desire to create a branded and personalized experience, capable of intelligently integrating users' smart phone and home device preferences and technologies. |
On November 19, 2018, we announced our intent to spin off our Automotive business into an independent publicly-traded company through a pro rata distribution to our common stock holders. Completion of the proposed spin-off is subject to certain conditions, including final approval by our Board of Directors. We are targeting to compete the separation of the business by the end of fiscal year 2019.
• | Imaging. The imaging market is evolving to include more networked solutions to MFP devices, as well as more mobile access to those networked solutions, and away from packaged software. We are investing to merge the scan and print technology platforms to improve mobile access to our solutions and technologies, expand our distribution channels and embedded relationships, and expand our language coverage for OCR in order to drive a more comprehensive and compelling offering to our partners. |
On November 11, 2018, we entered into a definitive stock purchase agreement, pursuant to which we agreed to sell our Imaging business and associated assets for a total cash consideration of approximately $400 million. The transaction, which is subject to regulatory review and other customary closing conditions, is expected to close by the end of the second quarter of fiscal year 2019.
22
• | Other. Our Other segment includes our Subscriber Revenue Services ("SRS") and Devices businesses. Our SRS business provides value-added services to mobile operators in India and Brazil (“Mobile Operator Services”) and voicemail transcription services to mobile operators in the rest of the world (“Voicemail-to-Text”). Our Devices business provides speech recognition solutions and predictive text technologies for handset devices. Our Mobile Operator Services has experienced dramatic market disruptions during fiscal year 2018. Our Devices revenue has been declining due to the ongoing consolidation of our handset manufacturer customer base and continued erosion of our penetration of the remaining market. During the fourth quarter of fiscal 2018, in connection with our comprehensive portfolio and business review efforts, we commenced a wind-down of our Devices and Mobile Operator Services businesses. |
Cybersecurity & Data Privacy Matters
On June 27, 2017, Nuance was a victim of the global NotPetya malware incident (the “2017 Malware Incident”), which primarily impacted our medical transcription services. For fiscal year 2017, we estimated that our Healthcare segment lost approximately $65.0 million in revenues, primarily due to the service disruption and the reserves we established for customer refund credits related to the incident. Additionally, we incurred incremental costs of approximately $24.0 million for fiscal year 2017 as a result of our remediation and restoration efforts, as well as incremental amortization expenses.
Also, in December 2017, an unauthorized third party illegally accessed certain reports hosted on a Nuance transcription platform. This incident was limited in scope to records of approximately 45,000 individuals and was isolated to a single transcription platform that was promptly shutdown. Customers using that platform were notified of the incident and were migrated to our eScription transcription platforms. We also notified law enforcement authorities and have cooperated in their investigation into the matter. The law enforcement investigation resulted in the identification of the third party, and the accessed reports have been recovered. This incident did not have a material effect on our financial results for fiscal year 2018 and is not expected to have a material effect on our financial results for future periods. See “Risk Factors - Cybersecurity and data privacy incidents or breaches may damage client relations and inhibit our growth.”
Key Metrics
In evaluating the financial condition and operating performance of our business, management focuses on revenue, net income, gross margins, operating margins, cash flow from operations, and changes in deferred revenue. A summary of these key financial metrics is as follows:
For the fiscal year 2018, as compared to the fiscal year 2017:
• | Total revenue increased by $112.3 million from $1,939.4 million to $2,051.7 million; |
• | Net loss increased by $8.9 million to $159.9 million; |
• | Gross margins increased by 1.4 percentage points to 57.4%; |
• | Operating margins decreased by 6.9 percentage points to (4.2)%; |
• | Cash provided by operating activities for the fiscal year 2018 was $444.4 million, an increase of $65.6 million from fiscal year 2017. |
As of September 30, 2018, as compared to September 30, 2017:
• | Total deferred revenue increased by 10.5% to $873.0 million, primarily driven by the continued growth of our Automotive connected solutions and Healthcare bundled offerings. |
A summary of other key operating metrics for fiscal year 2018, as compared to the fiscal year 2017, is as follows:
• | Net new bookings increased by 4.9% from the prior fiscal year to $1.7 billion. The net new bookings growth benefited from strong bookings performance primarily in our Automotive and Enterprise segments. |
Bookings represent the estimated gross revenue value of transactions at the time of contract execution, except for maintenance and support offerings. For fixed price contracts, the bookings value represents the gross total contract value. For contracts where revenue is based on transaction volume, the bookings value represents the contract price multiplied by the estimated future transaction volume during the contract term, whether or not such transaction volumes are guaranteed under a minimum commitment clause. Actual results could be different than our initial estimate. The maintenance and support bookings value
23
represents the amount the customer is invoiced in the period. Because of the inherent estimates required to determine bookings and the fact that the actual revenue may differ from our initial bookings estimates, we consider bookings one indicator of potential future revenue and not as an arithmetic measure of backlog.
Net new bookings represent the estimated revenue value at the time of contract execution from new contractual arrangements or the estimated revenue value incremental to the portion of value that will be renewed under pre-existing arrangements.
• | Recurring revenue represented 71.4% for fiscal year 2018 and 72.5% for fiscal year 2017. Recurring revenue represents the sum of recurring product and licensing, hosting, and maintenance and support revenues as well as the portion of professional services revenue delivered under ongoing contracts. Recurring product and licensing revenue comprises term-based and ratable licenses as well as revenues from royalty arrangements. |
• | Annualized line run-rate in our on-demand healthcare solutions decreased by 4% from a year ago to approximately 2.8 billion lines per year. The annualized line run-rate for the fourth quarter of fiscal year 2017 reflected the negative impact of the 2017 Malware Incident, whereas the annualized run-rate for the fourth quarter of fiscal year 2018 reflected the continued erosion of our medical transcription services. The annualized line run-rate is determined using billed equivalent line counts in a given quarter, multiplied by four. |
• | Estimated three-year value of total on-demand contracts increased 5.0% from the prior fiscal year to approximately $2.4 billion, primarily by growth in our Dragon Medical cloud-based solutions and automotive connected car businesses, offset by decreases in SRS and Devices as well as the continued erosion of our medical transcription services. We determine this value as of the end of the period reported, by using our estimate of three years of anticipated future revenue streams under signed on-demand contracts then in place, whether or not they are guaranteed through a minimum commitment clause. Our estimate is based on assumptions used in evaluating the contracts and determining sales compensation, adjusted for changes in estimated launch dates, actual volumes achieved, and other factors deemed relevant. For contracts with an expiration date beyond three years, we include only the value expected within three years. For other contracts, we assume renewal consistent with historic renewal rates unless there is a known cancellation. Contracts are generally priced by volume of usage and typically have no or low minimum commitments. Actual revenue could vary from our estimates due to factors such as cancellations, non-renewals or volume fluctuations. |
RESULTS OF OPERATIONS
Total Revenues
The following tables show total revenues by product type and revenue by geographic location, based on the location of our customers, in dollars and percentage change (dollars in millions):
Fiscal Year 2018 | Fiscal Year 2017 | Fiscal Year 2016 | % Change 2018 vs. 2017 | % Change 2017 vs. 2016 | |||||||||||||
Professional services and hosting | $ | 1,049.4 | $ | 976.9 | $ | 955.3 | 7.4 | % | 2.3 | % | |||||||
Product and licensing | 684.2 | 635.4 | 669.2 | 7.7 | % | (5.1 | )% | ||||||||||
Maintenance and support | 318.0 | 327.1 | 324.3 | (2.8 | )% | 0.9 | % | ||||||||||
Total Revenues | $ | 2,051.7 | $ | 1,939.4 | $ | 1,948.9 | 5.8 | % | (0.5 | )% | |||||||
United States | $ | 1,470.7 | $ | 1,352.0 | $ | 1,385.3 | 8.8 | % | (2.4 | )% | |||||||
International | 581.0 | 587.3 | 563.6 | (1.1 | )% | 4.2 | % | ||||||||||
Total Revenues | $ | 2,051.7 | $ | 1,939.4 | $ | 1,948.9 | 5.8 | % | (0.5 | )% | |||||||
Fiscal Year 2018 Compared with Fiscal Year 2017
The geographic split for fiscal year 2018 was 72% of total revenue in the United States and 28% internationally, as compared to 70% of total revenue in the United States and 30% internationally for the prior fiscal year.
Fiscal Year 2017 Compared with Fiscal Year 2016
The geographic split for fiscal years 2017 was 70% of total revenue in the United States and 30% internationally, as compared to 71% of total revenue in the United States and 29% internationally for the prior fiscal year.
24
Professional Services and Hosting Revenue
Professional services revenue primarily consists of consulting, implementation and training services for customers. Hosting revenue primarily relates to delivering on-demand hosted services, such as medical transcription, automated customer care applications, mobile operator services, and mobile infotainment and search and transcription, over a specified term. The following table shows professional services and hosting revenue, in dollars and as a percentage of total revenues (dollars in millions):
Fiscal Year 2018 | Fiscal Year 2017 | Fiscal Year 2016 | % Change 2018 vs. 2017 | % Change 2017 vs. 2016 | |||||||||||||
Professional services revenue | $ | 278.3 | $ | 243.1 | $ | 225.2 | 14.5 | % | 7.9 | % | |||||||
Hosting revenue | 771.1 | 733.8 | 730.2 | 5.1 | % | 0.5 | % | ||||||||||
Professional services and hosting revenue | $ | 1,049.4 | $ | 976.9 | $ | 955.3 | 7.4 | % | 2.3 | % | |||||||
As a percentage of total revenues | 51.2 | % | 50.4 | % | 49.0 | % | |||||||||||
Fiscal Year 2018 Compared with Fiscal Year 2017
Professional services revenue increased by $35.3 million, or 14.5%, primarily driven by a $49.4 million increase in Healthcare, offset in part by a $6.5 million decrease in Imaging and a $4.2 million decrease in Automotive. Healthcare professional services revenue increased primarily due to higher revenue from EHR implementation and optimization services. Imaging professional services decreased primarily due to certain nonrecurring implementation services that occurred in fiscal year 2017. Automotive professional services revenue decreased primarily due to a shift towards connected services.
Hosting revenue increased by $37.3 million, or 5.1%, primarily driven by a $41.9 million increase in Healthcare, a $14.5 million increase in Automotive, and a $6.7 million increase in Enterprise, offset in part by a $25.8 million decrease in Other. Healthcare hosting revenue increased as the segment recovered from the 2017 Malware Incident throughout the year; also contributing to the increase was the continued market penetration and growth of our Dragon Medical cloud-based solutions, offset by in part by the continued erosion of our transcription services. Automotive hosting revenue increased primarily due to the continued growth in our ASR and infotainment platform services. Enterprise hosting revenue increased primarily due to the growth in our omni-channel hosting solutions. Other segment hosting revenue decreased primarily driven by the declines in both of our SRS and Devices businesses.
As a percentage of total revenue, professional services and hosting revenue increased from 50.4% for fiscal year 2017 to 51.2% for fiscal year 2018.
Fiscal Year 2017 Compared with Fiscal Year 2016
Professional services revenue increased by $17.9 million, or 7.9%, primarily due to acquisitions in our Healthcare segment and the continued growth in voice biometrics offerings in our Enterprise segment.
Hosting revenue increased by $3.7 million, or 0.5%, primarily driven by a $48.3 million increase in Enterprise and a $13.2 million increase in Automotive segments, offset in part by a $57.7 million decrease in Healthcare. Enterprise hosting revenue increased primarily due to the incremental revenue from acquisitions, growth in our omni-channel cloud offerings, and the continued strength in our on-premise and service portfolios. Automotive hosting revenue increased primarily due to the continued growth in our ASR and infotainment platform services. Healthcare hosting revenue declined primarily due to the 2017 Malware Incident and the continued erosion of our transcription services, offset in part by the continued market penetration and growth of our Dragon Medical cloud-based solutions.
As a percentage of total revenue, professional services and hosting revenue increased from 49.0% for fiscal year 2016 to 50.4%
for fiscal year 2017.
25
Product and Licensing Revenue
Product and licensing revenue primarily consists of sales and licenses of our technology. The following table shows product and licensing revenue, in dollars and as a percentage of total revenues (dollars in millions):
Fiscal Year 2018 | Fiscal Year 2017 | Fiscal Year 2016 | % Change 2018 vs. 2017 | % Change 2017 vs. 2016 | |||||||||||||
Product and licensing revenue | $ | 684.2 | $ | 635.4 | $ | 669.2 | 7.7 | % | (5.1 | )% | |||||||
As a percentage of total revenues | 33.4 | % | 32.8 | % | 34.3 | % | |||||||||||
Fiscal Year 2018 Compared with Fiscal Year 2017
Product and licensing revenue increased by $48.8 million, or 7.7%, primarily driven by a $16.3 million increase in Automotive, a $14.5 million increase in Healthcare, and a $12.8 million increase in Enterprise. Automotive product and licensing revenue increased primarily due to higher royalties from existing and new customers. Healthcare product and licensing revenue increased primarily due to higher revenue from diagnostics solutions due to recent acquisitions. Enterprise product and licensing revenue increased primarily due to higher contact center license revenue.
As a percentage of total revenue, product and licensing revenue increased from 32.8% for fiscal year 2017 to 33.4% for fiscal year 2018.
Fiscal Year 2017 Compared with Fiscal Year 2016
Product and licensing revenue decreased by $33.8 million, or 5.1%, primarily driven by a $25.6 million decrease in Imaging, a $16.7 million decrease in Healthcare, and a $16.7 million decrease in Other, offset in part by a $23.0 million increase in Automotive. Imaging product and licensing revenue decreased primarily due to lower sales of our multi-functional printer ("MFP") solutions. Healthcare product and licensing revenue decreased primarily due to the continuing customer transition from product licenses to cloud-based solutions. Other product and licensing revenue decreased primarily driven by the ongoing consolidation of our handset manufacturer customer base and continued erosion of our penetration of the remaining market. Automotive product and licensing revenue increased primarily due to higher royalties from existing and new customers.
As a percentage of total revenue, product and licensing revenue decreased from 34.3% for fiscal year 2016 to 32.8% for fiscal year 2017.
Maintenance and Support Revenue
Maintenance and support revenue primarily consists of technical support and maintenance services. The following table shows maintenance and support revenue, in dollars and as a percentage of total revenues (dollars in millions):
Fiscal Year 2018 | Fiscal Year 2017 | Fiscal Year 2016 | % Change 2018 vs. 2017 | % Change 2017 vs. 2016 | |||||||||||||
Maintenance and support revenue | $ | 318.0 | $ | 327.1 | $ | 324.3 | (2.8 | )% | 0.9 | % | |||||||
As a percentage of total revenues | 15.5 | % | 16.9 | % | 16.6 | % | |||||||||||
Fiscal Year 2018 Compared with Fiscal Year 2017
Maintenance and support revenue decreased by $9.1 million, or 2.8%, primarily due to a $18.1 million decrease in Healthcare, offset in part by a $6.0 million increase in Imaging and a $4.6 million increase in Enterprise. The decrease in Healthcare was primarily driven by the continuing customer transition from product licenses to cloud-based solutions. The increase in Imaging was primarily driven by the contract renewal from existing customers. The increase in Enterprise was primarily driven by higher volume of contact center license transactions with maintenance and support.
Fiscal Year 2017 Compared with Fiscal Year 2016
Maintenance and support revenue increased by $2.7 million, or 0.9%, primarily due to a $6.7 million increase in our Enterprise segment due to maintenance renewals, offset in part by a $4.1 million decrease in Healthcare primarily due to the continuing customer transition from product licenses to cloud-based solutions.
26
COSTS AND EXPENSES
Cost of Professional Services and Hosting Revenue
Cost of professional services and hosting revenue primarily consists of compensation for services personnel, outside consultants and overhead, as well as the hardware, infrastructure and communications fees that support our hosting solutions. The following table shows the cost of professional services and hosting revenue, in dollars and as a percentage of professional services and hosting revenue (dollars in millions):
Fiscal Year 2018 | Fiscal Year 2017 | Fiscal Year 2016 | % Change 2018 vs. 2017 | % Change 2017 vs. 2016 | |||||||||||||
Cost of professional services and hosting revenue | $ | 681.5 | $ | 660.8 | $ | 626.2 | 3.1 | % | 5.5 | % | |||||||
As a percentage of professional services and hosting revenue | 64.9 | % | 67.6 | % | 65.5 | % | |||||||||||
Fiscal Year 2018 Compared with Fiscal Year 2017
The increase in cost of professional services and hosting revenue was primarily due to higher professional services costs in our Healthcare segment related to EHR implementation and optimization services and higher hosting costs related to the growth of our automotive connected car services, offset in part by lower costs of medical transcription services. Gross margins increased by 2.7 percentage points as our Healthcare segment recovered from the 2017 Malware Incident throughout the year. Also contributing to the margin improvement was a favorable shift in revenue mix towards higher margin Dragon Medical cloud-based offerings, offset in part by margin compression in our medical transcription services and the increase in EHR implementation and optimization services which carried lower margins.
Fiscal Year 2017 Compared with Fiscal Year 2016
The increase in cost of professional services and hosting revenue was primarily driven by higher employee and infrastructure-related costs due to higher revenues in our Enterprise segment. Gross margins decreased by 2.1 percentage points primarily due to the negative impact of the 2017 Malware Incident, the continued erosion of our medical transcription services in Healthcare, and lower margins in Enterprise due to recent acquisitions. Partially offsetting the margin declines was the favorable shift in revenue mix to higher margin professional services in Imagining.
Cost of Product and Licensing Revenue
Cost of product and licensing revenue primarily consists of material and fulfillment costs, manufacturing and operations costs and third-party royalty expenses. The following table shows the cost of product and licensing revenue, in dollars and as a percentage of product and licensing revenue (dollars in millions):
Fiscal Year 2018 | Fiscal Year 2017 | Fiscal Year 2016 | % Change 2018 vs. 2017 | % Change 2017 vs. 2016 | |||||||||||||
Cost of product and licensing revenue | $ | 77.1 | $ | 74.0 | $ | 86.4 | 4.2 | % | (14.4 | )% | |||||||
As a percentage of product and licensing revenue | 11.3 | % | 11.6 | % | 12.9 | % | |||||||||||
Fiscal Year 2018 Compared with Fiscal Year 2017
The increase in cost of product and licensing revenue was due to higher costs related to our clinical documentation and diagnostic solutions. Gross margins increased by 0.3 percentage points, or essentially flat year-over-year.
Fiscal Year 2017 Compared to Fiscal Year 2016
The decrease in cost of product and licensing revenue was driven by lower costs related to Dragon medical and Dragon consumer perpetual licenses, as well as our MFP solutions. Gross margins increased by 1.3 percentage points, due to a favorable shift in revenue mix towards higher margin products Healthcare and Imaging.
27
Cost of Maintenance and Support Revenue
Cost of maintenance and support revenue primarily consists of compensation for product support personnel and overhead. The following table shows cost of maintenance and support revenue, in dollars and as a percentage of maintenance and support revenue (dollars in millions):
Fiscal Year 2018 | Fiscal Year 2017 | Fiscal Year 2016 | % Change 2018 vs. 2017 | % Change 2017 vs. 2016 | |||||||||||||
Cost of maintenance and support revenue | $ | 58.1 | $ | 54.1 | $ | 54.1 | 7.4 | % | — | % | |||||||
As a percentage of maintenance and support revenue | 18.3 | % | 16.5 | % | 16.7 | % | |||||||||||
Fiscal Year 2018 Compared with Fiscal Year 2017
Cost of maintenance and support revenue increased by $4.0 million, or 7.4%, primarily driven by higher compensation costs in Imaging. Gross margins decreased by 1.8 percentage points primarily due to lower margin on Dragon Medical software maintenance and support services in Healthcare.
Fiscal Year 2017 Compared with Fiscal Year 2016
Cost and the gross margin of maintenance and support revenue remained essentially flat during fiscal year 2017.
Research and Development Expenses
Research and development ("R&D") expenses primarily consist of salaries, benefits, and overhead relating to engineering staff as well as third party engineering costs. The following table shows research and development expense, in dollars and as a percentage of total revenues (dollars in millions):
Fiscal Year 2018 | Fiscal Year 2017 | Fiscal Year 2016 | % Change 2018 vs. 2017 | % Change 2017 vs. 2016 | |||||||||||||
Research and development expense | $ | 305.3 | $ | 266.1 | $ | 271.1 | 14.7 | % | (1.8 | )% | |||||||
As a percentage of total revenues | 14.9 | % | 13.7 | % | 13.9 | % | |||||||||||
Fiscal Year 2018 Compared with Fiscal Year 2017
R&D expense increased by $39.2 million, primarily due to higher compensation expenses as we continue to invest in product innovation and new technologies to support our long-term growth.
Fiscal Year 2017 Compared with Fiscal Year 2016
R&D expense decreased by $5.0 million, primarily due to our continued cost-savings initiatives to reduce headcount and move R&D activities to lower-cost locations, offset in part by higher compensation expenses in our Enterprise segment due to acquisitions.
Sales and Marketing Expenses
Sales and marketing expenses include salaries and benefits, commissions, advertising, direct mail, public relations, tradeshow costs and other costs of marketing programs, travel expenses associated with our sales organization and overhead. The following table shows sales and marketing expense, in dollars and as a percentage of total revenues (dollars in millions):
Fiscal Year 2018 | Fiscal Year 2017 | Fiscal Year 2016 | % Change 2018 vs. 2017 | % Change 2017 vs. 2016 | |||||||||||||
Sales and marketing expense | $ | 388.3 | $ | 398.1 | $ | 390.9 | (2.5 | )% | 1.8 | % | |||||||
As a percentage of total revenues | 18.9 | % | 20.5 | % | 20.1 | % | |||||||||||
Fiscal Year 2018 Compared with Fiscal Year 2017
The decrease in sales and marketing expense was primarily driven by lower commission expenses due to recent changes in our commission plans.
28
Fiscal Year 2017 Compared with Fiscal Year 2016
The increase in sales and marketing expense was primarily due to higher compensation and commission expenses on increased
headcount in our Enterprise segment, offset in part by lower marketing spend in our Healthcare segment.
General and Administrative Expenses
General and administrative expenses primarily consist of personnel costs for administration, finance, human resources, general management, fees for external professional advisers including accountants and attorneys, and provisions for doubtful accounts. The following table shows general and administrative expense, in dollars and as a percentage of total revenues (dollars in millions):
Fiscal Year 2018 | Fiscal Year 2017 | Fiscal Year 2016 | % Change 2018 vs. 2017 | % Change 2017 vs. 2016 | |||||||||||||
General and administrative expense | $ | 229.8 | $ | 166.7 | $ | 168.5 | 37.9 | % | (1.1 | )% | |||||||
As a percentage of total revenues | 11.2 | % | 8.6 | % | 8.6 | % | |||||||||||
Fiscal Year 2018 Compared with Fiscal Year 2017
General and administrative expense increased by $63.1 million primarily due to professional services fees related to evaluating strategic alternatives for certain businesses, establishing the Automotive business as a separate operating segment, and legal expenses related to enforcing our intellectual property rights.
Fiscal Year 2017 Compared with Fiscal Year 2016
General and administrative expense decreased by $1.8 million as the effect of higher administrative headcount was more than offset by lower stock-based compensation and lower professional fees related to identifying and evaluating strategic initiatives.
Amortization of Intangible Assets
Amortization of acquired patents and core technology are included within cost of revenues whereas the amortization of other intangible assets, such as acquired customer relationships, trade names and trademarks, are included within operating expenses. Customer relationships are amortized on an accelerated basis based upon the pattern in which the economic benefits of the customer relationships are being realized. Other identifiable intangible assets are amortized on a straight-line basis over their estimated useful lives. Amortization expense was recorded as follows (dollars in millions):
Fiscal Year 2018 | Fiscal Year 2017 | Fiscal Year 2016 | % Change 2018 vs. 2017 | % Change 2017 vs. 2016 | |||||||||||||
Cost of revenues | $ | 56.9 | $ | 64.9 | $ | 62.9 | (12.3 | )% | 3.2 | % | |||||||
Operating expense | 91.1 | 113.9 | 108.0 | (20.0 | )% | 5.5 | % | ||||||||||
Total amortization expense | $ | 148.0 | $ | 178.7 | $ | 170.9 | (17.2 | )% | 4.6 | % | |||||||
As a percentage of total revenues | 7.2 | % | 9.2 | % | 8.8 | % | |||||||||||
Fiscal Year 2018 Compared with Fiscal Year 2017
Amortization of intangible assets expense for fiscal year 2018 decreased by $30.8 million from $178.7 million for fiscal year 2017, as certain intangible assets became fully amortized in fiscal years 2017 and 2018.
Fiscal Year 2017 Compared with Fiscal Year 2016
Amortization of intangible assets expense for fiscal year 2017 increased by $7.9 million from $170.9 million for fiscal year 2016. The increase was primarily due to the amortization of customer relationship assets acquired in acquisitions.
29
Acquisition-Related Costs, Net
Acquisition-related costs include costs related to business and other acquisitions, including potential acquisitions. These costs consist of (i) transition and integration costs, including retention payments, transitional employee costs, earn-out payments, and other costs related to integration activities; (ii) professional service fees, including financial advisory, legal, accounting, and other outside services incurred in connection with acquisition activities, and disputes and regulatory matters related to acquired entities; and (iii) fair value adjustments to acquisition-related contingencies. A summary of the acquisition-related costs is as follows (dollars in millions):
Fiscal Year 2018 | Fiscal Year 2017 | Fiscal Year 2016 | % Change 2018 vs. 2017 | % Change 2017 vs. 2016 | |||||||||||||
Transition and integration costs | $ | 16.1 | $ | 15.2 | $ | 6.1 | 5.9 | % | 149.2 | % | |||||||
Professional service fees | 3.5 | 12.6 | 10.9 | (72.2 | )% | 15.6 | % | ||||||||||
Acquisition-related adjustments | (3.4 | ) | (0.1 | ) | 0.2 | 3,300.0 | % | (150.0 | )% | ||||||||
Total Acquisition-related costs, net | $ | 16.1 | $ | 27.7 | $ | 17.2 | (41.9 | )% | 61.0 | % | |||||||
As a percentage of total revenue | 0.8 | % | 1.4 | % | 0.9 | % | |||||||||||
Fiscal Year 2018 Compared with Fiscal Year 2017
Acquisition-related costs, net for fiscal year 2018 decreased by $11.6 million, primarily due to reduced acquisition activities during fiscal year 2018.
Fiscal Year 2017 Compared with Fiscal Year 2016
Acquisition-related costs, net for fiscal year 2017 increased by $10.5 million primarily due to higher contingent retention payments related to acquisitions, which is included within transition and integration costs.
30
Restructuring and Other Charges, Net
While restructuring and other charges, net are excluded from our calculation of segment profit, the table below presents the restructuring and other charges, net associated with each segment (dollars in thousands):
Personnel | Facilities | Total Restructuring Expenses | Other Charges | Total | |||||||||||||||
Fiscal Year 2018 | |||||||||||||||||||
Healthcare | $ | 11,563 | $ | 25 | $ | 11,588 | $ | — | $ | 11,588 | |||||||||
Enterprise | 4,217 | 2,243 | 6,460 | — | 6,460 | ||||||||||||||
Automotive | 4,160 | 20 | 4,180 | — | 4,180 | ||||||||||||||
Imaging | 5,304 | 1,168 | 6,472 | — | 6,472 | ||||||||||||||
Other | 1,473 | 647 | 2,120 | 7,103 | 9,223 | ||||||||||||||
Corporate | 10,107 | 953 | 11,060 | 14,515 | 25,575 | ||||||||||||||
Total fiscal year 2018 | $ | 36,824 | $ | 5,056 | $ | 41,880 | $ | 21,618 | $ | 63,498 | |||||||||
Fiscal Year 2017 | |||||||||||||||||||
Healthcare | $ | 4,283 | $ | 870 | $ | 5,153 | $ | 8,758 | $ | 13,911 | |||||||||
Enterprise | 2,141 | 3,480 | 5,621 | — | 5,621 | ||||||||||||||
Automotive | 1,838 | — | 1,838 | — | 1,838 | ||||||||||||||
Imaging | 744 | 387 | 1,131 | — | 1,131 | ||||||||||||||
Other | 2,954 | (15 | ) | 2,939 | 10,773 | 13,712 | |||||||||||||
Corporate | 1,337 | 2,013 | 3,350 | 21,491 | 24,841 | ||||||||||||||
Total fiscal year 2017 | $ | 13,297 | $ | 6,735 | $ | 20,032 | $ | 41,022 | $ | 61,054 | |||||||||
Fiscal Year 2016 | |||||||||||||||||||
Healthcare | $ | 3,531 | $ | 1,398 | $ | 4,929 | $ | — | $ | 4,929 | |||||||||
Enterprise | 1,214 | 2,782 | 3,996 | — | 3,996 | ||||||||||||||
Automotive | 1,967 | — | 1,967 | — | 1,967 | ||||||||||||||
Imaging | 284 | 478 | 762 | — | 762 | ||||||||||||||
Other | 3,870 | 1,557 | 5,427 | (486 | ) | 4,941 | |||||||||||||
Corporate | 2,267 | 5,391 | 7,658 | 971 | 8,629 | ||||||||||||||
Total fiscal year 2016 | $ | 13,133 | $ | 11,606 | $ | 24,739 | $ | 485 | $ | 25,224 | |||||||||
Fiscal Year 2018
For fiscal year 2018, we recorded restructuring charges of $41.9 million, which included $36.8 million related to the termination of approximately 1,495 employees and $5.1 million charge related to certain excess facilities, including adjustment to sublease assumptions associated with these facilities. These actions were part of our strategic initiatives focused on investment rationalization, process optimization and cost reduction. We expect the remaining outstanding severance of $10.6 million to be substantially paid by the end of the first quarter of fiscal year 2019, and the remaining of $7.6 million for the excess facilities to be made through fiscal year 2027, in accordance with the terms of the applicable leases.
Additionally, during fiscal year 2018, we recorded $5.7 million for costs related to the transition agreement of our former CEO, $4.8 million professional services fees related to assessment and establishment of our corporate transformational efforts, $4.0 million related to our remediation and restoration effort after the 2017 Malware Incident, and fixed asset impairment charges of $7.1 million for SRS and Devices, as more fully described in Note 4. The cash payments associated with the CEO transition agreement are expected to be made through fiscal year 2020.
Fiscal Year 2017
For fiscal year 2017, we recorded restructuring charges of $20.0 million, which included $13.3 million related to the termination of approximately 807 terminated employees and $6.7 million charge related to certain excess facilities, including adjustment to sublease assumptions associated with these facilities. These actions were part of our initiatives to reduce costs and optimize processes.
31
Additionally, during fiscal year 2017, we recorded $8.1 million for costs related to the transition agreement of our former CEO, $18.1 million of professional services fees and $4.0 million of fixed asset and inventory write-down as a result of the Malware Incident, and an impairment charge of $10.8 million related to an internally developed software.
Fiscal Year 2016
For fiscal year 2016, we recorded restructuring charges of $24.7 million, which included $13.1 million related to the termination of approximately 452 employees as part of our initiatives to reduce costs and optimize processes, and $11.6 million charge related to certain excess facility space, including adjustment to sublease assumptions associated with these facilities.
Additionally, during fiscal year 2016, we recorded certain other charges that totaled $0.5 million for litigation contingency reserves.
Impairment of Goodwill and Other Intangible Assets
As more fully described in Note 4 of the accompanying consolidated financial statements, we recorded $170.9 million impairment charges of goodwill and other intangible assets for Devices and SRS for fiscal year 2018.
Other Expenses, net
Other expenses, net consists primarily of interest income, interest expense, foreign exchange gains (losses), and net gain (loss) from other non-operating activities. A summary of Other expenses, net is as follows (dollars in millions):
Fiscal Year 2018 | Fiscal Year 2017 | Fiscal Year 2016 | % Change 2018 vs. 2017 | % Change 2017 vs. 2016 | |||||||||||||
Interest income | $ | 9.3 | $ | 6.9 | $ | 4.4 | 34.7 | % | 56.0 | % | |||||||
Interest expense | (137.3 | ) | (156.9 | ) | (132.7 | ) | (12.5 | )% | 18.2 | % | |||||||
Other expense, net | (1.9 | ) | (21.0 | ) | (8.5 | ) | (91.1 | )% | 147.6 | % | |||||||
Total other expenses, net | $ | (129.8 | ) | $ | (171.0 | ) | $ | (136.8 | ) | ||||||||
Fiscal Year 2018 Compared with Fiscal Year 2017
Interest expense decreased by $19.6 million primarily due to the repurchase of $331.2 million outstanding 2.75% convertible debentures in November 2017. Other expense, net decreased by $19.2 million primarily due to an $18.6 million loss on extinguishment of debt resulting from the repurchase of our 2020 Senior Notes in fiscal year 2017.
Fiscal Year 2017 Compared with Fiscal Year 2016
Interest expense increased by $24.2 million primarily driven by the issuance of the 2026 Senior Notes and the 2025 Convertible Debenture, offset in part by the repurchase of $600 million principal of our 2020 Senior Notes in fiscal year 2017. Other expense, net increased by $12.5 million primarily due to an $18.6 million loss on extinguishment of debt resulting from the repurchase of our 2020 Senior Notes discussed above, offset in part by extinguishment losses of $4.9 million recorded in fiscal year 2016.
Provision for Income Taxes
The following table shows the provision for income taxes and the effective income tax rate (dollars in millions):
Fiscal Year 2018 | Fiscal Year 2017 | Fiscal Year 2016 | % Change 2018 vs. 2017 | % Change 2017 vs. 2016 | |||||||||||||
(Benefit) Provision for income taxes | $ | (56.8 | ) | $ | 32.0 | $ | 14.2 | (277.6 | )% | 125.3 | % | ||||||
Effective income tax rate | 26.2 | % | (26.9 | )% | 816.4 | % | |||||||||||
Fiscal Year 2018 Compared with Fiscal Year 2017
Our effective income tax rate was 26.2% in fiscal year 2018, compared to (26.9)% in fiscal year 2017. The effective tax rate of 26.2% in fiscal year 2018 differed from the U.S. statutory rate, primarily due to the net tax benefits resulting from the Tax Cuts and Jobs Act ("TCJA") remeasurement of deferred tax assets and liabilities at the lower enacted rate, and our foreign earnings being subject to lower tax rates, offset by in part by additional valuation allowance related to current period losses, the tax effect of goodwill impairment charges that are not deductible, and the provision for the deemed repatriation of foreign cash and earnings. The effective tax rate of (26.9)% in fiscal year 2017 differed from the U.S. statutory rate, primarily due to additional valuation
32
allowance related to current period losses in the United States and an increase in deferred tax liabilities related to goodwill, partially offset by our earnings in foreign operations that are subject to significantly lower tax rates than U.S. statutory tax rate.
Provision for income taxes decreased by $88.8 million in fiscal year 2018, primarily due to the lower valuation allowance provided related to the losses incurred for the current fiscal year, the net tax benefits resulting from the TCJA remeasurement of deferred tax assets and liabilities at the lower enacted rate, offset in part by the tax effect of goodwill impairment charges that are not deductible, and the provision for the deemed repatriation of foreign cash and earnings.
Fiscal Year 2017 Compared with Fiscal Year 2016
Our effective income tax rate was (26.9)% in fiscal year 2017, compared to 816.4% in fiscal year 2016. The effective tax rate of (26.9)% in fiscal year 2017 differed from the U.S. statutory rate, primarily due to additional valuation allowance related to current period losses in the United States and an increase in deferred tax liabilities related to goodwill, partially offset by our earnings in foreign operations that are subject to significantly lower tax rates than U.S. statutory tax rate. The effective income tax rates in fiscal year 2016 differs from the U.S. federal statutory rate of 35% primarily due to additional valuation allowance related to current period losses in the United States, an increase in the deferred tax liabilities related to goodwill, and an increase in current tax provisions due to the one-time repatriation of foreign earnings offset by the utilization of previously unbenefited domestic loss and credit carryforwards. These were offset in part by our foreign earnings subject to significantly lower tax rates, and a $22.1 million release of domestic valuation allowance as a result of tax benefits recorded in connection with our acquisitions during the period for which a deferred tax liability was established in purchase accounting.
Provision for income taxes increased by $17.8 million in fiscal year 2017 as compared to fiscal year 2016, primarily due to the
additional valuation allowance provided related to the losses incurred for the current fiscal year and an increase in deferred tax
liabilities related to goodwill in fiscal year 2017, offset in part by the effect of one-time repatriated foreign earnings in fiscal year 2016.
SEGMENT ANALYSIS
During the first quarter of fiscal year 2018, we commenced a review of our segment reporting structure to better align our Chief Operating Decision Maker's ("CODM") long-term strategic focus with our organizational structure. During the second quarter of fiscal year 2018, we implemented a number organizational changes to align our segment reporting structure with our long-term strategic focuses, including (i) establishing our Automotive business as a separate operating segment, (ii) moving our Dragon TV business from our former Mobile operating segment into our Enterprise operating segment to consolidate our telecommunications market resources, and (iii) establishing an Other segment that includes our SRS and Devices businesses, previously reported within our former Mobile operating segment. As a result, segment information for fiscal years 2018, 2017 and 2016 has been recast to reflect the new segment reporting structure.
33
For further details of financial information about our operating segments, see Note 20 to the accompanying consolidated financial statements included in Item 8 of this Annual Report on Form 10-K. The following table presents certain financial information about our operating segments (dollars in millions).
Fiscal Year 2018 | Fiscal Year 2017 | Fiscal Year 2016 | % Change 2018 vs. 2017 | % Change 2017 vs. 2016 | |||||||||||||
Segment Revenues | |||||||||||||||||
Healthcare | $ | 984.8 | $ | 899.3 | $ | 973.3 | 9.5 | % | (7.6 | )% | |||||||
Enterprise | 483.2 | 474.3 | 396.0 | 1.9 | % | 19.8 | % | ||||||||||
Automotive | 279.4 | 252.2 | 214.3 | 10.8 | % | 17.7 | % | ||||||||||
Imaging | 212.9 | 217.7 | 241.6 | (2.2 | )% | (9.9 | )% | ||||||||||
Other | 109.1 | 133.8 | 154.4 | (18.5 | )% | (13.4 | )% | ||||||||||
Total segment revenues | 2,069.4 | 1,977.4 | 1,979.6 | 4.7 | % | (0.1 | )% | ||||||||||
Less: acquisition related revenue adjustments (a) | (17.7 | ) | (38.0 | ) | (30.7 | ) | (53.4 | )% | 23.9 | % | |||||||
Total revenues | $ | 2,051.7 | $ | 1,939.4 | $ | 1,948.9 | 5.8 | % | (0.5 | )% | |||||||
Segment Profit | |||||||||||||||||
Healthcare | $ | 331.4 | $ | 262.1 | $ | 313.5 | 26.4 | % | (16.4 | )% | |||||||
Enterprise | 142.4 | 135.6 | 129.3 | 5.0 | % | 4.9 | % | ||||||||||
Automotive | 109.9 | 118.9 | 95.7 | (7.6 | )% | 24.3 | % | ||||||||||
Imaging | 67.4 | 79.5 | 100.8 | (15.2 | )% | (21.1 | )% | ||||||||||
Other | 28.4 | 41.6 | 38.4 | (31.6 | )% | 8.2 | % | ||||||||||
Total segment profit | $ | 679.5 | $ | 637.7 | $ | 677.6 | 6.5 | % | (5.9 | )% | |||||||
Segment Profit Margin | |||||||||||||||||
Healthcare | 33.6 | % | 29.1 | % | 32.2 | % | 4.5 | (3.1 | ) | ||||||||
Enterprise | 29.5 | % | 28.6 | % | 32.6 | % | 0.9 | (4.0 | ) | ||||||||
Automotive | 39.3 | % | 47.1 | % | 44.6 | % | (7.8 | ) | 2.5 | ||||||||
Imaging | 31.7 | % | 36.5 | % | 41.7 | % | (4.8 | ) | (5.2 | ) | |||||||
Other | 26.1 | % | 31.1 | % | 24.9 | % | (5.0 | ) | 6.2 | ||||||||
Total segment profit margin | 32.8 | % | 32.3 | % | 34.2 | % | 0.5 | (1.9 | ) | ||||||||
(a) | Segment revenues differ from reported revenues due to certain revenue adjustments related to acquisitions that would otherwise have been recognized but for the purchase accounting treatment of the business combinations. These revenues are included to allow for more complete comparisons to the financial results of historical operations and in evaluating management performance. |
Segment Revenues
Fiscal Year 2018 Compared with Fiscal Year 2017
• | Healthcare segment revenues increased by $85.5 million during fiscal year 2018 as the segment recovered from the 2017 Malware Incident throughout the year, as well as the continued market penetration and growth of our Dragon Medical cloud-based solutions and higher revenue from EHR implementation and optimization services, offset in part by the continued erosion of our transcription services. |
• | Enterprise segment revenues increased by $8.9 million during fiscal year 2018 primarily due to higher contact center license and services revenue, offset in part by lower revenue from our inbound and outbound on-demand solutions. |
• | Automotive segment revenues increased by $27.2 million during fiscal year 2018 primarily due to higher royalties and revenues from our hosting solutions driven by continued growth in our ASR and infotainment platform services. |
• | Imaging segment revenues decreased by $4.8 million during fiscal year 2018 primarily due to lower revenue from our scanning and print management solutions, offset in part by higher revenue from our core Imaging solutions due to new product launch. |
• | Other segment revenue decreased by $24.7 million primarily due to the accelerated declines in both SRS and Devices businesses during fiscal year 2018. The decline in SRS was primarily due to the recent market disruptions in India and Brazil. These markets have experienced a dramatic recent disruption as a result of accelerated change in competition and business models for our SRS mobile operator customers, which has reduced demand for our services. The decline in our Devices business was |
34
primarily due to the ongoing consolidation of our handset manufacturer customer base, as well as continued erosion of our penetration of the remaining market.
As more fully described in Note 4 to the accompanying consolidated financial statements, during the fourth quarter of fiscal 2018, in connection with our comprehensive portfolio and business review efforts, we commenced a wind-down of our Devices and Mobile Operator Services businesses.
Fiscal Year 2017 Compared with Fiscal Year 2016
• | Healthcare segment revenues decreased by $74.0 million during fiscal year 2017 primarily due to decreases in hosting revenue and product and licensing revenue. Hosting revenue decreased by $58.2 million primarily due to the negative impact of the 2017 Malware Incident throughout the year, and the continued erosion of the transcription services, offset in part by the positive effect of customers' transition to cloud-based offerings. Product and licensing revenue decreased by $17.9 million primarily as a result of lower revenues from our licensed Dragon Medical product sales as we transition from product licensing to subscription and cloud-based offerings. We estimated the revenue impact of the Malware Incident due to the service interruption to be approximately $65 million for fiscal year 2017. |
• | Enterprise segment revenues increased by $78.3 million during fiscal year 2017 primarily due to the incremental revenue from recent acquisitions, increases in our omni-channel cloud offerings, and the continued strength in our on-premise and on-demand service portfolios. |
• | Automotive segment revenues increased by $37.9 million during fiscal year 2017 primarily due to higher royalties and revenues from our hosting solutions driven by continued growth in our speech recognition and infotainment platform services. |
• | Imaging segment revenues decreased by $23.8 million during fiscal year 2017 primarily due to the lower sales from our MFP solutions. |
• | Other segment revenues decreased by $20.7 million during fiscal year 2017 primarily due to declines in both the SRS and Devices business. |
Segment Profit
Fiscal Year 2018 Compared with Fiscal Year 2017
• | Healthcare segment profit increased by $69.2 million, or 26.4%, primarily due to higher segment revenue and higher gross margin. Healthcare operating results for fiscal year 2017 was negatively impacted by the 2017 Malware Incident. The gross margin for fiscal year 2018 reflected a favorable shift in revenue mix towards higher margin Dragon Medical cloud-based offerings, offset in part by the increase in EHR implementation and optimization services which carried lower margins. As a result, segment profit margin increased by 4.5 percentage points, to 33.6% for fiscal year 2018. |
• | Enterprise segment profit increased by $6.8 million, or 5.0%, primarily due to higher segment revenue, offset in part by lower gross margin. The lower gross margin was primarily due to higher infrastructure costs and increased headcount to support future growth. As a result, segment profit margin increased by 0.9 percentage points to 29.5% for fiscal year 2018 from 28.6% for fiscal year 2017. |
• | Automotive segment profit decreased by $9.0 million, or 7.6%, primarily due to lower gross margin and higher R&D expenses, offset in part by higher revenue. The lower gross margin was primarily driven by increased professional services headcount to support implementation of our connected solutions across existing and new customer base. The higher R&D expense was primarily driven by our increased investment in new technologies. As a result, segment profit margin decreased by 7.8 percentage points to 39.3% for fiscal year 2018 from 47.1% for fiscal year 2017. |
• | Imaging segment profit decreased by $12.1 million, or 15.2%, primarily due to lower segment revenue, lower gross margin, and higher operating expenses. Gross margin declined as a result of an unfavorable shift in revenue mix from higher margin software revenue to lower margin hardware revenue. Operating expenses increased primarily due to higher sales and marketing expenses to support new products and solutions, and drive greater market penetration. As a result, segment profit margin decreased by 4.8 percentage points to 31.7% for fiscal year 2018 from 36.5% for fiscal year 2017. |
• | Other segment profit decreased by $13.2 million, or 31.6%, primarily due to lower revenue and the margin compression in SRS and Devices. Segment profit margin declined primarily due to lower revenues and relatively fixed costs and expenses |
35
structure. As more fully described in Note 4 to the accompanying consolidated financial statements, during the fourth quarter of fiscal 2018, in connection with our comprehensive portfolio and business review efforts, we commenced a wind-down of our Devices and Mobile Operator Services businesses.
Fiscal Year 2017 Compared with Fiscal Year 2016
• | Healthcare segment profit decreased by $51.3 million, or 16.4%, primarily due to lower segment revenue and lower gross margin as a result of the negative impact of the 2017 Malware Incident and the continued erosion of the transcription services, offset in part by the positive effect of customers' transition to cloud based offerings. Segment profit margin decreased by 3.1 percentage points, to 29.1% for fiscal year 2017 from 32.2% for fiscal year 2016, primarily due to lower gross margin. |
• | Enterprise segment profit increased by $6.4 million, or 4.9%, primarily due to higher segment revenue, offset in part by lower gross margin and higher R&D expenses. Gross margin was lower as our recently acquired entities carried lower gross margins. R&D expenses increased as a result of increased R&D headcount due to recent acquisitions. Segment profit margin decreased by 4.0 percentage points to 28.6% for fiscal year 2017 from 32.6% for fiscal year 2016, primarily due to lower gross margin and higher operating expenses margin. |
• | Automotive segment profit increased by $23.2 million, or 24.3%, primarily due to higher revenues and gross margin. The gross margin improvement was primarily due to a favorable shift to higher margin cloud-based and licensing offerings. Segment profit margin increased by 2.5 percentage points to 47.1% for fiscal year 2017 from 44.6% for fiscal year 2016, primarily due to higher gross margin and lower operating expense margin as the segment continued to benefit from our costs savings and process optimization initiatives. |
• | Imaging segment profit decreased by $21.3 million, or 21.1%, primarily due to lower segment revenue. Segment profit margin decreased by 5.2 percentage points to 36.5% during fiscal year 2017 from 41.7% during fiscal year 2016, primarily due to relatively flat operating expenses on lower revenues. |
• | Other segment profit increased by $3.1 million, or 8.2%, primarily due to higher gross margin, offset in part by lower revenue. Higher gross margin was primarily driven by the timing of product and licensing revenue. Segment profit margin increased by 6.2 percentage points to 31.1% during fiscal year 2017 from 24.9% during fiscal year 2016. |
LIQUIDITY AND CAPITAL RESOURCES
Liquidity
We had cash and cash equivalents and marketable securities of $473.5 million as of September 30, 2018, a decrease of $400.6 million from $874.1 million as of September 30, 2017. Our working capital, as defined by total current assets less total current liabilities, was $164.5 million as of September 30, 2018, compared to $216.4 million as of September 30, 2017. Additionally, we had availability of $242.5 million under our revolving credit facility as of September 30, 2018. We believe that our existing sources of liquidity are sufficient to support our operating needs, capital requirements and any debt service requirements for the next twelve months.
Cash and cash equivalents and marketable securities held by our international operations totaled $112.8 million as of September 30, 2018 and $148.6 million as of September 30, 2017. We utilize a variety of financing strategies to ensure that our worldwide cash is available to meet our liquidity needs. We expect the cash held overseas to be permanently invested in our international operations, and our U.S. operation to be funded through its own operating cash flows, cash and marketable securities within the U.S., and if necessary, borrowing under our revolving credit facility.
36
Corporate Transformation Program and Strategic Business Review
During the third quarter of fiscal year 2018, we commenced a strategic and operational review of our business with the goal of improving our focuses on leveraging our core strengths in key vertical markets and sustaining our long-term growth and profitability.
In connection with the business review, we commenced a wind-down of our Mobile Operator Services and Devices businesses during the fourth quarter of fiscal year 2018. On November 11, 2018, we entered into a definitive stock purchase agreement, pursuant to which we agreed to sell our Imaging business and associated assets for a total cash consideration of approximately $400 million. The transaction, which is subject to regulatory review and other customary closing conditions, is expected to close by the end of the second quarter of fiscal year 2019. Additionally, on November 19, 2018, we announced our intent to spin off our Automotive business into an independent publicly-traded company through a pro rata distribution to our common stock holders. Completion of the proposed spin-off is subject to certain conditions, including final approval by our Board of Directors. We are targeting to compete the separation of the business by the end of fiscal year 2019.
We expect to spend $50 million to $75 million to effect the separation and stand-up of the businesses in fiscal year 2019. In addition, as part of the transformation initiatives, we incurred approximately $4.8 million expense related to the assessment of operational efficiency and the establishment of the program during fiscal year 2018. We expect to incur $60 million to $70 million of restructuring related expenditures in fiscal year 2019.
Cash provided by operating activities
Fiscal Year 2018 Compared with Fiscal Year 2017
Cash provided by operating activities for fiscal year 2018 was $444.4 million, an increase of $65.6 million, or 17%, from $378.9 million for fiscal year 2017. The net increase was primarily due to:
• | An increase of $25.0 million driven by favorable changes in working capital, primarily due to the timing of billing and collections; and |
• | An increase in cash inflows of $39.3 million from deferred revenue. Deferred revenue contributed cash inflow of $86.2 million in fiscal year 2018, as compared to $46.9 million in fiscal year 2017, primarily driven by continued growth of our Automotive connected solutions and Healthcare bundled offerings. |
Fiscal Year 2017 Compared to Fiscal Year 2016
Cash provided by operating activities for fiscal year 2017 was $378.9 million, a decrease of $186.9 million, or 33%, from $565.8 million for fiscal year 2016. The net decrease was primarily due to:
• | A decrease of $77.1 million in cash flows resulting from a higher net loss, exclusive of non-cash adjustment items; |
• | A decrease of $95.0 million in cash flows resulting from unfavorable changes in working capital, excluding deferred revenue; and |
• | A decrease in cash inflows of $14.9 million from deferred revenue. Deferred revenue contributed cash inflow of $46.9 million in fiscal year 2017, as compared to $61.7 million in fiscal year 2016. The deferred revenue growth in fiscal year 2017 was driven primarily by our hosting solutions in automotive connected services within our Mobile segment and bundled offerings within our Healthcare segment. |
Cash used in investing activities
Fiscal Year 2018 Compared with Fiscal Year 2017
Cash used in investing activities for fiscal year 2018 was $37.3 million, a decrease of $296.9 million, or 89%, from $334.2 million for fiscal year 2017. The net decrease was primarily due to:
• | An increase of $280.3 million in net proceeds from the sale and purchase of marketable securities and other investments; and |
• | A decrease of $13.0 million in capital expenditures. |
Fiscal Year 2017 Compared to Fiscal Year 2016
Cash used in investing activities for fiscal year 2017 was $334.2 million, an increase of $71.2 million, or 27%, from $263.0 million for fiscal year 2016. The net increase was primarily due to:
37
• | An increase in cash outflows of $214.8 million for payments of marketable securities and other investments, offset in part by; |
• | An increase in cash inflows of $91.6 million for proceeds from marketable securities and other investment; and |
• | A decrease in cash outflows of $59.0 million for business and technology acquisitions. |
Cash (used in) provided by financing activities
Fiscal Year 2018 Compared with Fiscal Year 2017
Cash used by financing activities for fiscal year 2018 was $680.3 million, an increase of $747.4 million, or 1,115%, from cash provided by financing activities of $67.1 million for fiscal year 2017. The net increase was primarily due to:
• | A decrease in cash inflows of $837.5 million from debt issuance. During fiscal year 2017, the cash inflows from debt activities includes $495.0 million net proceeds from the issuance of 5.625% Senior Notes due 2026; and $343.6 million net proceeds from the issuance of our 1.25% 2025 Convertible Debentures; |
• | An increase in cash outflows of $37.0 million related to share repurchases. During fiscal year 2018 and 2017, we repurchased 9.7 million shares and 5.8 million shares for $136.1 million and $99.1 million, respectively; and |
• | An increase in cash outflows of $24.8 million related to acquisition payments with extended payment terms, offset in part by, |
• | A decrease in cash outflows of $152.9 million from the redemption and repayment of debt. During fiscal year 2018, holders of approximately $331.2 million in aggregate principal amount of the 2.75% 2031 Debentures exercised their right to require us to repurchase such debentures, and we repurchased $150.0 million in aggregate principal amount of our 2020 Senior Notes. During fiscal year 2017, we repurchased $600.0 million in aggregate principal amount of our 2020 Senior Notes and $17.8 million in aggregate principal amount of our 2031 Convertible Debentures. |
Fiscal Year 2017 Compared to Fiscal Year 2016
Cash used in financing activities for fiscal year 2017 was $67.1 million, an increase of $372.2 million, or 122%, from cash used in financing activities of $305.1 million for fiscal year 2016. The net increase was primarily due to:
• | A decrease in cash outflows of $600.4 million related to share repurchases. We repurchased 5.8 million shares of our common stock for $99.1 million in fiscal year 2017 as compared to 9.4 million shares repurchased under our share repurchase program and 26.3 million shares repurchased from the Icahn Group for total cash outflow of $699.5 million in fiscal year 2016; |
• | A decrease in net cash inflows of $244.1 million from debt activities. The fiscal year 2017 activity included approximately$495.0 million net proceeds from the issuance of our 2026 Senior Notes, approximately $343.6 million net proceeds from the issuance of our 1.25% 2025 Debentures, offset by the repurchases of $600.0 million in aggregate principal of our 2020 Senior Notes and $17.8 million in aggregate principal of our 2031 Convertible Debentures. The fiscal year 2016 activity included proceeds of $663.8 million, net of issuance costs, from the issuance of our 1.0% 2035 Debentures offset by the repurchase of $38.3 million in aggregate principal on our 2.75% Senior Convertible Debentures due in 2031 and repayment of $472.5 million on our term loan under the amended and restated credit agreement; and |
• | An increase in cash outflows of $14.5 million as a result of higher cash payments required to net share settle employee equity awards due to the increase in the intrinsic value of shares vested during fiscal year 2017 as compared to fiscal year 2016. |
Debt
For a detailed description of the terms and restrictions of the debt and revolving credit facility, see Note 9 to the accompanying consolidated financial statements.
We expect to incur cash interest payment on outstanding debt of $78.8 million in fiscal year 2019, based on the outstanding balance as of September 30, 2018 and the holders' right of redemption discussed above. We expect to fund our debt service requirements through existing sources of liquidity and our operating cash flows.
Share Repurchases
On April 29, 2013, our Board of Directors approved a share repurchase program for up to $500.0 million, which was increased by $500.0 million on April 29, 2015. On August 1, 2018, our Board of Directors approved additional $500.0 million under our share repurchase program. Under the terms of the share repurchase program, we have the ability to repurchase shares through a variety of methods, which may include open market purchases, privately negotiated transactions, block trades, accelerated
38
stock repurchase transactions, or any combination of such methods. The share repurchase program does not require us to acquire any specific number of shares and may be modified, suspended, extended or terminated by us at any time without prior notice. The timing and the amount of any purchases will be determined by management based on an evaluation of market conditions, capital allocation alternatives, and other factors.
We spent $136.1 million, $99.1 million and $197.5 million on share repurchases during the fiscal years 2018, 2017 and 2016, respectively. Approximately $557.3 million remained available for share repurchases as of September 30, 2018 pursuant to our share repurchase program.
Off-Balance Sheet Arrangements, Contractual Obligations, Contingent Liabilities and Commitments
Contractual Obligations
The following table outlines our contractual payment obligations as of September 30, 2018 (dollars in millions):
Payments Due by Fiscal Year Ended September 30, | ||||||||||||||||||||
Contractual Obligations | Total | 2019 | 2020 and 2021 | 2022 and 2023 | Thereafter | |||||||||||||||
Convertible Debentures (1) | $ | 1,337.0 | $ | — | $ | — | $ | 987.0 | $ | 350.0 | ||||||||||
Senior Notes | 1,100.0 | — | 300.0 | — | 800.0 | |||||||||||||||
Interest payable on long-term debt (2) | 458.7 | 78.8 | 141.0 | 113.8 | 125.1 | |||||||||||||||
Letter of Credit (3) | 6.9 | 6.8 | 0.1 | — | — | |||||||||||||||
Lease obligations and other liabilities: | ||||||||||||||||||||
Operating leases | 165.0 | 29.1 | 39.5 | 32.0 | 64.4 | |||||||||||||||
Operating leases under restructuring (4) | 60.9 | 10.1 | 17.9 | 17.2 | 15.7 | |||||||||||||||
Purchase commitments for inventory, property and equipment (5) | 32.6 | 8.0 | 13.8 | 10.8 | — | |||||||||||||||
Total contractual cash obligations | $ | 3,161.1 | $ | 132.8 | $ | 512.3 | $ | 1,160.8 | $ | 1,355.2 | ||||||||||
(1) | Pursuant to the terms of each convertible instrument, holders have the right to redeem the debt on specific dates prior to maturity. The repayment schedule above assumes that payment is due on the next redemption date after September 30, 2018. |
(2) | Interest per annum is due and payable semi-annually and is determined based on the outstanding principal as of September 30, 2018, the stated interest rate of each debt instrument and the assumed redemption dates discussed above. |
(3) | Letters of Credit are in place primarily to secure future operating lease payments. |
(4) | Obligations include contractual lease commitments related to facilities that were part of restructuring plans. As of September 30, 2018, we have subleased certain of the facilities with total sublease income of $42.8 million through fiscal year 2027. |
(5) | These amounts include non-cancelable purchase commitments for property and equipment as well as inventory in the normal course of business to fulfill customer backlog. |
The summary above does not include unrecognized tax benefits of $30.4 million and the one-time mandatory repatriation tax of $5.8 million as of September 30, 2018. We do not expect a significant change in the amount of unrecognized tax benefits within the next 12 months. We estimate that none of this amount will be paid within the next year and we are currently unable to reasonably estimate the timing of payments for the remainder of the liability.
Contingent Liabilities and Commitments
Certain acquisition payments to selling stockholders were contingent upon the achievement of pre-determined performance targets over a period of time after the acquisition. Such contingent payments were recorded at estimated fair values upon the acquisition and re-measured in subsequent reporting periods. As of September 30, 2018, we may be required to pay the selling stockholders up to $12.4 million contingent upon achieving specified performance goals, including the achievement of future bookings and sales targets related to the products of the acquired entities. In addition, certain deferred compensation payments to selling stockholders contingent upon their continued employment after the acquisition were recorded as compensation expense over the requisite service period. Additionally, as of September 30, 2018, the remaining deferred payment obligations of $19.9 million to certain former stockholders, which are contingent upon their continued employment, will be recognized ratably as compensation expense over the remaining requisite service periods.
39
Financial Instruments
We use financial instruments to manage our foreign exchange risk. We operate our business in countries throughout the world and transact business in various foreign currencies. Our foreign currency exposures typically arise from transactions denominated in currencies other than the functional currency of our operations. We have a program that primarily utilizes foreign currency forward contracts to offset the risks associated with the effect of certain foreign currency exposures. Our program is designed so that increases or decreases in our foreign currency exposures are offset by gains or losses on the foreign currency forward contracts in order to mitigate the risks and volatility associated with our foreign currency transactions. Generally, we enter into such contracts for less than 90 days and have no cash requirements until maturity. At September 30, 2018 and 2017, we had outstanding contracts with a total notional value of $117.1 million and $69.0 million, respectively.
Defined Benefit Plans
We sponsor certain defined benefit plans that are offered primarily by certain of our foreign subsidiaries. Many of these plans were assumed through our acquisitions or are required by local regulatory requirements. We may deposit funds for these plans with insurance companies, third party trustees, or into government-managed accounts consistent with local regulatory requirements, as applicable. Our total defined benefit plan pension expenses were $0.3 million, $0.4 million and $0.1 million for fiscal years 2018, 2017 and 2016, respectively. The aggregate projected benefit obligation as of September 30, 2018 and September 30, 2017 was $34.7 million and $37.2 million, respectively. The aggregate net liability of our defined benefit plans as of September 30, 2018 and September 30, 2017 was $11.1 million and $13.2 million, respectively.
Off-Balance Sheet Arrangements
Through September 30, 2018, we have not entered into any off-balance sheet arrangements or material transactions with unconsolidated entities or other persons.
CRITICAL ACCOUNTING POLICIES, JUDGMENTS AND ESTIMATES
The preparation of financial statements in conformity with U.S. generally accepted accounting principles, requires management to make estimates and assumptions that affect the reported amounts of assets and liabilities, and the disclosure of contingent assets and liabilities at the date of the financial statements, and the reported amounts of revenue and expenses during the reporting period. On an ongoing basis, we evaluate our estimates, assumptions and judgments, including those related to revenue recognition; allowance for doubtful accounts and sales returns; accounting for deferred costs; accounting for internally developed software; the valuation of goodwill and intangible assets; accounting for business combinations, including contingent consideration; accounting for stock-based compensation; accounting for derivative instruments; accounting for income taxes and related valuation allowances; and loss contingencies. Our management bases its estimates on historical experience, market participant fair value considerations, projected future cash flows and various other factors that are believed to be reasonable under the circumstances. Actual results could differ from these estimates.
We believe the following critical accounting policies most significantly affect the portrayal of our financial condition and results of operations and require our most difficult and subjective judgments.
Revenue Recognition. We derive revenue from the following sources: (1) software license agreements, including royalty and other usage-based arrangements, (2) professional services, (3) hosting services and (4) post-contract customer support ("PCS"). Our hosting services are generally provided through on-demand, usage-based or per transaction fee arrangements. Our revenue recognition policies for these revenue streams are discussed below.
The sale and/or license of software solutions and technology is deemed to have occurred when a customer either has taken possession of or has access to take immediate possession of the software or technology. In select situations, we sell or license intellectual property in conjunction with, or in place of, embedding our intellectual property in software. We also have non-software arrangements including hosting services where the customer does not take possession of the software at the outset of the arrangement either because they have no contractual right to do so or because significant penalties preclude them from doing so. Generally, we recognize revenue when (i) persuasive evidence of an arrangement exists, (ii) delivery has occurred, (iii) the fee is fixed or determinable and (iv) collectibility is probable.
Revenue from royalties on sales of our software products by original equipment manufacturers (“OEMs”), where no services are included, is recognized in the quarter earned so long as we have been notified by the OEM that such royalties are due, and provided that all other revenue recognition criteria are met.
40
Software arrangements generally include PCS, which includes telephone support and the right to receive unspecified upgrades/enhancements on a when-and-if-available basis, typically for one to five years. Revenue from PCS is recognized ratably on a straight-line basis over the term that the maintenance service is provided. When PCS renews automatically, we provide a reserve based on historical experience for contracts expected to be canceled for non-payment. All known and estimated cancellations are recorded as a reduction to revenue and accounts receivable.
For our software and software-related multiple element arrangements, where customers purchase both software related products and software related services, we use vendor-specific objective evidence (“VSOE”) of fair value for software and software-related services to separate the elements and account for them separately. VSOE exists when a company can support the fair value of its software and/or software-related services based on evidence of the prices charged when the same elements are sold separately. For the undelivered elements, VSOE of fair value is required in order to separate the accounting for various elements in a software and related services arrangement. We have established VSOE of fair value for the majority of our PCS, professional services, and training.
When we provide professional services considered essential to the functionality of the software, we recognize revenue from the professional services as well as any related software licenses on a percentage-of-completion basis whereby the arrangement consideration is recognized as the services are performed, as measured by an observable input. In these circumstances, we separate license revenue from professional service revenue for income statement presentation by allocating VSOE of fair value of the professional services as professional services and hosting revenue and the residual portion as product and licensing revenue. We generally determine the percentage-of-completion by comparing the labor hours incurred to-date to the estimated total labor hours required to complete the project. We consider labor hours to be the most reliable, available measure of progress on these projects. Adjustments to estimates to complete are made in the periods in which facts resulting in a change become known. When the estimate indicates that a loss will be incurred, such loss is recorded in the period identified. Significant judgments and estimates are involved in determining the percent complete of each contract. Different assumptions could yield materially different results.
We offer some of our products via a Software-as-a-Service ("SaaS") model also known as a hosted model. In this type of arrangement, we are compensated in three ways: (1) fees for up-front setup of the service environment, (2) fees charged on a usage or per transaction basis, and (3) fees charged for on-demand service. Our up-front setup fees are nonrefundable. We recognize the up-front setup fees ratably over the longer of the contract lives, or the expected lives of the customer relationships. The usage-based or per transaction fees are due and payable as each individual transaction is processed through the hosting service and is recognized as revenue in the period the services are provided. The on-demand service fees are recognized ratably over our estimate of the useful life of devices on which the hosting service is provided.
We enter into multiple-element arrangements that may include a combination of our various software related and non-software related products and services offerings including software licenses, post contract support ("PCS"), professional services, and our hosting services. In such arrangements, we allocate total arrangement consideration to software or software-related elements and any non-software element separately based on the selling price hierarchy group following our policies. Where determined we determine the selling price for each deliverable using VSOE of selling price, if it exists, or Third Party Evidence (“TPE”) of selling price. Typically, we are unable to determine TPE of selling price. Therefore, when neither VSOE nor TPE of selling price exist for a deliverable, we use our Estimate of Selling Price (“ESP”) for the purposes of allocating the arrangement consideration. We determine ESP for a product or service by considering multiple factors including, but not limited to, major project groupings, market conditions, competitive landscape, price list and discounting practices. Revenue allocated to each element is then recognized when the basic revenue recognition criteria are met for each element.
When products are sold through distributors or resellers, title and risk of loss generally passes upon shipment, at which time the transaction is invoiced and the payment is due. Shipments to distributors and resellers without right of return are recognized as revenue upon shipment, provided all other revenue recognition criteria are met. Certain distributors and resellers have been granted rights of return for as long as the distributors or resellers hold the inventory. We cannot estimate historical returns from these distributors and resellers; and therefore, cannot use such estimates as the basis upon which to estimate future sales returns. As a result, we recognize revenue from sales to these distributors and resellers when the products are sold through to retailers and end-users.
When products are sold directly to retailers or end-users, we make an estimate of sales returns based on historical experience. The provision for these estimated returns is recorded as a reduction of revenue and accounts receivable at the time that the related revenue is recorded. If actual returns differ significantly from our estimates, such differences could have a material impact on our results of operations for the period in which the actual returns become known.
41
We record consideration given to a reseller as a reduction of revenue to the extent we have recorded cumulative revenue from the customer or reseller. However, when we receive an identifiable benefit in exchange for the consideration and can reasonably estimate the fair value of the benefit received, the consideration is recorded as an operating expense.
We record reimbursements received for out-of-pocket expenses as revenue, with offsetting costs recorded as cost of revenue. Out-of-pocket expenses generally include, but are not limited to, expenses related to transportation, lodging and meals. We record shipping and handling costs billed to customers as revenue with offsetting costs recorded as cost of revenue.
Our revenue recognition policies require management to make significant estimates. Management analyzes various factors, including a review of specific transactions, historical experience, creditworthiness of customers and current market and economic conditions. Changes in judgments based upon these factors could impact the timing and amount of revenue and cost recognized and thus affects our results of operations and financial condition.
Business Combinations. We determine and allocate the purchase price of an acquired company to the tangible and intangible assets acquired and liabilities assumed as of the business combination date. The purchase price allocation process requires us to use significant estimates and assumptions, including fair value estimates, as of the business acquisition date, including:
• | estimated fair values of intangible assets; |
• | estimated fair market values of legal performance commitments to customers, assumed from the acquiree under existing contractual obligations (classified as deferred revenue) at the date of acquisition; |
• | estimated fair market values of stock awards assumed from the acquiree that are included in the purchase price; |
• | estimated fair market value of required payments under contingent consideration provisions; |
• | estimated income tax assets and liabilities assumed from the acquiree; and |
• | estimated fair value of pre-acquisition contingencies assumed from the acquiree. |
While we use our best estimates and assumptions to determine the fair values of assets acquired and liabilities assumed at the date of acquisition, our estimates and assumptions are inherently uncertain and subject to refinement. As a result, within the measurement period, which is generally one year from the date of acquisition, we record adjustments to the assets acquired and liabilities assumed against goodwill in the period the amounts are determined. Adjustments identified subsequent to the measurement period are recorded within Acquisition-related costs, net.
Although we believe the assumptions and estimates we have made in the past have been reasonable and appropriate, they are based in part on historical experience and information obtained from the management of the acquired companies and are inherently uncertain. Examples of critical estimates in valuing certain of the intangible assets we have acquired or may acquire in the future include but are not limited to:
• | future expected cash flows from software license sales, support agreements, consulting contracts, hosting services, other customer contracts and acquired developed technologies and patents; |
• | expected costs to develop in-process research and development projects into commercially viable products and the estimated cash flows from the projects when completed; |
• | the acquired company’s brand and competitive position, as well as assumptions about the period during which the acquired brand will continue to be used in the combined company’s product portfolio; and |
• | discount rates. |
Unanticipated events and circumstances may occur which may affect the accuracy or validity of such assumptions, estimates or actual results.
In connection with the purchase price allocations for our acquisitions, we estimate the fair market value of legal performance commitments to customers, which are classified as deferred revenue. The estimated fair market value of these obligations is determined and recorded as of the acquisition date.
42
We may identify certain pre-acquisition contingencies. If, during the purchase price allocation period, we are able to determine the fair values of a pre-acquisition contingencies, we will include that amount in the purchase price allocation. If we are unable to determine the fair value of a pre-acquisition contingency at the end of the measurement period, we will evaluate whether to include an amount in the purchase price allocation based on whether it is probable a liability had been incurred and whether an amount can be reasonably estimated. Subsequent to the end of the measurement period, any adjustment to amounts recorded for a pre-acquisition contingency will be included within acquisition-related cost, net in the period in which the adjustment is determined.
Goodwill Impairment Analysis. Goodwill represents the excess of the purchase price in a business combination over the fair value of net tangible and intangible assets acquired. Goodwill and intangible assets with indefinite lives are not amortized, but rather the carrying amounts of these assets are assessed for impairment at least annually or whenever events or changes in circumstances indicate that the carrying value of these assets may not be recoverable. Goodwill is tested for impairment annually on July 1, the first day of the fourth quarter of the fiscal year. In fiscal year 2017, we elected to early adopt ASU 2017-04, “Simplifying the Test for Goodwill Impairment” for its annual goodwill impairment test. ASU 2017-04 removes Step 2 of the goodwill impairment test requiring a hypothetical purchase price allocation. Goodwill impairment, if any, is determined by comparing the reporting unit's fair value to its carrying value. An impairment loss is recognized in an amount equal to the excess of the reporting unit's carrying value over its fair value, up to the amount of goodwill allocated to the reporting unit. There is no goodwill impairment for fiscal years 2017 and 2016. See Note 4 to the accompanying consolidated financial statements for the impairment losses recorded in fiscal year 2018.
For the purpose of testing goodwill for impairment, all goodwill acquired in a business combination is assigned to one or more reporting units. A reporting unit represents an operating segment or a component within an operating segment for which discrete financial information is available and is regularly reviewed by segment management for performance assessment and resource allocation. Components of similar economic characteristics are aggregated into one reporting unit for the purpose of goodwill impairment assessment. Reporting units are identified annually and re-assessed periodically for recent acquisitions or any changes in segment reporting structure.
Corporate assets and liabilities are allocated to each reporting unit based on the reporting unit’s revenue, total operating expenses or operating income as a percentage of the consolidated amounts. Corporate debt and other financial liabilities that are not directly attributable to the reporting unit's operations and would not be transferred to hypothetical purchasers of the reporting units are excluded from a reporting unit's carrying amount.
The fair value of a reporting unit is generally determined using a combination of the income approach and the market approach. For the income approach, fair value is determined based on the present value of estimated future after-tax cash flows, discounted at an appropriate risk-adjusted rate. We use our internal forecasts to estimate future after-tax cash flows and estimate the long-term growth rates based on our most recent views of the long-term outlook for each reporting unit. Actual results may differ from those assumed in our forecasts. We derive our discount rates using a capital asset pricing model and analyzing published rates for industries relevant to our reporting units to estimate the weighted average cost of capital. We adjust the discount rates for the risks and uncertainty inherent in the respective businesses and in our internally developed forecasts. For the market approach, we use a valuation technique in which values are derived based on valuation multiples of comparable publicly traded companies. We assess each valuation methodology based upon the relevance and availability of the data at the time we perform the valuation and weight the methodologies appropriately.
Long-Lived Assets with Definite-Lives. Our long-lived assets consist principally of technology, customer relationships, internally developed software, land, and building and equipment. Customer relationships are amortized over their estimated economic lives based on the pattern of economic benefits expected to be generated from the use of the asset. Other definite-lived assets are amortized over their estimated economic lives using the straight-line method. The remaining useful lives of long-lived assets are re-assessed periodically at the asset group level for any events and circumstances that may change the future cash flows expected to be generated from the long-lived asset or asset group.
43
Internally developed software consists of capitalized costs incurred during the application development stage, which include costs related design of the software configuration and interfaces, coding, installation and testing. Costs incurred during the preliminary project stage and post-implementation stage are expensed as incurred. Internally developed software is amortized over the estimated useful life, commencing on the date when the asset is ready for its intended use. Land, building and equipment are stated at cost and depreciated over their estimated useful lives. Leasehold improvements are depreciated over the shorter of the related lease term or the estimated useful life. Depreciation is computed using the straight-line method. Repair and maintenance costs are expensed as incurred. The cost and related accumulated depreciation of sold or retired assets are removed from the accounts and any gain or loss is included in the results of operations for the period.
Long-lived assets with definite lives are tested for impairment whenever events or changes in circumstances indicate the carrying value of a specific asset or asset group may not be recoverable. We assess the recoverability of long-lived assets with definite-lives at the asset group level. Asset groups are determined based upon the lowest level for which identifiable cash flows are largely independent of the cash flows of other assets and liabilities. When the asset group is also a reporting unit, goodwill assigned to the reporting unit is also included in the carrying amount of the asset group. For the purpose of the recoverability test, we compare the total undiscounted future cash flows from the use and disposition of the assets with its net carrying amount. When the carrying value of the asset group exceeds the undiscounted future cash flows, the asset group is deemed to be impaired. The amount of the impairment loss represents the excess of the asset or asset group’s carrying value over its estimated fair value, which is generally determined based upon the present value of estimated future pre-tax cash flows that a market participant would expect from use and disposition of the long-lived asset or asset group. See Note 4 for the impairment charges recorded in fiscal year 2018.
Accounting for Stock-Based Compensation. We recognize stock-based compensation expense over the requisite service period, based on the grant date fair value of the awards and the number of the awards expected to be vested based upon service and performance conditions. The fair value of restricted stock units is determined based on the number of shares granted and the quoted price of our common stock, and the fair value of stock options is estimated on the date of grant using the Black-Scholes model. Determining the fair value of share-based awards at the grant date requires judgment, including estimating expected dividends, share price volatility, forfeiture rates and the number of performance-based restricted stock units expected to be granted. If actual results differ significantly from these estimates, the actual stock-based compensation expense may significantly differ from our estimates.
Income Taxes. Deferred tax assets and liabilities are recognized for the estimated future tax consequences attributable to differences between the financial statement carrying amounts of assets and liabilities and their respective tax bases. This method also requires the recognition of future tax benefits such as net operating loss carryforwards, to the extent that realization of such benefits is more likely than not after consideration of all available evidence. As the income tax returns are not due and filed until after the completion of our annual financial reporting requirements, the amounts recorded for the current period reflect estimates for the tax-based activity for the period. In addition, estimates are often required with respect to, among other things, the appropriate state and foreign income tax rates to use, the potential utilization of operating loss carry-forwards and valuation allowances required, if any, for tax assets that may not be realizable in the future. Tax laws and tax rates vary substantially in these jurisdictions, and are subject to change given the political and economic climate. We report and pay income tax based on operational results and applicable law. Our tax provision contemplates tax rates currently in effect to determine both our current and deferred tax provisions.
Any significant fluctuation in rates or changes in tax laws could cause our estimates of taxes we anticipate either paying or recovering in the future to change. Such changes could lead to either increases or decreases in our effective tax rate.
We have historically estimated the future tax consequence of certain items, including bad debts, inventory valuation, and accruals that cannot be deducted for income tax purposes until such expenses are paid or the related assets are disposed. We believe the procedures and estimates used in our accounting for income taxes are reasonable and in accordance with established tax law. The income tax estimates used have not resulted in material adjustments to income tax expense in subsequent periods when the estimates are adjusted to the actual filed tax return amounts.
Deferred tax assets and liabilities are measured using enacted tax rates expected to apply to taxable income in the fiscal years in which those temporary differences are expected to be recovered or settled. With respect to earnings expected to be indefinitely reinvested offshore, we do not accrue tax for the repatriation of such foreign earnings.
We regularly review our deferred tax assets for recoverability considering historical profitability, projected future taxable income, the expected timing of the reversals of existing temporary differences and tax planning strategies. In assessing the need for a valuation allowance, we consider both positive and negative evidence related to the likelihood of realization of the deferred tax assets. The weight given to the positive and negative evidence is commensurate with the extent to which the evidence may be objectively verified. If positive evidence regarding projected future taxable income, exclusive of reversing taxable temporary
44
differences, existed it would be difficult for it to outweigh objective negative evidence of recent financial reporting losses. Generally, cumulative loss in recent years is a significant piece of negative evidence that is difficult to overcome in determining that a valuation allowance is not needed.
As of September 30, 2018, we have $183.3 million of valuation allowances recorded against all U.S. deferred tax assets and certain foreign deferred tax assets. If we are subsequently able to utilize all or a portion of the deferred tax assets for which the remaining valuation allowance has been established, then we may be required to recognize these deferred tax assets through the reduction of the valuation allowance which could result in a material benefit to our results of operations in the period in which the benefit is determined.
We recognize tax benefits from uncertain tax positions only if it is more likely than not that the tax position will be sustained on examination by the taxing authorities, based on the technical merits of the position. The tax benefits recognized in the financial statements from such positions are then measured based on the largest benefit which is more likely than not to be realized upon ultimate settlement.
Loss Contingencies. We are subject to legal proceedings, lawsuits and other claims relating to labor, service and other matters arising in the ordinary course of business, as discussed in Note 16 of Notes to our Consolidated Financial Statements. On a quarterly basis, we review the status of each significant matter and assess our potential financial exposure. If the potential loss from any claim or legal proceeding is considered probable and the amount can be reasonably estimated, we accrue a liability for the estimated loss. Significant judgments are required for the determination of probability and the range of the outcomes. Due to the inherent uncertainties, estimates are based only on the best information available at the time. Actual outcomes may differ from our estimates. As additional information becomes available, we reassess the potential liability related to our pending claims and litigation and may revise our estimates. Such revisions may have a material impact on our results of operations and financial position.
RECENTLY ADOPTED ACCOUNTING STANDARDS
See Note 2 to the accompanying consolidated financial statements for a description of recently adopted accounting standards.
ISSUED ACCOUNTING STANDARDS NOT YET ADOPTED
See Note 2 to the accompanying consolidated financial statements for a description of certain issued accounting standards that have not been adopted and may impact our financial statements in future reporting periods.
Item 7A.Quantitative and Qualitative Disclosures about Market Risk
We are exposed to market risk from changes in foreign currency exchange rates, interest rates and equity prices which could affect operating results, financial position and cash flows. We manage our exposure to these market risks through our regular operating and financing activities and, when appropriate, through the use of derivative financial instruments.
Exchange Rate Sensitivity
We are exposed to changes in foreign currency exchange rates. Any foreign currency transaction, defined as a transaction denominated in a currency other than the local functional currency, will be reported in the functional currency at the applicable exchange rate in effect at the time of the transaction. A change in the value of the functional currency compared to the foreign currency of the transaction will have either a positive or negative impact on our financial position and results of operations.
Assets and liabilities of our foreign entities are translated into U.S. dollars at exchange rates in effect at the balance sheet date and income and expense items are translated at average rates for the applicable period. Therefore, the change in the value of the U.S. dollar compared to foreign currencies will have either a positive or negative effect on our financial position and results of operations. Historically, our primary exposure has related to transactions denominated in the euro, British pound, Brazilian real, Canadian dollar, Japanese yen, Indian rupee and Hungarian forint.
A hypothetical change of 10% in appreciation or depreciation in foreign currency exchange rates from the quoted foreign currency exchange rates at September 30, 2018 would not have a material impact on our revenue, operating results or cash flows in the coming year.
45
Periodically, we enter into forward exchange contracts to hedge against foreign currency fluctuations. These contracts may or may not be designated as cash flow hedges for accounting purposes. We have in place a program which primarily uses forward contracts to offset the risks associated with foreign currency exposures that arise from transactions denominated in currencies other than the functional currencies of our worldwide operations. The program is designed so that increases or decreases in our foreign currency exposures are offset by gains or losses on the foreign currency forward contracts. The outstanding contracts are not designated as cash flow hedges and generally are for periods less than 90 days. The notional contract amount of outstanding foreign currency exchange contracts not designated as cash flow hedges was $117.1 million at September 30, 2018. Based on the nature of the transactions for which the contracts were purchased, a hypothetical change of 10% in exchange rates would not have a material impact on our financial results.
Interest Rate Sensitivity
We are exposed to interest rate risk as a result of our cash and cash equivalents and marketable securities.
At September 30, 2018, we held approximately $473.5 million of cash and cash equivalents and marketable securities consisting of cash, money-market funds, bank deposits and a separately managed investment portfolio. Assuming a one percentage point increase in interest rates, our interest income on our investments classified as cash and cash equivalents and marketable securities would increase by approximately $3.7 million per annum, based on the September 30, 2018 reported balances of our investment accounts.
At September 30, 2018, we had no outstanding debt exposed to variable interest rates.
Convertible Debentures
The fair values of our convertible debentures are dependent on the price and volatility of our common stock as well as movements in interest rates. The fair market values of these debentures will generally increase as the market price of our common stock increases and will decrease as the market price of our common stock decreases. The fair market values of these debentures will generally increase as interest rates fall and decrease as interest rates rise. The market value and interest rate changes affect the fair market values of these debentures, but do not impact our financial position, results of operations or cash flows due to the fixed nature of the debt obligations. However, increases in the value of our common stock above the stated trigger price for each issuance for a specified period of time may provide the holders of these debentures the right to convert each bond using a conversion ratio and payment method as defined in the debenture agreement.
The following tables summarizes the fair value and conversion value of our convertible debentures, and the estimated increase in the fair value and conversion value with a hypothetical 10% increase in the stock price of $17.32 as of September 30, 2018 (dollars in millions):
September 30, 2018 | |||||||
Fair value | Conversion value | Increase to fair value | Increase to conversion value | ||||
2.75% 2031 Debentures | $46.4 | $25.0 | $0.1 | $2.5 | |||
1.5% 2035 Debentures | $267.8 | $196.5 | $9.7 | $19.7 | |||
1.0% 2035 Debentures | $634.1 | $430.4 | $19.9 | $43.0 | |||
1.25 % 2025 Debentures | $361.0 | $272.9 | $19.1 | $27.3 | |||
Item 8. | Financial Statements and Supplementary Data |
Nuance Communications, Inc. Consolidated Financial Statements
46
NUANCE COMMUNICATIONS, INC.
INDEX TO CONSOLIDATED FINANCIAL STATEMENTS
Page | |
47
REPORT OF INDEPENDENT REGISTERED PUBLIC ACCOUNTING FIRM
Stockholders and Board of Directors
Nuance Communications, Inc.
Burlington, Massachusetts
Opinion on the Consolidated Financial Statements
We have audited the accompanying consolidated balance sheets of Nuance Communications, Inc. (the “Company”) and subsidiaries as of September 30, 2018 and 2017, the related consolidated statements of operations and comprehensive loss, stockholders’ equity, and cash flows for each of the three years in the period ended September 30, 2018, and the related notes (collectively referred to as the “consolidated financial statements”). In our opinion, the consolidated financial statements present fairly, in all material respects, the financial position of the Company and subsidiaries at September 30, 2018 and 2017, and the results of their operations and their cash flows for each of the three years in the period ended September 30, 2018, in conformity with accounting principles generally accepted in the United States of America.
We also have audited, in accordance with the standards of the Public Company Accounting Oversight Board (United States) (“PCAOB”), the Company's internal control over financial reporting as of September 30, 2018, based on criteria established in Internal Control - Integrated Framework (2013) issued by the Committee of Sponsoring Organizations of the Treadway Commission (“COSO”) and our report dated November 20, 2018 expressed an unqualified opinion thereon.
Basis for Opinion
These consolidated financial statements are the responsibility of the Company’s management. Our responsibility is to express an opinion on the Company’s consolidated financial statements based on our audits. We are a public accounting firm registered with the PCAOB” and are required to be independent with respect to the Company in accordance with the U.S. federal securities laws and the applicable rules and regulations of the Securities and Exchange Commission and the PCAOB.
We conducted our audits in accordance with the standards of the PCAOB. Those standards require that we plan and perform the audit to obtain reasonable assurance about whether the consolidated financial statements are free of material misstatement, whether due to error or fraud.
Our audits included performing procedures to assess the risks of material misstatement of the consolidated financial statements, whether due to error or fraud, and performing procedures that respond to those risks. Such procedures included examining, on a test basis, evidence regarding the amounts and disclosures in the consolidated financial statements. Our audits also included evaluating the accounting principles used and significant estimates made by management, as well as evaluating the overall presentation of the consolidated financial statements. We believe that our audits provide a reasonable basis for our opinion.
BDO USA, LLP | |
We have served as the Company's auditor since 2004.
Boston, Massachusetts
November 20, 2018
48
REPORT OF INDEPENDENT REGISTERED PUBLIC ACCOUNTING FIRM
Stockholders and Board of Directors
Nuance Communications, Inc.
Burlington, Massachusetts
Opinion on Internal Control over Financial Reporting
We have audited Nuance Communication, Inc.’s (the “Company’s”) internal control over financial reporting as of September 30, 2018, based on criteria established in Internal Control - Integrated Framework (2013) issued by the Committee of Sponsoring Organizations of the Treadway Commission (the “COSO criteria”). In our opinion, the Company maintained, in all material respects, effective internal control over financial reporting as of September 30, 2018 based on the COSO criteria.
We also have audited, in accordance with the standards of the Public Company Accounting Oversight Board (United States) (“PCAOB”), the consolidated balance sheets of the Company as of September 30, 2018 and 2017, the related consolidated statements of operations and comprehensive loss, stockholders’ equity, and cash flows for each of the three years in the period ended September 30, 2018, and the related notes and our report dated November 20, 2018 expressed an unqualified opinion thereon.
Basis for Opinion
The Company’s management is responsible for maintaining effective internal control over financial reporting and for its assessment of the effectiveness of internal control over financial reporting, included in the accompanying Item 9A, Management’s Report on Internal Control over Financial Reporting. Our responsibility is to express an opinion on the Company’s internal control over financial reporting based on our audit. We are a public accounting firm registered with the PCAOB and are required to be independent with respect to the Company in accordance with U.S. federal securities laws and the applicable rules and regulations of the Securities and Exchange Commission and the PCAOB.
We conducted our audit of internal control over financial reporting in accordance with the standards of the PCAOB. Those standards require that we plan and perform the audit to obtain reasonable assurance about whether effective internal control over financial reporting was maintained in all material respects. Our audit included obtaining an understanding of internal control over financial reporting, assessing the risk that a material weakness exists, and testing and evaluating the design and operating effectiveness of internal control based on the assessed risk. Our audit also included performing such other procedures as we considered necessary in the circumstances. We believe that our audit provides a reasonable basis for our opinion.
Definition and Limitations of Internal Control over Financial Reporting
A company’s internal control over financial reporting is a process designed to provide reasonable assurance regarding the reliability of financial reporting and the preparation of financial statements for external purposes in accordance with generally accepted accounting principles. A company’s internal control over financial reporting includes those policies and procedures that (1) pertain to the maintenance of records that, in reasonable detail, accurately and fairly reflect the transactions and dispositions of the assets of the company; (2) provide reasonable assurance that transactions are recorded as necessary to permit preparation of financial statements in accordance with generally accepted accounting principles, and that receipts and expenditures of the company are being made only in accordance with authorizations of management and directors of the company; and (3) provide reasonable assurance regarding prevention or timely detection of unauthorized acquisition, use, or disposition of the company’s assets that could have a material effect on the financial statements.
Because of its inherent limitations, internal control over financial reporting may not prevent or detect misstatements. Also, projections of any evaluation of effectiveness to future periods are subject to the risk that controls may become inadequate because of changes in conditions, or that the degree of compliance with the policies or procedures may deteriorate.
BDO USA, LLP | |
Boston, Massachusetts
November 20, 2018
49
NUANCE COMMUNICATIONS, INC.
CONSOLIDATED STATEMENTS OF OPERATIONS
Year Ended September 30, | |||||||||||
2018 | 2017 | 2016 | |||||||||
(In thousands, except per share amounts) | |||||||||||
Revenues: | |||||||||||
Professional services and hosting | $ | 1,049,448 | $ | 976,893 | $ | 955,329 | |||||
Product and licensing | 684,230 | 635,391 | 669,227 | ||||||||
Maintenance and support | 317,983 | 327,078 | 324,347 | ||||||||
Total revenues | 2,051,661 | 1,939,362 | 1,948,903 | ||||||||
Cost of revenues: | |||||||||||
Professional services and hosting | 681,516 | 660,849 | 626,168 | ||||||||
Product and licensing | 77,086 | 74,004 | 86,379 | ||||||||
Maintenance and support | 58,095 | 54,094 | 54,077 | ||||||||
Amortization of intangible assets | 56,873 | 64,853 | 62,876 | ||||||||
Total cost of revenues | 873,570 | 853,800 | 829,500 | ||||||||
Gross profit | 1,178,091 | 1,085,562 | 1,119,403 | ||||||||
Operating expenses: | |||||||||||
Research and development | 305,323 | 266,097 | 271,130 | ||||||||
Sales and marketing | 388,305 | 398,130 | 390,866 | ||||||||
General and administrative | 229,774 | 166,677 | 168,473 | ||||||||
Amortization of intangible assets | 91,093 | 113,895 | 108,021 | ||||||||
Acquisition-related costs, net | 16,101 | 27,740 | 17,166 | ||||||||
Restructuring and other charges, net | 63,498 | 61,054 | 25,224 | ||||||||
Impairment of goodwill and other intangible assets | 170,941 | — | — | ||||||||
Total operating expenses | 1,265,035 | 1,033,593 | 980,880 | ||||||||
(Loss) income from operations | (86,944 | ) | 51,969 | 138,523 | |||||||
Other income (expense): | |||||||||||
Interest income | 9,327 | 6,922 | 4,438 | ||||||||
Interest expense | (137,253 | ) | (156,889 | ) | (132,732 | ) | |||||
Other expense, net | (1,865 | ) | (21,017 | ) | (8,490 | ) | |||||
(Loss) income before income taxes | (216,735 | ) | (119,015 | ) | 1,739 | ||||||
(Benefit) provision for income taxes | (56,807 | ) | 31,981 | 14,197 | |||||||
Net loss | $ | (159,928 | ) | $ | (150,996 | ) | $ | (12,458 | ) | ||
Net loss per share: | |||||||||||
Basic | $ | (0.55 | ) | $ | (0.52 | ) | $ | (0.04 | ) | ||
Diluted | $ | (0.55 | ) | $ | (0.52 | ) | $ | (0.04 | ) | ||
Weighted average common shares outstanding: | |||||||||||
Basic | 291,318 | 289,348 | 292,129 | ||||||||
Diluted | 291,318 | 289,348 | 292,129 | ||||||||
See accompanying notes.
50
NUANCE COMMUNICATIONS, INC.
CONSOLIDATED STATEMENTS OF COMPREHENSIVE LOSS
Year Ended September 30, | |||||||||||
2018 | 2017 | 2016 | |||||||||
(In thousands) | |||||||||||
Net loss | $ | (159,928 | ) | $ | (150,996 | ) | $ | (12,458 | ) | ||
Other comprehensive income (loss): | |||||||||||
Foreign currency translation adjustment | (23,973 | ) | 13,027 | 2,421 | |||||||
Pension adjustments | 2,644 | 1,774 | (1,741 | ) | |||||||
Unrealized (loss) gain on marketable securities | (192 | ) | (9 | ) | 131 | ||||||
Total other comprehensive (loss) income, net | (21,521 | ) | 14,792 | 811 | |||||||
Comprehensive loss | $ | (181,449 | ) | $ | (136,204 | ) | $ | (11,647 | ) | ||
See accompanying notes.
51
NUANCE COMMUNICATIONS, INC.
CONSOLIDATED BALANCE SHEETS
September 30, 2018 | September 30, 2017 | ||||||
(In thousands, except per share amounts) | |||||||
ASSETS | |||||||
Current assets: | |||||||
Cash and cash equivalents | $ | 315,963 | $ | 592,299 | |||
Marketable securities | 135,579 | 251,981 | |||||
Accounts receivable, less allowances for doubtful accounts of $11,724 and $14,333 | 378,832 | 395,392 | |||||
Prepaid expenses and other current assets | 98,257 | 88,269 | |||||
Total current assets | 928,631 | 1,327,941 | |||||
Marketable securities | 21,932 | 29,844 | |||||
Land, building and equipment, net | 155,894 | 176,548 | |||||
Goodwill | 3,504,457 | 3,590,608 | |||||
Intangible assets, net | 549,508 | 664,474 | |||||
Other assets | 141,957 | 142,508 | |||||
Total assets | $ | 5,302,379 | $ | 5,931,923 | |||
LIABILITIES AND STOCKHOLDERS’ EQUITY | |||||||
Current liabilities: | |||||||
Current portion of long-term debt | $ | — | $ | 376,121 | |||
Contingent and deferred acquisition payments | 14,211 | 28,860 | |||||
Accounts payable (including $416 due to a related party as of September 30, 2018, as more fully described in Note 19) | 84,516 | 94,604 | |||||
Accrued expenses and other current liabilities | 281,644 | 245,901 | |||||
Deferred revenue | 383,793 | 366,042 | |||||
Total current liabilities | 764,164 | 1,111,528 | |||||
Long-term debt | 2,185,361 | 2,241,283 | |||||
Deferred revenue, net of current portion | 489,177 | 423,929 | |||||
Deferred tax liabilities | 49,931 | 131,320 | |||||
Other liabilities | 96,250 | 92,481 | |||||
Total liabilities | 3,584,883 | 4,000,541 | |||||
Commitments and contingencies (Note 16) | |||||||
Stockholders’ equity: | |||||||
Common stock, $0.001 par value per share; 560,000 shares authorized; 291,504 and 293,938 shares issued and 287,753 and 290,187 shares outstanding, respectively | 291 | 294 | |||||
Additional paid-in capital | 2,597,693 | 2,629,245 | |||||
Treasury stock, at cost (3,751 shares) | (16,788 | ) | (16,788 | ) | |||
Accumulated other comprehensive loss | (122,863 | ) | (101,342 | ) | |||
Accumulated deficit | (740,837 | ) | (580,027 | ) | |||
Total stockholders’ equity | 1,717,496 | 1,931,382 | |||||
Total liabilities and stockholders’ equity | $ | 5,302,379 | $ | 5,931,923 | |||
See accompanying notes.
52
NUANCE COMMUNICATIONS, INC.
CONSOLIDATED STATEMENTS OF STOCKHOLDERS’ EQUITY
Accumulated | |||||||||||||||||||||||||||||
Common Stock | Additional Paid-In Capital | Treasury Stock | Other Comprehensive Loss | Accumulated Deficit | Total Stockholders' Equity | ||||||||||||||||||||||||
Shares | Amount | Shares | Amount | ||||||||||||||||||||||||||
(In thousands) | |||||||||||||||||||||||||||||
Balance at September 30, 2015 | 313,531 | $ | 314 | $ | 2,815,244 | 3,751 | $ | (16,788 | ) | $ | (116,945 | ) | $ | (416,573 | ) | $ | 2,265,252 | ||||||||||||
Issuance of common stock under employee stock plans | 11,131 | 11 | 16,839 | — | — | — | — | 16,850 | |||||||||||||||||||||
Cancellation of restricted stock, and repurchase of common stock at cost for employee tax withholding | (3,619 | ) | (4 | ) | (68,666 | ) | — | — | — | — | (68,670 | ) | |||||||||||||||||
Stock-based compensation | — | — | 162,884 | — | — | — | — | 162,884 | |||||||||||||||||||||
Repurchase and retirement of common stock | (35,753 | ) | (36 | ) | (698,658 | ) | — | — | — | — | (698,694 | ) | |||||||||||||||||
Net issuance of common stock in connection with acquisitions and collaboration agreements | 6,094 | 6 | 89,785 | — | — | — | — | 89,791 | |||||||||||||||||||||
Equity portion of convertible debt issuance/retirement, net of tax effect | — | — | 175,564 | — | — | — | — | 175,564 | |||||||||||||||||||||
Net loss | — | — | — | — | — | — | (12,458 | ) | (12,458 | ) | |||||||||||||||||||
Other comprehensive loss | — | — | — | — | — | 811 | — | 811 | |||||||||||||||||||||
Balance at September 30, 2016 | 291,384 | 291 | 2,492,992 | 3,751 | (16,788 | ) | (116,134 | ) | (429,031 | ) | 1,931,330 | ||||||||||||||||||
Issuance of common stock under employee stock plans | 10,709 | 11 | 17,372 | — | — | — | — | 17,383 | |||||||||||||||||||||
Cancellation of restricted stock, and repurchase of common stock at cost for employee tax withholding | (3,377 | ) | (3 | ) | (55,129 | ) | — | — | — | — | (55,132 | ) | |||||||||||||||||
Stock-based compensation | — | — | 160,575 | — | — | — | — | 160,575 | |||||||||||||||||||||
Repurchase and retirement of common stock | (5,797 | ) | (6 | ) | (99,071 | ) | — | — | — | — | (99,077 | ) | |||||||||||||||||
Net issuance of common stock in connection with acquisitions and charitable contributions | 1,019 | 1 | 16,346 | — | — | — | — | 16,347 | |||||||||||||||||||||
Equity portion of convertible debt issuance/retirement, net of tax effect | — | — | 96,160 | — | — | — | — | 96,160 | |||||||||||||||||||||
Net loss | — | — | — | — | — | — | (150,996 | ) | (150,996 | ) | |||||||||||||||||||
Other comprehensive income | — | — | — | — | — | 14,792 | — | 14,792 | |||||||||||||||||||||
Balance at September 30, 2017 | 293,938 | 294 | 2,629,245 | 3,751 | (16,788 | ) | (101,342 | ) | (580,027 | ) | 1,931,382 | ||||||||||||||||||
Prior period adjustment related to early adoption of ASU 2016-16 | — | — | — | — | — | (882 | ) | (882 | ) | ||||||||||||||||||||
Issuance of common stock under employee stock plans | 10,568 | 10 | 18,374 | — | — | — | — | 18,384 | |||||||||||||||||||||
Cancellation of restricted stock, and repurchase of common stock at cost for employee tax withholding | (3,304 | ) | (3 | ) | (52,333 | ) | — | — | — | — | (52,336 | ) | |||||||||||||||||
Stock-based compensation | — | — | 138,487 | — | — | — | — | 138,487 | |||||||||||||||||||||
Repurchase and retirement of common stock | (9,698 | ) | (10 | ) | (136,080 | ) | — | — | — | — | (136,090 | ) | |||||||||||||||||
Net loss | — | — | — | — | — | — | (159,928 | ) | (159,928 | ) | |||||||||||||||||||
Other comprehensive income | — | — | — | — | — | (21,521 | ) | — | (21,521 | ) | |||||||||||||||||||
Balance at September 30, 2018 | 291,504 | $ | 291 | $ | 2,597,693 | 3,751 | $ | (16,788 | ) | $ | (122,863 | ) | $ | (740,837 | ) | $ | 1,717,496 | ||||||||||||
See accompanying notes.
53
NUANCE COMMUNICATIONS, INC.
CONSOLIDATED STATEMENTS OF CASH FLOWS
Year Ended September 30, | |||||||||||
2018 | 2017 | 2016 | |||||||||
(In thousands) | |||||||||||
Cash flows from operating activities: | |||||||||||
Net loss | $ | (159,928 | ) | $ | (150,996 | ) | $ | (12,458 | ) | ||
Adjustments to reconcile net loss to net cash provided by operating activities: | |||||||||||
Depreciation and amortization | 210,316 | 234,413 | 231,474 | ||||||||
Stock-based compensation | 150,785 | 154,272 | 163,828 | ||||||||
Non-cash interest expense | 49,091 | 59,295 | 47,105 | ||||||||
Deferred tax (benefit) provision | (87,217 | ) | 4,855 | (12,014 | ) | ||||||
(Gain) loss on extinguishment of debt | (348 | ) | 18,565 | 4,851 | |||||||
Impairment of goodwill and other intangible assets | 170,941 | — | — | ||||||||
Impairment of fixed assets | 10,550 | 16,351 | 2,480 | ||||||||
Other | 2,230 | 8,403 | (3,055 | ) | |||||||
Changes in operating assets and liabilities, excluding effects of acquisitions: | |||||||||||
Accounts receivable | 19,641 | (6,349 | ) | 25,450 | |||||||
Prepaid expenses and other assets | (20,389 | ) | (14,661 | ) | (9,645 | ) | |||||
Accounts payable | (14,315 | ) | (1,207 | ) | 38,206 | ||||||
Accrued expenses and other liabilities | 26,847 | 9,040 | 27,826 | ||||||||
Deferred revenue | 86,222 | 46,886 | 61,747 | ||||||||
Net cash provided by operating activities | 444,426 | 378,867 | 565,795 | ||||||||
Cash flows from investing activities: | |||||||||||
Capital expenditures | (48,845 | ) | (61,835 | ) | (54,883 | ) | |||||
Payments for business and technology acquisitions, net of cash acquired (including cash payments of $5,725 to a related party for fiscal 2018, see Note 19) | (110,170 | ) | (113,769 | ) | (172,763 | ) | |||||
Purchases of marketable securities and other investments | (201,995 | ) | (332,470 | ) | (117,640 | ) | |||||
Proceeds from sales and maturities of marketable securities and other investments | 323,695 | 173,864 | 82,285 | ||||||||
Net cash used in investing activities | (37,315 | ) | (334,210 | ) | (263,001 | ) | |||||
Cash flows from financing activities: | |||||||||||
Repayment and redemption of debt | (481,172 | ) | (634,055 | ) | (511,844 | ) | |||||
Proceeds from issuance of long-term debt, net of issuance costs | — | 837,482 | 959,358 | ||||||||
Payments for repurchase of common stock | (136,090 | ) | (99,077 | ) | (699,472 | ) | |||||
Acquisition payments with extended payment terms | (24,842 | ) | — | — | |||||||
Proceeds from issuance of common stock from employee stock plans | 18,384 | 17,383 | 16,850 | ||||||||
Payments for taxes related to net share settlement of equity awards | (55,396 | ) | (54,099 | ) | (68,636 | ) | |||||
Other financing activities | (1,232 | ) | (583 | ) | (1,371 | ) | |||||
Net cash (used in) provided by financing activities | (680,348 | ) | 67,051 | (305,115 | ) | ||||||
Effects of exchange rate changes on cash and cash equivalents | (3,099 | ) | (1,029 | ) | 4,492 | ||||||
Net (decrease) increase in cash and cash equivalents | (276,336 | ) | 110,679 | 2,171 | |||||||
Cash and cash equivalents at beginning of year | 592,299 | 481,620 | 479,449 | ||||||||
Cash and cash equivalents at end of year | $ | 315,963 | $ | 592,299 | $ | 481,620 | |||||
See accompanying notes.
54
1. | Organization and Presentation |
Nuance Communications, Inc. (“we,” “Nuance,” or “the Company”) is a leading provider of voice recognition and natural language understanding solutions. We work with companies around the world, from banks and hospitals to airlines, telecommunications carriers, and automotive manufacturers and suppliers, who use our solutions and technologies to create better experiences for their customers and their users by enhancing the users' experience, increasing productivity and customer satisfaction. We offer our customers high accuracy in automated speech recognition, capabilities for natural language understanding, dialog and information management, biometric speaker authentication, text-to-speech, optical character recognition capabilities, and domain knowledge, along with professional services and implementation support. Using advanced analytics and algorithms, our technologies create personalized experiences and transform the way people interact with information and the technology around them. We market and sell our solutions and technologies around the world directly through a dedicated sales force, through our e-commerce website and also through a global network of resellers, including system integrators, independent software vendors, value-added resellers, distributors, hardware vendors, and telecommunications carriers. We have five reportable segments: Healthcare, Enterprise, Automotive, Imaging and Other. See Note 20 for a description of each of these segments.
2. Summary of Significant Accounting Policies
Use of Estimates
The consolidated financial statements are prepared in accordance with United States ("U.S.") generally accepted accounting principles ("GAAP"), which requires management to make estimates and assumptions. These estimates, judgments and assumptions can affect the reported amounts in the financial statements and the footnotes thereto. Actual results could differ materially from these estimates. On an ongoing basis, we evaluate our estimates, assumptions and judgments. Significant estimates inherent to the preparation of financial statements include: revenue recognition; the allowances for doubtful accounts and sales returns; accounting for deferred costs; accounting for internally developed software; the valuation of goodwill and intangible assets; accounting for business combinations, including contingent consideration; accounting for stock-based compensation; accounting for derivative instruments; accounting for income taxes and related valuation allowances; and loss contingencies. We base our estimates on historical experience, market participant fair value considerations, projected future cash flows, and various other factors that are believed to be reasonable under the circumstances. Actual amounts could differ significantly from these estimates.
Basis of Consolidation
The consolidated financial statements include our accounts and those of our wholly-owned domestic and foreign subsidiaries. Intercompany transactions and balances have been eliminated.
Revenue Recognition
We derive revenue from the following sources: (1) software license agreements, including royalty and other usage-based arrangements, (2) professional services, (3) hosting services and (4) post-contract customer support ("PCS"). Our hosting services are generally provided through on-demand, usage-based or per transaction fee arrangements. Generally, we recognize revenue when (i) persuasive evidence of an arrangement exists, (ii) delivery has occurred, (iii) the fee is fixed or determinable and (iv) collectibility is probable. Our revenue recognition policies for these revenue streams are discussed below.
The sale and/or license of software solutions and technology is deemed to have occurred when a customer either has taken possession of or has access to take immediate possession of the software or technology. In select situations, we sell or license intellectual property in conjunction with, or in place of, embedding our intellectual property in software. We also have non-software arrangements including hosting services where the customer does not take possession of the software at the outset of the arrangement either because they have no contractual right to do so or because significant penalties preclude them from doing so.
Revenue from royalties on sales of our software products by original equipment manufacturers (“OEMs”), where no services are included, is recognized in the quarter earned so long as we have been notified by the OEM that such royalties are due, and provided that all other revenue recognition criteria are met.
Software arrangements generally include PCS, which includes telephone support and the right to receive unspecified upgrades/enhancements on a when-and-if-available basis, typically for one to five years. Revenue from PCS is generally recognized ratably on a straight-line basis over the term that the maintenance service is provided. When PCS renews automatically, we provide a reserve based on historical experience for contracts expected to be canceled for non-payment. All known and estimated cancellations are recorded as a reduction to revenue and accounts receivable.
55
NUANCE COMMUNICATIONS, INC.
NOTES TO CONSOLIDATED FINANCIAL STATEMENTS — (Continued)
For our software and software-related multiple element arrangements, where customers purchase both software related products and software related services, we use vendor-specific objective evidence (“VSOE”) of fair value for software and software-related services to separate the elements and account for them separately. VSOE exists when a company can support the fair value of its software and/or software-related services based on evidence of the prices charged when the same elements are sold separately. For the undelivered elements, VSOE of fair value is required in order to separate the accounting for various elements in a software and related services arrangement. We have established VSOE of fair value for the majority of our PCS, professional services, and training.
When we provide professional services considered essential to the functionality of the software, we recognize revenue from the professional services as well as any related software licenses on a percentage-of-completion basis whereby the arrangement consideration is recognized as the services are performed, as measured by an observable input. In these circumstances, we separate license revenue from professional service revenue for income statement presentation by allocating VSOE of fair value of the professional services as professional services and hosting revenue and the residual portion as product and licensing revenue. We generally determine the percentage-of-completion by comparing the labor hours incurred to-date to the estimated total labor hours required to complete the project. We consider labor hours to be the most reliable, available measure of progress on these projects. Adjustments to estimates to complete are made in the periods in which facts resulting in a change become known. When the estimate indicates that a loss will be incurred, such loss is recorded in the period identified. Significant judgments and estimates are involved in determining the percentage of completion of each contract. Different assumptions could yield materially different results.
We offer some of our products via a Software-as-a-Service ("SaaS") model also known as a hosting model. In this type of arrangement, we are compensated in three ways: (1) fees for up-front setup of the service environment, (2) fees charged on a usage or per transaction basis, and (3) fees charged for on-demand service. Our up-front setup fees are nonrefundable. We recognize the up-front setup fees ratably over the longer of the contract lives or the expected lives of the customer relationships. The usage-based or per transaction fees are due and payable as each individual transaction is processed through the hosting service and is recognized as revenue in the period the services are provided. The on-demand service fees are recognized ratably over our estimate of the useful life of devices on which the hosting service is provided.
We enter into multiple-element arrangements that may include a combination of our various software related and non-software related products and services offerings including software licenses, PCS, professional services, and our hosting services. In such arrangements, we allocate total arrangement consideration to software or software-related elements and any non-software element separately based on the selling price hierarchy group following our policies. Where possible, we determine the selling price for each deliverable using VSOE of selling price, if it exists, or Third Party Evidence (“TPE”) of selling price. Typically, we are unable to determine TPE of selling price. Therefore, when neither VSOE nor TPE of selling price exist for a deliverable, we use our Estimate of Selling Price (“ESP”) for the purposes of allocating the arrangement consideration. We determine ESP for a product or service by considering multiple factors including, but not limited to, major project groupings, market conditions, competitive landscape, price list and discounting practices. Revenue allocated to each element is then recognized when the basic revenue recognition criteria are met for each element.
When products are sold through distributors or resellers, title and risk of loss generally passes upon shipment, at which time the transaction is invoiced and the payment is due. Shipments to distributors and resellers without right of return are recognized as revenue upon shipment, provided all other revenue recognition criteria are met. Certain distributors and resellers have been granted rights of return for as long as the distributors or resellers hold the inventory. We cannot use historical returns from these distributors and resellers as a basis upon which to estimate future sales returns. As a result, we recognize revenue from sales to these distributors and resellers when the products are sold through to retailers and end-users.
When products are sold directly to retailers or end-users, we make an estimate of sales returns based on historical experience. The provision for these estimated returns is recorded as a reduction of revenue and accounts receivable at the time that the related revenue is recorded. If actual returns differ significantly from our estimates, such differences could have a material impact on our results of operations for the period in which the actual returns become known.
We record consideration given to a reseller as a reduction of revenue to the extent we have recorded cumulative revenue from the customer or reseller. However, when we receive an identifiable benefit in exchange for the consideration, and can reasonably estimate the fair value of the benefit received, the consideration is recorded as an operating expense.
56
NUANCE COMMUNICATIONS, INC.
NOTES TO CONSOLIDATED FINANCIAL STATEMENTS — (Continued)
We record reimbursements received for out-of-pocket expenses as revenue, with offsetting costs recorded as cost of revenue. Out-of-pocket expenses generally include, but are not limited to, expenses related to transportation, lodging and meals. We record shipping and handling costs billed to customers as revenue with offsetting costs recorded as cost of revenue.
Business Combinations
We determine and allocate the purchase price of an acquired company to the tangible and intangible assets acquired and liabilities assumed as of the date of acquisition. Results of operations and cash flows of acquired companies are included in our operating results from the date of acquisition. The purchase price allocation process requires us to use significant estimates and assumptions, which include:
• | estimated fair values of intangible assets; |
• | estimated fair values of legal performance commitments to customers, assumed from the acquiree under existing contractual obligations (classified as deferred revenue); |
• | estimated fair values of stock awards assumed from the acquiree that are included in the purchase price; |
• | estimated fair value of required payments under contingent consideration provisions; |
• | estimated income tax assets and liabilities assumed from the acquiree; and |
• | estimated fair value of pre-acquisition contingencies assumed from the acquiree. |
The fair value of any contingent consideration is established at the acquisition date and included in the total purchase price. The contingent consideration is then adjusted to fair value, with any measurement-period adjustment recorded against goodwill. Adjustments identified subsequent to the measurement period are recorded within Acquisition-related costs, net.
While we use our best estimates and assumptions as part of the purchase price allocation process to accurately value assets acquired and liabilities assumed at the business combination date, our estimates and assumptions are inherently uncertain and subject to refinement. As a result, during the measurement period, which is generally one year from the acquisition date, any adjustment to the assets acquired and liabilities assumed is recorded against goodwill in the period in which the amount is determined. Any adjustment identified subsequent to the measurement period is included in operating results in the period in which the amount is determined.
Goodwill
Goodwill represents the excess of the purchase price in a business combination over the fair value of net tangible and intangible assets acquired. Goodwill and intangible assets with indefinite lives are not amortized, but rather the carrying amounts of these assets are assessed for impairment at least annually or whenever events or changes in circumstances indicate that the carrying value of these assets may not be recoverable. Goodwill is tested for impairment annually on July 1, the first day of the fourth quarter of the fiscal year. In fiscal year 2017, we elected to early adopt ASU 2017-04, “Simplifying the Test for Goodwill Impairment” for its annual goodwill impairment test. ASU 2017-04 removes Step 2 of the goodwill impairment test requiring a hypothetical purchase price allocation. Goodwill impairment, if any, is determined by comparing the reporting unit's fair value to its carrying value. An impairment loss is recognized in an amount equal to the excess of the reporting unit's carrying value over its fair value, up to the amount of goodwill allocated to the reporting unit. There is no goodwill impairment for fiscal years 2017 and 2016. See Note 4 for the impairment charges recorded in fiscal year 2018.
For the purpose of testing goodwill for impairment, all goodwill acquired in a business combination is assigned to one or more reporting units. A reporting unit represents an operating segment or a component within an operating segment for which discrete financial information is available and is regularly reviewed by segment management for performance assessment and resource allocation. Components of similar economic characteristics are aggregated into one reporting unit for the purpose of goodwill impairment assessment. Reporting units are identified annually and re-assessed periodically for recent acquisitions or any changes in segment reporting structure.
Corporate assets and liabilities are allocated to each reporting unit based on the reporting unit’ revenue, total operating expenses or operating income as a percentage of the consolidated amounts. Corporate debt and other financial liabilities that are not directly attributable to the reporting unit's operations and would not be transferred to hypothetical purchasers of the reporting units are excluded from a reporting unit's carrying amount.
The fair value of a reporting unit is generally determined using a combination of the income approach and the market approach. For the income approach, fair value is determined based on the present value of estimated future after-tax cash flows, discounted
57
NUANCE COMMUNICATIONS, INC.
NOTES TO CONSOLIDATED FINANCIAL STATEMENTS — (Continued)
at an appropriate risk-adjusted rate. We use our internal forecasts to estimate future after-tax cash flows and estimate the long-term growth rates based on our most recent views of the long-term outlook for each reporting unit. Actual results may differ from those assumed in our forecasts. We derive our discount rates using a capital asset pricing model and analyzing published rates for industries relevant to our reporting units to estimate the weighted average cost of capital. We adjust the discount rates for the risks and uncertainty inherent in the respective businesses and in our internally developed forecasts. For the market approach, we use a valuation technique in which values are derived based on valuation multiples of comparable publicly traded companies. We assess each valuation methodology based upon the relevance and availability of the data at the time we perform the valuation and weight the methodologies appropriately.
Long-Lived Assets with Definite-Lives
Our long-lived assets consist principally of technology, customer relationships, internally developed software, land, and building and equipment. Customer relationships are amortized over their estimated economic lives based on the pattern of economic benefits expected to be generated from the use of the asset. Other definite-lived assets are amortized over their estimated economic lives using the straight-line method. The remaining useful lives of long-lived assets are re-assessed periodically for any events and circumstances that may change the future cash flows expected to be generated from the long-lived asset or asset group.
Internally developed software consists of capitalized costs incurred during the application development stage, which include costs related design of the software configuration and interfaces, coding, installation and testing. Costs incurred during the preliminary project stage and post-implementation stage are expensed as incurred. Internally developed software is amortized over the estimated useful life, commencing on the date when the asset is ready for its intended use. Land, building and equipment are stated at cost and depreciated over their estimated useful lives. Leasehold improvements are depreciated over the shorter of the related lease term or the estimated useful life. Depreciation is computed using the straight-line method. Repair and maintenance costs are expensed as incurred. The cost and related accumulated depreciation of sold or retired assets are removed from the accounts and any gain or loss is included in the results of operations for the period.
Long-lived assets with definite lives are tested for impairment whenever events or changes in circumstances indicate the carrying value of a specific asset or asset group may not be recoverable. We assess the recoverability of long-lived assets with definite-lives at the asset group level. Asset groups are determined based upon the lowest level for which identifiable cash flows are largely independent of the cash flows of other assets and liabilities. When the asset group is also a reporting unit, goodwill assigned to the reporting unit is also included in the carrying amount of the asset group. For the purpose of the recoverability test, we compare the total undiscounted future cash flows from the use and disposition of the assets with its net carrying amount. When the carrying value of the asset group exceeds the undiscounted future cash flows, the asset group is deemed to be impaired. The amount of the impairment loss represents the excess of the asset or asset group’s carrying value over its estimated fair value, which is generally determined based upon the present value of estimated future pre-tax cash flows that a market participant would expect from use and disposition of the long-lived asset or asset group. See Note 4 for the impairment charges recorded in fiscal year 2018.
Cash and Cash Equivalents
Cash and cash equivalents consists of cash on hand, including money market funds and time deposits with original maturities of 90 days or less.
Marketable Securities
Marketable securities consist of time deposits and high-quality corporate debt instruments with stated maturities of more than 90 days. Investments are classified as available-for-sale and are recorded on the balance sheet at fair value with unrealized gains or losses reported as a separate component of accumulated other comprehensive income (loss), net of tax.
Accounts Receivable Allowances
Allowances for Doubtful Accounts: We record allowances for doubtful accounts for the estimated probable losses on uncollectible accounts receivable. The allowance is based upon the credit worthiness of our customers, our historical experience, the age of the receivable and current market and economic conditions. Receivables are written off against these allowances in the period they are determined to be uncollectible.
Allowances for Sales Returns: We record allowances for sales returns from customers for which we have the ability to estimate returns based on historical experience. The returns allowance is recorded as a reduction to revenue and accounts receivable at the time the related revenue is recorded. Receivables are written off against the allowance in the period the return is received.
58
NUANCE COMMUNICATIONS, INC.
NOTES TO CONSOLIDATED FINANCIAL STATEMENTS — (Continued)
For the years ended September 30, 2018, 2017 and 2016, the activity related to accounts receivable allowances was as follows (dollars in thousands):
Allowance for Doubtful Accounts | Allowance for Sales Returns | ||||||
Balance at September 30, 2015 | $ | 9,184 | $ | 8,172 | |||
Bad debt provision | 3,103 | — | |||||
Write-offs, net of recoveries | (1,249 | ) | — | ||||
Revenue adjustments, net | — | (616 | ) | ||||
Balance at September 30, 2016 | 11,038 | 7,556 | |||||
Bad debt provisions | 3,792 | — | |||||
Write-offs, net of recoveries | (497 | ) | — | ||||
Revenue adjustments, net (a) | — | 27,750 | |||||
Balance at September 30, 2017 | 14,333 | 35,306 | |||||
Bad debt provisions | 2,666 | — | |||||
Write-offs, net of recoveries | (5,275 | ) | — | ||||
Revenue adjustments, net (b) | — | (23,982 | ) | ||||
Balance at September 30, 2018 | $ | 11,724 | $ | 11,324 | |||
(a) The increase in provisions primarily relates to accommodations made to our customers in connection with our Healthcare transcription service interruption due to the global NotPetya malware incident (the "2017 Malware Incident")
(b) The decrease in provisions was primarily due to the resolution of the reserves related to the 2017 Malware Incident.
Inventories
Inventories are stated at the lower of cost, computed using the first-in, first-out method, or market value and are included in other current assets. We regularly review inventory quantities on hand and record a provision for excess and/or obsolete inventory primarily based on future purchase commitments with our suppliers, and the estimated utility of our inventory as well as other factors including technological changes and new product development. Inventories are included within Prepaid expenses and other current assets on the Consolidated balance sheets.
Inventories, net of allowances, consisted of the following (dollars in thousands):
September 30, 2018 | September 30, 2017 | ||||||
Components and parts | $ | 6,948 | $ | 5,684 | |||
Finished products | 610 | 404 | |||||
Total Inventories | $ | 7,558 | $ | 6,088 | |||
Research and Development Expenses
Research and development costs related to software that is or will be sold or licensed externally to third-parties, or for which a substantive plan exists to sell or license such software in the future, incurred subsequent to the establishment of technological feasibility, but prior to the general release of the product, are capitalized and amortized to cost of revenue over the estimated useful life of the related products. We have determined that technological feasibility is reached shortly before the general release of our software products. Costs incurred after technological feasibility is established have not been material. We expense research and development costs as incurred.
Acquisition-Related Costs, net
Acquisition-related costs include costs related to business and other acquisitions, including potential acquisitions. These costs consist of (i) transition and integration costs, including retention payments, transitional employee costs and earn-out payments, and other costs related to integration activities; (ii) professional service fees, including financial advisory, legal, accounting, and
59
NUANCE COMMUNICATIONS, INC.
NOTES TO CONSOLIDATED FINANCIAL STATEMENTS — (Continued)
other outside services incurred in connection with acquisition activities, and disputes and regulatory matters related to acquired entities; and (iii) fair value adjustments to acquisition-related contingencies.
The components of acquisition-related costs, net are as follows (dollars in thousands):
2018 | 2017 | 2016 | |||||||||
Transition and integration costs | $ | 16,067 | $ | 15,224 | $ | 6,070 | |||||
Professional service fees | 3,450 | 12,622 | 10,876 | ||||||||
Acquisition-related adjustments | (3,416 | ) | (106 | ) | 220 | ||||||
Total | $ | 16,101 | $ | 27,740 | $ | 17,166 | |||||
Advertising Costs
Advertising costs are expensed as incurred and recorded within sales and marketing expenses. The advertising costs capitalized as of September 30, 2018 and 2017 are de minimis. We incurred advertising costs of $19.5 million, $22.8 million and $27.8 million for fiscal years 2018, 2017 and 2016, respectively.
Convertible Debt
We bifurcate the debt and equity (the contingently convertible feature) components of our convertible debt instruments in a manner that reflects our nonconvertible debt borrowing rate at the time of issuance. The equity components of our convertible debt instruments are recorded within stockholders’ equity with an allocated issuance premium or discount. The debt issuance premium or discount is amortized to interest expense in our consolidated statement of operations using the effective interest method over the expected term of the convertible debt.
Income Taxes
Deferred tax assets and liabilities are recognized for the estimated future tax consequences attributable to differences between the carrying amounts of assets and liabilities and their respective tax bases. This method also requires the recognition of future tax benefits related to net operating loss carryforwards, to the extent that realization of such benefits is more likely than not after consideration of all available evidence. Deferred tax assets and liabilities are measured using the expected enacted tax rates applicable to the taxable income in the future periods in which those temporary differences are expected to be recovered or settled. We do not accrue income taxes for foreign earnings that are expected to be indefinitely reinvested.
We regularly review our deferred tax assets for recoverability considering historical profitability, projected future taxable income, the expected timing of the reversals of existing temporary differences and tax planning strategies. In assessing the need for a valuation allowance, we consider both positive and negative evidence related to the likelihood of realization of the deferred tax assets. The weights assigned to the positive and negative evidences are commensurate with the extent to which the evidence may be objectively verified. If positive evidence regarding projected future taxable income, exclusive of reversing taxable temporary differences, existed it would be difficult for it to outweigh objective negative evidence of recent financial reporting losses. Generally, cumulative loss in recent years is a significant piece of negative evidence that is difficult to overcome in determining that a valuation allowance is not needed.
As of September 30, 2018 and 2017, valuation allowances have been established for all U.S. and for certain foreign deferred tax assets which we believe do not meet the “more likely than not” criteria for recognition. If we are subsequently able to utilize all or a portion of the deferred tax assets for which a valuation allowance has been established, then we may be required to recognize these deferred tax assets through the reduction of the valuation allowance which could result in a material benefit to our results of operations in the period in which the benefit is determined.
60
NUANCE COMMUNICATIONS, INC.
NOTES TO CONSOLIDATED FINANCIAL STATEMENTS — (Continued)
Accumulated Other Comprehensive Loss
The components of accumulated other comprehensive loss, reflected in the consolidated statements of stockholders’ equity, consisted of the following (dollars in thousands):
2018 | 2017 | 2016 | |||||||||
Foreign currency translation adjustment | $ | (118,220 | ) | $ | (94,247 | ) | $ | (107,274 | ) | ||
Unrealized (losses) gains on marketable securities | (115 | ) | 77 | 86 | |||||||
Net unrealized losses on post-retirement benefits | (4,528 | ) | (7,172 | ) | (8,946 | ) | |||||
Accumulated other comprehensive loss | $ | (122,863 | ) | $ | (101,342 | ) | $ | (116,134 | ) | ||
No income tax provisions or benefits is recorded for foreign currency translation adjustment as the undistributed earnings in our foreign subsidiaries are expected to be indefinitely reinvested.
Concentration of Risk
Financial instruments that are potentially subject to significant concentrations of credit risk principally consist of cash, cash equivalents, marketable securities and trade accounts receivable. We place our cash and cash equivalents and marketable securities with financial institutions with high credit ratings. As part of our cash and investment management processes, we perform periodic evaluations of the credit standing of the financial institutions with whom we maintain deposits, and have not recorded any credit losses to-date. For trade accounts receivable, we perform ongoing credit evaluations of our customers’ financial condition and limit the amount of credit extended when deemed appropriate. No customer accounted for more than 10% of our net accounts receivable balance at September 30, 2018 and 2017 or 10% of our revenue for fiscal years 2018, 2017 or 2016.
Foreign Currency Translation
The functional currency of a foreign subsidiary is generally the local currency. We translate the financial statements of foreign subsidiaries to U.S. dollars using month-end exchange rates for assets and liabilities, and average rates for the reporting period for revenues, costs, and expenses. We record translation gains and losses in accumulated other comprehensive loss as a component of stockholders’ equity. We record net foreign exchange transaction gains and losses resulting from the conversion of the transaction currency to the functional currency within in other expense, net. Foreign currency transaction losses for fiscal years 2018, 2017 and 2016 were $1.1 million, $1.4 million and $1.5 million, respectively.
Financial Instruments and Hedging Activities
We use forward currency exchange contracts to manage our exposure to fluctuations in foreign currency for certain transactions. In order for instruments to be designated as hedges, specific criteria must be met, including (i) formal documentation must exist for both the hedging relationship and our risk management objectives and strategies for undertaking the hedging activities, (ii) at the inception and on an ongoing basis, the hedging relationship is expected to be highly effective in offsetting changes in fair value attributed to the hedged risk during the period that the hedge is designated, and (iii) an assessment of effectiveness is required whenever financial statements or earnings are reported.
The effective portion of changes in the fair values of contracts designated as cash flow hedges is recorded in equity as a component of accumulated other comprehensive income (loss) until the hedged item effects earnings. Once the underlying forecasted transaction is realized, the changes of fair vales of instruments designated as hedges reclassified from accumulated other comprehensive loss to the statement of operations, in the appropriate income statement line items. Any ineffective portion of the instruments designated as cash flow hedges is recognized in current earnings. We report cash flows arising from derivative financial instruments designated as fair value or cash flow hedges consistent with the classification of the cash flows from the underlying hedged items that these derivatives are hedging.
No forward exchange contracts are designated as hedges for fiscal year 2018, 2017, or 2016. Changes in the fair values of the forward currency exchange contracts are recorded within other expense, net. Cash flows related to investments and settlements of forward currency exchange contracts are included within cash flows from investing activities.
61
NUANCE COMMUNICATIONS, INC.
NOTES TO CONSOLIDATED FINANCIAL STATEMENTS — (Continued)
Stock-Based Compensation
We recognize stock-based compensation expense over the requisite service period, based on the grant date fair value of the awards and the number of the awards expected to be vested based upon service and performance conditions, net of forfeitures. The fair value of restricted stock units is determined based on the number of shares granted and the quoted price of our common stock, and the fair value of stock options is estimated on the date of grant using the Black-Scholes model. Historically, we recognized excess tax benefit within Additional Paid-in Capital to the extent that the benefit was utilized to reduce current tax payables. We record any tax effect related to stock-based awards through the consolidated statements of operations. Excess tax benefits are recognized as deferred tax assets upon settlement and are subject to regular review for valuation allowance.
Net Loss Per Share
Basic net loss or income per share is computed using the weighted-average number of common shares outstanding during the period. Diluted net income per share is computed using the weighted-average number of common shares, giving effect to potentially dilutive securities outstanding during the period. Potentially dilutive securities consist of stock options, restricted stock units, contingently issuable shares under earn-out agreements, and potential issuance of stock upon conversion of our convertible debentures, as more fully described in Note 9. In the event of conversion, each convertible debenture entitles the holder to receive in cash the principal amount with any accrued interest, and in cash or common stock, at our election, any excess of conversion value over the principal amount plus accrued interest. Therefore, only the shares of common stock potentially issuable upon conversion, if any, are considered dilutive to the weighted average common shares calculation.
For fiscal year 2018, 2017 and 2016, respectively, 9.1 million, 7.8 million, and 8.8 million shares of common stock equivalent securities were excluded from the computation of diluted net loss per share as the inclusion would be anti-dilutive due to the net loss reported for these periods.
Recently Adopted Accounting Standards
In October 2016, the Financial Accounting Standards Board ("FASB") issued Accounting Standards Update ("ASU") 2016-16, "Income Taxes (Topic 740): Intra-Entity Transfers of Assets Other Than Inventory" ("ASU 2016-16"), which requires income tax consequences of inter-company transfers of assets other than inventory to be recognized when the transfer occurs. ASU 2016-16 is effective for fiscal years beginning after December 15, 2017, with early adoption permitted. We early adopted the guidance during the first quarter of fiscal year 2018. As a result, deferred tax liabilities of $0.9 million arising from inter-company transfers in prior years were recognized and recorded against the beginning balance of accumulated deficit in the first quarter of fiscal year 2018. The adoption of the guidance did not have a material impact on our consolidated financial statements for any period presented.
Issued Accounting Standards Not Yet Adopted
From time to time, new accounting pronouncements are issued by the FASB and are adopted by us as of the specified effective dates. Unless otherwise discussed, such pronouncements did not have or will not have a significant impact on our consolidated financial position, results of operations or cash flows, or do not apply to our operations.
Revenue Recognition
In May 2014, the FASB issued ASU No. 2014-09, "Revenue from Contracts with Customers: Topic 606" ("ASU 2014-09"), under which revenue is recognized when a customer obtains control of promised goods or services in an amount that reflects the consideration the entity expects to receive for those goods or services. ASU 2014-09 defines a five-step process to achieve this core principle and, in doing so, it is possible more judgment and estimates may be required within the revenue recognition process than required under existing U.S. GAAP including identifying performance obligations in the contract, estimating the amount of variable consideration to include in the transaction price and allocating the transaction price to each separate performance obligation. ASU 2014-09 permits two methods of adoption: (i) retrospective to each prior reporting period presented; or (ii) retrospective with the cumulative effect of initially applying the guidance recognized at the date of initial application. In August 2015, the FASB issued ASU No. 2015-14, Revenue from Contracts with Customers: Deferral of the Effective Date, which deferred the effective date of the new revenue standard for periods beginning after December 15, 2016 to December 15, 2017, with early adoption permitted but not earlier than the original effective date. ASU 2014-09 is effective for us beginning on October 1, 2018 and we plan to adopt ASU 2014-09 using the cumulative catch-up transition method, with a cumulative adjustment to retained earnings as opposed to retrospectively adjusting prior periods.
62
NUANCE COMMUNICATIONS, INC.
NOTES TO CONSOLIDATED FINANCIAL STATEMENTS — (Continued)
In the first quarter of fiscal 2017, we commenced a project to assess the potential impact of the new standard on our consolidated financial statements and related disclosures. This project also included the assessment and enhancement of our internal processes, controls and systems to address the new standard.
While we are continuing to assess all potential impacts of ASU 2014-09, we currently believe the most significant impact relates to our accounting for arrangements that include term-based software licenses bundled with other performance obligations including (i) maintenance and support and (ii) professional services. A significant number of our Healthcare and Imaging customer contracts include term-based software licenses bundled with other performance obligations. Under current GAAP, the revenue attributable to these software licenses is recognized ratably over the term of the arrangement because vendor-specific objective evidence ("VSOE") does not exist for the undelivered maintenance and support element as it is not sold separately. Under ASU 2014-09, the requirement to have VSOE for undelivered elements to enable the separation of revenue for the delivered software licenses is eliminated. Accordingly, under the new standard we will be required to recognize term-based software revenue as control is transferred and based upon the amount proportionally allocated to the term-based software license from the contract transaction price. We do not currently expect ASU 2014-09 to have a significant effect on the timing of revenue related to our renewal maintenance, professional services and cloud offerings.
We currently expect to record a pre-tax cumulative adjustment to decrease deferred revenues by approximately $80 million to $110 million upon the adoption. The adjustment primarily relates to the timing of revenue recognition, as noted above, and the allocation of the transaction price to the performance obligations on a relative standalone selling price basis.
Additionally, the new guidance requires direct and incremental costs to acquire a contract be capitalized and amortized over the pattern of transfer of the goods and services to which the asset relates, whereas we expense sales commissions as incurred under the existing guidance. We expect to record a pre-tax cumulative adjustment to capitalize sales commission costs of approximately $35 million to $45 million upon the adoption, with a corresponding decrease to retained earnings. The tax effect of the adjustments have not been reflected in the amounts. We expect to complete our analysis for the impact of the implementation by December 31, 2018.
Leases
In February 2016, the FASB issued ASU No. 2016-02, "Leases" ("ASU 2016-02"), which will become effective for fiscal years beginning after December 15, 2018 and interim periods therein, with early adoption permitted. The guidance requires lessees to recognize on the balance sheet a right-of-use asset, representing its right to use the underlying asset for the lease term, and a lease liability for all leases with terms greater than 12 months. The accounting applied by the lessor is largely unchanged from that applied under the existing lease standard. The guidance also requires qualitative and quantitative disclosures designed to assess the amount, timing, and uncertainty of cash flows arising from leases. The guidance requires the use of a modified retrospective transition approach, which includes a number of optional practical expedients that entities may elect to apply. We are currently evaluating the impact of the guidance on our consolidated financial statements and related processes and internal controls. While we expect the implementation to result in the recognition of right-of-use assets and lease liabilities for most of our operating lease commitments, we do not expect the guidance to have material impact on our consolidated statements of cash flows.
In August 2018, the FASB issued Accounting Standards Updates ("ASU") 2018-15, "Intangibles—Goodwill and Other—Internal-Use Software (Subtopic 350-40): Customer’s Accounting for Implementation Costs Incurred in a Cloud Computing Arrangement That Is a Service Contract", which is effective for fiscal year beginning after December 15, 2019, and interim periods within those fiscal years, with early adoption permitted. The guidance requires that implementation costs related to a hosting arrangement that is a service contract be capitalized and amortized over the term of the hosting arrangement, starting when the module or component of the hosting arrangement is ready for its intended use. The guidance will be applied retrospectively to each period presented. We do not expect the implementation to have a material impact on our consolidated financial statements.
Other Accounting Pronouncements
In January 2018, the FASB issued ASU 2018-02, "Income Statement - Reporting Comprehensive Income (Topic 220): Reclassification of Certain Tax Effects from Accumulated Other Comprehensive Income ("AOCI"), which is effective for fiscal years beginning after December 15, 2018 and interim periods therein, with early adoption permitted. The guidance gives entities the option to reclassify to retained earnings the tax effects resulting from the Tax Cuts and Jobs Act ("TCJA") related to items in AOCI. The new guidance may be applied retrospectively to each period in which the effect of the Act is recognized in the period of adoption. We do not expect the implementation to have a material impact on our consolidated financial statements.
63
NUANCE COMMUNICATIONS, INC.
NOTES TO CONSOLIDATED FINANCIAL STATEMENTS — (Continued)
In August 2016, the FASB issued ASU 2016-15, "Statement of Cash Flows (Topic 230): Classification of Certain Cash Receipts and Cash Payments" ("ASU 2016-15"), which is effective for fiscal years beginning after December 15, 2017 and the interim periods therein, with early adoption permitted. The guidance requires cash flows with multiple characteristics to be classified using a three-step process, including (i) determining whether explicit guidance is applicable, (ii) separating each identifiable source or use of cash flows, and (iii) determining the predominant source or use of cash flows when the source or use of cash flows cannot be separately identifiable. The guidance will be applied retrospectively to each period presented. We do not expect the implementation to have a material impact on our consolidated financial statements.
In January 2016, the FASB issued ASU No. 2016-01, "Recognition and Measurement of Financial Assets and Financial Liabilities" ("ASU 2016-01"). ASU 2016-01 amends the guidance on the classification and measurement of financial instruments. Although ASU 2016-01 retains many current requirements, it significantly revises accounting related to the classification and measurement of investments in equity securities and the presentation of certain fair value changes for financial liabilities measured at fair value. ASU 2016-01 also amends certain disclosure requirements associated with the fair value of financial instruments and is effective for us in the first quarter of fiscal year 2019. Based on the composition of our investment portfolio, we do not believe the adoption of ASU 2016-01 will have a material impact on our consolidated financial statements.
3. Business Acquisitions
As part of our business strategy, we have acquired, and may acquire in the future, certain businesses and technologies primarily to expand our products and service offerings.
Fiscal Year 2018 Acquisitions
In fiscal year 2018, we completed several acquisitions in our Healthcare and Automotive segments for a total consideration of $129.5 million, including $114.6 million in cash, $2.0 million estimated fair value for future contingent payments, and effective settlement of preexisting relationship with the acquiree of $12.9 million. As a result, we recognized goodwill of $62.9 million, including immaterial measurement-period adjustments through September 30, 2018, and other intangible assets of $60.8 million, with a weighted average life of 6.0 years.
We are still finalizing the fair value estimates of assets acquired and liabilities assumed in these acquisitions. These fair value estimates are subject to change as we obtain additional information during the measurement periods up to one year from the acquisitions. There were no significant changes to the fair value estimates during fiscal year 2018.
We have not furnished pro forma financial information or the acquired entities' results of operations for the post-acquisition periods, as such acquisitions were not material, individually or in the aggregate, to our consolidated financial statements.
Fiscal Year 2017 Acquisitions
In fiscal year 2017, we acquired several businesses in our Enterprise, Healthcare and Other segments for a total consideration of $97.4 million, including $75.7 million in cash, issuance of 0.8 million shares of our common stock valued at $13.4 million, and $8.3 million estimated fair value for future contingent payments. As a result, we recognized goodwill of $62.3 million and other intangible assets of $39.1 million, with a weighted average life of 5.9 years. The results of operations of the acquired entities have been included within our consolidated results of operations from the acquisition dates. Such acquisitions were not significant individually or in the aggregate to our consolidated financial statements.
Fiscal Year 2016 Acquisitions
Acquisition of TouchCommerce, Inc.
In August 2016, we acquired all of the outstanding stock of TouchCommerce. TouchCommerce is a provider of omni-channel solutions to engage their customers on any device through online chat, guides, personalized content, and other automated tools, resulting in enhanced customer experience, increased revenue and reduced support costs. We expected this acquisition to expand our customer care solutions with a range of new digital engagement offerings, including live chat, customer analytics and personalization solutions within our Enterprise segment. We expected to be able to provide an end-to-end engagement platform that merges intelligent self-service with assisted service to increase customer satisfaction, strengthen customer loyalty and improve business results. The aggregate consideration for this transaction was $217.5 million, which included $132.5 million paid in cash and $85.0 million paid in our common stock. The acquisition was a stock purchase and the goodwill resulting from this acquisition is not deductible for tax purposes. The results of operations of TouchCommerce was included within our Enterprise segment from the acquisition date.
64
NUANCE COMMUNICATIONS, INC.
NOTES TO CONSOLIDATED FINANCIAL STATEMENTS — (Continued)
A summary of the final allocation of the purchase consideration for our TouchCommerce acquisition is as follows (dollars in thousands):
TouchCommerce | |||
Purchase consideration: | |||
Cash | $ | 113,008 | |
Common stock (a) | 85,000 | ||
Deferred acquisition payment | 19,458 | ||
Total purchase consideration | $ | 217,466 | |
Allocation of the purchase consideration: | |||
Cash | $ | 137 | |
Accounts receivable (b) | 14,897 | ||
Goodwill | 117,576 | ||
Identifiable intangible assets (c) | 110,800 | ||
Other assets | 1,521 | ||
Total assets acquired | 244,931 | ||
Current liabilities | (4,134 | ) | |
Deferred tax liability | (19,913 | ) | |
Deferred revenue | (2,784 | ) | |
Other long-term liabilities | (634 | ) | |
Total liabilities assumed | (27,465 | ) | |
Net assets acquired | $ | 217,466 | |
(a)5,749,807 shares of our common stock valued at $14.78 per share were issued at closing.
(b)Accounts receivable have been recorded at their estimated fair values and the fair value reserve was not material.
(c) | The following are the identifiable intangible assets acquired and their respective weighted average useful lives, as determined based on preliminary valuations (dollars in thousands): |
TouchCommerce | |||||
Amount | Weighted Average Life (Years) | ||||
Core and completed technology | $ | 26,000 | 6.0 | ||
Customer relationships | 81,600 | 10.0 | |||
Trade names | 3,200 | 5.0 | |||
Total | $ | 110,800 | |||
Other Fiscal Year 2016 Acquisitions
During fiscal year 2016, we acquired several businesses in our Healthcare segment for a total consideration of $50.4 million, including an estimated fair value for future contingent payments. The results of operations of these acquisitions have been included in our financial results since their respective acquisition dates. Such acquisitions were not significant individually or in the aggregate to our consolidated financial statements.
65
NUANCE COMMUNICATIONS, INC.
NOTES TO CONSOLIDATED FINANCIAL STATEMENTS — (Continued)
4. Goodwill and Intangible Assets
The changes in the carrying amount of goodwill for our reportable segments for fiscal years 2018 and 2017 were as follows (in thousands):
Healthcare | Enterprise | Imaging | Mobile | Automotive | Other | Total | |||||||||||||||||||||
Balance as of September 30, 2016 | $ | 1,381,076 | $ | 653,368 | $ | 257,038 | $ | 1,217,397 | $ | — | $ | — | $ | 3,508,879 | |||||||||||||
Acquisitions | 32,985 | 14,415 | — | 13,660 | — | — | 61,060 | ||||||||||||||||||||
Purchase accounting adjustments | (49 | ) | (463 | ) | — | — | — | — | (512 | ) | |||||||||||||||||
Effect of foreign currency translation | 4,322 | 6,152 | 754 | 9,953 | — | — | 21,181 | ||||||||||||||||||||
Balance as of September 30, 2017 | 1,418,334 | 673,472 | 257,792 | 1,241,010 | — | — | 3,590,608 | ||||||||||||||||||||
Acquisitions | 14,936 | — | — | — | 50,193 | — | 65,129 | ||||||||||||||||||||
Purchase accounting adjustments | (705 | ) | — | — | 2,697 | (3,275 | ) | — | (1,283 | ) | |||||||||||||||||
Effect of foreign currency translation | (2,240 | ) | (2,116 | ) | (440 | ) | 5,344 | (7,424 | ) | (1,340 | ) | (8,216 | ) | ||||||||||||||
Reorganization (Note 19) | — | 11,991 | — | (1,249,051 | ) | 1,080,453 | 156,607 | — | |||||||||||||||||||
Impairment charge (a) | — | — | — | — | — | (141,781 | ) | (141,781 | ) | ||||||||||||||||||
Balance as of September 30, 2018 | $ | 1,430,325 | $ | 683,347 | $ | 257,352 | $ | — | $ | 1,119,947 | $ | 13,486 | $ | 3,504,457 | |||||||||||||
(a) | Represents accumulated impairment charge as of September 30, 2018. |
Intangible assets consist of the following as of September 30, 2018 and 2017, which includes licensed technology with a net book value of $47.6 million and $67.3 million, respectively (dollars in thousands):
September 30, 2018 | |||||||||||||
Gross Carrying Amount | Accumulated Amortization | Net Carrying Amount (a) | Weighted Average Remaining Life (Years) | ||||||||||
Customer relationships | $ | 765,571 | $ | (372,121 | ) | $ | 393,450 | 6.3 | |||||
Technology and patents | 327,695 | (189,344 | ) | 138,351 | 3.8 | ||||||||
Trade names, trademarks, and other | 57,809 | (40,102 | ) | 17,707 | 2.2 | ||||||||
Total | $ | 1,151,075 | $ | (601,567 | ) | $ | 549,508 | ||||||
(a) | As more fully described below, the balance as of September 30, 2018 reflected impairment charges of $29.2 million related to Mobile Operator Services and Devices intangible assets that we recorded during the fourth quarter of fiscal year 2018. |
September 30, 2017 | |||||||||||||
Gross Carrying Amount | Accumulated Amortization | Net Carrying Amount | Weighted Average Remaining Life (Years) | ||||||||||
Customer relationships | $ | 790,846 | $ | (338,511 | ) | $ | 452,335 | 7.2 | |||||
Technology and patents | 447,119 | (264,562 | ) | 182,557 | 4.6 | ||||||||
Trade names, trademarks, and other | 58,923 | (29,341 | ) | 29,582 | 2.9 | ||||||||
Total | $ | 1,296,888 | $ | (632,414 | ) | $ | 664,474 | 6.3 | |||||
Amortization expense for acquired technology and patents is included in the cost of revenue in the accompanying statements of operations and was $56.9 million, $64.9 million and $62.9 million in fiscal 2018, 2017 and 2016, respectively. Amortization expense for customer relationships, trade names, trademarks, and other, and non-competition agreements is included in operating expenses and was $91.1 million, $113.9 million and $108.0 million in fiscal 2018, 2017 and 2016, respectively.
66
NUANCE COMMUNICATIONS, INC.
NOTES TO CONSOLIDATED FINANCIAL STATEMENTS — (Continued)
Estimated amortization expense for each of the five succeeding years as of September 30, 2018, is as follows (in thousands):
Year Ending September 30, | Cost of Revenue | Other Operating Expenses | Total | |||||||||
2019 | $ | 41,444 | $ | 82,384 | $ | 123,828 | ||||||
2020 | 36,303 | 74,500 | 110,803 | |||||||||
2021 | 27,960 | 68,156 | 96,116 | |||||||||
2022 | 19,466 | 61,854 | 81,320 | |||||||||
2023 | 10,131 | 48,701 | 58,832 | |||||||||
Thereafter | 3,047 | 75,562 | 78,609 | |||||||||
Total | $ | 138,351 | $ | 411,157 | $ | 549,508 | ||||||
Interim Impairment Analysis
Effective in the second quarter of fiscal year 2018, our Automotive business, which was previously included within our former Mobile segment, became a standalone operating segment. In addition, we moved our Dragon TV business from our former Mobile operating segment into our Enterprise operating segment.
As a result of the reorganization, the original Mobile reporting unit was separated into three discrete lines of business - Automotive, Dragon TV, and Devices. We assigned $1,080.5 million, $12.0 million, and $36.0 million of goodwill to Automotive, Dragon TV and Devices, respectively, based on their relative fair values as of March 31, 2018, and assessed the assigned goodwill for impairment by comparing each component’s fair value to its carrying amount. The fair values of Automotive and Dragon TV significantly exceeded their carrying amounts. However, the carrying value of Devices exceeded its fair value by $35.1 million due to the standalone multi-year operating plan reflecting the ongoing consolidation of our handset manufacturer customer base and continued erosion of our penetration of the remaining market. As a result, we recorded a $35.1 million goodwill impairment for the second quarter of fiscal 2018. After the impairment charge, the goodwill assigned to Devices as of March 31, 2018 was immaterial. The reorganization did not result in any impairment charge of other intangible assets.
Also during the second quarter of fiscal 2018, our Subscriber Revenue Services ("SRS") reporting unit, originally included within our former Mobile operating segment, recorded significantly lower revenue and profitability due to market disruptions in certain markets that we serve. Our SRS business provides value-added services to mobile operators in emerging markets, primarily in India and Brazil. These markets had experienced dramatic disruption as a result of accelerated change in competition and business models for our mobile operator customers. Specifically, the rapid shift away from a model where voice, data and text are offered separately toward unlimited bundled services at considerably lower costs has significantly reduced mobile operators’ demand for our services. This reduced demand materially impacted our future expectations for SRS revenues. As a result, executive management performed an updated strategic assessment and reduced the long-term growth rates and profitability contemplated in SRS's multi-year operating plan. We concluded that these financial results coupled with the rapid market shifts being experienced in the industry were factors that represented impairment indicators, triggering a review of goodwill and indefinite-lived intangible assets for impairment during the second quarter of fiscal 2018. Based on the result of the impairment assessment, the carrying value of SRS exceeded its fair value by $94.3 million. In addition, we recorded an $8.5 million deferred tax benefit related to SRS’s goodwill, which is amortized over time for tax purposes, and therefore increased the impairment charge by the same amount. As a result, we recorded a goodwill impairment charge of $102.8 million related to SRS for the second quarter of fiscal 2018. After the impairment charge, goodwill assigned to SRS was $17.8 million as of March 31, 2018. The assessment did not result in any impairment charge of other intangible assets.
The fair value of a reporting unit is generally determined using a combination of the income approach and the market approach, where the income approach is weighted 50% and the market approach 50%. The fair values of Devices and Dragon TV, however, were determined solely based upon the income approach due to the lack of comparable public companies or comparable acquisitions.
Wind-down of Devices and Mobile Operator Services and Annual Goodwill Impairment Analysis
During the fourth quarter of fiscal 2018, in connection with our strategic business review announced in our earnings release issued on May 9, 2018, we restructured our SRS business by separating the voicemail transcription services business (“Voice-to-Text”), which will continue to operate as part of the Other Segment, and commenced a wind-down of the SRS Mobile Operator Services in India and Brazil, and our Devices businesses. As a result, we revised our multi-year operating plans of Mobile Operator Services and Devices, as part of our fiscal 2019 budgeting process, to reflect a significant decline in revenue and operating income. The wind-down decision has resulted in significantly lower estimated future cash flows over a considerably shorter time horizon, which triggered a review of goodwill and long-lived asset groups for impairment.
67
NUANCE COMMUNICATIONS, INC.
NOTES TO CONSOLIDATED FINANCIAL STATEMENTS — (Continued)
We first assessed the long-lived asset groups within the businesses for impairment, and then compared a reporting unit’s carrying amount after the long-lived asset group impairment, if any, with its estimated fair value. Mobile Operator Services and Voicemail-to-Text, which were included within the former SRS reporting unit, were assessed for the impairment of goodwill and long-lived asset groups separately. For the purpose of the goodwill impairment assessment, total goodwill of the former SRS reporting unit was assigned to Mobile Operator Services and Voice-to-text services based on their relative fair values as of July 1, 2018. As a result, $3.4 million of goodwill was assigned to Mobile Operator Services and $13.5 million goodwill was assigned to Voicemail-to-Text.
As a result of the impairment review, we recorded $15.0 million impairment charge for Devices for the fourth quarter of fiscal year 2018, including $7.6 million related to acquired trade names and customer relationships, $0.8 million related to acquired technology assets, $6.2 million related to fixed assets, and $0.4 million related to its remaining goodwill; additionally, we recorded $25.1 million impairment charge for our Mobile Operator Services for the fourth quarter of fiscal year 2018, including $12.9 million related to acquired trade names and customer relationships, $7.9 million related to acquired technology assets, $0.9 million related to fixed assets, and $3.4 million related to goodwill.
For the annual goodwill impairment analysis, the estimated fair value of each of Healthcare, Enterprise, Automotive, Imaging and Voice-to-Text significantly exceeded their carrying amounts. The fair value of a reporting unit is generally determined using a combination of the income approach and the market approach, where the income approach is weighted 50% and the market approach 50%.
Determining the fair value of a long-lived asset group or a reporting unit requires the use of significant estimates and assumptions, all of which we believe are reasonable but nevertheless inherently uncertain. These estimates and assumptions include revenue growth rates and operating margins used to estimate future cash flows, risk-adjusted discount rates, future economic and market conditions, and the use of market comparables. Also, if we experience lower-than-expected growth or fail to sustain our profitability due to changing market dynamics, competition or technological obsolescence, it could adversely impact the long-term assumptions used in our impairment analysis. Such changes in assumptions and estimates may result in additional impairment of our goodwill and/or other long-lived assets, which could materially impact our future results of operations and financial conditions. Additionally, as we continue our product portfolio review and implement organizational changes to better align with our long-term strategies, decisions from such efforts may trigger additional impairment reviews of goodwill and other long-lived assets, which may result in additional impairment charges in the future periods.
5. Accounts Receivable
Accounts receivable, net consisted of the following (in thousands):
September 30, 2018 | September 30, 2017 | ||||||
Trade accounts receivable | $ | 368,467 | $ | 417,516 | |||
Unbilled accounts receivable under long-term contracts | 33,413 | 27,515 | |||||
Gross accounts receivable | 401,880 | 445,031 | |||||
Less: allowance for doubtful accounts | (11,724 | ) | (14,333 | ) | |||
Less: allowance for sales returns | (11,324 | ) | (35,306 | ) | |||
Accounts receivable, net | $ | 378,832 | $ | 395,392 | |||
68
NUANCE COMMUNICATIONS, INC.
NOTES TO CONSOLIDATED FINANCIAL STATEMENTS — (Continued)
6. Land, Building and Equipment, Net
Land, building and equipment, net consisted of the following (dollars in thousands):
Useful Life (In Years) | September 30, 2018 | September 30, 2017 | ||||||||
Land | — | $ | 2,400 | $ | 2,400 | |||||
Building | 30 | 5,409 | 5,456 | |||||||
Machinery and equipment | 3-5 | 164,089 | 144,130 | |||||||
Computers, software and equipment | 3-5 | 183,904 | 187,732 | |||||||
Leasehold improvements | 2-15 | 37,393 | 34,478 | |||||||
Furniture and fixtures | 5-7 | 18,322 | 19,171 | |||||||
Construction in progress | — | 2,088 | 9,121 | |||||||
Subtotal | 413,605 | 402,488 | ||||||||
Less: accumulated depreciation | (257,711 | ) | (225,940 | ) | ||||||
Land, building and equipment, net | $ | 155,894 | $ | 176,548 | ||||||
As of September 30, 2018 and 2017, the net book value of capitalized internal-use software costs was $14.5 million and $27.0 million, respectively, which are included within computers, software and equipment and construction in progress.
Depreciation expense for fiscal years 2018, 2017 and 2016 was $62.4 million, $55.7 million and $60.6 million, respectively, which included amortization expense of $11.0 million, $11.9 million and $12.7 million, respectively, for internally developed software costs.
7. Accrued Expenses and Other Current Liabilities
Accrued expenses and other current liabilities consisted of the following (in thousands):
September 30, 2018 | September 30, 2017 | ||||||
Compensation | $ | 181,992 | $ | 159,951 | |||
Accrued interest payable | 21,326 | 26,285 | |||||
Cost of revenue related liabilities | 32,667 | 20,124 | |||||
Consulting and professional fees | 21,441 | 12,649 | |||||
Facilities related liabilities | 5,340 | 7,158 | |||||
Sales and marketing incentives | 2,904 | 3,655 | |||||
Sales and other taxes payable | 6,602 | 3,125 | |||||
Other | 9,372 | 12,954 | |||||
Total | $ | 281,644 | $ | 245,901 | |||
69
NUANCE COMMUNICATIONS, INC.
NOTES TO CONSOLIDATED FINANCIAL STATEMENTS — (Continued)
8. Deferred Revenue
Deferred maintenance revenue consists of prepaid fees received for post-contract customer support for our products, including telephone support and the right to receive unspecified upgrades/updates on a when-and-if-available basis. Unearned revenue includes fees for up-front set-up of the service environment; fees charged for on-demand service; certain software arrangements for which we do not have fair value of post-contract customer support, resulting in ratable revenue recognition for the entire arrangement on a straight-line basis; and fees in excess of estimated earnings on percentage-of-completion service contracts.
Deferred revenue consisted of the following (dollars in thousands):
September 30, 2018 | September 30, 2017 | ||||||
Current Liabilities: | |||||||
Deferred maintenance revenue | $ | 160,146 | $ | 162,958 | |||
Unearned revenue | 223,647 | 203,084 | |||||
Total current deferred revenue | $ | 383,793 | $ | 366,042 | |||
Long-term Liabilities: | |||||||
Deferred maintenance revenue | $ | 59,800 | $ | 60,298 | |||
Unearned revenue | 429,377 | 363,631 | |||||
Total long-term deferred revenue | $ | 489,177 | $ | 423,929 | |||
9. Debt
At September 30, 2018 and 2017, we had the following borrowing obligations (dollars in thousands):
September 30, 2018 | September 30, 2017 | ||||||
5.625% Senior Notes due 2026, net of deferred issuance costs of $5.1 million and $5.7 million, respectively. Effective interest rate 5.625%. | $ | 494,915 | $ | 494,298 | |||
5.375% Senior Notes due 2020, net of deferred issuance costs of $1.2 million and $2.3 million, respectively, and unamortized premium of $- and $1.0 million, respectively. Effective interest rate 5.375%. | 298,759 | 448,630 | |||||
6.000% Senior Notes due 2024, net of deferred issuance costs of $1.8 million and $2.1 million, respectively. Effective interest rate 6.000%. | 298,220 | 297,910 | |||||
1.00% Convertible Debentures due 2035, net of unamortized discount of $116.9 million and $140.9 million, respectively, and deferred issuance costs of $5.6 million and $6.9 million, respectively. Effective interest rate 5.622%. | 553,973 | 528,690 | |||||
2.75% Convertible Debentures due 2031, net of unamortized discount of $1.5 million and deferred issuance costs of $0.1 million as of September 30, 2017. Effective interest rate 7.432%. | 46,568 | 376,121 | |||||
1.25% Convertible Debentures due 2025, net of unamortized discount of $82.4 million and $92.7 million, respectively, and deferred issuance costs of $3.7 million and $4.3 million, respectively. Effective interest rate 5.578%. | 263,863 | 253,054 | |||||
1.50% Convertible Debentures due 2035, net of unamortized discount of $32.8 million and $42.5 million, respectively, and deferred issuance costs of $1.1 million and $1.5 million, respectively. Effective interest rate 5.394%. | 229,906 | 219,875 | |||||
Deferred issuance costs related to our Revolving Credit Facility | (843 | ) | (1,174 | ) | |||
Total debt | 2,185,361 | 2,617,404 | |||||
Less: current portion | — | 376,121 | |||||
Total long-term debt | $ | 2,185,361 | $ | 2,241,283 | |||
70
NUANCE COMMUNICATIONS, INC.
NOTES TO CONSOLIDATED FINANCIAL STATEMENTS — (Continued)
The following table summarizes the maturities of our borrowing obligations as of September 30, 2018 (dollars in thousands):
Fiscal Year | Convertible Debentures (1) | Senior Notes | Total | |||||||||
2019 | $ | — | $ | — | $ | — | ||||||
2020 | — | 300,000 | 300,000 | |||||||||
2021 | — | — | — | |||||||||
2022 | 310,463 | — | 310,463 | |||||||||
2023 | 676,488 | — | 676,488 | |||||||||
Thereafter | 350,000 | 800,000 | 1,150,000 | |||||||||
Total before unamortized discount | 1,336,951 | 1,100,000 | 2,436,951 | |||||||||
Less: unamortized discount and issuance costs | (242,641 | ) | (8,949 | ) | (251,590 | ) | ||||||
Total long-term debt | $ | 1,094,310 | $ | 1,091,051 | $ | 2,185,361 | ||||||
(1) | Pursuant to the terms of each convertible instrument, holders have the right to redeem the debt on specific dates prior to maturity. The repayment schedule above assumes that payment is due on the next redemption date after September 30, 2018. |
5.625% Senior Notes due 2026
In December 2016, we issued $500.0 million aggregate principal amount of 5.625% Senior Notes due on December 15, 2026 (the "2026 Senior Notes") in a private placement. The proceeds from the 2026 Senior Notes were approximately $493.8 million, net of issuance costs, and we used the proceeds to repurchase a portion of our 2020 Senior Notes. The 2026 Senior Notes bear interest at 5.625% per year, payable in cash semi-annually in arrears.
The 2026 Senior Notes are unsecured senior obligations and are guaranteed on an unsecured senior basis by certain of our domestic subsidiaries ("Subsidiary Guarantors"). The 2026 Senior Notes and the guarantees rank equally in right of payment with all of our and the Subsidiary Guarantors’ existing and future unsecured senior debt and rank senior in right of payment to all of our and the Subsidiary Guarantors’ future unsecured subordinated debt. The 2026 Senior Notes and guarantees effectively rank junior to all our secured debt and that of the Subsidiary Guarantors to the extent of the value of the collateral securing such debt and to all liabilities, including trade payables, of our subsidiaries that have not guaranteed the 2026 Senior Notes.
At any time before December 15, 2021, we may redeem all or a portion of the 2026 Senior Notes at a redemption price equal to 100% of the aggregate principal amount of the 2026 Senior Notes to be redeemed, plus a “make-whole” premium and accrued and unpaid interest to, but excluding, the redemption date. At any time on or after December 15, 2021, we may redeem all or a portion of the 2026 Senior Notes at certain redemption prices expressed as percentages of the principal amount, plus accrued and unpaid interest to, but excluding, the redemption date. At any time and from time to time before December 15, 2021, we may redeem up to 35% of the aggregate outstanding principal amount of the 2026 Senior Notes with the net cash proceeds received by us from certain equity offerings at a price equal to 105.625% of the aggregate principal amount, plus accrued and unpaid interest to, but excluding, the redemption date, provided that the redemption occurs no later than 120 days after the closing of the related equity offering, and at least 50% of the original aggregate principal amount of the 2026 Senior Notes remains outstanding immediately thereafter.
Upon the occurrence of certain asset sales or a change in control, we must offer to repurchase the 2026 Senior Notes at a price equal to 100% in the case of an asset sale, or 101% in the case of a change of control, of the principal amount plus accrued and unpaid interest to, but excluding, the repurchase date.
5.375% Senior Notes due 2020
On August 14, 2012, we issued $700.0 million aggregate principal amount of 5.375% Senior Notes due on August 15, 2020 in a private placement. The net proceeds were approximately $689.1 million, net of issuance costs, and bear interest at 5.375% per year, payable in cash semi-annually in arrears. On October 22, 2012, we issued, in a private placement, an additional $350.0 million aggregate principal amount of our 5.375% Senior Notes due 2020 (collectively the "Notes"). The Notes were issued pursuant to the indenture agreement dated August 14, 2012. Total proceeds received, net of issuance costs, were $351.7 million.
The Notes are our unsecured senior obligations and are guaranteed (the “Guarantees”) on an unsecured senior basis by Subsidiary
71
NUANCE COMMUNICATIONS, INC.
NOTES TO CONSOLIDATED FINANCIAL STATEMENTS — (Continued)
Guarantors. The Notes and Guarantees rank equally in right of payment with all of our and the Subsidiary Guarantors' existing and future unsecured senior debt and rank senior in right of payment to all of our and the Subsidiary Guarantors' future unsecured subordinated debt. The Notes and Guarantees effectively rank junior to all secured debt of our and the Subsidiary Guarantors to the extent of the value of the collateral securing such debt and to all liabilities, including trade payables, of our subsidiaries that have not guaranteed the Notes.
At any time, we may redeem all or a portion of the Notes at certain redemption prices expressed as percentages of the principal amount, plus accrued and unpaid interest to, but excluding, the redemption date.
Upon the occurrence of certain asset sales or a change in control, we must offer to repurchase the Notes at a price equal to 100%, in the case of an asset sale, or 101%, in the case of a change of control, of the principal amount plus accrued and unpaid interest to, but excluding, the repurchase date.
In January 2017, we repurchased $600.0 million in aggregate principal amount of our 2020 Senior Notes using cash and cash equivalents and the net proceeds from our 2026 Senior Notes issued in December 2016. As a result, we recorded an extinguishment loss of $18.6 million in fiscal year 2017.
In September 2018, we repurchased $150.0 million in aggregate principal amount of our 2020 Senior Notes at par. As a result, we wrote off the remaining unamortized premium and deferred issuance costs related to the repayment and recorded an extinguishment gain of $0.3 million in fiscal year 2018. Following this activity, $300.0 million in aggregate principal amount of our 2020 Senior Notes remains outstanding as of September 30, 2018.
6.0% Senior Notes due 2024
In June 2016, we issued $300.0 million aggregate principal amount of 6.0% Senior Notes due on July 1, 2024 (the "2024 Senior Notes") in a private placement. The proceeds from the 2024 Senior Notes were approximately $297.5 million, net of issuance costs. The 2024 Senior Notes bear interest at 6.0% per year, payable in cash semi-annually in arrears.
The 2024 Senior Notes are unsecured senior obligations and are guaranteed on an unsecured senior basis by our Subsidiary Guarantors. The 2024 Senior Notes and the guarantees rank equally in right of payment with all of our and the Subsidiary Guarantors’ existing and future unsecured senior debt, including our obligations and those of each such Subsidiary Guarantor under our senior credit facility, and rank senior in right of payment to all of our and the Subsidiary Guarantors’ future unsecured subordinated debt. The 2024 Senior Notes and guarantees effectively rank junior to all our secured debt and that of the Subsidiary Guarantors to the extent of the value of the collateral securing such debt and to all liabilities, including trade payables, of our subsidiaries that have not guaranteed the 2024 Senior Notes.
At any time before July 1, 2019, we may redeem all or a portion of the 2024 Senior Notes at a redemption price equal to 100% of the aggregate principal amount of the 2024 Senior Notes to be redeemed, plus a “make-whole” premium and accrued and unpaid interest to, but excluding, the redemption date. At any time on or after July 1, 2019, we may redeem all or a portion of the 2024 Senior Notes at certain redemption prices expressed as percentages of the principal amount, plus accrued and unpaid interest to, but excluding, the redemption date. At any time and from time to time before July 1, 2019, we may redeem up to 35% of the aggregate outstanding principal amount of the 2024 Senior Notes with the net cash proceeds received by us from certain equity offerings at a price equal to 106% of the aggregate principal amount, plus accrued and unpaid interest to, but excluding, the redemption date, provided that the redemption occurs no later than 120 days after the closing of the related equity offering, and at least 50% of the original aggregate principal amount of the 2024 Senior Notes remains outstanding immediately thereafter.
Upon the occurrence of certain asset sales or a change in control, we must offer to repurchase the 2024 Senior Notes at a price equal to 100% in the case of an asset sale, or 101% in the case of a change of control, of the principal amount plus accrued and unpaid interest to, but excluding, the repurchase date.
1.0% Convertible Debentures due 2035
In December 2015, we issued $676.5 million in aggregate principal amount of 1.0% Senior Convertible Debentures due in 2035 (the “1.0% 2035 Debentures”). Total proceeds were $663.8 million, net of issuance costs, and we used a portion to repurchase $38.3 million in aggregate principal on our 2.75% Senior Convertible Debentures due in 2031 (the “2031 Debentures”) and to repay the aggregate principal balance of $472.5 million on our term loan under the amended and restated credit agreement. The 1.0% 2035 Debentures bear interest at 1.0% per year, payable in cash semi-annually in arrears. In addition to ordinary interest and default additional interest, beginning with the semi-annual interest period commencing on December 15, 2022, contingent interest will accrue during any regular semi-annual interest period where the average trading price of our 1.0% 2035 Debentures
72
NUANCE COMMUNICATIONS, INC.
NOTES TO CONSOLIDATED FINANCIAL STATEMENTS — (Continued)
for the ten trading day period immediately preceding the first day of such semi-annual period is greater than or equal to $1,200 per $1,000 principal amount of our 1.0% 2035 Debentures, in which case, contingent interest will accrue at a rate of 0.50% per annum of such average trading price. The 1.0% 2035 Debentures mature on December 15, 2035, subject to the right of the holders to require us to redeem the 1.0% 2035 Debentures on December 15, 2022, 2027, or 2032. The 1.0% 2035 Debentures are general senior unsecured obligations and rank equally in right of payment with all of our existing and future unsecured, unsubordinated indebtedness and senior in right of payment to any indebtedness that is contractually subordinated to the 1.0% 2035 Debentures. The 1.0% 2035 Debentures will be effectively subordinated to indebtedness and other liabilities of our subsidiaries.
We account separately for the liability and equity components of the 1.0% 2035 Debentures in accordance with authoritative guidance for convertible debt instruments that may be settled in cash upon conversion. The guidance requires the carrying amount of the liability component to be estimated by measuring the fair value of a similar liability that does not have an associated conversion feature and record the remainder in stockholders’ equity. At issuance, we allocated $495.4 million to long-term debt, and $181.1 million has been recorded as additional paid-in capital, which is being amortized to interest expense using the effective interest rate method through December 2022.
If converted, the principal amount of the 1.0% 2035 Debentures is payable in cash and any amounts payable in excess of the principal amount will (based on an initial conversion rate, which represents an initial conversion price of approximately $27.22 per share, subject to adjustment) be paid in cash or shares of our common stock, at our election, only in the following circumstances and to the following extent: (i) prior to June 15, 2035, on any date during any fiscal quarter (and only during such fiscal quarter) if the closing sale price of our common stock was more than 130% of the then current conversion price for at least 20 trading days in the period of the 30 consecutive trading days ending on the last trading day of the previous fiscal quarter; (ii) during the five consecutive business-day period following any five consecutive trading-day period in which the trading price for $1,000 principal amount of the 1.0% 2035 Debentures for each day during such five trading-day period was less than 98% of the closing sale price of our common stock multiplied by the then current conversion rate; (iii) upon the occurrence of specified corporate transactions, as described in the indenture for the 1.0% 2035 Debentures; or (iv) at the option of the holder at any time on or after June 15, 2035. Additionally, we may redeem the 1.0% 2035 Debentures, in whole or in part, on or after December 20, 2022 for cash at a price equal to 100% of the principal amount of the 1.0% 2035 Debentures to be purchased plus any accrued and unpaid interest, including any additional interest to, but excluding, the repurchase date. Each holder shall have the right, at such holder’s option, to require us to repurchase all or any portion of the 1.0% 2035 Debentures held by such holder on December 15, 2022, December 15, 2027, or December 15, 2032 at par plus accrued and unpaid interest. If we undergo a fundamental change or non-stock change of control (as described in the indenture for the 1.0% 2035 Debentures) prior to maturity, holders will have the option to require us to repurchase all or any portion of their debentures for cash at a price equal to 100% of the principal amount of the 1.0% 2035 Debentures to be purchased plus any accrued and unpaid interest, including any additional interest to, but excluding, the repurchase date. As of September 30, 2018, none of the conversion criteria were met for the 1.0% 2035 Debentures. If the conversion criteria were met, we could be required to repay all or some of the aggregate principal amount in cash prior to the maturity date.
2.75% Convertible Debentures due 2031
On October 24, 2011, we sold $690.0 million of 2.75% Convertible Debentures due in 2031 in a private placement. Total proceeds, net of issuance costs, were $676.1 million. The 2031 Debentures bear interest at 2.75% per year, payable in cash semi-annually in arrears. The 2031 Debentures mature on November 1, 2031, subject to the right of the holders to require us to redeem the 2031 Debentures on November 1, 2017, 2021, and 2026. The 2031 Debentures are general senior unsecured obligations and rank equally in right of payment with all of our existing and future unsecured, unsubordinated indebtedness and senior in right of payment to any indebtedness that is contractually subordinated to the 2031 Debentures. The 2031 Debentures will be effectively subordinated to indebtedness and other liabilities of our subsidiaries.
We account separately for the liability and equity components of the 2031 Debentures in accordance with authoritative guidance for convertible debt instruments that may be settled in cash upon conversion. At issuance, we allocated $533.6 million to long-term debt, and $156.4 million has been recorded as additional paid-in capital, which was amortized to interest expense using the effective interest rate method through November 2017.
In June 2015, we entered into separate privately negotiated agreements with certain holders of our 2031 Debentures to exchange, in a private placement, $256.2 million in aggregate principal amount of our 2031 Debentures for approximately $263.9 million in aggregate principal amount of our 1.5% 2035 Debentures. Upon repurchase we recorded an extinguishment loss of $17.7 million in other expense, net, in the accompanying consolidated statements of operations. In December 2015, we entered into separate privately negotiated agreements with certain holders of our 2031 Debentures to repurchase $38.3 million in aggregate principal with proceeds received from the issuance of our 1.0% 2035 Debentures. Upon repurchase we recorded an extinguishment
73
NUANCE COMMUNICATIONS, INC.
NOTES TO CONSOLIDATED FINANCIAL STATEMENTS — (Continued)
loss of $2.4 million in other expense, net, in the accompanying consolidated statements of operations. In accordance with the authoritative guidance for convertible debt instruments, a loss on extinguishment is equal to the difference between the reacquisition price and the net carrying amount of the extinguished debt for our 2031 Debentures, including any unamortized debt discount or issuance costs. Following this activity, $395.5 million in aggregate principal amount of our 2031 Debentures remain outstanding. The aggregate debt discount was amortized to interest expense using the effective interest rate method through November 2017.
If converted, the principal amount of the 2031 Debentures is payable in cash and any amounts payable in excess of the principal amount will (based on an initial conversion rate, which represents an initial conversion price of approximately $32.30 per share, subject to adjustment) be paid in cash or shares of our common stock, at our election, only in the following circumstances and to the following extent: (i) on any date during any fiscal quarter (and only during such fiscal quarter) if the closing sale price of our common stock was more than 130% of the then current conversion price for at least 20 trading days in the period of the 30 consecutive trading days ending on the last trading day of the previous fiscal quarter; (ii) during the five consecutive business-day period following any five consecutive trading-day period in which the trading price for $1,000 principal amount of the 2031 Debentures for each day during such five trading-day period was less than 98% of the closing sale price of our common stock multiplied by the then current conversion rate; (iii) upon the occurrence of specified corporate transactions, as described in the indenture for the 2031 Debentures; or (iv) at the option of the holder at any time on or after May 1, 2031. Additionally, we may redeem the 2031 Debentures, in whole or in part, at par plus accrued and unpaid interest. Each holder shall have the right, at such holder's option, to require us to repurchase all or any portion of the 2031 Debentures held by such holder on November 1, 2021 and November 1, 2026 at par plus accrued and unpaid interest. If we undergo a fundamental change (as described in the indenture for the 2031 Debentures) prior to maturity, holders will have the option to require us to repurchase all or any portion of their debentures for cash at a price equal to 100% of the principal amount of the debentures to be purchased plus any accrued and unpaid interest, including any additional interest to, but excluding, the repurchase date. As of September 30, 2018, no conversion triggers were met. If the conversion triggers were met, we could be required to repay all or some of the aggregate principal amount in cash prior to the maturity date.
In November 2017, holders of approximately $331.2 million in aggregate principal amount of the outstanding 2031 Debentures exercised their right to require us to repurchase such debentures. Following the repurchase, $46.6 million in aggregate principal amount of the 2031 Debentures remains outstanding. On or after November 6, 2017, we have the right to call for redemption of some or all of the remaining outstanding 2031 Debentures.
1.25% Convertible Debentures due 2025
In March 2017, we issued $350.0 million in aggregate principal amount of 1.25% Senior Convertible Debentures due in 2025 (the “1.25% 2025 Debentures”) in a private placement. The proceeds were approximately $343.6 million, net of issuance costs. We used a portion of the proceeds to repurchase 5.8 million shares of our common stock for $99.1 million and $17.8 million in aggregate principal on our 2031 Debentures. The 1.25% 2025 Debentures bear interest at 1.25% per year, payable in cash semi-annually in arrears, beginning on October 1, 2017. The 1.25% 2025 Debentures mature on April 1, 2025. The 1.25% 2025 Debentures are general senior unsecured obligations and rank equally in right of payment with all of our existing and future unsecured, unsubordinated indebtedness and senior in right of payment to any indebtedness that is contractually subordinated to the 1.25% 2025 Debentures. The 1.25% 2025 Debentures will be effectively subordinated to indebtedness and other liabilities of our subsidiaries.
We account separately for the liability and equity components of the 1.25% 2025 Debentures in accordance with authoritative guidance for convertible debt instruments that may be settled in cash upon conversion. The guidance requires the carrying amount of the liability component to be estimated by measuring the fair value of a similar liability that does not have an associated conversion feature and record the remainder in stockholders’ equity. At issuance, we allocated $252.1 million to long-term debt, and $97.9 million has been recorded as additional paid-in capital, which is being amortized to interest expense using the effective interest rate method through April 1, 2025.
If converted, the principal amount of the 1.25% 2025 Debentures is payable in cash and any amounts payable in excess of the principal amount will (based on an initial conversion rate, which represents an initial conversion price of approximately $22.22 per share, subject to adjustment under certain circumstances) be paid in cash or shares of our common stock, at our election, only in the following circumstances and to the following extent: (i) prior to October 1, 2024, on any date during any fiscal quarter (and only during such fiscal quarter) if the closing sale price of our common stock was more than 130% of the then current conversion price for at least 20 trading days in the period of the 30 consecutive trading days ending on the last trading day of the previous fiscal quarter; (ii) at any time on or after October 1, 2024, (iii) during the five consecutive business-day period immediately following any five consecutive trading-day period in which the trading price for $1,000 principal amount of the 1.25% 2025 Debentures for each day during such five trading-day period was less than 98% of the closing sale price of our common stock
74
NUANCE COMMUNICATIONS, INC.
NOTES TO CONSOLIDATED FINANCIAL STATEMENTS — (Continued)
multiplied by the then current conversion rate; or (iv) upon the occurrence of specified corporate transactions, as described in the indenture for the 1.25% 2025 Debentures. We may not redeem the 1.25% 2025 Debentures prior to the maturity date. If we undergo a fundamental change or non-stock change of control (as described in the indenture for the 1.25% 2025 Debentures) prior to maturity, holders will have the option to require us to repurchase all or any portion of their debentures for cash at a price equal to 100% of the principal amount of the 1.25% 2025 Debentures to be purchased plus any accrued and unpaid interest, including any additional interest to, but excluding, the repurchase date. As of September 30, 2018, none of the conversion criteria were met for the 1.25% 2025 Debentures. If the conversion criteria were met, we could be required to repay all or some of the aggregate principal amount in cash prior to the maturity date.
1.50% Convertible Debentures due 2035
In June 2015, we issued $263.9 million in aggregate principal amount of 1.50% Senior Convertible Debentures due in 2035 (the “1.5% 2035 Debentures”) in exchange for $256.2 million in aggregate principal amount of our 2031 Debentures. Total proceeds, net of issuance costs, were $253.2 million. The 1.5% 2035 Debentures were issued at 97.09% of the principal amount, which resulted in a discount of $7.7 million. The 1.5% 2035 Debentures bear interest at 1.50% per year, payable in cash semi-annually in arrears. In addition to ordinary interest and default additional interest, beginning with the semi-annual interest period commencing on November 1, 2021, contingent interest will accrue during any regular semi-annual interest period where the average trading price of our 1.5% 2035 Debentures for the ten trading day period immediately preceding the first day of such semi-annual period is greater than or equal to $1,200 per $1,000 principal amount of our 1.5% 2035 Debentures, in which case, contingent interest will accrue at a rate of 0.50% per annum of such average trading price. The 1.5% 2035 Debentures mature on November 1, 2035, subject to the right of the holders to require us to redeem the 1.5% 2035 Debentures on November 1, 2021, 2026, or 2031. The 1.5% 2035 Debentures are general senior unsecured obligations and rank equally in right of payment with all of our existing and future unsecured, unsubordinated indebtedness and senior in right of payment to any indebtedness that is contractually subordinated to the 1.5% 2035 Debentures. The 1.5% 2035 Debentures will be effectively subordinated to indebtedness and other liabilities of our subsidiaries.
We account separately for the liability and equity components of the 1.5% 2035 Debentures in accordance with authoritative guidance for convertible debt instruments that may be settled in cash upon conversion. At issuance, we allocated $208.6 million to long-term debt, and $55.3 million has been recorded as additional paid-in capital, which is being amortized to interest expense using the effective interest rate method through November 2021.
If converted, the principal amount of the 1.5% 2035 Debentures is payable in cash and any amounts payable in excess of the principal amount, will (based on an initial conversion rate, which represents an initial conversion price of approximately $23.26 per share, subject to adjustment) be paid in cash or shares of our common stock, at our election, only in the following circumstances and to the following extent: (i) prior to May 1, 2035, on any date during any fiscal quarter beginning after September 30, 2015 (and only during such fiscal quarter) if the closing sale price of our common stock was more than 130% of the then current conversion price for at least 20 trading days in the period of the 30 consecutive trading days ending on the last trading day of the previous fiscal quarter; (ii) during the five consecutive business-day period following any five consecutive trading-day period in which the trading price for $1,000 principal amount of the 1.5% 2035 Debentures for each day during such five trading-day period was less than 98% of the closing sale price of our common stock multiplied by the then current conversion rate; (iii) upon the occurrence of specified corporate transactions, as described in the indenture for the 1.5% 2035 Debentures; or (iv) at the option of the holder at any time on or after May 1, 2035. Additionally, we may redeem the 1.5% 2035 Debentures, in whole or in part, on or after November 5, 2021 for cash at a price equal to 100% of the principal amount of the 1.5% 2035 Debentures to be purchased plus any accrued and unpaid interest, including any additional interest to, but excluding, the repurchase date. Each holder shall have the right, at such holder’s option, to require us to repurchase all or any portion of the 1.5% 2035 Debentures held by such holder on November 1, 2021, November 1, 2026, or November 1, 2031 at par plus accrued and unpaid interest. Upon repurchase, we will pay the principal amount in cash and any amounts payable in excess of the principal amount will be paid in cash or shares of our common stock, at our election, with the exception that we may not elect to pay cash in lieu of more than 80% of the number of our common shares we would be obligated to deliver. If we undergo a fundamental change (as described in the indenture for the 1.5% 2035 Debentures) prior to maturity, holders will have the option to require us to repurchase all or any portion of their debentures for cash at a price equal to 100% of the principal amount of the 1.5% 2035 Debentures to be purchased plus any accrued and unpaid interest, including any additional interest to, but excluding, the repurchase date. As of September 30, 2018, none of the conversion criteria were met for the 1.5% 2035 Debentures. If the conversion criteria were met, we could be required to repay all or some of the aggregate principal amount in cash prior to the maturity date.
75
NUANCE COMMUNICATIONS, INC.
NOTES TO CONSOLIDATED FINANCIAL STATEMENTS — (Continued)
Revolving Credit Facility
Our revolving credit agreement (the “Revolving Credit Facility”), which expires on April 15, 2021, provides for aggregate borrowing commitments of $242.5 million, including the revolving facility loans, the swingline loans and issuance of letters of credit. As of September 30, 2018, after taking into account the outstanding letters of credit of $6.9 million, we had $235.6 million available for additional borrowing under the Revolving Credit Facility. The borrowing outstanding under the Revolving Credit Facility bears interest at either (i) LIBOR plus an applicable margin of 1.50% or 1.75%, or (ii) the alternative base rate plus an applicable margin of 0.50% or 0.75%. The Revolving Credit Facility is secured by substantially all our assets. The Revolving Credit Facility contains customary affirmative and negative covenants and conditions to borrowing, as well as customary events of default. As of September 30, 2018, we are in compliance with all the debt covenants.
10. Financial Instruments and Hedging Activities
Derivatives not Designated as Hedges
Forward Currency Contracts
We have operations in a number of international locations, including certain developing markets where currency exchange rates can be volatile. We utilize foreign currency forward contracts to mitigate the risks associated with changes in foreign currency exchange rates so that our exposure to foreign currencies will be mitigated or offset by the gains or losses on the foreign currency forward contracts. Generally, we enter into such contracts for less than 90 days and have no cash requirements until maturity. As of September 30, 2018 and 2017, we had outstanding contracts with a total notional value of $117.1 million and $69.0 million, respectively.
We did not designate any forward contracts as hedging instruments for fiscal years 2018, 2017 and 2016. Therefore, changes in fair value of foreign currency forward contracts were recognized within other expense, net in our condensed consolidated statements of operations. The cash flows related to the settlement of forward contracts not designated as hedging instruments are included in cash flows from investing activities within our condensed consolidated statement of cash flows.
A summary of our derivative instruments is as follows (dollars in thousands):
Derivatives Not Designated as Hedges: | Balance Sheet Classification | September 30, 2018 | September 30, 2017 | |||||||
Foreign currency contracts | Prepaid expenses and other current assets | $ | 143 | $ | 220 | |||||
Foreign currency contracts | Accrued expenses and other liabilities | (1,192 | ) | (373 | ) | |||||
A summary of gains (losses) recognized from the derivative instruments is as follows (dollars in thousands):
Income Statement Classification Income (loss) recognized | ||||||||||||||
Derivatives Not Designated as Hedges: | 2018 | 2017 | 2016 | |||||||||||
Foreign currency contracts | Other expense, net | $ | (3,616 | ) | $ | 6,811 | $ | 2,021 | ||||||
11. Fair Value Measures
Fair value is defined as the price that would be received to sell an asset, or paid to transfer a liability, in an orderly transaction between market participants at the measurement date. Valuation techniques must maximize the use of observable inputs and minimize the use of unobservable inputs. When determining the fair value measurements for assets and liabilities required to be recorded at fair value, we consider the principal or most advantageous market in which we would transact and consider assumptions that market participants would use when pricing the asset or liability, such as inherent risk, transfer restrictions, and risk of nonperformance.
The determination of the applicable level within the hierarchy of a particular financial asset or liability depends on the lowest level of inputs that are significant to the fair value measurement as of the measurement date as follows:
• | Level 1: Quoted prices for identical assets or liabilities in active markets. |
• | Level 2: Observable inputs other than those described as Level 1. |
76
NUANCE COMMUNICATIONS, INC.
NOTES TO CONSOLIDATED FINANCIAL STATEMENTS — (Continued)
• | Level 3: Unobservable inputs that are supportable by little or no market activities and are based on significant assumptions and estimates. |
Assets and liabilities measured at fair value on a recurring basis at September 30, 2018 and 2017 consisted of (in thousands):
September 30, 2018 | |||||||||||||||
Level 1 | Level 2 | Level 3 | Total | ||||||||||||
Assets: | |||||||||||||||
Money market funds (a) | $ | 200,004 | $ | — | $ | — | $ | 200,004 | |||||||
Time deposits(b) | — | 88,158 | — | 88,158 | |||||||||||
Commercial paper, $27,194 at cost(b) | — | 27,363 | — | 27,363 | |||||||||||
Corporate notes and bonds, $57,563 at cost(b) | — | 57,417 | — | 57,417 | |||||||||||
Foreign currency exchange contracts(b) | — | 143 | — | 143 | |||||||||||
Total assets at fair value | $ | 200,004 | $ | 173,081 | $ | — | $ | 373,085 | |||||||
Liabilities: | |||||||||||||||
Foreign currency exchange contracts(b) | $ | — | $ | (1,192 | ) | $ | — | $ | (1,192 | ) | |||||
Contingent acquisition payments(c) | — | — | (4,000 | ) | (4,000 | ) | |||||||||
Total liabilities at fair value | $ | — | $ | (1,192 | ) | $ | (4,000 | ) | $ | (5,192 | ) | ||||
September 30, 2017 | |||||||||||||||
Level 1 | Level 2 | Level 3 | Total | ||||||||||||
Assets: | |||||||||||||||
Money market funds(a) | $ | 381,899 | $ | — | $ | — | $ | 381,899 | |||||||
Time deposits(b) | — | 85,570 | — | 85,570 | |||||||||||
Commercial paper, $41,805 at cost(b) | — | 41,968 | — | 41,968 | |||||||||||
Corporate notes and bonds, $74,150 at cost(b) | — | 74,067 | — | 74,067 | |||||||||||
Foreign currency exchange contracts(b) | — | 220 | — | 220 | |||||||||||
Total assets at fair value | $ | 381,899 | $ | 201,825 | $ | — | $ | 583,724 | |||||||
Liabilities: | |||||||||||||||
Foreign currency exchange contracts(b) | $ | — | $ | (373 | ) | $ | — | $ | (373 | ) | |||||
Contingent acquisition payments(c) | — | — | (8,648 | ) | (8,648 | ) | |||||||||
Total liabilities at fair value | $ | — | $ | (373 | ) | $ | (8,648 | ) | $ | (9,021 | ) | ||||
(a) | Money market funds and time deposits with original maturity of 90 days or less are included within cash and cash equivalents in the consolidated balance sheets and are valued at quoted market prices in active markets. |
(b) Time deposits, commercial paper, corporate notes and bonds, and foreign currency exchange contracts are recorded at fair market values, which are determined based on the most recent observable inputs for similar instruments in active markets or quoted prices for identical or similar instruments in markets that are not active or are directly or indirectly observable. Time deposits are generally for terms of one year or less. Commercial paper and corporate notes and bonds generally mature within three years and had a weighted average maturity of 0.61 years as of September 30, 2018.
(c) The fair values of our contingent consideration arrangements were determined using either the option pricing model with Monte Carlo simulation or the probability-weighted discounted cash flow method.
As of September 30, 2017, $80.2 million of debt securities included within marketable securities were designated as held-to-maturity investments, which had a weighted average maturity of 0.27 years and an estimated fair value of $80.4 million based on Level 2 measurements. No debt instruments were designated as held-to-maturity investments as of September 30, 2018.
The estimated fair value of our long-term debt approximated $2,423.6 million (face value $2,437.0 million) as of September 30, 2018 and $2,930.9 million (face value $2,918.1 million) as of September 30, 2017, based on Level 2 measurements. The fair value of each borrowing was estimated using the average of the bid and ask trading quotes at the end of the reporting periods. There was no balance outstanding under our revolving credit agreement as of September 30, 2018 and September 30, 2017.
77
NUANCE COMMUNICATIONS, INC.
NOTES TO CONSOLIDATED FINANCIAL STATEMENTS — (Continued)
Additionally, contingent acquisition payments are recorded at fair values upon the acquisition, and remeasured in subsequent reporting periods with the changes in fair values recorded within acquisition-related costs, net. Such payments are contingent upon the achievement of specified performance targets and are valued using the option pricing model with Monte Carlo simulation or the probability-weighted discounted cash flow model (Level 3 measurement).
The following table provides a summary of changes in fair value of our Level 3 financial instruments for the years ended September 30, 2018 and 2017 (dollars in thousands):
Amount | |||
Balance as of September 30, 2016 | $ | 8,240 | |
Earn-out liability established at time of acquisition | 8,253 | ||
Payments and foreign currency translation | (7,830 | ) | |
Adjustments to fair value included in acquisition-related costs, net | (15 | ) | |
Balance as of September 30, 2017 | 8,648 | ||
Earn-out liability established at time of acquisition | 2,000 | ||
Payments and foreign currency translation | (8,188 | ) | |
Adjustments to fair value included in acquisition-related costs, net | 1,540 | ||
Balance as of September 30, 2018 | $ | 4,000 | |
Contingent acquisition payment liabilities are scheduled to be paid in periods through fiscal year 2021. As of September 30, 2018, we could be required to pay up to $12.4 million if the specified performance targets are achieved.
12. Restructuring and Other Charges, Net
Restructuring and other charges, net include restructuring expenses as well as other charges that are unusual in nature, are the result of unplanned events, and arise outside the ordinary course of our business. Restructuring expenses consist of employee severance costs, charges for the closure of excess facilities and other contract termination costs. Other charges include litigation contingency reserves, costs related to the transition agreement of our former CEO, asset impairment charges, expenses associated with the 2017 Malware Incident and gains or losses on the sale or disposition of certain non-strategic assets or product lines.
The components of restructuring and other charges, net are as follows:
2018 | 2017 | 2016 | |||||||||
Severance costs | $ | 36,824 | $ | 13,297 | $ | 13,133 | |||||
Costs of consolidating duplicate facilities | 5,056 | 6,735 | 11,606 | ||||||||
Total restructuring charges | 41,880 | 20,032 | 24,739 | ||||||||
Other charges | 21,618 | 41,022 | 485 | ||||||||
Total restructuring and other charges, net | $ | 63,498 | $ | 61,054 | $ | 25,224 | |||||
78
NUANCE COMMUNICATIONS, INC.
NOTES TO CONSOLIDATED FINANCIAL STATEMENTS — (Continued)
The following table sets forth accrual activity relating to restructuring reserves for fiscal years 2018, 2017 and 2016 (in thousands):
Personnel | Facilities | Total | |||||||||
Balance at September 30, 2015 | $ | 635 | $ | 6,222 | $ | 6,857 | |||||
Restructuring charges, net | 13,133 | 11,606 | 24,739 | ||||||||
Non-cash adjustment | (57 | ) | 164 | 107 | |||||||
Cash payments | (11,050 | ) | (6,860 | ) | (17,910 | ) | |||||
Balance at September 30, 2016 | 2,661 | 11,132 | 13,793 | ||||||||
Restructuring charges, net | 13,297 | 6,735 | 20,032 | ||||||||
Non-cash adjustment | — | (1,374 | ) | (1,374 | ) | ||||||
Cash payments | (14,412 | ) | (7,334 | ) | (21,746 | ) | |||||
Balance at September 30, 2017 | 1,546 | 9,159 | 10,705 | ||||||||
Restructuring charges, net | 36,824 | 5,056 | 41,880 | ||||||||
Non-cash adjustment | — | (998 | ) | (998 | ) | ||||||
Cash payments | (27,778 | ) | (5,599 | ) | (33,377 | ) | |||||
Balance at September 30, 2018 | $ | 10,592 | $ | 7,618 | $ | 18,210 | |||||
Restructuring and other charges, net by segment are as follows (dollars in thousands):
Personnel | Facilities | Total Restructuring | Other Charges | Total | |||||||||||||||
Fiscal Year 2018 | |||||||||||||||||||
Healthcare | $ | 11,563 | $ | 25 | $ | 11,588 | $ | — | $ | 11,588 | |||||||||
Enterprise | 4,217 | 2,243 | 6,460 | — | 6,460 | ||||||||||||||
Automotive | 4,160 | 20 | 4,180 | — | 4,180 | ||||||||||||||
Imaging | 5,304 | 1,168 | 6,472 | — | 6,472 | ||||||||||||||
Other | 1,473 | 647 | 2,120 | 7,103 | 9,223 | ||||||||||||||
Corporate | 10,107 | 953 | 11,060 | 14,515 | 25,575 | ||||||||||||||
Total fiscal year 2018 | $ | 36,824 | $ | 5,056 | $ | 41,880 | $ | 21,618 | $ | 63,498 | |||||||||
Fiscal Year 2017 | |||||||||||||||||||
Healthcare | $ | 4,283 | $ | 870 | $ | 5,153 | $ | 8,758 | $ | 13,911 | |||||||||
Enterprise | 2,141 | 3,480 | 5,621 | — | 5,621 | ||||||||||||||
Automotive | 1,838 | — | 1,838 | — | 1,838 | ||||||||||||||
Imaging | 744 | 387 | 1,131 | — | 1,131 | ||||||||||||||
Other | 2,954 | (15 | ) | 2,939 | 10,773 | 13,712 | |||||||||||||
Corporate | 1,337 | 2,013 | 3,350 | 21,491 | 24,841 | ||||||||||||||
Total fiscal year 2017 | $ | 13,297 | $ | 6,735 | $ | 20,032 | $ | 41,022 | $ | 61,054 | |||||||||
Fiscal Year 2016 | |||||||||||||||||||
Healthcare | $ | 3,531 | $ | 1,398 | $ | 4,929 | $ | — | $ | 4,929 | |||||||||
Enterprise | 1,214 | 2,782 | 3,996 | — | 3,996 | ||||||||||||||
Automotive | 1,967 | — | 1,967 | — | 1,967 | ||||||||||||||
Imaging | 284 | 478 | 762 | — | 762 | ||||||||||||||
Other | 3,870 | 1,557 | 5,427 | (486 | ) | 4,941 | |||||||||||||
Corporate | 2,267 | 5,391 | 7,658 | 971 | 8,629 | ||||||||||||||
Total fiscal year 2016 | $ | 13,133 | $ | 11,606 | $ | 24,739 | $ | 485 | $ | 25,224 | |||||||||
Fiscal Year 2018
For fiscal year 2018, we recorded restructuring charges of $41.9 million, which included $36.8 million related to the termination of approximately 1,495 employees and $5.1 million charge related to certain excess facilities, including adjustment to sublease assumptions associated with these facilities. These actions were part of our strategic initiatives focused on investment rationalization, process optimization and cost reduction. We expect the remaining outstanding severance of $10.6 million to be
79
NUANCE COMMUNICATIONS, INC.
NOTES TO CONSOLIDATED FINANCIAL STATEMENTS — (Continued)
substantially paid by the end of the first quarter of fiscal year 2019, and the remaining of $7.6 million for the excess facilities to be made through fiscal year 2027, in accordance with the terms of the applicable leases.
Additionally, during fiscal year 2018, we recorded $5.7 million for costs related to the transition agreement of our former CEO, $4.8 million professional services fees related to assessment and establishment of our corporate transformational efforts, $4.0 million related to our remediation and restoration effort after the 2017 Malware Incident, and fixed asset impairment charges of $7.1 million for SRS and Devices, as more fully described in Note 4. The cash payments associated with the CEO transition agreement are expected to be made through fiscal year 2020.
Fiscal Year 2017
For fiscal year 2017, we recorded restructuring charges of $20.0 million, which included $13.3 million related to the termination of approximately 807 terminated employees and $6.7 million charge related to certain excess facilities, including adjustment to sublease assumptions associated with these facilities. These actions were part of our initiatives to reduce costs and optimize processes.
Additionally, during fiscal year 2017, we recorded $8.1 million for costs related to the transition agreement of our former CEO, $18.1 million of professional services fees and $4.0 million of fixed asset and inventory write-down as a result of the 2017 Malware Incident, and an impairment charge of $10.8 million related to an internally developed software.
Fiscal Year 2016
For fiscal year 2016, we recorded restructuring charges of $24.7 million, which included $13.1 million related to the termination of approximately 452 employees as part of our initiatives to reduce costs and optimize processes, and $11.6 million charge related to certain excess facility space, including adjustment to sublease assumptions associated with these facilities.
Additionally, during fiscal year 2016, we recorded certain other charges that totaled $0.5 million for litigation contingency reserves.
13. Supplemental Cash Flow Information
Cash paid for Interest and Income Taxes:
Year Ended September 30, | |||||||||||
2018 | 2017 | 2016 | |||||||||
(Dollars in thousands) | |||||||||||
Interest paid | $ | 93,121 | $ | 91,718 | $ | 77,010 | |||||
Income taxes paid | $ | 20,802 | $ | 24,359 | $ | 21,068 | |||||
Non-Cash Investing and Financing Activities:
From time to time, we issue shares of our common stock in connection with our business and asset acquisitions, including shares issued as payment for acquisitions, shares initially held in escrow, and shares issued as payment for contingent consideration, which is discussed in Notes 2 and 3. In addition, in connection with certain collaboration agreements, we issued shares of our common stock to our partners in satisfaction of our payment obligations under the terms of the agreements, as discussed in Note 2.
14. Stockholders' Equity
Share Repurchases
On April 29, 2013, our Board of Directors approved a share repurchase program for up to $500.0 million, which was increased by $500.0 million on April 29, 2015. On August 1, 2018, our Board of Directors approved an additional $500.0 million under our share repurchase program. Under the terms of the share repurchase program, we have the ability to repurchase shares from time to time through a variety of methods, which may include open market purchases, privately negotiated transactions, block trades, accelerated share repurchase transactions, or any combination of such methods. The share repurchase program does not require us to acquire any specific number of shares and may be modified, suspended, extended or terminated by us at any time without prior notice. The timing and the amount of any purchases will be determined by management based on an evaluation of market conditions, capital allocation alternatives, and other factors.
80
NUANCE COMMUNICATIONS, INC.
NOTES TO CONSOLIDATED FINANCIAL STATEMENTS — (Continued)
We repurchased 9.7 million shares, 5.8 million shares and 9.4 million shares for $136.1 million, $99.1 million and $197.5 million during the fiscal years ended September 30, 2018, 2017 and 2016, respectively, under the program. The amount paid in excess of par value is recognized in additional paid in capital and these shares were retired upon repurchase. Since the commencement of the program, we have repurchased 56.2 million shares for $942.7 million, including 1.0 million shares repurchased from our Chief Executive Officer in fiscal year 2016. Approximately $557.3 million remained available for share repurchases as of September 30, 2018 pursuant to our share repurchase program.
Related Party Share Repurchases
In December 2015, as part of our share repurchase program, we repurchased 1.0 million shares from our former CEO, composed of 649,649 outstanding shares and 800,000 vested stock options with a net share equivalent of 350,351 shares, for an aggregate purchase price of $21.4 million, which approximated the fair value of our common stock on the day of the repurchase.
In March 2016, our Board of Directors approved a repurchase agreement with the Icahn Group to repurchase 26.3 million shares of our common stock at a price of $19.00 per share, which approximated the fair value of our common stock on the day of the repurchase, for a total purchase price of $500.0 million (the "Repurchase"). At the closing of the Repurchase, we paid $375.0 million in cash and issued a promissory note in the amount of $125.0 million. The promissory note bore interest at a rate per annum equal to approximately 2.64% and had a maturity date of June 13, 2016. On April 15, 2016, we fully repaid the promissory note. Immediately prior to the Repurchase, the Icahn Group owned approximately 60.8 million shares, or approximately 20%, of our outstanding common stock. In connection with the Repurchase, David Schechter and Brett Icahn, the Icahn Group representatives on our Board of Directors, resigned from our Board of Directors.
Stock Issuances
During the year ended September 30, 2017, we issued 844,108 shares of our common stock valued at $13.4 million in connection with a business acquisition and 175,000 shares of our common stock valued at $2.9 million associated with charitable contributions. During fiscal year 2016, we issued 403,325 shares of our common stock valued at $6.5 million to our partner in a healthcare collaboration agreement as settlement for a buy-out option and 5,749,807 shares of our common stock valued at $85.0 million as consideration for our acquisition of TouchCommerce, which are discussed in Notes 2 and 3.
Preferred Stock
We are authorized to issue up to 40,000,000 shares of preferred stock, par value $0.001 per share. The undesignated shares of preferred stock will have rights, preferences, privileges and restrictions, including voting rights, dividend rights, conversion rights, redemption privileges and liquidation preferences, as shall be determined by the Board of Directors upon issuance of the preferred stock. There were no outstanding shares of preferred stock as of September 30, 2018 or September 30, 2017.
Series A Preferred Stock
We have designated 1,000,000 shares as Series A Preferred Stock, par value $0.001 per share. The Series A Preferred Stock is entitled to receive dividends equal to the greater of $1.00 and 1,000 times the aggregate per share amount of all dividends declared on our Common Stock. Holders of each share of the Series A Preferred Stock are entitled to 1,000 votes on all matters submitted to a vote of the stockholders of the Corporation, and shall vote as one class. The Series A Preferred Stock is not redeemable, and has the right to certain liquidation preferences over our Common Stock. The Series A Preferred Stock ranks junior to all other series of the Preferred Stock as to the payment of dividends and the distribution of assets. There were no outstanding shares of preferred stock as of September 30, 2018 or September 30, 2017.
Series B Preferred Stock
We have designated 15,000,000 shares as Series B Preferred Stock, par value $0.001 per share. The Series B Preferred Stock is convertible into shares of common stock on a one-for-one basis and has a liquidation preference of $1.30 per share plus all declared but unpaid dividends. The holders of Series B Preferred Stock are entitled to non-cumulative dividends at the rate of $0.05 per annum per share, payable when, and if, declared by the Board of Directors. To date, no dividends have been declared by the Board of Directors. Holders of Series B Preferred Stock have no voting rights, except those rights provided under Delaware law. There were no outstanding shares of preferred stock as of September 30, 2018 or September 30, 2017.
81
NUANCE COMMUNICATIONS, INC.
NOTES TO CONSOLIDATED FINANCIAL STATEMENTS — (Continued)
15. Stock-Based Compensation
On February 28, 2018, our stockholders approved amendments to the Company’s amended and restated 2000 Stock Plan (the “Amended and Restated 2000 Stock Plan”). The Amended and Restated 2000 Stock Plan (i) increases the number of shares issuable by 6,400,000 to 82,250,000 shares; (ii) prohibits the payment of dividends relating to unvested awards unless and until such awards become vested; and (iii) prohibits shares that are withheld for taxes or to pay the exercise price of options or stock appreciation rights, or that are reacquired on the open market or otherwise using cash from option exercises, from becoming available for future grant under the Amended and Restated 2000 Stock Plan.
As of September 30, 2018, we had 13.4 million shares available for future grants under the Amended and Restated 2000 Stock Plan. We recognize stock-based compensation expenses over the requisite service periods. Our share-based awards are classified within equity. The amounts included in the condensed consolidated statements of operations related to stock-based compensation are as follows (in thousands):
2018 | 2017 | 2016 | |||||||||
Cost of professional services and hosting | $ | 31,299 | $ | 28,962 | $ | 31,054 | |||||
Cost of product and licensing | 816 | 348 | 376 | ||||||||
Cost of maintenance and support | 5,126 | 3,767 | 4,138 | ||||||||
Research and development | 40,087 | 33,061 | 35,671 | ||||||||
Sales and marketing | 39,656 | 45,813 | 49,064 | ||||||||
General and administrative | 33,801 | 42,321 | 43,525 | ||||||||
Total | $ | 150,785 | $ | 154,272 | $ | 163,828 | |||||
Stock Options
We have share-based award plans under which employees, officers and directors may be granted stock options to purchase our common stock, generally at the fair market value of the grant date. Our plans do not allow for options to be granted at below fair market value, nor can they be re-priced at any time. Options granted under our plans generally become exercisable over a period of two to four years and have a maximum term of ten years. We have also assumed options and option plans in connection with certain of our acquisitions. These stock options are governed by the plans and agreements that they were originally issued under but are now exercisable for shares of our common stock.
82
NUANCE COMMUNICATIONS, INC.
NOTES TO CONSOLIDATED FINANCIAL STATEMENTS — (Continued)
The table below summarizes activities related to stock options for the years ended September 30, 2018, 2017 and 2016:
Number of Shares | Weighted Average Exercise Price | Weighted Average Remaining Contractual Term | Aggregate Intrinsic Value(a) | |||||||||
Outstanding at September 30, 2015 | 2,923,989 | $ | 14.01 | |||||||||
Granted | — | $ | — | |||||||||
Exercised | (955,060 | ) | $ | 11.96 | ||||||||
Forfeited | — | $ | — | |||||||||
Expired | (3,103 | ) | $ | 10.42 | ||||||||
Outstanding at September 30, 2016 | 1,965,826 | $ | 15.01 | |||||||||
Granted | — | $ | — | |||||||||
Exercised/Repurchased(b) | (1,932,286 | ) | $ | 14.98 | ||||||||
Forfeited | — | $ | — | |||||||||
Expired | (9,733 | ) | $ | 20.01 | ||||||||
Outstanding at September 30, 2017 | 23,807 | $ | 15.39 | |||||||||
Granted | — | $ | — | |||||||||
Exercised | (2,963 | ) | $ | 2.61 | ||||||||
Forfeited | — | $ | — | |||||||||
Expired | (1,700 | ) | $ | 15.99 | ||||||||
Outstanding at September 30, 2018 | 19,144 | $ | 17.31 | 3.1 years | $ | 0.1 | million | |||||
Exercisable at September 30, 2018 | 19,144 | $ | 17.31 | 3.1 years | $ | 0.1 | million | |||||
Exercisable at September 30, 2017 | 23,798 | |||||||||||
Exercisable at September 30, 2016 | 1,965,817 | |||||||||||
(a) | The aggregate intrinsic value represents any excess of the closing price of our common stock of $17.32 on September 30, 2018 over the exercise price of the underlying options. |
(b) | We repurchased 1.0 million shares owned directly or indirectly by our Chief Executive Officer, including 649,649 outstanding shares and 800,000 vested stock options with a net share equivalent of 350,351 shares, for an aggregate purchase price of $21.4 million. |
As of September 30, 2018, there was no unamortized fair value of stock options. A summary of intrinsic value of stock options exercised is as follows:
2018 | 2017 | 2016 | |||||||||
Total intrinsic value of stock options exercised (in millions) | $ | 0.04 | $ | 3.59 | $ | 8.63 | |||||
Restricted Awards
We are authorized to issue equity incentive awards in the form of Restricted Awards, including Restricted Units and Restricted Stock, which are individually discussed below. Unvested Restricted Awards may not be sold, transferred or assigned. The fair value of the Restricted Awards is measured based upon the market price of the underlying common stock as of the date of grant, reduced by the purchase price of $0.001 per share of the awards. Restricted Awards generally vest over a period of two to four years. We also issued certain Restricted Awards with vesting solely dependent on the achievement of specified performance targets. The fair value of the Restricted Awards is amortized to expense over the awards’ applicable requisite service periods using the straight-line method. In the event that the employees’ employment with us terminates, or in the case of awards with only performance goals, if those goals are not met, any unvested shares are forfeited and revert to us.
In order to satisfy our employees’ withholding tax liability as a result of the vesting of Restricted Awards, we have historically repurchased shares upon the employees’ vesting. In fiscal year 2018, we withheld payroll taxes totaling $52.3 million related to 3.3 million shares of common stock that were repurchased or canceled.
83
NUANCE COMMUNICATIONS, INC.
NOTES TO CONSOLIDATED FINANCIAL STATEMENTS — (Continued)
Restricted Units
Restricted Units are not included in issued and outstanding common stock until the shares are vested and released. The table below summarizes activity relating to Restricted Units:
Number of Shares Underlying Restricted Units — Contingent Awards | Number of Shares Underlying Restricted Units — Time-Based Awards | ||||
Outstanding at September 30, 2015 | 4,700,210 | 7,007,839 | |||
Granted | 2,533,389 | 7,146,415 | |||
Earned/released | (2,254,445 | ) | (7,243,615 | ) | |
Forfeited | (754,666 | ) | (1,026,616 | ) | |
Outstanding at September 30, 2016 | 4,224,488 | 5,884,023 | |||
Granted | 3,224,696 | 8,457,761 | |||
Earned/released | (1,790,514 | ) | (7,150,783 | ) | |
Forfeited | (614,739 | ) | (713,837 | ) | |
Outstanding at September 30, 2017 | 5,043,931 | 6,477,164 | |||
Granted | 2,175,537 | 8,876,712 | |||
Earned/released | (2,092,862 | ) | (7,156,468 | ) | |
Forfeited | (2,087,038 | ) | (1,325,321 | ) | |
Outstanding at September 30, 2018 | 3,039,568 | 6,872,087 | |||
Weighted average remaining recognition period of outstanding Restricted Units | 1.0 year | 2.2 years | |||
Unrecognized stock-based compensation expense of outstanding Restricted Units | $33.1 million | $82.3 million | |||
Aggregate intrinsic value of outstanding Restricted Units (1) | $52.6 million | $119.1 million | |||
(1) | The aggregate intrinsic value represents any excess of the closing price of our common stock of $17.32 on September 30, 2018 over the exercise price of the underlying Restricted Units. |
A summary of the weighted-average grant-date fair value of Restricted Units granted, and the aggregate intrinsic value of Restricted Units vested for each fiscal year is as follows:
2018 | 2017 | 2016 | |||||||||
Weighted-average grant-date fair value per share | $ | 15.47 | $ | 16.31 | $ | 18.93 | |||||
Total intrinsic value of shares vested (in millions) | $ | 146.5 | $ | 146.0 | $ | 179.7 | |||||
84
NUANCE COMMUNICATIONS, INC.
NOTES TO CONSOLIDATED FINANCIAL STATEMENTS — (Continued)
Restricted Stock Awards
Restricted stock awards ("Restricted Stock") are included within the issued and outstanding common stock at the date of the grant. The table below summarizes activities related to Restricted Stock:
Number of Shares Underlying Restricted Stock | Weighted Average Grant Date Fair Value | |||||
Outstanding at September 30, 2015 | 250,000 | $ | 15.71 | |||
Granted | — | $ | — | |||
Vested | (250,000 | ) | $ | 15.71 | ||
Outstanding at September 30, 2016 | — | $ | — | |||
Granted | 250,000 | $ | 15.55 | |||
Vested | (250,000 | ) | $ | 15.55 | ||
Outstanding at September 30, 2017 | — | $ | — | |||
Granted | — | $ | — | |||
Vested | — | $ | — | |||
Outstanding at September 30, 2018 | — | $ | — | |||
A summary of the weighted-average grant-date fair value of Restricted Stock granted, and the aggregate intrinsic value of Restricted Stock vested for each fiscal year is as follows:
2018 | 2017 | 2016 | |||||||||
Weighted-average grant-date fair value per share | $ | — | $ | 15.55 | $ | — | |||||
Total intrinsic value of shares vested (in millions) | $ | — | $ | 3.9 | $ | 4.3 | |||||
1995 Employee Stock Purchase Plan
Our 1995 Employee Stock Purchase Plan (the "Plan”), as amended and restated on January 27, 2015, authorizes the issuance of a maximum of 20,000,000 shares of common stock in semi-annual offerings to employees at a price equal to the lower of 85% of the closing price on the applicable offering commencement date or 85% of the closing price on the applicable offering termination date. Stock-based compensation expense for the employee stock purchase plan is recognized for the fair value benefit accorded to participating employees. At September 30, 2018, we have reserved 5,099,834 shares for future issuance. A summary of the weighted-average grant-date fair value, shares issued and total stock-based compensation expense recognized related to the Plan are as follows:
2018 | 2017 | 2016 | |||||||||
Weighted-average grant-date fair value per share | $ | 4.00 | $ | 3.84 | $ | 3.97 | |||||
Total shares issued (in millions) | 1.3 | 1.3 | 1.2 | ||||||||
Total stock-based compensation expense (in millions) | $ | 5.2 | $ | 4.9 | $ | 4.8 | |||||
The fair value of the purchase rights granted under this plan was estimated on the date of grant using the Black-Scholes option-pricing model that uses the following weighted-average assumptions, which were derived in a manner similar to those discussed above relative to stock options:
2018 | 2017 | 2016 | ||||||
Dividend yield | 0.0 | % | 0.0 | % | 0.0 | % | ||
Expected volatility | 32.1 | % | 29.3 | % | 34.0 | % | ||
Average risk-free interest rate | 2.0 | % | 0.9 | % | 0.5 | % | ||
Expected term (in years) | 0.5 | 0.5 | 0.5 | |||||
85
NUANCE COMMUNICATIONS, INC.
NOTES TO CONSOLIDATED FINANCIAL STATEMENTS — (Continued)
16. Commitments and Contingencies
Operating Leases
We have various operating leases for office space around the world. In connection with many of our acquisitions, we assumed facility lease obligations. Among these assumed obligations are lease payments related to office locations that were vacated by certain of the acquired companies prior to the acquisition date. Additionally, certain of our lease obligations have been included in various restructuring charges (Note 12).
The following table outlines our gross future minimum payments under all non-cancelable operating leases as of September 30, 2018 (dollars in thousands):
Year Ending September 30, | Operating Leases | Operating leases under restructuring | Total | |||||||||
2019 | $ | 29,119 | $ | 10,128 | $ | 39,247 | ||||||
2020 | 21,299 | 9,359 | 30,658 | |||||||||
2021 | 18,216 | 8,536 | 26,752 | |||||||||
2022 | 16,449 | 8,456 | 24,905 | |||||||||
2023 | 15,572 | 8,734 | 24,306 | |||||||||
Thereafter | 64,310 | 15,663 | 79,973 | |||||||||
Total | $ | 164,965 | $ | 60,876 | $ | 225,841 | ||||||
As of September 30, 2018, we have subleased certain office space that is included in the above table to third parties. As of September 30, 2018, the aggregate sublease income to be recognized during the remaining lease terms for restructured facilities is $42.8 million, with approximately $5.9 million annually for each of the next five fiscal years and approximately $13.3 million thereafter.
Total rent expense, including rent expense for our data centers, was approximately $45.7 million, $38.5 million and $38.3 million for the years ended September 30, 2018, 2017 and 2016, respectively.
Litigation and Other Claims
Similar to many companies in the software industry, we are involved in a variety of claims, demands, suits, investigations and proceedings that arise from time to time relating to matters incidental to the ordinary course of our business, including actions with respect to contracts, intellectual property, employment, benefits and securities matters. If the potential loss from any claim or legal proceeding is considered probable and the amount can be reasonably estimated, we accrue a liability for the estimated loss. Significant judgments are required for the determination of probability and the range of the outcomes. Due to the inherent uncertainties, estimates are based only on the best information available at the time. Actual outcomes may differ from our estimates. As additional information becomes available, we reassess the potential liability related to our pending claims and litigation and may revise our estimates. Such revisions may have a material impact on our results of operations and financial position. As of September 30, 2018 and 2017, accrued losses were not material to our consolidated financial statements, and we do not expect any pending matter to have a material impact on our consolidated financial statements.
Guarantees and Other
We include indemnification provisions in the contracts we enter into with customers and business partners. Generally, these provisions require us to defend claims arising out of our products’ infringement of third-party intellectual property rights, breach of contractual obligations and/or unlawful or otherwise culpable conduct. The indemnity obligations generally cover damages, costs and attorneys’ fees arising out of such claims. In most, but not all cases, our total liability under such provisions is limited to either the value of the contract or a specified, agreed upon amount. In some cases, our total liability under such provisions is unlimited. In many, but not all cases, the term of the indemnity provision is perpetual. While the maximum potential amount of future payments we could be required to make under all the indemnification provisions is unlimited, we believe the estimated fair value of these provisions is minimal due to the low frequency with which these provisions have been triggered.
86
NUANCE COMMUNICATIONS, INC.
NOTES TO CONSOLIDATED FINANCIAL STATEMENTS — (Continued)
We indemnify our directors and officers to the fullest extent permitted by Delaware law, which provides among other things, indemnification to directors and officers for expenses, judgments, fines, penalties and settlement amounts incurred by such persons in their capacity as a director or officer of the company, regardless of whether the individual is serving in any such capacity at the time the liability or expense is incurred. Additionally, in connection with certain acquisitions, we agreed to indemnify the former officers and members of the boards of directors of those companies, on similar terms as described above, for a period of six years from the acquisition date. In certain cases, we purchase director and officer insurance policies related to these obligations, which fully cover the six-year period. To the extent that we do not purchase a director and officer insurance policy for the full period of any contractual indemnification, and such directors and officers do not have coverage under separate insurance policies, we would be required to pay for costs incurred, if any, as described above.
17. Pension and Other Post-Retirement Benefits
Defined Contribution Plans
We have established a retirement savings plan under Section 401(k) of the Internal Revenue Code (the “401(k) Plan”). The 401(k) Plan covers substantially all of our U.S. employees who meet minimum age and service requirements, and allows participants to defer a portion of their annual compensation on a pre-tax basis. We match 50% of employee contributions up to 4% of eligible salary. Employer's contributions vest one-third annually over a three-year period. Our contributions to the 401(k) Plan that covers substantially all of our U.S. employees who meet the minimum requirements totaled $6.7 million, $6.7 million and $6.6 million for fiscal years 2018, 2017 and 2016, respectively. We make contributions to various other plans in certain of our foreign operations; total contributions to these plans are not material.
Defined Benefit Plans
We sponsor certain defined benefit plans that are offered primarily by our foreign subsidiaries. Many of these plans were assumed through our acquisitions or are required by local regulatory requirements. We may deposit funds for these plans with insurance companies, third party trustees, or into government-managed accounts consistent with local regulatory requirements, as applicable. Our total defined benefit pension expenses were $0.3 million, $0.4 million and $0.1 million for fiscal years 2018, 2017 and 2016, respectively. The aggregate projected benefit obligation as of September 30, 2018 and September 30, 2017 was $34.7 million and $37.2 million, respectively. The aggregate net liability of our defined benefit plans as of September 30, 2018 and September 30, 2017 was $11.1 million and $13.2 million, respectively.
18. Income Taxes
Recent Tax Legislation
On December 22, 2017, the Tax Cuts and Jobs Act ("TCJA") was signed into law. The TCJA significantly revises the U.S. corporate income tax by, among other things, lowering corporate income tax rates, implementing a hybrid territorial tax system, and imposing a mandatory one-time repatriation tax on foreign cash and earnings.
As a result of the TCJA, we remeasured certain deferred tax assets and liabilities at the lower rates and recorded approximately $92.9 million of tax benefits for fiscal year 2018. Additionally, as of September 30, 2018, we recorded a $5.8 million provision for the deemed repatriation of foreign cash and earnings, which is estimated based upon estimated foreign earnings and foreign income taxes. We are in the process of finalizing our assessment, which will be completed in December 2018.
Provision for Income Taxes
The components of (loss) income before income taxes are as follows (in thousands):
Year Ended September 30, | |||||||||||
2018 | 2017 | 2016 | |||||||||
Domestic | $ | (187,616 | ) | $ | (228,406 | ) | $ | (118,410 | ) | ||
Foreign | (29,119 | ) | 109,391 | 120,149 | |||||||
(Loss) income before income taxes | $ | (216,735 | ) | $ | (119,015 | ) | $ | 1,739 | |||
87
NUANCE COMMUNICATIONS, INC.
NOTES TO CONSOLIDATED FINANCIAL STATEMENTS — (Continued)
The components of the (benefit) provision for income taxes are as follows (in thousands):
Year Ended September 30, | |||||||||||
2018 | 2017 | 2016 | |||||||||
Current: | |||||||||||
Federal | $ | 4,189 | $ | — | $ | — | |||||
State | 598 | 2,185 | 3,230 | ||||||||
Foreign | 25,623 | 24,941 | 22,981 | ||||||||
Total current | 30,410 | 27,126 | 26,211 | ||||||||
Deferred: | |||||||||||
Federal | (83,319 | ) | 7,291 | (7,235 | ) | ||||||
State | 2,303 | 1,133 | (1,962 | ) | |||||||
Foreign | (6,201 | ) | (3,569 | ) | (2,817 | ) | |||||
Total deferred | (87,217 | ) | 4,855 | (12,014 | ) | ||||||
(Benefit) provision for income taxes | $ | (56,807 | ) | $ | 31,981 | $ | 14,197 | ||||
Effective income tax rate | 26.2 | % | (26.9 | )% | 816.4 | % | |||||
The (benefit) provision for income taxes differed from the amount computed by applying the federal statutory rate to our (loss) income before income taxes as follows (in thousands):
Year Ended September 30, | |||||||||||
2018 | 2017 | 2016 | |||||||||
Federal tax benefit at statutory rate | $ | (53,165 | ) | $ | (41,655 | ) | $ | 609 | |||
State tax provision, net of federal benefit | 1,698 | 2,560 | 137 | ||||||||
Foreign tax rate and other foreign related tax items | (13,539 | ) | (20,415 | ) | (25,976 | ) | |||||
Repatriated earnings, net of foreign tax credits | — | — | 71,343 | ||||||||
Stock-based compensation | 3,290 | 6,934 | 6,154 | ||||||||
Non-deductible expenditures | 2,546 | 3,247 | 3,235 | ||||||||
Change in U.S. and foreign valuation allowance | 56,557 | 72,318 | (53,079 | ) | |||||||
TCJA impact | (87,057 | ) | — | — | |||||||
Goodwill impairment | 28,640 | — | — | ||||||||
Executive compensation | 503 | 5,492 | 4,749 | ||||||||
Other | 3,720 | 3,500 | 7,025 | ||||||||
(Benefit) provision for income taxes | $ | (56,807 | ) | $ | 31,981 | $ | 14,197 | ||||
The effective income tax rate is based upon the income for the year, the composition of the income in different countries, changes relating to valuation allowances for certain countries if and as necessary, and adjustments, if any, for the potential tax consequences, benefits or resolutions of audits or other tax contingencies. Our aggregate income tax rate in foreign jurisdictions is lower than our income tax rate in the United States; the majority of our income before provision for income taxes from foreign operations has been earned by subsidiaries in Ireland. Our effective tax rate may be adversely affected by earnings being lower than anticipated in countries where we have lower statutory tax rates and higher than anticipated in countries where we have higher statutory tax rates.
The effective income tax rate in fiscal year 2018 differs from the U.S. federal statutory rate of 24.5% primarily due to the net tax benefits resulting from the TCJA remeasurement of deferred tax assets and liabilities at the lower enacted rate, and our foreign earnings subject to lower tax rates, offset in part by additional valuation allowance related to current period losses, the tax effect of goodwill impairment charges that are not deductible, and the provision for the deemed repatriation of foreign cash and earnings.
The effective income tax rate in fiscal year 2017 differs from the U.S. federal statutory rate of 35% primarily due to additional valuation allowance related to current period losses in the United States, and an increase in deferred tax liabilities related to goodwill, partially offset by our earnings in foreign operations that are subject to significantly lower tax rates than U.S. statutory tax rate.
88
NUANCE COMMUNICATIONS, INC.
NOTES TO CONSOLIDATED FINANCIAL STATEMENTS — (Continued)
The effective income tax rates in fiscal year 2016 differs from the U.S. federal statutory rate of 35% primarily due to additional valuation allowance related to current period losses in the United States, an increase in the deferred tax liabilities related to goodwill, and an increase in current tax provisions due to the one-time repatriation of foreign earnings offset by the utilization of previously unbenefited domestic loss and credit carryforwards. These were offset in part by our foreign earnings subject to significantly lower tax rates, and a $22.1 million release of domestic valuation allowance as a result of tax benefits recorded in connection with our acquisitions during the period for which a deferred tax liability was established in purchase accounting.
As of September 30, 2018, we have not provided taxes on $310.5 million of undistributed earnings of our foreign subsidiaries, which may be subject to foreign withholding taxes upon repatriation, as we consider these earnings indefinitely reinvested. Our indefinite reinvestment determination is based on the future operational and capital requirements of our domestic and foreign operations. We expect our international cash and cash equivalents and marketable securities of $112.8 million will continue to be used for our foreign operations and therefore do not anticipate repatriating these funds. As of September 30, 2018, it is not practical to calculate the unrecognized deferred tax liability on these earnings due to the complexities of the utilization of foreign tax credits and other tax assets.
Deferred tax assets (liabilities) consist of the following as of September 30, 2018 and 2017 (in thousands):
2018 | 2017 | ||||||
Deferred tax assets: | |||||||
Net operating loss carryforwards | $ | 192,017 | $ | 269,495 | |||
Federal and state credit carryforwards | 46,721 | 58,803 | |||||
Accrued expenses and other reserves | 41,371 | 53,795 | |||||
Difference in timing of revenue related items | 81,647 | 100,971 | |||||
Deferred compensation | 19,315 | 30,528 | |||||
Other | 13,802 | 20,424 | |||||
Total deferred tax assets | 394,873 | 534,016 | |||||
Valuation allowance for deferred tax assets | (183,295 | ) | (229,449 | ) | |||
Net deferred tax assets | 211,578 | 304,567 | |||||
Deferred tax liabilities: | |||||||
Depreciation | (15,729 | ) | (36,016 | ) | |||
Convertible debt | (92,452 | ) | (136,609 | ) | |||
Acquired intangibles | (131,959 | ) | (221,707 | ) | |||
Unremitted earnings of foreign subsidiaries | — | (20,850 | ) | ||||
Net deferred tax liabilities | $ | (28,562 | ) | $ | (110,615 | ) | |
Reported as: | |||||||
Other assets | $ | 21,369 | $ | 20,705 | |||
Long-term deferred tax liabilities | (49,931 | ) | (131,320 | ) | |||
Net deferred tax liabilities | $ | (28,562 | ) | $ | (110,615 | ) | |
Deferred tax assets are reduced by a valuation allowance if, based on the weight of available positive and negative evidence, it is more likely than not that some portion or all the deferred tax assets will not be realized. During fiscal year 2018, the valuation allowance for deferred tax assets decreased by $46.2 million. This decrease mainly relates to the remeasurement of deferred tax assets and liabilities at the TCJA lower federal tax rate of 21% and the reduction of foreign tax credit carryforwards utilized and the TCJA mandatory repatriation of foreign earnings tax. The decrease was partially offset by reduction of deferred tax liabilities due to intangible asset impairments, establishment of valuation allowance related to current period losses, and reversal of deferred tax liabilities on foreign earnings. As of September 30, 2018, we have $142.8 million and $40.5 million in valuation allowance against our net domestic and foreign deferred tax assets, respectively. As of September 30, 2017, we had $202.3 million and $27.1 million in valuation allowance against our net domestic and foreign deferred tax assets, respectively.
The majority of deferred tax assets relate to net operating losses, the use of which may not be available as a result of limitations on the use of acquired losses. With respect to these operating losses, there is no assurance that they will be used given the current assessment of the limitations on their use or our current projection of future taxable income in the entities for which these losses relate. Based on our analysis, we have concluded that it is not more likely than not that the majority of our deferred tax assets can
89
NUANCE COMMUNICATIONS, INC.
NOTES TO CONSOLIDATED FINANCIAL STATEMENTS — (Continued)
be realized and therefore a valuation allowance has been assigned to these deferred tax assets. If we are subsequently able to utilize all or a portion of the deferred tax assets for which a valuation allowance has been established, then we may be required to recognize these deferred tax assets through the reduction of the valuation allowance which could result in a material benefit to our results of operations in the period in which the benefit is determined.
At September 30, 2018 and 2017, we had U.S. federal net operating loss carryforwards of $692.9 million and $642.0 million, respectively. At September 30, 2018 and 2017, we had state net operating loss carryforwards of $259.1 million and $262.7 million, respectively. The net operating loss and credit carryforwards are subject to an annual limitation due to the ownership change limitations provided by the Internal Revenue Code of 1986 and similar state tax provisions. As of September 30, 2018 and 2017, we had foreign net operating loss carryforwards of $164.9 million and $168.8 million, respectively. These carryforwards will expire at various dates beginning in 2018 and extending up to an unlimited period.
As of September 30, 2018 and 2017, we had federal research and development carryforwards and foreign tax credit carryforwards of $30.2 million and $43.5 million, respectively. As of September 30, 2018 and 2017, we had state research and development credit and investment tax credit carryforwards of $5.3 million and $6.2 million, respectively. As of September 30, 2018 and 2017, we had foreign investment tax credit carryforwards of $14.7 million and $14.8 million, respectively.
Uncertain Tax Positions
We recognize tax benefits from uncertain tax positions only if it is more likely than not that the tax position will be sustained on examination by the taxing authorities, based on the technical merits of the position. The tax benefits recognized in the financial statements from such positions are then measured based on the largest benefit which is more likely than not to be realized upon ultimate settlement. We recognize interest and penalties related to uncertain tax positions in our provision for income taxes line of our consolidated statements of operations.
The aggregate changes in the balance of our gross unrecognized tax benefits were as follows (in thousands):
September 30, | |||||||
2018 | 2017 | ||||||
Balance at the beginning of the year | $ | 34,058 | $ | 31,955 | |||
Increases related to tax positions from prior fiscal years | 1,720 | 2,745 | |||||
Decreases related to tax positions from prior fiscal years | (2,281 | ) | (602 | ) | |||
Increases for tax positions taken during current period | 1,709 | 1,676 | |||||
Decreases for tax settlements and lapse in statutes | (4,083 | ) | (1,083 | ) | |||
Cumulative translation adjustments | (724 | ) | (633 | ) | |||
Balance at the end of the year | $ | 30,399 | $ | 34,058 | |||
As of September 30, 2018, $30.4 million of the unrecognized tax benefits, if recognized, would impact our effective tax rate. We do not expect a significant change in the amount of unrecognized tax benefits within the next 12 months. We recognized interest and penalties related to uncertain tax positions in our provision for income taxes of $1.4 million, $2.1 million, and $2.2 million during fiscal years 2018, 2017, and 2016, respectively. We recorded interest and penalties of $10.8 million and $9.9 million as of September 30, 2018 and 2017, respectively.
We are subject to U.S. federal income tax, various state and local taxes, and international income taxes in numerous jurisdictions. The federal tax returns for 1999 through 2014 remain subject to examination for the purpose of determining the amount of remaining tax NOL and other carryforwards. Additionally, the federal tax returns for 2015 through 2018 years remain open for all purposes of examination by the IRS and other taxing authorities in material jurisdictions.
19. Related Party Transaction
In January 2018, we entered into a software and license agreement (the "License Agreement") with Magnet Systems, Inc. ("Magnet") which was pre-approved by our Board of Directors. A member of the Magnet board of directors also served on our board of directors at the time of the transaction. Pursuant to the License Agreement, Magnet granted us a perpetual software license to certain technology for a one-time payment of $5.0 million in cash, with $3.5 million paid immediately upon the effective date of the License Agreement and $1.5 million payable upon the earlier of (i) the 120-day period following the effective date of the License Agreement or (ii) signature of a statement of work for the engineering services described below.
90
NUANCE COMMUNICATIONS, INC.
NOTES TO CONSOLIDATED FINANCIAL STATEMENTS — (Continued)
Additionally, we entered into a service agreement (the "Service Agreement") with Magnet, pursuant to which, Magnet will provide engineering services to assist in integrating the licensed technology into certain of our Enterprise solutions. Based upon the statement of work signed on April 19, 2018, total fees under the Service Agreement should not exceed $2.0 million and are payable within thirty days after receipt of each invoice for services performed and accepted in accordance with the terms of the Service Agreement.
For fiscal year 2018, we made a total payment of $5.7 million to Magnet, with $5.0 million related to the license and $0.7 million related to the integration services. As of September 30, 2018, $0.4 million was included within Accounts payable.
20. Segment and Geographic Information
During the first quarter of fiscal year 2018, we commenced a review of our segment reporting structure to better align our Chief Operating Decision Maker's ("CODM") long-term strategic focus with our organizational structure. During the second quarter of fiscal year 2018, we implemented a number organizational changes to align our segment reporting structure with our long-term strategic focuses, including (i) establishing our Automotive business as a separate operating segment, (ii) moving our Dragon TV business from our former Mobile operating segment into our Enterprise operating segment to consolidate our telecommunications market resources, and (iii) establishing an Other segment that includes our SRS and Devices businesses, previously reported within our former Mobile operating segment. As a result, segment information for fiscal years 2018, 2017 and 2016 has been recast to reflect the new segment reporting structure.
Our CODM regularly reviews segment revenues and segment profits for performance evaluation and resources allocation. Segment revenues include certain acquisition-related adjustments for revenues that would otherwise have been recognized without the acquisition. Segment profits reflect controllable costs directly related to each segment and the allocation of certain corporate expenses such as, corporate sales and marketing expenses and research and development project costs that benefit multiple segments. Certain items such as stock-based compensation, amortization of intangible assets, acquisition-related costs, net, restructuring and other charges, net, other expenses, net and certain unallocated corporate expenses are excluded from segment profits, which allow for more meaningful comparisons to the financial results of the historical operations for performance evaluation and resources allocation by our CODM.
• | The Healthcare segment is primarily engaged in providing clinical speech and clinical language understanding solutions that improve the clinical documentation process, from capturing the complete patient record to improving clinical documentation and quality measures for reimbursement. |
• | The Enterprise segment is primarily engaged in using speech, natural language understanding, and artificial intelligence to provide automated customer solutions and services for voice, mobile, web and messaging channels. |
• | The Automotive segment is primarily engaged in providing automotive manufacturers and their suppliers branded and personalized virtual assistants and connected car services built on our voice recognition and natural language understanding technologies. |
• | The Imaging segment is primarily engaged in software solutions and expertise that help professionals and organizations to gain optimal control of their document and information processes through scanning and print management. |
• | Other segment includes our SRS and Devices businesses. Our SRS business provides value-added services to mobile operators in India and Brazil (“Mobile Operator Services”) and voicemail transcription services to mobile operators in the rest of the world (“Voicemail-to-Text”). Our Devices business provides speech recognition solutions and predictive text technologies for handset devices. |
91
NUANCE COMMUNICATIONS, INC.
NOTES TO CONSOLIDATED FINANCIAL STATEMENTS — (Continued)
As we do not track our assets by operating segment, we do not include total assets or depreciation expenses by operating segment. The following table presents segment results along with a reconciliation of segment profits to (loss) income before income taxes (in thousands):
Year Ended September 30, | |||||||||||
2018 | 2017 | 2016 | |||||||||
Segment revenues: | |||||||||||
Healthcare | $ | 984,819 | $ | 899,341 | $ | 973,297 | |||||
Enterprise | 483,194 | 474,317 | 396,026 | ||||||||
Automotive | 279,402 | 252,218 | 214,267 | ||||||||
Imaging | 212,903 | 217,749 | 241,569 | ||||||||
Other | 109,064 | 133,766 | 154,434 | ||||||||
Total segment revenues | 2,069,382 | 1,977,391 | 1,979,593 | ||||||||
Acquisition related revenue adjustments (a) | (17,721 | ) | (38,029 | ) | (30,690 | ) | |||||
Total consolidated revenue | 2,051,661 | 1,939,362 | 1,948,903 | ||||||||
Segment profit: | |||||||||||
Healthcare | 331,382 | 262,149 | 313,466 | ||||||||
Enterprise | 142,422 | 135,638 | 129,259 | ||||||||
Automotive | 109,867 | 118,869 | 95,660 | ||||||||
Imaging | 67,391 | 79,512 | 100,823 | ||||||||
Other | 28,417 | 41,568 | 38,434 | ||||||||
Total segment profit | 679,479 | 637,736 | 677,642 | ||||||||
Corporate expenses and other, net | (199,411 | ) | (125,924 | ) | (128,239 | ) | |||||
Acquisition-related revenues and costs of revenues adjustment | (17,721 | ) | (38,029 | ) | (29,765 | ) | |||||
Stock-based compensation | (150,785 | ) | (154,272 | ) | (163,828 | ) | |||||
Amortization of intangible assets | (147,966 | ) | (178,748 | ) | (170,897 | ) | |||||
Acquisition-related costs, net | (16,101 | ) | (27,740 | ) | (17,166 | ) | |||||
Restructuring and other charges, net | (63,498 | ) | (61,054 | ) | (25,224 | ) | |||||
Impairment of goodwill and other intangible assets | (170,941 | ) | — | — | |||||||
Costs associated with IP collaboration agreements (b) | — | — | (4,000 | ) | |||||||
Other expenses, net | (129,791 | ) | (170,984 | ) | (136,784 | ) | |||||
(Loss) income before income taxes | $ | (216,735 | ) | $ | (119,015 | ) | $ | 1,739 | |||
(a) | Segment revenues differ from reported revenues due to certain revenue adjustments related to acquisitions that would otherwise have been recognized but for the purchase accounting treatment of the business combinations. These revenues are included to allow for more complete comparisons to the financial results of historical operations and in evaluating management performance. |
(b) | We entered into certain collaboration agreements in order to gain access to a third party’s extensive speech recognition technology, natural language technology, and semantic processing technology. Pursuant to these agreements, we had sole rights to commercialize such intellectual property for periods ranging between two to six years. For fiscal year 2016, we recognized $4.0 million as sales and marketing expense for the exclusive commercialization rights related to one of these collaboration agreements in our consolidated statements of operations. No expenses were recognized for fiscal years 2018 and 2017. |
No country outside of the United States provided greater than 10% of our total revenue. Revenue, classified by the major geographic areas in which our customers are located, was as follows (dollars in thousands):
2018 | 2017 | 2016 | |||||||||
United States | $ | 1,470,669 | $ | 1,352,039 | $ | 1,385,265 | |||||
International | 580,992 | 587,323 | 563,638 | ||||||||
Total | $ | 2,051,661 | $ | 1,939,362 | $ | 1,948,903 | |||||
92
NUANCE COMMUNICATIONS, INC.
NOTES TO CONSOLIDATED FINANCIAL STATEMENTS — (Continued)
No country outside of the United States held greater than 10% of our long-lived or total assets. Our long-lived assets, including intangible assets and goodwill, were located as follows (dollars in thousands):
September 30, 2018 | September 30, 2017 | ||||||
United States | $ | 3,378,698 | $ | 3,604,140 | |||
International | 995,050 | 999,842 | |||||
Total | $ | 4,373,748 | $ | 4,603,982 | |||
21. Subsequent Event
During the third quarter of fiscal year 2018, we commenced a strategic and operational review of our business with the goal of improving our focuses on leveraging our core strengths in key vertical markets and sustaining our long-term growth and profitability.
In connection with our strategic business review, our Board of Directors approved the divestiture of our Imaging business on November 7, 2018. On November 11, 2018, we entered into a definitive stock purchase agreement, pursuant to which we agreed to sell our Imaging business and associated assets for a total cash consideration of approximately $400 million. The transaction, which is subject to regulatory review and other customary closing conditions, is expected to close by the end of the second quarter of fiscal year 2019.
Additionally, on November 19, 2018, we announced our intent to spin off our Automotive business into an independent publicly-traded company through a pro rata distribution to our common stock holders. Completion of the proposed spin-off is subject to certain conditions, including final approval by our Board of Directors. We are targeting to compete the separation of the business by the end of fiscal year 2019.
22. Quarterly Data (Unaudited)
The following information has been derived from unaudited consolidated financial statements that, in the opinion of management, include all recurring adjustments necessary for a fair statement of such information (dollars in thousands, except per share amounts):
First Quarter | Second Quarter | Third Quarter | Fourth Quarter | Fiscal Year | |||||||||||||||
2018 | |||||||||||||||||||
Total revenue | $ | 501,645 | $ | 514,224 | $ | 502,887 | $ | 532,905 | $ | 2,051,661 | |||||||||
Gross profit | $ | 280,451 | $ | 285,236 | $ | 289,449 | $ | 322,955 | $ | 1,178,091 | |||||||||
Net income (loss) | $ | 53,228 | $ | (164,053 | ) | $ | (14,037 | ) | $ | (35,066 | ) | $ | (159,928 | ) | |||||
Net income (loss) per share: | |||||||||||||||||||
Basic | $ | 0.18 | $ | (0.56 | ) | $ | (0.05 | ) | $ | (0.12 | ) | $ | (0.55 | ) | |||||
Diluted | $ | 0.18 | $ | (0.56 | ) | $ | (0.05 | ) | $ | (0.12 | ) | $ | (0.55 | ) | |||||
Weighted average common shares outstanding: | |||||||||||||||||||
Basic | 291,367 | 294,103 | 292,663 | 287,052 | 291,318 | ||||||||||||||
Diluted | 295,995 | 294,103 | 292,663 | 287,052 | 291,318 | ||||||||||||||
First Quarter | Second Quarter | Third Quarter | Fourth Quarter | Fiscal Year | |||||||||||||||
2017 | |||||||||||||||||||
Total revenue | $ | 487,658 | $ | 499,573 | $ | 486,221 | $ | 465,910 | $ | 1,939,362 | |||||||||
Gross profit | $ | 275,248 | $ | 286,155 | $ | 270,008 | $ | 254,151 | $ | 1,085,562 | |||||||||
Net loss | $ | (23,929 | ) | $ | (33,808 | ) | $ | (27,836 | ) | $ | (65,423 | ) | $ | (150,996 | ) | ||||
Net loss per share: | |||||||||||||||||||
Basic | $ | (0.08 | ) | $ | (0.12 | ) | $ | (0.10 | ) | $ | (0.23 | ) | $ | (0.52 | ) | ||||
Diluted | $ | (0.08 | ) | $ | (0.12 | ) | $ | (0.10 | ) | $ | (0.23 | ) | $ | (0.52 | ) | ||||
Weighted average common shares outstanding: | |||||||||||||||||||
Basic | 288,953 | 291,021 | 287,856 | 288,718 | 289,348 | ||||||||||||||
Diluted | 288,953 | 291,021 | 287,856 | 288,718 | 289,348 | ||||||||||||||
93
Item 9. | Changes in and Disagreements with Accountants on Accounting and Financial Disclosure |
Not applicable.
Item 9A.Controls and Procedures
Disclosure Controls and Procedures
Our management, with the participation of our Chief Executive Officer and Chief Financial Officer, has evaluated the effectiveness of our disclosure controls and procedures. Our disclosure controls and procedures are designed (i) to ensure that information required to be disclosed by us in the reports that we file or submit under the Securities Exchange Act of 1934, as amended (the "Exchange Act") is recorded, processed and summarized and reported within the time periods specified in the SEC’s rules and forms and (ii) to ensure that information required to be disclosed in the reports we file or submit under the Exchange Act is accumulated and communicated to our management, including our Chief Executive Officer and Chief Financial Officer, to allow timely decisions regarding required disclosure. Based on that evaluation, our Chief Executive Officer and Chief Financial Officer concluded that, as of September 30, 2018, our disclosure controls and procedures were effective.
Management Report on Internal Control Over Financial Reporting
Management is responsible for establishing and maintaining adequate internal control over financial reporting, as defined in Rules 13a-15(f) and 15d-15(f) under the Exchange Act. Our internal control over financial reporting is designed to provide reasonable assurance regarding the reliability of financial reporting and the preparation of financial statements for external reporting purposes in accordance with generally accepted accounting principles. Our internal control over financial reporting includes those policies and procedures that:
• | pertain to the maintenance of records that, in reasonable detail, accurately and fairly reflect the transactions and dispositions of our assets; |
• | provide reasonable assurance that transactions are recorded as necessary to permit preparation of financial statements in accordance with generally accepted accounting principles, and that our receipts and expenditures are being made only in accordance with authorizations of our management and directors; and, |
• | provide reasonable assurance regarding prevention or timely detection of unauthorized acquisition, use or disposition of our assets that could have a material effect on the financial statements. |
Because of its inherent limitations, internal control over financial reporting may not prevent or detect misstatements. Also, projections of any evaluation of effectiveness to future periods are subject to the risk that controls may become inadequate because of changes in conditions and that the degree of compliance with the policies or procedures may deteriorate.
Management has assessed the effectiveness of our internal control over financial reporting as of September 30, 2018, utilizing the criteria set forth by the Committee of Sponsoring Organizations of the Treadway Commission (“COSO”) in the 2013 Internal Control-Integrated Framework. Based on the results of this assessment, management (including our Chief Executive Officer and our Chief Financial Officer) has concluded that, as of September 30, 2018, our internal control over financial reporting was effective.
The attestation report concerning the effectiveness of our internal control over financial reporting as of September 30, 2018 issued by BDO USA, LLP, an independent registered public accounting firm, appears in Item 8 of this Annual Report on Form 10-K.
Changes in Internal Controls Over Financial Reporting
There have been no changes in our internal controls over financial reporting during the fourth quarter of fiscal 2018 that have materially affected, or are reasonably likely to materially affect, our internal controls over financial reporting.
94
Item 9B. | Other Information |
On November 19, 2018, the Compensation Committee of the Board of Directors approved the payment of a $1 million transaction bonus to Alvaro Monserrat, the Executive Vice President and General Manager of the Imaging business, upon and subject to the occurrence of the closing of the sale of the Imaging business, in recognition of Mr. Monserrat’s integral role in the transaction. The Committee also approved the payment of a bonus under the Company’s annual incentive plan, upon and subject to the closing of the transaction, to Mr. Monserrat in the amount of 100% of target in the event that the closing occurs on or before March 31, 2019, and in an amount based on the Company’s projected fiscal year forecast in the event the closing occurs after March 31, 2019, in each case pro-rated for the portion of the fiscal year that runs to and including the closing date. Each such bonus may be paid to Mr. Monserrat in cash or equity, at the Company’s option. The Committee also approved the acceleration and vesting of all of Mr. Monserrat’s outstanding performance stock units, at target, and restricted stock units, scheduled to vest through November 30, 2019, such acceleration and vesting to occur upon and subject to the closing of the transaction. Mr. Monserrat must remain continuously employed with the Company and work diligently and in good faith through the closing of the transaction in order to be eligible for the bonuses and accelerated vesting summarized above.
PART III
Certain information required by Part III is omitted from this Annual Report on Form 10-K since we intend to file our definitive Proxy Statement for our next Annual Meeting of Stockholders, pursuant to Regulation 14A of the Securities Exchange Act of 1934, as amended (the “Proxy Statement”), within 120 days of the end of the fiscal year covered by this report, and certain information to be included in the Proxy Statement is incorporated herein by reference.
Item 10. | Directors, Executive Officers and Corporate Governance |
The information required by this item concerning our directors is incorporated by reference to the information set forth in the section titled “Election of Directors” in our Proxy Statement. Information required by this item concerning our executive officers is incorporated by reference to the information set forth in the section entitled “Executive Compensation, Management and Other Information” in our Proxy Statement. Information regarding Section 16 reporting compliance is incorporated by reference to the information set forth in the section entitled “Section 16(a) Beneficial Ownership Reporting Compliance” in our Proxy Statement.
Our Board of Directors adopted a Code of Business Conduct and Ethics for all of our directors, officers and employees on September 15, 2015. Our Code of Business Conduct and Ethics can be found at our website: www.nuance.com. We will provide to any person without charge, upon request, a copy of our Code of Business Conduct and Ethics. Such a request should be made in writing and addressed to Investor Relations, Nuance Communications, Inc., 1 Wayside Road, Burlington, MA 01803.
To date, there have been no waivers under our Code of Business Conduct and Ethics. We will post any waivers, if and when granted, of our Code of Business Conduct and Ethics on our website at www.nuance.com.
Item 11. | Executive Compensation |
The information required by this item regarding executive compensation is incorporated by reference to the information set forth in the section titled “Executive Compensation, Management and Other Information” in our Proxy Statement.
Item 12. | Security Ownership of Certain Beneficial Owners and Management and Related Stockholders Matters |
The information required by this item regarding security ownership of certain beneficial owners and management is incorporated by reference to the information set forth in the sections titled “Security Ownership of Certain Beneficial Owners and Management” and “Equity Compensation Plan Information” in our Proxy Statement.
95
Item 13. | Certain Relationships and Related Transactions, and Director Independence |
It is the policy of the Board that all transactions required to be reported pursuant to Item 404 of Regulation S-K be subject to approval by the Audit Committee of the Board. In furtherance of relevant Nasdaq rules and our commitment to corporate governance, the charter of the Audit Committee provides that the Audit Committee shall review and approve any proposed related party transactions including, transactions required to be reported pursuant to Item 404 of Regulation S-K for potential conflict of interest situations. The Audit Committee reviews the material facts of all transactions that require the committee’s approval and either approves or disapproves of the transaction. In determining whether to approve a transaction, the Audit Committee will take into account, among other factors it deems appropriate, whether the transaction is on terms no less favorable than terms generally available to an unaffiliated third-party under the same or similar circumstances.
The additional information required by this item regarding certain relationships and related party transactions is incorporated by reference to the information set forth in the sections titled “Transactions with Related Persons” and “Corporate Governance-Board Independence” in our Proxy Statement.
Item 14. | Principal Accountant Fees and Services |
The information required by this section is incorporated by reference from the information in the section entitled “Ratification of Appointment of Independent Registered Public Accounting Firm” in our Proxy Statement.
PART IV
Item 15. | Exhibits and Financial Statement Schedules |
(a) | The following documents are filed as a part of this Report: |
(1) | Financial Statements — See Index to Financial Statements in Item 8 of this Report. |
(2) | Financial Statement Schedules — All schedules have been omitted as the requested information is inapplicable or the information is presented in the financial statements or related notes included as part of this Report. |
(3) | Exhibits — See Item 15(b) of this Report below. |
(b) | Exhibits. |
EXHIBIT INDEX
Incorporated by Reference | ||||||||||||
Exhibit Index # | Exhibit Description | Form | File No. | Exhibit | Filing Date | Filed Herewith | ||||||
3.1 | 10-Q | 0-27038 | 3.2 | 5/11/2001 | ||||||||
3.2 | 10-Q | 0-27038 | 3.1 | 8/9/2004 | ||||||||
3.3 | 8-K | 0-27038 | 3.1 | 10/19/2005 | ||||||||
3.4 | 8-K | 0-27038 | 3.1 | 11/9/2018 | X | |||||||
3.5 | S-3 | 333-142182 | 3.3 | 4/18/2007 | ||||||||
3.6 | 8-K | 0-27038 | 3.1 | 8/20/2013 | ||||||||
96
Incorporated by Reference | ||||||||||||
Exhibit Index # | Exhibit Description | Form | File No. | Exhibit | Filing Date | Filed Herewith | ||||||
3.7 | 8-K | 0-27038 | 3.2 | 8/20/2013 | ||||||||
4.1 | Specimen Common Stock Certificate. | 8-A | 0-27038 | 4.1 | 12/6/1995 | |||||||
4.2 | 8-K | 0-27038 | 4.1 | 10/24/2011 | ||||||||
4.3 | 8-K | 0-27038 | 4.1 | 8/14/2012 | ||||||||
4.4 | 8-K | 0-27038 | 4.1 | 8/20/2013 | ||||||||
4.5 | 8-K | 001-36056 | 4.2 | 8/18/2014 | ||||||||
4.6 | 8-K | 001-36056 | 4.1 | 6/22/2015 | ||||||||
4.7 | 8-K | 001-36056 | 4.1 | 12/7/2015 | ||||||||
4.8 | 8-K | 001-36056 | 4.1 | 6/22/2016 | ||||||||
10.1 | S-8 | 333-108767 | 5/10/2018 | |||||||||
10.2 | S-8 | 001-36056 | 4.2 | 2/6/2015 | ||||||||
10.3 | 8-K | 001-36056 | 10.1 | 3/6/2018 | ||||||||
10.4 | 10-K/A | 0-27038 | 10.17 | 12/15/2006 | ||||||||
10.5 | 10-K/A | 0-27038 | 10.18 | 12/15/2006 | ||||||||
10.6 | 10-K/A | 0-27038 | 10.19 | 12/15/2006 | ||||||||
10.7 | 10-Q | 001-36056 | 10.3 | 8/9/2018 | ||||||||
10.8 | 8-K | 0-27038 | 10.1 | 11/17/2016 | ||||||||
10.9 | 10-K | 001-36056 | 10.9 | 11/22/2016 | ||||||||
10.10 | 10-Q | 001-36056 | 10.2 | 8/9/2018 | ||||||||
97
Incorporated by Reference | ||||||||||||
Exhibit Index # | Exhibit Description | Form | File No. | Exhibit | Filing Date | Filed Herewith | ||||||
10.11 | 8-K | 001-36056 | 10.1 | 12/2/2015 | ||||||||
10.12 | 8-K | 001-36056 | 10.1 | 4/19/2016 | ||||||||
10.13 | 8-K | 001-36056 | 10.2 | 4/19/2016 | ||||||||
10.14 | 8-K | 001-36056 | 10.1 | 6/17/2016 | ||||||||
10.15 | 8-K | 001-36056 | 10.1 | 9/7/2016 | ||||||||
10.16 | X | |||||||||||
10.17 | 8-K | 001-36056 | 10.1 | 3/22/2018 | ||||||||
10.18 | 8-K | 001-36056 | 2.1 | 11/14/2018 | ||||||||
14.1 | X | |||||||||||
21.1 | X | |||||||||||
23.1 | X | |||||||||||
24.1 | X | |||||||||||
31.1 | X | |||||||||||
31.2 | X | |||||||||||
32.1 | X | |||||||||||
101 | The following materials from Nuance Communications, Inc.’s Annual Report on Form 10-K for the fiscal year ended September 30, 2018, formatted in XBRL (Extensible Business Reporting Language): (i) the Consolidated Statements of Operations, (ii) the Consolidated Statements of Comprehensive Loss, (iii) the Consolidated Balance Sheets, (iv) the Consolidated Statements of Cash Flows, and (v) Notes to Unaudited Condensed Consolidated Financial Statements. | |||||||||||
* | Denotes management compensation plan or arrangement | |
98
SIGNATURES
Pursuant to the requirements of Section 13 or 15(d) of the Securities Exchange Act of 1934, the Registrant has duly caused this Annual Report on Form 10-K to be signed on its behalf by the undersigned, thereunto duly authorized.
NUANCE COMMUNICATIONS, INC. | ||
By: | /s/ Mark Benjamin | |
Mark Benjamin | ||
Chief Executive Officer | ||
POWER OF ATTORNEY
KNOW ALL PERSONS BY THESE PRESENTS, that each individual whose signature appears below constitutes and appoints Mark Benjamin and Daniel D. Tempesta, and each of them acting individually, as his or her true and lawful attorneys-in-fact and agents, each with full power of substitution and resubstitution, for him or her and in his or her name, place and stead, in any and all capacities, to sign any and all amendments to this Annual Report on Form 10-K and to file the same with all exhibits thereto, and all documents in connection therewith, with the Securities and Exchange Commission, granting unto said attorneys-in-fact and agents, and each of them, full power and authority to do and perform each and every act and thing requisite and necessary to be done, as fully to all intents and purposes as he or she might or could do in person, and hereby ratifying and confirming all that said attorneys-in-fact and agents or any of them, or their or his substitute or substitutes, may lawfully do or cause to be done by virtue hereof. This power of attorney may be executed in counterparts.
Pursuant to the requirements of the Securities Exchange Act of 1934, this Annual Report on Form 10-K has been signed by the following persons in the capacities and on the dates indicated.
/s/ Mark Benjamin | ||
Date: 11/20/2018 | Mark Benjamin, Chief Executive Officer (Principal Executive Officer) | |
/s/ Daniel D. Tempesta | ||
Date: 11/20/2018 | Daniel D. Tempesta Executive Vice President and Chief Financial Officer (Principal Financial Officer) | |
/s/ Arthur Giterman | ||
Date: 11/20/2018 | Arthur Giterman Senior Vice President, Chief Accounting Officer and Corporate Controller (Principal Accounting Officer) | |
/s/ Daniel J. Brennan | ||
Date: 11/20/2018 | Daniel J. Brennan, Director | |
/s/ Laura S. Kaiser | ||
Date: 11/20/2018 | Laura S. Kaiser, Director | |
/s/ Lloyd A. Carney | ||
Date: 11/20/2018 | Lloyd A. Carney, Chairman of the Board | |
/s/ Mark R. Laret | ||
Date: 11/20/2018 | Mark R. Laret, Director | |
/s/ Michal Katz | ||
Date: 11/20/2018 | Michal Katz, Director | |
/s/ Robert J, Finocchio, Jr | ||
Date: 11/20/2018 | Robert J, Finocchio, Jr., Director | |
/s/ Sanjay N. Vaswani | ||
Date: 11/20/2018 | Sanjay N. Vaswani, Director | |
/s/ Thomas D. Ebling | ||
Date: 11/20/2018 | Thomas D. Ebling, Director | |
Item 16. | Form 10-K Summary |
Not applicable.