Attached files
| file | filename |
|---|---|
| EX-99.2 - EXHIBIT 99.2 - ONE Gas, Inc. | financialguidancenr.htm |
| EX-99.1 - EXHIBIT 99.1 - ONE Gas, Inc. | dividenddeclarationnr.htm |
| 8-K - 8-K - ONE Gas, Inc. | ogs2020guidanceanddivi.htm |

Exhibit 99.3 2020 FINANCIAL GUIDANCE January 21, 2020

Forward-Looking Statements Statements contained in this presentation that include company expectations or predictions should be considered forward-looking statements that are covered by the safe harbor provisions of the Securities Act of 1933 and the Securities and Exchange Act of 1934. It is important to note that the actual results could differ materially from those projected in such forward-looking statements. For additional information that could cause actual results to differ materially from such forward-looking statements, refer to ONE Gas’ Securities and Exchange Commission filings. All future cash dividends discussed in this presentation are subject to the approval of the ONE Gas board of directors. All references in this presentation to guidance are based on news releases issued on or before Jan. 21, 2020, and are not being updated or affirmed by this presentation. 2 | ONE Gas, Inc.

2020 Guidance Summary Initiated Jan. 21, 2020 DILUTED EPS 2020 $3.51 $3.56 • Net income range of $186 ‒ $198 million $3.25 • EPS range of $3.44 ‒ $3.68 per diluted share $3.08 • Estimated average rate base of $3.91 billion $2.65 • Average rate base growth of 7% between 2019 ‒ 2024 2016 2017 2018 2019G* 2020G* *Represents midpoint of guidance range, updated Jan. 21, 2020 Expected average annual EPS growth of 5 – 7% between 2019 and 2024 3 | ONE Gas, Inc. FINANCIAL GUIDANCE

Growing Dividends Building Shareholder Value DIVIDENDS & PAYOUT RATIO Quarterly dividend: $2.16 $2.00 54 cents per share in 2020* $1.84 • $1.68 • Target dividend payout ratio $1.40 57% 61% of 55 ‒ 65% of net income 57% 55% 53% *Subject to board approval 2016 2017 2018 2019G 2020G Expected average annual growth of 6 – 8% between 2019 and 2024 4 | ONE Gas, Inc. FINANCIAL GUIDANCE

Return on Equity 8.1% 8.3%* 8.4%* Continue to minimize the gap between allowed 7.7% 7.9% and actual returns Authorized ROE by state: • Kansas ‒ Not stated due to black box settlement; KGS estimates ROE embedded in GSRS pre-tax carrying charge is ~ 9.3% • Oklahoma ‒ 9% to 10% band, with a 9.5% midpoint 2016 2017 2018 2019G 2020G • Texas ‒ ~ 9.5% weighted average * Reflects the midpoint of earnings guidance and estimated average rate base 5 | ONE Gas, Inc. FINANCIAL GUIDANCE

Cash Flow Sources and Uses $591 $591 Dividends and capital expenditures primarily funded by Financing cash flow from operations requirements $174 Capital ) expenditures and $700 million revolving credit facility supports financing asset removal ILLIONS costs needs through the commercial paper program (M Cash flow from $475 operations* $417 ~$850 ‒ $900 million net financing needs through 2024 • ~25% expected to be equity Dividends $116 2020 Sources 2020 Uses * Before changes in working capital. See non-GAAP information in Appendix. 6 | ONE Gas, Inc. FINANCIAL GUIDANCE

Manageable Debt Profile Strong Liquidity Position – Sept. 30, 2019 DEBT MATURITIES LIQUIDITY PROFILE (MILLIONS) (MILLIONS) $600 $700 $400 $300 4.658% $396 4.500% 3.610% 2024 2044 2048 Credit Facility Short-term Borrowings* * Includes commercial paper and letters of credit 7 | ONE Gas, Inc. FINANCIAL GUIDANCE

CAPITAL EXPENDITURES & RATE BASE

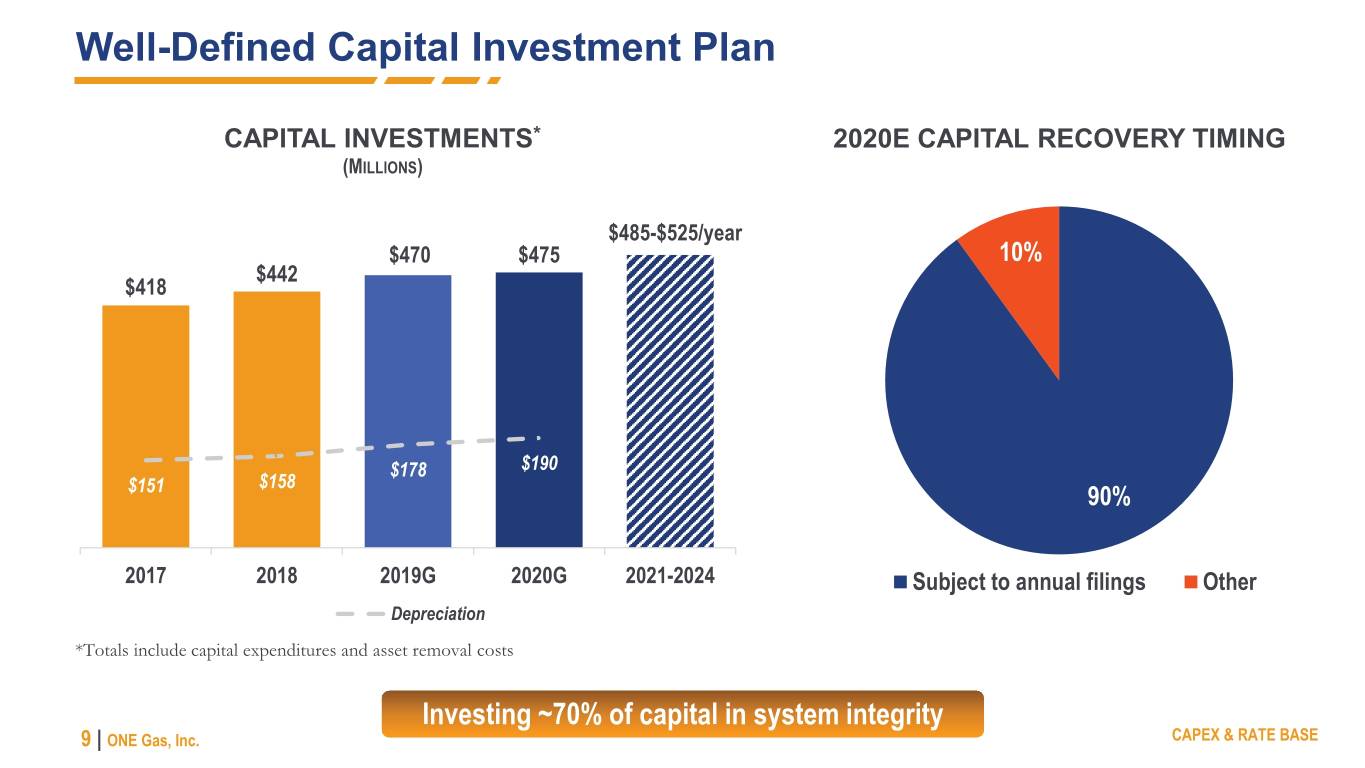
Well-Defined Capital Investment Plan CAPITAL INVESTMENTS* 2020E CAPITAL RECOVERY TIMING (MILLIONS) $485-$525/year $470 $475 10% $442 $418 $178 $190 $158 $151 90% 2017 2018 2019G 2020G 2021-2024 Subject to annual filings Other Depreciation *Totals include capital expenditures and asset removal costs Investing ~70% of capital in system integrity 9 | ONE Gas, Inc. CAPEX & RATE BASE

Capital Expenditures with Asset Removal Costs OKLAHOMA TEXAS KANSAS 2019: 2.5X DEPRECIATION 2019: 3.6X DEPRECIATION 2019: 1.9X DEPRECIATION $191 * $180 $181 * $173 $166 * $156 * $126 $128 * $149 $123 $123 * $136 $122 $105 $106 $67 ) $64 $78 $52 $69 $74 $47 $50 ILLIONS $67 $64 $40 $43 (M $34 $37 $29 2016 2017 2018 2019G 2020G 2016 2017 2018 2019G 2020G 2016 2017 2018 2019G 2020G * Represents midpoint of guidance, updated Jan. 21, 2020 Note: Capital expenditures include accruals Depreciation 10 | ONE Gas, Inc. CAPEX & RATE BASE

Rate Base Growth ESTIMATED AVERAGE RATE BASE* 2020 ESTIMATED AVERAGE RATE BASE (BILLIONS) TOTAL: $3.91 BILLION* $3.91 $3.62 $3.18 $3.36 $2.96 $1.14 billion $1.65 billion $1.12 billion 2016 2017 2018 2019G 2020G Oklahoma Kansas Texas * For definition of estimated average rate base, see Rate Base Definition slide Expected average annual growth of 7% between 2019 and 2024 11 | ONE Gas, Inc. CAPEX & RATE BASE

APPENDIX

2020 Guidance Table (Unaudited) 2020 (Millions of dollars, except per share amount) Total revenues* $ 1,567 Cost of natural gas 574 Operating expenses Operations and maintenance 435 Depreciation and amortization 190 General taxes 61 Total operating expenses 686 Operating income 307 Other income (expense), net (7) Interest expense (67) Income before income taxes 233 Income taxes (41) Net income* $ 192 Earnings per share, diluted* $ 3.56 *Represents midpoint of guidance range 13 | ONE Gas, Inc. APPENDIX

Authorized Rate Base OKLAHOMA¹ KANSAS² TEXAS¹ $1,475 4 $1,407 3 $1,257 $1,202 4 $1,033 $1,068 4 $947 $986 $979 $925 $895 $826 $822 $781 $745 $639 ) ILLIONS (M 2015 2016 2017 2018 2019 2014 2015 2016 2017 2018 2019 2015 2016 2017 2018 2019 ¹ Rate bases presented in this table are those from the last approved rate filings for each jurisdiction. These amounts are not necessarily indicative of current or future rate bases. ² KGS’ most recent rate case, approved in February 2019, was settled without a determination of rate base and reflects Kansas Gas Service’s estimate of rate base contained within the settlement; these amounts are not necessarily indicative of current or future rate base. 3 Reflects the 2018 PBRC filing, approved in January 2019 4 As of December 2019 14 | ONE Gas, Inc. APPENDIX

Rate Base Definition Authorized Rate Base – $3.63 billion (as of December 2019) • Includes capital investments authorized in most recent rate case and interim filings • Does not include any capital investments since last approved rate case or filings 2020G Estimated Average Rate Base – $3.91 billion • Average of rate base per book at beginning and end of year • Includes capital investments and other changes in rate base not yet approved for recovery 15 | ONE Gas, Inc. APPENDIX

Non-GAAP Information ONE Gas has disclosed in this presentation cash flow from operations before changes in working capital, which is a non-GAAP financial measure. Cash flow from operations before changes in working capital is used as a measure of the company's financial performance. Cash flow from operations before changes in working capital is defined as net income adjusted for depreciation and amortization, deferred income taxes, and certain other noncash items. This non-GAAP financial measure is useful to investors as an indicator of financial performance of the company to generate cash flows sufficient to support our capital expenditure programs and pay dividends to our investors. ONE Gas cash flow from operations before changes in working capital should not be considered in isolation or as a substitute for net income, total revenue or any other measure of financial performance presented in accordance with GAAP. This non-GAAP financial measure excludes some, but not all, items that affect net income. Additionally, these calculations may not be comparable with similarly titled measures of other companies. Reconciliations of cash flow from operations before changes in working capital to the most directly comparable GAAP measure is included in this presentation. 16 | ONE Gas, Inc. APPENDIX

Non-GAAP Reconciliation Cash Flow From Operations Before Changes in Working Capital* 2020** (MILLIONS) GUIDANCE Net Income $ 192 Depreciation and amortization 190 Deferred taxes 20 Other 15 Cash flow from operations before changes in working capital $ 417 * Amounts shown are midpoints of ranges provided ** As of Jan. 21, 2020 17 | ONE Gas, Inc. APPENDIX
