Attached files
| file | filename |
|---|---|
| EX-32.2 - DINAN CERTIFICATION SECTION 906 - ONE Gas, Inc. | ogs10-k2016exhibit322.htm |
| EX-32.1 - NORTON CERTIFICATION SECTION 906 - ONE Gas, Inc. | ogs10-k2016exhibit321.htm |
| EX-31.2 - DINAN CERTIFICATION SECTION 302 - ONE Gas, Inc. | ogs10-k2016exhibit312.htm |
| EX-31.1 - NORTON CERTIFICATION SECTION 302 - ONE Gas, Inc. | ogs10-k2016exhibit311.htm |
| EX-23.1 - CONSENT OF INDEPENDENT REGISTERED PUBLIC ACCOUNTING FIRM - ONE Gas, Inc. | ogs10-k2016exhibit231.htm |
| EX-21.1 - SUBSIDIARIES OF ONE GAS, INC. - ONE Gas, Inc. | ogs10-k2016exhibit211.htm |
| EX-12.1 - RATIO OF EARNINGS TO FIXED CHARGES - ONE Gas, Inc. | ogs10-k2016exhibit121.htm |
| EX-10.19 - DF COMP PLAN - NON EMPLOYEE DIRECTORS - ONE Gas, Inc. | ogs10-k2016exhibit1019.htm |
| EX-10.16 - 2017 PSU AGREEMENT - ONE Gas, Inc. | ogs10-k2016exhibit1016.htm |
| EX-10.15 - 2017 RSU AGREEMENT - ONE Gas, Inc. | ogs10-k2016exhibit1015.htm |
| EX-10.5 - ANNUAL OFFICER INCENTIVE PLAN - ONE Gas, Inc. | ogs10-k2016exhibit105.htm |
UNITED STATES
SECURITIES AND EXCHANGE COMMISSION
WASHINGTON, D.C. 20549
FORM 10-K
X ANNUAL REPORT PURSUANT TO SECTION 13 OR 15(d) OF THE SECURITIES EXCHANGE ACT OF 1934
For the fiscal year ended December 31, 2016.
OR
__ TRANSITION REPORT PURSUANT TO SECTION 13 OR 15(d) OF THE SECURITIES EXCHANGE ACT OF 1934
For the transition period from __________ to __________.
Commission file number 001-36108
ONE Gas, Inc.
(Exact name of registrant as specified in its charter)
Oklahoma | 46-3561936 |
(State or other jurisdiction of incorporation or organization) | (I.R.S. Employer Identification No.) |
15 East Fifth Street, Tulsa, OK | 74103 |
(Address of principal executive offices) | (Zip Code) |
Registrant’s telephone number, including area code (918) 947-7000
Securities registered pursuant to Section 12(b) of the Act:
Common stock, par value of $0.01 | New York Stock Exchange |
(Title of each class) | (Name of each exchange on which registered) |
Securities registered pursuant to Section 12(g) of the Act: None
Indicate by check mark if the registrant is a well-known seasoned issuer, as defined in Rule 405 of the Securities Act. Yes X No__
Indicate by check mark if the registrant is not required to file reports pursuant to Section 13 or Section 15(d) of the Act. Yes __ No X
Indicate by check mark whether the registrant (1) has filed all reports required to be filed by Section 13 or 15(d) of the Securities Exchange Act of 1934 during the preceding 12 months (or for such shorter period that the registrant was required to file such reports), and (2) has been subject to such filing requirements for the past 90 days. Yes X No __
Indicate by check mark whether the registrant has submitted electronically and posted on its corporate website, if any, every Interactive Data File required to be submitted and posted pursuant to Rule 405 of Regulation S-T (§ 232.405 of this chapter) during the preceding 12 months (or for such shorter period that the registrant was required to submit and post such files). Yes X No _
Indicate by check mark if disclosure of delinquent filers pursuant to Item 405 of Registration S-K (§229.405 of this chapter) is not contained herein, and will not be contained, to the best of registrant’s knowledge, in definitive proxy or information statements incorporated by reference in Part III of this Form 10-K or any amendment to this Form 10-K. X
Indicate by check mark whether the registrant is a large accelerated filer, an accelerated filer, a non-accelerated filer, or a smaller reporting company. See the definitions of “large accelerated filer,” “accelerated filer” and “smaller reporting company” in Rule 12b-2 of the Exchange Act. (Check one) Large accelerated filer X Accelerated filer __ Non-accelerated filer __ Smaller reporting company __
Indicate by check mark whether the registrant is a shell company (as defined in Rule 12b-2 of the Act). Yes__ No X
The aggregate market value of the equity securities held by nonaffiliates based on the closing trade price of the registrant on June 30, 2016, was $3.2 billion.
On February 10, 2017, we had 52,283,788 shares of common stock outstanding.
DOCUMENTS INCORPORATED BY REFERENCE:
Portions of the definitive proxy statement to be delivered to shareholders in connection with the Annual Meeting of Shareholders to be held May 25, 2017, are incorporated by reference in Part III.
ONE Gas, Inc.
2016 ANNUAL REPORT
Page No. | |||
Item 16. | Form 10-K Summary | ||
As used in this Annual Report, references to “we,” “our,” “us” or the “company” refer to ONE Gas, Inc., an Oklahoma corporation, and its predecessors and subsidiary, unless the context indicates otherwise.
2
GLOSSARY
The abbreviations, acronyms and industry terminology used in this Annual Report are defined as follows:
ACA | Annual Cost Adjustment |
AFUDC | Allowance for funds used during construction |
Annual Report | Annual Report on Form 10-K for the year ended December 31, 2016 |
ASU | Accounting Standards Update |
ATSR | Ad-Valorem Tax Surcharge Rider |
Bcf | Billion cubic feet |
Bcf/d | Billion cubic feet per day |
CERCLA | Federal Comprehensive Environmental Response, Compensation and Liability Act of 1980, as amended |
CFTC | Commodities Futures Trading Commission |
Clean Air Act | Federal Clean Air Act, as amended |
Clean Water Act | Federal Water Pollution Control Amendments of 1972, as amended |
CNG | Compressed natural gas |
Code | Internal Revenue Code of 1986, as amended |
COG | Cost of gas |
COGR | Cost of gas rider |
COSA | Cost-of-Service Adjustment |
DOT | United States Department of Transportation |
Dth | Dekatherm |
EPA | United States Environmental Protection Agency |
EPARR | El Paso Annual Rate Review |
EPS | Earnings per share |
EPSA | El Paso Service Area |
Exchange Act | Securities Exchange Act of 1934, as amended |
FASB | Financial Accounting Standards Board |
FERC | Federal Energy Regulatory Commission |
GAAP | Accounting principles generally accepted in the United States of America |
GRIP | Texas Gas Reliability Infrastructure Program |
GSRS | Gas System Reliability Surcharge |
Heating Degree Day or HDD | A measure designed to reflect the demand for energy needed for heating based on the extent to which the daily average temperature falls below a reference temperature for which no heating is required, usually 65 degrees Fahrenheit |
IFRS | International Financial Reporting Standards |
IRS | U.S. Internal Revenue Service |
IRS Ruling | Private Letter Ruling from IRS |
KCC | Kansas Corporation Commission |
KDHE | Kansas Department of Health and Environment |
kWh | Kilowatt hour |
LDCs | Local distribution companies |
LIBOR | London Interbank Offered Rate |
Moody’s | Moody’s Investors Service, Inc. |
MMcf | Million cubic feet |
NOL | Net operating loss |
NPRM | Notice of proposed rulemaking |
NYMEX | New York Mercantile Exchange |
NYSE | New York Stock Exchange |
OCC | Oklahoma Corporation Commission |
ONE Gas | ONE Gas, Inc. |
ONE Gas Credit Agreement | ONE Gas’ $700 million revolving credit agreement, which expires in January 2019 |
3
ONE Gas Predecessor | ONE Gas’ predecessor for accounting purposes that consists of the business attributable to ONEOK’s natural gas distribution segment that was transferred to ONE Gas in connection with its separation from ONEOK |
ONEOK | ONEOK, Inc. and its subsidiaries |
ONEOK Partners | ONEOK Partners, L.P. and its subsidiaries |
OSHA | Occupational Safety and Health Administration |
PBRC | Performance-Based Rate Change |
PGA | Purchased Gas Adjustment |
PHMSA | United States Department of Transportation Pipeline and Hazardous Materials Safety Administration |
Pipeline Safety Improvement Act | Pipeline Safety Improvement Act of 2002, as amended |
Pipeline Safety, Regulatory Certainty and Job Creation Act | Pipeline Safety, Regulatory Certainty and Job Creation Act of 2011, as amended |
ROE | Return on equity calculated consistent with utility ratemaking principles in each jurisdiction in which we operate |
RRC | Railroad Commission of Texas |
S&P | Standard and Poor’s Rating Services |
SEC | Securities and Exchange Commission |
Securities Act | Securities Act of 1933, as amended |
Senior Notes | ONE Gas’ registered notes consisting of $300 million of 2.07 percent senior notes due 2019, $300 million of 3.61 percent senior notes due 2024 and $600 million of 4.658 percent notes due 2044. |
Separation and Distribution Agreement | Separation and Distribution Agreement dated January 14, 2014, between ONEOK and ONE Gas |
TAC | Temperature Adjustment Clause |
Tax Matters Agreement | Tax Matters Agreement dated January 14, 2014, between ONEOK and ONE Gas |
Transition Services Agreement | Transition Services Agreement dated January 14, 2014, between ONEOK and ONE Gas |
WNA | Weather normalization adjustments |
XBRL | eXtensible Business Reporting Language |
The statements in this Annual Report that are not historical information, including statements concerning plans and objectives of management for future operations, economic performance or related assumptions, are forward-looking statements. Forward-looking statements may include words such as “anticipate,” “estimate,” “expect,” “project,” “intend,” “plan,” “believe,” “should,” “goal,” “forecast,” “guidance,” “could,” “may,” “continue,” “might,” “potential,” “scheduled” and other words and terms of similar meaning. Although we believe that our expectations regarding future events are based on reasonable assumptions, we can give no assurance that such expectations and assumptions will be achieved. Important factors that could cause actual results to differ materially from those in the forward-looking statements are described under Part I, Item 1A, “Risk Factors,” and Part II, Item 7, Management’s Discussion and Analysis of Financial Condition and Results of Operation and “Forward-Looking Statements,” in this Annual Report.
4
PART I
ITEM 1. BUSINESS
OUR BUSINESS
We are a 100 percent regulated natural gas distribution utility, headquartered in Tulsa, Oklahoma. We are one of the largest publicly traded natural gas utilities in the United States, and successor to the company founded in 1906 as Oklahoma Natural Gas Company, which became ONEOK, Inc. (NYSE: OKE) in 1980. On January 31, 2014, ONE Gas officially separated from ONEOK.
We provide natural gas distribution services to more than 2 million customers, and we are the largest natural gas distributor in Oklahoma and Kansas and the third largest in Texas, in terms of customers. We serve residential, commercial and industrial, transportation and wholesale and public authority customers in all three states. Our largest natural gas distribution markets in terms of customers are Oklahoma City and Tulsa, Oklahoma; Kansas City, Wichita and Topeka, Kansas; and Austin and El Paso, Texas. Our three divisions, Oklahoma Natural Gas, Kansas Gas Service and Texas Gas Service, distribute natural gas to approximately 88 percent, 72 percent and 13 percent of the natural gas distribution customers in Oklahoma, Kansas and Texas, respectively.
Our common stock trades on the NYSE under the symbol “OGS,” and is included in the S&P MidCap 400 Index.
SEPARATION FROM ONEOK, INC.
On January 8, 2014, ONEOK’s board of directors approved the distribution of all the shares of our common stock to holders of ONEOK common stock.
In order for ONEOK to effect the distribution, we requested, and the SEC declared effective, our Registration Statement on Form 10 on January 10, 2014. ONEOK transferred all of the assets and liabilities primarily related to its natural gas distribution business to us. Assets and liabilities included accounts receivable and payable, natural gas in storage, regulatory assets and liabilities, pipeline and other natural gas distribution facilities, customer deposits, employee-related assets and liabilities, including amounts attributable to pension and other postemployment benefits, tax-related assets and liabilities and other assets and liabilities primarily associated with providing natural gas distribution service in Oklahoma, Kansas and Texas. Cash and certain corporate assets, such as office space in the corporate headquarters and certain IT hardware and software, were not transferred to us; however, the Transition Services Agreement between ONEOK and us provided temporary access to such corporate assets as necessary to operate our business prior to obtaining applicable corporate assets on our own.
Immediately prior to the contribution of the natural gas distribution business to us, ONEOK contributed to the capital of the natural gas distribution business all of the amounts outstanding on the natural gas distribution business’s short-term note payable to and long-term line of credit with ONEOK. We received approximately $1.19 billion of cash from a private placement of senior notes (which were later exchanged for registered notes), then used a portion of those proceeds to fund a cash payment of approximately $1.13 billion to ONEOK. On January 31, 2014, ONEOK distributed one share of our common stock for every four shares of ONEOK common stock held by ONEOK shareholders of record as of the close of business on January 21, 2014, the record date of the distribution. At the close of business on January 31, 2014, ONE Gas became an independent, publicly traded company as a result of the distribution. Our common stock began trading “regular-way” on the NYSE on February 3, 2014. ONEOK did not retain any ownership interest in our company.
Prior to our separation from ONEOK, our financial statements were derived from ONEOK’s financial statements, which included its natural gas distribution business as if we, for accounting purposes, had been a separate company for all periods presented. The assets and liabilities in the financial statements have been reflected on a historical basis. The financial statements for periods prior to the separation also include expense allocations for certain corporate functions historically performed by ONEOK, including allocations of general corporate expenses related to executive oversight, accounting, treasury, tax, legal, information technology and other services. We believe our assumptions underlying the financial statements, including the assumptions regarding the allocation of general corporate expenses from ONEOK, are reasonable. However, the financial statements may not include all of the actual expenses that would have been incurred by us and may not reflect our results of operations, financial position and cash flows had we been a separate publicly traded company during the periods presented prior to the separation.
5
OUR STRATEGY
We operate with a mission to deliver natural gas for a better tomorrow. Our vision is to be a premier natural gas distribution company, creating exceptional value for all stakeholders. Our business strategy is focused on operating our systems in a safe, reliable and environmentally responsible manner, growing our business strategically, while delivering quality customer service to our customers. We believe this will enable us to generate a competitive total return for our shareholders and maintain our financial stability, leading to our strategic goals of zero harm and a fair return. We intend to accomplish our objectives by executing on the strategies listed below:
• | Focus on Safety, Reliability and Compliance - We are committed, first and foremost, to pursuing a zero-incident safety and compliance culture through programs, procedures, policies, guidelines and other internal controls designed to mitigate risk and incidents that may harm our employees, contractors, customers, the public or the environment. Additionally, a significant portion of our capital spending is focused on the safety, integrity, reliability and efficiency of our natural gas distribution system. We are committed to compliance with all federal, state and local laws and regulations. |
• | High-performing Workforce - The foundation of our company consists of our employees. Our success begins with our people and a commitment to attracting, retaining and developing a high-performing workforce where every employee understands that they can and do make a difference. We embrace and promote inclusion, diversity and collaboration. We expect a high standard of performance from our employees, and encourage our workforce to measure their productivity and be accountable for the best work possible. Each day that we do our best to safely and efficiently meet the needs of our customers is a day that leads to individual success and, ultimately, the success of the company. |
• | Increase Our Achieved ROE - We continually seek to improve our achieved ROE through improved operational performance and regulatory mechanisms. The difference between our achieved and allowed ROE is related primarily to regulatory lag. We make investments that increase our rate base and we incur increases in our costs that are above the amounts reflected in the rates we charge for our service. |
We continue to leverage technology to improve our operational performance. Ongoing initiatives to expand the use of technology in key areas of operations and customer service are expected to result in increased efficiency, thereby helping reduce the rate of increasing expenses.
Our focus on our credit metrics and maintaining a balanced approach to capital management are significant objectives in providing reasonable rates to customers while also providing a fair return to shareholders. We believe that maintaining an investment-grade credit rating is prudent for our business as we seek to access the capital markets to finance capital investments. As a 100-percent regulated utility, we intend to maintain strong credit metrics while we pursue a balanced approach to capital investment and a return of capital to shareholders via a dividend that we believe will be competitive with our peer group.
• | Advocate Constructive Relationships with Key Stakeholders - We plan to continue our constructive, transparent relationships with our key stakeholders, which include our customers, employees, investors, legislators and regulators. Our strategy includes meeting the needs of our customers through the delivery of safe and reliable natural gas service while seeking outcomes in future rate proceedings that provide recovery of our costs and a fair return on our infrastructure investments. |
• | Identify and Pursue Growth Opportunities - Our growth opportunities are a result of capital investments related to the safety and reliability of our existing system, as identified by our system integrity program, in addition to system expansion related to the economic and population growth in our service territories. As a result of our commitment to enhance the integrity, reliability and safety of our existing infrastructure, we are making significant investments in our existing system, which we expect to further grow our rate base. In addition, as some of our service territories continue to experience economic growth, we expect to grow our rate base through capital investments in new service lines and main line extensions, predominately in the seven major metropolitan areas we serve. |
We believe that the competitiveness of natural gas is increasing, creating new market opportunities for natural gas as an energy source within our existing service territories. Our emphasis on safety and a positive customer service experience makes our business an important part of the communities we serve. Natural gas remains positioned within the United States energy economy as the foundation fuel of scale, which we believe will support sustainable growth opportunities, energy independence and national security.
6
We remain committed to maintaining our status as a 100-percent regulated natural gas utility. We will, however, follow a disciplined financial and operational approach to evaluating both strategic acquisition opportunities and continued investments in our existing rate base.
REGULATORY OVERVIEW
We are subject to the regulations and oversight of the state and local regulatory authorities of the territories in which we operate. Rates and charges for natural gas distribution services are established by the OCC for Oklahoma Natural Gas and by the KCC for Kansas Gas Service. Texas Gas Service is subject to regulatory oversight by the various incorporated cities that it serves, which have primary jurisdiction for their respective service areas. Rates in unincorporated areas of Texas and all appellate matters are subject to regulatory oversight by the RRC. These regulatory authorities have the responsibility of ensuring that the utilities in their jurisdictions provide safe and reliable service at a reasonable cost, while providing utility companies the opportunity to earn a fair and reasonable return on their investments.
Generally, our rates and charges are established in rate case proceedings. Regulatory authorities may also approve mechanisms that allow for adjustments for specific costs or investments made between rate cases. Due to the nature of the regulatory process, there is an inherent lag between the time that we make investments or incur additional costs and the setting of new rates and/or charges to recover those investments or costs. Additionally, we are not allowed recovery of certain costs we incur. The delay between the time investments are made or increases in costs are incurred and the time that our rates are adjusted to reflect these investments and costs is referred to as regulatory lag.
The following provides additional detail on the regulatory mechanisms in the jurisdictions we serve.
Oklahoma - Oklahoma Natural Gas currently operates under a PBRC mechanism, which provides for streamlined annual rate reviews between rate cases and includes adjustments for incremental capital investment and allowed expenses. Under this mechanism, we have an allowed ROE of between 9 percent and 10 percent. If our achieved ROE is below 9 percent, our base rates are increased upon OCC approval to an amount necessary to restore the ROE to 9.5 percent. If our achieved ROE exceeds 10 percent, the portion of the earnings that resulted in an achieved ROE that exceeds 10 percent is shared with our customers, who receive the benefit of 75 percent of the portion of earnings that resulted in an achieved ROE that exceeds 10 percent. We receive the benefit of the remaining 25 percent. Oklahoma Natural Gas is required to file a rate case on or before June 30, 2021, based on a test year consisting of the twelve months ending December 31, 2020. Other regulatory mechanisms in Oklahoma include the following:
• | Rate Design for Residential Customers - Oklahoma Natural Gas is authorized to utilize a rate structure providing customers with two rate choices. Rate Choice “A” is designed for customers whose annual normalized volume is less than 50 Dth. These customers pay a fixed monthly service charge and a per Dth delivery fee. Although a portion of the net margin for customers in Rate Choice “A” is dependent on usage, these customers use relatively small quantities of natural gas and therefore the net margin that is dependent on usage is not significant. The fixed monthly residential customer charge is $16.70, with a delivery fee of $4.1143 per Dth for these customers. Rate Choice “B” is designed for customers whose annual normalized volume is 50 Dth or greater. These customers pay only a fixed monthly service charge of $33.84. At December 31, 2016, 71 percent of Oklahoma Natural Gas’ residential customers were on Rate Choice “B.” |
• | Rate Design for Commercial and Industrial Customers - Oklahoma Natural Gas is authorized to utilize a structure providing two different rate choices for its Small Commercial and Industrial, or SCI, customers. Rate Choice “A” is designed for SCI customers whose annual normalized volume is less than 40 Dth. These customers pay both a fixed monthly service charge of $20.90 and a delivery fee of $4.5599 per Dth. Rate Choice “B” is designed for SCI customers whose annual normalized volume is 40 Dth or greater but less than 150 Dth. These customers pay only a fixed monthly service charge of $36.10. All of Oklahoma Natural Gas’ Large Commercial and Industrial, or LCI, customers, whose annual volume is 150 Dth or greater, but less than 5,000 Dth, pay a fixed monthly service charge of $94.88. At December 31, 2016, 78 percent of Oklahoma Natural Gas’ commercial and industrial customers were on either SCI Rate Choice “B” or LCI. |
• | PGA Clause - Oklahoma Natural Gas’ commodity, transportation, storage and gas purchase operations and maintenance costs are passed through to its sales customers, without profit, via the PGA. Any costs associated with natural gas that is lost, used or unaccounted for in operations and the fuel-related portion of bad debts are also recovered through the PGA. |
• | TAC - The TAC is a weather normalization mechanism designed to reduce the delivery charge component of customers’ bills for the additional volumes used when the actual HDDs exceed the normalized HDDs and to increase the delivery charge component of customers’ bills for volumes not used when actual HDDs are less than the normal HDDs. Normalized HDDs established through our most recent rate proceeding are based on 10-year weighted |
7
average HDDs as of December 31, 2014, for years 2005-2014, as calculated using 11 weather stations across Oklahoma and weighted on average customer count for Oklahoma. The TAC is in effect from November through April.
• | Energy Efficiency Programs - Oklahoma Natural Gas has Energy Efficiency Programs, available to all of its sales customers. The costs associated with these programs and an incentive to offer these programs are recovered through a monthly surcharge on customer bills. Oklahoma Natural Gas collects approximately $11.5 million each year from sales customers to fund the programs, which provides rebates for energy efficient natural gas appliances. |
• | CNG Rebate Program - The CNG Rebate Program is designed to promote and support the CNG market in the state of Oklahoma by offering rebates to Oklahoma residents who purchase dedicated and bi-fueled natural gas vehicles or install residential CNG fueling stations. The rebates are funded by a $0.25 per gasoline gallon equivalent surcharge that Oklahoma Natural Gas is authorized to collect on fuel purchased from a CNG dispenser owned by Oklahoma Natural Gas. Collections from the surcharge to fund the program were not material in 2016. |
For the year ended December 31, 2016, approximately 88 percent of Oklahoma Natural Gas’ net margin from its sales customers was recovered from fixed charges.
Kansas - Kansas Gas Service files periodic rate cases with the KCC as needed to increase base rates to reflect Kansas Gas Service’s authorized revenue requirement. Other regulatory mechanisms in Kansas include the following:
• | COGR and ACA - These mechanisms allow Kansas Gas Service to recover the actual cost of the natural gas it sells to its customers. The COGR includes a monthly estimate of the cost Kansas Gas Service incurs in transporting, storing and purchasing natural gas supply for its sales customers, the ACA and other charges and credits. The ACA is an annual component of the COGR that compares the cost of gas recovered through the COGR for the preceding year with the actual natural gas supply costs and the fuel-related portion of bad debts for the same period. Any over- or under-recovery is reflected in the subsequent year’s COGR. |
• | WNA Clause - In 2016, the WNA Clause required Kansas Gas Service to accrue the variation in net margin resulting from actual weather differing from normal weather occurring from November through March. Beginning in April 2017, the WNA mechanism will allow an accrual each month of the year. WNA is designed to reduce the delivery charge component of customers’ bills for the additional volumes used when the actual HDDs exceed the normalized HDDs and to increase the delivery charge component of customers’ bills for the reduction in volumes used when actual HDDs are less than the normal HDDs. Normal HDDs are established through rate proceedings and are based on 30-year average for years 1981-2010 published by the National Oceanic and Atmospheric Administration, as calculated using 13 weather stations across Kansas and weighted on HDDs by weather station and customers for Kansas. Annually, the amount of the adjustment is determined and is then applied to customers’ bills over the subsequent 12-month period. Beginning in April 2017, Normal HDDs will be based on a 30-year average for years 1981-2010 published by the National Oceanic and Atmospheric Administration, as calculated using 4 weather stations across Kansas and weighted on HDDs by weather station and customers for Kansas. |
• | ATSR - This rider requires Kansas Gas Service to recover the difference each year between the property tax costs included in its base rates and its actual property tax costs incurred without having to file a rate case. The amount of the adjustment is determined annually and recovered over the subsequent 12 months as a change in the delivery-charge component of customers’ bills. |
• | Pension and Other Postemployment Benefits Trackers - These trackers require Kansas Gas Service to track and defer for recovery in its next rate case the difference between the pension and other postemployment benefit costs included in base rates and actual expense as determined in accordance with GAAP. |
• | GSRS - This surcharge allows Kansas Gas Service to file for a rate adjustment providing a recovery of and return on qualifying infrastructure investments, such as expenditures necessary to meet state and federal pipeline safety requirements and government-required relocation projects, incurred between rate case filings. The filing cannot occur more often than once every 12 months and the rate adjustment cannot increase the monthly charge by more than $0.40 per residential customer compared with the most recent GSRS filing. After five annual filings, Kansas Gas Service is required to file a rate case or cease collection of the surcharge. |
The fixed monthly residential customer charge for Kansas Gas Service was $15.35 for the year ended December 31, 2016. Beginning January 1, 2017, the residential customer charge is $16.70. For the year ended December 31, 2016, approximately 55 percent of Kansas Gas Service’s net margin from its sales customers was recovered from fixed charges.
8
Texas - Texas Gas Service has grouped its customers into six service areas. These service areas are further divided into the incorporated cities and the unincorporated areas, referred to as the environs. The incorporated cities in the service areas have original jurisdiction, with the RRC having appellate authority, and the RRC has original jurisdiction for the environs. Periodic rate cases are filed with the cities or the RRC, as needed, to reflect Texas Gas Service’s authorized revenue requirement. Other regulatory mechanisms and constructs in Texas include the following:
• | GRIP Statute - For the incorporated cities in three of the service areas and for the environs in five of the service areas, comprising 86 percent of Texas Gas Service’s customers, Texas Gas Service makes an annual filing under the GRIP statute, which allows it to recover taxes and depreciation and to earn a return on the annual net increase in investment for the service area. After five annual GRIP filings, Texas Gas Service is required to file a full rate case. A full rate case may be filed at shorter intervals if desired by either Texas Gas Service or the regulator. |
• | COSA Filings - In three of the service areas, comprising 14 percent of its customers, Texas Gas Service makes an annual COSA filing for the incorporated cities. COSA tariffs permit Texas Gas Service to recover return, taxes and depreciation on the annual increases in net investment, as well as annual increases or decreases in certain expenses and revenues. The COSAs have a cap of 3.5 percent to 5 percent on all or a portion of the increase. A full rate case may be filed when desired by Texas Gas Service or the regulator, but is not required. |
• | WNA Clause - Texas Gas Service employs WNA clauses in all six service areas. The WNA clause is designed to reduce the delivery charge component of customers’ bills for the additional volumes used when the actual HDDs exceed the normalized HDDs and to increase the delivery charge component of customers’ bills for the reduction in volumes used when actual HDDs are less than the normal HDDs. Normal HDDs are established through rate proceedings in each of our jurisdictions and are generally based on a 10-year average of HDDs in each jurisdiction. The WNA clause is in effect from September through May. |
• | COG Clause - In all service areas, Texas Gas Service recovers 100 percent of its natural gas costs, including transportation and storage costs, interest on natural gas in storage and the natural gas cost component of bad debts, via a COG mechanism, subject to a limitation of 5 percent on lost-and-unaccounted-for natural gas. The COG is reconciled annually to compare the natural gas costs recovered through the COG with the actual natural gas supply costs. Any over- or under-recovery is refunded or recovered, as applicable, in the subsequent year. |
• | Pension and Other Postemployment Benefits - Texas Gas Service is authorized by statute to defer pension and other postemployment benefit costs that exceed the amount recovered in base rates and to seek recovery of the deferred costs in a future rate case. |
• | Pipeline-Integrity Testing Riders - Texas Gas Service recovers approximately 90 percent of its pipeline-integrity testing expenses via riders and COSAs, with the remainder included in base rates. |
• | Safety-Related Plant Replacements - Texas Gas Service is authorized by RRC rule to defer interest cost, taxes and depreciation expense on safety-related plant replacements from the time the replacements are in service until the plant is reflected in base rates, and to seek recovery of those accrued amounts in a future rate proceeding. |
• | Energy Conservation Program - Texas Gas Service has an Energy Conservation Program in its Central Texas and Rio Grande Valley service areas, comprising 49 percent of total customers. Texas Gas Service collects approximately $3.5 million per year from customers to fund the program, which provides energy audits, weatherization and appliance rebates to promote energy conservation. |
The average fixed monthly residential customer charge for Texas Gas Service is $14.72, and for the year ended December 31, 2016, approximately 70 percent of Texas Gas Service’s net margin from its sales customers was recovered from fixed charges.
MARKET CONDITIONS AND SEASONALITY
Supply - We purchased 134 Bcf and 157 Bcf of natural gas supply in 2016 and 2015, respectively. The decrease in 2016 resulted primarily from lower supply requirements due to warmer temperatures compared with 2015. Our natural gas supply portfolio consists of long-term, seasonal and short-term contracts from a diverse group of suppliers. We award these contracts through competitive-bidding processes to ensure reliable and competitively priced natural gas supply. We acquire our natural gas supply from natural gas processors, marketers and producers.
An objective of our supply-sourcing strategy is to provide value to our customers through reliable, competitively priced and flexible natural gas supply and transportation from multiple production areas and suppliers. This strategy is designed to mitigate the impact on our supply from physical interruption, financial difficulties of a single supplier, natural disasters and other unforeseen force majeure events, as well as to ensure these resources are reliable and flexible to meet the variations of customer demands.
We do not anticipate problems with securing natural gas supply to satisfy customer demand; however, if supply shortages were to occur, we have curtailment provisions in our tariffs that allow us to reduce or discontinue natural gas service to large
9
industrial users and to request that residential and commercial customers reduce their natural gas requirements to an amount essential for public health and safety. In addition, during times of critical supply disruptions, curtailments of deliveries to customers with firm contracts may be made in accordance with guidelines established by appropriate federal, state and local regulatory agencies.
Natural gas supply requirements are affected by weather conditions. In addition, economic conditions impact the requirements of our commercial and industrial customers. Natural gas usage per residential customer may decline as customers change their consumption patterns in response to a variety of factors, including:
• | more volatile and higher natural gas prices; |
• | more energy-efficient construction; |
• | fuel switching from natural gas to electricity; and |
• | customers improving the energy efficiency of existing homes by replacing doors and windows, adding insulation, and replacing appliances with more efficient appliances. |
In each jurisdiction in which we operate, changes in customer-usage profiles are considered in the periodic redesign of our rates.
As of December 31, 2016, we had 50.4 Bcf of natural gas storage capacity under lease with remaining terms ranging from one to ten years and maximum allowable daily withdrawal capacity of approximately 1.3 Bcf. This storage capacity allows us to purchase natural gas during the off-peak season and store it for use in the winter periods. This storage is also needed to assure the reliability of gas deliveries during peak demands for natural gas. Approximately 27 percent of our winter natural gas supply needs for our sales customers is expected to be supplied from storage.
In managing our natural gas supply portfolios, we partially mitigate price volatility using a combination of financial derivatives and natural gas in storage. We have natural gas financial hedging programs that have been authorized by the OCC, KCC and in certain jurisdictions in Texas. We do not utilize financial derivatives for speculative purposes, nor do we have trading operations associated with our business.
Demand - See discussion below under “Seasonality,” “Competition” and “Compressed Natural Gas” for factors affecting demand for our services.
Seasonality - Natural gas sales to residential and commercial customers are seasonal, as a substantial portion of their natural gas requirements are for heating. Accordingly, the volume of natural gas sales is higher normally during the months of November through March than in other months of the year. The impact on our margins resulting from weather temperatures that are above or below normal is offset partially through our TAC and WNA mechanisms. See discussion above under “Regulatory Overview.”
Competition - We encounter competition based on customers’ preference for natural gas, compared with other energy alternatives and their comparative prices. We compete primarily to supply energy for space and water heating, cooking and clothes drying. Significant energy usage competition occurs between natural gas and electricity in the residential and small commercial markets. Customers and builders typically make the decision on the type of equipment, and therefore the energy source, at initial installation, generally locking in the chosen energy source for the life of the equipment. Changes in the competitive position of natural gas relative to electricity and other energy alternatives have the potential to cause a decline in consumption of natural gas or in the number of natural gas customers.
The U.S. Department of Energy issued a statement of policy that it will use full fuel-cycle measures of energy use and emissions when evaluating energy-conservation standards for appliances. In addition, the EPA has determined that source energy is the most equitable unit for evaluating energy consumption. Assessing energy efficiency in terms of a full fuel-cycle or source-energy analysis, which takes all energy use into account, including transmission, delivery and production losses, in addition to energy consumed at the site, highlights the high overall efficiency of natural gas in residential and commercial uses compared with electricity.
10
The table below contains data related to the cost of delivered gas relative to electricity based on current market conditions:
Natural Gas vs. Electricity | Oklahoma | Kansas | Texas | |||||||||
Average retail price of electricity / kWh(1) | 10.14¢ | 13.02¢ | 11.04¢ | |||||||||
Natural gas price equivalent of electricity / Dth(1) | $ | 29.72 | $ | 38.16 | $ | 32.36 | ||||||
ONE Gas delivered cost of natural gas / Dth(2) | $ | 9.25 | $ | 10.07 | $ | 10.97 | ||||||
Natural gas advantage ratio(3) | 3.2x | 3.8x | 2.9x | |||||||||
(1) Source: United States Energy Information Agency, www.eia.gov, for the eleven-month period ended November 30, 2016.
(2) Represents the average delivered cost of natural gas to a residential customer, including the cost of the natural gas supplied, fixed customer charge, delivery charges and charges for riders, surcharges and other regulatory mechanisms associated with the services we provide, for the year ended December 31, 2016.
(3) Calculated as the ratio of the natural gas price equivalent per Dth of the average retail price of electricity per kilowatt hour to the ONE Gas delivered average cost of natural gas per Dth.
We are subject to competition from other pipelines for our large industrial and commercial customers, and this competition has and may continue to impact margins. Under our transportation tariffs, qualifying industrial and commercial customers are able to purchase their natural gas needs from the supplier of their choice and have us transport it for a fee. A portion of the transportation services that we provide are at negotiated rates that are below the maximum approved transportation tariff rates. Reduced-rate transportation service may be negotiated when a competitive pipeline is in close proximity or another viable energy option is available to the customer. Increased competition could potentially lower these rates.
CNG - In meeting increased interest in CNG for motor vehicle transportation, particularly from fleet operators, we have been developing an incremental source of transportation revenue by supplying natural gas to CNG fueling stations. As of December 31, 2016, we supply 143 fueling stations, 30 of which we operate. Of the 113 remaining stations, 64 are retail and 49 are private CNG stations. We transported 2.5 million Dth to CNG stations in 2016, which represents an increase of 7 percent compared with 2015.
We will continue to support industry efforts to encourage development of more vehicle options by car and truck manufacturers, to support third-party investment in CNG fueling stations and to continue tax incentives for CNG. We continue to deploy a minimum amount of capital to connect CNG stations and allow the free market to build and operate the stations.
ENVIRONMENTAL AND SAFETY MATTERS
See Note 13 of the Notes to Financial Statements and Management’s Discussion and Analysis of Financial Condition and Results of Operations in this Annual Report for information regarding environmental and safety matters.
EMPLOYEES
We employed approximately 3,400 people at February 1, 2017, including approximately 700 people at Kansas Gas Service who are subject to collective bargaining agreements. The following table sets forth our contracts with collective bargaining units at February 1, 2017:
Union | Approximate Employees | Contract Expires | ||
The United Steelworkers | 400 | October 31, 2019 | ||
International Brotherhood of Electrical Workers (IBEW) | 300 | June 30, 2017 | ||
11
EXECUTIVE OFFICERS OF THE REGISTRANT
All executive officers are elected annually by our Board of Directors and each serves until such person resigns, is removed or is otherwise disqualified to serve or until such officer’s successor is duly elected. Our executive officers listed below include the officers who have been designated by our Board of Directors as our Section 16 executive officers.
Name | Age* | Business Experience in Past Five Years | ||
Pierce H. Norton II | 56 | 2014 to present | President, Chief Executive Officer and Director | |
2013 to 2014 | Executive Vice President, Commercial, ONEOK and ONEOK Partners | |||
2012 | Executive Vice President and Chief Operating Officer, ONEOK and ONEOK Partners | |||
Curtis L. Dinan | 49 | 2014 to present | Senior Vice President, Chief Financial Officer and Treasurer | |
2012 to 2014 | Senior Vice President, Natural Gas, ONEOK Partners | |||
Joseph L. McCormick | 57 | 2014 to present | Senior Vice President, General Counsel and Assistant Secretary | |
2012 to 2014 | Vice President and Associate General Counsel, ONEOK and ONEOK Partners | |||
Caron A. Lawhorn | 55 | 2014 to present | Senior Vice President, Commercial | |
2013 to 2014 | Senior Vice President, Commercial, Natural Gas Distribution, ONEOK | |||
2012 | President, ONEOK Distribution Companies, ONEOK | |||
Robert S. McAnnally | 53 | 2015 to present | Senior Vice President, Operations | |
2012 to 2015 | Senior Vice President, Marketing and Customer Service, Alabama Gas Corporation, a subsidiary of The Laclede Group, Inc. (now Spire Inc.) | |||
2012 | Vice President, External Affairs, Energen Corporation | |||
Mark A. Bender | 52 | 2015 to present | Senior Vice President, Administration and Chief Information Officer | |
2014 to 2015 | Vice President and Chief Information Officer | |||
2012 to 2014 | Vice President of Information Technology Operations, Chesapeake Energy Corporation | |||
2012 | Chief Information Officer, Oral Roberts University | |||
* As of January 1, 2017 | ||||
No family relationship exists between any of the executive officers, nor is there any arrangement or understanding between any executive officer and any other person pursuant to which the officer was selected.
INFORMATION AVAILABLE ON OUR WEBSITE
We make available, free of charge, on our website (www.onegas.com) copies of our Annual Report, Quarterly Reports on Form 10-Q, Current Reports on Form 8-K, amendments to those reports filed or furnished to the SEC pursuant to Section 13(a) or 15(d) of the Exchange Act and reports of holdings of our securities filed by our officers and directors under Section 16 of the Exchange Act as soon as reasonably practicable after filing such material electronically or otherwise furnishing it to the SEC. Copies of our Code of Business Conduct and Ethics, Corporate Governance Guidelines, Certificate of Incorporation, bylaws and the written charters of our Audit Committee, Executive Compensation Committee, Corporate Governance Committee and Executive Committee are also available on our website, and we will provide copies of these documents upon request. Our website and any contents thereof are not incorporated by reference into this report.
We also make available on our website the Interactive Data Files required to be submitted and posted pursuant to Rule 405 of Regulation S-T.
12
ITEM 1A. RISK FACTORS
Our investors should consider the following risks that could affect us and our business. Although we have tried to discuss key factors, our investors need to be aware that other risks may prove to be important in the future. New risks may emerge at any time, and we cannot predict such risks or estimate the extent to which they may affect our financial performance. Investors should carefully consider the following discussion of risks and the other information included or incorporated by reference in this Annual Report, including “Forward-Looking Statements,” which are included in Item 7, “Management’s Discussion and Analysis of Financial Condition and Results of Operations.”
RISK FACTORS INHERENT IN OUR BUSINESS
Regulatory actions could impact our ability to earn a reasonable rate of return on our invested capital and to fully recover our operating costs.
In addition to regulation by other governmental authorities, we are subject to regulation by the OCC, KCC, RRC and various municipalities in Texas. These authorities set the rates that we charge our customers for our services. There can be no assurance that we will be able to obtain rate increases or that our authorized rates of return will continue at the current levels. We monitor and compare the rates of return we achieve with our allowed rates of return and initiate general and specific rate proceedings as needed. If a regulatory agency were to prohibit us from setting rates that allow for the timely recovery of our costs and a reasonable return by significantly lowering our allowed return or adversely altering our cost allocation, rate design or other tariff provisions, modifying or eliminating cost trackers, prohibiting recovery of regulatory assets or disallowing portions of our expenses, then our earnings could be adversely impacted. Regulatory proceedings also involve a risk of rate reduction, because once a proceeding has been filed, it is subject to challenge by various interveners.
Further, accounting principles that govern our company permit certain assets that result from the regulatory process to be recorded on our Balance Sheets that could not be recorded under GAAP for nonregulated entities. We consider factors such as rate orders from regulators, previous rate orders for substantially similar costs, written approval from the regulators and analysis of recoverability by internal and external legal counsel to determine the probability of future recovery of these assets. If we determine future recovery is no longer probable, we would be required to write off the regulatory assets at that time, which would also adversely affect our results of operations and cash flows. Regulatory authorities also review whether our natural gas costs are prudent and can adjust the amount of our natural gas costs that we pass through to our customers. If any of our natural gas costs were disallowed, our results of operations and cash flows would also be adversely affected.
In the normal course of business in the regulatory environment, assets are placed in service before regulatory action is taken, such as filing a rate case or for interim recovery under a capital tracking mechanism that could result in an adjustment of our returns. Once we make a regulatory filing, regulatory bodies have the authority to suspend implementation of the new rates while studying the filing. Because of this process, we may suffer the negative financial effects of having placed in service assets that do not initially earn our authorized rate of return or may not be allowed recovery on such expenditures at all.
The profitability of our operations is dependent on our ability to timely recover the costs related to providing natural gas service to our customers. However, we are unable to predict the impact that new regulatory requirements will have on our operating expenses or the level of capital expenditures and we cannot give assurance that our regulators will continue to allow recovery of such expenditures in the future. Changes in the regulatory environment applicable to our business or the imposition of additional regulation could impair our ability to recover costs absorbed historically by our customers, and adversely impact our results of operations, financial condition and cash flows.
We are subject to comprehensive energy regulation by governmental agencies, and the recovery of our costs is dependent on regulatory action.
We are subject to comprehensive regulation by several state and municipal utility regulatory agencies, which significantly influences our operating environment and our ability to recover our costs from utility customers. The utility regulatory authorities in Oklahoma, Kansas and Texas regulate many aspects of our utility operations, including organization, safety, financing, affiliate transactions, customer service and the terms of service to customers, including the rates that we can charge customers. The profitability of our operations is dependent on our ability to pass through costs related to providing natural gas to our customers by filing periodic rate cases. The regulatory environment applicable to our operations could impair our ability to recover costs historically absorbed by our customers. In addition, as the regulatory environment applicable to our operations increases in complexity, the risk of inadvertent noncompliance could also increase. Our failure to comply with applicable laws and regulations could result in the imposition of fines, penalties or other enforcement action by the authorities that regulate our operations.
13
We are unable to predict the impact that the future regulatory activities of these agencies will have on our operations. Changes in regulations or the imposition of additional regulations could have an adverse impact on our business, financial condition and results of operations. Further, the results of our operations could be impacted adversely if our authorized cost-recovery mechanisms do not function as anticipated.
We are involved in legal or administrative proceedings before various courts and governmental bodies that could adversely affect our financial condition, results of operations and cash flows.
In the normal course of business, we are involved in legal or administrative proceedings before various courts and governmental bodies with respect to general claims, rates, environmental issues, gas cost prudence reviews and other matters. Adverse decisions regarding these matters, to the extent they require us to make payments in excess of amounts provided for in our financial statements, or to the extent they are not covered by insurance, could adversely affect our financial condition, results of operations and cash flows.
Unfavorable economic and market conditions could adversely affect our earnings.
Weakening economic activity in our markets could result in a loss of existing customers, fewer new customers, especially in newly constructed homes and other buildings, or a decline in energy consumption, any of which could adversely affect our revenues or restrict our future growth. It may become more difficult for customers to pay their natural gas bills, leading to slow collections and higher-than-normal levels of accounts receivable, which in turn could increase our financing requirements and bad debt expense. Changes in monetary or other policies of the federal or state governments may adversely affect the economic climate for the United States, the regions in which we operate or particular industries, such as ours or those of our customers. The foregoing could adversely affect our business, financial condition, results of operations and cash flows.
Increases in the price of natural gas could reduce our earnings, increase our working capital requirements and adversely impact our customer base.
Changes in supply and demand within the natural gas markets, as well as other factors, could cause an increase in the price of natural gas. The increased production in the U.S. of natural gas from shale formations has put downward pressure on the wholesale cost of natural gas; however, other factors could put upward pressure on natural gas prices, including restrictions or regulations on shale natural gas production and waste water disposal, increased demand from natural gas fueled electric power generation and increases in natural gas exports. Additionally, the CFTC under the 2010 Dodd-Frank Wall Street Reform and Consumer Protection Act has regulatory authority of the over-the-counter derivatives markets. Regulations affecting derivatives could increase the price of our natural gas supply. Also, the threat of terrorist activities or heightened international tensions could lead to increased economic instability and volatility in the price of natural gas.
Natural gas costs are passed through to our customers based on the actual cost of the natural gas we purchase. However, an increase in the price of natural gas could cause us to experience a significant increase in short-term debt because we must pay suppliers for natural gas when purchased. Costs are recovered through our collection on customer bills following consumption by our customers. The delay in recovery of our natural gas costs could adversely affect our financial condition and cash flows.
Further, higher and more volatile natural gas prices may adversely impact our customers’ perception of natural gas. Substantial fluctuations in natural gas prices can occur from year to year and sustained periods of high natural gas prices or of pronounced natural gas price volatility may lead to customers selecting other energy alternatives, such as electricity, and to increased scrutiny of the prudency of our natural gas procurement strategies and practices by our regulators. It may also cause new home developers, builders and new customers to select alternative sources of energy. Additionally, high natural gas prices may cause customers to conserve more and may also adversely impact our accounts receivable collections, resulting in higher bad debt expense. The occurrence of any of the foregoing could adversely affect our business, financial condition, results of operations and cash flows, as well as our future growth opportunities.
Our risk-management policies and procedures may not be effective, and employees may violate our risk-management policies.
We have implemented a set of policies and procedures that involve both our senior management and the Audit Committee of our Board of Directors to assist us in managing risks associated with our business. These risk-management policies and procedures are intended to align strategies, processes, people, information technology and business knowledge so that risk is managed throughout the organization. However, as conditions change and become more complex, current risk measures may fail to assess adequately the relevant risk due to changes in the market and the presence of risks previously unknown to us.
14
Additionally, if employees fail to adhere to our policies and procedures or if our policies and procedures are not effective, potentially because of future conditions or risks outside of our control, we may be exposed to greater risk than we had intended. Ineffective risk-management policies and procedures or violation of risk-management policies and procedures could have an adverse effect on our earnings, financial condition and cash flows.
Our business is subject to competition that could adversely affect our results of operations.
The natural gas distribution business is competitive, and we face competition from other companies that supply energy, including electric companies, propane dealers, renewable energy providers and coal companies in relation to sources of energy for electric power plants, as well as nuclear energy. Significant competitive factors include efficiency, quality and reliability of the services we provide and price.
The most significant product competition occurs between natural gas and electricity in the residential and small commercial markets. Natural gas competes with electricity for water and space heating, cooking, clothes drying and other general energy needs. Increases in the price of natural gas or decreases in the price of other energy sources could adversely impact our competitive position by decreasing the price benefits of natural gas to the consumer. Customers and builders typically make the decision on the type of equipment at initial installation and use the chosen energy source for the life of the equipment. Changes in the competitive position of natural gas relative to electricity and other energy products have the potential to cause a decline in consumption or in the number of natural gas customers.
Consumer or government-mandated conservation efforts, higher natural gas costs or decreases in the price of other energy sources also may encourage decreases in natural gas consumption and allow competition from alternative energy sources for applications that have used natural gas, encouraging some customers to move away from natural gas-fired equipment to equipment fueled by other energy sources. Competition between natural gas and other forms of energy is also based on efficiency, performance, reliability, safety, environmental and other nonprice factors. Technological improvements in other energy sources and events that impair the public perception of the nonprice attributes of natural gas could erode our competitive advantage. These factors in turn could decrease the demand for natural gas, impair our ability to attract new customers, and cause existing customers to switch to other forms of energy or to bypass our systems in favor of alternative competitive sources. This could result in slow or no customer growth and could cause customers to reduce or cease using our product, thereby reducing our ability to make capital expenditures and otherwise grow our business and adversely affecting our financial condition, results of operations and cash flows.
Our business activities are concentrated in three states.
We provide natural gas distribution services to customers in Oklahoma, Kansas and Texas. Changes in the regional economies, politics, regulations and weather patterns of these states could adversely impact the growth opportunities available to us and the usage patterns and financial condition of our customers. This could adversely affect our financial condition, results of operations and cash flows.
The availability of adequate natural gas pipeline transportation and storage capacity and natural gas supply may decrease and impair our ability to meet customers’ natural gas requirements and reduce our earnings.
In order to meet customers’ natural gas demands, we must obtain sufficient natural gas supplies, pipeline transportation and storage capacity from third parties. If we are unable to obtain these, our ability to meet our customers’ natural gas requirements could be impaired and our financial condition and results of operations may be impacted adversely. A significant disruption to or reduction in natural gas supply, pipeline capacity or storage capacity due to events including, but not limited to, operational failures or disruptions, hurricanes, tornadoes, floods, freeze off of natural gas wells, terrorist or cyber-attacks or other acts of war, or legislative or regulatory actions, could reduce our normal supply of natural gas and thereby reduce our earnings.
A downgrade in our credit ratings could adversely affect our cost of and ability to access capital.
Our ability to obtain adequate and cost-effective financing depends in part on our credit ratings. A reduction in our ratings by our rating agencies could adversely affect our costs of borrowing and/or access to sources of liquidity and capital. Such a downgrade could further limit or delay our access to public and private credit markets and increase the costs of borrowing under available credit lines. Should our credit ratings be downgraded, it could limit or delay our ability to obtain additional financing in the future for working capital, capital expenditures and acquisitions. An increase in borrowing costs without the ability to recover these higher costs in the rates charged to our customers could adversely affect our results of operations and cash flows by limiting our ability to earn our allowed rate of return.
15
We are subject to new and existing laws and regulations that may require significant expenditures or significant increases in operating costs or result in significant fines or penalties for noncompliance.
Our business and operations are subject to regulation by a number of federal agencies, including FERC, DOT, OSHA, EPA, CFTC and various regulatory agencies in Oklahoma, Kansas and Texas, and we are subject to numerous federal and state laws and regulations. Future changes to laws, regulations and policies may impair our ability to compete for business or to recover costs and may increase the cost of our operations. Furthermore, because the language in some laws and regulations is not prescriptive, there is a risk that our interpretation of these laws and regulations may not be consistent with expectations of regulators. Any compliance failure related to these laws and regulations may result in fines, penalties or injunctive measures affecting our operating assets. For example, under the Energy Policy Act of 2005, the FERC has civil penalty authority under the Natural Gas Act of 1938, as amended, to impose penalties for current violations of up to $1 million per day for each violation. In addition, as the regulatory environment for our industry increases in complexity, the risk of inadvertent noncompliance could also increase. Our failure to comply with applicable regulations could result in a material adverse effect on our business, financial condition, results of operations and cash flows, credit rating or reputation.
We are subject to strict regulations at many of our facilities regarding employee safety, and failure to comply with these regulations could adversely affect our financial results.
The workplaces associated with our facilities are subject to the requirements of DOT and OSHA, and comparable state statutes that regulate the protection of the health and safety of workers. The failure to comply with DOT, OSHA and state requirements or general industry standards, including keeping adequate records or preventing occupational exposure to regulated substances, could expose us to civil or criminal liability, enforcement actions, and regulatory fines and penalties and could have a material adverse effect on our business, financial condition, results of operations and cash flows.
We are subject to environmental regulations, which could adversely affect our operations or financial results.
We are subject to laws, regulations and other legal requirements enacted or adopted by federal, state and local governmental authorities relating to environmental and health and safety matters, including those legal requirements that govern discharges of substances into the air and water, the management and disposal of hazardous substances and waste, the clean-up of contaminated sites, groundwater quality and availability, plant and wildlife protection, as well as work practices related to employee health and safety. Environmental legislation also requires that our facilities, sites and other properties associated with our operations be operated, maintained, abandoned and reclaimed to the satisfaction of applicable regulatory authorities. The failure to comply with these laws, regulations and other requirements, or the discovery of presently unknown environmental conditions, could expose us to civil or criminal liability, enforcement actions and regulatory fines and penalties and could have a material adverse effect on our business, financial condition, results of operations and cash flows.
We also own or retain legal responsibility for certain environmental conditions at 12 former manufactured natural gas sites in Kansas. A number of environmental issues may exist with respect to manufactured gas plants. Accordingly, future costs are dependent on the final determination and regulatory approval of any remedial actions, the complexity of the site, level of remediation, changing technology and governmental regulations and could be material to our financial condition, results of operations and cash flows.
With the trend toward stricter standards, greater regulation and more extensive permit requirements for the types of assets operated by us that are subject to environmental regulation, our environmental expenditures could increase in the future, and such expenditures may not be fully recovered by insurance or recoverable in rates from our customers, which could adversely affect our financial condition, results of operations and cash flows.
We are subject to pipeline safety and system integrity laws and regulations that may require significant expenditures, significant increases in operating costs or, in the case of noncompliance, substantial fines.
We are subject to the Pipeline Safety Improvement Act, which requires companies like us that operate high-pressure pipelines to perform integrity assessments on pipeline segments that pass through densely populated areas or near specifically designated high-consequence areas. Further, the Pipeline Safety, Regulatory Certainty and Job Creation Act increased the maximum penalties for violating federal pipeline safety regulations and directed the DOT and Secretary of Transportation to conduct further review or studies on issues that may or may not be material to us. Compliance with existing or new laws and regulations may result in increased capital, operating and other costs which may not be recoverable in rates from our customers or may impact materially our competitive position relative to other energy providers. Failure to comply with such laws and regulations may result in fines, penalties or injunctive measures that would not be recoverable from customers in rates and could result in a material adverse effect on our financial condition, results of operations and cash flows. The failure to comply
16
with these laws, regulations and other requirements could expose us to civil or criminal liability, enforcement actions, and regulatory fines and penalties and could have a material adverse effect on our business, financial condition, results of operations and cash flows, and reputation.
Climate change, carbon neutral or energy-efficiency legislation or regulations could increase our operating costs or restrict our market opportunities, adversely affecting our growth, cash flows and results of operations.
International, federal, regional and/or state legislative and/or regulatory initiatives may attempt to control or limit the causes of climate change, including greenhouse gas emissions, such as carbon dioxide and methane. Such laws or regulations could impose costs tied to carbon emissions, operational requirements or restrictions, or additional charges to fund energy efficiency activities. They could also provide a cost advantage to alternative energy sources, impose costs or restrictions on end users of natural gas, or result in other costs or requirements, such as costs associated with the adoption of new infrastructure and technology to respond to new mandates. The focus on climate change could adversely impact the reputation of fossil fuel products or services. The occurrence of the foregoing events could put upward pressure on the cost of natural gas relative to other energy sources, increase our costs and the prices we charge to customers, reduce the demand for natural gas or cause fuel switching to other energy sources, and impact the competitive position of natural gas and the ability to serve new or existing customers, adversely affecting our business, results of operations and cash flows.
We are subject to physical and financial risks associated with climate change.
There is a growing belief that emissions of greenhouse gases may be linked to global climate change. Climate change creates physical and financial risk. Our customers’ energy needs vary with weather conditions, primarily temperature and humidity. For residential customers, heating and cooling represent their largest energy use. To the extent weather conditions may be affected by climate change, customers’ energy use could increase or decrease depending on the duration and magnitude of any changes. To the extent climate change adversely impacts the economic health of our operating territory, it could adversely impact customer demand or our customers’ ability to pay. A decrease in energy use due to weather changes may affect our financial condition through decreased revenues and cash flows. Extreme weather conditions in general require more system backup, adding to costs, and can contribute to increased system stresses, including service interruptions. Weather conditions outside of our operating territory could also have an impact on our revenues and cash flows by affecting natural gas prices. Severe weather impacts our operating territories primarily through thunderstorms, tornados and snow or ice storms. To the extent the frequency of extreme weather events increases, our cost of providing service could increase. We may not be able to pass on the higher costs to our customers or recover all the costs related to mitigating these physical risks. To the extent financial markets view climate change and emissions of greenhouse gases as a financial risk, this could adversely affect our ability to access capital markets or cause us to receive less favorable terms and conditions in future financings. Our business could be affected by the potential for lawsuits related to or against greenhouse gas emitters based on the claimed connection between greenhouse gas emissions and climate change, which could adversely impact our business, results of operations and cash flows.
Demand for natural gas is highly weather sensitive and seasonal, and weather conditions may cause our earnings to vary from year to year.
Our earnings can vary from year to year, depending in part on weather conditions, which directly influence the volume of natural gas delivered to customers. Natural gas sales to residential and commercial customers are seasonal, as a substantial portion of their natural gas requirements are for heating during the winter months. Warmer-than-normal weather can reduce our utility margins as customer consumption declines. We have implemented weather normalization mechanisms for our sales to customers in Oklahoma, Kansas and portions of Texas, which are designed to limit our earnings sensitivity to weather. Weather normalization mechanisms require us to increase customer billings to offset lower natural gas usage when weather is warmer than normal and decrease customer billings to offset higher natural gas usage when weather is colder than normal. If our rates and tariffs are modified to curtail such weather protection programs, then we would be exposed to additional risk associated with weather. As a result of occurrences of the foregoing, our results of operations and cash flows could vary and be impacted adversely.
We may not be able to complete necessary or desirable expansion or infrastructure development projects, which may delay or prevent us from serving our customers or expanding our business.
In order to serve new customers or expand our service to existing customers, we may need to maintain, expand or upgrade our distribution and/or transmission infrastructure, including laying new distribution lines. Various factors may prevent or delay us from completing such projects or make completion more costly, such as the inability to obtain required approval from local, state and/or federal regulatory and governmental bodies, public opposition to the project, inability to obtain adequate financing,
17
competition for labor and materials, construction delays, cost overruns, and inability to negotiate acceptable agreements relating to construction or other material components of an infrastructure development project. As a result, we may not be able to serve adequately existing customers or support customer growth, which would adversely impact our business, stakeholder perception, financial condition, results of operations and cash flows.
We may pursue acquisitions, divestitures and other strategic opportunities, the success of which may adversely impact our results of operations, cash flows and financial condition.
As part of our strategic objectives, we may pursue acquisitions to complement or expand our business, as well as divestitures and other strategic opportunities. We may not be able to successfully negotiate, finance or receive regulatory approval for future acquisitions or integrate the acquired businesses with our existing business and services. These efforts may also distract our management and employees from day-to-day operations and require substantial commitments of time and resources. Future acquisitions could result in potentially dilutive issuances of equity securities, a decrease in our liquidity as a result of our using a significant portion of our available cash or borrowing capacity to finance the acquisition, the incurrence of debt, contingent liabilities and amortization expenses and substantial goodwill. The effects of these strategic decisions may have long-term implications that are not likely to be known to us in the short-term. Changing political climates and public attitudes may adversely affect the ongoing acceptability of strategic decisions that have been made (and, in some cases, previously approved by regulators) to the detriment of the company. We may be affected materially and adversely if we are unable to successfully integrate businesses that we acquire.
An impairment of goodwill and long-lived assets could reduce our earnings.
At December 31, 2016, we had approximately $158 million of goodwill recorded on our balance sheet. Goodwill is recorded when the purchase price of a business exceeds the fair market value of the tangible and separately measurable intangible net assets. GAAP requires us to test goodwill for impairment on an annual basis or when events or circumstances occur indicating that goodwill might be impaired. Long-lived assets with finite useful lives are reviewed for impairment whenever events or changes in circumstances indicate that the carrying amount may not be recoverable. If we determine that impairment is indicated, we would be required to take an immediate noncash charge to earnings with a correlative effect on our equity and balance sheet leverage as measured by debt to total capitalization, which could adversely impact our financial condition and results of operations.
We may be unable to access capital or our cost of capital may increase significantly.
Our ability to obtain adequate and cost-effective financing is dependent upon the liquidity of the financial markets, in addition to our financial condition and credit ratings. Disruptions in the capital and credit markets could adversely affect our ability to access short-term and long-term capital. Access to funds under our ONE Gas Credit Agreement will be dependent on the ability of the participating banks to meet their funding commitments. Those banks may not be able to meet their funding commitments if they experience shortages of capital and liquidity. Disruptions and volatility in the global credit markets could cause the interest rate we pay on our ONE Gas Credit Agreement, which is based on LIBOR, to increase. This could result in higher interest rates on future financings, and could impact the liquidity of the lenders under our ONE Gas Credit Agreement, potentially impairing their ability to meet their funding commitments to us. Disruptions in the capital and credit markets as a result of uncertainty, changing or increased regulation or failures of significant financial institutions could adversely affect our access to capital needed for our business. The inability to access adequate capital or an increase in the cost of capital may require us to conserve cash, prevent or delay us from making capital expenditures, and require us to reduce or eliminate our dividend or other discretionary uses of cash. A significant reduction in our liquidity could cause a negative change in our ratings outlook or even a reduction in our credit ratings. This could in turn further limit our access to credit markets and increase our costs of borrowing.
Changes in federal and state fiscal, tax and monetary policy could significantly increase our costs or decrease our cash flows.
Changes in federal and state fiscal, tax and monetary policy may result in increased taxes, interest rates, and inflationary pressures on the costs of goods, services and labor. This could increase our expenses and capital spending and decrease our cash flows if we are not able to recover or recover timely such increased costs from our customers. This series of events may increase our rates to customers and thus may adversely impact customer billings and customer growth. Changes in tax rules could adversely affect our cash flows. Any of these events may cause us to increase debt, conserve cash, adversely affect our ability to make capital expenditures to grow the business or other discretionary uses of cash, and could adversely affect our cash flows.
18
Federal, state and local jurisdictions may challenge our tax return positions.
The preparation of our federal and state tax return filings may require significant judgments, use of estimates and the interpretation and application of complex tax laws. Significant judgment also is required in assessing the timing and amounts of deductible and taxable items, and in determining the amount of any reserves for potential adverse outcomes regarding tax positions that have been taken that may be subject to challenge by taxing authorities. Despite management’s expectation that our tax return positions will be fully supportable, certain positions may be challenged successfully by federal, state and local jurisdictions.
As a result of cross-default provisions in our borrowing arrangements, we may be unable to satisfy all of our outstanding obligations in the event of a default on our part.
The terms of our debt agreements contain cross-default provisions, which provide that we will be in default under such agreements in the event of certain defaults under other debt agreements. Accordingly, should an event of default occur under any of those agreements, we would face the prospect of being in default under all of our debt agreements, obliged in such instance to satisfy all of our outstanding indebtedness simultaneously. In such an event, we may not be able to obtain alternative financing or, if we are able to obtain such financing, we may not be able to obtain it on terms acceptable to us, which would adversely affect our ability to implement our business plan, have flexibility in planning for, or reacting to, changes in our business, make capital expenditures and finance our operations.
The cost of providing pension and other postemployment health care benefits to eligible employees and qualified retirees is subject to changes in pension fund values and changing demographics and may increase. In addition, the passage of the Patient Protection and Affordable Care Act in 2010 and its potential repeal and replacement could increase the cost of health care benefits for our employees. Further, the costs to us of providing such benefits and related funding requirements are subject to the continued and timely recovery of such costs through our rates.
We have defined benefit pension plans and other postemployment welfare plans for certain employees. Our defined benefit and other postemployment welfare plans are closed to new participants. Our other postemployment welfare plans only subsidize costs for providing postemployment medical benefits. The cost of providing these benefits to eligible current and former employees is subject to changes in the market value of our pension and other postemployment benefit plan assets, changing demographics, including longer life expectancy of plan participants and their beneficiaries, and changes in health care costs.
Any sustained declines in equity markets and reductions in bond values may have a material adverse effect on the value of our pension and other postemployment benefit plan assets. In these circumstances, additional cash contributions to our pension and other postemployment benefit plans may be required, which could have a material adverse impact on our financial condition and cash flows.
In addition, the costs of providing health care benefits to our employees could increase over the next five to ten years due in large part to the Patient Protection and Affordable Care Act of 2010, and its potential repeal and replacement. The future costs of compliance with the provisions are difficult to measure at this time. Also, our costs of providing such benefits and related funding requirements could also materially increase in the future, depending on the timing of the recovery, if any, of such costs through our rates, which could adversely impact our financial condition and cash flows.
Our business is subject to operational hazards and unforeseen interruptions that could materially and adversely affect our business and for which we may not be insured adequately.
We are subject to all of the risks and hazards typically associated with the natural gas distribution business. Operating risks include, but are not limited to, leaks, pipeline ruptures and the breakdown or failure of equipment or processes. Other operational hazards and unforeseen interruptions include adverse weather conditions, accidents, explosions, fires, the collision of equipment with our pipeline facilities (for example, this may occur if a third-party were to perform excavation or construction work near our facilities) and catastrophic events, such as tornados, hurricanes, earthquakes, floods or other similar events beyond our control. It is also possible that our facilities could be direct targets or indirect casualties of an act of terrorism, including cyber attacks. A casualty occurrence might result in injury or loss of life, extensive property damage or environmental damage caused to or by employees, customers, contractors, vendors and other third parties. The location of pipeline facilities near populated areas, including residential areas, commercial business centers and industrial gathering places, could increase the level of damages resulting from these risks. Liabilities incurred and interruptions to the operations of our pipelines or other facilities caused by such an event could reduce revenues generated by us and increase expenses, which could have a material adverse effect on our financial condition, results of operations and cash flows. Additionally, our regulators may
19
not allow us to recover part or all of the increased cost related to the foregoing events from our customers, which would adversely affect our earnings and cash flows.
Unanticipated events or a combination of events, failure in resources needed to respond to events, or slow or inadequate response to events may have an adverse impact on our financial condition, results of operations and cash flows.
While we have general liability and property insurance currently in place in amounts that we consider appropriate based on our assessment of business risk and best practices in our industry and in general business, such policies are subject to certain limits and deductibles. Further, we are not fully insured against all risks inherent in our business. As a result of market conditions, premiums and deductibles for certain insurance policies can increase substantially, and, in some instances, certain insurance may become unavailable or available only for reduced amounts of coverage. Consequently, we may not be able to renew existing insurance policies or purchase other desirable insurance on commercially reasonable terms, if at all.
The insurance proceeds received for any loss of, or any damage to, any of our facilities or to third parties may not be sufficient to restore the total loss or damage. Further, the proceeds of any such insurance may not be paid in a timely manner. The occurrence of any of the foregoing could have a material adverse effect on our financial condition, results of operations and cash flows.
Our business increasingly relies on technology, the failure of which, or the occurrence of cyber security attacks thereon, or those of third parties, may adversely affect our financial results.
Due to increased technology advances, we have become more reliant on technology to help increase efficiency in our business. We use computer programs to help run our financial and operations organizations, including an enterprise resource planning system that integrates data and reporting activities across our company. The failure of these or other similarly important technologies, the lack of alternative technologies, or our inability to have these technologies supported, updated, expanded or integrated into other technologies, could hinder our operations and adversely impact our financial condition and results of operations. The use of technological programs, systems and tools may subject our business to increased risks.
Our business is dependent upon our operational systems to process a large amount of data and complex transactions. If any of our financial, operational or other data processing systems fail or have other significant shortcomings, our financial results could be affected adversely. Our financial results could also be affected adversely if an employee or third party causes our operational systems to fail, either as a result of inadvertent error or by deliberately tampering with or manipulating our operational systems. In addition, dependence upon automated systems may further increase the risk that operational system flaws, employee or third party tampering or manipulation of those systems will result in losses that are difficult to detect or mitigate.
There is no guarantee that the precautions we take to protect against unauthorized access to secured data on our systems are adequate to safeguard against all security breaches. Any future cyber security attacks, or threats of such attacks, that affect our distribution facilities, our customers, our suppliers and third party service providers or any financial data could have a material adverse effect on our businesses. As potential cyber security attacks become more common and sophisticated, we could be required to incur increased costs to strengthen our systems or to obtain additional insurance coverage against potential losses. In addition, cyber attacks, or threats of cyber attacks, on our company, customer and employee data may result in a financial loss and may adversely impact our reputation. Third-party systems on which we rely could also suffer operational system failure.
The foregoing events could adversely affect our business reputation, diminish customer confidence, disrupt operations, subject us to financial liability or increased regulation, increase our costs and expose us to material legal claims and liability, and our business, financial condition and results of operations could be affected adversely.
Our business could be adversely affected by strikes or work stoppages by our unionized employees.
At February 1, 2017, approximately 700 of our estimated 3,400 employees were represented by collective-bargaining units under collective-bargaining agreements. We are involved periodically in discussions with collective-bargaining units representing some of our employees to negotiate or renegotiate labor agreements. We cannot predict the results of these negotiations, including whether any failure to reach new agreements will have a negative effect on our business, financial condition and results of operations or whether we will be able to reach any agreement with the collective-bargaining units. Any failure to reach agreement on new labor contracts might result in a work stoppage. Any future work stoppage could, depending on the operations and the length of the work stoppage, have a material adverse effect on our financial condition and results of operations.
20
A shortage of skilled labor may make it difficult for us to maintain labor productivity and competitive costs, which could adversely affect operations and cash flows. Further, we may be unable to attract and retain directors, management and professional and technical employees, which could adversely impact our earnings.
Our operations require skilled and experienced workers with proficiency in multiple tasks. In recent years, a shortage of workers trained in various skills associated with the natural gas distribution business has caused us to conduct certain operations without full staff, thus hiring outside resources, which may decrease productivity and increase costs. This shortage of trained workers is the result of experienced workers reaching retirement age and increased competition for workers in certain areas, combined with the difficulty of attracting new workers to the natural gas distribution industry. This shortage of skilled labor could continue over an extended period. If the shortage of experienced labor continues or worsens, it could have an adverse impact on labor productivity and costs and our ability to meet the needs of our customers in the event there is an increase in the demand for our products and services, which could adversely affect our business and cash flows.
Our ability to implement our business strategy, satisfy our regulatory requirements, and serve our customers is dependent upon our ability to continue to recruit qualified directors, employ talented managers and professionals and attract and retain a skilled, high-performing workforce. We are subject to the risk that we will not be able to effectively replace or transfer the knowledge and expertise of retiring directors or employees. Without effective succession, our ability to provide quality service to our customers and satisfy our regulatory requirements will be challenged, and this could adversely impact our business, financial condition, results of operations and cash flows.
Changes in accounting standards may adversely impact our financial condition and results of operations.
We are subject to additional changes in GAAP, SEC regulations and other interpretations of financial reporting requirements for public utilities. We neither have control over the impact these changes may have on our financial condition or results of operations nor the timing of such changes.
Our financing arrangements subject us to various restrictions that could limit our operating flexibility.
The covenants in the indenture governing our Senior Notes and our ONE Gas Credit Agreement restrict our ability to create or permit certain liens, to consolidate or merge or to convey, transfer or lease substantially all of our properties and assets.
The ONE Gas Credit Agreement includes a requirement that our debt to total capital ratio may not exceed 70 percent as of the end of any calendar quarter. Events beyond our control could impair our ability to satisfy this requirement. As long as our indebtedness remains outstanding, these restrictive covenants could impair our ability to expand or pursue our growth strategy. In addition, the breach of any covenants or any payment obligations in any of these debt agreements will result in an event of default under the applicable debt instrument. If there were an event of default under one of our debt agreements, the holders of the defaulted debt may have the ability to cause all amounts outstanding with respect to that debt to be due and payable, subject to applicable grace periods. This could trigger cross-defaults under our other debt agreements, including our Senior Notes. Forced repayment of some or all of our indebtedness would reduce our available cash and have an adverse impact on our financial condition and results of operations.
Some of our debt, including borrowings under our ONE Gas Credit Agreement and our commercial paper program, is based on variable rates of interest, which could result in higher interest expenses in the event of an increase in interest rates.
In the future, we could be exposed to fluctuations in variable interest rates. This increases our exposure to fluctuations in market interest rates. Amounts borrowed under the ONE Gas Credit Agreement and commercial paper program are based on variable rates of interest. If these rates rise, the interest rate on this debt will also increase. Therefore, an increase in these rates may increase our interest payment obligations and have a negative effect on our cash flows and financial position.
RISKS RELATING TO THE SEPARATION
We are responsible for certain contingent and other liabilities related to the historical natural gas distribution business of ONEOK, as well as a portion of any contingent corporate liabilities of ONEOK that do not relate to either the natural gas distribution business or ONEOK’s remaining businesses.
Under the Separation and Distribution Agreement between us and ONEOK, we assumed and are responsible for certain contingent and other corporate liabilities related to the historical natural gas distribution business of ONEOK (including
21
associated costs and expenses, whether arising prior to, at, or after our separation). In addition, under the Separation and Distribution Agreement we are also responsible for a portion of any contingent corporate liabilities of ONEOK that do not relate to either our business or the business of ONEOK following the separation (for example, liabilities associated with certain corporate activities not specifically attributable to either business). If we are required to indemnify ONEOK or are otherwise liable for these liabilities, they may have a material adverse effect on our financial condition, results of operations and cash flows.
Third parties may seek to hold us responsible for liabilities of ONEOK that we did not assume in our agreements.
Third parties may seek to hold us responsible for retained liabilities of ONEOK. Under our agreements with ONEOK, ONEOK has agreed to indemnify us for claims and losses relating to these retained liabilities. However, if those liabilities are significant and we are ultimately held liable for them, we cannot assure that we will be able to recover the full amount of our losses from ONEOK.
Our prior and continuing relationship with ONEOK exposes us to risks attributable to businesses of ONEOK.
ONEOK is obligated to indemnify us for losses that a party may seek to impose upon us or our affiliates for liabilities relating to the business of ONEOK. Any claims made against us that are properly attributable to ONEOK in accordance with these arrangements require us to exercise our rights under our agreements with ONEOK to obtain payment from ONEOK. We are exposed to the risk that, in these circumstances, ONEOK cannot, or will not, make the required payment.
If the distribution, together with certain related transactions, were to fail to qualify as a tax-free transaction for U.S. federal income tax purposes under Sections 355, 368(a)(1)(D) and other related provisions of the Code, then ONEOK and/or its shareholders could incur significant U.S. federal income tax liabilities, and we could incur significant indemnity obligations.
ONEOK received an IRS Ruling to the effect that the distribution, together with certain related transactions, qualified as tax-free to ONEOK, us and the ONEOK shareholders under Sections 355, 368(a)(1)(D) and other related provisions of the Code. ONEOK also received an opinion of Skadden, Arps, Slate, Meagher & Flom LLP, tax counsel to ONEOK, which opinion relies on the continued validity of the IRS Ruling, with respect to certain issues relating to the tax-free nature of the transactions that were not addressed in or covered by the IRS Ruling.
The IRS Ruling and the tax opinion rely upon certain assumptions, as well as statements, representations and certain undertakings made by our officers and the officers of ONEOK regarding the past and future conduct of the companies’ respective businesses and other matters. If any of those statements, representations or assumptions are incorrect or untrue in any material respect or any of those undertakings are not complied with, the conclusions reached in the IRS Ruling or the opinion could be affected adversely, and ONEOK and/or its shareholders could be subject to significant tax liabilities. Notwithstanding the IRS Ruling and opinion of tax counsel, the IRS could determine on audit that the distribution, together with certain related transactions, was taxable if it determines that any of these statements, representations, assumptions, or undertakings were not correct or have been violated or if it disagrees with the conclusions in the opinion that were not covered by the IRS Ruling, or for other reasons, including as a result of certain significant changes in the stock ownership of ONEOK or us after the distribution.
If the distribution were subsequently determined, for whatever reason, not to qualify as a transaction that is tax-free for U.S. federal income tax purposes under Sections 355, 368(a)(1)(D), and other related provisions of the Code, ONEOK and/or the holders of ONEOK common stock immediately prior to the distribution could incur significant tax liabilities, and, in certain circumstances as described further under "Certain Relationships and Related Transactions, and Director Independence - Tax Matters Agreement," we will be required to indemnify ONEOK, its subsidiaries, and certain related persons for taxes and related expenses resulting from the distribution, which could be material. Any such indemnity obligation could have a materially adverse impact on our financial condition.
To preserve the tax-free treatment to ONEOK and/or its shareholders of the distribution and certain related transactions, we may not be able to engage in certain transactions.
To preserve the tax-free treatment to ONEOK and/or its shareholders of the distribution and certain related transactions, we are restricted, under the Tax Matters Agreement between us and ONEOK, from taking any action that prevents such transactions from being tax-free for U.S. federal, state and local income tax purposes. These restrictions may limit our ability to pursue certain strategic transactions or engage in other transactions, including using our common stock to make acquisitions and in connection with equity capital market transactions that might increase the value of our business.
22
RISKS RELATING TO OUR COMMON STOCK
Provisions in our certificate of incorporation, our bylaws, Oklahoma law and certain of the agreements into which we have entered as part of the separation may prevent or delay an acquisition of our company, which could decrease the trading price of our common stock.
Our certificate of incorporation, bylaws and Oklahoma law contain provisions that are intended to deter coercive takeover practices and inadequate takeover bids by making such practices or bids unacceptably expensive to the raider and to encourage prospective acquirers to negotiate with our board of directors rather than to attempt a hostile takeover. These provisions include, among others:
• | a board of directors that is divided into three classes with staggered terms; |
• | rules regarding how shareholders may present proposals or nominate directors for election at shareholder meetings; |
• | the right of our board of directors to issue preferred stock without shareholder approval; and |
• | limitations on the right of shareholders to remove directors. |
Oklahoma law also imposes some restrictions on mergers and other business combinations between us and any holder of 15 percent or more of our outstanding common stock.
We believe these provisions protect our shareholders from coercive or otherwise potentially unfair takeover tactics by requiring potential acquirers to negotiate with our board of directors and by providing our board of directors with more time to assess any acquisition proposal. These provisions are not intended to make our company immune from takeovers. However, these provisions apply even if the offer may be considered beneficial by some shareholders and could delay or prevent an acquisition that our board of directors determines is not in the best interests of our company and our shareholders.
Our ability to pay dividends on our common stock will depend on our ability to generate sufficient positive earnings and cash flows.
Our ability to pay dividends in the future will depend upon, among other things, our future earnings, cash flows and restrictive covenants, if any, under future credit agreements to which we may be a party. Our cash available for dividends will principally be generated from our operations. Because the cash we generate from operations will fluctuate from quarter to quarter, we may not be able to maintain future dividends at the levels we expect or at all. Our ability to pay dividends depends primarily on cash flows, including cash flows from changes in working capital, and not solely on profitability, which is affected by noncash items. As a result, we may pay dividends during periods when we record net losses and may be unable to pay cash dividends during periods when we record net income.
ITEM 1B. UNRESOLVED STAFF COMMENTS
None.
ITEM 2. PROPERTIES
The following table sets forth the approximate miles of distribution mains and transmission pipeline as of December 31, 2016:
Properties (miles) | OK | KS | TX | Total | |||||
Distribution | 18,500 | 11,600 | 10,100 | 40,200 | |||||
Transmission | 700 | 1,500 | 300 | 2,500 | |||||
Total properties | 19,200 | 13,100 | 10,400 | 42,700 | |||||
We lease approximately 400 thousand square feet of office space and other facilities for our operations. In addition, we have 50.4 Bcf of natural gas storage capacity under lease, with maximum allowable daily withdrawal capacity of approximately 1.3 Bcf/d.
ITEM 3. LEGAL PROCEEDINGS
See Note 13 of the Notes to Financial Statements in this Annual Report for information regarding legal proceedings.
23
ITEM 4. MINE SAFETY DISCLOSURES
Not applicable.
24
PART II
ITEM 5. | MARKET FOR REGISTRANT’S COMMON EQUITY, RELATED STOCKHOLDER MATTERS AND ISSUER PURCHASES OF EQUITY SECURITIES |
MARKET INFORMATION, HOLDERS AND DIVIDENDS
Our common stock is listed on the NYSE under the trading symbol “OGS.” The following table sets forth the high and low closing prices of our common stock for the period indicated:
Year Ended | ||||||||||
December 31, 2016 | ||||||||||
High | Low | Dividends | ||||||||
First Quarter | $ | 61.78 | $ | 48.40 | $ | 0.35 | ||||
Second Quarter | $ | 66.59 | $ | 56.95 | $ | 0.35 | ||||
Third Quarter | $ | 66.50 | $ | 59.50 | $ | 0.35 | ||||
Fourth Quarter | $ | 64.59 | $ | 56.75 | $ | 0.35 | ||||
Year Ended | ||||||||||
December 31, 2015 | ||||||||||
High | Low | Dividends | ||||||||
First Quarter | $ | 46.11 | $ | 39.38 | $ | 0.30 | ||||
Second Quarter | $ | 44.33 | $ | 41.41 | $ | 0.30 | ||||
Third Quarter | $ | 45.56 | $ | 41.70 | $ | 0.30 | ||||
Fourth Quarter | $ | 51.34 | $ | 45.18 | $ | 0.30 | ||||
At February 10, 2017, there were 13,691 registered shareholders of the Company’s common stock.
In January 2017, we declared a dividend of $0.42 per share ($1.68 per share on an annualized basis), to shareholders of record as of February 24, 2017, payable on March 10, 2017.
ISSUER PURCHASES OF EQUITY SECURITIES
We repurchased approximately 407 thousand shares of our common stock for approximately $24.1 million during the year ended December 31, 2016.
Employee Stock Award Program
Under the Employee Stock Award Program, we issue, for no monetary consideration, one share of our common stock to all eligible employees when the per-share closing price of our common stock on the NYSE closes for the first time at or above each $1.00 increment above $34. The total number of shares of our common stock authorized for issuance under this program is 125,000. Shares issued to employees under this program during 2016, 2015 and 2014 totaled 50,573, 23,506 and 35,324, respectively, leaving 15,603 shares for future awards. Compensation expense, before taxes, related to the Employee Stock Award Program was $3.0 million, $1.1 million and $2.5 million for 2016, 2015 and 2014, respectively.
The shares issued under this program have not been registered under the Securities Act, in reliance upon the position taken by the SEC (see Release No. 6188, dated February 1, 1980) that the issuance of shares to employees pursuant to a program of this kind does not require registration under the Securities Act. See Note 10 of the Notes to Financial Statements in this Annual Report for additional information.
25
Performance Graph
The following performance graph compares the performance of our common stock with the S&P MidCap 400 Index, the Dow Jones Industrial Average and a ONE Gas Peer Group during the period beginning February 3, 2014, and ending on December 31, 2016. February 3, 2014 was the first day of “regular way” trading for ONE Gas common stock on the NYSE. This graph assumes a $100 investment in our common stock and in each of the indices at the beginning of the period and a reinvestment of dividends paid on such investments throughout the period.
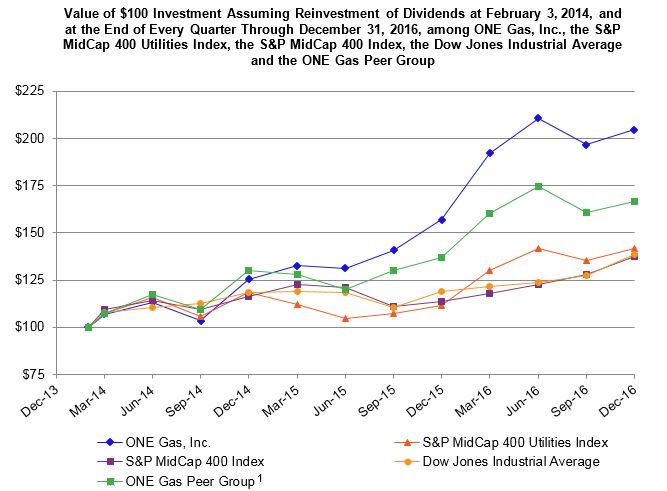
Cumulative Total Return | ||||||||||||||||||||||||||||||||||||
As of Each Quarter Ending | ||||||||||||||||||||||||||||||||||||
2014 | 2015 | 2016 | ||||||||||||||||||||||||||||||||||
3/31 | 6/30 | 9/30 | 12/31 | 3/31 | 6/30 | 9/30 | 12/31 | 3/31 | 6/30 | 9/30 | 12/31 | |||||||||||||||||||||||||
ONE Gas, Inc. | $ | 106.84 | $ | 113.12 | $ | 103.41 | $ | 125.39 | $ | 132.43 | $ | 131.32 | $ | 140.81 | $ | 156.83 | $ | 192.13 | $ | 210.61 | $ | 196.68 | $ | 204.61 | ||||||||||||
S&P MidCap 400 Utilities Index | $ | 107.49 | $ | 115.89 | $ | 105.54 | $ | 118.29 | $ | 112.20 | $ | 104.63 | $ | 107.00 | $ | 111.26 | $ | 129.79 | $ | 141.94 | $ | 135.28 | $ | 141.69 | ||||||||||||
S&P MidCap 400 Index | $ | 109.21 | $ | 113.93 | $ | 109.38 | $ | 116.32 | $ | 122.50 | $ | 121.19 | $ | 110.89 | $ | 113.78 | $ | 118.09 | $ | 122.80 | $ | 127.89 | $ | 137.37 | ||||||||||||
Dow Jones Industrial Average | $ | 107.54 | $ | 110.59 | $ | 112.66 | $ | 118.52 | $ | 118.91 | $ | 118.56 | $ | 110.28 | $ | 118.77 | $ | 121.39 | $ | 123.90 | $ | 127.34 | $ | 138.37 | ||||||||||||
ONE Gas Peer Group1 | $ | 107.47 | $ | 117.11 | $ | 109.30 | $ | 129.96 | $ | 128.14 | $ | 119.72 | $ | 129.81 | $ | 137.14 | $ | 160.25 | $ | 174.63 | $ | 160.66 | $ | 166.79 | ||||||||||||
1 The ONE Gas peer group used in this graph is the same peer group that will be used in determining our level of performance under our 2016 performance units at the end of the three-year performance period and is comprised of the following companies: Alliant Energy Corporation; Atmos Energy Corporation; Avista Corporation; CMS Energy Corporation; New Jersey Resources Corporation; NiSource Inc.; Northwest Natural Gas Company; NorthWestern Corporation; South Jersey Industries, Inc.; Southwest Gas Corporation; Spire Inc.; Vectren Corporation and WGL Holdings, Inc. | ||||||||||||||||||||||||||||||||||||
26
ITEM 6. SELECTED FINANCIAL DATA
The following table sets forth our selected financial data for each of the periods indicated:
Years Ended December 31, | ||||||||||||||||||||
2016 | 2015 | 2014 | 2013 | 2012 | ||||||||||||||||
(Millions of dollars except per share data) | ||||||||||||||||||||
Statement of income data: | ||||||||||||||||||||
Revenues | $ | 1,427.2 | $ | 1,547.7 | $ | 1,818.9 | $ | 1,690.0 | $ | 1,376.6 | ||||||||||
Net margin | $ | 885.4 | $ | 841.7 | $ | 827.0 | $ | 813.0 | $ | 756.4 | ||||||||||
Operating income | $ | 269.1 | $ | 239.1 | $ | 225.3 | $ | 220.3 | $ | 215.7 | ||||||||||
Net income | $ | 140.1 | $ | 119.0 | $ | 109.8 | $ | 99.2 | $ | 96.5 | ||||||||||
Basic earnings per share | $ | 2.67 | $ | 2.26 | $ | 2.10 | $ | 1.90 | $ | 1.84 | ||||||||||
Diluted earnings per share | $ | 2.65 | $ | 2.24 | $ | 2.07 | $ | 1.90 | $ | 1.84 | ||||||||||
Dividends declared per common share | $ | 1.40 | $ | 1.20 | $ | 0.84 | — | — | ||||||||||||
December 31, | ||||||||||||||||||||
2016 | 2015 | 2014 | 2013 | 2012 | ||||||||||||||||
(Millions of dollars) | ||||||||||||||||||||
Balance sheet data: | ||||||||||||||||||||
Total assets | $ | 4,942.8 | $ | 4,634.8 | $ | 4,638.8 | $ | 3,846.5 | $ | 3,491.3 | ||||||||||
Long-term debt, including current maturities | $ | 1,192.5 | $ | 1,191.7 | $ | 1,190.9 | $ | 1.3 | $ | 1.5 | ||||||||||
Long-term line of credit with ONEOK | $ | — | $ | — | $ | — | $ | 1,027.6 | $ | 1,027.6 | ||||||||||
Prior to 2014, historical basic and diluted earnings per share for the periods presented were calculated based on the number of shares distributed to ONEOK shareholders on separation plus any shares associated with fully vested stock awards that had not been issued and considered outstanding as of the beginning of each period prior to the separation. See Note 1 of the Notes to Financial Statements in this Annual Report for additional information on earnings per share.
ITEM 7. | MANAGEMENT’S DISCUSSION AND ANALYSIS OF FINANCIAL CONDITION AND RESULTS OF OPERATIONS |
The following discussion and analysis should be read in conjunction with our audited financial statements and Notes to Financial Statements in this Annual Report.
EXECUTIVE SUMMARY
We are a 100 percent regulated natural gas distribution company. As such, our regulators determine the rates we are allowed to charge for our service based on our revenue requirements needed to achieve our authorized rates of return. We earn revenues from the delivery of natural gas, but do not earn a profit on the natural gas that we deliver, as those costs are passed through to our customers at cost. The primary components of our revenue requirements are the amount of capital invested in our business, which is also known as rate base, our allowed rate of return on our capital investments and our recoverable operating expenses, including depreciation and income taxes. Our rates have both a fixed and a variable component, with approximately 74 percent of our natural gas sales net margin in 2016 derived from fixed monthly charges to our customers. The variable component of our rates is dependent on the consumption of natural gas, which is impacted primarily by the weather and, to a lesser extent, economic activity. While we have weather normalization mechanisms in most jurisdictions that adjust customers’ bills when the actual HDDs differ from normalized HDDs, these mechanisms are in place for only a portion of the year and do not offset all fluctuations in usage resulting from weather variability. Accordingly, the weather can have either a positive or negative impact on our financial performance.
Our financial performance, therefore, is contingent on a number of factors, including: (1) regulatory outcomes, which determine the returns we are authorized to earn and the rates we are allowed to charge for our service; (2) the consumption of natural gas, which impacts the amount of our net margin derived from the variable component of our rates; (3) our operating performance, which impacts our operating expenses; and (4) the perceived value of natural gas relative to other energy sources, particularly electricity, which influences our customers’ choice of natural gas to provide a portion of their energy needs.
27
We are subject to regulatory requirements for pipeline integrity and environmental compliance. These requirements impact our operating expenses and the level of capital expenditures required for compliance. Historically, our regulators have allowed recovery of these expenditures. However, because integrity and environmental regulation is changing constantly, our capital and operating expenditures to comply will change, as well. Although we believe our regulators will continue to allow recovery of such expenditures in the future, we will continue to make these expenditures with no assurance about if, or over what period, we will be permitted to recover them.
RECENT DEVELOPMENTS
In January 2017, we declared a dividend of $0.42 per share ($1.68 per share on an annualized basis) for shareholders of record as of February 24, 2017, payable on March 10, 2017.
REGULATORY ACTIVITIES
Oklahoma - In March 2016, Oklahoma Natural Gas filed its energy efficiency program true-up application for its 2015 program year, requesting a utility incentive of $1.9 million and a program true-up adjustment of $3.1 million. This filing also sought approval for the demand portfolio of conservation and energy efficiency programs for calendar years 2017 through 2019. In October 2016, the OCC approved the joint stipulation and settlement agreement which was filed in August 2016.
In July 2015, Oklahoma Natural Gas filed a request with the OCC for an increase in base rates, reflecting system investments and operating costs necessary to maintain the safety and reliability of its natural gas distribution system. In January 2016, the OCC approved a joint stipulation and settlement agreement to allow an increase in revenue of $29,995,000. We also recorded a regulatory asset of $2.4 million to recover certain information technology costs incurred as a result of our separation from ONEOK in 2014, which will be recovered over four years. The agreement set Oklahoma Natural Gas’ authorized return on equity at 9.5 percent, which represents the midpoint of the allowed range of 9.0 to 10.0 percent, and approved a rate base of approximately $1.2 billion. The agreement includes the continuation, with certain modifications, of the PBRC tariff that was established in 2009. Oklahoma Natural Gas expects to make its next PBRC filing on or before March 15, 2017.
In March 2015, Oklahoma Natural Gas filed its energy efficiency program true-up application for its 2014 program year, requesting a utility incentive of $1.2 million. In December 2015, the OCC approved the joint stipulation and settlement agreement which was filed in July 2015.
Oklahoma Natural Gas filed a PBRC application in March 2014. In June 2014, a joint stipulation and settlement agreement associated with our PBRC filing was reached and contained an increase in base rates of approximately $13.7 million, and an energy-efficiency program true-up and a utility incentive adjustment of $0.9 million. In August 2014, the settlement was approved by the OCC.
Kansas - In May 2016, Kansas Gas Service filed a request with the KCC for an increase in base rates, reflecting system investments and operating costs necessary to maintain the safety and reliability of its natural gas distribution system. Kansas Gas Service’s request represented a net base rate increase of $28.0 million. Kansas Gas Service is already recovering approximately $7.4 million from customers through the GSRS mechanism, resulting in a total base rate increase of $35.4 million. The filing was based on a 10.0 percent return on equity and a common equity ratio of 55.0 percent. The filing represented a rate base of $903 million, compared with $826 million included in existing base rates plus previously approved GSRS-eligible investments. In October 2016, Kansas Gas Service reached a unanimous settlement agreement with all parties for a net increase in base rates of approximately $8.1 million. Including the GSRS of approximately $7.4 million, the total base rate increase is $15.5 million. The agreement is a “black-box settlement,” meaning the parties agreed to a specific revenue number but no specific return on equity. The KCC issued an order approving the unanimous settlement agreement in November 2016, with new rates effective January 1, 2017.
In August 2015, Kansas Gas Service submitted an application to the KCC requesting an increase of approximately $2.4 million related to its GSRS. In November 2015, the KCC approved the $2.4 million increase effective December 2015.
In August 2014, Kansas Gas Service submitted an application to the KCC requesting an increase in rates of approximately $3.5 million related to its GSRS. In November 2014, the KCC approved an increase of $3.5 million effective in December 2014.
Texas - In June 2016, Texas Gas Service filed a rate case requesting an increase in revenues of $11.6 million for its Central Texas and South Texas service areas. The filing included a request to consolidate the South Texas service area with the Central
28
Texas service area. Texas Gas Service filed this rate case directly with the incorporated cities of the Central Texas service area, which includes the city of Austin, and the RRC for the unincorporated areas. In October 2016, all parties to the filing reached a unanimous settlement agreement for an increase in revenues of $6.8 million for the new consolidated service area. New rates were effective in November 2016, for customers in the incorporated cities of the former Central Texas service area. RRC approval was received in November 2016 and new rates became effective for customers in the unincorporated areas of the new consolidated Central Texas service area the same month. Texas Gas Service received approval for the same rates in the incorporated areas of the former South Texas service area with new rates effective in January 2017. In the agreement, the parties established a 9.5 percent return on equity and a 60.1 percent common equity ratio.
In November 2015, Texas Gas Service notified the EPSA that it would be filing a full rate case in 2016 in lieu of the previously agreed to annual rate review mechanism called EPARR. In March 2016, Texas Gas Service filed a rate case requesting an increase in revenues of $12.8 million for the EPSA and its Dell City and Permian service areas. The filing included a request to consolidate these three service areas into a new West Texas service area. Texas Gas Service filed this rate case directly with the incorporated cities of the EPSA and Dell City service area and the RRC for the unincorporated areas. In July 2016, several incorporated cities, including the city of El Paso, denied the request and Texas Gas Service appealed the denial to the RRC. In September 2016, the RRC approved consolidation of the three service areas into the new West Texas service area and a base rate increase of $8.8 million, which was based on a 9.5 percent return on equity and a 60.1 percent common equity ratio. In October 2016, rates went into effect for all service areas, except for the incorporated cities in the former Permian service area. Texas Gas Service filed for these new rates with the incorporated cities in the former Permian service area in October 2016 and the rates became effective in December 2016.
In December 2015, Texas Gas Service filed a rate case requesting an increase in revenues of $3.1 million for its Galveston and South Jefferson County service areas. The filing included a request to consolidate these two service areas into a new Gulf Coast service area. Texas Gas Service filed this rate case directly with the incorporated cities and the RRC for the unincorporated areas. Texas Gas Service reached a unanimous settlement agreement with representatives of the incorporated cities and the staff of the RRC on behalf of the unincorporated areas for an increase in revenues of $2.3 million. New rates became effective in May 2016.
In March 2015, Texas Gas Service filed under the EPARR, requesting an increase in revenues totaling $11.2 million in the city of El Paso and surrounding incorporated cities in the EPSA. In August 2015, Texas Gas Service and the incorporated cities in the EPSA reached an agreement on a rate increase of $8.0 million to take effect in August 2015. In April 2015, Texas Gas Service filed with the RRC under the GRIP statute, requesting an increase of $0.4 million in revenues for the unincorporated areas of the EPSA. The RRC approved the filing in July 2015.
Texas Gas Service received approval under the GRIP statute with the city of Austin, Texas, and surrounding communities in May 2015, for an increase in revenues of approximately $3.7 million. The new rates were effective in June 2015.
In the normal course of business, Texas Gas Service has filed rate cases and sought GRIP and COSA increases in various other Texas jurisdictions to address investments in rate base and changes in expenses. Annual rate increases associated with these filings that were approved totaled $2.0 million, $4.8 million and $4.0 million in 2016, 2015 and 2014, respectively.
General - Certain costs to be recovered through the ratemaking process have been capitalized as regulatory assets. Should recovery cease due to regulatory actions, certain of these assets may no longer meet the criteria for recognition and accordingly, a writeoff of regulatory assets and stranded costs may be required. There were no writeoffs of regulatory assets resulting from the failure to meet the criteria for capitalization during 2016, 2015 and 2014.
29
We operate in one reportable business segment: regulated public utilities that deliver natural gas to residential, commercial, industrial, wholesale, public authority and transportation customers. We evaluate our financial performance principally on operating income.
Selected Financial Results - The following table sets forth certain selected financial results for our operations for the periods indicated:
Variances | Variances | |||||||||||||||||||||||||
Years Ended December 31, | 2016 vs. 2015 | 2015 vs. 2014 | ||||||||||||||||||||||||
Financial Results | 2016 | 2015 | 2014 | Increase (Decrease) | Increase (Decrease) | |||||||||||||||||||||
(Millions of dollars, except percentages) | ||||||||||||||||||||||||||
Natural gas sales | $ | 1,300.1 | $ | 1,417.9 | $ | 1,680.1 | $ | (117.8 | ) | (8 | )% | $ | (262.2 | ) | (16 | )% | ||||||||||
Transportation revenues | 98.1 | 98.8 | 102.3 | (0.7 | ) | (1 | )% | (3.5 | ) | (3 | )% | |||||||||||||||
Cost of natural gas | 541.8 | 706.0 | 991.9 | (164.2 | ) | (23 | )% | (285.9 | ) | (29 | )% | |||||||||||||||
Net margin, excluding other revenues | 856.4 | 810.7 | 790.5 | 45.7 | 6 | % | 20.2 | 3 | % | |||||||||||||||||
Other revenues | 29.0 | 31.0 | 36.5 | (2.0 | ) | (6 | )% | (5.5 | ) | (15 | )% | |||||||||||||||
Net margin | 885.4 | 841.7 | 827.0 | 43.7 | 5 | % | 14.7 | 2 | % | |||||||||||||||||
Operating costs | 472.5 | 469.6 | 476.0 | 2.9 | 1 | % | (6.4 | ) | (1 | )% | ||||||||||||||||
Depreciation and amortization | 143.8 | 133.0 | 125.7 | 10.8 | 8 | % | 7.3 | 6 | % | |||||||||||||||||
Operating income | $ | 269.1 | $ | 239.1 | $ | 225.3 | $ | 30.0 | 13 | % | $ | 13.8 | 6 | % | ||||||||||||
Capital expenditures | $ | 309.0 | $ | 294.3 | $ | 297.1 | $ | 14.7 | 5 | % | $ | (2.8 | ) | (1 | )% | |||||||||||
Net margin is comprised of total revenues less cost of natural gas. Cost of natural gas includes commodity purchases, fuel, storage, transportation and other gas purchase costs recovered through our cost of natural gas regulatory mechanisms and does not include an allocation of general operating costs or depreciation and amortization. In addition, our cost of natural gas regulatory mechanisms provide a method of recovering natural gas costs on an ongoing basis without a profit. Therefore, although our revenues will fluctuate with the cost of gas that we purchase, net margin is not affected by fluctuations in the cost of natural gas.
The following table sets forth our net margin, excluding other revenues, by type of customer, for the periods indicated:
Variances | Variances | |||||||||||||||||||||||||
Years Ended December 31, | 2016 vs. 2015 | 2015 vs. 2014 | ||||||||||||||||||||||||
Net Margin, Excluding Other Revenues | 2016 | 2015 | 2014 | Increase (Decrease) | Increase (Decrease) | |||||||||||||||||||||
Natural gas sales | (Millions of dollars, except percentages) | |||||||||||||||||||||||||
Residential | $ | 629.8 | $ | 589.8 | $ | 569.7 | $ | 40.0 | 7 | % | $ | 20.1 | 4 | % | ||||||||||||
Commercial and industrial | 121.7 | 115.6 | 112.9 | 6.1 | 5 | % | 2.7 | 2 | % | |||||||||||||||||
Wholesale and public authority | 6.8 | 6.5 | 5.6 | 0.3 | 5 | % | 0.9 | 16 | % | |||||||||||||||||
Net margin on natural gas sales | 758.3 | 711.9 | 688.2 | 46.4 | 7 | % | 23.7 | 3 | % | |||||||||||||||||
Transportation revenues | 98.1 | 98.8 | 102.3 | (0.7 | ) | (1 | )% | (3.5 | ) | (3 | )% | |||||||||||||||
Net margin, excluding other revenues | $ | 856.4 | $ | 810.7 | $ | 790.5 | $ | 45.7 | 6 | % | $ | 20.2 | 3 | % | ||||||||||||
Our net margin on natural gas sales is comprised of two components, fixed and variable margin. Fixed margin reflects the portion of our net margin attributable to the monthly fixed customer charge component of our rates, which does not fluctuate based on customer usage in each period. Variable margin reflects the portion of our net margin that fluctuates with the volumes delivered and billed. We believe that the combination of the significant residential component of our customer base, the fixed charge component of our sales margin and our regulatory rate mechanisms in place result in a stable cash flow profile. The following table sets forth our net margin on natural gas sales by revenue type for the periods indicated:
Variances | Variances | |||||||||||||||||||||||||
Years Ended December 31, | 2016 vs. 2015 | 2015 vs. 2014 | ||||||||||||||||||||||||
Net Margin on Natural Gas Sales | 2016 | 2015 | 2014 | Increase (Decrease) | Increase (Decrease) | |||||||||||||||||||||
Net margin on natural gas sales | (Millions of dollars, except percentages) | |||||||||||||||||||||||||
Fixed margin | $ | 557.5 | $ | 519.2 | $ | 490.4 | $ | 38.3 | 7 | % | $ | 28.8 | 6 | % | ||||||||||||
Variable margin | 200.8 | 192.7 | 197.8 | 8.1 | 4 | % | (5.1 | ) | (3 | )% | ||||||||||||||||
Net margin on natural gas sales | $ | 758.3 | $ | 711.9 | $ | 688.2 | $ | 46.4 | 7 | % | $ | 23.7 | 3 | % | ||||||||||||
30
2016 vs. 2015 - Net margin increased $43.7 million due primarily to the following:
• | an increase of $44.0 million from new rates primarily in Oklahoma and Texas; |
• | an increase of $3.8 million in residential sales due primarily to customer growth in Oklahoma and Texas; and |
• | an increase of $1.3 million in ad-valorem recoveries in Kansas, which is offset with higher regulatory amortization expense in depreciation and amortization expense; offset partially by |
• | a decrease of $1.8 million due to lower sales volumes, net of weather normalization, primarily from warmer weather in 2016 compared to 2015; |
• | a decrease of $1.7 million due primarily to lower transportation volumes from weather-sensitive customers in Kansas and Oklahoma; and |
• | a decrease of $1.1 million in CNG revenues in Oklahoma. |
Operating costs increased $2.9 million due primarily to the following:
• | an increase of $4.0 million in environmental remediation costs discussed further below in our Environmental, Safety and Regulatory Matters; |
• | an increase of $2.7 million in legal-related costs; and |
• | an increase of $0.9 million in employee-related costs; offset partially by |
• | a decrease of $2.9 million from the deferral of certain information technology costs incurred as a result of our separation from ONEOK in 2014, which was approved in Oklahoma as a regulatory asset, and a deferral of regulatory expenses incurred previously, which was approved in the West Texas rate case as a regulatory asset; and |
• | a decrease of $1.5 million in information technology costs. |
Depreciation and amortization expense increased $10.8 million due primarily to an increase in depreciation from our capital expenditures being placed into service.
2015 vs. 2014 - Net margin increased $14.7 million due primarily to the following:
• | an increase of $27.5 million from new rates, primarily in Texas and Oklahoma; and |
• | an increase of $4.8 million in residential sales due primarily to customer growth in Oklahoma and Texas; offset partially by |
• | a decrease of $6.0 million due to lower line extension revenue, from commercial and industrial customers, and other revenues; |
• | a decrease of $4.8 million due to lower sales volumes, net of weather normalization, primarily due to warmer weather in 2015; |
• | a decrease of $3.7 million in rider and surcharge recoveries due to a lower ad-valorem surcharge in Kansas and the expiration of the rider associated with the recovery of take-or-pay settlements in Oklahoma, both of which are offset by lower regulatory amortization in depreciation and amortization expense below; and |
• | a decrease of $3.1 million due primarily to lower transportation volumes from weather-sensitive customers primarily in Kansas. |
Operating costs decreased $6.4 million due primarily to the following:
• | a decrease of $6.8 million in information technology services associated with our separation from ONEOK; |
• | a decrease of $6.0 million in outside services costs due primarily to operational efficiencies; |
• | a decrease of $4.1 million in legal and worker’s compensation expense; |
• | a decrease of $2.7 million in bad debt expense primarily due to warmer weather in Kansas; |
• | a decrease of $1.4 million in fleet-related expenses due primarily to lower fuel costs; and |
• | a decrease of $0.9 million in ad-valorem taxes; offset partially by |
• | an increase of $16.3 million in employee-related costs due primarily to increases of $9.3 million in higher labor costs due to an increase in our number of employees and $7.0 million in benefit costs, which includes the impact of the changes in our discount rate for pension and other postemployment benefit costs compared with the prior year. |
Depreciation and amortization expense increased $7.3 million due primarily to an increase in depreciation of $12.1 million from capital expenditures being placed in service, offset partially by a decrease in the amortization of the ad-valorem surcharge in Kansas and the take-or-pay rider in Oklahoma of $3.6 million.
Capital Expenditures - Our capital expenditures program includes expenditures for pipeline integrity, extending service to new areas, modifications to customer service lines, increasing system capabilities, pipeline replacements, automated meter reading,
31
government-mandated pipeline relocations, fleet, facilities and information technology assets. It is our practice to maintain and upgrade our infrastructure, facilities and systems to ensure safe, reliable and efficient operations.
Capital expenditures increased $14.7 million for 2016, compared with 2015, due primarily to increased system integrity activities and extending service to new areas. Capital expenditures decreased $2.8 million for 2015, compared with 2014, due primarily to reduced spending on information technology hardware and software in 2014 related to our separation from ONEOK. Our capital expenditures are expected to be approximately $350.0 million for 2017.
Selected Operating Information - The following tables set forth certain selected operating information for the periods indicated:
Years Ended | Variances | ||||||||||||||||||||||||
December 31, | 2016 vs. 2015 | ||||||||||||||||||||||||
(in thousands) | 2016 | 2015 | Increase (Decrease) | ||||||||||||||||||||||
Average Number of Customers | OK | KS | TX | Total | OK | KS | TX | Total | OK | KS | TX | Total | |||||||||||||
Residential | 787 | 581 | 612 | 1,980 | 783 | 579 | 606 | 1,968 | 4 | 2 | 6 | 12 | |||||||||||||
Commercial and industrial | 73 | 50 | 34 | 157 | 73 | 50 | 34 | 157 | — | — | — | — | |||||||||||||
Wholesale and public authority | — | — | 3 | 3 | — | — | 3 | 3 | — | — | — | — | |||||||||||||
Transportation | 5 | 6 | 1 | 12 | 5 | 6 | 1 | 12 | — | — | — | — | |||||||||||||
Total customers | 865 | 637 | 650 | 2,152 | 861 | 635 | 644 | 2,140 | 4 | 2 | 6 | 12 | |||||||||||||
Years Ended | Variances | ||||||||||||||||||||||||
December 31, | 2015 vs. 2014 | ||||||||||||||||||||||||
(in thousands) | 2015 | 2014 | Increase (Decrease) | ||||||||||||||||||||||
Average Number of Customers | OK | KS | TX | Total | OK | KS | TX | Total | OK | KS | TX | Total | |||||||||||||
Residential | 783 | 579 | 606 | 1,968 | 776 | 578 | 601 | 1,955 | 7 | 1 | 5 | 13 | |||||||||||||
Commercial and industrial | 73 | 50 | 34 | 157 | 72 | 50 | 34 | 156 | 1 | — | — | 1 | |||||||||||||
Wholesale and public authority | — | — | 3 | 3 | — | — | 4 | 4 | — | — | (1 | ) | (1 | ) | |||||||||||
Transportation | 5 | 6 | 1 | 12 | 5 | 6 | 1 | 12 | — | — | — | — | |||||||||||||
Total customers | 861 | 635 | 644 | 2,140 | 853 | 634 | 640 | 2,127 | 8 | 1 | 4 | 13 | |||||||||||||
Years Ended December 31, | |||||||||
Volumes (MMcf) | 2016 | 2015 | 2014 | ||||||
Natural gas sales | |||||||||
Residential | 105,494 | 115,477 | 125,337 | ||||||
Commercial and industrial | 33,084 | 35,943 | 38,555 | ||||||
Wholesale and public authority | 2,406 | 2,615 | 2,454 | ||||||
Total volumes sold | 140,984 | 154,035 | 166,346 | ||||||
Transportation | 208,141 | 204,763 | 213,456 | ||||||
Total volumes delivered | 349,125 | 358,798 | 379,802 | ||||||
Total volumes delivered decreased for 2016, compared with 2015, due primarily to warmer temperatures in 2016. Total volumes delivered decreased for 2015, compared with 2014, due primarily to warmer temperatures in 2015. The impacts on margins for the periods presented were mitigated largely by weather-normalization mechanisms. Transportation volumes increased slightly for 2016, compared with 2015, due to a large industrial customer’s facility undergoing maintenance in 2015, offset by a decrease in transportation volumes associated with smaller weather-sensitive customers.
Wholesale sales represent contracted natural gas volumes that exceed the needs of our residential, commercial and industrial customer base and are available for sale to other parties. The impact to net margin from changes in volumes associated with these customers is minimal.
32
Years Ended | |||||||||||||||||||||
December 31, | |||||||||||||||||||||
2016 | 2015 | 2016 vs. 2015 | 2016 | 2015 | |||||||||||||||||
HDDs | Actual | Normal | Actual | Normal | Actual Variance | Actual as a percent of Normal | |||||||||||||||
Oklahoma | 2,843 | 3,264 | 3,135 | 3,317 | (9 | )% | 87 | % | 95 | % | |||||||||||
Kansas | 4,016 | 4,860 | 4,264 | 4,860 | (6 | )% | 83 | % | 88 | % | |||||||||||
Texas | 1,455 | 1,785 | 1,715 | 1,785 | (15 | )% | 82 | % | 96 | % | |||||||||||
Years Ended | |||||||||||||||||||||
December 31, | |||||||||||||||||||||
2015 | 2014 | 2015 vs. 2014 | 2015 | 2014 | |||||||||||||||||
HDDs | Actual | Normal | Actual | Normal | Actual Variance | Actual as a percent of Normal | |||||||||||||||
Oklahoma | 3,135 | 3,317 | 3,720 | 3,317 | (16 | )% | 95 | % | 112 | % | |||||||||||
Kansas | 4,264 | 4,860 | 5,179 | 4,860 | (18 | )% | 88 | % | 107 | % | |||||||||||
Texas | 1,715 | 1,785 | 1,716 | 1,788 | — | % | 96 | % | 96 | % | |||||||||||
Normal HDDs are established through rate proceedings in each of our rate jurisdictions for use primarily in weather normalization billing calculations. Normal HDDs disclosed above are based on:
• | For 2016, 10-year weighted average HDDs as of December 31, 2014, for years 2005-2014, as calculated using 11 weather stations across Oklahoma and weighted on average customer count for Oklahoma, and for 2015 and 2014, 10-year weighted average HDDs as of December 31, 2008, for years 1999-2008, as calculated using 11 weather stations across Oklahoma and weighted on average customer count for Oklahoma; |
• | 30-year average for years 1981-2010 published by the National Oceanic and Atmospheric Administration, as calculated using 13 weather stations across Kansas and weighted on HDDs by weather station and customers for Kansas; and |
• | an average of HDDs authorized in our most recent rate proceeding in each jurisdiction, and weighted using a rolling 10-year average of actual natural gas distribution sales volumes by jurisdiction for Texas. |
Actual HDDs are based on year-to-date, weighted average of:
• | 11 weather stations and customers by month for Oklahoma; |
• | 13 weather stations and customers by month for Kansas; and |
• | 9 weather stations and natural gas distribution sales volumes by service area for Texas. |
CONTINGENCIES
We are a party to various litigation matters and claims that have arisen in the normal course of our operations. While the results of litigation and claims cannot be predicted with certainty, we believe the reasonably possible losses from such matters, individually and in the aggregate, are not material. Additionally, we believe the probable final outcome of such matters will not have a material adverse effect on our results of operations, financial position or cash flows. See Note 13 of the Notes to Financial Statements in this Annual Report for information with respect to legal proceedings.
LIQUIDITY AND CAPITAL RESOURCES
General - We have relied primarily on operating cash flow and commercial paper for our liquidity and capital resource requirements. We fund operating expenses, working capital requirements, including purchases of natural gas, and capital expenditures primarily with cash from operations and commercial paper.
We believe that the combination of the significant residential component of our customer base, the fixed-charge component of our natural gas sales net margin and our regulatory rate mechanisms that we have in place result in a stable cash flow profile. Because the energy consumption of residential customers is less volatile compared with commercial and industrial customers, our business historically has generated stable and predictable net margin and cash flows. Additionally, we have several
33
regulatory rate mechanisms in place to reduce the lag in earning a return on our capital expenditures. We anticipate that our cash flow generated from operations and our expected short- and long-term financing arrangements will enable us to maintain our current and planned level of operations and provide us flexibility to finance our infrastructure investments.
Our ability to access capital markets for debt and equity financing under reasonable terms depends on market conditions and our financial condition and credit ratings. We believe that stronger credit ratings will provide a significant advantage to our business. By maintaining a conservative financial profile and stable revenue base, we believe that we will be able to maintain an investment-grade credit rating, which we believe will provide us access to diverse sources of capital at favorable rates in order to finance our infrastructure investments.
Short-term Financing - The ONE Gas Credit Agreement, which is scheduled to expire in January 2019, contains certain financial, operational and legal covenants. Among other things, these covenants include maintaining ONE Gas’ total debt-to-capital ratio of no more than 70 percent at the end of any calendar quarter. The ONE Gas Credit Agreement also contains customary affirmative and negative covenants, including covenants relating to liens, indebtedness of subsidiaries, investments, changes in the nature of business, fundamental changes, transactions with affiliates, burdensome agreements, and use of proceeds. In the event of a breach of certain covenants by ONE Gas, amounts outstanding under the ONE Gas Credit Agreement may become due and payable immediately. At December 31, 2016, our total debt-to-capital ratio was 41 percent, and we were in compliance with all covenants under the ONE Gas Credit Agreement.
The ONE Gas Credit Agreement includes a $50 million sublimit for the issuance of standby letters of credit and also features an option to request an increase in the size of the facility to an aggregate of $1.2 billion from $700 million, upon satisfaction of customary conditions, including receipt of commitments from new lenders or increased commitments from existing lenders. Borrowings made under the facility are available for general corporate purposes. The ONE Gas Credit Agreement contains provisions for an applicable margin rate and an annual facility fee, both of which adjust with changes in our credit rating. Based on our current credit ratings, borrowings, if any, will accrue interest at LIBOR plus 79.5 basis points, and the annual facility fee is 8 basis points.
We may reduce the unutilized portion of the ONE Gas Credit Agreement in whole or in part without premium or penalty. The ONE Gas Credit Agreement contains customary events of default. Upon the occurrence of certain events of default, the obligations under the ONE Gas Credit Agreement may be accelerated and the commitments may be terminated.
We have a commercial paper program under which we may issue unsecured commercial paper up to a maximum amount of $700 million to fund short-term borrowing needs. The maturities of the commercial paper notes may vary but may not exceed 270 days from the date of issue. The commercial paper notes are generally sold at par less a discount representing an interest factor.
The ONE Gas Credit Agreement is available to repay the commercial paper notes, if necessary. Amounts outstanding under the commercial paper program reduce the borrowing capacity under the ONE Gas Credit Agreement.
At December 31, 2016, we had issued $145 million in the form of commercial paper, $1.5 million in letters of credit outstanding and had approximately $14.7 million of cash and cash equivalents. At December 31, 2016, we had no borrowings and $553.5 million of credit available under the ONE Gas Credit Agreement. The weighted-average interest rate on our commercial paper was 0.95 percent at December 31, 2016.
Long-Term Debt - The indenture governing our Senior Notes includes an event of default upon the acceleration of other indebtedness of $100 million or more. Such events of default would entitle the trustee or the holders of 25 percent in aggregate principal amount of the outstanding Senior Notes to declare those Senior Notes immediately due and payable in full.
We may redeem our Senior Notes at par, plus accrued and unpaid interest to the redemption date, starting one month, three months, and six months, respectively, before their maturity dates. Prior to these dates, we may redeem these Senior Notes, in whole or in part, at a redemption price equal to the principal amount, plus accrued and unpaid interest and a make-whole premium. The redemption price will never be less than 100 percent of the principal amount of the respective Senior Notes plus accrued and unpaid interest to the redemption date. Our Senior Notes are senior unsecured obligations, ranking equally in right of payment with all of our existing and future unsecured senior indebtedness.
34
Credit Ratings - Our credit ratings as of December 31, 2016, were:
Rating Agency | Rating | Outlook |
Moody’s | A2 | Stable |
S&P | A- | Positive |
Our commercial paper is currently rated Prime-1 by Moody’s and A-2 by S&P. We intend to maintain strong credit metrics while we pursue a balanced approach to capital investment and a return of capital to shareholders via a dividend that we believe will be competitive with our peer group. In June 2016, S&P changed our outlook to Positive from Stable.
Pension and Other Postemployment Benefit Plans - Information about our pension and other postemployment benefits plans, including anticipated contributions, is included under Note 11 of the Notes to Financial Statements in this Annual Report.
CASH FLOW ANALYSIS
We use the indirect method to prepare our Statements of Cash Flows. Under this method, we reconcile net income to cash flows provided by operating activities by adjusting net income for those items that impact net income but may not result in actual cash receipts or payments and changes in our assets and liabilities not classified as investing or financing activities during the period. Items that impact net income but may not result in actual cash receipts or payments include, but are not limited to, depreciation and amortization, deferred income taxes, share-based compensation expense and provision for doubtful accounts.
The following table sets forth the changes in cash flows by operating, investing and financing activities for the periods indicated:
Years Ended December 31, | Variances | |||||||||||||||||
2016 | 2015 | 2014 | 2016 vs. 2015 | 2015 vs. 2014 | ||||||||||||||
(Millions of dollars) | ||||||||||||||||||
Total cash provided by (used in): | ||||||||||||||||||
Operating activities | $ | 281.6 | $ | 394.2 | $ | 246.6 | $ | (112.6 | ) | $ | 147.6 | |||||||
Investing activities | (308.5 | ) | (294.3 | ) | (297.1 | ) | (14.2 | ) | 2.8 | |||||||||
Financing activities | 39.2 | (109.4 | ) | 59.2 | 148.6 | (168.6 | ) | |||||||||||
Change in cash and cash equivalents | 12.3 | (9.5 | ) | 8.7 | 21.8 | (18.2 | ) | |||||||||||
Cash and cash equivalents at beginning of period | 2.4 | 11.9 | 3.2 | (9.5 | ) | 8.7 | ||||||||||||
Cash and cash equivalents at end of period | $ | 14.7 | $ | 2.4 | $ | 11.9 | $ | 12.3 | $ | (9.5 | ) | |||||||
Operating Cash Flows - Changes in cash flows from operating activities are due primarily to changes in net margin and operating expenses discussed in Financial Results and Operating Information. Changes in natural gas prices and demand for our services or natural gas, whether because of general economic conditions, changes in supply or increased competition from other service providers, could affect our earnings and operating cash flows. Typically, our cash flows from operations are greater in the first half of the year compared with the second half of the year.
2016 vs. 2015 - Cash flows from operating activities were lower in 2016 compared with 2015. Before considering the impacts of operating asset and liability changes, cash flows were higher in 2016 compared with 2015 due primarily to an increase in net income, higher noncash expenses for depreciation and amortization and deferred income taxes. The increase in operating asset and liability changes more than offset these increases. The largest increase in working capital relates to an increase in accounts receivable caused by higher costs of natural gas delivered to customers in the fourth quarter of 2016 compared with 2015, when accounts receivable declined. Additionally, through 2016, our net over-recovered purchased gas costs decreased by $29.3 million. Through 2015, our net over-recovered purchased gas costs increased by $25.3 million. The change in the natural gas cost recoveries between periods also contributed to the decrease in cash flows from operating assets and liabilities.
2015 vs. 2014 - Cash flows from operating assets and liabilities in our operating activities increased in 2015, compared with 2014, due primarily to the collection of trade receivables, tax receivables, payment of trade payables and the recovery of natural gas purchase costs, including natural gas in storage, through our purchased-gas cost adjustment mechanisms, which were impacted by warmer weather and lower natural gas costs. The timing of cash collections from customers and payments to
35
vendors and suppliers vary from period to period in the normal course of business and directly impact our cash flows from operations. In addition, our changes in income taxes receivable were impacted by an extension of the IRS rules for bonus depreciation.
Investing Cash Flows - 2016 vs. 2015 - Cash used in investing activities increased for 2016, compared to 2015, due primarily to capital expenditures for increased system integrity activities and extending service to new areas.
2015 vs. 2014 - Cash used in investing activities decreased for 2015, compared to 2014, due primarily to capital expenditures for information technology hardware and software associated with our separation from ONEOK.
Financing Cash Flows - 2016 vs. 2015 - Cash provided by financing activities for 2016 increased, compared with cash used in 2015, due primarily to net borrowings on our notes payable to fund working capital and capital investments, offset partially by the 20 cent per share increase in annual dividends.
2015 vs. 2014 - Cash used in financing activities increased for 2015, compared with 2014, due primarily to an increase in the quarterly dividend rate of two cents, an additional quarter of dividends paid in 2015, a decrease in our outstanding notes payable, and purchases of treasury stock.
ENVIRONMENTAL, SAFETY AND REGULATORY MATTERS
Environmental Matters - We are subject to multiple historical, wildlife preservation and environmental laws and/or regulations that affect many aspects of our present and future operations. Regulated activities include, but are not limited to, those involving air emissions, storm water and wastewater discharges, handling and disposal of solid and hazardous wastes, wetland preservation, hazardous materials transportation, and pipeline and facility construction. These laws and regulations require us to obtain and/or comply with a wide variety of environmental clearances, registrations, licenses, permits and other approvals. Failure to comply with these laws, regulations, licenses and permits may expose us to fines, penalties and/or interruptions in our operations that could be material to our results of operations. In addition, emission controls and/or other regulatory or permitting mandates under the Clean Air Act and other similar federal and state laws could require unexpected capital expenditures. We cannot assure that existing environmental statutes and regulations will not be revised or that new regulations will not be adopted or become applicable to us. Revised or additional statutes or regulations that result in increased compliance costs or additional operating restrictions could have a material adverse effect on our business, financial condition, results of operations and cash flows.
We own or retain legal responsibility for the environmental conditions at 12 former manufactured natural gas sites in Kansas. These sites contain potentially harmful materials that are subject to control or remediation under various environmental laws and regulations. A consent agreement with the KDHE governs all work at these sites. The terms of the consent agreement require us to investigate these sites and set remediation activities based upon the results of the investigations and risk analysis. Remediation typically involves the management of contaminated soils and may involve removal of structures and monitoring and/or remediation of groundwater.
We have completed or addressed removal of the source of soil contamination at 11 of the 12 sites, and continue to monitor groundwater at eight of the 12 sites according to plans approved by the KDHE. Regulatory closure has been achieved at three of the sites, subject to any future regulatory remediation requirements that may require additional costs. During 2016, we completed a site assessment at the twelfth site where no active soil remediation has occurred. We have submitted a work plan to the KDHE for approval to remove contaminated soil at this site. Costs associated with the remediation at this site are not expected to be material to our results of operations or financial position.
With regard to one of our former manufactured natural gas sites, recent results from periodic monitoring and a 2016 interim site investigation indicated elevated levels of potentially harmful materials at the site. In response to the results of the interim site investigation, during the fourth quarter of 2016, potential investigation and remediation alternatives were developed. We have estimated the potential costs associated with additional investigation and remediation to be in the range of $4.0 million to $7.0 million. Additional testing and work plan development will be conducted in 2017 to develop a remediation work plan to present to the KDHE for approval and could impact our estimates of the cost of remediation at this site. A single reliable estimate of the remediation costs is not feasible due to the amount of uncertainty in the ultimate remediation approach that will be utilized. Accordingly, in the fourth quarter of 2016, we recorded a reserve of $4.0 million for this site.
Our expenditures for environmental evaluation, mitigation, remediation and compliance to date have not been significant in relation to our financial position, results of operations or cash flows, and our expenditures related to environmental matters had no material effects on earnings or cash flows during 2016, 2015 and 2014. A number of environmental issues may exist with
36
respect to manufactured gas plants that are unknown to us. Accordingly, future costs are dependent on the final determination and regulatory approval of any remedial actions, the complexity of the site, level of remediation required, changing technology and governmental regulations, and to the extent not recovered by insurance or recoverable in rates from our customers, could be material to our financial condition, results of operations or cash flows.
With the trend toward stricter standards, greater regulation and more extensive permit requirements for the types of assets operated by us that are subject to environmental regulation, our environmental expenditures could increase in the future, and such expenditures may not be fully recovered by insurance or recoverable in rates from our customers, and those costs may adversely affect our financial condition, results of operations and cash flows. We do not expect expenditures for these matters to have a material adverse effect on our financial condition, results of operations or cash flows.
Pipeline Safety - We are subject to PHMSA regulations, including integrity-management regulations. PHMSA regulations require pipeline companies operating high-pressure transmission pipelines to perform integrity assessments on pipeline segments that pass through densely populated areas or near specifically designated high-consequence areas. In January 2012, the Pipeline Safety, Regulatory Certainty and Job Creation Act was signed into law. The law increased maximum penalties for violating federal pipeline safety regulations and directs the DOT and the Secretary of Transportation to conduct further review or studies on issues that may or may not be material to us. These issues include, but are not limited to, the following:
• | an evaluation of whether natural gas pipeline integrity-management requirements should be expanded beyond current high-consequence areas; |
• | a verification of records for pipelines in class 3 and 4 locations and high-consequence areas to confirm maximum allowable operating pressures; and |
• | a requirement to test previously untested pipelines operating above 30 percent yield strength in high-consequence areas. |
In April 2016, PHMSA published a NPRM, the Safety of Gas Transmission & Gathering Lines Rule, in the Federal Register to revise pipeline safety regulations applicable to the safety of onshore natural gas transmission and gathering pipelines. Proposals include changes to pipeline integrity management requirements and other safety-related requirements. The NPRM comment period ended July 7, 2016, and comments are under review by PHMSA. The potential capital and operating expenditures associated with the NPRM are currently being evaluated and could be significant depending on the final regulations.
Air and Water Emissions - The Clean Air Act, the Clean Water Act, analogous state laws and/or regulations promulgated thereunder, impose restrictions and controls regarding the discharge of pollutants into the air and water in the United States. Under the Clean Air Act, a federally enforceable operating permit is required for sources of significant air emissions. We may be required to incur certain capital expenditures for air-pollution-control equipment in connection with obtaining or maintaining permits and approvals for sources of air emissions. We do not expect that these expenditures will have a material impact on our respective results of operations, financial position or cash flows. The Clean Water Act imposes substantial potential liability for the removal of pollutants discharged to waters of the United States and remediation of waters affected by such discharge.
International, federal, regional and/or state legislative and/or regulatory initiatives may attempt to regulate greenhouse gas emissions. We monitor relevant legislation and regulatory initiatives to assess the potential impact on our operations. The EPA’s Mandatory Greenhouse Gas Reporting Rule requires annual greenhouse gas emissions reporting as carbon dioxide equivalents from affected facilities and for the natural gas delivered by us to our natural gas distribution customers who are not otherwise required to report their own emissions. The additional cost to gather and report this emission data did not have, and we do not expect it to have, a material impact on our results of operations, financial position or cash flows. In addition, Congress has considered, and may consider in the future, legislation to reduce greenhouse gas emissions, including carbon dioxide and methane. Likewise, the EPA may institute additional regulatory rulemaking associated with greenhouse gas emissions. At this time, no rule or legislation has been enacted for natural gas distribution that assesses any costs, fees or expenses on any of these emissions.
CERCLA - The federal CERCLA, also commonly known as Superfund, imposes strict, joint and several liability, without regard to fault or the legality of the original act, on certain classes of “persons” (defined under CERCLA) that caused and/or contributed to the release of a hazardous substance into the environment. These persons include, but are not limited to, the owner or operator of a facility where the release occurred and/or companies that disposed or arranged for the disposal of the hazardous substances found at the facility. Under CERCLA, these persons may be liable for the costs of cleaning up the hazardous substances released into the environment, damages to natural resources and the costs of certain health studies. We
37
do not expect that our responsibilities under CERCLA will have a material impact on our respective results of operations, financial position or cash flows.
Pipeline Security - The U.S. Department of Homeland Security’s Transportation Security Administration issued updated pipeline security guidelines in April 2012. Our pipeline facilities have been reviewed according to the current guidelines and no material changes have been required to date.
Environmental Footprint - Our environmental and climate change strategy focuses on taking steps to minimize the impact of our operations on the environment. These strategies include: (1) developing and maintaining an accurate greenhouse gas emissions inventory according to current rules issued by the EPA; (2) improving the integrity of our various pipelines; (3) following developing technologies for emission control; and (4) utilizing practices to reduce the loss of methane from our facilities.
We participate in the EPA’s Natural Gas STAR Program to voluntarily reduce methane emissions. We continue to focus on maintaining low rates of lost-and-unaccounted-for natural gas through expanded implementation of best practices to limit the release of natural gas during pipeline and facility maintenance and operations. Additionally, in March 2016, we were one of 40 founding partners to launch the EPA’s Natural Gas STAR Methane Challenge Program, whereby oil and natural gas companies agree to promote and track commitments to reduce methane emissions beyond what is federally required. Our Methane Challenge Program commitment to annually replace or rehabilitate at least two percent of our combined inventory of cast iron and noncathodically-protected steel pipe aligns with our planned system integrity expenditures for infrastructure replacements. We anticipate reporting in 2018 our calendar year 2017 performance relative to our commitment.
Additional information about our environmental matters is included in the section entitled “Environmental Matters” in Note 13 of the Notes to Financial Statements in this Annual Report. We cannot assure that existing environmental statutes and regulations will not be revised or that new regulations will not be adopted or become applicable to us. Revised or additional regulations that result in increased compliance costs or additional operating restrictions could have a material adverse effect on our business, financial condition and results of operations. Our expenditures for environmental investigation, and remediation compliance to-date have not been significant in relation to our financial position, results of operations or cash flows, and our expenditures related to environmental matters had no material effects on earnings or cash flows during 2016, 2015 and 2014.
Regulatory - Several regulatory initiatives impacted the earnings and future earnings potential of our business. See additional information regarding our regulatory initiatives in Management’s Discussion and Analysis of Financial Condition and Results of Operations.
IMPACT OF NEW ACCOUNTING STANDARDS
Information about the impact of new accounting standards is included in Note 1 of the Notes to Financial Statements in this Annual Report.
ESTIMATES AND CRITICAL ACCOUNTING POLICIES
The preparation of our financial statements and related disclosures in accordance with GAAP requires us to make estimates and assumptions with respect to values or conditions that cannot be known with certainty that affect the reported amounts of assets and liabilities; and also requires the disclosure of contingent assets and liabilities at the date of the financial statements. These estimates and assumptions also affect the reported amounts of revenue and expenses during the reporting period. Although we believe these estimates and assumptions are reasonable, actual results could differ from our estimates. See our Risk Factors and/or Forward-Looking Statements for factors which could impact our estimates.
The following summary sets forth what we consider to be our most critical estimates and accounting policies. Our critical accounting policies are defined as those estimates and policies most important to the portrayal of our financial condition and results of operations and that require management’s most difficult, subjective or complex judgment, particularly because of the need to make estimates concerning the impact of inherently uncertain matters.
Regulation - Our operations are subject to regulation with respect to rates, service, maintenance of accounting records and various other matters by the respective regulatory authorities in the states in which we operate. We account for the financial effects of the ratemaking and accounting practices and policies of the various regulatory commissions in our financial statements. We record regulatory assets for costs that have been deferred for which future recovery through customer rates is considered probable and regulatory liabilities when it is probable that revenues will be reduced for amounts that will be credited to customers through the ratemaking process. As a result, certain costs that would normally be expensed under GAAP
38
are capitalized or deferred on the balance sheet because it is probable they can be recovered through rates. Discontinuing the application of this method of accounting for regulatory assets and liabilities could significantly increase our operating expenses, as fewer costs would likely be capitalized or deferred on the balance sheet, which could reduce our net income. Further, regulation may impact the period in which revenues or expenses are recognized. The amounts to be recovered or recognized are based upon historical experience and our understanding of the regulations. The impact of regulation on our operations may be affected by decisions of the regulatory authorities or the issuance of new regulations.
For further discussion of regulatory assets and liabilities, see Note 8 of the Notes to Financial Statements in this Annual Report.
Impairment of Goodwill - We assess our goodwill for impairment at least annually as of July 1. Our goodwill impairment analysis performed in 2016 and 2015, utilized a qualitative assessment and did not result in any impairment indicators. Subsequent to July 1, 2016, no event has occurred indicating that the fair value is less than the carrying value.
As part of our goodwill impairment test, we first assess qualitative factors (including macroeconomic conditions, industry and market considerations, cost factors and overall financial performance) to determine whether it is more likely than not that our fair value is less than our carrying amount. If further testing is necessary, we perform a two-step impairment test for goodwill. In the first step, an initial assessment is made by comparing our fair value with our book value, including goodwill. If the fair value is less than the book value, an impairment is indicated, and we must perform a second test to measure the amount of the impairment. In the second test, we calculate the implied fair value of the goodwill by deducting the fair value of all tangible and intangible net assets from the fair value determined in step one of the assessment. If the carrying value of the goodwill exceeds the implied fair value of the goodwill, we will record an impairment charge.
To estimate our fair value, we use two generally accepted valuation approaches, an income approach and a market approach, using assumptions consistent with a market participant’s perspective. Under the income approach, we use anticipated cash flows over a period of years plus a terminal value and discount these amounts to their present value using appropriate discount rates. Under the market approach, we apply acquisition multiples to forecasted cash flows. The acquisition multiples used are consistent with historical asset transactions. The forecasted cash flows are based on average forecasted cash flows over a period of years.
Our impairment tests require the use of assumptions and estimates, such as industry economic factors and the profitability of future business strategies. If actual results are not consistent with our assumptions and estimates or our assumptions and estimates change due to new information, we may be exposed to future impairment charges.
See Note 1 of the Notes to Financial Statements in this Annual Report for further discussion of goodwill.
Pension and Other Postemployment Benefits - We have defined benefit retirement plans covering eligible retirees and full-time employees. We also sponsor welfare plans that provide other postemployment medical and life insurance benefits to eligible retirees and employees who retire with at least five years of service.
To calculate the expense and liabilities related to our plans, we utilize an outside actuarial consultant, which uses statistical and other factors to anticipate future events. These factors include assumptions about the discount rate, expected return on plan assets, rate of future compensation increases, age and employment periods. We use tables issued by the Society of Actuaries to estimate mortality rates. In determining the projected benefit costs, assumptions can change from period to period and may result in material changes in the costs we recognize.
In October 2015, we announced to certain pre-65 participants in our postemployment medical plans a change from a self-insured postemployment medical plan to a plan providing participants an annual benefit that would allow them to select coverage on a healthcare exchange beginning January 1, 2017. As a result, we remeasured the respective plan assets and liabilities, which resulted in a reduction in benefit obligations of our postemployment benefit plan of $11.9 million.
In September 2016, due to uncertain market conditions with health insurance exchange providers, we elected not to move the eligible pre-65 participants in our postemployment medical plans to a healthcare exchange. As a result, we remeasured the respective plan assets and benefit obligations, effective September 30, 2016. In the fourth quarter of 2016, we amended our other postemployment medical plan to allow certain participants access to reimbursable retirement accounts. The net impact of these plan amendments in 2016 was a $483 thousand increase in our other postemployment benefit plan obligation.
In addition, in the fourth quarter of 2016, we settled a portion of our pension benefit obligation and paid lump sum benefits to certain terminated vested participants.
39
During 2016, we recorded net periodic benefit costs of $32.0 million and $2.6 million related to our pension plans and other postemployment benefit plans, respectively, prior to regulatory deferrals. We estimate that in 2017, we will record $30.2 million and $1.7 million related to pension plans and other postemployment benefit plans, respectively, prior to regulatory deferrals.
The following table sets forth the significant assumptions used to determine our estimated 2017 net periodic benefit cost related to our defined pension and other postemployment benefit plans, and sensitivity to changes with respect to these assumptions:
Rate Used | Cost Sensitivity (a) | Obligation Sensitivity (b) | ||||||||
(Millions of dollars) | ||||||||||
Discount rate for pension | 4.30% | $ | 3.1 | $ | 30.7 | |||||
Discount rate for other postemployment benefits | 4.20% | $ | 0.6 | $ | 6.3 | |||||
Expected long-term return on plan assets (c) | 7.75%/7.60% | $ | 2.3 | $ | — | |||||
(a) Approximate impact a quarter percentage point decrease in the assumed rate would have on net periodic pension costs.
(b) Approximate impact a quarter percentage point decrease in the assumed rate would have on defined benefit pension obligation.
(c) Expected long-term return on plan assets for pension and other postemployment benefits are 7.75 percent and 7.60 percent, respectively.
Assumed health care cost-trend rates have a significant effect on the amounts reported for our other postemployment benefit plans. A one percentage point change in assumed health care cost trend rates would have the following effects:
One Percentage Point Increase | One Percentage Point Decrease | |||||||
(Millions of dollars) | ||||||||
Effect on total of service and interest cost | $ | 0.9 | $ | (0.9 | ) | |||
Effect on other postemployment benefit obligation | $ | 4.0 | $ | (3.9 | ) | |||
During 2016, we contributed approximately $12.4 million to our defined benefit pension plan and $13.2 million to our other postemployment benefit plans. In 2017, we expect to contribute approximately $1.0 million to our defined benefit pension plan and $3.1 million to our other postemployment benefit plans.
Revenue Recognition - For regulated deliveries of natural gas, we read meters and bill customers on a monthly cycle. We recognize revenues upon the delivery of natural gas commodity or services rendered to customers. Revenues are accrued for natural gas delivered and services rendered to customers, but not yet billed, based on estimates from the last meter-reading date to month end (accrued unbilled revenue). The billing cycles for customers do not necessarily coincide with the accounting periods used for financial reporting purposes. We accrue unbilled revenues for natural gas that has been delivered but not yet billed at the end of an accounting period. Accrued unbilled revenue is based on a percentage estimate of amounts unbilled each month, which is dependent upon a number of factors, some of which require management’s judgment. These factors include customer consumption patterns and the impact of weather on usage.
Contingencies - Our accounting for contingencies covers a variety of business activities, including contingencies for legal and environmental exposures. We accrue these contingencies when our assessments indicate that it is probable that a liability has been incurred or an asset will not be recovered and an amount can be reasonably estimated. We expense legal fees as incurred and base our legal liability estimates on currently available facts and our assessments of the ultimate outcome or resolution. Accruals for estimated losses from environmental remediation obligations generally are recognized no later than the completion of a remediation feasibility study. Recoveries of environmental remediation costs from other parties are recorded as assets when their receipt is deemed probable. In 2016, we recorded a reserve of $4.0 million for potential costs associated with further investigation and remediation at one of our manufactured natural gas sites. Our expenditures for environmental evaluation, mitigation, remediation and compliance to date have not been significant in relation to our financial position or results of operations, and our expenditures related to environmental matters had no material effect on earnings or cash flows for 2016, 2015 and 2014. Actual results may differ from our estimates resulting in an impact, positive or negative, on earnings.
See Note 13 of the Notes to Financial Statements in this Annual Report for additional discussion of contingencies.
40
CONTRACTUAL OBLIGATIONS
The following table sets forth our contractual obligations at December 31, 2016:
Contractual Obligations | ||||||||||||||||||||||||||||
(Millions of dollars) | ||||||||||||||||||||||||||||
2017 | 2018 | 2019 | 2020 | 2021 | Thereafter | Total | ||||||||||||||||||||||
Long-term debt, including current maturities | $ | — | $ | — | $ | 300.0 | $ | — | $ | — | $ | 901.3 | $ | 1,201.3 | ||||||||||||||
Interest payments on debt | 45.1 | 45.1 | 39.4 | 38.9 | 38.9 | 611.2 | 818.6 | |||||||||||||||||||||
Firm transportation and storage capacity contracts | 191.0 | 165.6 | 113.2 | 105.8 | 94.7 | 98.2 | 768.5 | |||||||||||||||||||||
Natural gas purchase commitments | 207.3 | 2.4 | 1.4 | 0.8 | 0.8 | 1.3 | 214.0 | |||||||||||||||||||||
Employee benefit plans | 4.1 | 3.1 | 13.1 | 38.4 | 38.7 | — | 97.4 | |||||||||||||||||||||
Operating leases | 5.6 | 5.2 | 4.4 | 3.6 | 3.2 | 4.4 | 26.4 | |||||||||||||||||||||
Total | $ | 453.1 | $ | 221.4 | $ | 471.5 | $ | 187.5 | $ | 176.3 | $ | 1,616.4 | $ | 3,126.2 | ||||||||||||||
Long-term debt and interest payments on debt - Long-term debt includes our three debt issuances at their due dates. Interest payments on debt are calculated by multiplying our long-term debt by the respective coupon rates.
Firm transportation and storage contracts - We are party to fixed-price contracts providing us with firm transportation and storage capacity. The commitments associated with these contracts are recoverable through our purchased-gas cost mechanisms as allowed by the applicable regulatory authority.
Natural gas purchase commitments - We are party to fixed-price and variable-price contracts for the purchase of natural gas. Future variable-price natural gas purchase commitments are estimated based on market price information. Actual future variable-price purchase commitments may vary depending on market prices at the time of delivery. As market information changes daily and is potentially volatile, these values may change significantly. The commitments associated with these contracts are recoverable through our purchased-gas cost mechanisms as allowed by the applicable regulatory authority.
Employee benefit plans - Employee benefit plans include our anticipated contribution to maintain the minimum required funding level for our pension and other postemployment benefit plans. See Note 11 of the Notes to Financial Statements in this Annual Report for discussion of employee benefit plans.
Operating leases - Our operating leases include leases for office space, facilities and information technology hardware and software.
FORWARD-LOOKING STATEMENTS
Some of the statements contained and incorporated in this Annual Report are forward-looking statements within the meaning of Section 27A of the Securities Act and Section 21E of the Exchange Act. The forward-looking statements relate to our anticipated financial performance, liquidity, management’s plans and objectives for our future operations, our business prospects, the outcome of regulatory and legal proceedings, market conditions and other matters. We make these forward-looking statements in reliance on the safe harbor protections provided under the Private Securities Litigation Reform Act of 1995. The following discussion is intended to identify important factors that could cause future outcomes to differ materially from those set forth in the forward-looking statements.
Forward-looking statements include the items identified in the preceding paragraph, the information concerning possible or assumed future results of our operations and other statements contained or incorporated in this Annual Report identified by words such as “anticipate,” “estimate,” “expect,” “project,” “intend,” “plan,” “believe,” “should,” “goal,” “forecast,” “guidance,” “could,” “may,” “continue,” “might,” “potential,” “scheduled,” and other words and terms of similar meaning. One should not place undue reliance on forward-looking statements, which are applicable only as of the date of this Annual Report. Known and unknown risks, uncertainties and other factors may cause our actual results, performance or achievements to be materially different from any future results, performance or achievements expressed or implied by forward-looking statements. Those factors may affect our operations, markets, products, services and prices. In addition to any assumptions and other factors referred to specifically in connection with the forward-looking statements, factors that could cause our actual results to differ materially from those contemplated in any forward-looking statement include, among others, the following:
• | our ability to recover operating costs and amounts equivalent to income taxes, costs of property, plant and equipment and regulatory assets in our regulated rates; |
41
• | our ability to manage our operations and maintenance costs; |
• | changes in regulation of natural gas distribution services, particularly those in Oklahoma, Kansas and Texas; |
• | the economic climate and, particularly, its effect on the natural gas requirements of our residential and |
commercial industrial customers;
• | competition from alternative forms of energy, including, but not limited to, electricity, solar power, wind power, geothermal energy and biofuels; |
• | conservation efforts of our customers; |
• | variations in weather, including seasonal effects on demand, the occurrence of storms and disasters, and climate change; |
• | indebtedness could make us more vulnerable to general adverse economic and industry conditions, limit our ability to borrow additional funds and/or place us at competitive disadvantage compared with competitors; |
• | our ability to secure reliable, competitively priced and flexible natural gas transportation and supply, including decisions by natural gas producers to reduce production or shut-in producing natural gas wells and expiration of existing supply, and transportation and storage arrangements that are not replaced with contracts with similar terms and pricing; |
• | the mechanical integrity of facilities operated; |
• | operational hazards and unforeseen operational interruptions; |
• | adverse labor relations; |
• | the effectiveness of our strategies to reduce earnings lag, margin protection strategies and risk mitigation strategies; |
• | our ability to generate sufficient cash flows to meet all our cash needs; |
• | changes in the financial markets during the periods covered by the forward-looking statements, particularly those affecting the availability of capital and our ability to refinance existing debt and fund investments and acquisitions; |
• | actions of rating agencies, including the ratings of debt, general corporate ratings and changes in the rating agencies’ ratings criteria; |
• | changes in inflation and interest rates; |
• | our ability to recover the costs of natural gas purchased for our customers; |
• | impact of potential impairment charges; |
• | volatility and changes in markets for natural gas; |
• | possible loss of LDC franchises or other adverse effects caused by the actions of municipalities; |
• | payment and performance by counterparties and customers as contracted and when due; |
• | changes in existing or the addition of new environmental, safety, tax and other laws to which we and our subsidiaries are subject; |
• | the uncertainty of estimates, including accruals and costs of environmental remediation; |
• | advances in technology; |
• | population growth rates and changes in the demographic patterns of the markets we serve; |
• | acts of nature and the potential effects of threatened or actual terrorism, including cyber attacks or breaches of technology systems and war; |
• | the sufficiency of insurance coverage to cover losses; |
• | the effects of our strategies to reduce tax payments; |
• | the effects of litigation and regulatory investigations, proceedings, including our rate cases, or inquiries; |
• | changes in accounting standards; |
• | changes in corporate governance standards; |
• | discovery of material weaknesses in our internal controls; |
• | our ability to attract and retain talented employees, management and directors; |
• | declines in the discount rates on, declines in the market value of the debt and equity securities of, and increases in funding requirements for, our defined benefit plans; |
• | the ability to successfully complete merger, acquisition or divestiture plans, regulatory or other limitations imposed as a result of a merger, acquisition or divestiture, and the success of the business following a merger, acquisition or divestiture; |
• | the final resolutions or outcomes with respect to our contingent and other corporate liabilities related to the natural gas distribution business and any related actions for indemnification made pursuant to the Separation and Distribution Agreement with ONEOK; and |
• | the costs associated with increased regulation and enhanced disclosure and corporate governance requirements pursuant to the Dodd-Frank Wall Street Reform and Consumer Protection Act of 2010. |
These factors are not necessarily all of the important factors that could cause actual results to differ materially from those expressed in any of our forward-looking statements. Other factors could also have material adverse effects on our future results. These and other risks are described in greater detail in Item 1A, Risk Factors, in this Annual Report. All forward-looking statements attributable to us or persons acting on our behalf are expressly qualified in their entirety by these factors.
42
Other than as required under securities laws, we undertake no obligation to update publicly any forward-looking statement whether as a result of new information, subsequent events or change in circumstances, expectations or otherwise.
ITEM 7A. QUANTITATIVE AND QUALITATIVE DISCLOSURES ABOUT MARKET RISK
Our exposure to market risk discussed below includes forward-looking statements. Our views on market risk are not necessarily indicative of actual results that may occur and do not represent the maximum possible gains and losses that may occur since actual gains and losses will differ from those estimated based on actual fluctuations in commodity prices or interest rates and the timing of transactions.
Commodity Price Risk
Our commodity price risk, driven primarily by fluctuations in the price of natural gas, is mitigated by our purchased-gas cost adjustment mechanisms. We use derivative instruments to economically hedge the cost of anticipated natural gas purchases during the winter heating months to protect our customers from upward market price volatility of natural gas. Additionally, we inject natural gas into storage during the summer months and withdraw the natural gas during the winter heating season. Gains or losses associated with these derivative instruments and storage activities are included in, and recoverable through our purchased-gas cost adjustment mechanisms, which are subject to review by regulatory authorities.
Interest-Rate Risk
We are exposed to interest-rate risk primarily associated with new debt financing needed to fund capital requirements, including future contractual obligations and maturities of long-term and short-term debt. We expect to manage interest-rate risk on future borrowings through the use of fixed-rate debt, floating-rate debt and, at times, interest-rate swaps. Fixed-rate swaps may be used to reduce our risk of increased interest costs during periods of rising interest rates. Floating-rate swaps may be used to convert the fixed rates of long-term borrowings into short-term variable rates.
Counterparty Credit Risk
We assess the creditworthiness of our customers. Those customers who do not meet minimum standards are required to provide security, including deposits and other forms of collateral, when appropriate. With more than 2 million customers across three states, we are not exposed materially to a concentration of credit risk. We maintain a provision for doubtful accounts based upon factors surrounding the credit risk of customers, historical trends, consideration of the current credit environment and other information. In Oklahoma, Kansas and most jurisdictions we serve in Texas, we are able to recover natural gas costs related to uncollectible accounts through our purchased-gas cost adjustment mechanisms.
43
This page intentionally left blank.
44
ITEM 8. FINANCIAL STATEMENTS AND SUPPLEMENTARY DATA
Report of Independent Registered Public Accounting Firm
To the Board of Directors and Shareholders of ONE Gas, Inc.:
In our opinion, the accompanying balance sheets and the related statements of income, comprehensive income, equity and cash flows present fairly, in all material respects, the financial position of ONE Gas, Inc. (the Company) at December 31, 2016 and 2015, and the results of its operations and its cash flows for each of the three years in the period ended December 31, 2016 in conformity with accounting principles generally accepted in the United States of America. Also in our opinion, the Company maintained, in all material respects, effective internal control over financial reporting as of December 31, 2016, based on criteria established in Internal Control - Integrated Framework (2013) issued by the Committee of Sponsoring Organizations of the Treadway Commission (COSO). The Company’s management is responsible for these financial statements, for maintaining effective internal control over financial reporting and for its assessment of the effectiveness of internal control over financial reporting, included in Management’s Report on Internal Control Over Financial Reporting appearing under Item 9A. Our responsibility is to express opinions on these financial statements and on the Company’s internal control over financial reporting based on our audits. We conducted our audits in accordance with the standards of the Public Company Accounting Oversight Board (United States). Those standards require that we plan and perform the audits to obtain reasonable assurance about whether the financial statements are free of material misstatement and whether effective internal control over financial reporting was maintained in all material respects. Our audits of the financial statements included examining, on a test basis, evidence supporting the amounts and disclosures in the financial statements, assessing the accounting principles used and significant estimates made by management, and evaluating the overall financial statement presentation. Our audit of internal control over financial reporting included obtaining an understanding of internal control over financial reporting, assessing the risk that a material weakness exists, and testing and evaluating the design and operating effectiveness of internal control based on the assessed risk. Our audits also included performing such other procedures as we considered necessary in the circumstances. We believe that our audits provide a reasonable basis for our opinions.
A company’s internal control over financial reporting is a process designed to provide reasonable assurance regarding the reliability of financial reporting and the preparation of financial statements for external purposes in accordance with generally accepted accounting principles. A company’s internal control over financial reporting includes those policies and procedures that (i) pertain to the maintenance of records that, in reasonable detail, accurately and fairly reflect the transactions and dispositions of the assets of the company; (ii) provide reasonable assurance that transactions are recorded as necessary to permit preparation of financial statements in accordance with generally accepted accounting principles, and that receipts and expenditures of the company are being made only in accordance with authorizations of management and directors of the company; and (iii) provide reasonable assurance regarding prevention or timely detection of unauthorized acquisition, use, or disposition of the company’s assets that could have a material effect on the financial statements.
Because of its inherent limitations, internal control over financial reporting may not prevent or detect misstatements. Also, projections of any evaluation of effectiveness to future periods are subject to the risk that controls may become inadequate because of changes in conditions, or that the degree of compliance with the policies or procedures may deteriorate.
/s/ PricewaterhouseCoopers LLP
Tulsa, Oklahoma
February 23, 2017
45
ONE Gas, Inc. | ||||||||||||
STATEMENTS OF INCOME | ||||||||||||
Years Ended December 31, | ||||||||||||
2016 | 2015 | 2014 | ||||||||||
(Thousands of dollars, except per share amounts) | ||||||||||||
Revenues | $ | 1,427,232 | $ | 1,547,692 | $ | 1,818,906 | ||||||
Cost of natural gas | 541,797 | 705,959 | 991,949 | |||||||||
Net margin | 885,435 | 841,733 | 826,957 | |||||||||
Operating expenses | ||||||||||||
Operations and maintenance | 417,142 | 414,476 | 420,686 | |||||||||
Depreciation and amortization | 143,829 | 133,023 | 125,722 | |||||||||
General taxes | 55,344 | 55,105 | 55,255 | |||||||||
Total operating expenses | 616,315 | 602,604 | 601,663 | |||||||||
Operating income | 269,120 | 239,129 | 225,294 | |||||||||
Other income | 1,447 | 263 | 1,625 | |||||||||
Other expense | (1,490 | ) | (2,813 | ) | (2,949 | ) | ||||||
Interest expense, net | (43,739 | ) | (44,570 | ) | (45,842 | ) | ||||||
Income before income taxes | 225,338 | 192,009 | 178,128 | |||||||||
Income taxes | (85,243 | ) | (72,979 | ) | (68,338 | ) | ||||||
Net income | $ | 140,095 | $ | 119,030 | $ | 109,790 | ||||||
Earnings per share | ||||||||||||
Basic | $ | 2.67 | $ | 2.26 | $ | 2.10 | ||||||
Diluted | $ | 2.65 | $ | 2.24 | $ | 2.07 | ||||||
Average shares (thousands) | ||||||||||||
Basic | 52,453 | 52,578 | 52,364 | |||||||||
Diluted | 52,963 | 53,254 | 52,946 | |||||||||
Dividends declared per share of stock | $ | 1.40 | $ | 1.20 | $ | 0.84 | ||||||
See accompanying Notes to Financial Statements.
46
ONE Gas, Inc. | ||||||||||||
STATEMENTS OF COMPREHENSIVE INCOME | ||||||||||||
Years Ended December 31, | ||||||||||||
2016 | 2015 | 2014 | ||||||||||
(Thousands of dollars) | ||||||||||||
Net income | $ | 140,095 | $ | 119,030 | $ | 109,790 | ||||||
Other comprehensive income (loss), net of tax | ||||||||||||
Change in pension and other postemployment benefit plans liability, net of tax of $197, $(483), and $1,244, respectively | (314 | ) | 773 | (1,781 | ) | |||||||
Total other comprehensive income (loss), net of tax | (314 | ) | 773 | (1,781 | ) | |||||||
Comprehensive income | $ | 139,781 | $ | 119,803 | $ | 108,009 | ||||||
See accompanying Notes to Financial Statements.
47
ONE Gas, Inc. | ||||||||
BALANCE SHEETS | ||||||||
December 31, | December 31, | |||||||
2016 | 2015 | |||||||
Assets | (Thousands of dollars) | |||||||
Property, plant and equipment | ||||||||
Property, plant and equipment | $ | 5,404,168 | $ | 5,132,682 | ||||
Accumulated depreciation and amortization | 1,672,548 | 1,620,771 | ||||||
Net property, plant and equipment | 3,731,620 | 3,511,911 | ||||||
Current assets | ||||||||
Cash and cash equivalents | 14,663 | 2,433 | ||||||
Accounts receivable, net | 290,944 | 216,343 | ||||||
Materials and supplies | 34,084 | 33,325 | ||||||
Income tax receivable | 1,397 | 38,877 | ||||||
Natural gas in storage | 125,432 | 142,153 | ||||||
Regulatory assets | 83,146 | 32,925 | ||||||
Other current assets | 19,257 | 16,789 | ||||||
Total current assets | 568,923 | 482,845 | ||||||
Goodwill and other assets | ||||||||
Regulatory assets | 440,522 | 435,863 | ||||||
Goodwill | 157,953 | 157,953 | ||||||
Other assets | 43,773 | 46,193 | ||||||
Total goodwill and other assets | 642,248 | 640,009 | ||||||
Total assets | $ | 4,942,791 | $ | 4,634,765 | ||||
See accompanying Notes to Financial Statements.
48
ONE Gas, Inc. | ||||||||
BALANCE SHEETS | ||||||||
(Continued) | ||||||||
December 31, | December 31, | |||||||
2016 | 2015 | |||||||
Equity and Liabilities | (Thousands of dollars) | |||||||
Equity and long-term debt | ||||||||
Common stock, $0.01 par value: authorized 250,000,000 shares; issued 52,598,005 shares and outstanding 52,283,260 shares at December 31, 2016; issued 52,598,005 shares and outstanding 52,259,224 shares at December 31, 2015 | $ | 526 | $ | 526 | ||||
Paid-in capital | 1,749,574 | 1,764,875 | ||||||
Retained earnings | 161,021 | 95,046 | ||||||
Accumulated other comprehensive income (loss) | (4,715 | ) | (4,401 | ) | ||||
Treasury stock, at cost: 314,745 shares at December 31, 2016 and 338,781 shares at December 31, 2015 | (18,126 | ) | (14,491 | ) | ||||
Total equity | 1,888,280 | 1,841,555 | ||||||
Long-term debt, excluding current maturities, and net of issuance costs of $8,851 and $9,645, respectively | 1,192,446 | 1,191,660 | ||||||
Total equity and long-term debt | 3,080,726 | 3,033,215 | ||||||
Current liabilities | ||||||||
Current maturities of long-term debt | 7 | 7 | ||||||
Notes payable | 145,000 | 12,500 | ||||||
Accounts payable | 131,988 | 107,482 | ||||||
Accrued interest | 18,854 | 18,873 | ||||||
Accrued taxes other than income | 42,571 | 37,249 | ||||||
Accrued liabilities | 22,931 | 31,470 | ||||||
Customer deposits | 61,209 | 60,325 | ||||||
Regulatory liabilities | 11,922 | 24,615 | ||||||
Other current liabilities | 9,451 | 11,700 | ||||||
Total current liabilities | 443,933 | 304,221 | ||||||
Deferred credits and other liabilities | ||||||||
Deferred income taxes | 1,038,568 | 951,785 | ||||||
Employee benefit obligations | 303,507 | 272,309 | ||||||
Other deferred credits | 76,057 | 73,235 | ||||||
Total deferred credits and other liabilities | 1,418,132 | 1,297,329 | ||||||
Commitments and contingencies | ||||||||
Total liabilities and equity | $ | 4,942,791 | $ | 4,634,765 | ||||
See accompanying Notes to Financial Statements.
49
This page intentionally left blank.
50
ONE Gas, Inc. | ||||||||||||
STATEMENTS OF CASH FLOWS | ||||||||||||
Years Ended December 31, | ||||||||||||
2016 | 2015 | 2014 | ||||||||||
(Thousands of dollars) | ||||||||||||
Operating activities | ||||||||||||
Net income | $ | 140,095 | $ | 119,030 | $ | 109,790 | ||||||
Adjustments to reconcile net income to net cash provided by operating activities: | ||||||||||||
Depreciation and amortization | 143,829 | 133,023 | 125,722 | |||||||||
Deferred income taxes | 86,788 | 63,789 | 49,935 | |||||||||
Share-based compensation expense | 11,219 | 9,187 | 7,613 | |||||||||
Provision for doubtful accounts | 5,427 | 4,520 | 7,195 | |||||||||
Changes in assets and liabilities: | ||||||||||||
Accounts receivable | (80,028 | ) | 105,886 | 23,044 | ||||||||
Materials and supplies | (759 | ) | (5,814 | ) | 10,868 | |||||||
Income tax receivable | 37,480 | 4,923 | (43,800 | ) | ||||||||
Natural gas in storage | 16,721 | 43,147 | (19,172 | ) | ||||||||
Asset removal costs | (53,430 | ) | (51,608 | ) | (47,125 | ) | ||||||
Accounts payable | 27,596 | (59,635 | ) | (6,881 | ) | |||||||
Accrued interest | (19 | ) | 1 | 18,743 | ||||||||
Accrued taxes other than income | 5,322 | (7,493 | ) | 12,316 | ||||||||
Accrued liabilities | (8,539 | ) | 5,451 | 21,228 | ||||||||
Customer deposits | 884 | 322 | 2,643 | |||||||||
Regulatory assets and liabilities | (49,472 | ) | 50,658 | 30,067 | ||||||||
Employee benefit obligation | (25,666 | ) | (15,033 | ) | (10,102 | ) | ||||||
Other assets and liabilities | 24,119 | (6,147 | ) | (45,421 | ) | |||||||
Cash provided by operating activities | 281,567 | 394,207 | 246,663 | |||||||||
Investing activities | ||||||||||||
Capital expenditures | (309,071 | ) | (294,320 | ) | (297,103 | ) | ||||||
Other | 492 | — | — | |||||||||
Cash used in investing activities | (308,579 | ) | (294,320 | ) | (297,103 | ) | ||||||
Financing activities | ||||||||||||
Borrowings (repayment) on notes payable, net | 132,500 | (29,500 | ) | 42,000 | ||||||||
Repurchase of common stock | (24,066 | ) | (24,122 | ) | — | |||||||
Issuance of debt, net of discounts | — | — | 1,199,994 | |||||||||
Long-term debt financing costs | — | — | (11,087 | ) | ||||||||
Cash payment to ONEOK upon separation | — | — | (1,130,000 | ) | ||||||||
Issuance of common stock | 4,017 | 7,051 | 2,001 | |||||||||
Dividends paid | (73,209 | ) | (62,826 | ) | (43,696 | ) | ||||||
Cash provided by (used in) financing activities | 39,242 | (109,397 | ) | 59,212 | ||||||||
Change in cash and cash equivalents | 12,230 | (9,510 | ) | 8,772 | ||||||||
Cash and cash equivalents at beginning of period | 2,433 | 11,943 | 3,171 | |||||||||
Cash and cash equivalents at end of period | $ | 14,663 | $ | 2,433 | $ | 11,943 | ||||||
Supplemental cash flow information: | ||||||||||||
Cash paid for interest, net of amounts capitalized | $ | 42,129 | $ | 42,980 | $ | 21,066 | ||||||
Cash (received) paid for income taxes, net | $ | (35,702 | ) | $ | (5,423 | ) | $ | 44,603 | ||||
See accompanying Notes to Financial Statements.
51
ONE Gas, Inc. | |||||||||||
STATEMENTS OF EQUITY | |||||||||||
Common Stock Issued | Common Stock | Paid-in Capital | Retained Earnings | ||||||||
(Shares) | (Thousands of dollars) | ||||||||||
January 1, 2014 | 100 | $ | — | $ | — | $ | — | ||||
Net income | — | — | — | 84,214 | |||||||
Other comprehensive loss | — | — | — | — | |||||||
Net transfers from ONEOK | — | — | — | — | |||||||
Reclassification of Owner’s net investment to paid-in capital | — | — | 1,749,078 | — | |||||||
Issuance of common stock at the separation | 51,941,136 | 520 | (520 | ) | — | ||||||
Common stock issued | 142,623 | 1 | 9,614 | — | |||||||
Common stock dividends - $0.84 per share | — | — | 624 | (44,320 | ) | ||||||
December 31, 2014 | 52,083,859 | 521 | 1,758,796 | 39,894 | |||||||
Net income | — | — | — | 119,030 | |||||||
Other comprehensive loss | — | — | — | — | |||||||
Repurchase of common stock | — | — | — | — | |||||||
Common stock issued | 514,146 | 5 | 5,027 | — | |||||||
Common stock dividends - $1.20 per share | — | — | 1,052 | (63,878 | ) | ||||||
December 31, 2015 | 52,598,005 | 526 | 1,764,875 | 95,046 | |||||||
Net income | — | — | — | 140,095 | |||||||
Other comprehensive income | — | — | — | — | |||||||
Repurchase of common stock | — | — | — | — | |||||||
Common stock issued and other | — | — | (16,212 | ) | — | ||||||
Common stock dividends - $1.40 per share | — | — | 911 | (74,120 | ) | ||||||
December 31, 2016 | 52,598,005 | $ | 526 | $ | 1,749,574 | $ | 161,021 | ||||
See accompanying Notes to Financial Statements.
52
ONE Gas, Inc. | ||||||||||||
STATEMENTS OF EQUITY | ||||||||||||
(Continued) | ||||||||||||
Treasury Stock | Owner’s Net Investment | Accumulated Other Comprehensive Income (Loss) | Total Equity | |||||||||
(Thousands of dollars) | ||||||||||||
January 1, 2014 | $ | — | $ | 1,239,023 | $ | — | $ | 1,239,023 | ||||
Net income | — | 25,576 | — | 109,790 | ||||||||
Other comprehensive loss | — | — | (1,781 | ) | (1,781 | ) | ||||||
Net transfers from ONEOK | — | 484,479 | (3,393 | ) | 481,086 | |||||||
Reclassification of Owner’s net investment to paid-in capital | — | (1,749,078 | ) | — | — | |||||||
Issuance of common stock at the separation | — | — | — | — | ||||||||
Common stock issued | — | — | — | 9,615 | ||||||||
Common stock dividends - $0.84 per share | — | — | — | (43,696 | ) | |||||||
December 31, 2014 | — | — | (5,174 | ) | 1,794,037 | |||||||
Net income | — | — | — | 119,030 | ||||||||
Other comprehensive loss | — | — | 773 | 773 | ||||||||
Repurchase of common stock | (24,122 | ) | — | — | (24,122 | ) | ||||||
Common stock issued | 9,631 | — | — | 14,663 | ||||||||
Common stock dividends - $1.20 per share | — | — | — | (62,826 | ) | |||||||
December 31, 2015 | (14,491 | ) | — | (4,401 | ) | 1,841,555 | ||||||
Net income | — | — | — | 140,095 | ||||||||
Other comprehensive income | — | — | (314 | ) | (314 | ) | ||||||
Repurchase of common stock | (24,066 | ) | — | — | (24,066 | ) | ||||||
Common stock issued and other | 20,431 | — | — | 4,219 | ||||||||
Common stock dividends - $1.40 per share | — | — | — | (73,209 | ) | |||||||
December 31, 2016 | $ | (18,126 | ) | $ | — | $ | (4,715 | ) | $ | 1,888,280 | ||
See accompanying Notes to Financial Statements.
53
ONE Gas, Inc.
NOTES TO FINANCIAL STATEMENTS
1. | SUMMARY OF SIGNIFICANT ACCOUNTING POLICIES |
Organization and Nature of Operations - Prior to January 31, 2014, ONE Gas was a wholly owned subsidiary of ONEOK and comprised its former natural gas distribution business. On January 31, 2014, ONEOK distributed one share of our common stock for every four shares of ONEOK common stock held by ONEOK shareholders of record as of the close of business on January 21, 2014, the record date of the distribution. At the close of business on January 31, 2014, we became an independent, publicly traded company as a result of the distribution. Our common stock began trading “regular-way” under the ticker symbol “OGS” on the NYSE on February 3, 2014.
We provide natural gas distribution services to more than 2 million customers through our divisions in Oklahoma, Kansas and Texas through Oklahoma Natural Gas, Kansas Gas Service and Texas Gas Service, respectively. We serve residential, commercial, industrial and transportation customers in all three states. In addition, we also provide natural gas distribution services to wholesale and public authority customers.
Basis of Presentation - Prior to our separation from ONEOK, our financial statements were derived from ONEOK’s financial statements, which included its natural gas distribution business as if we, for accounting purposes, had been a separate company for all periods presented. The assets and liabilities in the financial statements have been reflected on a historical basis. The financial statements for the period prior to the separation also includes expense allocations for certain corporate functions historically performed by ONEOK, including allocations of general corporate expenses related to executive oversight, accounting, treasury, tax, legal, information technology and other services. We believe our assumptions underlying the financial statements, including the assumptions regarding the allocation of general corporate expenses from ONEOK, are reasonable. However, the financial statements may not include all of the actual expenses that would have been incurred by us and may not reflect our results of operations, financial position and cash flows had we been a separate publicly traded company during the period presented prior to the separation.
All financial information presented after the separation represents the results of operations, financial position and cash flows of ONE Gas. Accordingly:
• | Our Statements of Income and Comprehensive Income for the year ended December 31, 2014, consist of the results of ONE Gas for the eleven months ended December 31, 2014, and the results of ONE Gas Predecessor for the one month ended January 31, 2014. |
• | Our Statement of Cash Flows for the year ended December 31, 2014, consists of the results of ONE Gas for the eleven months ended December 31, 2014, and the results of ONE Gas Predecessor for the one month ended January 31, 2014. |
• | Our Statement of Equity for the year ended December 31, 2014, consists of both the activity for ONE Gas Predecessor prior to January 31, 2014, and the activity for ONE Gas completed in connection with, and subsequent to, the separation on January 31, 2014. |
The financial statements include the accounts of the natural gas distribution business as set forth in “Organization and Nature of Operations” above. All significant balances and transactions between our divisions have been eliminated.
Use of Estimates - The preparation of our financial statements and related disclosures in accordance with GAAP requires us to make estimates and assumptions with respect to values or conditions that cannot be known with certainty that affect the reported amount of assets and liabilities, and the disclosure of contingent assets and liabilities at the date of the financial statements. These estimates and assumptions also affect the reported amounts of revenue and expenses during the reporting period. Items that may be estimated include, but are not limited to, the economic useful life of assets, fair value of assets and liabilities, provisions for doubtful accounts receivable, unbilled revenues for natural gas delivered but for which meters have not been read, natural gas purchased but for which no invoice has been received, provision for income taxes, including any deferred tax valuation allowances, the results of litigation and various other recorded or disclosed amounts.
We evaluate these estimates on an ongoing basis using historical experience and other methods we consider reasonable based on the particular circumstances. Nevertheless, actual results may differ significantly from the estimates. Any effects on our financial position or results of operations from revisions to these estimates are recorded in the period when the facts that give rise to the revision become known.
Fair Value Measurements - We define fair value as the price that would be received from the sale of an asset or the transfer of a liability in an orderly transaction between market participants at the measurement date. We use the market and income
54
approaches to determine the fair value of our assets and liabilities and consider the markets in which the transactions are executed. We measure the fair value of a group of financial assets and liabilities consistent with how a market participant would price the net risk exposure at the measurement date.
Fair Value Hierarchy - At each balance sheet date, we utilize a fair value hierarchy to classify fair value amounts recognized or disclosed in our financial statements based on the observability of inputs used to estimate such fair value. The levels of the hierarchy are described below:
• | Level 1 - Unadjusted quoted prices in active markets for identical assets or liabilities; |
• | Level 2 - Significant observable pricing inputs other than quoted prices included within Level 1 that are, either directly or indirectly, observable as of the reporting date. Essentially, this represents inputs that are derived principally from or corroborated by observable market data; and |
• | Level 3 - May include one or more unobservable inputs that are significant in establishing a fair value estimate. These unobservable inputs are developed based on the best information available and may include our own internal data. |
We recognize transfers into and out of the levels as of the end of each reporting period.
Determining the appropriate classification of our fair value measurements within the fair value hierarchy requires management’s judgment regarding the degree to which market data is observable or corroborated by observable market data. We categorize derivatives for which fair value is determined using multiple inputs within a single level, based on the lowest level input that is significant to the fair value measurement in its entirety. See Note 7 for additional information regarding our fair value measurements.
Cash and Cash Equivalents - Cash equivalents consist of highly liquid investments, which are readily convertible into cash and have original maturities of three months or less.
Revenue Recognition - For regulated deliveries of natural gas, we read meters and bill customers on a monthly cycle. We recognize revenues upon the delivery of the natural gas commodity or services rendered to customers. The billing cycles for customers do not necessarily coincide with the accounting periods used for financial reporting purposes. Revenues are accrued for natural gas delivered and services rendered to customers, but not yet billed. Accrued unbilled revenue is based on a percentage estimate of amounts unbilled each month, which is dependent upon a number of factors, some of which require management’s judgment. These factors include customer consumption patterns and the impact of weather on usage. The amounts of accrued unbilled natural gas sales revenues at December 31, 2016 and 2015, were $143.2 million and $109.6 million, respectively.
We collect and remit other taxes on behalf of governmental authorities, and we record these amounts in accrued taxes other than income in our Balance Sheets on a net basis.
Cost of Natural Gas - Net margin is comprised of total revenues less cost of natural gas. Cost of natural gas includes commodity purchases, fuel, storage, transportation and other gas purchase costs recovered through our cost of natural gas regulatory mechanisms and does not include an allocation of general operating costs or depreciation and amortization. In addition, our cost of natural gas regulatory mechanisms provide a method of recovering natural gas costs on an ongoing basis without a profit. Therefore, although our revenues will fluctuate with the cost of gas that we purchase, net margin is not affected by fluctuations in the cost of natural gas. See Note 8 regulatory assets and liabilities for additional discussion of purchased gas cost recoveries.
Accounts Receivable - Accounts receivable represent valid claims against nonaffiliated customers for natural gas sold or services rendered, net of allowances for doubtful accounts. We assess the creditworthiness of our customers. Those customers who do not meet minimum standards are required to provide security, including deposits and other forms of collateral, when appropriate. With more than 2 million customers across three states, we are not exposed materially to a concentration of credit risk. We maintain an allowance for doubtful accounts based upon factors surrounding the credit risk of customers, historical trends, consideration of the current credit environment and other information. In Oklahoma, Kansas and most jurisdictions we serve in Texas, we are able to recover natural gas costs related to doubtful accounts through purchased-gas cost adjustment mechanisms. At December 31, 2016 and 2015, our allowance for doubtful accounts was $4.2 million and $3.5 million, respectively.
Inventories - Natural gas in storage is maintained on the basis of weighted-average cost. Natural gas inventories that are injected into storage are recorded in inventory based on actual purchase costs, including storage and transportation costs.
55
Natural gas inventories that are withdrawn from storage are accounted for in our purchased-gas cost adjustment mechanisms at the weighted-average inventory cost.
Materials and supplies inventories are stated at the lower of weighted-average cost or net realizable value.
Derivatives and Risk Management Activities - We record all derivative instruments at fair value, with the exception of normal purchases and normal sales that are expected to result in physical delivery. The accounting for changes in the fair value of a derivative instrument depends on whether it has been designated and qualifies as part of a hedging relationship and, if so, the reason for holding it, or if regulatory rulings require a different accounting treatment.
If certain conditions are met, we may elect to designate a derivative instrument as a hedge of exposure to changes in fair values or cash flows.
The table below summarizes the various ways in which we account for our derivative instruments and the impact on our financial statements:
Recognition and Measurement | ||||
Accounting Treatment | Balance Sheet | Income Statement | ||
Normal purchases and normal sales | - | Fair value not recorded | - | Change in fair value not recognized in earnings |
Mark-to-market | - | Recorded at fair value | - | Change in fair value recognized in, and recoverable through, the purchased-gas cost adjustment mechanisms |
We have not elected to formally designate any of our derivative instruments as hedges. Gains or losses associated with the fair value of commodity derivative instruments entered into by us are included in, and recoverable through, the purchased-gas cost adjustment mechanisms.
See Note 7 for additional information regarding our fair value measurements and hedging activities using derivatives.
Property, Plant and Equipment - Our properties are stated at cost, which includes direct construction costs such as direct labor, materials, burden and AFUDC. Generally, the cost of our property retired or sold, plus removal costs, less salvage, is charged to accumulated depreciation. Gains and losses from sales or retirement of an entire operating unit or system of our properties are recognized in income. Maintenance and repairs are charged directly to expense.
AFUDC represents the cost of borrowed funds used to finance construction activities. We capitalize interest costs during the construction or upgrade of qualifying assets. Capitalized interest is recorded as a reduction to interest expense.
Our properties are depreciated using the straight-line method over their estimated useful lives. Generally, we apply composite depreciation rates to functional groups of property having similar economic circumstances. We periodically conduct depreciation studies to assess the economic lives of our assets. These depreciation studies are completed as a part of our regulatory proceedings, and the changes in economic lives, if applicable, are implemented prospectively when the new rates are effective. Changes in the estimated economic lives of our property, plant and equipment could have a material effect on our financial position, results of operations or cash flows.
Property, plant and equipment on our Balance Sheets includes construction work in process for capital projects that have not yet been placed in service and therefore are not being depreciated. Assets are transferred out of construction work in process when they are substantially complete and ready for their intended use.
See Note 9 for additional information regarding our property, plant and equipment.
Impairment of Goodwill and Long-Lived Assets - We assess our goodwill for impairment at least annually as of July 1. Our goodwill impairment analysis performed in 2016, 2015 and 2014, utilized a qualitative assessment and did not result in any impairment indicators. Subsequent to July 1, 2016, no event has occurred indicating that it is more likely than not that our fair value is less than our carrying value of our net assets.
As part of our goodwill impairment test, we first assess qualitative factors (including macroeconomic conditions, industry and market considerations, cost factors and overall financial performance) to determine whether it is more likely than not that our fair value is less than our carrying amount. If further testing is necessary, we perform a two-step impairment test for goodwill.
56
In the first step, an initial assessment is made by comparing our fair value with our book value, including goodwill. If the fair value is less than the book value, an impairment is indicated, and we must perform a second test to measure the amount of the impairment. In the second test, we calculate the implied fair value of the goodwill by deducting the fair value of all tangible and intangible net assets from the fair value determined in step one of the assessment. If the carrying value of the goodwill exceeds the implied fair value of the goodwill, we will record an impairment charge.
To estimate our fair value, we use two generally accepted valuation approaches, an income approach and a market approach, using assumptions consistent with a market participant’s perspective. Under the income approach, we use anticipated cash flows over a period of years plus a terminal value and discount these amounts to their present value using appropriate discount rates. Under the market approach, we apply acquisition multiples to forecasted cash flows. The acquisition multiples used are consistent with historical market transactions. The forecasted cash flows are based on average forecasted cash flows over a period of years.
We assess our long-lived assets for impairment whenever events or changes in circumstances indicate that an asset’s carrying amount may not be recoverable. An impairment is indicated if the carrying amount of a long-lived asset exceeds the sum of the undiscounted future cash flows expected to result from the use and eventual disposition of the asset. If an impairment is indicated, we record an impairment loss equal to the difference between the carrying value and the fair value of the long-lived asset. We determined that there were no asset impairments in 2016, 2015 or 2014.
Regulation - We are subject to the rate regulation and accounting requirements of the OCC, KCC, RRC and various municipalities in Texas. We follow the accounting and reporting guidance for regulated operations. During the ratemaking process, regulatory authorities set the framework for what we can charge customers for our services and establish the manner that our costs are accounted for, including allowing us to defer recognition of certain costs and permitting recovery of the amounts through rates over time, as opposed to expensing such costs as incurred. Examples include weather normalization, unrecovered purchased-gas costs, pension and postemployment benefit costs and ad-valorem taxes. This allows us to stabilize rates over time rather than passing such costs on to the customer for immediate recovery. Actions by regulatory authorities could have an effect on the amount recovered from rate payers. Any difference in the amount recoverable and the amount deferred is recorded as income or expense at the time of the regulatory action. A write-off of regulatory assets and costs not recovered may be required if all or a portion of the regulated operations have rates that are no longer:
• | established by independent regulators; |
• | designed to recover the specific entity’s costs of providing regulated services; and |
• | set at levels that will recover our costs when considering the demand and competition for our services. |
See Note 8 for additional information regarding our regulatory assets and liabilities disclosures.
Pension and Other Postemployment Employee Benefits - We have defined benefit retirement plans covering eligible employees. We also sponsor welfare plans that provide other postemployment medical and life insurance benefits to eligible employees who retire with at least five years of service. To calculate the costs and liabilities related to our plans, we utilize an outside actuarial consultant, which uses statistical and other factors to anticipate future events. These factors include assumptions about the discount rate, expected return on plan assets, rate of future compensation increases, age and mortality and employment periods. In determining the projected benefit obligations and costs, assumptions can change from period to period and may result in material changes in the cost and liabilities we recognize.
Income Taxes - Deferred income taxes are recorded for the difference between the financial statement and income tax basis of assets and liabilities and carryforward items, based on income tax laws and rates existing at the time the temporary differences are expected to reverse. The effect on deferred taxes of a change in tax rates is deferred and amortized for operations regulated by the OCC, KCC, RRC and various municipalities in Texas, if, as a result of an action by a regulator, it is probable that the effect of the change in tax rates will be recovered from or returned to customers through future rates. We continue to amortize previously deferred investment tax credits for ratemaking purposes over the periods prescribed by our regulators.
A valuation allowance for deferred tax assets is recognized when it is more likely than not that some or all of the benefit from the deferred tax asset will not be realized. To assess that likelihood, we use estimates and judgment regarding our future taxable income, as well as the jurisdiction in which such taxable income is generated, to determine whether a valuation allowance is required. Such evidence can include our current financial position, our results of operations, both actual and forecasted, the reversal of deferred tax liabilities, as well as the current and forecasted business economics of our industry. We had no valuation allowance at December 31, 2016 and 2015.
57
We utilize a more-likely-than-not recognition threshold and measurement attribute for the financial statement recognition and measurement of a tax position that is taken or expected to be taken in a tax return. We reflect penalties and interest as part of income tax expense as they become applicable for tax provisions that do not meet the more-likely-than-not recognition threshold and measurement attribute. There were no material uncertain tax positions at December 31, 2016 and 2015. See Note 12 for additional information regarding income taxes.
Asset Retirement Obligations - Asset retirement obligations represent legal obligations associated with the retirement of long-lived assets that result from the acquisition, construction, development and/or normal use of the asset. Certain long-lived assets that comprise our natural gas distribution systems, primarily our pipeline assets, are subject to agreements or regulations that give rise to an asset retirement obligation for removal or other disposition costs associated with retiring the assets in place upon the discontinued use of the natural gas distribution system. We recognize the fair value of a liability for an asset retirement obligation in the period when it is incurred if a reasonable estimate of the fair value can be made. We are not able to estimate reasonably the fair value of the asset retirement obligations for portions of our assets because the settlement dates are indeterminable given our expected continued use of the assets with proper maintenance. We expect our natural gas distribution systems will continue in operation as long as natural gas supply and demand for natural gas distribution service exists. Based on the widespread use of natural gas for heating and cooking activities by residential and commercial customers in our service areas, management expects supply and demand to exist for the foreseeable future.
In accordance with long-standing regulatory treatment, we collect through rates the estimated costs of removal on certain regulated properties through depreciation expense, with a corresponding credit to accumulated depreciation and amortization. These removal costs collected through our rates include costs attributable to legal and nonlegal removal obligations; however, the amounts collected that are in excess of these nonlegal asset-removal costs incurred are accounted for as a regulatory liability for financial reporting purposes. Historically, with the exception of the regulatory authority in Kansas, the regulatory authorities that have jurisdiction over our regulated operations have not required us to quantify or disclose this amount; rather, these costs are addressed prospectively in depreciation rates and are set in each general rate order. We have made an estimate of our regulatory liability using current rates since the last general rate order in each of our jurisdictions if the removal costs collected have exceeded our removal cost incurred; however, for financial reporting purposes, significant uncertainty exists regarding the future disposition of this regulatory liability, pending, among other issues, clarification of regulatory intent. We continue to monitor the regulatory requirements, and the liability may be adjusted as more information is obtained. We record the estimated asset removal obligation in noncurrent liabilities in other deferred credits on our Balance Sheets. To the extent this estimated liability is adjusted, such amounts will be reclassified between accumulated depreciation and amortization and other deferred credits and therefore will not have an impact on earnings.
Contingencies - Our accounting for contingencies covers a variety of business activities, including contingencies for legal and environmental exposures. We accrue these contingencies when our assessments indicate that it is probable that a liability has been incurred or an asset will not be recovered and an amount can be estimated reasonably. We expense legal fees as incurred and base our legal liability estimates on currently available facts and our estimates of the ultimate outcome or resolution. Accruals for estimated losses from environmental remediation obligations generally are recognized no later than the completion of a remediation feasibility study. Recoveries of environmental remediation costs from other parties are recorded as assets when their receipt is deemed probable. Actual results may differ from our estimates resulting in an impact, positive or negative, on earnings. See Note 13 for additional information regarding contingencies.
Share-Based Payments - We expense the fair value of share-based payments net of estimated forfeitures. We estimate forfeiture rates based on historical forfeitures under our share-based payment plans.
Earnings per share - Basic EPS is based on net income and is calculated based upon the daily weighted-average number of common shares outstanding during the periods presented. Also, this calculation includes fully vested stock awards that have not yet been issued as common stock. Diluted EPS includes the above, plus unvested stock awards granted under our compensation plans, but only to the extent these instruments dilute earnings per share.
Segments - We operate in one reportable business segment: regulated public utilities that deliver natural gas to residential, commercial, industrial, wholesale, public authority and transportation customers. We define reportable business segments as components of an organization for which discrete financial information is available and operating results are evaluated on a regular basis by the chief operating decision maker (CODM) in order to assess performance and allocate resources. Our CODM is our Chief Executive Officer (CEO). Characteristics of our organization that were relied upon in making this determination include the similar nature of services we provide, the functional alignment of our organizational structure, and the reports that are regularly reviewed by the CODM for the purpose of assessing performance and allocating resources. Our management is functionally aligned and centralized, with performance evaluated based upon results of the entire distribution
58
business. Capital allocation decisions are driven by asset integrity management, operating efficiency, growth opportunities and government relocations, not geographic location or regulatory jurisdiction.
In 2016, 2015 and 2014, we had no single external customer from which we received 10 percent or more of our gross revenues.
Treasury Stock - We record treasury stock purchases at cost, which includes incremental direct transaction costs. Amounts are recorded as reductions in equity in our Balance Sheets. We record the reissuance of treasury stock at our weighted average cost of treasury shares recorded in equity in our Balance Sheets.
Recently Issued Accounting Standards Update - In January 2017, the FASB issued ASU 2017-04, “Intangibles - Goodwill and Other (Topic 350): Simplifying the Test for Goodwill Impairment,” which simplifies how an entity is required to test goodwill for impairment by eliminating Step 2 of the goodwill test, where the measurement of a goodwill impairment loss was determined by comparing the implied fair value of a reporting unit’s goodwill with the carrying amount of that goodwill. Upon adoption, a goodwill impairment will be the amount by which a reporting unit’s carrying value exceeds its fair value, not to exceed the carrying amount of goodwill. This new guidance is required for our interim and annual reports for periods beginning after December 15, 2019, and early adoption is permitted. We do not expect this guidance to have a material impact on our financial statements and will adjust our goodwill testing procedures accordingly upon adoption.
In March 2016, the FASB issued ASU 2016-09, “Improvements to Employee Share-Based Payment Accounting,” which includes various new aspects to simplify how share-based payments are accounted for and presented in the financial statements. The new standard modifies several aspects of the accounting and reporting for employee share-based payments and related tax accounting impacts, including the presentation in the statements of operations and cash flows. We will adopt this new guidance in the first quarter of 2017. Prospectively, we will record excess tax expenses or benefits in income tax expense. We will record a cumulative-effect increase of $11.0 million to retained earnings, with an offset to a deferred tax asset, as of the beginning of the reporting period in 2017 for excess tax benefits earned prior to January 1, 2017. We will continue our use of the estimation method to account for share unit awards forfeitures rather than actual forfeitures. We will adopt the classification of cash flows for changes in excess tax benefits prospectively in operating activities, and employer withholding shares for tax-withholding purposes for employees retrospectively in investing activities in our statement of cash flows.
In February 2016, the FASB issued ASU 2016-02, “Leases (Topic 842),” which prescribes recognizing lease assets and liabilities on the balance sheet and includes disclosure of key information about leasing arrangements. A modified retrospective transition approach is required for leases existing at the time of adoption. We are evaluating our population of leases, analyzing lease agreements, and holding meetings with cross-divisional teams to determine the potential impact of this accounting standard on our financial position or results of operations and the transition approach we will utilize. This new guidance is required for our interim and annual reports for periods beginning after December 15, 2018, and early adoption is permitted.
In October 2015, the FASB issued ASU 2015-17, “Balance Sheet Classification of Deferred Taxes,” to simplify reporting of deferred taxes. The new guidance requires all deferred tax assets and liabilities, along with any related valuation allowance, be classified as noncurrent on the balance sheet. This guidance is required to be adopted for our interim and annual reports for periods beginning after December 15, 2016, but early adoption is permitted. We have adopted this guidance early to simplify our financial reporting process, have applied it prospectively for the period beginning October 1, 2015, and it did not have a material impact on our financial statements. Prior periods were not retrospectively adjusted.
In August 2015, the FASB issued ASU 2015-15, “Interest-Imputation of Interest (Subtopic 835-30),” which specifically addresses the presentation and subsequent measurement of debt issuance costs associated with line of credit arrangements. We adopted this guidance in the first quarter 2016, and it did not have an impact on our financial position or results of operations.
In April 2015, the FASB issued ASU 2015-03, “Interest-Imputation of Interest,” which requires that debt issuance costs related to a recognized debt liability be presented in the balance sheet as a direct deduction from the carrying amount of that debt liability. We adopted this guidance in the first quarter of 2016, and have applied the changes retrospectively to all periods presented. We have presented such amounts as a direct deduction from the face amount of our long-term debt, rather than in other assets as a deferred charge in our Balance Sheets. Amortization of the debt issuance costs continues to be reported as interest expense in our Statements of Income.
In April 2015, the FASB issued ASU 2015-05, “Intangibles-Goodwill and Other-Internal-Use Software,” which helps entities evaluate the accounting for fees paid by a customer in a cloud computing arrangement. We adopted this guidance prospectively in the first quarter of 2016, and it did not have a material impact on our financial position or results of operations.
59
In May 2014, the FASB issued ASU 2014-09, “Revenue from Contracts with Customers,” which clarifies and converges the revenue recognition principles under GAAP and International Financial Reporting Standards. In July 2015, FASB delayed the effective date for one year. We have substantially completed evaluating all of our sources of revenue to determine the potential effect on our financial position, results of operations and cash flows. We continue to monitor accounting task forces and the FASB for additional implementation guidance related to: (1) the accounting for funds received from third parties to partially or fully reimburse the cost of construction of an asset; (2) the evaluation of collectability from customers if a utility has regulatory mechanisms to help assure recovery of uncollected accounts from ratepayers; and (3) the accounting for alternative revenue programs, such as performance-based ratemaking, that may impact the final conclusions of our evaluation. Until these items are resolved, we cannot determine the effect the new guidance will have on our financial position, results of operations, cash flows, business processes or the transition method we will utilize to adopt the new guidance. We are required to adopt this new guidance for our interim and annual reports beginning with the first quarter 2018.
2. | CREDIT FACILITY AND SHORT-TERM NOTES PAYABLE |
The ONE Gas Credit Agreement contains certain financial, operational and legal covenants. Among other things, these covenants include maintaining ONE Gas’ total debt-to-capital ratio of no more than 70 percent at the end of any calendar quarter. The ONE Gas Credit Agreement also contains customary affirmative and negative covenants, including covenants relating to liens, indebtedness of subsidiaries, investments, changes in the nature of business, fundamental changes, transactions with affiliates, burdensome agreements, and use of proceeds. In the event of a breach of certain covenants by ONE Gas, amounts outstanding under the ONE Gas Credit Agreement may become due and payable immediately. At December 31, 2016, our total debt-to-capital ratio was 41 percent and we were in compliance with all covenants under the ONE Gas Credit Agreement.
The ONE Gas Credit Agreement includes a $50 million sublimit for the issuance of standby letters of credit and also features an option to request an increase in the size of the facility to an aggregate of $1.2 billion from $700 million by either commitments from new lenders or increased commitments from existing lenders. Borrowings made under the facility are available for general corporate purposes. The ONE Gas Credit Agreement contains provisions for an applicable margin rate and an annual facility fee, both of which adjust with changes in our credit rating. Based on our current credit ratings, borrowings, if any, will accrue interest at LIBOR plus 79.5 basis points, and the annual facility fee is 8 basis points.
We have a commercial paper program under which we may issue unsecured commercial paper up to a maximum amount of $700 million to fund short-term borrowing needs. The maturities of the commercial paper notes may vary but may not exceed 270 days from the date of issue. The commercial paper notes are sold generally at par less a discount representing an interest factor.
The ONE Gas Credit Agreement is available to repay the commercial paper notes, if necessary. Amounts outstanding under the commercial paper program reduce the borrowing capacity under the ONE Gas Credit Agreement.
At December 31, 2016, we had $145.0 million of commercial paper and $1.5 million in letters of credit issued under the ONE Gas Credit Agreement, with no borrowings and $553.5 million of remaining credit available under the ONE Gas Credit Agreement. The weighted-average interest rate on our commercial paper was 0.95 percent and 0.70 percent at December 31, 2016 and 2015, respectively.
3. | LONG-TERM DEBT |
In January 2014, we issued senior notes, consisting of $300 million of 2.07 percent senior notes due 2019, $300 million of 3.61 percent senior notes due 2024 and $600 million of 4.658 percent senior notes due 2044. The indenture governing our Senior Notes includes an event of default upon the acceleration of other indebtedness of $100 million or more. Such events of default would entitle the trustee or the holders of 25 percent in the aggregate principal amount of the outstanding Senior Notes to declare those senior notes immediately due and payable in full.
We may redeem our Senior Notes at par, plus accrued and unpaid interest to the redemption date, starting one month, three months, and six months, respectively, before their maturity dates. Prior to these dates, we may redeem these Senior Notes, in whole or in part, at a redemption price equal to the principal amount, plus accrued and unpaid interest and a make-whole premium. The redemption price will never be less than 100 percent of the principal amount of the respective note plus accrued and unpaid interest to the redemption date. Our Senior Notes are senior unsecured obligations, ranking equally in right of payment with all of our existing and future unsecured senior indebtedness.
60
4. | EQUITY |
Preferred Stock - At December 31, 2016, we had 50 million, $0.01 par value, authorized shares of preferred stock available. We have not issued or established any classes or series of shares of preferred stock.
Common Stock - At December 31, 2016, we had approximately 197.7 million shares of authorized common stock available for issuance.
Treasury Shares - We purchase treasury shares to be used to offset shares issued under our employee and non-employee director equity compensation and employee stock purchase plans. Our Board of Directors established an annual limit of $20 million of treasury stock purchases, exclusive of funds received through the dividend reinvestment and employee stock purchase plans. Stock purchases may be made in the open market or in private transactions at times, and in amounts that we deem appropriate. There is no guarantee as to the exact number of shares that we purchase, and we can terminate or limit the program at any time.
Dividends Declared - In January 2017, we declared a dividend of $0.42 per share ($1.68 per share on an annualized basis) for shareholders of record on February 24, 2017, payable March 10, 2017.
5. | ACCUMULATED OTHER COMPREHENSIVE INCOME (LOSS) |
The following table sets forth the balance in accumulated other comprehensive income (loss) for the period indicated:
Accumulated Other Comprehensive Income (Loss) | ||||
(Thousands of dollars) | ||||
January 1, 2015 | $ | (5,174 | ) | |
Pension and other postemployment benefit plans obligations | ||||
Other comprehensive income (loss) before reclassification, net of tax of $(130) | 209 | |||
Amounts reclassified from accumulated other comprehensive income (loss), net of tax of $(353) | 564 | |||
Other comprehensive income (loss) | 773 | |||
December 31, 2015 | (4,401 | ) | ||
Pension and other postemployment benefit plans obligations | ||||
Other comprehensive income (loss) before reclassification, net of tax of $486 | (776 | ) | ||
Amounts reclassified from accumulated other comprehensive income (loss), net of tax of $(289) | 462 | |||
Other comprehensive income (loss) | (314 | ) | ||
December 31, 2016 | $ | (4,715 | ) | |
The following table sets forth the effect of reclassifications from accumulated other comprehensive income (loss) on our Statements of Income for the period indicated:
Details about Accumulated Other Comprehensive Income | Year Ended December 31, | Affected Line Item in the | |||||||||||
(Loss) Components | 2016 | 2015 | 2014 | Statements of Income | |||||||||
(Thousands of dollars) | |||||||||||||
Pension and other postemployment benefit plan obligations (a) | |||||||||||||
Amortization of net loss | $ | 40,912 | $ | 47,494 | $ | 34,169 | |||||||
Amortization of unrecognized prior service cost | (3,316 | ) | (1,962 | ) | (1,211 | ) | |||||||
37,596 | 45,532 | 32,958 | |||||||||||
Regulatory adjustments (b) | (36,845 | ) | (44,615 | ) | (32,445 | ) | |||||||
751 | 917 | 513 | Income before income taxes | ||||||||||
(289 | ) | (353 | ) | (198 | ) | Income tax expense | |||||||
Total reclassifications for the period | $ | 462 | $ | 564 | $ | 315 | Net income | ||||||
(a) These components of accumulated other comprehensive income (loss) are included in the computation of net periodic benefit cost. See Note 11 for additional information regarding our net periodic benefit cost.
(b) Regulatory adjustments represent pension and other postemployment benefit costs expected to be recovered through rates and are deferred as part of our regulatory assets. See Note 8 for additional information regarding our regulatory assets and liabilities.
61
6. | EARNINGS PER SHARE |
The following tables set forth the computation of basic and diluted EPS from continuing operations for the periods indicated:
Year Ended December 31, 2016 | ||||||||||
Income | Shares | Per Share Amount | ||||||||
(Thousands, except per share amounts) | ||||||||||
Basic EPS Calculation | ||||||||||
Net income available for common stock | $ | 140,095 | 52,453 | $ | 2.67 | |||||
Diluted EPS Calculation | ||||||||||
Effect of dilutive securities | — | 510 | ||||||||
Net income available for common stock and common stock equivalents | $ | 140,095 | 52,963 | $ | 2.65 | |||||
Year Ended December 31, 2015 | ||||||||||
Income | Shares | Per Share Amount | ||||||||
(Thousands, except per share amounts) | ||||||||||
Basic EPS Calculation | ||||||||||
Net income available for common stock | $ | 119,030 | 52,578 | $ | 2.26 | |||||
Diluted EPS Calculation | ||||||||||
Effect of dilutive securities | — | 676 | ||||||||
Net income available for common stock and common stock equivalents | $ | 119,030 | 53,254 | $ | 2.24 | |||||
Year Ended December 31, 2014 | ||||||||||
Income | Shares | Per Share Amount | ||||||||
(Thousands, except per share amounts) | ||||||||||
Basic EPS Calculation | ||||||||||
Net income available for common stock | $ | 109,790 | 52,364 | $ | 2.10 | |||||
Diluted EPS Calculation | ||||||||||
Effect of dilutive securities | — | 582 | ||||||||
Net income available for common stock and common stock equivalents | $ | 109,790 | 52,946 | $ | 2.07 | |||||
7. | DERIVATIVE FINANCIAL INSTRUMENTS AND FAIR VALUE MEASUREMENTS |
Derivative Instruments - At December 31, 2016, we held purchased natural gas call options for the heating season ending March 2017, with total notional amounts of 14.3 Bcf, for which we paid premiums of $5.4 million, and which had a fair value of $6.5 million. At December 31, 2015, we held purchased natural gas call options for the heating season ended March 2016, with total notional amounts of 17.0 Bcf, for which we paid premiums of $5.8 million, and which had a fair value of $0.4 million. The premiums paid and any cash settlements received are recorded as part of our unrecovered purchased-gas costs in current regulatory assets as these contracts are included in, and recoverable through, the purchased-gas cost adjustment mechanisms. Additionally, changes in fair value associated with these contracts are deferred as part of our unrecovered purchased-gas costs in our Balance Sheets. Our natural gas call options are classified as Level 1 as fair value amounts are based on unadjusted quoted prices in active markets including NYMEX-settled prices. There were no transfers between levels for the periods presented.
Other Financial Instruments - The approximate fair value of cash and cash equivalents, accounts receivable and accounts payable is equal to book value, due to the short-term nature of these items. Our cash and cash equivalents are comprised of bank and money market accounts, and are classified as Level 1.
Short-term notes payable and commercial paper are due upon demand and, therefore, the carrying amounts approximate fair value and are classified as Level 1. The book value of our long-term debt, including current maturities, was $1.2 billion at both December 31, 2016 and 2015. The estimated fair value of our long-term debt, including current maturities, was $1.2 billion at
62
both December 31, 2016 and 2015. The estimated fair value of our Senior Notes was determined using quoted market prices, and are considered Level 2.
8. | REGULATORY ASSETS AND LIABILITIES |
The table below presents a summary of regulatory assets, net of amortization, and liabilities for the periods indicated:
December 31, 2016 | ||||||||||||||
Remaining Recovery Period | Current | Noncurrent | Total | |||||||||||
(Thousands of dollars) | ||||||||||||||
Under-recovered purchased-gas costs | 1 year | $ | 29,901 | $ | — | $ | 29,901 | |||||||
Pension and other postemployment benefit costs | See Note 11 | 31,498 | 427,448 | 458,946 | ||||||||||
Weather normalization | 1 year | 17,661 | — | 17,661 | ||||||||||
Reacquired debt costs | 11 years | 812 | 8,108 | 8,920 | ||||||||||
Other | 1 to 22 years | 3,274 | 4,966 | 8,240 | ||||||||||
Total regulatory assets, net of amortization | 83,146 | 440,522 | 523,668 | |||||||||||
Over-recovered purchased-gas costs | 1 year | (10,154 | ) | — | (10,154 | ) | ||||||||
Ad-valorem tax | 1 year | (1,768 | ) | — | (1,768 | ) | ||||||||
Total regulatory liabilities | (11,922 | ) | — | (11,922 | ) | |||||||||
Net regulatory assets and liabilities | $ | 71,224 | $ | 440,522 | $ | 511,746 | ||||||||
December 31, 2015 | ||||||||||||||
Remaining Recovery Period | Current | Noncurrent | Total | |||||||||||
(Thousands of dollars) | ||||||||||||||
Under-recovered purchased-gas costs | 1 year | $ | 13,336 | $ | — | $ | 13,336 | |||||||
Pension and other postemployment benefit costs | See Note 11 | 15,670 | 425,175 | 440,845 | ||||||||||
Weather normalization | 1 year | 2,198 | — | 2,198 | ||||||||||
Reacquired debt costs | 12 years | 812 | 8,919 | 9,731 | ||||||||||
Other | 1 to 23 years | 909 | 1,769 | 2,678 | ||||||||||
Total regulatory assets, net of amortization | 32,925 | 435,863 | 468,788 | |||||||||||
Accumulated removal costs (a) | up to 50 years | — | (9,032 | ) | (9,032 | ) | ||||||||
Over-recovered purchased-gas costs | 1 year | (22,884 | ) | — | (22,884 | ) | ||||||||
Ad-valorem tax | 1 year | (1,731 | ) | — | (1,731 | ) | ||||||||
Total regulatory liabilities | (24,615 | ) | (9,032 | ) | (33,647 | ) | ||||||||
Net regulatory assets and liabilities | $ | 8,310 | $ | 426,831 | $ | 435,141 | ||||||||
(a) Included in other deferred credits in our Balance Sheets.
Regulatory assets on our Balance Sheets, as authorized by the various regulatory authorities, are probable of recovery. Base rates are designed to provide a recovery of cost during the period rates are in effect but do not generally provide for a return on investment for amounts we have deferred as regulatory assets. All of our regulatory assets recoverable through base rates are subject to review by the respective regulatory authorities during future rate proceedings. We are not aware of any evidence that these costs will not be recoverable through either rate riders or base rates, and we believe that we will be able to recover such costs, consistent with our historical recoveries.
Purchased-gas costs represent the natural gas costs that have been over- or under-recovered from customers through the purchased-gas cost adjustment mechanisms, and includes natural gas utilized in our operations and premiums paid and any cash settlements received from our purchased natural gas call options.
We amortize reacquired debt costs in accordance with the accounting guidelines prescribed by the OCC and KCC.
Weather normalization represents revenue over- or under-recovered through the WNA rider in Kansas. This amount is deferred as a regulatory asset or liability for a 12-month period. Kansas Gas Service then applies an adjustment to the customers’ bills for 12 months to refund the over-collected revenue or bill the under-collected revenue.
63
Ad-valorem tax represents an increase or decrease in Kansas Gas Service’s taxes above or below the amount approved in a rate case. This amount is deferred as a regulatory asset or liability for a 12-month period. Kansas Gas Service then applies an adjustment to the customers’ bills for 12 months to refund the over-collected revenue or bill the under-collected revenue.
Recovery through rates resulted in amortization of regulatory assets of approximately $3.8 million, $1.6 million and $6.4 million for the years ended December 31, 2016, 2015 and 2014, respectively.
We collect, through our rates, the estimated costs of removal on certain regulated properties through depreciation expense, with a corresponding credit to accumulated depreciation and amortization. These removal costs are nonlegal obligations; however, the amounts collected that are in excess of these nonlegal asset-removal costs incurred are accounted for as a regulatory liability. We have made an estimate of our regulatory liability using current rates since the last general rate order in each of our jurisdictions if the removal costs collected have exceeded our removal costs incurred. We record the estimated nonlegal asset-removal obligation in noncurrent liabilities in other deferred credits on our Balance Sheets.
In January 2016, as a result of our rate case in Oklahoma, we recorded a regulatory asset of $2.4 million to recover certain information technology costs incurred as a result of our separation from ONEOK in 2014, which will be recovered over four years.
9. | PROPERTY, PLANT AND EQUIPMENT |
The following table sets forth our property, plant and equipment by property type, for the periods indicated:
December 31, | December 31, | |||||||
2016 | 2015 | |||||||
(Thousands of dollars) | ||||||||
Natural gas distribution pipelines and related equipment | $ | 4,321,429 | $ | 4,114,090 | ||||
Natural gas transmission pipelines and related equipment | 481,953 | 462,654 | ||||||
General plant and other | 530,459 | 498,906 | ||||||
Construction work in process | 70,327 | 57,032 | ||||||
Property, plant and equipment | 5,404,168 | 5,132,682 | ||||||
Accumulated depreciation and amortization | (1,672,548 | ) | (1,620,771 | ) | ||||
Net property, plant and equipment | $ | 3,731,620 | $ | 3,511,911 | ||||
We compute depreciation expense by applying composite, straight-line rates of 2.0 percent to 3.0 percent that were approved by various regulatory authorities.
We recorded capitalized interest of $3.6 million, $2.6 million and $2.5 million for the years ended December 31, 2016, 2015 and 2014, respectively. We incurred liabilities for construction work in process and asset removal costs that had not been paid at December 31, 2016, 2015 and 2014 of $11.9 million, $15.0 million and $7.0 million, respectively. Such amounts are not included in capital expenditures on the Statements of Cash Flows.
10. | SHARE-BASED PAYMENTS |
The ONE Gas Equity Compensation Plan (ECP) provides for the granting of stock-based compensation, including incentive stock options, nonstatutory stock options, stock bonus awards, restricted stock awards, restricted stock unit awards, performance stock awards and performance unit awards to eligible employees and the granting of stock awards to nonemployee directors. We have reserved 2.8 million shares of common stock for issuance under the ECP. At December 31, 2016, we had approximately 1.1 million shares available for issuance under the ECP, which reflect shares issued and estimated shares expected to be issued upon vesting of outstanding awards granted under the plan, less forfeitures. The plan allows for the deferral of awards granted in stock or cash, in accordance with Internal Revenue Code section 409A requirements.
Compensation cost expensed for our share-based payment plans was $7.0 million, net of tax benefits of $4.3 million, for 2016, $5.7 million, net of tax benefits of $3.5 million, for 2015, and $7.0 million, net of tax benefits of $4.4 million, for 2014.
Restricted Stock Unit Awards - We have granted restricted stock unit awards to key employees that vest over a service period of generally three years and entitle the grantee to receive shares of our common stock. Restricted stock unit awards granted accrue dividend equivalents in the form of additional restricted stock units prior to vesting. Restricted stock unit awards are measured at fair value as if they were vested and issued on the grant date, reduced by expected dividend payments for awards
64
that do not accrue dividends and adjusted for estimated forfeitures. Compensation expense is recognized on a straight-line basis over the vesting period of the award. A forfeiture rate of 3 percent per year based on historical forfeitures under our share-based payment plans is used.
Performance Stock Unit Awards - We have granted performance stock unit awards to key employees. The shares of common stock underlying the performance stock units vest at the expiration of a service period of generally three years if certain performance criteria are met by us as determined by the Executive Compensation Committee of the Board of Directors. Upon vesting, a holder of performance stock units is entitled to receive a number of shares of common stock equal to a percentage (0 percent to 200 percent) of the performance stock units granted, based on our total shareholder return over the vesting period, compared with the total shareholder return of a peer group of other utilities over the same period.
If paid, the outstanding performance stock unit awards entitle the grantee to receive shares of our common stock. The outstanding performance stock unit awards are equity awards with a market-based condition, which results in the compensation expense for these awards being recognized on a straight-line basis over the requisite service period, provided that the requisite service period is fulfilled, regardless of when, if ever, the market condition is satisfied. The performance stock unit awards granted accrue dividend equivalents in the form of additional performance stock units prior to vesting. The fair value of these performance stock units was estimated on the grant date based on a Monte Carlo model. The compensation expense on these awards will only be adjusted for changes in forfeitures. A forfeiture rate of 3 percent per year based on historical forfeitures under our share-based payment plans was used.
Restricted Stock Unit Award Activity
As of December 31, 2016, there was $2.8 million of total unrecognized compensation costs related to the nonvested restricted stock unit awards, which is expected to be recognized over a weighted-average period of 1.7 years. The following tables set forth activity and various statistics for restricted stock unit awards outstanding under the respective plans for the period indicated:
Number of Units | Weighted- Average Price | ||||||
Nonvested December 31, 2015 | 231,258 | $ | 32.59 | ||||
Granted | 42,935 | $ | 58.30 | ||||
Vested | (77,033 | ) | $ | 23.76 | |||
Forfeited | (2,260 | ) | $ | 38.04 | |||
Nonvested December 31, 2016 | 194,900 | $ | 41.68 | ||||
2016 | 2015 | 2014 | ||||||||||
Weighted-average grant date fair value (per share) | $ | 58.30 | $ | 41.40 | $ | 33.19 | ||||||
Fair value of shares granted (thousands of dollars) | $ | 2,503 | $ | 3,141 | $ | 3,149 | ||||||
The fair value of restricted stock vested was $4.5 million and $6.5 million in 2016 and 2015, respectively.
Performance Stock Unit Award Activity
As of December 31, 2016, there was $4.8 million of total unrecognized compensation cost related to the nonvested performance stock unit awards, which is expected to be recognized over a weighted-average period of 1.7 years. The following tables set forth activity and various statistics related to our performance stock unit awards and the assumptions used by us in the valuations of the 2016, 2015 and 2014 grants at the grant date:
Number of Units | Weighted- Average Price | ||||||
Nonvested December 31, 2015 | 439,250 | $ | 27.35 | ||||
Granted | 74,395 | $ | 64.06 | ||||
Vested | (221,882 | ) | $ | 15.11 | |||
Forfeited | (2,952 | ) | $ | 41.44 | |||
Nonvested December 31, 2016 | 288,811 | $ | 46.06 | ||||
65
2016 | 2015 | 2014 | |||||
Volatility (a) | 18.20% | 15.90% | 18.40% | ||||
Dividend yield | 2.40% | 2.90% | 3.37% | ||||
Risk-free interest rate | 0.91% | 1.10% | 0.67% | ||||
(a) - Volatility based on historical volatility over three years using daily stock price observations of our peer utilities. | |||||||
2016 | 2015 | 2014 | ||||||||||
Weighted-average grant date fair value (per share) | $ | 64.06 | $ | 44.48 | $ | 35.98 | ||||||
Fair value of shares granted (thousands of dollars) | $ | 4,766 | $ | 4,486 | $ | 4,462 | ||||||
The fair value of performance stock vested was $19.5 million and $23.5 million in 2016 and 2015, respectively.
Employee Stock Purchase Plan
We have reserved a total of 700 thousand shares of common stock for issuance under our Employee Stock Purchase Plan (the ESPP). Subject to certain exclusions, all employees who work at least 20 hours per week are eligible to participate in the ESPP. Employees can choose to have up to 10 percent of their annual base pay withheld to purchase our common stock, subject to terms and limitations of the plan. The purchase price of the stock is 85 percent of the lower of the average market price of our common stock on the grant date or exercise date. Approximately 41 percent, 40 percent and 36 percent of employees participated in the plan in 2016, 2015 and 2014, respectively, and purchased 83,431 shares at $54.51 in 2016, 51,092 shares at $36.15 in 2015, and 51,418 shares at $32.29 in 2014. Compensation expense, before taxes, was $1.4 million, $1.3 million and $0.4 million in 2016, 2015 and 2014, respectively.
Employee Stock Award Program
Under the Employee Stock Award Program, we issue, for no monetary consideration, one share of our common stock to all eligible employees when the per-share closing price of our common stock on the NYSE closes for the first time at or above each $1.00 increment above $34. The total number of shares of our common stock authorized for issuance under this program is 125,000. Shares issued to employees under this program during 2016, 2015 and 2014 totaled 50,573, 23,506 and 35,324, respectively, leaving 15,603 shares for future awards. Compensation expense, before taxes, related to the Employee Stock Award Program was $3.0 million, $1.1 million and $2.5 million for 2016, 2015 and 2014, respectively.
11. | EMPLOYEE BENEFIT PLANS |
Retirement and Other Postemployment Benefit Plans
Retirement Plans - We have a defined benefit pension plan covering nonbargaining-unit employees hired before January 1, 2005, and certain bargaining-unit employees hired before December 15, 2011. Nonbargaining unit employees hired after December 31, 2004; employees represented by Local No. 304 of the International Brotherhood of Electrical Workers (IBEW) hired on or after July 1, 2010; employees represented by the United Steelworkers hired on or after December 15, 2011; and employees who accepted a one-time opportunity to opt out of the defined benefit pension plan are covered by a profit-sharing plan. Certain employees of the Texas Gas Service division are entitled to benefits under a frozen cash-balance pension plan. In addition, we have a supplemental executive retirement plan for the benefit of certain officers. No new participants in the supplemental executive retirement plan have been approved since 2005, and it was formally closed to new participants as of January 1, 2014. We fund our defined benefit pension costs at a level needed to maintain or exceed the minimum funding levels required by the Employee Retirement Income Security Act of 1974, as amended, and the Pension Protection Act of 2006. Pension expense was $32.0 million, $38.0 million and $27.1 million in 2016, 2015 and 2014, respectively.
Other Postemployment Benefit Plans - We sponsor health and welfare plans that provide postemployment medical and life insurance benefits to certain employees who retire with at least five years of service. The postemployment medical plan is contributory based on hire date, age and years of service, with retiree contributions adjusted periodically, and contains other cost-sharing features such as deductibles and coinsurance. Other postemployment benefit expense was $2.6 million, $5.0 million and $5.9 million in 2016, 2015 and 2014, respectively, prior to regulatory deferrals.
Plan Amendments - In October 2015, we announced to certain pre-65 participants in our postemployment medical plans a change from a self-insured postemployment medical plan to a plan providing participants an annual benefit that would allow them to select coverage on a healthcare exchange beginning January 1, 2017. As a result, we remeasured the respective plan
66
assets and liabilities, which resulted in a reduction in benefit obligations of our postemployment benefit plan of $11.9 million in the fourth quarter of 2015.
In September 2016, due to uncertain market conditions with health insurance exchange providers, we elected not to move the eligible pre-65 participants in our postemployment medical plans to a healthcare exchange. As a result, we remeasured the respective plan assets and benefit obligations, effective September 30, 2016. In the fourth quarter of 2016, we further amended our other postemployment medical plan to allow certain participants access to reimbursable retirement accounts. The net impact of these plan amendments in 2016 was a $483 thousand increase in our other postemployment benefit plan obligation.
Actuarial Assumptions - The following table sets forth the weighted-average assumptions used to determine benefit obligations for pension and postemployment benefits for the periods indicated:
December 31, | ||||
2016 | 2015 | |||
Discount rate - pension plans | 4.30% | 4.75% | ||
Discount rate - other postemployment plans | 4.20% | 4.75% | ||
Compensation increase rate | 3.25% - 3.40% | 3.35% - 3.40% | ||
The following table sets forth the weighted-average assumptions used by us to determine the periodic benefit costs for the periods indicated:
Nine Months Ended September 30, | Three Months Ended December 31, | Years Ended December 31, | |||||||
2016 | 2016 | 2015 | 2014 | ||||||
Discount rate - pension plans | 4.75% | 4.75% | 4.25%/4.75% | (a) | 5.25% | ||||
Discount rate - other postemployment plans | 4.75% | 3.75% | 4.25%/4.75% | (a) | 5.00% | ||||
Expected long-term return on plan assets - pension plans | 7.75% | 7.75% | 7.75% | 7.75% | |||||
Expected long-term return on plan assets - other postemployment plans | 8.00% | 7.75% | 7.75% | 7.75% | |||||
Compensation increase rate | 3.35% - 3.40% | 3.35% - 3.40% | 3.30% - 3.50% | 3.35% - 3.50% | |||||
(a) Discount rate for the nine months ended September 30, 2015, and three months ended December 31, 2015, respectively.
We determine our overall expected long-term rate of return on plan assets, based on our review of historical returns and economic growth models. At December 31, 2016, we updated our assumed mortality rates to incorporate the new set of mortality tables issued by the Society of Actuaries in October 2016.
We determine our discount rates annually. We estimate our discount rate based upon a comparison of the expected cash flows associated with our future payments under our defined benefit pension and other postemployment obligations to a hypothetical bond portfolio created using high-quality bonds that closely match expected cash flows. Bond portfolios are developed by selecting a bond for each of the next 60 years based on the maturity dates of the bonds. Bonds selected to be included in the portfolios are only those rated by Moody’s as AA- or better and exclude callable bonds, bonds with less than a minimum issue size, yield outliers and other filtering criteria to remove unsuitable bonds.
Regulatory Treatment - The OCC, KCC and regulatory authorities in Texas have approved the recovery of pension costs and other postemployment benefits costs through rates for Oklahoma Natural Gas, Kansas Gas Service and Texas Gas Service, respectively. The costs recovered through rates are based on current funding requirements and the net periodic benefit cost for defined benefit pension and other postemployment costs. Differences, if any, between the expense and the amount recovered through rates would be reflected in earnings, net of authorized deferrals.
We historically have recovered defined benefit pension and other postemployment benefit costs through rates. We believe it is probable that regulators will continue to include the net periodic pension and other postemployment benefit costs in our cost of service.
67
Obligations and Funded Status - The following table sets forth our defined benefit pension and other postemployment benefit plans, benefit obligations and fair value of plan assets for the periods indicated:
Pension Benefits | Other Postemployment Benefits | ||||||||||||||
December 31, | December 31, | ||||||||||||||
2016 | 2015 | 2016 | 2015 | ||||||||||||
Changes in Benefit Obligation | (Thousands of dollars) | ||||||||||||||
Benefit obligation, beginning of period | $ | 985,624 | $ | 1,028,171 | $ | 228,253 | $ | 257,688 | |||||||
Service cost | 12,055 | 13,660 | 2,675 | 3,257 | |||||||||||
Interest cost | 45,550 | 43,542 | 10,235 | 10,628 | |||||||||||
Plan participants’ contributions | — | — | 3,043 | 2,915 | |||||||||||
Actuarial loss (gain) | 25,886 | (47,607 | ) | 14,309 | (19,702 | ) | |||||||||
Benefits paid | (71,066 | ) | (52,142 | ) | (15,450 | ) | (14,632 | ) | |||||||
Plan amendment | — | — | 483 | (11,901 | ) | ||||||||||
Settlements | (31,518 | ) | — | — | — | ||||||||||
Benefit obligation, end of period | 966,531 | 985,624 | 243,548 | 228,253 | |||||||||||
Change in Plan Assets | |||||||||||||||
Fair value of plan assets, beginning of period | 785,161 | 845,396 | 155,495 | 151,777 | |||||||||||
Actual return on plan assets | 48,768 | (9,026 | ) | 9,733 | 1,335 | ||||||||||
Employer contributions | 12,441 | 933 | 13,225 | 14,100 | |||||||||||
Plan participants’ contributions | — | — | 3,043 | 2,915 | |||||||||||
Benefits paid | (71,066 | ) | (52,142 | ) | (15,450 | ) | (14,632 | ) | |||||||
Settlements | (35,718 | ) | — | — | — | ||||||||||
Fair value of assets, end of period | 739,586 | 785,161 | 166,046 | 155,495 | |||||||||||
Balance at December 31 | $ | (226,945 | ) | $ | (200,463 | ) | $ | (77,502 | ) | $ | (72,758 | ) | |||
Current liabilities | $ | (941 | ) | $ | (912 | ) | $ | — | $ | — | |||||
Noncurrent liabilities | (226,004 | ) | (199,551 | ) | (77,502 | ) | (72,758 | ) | |||||||
Balance at December 31 | $ | (226,945 | ) | $ | (200,463 | ) | $ | (77,502 | ) | $ | (72,758 | ) | |||
In the fourth quarter of 2016, we settled a portion of our benefit obligation with the purchase of annuities. Benefits paid reflects $18.1 million of lump sum payments to certain terminated vested participants. The accumulated benefit obligation for our defined benefit pension plans was $912.4 million and $934.3 million at December 31, 2016 and 2015, respectively.
There are no plan assets expected to be withdrawn and returned to us in 2017.
68
Components of Net Periodic Benefit Cost - The following tables set forth the components of net periodic benefit cost for our defined benefit pension and other postemployment benefit plans for the period indicated:
Pension Benefits | |||||||||||
Year Ended December 31, | |||||||||||
2016 | 2015 | 2014 | |||||||||
(Thousands of dollars) | |||||||||||
Components of net periodic benefit cost | |||||||||||
Service cost | $ | 12,055 | $ | 13,660 | $ | 11,620 | |||||
Interest cost | 45,550 | 43,542 | 43,791 | ||||||||
Expected return on assets | (61,183 | ) | (61,769 | ) | (59,862 | ) | |||||
Amortization of unrecognized prior service cost | — | 266 | 549 | ||||||||
Amortization of net loss | 35,543 | 42,226 | 30,200 | ||||||||
Settlements | — | 27 | 773 | ||||||||
Net periodic benefit cost | $ | 31,965 | $ | 37,952 | $ | 27,071 | |||||
Other Postemployment Benefits | |||||||||||
Year Ended December 31, | |||||||||||
2016 | 2015 | 2014 | |||||||||
(Thousands of dollars) | |||||||||||
Components of net periodic benefit cost | |||||||||||
Service cost | $ | 2,675 | $ | 3,257 | $ | 3,468 | |||||
Interest cost | 10,235 | 10,628 | 11,605 | ||||||||
Expected return on assets | (12,370 | ) | (11,892 | ) | (11,393 | ) | |||||
Amortization of unrecognized prior service cost | (3,316 | ) | (2,228 | ) | (1,760 | ) | |||||
Amortization of net loss | 5,369 | 5,268 | 3,969 | ||||||||
Net periodic benefit cost | $ | 2,593 | $ | 5,033 | $ | 5,889 | |||||
Other Comprehensive Income (Loss) - The following table sets forth the amounts recognized in other comprehensive income (loss) related to our defined benefit pension benefits for the period indicated:
Pension Benefits | |||||||||||
Year Ended December 31, | |||||||||||
2016 | 2015 | 2014 | |||||||||
(Thousands of dollars) | |||||||||||
Net gain (loss) arising during the period | $ | (1,262 | ) | $ | 339 | $ | (3,543 | ) | |||
Amortization of loss | 751 | 917 | 518 | ||||||||
Deferred income taxes | 197 | (483 | ) | 1,244 | |||||||
Total recognized in other comprehensive income (loss) | $ | (314 | ) | $ | 773 | $ | (1,781 | ) | |||
There were no amounts recognized in other comprehensive income (loss) related to our other postemployment benefits for the periods presented.
69
The tables below set forth the amounts in accumulated other comprehensive income (loss) that had not yet been recognized as components of net periodic benefit expense for the periods indicated:
Pension Benefits | |||||||
December 31, | |||||||
2016 | 2015 | ||||||
(Thousands of dollars) | |||||||
Prior service credit (cost) | $ | — | $ | — | |||
Accumulated loss | (414,757 | ) | (407,798 | ) | |||
Accumulated other comprehensive loss before regulatory assets | (414,757 | ) | (407,798 | ) | |||
Regulatory asset for regulated entities | 407,073 | 400,625 | |||||
Accumulated other comprehensive loss after regulatory assets | (7,684 | ) | (7,173 | ) | |||
Deferred income taxes | 2,969 | 2,772 | |||||
Accumulated other comprehensive loss, net of tax | $ | (4,715 | ) | $ | (4,401 | ) | |
Other Postemployment Benefits | |||||||
December 31, | |||||||
2016 | 2015 | ||||||
(Thousands of dollars) | |||||||
Prior service credit (cost) | $ | 10,211 | $ | 14,010 | |||
Accumulated loss | (62,084 | ) | (50,447 | ) | |||
Accumulated other comprehensive loss before regulatory assets | (51,873 | ) | (36,437 | ) | |||
Regulatory asset for regulated entities | 51,873 | 36,437 | |||||
Accumulated other comprehensive loss after regulatory assets | — | — | |||||
Deferred income taxes | — | — | |||||
Accumulated other comprehensive loss, net of tax | $ | — | $ | — | |||
The following table sets forth the amounts recognized in either accumulated comprehensive income (loss) or regulatory assets expected to be recognized as components of net periodic benefit expense in the next fiscal year:
Pension Benefits | Other Postemployment Benefits | ||||||
Amounts to be recognized in 2017 | (Thousands of dollars) | ||||||
Prior service credit (cost) | $ | — | $ | (4,597 | ) | ||
Actuarial net loss | $ | 36,107 | $ | 6,484 | |||
Health Care Cost Trend Rates - The following table sets forth the assumed health care cost-trend rates for the periods indicated:
2016 | 2015 | ||
Health care cost-trend rate assumed for next year | 7.25% | 4.00% - 7.50% | |
Rate to which the cost-trend rate is assumed to decline (the ultimate trend rate) | 5.00% | 4.00% - 5.00% | |
Year that the rate reaches the ultimate trend rate | 2022 | 2022 | |
70
Assumed health care cost-trend rates have a significant effect on the amounts reported for our health care plans. A one percentage point change in assumed health care cost-trend rates would have the following effects:
One Percentage | One Percentage | ||||||
Point Increase | Point Decrease | ||||||
(Thousands of dollars) | |||||||
Effect on total of service and interest cost | $ | 233 | $ | (232 | ) | ||
Effect on other postemployment benefit obligation | $ | 3,937 | $ | (3,991 | ) | ||
Plan Assets - Our investment strategy is to invest plan assets in accordance with sound investment practices that emphasize long-term fundamentals. The goal of this strategy is to maximize investment returns while managing risk in order to meet the plan’s current and projected financial obligations. To achieve this strategy, we have established a liability-driven investment strategy to change the allocations as the plan reaches certain funded status. The plan’s investments include a diverse blend of various domestic and international equities, investment-grade debt securities which mirror the cash flows of our liability, insurance contracts and alternative investments. The current target allocation for the assets of our defined benefit pension plan is as follows:
U.S. large-cap equities | 37.4 | % |
Investment-grade bonds | 30.0 | % |
Developed foreign large-cap equities | 10.6 | % |
Alternative investments | 7.7 | % |
Mid-cap equities | 5.6 | % |
Emerging markets equities | 5.0 | % |
Small-cap equities | 3.7 | % |
Total | 100 | % |
As part of our risk management for the plans, minimums and maximums have been set for each of the asset classes listed above. All investment managers for the plan are subject to certain restrictions on the securities they purchase and, with the exception of indexing purposes, are prohibited from owning our stock.
The current target allocation for the assets of our other postemployment benefits plan is 30 percent fixed income securities and 70 percent equity securities.
71
The following tables set forth our pension benefits and other postemployment benefits plan assets by fair value category as of the measurement date:
Pension Benefits | ||||||||||||
December 31, 2016 | ||||||||||||
Asset Category | Level 1 | Level 2 | Level 3 | Total | ||||||||
(Thousands of dollars) | ||||||||||||
Investments: | ||||||||||||
Equity securities (a) | $ | 371,655 | $ | 58,987 | $ | — | $ | 430,642 | ||||
Government obligations | — | 47,445 | — | 47,445 | ||||||||
Corporate obligations (b) | — | 129,036 | — | 129,036 | ||||||||
Cash and money market funds (c) | 13,786 | 16,114 | — | 29,900 | ||||||||
Insurance contracts and group annuity contracts | — | — | 45,140 | 45,140 | ||||||||
Other investments (d) | — | 71 | 57,352 | 57,423 | ||||||||
Total assets | $ | 385,441 | $ | 251,653 | $ | 102,492 | $ | 739,586 | ||||
(a) - This category represents securities of the various market sectors from diverse industries.
(b) - This category represents bonds from diverse industries.
(c) - This category is primarily money market funds.
(d) - This category represents alternative investments such as hedge funds and other financial instruments.
Pension Benefits | ||||||||||||
December 31, 2015 | ||||||||||||
Asset Category | Level 1 | Level 2 | Level 3 | Total | ||||||||
(Thousands of dollars) | ||||||||||||
Investments: | ||||||||||||
Equity securities (a) | $ | 405,935 | $ | 62,150 | $ | — | $ | 468,085 | ||||
Government obligations | — | 44,651 | — | 44,651 | ||||||||
Corporate obligations (b) | — | 139,396 | — | 139,396 | ||||||||
Cash and money market funds (c) | 5,429 | 10,279 | — | 15,708 | ||||||||
Insurance contracts and group annuity contracts | — | — | 56,465 | 56,465 | ||||||||
Other investments (d) | 2,884 | — | 57,972 | 60,856 | ||||||||
Total assets | $ | 414,248 | $ | 256,476 | $ | 114,437 | $ | 785,161 | ||||
(a) - This category represents securities of the various market sectors from diverse industries.
(b) - This category represents bonds from diverse industries.
(c) - This category is primarily money market funds.
(d) - This category represents alternative investments such as hedge funds and other financial instruments.
72
Other Postemployment Benefits | ||||||||||||
December 31, 2016 | ||||||||||||
Asset Category | Level 1 | Level 2 | Level 3 | Total | ||||||||
(Thousands of dollars) | ||||||||||||
Investments: | ||||||||||||
Equity securities (a) | $ | 39,817 | $ | 7,323 | $ | — | $ | 47,140 | ||||
Government obligations | — | 75 | — | 75 | ||||||||
Corporate obligations (b) | — | 19,948 | — | 19,948 | ||||||||
Cash and money market funds (c) | 74 | 16,989 | — | 17,063 | ||||||||
Insurance contracts and group annuity contracts | — | 81,820 | — | 81,820 | ||||||||
Total assets | $ | 39,891 | $ | 126,155 | $ | — | $ | 166,046 | ||||
(a) - This category represents securities of the various market sectors from diverse industries.
(b) - This category represents bonds from diverse industries.
(c) - This category is primarily money market funds.
Other Postemployment Benefits | ||||||||||||
December 31, 2015 | ||||||||||||
Asset Category | Level 1 | Level 2 | Level 3 | Total | ||||||||
(Thousands of dollars) | ||||||||||||
Investments: | ||||||||||||
Equity securities (a) | $ | 54,560 | $ | 7,498 | $ | — | $ | 62,058 | ||||
Government obligations | — | 64 | — | 64 | ||||||||
Corporate obligations (b) | — | 200 | — | 200 | ||||||||
Cash and money market funds (c) | 233 | 13,322 | — | 13,555 | ||||||||
Insurance contracts and group annuity contracts | — | 79,531 | — | 79,531 | ||||||||
Other investments (d) | 4 | — | 83 | 87 | ||||||||
Total assets | $ | 54,797 | $ | 100,615 | $ | 83 | $ | 155,495 | ||||
(a) - This category represents securities of the various market sectors from diverse industries.
(b) - This category represents bonds from diverse industries.
(c) - This category is primarily money market funds.
(d) - This category represents alternative investments such as hedge funds.
The following table sets forth the reconciliation of Level 3 fair value measurements of our pension plans for the periods indicated:
Pension Benefits | |||||||||||
Insurance Contracts | Other Investments | Total | |||||||||
(Thousands of dollars) | |||||||||||
January 1, 2015 | $ | 59,877 | $ | 57,914 | $ | 117,791 | |||||
Net realized and unrealized gains (losses) | 2,188 | 58 | 2,246 | ||||||||
Settlements | (5,600 | ) | — | (5,600 | ) | ||||||
December 31, 2015 | $ | 56,465 | $ | 57,972 | $ | 114,437 | |||||
Net realized and unrealized gains (losses) | 4,518 | (620 | ) | 3,898 | |||||||
Sales and settlements | (15,843 | ) | — | (15,843 | ) | ||||||
December 31, 2016 | $ | 45,140 | $ | 57,352 | $ | 102,492 | |||||
73
Contributions - During 2016, we contributed $12.4 million to our defined benefit pension plans and we contributed $13.2 million to our other postemployment benefit plans. In 2017, we expect to contribute $1.0 million to our defined benefit pension plans and expect to contribute $3.1 million to our other postemployment benefit plans.
Pension and Other Postemployment Benefit Payments - Benefit payments for our defined benefit pension and other postemployment benefit plans for the period ended December 31, 2016 were $71.1 million and $15.5 million, respectively. The following table sets forth the pension benefits and other postemployment benefits payments expected to be paid in 2017-2026:
Pension Benefits | Other Postemployment Benefits | ||||||
Benefits to be paid in: | (Thousands of dollars) | ||||||
2017 | $ | 51,539 | $ | 16,165 | |||
2018 | $ | 52,660 | $ | 16,815 | |||
2019 | $ | 53,450 | $ | 17,073 | |||
2020 | $ | 54,812 | $ | 17,379 | |||
2021 | $ | 56,033 | $ | 17,401 | |||
2022 through 2026 | $ | 294,519 | $ | 86,559 | |||
The expected benefits to be paid are based on the same assumptions used to measure our benefit obligation at December 31, 2016, and include estimated future employee service.
Other Employee Benefit Plans
401(k) Plan - We have a 401(k) Plan which covers all full-time employees, and employee contributions are discretionary. We match 100 percent of each participant’s eligible contribution up to 6 percent of eligible compensation, subject to certain limits. Our contributions made to the plan were $10.8 million, $10.2 million and $9.7 million in 2016, 2015 and 2014, respectively.
Profit-Sharing Plan - We have a profit-sharing plan for all employees that do not participate in our defined benefit pension plan. We plan to make a contribution to the profit-sharing plan each quarter equal to 1 percent of each participant’s eligible compensation during the quarter. Additional discretionary employer contributions may be made at the end of each year. Employee contributions are not allowed under the plan. Our contributions made to the plan were $6.0 million, $6.5 million and $4.0 million in 2016, 2015 and 2014, respectively.
Employee Deferred Compensation Plan - Our Nonqualified Deferred Compensation Plan provides select employees with the option to defer portions of their compensation and provides nonqualified deferred compensation benefits that are not available due to limitations on employer and employee contributions to qualified defined contribution plans under the federal tax laws. Contributions made to the plan were not material in 2016, 2015 and 2014.
74
12. | INCOME TAXES |
The following table sets forth our provision for income taxes for the periods indicated:
Years Ended December 31, | |||||||||||
2016 | 2015 | 2014 | |||||||||
(Thousands of dollars) | |||||||||||
Current income tax provision | |||||||||||
Federal | $ | (2,016 | ) | $ | 7,135 | $ | 17,006 | ||||
State | 471 | 2,055 | 1,397 | ||||||||
Total current income tax provision | (1,545 | ) | 9,190 | 18,403 | |||||||
Deferred income tax provision | |||||||||||
Federal | 76,247 | 56,440 | 42,024 | ||||||||
State | 10,541 | 7,349 | 7,911 | ||||||||
Total deferred income tax provision | 86,788 | 63,789 | 49,935 | ||||||||
Total provision for income taxes | $ | 85,243 | $ | 72,979 | $ | 68,338 | |||||
The following table is a reconciliation of our income tax provision for the periods indicated:
Years Ended December 31, | |||||||||||
2016 | 2015 | 2014 | |||||||||
(Thousands of dollars) | |||||||||||
Income before income taxes | $ | 225,338 | $ | 192,009 | $ | 178,128 | |||||
Federal statutory income tax rate | 35 | % | 35 | % | 35 | % | |||||
Provision for federal income taxes | 78,868 | 67,203 | 62,345 | ||||||||
State income taxes, net of federal tax benefit | 7,158 | 6,114 | 6,051 | ||||||||
Other, net | (783 | ) | (338 | ) | (58 | ) | |||||
Total provision for income taxes | $ | 85,243 | $ | 72,979 | $ | 68,338 | |||||
The following table sets forth the tax effects of temporary differences that gave rise to significant portions of the deferred tax assets and liabilities for the periods indicated:
December 31, | |||||||
2016 | 2015 | ||||||
(Thousands of dollars) | |||||||
Deferred tax assets | |||||||
Employee benefits and other accrued liabilities | $ | 123,333 | $ | 110,148 | |||
Net operating loss | 23,094 | — | |||||
Other | 5,716 | 7,848 | |||||
Total deferred tax assets | 152,143 | 117,996 | |||||
Deferred tax liabilities | |||||||
Excess of tax over book depreciation | 990,682 | 897,667 | |||||
Purchased-gas cost adjustment | 13,822 | 3,999 | |||||
Other regulatory assets and liabilities, net | 186,207 | 168,115 | |||||
Total deferred tax liabilities | 1,190,711 | 1,069,781 | |||||
Net deferred tax liabilities | $ | 1,038,568 | $ | 951,785 | |||
As of December 31, 2016, we have federal and state income tax net operating loss (NOL) carryforwards of $63.0 million and $21.0 million, respectively, which will expire at various dates from 2024 through 2036. We believe that it is more likely than not that the tax benefits of the NOL carryforwards will be utilized prior to their expirations; therefore, no valuation allowance is necessary.
Deferred tax assets related to tax benefits of employee share-based compensation have been reduced for performance share units and restricted share units that vested in periods in which we were in an NOL position. This vesting resulted in tax
75
deductions in excess of previously recorded benefits based on the performance share unit and restricted share unit value at the time of grant. Although these additional tax benefits are reflected in NOL carryforwards in the tax return, the additional tax
benefit is not recognized until the deduction reduces taxes payable. A portion of the tax benefit does not reduce our current taxes payable due to NOL carryforwards; accordingly, these tax benefits are not reflected in our NOLs in deferred tax assets. Cumulative tax benefits included in NOL carryforwards but not reflected in deferred tax assets were $11.0 million as of December 31, 2016.
We have filed our consolidated federal and state tax returns for years 2014 and 2015.
13. | COMMITMENTS AND CONTINGENCIES |
Commitments - Operating leases represent future minimum lease payments under noncancelable leases covering office space, facilities and information technology hardware and software. Rental expense was $8.6 million in 2016 and $5.0 million in each of 2015 and 2014. The following table sets forth our operating lease payments for the periods indicated:
Operating Leases | ||||
(Millions of dollars) | ||||
2017 | $ | 5.6 | ||
2018 | 5.2 | |||
2019 | 4.4 | |||
2020 | 3.6 | |||
2021 | 3.2 | |||
Thereafter | 4.4 | |||
Total | $ | 26.4 | ||
Environmental Matters - We are subject to multiple historical, wildlife preservation and environmental laws and/or regulations, which affect many aspects of our present and future operations. Regulated activities include, but are not limited to, those involving air emissions, storm water and wastewater discharges, handling and disposal of solid and hazardous wastes, wetland preservation, hazardous materials transportation, and pipeline and facility construction. These laws and regulations require us to obtain and/or comply with a wide variety of environmental clearances, registrations, licenses, permits and other approvals. Failure to comply with these laws, regulations, licenses and permits may expose us to fines, penalties and/or interruptions in our operations that could be material to our results of operations. In addition, emission controls and/or other regulatory or permitting mandates under the Clean Air Act and other similar federal and state laws could require unexpected capital expenditures. We cannot assure that existing environmental statutes and regulations will not be revised or that new regulations will not be adopted or become applicable to us. Revised or additional statutes or regulations that result in increased compliance costs or additional operating restrictions could have a material adverse effect on our business, financial condition, results of operations and cash flows.
We own or retain legal responsibility for the environmental conditions at 12 former manufactured natural gas sites in Kansas. These sites contain potentially harmful materials that are subject to control or remediation under various environmental laws and regulations. A consent agreement with the KDHE governs all work at these sites. The terms of the consent agreement require us to investigate these sites and set remediation activities based upon the results of the investigations and risk analysis. Remediation typically involves the management of contaminated soils and may involve removal of structures and monitoring and/or remediation of groundwater.
We have completed or addressed removal of the source of soil contamination at 11 of the 12 sites, and continue to monitor groundwater at eight of the 12 sites according to plans approved by the KDHE. Regulatory closure has been achieved at three of the sites, subject to any future regulatory remediation requirements that may require additional costs. During 2016, we completed a site assessment at the twelfth site where no active soil remediation has occurred. We have submitted a work plan to the KDHE for approval to remove contaminated soil at this site. Costs associated with the remediation at this site are not expected to be material to our results of operations or financial position.
With regard to one of our other former manufactured natural gas sites, recent results from periodic monitoring and a 2016 interim site investigation indicated elevated levels of potentially harmful materials at the site. In response to the results of the interim site investigation, during the fourth quarter of 2016, potential investigation and remediation alternatives were developed. We have estimated the potential costs associated with additional investigation and remediation to be in the range of $4.0 million to $7.0 million. Additional testing and work plan development will be conducted in 2017 to determine a remediation work plan to present to the KDHE for approval and could impact our estimates of the cost of remediation at this
76
site. A single reliable estimate of the remediation costs is not feasible due to the amount of uncertainty in the ultimate remediation approach that will be utilized. Accordingly, in the fourth quarter of 2016, we recorded a reserve of $4.0 million for this site.
Our expenditures for environmental evaluation, mitigation, remediation and compliance to date have not been significant in relation to our financial position, results of operations or cash flows, and our expenditures related to environmental matters had no material effects on earnings or cash flows during 2016, 2015 and 2014. A number of environmental issues may exist with respect to manufactured gas plants that are unknown to us. Accordingly, future costs are dependent on the final determination and regulatory approval of any remedial actions, the complexity of the site, level of remediation required, changing technology and governmental regulations, and to the extent not recovered by insurance or recoverable in rates from our customers, could be material to our financial condition, results of operations or cash flows.
With the trend toward stricter standards, greater regulation and more extensive permit requirements for the types of assets operated by us that are subject to environmental regulation, our environmental expenditures could increase in the future, and such expenditures may not be fully recovered by insurance or recoverable in rates from our customers, and those costs may adversely affect our financial condition, results of operations and cash flows. We do not expect expenditures for these matters to have a material adverse effect on our financial condition, results of operations or cash flows.
Pipeline Safety - We are subject to PHMSA regulations, including integrity-management regulations. PHMSA regulations require pipeline companies operating high-pressure transmission pipelines to perform integrity assessments on pipeline segments that pass through densely populated areas or near specifically designated high-consequence areas. In January 2012, the Pipeline Safety, Regulatory Certainty and Job Creation Act was signed into law. The law increased maximum penalties for violating federal pipeline safety regulations and directs the DOT and the Secretary of Transportation to conduct further review or studies on issues that may or may not be material to us. These issues include, but are not limited to, the following:
• | an evaluation of whether natural gas pipeline integrity-management requirements should be expanded beyond current high-consequence areas; |
• | a verification of records for pipelines in class 3 and 4 locations and high-consequence areas to confirm maximum allowable operating pressures; and |
• | a requirement to test previously untested pipelines operating above 30 percent yield strength in high-consequence areas. |
In April 2016, PHMSA published a NPRM, the Safety of Gas Transmission & Gathering Lines Rule, in the Federal Register to revise pipeline safety regulations applicable to the safety of onshore natural gas transmission and gathering pipelines. Proposals include changes to pipeline integrity management requirements and other safety-related requirements. The NPRM comment period ended July 7, 2016, and comments are under review by PHMSA. The potential capital and operating expenditures associated with the NPRM are currently being evaluated and could be significant depending on the final regulations.
Legal Proceedings - We are a party to various litigation matters and claims that have arisen in the normal course of our operations. While the results of litigation and claims cannot be predicted with certainty, we believe the reasonably possible losses from such matters, individually and in the aggregate, are not material. Additionally, we believe the probable final outcome of such matters will not have a material adverse effect on our results of operations, financial position or cash flows.
77
14. | QUARTERLY FINANCIAL DATA (UNAUDITED) |
First Quarter | Second Quarter | Third Quarter | Fourth Quarter | |||||||||||||
Year Ended December 31, 2016 | ||||||||||||||||
(Thousands of dollars) | ||||||||||||||||
Revenues | $ | 508,364 | $ | 245,923 | $ | 232,191 | $ | 440,754 | ||||||||
Operating income | $ | 116,073 | $ | 43,621 | $ | 30,892 | $ | 78,534 | ||||||||
Net income | $ | 64,743 | $ | 20,300 | $ | 12,737 | $ | 42,315 | ||||||||
Earnings per share | ||||||||||||||||
Basic | $ | 1.23 | $ | 0.39 | $ | 0.24 | $ | 0.81 | ||||||||
Diluted | $ | 1.22 | $ | 0.38 | $ | 0.24 | $ | 0.80 | ||||||||
First Quarter | Second Quarter | Third Quarter | Fourth Quarter | |||||||||||||
Year Ended December 31, 2015 | ||||||||||||||||
(Thousands of dollars) | ||||||||||||||||
Revenues | $ | 676,531 | $ | 256,786 | $ | 225,226 | $ | 389,149 | ||||||||
Operating income | $ | 109,005 | $ | 31,270 | $ | 24,951 | $ | 73,903 | ||||||||
Net income | $ | 60,381 | $ | 12,076 | $ | 7,371 | $ | 39,202 | ||||||||
Earnings per share | ||||||||||||||||
Basic | $ | 1.15 | $ | 0.23 | $ | 0.14 | $ | 0.75 | ||||||||
Diluted | $ | 1.13 | $ | 0.23 | $ | 0.14 | $ | 0.74 | ||||||||
78
ITEM 9. | CHANGES IN AND DISAGREEMENTS WITH ACCOUNTANTS ON ACCOUNTING AND FINANCIAL DISCLOSURE |
None.
ITEM 9A. CONTROLS AND PROCEDURES
Evaluation of Disclosure Controls and Procedures
Our Chief Executive Officer (Principal Executive Officer) and Chief Financial Officer (Principal Financial Officer) have concluded that our disclosure controls and procedures were effective as of the end of the period covered by this report based on the evaluation of the controls and procedures required by Rule 13a-15(b) of the Exchange Act.
Management’s Report on Internal Control Over Financial Reporting
Our management is responsible for establishing and maintaining adequate internal control over financial reporting, as such term is defined in Exchange Act Rule 13a-15(f). Under the supervision and with the participation of our management, including our Principal Executive Officer and Principal Financial Officer, we evaluated the effectiveness of our internal control over financial reporting based on the framework in Internal Control-Integrated Framework (2013) issued by the Committee of Sponsoring Organizations of the Treadway Commission. Because of inherent limitations, internal control over financial reporting may not prevent or detect misstatements. Also, projections of any evaluation of effectiveness to future periods are subject to the risk that controls may become inadequate because of changes in conditions, or that the degree of compliance with the policies or procedures may deteriorate. Based on our evaluation under that framework and applicable SEC rules, our management concluded that our internal control over financial reporting was effective as of December 31, 2016.
The effectiveness of our internal control over financial reporting as of December 31, 2016, has been audited by PricewaterhouseCoopers LLP, an independent registered public accounting firm, as stated in their reports which are included herein (Item 8).
Changes in Internal Control Over Financial Reporting
There have been no changes in our internal control over financial reporting during the quarter ended December 31, 2016, that have materially affected, or are reasonably likely to materially affect, our internal control over financial reporting.
ITEM 9B. OTHER INFORMATION
Not applicable.
PART III.
ITEM 10. DIRECTORS, EXECUTIVE OFFICERS AND CORPORATE GOVERNANCE
Directors of the Registrant
Information concerning our directors is set forth in our 2017 definitive Proxy Statement and is incorporated herein by this reference.
Executive Officers of the Registrant
Information concerning our executive officers is included in Part I, Item 1, Business, of this Annual Report.
Compliance with Section 16(a) of the Exchange Act
Information on compliance with Section 16(a) of the Exchange Act is set forth in our 2017 definitive Proxy Statement and is incorporated herein by this reference.
79
Code of Ethics
Information concerning the code of ethics, or code of business conduct, is set forth in our 2017 definitive Proxy Statement and is incorporated herein by this reference.
Nominating Procedures
Information concerning the nominating procedures is set forth in our 2017 definitive Proxy Statement and is incorporated herein by this reference.
The Audit Committee
Information concerning the Audit Committee is set forth in our 2017 definitive Proxy Statement and is incorporated herein by this reference.
The Audit Committee Financial Experts
Information concerning the Audit Committee Financial Experts is set forth in our 2017 definitive Proxy Statement and is incorporated herein by this reference.
The Executive Compensation Committee
Information concerning the Executive Compensation Committee is set forth in our 2017 definitive Proxy Statement and is incorporated herein by this reference.
The Corporate Governance Committee
Information concerning the Corporate Governance Committee is set forth in our 2017 definitive Proxy Statement and is incorporated herein by this reference.
The Executive Committee
Information concerning the Executive Committee is set forth in our 2017 definitive Proxy Statement and is incorporated herein by this reference.
Committee Charters
The full text of our Audit Committee charter, Executive Compensation Committee charter, Corporate Governance Committee charter and Executive Committee charter are published on and may be printed from our website at www.onegas.com and are also available from our corporate secretary upon request.
ITEM 11. EXECUTIVE COMPENSATION
Information on executive compensation is set forth in our 2017 definitive Proxy Statement and is incorporated herein by this reference.
ITEM 12. | SECURITY OWNERSHIP OF CERTAIN BENEFICIAL OWNERS AND MANAGEMENT AND RELATED STOCKHOLDER MATTERS |
Security Ownership of Certain Beneficial Owners
Information concerning the ownership of certain beneficial owners is set forth in our 2017 definitive Proxy Statement and is incorporated herein by this reference.
Security Ownership of Management
Information on security ownership of directors and officers is set forth in our 2017 definitive Proxy Statement and is incorporated herein by this reference.
80
Equity Compensation Plan Information
The following table sets forth certain information concerning our equity compensation plans as of December 31, 2016:
Number of Securities Issued Upon Exercise of Outstanding Options, Warrants and Rights | Weighted-Average Exercise Price of Outstanding Options, Warrants and Rights | Number of Securities Remaining Available For Future Issuance Under Equity Compensation Plans (Excluding Securities in Column (a)) | |||||||||
Plan Category | (a) | (b) | (c) | ||||||||
Equity compensation plans approved by security holders (1) | — | $ | — | (3 | ) | 1,893,453 | |||||
Equity compensation plans not approved by security holders (2) | — | $ | — | 478,416 | |||||||
Total | — | $ | — | 2,371,869 | |||||||
(1) Includes restricted stock incentive units and performance-unit awards granted under our Equity Compensation Plan and our Nonqualified Deferred Compensation Plan for Nonemployee Directors. For a brief description of the material features of this plan, see Note 10 of the Notes to Financial Statements in this Annual Report.
(2) Includes shares granted under our Employee Stock Purchase Plan and Employee Stock Award Program. For a brief description of the material features of these plans, see Note 10 of the Notes to Financial Statements in this Annual Report. Column (c) includes 462,813 and 15,603 shares available for future issuance under our Employee Stock Purchase Plan and Employee Stock Award Program, respectively.
(3) Compensation deferred into our common stock under our Employee Non-Qualified Deferred Compensation Plan and Deferred Compensation Plan for Nonemployee Directors is distributed to participants at fair market value on the date of distribution. The price used for these plans to calculate the weighted-average exercise price in the table is $63.96, which represents the year-end closing price of our common stock on the NYSE.
ITEM 13. | CERTAIN RELATIONSHIPS AND RELATED TRANSACTIONS, AND DIRECTOR INDEPENDENCE |
Information on certain relationships and related transactions and director independence is set forth in our 2017 definitive Proxy Statement and is incorporated herein by this reference.
ITEM 14. | PRINCIPAL ACCOUNTING FEES AND SERVICES |
Information on the principal accountant’s fees and services is set forth in our 2017 definitive Proxy Statement and is incorporated herein by this reference.
81
PART IV.
ITEM 15. EXHIBITS, FINANCIAL STATEMENT SCHEDULES
(1) Financial Statements | Page No. | ||
(a) | Report of Independent Registered Public Accounting Firm | 45 | |
(b) | Statements of Income for the years ended December 31, 2016, 2015 and 2014 | 46 | |
(c) | Statements of Comprehensive Income for the years ended December 31, 2016, 2015 and 2014 | 47 | |
(d) | Balance Sheets as of December 31, 2016 and 2015 | 48-49 | |
(e) | Statements of Cash Flows for the years ended December 31, 2016, 2015 and 2014 | 51 | |
(f) | Statements of Equity for the years ended December 31, 2016, 2015 and 2014 | 52-53 | |
(g) | Notes to Financial Statements | 54-78 | |
(2) Financial Statements Schedules | |||
All schedules have been omitted because of the absence of conditions under which they are required. | |||
(3) Exhibits | ||
2.1 | Separation and Distribution Agreement, dated as of January 14, 2014, by and between ONE Gas, Inc. and ONEOK, Inc. (incorporated by reference to Exhibit 2.1 to ONE Gas, Inc.’s Current Report on Form 8-K filed on January 15, 2014 (File No. 1-36108)). | |
3.1 | Amended and Restated Certificate of Incorporation of ONE Gas, Inc., dated January 31, 2014 (incorporated by reference to Exhibit 4.5 to ONE Gas, Inc.’s Registration Statement on Form S-8 filed on January 31, 2014 (File No. 333-193690)). | |
3.2 | Amended and Restated By-Laws of ONE Gas, Inc. (incorporated by reference to Exhibit 3.1 to ONE Gas, Inc.’s Current Report on Form 8-K/A, Amendment No. 1 filed on July 26, 2016 (File No. 1-36108)). | |
4.1 | Form of Common Stock Certificate (incorporated by reference to Exhibit 4.2 to ONE Gas, Inc.’s Registration Statement on Form 10, Amendment No. 2 filed on December 23, 2013 (File No. 1-36108)). | |
4.2 | Indenture, dated January 27, 2014, between ONE Gas, Inc. and U.S. Bank National Association, as trustee (incorporated by reference to Exhibit 10.1 to ONE Gas, Inc.’s Current Report on Form 8-K filed on January 30, 2014 (File No. 1-36108)). | |
4.3 | Supplemental Indenture No. 1, dated January 27, 2014, between ONE Gas, Inc. and U.S. Bank National Association, as trustee (incorporated by reference to Exhibit 10.2 to ONE Gas, Inc.’s Current Report on Form 8-K filed on January 30, 2014 (File No. 1-36108)). | |
82
10.1 | Tax Matters Agreement, dated January 14, 2014, by and between ONE Gas, Inc. and ONEOK, Inc. (incorporated by reference to Exhibit 10.1 to ONE Gas, Inc.’s Current Report on Form 8-K filed on January 15, 2014 (File No. 1-36108)). | |
10.2 | Transition Services Agreement, dated January 14, 2014, by and between ONE Gas, Inc. and ONEOK, Inc. (incorporated by reference to Exhibit 10.2 to ONE Gas, Inc.’s Current Report on Form 8-K filed on January 15, 2014 (File No. 1-36108)). | |
10.3 | Employee Matters Agreement, dated January 14, 2014, by and between ONE Gas, Inc. and ONEOK, Inc. (incorporated by reference to Exhibit 10.3 to ONE Gas, Inc.’s Current Report on Form 8-K filed on January 15, 2014 (File No. 1-36108)). | |
10.4 | Form of ONE Gas, Inc. Indemnification Agreement between ONE Gas, Inc. and ONE Gas, Inc. officers and directors (incorporated by reference to Exhibit 10.5 to ONE Gas, Inc.’s Registration Statement on Form 10 filed on October 1, 2013 (File No. 1-36108)). | |
10.5 | ONE Gas, Inc. Annual Officer Incentive Plan. | |
10.6 | ONE Gas, Inc. Pre-2005 Nonqualified Deferred Compensation Plan (incorporated by reference to Exhibit 10.7 to ONE Gas, Inc.’s Registration Statement on Form 10, Amendment No. 2 filed on December 23, 2013 (File No. 1-36108)). | |
10.7 | ONE Gas, Inc. Employee Nonqualified Deferred Compensation Plan (incorporated by reference to Exhibit 10.8 to ONE Gas, Inc.’s Registration Statement on Form 10, Amendment No. 2 filed on December 23, 2013 (File No. 1-36108)). | |
10.8 | ONE Gas, Inc. Pre-2005 Supplemental Executive Retirement Plan (incorporated by reference to Exhibit 10.9 to ONE Gas, Inc.’s Registration Statement on Form 10, Amendment No. 2 filed on December 23, 2013 (File No. 1-36108)). | |
10.9 | ONE Gas, Inc. Supplemental Executive Retirement Plan (incorporated by reference to Exhibit 10.10 to ONE Gas, Inc.’s Registration Statement on Form 10, Amendment No. 2 filed on December 23, 2013 (File No. 1-36108)). | |
10.10 | Credit Agreement, dated as of December 20, 2013, among ONE Gas, Inc., Bank of America, N.A., as administrative agent, swingline lender and a letter of credit issuer, and the other lenders and letter of credit issuers parties thereto (incorporated by reference to Exhibit 10.2 to ONEOK, Inc.’s Current Report on Form 8-K filed on December 23, 2013 (File No. 1-13643)). | |
10.11 | ONE Gas, Inc. Officer Change in Control Severance Plan (incorporated by reference to Exhibit 10.12 to ONE Gas, Inc.’s Registration Statement filed on Form 10, Amendment No. 2 filed on December 23, 2013 (File No. 1-36108)). | |
10.12 | ONE Gas, Inc. Equity Compensation Plan (incorporated by reference to Exhibit 10.13 to ONE Gas, Inc.’s Registration Statement on Form 10, Amendment No. 2 filed on December 23, 2013 (File No. 1-36108)). | |
10.13 | Form of 2014 Restricted Unit Award Agreement (incorporated by reference to Exhibit 10.13 to ONE Gas, Inc.’s Annual Report on Form 10-K filed on February 25, 2014 (File No. 1-36108)). | |
10.14 | Form of 2014 Performance Unit Award Agreement (incorporated by reference to Exhibit 10.14 to ONE Gas, Inc.’s Annual Report on Form 10-K filed on February 25, 2014 (File No. 1-36108)). | |
10.15 | Form of 2017 Restricted Unit Award Agreement. | |
83
10.16 | Form of 2017 Performance Unit Award Agreement. | |
10.17 | ONE Gas, Inc. Equity Compensation Plan (incorporated by reference to Appendix A to ONE Gas, Inc.’s Definitive Proxy Statement on Schedule 14A filed on April 1, 2015 (File No. 1-36108)). | |
10.18 | ONE Gas, Inc. Employee Stock Purchase Plan (incorporated by reference to Exhibit 10.16 to ONE Gas, Inc.’s Registration Statement on Form 10, Amendment No. 2 filed on December 23, 2013 (File No. 1-36108)). | |
10.19 | ONE Gas, Inc. Deferred Compensation Plan for Non-Employee Directors. | |
10.20 | ONE Gas, Inc. 401(k) Plan of ONE Gas Employees and Former ONE Gas Employees effective as of January 1, 2014 (incorporated by reference to Exhibit 4.4 to ONE Gas, Inc.’s Registration Statement on Form S-8 filed on January 31, 2014 (File No. 333-193690)). | |
10.21 | Form of Commercial Paper Dealer Agreement (incorporated by reference to Exhibit 10.1 to ONE Gas, Inc.’s Current Report on Form 8-K filed on September 10, 2014 (File No. 1-36108)). | |
10.22 | Form of 2015 Performance Unit Award Agreement (incorporated by reference to Exhibit 10.2 to ONE Gas, Inc.’s Quarterly Report on Form 10-Q filed on April 30, 2015 (File 1-36108)). | |
10.23 | Form of 2015 Restricted Unit Award Agreement (incorporated by reference to Exhibit 10.3 to ONE Gas, Inc.’s Quarterly Report on Form 10-Q filed on April 30, 2015 (File 1-36108)). | |
10.24 | Form of 2016 Performance Unit Award Agreement (incorporated by reference to Exhibit 10.24 to ONE Gas, Inc.’s Annual Report on Form 10-K filed on February 18, 2016 (File No. 1-36108)). | |
10.25 | Form of 2016 Restricted Unit Award Agreement (incorporated by reference to Exhibit 10.25 to ONE Gas, Inc.’s Annual Report on Form 10-K filed on February 18, 2016 (File No. 1-36108)). | |
12.1 | Computation of Ratio of Earnings to Fixed Charges for the years ended December 31, 2016, 2015, 2014, 2013 and 2012. | |
21.1 | Subsidiaries of ONE Gas, Inc. | |
23.1 | Consent of Independent Registered Public Accounting Firm - PricewaterhouseCoopers LLP. | |
31.1 | Certification of Pierce H. Norton II pursuant to Section 302 of the Sarbanes-Oxley Act of 2002. | |
31.2 | Certification of Curtis L. Dinan pursuant to Section 302 of the Sarbanes-Oxley Act of 2002. | |
32.1 | Certification of Pierce H. Norton II pursuant to 18 U.S.C. Section 1350 as adopted pursuant to Section 906 of the Sarbanes-Oxley Act of 2002 (furnished only pursuant to Rule 13a-14(b)). | |
32.2 | Certification of Curtis L. Dinan pursuant to 18 U.S.C. Section 1350 as adopted pursuant to Section 906 of the Sarbanes-Oxley Act of 2002 (furnished only pursuant to Rule 13a-14(b)). | |
84
101.INS | XBRL Instance Document. | |
101.SCH | XBRL Schema Document. | |
101.CAL | XBRL Calculation Linkbase Document. | |
101.LAB | XBRL Label Linkbase Document. | |
101. PRE | XBRL Presentation Linkbase Document. | |
101.DEF | XBRL Extension Definition Linkbase Document. | |
Attached as Exhibit 101 to this Annual Report are the following XBRL-related documents: (i) Document and Entity Information; (ii) Statements of Income for the years ended December 31, 2016, 2015 and 2014; (iii) Statements of Comprehensive Income for the years ended December 31, 2016, 2015 and 2014; (iv) Balance Sheets as of December 31, 2016 and 2015; (v) Statements of Cash Flows for the years ended December 31, 2016, 2015 and 2014; (vi) Statements of Equity for the years ended December 31, 2016, 2015 and 2014; and (vii) Notes to Financial Statements.
We also make available on our website the Interactive Data Files submitted as Exhibit 101 to this Annual Report.
ITEM 16. FORM 10-K SUMMARY
None.
85
Signatures
Pursuant to the requirements of Section 13 or 15(d) of the Exchange Act, the registrant has duly caused this report to be signed on its behalf by the undersigned, thereunto duly authorized.
Date: February 23, 2017 | ONE Gas, Inc. | |
Registrant | ||
By: | /s/ Curtis L. Dinan | |
Curtis L. Dinan | ||
Senior Vice President, | ||
Chief Financial Officer and Treasurer | ||
Pursuant to the requirements of the Exchange Act, this report has been signed below by the following persons on behalf of the registrant and in the capacities indicated on this 23rd day of February 2017.
/s/ John W. Gibson | /s/ Pierce H. Norton II | ||
John W. Gibson | Pierce H. Norton II | ||
Chairman of the Board | President, Chief Executive Officer and | ||
Director | |||
/s/ Curtis L. Dinan | /s/ Robert B. Evans | ||
Curtis L. Dinan | Robert B. Evans | ||
Senior Vice President, | Director | ||
Chief Financial Officer and Treasurer | |||
(Principal Accounting Officer) | |||
/s/ Michael G. Hutchinson | /s/ Pattye L. Moore | ||
Michael G. Hutchinson | Pattye L. Moore | ||
Director | Director | ||
/s/ Eduardo A. Rodriguez | /s/ Douglas H. Yaeger | ||
Eduardo A. Rodriguez | Douglas H. Yaeger | ||
Director | Director | ||
86