Attached files
| file | filename |
|---|---|
| EX-99.1 - EXHIBIT 99.1 - Lipocine Inc. | tm201752d1_ex99-1.htm |
| 8-K - FORM 8-K - Lipocine Inc. | tm201752d1_8k.htm |

Enabling Oral Drug Delivery to Improve Patient Compliance LPCN 1144 for Pre - Cirrhotic NASH Exhibit 99.2
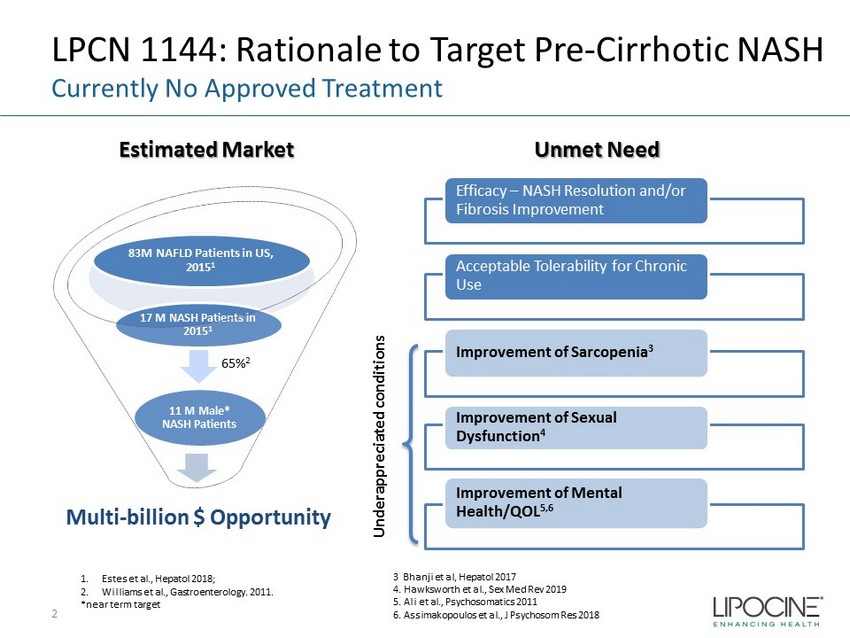
LPCN 1144: Rationale to Target Pre - Cirrhotic NASH 2 1. Estes et al., Hepatol 2018; 2. Williams et al., Gastroenterology. 2011. *near term target Multi - billion $ Opportunity 11 M Male* NASH Patients 17 M NASH Patients in 2015 1 83M NAFLD Patients in US, 2015 1 Underappreciated conditions Unmet Need Estimated Market Currently No Approved Treatment 3 Bhanji et al, Hepatol 2017 4. Hawksworth et al., Sex Med Rev 2019 5. Ali et al., Psychosomatics 2011 6. Assimakopoulos et al., J Psychosom Res 2018 65% 2 Efficacy – NASH Resolution and/or Fibrosis Improvement Acceptable Tolerability for Chronic Use Improvement of Sarcopenia 3 Improvement of Sexual Dysfunction 4 Improvement of Mental Health/QOL 5,6

LPCN 1144: Oral Testosterone Therapy Differentiated NASH Treatment Candidate Targets Unmet Need Mechanistic Evidence Clinical Experience • Efficacy – NASH resolution and/or fibrosis improvement • Acceptable tolerability for chronic use • Improvement of sarcopenia • Improvement of sexual dysfunction • Improvement of mental health • Anti - steatosis • Anti - inflammatory • Anti - oxidative • Cell regenerative • Meaningfully reduced liver fat • Well tolerated in 700+ subjects with up to 52 - week exposure • Improved sexual and mood dysfunction 3

Association Between T and Liver Disease Preclinical Evidence Mouse Model* Method ▪ Testicular - feminized Disease ▪ Hepatic Steatosis ▪ Liver Disease Induction Causes Lower T 4 Induction Method Model T Levels Gene - modified & Diet ob / ob (Obese Mouse) 1 ↓ T db / db (Diabetic Mouse) 2 ↓ T Chemical &/or Diet TAA (Mouse/Rat) 3 ↓ T CCL 4 (Rat/Mouse) 4 ↓ T Diet High Fat Diet (Rabbit) 5 ↓ T 1. Swerdloff et al., Endocrinol 1976 2. Yabiku et al., BMC Endocr Disord 2018 3. Lipocine TAA rat model study 2019 4. Elsawy et al., PeerJ 2019 5. Vignozzi et al., Mol Cell Endocrinol 2014 ▪ Low T Induces Liver Disease * Kelly et al., Life Sci 2014 4

5 Association Between T and Liver Disease Clinical Evidence 1. Sarkar et al., Gastroenterology 156(6):S - 1258 & Poster Sa1623, Digestive Disease Week 2019 2. Sumida et al., Gastroenterol Hepatol 2015 • Levels of free T decreased significantly with the increased incidence of lobular inflammation, hepatocyte ballooning, NAFLD activity score, and fibrosis 2. Free T (ng/dL) Free T (ng/dL) Fibrosis • Reportedly 75% of Biopsy - Confirmed NASH Male Patients Have Low T (< 372 ng/dL) 1

LPCN 1144 Proposed Mechanism 6 Across the Full Spectrum of NASH Pathogenesis Healthy Liver Steatosis Inflammation NASH Fibrosis LPCN 1144 Regeneration Booster 3 ▪ Obesity ▪ Insulin Resistance ▪ Dyslipidemia ▪ Metabolic Syndrome ▪ Hypogonadism (Low T) The removal of pro - fibrotic inputs or the strengthening of anti - fibrotic inputs is expected to stimulate scar resolution 4 Oxidative Stress 1. Bianchi VE, J Endoc Soc 2019; 2. Vignozzi et al., unpublished clinical data 2018; 3. Vic et al., Hepatol 1982; 4. Lucía Cordero - Espinoza and Meritxell Huch , J Clin Invest 2018 Comorbidities

Potential of Testosterone Therapy in NAFLD Preclinical Model Results 7 1. Kelly et al., Lif Sci 2014; 2. Nikolaenko et al., BMC Endocrinol 2014; 3. Cai et al., BMC Genomics 2015 Model Mouse Model 1 Rat Model 2 Pig Model 3 Methods ▪ Testicular - feminized + High cholesterol diet ▪ Castrated + High fat diet ▪ Castrated + High fat and cholesterol diet Disease ▪ Hepatic Steatosis ▪ NAFLD ▪ Hepatic steatosis, inflammation, elevated ALT T Therapy Effect ▪ Hepatic lipid deposition ▪ Lipogenesis ▪ Hepatic steatosis ▪ Hepatic apoptosis ▪ Vesicular inflammation ▪ Hepatic lipids ▪ Liver injury ▪ Hepatic steatosis

Potential of Testosterone Therapy Results from high fat diet (HFD) induced rabbit model* Giemsa – PAS Staining Red Oil Staining Masson’s Trichrome Staining TRT ↓ fibrosis TRT ↓ steatosis TRT ↓ inflammation RD HFD HFD +T * Vignozzi et al., Mol Cell Endocrinol 2014 8 T: Testosterone; OCA: Obeticholic Acid Effects on Liver Histology Effects on TNF - α (Inflammatory/Fibrosis Marker)

T Therapy Effects in Liver Regeneration Results from Hepatectomized Rat Model* 9 *90% hepatectomized, Vic et al., Hepatol 1982 40% recovery 60% recovery Total liver mass recovery completed Day 3 Day 4 Day 15 Testosterone Pretreatment Day 0 Day - 30 Testosterone Hepatectomy No Treatment Group 1 (n=50) T Treatment Group 2 (n=50) 100% died within 40 hours 80% survived beyond 40 hours Liver Mass Recovery (50% had a normal life span)

- 42% - 40% -60% -50% -40% -30% -20% -10% 0% Mean BL LF = 18.3% Mean BL LF = 20.5% BL ≥ 8% BL ≥ 10% Relative % Change of Liver Fat % Mean Relative* Liver Fat % Change LPCN 1144: Liver Fat Imaging Study (“LFS”) Results Meaningful Relative Liver Fat % Change and Responder Rate 10 LFS was an open - label, multi - center single - arm 16 - week study (N=36) with LPCN 1144 in hypogonadal males (NCT03868059) LF = liver fat * Mean relative changes of liver fat % were obtained in subjects with BL liver fat ≥ 8% (n=10) and BL ≥ 10% (n=8). ** Responder rate for relative change is % of patients with at least 30% for relative reduction of liver fat % from baseline. 80% 75% 0% 10% 20% 30% 40% 50% 60% 70% 80% 90% 100% Mean BL LF = 18.3% Mean BL LF = 20.5% BL ≥ 8% BL ≥ 10% % of Responders Responder Rate** for Liver Fat % Change

■ NAFL Free (LF < 5%) ■ NAFL (LF ≥ 5%) 11 NAFLD Free NAFLD Free NAFLD Free NAFLD Free NAFLD Free NAFLD Free 52% 48% Interim (Week 8, N=31) NAFL Free NAFL 63% 38% End of Study (Week 16, N=32) NAFL Free NAFL 34% 66% Baseline (N=32) NAFL Free NAFL LPCN 1144: Longitudinal Treatment Effect Improved NAFL Resolution Over Time NAFL is non - alcoholic fatty liver

LPCN 1144: Resolution of Liver Injury Markers Significant Normalization of Elevated Liver Enzymes* 12 52% 50% 67% 31% 0% 10% 20% 30% 40% 50% 60% 70% ALT AST ALP GGT % of Patients Normalized at EOS N 42 4 6 36 BL 53.6 U/L 59.8 U/L 125.3 U/L 82.2 U/L *1 - Yr SOAR Study (NCT02081300)
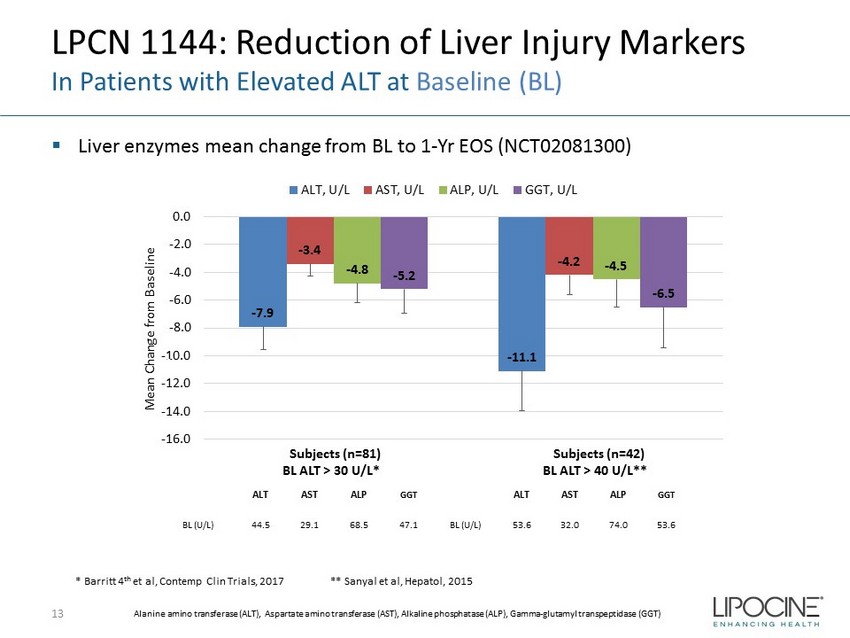
- 7.9 - 11.1 - 3.4 - 4.2 - 4.8 - 4.5 - 5.2 - 6.5 -16.0 -14.0 -12.0 -10.0 -8.0 -6.0 -4.0 -2.0 0.0 1 2 Mean Change from Baseline ALT, U/L AST, U/L ALP, U/L GGT, U/L LPCN 1144: Reduction of Liver Injury Markers In Patients with Elevated ALT at Baseline (BL) ▪ Liver enzymes mean change from BL to 1 - Yr EOS ( NCT02081300 ) 13 * Barritt 4 th et al, Contemp Clin Trials, 2017 ** Sanyal et al, Hepatol , 2015 x2 x2 x5 Alanine amino transferase (ALT), Aspartate amino transferase (AST), Alkaline phosphatase (ALP), Gamma - glutamyl transpeptidase (GGT) Subjects (n=81) BL ALT > 30 U/L* Subjects (n=42) BL ALT > 40 U/L** ALT AST ALP GGT ALT AST ALP GGT BL (U/L) 44.5 29.1 68.5 47.1 BL (U/L) 53.6 32.0 74.0 53.6

LPCN 1144: Effects on Serum Lipid Markers In Patients with Elevated Lipids at Baseline (BL) 14 • TG(triglyceride), LDL, Cholesterol, HDL upper normal limit (UNL) is 200 mg/dL, 160 mg/dL, 200 mg/dL, and 60 mg/dL, respective ly. • 1 - Yr SOAR Study (NCT02081300) - 17 - 64 -100 -80 -60 -40 -20 0 BL = 192 mg/dL BL = 320 mg/dL n = 207 n = 73 All subjects BL > ULN Mean TG CBL (mg/dL) TG Change from Baseline - 10 - 19 -25 -20 -15 -10 -5 0 BL = 198 mg/dL BL = 231 mg/dL n = 207 n = 92 All subjects BL > ULN Mean Cholesterol CBL (mg/dL) Cholesterol Change from Baseline - 3 - 15 -25 -20 -15 -10 -5 0 BL = 114 mg/dL BL = 175 mg/dL n = 194 n = 16 All subjects BL > ULN Mean LDL CBL (mg/dL) LDL Change from Baseline - 5.3 - 14.5 -20 -15 -10 -5 0 BL = 48.6 mg/dL BL = 70.8 mg/dL n = 207 n = 34 All subjects BL > ULN Mean HDL CBL (mg/dL) HDL Change from Baseline

LPCN 1144: LiFT Study * Ongoing Liver Fat Intervention with Oral Testosterone Study 15 Phase 2 paired - biopsy clinical study in NASH subjects (NCT04134091) □ Study Design ▪ Three - arm (1:1:1 randomization, two treatments and placebo), multi - center, double - blind ▪ 225mg twice daily (450mg Daily) ▪ 20 - 25 biopsy confirmed NASH male subjects per arm with NAS ≥ 4 ▪ Treatment duration of 36 weeks □ Primary Endpoint ▪ Change in hepatic fat fraction via MRI - PDFF measure □ Secondary Endpoints ▪ Change in NASH activity and fibrosis via liver biopsy scoring ▪ Change in liver enzymes, anthropometric measure, lipids, insulin resistance, inflammatory/fibrosis markers, and labs ▪ Change in quality - of - life degree (SF - 36 and PDQ), weight, BMI, waist circumference, waist to hip ratio, and PAQ activity * Website: www.lift - study.com 24 Weeks 12 Weeks SCREENING TREATMENT: 36 WEEKS Topline MRI - PDFF Results ~Mid 2020 Dose Start Topline Biopsy Results 4Q 2020/1Q 2021 MRI - PDFF Biopsy

Appendix 16

LPCN 1144: Multi - dimensional Mechanism of Action Across the Full Spectrum of NASH Pathogenesis 17 Homeostasis Modifier 1, 2 • Alter lipid, cholesterol, and glucose metabolism • Reduce visceral abdominal fat • Modify activity of hepatic lipase, and skeletal muscle/ adipose lipoprotein lipase Anti - inflammatory 2 / Antioxidant/Immuno - modulator 3 • Restore mitochondrial turnover and normalizes oxygen consumption 4 Regeneration Booster 5,6 • Stimulate satellite cells and myocyte precursor resulting in cell differentiation and myocyte proliferation 7 • Increases circulating endothelial progenitor cells (“EPC”) 8 Anabolic/Androgenic Agent 9 • T induces muscle fiber hypertrophy by promoting myogenesis by inhibiting adipogenesis 10 . • Inhibit myostatin 11 • Increase free T (lowering SHBG) • Improve sexual dysfunction 12 1. Shen and Shi, Int J Endocrinol, 2015 2. Kelly and Jones, J Endocrinol, 2013 3. Sinclair et al., J Gastroenterol Hepatol , 2015 4. Linda Vignozzi et al., University of Florence, IT, unpublished, 2018 5. A. Francavilla et al., Digest Dis Sci, 1989 6. Vic et al., Hepatol 1982 7. Sinha - Hikim et al., J Clin Endocrinol Metab , 2004 8. Liao CH et al., Andrology, 2013 9. Gentile MA et al., J Mol Endocrine, 2010 10. Bhasin S., J Gerontol 2003 11. Dasarathy and Merli , J Hepatol . 2016 12. Rizk et al., Curr Opin Urol 2017

LPCN 1144: Clinical Tolerability Experience Oral Prodrug of Endogenous Testosterone 18 Adverse Reaction N=654 subjects Headache 1.50% Acne 0.90% Hematocrit Increased 1.20% Blood Pressure Increased 0.30% Fatigue 0.20% Hypertension 0.60% □ 654 subjects in multiple completed studies with up to 52 - week exposure ▪ No death, no drug - related SAEs, no major cardiovascular events, no hepato - toxic events were reported.

Sarcopenia is Associated with NAFLD/NASH 1 LPCN 1144 has Potential to Improve Sarcopenia 2,3 19 1. Bhanji et al., Hepatol 2017 2. Bhasin S., J Gerontol 2003 3. Sinclair et al., J Gastroenterol Hepatol 2016 x Sarcopenia endpoint(s) under evaluation in the ongoing LiFT trial 3

Sexual Dysfunction is Associated with NAFLD/NASH 1 LPCN 1144 has Potential to Improve Sexual Dysfunction 2 20 1. Hawksworth et al., Sex Med Rev 2019 2. Rizk et al., Curr Opin Urol 2017 3. SOAR Trial: SOAR Trial: subjects for ALT BL > 40 U/L (N=33) 3 x Sexual dysfunction endpoint(s) under evaluation in the ongoing LiFT trial

Depression is Prevalent in NAFLD Patients 1 LPCN 1144 has Potential to Improve Mental Health 2 21 3 1. Ali et al., Psychosomatics 2011 2. Celec et al., Front Neurosci 2015 3. SOAR Trial: subjects for ALT BL > 40 U/L (N=33) x Mental health endpoint(s) under evaluation in the ongoing LiFT trial
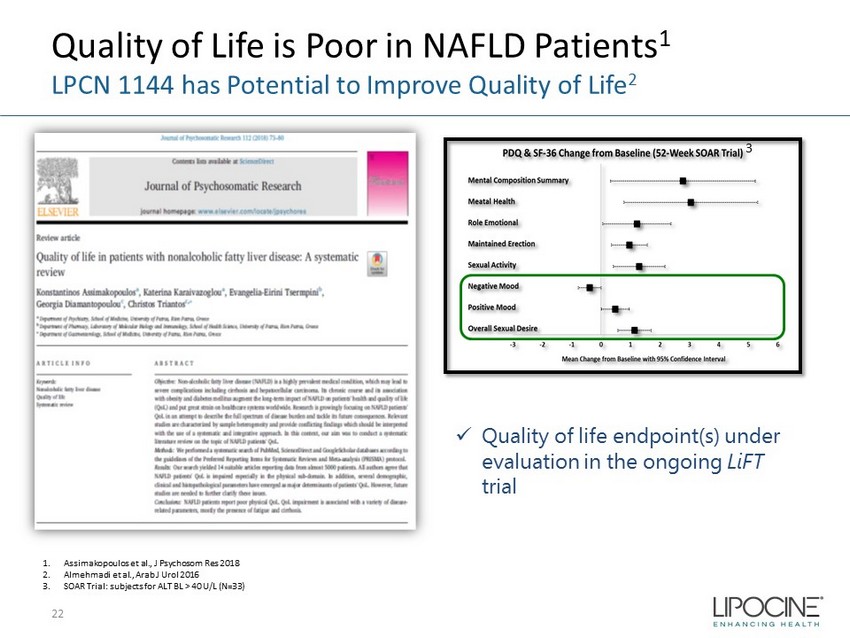
Quality of Life is Poor in NAFLD Patients 1 LPCN 1144 has Potential to Improve Quality of Life 2 22 1. Assimakopoulos et al., J Psychosom Res 2018 2. Almehmadi et al., Arab J Urol 2016 3. SOAR Trial: subjects for ALT BL > 40 U/L (N=33) 3 x Quality of life endpoint(s) under evaluation in the ongoing LiFT trial

LPCN 1144: Decreased Non - HDL Lipid Decrease in Non - HDL in 1 - Yr SOAR Trial (NCT02081300) 23 -14% -12% -10% -8% -6% -4% -2% 0% Overall OBS T2D HTN OBS/T2D MetS Non - HDL Mean Change from BL (%) n 207 116 45 98 24 18 Baseline, mg/dL 149 151 135 143 140 138 OBS: Obesity, T2D: Type 2 diabetes, HTN: Hypertension, MetS : Metabolic Syndrome