Attached files
| file | filename |
|---|---|
| EX-32.1 - CERTIFICATION - Cannis, Inc. | cann_ex321.htm |
| EX-31.2 - CERTIFICATION - Cannis, Inc. | cann_ex312.htm |
| EX-31.1 - CERTIFICATION - Cannis, Inc. | cann_ex311.htm |
| EX-21.1 - SUBSIDIARIES - Cannis, Inc. | cann_ex211.htm |
UNITED STATES
SECURITIES AND EXCHANGE COMMISSION
Washington, D.C. 20549
FORM 10-K
(Mark One)
x ANNUAL REPORT UNDER SECTION 13 OR 15(d) OF THE SECURITIES EXCHANGE ACT OF 1934
For the fiscal year ended: August 31, 2019
or
¨ TRANSITION REPORT UNDER SECTION 13 OR 15(d) OF THE SECURITIES EXCHANGE ACT OF 1934
For the transition period from ________ to ________
Commission File No. 333-214122
CANNIS, INC. |
(Exact name of registrant as specified in its charter) |
Nevada | 98-1322537 | |
(State or other jurisdiction of incorporation or formation) | (I.R.S. employer Identification No.) |
20, Jalan 51A/225A, Section 51A
Zone Perindustrian PTJC,
46100 Petaling Jaya, Selangor, Malaysia
(Address of principal executive offices) (Zip Code)
Registrant’s telephone number, including area code: +603 7865 3638
Securities registered pursuant to Section 12(b) of the Act:
None
Securities registered pursuant to Section 12(g) of the Act:
None
Indicate by check mark if the registrant is a well-known seasoned issuer, as defined in Rule 405 of the Securities Act. Yes ¨ No x
Indicate by check mark if the registrant is not required to file reports pursuant to Section 13 or Section 15(d) of the Act. Yes x No ¨
Indicate by check mark whether the registrant (1) has filed all reports required to be filed by Section 13 or 15(d) of the Exchange Act during the preceding 12 months (or for such shorter period that the registrant was required to file such reports), and (2) has been subject to such filing requirements for the past 90 days. Yes x No ¨
Indicate by check mark whether the registrant has submitted electronically every Interactive Data File required to be submitted pursuant to Rule 405 of Regulation S-T (§ 232.405 of this chapter) during the preceding 12 months (or for such shorter period that the registrant was required to submit such files). Yes ¨ No x
Indicate by check mark if disclosure of delinquent filers pursuant to Item 405 of Regulation S-K (§229.405 of this chapter) is not contained herein, and will not be contained, to the best of registrant’s knowledge, in definitive proxy or information statements incorporated by reference in Part III of this Form 10-K or any amendment to this Form 10-K. Yes ¨ No x
Indicate by check mark whether the registrant is a large accelerated filer, an accelerated filer, a non-accelerated filer, a smaller reporting company or an emerging growth company. See the definitions of “large accelerated filer,” “accelerated filer,” “non-accelerated filer,” “smaller reporting company” and “emerging growth company” in Rule 12b-2 of the Exchange Act.
Large accelerated filer | ¨ | Accelerated filer | ¨ |
Non-accelerated filer | x | Smaller reporting company | x |
Emerging growth company | ¨ |
If an emerging growth company, indicate by check mark if the registrant has elected not to use the extended transition period for complying with any new or revised financial accounting standards provided pursuant to Section 13(a) of the Exchange Act. ¨
Indicate by check mark whether the registrant is a shell company (as defined in Rule 12b-2 of the Exchange Act). Yes ¨ No x
As of the last business day of the Issuer’s most recently completed second fiscal quarter, March 31, 2019, the aggregate market value of the voting and non-voting common equity held by non-affiliates was nil due to the lack of a trading market.
As of December 16, 2019, there were 1,488,932,800 shares of Common Stock, $0.001 par value per share, outstanding.
DOCUMENTS INCORPORATED BY REFERENCE:
None
| 2 |
| Table of Contents |
FORWARD-LOOKING STATEMENTS
Certain statements made in this Annual Report on Form 10-K are “forward-looking statements” regarding the plans and objectives of management for future operations. Such statements involve known and unknown risks, uncertainties and other factors that may cause actual results, performance or achievements of the Registrant to be materially different from any future results, performance or achievements expressed or implied by such forward-looking statements. The forward-looking statements included herein are based on current expectations that involve numerous risks and uncertainties. The Registrant’s plans and objectives are based, in part, on assumptions involving the continued expansion of business. Assumptions relating to the foregoing involve judgments with respect to, among other things, future economic, competitive and market conditions and future business decisions, all of which are difficult or impossible to predict accurately and many of which are beyond the control of the Registrant. Although the Registrant believes its assumptions underlying the forward-looking statements are reasonable, any of the assumptions could prove inaccurate and, therefore, there can be no assurance the forward-looking statements included in this Report will prove to be accurate. In light of the significant uncertainties inherent in the forward-looking statements included herein, the inclusion of such information should not be regarded as a representation by the Registrant or any other person that the objectives and plans of the Registrant will be achieved.
USE OF DEFINED TERMS
Except where the context otherwise requires and for the purposes of this report only:
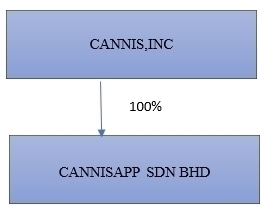
● | “we”, “us”, “our company”, “our” and “Company” refer to the combined business of Cannis, Inc., and its consolidated subsidiary; |
● | “Cannisapp” or “Subsidiary” refers to Cannisapp Sdn. Bhd., a Malaysia corporation and direct, wholly-owned subsidiary of the Company; |
● | “SEC” refers to the United States Securities and Exchange Commission; |
● | “Ringgit Malaysia”, “MYR”, and “RM” refer to the legal currency of Malaysia; |
● | “U.S. dollars”, “dollars” and “$” refer to the legal currency of the United States; |
● | “Securities Act” refers to the United States Securities Act of 1933, as amended; and |
● | “Exchange Act” refers to the United States Securities Exchange Act of 1934, as amended. |
Solely for the convenience of the reader, this report contains conversions of certain RM amounts into U.S. dollars at specified rates. No representation is made that the RM or U.S. dollar amounts referred to in this report could have been or could be converted into U.S. dollars or RM, as the case may be, at any particular rate or at all. See “Risk Factors—Risks Related to Our Business— Fluctuations in exchange rates could adversely affect our business and the value of our securities” for a discussion of the effects on the GMCI fluctuating exchange rates.
Background.
We were incorporated as Zartex, Inc. under the laws of the State of Nevada on August 17, 2016. We changed our name from Zartex, Inc. to Cannis, Inc. on December 6, 2018. The Company was in the business of software development which sought to deliver services for the garment distribution industry.
Effective November 14, 2018, a change of control occurred with respect to the Company. In connection with the change of control transaction, Mr. Eu Boon Ching acquired 6,335,000 shares of our common stock (or 99.9% of our issued and outstanding common stock) from former shareholders of the Company. In addition, the Company has ceased its operations, transferred its assets and became a “shell company” (as such term is defined in Rule 12b-2 under the Securities Exchange Act of 1934, as amended). Mr. Ching became our sole officer and director following the change of control.
| 3 |
| Table of Contents |
On April 24, 2019, the Company filed a Certificate of Amendment with the Nevada Secretary of State which;
(a). Increased the authorized shares of its common stock, $0.001 par value, from 75,000,000 to 1,500,000,000 shares, and
(b). Created a class of preferred stock, $0.001 par value, called the Class A Preferred Stock in the amount of 10,000,000 authorized shares, with each share of Class A Preferred Stock having 100 votes to be cast with respect to any and all matters presented to shareholders for a vote whether at a meeting of shareholders or by written consent. Apart from the voting rights stated in the preceding sentence, the Class A Preferred Stock has no other rights, privileges or preferences.
On August 5, 2019 (the “Closing Date”), we closed a share exchange under a Share Exchange Agreement (the “Stock Exchange Agreement”), with Cannisapp, and Mr. Ching, its sole stockholder, who, as mentioned above, is our majority shareholder and sole officer and director. Mr. Ching held 100% of the issued and outstanding stock of Cannisapp. Pursuant to the Stock Exchange Agreement and upon the closing of the Share Exchange, in exchange for all of the issued and outstanding capital stock of Cannisapp, we issued to Mr. Ching 1,482,492,800 shares of our common stock, par value $0.001 per share and 8,500,000 shares of Class A Preferred Stock, $0.001 par value (the Class A Preferred Stock has 100 for 1 voting rights per share). As a result of the Share Exchange, Mr. Ching remains the controlling shareholder of the Company, owning a total of 1,488,827,800 shares of common stock and all of our Class A Preferred Stock.
Immediately prior to the closing of the Stock Exchange Agreement, we had 6,440,000 shares of our common stock, $0.001 par value, and no shares of preferred stock $0.001 par value, issued and outstanding. Immediately after the closing of the Stock Exchange Agreement, we had 1,488,832,800 shares of our common stock, $0.001 par value, issued and outstanding and 8,500,000 shares of our Class A Preferred Stock, $0.001 par value, issued and outstanding issued and outstanding. The Class A Preferred Stock has 100 to 1 one voting rights per share.
The Share Exchange was accounted for under the business combination under common control of accounting. Pursuant to the Stock Exchange Agreement, we acquired the business of Cannisapp, which a technology-oriented company, specializing in the creation of mobile applications operating on Android and iOS operating systems. As a result, we have ceased being a “shell company.”
DESCRIPTION OF OUR BUSINESS
Cannisapp Business History.
Cannisapp was incorporated in Malaysia on April 2, 2018 as Antara Rimbun Sdn Bhd, a private limited liability company. On July 5, 2018, we changed our name to Nimpmos Sdn Bhd and subsequently to Cannisapp Sdn. Bhd. on September 2018. Our website is www.cannis.app. Cannisapp has two distinct, business segments, one is developing proprietary mobile applications and the other is offline sales distributor for nutritional supplements manufactured by third parties. The Company intends to integrate its offline sales with its mobile applications platform as part of its marketing strategy.
| 4 |
| Table of Contents |
We commenced offline sales of nutritional supplements in September 2018 while we are developing and marketing our mobile applications. We purchase nutritional supplement companies from suppliers located in the Peoples Republic of China and New Zealand. All of our revenues generated since inception of Cannisapp Sdn Bhd to date are derived from the offline sales of supplements.
Cannisapp, as a technology-oriented company, specializes in the creation of mobile applications operating on Android and iOS operating systems. We have developed and launched, in part, our app called Cannis App, which is a four-in-one mobile application consisting of Cannis Mall, Cannis Pay, Cannis Chat and Cannis Power.
We began developing our mobile applications during June of 2018 and launched our introductory version of Cannis App in August 18, 2018. Following the launch, in September 2018, we added functions such as discounted shopping with basic functions such as products classification, products search, products recommendation and location positioning. On November 1, 2018, we added Cannis Chat into Cannis App. On January 2019, we beta-tested Cannis Pay by adding it into Cannis App for online shopping payment and in-app function top up. In early February 2019, Cannis Power was introduced as one of the premium features of Cannis App.
The application development industry is an emerging industry in the twenty-first century that is undoubtedly important and indispensable to the society. There are two (2) type of applications that are common and trending in the market – desktop application and mobile phone application (“Apps”). Apps play a key role in the modern-day society, especially in those “want-to-know,” “want-to-go,” “want-to-do” and “want-to-buy” moments. It is a powerful and efficient consumer relationship-building medium that complements the growth of e-commerce industry and the connectivity between brands and consumers.
With the exponential growth of the mobile phones users, the app development industry is correspondingly growing rapidly. Our App development aims to develop an App with friendly interface that covers everyone’s daily needs in entertainment, lifestyle, business, social media and more.
It is our vision to create “an App that links the world,” and our Cannis Apps strive to minimize the distance between people and to eliminate all limitations of mobile phones. We envision our App, “Cannis” to be the next must-have App on everyone’s mobile phones, compatible on both Android and IOS operating systems, that could provide convenience and benefits to all mobile phone users.
I - Mobile Applications
Description of Cannisapp.
Cannisapp is our proprietary, integrated App that consists of four (4) main segments;
| (i) | Cannis Mall, an e-commerce module, |
| (ii) | Cannis Pay, a payment service, |
| (iii) | Cannis Chat, a social media in the form of instant messaging, and |
| (iv) | Cannis Power, a power bank sharing app. |
The users of Cannisapp can easily access to all four functions of Cannisapp without having the need to download and install other supporting App as all the four main elements of Cannisapp are designed to interface under Cannisapp. These four App segments help each other to draw different users with different needs and preference to the exposure of the diverse multiple applications offered by Cannisapp, with the aim of increasing user traffic.
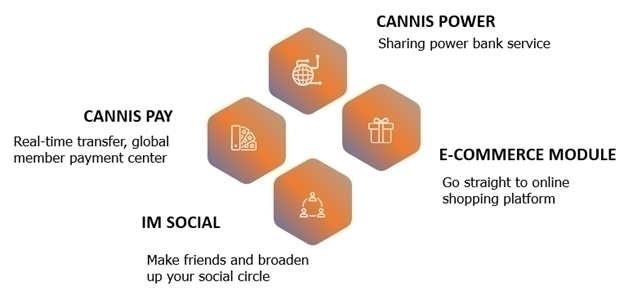
(Diagram: Cannisapp is a four-in-one App designed to bring convenience to its users)
| 5 |
| Table of Contents |
A. Cannis Mall, an E-Commerce Module.
Cannis Mall, a mobile online e-commerce platform, is one of the main functions of Cannisapp. Our Cannis Mall focuses on healthcare, lifestyle and fashion covering China, Malaysia, Indonesia, Korea, Vietnam, Thailand. Cannis Mall offers a business trading venue that is user-friendly to both merchants and consumers. Through Cannis Mall, merchants are able to promote and enhance its products sales, brand awareness and product recognition towards the consumers. The unique design and user-friendly interface of Cannis Mall is able to foster repeat customers for our merchants.
Cannis Mall contains a sophisticated search engine which enables users to search for a product interactively as the search engine would filter and refine the available products based on the user’s input. Upon the user decided to proceed with the purchase, the user will be redirected to a payment page for payment whereupon the user can make payment through our payment gateway, Cannis Pay.
Despite the fact that we have not officially launched Cannis Mall, we are working on procuring and inviting merchants to list their products with Cannis Mall. The table below sets out the range and number of merchants that are expected to join Cannis Mall.
Business Category | Quantity | Expected Joined Date |
Electronic Accessories | 2 | June 2020 |
Mobile & Gadget | 2 | June 2020 |
Beauty & Health | 7 | June 2020 |
Baby Products | 1 | June 2020 |
Home & Living | 1 | June 2020 |
Home Appliances | 1 | June 2020 |
Clothing | 3 | June 2020 |
Shoe & Bag | 3 | June 2020 |
Food & Beverages | 1 | June 2020 |
In addition to mobile online e-commerce platform, Cannis Mall organizes promotional events from time to time for the participation of its merchants, members and public. By organizing promotional events, Cannis Mall is able to invite the public to explore its Cannisapp and meet with the merchants which has resulted in the increase of new members signing up with Cannis Mall. We are hopeful that these events will contribute positively to our revenue in the future. Cannis Mall generates revenues from commissions on product sales on its site.
| 6 |
| Table of Contents |
The below images depict the homepage to our Cannis Mall:
| | | |


B. Cannis Pay, a Payment Gateway.
The advent and rapid continuous progress of technology continue to push for more frequent, immediate and instantaneous internet access and smartphone usage penetration continue to rise rapidly. As result, new application and frontiers been explored and penetrated. This phenomenon has altered the consumers’ behavior in shopping, consumption, entertainment, retail, financial and other transactional services.
Cannis Pay, an app-based payment gateway was launched in January 2019, specializes in payment processing technology and solution for online merchants that gives consumers a simple, convenient and hassle-free means to pay.
Cannis Pay operates a reliable and secure proprietary technology platform that enables small to large businesses to accept a vast array of payment types and channels in Malaysia, Indonesia, China and Thailand such as Wechat Pay, Paypal and Alipay and by credit card.
We have also signed up with various utilities companies, whereby our users through Cannis Pay will be in due course able to make payment for electricity bill, water bill, telephone bills, and our IT team is connecting up the linkage to expand this service. The table below sets out the range and number of merchants that are expected to join our Cannis Pay platform.
Business Category | Quantity | Expected Joined Date |
Telco (Prepaid Top Up) | 14 | June 2020 |
Telco (Bill/ Postpaid) | 7 | June 2020 |
Utilities | 19 | June 2020 |
Games | 20 | June 2020 |
By providing the utility bills payment service, Cannis Pay is entitled to receive a commission fee from every transaction made through Cannis Pay.
| 7 |
| Table of Contents |
The below images depict transactions through Cannis Pay.

C. Cannis Chat, an Instant Messaging and Social Platform.
Cannis Chat is an instant messaging system created to provide free instant messaging, voice call and video call to facilitate communication between our users and their families and friends. Cannis Chat is compatible to both Android and IOS operating systems. We believe that Cannis Chat will serve as a value-added function to Cannisapp as it will contribute positively to the network traffic of all the other functions of Cannisapp which will promote and attract traffic to Cannisapp.
The below images depict our Cannis Chat’s interface:
| |


| 8 |
| Table of Contents |
D. Cannis Power, a Shared Powerbank Service.
Cannis Power is a power bank sharing service operating in conjunction with Cannisapp. The idea of Cannis Power derives from a commonly experienced issue of battery depletion due to frequent mobile device usage. With Cannis Power, we are providing a cost-effective battery charging solution that will allow users to have their mobile devices charged and stay connected wherever they are.
“Cost-Effective Mobility” is a key concept of Cannis Power. The portals of Cannis Power are expected to be widely located at the premises of Cannisapp’s merchant partners. Users are required to scan a QR code endorsed on the portal of Cannis Power and the QR code will redirect the users to Cannisapp for power bank device rental payment page. Upon successful payment, the users may remove the power bank device from the portal of Cannis Power for any outdoor device charging.
The power bank device has large power capacity, and is light, portable, durable and safe to use and is equipped with three types of USB cables compatible for most mobile devices models. The power bank device can be used to charge multiple mobile devices with flexibility and mobility.
As at today we have secured a few merchants that have subscribed for our Cannis Power. The table below sets out the range and number of merchants that are currently subscribing to Cannis Power.
Business Category | Quantity | Number of Portal | Date Subscribed |
Beauty & Health | 2 | 2 | March 2019 |
Health Centre | 1 | 2 | March 2019 |
Club House | 1 | 2 | March 2019 |
Travel Agency | 1 | 1 | March 2019 |
Entertainment | 1 | 1 | March 2019 |
To date, Cannis Power has not contributed to our revenue as Cannis Power is currently under beta-test and is offered free of charge for its users. Upon the expiry of the testing period in June 2020, Cannis Power will charge users at the rate of; RM1.00 per hour and RM12.00 per day. Revenue generated from Cannis Power will be allocated 40% to us, 30% to the merchant and 30% to referral, if any.
The below images depict the power bank device of Cannis Power:

| 9 |
| Table of Contents |

App development progress
The estimated rollout schedule of our Cannis App with all four distinctive functions is depicted below along with estimated costs to achieve full functionality which is still subject to the availability of funds to complete the product developments.

Milestone | Go-Live Date | Cost to achieve (US$) |
1. Cannisapp Platform with Short Video function | 8.18.2018 | 340,020 |
2. Cannis Power | 3.30.2019 | NIL |
3. IM (Cannis Chat) | 5.31.2019 | 905,139 |
4. Cannis Pay | 6.1.2020 | 1,059,993 |
5. Cannis Mall (E-Commerce) | 6.1.2020 | 694,432 |
We have engaged an external application developer since June 2018 with a team of approximately 100 programmers. The external application developer is engaged to develop Cannisapp and to constantly improve Cannisapp according to our specifications as well as to meet the market requirements. In additional to the external application developer, we have also engaged programmers in China and Indonesia to study internet status of various countries and to produce solutions for the issues that our App may encounter in various countries.
| 10 |
| Table of Contents |
Intellectual Property
We have filed trademarks of our Cannis name and logos with various governmental agencies in People’s Republic of China, Malaysia, Thailand and Indonesia.
We do not have any patents protecting any of our Apps. In general, the level of protection afforded by a patent is directly proportional to the ability of the patent owner to protect and enforce those rights through legal action. Since our financial resources are limited, and patent litigation can be both expensive and time consuming, there can be no assurance that we will be able to successfully prosecute an infringement claim in the event that a competitor develops a technology or introduces a product that infringes on one or more of our patents or patent applications. There can be no assurance that our competitors will not independently develop other technologies that render our proposed products obsolete. In general, we believe the best protection of our proprietary technology will come from market position, technical innovation, speed-to-market, and product performance. There is no assurance that we will realize any benefit from our intellectual property rights.
Instead of patent protection, we rely on trade secrets and know-how. To protect our rights in these areas, we require all employees and consultants that perform work for us to enter into confidentiality agreements.
Government Regulation
We conduct our business in compliance with all governmental regulations in Malaysia, including adherence to the Communications and Multimedia Act 1998 and Consumer Protection Act 1999. We are unaware of and do not anticipate having to expend significant resources to comply with any governmental regulations in Malaysia. In addition, we will be subject to the laws and regulations of other jurisdictions in which we plan to sell our products, which are generally applicable to business operations, such as business licensing requirements, income taxes and payroll taxes. In general, other than stated above, the development and operation of our business is not subject to special regulatory and/or supervisory requirements.
Market and Competition
We do not aim to compete with other similar established players in the respective segment of operation, due to their respective operating history, financial and technical strength. However, we believe we are one of the few integrated apps that offers services combining various segments of the internet economy. We set out below the general discussion of our analysis of the market competition of our various segments of commercial activities. The main users of our Apps will be users who prefer integrated services that our App can offer.
Cannis Mall
The growth of e-commerce has great potential in Malaysia, that has a population of 30 million, internet users of 25 million, social media users of 24 million and the number of younger generation and online purchases in Malaysia and other South East Asia countries has been increasing that is beneficial to our business growth. In recent years, the e-commerce sector has been blooming and there are many new e-commerce platforms been launched in Malaysia targeting the Malaysia market and/or the South East Asia market. Among all the e-commerce platforms, we believe Lazada, Shoppe and 11th Street are our main competitors.
Started in 2011 by the Rocket Internet SE, Lazada has grown into Malaysia’s most popular online marketplace where sellers and buyers can trade. Lazada acts as a middleperson, guaranteeing delivery to buyer and payment to seller. In the early days, Lazada fueled its growth by giving out massive discount vouchers as well as offering free shipping to its customers. Lazada makes profit primarily by charging commissions every time a sale is made on its site. Recently, Lazada has also started selling sponsored product ads to sellers on its website.
Shopee is another e-commerce marketplace in Malaysia. Its core service is to facilitate transactions between buyers and sellers. By comparing with Lazada which began mainly as a desktop online marketplace, Shopee began with a focus on mobile shopping and it prioritizing growth on its app. Shopee started in 2015, and Shopee has surpassed online marketplaces such as Lelong and 11Street and become the second most popular e-commerce marketplace in Malaysia. Its growth has been fueled by offerings of free shipping to buyers as well as zero commission chargeable on sellers when a sale in made through the Shopee. Shopee profits through its sponsored ads. At this juncture, it remains unclear how Shopee plans to profit long-term as ad sponsored content is becoming less favorable among consumers.
11Street is another popular e-commerce marketplace in Malaysia. It started in 2014 as an expansion of its main company in Korea which was established in 2008. 11Street used to be the second largest online marketplace in Malaysia. Similar to Lazada, 11Street profits from charging a commission to sellers when a sale is concluded on its website as well as through its sponsored product ads.
| 11 |
| Table of Contents |
Cannis Pay
With the emergence of e-commerce and online purchases, the procedure required for payment systems has been changing. Users have migrated from cash payments to card payments, and now to non-cash payments. Non-cash payments occur through digital channels either held on digital wallets or new digital payment mechanisms. As this industry is still evolving, a wide variety of terms are used for such transactions, such as e-money, digital money, micro-payments and so forth.
E-wallet services are generally work through apps on smartphones. An e-wallet is based on an encrypted software which substitutes an analog wallet during monetary transactions. Further, e-wallet allows one to store multiple credit cards and bank accounts in a secure environment and eliminates the need to enter account information while making monetary transactions. Once a user has registered for an e-wallet and creates an e-wallet profile, they can then make swift payments.
In the latest trend, Near Field Communication (NFC) chip enabled smartphones are expected to drive the market as most of the smartphone manufacturers are equipping new phones with NFC. With this, users can place their smartphones within four inches of a pay pad or contactless reader to make payment.
There are many emerging e-wallet companies available in Malaysia and some of the major participants like Paypal, Boost, Grabpay and WeChat are discussed below.
Paypal is one of the most common payment gateways used by small businesses. It allows users to create three types of accounts on PayPal – Personal, Premier, and Business. Users can link their debit or credit cards to carry out transactions. Users can sign up PayPal for free and choose PayPal at the time of checkout when making a purchase. It is protected by “Buyer Protection”, which covers almost all online purchases. Paypal users do not have to pay any fees while making payments through eChecks or PayPal balance on a personal account, but a transaction fees will be charged if the user transfers money using a debit or a credit card to their account.
Boost, a relatively new e-wallet in the Malaysian market, allows users to scan the QR code to pay for their purchases. Their mechanism is that users can send money to friends and family from their Boost wallet without any additional charges and enjoy great deals and discounts on online shopping, gaming, movies, music, and more. Boost has 17 Malaysian banking partners, that includes Maybank 2U, CIMB Clicks, and more. Boost wallet can only be used by topping up the Boost wallet prior to using it.
Grab Pay is another e-wallet competitor in Malaysia originating from a popular e-hailing operator, Grab. Grab Pay offers more than just paying for the cab rides. Cab riders can use their Grab Credits to pay for their rides, to make purchases at a number of partnering stores, to order food, and prepaid credits top up and transfer.
WeChat, a popular Chinese mobile chat giant, launched its digital payment gateway WeChat Pay in Malaysia in June 2018. The e-wallet can be used for peer-to-peer money transfer as well as to make payments to offline merchants through its Quick Pay function. WeChat Pay My offers a range of everyday functions – such as mobile phone top-ups, and bus and plane ticket booking. However, the depth of services is still limited compared to those available in China.
Cannis Chat
Our main objective with Cannis Chat is to develop a new social media platform with new ideas and concepts. Thus, we expect strong comparisons and competition from existing social media applications in the market. The following are market values ascribed to the 3 top social media apps, namely Whatsapp, WeChat and Line.
Whatsapp is among the earliest and longest running social media app in app industry. It has accumulated 1.5 billion users from 180 different countries after their first launch on year 2009. Even though Whatsapp itself has never been listed on any share market, it was acquired by Facebook with $19 billion USD in year 2004, which is 5 years after its launch.
WeChat is the social media app originates from China that gathers most Chinese users around the world. It has monthly active users of 1.8 billion across 20 countries and an estimated $110 billion USD current market evaluation. WeChat is officially launched at year 2011 by parent company, Tencent.
| 12 |
| Table of Contents |
Line Corporation is a Tokyo-based subsidiary of the South Korean internet search giant Naver Corporation. Line Corporation owns Line, a social media app that is mainly associated with instant messaging, gaming and internet services with an estimated market value of $8.4 billion USD. Line gathers 2.18 billion monthly active users from 230 countries since their launch in year 2011.
Cannis Power
Power bank rental is based on the sharing-economy business model that may become the next phenomenon due to the large number of smartphone users. The sharing-economy, also known as collaborative consumption or peer-to-peer-based sharing, is a concept that highlights the ability, and perhaps the preference, of individuals to rent or borrow goods at competitive price rather than buy and own them.
In China, this sector is growing at an exponential rate, with the influx of capital inflows from internet giants. However in Malaysia, this business model has not been explored by any entity on a large scale. We foresee that an early venture into this business will give us the opportunity to be the leader in this industry as power bank rental service is still new in Malaysia. We envision ourselves to be a pioneer in this market.
However, there are two competitors in the Malaysian market, namely Brezze and NoMo, both are Singaporean based companies that have penetrated the Malaysian market with minimal exposure. NoMo is the most competitive of two, providing VIP Package to its members and has expanded its services even up to Ipoh, Malaysia Brezze on the other hand, is a new company that is running test in Malaysian market. Due to the limited operating history in Malaysia, there are limited information available on their services. However, we believe we can distinguish ourselves with these two competitors.
Competitive Advantages
Below are our competitive advantages in comparison with our competitors above.
| 1) | Cannis Mall |
| · | Will be interactive by providing purchase suggestions based on prior viewing or purchasing history. We believe this will provide ease of use thus making product searches, viewing and selection simpler. |
| · | With a sophisticated and efficient search engine, our users can search for a product interactively as the search engine would refine the products available based on the user’s input. |
| · | The simplicity of the design of Cannis Mall can make the execution and operation be more time-saving and cost saving which is the essence of our online shopping platform. |
| 2) | Cannis Pay |
| · | A strategic promotional tagline. |
| The market for cashless payments is already expanding in Malaysia and E-wallet payments constitute half of the total cashless payments made in Malaysia, but it is only 20% of the total payments made in the country. The digital economy is expected to be one of the major contributors to Malaysia’s GDP, is expected to achieve a target of 20% by 2020. In order to attract people to download and use the e-wallet, we have come up with a promotion strategy with a tagline “Download, Spend & Be Rewarded”. The mechanism of this promotion strategy requires user to download the e-wallet and spend RM100.00 on accumulative basis and be rewarded with RM10 worth of voucher. | |
| · | A strategic marketing approach. |
| With more marketing efforts and more education to the public on the benefits of cashless payments and e-wallets, we are confident that more and more Malaysians will learn about Cannis Pay and make the switch in the near future. Our competitive advantage relies mostly on our marketing strategy. When it comes to mobile wallet marketing, the options on how to promote mobile wallet content are nearly endless, although they are subject to monetary constraints. | |
|
|
|
| 3) | Cannis Chat |
| · | Attractive features. |
| There is support for stickers and GIFs, photo and video editing, and group chats among the members. It’s also completely free and doesn’t contain adverts. Cannis mission for its Chat app is to make it free, never sell data, and isn’t aiming to generate revenue. | |
| · | Real time Updates. |
| The basics are solid with real-time updates when messages are delivered, read, and when the recipient is responding. It also offers free voice and video calls, loads of stickers and emoticons. | |
| · | Unique Function. |
| · | The chat also has a unique function where user can choose to ignore the unread messages. There is also function of creative video (similar to Tik Tok) where user can share with their contact. |
| 13 |
| Table of Contents |
| 4) | Cannis Power |
| · | Exploring the untapped market of sharing power bank. |
| We expect Cannis Power, based on the concept of sharing economy, to grow rapidly in the future. According to a research conducted by MCMC (Malaysia Communication and Multimedia Communication), smartphone is the most common device to access Internet, at 89.4%. Additionally, in 2016, there were 28.5 million mobile broadband subscriptions compared to 2.5 million fixed broadband subscriptions. We believe with a growing number of smartphone users and internet subscribers; the sharing power bank service will become a phenomenon in Malaysia. | |
| · | Promotional Strategy. |
| We intend to implement a Free of Charge promotion where user only has to pay RM30 deposit, we confident that people will be attracted to use our service. The convenience that we create to rent the power bank is one of the competitive advantages that Cannis has available. A user can rent and return it anywhere at an affordable fee. The features of the device also contribute to the efficiency of the service. It can cater iOS and Android with three types of USB cables compatible for most mobile device’s models. |
Pricing considerations
The vast majority of users on all continents prefer free mobile applications. Statistics provided by Statista showed that in 2017, free mobile apps are projected to have been downloaded over 250 billion times worldwide. As for paid apps, Statista showed around 15 billion downloads in 2017.
Mobile Apps Downloads 2017
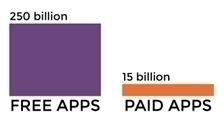
Source: Statista
Cannisapp is free-for-all and as of this date, we have accumulated 200,000 downloads from Malaysia, Indonesia and China.
With large customer base and strong network traffic in our App, each module on our App may provide revenue streams in the future. With the increase of utilization of each the module on our App, the immediate chain effect will be the increase of utilization of Cannis Pay. Users can utilize Cannisapp to perform cashless transactions such as shopping, utility bill payment, mobile credit top up and more.
Marketing strategy
We plan on using conventional marketing methods as well as social media to promote our Apps. We have a team of 15 employees to educate and guide user in using our App and to highlight the competitive strength of our App. Our Chief Marketing Officer will direct the market awareness and branding of our products.
| 14 |
| Table of Contents |
The following elaborates our marketing strategy:
1. Email Marketing
· We intend to use permitted email marketing, and design user-friendly contents (such as discounts, special offers, free gifts, etc.).
2. Popularize Resource Sharing
· The sharing of traffic flow between App to App, including our Apps, can also be considered as a mutual promotion. Through the cooperation with other App, implant each other’s download ports or links on the partner App, (can also embed the download port on strategic alliance companies’ App), the Cannis App will be cross-promoted in different industries to engage more customers.
3. Search Engine Advertisement
· Search engines are main channels for internet users to obtain information. An ordinary user would normally browse in the order of given rankings. We will endeavor to have CANNIS APP as one of the top picks while searching with related keywords and advertising on GOOGLE, Wikipedia, Facebook, YouTube, etc.
4. Online Podcasts and Bloggers
· Online podcasts (or webcasts) and bloggers have become an important component in forming public opinion in Malaysia. We will attempt to use these platforms to effectively improve our exposure. Promotion through online celebrities on platform such as Blogger with soft text can also increase word-of-mouth and publicity.
5. Social platform promotion (Micro-marketing)
· Create a CANNIS APP official platform account, the network promoting personnel will regularly update the public account content, effectively establish a stable user community, which can then proceed on with secondary marketing. Social media platforms are tools that give convenience to users on sharing, commenting and discussing, for instance, Facebook and Instagram, they can be managed by specialist to promote information about CANNIS APP, making full use of such platforms in increasing our users’ allegiance.
6. App Store Promote
· Popularize the APP ranking in major mobile phone app stores, third party app stores (Google store, iTunes), and other third party app download platforms, making it more convenient for users to download from various channels.
7. Mobile Vehicle Advertising
· According to the main road map of public transports, the CANNIS APP advertisements can be printed on huge mobile vehicles or stations, selectively invest a small amount in some taxis (TAXI, GRAB CAR); appropriate light box advertisements in main shopping streets, transit stations, large shopping malls, and certain bus stations, making it more intimate to the audience, and subtly forms a brand effect.
8. TV and Radio Advertising
· TV media advertising has long been integrated into the life of public. And since users normally have a good sense of trust in their favourite channels, cooperating with the Malaysian Radio and Television Stations depending on their viewing rate to place advertisement can be feasible and effective. Radio stations are also the main source for daily news, bridging an interaction between radio and users can help promote CANNIS APP.
9. Newspaper Banners And Single Page Ads
· Newspaper users are considered as a precise targetable group, suitable for explicit advertising. Putting on newspaper banner ads or single page ads in best-selling magazines in main Malaysia urban areas, will help to promote the value of CANNIS APP wishes to deliver to consumers.
10. Product Shopping Bags and Flyers
· Cooperate with partner merchants to customize co-branded shopping bags, while making visible the CANNIS APP information and its download method. Place leaflets at partner merchants’ along with some little gifts to attract more pick-ups or choose the crowded locations (such as shopping malls, schools, MRT transit stations, etc.), with the CANNIS APP QR code uniform on the personnel for more publicity and spreading.
11. Merchant Resource Sharing
· Place brief introductions about CANNIS APP at doorsteps through the cooperation with offline shops. Cannis battery banks can be placed at the cashier counters with eye-catching APP download sign. For those successful set up merchants, while users are renting Cannis battery banks, the users will be able to search for the shop location (sharing between users and merchants, forming a consumer-based reciprocal cycle), can then result in more traffic and customers, therefore increase the chance of our cooperation.
| 15 |
| Table of Contents |
12. Event Promotion.
· As mentioned above, we have organized events and activities with the intention to create market awareness and we will continue our efforts in ths regards. We organized Cannis Open Day on March 31, 2019 in our Head Quarters in Petaling Jaya, Selangor. On Cannis Open Day, we were able to introduce our App to the public which resulted in our user base and the engagement of our App have been increased significantly. Prior to the Cannis Open Day, we distributed flyers throughout the neighboring areas, and advertised it via social media platform. There were also lucky draws for people who showed up on Cannis Open Day.
II - Nutritional Supplements
Background.
In September 2018, we started offline sales distribution of three nutritional supplements manufactured by two separate companies. One company is located in the Peoples Republic of China and manufactures products known as “Tibet Cordyceps” and “Cordyceps King.” The other company is located in New Zealand and manufactures a product known as “BeauZell.”
We are the distributor for both companies, we sell these products by using sales dealers that sell for us. These sales dealers sell directly to consumers located in Malaysia and other parts of South East Asia such as Indonesia.
We do not have a written agreement with either manufacturer. We mark up the price charged to us by the manufacturer by up to 40%. Our sales dealers would mark up the price sold to the consumer. Once we place an order with the manufacturer, the manufacturer directly ships the order to the purchaser.
Product Information.
Tibet Cordyceps and Cordyceps King
Cordyceps is also known as the caterpillar fungus and sometimes even the winter worm. It is also known as the zombie caterpillar and is native to China and Tibet. It has been known to be used as a magic herb for years in the Chinese and Tibetan culture and medicine. Cordyceps King is sold in a one bottle packaging containing 60g. The cordyceps for this product is sourced at elevations around 3,000 feet above sea level. Tibet Cordyceps is sold in two bottle packaging of 60g each. The cordyceps for this product is sourced at elevations around 5,500 feet above sea level and is believed to have a higher anti-oxidant affect. Both Cordyceps is categorized as Cordyceps Sinensis which is known to slow aging in individuals and to induce great vitality in people. It is often used as a secret herb to produce stamina and youthful beauty and to speed up the healing process from various illnesses and weaknesses and injuries. It also helps in boosting one’s energy levels, thereby fighting fatigue.
| 16 |
| Table of Contents |
| |
Tibet Cordyceps – 2 bottles x 60g | Cordyceps King - 60g |


BeauZell
BeauZell on the other hand is a supplement that is made from deer placenta extract which is widely regarded as the best grade for supplemental use as the molecular structure of deer placenta matches well with human protein and BeauZell capsules are some of the most powerful products on the market, promoting everything from glowing skin to organ health and healthy blood sugar levels.

BeauZell – 30 capsules-9000mg
| 17 |
| Table of Contents |
We started selling these products in September 2018. Below is our revenue breakdown by fiscal quarter for each product category during the past 12 month, respectively:
|
| Quarter ended November 30, 2018 (US$) |
|
| Quarter ended February 28, 2019 (US$) |
|
| Quarter ended May 31, 2019 (US$) |
|
| Quarter ended August 31, 2019 (US$) |
|
| Total |
| |||||
Product |
|
|
|
|
|
|
|
|
|
|
|
|
|
|
| |||||
Tibet Cordyceps |
|
| 292,199 |
|
|
| 561,964 |
|
|
| 976,914 |
|
|
| 413,990 |
|
|
| 2,245,067 |
|
Cordyceps King |
|
| - |
|
|
| 80,014 |
|
|
| 282,804 |
|
|
| 165,632 |
|
|
| 528,449 |
|
Beauzell |
|
| 10,874 |
|
|
| 41,585 |
|
|
| 253,857 |
|
|
| 185,915 |
|
|
| 492,231 |
|
Others |
|
| 8,834 |
|
|
| 135,487 |
|
|
| 36,724 |
|
|
| 82,272 |
|
|
| 263,317 |
|
Total |
|
| 311,907 |
|
|
| 819,049 |
|
|
| 1,550,299 |
|
|
| 847,809 |
|
|
| 3,529,064 |
|
Market Analysis.
A. Cordyceps
Cordyceps Sinesis is native to the Himalayas and other mountainous parts of Asia. It has been one of the most prized compounds in Traditional Chinese Medicine for millennia, where it’s used for virility and stress. More recently, scientists have found a few benefits to C. sinensis:
| · | Physical endurance. A well-controlled study in older men found that, after 3 months of supplementing, C. sinensis increased lactate threshold by 10% and ventilatory threshold by 8.5% over placebo. In other words, C. sinensis increased cardio endurance by a substantial margin. |
|
|
|
| · | Curbing stress. Several studies shows that C. sinensis eases the physical effects of stress, including decreased inflammation and response. |
|
|
|
| · | Immune/organ function. C. sinensis improved liver function and kidney function in patients struggling with each. |
B. Deer Placenta
The ancient Chinese herbalist and acupuncturist Li Shizhen wrote about the benefits of the placenta as a medical supplement as early as the 1500s and dried placenta has been used for centuries to help patients suffering from everything from impotence to skin disorders and fatigue. Today, celebrities like Victoria Beckham and Kim Kardashian use sheep placenta facials for younger looking skin due to its high protein content and actress January Jones hit headlines for remedying postpartum depression with tablets made from the dried placenta which is known to be high in the blues-busting vitamin B6.
Placentophagy or the practice of consuming placenta is still new to western medicine but there is evidence to suggest that it could help to boost energy, improve iron levels and ward off depression. Deer placenta is widely regarded as the best grade for supplemental use as the molecular structure of deer placenta matches well with human protein. Deer placenta is highly prized because it contains a tremendous amount of stem cells and these have a powerful ability to regenerate and repair damaged cells, tissue and organs while protecting healthy cells and nurturing new life cycles. All of this activity promotes healthy glowing skin and overall wellness and vitality.
| 18 |
| Table of Contents |
Marketing.
Presently, we use independent sales dealers to market these supplements. Each independent dealer can choose how they want to sell the products. They generally use the following off-line methods:
-Direct Mail to a target audience.
-Cold Calls or word of mouth referrals.
-Booths at various health related trade shows, generally in Malaysia
In an effort to increase sales of this offline segment of our business, we intend to employ the following marketing strategies;
- Seek more sales dealers to broaden our sales channel. We intend to do this through word of mouth.
- Identify more health care related products to push through our sales channel.
- Open market in other countries such as Indonesia and China
- Use our Cannis Mall as a marketing tool once it is fully operational.
An investment in our common stock involves a high degree of risk. You should carefully consider the risks described below, together with all of the other information included in this report, before making an investment decision. If any of the following risks actually occurs, our business, financial condition or results of operations could suffer. In that case, the trading price of our common stock could decline, and you may lose all or part of your investment. You should read the section entitled “Special Notes Regarding Forward-Looking Statements” immediately following these risk factors for a discussion of what types of statements are forward-looking statements, as well as the significance of such statements in the context of this report.
OUR CASH REQUIREMENTS ARE SIGNIFICANT. THE FAILURE TO RAISE ADDITIONAL CAPITAL WILL HAVE A SIGNIFICANT ADVERSE EFFECT ON OUR FINANCIAL CONDITION AND OUR OPERATIONS. Our business plan of developing, introducing and marketing our Apps will require a signification cash infusion. As stated herein, we estimate our monthly cash requirements to approximate $240,000 until we achieve positive cash flow. At August 31, 2019 and 2018, the Company reported accumulated deficit of $4,954,178 and $1,341,636, respectively. In addition, as of August 31, 2019, the Company had a working capital deficit of approximately $5.4 million (consisting in significant part of $3.9 million in debt to our largest shareholder and our officer and director) with cash on hand less than $0.2 million. Our auditor’s report for the period from April 2, 2018 (Inception) to August 31, 2018 and for the year ended August 31, 2019 for Cannis, Inc. and its subsidiaries includes an explanatory paragraph to their audit opinion stating that our recurring losses from operations and working capital deficiency raise substantial doubt about our ability to continue as a going concern. We do not currently have sufficient financial resources to fund our operations or those of our subsidiaries. Therefore, we need additional financing to continue these operations.
We believe that our existing capital resources are not adequate to enable it to execute its business plan and as of the date of these financial statements and has no firm commitment for either additional debt or equity financing available to it in order to meet our current commitments. These conditions raise substantial doubt as to the Company’s ability to continue as a going concern. We estimate that we will require additional cash resources during fiscal 2019 and beyond based on our current operating plan and condition. We expect cash flows from operating activities to improve, primarily as a result of an increase in revenue and a decrease in certain operating expenses, although there can be no assurance thereof. If we fail to generate positive cash flow or obtain additional financing, when required, we may have to modify, delay, or abandon some or all of our business and expansion plans.
WE HAVE INCURRED NET LOSS IN THE PAST AND WE MAY CONTINUE TO EXPERIENCE LOSSES IN THE FUTURE. We incurred a net loss of $3,612,542 and $1,322,940 for the year ended August 31, 2019 and 2018. We cannot assure you that we will be able to generate net profits or positive cash flow from operating activities in the future. Our ability to achieve and maintain profitability will depend in large part on our ability to, among other things, increase our number of members and other users, grow and diversify our supplier base, and optimize our cost structure. We may not be able to achieve any of the above. We intend to continue to invest heavily for the foreseeable future in our fulfillment infrastructure and technology platform to support an even more carefully curated selection of products and to offer additional value-added services. As a result of the foregoing, we believe that we may incur net losses in the future.
| 19 |
| Table of Contents |
OUR OPERATING LOSSES AND WORKING CAPITAL DEFICIENCY RAISE SUBSTANTIAL DOUBT ABOUT OUR ABILITY TO CONTINUE AS A GOING CONCERN. IF WE DO NOT CONTINUE AS A GOING CONCERN, INVESTORS COULD LOSE THEIR ENTIRE INVESTMENT. Our operating losses and working capital deficiency raise substantial doubt about our ability to continue as a going concern. If we do not generate revenues, do not achieve profitability and do not have other sources of financing for our business, we may have to curtail or cease our development plans and operations, which could cause investors to lose the entire amount of their investment.
THE ADMINISTRATIVE COSTS OF PUBLIC COMPANY REGULATORY COMPLIANCE COULD BECOME BURDENSOME AND CONSUME A SIGNIFICANT AMOUNT OF OUR CASH RESOURCES WHICH COULD MATERIALLY AND ADVERSELY AFFECT OUR BUSINESS. We will incur significant costs and expenses in connection with assuring compliance with all laws, rules and regulations applicable to us as a public company. We anticipate that our ongoing costs and expenses of complying with our public reporting company obligations will be approximately $100,000 annually. Our reporting and compliance costs and expenses may increase substantially if we are able to deploy our business model on an international basis, which will add significant cross-border jurisdictional complexity to our regulatory compliance and our accounting controls and procedures. Our compliance costs and expenses could also increase substantially if we apply for trading of our securities on a national stock exchange which may have listing requirements that engender additional administration and compliance costs. We have assigned a high priority to establishing and maintaining controls, procedures, corporate compliance and public company reporting; however, there can be no assurance that we will have sufficient cash resources available to satisfy our public company reporting and compliance obligations. If we are unable to cover the cost of proper administration of our public company compliance and reporting obligations, we could become subject to sanctions, fines and penalties, our stock could be barred from trading in public capital markets and we may have to cease doing business.
INABILITY TO MAINTAIN OPERATIONAL INFRASTRUCTURE AND SYSTEMS. We understand that there are several challenges related to IT infrastructure that we going to face in future. The main challenges are regarding computing platforms, data acquisition, compute provisioning and management, data storage architectures, data analytics, and networks and communication. Some challenges that we may face in the future such as:
- Lack of Powerful Computing Platforms
The major challenge in growing processing power of computers has been the lack of energy and space to power supercomputers. IT managers have always been on the lookout for better and faster systems which will help in the faster processing of the large amounts of data available today.
- Data Acquisition Problems
Firewalls which protect emails, applications and web browsing can cause important packet losses in the TCP/IP networks. This can result in important data loss and reduce the network speeds considerably, making the online collaboration impossible. Similar losses can occur due to the switches and routers which do not have the required high-speed memory.
- Dearth of Ways to Improve Data Analytics
Currently there are not many methods in place which can be used by app company to separate quality data from the humongous data sets. It is important to identify patterns in the data and correctly analyse it and use it to take business decisions in infrastructure management.
- Improper Networks and Connectivity
For any app company to work smoothly, it is important that there is a good and reliable network in place. Without a reliable network connection, it be a difficult task for us to maintain service quality. New software-based methods and network architecture design are required for the optimization of data.
WE HAVE LIMITED OPERATING HISTORY MAKES IT DIFFICULT TO EVALUATE OUR BUSINESS AND PROSPECTS. We commenced operations in April 2018 and have a limited operating history. However, our historical performance may not be indicative of our future growth or financial results. Our growth may slow down or become negative, and revenues may decline for a number of possible reasons, some of which are beyond our control, including decreasing consumer spending, increasing competition, declining growth of our overall market or industry, the emergence of alternative business models, changes in rules, regulations, government policies or general economic conditions. It is difficult to evaluate our prospects, as we may not have sufficient experience in addressing the risks to which companies operating in rapidly evolving markets may be exposed. You should consider our prospects in light of the risks and uncertainties that companies with a limited operating history may encounter.
| 20 |
| Table of Contents |
INTELLECTUAL PROPERTY INFRINGEMENT RESULTING IN COSTLY LITIGATION. Our success depends in part upon our proprietary technology. We rely primarily on trademark, copyright, service mark and trade secret laws, confidentiality procedures, license agreements and contractual provisions to establish and protect our proprietary rights. Despite these precautions, third parties could copy or otherwise obtain and use our technology without authorization or develop similar technology independently. We also pursue the registration of our domain names, trademarks, and service marks in the United States. We cannot assure you that the protection of our proprietary rights will be adequate or that our competitors will not independently develop similar technology, duplicate our products and services or design around any intellectual property rights we hold.
We cannot assure you that third parties will not claim our current or future products infringe their intellectual property rights. Any such claims, with or without merit, could cause costly litigation that could consume significant management time. Such claims also might require us to enter into royalty or license agreements. If required, we may not be able to obtain such royalty or license agreements or obtain them on terms acceptable to us.
WE DO NOT HAVE FORMAL AGREEMENTS WITH THE TWO SUPPLEMENT SUPPLIERS. Presently, we do not have formal, written agreements with the two supplement companies. Instead, we operate under oral arrangements with such companies. Therefore, either or both companies, at any time, can change the existing terms to terms less favorable to the Company or otherwise terminate the agreement. The occurrence of either event may have a material adverse impact on the Company and its existing revenue stream.
WE MAY BE NEGATIVELY AFFECTED BY ADVERSE GENERAL ECONOMIC CONDITIONS. Current conditions in domestic and global economies are extremely uncertain. Adverse changes may occur as a result of softening global economies, wavering consumer confidence caused by the threat of terrorism and war, and other factors capable of affecting economic conditions. Such changes could have a material adverse effect on our business, financial condition, and results of operations.
BECAUSE OUR PRINCIPAL SHAREHOLDER CONTROLS OUR ACTIVITIES, HE MAY CAUSE US TO ACT IN A MANNER THAT IS MOST BENEFICIAL TO HIMSELF AND NOT TO OTHER SHAREHOLDERS WHICH COULD CAUSE US NOT TO TAKE ACTIONS THAT OUTSIDE INVESTORS MIGHT VIEW FAVORABLY. Our principal shareholder owns approximately 99% of our outstanding common stock. As a result, he effectively controls all matters requiring stockholder approval, including the election of directors, the approval of significant corporate transactions, such as mergers and related party transaction. These insiders also have the ability to delay or perhaps even block, by their ownership of our stock, an unsolicited tender offer. This concentration of ownership could have the effect of delaying, deterring or preventing a change in control of our company that you might view favorably.
OUR DIRECTORS MAY HAVE CONFLICTS OF INTEREST WHICH MAY NOT BE RESOLVED FAVORABLY TO US. Certain conflicts of interest may exist between our sole officer and director and us. Our sole officer and director has other business interests to which he also must devote his time, resources and attention. Thus, a conflict of interest may arise in the future that may cause our business to fail, including conflicts of interest in allocating his resources, time and attention to our Company and his other business interests.
WE MAY DEPEND UPON OUTSIDE ADVISORS; WHO MAY NOT BE AVAILABLE ON REASONABLE TERMS AND AS NEEDED. To supplement the business experience of our officers and directors, we may be required to employ accountants, technical experts, appraisers, attorneys, or other consultants or advisors. Our Board without any input from stockholders will make the selection of any such advisors. Furthermore, it is anticipated that such persons may be engaged on an “as needed” basis without a continuing fiduciary or other obligation to us. In the event we consider it necessary to hire outside advisors, we may elect to hire persons who are affiliates, if they are able to provide the required services.
RISKS RELATED TO DOING BUSINESS IN MALAYSIA
WE FACE THE RISK THAT CHANGES IN THE POLICIES OF THE MALAYSIA GOVERNMENT COULD HAVE A SIGNIFICANT IMPACT UPON THE BUSINESS WE MAY BE ABLE TO CONDUCT IN THE MALAYSIA AND THE PROFITABILITY OF SUCH BUSINESS. Policies of the Malaysia government can have significant effects on the economic conditions of the Malaysia. A change in policies by the Malaysia government could adversely affect our interests by, among other factors: changes in laws, regulations or the interpretation thereof, confiscatory taxation, restrictions on currency conversion, imports or sources of supplies, or the expropriation or nationalization of private enterprises. We cannot assure you that the government will continue to pursue current policies or that such policies may not be significantly altered, especially in the event of a change in leadership, social or political disruption, or other circumstances affecting the Malaysia’s political, economic and social environment.
| 21 |
| Table of Contents |
THE FLUCTUATION OF MALAYSIA RIGGIT (“RM”) AND CHINESE YUAN (“CNY”) MAY MATERIALLY AND ADVERSELY AFFECT YOUR INVESTMENT. The value of the RM against the U.S. dollar and other currencies may fluctuate and is affected by, among other things, changes in the Malaysia’s political and economic conditions. As we rely entirely on revenues earned in the Malaysia, any significant revaluation of RM may materially and adversely affect our cash flows, revenues and financial condition. For example, to the extent that we need to convert U.S. dollars we receive from an offering of our securities into RM for our operations, appreciation of the RM against the U.S. dollar could cause the RM equivalent of U.S. dollars to be reduced and therefore could have a material adverse effect on our business, financial condition and results of operations. Conversely, if we decide to convert our RM into U.S. dollars for the purpose of making dividend payments on our common stock or for other business purposes and the U.S. dollar appreciates against the RM, the U.S. dollar equivalent of the RM we convert would be reduced. In addition, the depreciation of significant U.S. dollar denominated assets could result in a change to our operations and a reduction in the value of these assets.
The Company incur significant costs and expenses that are denominated in Chinese Yuan (“CNY”) as supplier and service provider are located in China. The fluctuations in the exchange rates between the U.S. dollar, Malaysia Ringgit, and Chinese Yuan may affect our results of operations and financial condition.
The CNY’s exchange rate with the Malaysia Ringgit and other currencies is affected by, among other things, changes in China’s political and economic conditions and China’s foreign exchange policies. On July 21, 2005, the PRC government changed its decade-old policy of pegging the value of the CNY to the U.S. dollar. Under such policy, the CNY was permitted to fluctuate within a narrow and managed band against a basket of certain foreign currencies. Later on, the People’s Bank of China has decided to further implement the reform of the CNY exchange regime and to enhance the flexibility of CNY exchange rates. Such changes in policy have resulted in a significant appreciation of the CNY against the U.S. dollar since 2005 though there have been periods when the U.S. dollar has appreciated against the CNY as well. There remains significant international pressure on the PRC government to adopt a more flexible currency policy, which could result in a further and more significant adjustment of the CNY against the U.S. dollar.
To the extent that we need to convert Malaysia Ringgit or other currencies into the Chinese Yuan for our operations or other uses, appreciation of the Chinese Yuan against the Malaysia Ringgit or other currencies would have an adverse effect on the Chinese Yuan amount we would receive from the conversion. On the other hand, a decline in the value of the Chinese Yuan against the Malaysia Ringgit could reduce the Malaysia Ringgit equivalent amounts of our financial results.
BECAUSE OUR PRINCIPAL ASSETS ARE LOCATED OUTSIDE OF THE UNITED STATES AND ALL OF OUR DIRECTORS AND ALL OUR OFFICERS RESIDE OUTSIDE OF THE UNITED STATES, IT MAY BE DIFFICULT FOR YOU TO ENFORCE YOUR RIGHTS BASED ON U.S. FEDERAL SECURITIES LAWS AGAINST US AND OUR OFFICERS AND DIRECTORS OR TO ENFORCE A JUDGMENT OF A UNITED STATES COURT AGAINST US OR OUR OFFICERS AND DIRECTORS IN THE PRC. All of our directors and officers reside outside of the United States. In addition, substantially all of our assets are located outside of the United States. It may therefore be difficult for investors in the United States to enforce their legal rights based on the civil liability provisions of the U.S. Federal securities laws against us in the courts of either the U.S. or the Malaysia and, even if civil judgments are obtained in U.S. courts, to enforce such judgments in Malaysia courts.
FAILURE TO COMPLY WITH THE U.S. FOREIGN CORRUPT PRACTICES ACT AND MALAYSIA ANTI-CORRUPTION LAWS COULD SUBJECT US TO PENALTIES AND OTHER ADVERSE CONSEQUENCES. We are required to comply the Malaysia’s anti-corruption laws and the United States Foreign Corrupt Practices Act, which generally prohibits U.S. companies from engaging in bribery or other prohibited payments to foreign officials for the purpose of obtaining or retaining business. In addition, we are required to maintain records that accurately and fairly represent our transactions and have an adequate system of internal accounting controls. Foreign companies, including some of our competitors, are not subject to these prohibitions. Corruption, extortion, bribery, pay-offs, theft and other fraudulent practices occur from time-to-time in Malaysia. If our competitors engage in these practices, they may receive preferential treatment from personnel of some companies, giving our competitors an advantage in securing business or from government officials who might give them priority in obtaining new licenses, which would put us at a disadvantage. Although we inform our personnel that such practices are illegal, we cannot assure you that our employees or other cooperative dealers will not engage in such conduct for which we might be held responsible. If our employees or other cooperative dealers are found to have engaged in such practices, we could suffer severe penalties and other consequences that may have a material adverse effect on our business, financial condition and results of operations. In addition, our brand and reputation, our sales activities or the price of our common stock could be adversely affected if we become the target of any negative publicity as a result of actions taken by our employees or other cooperative dealers.
| 22 |
| Table of Contents |
RISKS RELATED TO OUR SECURITIES
WE WILL NEED TO RAISE ADDITIONAL CAPITAL. IF WE ARE UNABLE TO RAISE ADDITIONAL CAPITAL, OUR BUSINESS MAY FAIL. We will need to raise additional capital to fund our ongoing operations. We have no cash on hand nor any working capital. To secure additional financing, we may need to borrow money or sell more securities. Under the current circumstances, we may be unable to secure additional financing on favorable terms, if available at all.
OUR NEED FOR CAPITAL WILL CREATE ADDITIONAL RISKS AND CREATE POTENTIAL SUBSTANTIAL DILUTION TO EXISTING SHAREHOLDERS. As mentioned above, we will need to raise additional capital in the future. These capital expenditures are intended to be funded from third party sources and from affiliates if available, including the incurring of debt (which may be converted into common stock) and/or the sale of additional equity securities. As of the date of this agreement, the Company is indebted to certain affiliates in the amount of $22,550. This debt is due on demand and the Company has no means to repay its existing debt. To the extent that this debt is converted to common stock, the conversion of this debt will cause additional dilution to existing shareholders, which may be substantial. In addition, the sale of additional equity securities or the sale and conversion of other debt likewise will be dilutive to the interests of current equity holders and such dilution may be substantial. In addition, there can be no assurance that such additional financing, whether debt or equity, will be available to the Company or that it will be available on acceptable commercial terms. Any inability to secure such additional financing on appropriate terms could have a materially adverse impact on the business, financial condition and operating results of the Company.
THE REGULATION OF PENNY STOCKS BY SEC AND FINRA MAY HAVE AN EFFECT ON THE TRADABILITY OF OUR SECURITIES. Our shares are subject to a Securities and Exchange Commission rule that imposes special sales practice requirements upon broker-dealers who sell such securities to persons other than established customers or accredited investors. For purposes of the rule, the phrase “accredited investors” means, in general terms, institutions with assets in excess of $5,000,000, or individuals having a net worth in excess of $1,000,000 or having an annual income that exceeds $200,000 (or that, when combined with a spouse’s income, exceeds $300,000).
For transactions covered by the rule, the broker-dealer must make a special suitability determination for the purchaser and receive the purchaser’s written agreement to the transaction prior to the sale. Consequently, the rule may affect the ability of broker-dealers to sell our securities and also may affect the ability of purchasers in this offering to sell their securities in any market that might develop therefore.
In addition, the Securities and Exchange Commission has adopted a number of rules to regulate “penny stocks.” Such rules include Rules 3a51-1, 15g-1, 15g-2, 15g-3, 15g-4, 15g-5, 15g-6, 15g-7, and 15g-9 under the Securities Exchange Act of 1934, as amended. Because our securities constitute “penny stocks” within the meaning of the rules, the rules would apply to us and to our securities. The rules may further affect the ability of owners of Shares to sell our securities in any market that might develop for them.
Shareholders should be aware that, according to Securities and Exchange Commission, the market for penny stocks has suffered in recent years from patterns of fraud and abuse. Such patterns include (i) control of the market for the security by one or a few broker-dealers that are often related to the promoter or issuer; (ii) manipulation of prices through prearranged matching of purchases and sales and false and misleading press releases; (iii) “boiler room” practices involving high-pressure sales tactics and unrealistic price projections by inexperienced sales persons; (iv) excessive and undisclosed bid-ask differentials and markups by selling broker-dealers; and (v) the wholesale dumping of the same securities by promoters and broker-dealers after prices have been manipulated to a desired consequent investor losses. Our management is aware of the abuses that have occurred historically in the penny stock market. Although we do not expect to be in a position to dictate the behavior of the market or of broker-dealers who participate in the market, management will strive within the confines of practical limitations to prevent the described patterns from being established with respect to our securities.
| 23 |
| Table of Contents |
The shares of our common stock may be thinly-traded on OTC-Pink, meaning that the number of persons interested in purchasing our shares of common stock at or near ask prices at any given time may be relatively small or non-existent. This situation is attributable to a number of factors, including the fact that we are a small company which is relatively unknown to stock analysts, stock brokers, institutional investors and others in the investment community that generate or influence sales volume, and that even if we came to the attention of such persons, they tend to be risk-averse and would be reluctant to follow an unproven, early stage company such as ours or purchase or recommend the purchase of our shares of common stock until such time as we became more seasoned and viable. As a consequence, there may be periods of several days or more when trading activity in our shares of common stock is minimal or non-existent, as compared to a seasoned issuer which has a large and steady volume of trading activity that will generally support continuous sales without an adverse effect on Securities price.
OUR STOCK WILL IN ALL LIKELIHOOD BE THINLY TRADED AND AS A RESULT YOU MAY BE UNABLE TO SELL AT OR NEAR ASK PRICES OR AT ALL IF YOU NEED TO LIQUIDATE YOUR SHARES. We cannot give you any assurance that a broader or more active public trading market for our shares of Common Stock will develop or be sustained, or that any trading levels will be sustained. Due to these conditions, we can give investors no assurance that they will be able to sell their shares of common stock at or near ask prices or at all if you need money or otherwise desire to liquidate your shares of common stock of our Company.
OUR MAJORITY SHAREHOLDER WHO ALSO IS OUR PRESIDENT/CHIEF EXECUTIVE OFFICER MAY HAVE A CONFLICT OF INTEREST WITH THE MINORITY SHAREHOLDERS AT SOME TIME IN THE FUTURE. Our President/ Chief Executive Officer beneficially owns approximately 99% of our outstanding common stock. The interests of our officer and director may not be, at all times, the same as that of our other shareholders, he will have the ability to exert complete control over the affairs of the Company. Also, he will have the ability to control the outcome of most corporate actions requiring shareholder approval, including the sale of all or substantially all of our assets and amendments to our articles of incorporation. This concentration of ownership may also have the effect of delaying, deferring or preventing a change of control of us, which may be disadvantageous to minority shareholders.
RULE 144 SALES IN THE FUTURE MAY HAVE A DEPRESSIVE EFFECT ON OUR STOCK PRICE. All of the outstanding shares of common stock held by our present officers, directors, and affiliate stockholders are “restricted securities” within the meaning of Rule 144 under the Securities Act of 1933, as amended. As restricted Shares, these Shares may be resold only pursuant to an effective registration statement or under the requirements of Rule 144 or other applicable exemptions from registration under the Act and as required under applicable state securities laws. We are registering all of our outstanding Shares so officers, directors and affiliates will be able to sell their Shares if this Registration Statement becomes effective. Rule 144 provides in essence that a person who has held restricted securities for one year may, under certain conditions, sell every three months, in brokerage transactions, a number of Shares that does not exceed the greater of 1.0% of a company’s outstanding common stock or the average weekly trading volume during the four calendar weeks prior to the sale. There is no limit on the amount of restricted securities that may be sold by a nonaffiliate after the owner has held the restricted securities for a period of two years. A sale under Rule 144 or under any other exemption from the Act, may have a depressive effect upon the price of the common stock in any market that may develop.
THE PRICE OF OUR COMMON STOCK COULD BE HIGHLY VOLATILE. Our common stock will be subject to price volatility, low volumes of trades and large spreads in bid and ask prices quoted by market makers. Due to the low volume of shares traded on any trading day, persons buying or selling in relatively small quantities may easily influence prices of our common stock. This low volume of trades could also cause the price of our stock to fluctuate greatly, with large percentage changes in price occurring in any trading day session. Holders of our common stock may also not be able to readily liquidate their investment or may be forced to sell at depressed prices due to low volume trading. If high spreads between the bid and ask prices of our common stock exist at the time of a purchase, the stock would have to appreciate substantially on a relative percentage basis for an investor to recoup their investment. Broad market fluctuations and general economic and political conditions may also adversely affect the market price of our common stock. No assurance can be given that an active market in our common stock will develop or be sustained. If an active market does not develop, holders of our common stock may be unable to readily sell the shares they hold or may not be able to sell their shares at all.
| 24 |
| Table of Contents |
YOU MAY EXPERIENCE DILUTION OF YOUR OWNERSHIP INTERESTS DUE TO THE FUTURE ISSUANCE OF ADDITIONAL SHARES OF OUR COMMON STOCK WHICH COULD BE MATERIALLY ADVERSE TO THE VALUE OF OUR COMMON STOCK. As of August 31, 2019, we had 1,488,832,800 shares of our common stock and 8,500,000 shares of our preferred stock, issued and outstanding. We are authorized to issue up to 1,500,000,000 shares of common stock and 10,000,000 shares of preferred stock. Our Board of Directors may authorize the issuance of additional common or preferred shares under applicable state law without shareholder approval. We may also issue additional shares of our common stock or other securities that are convertible into or exercisable for common stock in connection with the hiring of personnel, future acquisitions, future private placements of our securities for capital raising purposes or for other business purposes, including the satisfaction of outstanding debt to affiliates and others. Future sales of substantial amounts of our common stock, or the perception that sales could occur, could have a material adverse effect on the price of our common stock. If we need to raise additional capital, it may be necessary for us to issue additional equity or convertible debt securities. If we issue equity or convertible debt securities, the net tangible book value per share may decrease, the percentage ownership of our current stockholders may be diluted and such equity securities may have rights, preferences or privileges senior or more advantageous to our common stockholders.
WE DO NOT ANTICIPATE PAYING CASH DIVIDENDS ON OUR COMMON STOCK. We do not anticipate paying any cash dividends on our common stock in the foreseeable future.
WE MAY BE UNSUCCESSFUL IN FINDING A MERGER THAT CAN BE ACCOMPLISHED WITH POSITIVE LONG-TERM RESULTS. The business of selecting and entering into a merger is fraught with all kinds of issues. For instance, the business may need capital that is never achieved, the management is not capable of carrying the business forward successfully, the business plan is ill conceived, and not executed, or competitive factors cause business failure. There are many other factors in addition to these, as may have been discussed above in “Risk Factors” which could cause our company to fail and the investors capital will be at risk.
FAILURE TO ACHIEVE AND MAINTAIN INTERNAL CONTROLS IN ACCORDANCE WITH SECTIONS 302 AND 404(A) OF THE SARBANES-OXLEY ACT OF 200 COULD HAVE A MATERIAL ADVERSE EFFECT ON OUR BUSINESS AND STOCK PRICE. If we fail to maintain adequate internal controls or fail to implement required new or improved controls, as such control standards are modified, supplemented or amended from time to time, we may not be able to assert that we can conclude on an ongoing basis that we have effective internal controls over financial reporting. Effective internal controls are necessary for us to produce reliable financial reports and are important in the prevention of financial fraud. If we cannot produce reliable financial reports or prevent fraud, our business and operating results could be harmed, investors could lose confidence in our reported financial information, and there could be a material adverse effect on our stock price.
Description of Property
We do not currently own any property. We are currently operating out of the premises on a rent basis. We consider our current principal office space arrangement adequate.
On October 1, 2018, we entered into a tenancy agreement with an unaffiliated third party for the rental of our current executive office. The rent is $123,000 per year and is a three-year lease with a two-year option to renew. The square footage of the leased premises is 17,449.
On October 1, 2018, we also rented the premises located at Level 9, Melilea Tower, No. 6, Avenue 3, The Horizon, Bangsar South, No.8, Jalan Kerinchi, 59200, Kuala Lumpur with area of 3,615 square feet. The lease was terminated on July 30, 2019 and rent was $102,000 per year.
Employee
As of the date of this filing, we have 38 full time employees, including senior management and no part time employees.
| 25 |
| Table of Contents |
Item 1B. Unresolved Staff Comments.
None.
We do not currently own any property. We are currently operating out of the premises on a rent basis. We consider our current principal office space arrangement adequate.
On October 1, 2018, we entered into a tenancy agreement with an unaffiliated third party for the rental of our current executive office. The rent is $123,000 per year and is a three-year lease with a two-year option to renew. The square footage of the leased premises is 17,449.
On October 1, 2018, we also rented the premises located at Level 9, Melilea Tower, No. 6, Avenue 3, The Horizon, Bangsar South, No.8, Jalan Kerinchi, 59200, Kuala Lumpur with area of 3,615 square feet. The rent is $102,000 per year and the lease terminated on July 30, 2019.
There are presently no pending legal proceedings to which the Company or any of its property is subject, or any material proceedings to which any director, officer or affiliate of the Company, any owner of record or beneficially of more than five percent of any class of voting securities is a party or has a material interest adverse to the Company, and no such proceedings are known to the Company to be threatened or contemplated against it.
Item 4. Mine Safety Disclosures.
None.
| 26 |
| Table of Contents |
Market Information
There is currently no established public trading market for our common shares. Our shares of common stock are approved for trading on the OTC Markets under the ticker symbol “MNIA.” Trading in stocks quoted on the OTC Markets is often thin and is characterized by wide fluctuations in trading prices due to many factors that may be unrelated to a company’s operations or business prospects.
OTC Markets securities are not listed or traded on the floor of an organized national or regional stock exchange. Instead, OTC Markets securities transactions are conducted through a telephone and computer network connecting dealers in stocks. OTC Markets issuers are traditionally smaller companies that do not meet the financial and other listing requirements of a regional or national stock exchange.
Holders
As of the date of this Report, the Company had a total of 1,488,932,800 shares of common stock and 8,500,000 shares of preferred stock, respectively issued and outstanding. The common stock is held by a total of 33 shareholders of record and the preferred stock is held by 1 shareholder of record.
Equity Compensation Plans
We do not have in effect any compensation plans under which our equity securities are authorized for issuance and we do not have any outstanding stock options.
Authorized Shares
Our Articles of Incorporation authorizes 1,500,000,000 shares of common stock and 10,000,000 shares of preferred stock, all at $0.001 par value.
Dividend Policy
The Company has not declared or paid any cash dividends on its Common Stock and does not intend to declare or pay any cash dividend in the foreseeable future. The payment of dividends, if any, is within the discretion of the Board of Directors and will depend on the Company’s earnings, if any, its capital requirements and financial condition and such other factors as the Board of Directors may consider.
Securities Authorized for Issuance under Equity Compensation Plans
The Company does not have any equity compensation plans or any individual compensation arrangements with respect to its Common Stock or Preferred Stock. The issuance of any of our Common Stock or Preferred Stock is within the discretion of our Board of Directors, which has the power to issue any or all of our authorized but unissued shares without stockholder approval.
Recent Sales of Unregistered Securities
None.
Issuer Purchases of Equity Securities
None.
| 27 |
| Table of Contents |
Item 6. Selected Financial Data.
As a “smaller reporting company” as defined by Rule 12b-2 of the Exchange Act, the Company is not required to provide this information.
Item 7. Management’s Discussion and Analysis of Financial Condition and Results of Operations.
The following discussion should be read in conjunction with our audited financial statements for the annual period ended August 31, 2019 and 2018 that appear elsewhere in this annual report. The following discussion contains forward-looking statements that reflect our plans, estimates and beliefs. Our actual results could differ materially from those discussed in the forward-looking statements. Factors that could cause or contribute to such differences include but are not limited to those discussed below and elsewhere in this annual report.
Our audited and unaudited financial statements are stated in United States Dollars and are prepared in accordance with United States Generally Accepted Accounting Principles.
Overview
We conduct our operations through our consolidated subsidiary, Cannisapp. The subsidiary was incorporated under the corporation laws in Malaysia on April 2, 2018 under the name Antara Rimbun Sdn Bhd. It affected a name changed to Nimpmos Sdn Bhd on July 5, 2018, and then to Cannisapp Sdn. Bhd. on September 12, 2018.
Cannisapp has two distinct, business segments. One is developing proprietary mobile applications and the other is acting as an offline sales distributor for nutritional supplements manufactured by third parties. We began selling nutritional supplements in September 2018. We commenced the development of our mobile applications operating on Android and iOS operating systems in June 2018.
Our offices are located at 20, Jalan 51A/225A, Section 51A, Zone Perindustrian PTJC, 46100 Petaling Jaya, Selangor, Malaysia and our website is www.cannis.app.
Cannis, Inc. formerly Zartex, Inc. was incorporated under the corporation laws in the State of Nevada on August 17, 2016. The Company changed its name from Zartex, Inc. to Cannis, Inc. on December 6, 2018. The Company was initially in the business of software development which sought to deliver services for the garment distribution industry. Effective November 14, 2018, a change of control occurred with respect to the Company. In connection with the change of control transaction, the Company ceased its operations, transferred its assets and became a “shell company.”
| 28 |
| Table of Contents |
On April 24, 2019, we filed a Certificate of Amendment with the Nevada Secretary of State whereby it amended its Articles of Incorporation by (a) increasing authorized number of shares of common stock from 75 million to 1.5 billion; and (b) creating a class of preferred stock, $0.001 par value, called the Class A Preferred Stock in the amount of 10,000,000 authorized shares, with each share of Class A Preferred Stock having 100 votes to be cast with respect to any and all matters presented to shareholders for a vote whether at a meeting of shareholders or by written consent. Apart from the voting rights stated in the preceding sentence, the Class A Preferred Stock shall have no other rights, privileges or preferences.
Recent Developments
Acquisition of Cannisapp
On August 5, 2019 (the “Closing Date”), we closed a share exchange under a Share Exchange Agreement (the “Stock Exchange Agreement”), with Cannisapp, and Mr. Ching, its sole stockholder, who is our majority shareholder and officer and director. Mr. Ching held 100% of the issued and outstanding stock of Cannisapp. Pursuant to the Stock Exchange Agreement and upon the closing of the Share Exchange, in exchange for all of the issued and outstanding capital stock of Cannisapp, we issued to Mr. Ching an aggregate amount of 1,482,492,800 shares of our common stock and 8,500,000 shares of Class A Preferred Stock, $0.001 par value, which has 100 for 1 voting rights per share. As a result of the Share Exchange, Mr. Ching remains the controlling shareholder of the Company, owning a total of 99.99% of our outstanding common stock and 100% of our outstanding Class A Preferred Stock. The Share Exchange was accounted for under the business combination under common control of accounting. As a result of the Share Exchange, we ceased to be a “shell company.”
Translation of amounts from the local currency of Cannisapp into US$1 has been made at the following exchange rates for the respective years:
|
| As of and for year ended August 31, |
|
| As of and for the year ended August 31, |
| ||
|
| 2019 |
|
| 2018 |
| ||
Year-end MYR: US$1 exchange rate |
|
| 4.2318 |
|
|
| 4.1075 |
|
Yearly average MYR: US$1 exchange rate |
|
| 4.0891 |
|
|
| 4.0379 |
|
RESULTS OF OPERATIONS
Results of Operations (Unaudited) for the Year Period Ended August 31, 2019 Compared to the Year Period Ended August 31, 2018.
The following table sets forth key components of the Company’s results of operations for the year ended August 31, 2019 compared to the year ended August 31, 2018. The discussion following the table addresses these results.
|
| For year ended August 31, 2019 |
|
| For year ended August 31, 2018 |
| ||
|
|
|
|
|
|
| ||
Revenue |
| $ | 3,529,064 |
|
| $ | - |
|
Cost of revenue |
|
| 2,504,972 |
|
|
| - |
|
Gross margin |
|
| 1,024,092 |
|
|
| - |
|
|
|
|
|
|
|
|
|
|
Operating expenses |
|
|
|
|
|
|
|
|
Selling expenses |
|
| 455,175 |
|
|
| 205,412 |
|
Research & development |
|
| 2,062,817 |
|
|
| 1,045,238 |
|
General and administrative expenses |
|
| 2,191,194 |
|
|
| 79,530 |
|
Total operating expenses |
|
| 4,709,186 |
|
|
| 1,330,180 |
|
|
|
|
|
|
|
|
|
|
Loss from operations |
|
| (3,685,094 | ) |
|
| (1,330,180 | ) |
|
|
|
|
|
|
|
|
|
Total other income/(expense) |
|
| 72,552 |
|
|
| 7,240 |
|
|
|
|
|
|
|
|
|
|
Net loss |
| $ | (3,612,542 | ) |
| $ | (1,322,940 | ) |
| 29 |
| Table of Contents |
Revenues. For the year ended August 31, 2019, we had revenue of $3,529,064, which were derived mostly from offline sales of nutritional supplements. For the year ended August 31, 2018, the Company did not generate any revenues. We act as a distributor for two different manufacturers and we began selling these supplements in September 2018.
We began developing our proprietary mobile applications in June 2018. We have not generated revenues from these applications for the year ended August 31, 2018 and 2019. We intend to integrate our offline sales with our mobile applications platform as part of our marketing strategy.
Cost of Revenue. For the year ended August 31, 2019, we had cost of revenue of $2,504,972, which represent costs of nutritional supplements sold. We did not generate any costs of revenue for the year ended August 31, 2018.
Operating expenses. Operating expenses consist of selling expenses, general and administrative expenses, and research and development expense.
For the year ended August 31, 2019, we had selling expenses of $455,175 compared with selling expenses of $205,412 for the year ended August 31, 2018, representing an increase of $249,763, or 122%. The increase in selling expenses for the current period is due to employee headcount increase and additional promotional activities taking place for the Company beginning in October 2018. Selling expenses include marketing and advertising costs related to the operations and development of Cannisapp.
For the year ended August 31, 2019, we had general and administrative expenses of $2,191,194, compared with general and administrative expenses of $79,530 for the year ended August 31, 2018, representing a significant increase of $2,111,664. The increase in general and administrative expenses for the current period reflects the significant growth in the Company’s business operations from October 2018. General and administrative expenses mainly consist of salaries and related employee benefits, office expenses, professional service fees, depreciation expenses, rent, and related costs.
For the year ended August 31, 2019, we had software research and development expenses of $2,062,817 compared with general and administrative expenses of $1,045,238 for the year ended August 31, 2018, representing an increase of $1,017,579, or 97%.
Loss from Operations. For the year ended August 31, 2019, we had loss from operations of $3,685,094 compared with loss from operations of $1,330,180 for the year ended August 31, 2018.
Other income/(expense). For the year ended August 31, 2019, we had total other income of $72,552 compared with total other income of $7,240 for the year ended August 31, 2018. The increase in other income was mainly due to the extinguish of debt by former shareholder in the amount of $35,236 for the year ended August 31, 2019.
| 30 |
| Table of Contents |
Liquidity and Capital Resources
Working Capital Deficit.
As of August 31, 2019, The Company had working capital deficit of $5,354,942, compared to a working capital deficit of $1,476,739 as of August 31, 2018. The increase in working capital deficit is a result of a significant increase in accounts payable and a substantial increase in related party payables as of August 31, 2019. The increase in both balances are related to the operational costs of the Company as it further develops and launches its mobile applications.
Cash Flows.
The following is a summary of the Company’s cash flows from operating, investing and financing activities for the year ended August 31, 2019 and 2018, respectively:
|
| Year ended August 31, 2019 |
|
| Year ended August 31, 2018 |
| ||
Net cash used in operating activities |
| $ | (1,924,111 | ) |
| $ | (950,087 | ) |
Net cash used in investing activities |
|
| (611,759 | ) |
|
| (178,678 | ) |
Net cash provided by financing activities |
|
| 2,595,870 |
|
|
| 1,099,806 |
|
Net change in cash and cash equivalents |
| $ | 60,000 |
|
| $ | (28,959 | ) |
Operating Activities
Net cash used in operating activities was $1,924,111 for the year ended August 31, 2019 compared with net cash used in operating activities of $950,087 for the year ended August 31, 2018. The increase was primarily the result of the significant increase in operating expenses of Cannisapp, partly offset by the increase in account payable.
Investing Activities
Net cash used in investing activities was $611,759 for the year ended August 31, 2019, compared to net cash used in investing activities of $178,678 for the year ended August 31, 2018. Net cash used in investing activities solely reflect purchase of fixed assets, such as computer, office equipment and leasehold improvement.
Financing Activities
Net cash provided by financing activities was $2,595,870 for the year ended August 31, 2019 compared to $1,099,806 for the year ended August 31, 2018. All of the cash inflow was advances from our related party. We continue to rely on advances from our majority shareholder to fund our operations.
Going Concern
The financial statements have been prepared “assuming that we will continue as a going concern,” which contemplates that we will realize our assets and satisfy our liabilities and commitments in the ordinary course of business.
Our monthly expenses are estimated to be $2,300,000 per month. The estimated monthly allocations are as follows:
| - | office rental at $100,000, |
|
|
| - | employee accommodations at $50,000, |
|
|
| - | salaries at $500,000, |
|
|
| - | research and development at $1,000,000 |
|
|
| - | other overheads, including legal and professional fees, travel expenses, maintenance and marketing cost at $120,000, and |
|
|
| - | consulting fees at $530,000. |
| 31 |
| Table of Contents |
The Company has not yet established an ongoing source of revenues and cash flows sufficient to cover the operating costs and allow it to continue as a going concern. The Company has a accumulated net loss of $4,954,178 as of August 31, 2019. These factors among others raise substantial doubt about the ability to continue as a going concern for a reasonable period of time.
In order to continue as a going concern, The Company will need, among other things, additional capital resources. Management’s plan is to obtain such resources by obtaining capital from management and significant shareholders sufficient to meet its minimal operating expenses and seeking third party equity and/or debt financing. However, management cannot provide any assurances that the Company will be successful in accomplishing any of its plans. These financial statements do not include any adjustments related to the recoverability and classification of assets or the amounts and classification of liabilities that might be necessary should the Company be unable to continue as a going concern.
Material commitments
As of the date of this Annual Report, we do not have any material commitments.
Off-balance sheet arrangements
As of the date of this Annual Report, we do not have any off-balance sheet arrangements that have or are reasonably likely to have a current or future effect on our financial condition, changes in financial condition, revenues or expenses, results of operations, liquidity, capital expenditures or capital resources that are material to investors.
SUMMARY OF SIGNIFICANT ACCOUNTING POLICIES
Basis of Presentation
The financial statements of the Company have been prepared in accordance with generally accepted accounting principles in the United States of America (“US GAAP”).
The accompanying consolidated financial statements include the accounts of the Company and its subsidiary. Significant inter-company transactions have been eliminated in consolidation.
In accordance with ASC 805-50-45-5, for transactions between entities under common control, financial statements and financial information presented for prior periods have been be retroactively adjusted to furnish comparative information. The accompanying consolidated financial statements are presented retrospectively as though the share exchange agreement between the Cannis, Inc. and Cannisapp Sdn Bhd occurred at the beginning of the first period presented.
Use of Estimates
The preparation of financial statements in conformity with accounting principles generally accepted in the United States of America requires management to make estimates and assumptions that affect the reported amounts of assets, liabilities, revenue, and expenses. Actual results and outcomes may differ from management’s estimates and assumptions.
Functional and presentation currency
The accompanying consolidated financial statements are presented in United States dollar (“$”), which is the reporting currency of the Company.
| 32 |
| Table of Contents |
The functional currency of Cannis Inc. is United States dollar.
The functional currency of the Connisapp is the currency of the primary economic environment in which Cannisapp operates, which is Malaysia Ringgit (“MYR”).
Transactions in currencies other than the entity’s functional currency are recorded at the rates of exchange prevailing on the date of the transaction. At the end of each reporting period, monetary items denominated in foreign currencies are translated at the rates prevailing at the end of the reporting periods. Exchange differences arising on the settlement of monetary items and on translation of monetary items at period-end are included in income statement of the period.
For the purpose of presenting these financial statements, the Company’s assets and liabilities are expressed in US$ at the exchange rate on the balance sheet date, stockholder’s equity accounts are translated at historical rates, and income and expense items are translated at the weighted average exchange rate during the period. The resulting translation adjustments are reported under accumulated other comprehensive income in the stockholder’s equity section of the balance sheets.
Fair Values of Financial Instruments
The Company adopted ASC 820 “Fair Value Measurements,” which defines fair value, establishes a three-level valuation hierarchy for disclosures of fair value measurement and enhances disclosures requirements for fair value measures. Current assets and current liabilities qualified as financial instruments and management believes their carrying amounts are a reasonable estimate of fair value because of the short period of time between the origination of such instruments and their expected realization and if applicable, their current interest rate is equivalent to interest rates currently available. The three levels are defined as follow:
| Level 1 — inputs to the valuation methodology are quoted prices (unadjusted) for identical assets or liabilities in active markets. |
| Level 2 — inputs to the valuation methodology include quoted prices for similar assets and liabilities in active markets, and inputs that are observable for the assets or liability, either directly or indirectly, for substantially the full term of the financial instruments. |
| Level 3 — inputs to the valuation methodology are unobservable and significant to the fair value. |
As of the balance sheet date, the estimated fair values of the financial instruments approximated their fair values due to the short-term nature of these instruments. Determining which category an asset or liability falls within the hierarchy requires significant judgment. The Company evaluates the hierarchy disclosures each year.
Related Parties
The Company adopted ASC 850, Related Party Disclosures, for the identification of related parties and disclosure of related party transactions.
Cash and Equivalents
The Company considers all highly liquid investments purchased with an original maturity of three months or less to be cash equivalents.
Accounts Receivable
Accounts receivable is recorded at the net value of less estimates for doubtful accounts. Management regularly reviews outstanding accounts and provides an allowance for doubtful accounts. When collection of the original invoice amounts is no longer probable, the Company will either partially or fully write-off the balance against the allowance for doubtful accounts.
Bad debt expenses were $nil and $nil for the year ended August 31, 2019 and 2018.
| 33 |
| Table of Contents |
Revenue Recognition
In 2014, the FASB issued guidance on revenue recognition (“ASC 606”), with final amendments issued in 2016. The underlying principle of ASC 606 is to recognize revenue to depict the transfer of goods or services to customers at the amount expected to be collected. ASC 606 creates a five-step model that requires entities to exercise judgment when considering the terms of contracts, which includes (1) identifying the contracts or agreements with a customer, (2) identifying our performance obligations in the contract or agreement, (3) determining the transaction price, (4) allocating the transaction price to the separate performance obligations, and (5) recognizing revenue as each performance obligation is satisfied. The Company only applies the five-step model to contracts when it is probable that the Company will collect the consideration it is entitled to in exchange for the services it transfers to its clients. The Company has concluded that the new guidance did not require any significant change to its revenue recognition processes.
The Company’s revenues mainly consist of offline products sales. The Company generally recognizes product sales revenue when the performance obligation have been satisfied pursuant to Malaysia law, including such factors as contract existed with the customer, delivery and acceptance of products by customer has occurred, the sales price is fixed or determinable and allocated to the products sold, sales and value-added tax laws have been complied with, and collectability is reasonably assured.
The Company estimates potential returns and records such estimates against its gross revenue to arrive at its reported net sales revenue. The Company has not experienced any sales returns.
Inventory
Inventories, which are primarily comprised of finished goods for sale, are stated at the lower of cost or net realizable value, using the first-in first-out (FIFO) method. The Company evaluates the need for reserves associated with obsolete, slow-moving and non-salable inventory by reviewing net realizable values on a periodic basis. Only defects products can be return to our suppliers.
Customer Deposits
The Company charges deposits when customers rent the power bank. The deposits will be fully refunded after the power bank is returned.
Advertising
The Company expenses advertising costs as incurred and includes it in selling expenses. The Company recorded $245,660 and $205,412 for advertising and promotions expenses for the year ended August 31, 2019 and 2018, respectively.
Income Taxes
Income taxes are provided in accordance with ASC No. 740, Accounting for Income Taxes. A deferred tax asset or liability is recorded for all temporary differences between financial and tax reporting and net operating loss carry-forwards. Deferred tax expense (benefit) results from the net change during the year of deferred tax assets and liabilities.
Deferred tax assets are reduced by a valuation allowance when, in the opinion of management, it is more likely than not that some portion of all of the deferred tax assets will be realized. Deferred tax assets and liabilities are adjusted for the effects of changes in tax laws and rates on the date of enactment.
A tax benefit from an uncertain tax position may be recognized only if it is more likely than not that the tax position will be sustained on examination by the taxing authorities. The determination is based on the technical merits of the position and presumes that the relevant taxing authority that has full knowledge of all relevant information will examine each uncertain tax position. Although the Company believes the estimates are reasonable, no assurance can be given that the final outcome of these matters will not be different than what is reflected in the historical income tax provisions and accruals.
| 34 |
| Table of Contents |
Property and Equipment & Depreciation
Property and equipment consist of computer, cellphone, office furniture and equipment, and leasehold improvement. All property and equipment are stated at historical cost net of accumulated depreciation. Repairs and maintenance are expensed as incurred. Property and equipment is depreciated on a straight-line basis over the following periods:
Computer and Electronics | 5 years |
Furniture and Fixture | 10 years |
Equipment | 10 years |
Leasehold Improvement | 10 years |
Leases
We determine if an arrangement is a lease at inception. Operating leases are included in operating lease right-of-use (“ROU”) assets, operating lease liabilities - current, and operating lease liabilities - noncurrent on the balance sheets. Finance leases are included in property and equipment, other current liabilities, and other long-term liabilities in our balance sheets.
ROU assets represent our right to use an underlying asset for the lease term and lease liabilities represent our obligation to make lease payments arising from the lease. Operating lease ROU assets and liabilities are recognized at commencement date based on the present value of lease payments over the lease term. As most of our leases do not provide an implicit rate, we generally use our incremental borrowing rate based on the estimated rate of interest for collateralized borrowing over a similar term of the lease payments at commencement date. The operating lease ROU asset also includes any lease payments made and excludes lease incentives. Our lease terms may include options to extend or terminate the lease when it is reasonably certain that we will exercise that option. Lease expense for lease payments is recognized on a straight-line basis over the lease term.
We do not have any lease agreements with lease and non-lease components which should generally accounted separately. For certain equipment leases, such as vehicles, we account for the lease and non-lease components as a single lease component. Additionally, for certain equipment leases, we apply a portfolio approach to effectively account for the operating lease ROU assets and liabilities.
Impairment of Long-lived Assets
The Company accounts for impairment of property and equipment and amortizable intangible assets in accordance with ASC 360, “Accounting for Impairment of Long-Lived Assets and Long-Lived Assets to be Disposed Of”, which requires the Company to evaluate a long-lived asset for recoverability when there is event or circumstance that indicate the carrying value of the asset may not be recoverable. An impairment loss is recognized when the carrying amount of a long-lived asset or asset group is not recoverable (when carrying amount exceeds the gross, undiscounted cash flows from use and disposition) and is measured as the excess of the carrying amount over the asset’s (or asset group’s) fair value.
Segment Information
The Company follows ASC-280, Disclosures about Segments of an Enterprise and Related Information, which requires certain financial and supplementary information to be disclosed on an annual and interim basis for each reportable segment of an enterprise. The Company believes that it operates in two business segments and in one geographical segment Malaysia.
Sales, cost of goods sold, and profit margin of each business segment as follows:
Business Segment |
| Offline |
|
| Online |
| ||
Sales |
| $ | 3,529,064 |
|
|
| - |
|
Cost of Goods Sold |
| $ | 2,504,972 |
|
|
| - |
|
Profit Margin |
|
| 29.02 | % |
|
| - |
|
Research & Development Expenses
Product development expenses consist primarily of third-party development and programming costs and other expenses that are directly attributable to the development of mobile applications, databases, software for the businesses of the Company.
| 35 |
The Company expenses all costs that are incurred in connection with the planning and implementation phases of development and costs that are associated with repair or maintenance of the existing mobile applications or the development of software and content.
Costs incurred in the development phase can be capitalized and amortized over the estimated product life when technological feasibility is reached. However, since the inception of Cannisapp Sdn Bhd, the amount of costs qualifying for capitalization has been insignificant. As a result, all development costs have been expensed as incurred.
New Accounting Pronouncements
In February, 2016, the FASB issued Accounting Standards Update No. 2016-02 (ASU 2016-02) “Leases (Topic 842)”. ASU 2016-02 requires a lessee to recognize in the statement of financial position a liability to make lease payments (the lease liability) and a right-of-use asset representing its right to use the underlying asset for the lease term. ASU 2016-02 is effective for interim and annual reporting periods beginning after December 15, 2018. Early adoption is permitted.
For finance leases, a lessee is required to do the following:
| · | Recognize a right-of-use asset and a lease liability, initially measured at the present value of the lease payments, in the statement of financial position |
| · | Recognize interest on the lease liability separately from amortization of the right-of-use asset in the statement of comprehensive income |
| · | Classify repayments of the principal portion of the lease liability within financing activities and payments of interest on the lease liability and variable lease payments within operating activities in the statement of cash flows. |
For operating leases, a lessee is required to do the following:
| · | Recognize a right-of-use asset and a lease liability, initially measured at the present value of the lease payments, in the statement of financial position |
| · | Recognize a single lease cost, calculated so that the cost of the lease is allocated over the lease term on a generally straight-line basis |
| · | Classify all cash payments within operating activities in the statement of cash flows. |
In July, 2018, the FASB issued Accounting Standards Update No. 2018-11 (ASU 2018-11), which amends ASC 842 so that entities may elect not to recast their comparative periods in transition (the “Comparatives Under 840 Option”). ASU 2018-11 allows entities to change their date of initial application to the beginning of the period of adoption. In doing so, entities would:
| · | Apply ASC 840 in the comparative periods. |
| · | Provide the disclosures required by ASC 840 for all periods that continue to be presented in accordance with ASC 840. |
| · | Recognize the effects of applying ASC 842 as a cumulative-effect adjustment to retained earnings for the period of adoption. |
In addition, the FASB also issued a series of amendments to ASU 2016-02 that address the transition methods available and clarify the guidance for lessor costs and other aspects of the new lease standard.
The management has reviewed the accounting pronouncements and adopted the new standard on September 1, 2019 using the modified retrospective method of adoption. The transition method expedient which allows entities to initially apply the requirements by recognizing a cumulative-effect adjustment to the opening balance of retained earnings in the period of adoption. As a result of electing this transition method, prior periods have not been restated. The adoption of this ASU resulted in the recording of additional lease assets and liabilities $501,302 each with no effect to opening balance of retained earnings as the Company did not have any leases prior to the adoption of this ASU.
Contractual Obligations
As a “smaller reporting company” as defined by Rule 12b-2 of the Exchange Act, the Company is not required to provide this information.
Item 7A. Quantitative and Qualitative Disclosures About Market Risk.
As a “smaller reporting company” as defined by Rule 12b-2 of the Exchange Act, the Company is not required to provide this information.
Item 8. Financial Statements and Supplementary Data.
Audited financial statements begin on the following page of this report.
| 36 |
| Table of Contents |
CANNIS, INC.
|
| Page |
|
|
|
| |
| F-2 |
| |
|
|
| |
| F-3 |
| |
|
|
| |
| F-4 |
| |
|
|
| |
| F-5 |
| |
|
|
| |
| F-6 |
| |
|
|
| |
| F-7 |
|
| F-1 |
| Table of Contents |
REPORT OF INDEPENDENT REGISTERED PUBLIC ACCOUNTING FIRM
| To: | The Board of Directors and Stockholders of |
|
|
| Cannis, Inc. |
Opinion on the Financial Statements
We have audited the accompanying consolidated balance sheets of Cannis, Inc. and subsidiaries (the Company) as of August 31, 2019 and August 31, 2018, and the consolidated related statements of operations, stockholders’ equity, and cash flows for each of the years in the two-year period ended August 31, 2019, and the related notes (collectively referred to as the consolidated financial statements). In our opinion, the consolidated financial statements present fairly, in all material respects, the financial position of the Company as of August 31, 2019 and August 31, 2018, and the results of its operations and its cash flows for each of the years in the two-year period ended August 31, 2019, in conformity with accounting principles generally accepted in the United States of America.
Explanatory Paragraph Regarding Going Concern
The accompanying consolidated financial statements have been prepared assuming that the Company will continue as a going concern. As discussed in Note 3 to the consolidated financial statements, the Company had incurred substantial losses during the year, and has a working capital deficit, which raises substantial doubt about its ability to continue as a going concern. Management’s plan in regards to these matters are described in Note 3. These consolidated financial statements do not include any adjustments that might result from the outcome of this uncertainty.
Basis for Opinion
These consolidated financial statements are the responsibility of the Company’s management. Our responsibility is to express an opinion on the Company’s consolidated financial statements based on our audits. We are a public accounting firm registered with the Public Company Accounting Oversight Board (United States) (PCAOB) and are required to be independent with respect to the Company in accordance with the U.S. federal securities laws and the applicable rules and regulations of the Securities and Exchange Commission and the PCAOB.
We conducted our audits in accordance with the standards of the PCAOB. Those standards require that we plan and perform the audit to obtain reasonable assurance about whether the financial statements are free of material misstatement, whether due to error or fraud. The Company is not required to have, nor were we engaged to perform, an audit of its internal control over financial reporting. As part of our audits, we are required to obtain an understanding of internal control over financial reporting, but not for the purpose of expressing an opinion on the effectiveness of the Company’s internal control over financial reporting. Accordingly, we express no such opinion.
Our audits included performing procedures to assess the risks of material misstatement of the financial statements, whether due to error or fraud, and performing procedures that respond to those risks. Such procedures included examining, on a test basis, evidence regarding the amounts and disclosures in the financial statements. Our audits also included evaluating the accounting principles used and significant estimates made by management, as well as evaluating the overall presentation of the consolidated financial statements. We believe that our audits provide a reasonable basis for our opinion.
| /s/ JLKZ CPA LLP |
|
| |
| JLKZ CPA LLP. |
|
| |
| Flushing, New York |
|
| |
| December 16, 2019 |
|
|
We have served as the Company’s auditor since 2016
| F-2 |
| Table of Contents |
Cannis, Inc. and Subsidiaries |
| |||||||
| ||||||||
August 31, 2019 and 2018 |
| |||||||
|
|
|
|
|
|
| ||
|
| August 31, |
|
| August 31, |
| ||
|
| 2019 |
|
| 2018 |
| ||
|
|
|
|
|
| |||
ASSETS | ||||||||
Current assets |
|
|
|
|
|
| ||
Cash and cash equivalents |
| $ | 118,128 |
|
| $ | 17,439 |
|
Inventories |
|
| 18,476 |
|
|
| 26,164 |
|
Due from related parties |
|
| 24,530 |
|
|
|
|
|
Prepayment and other current assets, net |
|
| 97,044 |
|
|
| 3,468 |
|
Total current assets |
|
| 258,178 |
|
|
| 47,071 |
|
|
|
|
|
|
|
|
|
|
Non-current assets |
|
|
|
|
|
|
|
|
Property, plant and equipment, net |
|
| 731,539 |
|
|
| 185,311 |
|
Operating lease right of use asset, net |
|
| 283,084 |
|
|
|
| |
Deposits |
|
| 42,261 |
|
|
| - |
|
Total non-current assets |
|
| 1,056,884 |
|
|
| 185,311 |
|
Total Assets |
| $ | 1,315,062 |
|
| $ | 232,382 |
|
|
|
|
|
|
|
|
|
|
LIABILITIES AND SHAREHOLDERS' EQUITY | ||||||||
Current liabilities |
|
|
|
|
|
|
|
|
Operating lease liabilities - current |
|
| 10,671 |
|
|
| - |
|
Accounts payable and accrued liabilities |
| $ | 1,983,745 |
|
| $ | 403,272 |
|
Customer deposit |
|
| 165,749 |
|
|
| - |
|
Due to related parties |
|
| 3,388,039 |
|
|
| 1,117,070 |
|
Other payables |
|
| 64,916 |
|
|
| - |
|
Total current liabilities |
|
| 5,613,120 |
|
|
| 1,520,342 |
|
Non-current liabilities |
|
|
|
|
|
|
|
|
Operating lease liabilities - noncurrent |
|
| 272,413 |
|
|
| - |
|
Total liabilities |
|
| 5,885,533 |
|
|
| 1,520,342 |
|
|
|
|
|
|
|
|
|
|
Shareholders' equity |
|
|
|
|
|
|
|
|
Class A Preferred Stock ($0.001 par value, 10,000,000 shares authorized, 8,500,000 shares issued and outstanding as of August 31,2019 and 2018) |
|
| 8,500 |
|
|
| 8,500 |
|
Common Stock ($0.001 par value, 1,500,000,000 shares authorized; 1,488,832,800 shares issued and outstanding as of August 31, 2019 and 2018) |
|
| 1,488,833 |
|
|
| 1,488,833 |
|
Additional paid-in capital |
|
| (1,289,533 | ) |
| (1,465,533) |
| |
Accumulated deficit |
|
| (4,954,178 | ) |
| (1,341,636) |
| |
Accumulated other comprehensive income |
|
| 175,907 |
|
|
| 21,876 |
|
Total shareholders' equity |
|
| (4,570,471 | ) |
| (1,287,960) |
| |
Total Liabilities and Shareholders' Equity |
| $ | 1,315,062 |
|
| $ | 232,382 |
|
|
|
| - |
|
|
| - |
|
The accompanying notes are an integral part of these consolidated financial statements
| F-3 |
| Table of Contents |
Cannis, Inc. and Subsidiaries | ||||||||
|
|
|
|
|
| |||
|
| For the Years Ended August 31, |
| |||||
|
| 2019 |
|
| 2018 |
| ||
|
|
|
|
|
|
| ||
Net revenues |
| $ | 3,529,064 |
|
| $ | - |
|
Cost of revenues |
|
| 2,504,972 |
|
|
| - |
|
Gross margin |
|
| 1,024,092 |
|
|
| - |
|
Operating expenses: |
|
|
|
|
|
|
|
|
Research and development |
|
| 2,062,817 |
|
|
| 1,045,238 |
|
Selling, general and administrative |
|
| 2,646,369 |
|
|
| 284,942 |
|
Total operating expenses |
|
| 4,709,186 |
|
|
| 1,330,180 |
|
|
|
|
|
|
|
|
|
|
Loss from operations |
|
| (3,685,094 | ) |
|
| (1,330,180 | ) |
|
|
|
|
|
|
|
|
|
Other income/(loss) |
|
|
|
|
|
|
|
|
Gain from extinguishment of related party debt |
|
| 35,236 |
|
|
| - |
|
Other income |
|
| 37,316 |
|
|
| 7,240 |
|
Total other income(loss) |
|
| 72,552 |
|
|
| 7,240 |
|
|
|
|
|
|
|
|
|
|
Operating loss before income taxes |
|
| (3,612,542 | ) |
|
| (1,322,940 | ) |
|
|
|
|
|
|
|
|
|
Provision for income taxes |
|
|
|
|
|
|
|
|
|
|
|
|
|
|
|
|
|
Net loss |
|
| (3,612,542 | ) |
|
| (1,322,940 | ) |
|
|
|
|
|
|
|
|
|
Other comprehensive income (loss) |
|
|
|
|
|
|
|
|
Net loss |
|
| (3,612,542 | ) |
|
| (1,322,940 | ) |
Foreign currency translation adjustment |
|
| 154,031 |
|
|
| 21,876 |
|
Total comprehensive income |
| $ | (3,458,511 | ) |
| $ | (1,301,064 | ) |
|
|
|
|
|
|
|
|
|
Loss per share |
|
|
|
|
|
|
|
|
Basic and Diluted |
| $ | 0.00 |
|
| $ | 0.00 |
|
Weighted average shares outstanding |
|
|
|
|
|
|
|
|
Basic and Diluted |
|
| 1,488,832,800 |
|
|
| 1,488,832,800 |
|
The accompanying notes are an integral part of these consolidated financial statements
| F-4 |
| Table of Contents |
Cannis, Inc. and Subsidiaries
Statements of Changes in Shareholders’ Equity
|
| No. of Class A Preferred Stock |
|
| Class A Preferred Stock |
|
| No. of Common Stock |
|
| Common Stock |
|
| Additional Paid In Capital |
|
| Accumulated Deficit |
|
| Accumulated other Comprehensive Income |
|
| Total |
| ||||||||
|
|
|
|
| $ |
|
|
|
|
| $ |
|
| $ |
|
| $ |
|
| $ |
|
| $ |
| ||||||||
Balance at August 31, 2017 |
|
| 8,500,000 |
|
|
| 8,500 |
|
|
| 1,488,832,800 |
|
|
| 1,488,833 |
|
|
| (1,465,533 | ) |
|
| (18,696 | ) |
|
|
|
|
| 13,104 |
| |
Net loss |
|
|
|
|
|
|
|
|
|
|
|
|
|
|
|
|
|
|
|
|
|
| (1,322,940 | ) |
|
|
|
|
| (1,322,940 | ) | |
Foreign Currency Translation Adjustment |
|
|
|
|
|
|
|
|
|
|
|
|
|
|
|
|
|
|
|
|
|
|
|
|
|
| 21,876 |
|
|
| 21,876 |
|
Balance at August 31, 2018 |
|
| 8,500,000 |
|
| $ | 8,500 |
|
|
| 1,488,832,800 |
|
| $ | 1,488,833 |
|
| $ | (1,465,533 | ) |
| $ | (1,341,636 | ) |
| $ | 21,876 |
|
| $ | (1,287,960 | ) |
Conversion of related party debt into common stock |
|
|
|
|
|
|
|
|
|
|
|
|
|
| 179,169 |
|
|
|
|
|
|
|
|
|
|
|
|
|
|
| 179,169 |
|
Issue of common stock to new shareholders |
|
|
|
|
|
|
|
|
|
|
|
|
|
| (179,169 | ) |
|
| 176,000 |
|
|
|
|
|
|
|
|
|
|
| (3,169 | ) |
Net Loss |
|
|
|
|
|
|
|
|
|
|
|
|
|
|
|
|
|
|
|
|
|
| (3,612,542 | ) |
|
|
|
|
|
| (3,612,542 | ) |
Foreign Currency Translation Adjustment |
|
|
|
|
|
|
|
|
|
|
|
|
|
|
|
|
|
|
|
|
|
|
|
|
|
| 154,031 |
|
|
| 154,031 |
|
Balance at August 31, 2019 |
|
| 8,500,000 |
|
| $ | 8,500 |
|
|
| 1,488,832,800 |
|
| $ | 1,488,833 |
|
| $ | (1,289,533 | ) |
| $ | (4,954,178 | ) |
| $ | 175,907 |
|
| $ | (4,570,471 | ) |
The accompanying footnotes are an integral part of these consolidated financial statements
| F-5 |
| Table of Contents |
Cannis, Inc. and Subsidiaries | ||||||||
|
|
|
|
|
| |||
|
| For the Years Ended August 31, |
| |||||
|
| 2019 |
|
| 2018 |
| ||
Cash flows from operating activities |
|
|
|
|
|
| ||
Net Loss |
| $ | (3,612,542 | ) |
| $ | (1,322,940 | ) |
Adjustments to reconcile net loss to net cash from operations: |
|
|
|
|
|
|
|
|
Depreciation |
|
| 34,173 |
|
|
| 5,502 |
|
Extinguishment of related party debt |
|
| (35,236 | ) |
|
|
|
|
Changes in assets and liabilities: |
|
|
|
|
|
|
|
|
Accounts receivable |
|
| - |
|
|
| - |
|
Inventories |
|
| 7,161 |
|
|
| (26,164 | ) |
Prepaid expenses |
|
| (99,038 | ) |
|
| - |
|
Deposit |
|
| (43,736 | ) |
|
| - |
|
Due from related parties |
|
| (25,386 | ) |
|
|
|
|
Other receivables |
|
| (1,393 | ) |
|
| - |
|
Accounts payable |
|
| 1,613,171 |
|
|
| 393,515 |
|
Customer deposits |
|
| 171,534 |
|
|
| - |
|
Other payables |
|
| 67,181 |
|
|
| - |
|
Net cash used in operating activities |
| $ | (1,924,111 | ) |
| $ | (950,087 | ) |
|
|
|
|
|
|
|
|
|
Cash flows from investing activities |
|
|
|
|
|
|
|
|
Purchases of property, plant and equipment |
|
| (611,759 | ) |
|
| (178,678 | ) |
Net cash used in investing activities |
| $ | (611,759 | ) |
| $ | (178,678 | ) |
|
|
|
|
|
|
|
|
|
Cash flows from financing activities |
|
|
|
|
|
|
|
|
Proceeds from related parties advances |
|
| 2,595,870 |
|
|
| 1,099,806 |
|
Net cash provided by financing activities |
| $ | 2,595,870 |
|
| $ | 1,099,806 |
|
|
|
|
|
|
|
|
|
|
Net increase/(decrease) in cash, and cash equivalents |
|
| 60,000 |
|
|
| (28,959 | ) |
|
|
|
|
|
|
|
|
|
Effect on changes in foreign exchange rate |
|
| 40,689 |
|
|
| 21,849 |
|
Cash, and cash equivalents, beginning of period |
|
| 17,439 |
|
|
| 24,549 |
|
|
|
|
|
|
|
|
|
|
Cash, and cash equivalents, end of period |
| $ | 118,128 |
|
| $ | 17,439 |
|
|
|
| - |
|
|
| - |
|
Supplementary non-cash investing and financing activities: |
|
|
|
|
|
|
|
|
Conversion of related party debt into ordinary shares |
|
| 179,169 |
|
|
| - |
|
Recognized ROU assets through lease liabilities |
| $ | 352,266 |
|
| $ | - |
|
|
|
|
|
|
|
|
|
|
Supplemental cash flow information |
|
|
|
|
|
|
|
|
Cash paid for interest |
| $ | - |
|
| $ | - |
|
Cash paid for income taxes |
| $ | - |
|
| $ | - |
|
The accompanying footnotes are an integral part of these consolidated financial statements
| F-6 |
| Table of Contents |
NOTE 1 – ORGANIZATION AND BASIS OF PRESENTATION
Cannis, Inc. (“Cannis”), formerly Zartex, Inc. was incorporated under the laws of the State of Nevada on August 17, 2016.
Effective November 14, 2018, a change of control occurred with respect to Cannis, Inc. where Mr. Eu Boon Ching acquired 99.9% of Cannis’s issued and outstanding common stock from former shareholders of Cannis. Simultaneously, Cannis ceased its operations, transferred its assets and became a “shell company”. Mr. Ching also became sole officer and director of Cannis following the change of control.
On August 5, 2019, Cannis, Inc., Cannisapp Sdn Bhd (“Cannisapp”), and Mr. Ching entered into a Stock Exchange Agreement. Pursuant to the terms of the Stock Exchange Agreement, Cannis, Inc. issued an aggregate of 1,482,492,800 shares of common stock and 8,500,000 shares of Class A Preferred Stock for all of the outstanding capital stock of Cannisapp. As a result, Cannisapp became a wholly owned subsidiary of Cannis, Inc. Immediately following the Share Exchange, the business of Cannisapp became the business of Cannis, Inc. and the executive officers of Cannisapp became executive officers of the Company.
Cannisapp Sdn Bhd, formerly known as Antara Rimbun Sdn Bhd, was incorporated in Malaysia on April 2, 2018 and Mr. Ching owned 100% of the issued and outstanding stock of Cannisapp.
Cannis entered into a share exchange agreement with Cannisapp whereas the acquisition was accounted under US GAAP as a business combination under common control with Cannis being the acquirer and Cannisapp being the acquiree as both entities were owned by the same controlling shareholder prior to the business combination. Accordingly, historical cost is the basis for transfer of assets and liabilities in the business combination in accordance with ASC 805-50-30-5.
Cannis, Inc. and its consolidated subsidiary is collectively referred to herein as the “Company”, “we” and “us”, unless specific reference is made to an entity.
NOTE 2 – SUMMARY OF SIGNIFICANT ACCOUNTING POLICIES
Basis of presentation
The financial statements of the Company have been prepared in accordance with generally accepted accounting principles in the United States of America (“US GAAP”).
The accompanying consolidated financial statements include the accounts of the Company and its subsidiary. Significant inter-company transactions have been eliminated in consolidation.
In accordance with ASC 805-50-45-5, for transactions between entities under common control, financial statements and financial information presented for prior periods have been be retroactively adjusted to furnish comparative information. The accompanying consolidated financial statements are presented retrospectively as though the share exchange agreement between the Cannis, Inc. and Cannisapp Sdn Bhd occurred at the beginning of the first period presented.
| F-7 |
| Table of Contents |
Cannisapp Sdn Bhd did not have any activities for the period from April 2, 2018 (Inception) and May 31, 2018, therefore it was not presented in the financial statements.
Use of estimates
The preparation of financial statements in conformity with accounting principles generally accepted in the United States of America requires management to make estimates and assumptions that affect the reported amounts of assets, liabilities, revenue, and expenses. Actual results and outcomes may differ from management’s estimates and assumptions.
Functional and presentation currency
The accompanying consolidated financial statements are presented in United States dollar (“$”), which is the reporting currency of the Company.
The functional currency of Cannis Inc. is United States dollar.
The functional currency of Cannisapp is the currency of the primary economic environment in which Cannisapp operates which is Malaysia Ringgit (“MYR”).
Transactions in currencies other than the entity’s functional currency are recorded at the rates of exchange prevailing on the date of the transaction. At the end of each reporting period, monetary items denominated in foreign currencies are translated at the rates prevailing at the end of the reporting periods. Exchange differences arising on the settlement of monetary items and on translation of monetary items at period-end are included in income statement of the period.
For the purpose of presenting these financial statements, the Company’s assets and liabilities are expressed in US$ at the exchange rate on the balance sheet date, stockholder’s equity accounts are translated at historical rates, and income and expense items are translated at the weighted average exchange rate during the period. The resulting translation adjustments are reported under accumulated other comprehensive income in the stockholder’s equity section of the balance sheets.
Exchange rate used for the translation as follows:
US$ to MYR
|
| Period End |
|
| Average |
| ||
August 31, 2018 |
|
| 4.1075 |
|
|
| 4.0379 |
|
August 31, 2019 |
|
| 4.2318 |
|
|
| 4.0891 |
|
| F-8 |
| Table of Contents |
Fair values of financial instruments
The Company adopted ASC 820 “Fair Value Measurements,” which defines fair value, establishes a three-level valuation hierarchy for disclosures of fair value measurement and enhances disclosures requirements for fair value measures. Current assets and current liabilities qualified as financial instruments and management believes their carrying amounts are a reasonable estimate of fair value because of the short period of time between the origination of such instruments and their expected realization and if applicable, their current interest rate is equivalent to interest rates currently available. The three levels are defined as follow:
| · | Level 1 — inputs to the valuation methodology are quoted prices (unadjusted) for identical assets or liabilities in active markets. |
| · | Level 2 — inputs to the valuation methodology include quoted prices for similar assets and liabilities in active markets, and inputs that are observable for the assets or liability, either directly or indirectly, for substantially the full term of the financial instruments. |
| · | Level 3 — inputs to the valuation methodology are unobservable and significant to the fair value. |
As of the balance sheet date, the estimated fair values of the financial instruments approximated their fair values due to the short-term nature of these instruments. Determining which category an asset or liability falls within the hierarchy requires significant judgment. The Company evaluates the hierarchy disclosures each year.
Related parties
The Company adopted ASC 850, Related Party Disclosures, for the identification of related parties and disclosure of related party transactions.
Cash and cash equivalents
The Company considers all highly liquid investments purchased with an original maturity of three months or less to be cash equivalents.
Accounts Receivable
Accounts receivable is recorded at the net value of less estimates for doubtful accounts. Management regularly reviews outstanding accounts and provides an allowance for doubtful accounts. When collection of the original invoice amounts is no longer probable, the Company will either partially or fully write-off the balance against the allowance for doubtful accounts.
Bad debt expenses were $nil and $nil for the year ended August 31, 2019 and 2018, respectively.
Revenue Recognition
The Company adopted ASC 606 requires the use of a new five-step model to recognize revenue from customer contracts. The five-step model requires entities to exercise judgment when considering the terms of contracts, which includes (1) identifying the contracts or agreements with a customer, (2) identifying our performance obligations in the contract or agreement, (3) determining the transaction price, (4) allocating the transaction price to the separate performance obligations, and (5) recognizing revenue as each performance obligation is satisfied. The Company only applies the five-step model to contracts when it is probable that the Company will collect the consideration it is entitled to in exchange for the services it transfers to its clients. The Company has concluded that the new guidance did not require any significant change to its revenue recognition processes.
| F-9 |
| Table of Contents |
The Company’s revenues mainly consist of offline products sales. The Company generally recognizes product sales revenue when the performance obligation have been satisfied pursuant to Malaysia law, including such factors as contract existed with the customer, delivery and acceptance of products by customer has occurred, the sales price is fixed or determinable and allocated to the products sold, sales and value-added tax laws have been complied with, and collectability is reasonably assured.
The Company estimates potential returns and records such estimates against its gross revenue to arrive at its reported net sales revenue. The Company has not experienced any sales returns.
Inventory
Inventories, which are primarily comprised of finished goods for sale, are stated at the lower of cost or net realizable value, using the first-in first-out (FIFO) method. The Company evaluates the need for reserves associated with obsolete, slow-moving and non-salable inventory by reviewing net realizable values on a periodic basis. Only defects products can be return to our suppliers.
Customer Deposits
The Company charges deposits when customers rent the power bank. The deposits will be fully refunded after the power bank is returned.
Advertising
The Company expenses advertising costs as incurred and includes it in selling expenses. The Company recorded $245,660 and $205,412 for advertising and promotions expenses for the year ended August 31, 2019 and 2018, respectively.
Income Taxes
Income taxes are provided in accordance with ASC No. 740, Accounting for Income Taxes. A deferred tax asset or liability is recorded for all temporary differences between financial and tax reporting and net operating loss carry-forwards. Deferred tax expense (benefit) results from the net change during the year of deferred tax assets and liabilities.
Deferred tax assets are reduced by a valuation allowance when, in the opinion of management, it is more likely than not that some portion of all of the deferred tax assets will be realized. Deferred tax assets and liabilities are adjusted for the effects of changes in tax laws and rates on the date of enactment.
A tax benefit from an uncertain tax position may be recognized only if it is more likely than not that the tax position will be sustained on examination by the taxing authorities. The determination is based on the technical merits of the position and presumes that the relevant taxing authority that has full knowledge of all relevant information will examine each uncertain tax position. Although the Company believes the estimates are reasonable, no assurance can be given that the final outcome of these matters will not be different than what is reflected in the historical income tax provisions and accruals.
| F-10 |
| Table of Contents |
Property and Equipment & Depreciation
Property and equipment consist of computer, office furniture and equipment, and leasehold improvement. All property and equipment are stated at historical cost net of accumulated depreciation. Repairs and maintenance are expensed as incurred. Property and equipment are depreciated on a straight-line basis over the following periods:
Computer and Electronics | 5 years |
Furniture and Fixture | 10 years |
Equipment | 10 years |
Leasehold Improvement | 10 years |
Leases
We determine if an arrangement is a lease at inception. Operating leases are included in operating lease right-of-use (“ROU”) assets, operating lease liabilities - current, and operating lease liabilities - noncurrent on the balance sheets. Finance leases are included in property and equipment, other current liabilities, and other long-term liabilities in our balance sheets.
ROU assets represent our right to use an underlying asset for the lease term and lease liabilities represent our obligation to make lease payments arising from the lease. Operating lease ROU assets and liabilities are recognized at commencement date based on the present value of lease payments over the lease term. As most of our leases do not provide an implicit rate, we generally use our incremental borrowing rate based on the estimated rate of interest for collateralized borrowing over a similar term of the lease payments at commencement date. The operating lease ROU asset also includes any lease payments made and excludes lease incentives. Our lease terms may include options to extend or terminate the lease when it is reasonably certain that we will exercise that option. Lease expense for lease payments is recognized on a straight-line basis over the lease term.
Impairment of Long-lived assets
The Company accounts for impairment of property and equipment and amortizable intangible assets in accordance with ASC 360, “Accounting for Impairment of Long-Lived Assets and Long-Lived Assets to be Disposed Of”, which requires the Company to evaluate a long-lived asset for recoverability when there is event or circumstance that indicate the carrying value of the asset may not be recoverable. An impairment loss is recognized when the carrying amount of a long-lived asset or asset group is not recoverable (when carrying amount exceeds the gross, undiscounted cash flows from use and disposition) and is measured as the excess of the carrying amount over the asset’s (or asset group’s) fair value.
Research & development expenses
Product development expenses consist primarily of third-party development and programming costs and other expenses that are directly attributable to the development of mobile applications, databases, software for the businesses of the Company.
The Company expenses all costs that are incurred in connection with the planning and implementation phases of development and costs that are associated with repair or maintenance of the existing mobile applications or the development of software and content.
Costs incurred in the development phase can be capitalized and amortized over the estimated product life when technological feasibility is reached. However, since the inception of the Company, the amount of costs qualifying for capitalization has been insignificant. As a result, all development costs have been expensed as incurred.
| F-11 |
| Table of Contents |
The Company recorded $2,062,817 and $1,045,238 of research and development expenses for the years ended August 31, 2019 and 2018, respectively.
New Accounting Pronouncements
In February, 2016, the FASB issued Accounting Standards Update No. 2016-02 (ASU 2016-02) “Leases (Topic 842)”. ASU 2016-02 requires a lessee to recognize in the statement of financial position a liability to make lease payments (the lease liability) and a right-of-use asset representing its right to use the underlying asset for the lease term. ASU 2016-02 is effective for interim and annual reporting periods beginning after December 15, 2018. Early adoption is permitted.
For finance leases, a lessee is required to do the following:
| · | Recognize a right-of-use asset and a lease liability, initially measured at the present value of the lease payments, in the statement of financial position |
|
|
|
| · | Recognize interest on the lease liability separately from amortization of the right-of-use asset in the statement of comprehensive income |
|
|
|
| · | Classify repayments of the principal portion of the lease liability within financing activities and payments of interest on the lease liability and variable lease payments within operating activities in the statement of cash flows. |
For operating leases, a lessee is required to do the following:
| · | Recognize a right-of-use asset and a lease liability, initially measured at the present value of the lease payments, in the statement of financial position |
|
|
|
| · | Recognize a single lease cost, calculated so that the cost of the lease is allocated over the lease term on a generally straight-line basis |
|
|
|
| · | Classify all cash payments within operating activities in the statement of cash flows. |
In July, 2018, the FASB issued Accounting Standards Update No. 2018-11 (ASU 2018-11), which amends ASC 842 so that entities may elect not to recast their comparative periods in transition (the “Comparatives Under 840 Option”). ASU 2018-11 allows entities to change their date of initial application to the beginning of the period of adoption. In doing so, entities would:
| · | Apply ASC 840 in the comparative periods. |
|
|
|
| · | Provide the disclosures required by ASC 840 for all periods that continue to be presented in accordance with ASC 840. |
|
|
|
| · | Recognize the effects of applying ASC 842 as a cumulative-effect adjustment to retained earnings for the period of adoption. |
In addition, the FASB also issued a series of amendments to ASU 2016-02 that address the transition methods available and clarify the guidance for lessor costs and other aspects of the new lease standard.
The management has reviewed the accounting pronouncements and adopted the new standard on January 1, 2019 using the modified retrospective method of adoption. The transition method expedient which allows entities to initially apply the requirements by recognizing a cumulative-effect adjustment to the opening balance of retained earnings in the period of adoption. As a result of electing this transition method, prior periods have not been restated. The adoption of this ASU resulted in the recording of additional lease assets and liabilities $352,266 each with no effect to opening balance of retained earnings as the Company did not have any leases prior to the adoption of this ASU.
| F-12 |
| Table of Contents |
NOTE 3 – GOING CONCERN
The Company’s financial statements as of August 31, 2019, been prepared using generally accepted accounting principles in the United States of America applicable to a going concern, which contemplates the realization of assets and liquidation of liabilities in the normal course of business.
The Company has not yet established an ongoing source of revenues and cash flows sufficient to cover its operating costs and allow it to continue as a going concern. The Company has accumulated net loss of $4,954,178 as of August 31, 2019. These factors among others raise substantial doubt about the ability of the company to continue as a going concern for a reasonable period of time.
In order to continue as a going concern, the Company will need, among other things, additional capital resources. Management’s plan is to obtain such resources for the Company by obtaining capital from management and significant shareholders sufficient to meet its minimal operating expenses and seeking third party equity and/or debt financing. However, management cannot provide any assurances that the Company will be successful in accomplishing any of its plans. These financial statements do not include any adjustments related to the recoverability and classification of assets or the amounts and classification of liabilities that might be necessary should the Company be unable to continue as a going concern.
NOTE 4 – PROPERTY & EQUIPMENT
Property and equipment, net, is comprised of the following:
As of August 31, 2019 |
|
|
|
|
|
|
|
|
| |||
|
|
|
|
| Accumulated |
|
|
| ||||
Category |
| Cost |
|
| Depreciation |
|
| Net |
| |||
Computer & Electronics |
| $ | 30,637 |
|
| $ | 3,802 |
|
| $ | 26,835 |
|
Furniture & Fixture |
|
| 268,587 |
|
|
| 21,444 |
|
|
| 247,143 |
|
Equipment |
|
| 111,995 |
|
|
| 1,785 |
|
|
| 110,210 |
|
Leasehold Improvement |
|
| 353,341 |
|
|
| 5,990 |
|
|
| 347,351 |
|
|
| $ | 764,560 |
|
| $ | 33,021 |
|
| $ | 731,539 |
|
As of August 31, 2018 |
|
|
|
|
|
|
|
|
| |||
|
|
|
|
| Accumulated |
|
|
| ||||
Category |
| Cost |
|
| Depreciation |
|
| Net |
| |||
Computer & Electronics |
| $ | 15,456 |
|
| $ | 2,766 |
|
| $ | 12,690 |
|
Furniture & Fixture |
|
| 174,072 |
|
|
| 1,451 |
|
|
| 172,621 |
|
|
| $ | 189,528 |
|
| $ | 4,217 |
|
| $ | 185,311 |
|
Depreciation expense was $33,561 and $3,770 for the year ended August 31, 2019 and 2018, respectively.
| F-13 |
| Table of Contents |
NOTE 5 – RELATED PARTY TRANSACTIONS
The related parties consisted of the following:
Name of related party |
| Nature of relationship |
Mr. Ching Eu Boon |
| Majority shareholder, Chief Executive Officer and Director (Chairman) of the Company |
Ms. Lim Mei Fong |
| Spouse of Mr. Ching Eu Boon |
Mr. Aleksandr Zausaev |
| Former sole officer and director of the Company |
Mr. Mohd Mustaqim bin Abdullah |
| Chief Operations Officer |
Ms. XiaoJia Huang |
| Chief Financial Officer |
Mr. Cheng-Yi Chou |
| Chief Marketing Officer |
Cannis Group Indonesia |
| a company with common director |
World Speed Notion Sdn Bhd |
| a company with common director |
Related Party Receivable
As of August 31, 2019, total balance due to related party was $24,530, and the balances due to Cannis Group Indonesia and Mr. Mohd Mustaqim bin Abdullah were $24,098 and $432 respectively.
During the year ended August 31, 2019, Cannis Group Indonesia borrowed $ 11,935 from the Company and repaid $11,935.
Related Party Payable
Related Party |
| August 31, 2019 |
|
| August 31, 2018 |
| ||
Mr. Ching Eu Boon |
| $ | 3,381,115 |
|
| $ | 1,084,691 |
|
Mr. Aleksandr Zausaev |
|
| - |
|
| $ | 32,379 |
|
World Speed Notion Sdn Bhd |
|
| 6,924 |
|
|
|
|
|
Total |
| $ | 3,388,039 |
|
| $ | 1,117,070 |
|
| F-14 |
| Table of Contents |
For the year ended August 31, 2018, Mr. Ching advanced $1,084,691 to the Company as working capital for its operation.
For the year ended August 31, 2019, Mr. Ching advanced $3,027,468 to the Company as working capital for its operation. The loan was interest free, unsecured and due on demand.
In December 2018, Mr. Ching converted $179,169 (MYR 732,640) of the outstanding amount into 732,640 shares of ordinary shares of the Company’s subsidiary.
As of August 31, 2019, the outstanding balance due to Mr. Ching was $3,381,115.
Since August 17, 2016 through August 31, 2018 the Company's former sole officer and director, Mr. Aleksandr Zausaev, has loaned the Company from time to time to pay for incorporation costs and operating expenses. As of August 31, 2018 and 2019, the outstanding payable amount to Mr Zausaev was $32,379 and $0. Mr. Zausaev forgave the related party debt. The Company relinquished all its assets to settle all its liabilities during the change of control transaction.
Ms Lim Mei Fong leased the employee accommodation to the Company from April 25, 2018 to April 24, 2021, with monthly rent of $770. The total rent expense for the year ended August 31, 2019 was $3,081 and the rent deposit was $2,977 as of August 31, 2019.
NOTE 6 – LEASES
The Company has operating leases for corporate offices and employees’ accommodation. These leases have remaining lease terms of 1 year to 3 years. The Company has elected to not recognize lease assets and liabilities for leases with a term less than twelve months.
Operating lease right-of-use assets and liabilities are recognized at commencement date based on the present value of lease payments over the lease term. The discount rate used to calculate present value is incremental borrowing rate or, if available, the rate implicit in the lease. The Company determines the incremental borrowing rate for each lease based primarily on its lease term in Malaysia which is approximately 5%.
Operating lease expenses were $197,290 and $nil for the year ended August 31, 2019 and 2018.
The undiscounted future minimum lease payment schedule as follows:
For the year ending August 31, |
|
|
| |
2020 |
|
| 142,209 |
|
2021 |
|
| 127,889 |
|
2022 |
|
| 29,066 |
|
Thereafter |
|
| - |
|
Total |
| $ | 299,164 |
|
| F-15 |
| Table of Contents |
NOTE 7 – STOCKHOLDERS’ EQUITY
The Company is authorized to issue 10,000,000 numbers of Class A Preferred Stock at par value of $0.001 per share and 1,500,000,000 shares of common stock.
In December 2018, Mr. Ching converted $177,164 (MYR 732,640) of the outstanding amount into 732,640 shares of ordinary shares of the Company.
On August 5, 2019, the Company, Cannisapp, and Mr. Ching entered into the Stock Exchange Agreement, where the Company issued an aggregate of 1,482,492,800 shares of common stock and 8,500,000 shares of Class A Preferred Stock in exchange for all of the outstanding capital stock of Cannisapp.
As of August 31, 2019, the Company has 1,488,832,800 shares of common shares issued and outstanding, and 8,500,000 shares of Class A Preferred Stock issued and outstanding.
NOTE 8 – INCOME TAX
United States of America
Cannis, Inc. is established in the State of Nevada in United States and is subject to Nevada state and US Federal tax laws. Cannis Inc. has not recognized an income tax benefit for its operating losses based on uncertainties concerning its ability to generate taxable in future period.
The components of deferred tax assets and liabilities as follows:
|
| August 31, 2019 |
|
| August 31, 2018 |
| ||
Deferred tax asset |
| $ |
|
| $ |
| ||
Net operating losses carry forwards |
|
| 27,545 |
|
|
| 10,432 |
|
Valuation allowance |
|
| (27,545 | ) |
|
| (10,432 | ) |
Deferred tax asset, net |
| $ | - |
|
| $ | - |
|
Malaysia
Cannisapp Sdn Bhd is subject to Malaysia income tax laws. The standard corporate tax rate is 24%, while the rate for resident small and medium-sized companies (i.e. companies incorporated in Malaysia with paid-up capital of MYR 2.5 million or less and that are not part of a group containing a companying exceeding this capitalization threshold) is 17% (reduced from 18%, effective 2019) on the first MYR 500,000 (approximately $120,907), with the balance being tax at the 24% rate.
For the year ended August 31, 2019 and from April 2, 2018 (inception) to August 31, 2018, Cannisapp Sdn Bhd did not record income tax expenses because it reported operating losses. The net taxable income (losses) before income taxes and its provision for income taxes as follows:
|
| Year Ended August 31, 2019 |
|
| Year Ended August 31, 2018 |
| ||
Net profit/(loss) before income taxes |
| $ | 3,531,055 |
|
| $ | 1,291,958 |
|
Tax rate |
|
| 17 | % |
|
| 18 | % |
Tax expenses (benefit) at the statutory tax rate |
|
| (600,279 | ) |
|
| (232,553 | ) |
|
|
|
|
|
|
|
|
|
Tax effects of: |
|
|
|
|
|
|
|
|
Income not subject to tax |
|
| - |
|
|
| (1,303 | ) |
Utilization of deferred tax assets previously not recognized |
|
| - |
|
|
|
|
|
Non-deductible expenses (Permanent) |
|
| 404,364 |
|
|
| 193,982 |
|
Non-deductible expenses (Temporary) |
|
| 26,847 |
|
|
| (9,562 | ) |
Income tax expense (benefit), net |
| $ | (169,068 | ) |
| $ | (49,436 | ) |
| F-16 |
| Table of Contents |
The components of deferred tax assets and liabilities as follows:
|
| August 31, |
|
| August 31 |
| ||
|
| 2019 |
|
| 2018 |
| ||
Deferred tax asset |
|
|
|
|
|
| ||
Capital Allowance |
| $ | 15,971 |
|
| $ | 9,850 |
|
Net operating loss carryover |
|
| 191,427 |
|
|
| 35,573 |
|
Valuation allowance |
|
| (207,398 | ) |
|
| (45,423 | ) |
Deferred tax assets, net |
| $ | - |
|
| $ | - |
|
NOTE 9 – SEGMENT INFORMATION
The Company believes that it operates in two business segments offline sales distribution and online commerce and services; and operates in one geographical segment Malaysia.
The Company’s operating segments are as follows:
Online commerce and services which is comprised of platforms operating in retail and wholesale commerce, retail and wholesale commerce — cross-border and global, local consumer services and others.
Offline sales distribution which is comprised of sales and distributions of nutritional supplements which will be integrated with the Company’s mobile application platform.
|
| Year Ended August 31, |
|
| Year Ended August 31, |
| ||
|
| 2019 |
|
| 2018 |
| ||
Sales Revenues |
|
|
|
|
|
| ||
Online commerce and services |
| $ | - |
|
| $ | - |
|
Offline sales distribution |
|
| 3,529,064 |
|
|
| - |
|
Total sales revenues |
| $ | 3,529,064 |
|
| $ | - |
|
|
|
|
|
|
|
|
|
|
Income (loss) from operations |
|
|
|
|
|
|
|
|
Online commerce and services |
| $ |
|
| $ | (1,045,225 | ) | |
Offline sales distribution |
|
| (2,504,972 | ) |
|
| (2,53,973 | ) |
Total income (loss) from operations |
| $ | (2,504,972 | ) |
| $ | (1,299,958 | ) |
| F-17 |
| Table of Contents |
NOTE 10 – CONCENTRATIONS, RISKS AND UNCERTAINTIES
Credit risk
Cash deposits with banks are held in financial institutions in Malaysia, which are federally insured with deposit protection up to MYR250,000 (approximately $59,899). Accordingly, the Company has a concentration of credit risk related to the uninsured part of bank deposits. The Company has not experienced any losses in such accounts and believes it is not exposed to significant credit risk.
Concentration
The Company offer limited varieties of products for sale while depends on few suppliers for these products. Accordingly, The Company has a concentration risk related to these products and suppliers. Failure to maintain existing relationships with the suppliers or to establish new relationships in the future could negatively affect the Company’s ability to obtain products sold to customers in a timely manner. If the Company is unable to obtain ample supply of products from existing suppliers or alternative sources of supply, the Company may be unable to satisfy the orders from its customers, which could materially and adversely affect revenues.
The concentration on products sales revenues is as follows:
|
| Year ended August 31, 2019 |
|
| Year ended August 31, 2018 |
| ||||||||||
|
| Amount |
|
| % |
|
| Amount |
|
| % |
| ||||
Product A |
| $ | 2,340,259 |
|
|
| 63% |
| $ | - |
|
|
| N/A |
| |
Product B |
|
| 613,437 |
|
|
| 17% |
|
| - |
|
|
| N/A |
| |
Product C |
|
| 516,514 |
|
|
| 14% |
|
| - |
|
|
| N/A |
| |
Total |
| $ | 3,470,211 |
|
|
| 94% |
| $ | - |
|
|
| N/A |
| |
| F-18 |
| Table of Contents |
The concentration on suppliers’ purchases is as follows:
|
| Year ended August 31, 2019 |
|
| Year ended August 31, 2018 |
| ||||||||||
|
| Amount |
|
| % |
|
| Amount |
|
| % |
| ||||
Supplier A |
| $ | 1,546,091 |
|
|
| 59 | % |
| $ | - |
|
|
| N/A |
|
Supplier B |
|
| 477,420 |
|
|
| 18 | % |
|
| - |
|
|
| N/A |
|
Supplier C |
|
| 423,369 |
|
|
| 16 | % |
|
| - |
|
|
| N/A |
|
Total |
| $ | 2,446,880 |
|
|
| 93 | % |
| $ | - |
|
|
| N/A |
|
The concentration on customers’ sales revenues is as follows:
|
| Year ended August 31, 2019 |
|
| Year ended August 31, 2018 |
| ||||||||||
|
| Amount |
|
| % |
|
| Amount |
|
| % |
| ||||
Customer A |
| $ | 294,954 |
|
|
| 8 | % |
| $ | - |
|
|
| N/A |
|
Customer B |
|
| 199,589 |
|
|
| 5 | % |
|
| - |
|
|
| N/A |
|
Customer C |
|
| 161,400 |
|
|
| 4 | % |
|
| - |
|
|
| N/A |
|
|
| $ | 655,944 |
|
|
| 17 | % |
| $ | - |
|
|
| N/A |
|
NOTE 11 - SUBSEQUENT EVENTS
The Company evaluates subsequent events that have occurred after the balance sheet date but before the financial statements are issued. Based on this evaluation, the Company concluded that subsequent to August 31, 2019 but prior to December 16, 2019, the date the financial statements were available to be issued, there was no subsequent event that would require disclosure to or adjustment to the financial statements other than the ones disclosed above.
F-19 |
| Table of Contents |
Item 9. Changes in and Disagreements with Accountants on Accounting and Financial Disclosure.
There are not and have not been any disagreements between the Company and its accountants on any matter of accounting principles, practices or financial statement disclosure.
Item 9A. Controls and Procedures.
Evaluation of Disclosure Controls and Procedures
In connection with the preparation of this annual report, an evaluation was carried out by the Company’s management, with the participation of the principal executive officer and the principal financial officer, of the effectiveness of the Company’s disclosure controls and procedures (as defined in Rules 13a-15(e) and 15d-15(e) under the Exchange Act (“Exchange Act”) as of August 31, 2019. Disclosure controls and procedures are designed to ensure that information required to be disclosed in reports filed or submitted under the Exchange Act is recorded, processed, summarized, and reported within the time periods specified in the Commission’s rules and forms, and that such information is accumulated and communicated to management, including the principal executive officer and the principal financial officer, to allow timely decisions regarding required disclosures.
Based on that evaluation, the Company’s management concluded, as of the end of the period covered by this report, that the Company’s disclosure controls and procedures were not effective in recording, processing, summarizing, and reporting information required to be disclosed, within the time periods specified in the Commission’s rules and forms, and that such information was not accumulated and communicated to management, including the principal executive officer and the principal financial officer, to allow timely decisions regarding required disclosures.
Management’s Report on Internal Control over Financial Reporting
The management of the Company is responsible for establishing and maintaining adequate internal control over financial reporting. The Company’s internal control over financial reporting is a process, under the supervision of the principal executive officer and the principal financial officer, designed to provide reasonable assurance regarding the reliability of financial reporting and the preparation of the Company’s financial statements for external purposes in accordance with United States generally accepted accounting principles (GAAP). Internal control over financial reporting includes those policies and procedures that:
| · | Pertain to the maintenance of records that in reasonable detail accurately and fairly reflect the transactions and dispositions of the Company’s assets; |
| · | Provide reasonable assurance that transactions are recorded as necessary to permit preparation of the financial statements in accordance with generally accepted accounting principles, and that receipts and expenditures are being made only in accordance with authorizations of management and the board of directors; and |
| · | Provide reasonable assurance regarding prevention or timely detection of unauthorized acquisition, use, or disposition of the Company’s assets that could have a material effect on the financial statements. |
Because of its inherent limitations, internal control over financial reporting may not prevent or detect misstatements. Also, projections of any evaluation of effectiveness to future periods are subject to the risk that controls may become inadequate because of changes in conditions or that the degree of compliance with the policies or procedures may deteriorate.
The Company’s management conducted an assessment of the effectiveness of our internal control over financial reporting as of August 31, 2019, based on criteria established in Internal Control – Integrated Framework issued by the Committee of Sponsoring Organizations of the Treadway Commission (2013) as set forth in its Internal Control - Integrated Framework. This assessment identified material weaknesses in internal control over financial reporting. A material weakness is a control deficiency, or a combination of deficiencies in internal control over financial reporting that creates a reasonable possibility that a material misstatement in annual or interim financial statements will not be prevented or detected on a timely basis. Since the assessment of the effectiveness of our internal control over financial reporting did identify a material weakness, management considers its internal control over financial reporting to be ineffective.
Management has concluded that our internal control over financial reporting had the following material deficiencies:
| · | We were unable to maintain segregation of duties within our business operations due to our reliance on a single individual fulfilling the role of sole officer and director. |
| ||
| · | Lack of a functioning audit committee due to a lack of a majority of independent members and a lack of a majority of outside directors on our Board of Directors, resulting in ineffective oversight in the establishment and monitoring of required internal control and procedures. |
|
|
|
| · | Lack of qualified internal accounting personnel with sufficient knowledge of US GAAP and reporting requirements of a U.S. publicly-listed company. |
While these control deficiencies to our 2019 or 2018 interim or annual financial statements, it could have resulted in a material misstatement that might have been prevented or detected by a segregation of duties. Accordingly, we have determined that this control deficiency constitutes a material weakness.
To the extent reasonably possible, given our limited resources, our goal is, upon consummation of a merger with a private operating company, to separate the responsibilities of principal executive officer and principal financial officer, intending to rely on two or more individuals. We will also seek to expand our current board of directors to include additional individuals willing to perform directorial functions. Since the recited remedial actions will require that we hire or engage additional personnel, this material weakness may not be overcome in the near term due to our limited financial resources. Until such remedial actions can be realized, we will continue to rely on the advice of outside professionals and consultants.
This annual report does not include an attestation report of our registered public accounting firm regarding our internal controls over financial reporting. Management’s report was not subject to attestation by our registered public accounting firm pursuant to Section 404(c) of the Sarbanes-Oxley Act that permit us to provide only management’s report in this annual report.
Changes in Internal Controls over Financial Reporting
During the year ended August 31, 2019, other than the change in ownership, there has been no change in internal control over financial reporting that has materially affected or is reasonably likely to materially affect our internal control over financial reporting.
None
| 37 |
| Table of Contents |
Item 10. Directors, Executive Officers and Corporate Governance.
The following table sets forth the name, age, and position of sole executive officers and directors. Executive officers are elected annually by our Board of Directors. Each executive officer holds his office until he resigns, is removed by the Board, or his successor is elected and qualified. Directors are elected annually by our stockholders at the annual meeting. Each director holds his office until his successor is elected and qualified or his earlier resignation or removal.
NAME | AGE | POSITION | ||
Eu Boon Ching | 53 | Chief Executive Officer and Director (Chairman) | ||
Mohd Mustaqim bin Abdullah | 45 | Chief Operations Officer | ||
XiaoJia Huang | 44 | Chief Financial Officer | ||
Cheng-Yi Chou | 34 | Chief Marketing Officer |
Eu Boon Ching. Mr. Ching has been the Chairman, Chief Executive Officer, Chief Financial Officer, Secretary and Treasurer of the Company since November 14, 2018. He is the founder of Cannisapp Sdn Bhd and has been its Chief Executive Officer since its inception in June 2018. He is a successful, well recognised entrepreneur, writer and motivational speaker in Malaysia. He is the Chairman of Alibaba Taobao Academy in Malaysia since year 2016. He has authored 12 bestselling titles written in Malay Language in motivation and self-improvement that has transformed many lives. From year 2012 to 2015, he served as Pandamaran State Coordinator for the Office of Prime Minister of Malaysia (JPM); from 2015 to May 2018, he served as Parliament Klang Coordinator for the Office of Prime Minister of Malaysia (JPM). From 1988, he served as member of Malaysia Chinese Association.
Mohd Mustaqim bin Abdullah. Mr. Abdullah has been the Chief Operations Officer of the Company since the closing of the Stock Exchange Agreement August 5, 2019. He has occupied the same position at Cannisapp since September 2018. In 2009, he was a Marketing Manager in Revell Global Sdn. Bhd., Kuala Lumpur. He left in March 2015 and obtained a certificate as a Certified International Coach from the Chartered Institute of Management in Vancouver, Canada. He also obtained an Executive Master of Business Administration from IEMD Graduate Business School, Barcelona, Spain in 2016. From April 2015 to March 2016, he also served a year as the Sales Manager in Federico Mahora Malaysia Sdn. Bhd., Malaysia. Thereafter in April 2016, he took up the role as a Chief Executive Officer in Kirin Bio Holdings Sdn. Bhd., Shah Alam, Malaysia, a position he held until his current role.
XiaoJia Huang. Ms. Huang has been the Chief Finance Officer of the Company since the closing of the Stock Exchange Agreement August 5, 2019. She occupied the same position at Cannisapp since September 2018. She has occupied the same position at Cannisapp since August 2018. She is a Fellow Member of the Association of Chartered Certified Accountants (FCCA), United Kingdom since year 2006. From Jan 2016 to June 2018, she worked as Group Accountant in BCB Berhad and BCB Development Sdn Bhd., a listed company located in Malaysia. In addition to overseeing the daily operations of the firm in Kuala Lumpur and Selangor, she also assisted in financing projects. Before join BCB Group of Companies, from December 2014 to December 2015, she served as Business Development Director for Dataprep Berhad and involved in Merge & Acquisition in China and Cambodia and Russia. She has accumulated 20 years of experiences in the areas of Finance and Accounting.
Cheng-Yi Chou. Mr. Chou has been the Chief Marketing Officer of the Company since the closing of the Stock Exchange Agreement August 5, 2019. He has occupied the same position at Cannisapp since November 2018. He is responsible of the design and commercialization of our App, targeting to the South East Asia market. In 2017, he founded “RE Red Packet” an “economic sharing” app in Taiwan. According to Google Play statistics, it has accumulated over 500,000 downloads to date. From October 2016 to December 2017, he served as the General Manager in Fulife Private Limited, Taiwan, a company aiming to promote a green, eco-friendly community. From 2015 to 2016, he served as the General Manager at Hui Guang Investment Management Private Limited, Beijing, a company promoting energy recycling and reuse. From 2013 to 2015, he worked as a marketing consultant for SuperMedia, located in Taiwan, assisting in the planning of more than 500 online videos. The platform accumulated more than 3,000 creators, and accumulated 2 billion views in two years, becoming the main promoter of Taiwan’s new media industry. He graduated with a bachelor’s degree of Business Administration from National Yunlin University of Science and Technology in January 2010.
| 38 |
| Table of Contents |
Family Relationship
There is no family relationship among the directors and officers of the Company.
Corporate Governance
Board Committees
We presently do not have an audit committee, compensation committee or nominating committee or committee performing similar functions, as our management believes that until this point it has been premature at the early stage of our management and business development to form an audit, compensation or nominating committee. Until these committees are established, these decisions will continue to be made by our Board of Directors. Although our Board of Directors has not established any minimum qualifications for director candidates, when considering potential director candidates, our Board of Directors considers the candidate’s character, judgment, skills and experience in the context of the needs of our Company and our Board of Directors.
Nominating Committee. We have not established a Nominating Committee because of our limited operations; we believe that we are able to effectively manage the issues normally considered by a Nominating Committee.
Audit Committee. We do not have an Audit Committee. The Company’s board of directors performs some of the same functions of an Audit Committee, such as; recommending a firm of independent certified public accountants to audit the financial statements; reviewing the auditors’ independence, the financial statements and their audit report; and reviewing management’s administration of the system of internal accounting controls. The Company does not currently have a written audit committee charter or similar document.
Code of Ethics. We do not currently have a Code of Ethics in place for the Company, although our Board of Directors has developed a framework for adoption in the coming months. Our business operations are currently not complex and are very limited. The Company seeks advice and counsel from outside experts such as our lawyers and accountants on matters relating to corporate governance and financial reporting.
Director Independence
Currently, we do not have independent directors, as the term “independent” is defined by the rules of the Nasdaq Stock Market.
Involvement in Certain Legal Proceedings
Over the past ten years, none of our directors or executive officers has been (i) involved in any petition under Federal bankruptcy laws or any state insolvency law, (ii) convicted in a criminal proceeding or is a named subject of a pending criminal proceeding (excluding traffic violations and other minor offenses), (iii) subject of any order, judgment, or decree, not subsequently reversed, suspended or vacated, of any court of competent jurisdiction, permanently or temporarily enjoining him from (a) acting as a future’s commission merchant, introducing broker, commodity trading advisor, commodity pool operator, floor broker, leverage transaction merchant, any other person regulated by the Commodity Futures Trading Commission, or an associated person of any of the foregoing, or as an investment adviser, underwriter, broker or dealer in securities, or as an affiliated person, director or employee of any investment company, bank, savings and loan association or insurance company, or engaging in or continuing any conduct or practice in connection with such activity, (b) engaging in any type of business practice, or (c) engaging in any activity in connection with the purchase or sale of any security or commodity or in connection with any violation of Federal or State securities laws or Federal commodities laws, or (d) subject of any order, judgment or decree, not subsequently reversed, suspended or vacated, of any Federal or State authority barring, suspending or otherwise limiting for more than 60 days the right to engage in any activity described in (iii)(a), (iv) found by a court of competent jurisdiction in a civil action or by the Commission to have violated any Federal or State securities law, and the judgment in such civil action or finding by the Commission has not been subsequently reversed, suspended, or vacated, (v) found by a court of competent jurisdiction in a civil action or by the Commodity Futures Trading Commission to have violated any Federal commodities law, and the judgment in such civil action or finding by the Commodity Futures Trading Commission has not been subsequently reversed, suspended or vacated. (vi) subject of, or a party to, any Federal or State judicial or administrative order, judgment, decree, or finding, not subsequently reversed, suspended or vacated, relating to an alleged violation of (a) any Federal or State securities or commodities law or regulation, (b) any law or regulation respecting financial institutions or insurance companies, or (c) any law or regulation prohibiting mail or wire fraud or fraud in connection with any business entity, or (vii) the subject of, or a party to, any sanction or order, not subsequently reversed, suspended or vacated, of any self-regulatory organization (as defined in Section 3(a)(26) of the Exchange Act (15 U.S.C. 78c(a)(26))), any registered entity (as defined in Section 1(a)(29) of the Commodity Exchange Act (7 U.S.C. 1(a)(29))), or any equivalent exchange, association, entity or organization that has disciplinary authority over its members or persons associated with a member. Except as set forth in our discussion below in “Transactions with Related Persons; Promoters and Certain Control Persons; Director Independence,” none of our directors, director nominees or executive officers has been involved in any transactions with us or any of our directors, executive officers, affiliates or associates which are required to be disclosed pursuant to the rules and regulations of the SEC.
| 39 |
| Table of Contents |
Item 11. Executive Compensation.
The following table sets forth information concerning all cash and non-cash compensation awarded to, earned by or paid to the named persons for services rendered in all capacities during fiscal year ended August 31, 2018. The Company, through the Subsidiary commenced operations in June 2018, and as a result, the compensation for 2018 is a pro-rata amount. No other executive officer received total annual salary and bonus compensation in excess of $100,000.
|
|
|
|
|
|
|
|
| Stock |
|
| Option |
|
| All Other |
|
|
|
| |||||||
|
|
|
| Salary |
|
| Bonus |
|
| Awards |
|
| Awards |
|
| Compensation |
|
| Total |
| ||||||
Name and Principal Position |
| Year |
| ($) |
|
| ($) |
|
| ($) |
|
| ($) |
|
| ($) |
|
| ($) |
| ||||||
Eu Boon Ching(1) |
| 2018 |
|
| 52,235 |
|
|
| 0 |
|
|
| 0 |
|
|
| 0 |
|
|
| 0 |
|
|
| 52,235 |
|
Chairman, President, and |
| 2019 |
|
| 90,000 |
|
|
|
|
|
|
|
|
|
|
|
|
|
|
|
|
|
|
| 90,000 |
|
Chief Executive Officer |
|
|
|
|
|
|
|
|
|
|
|
|
|
|
|
|
|
|
|
|
|
|
|
|
|
|
|
|
|
|
|
|
|
|
|
|
|
|
|
|
|
|
|
|
|
|
|
|
|
|
|
|
|
Mohd Mustaqim bin Abdullah (2) |
| 2018 |
|
| 16,815 |
|
|
| 0 |
|
|
| 0 |
|
|
| 0 |
|
|
| 0 |
|
|
| 16,815 |
|
Chief Operations Officer |
| 2019 |
|
| 56,025 |
|
|
|
|
|
|
|
|
|
|
|
|
|
|
|
|
|
|
| 56,025 |
|
|
|
|
|
|
|
|
|
|
|
|
|
|
|
|
|
|
|
|
|
|
|
|
|
|
|
|
XiaoJia Huang (3) |
| 2018 |
|
| 20,894 |
|
|
| 0 |
|
|
| 0 |
|
|
| 0 |
|
|
| 0 |
|
|
| 20,894 |
|
Chief Financial Officer |
| 2019 |
|
| 66,700 |
|
|
|
|
|
|
|
|
|
|
|
|
|
|
|
|
|
|
| 66,700 |
|
|
|
|
|
|
|
|
|
|
|
|
|
|
|
|
|
|
|
|
|
|
|
|
|
|
|
|
Cheng-Yi Chou(4) |
| 2018 |
|
| 9,450 |
|
|
| 0 |
|
|
| 0 |
|
|
| 0 |
|
|
| 0 |
|
|
| 9,450 |
|
Chief Marketing Officer |
| 2019 |
|
| 60,700 |
|
|
|
|
|
|
|
|
|
|
|
|
|
|
|
|
|
|
| 60,700 |
|
(1). Mr. Ching’s annual salary is US$90,000 per annum.
(2). Mr. Abdullah’s annual salary is US$56,400 per annum.
(3). Ms. Huang’s annual salary is US$66,000 per annum.
(4). Mr. Chou’s annual salary is US$60,000 per annum.
Employment Agreements.
Except as noted below, there are no agreements or understandings for any of our executive officers or directors to resign at the request of another person and no officer or director is acting on behalf of nor will any of them act at the direction of any other person.
On June 1, 2018, Mr. Eu Boon Ching and Cannisapp Sdn Bhd. (previously known as Nimpmos Sdn Bhd.) entered into a Letter of Employment for the appointment of Mr. Ching as the Chief Executive Officer of Cannisapp Sdn. Bhd. for a period of three years.
| 40 |
| Table of Contents |
On September 1, 2018, Ms. Xiao Jia Huang and Cannisapp Sdn Bhd. entered into a Letter of Employment dated for the appointment of Ms. Huang as the Chief Financial Officer of Cannisapp Sdn. Bhd. There is no term on the Letter of Employment.
On November 1, 2018, Mr. Cheng Yi Chou and Cannisapp Sdn Bhd entered into a Letter of Employment dated for the appointment of Mr. Chou as the Chief Marketing Officer of Cannisapp Sdn. Bhd. There is no term on the Letter of Employment.
September 1, 2018, Mr. Mohammad Mustaqim bin Abdullah and Cannisapp Sdn Bhd entered into a Letter of Employment for the appointment Mr. Abdullah as the Chief Operation Officer of Cannisapp Sdn. Bhd.
There is no term on the Letter of Employment.
Grants of Plan-Based Awards
No plan-based awards were granted to any of our named executive officers during the fiscal years ended August 31, 2018 and 2019.
Outstanding Equity Awards at Fiscal Year End
No unexercised options or warrants were held by any of our named executive officers at August 31, 2018 and 2019. No equity awards were made during the fiscal years ended August 31, 2018 and 2019.
Option Exercises and Stock Vested
No options to purchase our capital stock were exercised by any of our named executive officers, nor was any restricted stock held by such executive officers vested during the fiscal years ended August 31, 2018 and 2019.
Pension Benefits
No named executive officers received or held pension benefits during the fiscal years ended August 31, 2018 and 2019.
Nonqualified Deferred Compensation
No nonqualified deferred compensation was offered or issued to any named executive officer during the fiscal years ended August 31, 2018 and 2019.
Potential Payments Upon Termination or Change in Control
Our executive officers are not entitled to severance payments upon the termination of their employment agreements or following a change in control.
Compensation of Directors
No member of our Board of Directors received any compensation for his services as a director during the fiscal years ended August 31, 2018 and 2019.
Compensation Committee Interlocks and Insider Participation
During the fiscal years 2018 and 2019, we did not have a standing compensation committee. Our Board of Directors was responsible for the functions that would otherwise be handled by the compensation committee. All directors participated in deliberations concerning executive officer compensation, including directors who were also executive officers, however, none of our executive officers received any compensation during the last fiscal year. None of our executive officers has served on the Board of Directors or compensation committee (or other committee serving an equivalent function) of any other entity, any of whose executive officers served on our Board or Compensation Committee.
| 41 |
| Table of Contents |
The following table sets forth certain information, as of the date hereof and gives effect to the Stock Exchange Agreement, with respect to the beneficial ownership of the outstanding common stock by (i) any holder of more than five (5%) percent; (ii) each of our executive officers and directors; and (iii) our directors and executive officers as a group. Except as otherwise indicated, each of the stockholders listed below has sole voting and investment power over the shares beneficially owned. The securities “beneficially owned” by an individual are determined in accordance with the definition of “beneficial ownership” set forth in the regulations promulgated under the Exchange Act and, accordingly, may include securities owned by or for, among others, the spouse and/or minor children of an individual and any other relative who resides in the same home as such individual, as well as other securities as to which the individual has or shares voting or investment power or which each person has the right to acquire within 60 days through the exercise of options or otherwise. Beneficial ownership may be disclaimed as to certain of the securities. This table has been prepared based on 1,488,827,800 shares of common stock outstanding and 8,500,000 shares of preferred stock (Class A Preferred Stock) outstanding as of date of this report. Unless otherwise specified, the address of each of the persons set forth below is in care of the Company.
Name and Address of Beneficial Owner Officers and Directors | Number and Title of Shares Beneficially Owned | % Common Stock | % Preferred Stock | % Total Voting Power(1) |
Eu Boon Ching President and Chairman | 1,488,827,800 shares common stock 8,500,000 shares Class A Preferred Stock (2) | 99.99 |
100 | 99.99 |
Mohd Mustaqim bin Abdullah Chief Operations Officer | 0 shares common stock and 0 shares preferred stock |
0 |
0 |
0 |
XiaoJia Huang Chief Financial Officer | 0 shares common stock and 0 shares preferred stock |
0 |
0 |
0 |
| ||||
Cheng-Yi Chou Chief Marketing Officer | 0 shares common stock and 0 shares preferred stock |
0 |
0 |
0 |
All officers and directors as a group (4 persons) | 1,488,827,800 common stock 8,500,000 Class A Preferred stock | 99.99 | 100 | 99.99% |
(1). Represents combined voting power of the common stock and Class A Preferred Stock.
(2). Class A Preferred Stock has 100 votes per share on all matters presented to shareholders for a vote.
Item 13. Certain Relationships and Related Transactions, and Director Independence.
Stock Exchange Agreement.
On August 12, 2019, the Company, Cannisapp Sdn Bhd., and Mr. Ching entered into a Stock Exchange Agreement (“Stock Exchange Agreement”), which closed on August 5, 2019. Pursuant to the terms of the Stock Exchange Agreement, we issued to Mr. Ching 1,482,492,800 shares of our common stock, par value $0.001 per share and 8,500,000 shares of Class A Preferred Stock, $0.001 par value (the Class A Preferred Stock has 100 for 1 voting rights per share) for all of the outstanding capital stock of Cannisapp. As a result, Cannisapp became a wholly owned subsidiary of the Company.
Immediately prior to the closing of the Stock Exchange Agreement, we had 6,440,000 shares of our common stock, $0.001 par value, issued and outstanding. Immediately after the closing of the Stock Exchange Agreement, we had 1,488,932,800 shares of our common stock, $0.001 par value, issued and outstanding and 8,500,000 shares of our Class A Preferred Stock, $0.001 par value, issued and outstanding issued and outstanding. The Class A Preferred Stock has 100 to 1 one voting rights per share and no other rights, preferences or privileges.
| 42 |
| Table of Contents |
Related Party Receivable
As of August 31, 2019, total balance due to related party was $24,530. And the balances due to Cannis Group Indonesia and Mr. Mohd Mustaqim bin Abdullah were $24,098 and $432 respectively.
During the year ended August 31, 2019, Cannis Group Indonesia borrowed $ 11,935 from the Company and repaid $11,935.
Related Party Payable
Related Party |
| As of August 31, 2019 |
|
| As of August 31, 2018 |
| ||
Mr. Ching Eu Boon |
| $ | 3,381,115 |
|
| $ | 1,084,691 |
|
Mr. Aleksandr Zausaev |
|
| - |
|
| $ | 32,379 |
|
World Speed Notion Sdn Bhd |
|
| 6,924 |
|
|
|
|
|
Total |
| $ | 3,388,039 |
|
| $ | 1,117,070 |
|
Mr. Ching Eu Boon, the Company’s sole shareholder, director, and officer, became the majority shareholder of Cannis, Inc. (formerly Zartex, Inc.) on November 14, 2018.
For the year ended August 31, 2018, Mr. Ching advanced $1,084,691 to the Company as working capital for its operation. The amount was interest free, unsecured and due on demand.
For the year ended August 31, 2019, Mr. Ching advanced $3,027,468 to the Company as working capital for its operation and received $336,336 in payments from the Company. The loan was interest free, unsecured and due on demand.
Since August 17, 2016 (inception of Cannisapp Sdn Bhd) through August 31, 2018 the Company’s former sole officer and director, Mr. Aleksandr Zausaev, has loaned the Company from time to time to pay for incorporation costs and operating expenses. As of August 31, 2018, the outstanding payable amount to Mr Zausaev was $32,379.
In December 2018, Mr. Ching converted $179,169 (MYR 732,640) in outstanding loan to the Company into 732,640 shares of common stock of the Company.
As of August 31, 2019, the outstanding balance due to Mr. Ching was $3,381,115, and the outstanding balance due to World Speed Notion Sdn Bhd was $6,924.
Item 14. Principal Accountant Fees and Services.
JLKZ CPA LLP is the Company’s current independent registered public accounting firm.
| 43 |
| Table of Contents |
(1) Audit Fees
The aggregate fees billed for each of the last two fiscal years for professional services rendered by the principal accountant for our audit of annual financial statements and review of financial statements included in our quarterly reports or services that are normally provided by the accountant in connection with statutory and regulatory filings or engagements for those fiscal years were:
2019 |
| $ | 40,000 |
|
| JLKZ CPA LLP |
2018 |
| $ | 9,800 |
|
| JLKZ CPA LLP |
(2) Audit-Related Fees
The aggregate fees billed in each of the last two fiscal years for assurance and related services by the principal accountants that are reasonably related to the performance of the audit or review of our financial statements and are not reported in the preceding paragraph:
2019 |
| $ | 0 |
|
2018 |
| $ | 0 |
|
(3) Tax Fees
The aggregate fees billed in each of the last two fiscal years for professional services rendered by the principal accountant for tax compliance, tax advice, and tax planning were:
2019 |
| $ | 0 |
|
2018 |
| $ | 600 |
|
(4) All Other Fees
The aggregate fees billed in each of the last two fiscal years for the products and services provided by the principal accountant, other than the services reported in paragraphs (1), (2), and (3) were:
2019 |
| $ | 0 |
|
2018 |
| $ | 0 |
|
The percentage of hours expended on the principal accountant’s engagement to audit our financial statements for the most recent fiscal year that were attributed to work performed by persons other than the principal accountant’s full time, permanent employees was 0%.
Audit Committee’s Pre-Approval Process
The Board of Directors acts as the audit committee of the Company, and accordingly, all services are approved by all the members of the Board of Directors.
| 44 |
| Table of Contents |
Item 15. Exhibits, Financial Statement Schedules.
(b) Index to Exhibits required by Item 601 of Regulation S-K.
_______________
(1). Filed as an Exhibit to the Company’s Form 8-K/A filed on August 22, 2019.
(2). Filed as an Exhibit to the Company’s Form S-1 filed on October 14, 2016.
(3). Filed as an Exhibit to the Company’s Form 8-K filed on January 4, 2019.
(4). Filed as an Exhibit to the Company’s Form 8-K filed on April 30, 2019.
+ In accordance with SEC Release 33-8238, Exhibit 32.1 is being furnished and not filed.
| 45 |
| Table of Contents |
Pursuant to the requirements of Section 13 or 15(d) of the Securities Exchange Act of 1934, the registrant has duly caused this report to be signed on its behalf by the undersigned, thereunto duly authorized.
CANNIS, INC. |
| ||
| |||
Dated: December 17, 2019 | By: | /s/ Eu Boon Ching |
|
Eu Boon Ching |
| ||
Chairman, President and CEO |
| ||
Pursuant to the requirements of the Securities Exchange Act of 1934, this report has been signed below by the following person on behalf of the registrant and in the capacities and on the dates indicated.
Signature | Title | Date | ||
/s/ Eu Boon Ching | President, CEO and Director | December 17, 2019 | ||
Eu Boon Ching | (Principal Executive Officer) |
Pursuant to the requirements of the Securities Exchange Act of 1934, this report has been signed below by the following person on behalf of the registrant and in the capacities and on the dates indicated.
/s/ XiaoJia Huang | Chief Financial Officer | December 17, 2019 | ||
XiaoJia Huang | (Principal Financial Officer and Principal Accounting Officer) |
| 46 |