Attached files
| file | filename |
|---|---|
| EX-99.1 - EXHIBIT 99.1 - Santander Consumer USA Holdings Inc. | a2018q4exhibit991.htm |
| 8-K - 8-K - Santander Consumer USA Holdings Inc. | a2018q4earningsrelease.htm |

Exhibit 99.2 Fourth Quarter and Full Year 2018 01.30.2019

IMPORTANT INFORMATION 2 Forward-Looking Statements This presentation contains forward-looking statements within the meaning of the Private Securities Litigation Reform Act of 1995. Any statements about our expectations, beliefs, plans, predictions, forecasts, objectives, assumptions, or future events or performance are not historical facts and may be forward-looking. These statements are often, but not always, made through the use of words or phrases such as anticipates, believes, can, could, may, predicts, potential, should, will, estimates, plans, projects, continuing, ongoing, expects, intends, and similar words or phrases. Although we believe that the expectations reflected in these forward-looking statements are reasonable, these statements are not guarantees of future performance and involve risks and uncertainties that are subject to change based on various important factors, some of which are beyond our control. For additional discussion of these risks, refer to the section entitled Risk Factors and elsewhere in our Annual Report on Form 10-K and our Quarterly Reports on Form 10-Q filed by us with the U.S. Securities and Exchange Commission (SEC). Among the factors that could cause the forward-looking statements in this presentation and/or our financial performance to differ materially from that suggested by the forward-looking statements are: (a) the inherent limitations in internal controls over financial reporting; (b) our ability to remediate any material weaknesses in internal controls over financial reporting completely and in a timely manner; (c) continually changing federal, state, and local laws and regulations could materially adversely affect our business; (d) adverse economic conditions in the United States and worldwide may negatively impact our results; (e) our business could suffer if our access to funding is reduced; (f) significant risks we face implementing our growth strategy, some of which are outside our control; (g) unexpected costs and delays in connection with exiting our personal lending business; (h) our agreement with FCA US LLC may not result in currently anticipated levels of growth, and is subject to certain conditions that could result in termination of the agreement; (i) our business could suffer if we are unsuccessful in developing and maintaining relationships with automobile dealerships; (j) our financial condition, liquidity, and results of operations depend on the credit performance of our loans; (k) loss of our key management or other personnel, or an inability to attract such management and personnel; (l) certain regulations, including but not limited to oversight by the Office of the Comptroller of the Currency, the Consumer Financial Protection Bureau, the European Central Bank, and the Federal Reserve, whose oversight and regulation may limit certain of our activities, including the timing and amount of dividends and other limitations on our business; and (m) future changes in our relationship with Banco Santander which could adversely affect our operations. If one or more of the factors affecting our forward-looking information and statements proves incorrect, our actual results, performance or achievements could differ materially from those expressed in, or implied by, forward-looking information and statements. Therefore, we caution the reader not to place undue reliance on any forward-looking information or statements. The effect of these factors is difficult to predict. Factors other than these also could adversely affect our results, and the reader should not consider these factors to be a complete set of all potential risks or uncertainties. Any forward-looking statements only speak as of the date of this document, and we undertake no obligation to update any forward-looking information or statements, whether written or oral, to reflect any change, except as required by law. All forward-looking statements attributable to us are expressly qualified by these cautionary statements.

FY 2018 HIGHLIGHTS 3 » Net income for the full year 2018 was $916 million, or $2.54 per diluted common share » The Federal Reserve terminated the 2015 Written Agreement with SC's majority owner, Santander Holdings USA, Inc. (“SHUSA”). SHUSA also received its second consecutive capital stress test non-objection » Achieved an average annual FCA penetration rate of 30%, up from 21% in 2017 » Through Santander Bank N.A., fully-launched a program in July leading to $1.9 billion in originations, and increased FCA dealer receivables (“floorplan”) 43% year-over-year, to $2.8 billion » Leading auto loan asset-backed securities (“ABS”) issuer with $13 billion in ABS » Completed prime auto loan portfolio conversion with a new third party increasing serviced for others balance by $1.0 billion » Reached agreements with AutoFi & AutoGravity expanding SC digital partnerships in 2018 » Total auto originations1 of $28.8 billion, up 43% YoY » Net finance and other interest income of $4.5 billion, up 1.8% YoY » RIC net charge-off ratio of 8.5%, down 50 basis points YoY » 59+ DQ ratio of 6.0% down 30 basis points YoY » Return on average assets (“ROA”) of 2.2% » Expense ratio of 2.1% *Prior periods have been revised as stated in the 8-K filed by SC on October 31, 2018. See financial supplement on the SC Investor Relations website for further details. 1 Includes SBNA Originations

ECONOMIC INDICATORS 4 U.S. Auto Sales Consumer Confidence3 Units in Millions Index Q1 1966=100 1 20 Used Sales Quarterly Total New SAAR2 Retail Fleet 20 18 17.6 18 Max 101 16 16 98.3 14.3 14 14 12 12 10.2 10 10 8 8 ORIGINATIONS 6 6 4 4 3.3 2 2 Min 55 0 Dec-12 Dec-13 Dec-14 Dec-15 Dec-16 Dec-17 Dec-18 Dec-08 Dec-09 Dec-10 Dec-11 Dec-12 Dec-13 Dec-14 Dec-15 Dec-16 Dec-17 Dec-18 4 U.S. GDP US Unemployment Statistics5 % Max: 4.2 Max:10 3.4 CREDIT 3.9 Min -4 Min: 3.7 Dec-08 Dec-09 Dec-10 Dec-11 Dec-12 Dec-13 Dec-14 Dec-15 Dec-16 Dec-17 Dec-18 Dec-08 Dec-09 Dec-10 Dec-11 Dec-12 Dec-13 Dec-14 Dec-15 Dec-16 Dec-17 Dec-18 1 Edmunds’ data, one quarter lag, data as of December 31, 2018 2 JD Power SAAR data 3 University of Michigan 4 U.S. Bureau of Economic Analysis, one quarter lag, data as of December 31, 2018 5 U.S. Bureau of Labor Statistics

AUTO INDUSTRY ANALYSIS 5 Used Vehicle Indices1 SC Recovery Rates2 Manheim: Seasonally Adjusted JD Power: Not Seasonally Adjusted % Manheim (Left Axis) JDP Used-Vehicle Price Index (Right Axis) 145 135 60% SC Auction Only Recovery Rate SC Recovery Rate (Quarterly) 140 130 55% 137.6 135 125 130 120 50% 47.6% 46.3% SEVERITY 125 116.9 115 47.3% 45% 120 110 43.4% 40% 115 105 110 100 35% Dec-13 Dec-14 Dec-15 Dec-16 Dec-17 Dec-18 Dec-13 Dec-14 Dec-15 Dec-16 Dec-17 Dec-18 Industry Net Loss Rates3 Industry 60+ Day Delinquency Rates3 % % Subprime Subprime Max 13.6% Max 5.9% 5.5% 9.2% CREDIT Min 3.3% Min 1.6% Oct-08 Oct-10 Oct-12 Oct-14 Oct-16 Oct-18 Oct-08 Oct-10 Oct-12 Oct-14 Oct-16 Oct-18 1 Manheim, Inc.; Indexed to a basis of 100 at 1995 levels; JD Power Used-Vehicle Price Index (not seasonally adjusted) 2 Auction Only - includes all auto-related recoveries including inorganic/purchased receivables from auction lanes only 2 Auction Plus – Per the financial statements includes insurance proceeds, bankruptcy/deficiency sales, and timing impacts 3 Standard & Poor’s Rating Services (ABS Auto Trust Data – two-month lag on data, as of Oct 31, 2018)

DIVERSIFIED UNDERWRITING ACROSS THE CREDIT SPECTRUM 6 Originations growth across all channels; fully launched SBNA originations program Quarterly Originations Full Year Originations % Variance $ in millions Q4 2017 Q4 2018 2017 2018 Quarterly YoY FYoFY Total Core Retail Auto $ 1,469 $ 2,221 $ 7,471 $ 9,416 51% 26% Chrysler Capital Loans (<640)1 741 1,337 3,372 5,718 80% 70% Chrysler Capital Loans (≥640)1 804 1,176 3,341 3,921 46% 17% Total Chrysler Capital Retail 1,545 2,512 6,713 9,638 63% 44% Total Leases2 1,299 2,129 5,997 9,752 64% 63% Total Auto Originations3 4,313 6,862 20,181 28,807 59% 43% Total Personal Lending 529 544 1,477 1,483 3% 0% Total SC Originations $ 4,842 $ 7,406 $ 21,659 $ 30,289 53% 40% Balances Balances Asset Sales4 - - 2,979 2,906 N/A (2%) SBNA Originations4 - 1,116 - 1,855 N/A N/A Average Managed Assets5 49,022 53,804 50,161 51,329 10% 2% 1 Approximate FICOs 2 Includes nominal capital lease originations 3 Includes SBNA originations 4 Asset sales and SBNA originations are not on SC’s balance sheet, servicing rights retained 5 Prior periods have been revised as stated in the 8-K filed by SC on October 31, 2018. See financial supplement on the SC Investor Relations website for further details.
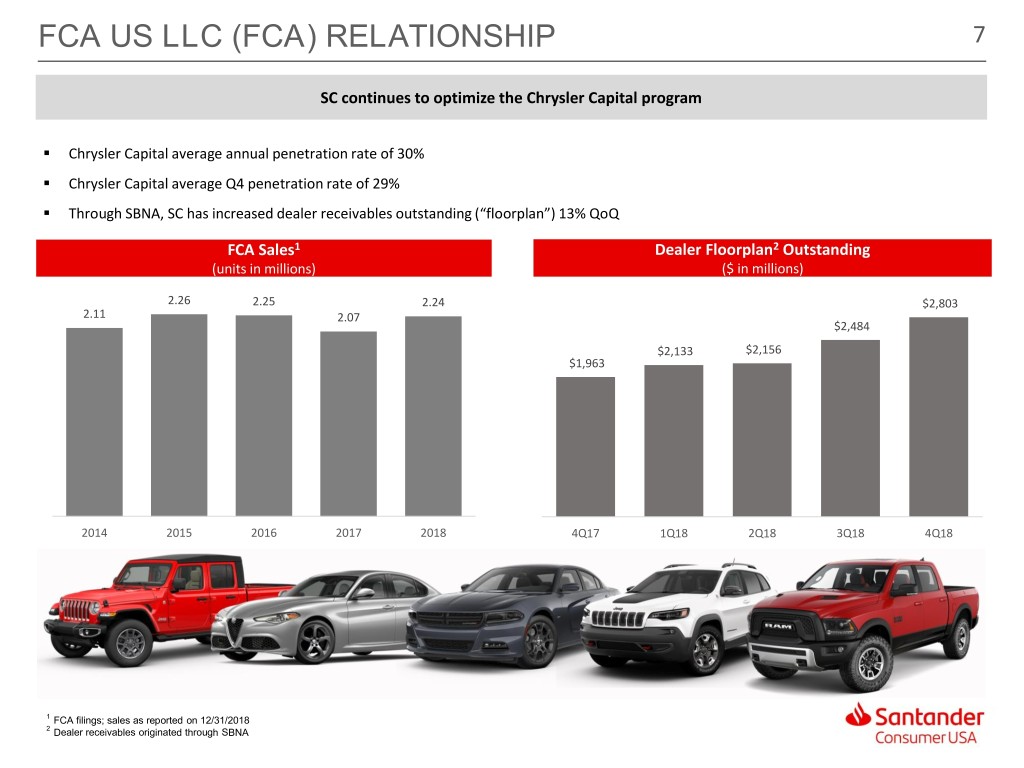
FCA US LLC (FCA) RELATIONSHIP 7 SC continues to optimize the Chrysler Capital program . Chrysler Capital average annual penetration rate of 30% . Chrysler Capital average Q4 penetration rate of 29% . Through SBNA, SC has increased dealer receivables outstanding (“floorplan”) 13% QoQ FCA Sales1 Dealer Floorplan2 Outstanding (units in millions) ($ in millions) 2.26 2.25 2.24 $2,803 2.11 2.07 $2,484 $2,133 $2,156 $1,963 2014 2015 2016 2017 2018 4Q17 1Q18 2Q18 3Q18 4Q18 1 FCA filings; sales as reported on 12/31/2018 2 Dealer receivables originated through SBNA

SERVICED FOR OTHERS (SFO) PLATFORM 8 $1.1 billion in originations in Q4 2018 through the SBNA originations program Serviced for Others Balances, End of Period ($ in Millions) $9,511 $9,195 $8,985 $8,639 $8,723 4Q17 1Q18 2Q18 3Q18 4Q18 Santander Flow Sales 1,475 1,156 275 SBNA Originations 24 29 685 1,116 Other1 972 1 Other includes 2Q18 portfolio conversion

Q4 2018 HIGHLIGHTS AND SUBSEQUENT EVENTS 9 » Net income of $104 million, or $0.29 per diluted common share » Total auto originations1 of $6.9 billion, up 59% YoY » Core retail auto originations of $2.2 billion, up 51% YoY » Chrysler Capital loan originations of $2.5 billion, up 63% YoY » Chrysler Capital lease originations of $2.1 billion, up 64% YoY » SBNA Program Originations of $1.1 billion » Net finance and other interest income of $1.1 billion, up 9% YoY » ROA of 1.0% » CET1 ratio of 15.7% » $2.2 billion in ABS sold » NCO ratio of 10.6% up 30 basis points YoY » 59+ DQ ratio of 6.0% down 30 basis points YoY » In January 2019, the Company completed its previously announced $200 million share repurchase program » $1.0 billion in ABS through DRIVE 2019-1 *Prior periods have been revised as stated in the 8-K filed by SC on October 31, 2018. See financial supplement on the SC Investor Relations website for further details. 1 Includes SBNA Originations

Q4 2018 FINANCIAL RESULTS 10 Q4 2017 figures were impacted by certain significant items including tax reform1 Three Months Ended (Unaudited, Dollars in Thousands, except per share) % Variance December 31, 2018 September 30, 2018 December 31, 20171 QoQ YoY Interest on finance receivables and loans $ 1,235,889 $ 1,227,129 $ 1,165,091 1% 6% Net leased vehicle income 204,785 194,021 112,491 6% 82% Other finance and interest income 9,082 8,522 4,470 7% 103% Interest expense 311,196 285,583 236,600 9% 32% Net finance and other interest income $ 1,138,560 $ 1,144,089 $ 1,045,452 (0%) 9% Provision for credit losses 690,786 597,914 598,293 16% 15% Profit sharing 14,255 1,652 7,235 763% 97% Total other income (33,418) 24,640 (37,716) (236%) (11%) Total operating expenses 256,468 272,341 426,040 (6%) (40%) Income before tax $ 143,633 $ 296,823 $ (23,833) (52%) (703%) Income tax expense 39,295 64,875 (601,282) (39%) (107%) Net income $ 104,338 $ 231,947 $ 577,450 (55%) (82%) Diluted EPS ($) $ 0.29 $ 0.64 $ 1.60 (55%) (82%) Average total assets $ 43,458,471 $ 41,985,751 $ 38,973,432 4% 11.5% Average managed assets $ 53,804,349 $ 52,472,270 $ 49,021,506 3% 9.8% *Prior periods have been revised as stated in the 8-K filed by SC on October 31, 2018. See financial supplement on the SC Investor Relations website for further details. 1As stated in the 8-K filed by SC January 31, 2018, Q4 2017 figures were impacted by certain significant items including tax reform.
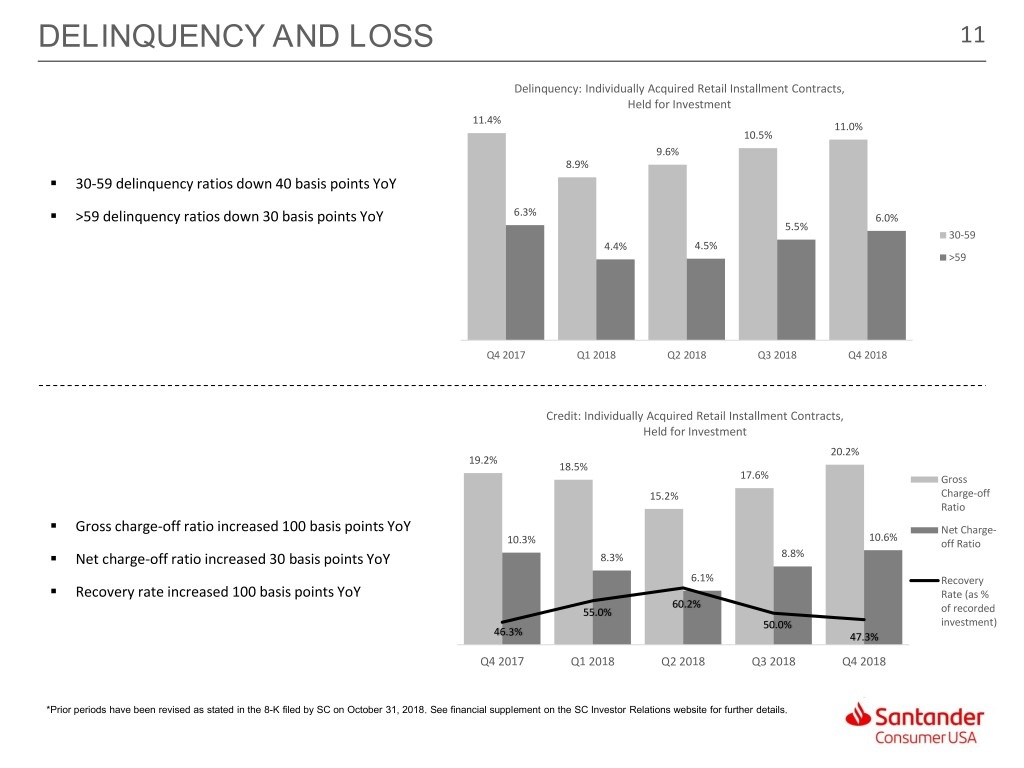
DELINQUENCY AND LOSS 11 Delinquency: Individually Acquired Retail Installment Contracts, Held for Investment 11.4% 11.0% 10.5% 9.6% 8.9% . 30-59 delinquency ratios down 40 basis points YoY . 6.3% >59 delinquency ratios down 30 basis points YoY 6.0% 5.5% 30-59 4.4% 4.5% >59 Q4 2017 Q1 2018 Q2 2018 Q3 2018 Q4 2018 Credit: Individually Acquired Retail Installment Contracts, Held for Investment 23.0% 120.0% 20.2% 19.2% 110.0% 18.5% 17.6% 18.0% Gross 100.0% 15.2% Charge-off Ratio . 90.0% Gross charge-off ratio increased 100 basis points YoY 13.0% Net Charge- 10.6% 80.0% 10.3% off Ratio . 8.3% 8.8% Net charge-off ratio increased 30 basis points YoY 70.0% 8.0% 6.1% Recovery . 60.0% Recovery rate increased 100 basis points YoY Rate (as % 60.2% 55.0% 50.0% of recorded 3.0% 50.0% investment) 46.3% 47.3% 40.0% -2.0% Q4 2017 Q1 2018 Q2 2018 Q3 2018 Q4 2018 30.0% *Prior periods have been revised as stated in the 8-K filed by SC on October 31, 2018. See financial supplement on the SC Investor Relations website for further details.
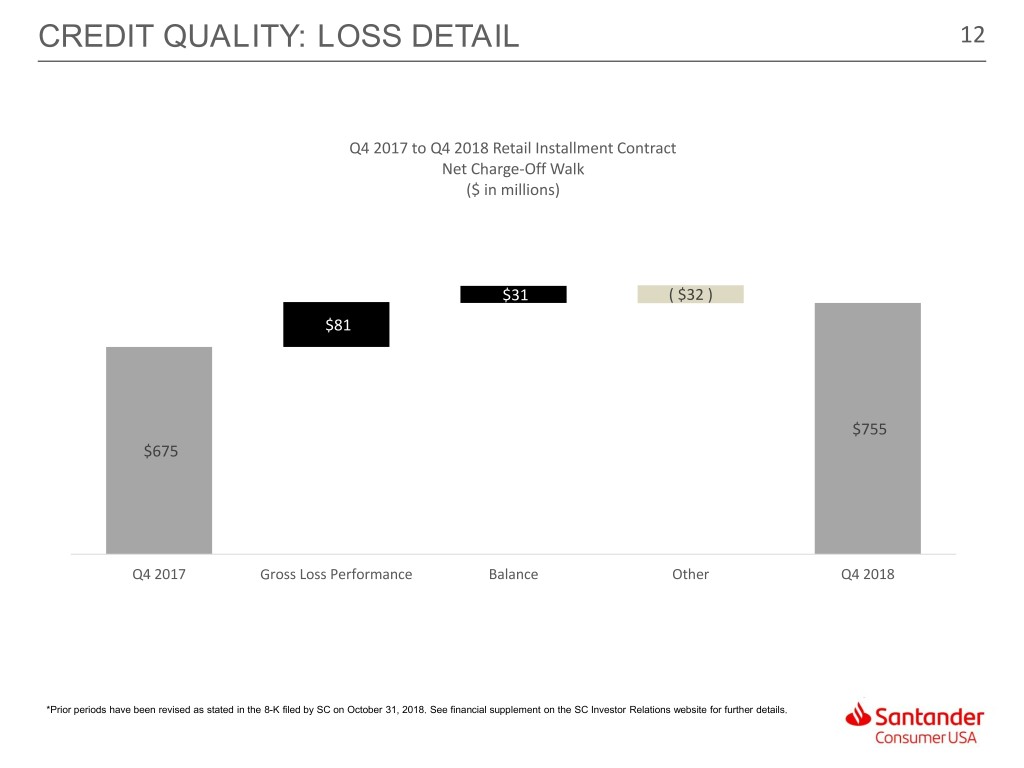
CREDIT QUALITY: LOSS DETAIL 12 Q4 2017 to Q4 2018 Retail Installment Contract Net Charge-Off Walk ($ in millions) $31 ( $32 ) $81 $755 $675 Q4 2017 Gross Loss Performance Balance Other Q4 2018 *Prior periods have been revised as stated in the 8-K filed by SC on October 31, 2018. See financial supplement on the SC Investor Relations website for further details.

PROVISION AND RESERVES 13 Q3 2018 to Q4 2018 ALLL Reserve Walk2 ($ in millions) 3,800 3,700 $33 . Allowance decreased $65 million QoQ 3,600 $77 . 1 New volume, TDR migration and performance 3,500 $293 ($468) adjustment were offset by liquidations and other 3,400 3,300 3,200 3,305 3,100 $3,240 3,000 Q3 2018 New Performance TDR Liquidations Q4 2018 Volume Adjustment Migration & Other Provision Expense and Allowance Ratio ($ in millions) $800 $691 14.5% $700 $598 $598 $600 . $510 Allowance to loans ratio decreased 30 bps to 11.4% QoQ $500 $407 13.0% . $400 Provision for credit losses increased $93 million YoY 12.9% 12.7% $300 12.1% 11.5% $200 11.7% $100 11.4% $0 10.0% Q4 2017 Q1 2018 Q2 2018 Q3 2018 Q4 2018 Provision for credit losses Allowance Ratio *Prior periods have been revised as stated in the 8-K filed by SC on October 31, 2018. See financial supplement on the SC Investor Relations website for further details. 1 TDR migration – the allowance for assets classified as TDRs or “troubled debt restructuring” takes into consideration expected lifetime losses, typically requiring additional coverage 2 Explanation of quarter over quarter variance are estimates

TDR BALANCE COMPOSITION BY VINTAGE 14 TDR balances are down quarter over quarter TDR Balance by Origination Vintage ($ billions) $6.30 $6.31 $6.10 $6.10 $5.89 $5.79 2% $5.76 16% 6% 4% 9% 20% $5.38 24% 10% 14% 26% 35% 36% 37% 27% 37% 27% 36% 34% 29% 32% 27% 24% 31% 22% 20% 18% 17% 16% 32% 28% 23% 21% 18% 16% 14% 12% 1Q17 2Q17 3Q17 4Q17 1Q18 2Q18 3Q18 4Q18 2013 & Prior 2014 2015 2016 2017 *Prior periods have been revised as stated in the 8-K filed by SC on October 31, 2018. See financial supplement on the SC Investor Relations website for further details.

EXPENSE MANAGEMENT 15 Q4 2017 Operating expenses were impacted by certain significant items1 $60,002 10.0% $52,472 $53,804 $50,445 $49,022 $50,002 $48,517 8.0% Average $426 Managed $40,002 Assets 6.0% ($ millions) $30,002 $288 $277 $272 Total $256 Expenses 4.0% ($ millions) $20,002 3.5% 2.0% Expense $10,002 2.4% 2.2% Ratio 2.1% 1.9% $2 0.0% Q4 2017 1 Q1 2018 Q2 2018 Q3 2018 Q4 2018 *Prior periods have been revised as stated in to the 8-K filed on October 31, 2018 by SC. See financial supplement on the SC Investor Relations website for further details. 1 Q4 2017 was impacted by significant items. Please refer to the 8-K filed January 31, 2018 for further details.

FUNDING AND LIQUIDITY 16 Total funding of $45.2 billion at the end Q4 2018, up 7% from $42.3 billion at the end of Q3 2018 Asset-Backed Securities Financings ($ Billions) ($ Billions) Amortizing Revolving 9.9 10.1 19.7 19.3 9.6 9.9 4.5 5.9 7.7 5.2 5.4 4.2 Q3 2018 Q4 2018 Q3 2018 Q4 2018 Q3 2018 Q4 2018 Unused Used . $13 billion in asset-backed securities (ABS) in 2018 . $17.8 billion in commitments from 12 lenders1 . 58% unused capacity on revolving lines at Q4 2018 Banco Santander & Subsidiaries SBNA Originations & Asset Sales ($ Billions) ($ Billions) 7.0 6.5 1.1 3.0 3.5 1.0 Term Asset Sales 0.5 0.5 Revolving 0.7 1.1 SBNA 3.0 3.0 Contingent Originations 0.3 Q3 2018 Q4 2018 Q3 2018 Q4 2018 . $7.0 billion in total commitments . No asset sales in Q4 . 100% unused revolving capacity at Q4 2018 1 Does not include repo facilities

CONSISTENT CAPITAL GENERATION 17 During January 2019, the Company completed its previously announced $200 million share repurchase program. 1 2 CET1 TCE/TA 17.0% 16.9% 16.9% 16.6% 16.4% 16.4% 16.5% 16.2% 15.7% 15.8% $ in millions Q4 2017 Q1 2018 Q2 2018 Q3 2018 Q4 2018 Tangible Assets $39,299 $39,924 $41,052 $42,701 $43,851 Tangible Common Equity $6,362 $6,608 $6,928 $7,035 $6,909 *Prior periods have been revised as stated in the 8-K filed by SC on October 31, 2018. See financial supplement on the SC Investor Relations website for further details. 1 Common Equity Tier 1 (CET1) Capital Ratio is a non-GAAP financial measure that begins with stockholders’ equity and then adjusts for AOCI, goodwill/intangibles, DTAs, cash flow hedges and other regulatory exclusions over risk-weighted assets. See appendix for further details. 2 Tangible Common Equity to Tangible Assets is a non-GAAP financial measure defined as the ratio of Total Equity, excluding Goodwill and Intangible Assets, to Total Assets, excluding Goodwill and Intangible Assets

APPENDIX
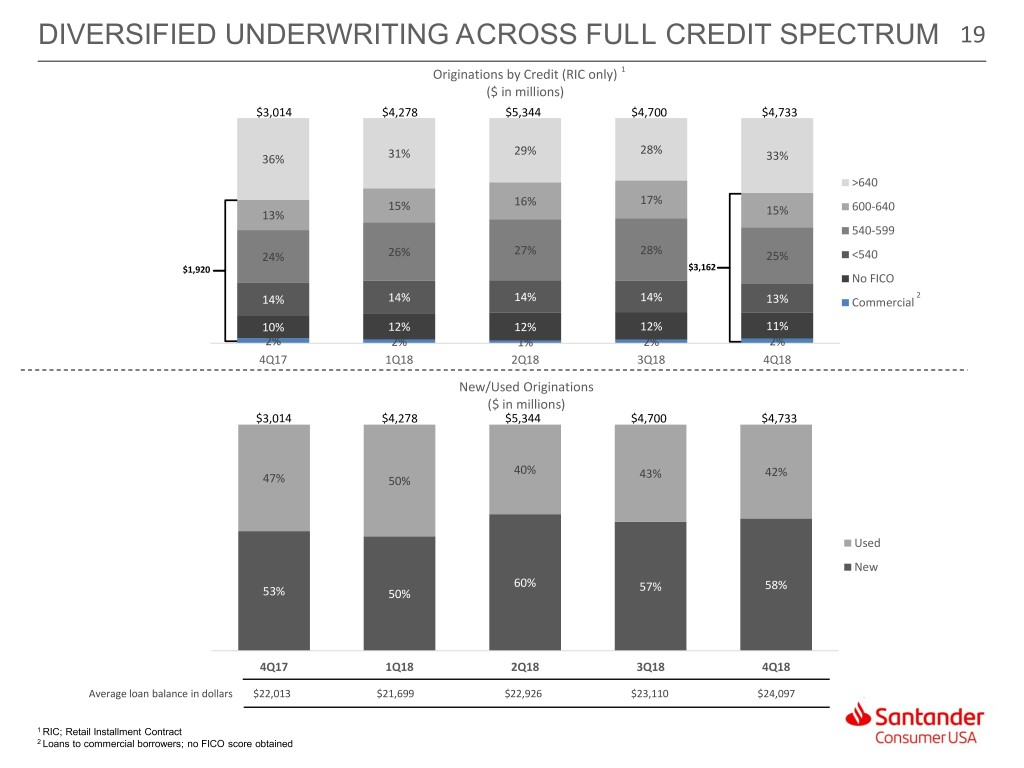
DIVERSIFIED UNDERWRITING ACROSS FULL CREDIT SPECTRUM 19 Originations by Credit (RIC only) 1 ($ in millions) $3,014 $4,278 $5,344 $4,700 $4,733 29% 28% 36% 31% 33% >640 17% 15% 16% 600-640 13% 15% 540-599 27% 28% 24% 26% 25% <540 $1,920 $3,162 No FICO 2 14% 14% 14% 14% 13% Commercial 10% 12% 12% 12% 11% 2% 2% 1% 2% 2% 4Q17 1Q18 2Q18 3Q18 4Q18 New/Used Originations ($ in millions) $3,014 $4,278 $5,344 $4,700 $4,733 40% 43% 42% 47% 50% Used New 60% 57% 58% 53% 50% 4Q17 1Q18 2Q18 3Q18 4Q18 Average loan balance in dollars $22,013 $21,699 $22,926 $23,110 $24,097 1 RIC; Retail Installment Contract 2 Loans to commercial borrowers; no FICO score obtained
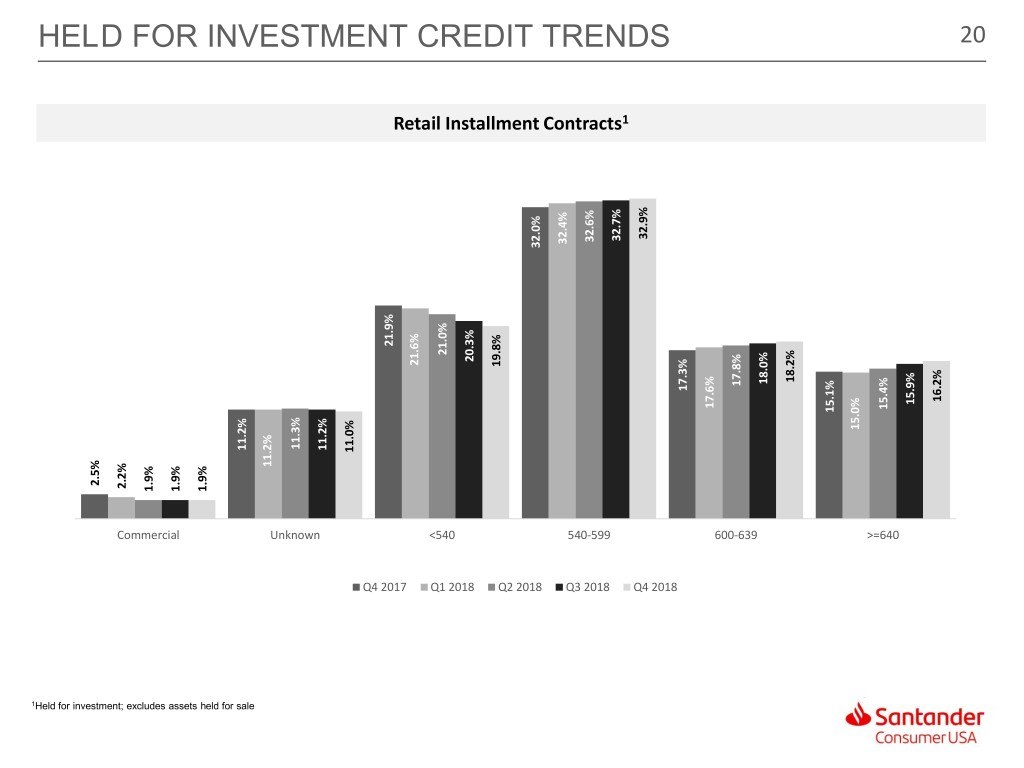
HELD FOR INVESTMENT CREDIT TRENDS 20 Retail Installment Contracts1 32.9% 32.7% 32.6% 32.4% 32.0% 21.9% 21.0% 20.3% 21.6% 19.8% 18.2% 18.0% 17.8% 17.3% 16.2% 15.9% 17.6% 15.4% 15.1% 15.0% 11.3% 11.2% 11.2% 11.0% 11.2% 2.5% 2.2% 1.9% 1.9% 1.9% Commercial Unknown <540 540-599 600-639 >=640 Q4 2017 Q1 2018 Q2 2018 Q3 2018 Q4 2018 1Held for investment; excludes assets held for sale
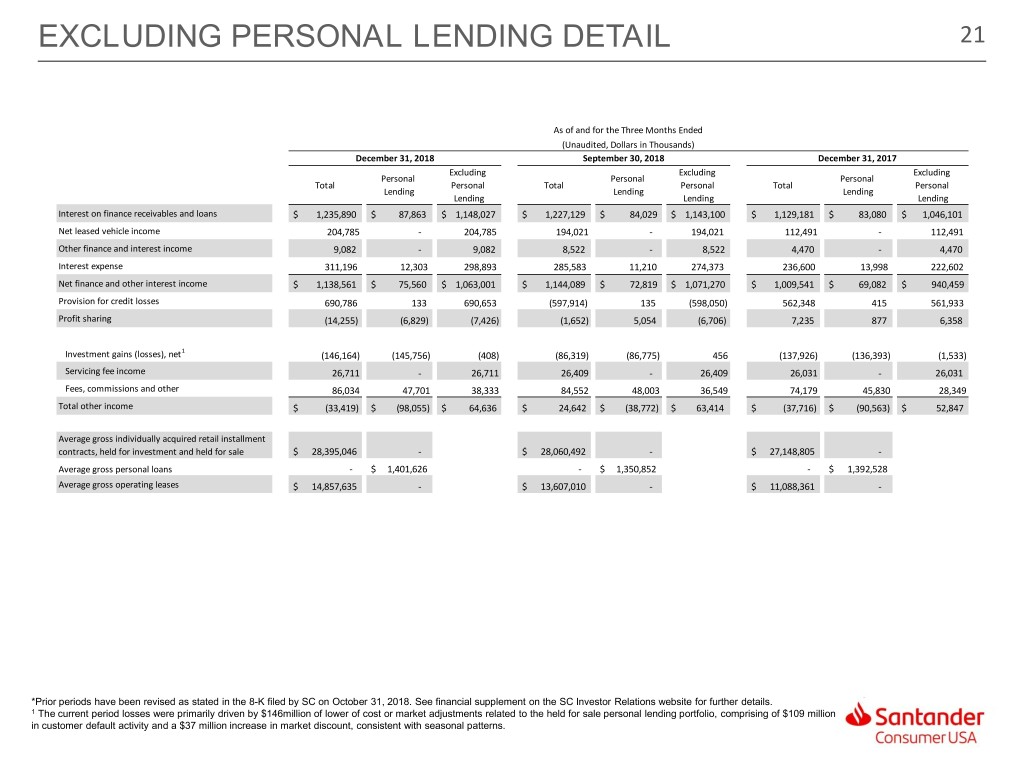
EXCLUDING PERSONAL LENDING DETAIL 21 As of and for the Three Months Ended (Unaudited, Dollars in Thousands) December 31, 2018 September 30, 2018 December 31, 2017 Excluding Excluding Excluding Personal Personal Personal Total Personal Total Personal Total Personal Lending Lending Lending Lending Lending Lending Interest on finance receivables and loans $ 1,235,890 $ 87,863 $ 1,148,027 $ 1,227,129 $ 84,029 $ 1,143,100 $ 1,129,181 $ 83,080 $ 1,046,101 Net leased vehicle income 204,785 - 204,785 194,021 - 194,021 112,491 - 112,491 Other finance and interest income 9,082 - 9,082 8,522 - 8,522 4,470 - 4,470 Interest expense 311,196 12,303 298,893 285,583 11,210 274,373 236,600 13,998 222,602 Net finance and other interest income $ 1,138,561 $ 75,560 $ 1,063,001 $ 1,144,089 $ 72,819 $ 1,071,270 $ 1,009,541 $ 69,082 $ 940,459 Provision for credit losses 690,786 133 690,653 (597,914) 135 (598,050) 562,348 415 561,933 Profit sharing (14,255) (6,829) (7,426) (1,652) 5,054 (6,706) 7,235 877 6,358 1 Investment gains (losses), net (146,164) (145,756) (408) (86,319) (86,775) 456 (137,926) (136,393) (1,533) Servicing fee income 26,711 - 26,711 26,409 - 26,409 26,031 - 26,031 Fees, commissions and other 86,034 47,701 38,333 84,552 48,003 36,549 74,179 45,830 28,349 Total other income $ (33,419) $ (98,055) $ 64,636 $ 24,642 $ (38,772) $ 63,414 $ (37,716) $ (90,563) $ 52,847 Average gross individually acquired retail installment contracts, held for investment and held for sale $ 28,395,046 - $ 28,060,492 - $ 27,148,805 - Average gross personal loans - $ 1,401,626 - $ 1,350,852 - $ 1,392,528 Average gross operating leases $ 14,857,635 - $ 13,607,010 - $ 11,088,361 - *Prior periods have been revised as stated in the 8-K filed by SC on October 31, 2018. See financial supplement on the SC Investor Relations website for further details. 1 The current period losses were primarily driven by $146million of lower of cost or market adjustments related to the held for sale personal lending portfolio, comprising of $109 million in customer default activity and a $37 million increase in market discount, consistent with seasonal patterns.

FY 2018 EXCLUDING PERSONAL LENDING DETAIL 22 Personal lending earned $117 million before operating expenses and taxes for FY 20181 For the Year Ended ($ in Thousands) December 31, 2018 Excluding Personal Total Personal Lending Lending Interest on finance receivables and loans $ 4,842,564 $ 345,923 $ 4,496,641 Net leased vehicle income 721,963 - 721,963 Other finance and interest income 33,235 - 33,235 Interest expense 1,111,760 45,386 1,066,374 Net finance and other interest income $ 4,486,002 $ 300,537 $ 4,185,465 Provision for credit losses 2,205,585 187 2,205,398 Profit sharing 33,137 6,850 26,287 2 Investment gains (losses), net (401,638) (367,219) (34,419) Servicing fee income 106,840 - 106,840 Fees, commissions and other 333,458 190,429 143,029 Total other income $ 38,660 $ (176,790) $ 215,450 Average gross individually acquired retail installment contracts, held for investment and held for sale $ 27,756,099 - Average gross personal loans - $ 1,404,261 Average gross operating leases $ 13,048,396 - *Prior periods have been revised as stated in the 8-K filed by SC on October 31, 2018. See financial supplement on the SC Investor Relations website for further details. 1 Personal lending calculation = Net finance and other interest income $300,538 minus Provision $187 minus Profit sharing $6,850 plus Total other income $(176,790) = $116,711 2 The current period losses were primarily driven by $367million of lower of cost or market adjustments related to the held for sale personal lending portfolio, comprising of $405 million in customer default activity and a $38 million decrease in market discount.
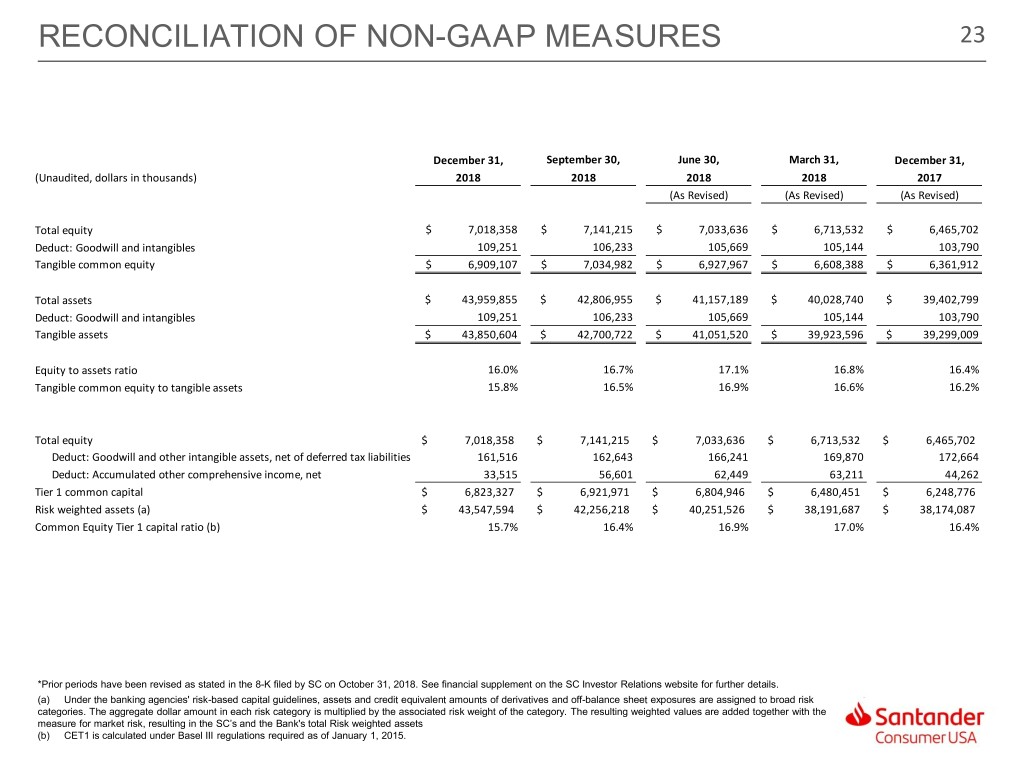
RECONCILIATION OF NON-GAAP MEASURES 23 December 31, September 30, June 30, March 31, December 31, (Unaudited, dollars in thousands) 2018 2018 2018 2018 2017 (As Revised) (As Revised) (As Revised) Total equity $ 7,018,358 $ 7,141,215 $ 7,033,636 $ 6,713,532 $ 6,465,702 Deduct: Goodwill and intangibles 109,251 106,233 105,669 105,144 103,790 Tangible common equity $ 6,909,107 $ 7,034,982 $ 6,927,967 $ 6,608,388 $ 6,361,912 Total assets $ 43,959,855 $ 42,806,955 $ 41,157,189 $ 40,028,740 $ 39,402,799 Deduct: Goodwill and intangibles 109,251 106,233 105,669 105,144 103,790 Tangible assets $ 43,850,604 $ 42,700,722 $ 41,051,520 $ 39,923,596 $ 39,299,009 Equity to assets ratio 16.0% 16.7% 17.1% 16.8% 16.4% Tangible common equity to tangible assets 15.8% 16.5% 16.9% 16.6% 16.2% Total equity $ 7,018,358 $ 7,141,215 $ 7,033,636 $ 6,713,532 $ 6,465,702 Deduct: Goodwill and other intangible assets, net of deferred tax liabilities 161,516 162,643 166,241 169,870 172,664 Deduct: Accumulated other comprehensive income, net 33,515 56,601 62,449 63,211 44,262 Tier 1 common capital $ 6,823,327 $ 6,921,971 $ 6,804,946 $ 6,480,451 $ 6,248,776 Risk weighted assets (a) $ 43,547,594 $ 42,256,218 $ 40,251,526 $ 38,191,687 $ 38,174,087 Common Equity Tier 1 capital ratio (b) 15.7% 16.4% 16.9% 17.0% 16.4% *Prior periods have been revised as stated in the 8-K filed by SC on October 31, 2018. See financial supplement on the SC Investor Relations website for further details. (a) Under the banking agencies' risk-based capital guidelines, assets and credit equivalent amounts of derivatives and off-balance sheet exposures are assigned to broad risk categories. The aggregate dollar amount in each risk category is multiplied by the associated risk weight of the category. The resulting weighted values are added together with the measure for market risk, resulting in the SC’s and the Bank's total Risk weighted assets (b) CET1 is calculated under Basel III regulations required as of January 1, 2015.

