Attached files
| file | filename |
|---|---|
| EX-10.30 - EXHIBIT 10.30 - Santander Consumer USA Holdings Inc. | a2017q4ex1030.htm |
| EX-32.2 - EXHIBIT 32.2 - Santander Consumer USA Holdings Inc. | a2017q4ex322.htm |
| EX-32.1 - EXHIBIT 32.1 - Santander Consumer USA Holdings Inc. | a2017q4ex321.htm |
| EX-31.2 - EXHIBIT 31.2 - Santander Consumer USA Holdings Inc. | a2017q4ex312.htm |
| EX-31.1 - EXHIBIT 31.1 - Santander Consumer USA Holdings Inc. | a2017q4ex311.htm |
| EX-23.2 - EXHIBIT 23.2 - Santander Consumer USA Holdings Inc. | a2017q4ex232.htm |
| EX-23.1 - EXHIBIT 23.1 - Santander Consumer USA Holdings Inc. | a2017q4ex231.htm |
| EX-21.1 - EXHIBIT 21.1 - Santander Consumer USA Holdings Inc. | a2017q4ex211.htm |
UNITED STATES
SECURITIES AND EXCHANGE COMMISSION
Washington, D.C. 20549
FORM 10-K
ý | Annual Report Pursuant to Section 13 or 15(d) of the Securities Exchange Act of 1934 |
For the fiscal year ended December 31, 2017
¨ | Transition Report Pursuant to Section 13 or 15(d) of the Securities Exchange Act of 1934 |
Commission File Number: 001-36270
SANTANDER CONSUMER USA HOLDINGS INC.
(Exact Name of Registrant as Specified in Its Charter)
_______________________________________________________________
Delaware | 32-0414408 | |
(State or other jurisdiction of incorporation or organization) | (I.R.S. Employer Identification Number) | |
1601 Elm Street, Suite 800
Dallas, Texas 75201
(214) 634-1110
(Address, including zip code, and telephone number, including area code, of principal executive offices)
_______________________________________________________________
Securities registered pursuant to Section 12(b) of the Act:
Title of Class | Name of Exchange on Which Registered | |
Common Stock, $0.01 par value per share | New York Stock Exchange | |
Securities registered pursuant to Section 12(g) of the Act:
None
_______________________________________________________________
Indicate by check mark whether the registrant is a well-known seasoned issuer, as defined in Rule 405 of the Securities Act. Yes ý No ¨
Indicate by check mark if the registrant is not required to file reports pursuant to Section 13 or 15(d) of the Act. Yes ¨ No ý
Indicate by check mark whether the registrant (1) has filed all reports required to be filed by Section 13 or 15(d) of the Securities Exchange Act of 1934 during the preceding 12 months (or for such shorter period that the registrant was required to file such reports), and (2) has been subject to such filing requirements for the past 90 days. Yes ý No ¨
Indicate by check mark whether the registrant has submitted electronically and posted on its corporate Web site, if any, every Interactive Data File required to be submitted and posted pursuant to Rule 405 of Regulation ST (Section 232.405 of this chapter) during the preceding 12 months (or for such shorter period that the registrant was required to submit and post such files). Yes ý No ¨
Indicate by check mark if disclosure of delinquent filers pursuant to Item 405 of Regulation S-K is not contained herein, and will not be contained, to the best of Registrant’s knowledge, in definitive proxy or information statements incorporated by reference in Part III of this Form 10-K or any amendment to this Form 10-K. ý
Indicate by check mark whether the registrant is a large accelerated filer, an accelerated filer, a non-accelerated filer, a smaller reporting company or an emerging growth company. See definition of “large accelerated filer”, “accelerated filer”, “smaller reporting company” and “emerging growth company” in Rule 12b-2 of the Exchange Act. (Check one):
Large accelerated filer | ý | Accelerated filer | ¨ | Emerging growth company | ¨ | ||||
Non-accelerated filer | ¨ | Smaller reporting company | ¨ | ||||||
If an emerging growth company, indicate by check mark if the registrant has elected not to use the extended transition period for complying with any new or revised financial accounting standards provided pursuant to Section 13(a) of the Exchange Act. ¨
Indicate by check mark whether the registrant is a shell company (as defined in Rule 12b-2 of the Exchange Act) Yes ¨ No ý
As of June 30, 2017, the Registrant’s common stock, par value $0.01 per share, held by non-affiliates had an aggregate market value of approximately $1.4 billion based on the closing price on that date on the New York Stock Exchange of $12.76 per share.
Indicate the number of shares outstanding of each of the issuer’s classes of common stock, as of the latest practicable date.
Class | Outstanding at February 15, 2018 | |
Common Stock ($0.01 par value) | 360,608,237 shares | |
Documents Incorporated By Reference
Portions of the registrant’s definitive proxy statement to its 2018 annual meeting of stockholders (the Proxy Statement) are incorporated by reference into Part III of the Annual Report on Form 10-K where indicated.
INDEX
Unless otherwise specified or the context otherwise requires, the use herein of the terms “we,” “our,” “us,” “SC,” and the “Company” refer to Santander Consumer USA Holdings Inc. and its consolidated subsidiaries.
Cautionary Note Regarding Forward-Looking Information
This Annual Report on Form 10-K contains forward-looking statements within the meaning of the Private Securities Litigation Reform Act of 1995. Any statements about the Company's expectations, beliefs, plans, predictions, forecasts, objectives, assumptions, or future events or performance are not historical facts and may be forward-looking. These statements are often, but not always, made through the use of words or phrases such as “anticipates,” “believes,” “can,” “could,” “may,” “predicts,” “potential,” “should,” “will,” “estimate,” “plans,” “projects,” “continuing,” “ongoing,” “expects,” “intends,” and similar words or phrases. Although the Company believes that the expectations reflected in these forward-looking statements are reasonable, these statements are not guarantees of future performance and involve risks and uncertainties which are subject to change based on various important factors, some of which are beyond the Company's control. Among the factors that could cause the Company's actual performance to differ materially from those suggested by the forward-looking statements are:
2
• | the Company operates in a highly regulated industry and continually changing federal, state, and local laws and regulations could materially adversely affect its business; |
• | the Company's ability to remediate any material weaknesses in internal controls over financial reporting completely and in a timely manner; |
• | adverse economic conditions in the United States and worldwide may negatively impact the Company's results; |
• | the business could suffer if access to funding is reduced or if there is a change in the Company’s funding costs or ability to execute securitizations; |
• | the Company faces significant risks implementing its growth strategy, some of which are outside of its control; |
• | the Company may not realize the anticipated benefits from, and may incur unexpected costs and delays in connection with exiting its personal lending business; |
• | the Company's agreement with FCA may not result in currently anticipated levels of growth and is subject to performance conditions that could result in termination of the agreement; |
• | the business could suffer if the Company is unsuccessful in developing and maintaining relationships with automobile dealerships; |
• | the Company's financial condition, liquidity, and results of operations depend on the credit performance of its loans; |
• | loss of the Company's key management or other personnel, or an inability to attract such management and personnel, could negatively impact its business; |
• | the Company is directly and indirectly, through its relationship with SHUSA, subject to certain banking and financial services regulations, including oversight by the Office of the Comptroller of the Currency (OCC), the Consumer Financial Protection Bureau (CFPB), the European Central Bank, and the Federal Reserve Bank of Boston (FRBB); such oversight and regulation may limit certain of the Company's activities, including the timing and amount of dividends and other limitations on the Company's business; |
• | future changes in the Company's ownership by, or relationship with, SHUSA or Santander, could adversely affect its operations; and |
• | the other factors that are described in Part I, Item IA - Risk Factors of this Annual Report on Form 10-K. |
If one or more of the factors affecting the Company's forward-looking information and statements renders forward-looking information or statements incorrect, the Company's actual results, performance or achievements could differ materially from those expressed in, or implied by, forward-looking information and statements. Therefore, the Company cautions the reader not to place undue reliance on any forward-looking information or statements. The effect of these factors is difficult to predict. Factors other than these also could adversely affect the Company's results, and the reader should not consider these factors to be a complete set of all potential risks or uncertainties. New factors emerge from time to time, and management cannot assess the impact of any such factor on the Company's business or the extent to which any factor, or combination of factors, may cause results to differ materially from those contained in any forward-looking statement. Any forward-looking statements only speak as of the date of this document, and the Company undertakes no obligation to update any forward-looking information or statements, whether written or oral, to reflect any change, except as required by law. All forward-looking statements attributable to the Company are expressly qualified by these cautionary statements.
Glossary
The following is a list of abbreviations, acronyms, and commonly used terms used in this Annual Report on Form 10-K.
ABS | Asset-backed securities |
Advance Rate | The maximum percentage of unpaid principal balance that a lender is willing to lend |
ALG | Automotive Lease Guide |
APR | Annual Percentage Rate |
ASC | Accounting Standards Codification |
ASU | Accounting Standards Update |
Auto Finance Holdings | Sponsor Auto Finance Holdings Series LP, a former investor in SC |
Bluestem | Bluestem Brands, Inc., an online retailer for whose customers SC provides financing |
Board | SC’s Board of Directors |
Capmark | Capmark Financial Group Inc., an investment company |
3
CBP | Citizens Bank of Pennsylvania |
CCAR | Comprehensive Capital Analysis and Review |
CCART | Chrysler Capital Auto Receivables Trust, a securitization platform |
Centerbridge | Centerbridge Partners, L.P., a private equity firm |
CEO | Chief Executive Officer |
CFPB | Consumer Financial Protection Bureau |
CFO | Chief Financial Officer |
Chrysler Agreement | Ten-year private-label financing agreement with FCA |
Clean-up Call | The early redemption of a debt instrument by the issuer, generally when the underlying portfolio has amortized to 5% or 10% of its original balance |
Commission | U.S. Securities and Exchange Commission |
Credit Enhancement | A method such as overcollateralization, insurance, or a third-party guarantee, whereby a borrower reduces default risk |
Dealer Loan | A floorplan line of credit, real estate loan, working capital loan, or other credit extended to an automobile dealer |
Dodd-Frank Act | Comprehensive financial regulatory reform legislation enacted by the U.S. Congress on July 21, 2010 |
DOJ | U.S. Department of Justice |
DRIVE | Drive Auto Receivables Trust, a securitization platform |
ECB | European Central Bank |
ECOA | Equal Credit Opportunity Act |
ERMC | Enterprise Risk Management Committee |
Employment Agreement | The amended and restated employment agreement, executed as of December 31, 2011, by and among SC, Banco Santander, S.A. and Thomas G. Dundon |
Exchange Act | Securities Exchange Act of 1934, as amended |
FASB | Financial Accounting Standards Board |
FCA | Fiat Chrysler Automobiles US LLC, formerly Chrysler Group LLC |
FICO® | A common credit score created by Fair Isaac Corporation that is used on the credit reports that lenders use to assess an applicant’s credit risk. FICO® is computed using mathematical models that take into account five factors: payment history, current level of indebtedness, types of credit used, length of credit history, and new credit |
FIRREA | Financial Institutions Reform, Recovery and Enforcement Act of 1989 |
Floorplan Loan | A revolving line of credit that finances inventory until sold |
Federal Reserve Board | Board of Governors of the Federal Reserve System |
FRBB | Federal Reserve Bank of Boston |
FTC | Federal Trade Commission |
GAP | Guaranteed Auto Protection |
IPO | SC's Initial Public Offering |
ISDA | International Swaps and Derivative Association |
J.D. Power | J.D. Power and Associates |
LendingClub | LendingClub Corporation, a peer-to-peer personal lending platform company from which SC acquired loans under terms of flow agreements |
Managed Assets | Managed assets included assets (a) owned and serviced by the Company; (b) owned by the Company and serviced by others; and (c) serviced for others. |
MSA | Master Service Agreement |
Nonaccretable Difference | The difference between the undiscounted contractual cash flows and the undiscounted expected cash flows of a portfolio acquired with deteriorated credit quality |
NYSE | New York Stock Exchange |
OCC | Office of the Comptroller of the Currency |
Overcollateralization | A credit enhancement method whereby more collateral is posted than is required to obtain financing |
4
OEM | Original equipment manufacturer |
Private-label | Financing branded in the name of the product manufacturer rather than in the name of the finance provider |
Remarketing | The controlled disposal of leased vehicles that have reached the end of their lease term or of financed vehicles obtained through repossession |
Residual Value | The future value of a leased asset at the end of its lease term |
Santander | Banco Santander, S.A. |
SBNA | Santander Bank, N.A., a wholly-owned subsidiary of SHUSA. Formerly Sovereign Bank, N.A. |
SC | Santander Consumer USA Holdings Inc., a Delaware corporation, and its consolidated subsidiaries |
SCI | Santander Consumer International Puerto Rico, LLC |
SC Illinois | Santander Consumer USA Inc., an Illinois Corporation and wholly-owned subsidiary of SC |
SCRA | Servicemembers Civil Relief Act |
SDART | Santander Drive Auto Receivables Trust, a securitization platform |
SEC | U.S. Securities and Exchange Commission |
Separation Agreement | The Separation Agreement dated July 2, 2015 entered into by Thomas G. Dundon with SC, DDFS LLC, SHUSA, Santander Consumer USA Inc. (the wholly owned subsidiary of SC) and Banco Santander, S.A. |
Shareholders Agreement | The Shareholders Agreement dated January 28, 2014, by and among the Company, SHUSA, DDFS, Thomas G. Dundon, Sponsor Auto Finance Holdings Series LP, and, for the certain sections set forth therein, Banco Santander, as amended |
SHUSA | Santander Holdings USA, Inc., a wholly-owned subsidiary of Santander and the majority owner of SC |
SPAIN | Santander Prime Auto Issuing Note Trust, a securitization platform |
SRT | Santander Retail Auto Lease Trust, a lease securitization platform |
Subvention | Reimbursement of the finance provider by a manufacturer for the difference between a market loan or lease rate and the below-market rate given to a customer |
TDR | Troubled Debt Restructuring |
Trusts | Special purpose financing trusts utilized in SC’s financing transactions |
U.S. GAAP | U.S. Generally Accepted Accounting Principles |
VIE | Variable Interest Entity |
Warehouse Facility | A revolving line of credit generally used to fund finance receivable originations |
5
PART I
ITEM I. | BUSINESS |
General
Santander Consumer USA Holdings Inc. (SC or the Company) was incorporated in 2013 in the State of Delaware and is the holding company for Santander Consumer USA Inc., an Illinois corporation, and subsidiaries, a specialized consumer finance company focused on vehicle finance and third-party servicing. The Company’s primary business is the indirect origination and securitization of retail installment contracts, principally through manufacturer-franchised dealers in connection with their sale of new and used vehicles to retail consumers.
Since May 1, 2013, under the terms of a ten-year private-label financing agreement (the Chrysler Agreement) with Fiat Chrysler Automobiles US LLC (FCA), the Company has been FCA’s preferred provider for consumer loans and leases and dealer loans. Business generated under terms of the Chrysler Agreement is branded as Chrysler Capital. In conjunction with the Chrysler Agreement, the Company offers a full spectrum of auto financing products and services to FCA customers and dealers under the Chrysler Capital brand. These products and services include consumer retail installment contracts and leases, as well as dealer loans for inventory, construction, real estate, working capital and revolving lines of credit.
The Company also originates vehicle loans through a web-based direct lending program, purchases vehicle retail installment contracts from other lenders, and services automobile and recreational and marine vehicle portfolios for other lenders. Additionally, the Company has other relationships through which it holds personal loans, private-label credit cards and other consumer finance products. However, in October 2015, the Company announced its exit from personal lending, and accordingly, substantially all of its personal lending assets are classified as held for sale at December 31, 2017.
As of February 15, 2018, the Company was owned approximately 68.1% by SHUSA, a wholly-owned subsidiary of Santander, and approximately 31.9% by other shareholders.
The Company's Markets
The consumer finance industry in the United States has approximately $3 trillion of outstanding borrowings as of December 31, 2017 and includes vehicle loans and leases, credit cards, home equity lines of credit, private student loans, and personal loans.
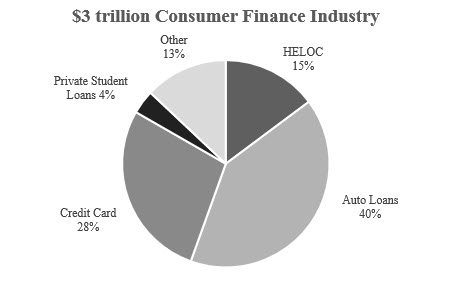
Sources: Federal Reserve Bank of New York; Consumer Financial Protection Bureau
The Company's primary focus is the vehicle finance segment of the U.S. consumer finance industry. Vehicle finance includes loans and leases taken out by consumers to fund the purchase of new and used automobiles, as well as other vehicles such as motorcycles, recreational vehicles, and watercraft. Within the vehicle finance segment, the Company maintains a strong presence in the auto finance market. The auto finance market features a fungible product resulting in an efficient pricing market, but it is highly fragmented, with no individual lender accounting for more than 10% of total market share. As of December 31, 2017, there were approximately $1.2 trillion of auto loans outstanding in the United States.
The Company originates both prime and nonprime vehicle loans, and maintains on its balance sheet primarily nonprime loans. The Company also originates leases, substantially all of which are extended to prime borrowers. Historically, used car financing has made up a majority of the Company's business. In 2017, through the third quarter, used automobiles accounted for 70% of total automobiles sold in the United States, and approximately 53% of used car purchases were financed. The primary metrics
6
used by the market to monitor the strength of the used car market are the Manheim Used Vehicle Index and J.D. Power Price Index, measures of wholesale used car prices adjusted by their mileage or vintage. As of December 31, 2017, used car financing represented 59% of the Company's outstanding retail installment contracts, of which 82% consisted of nonprime auto loans.
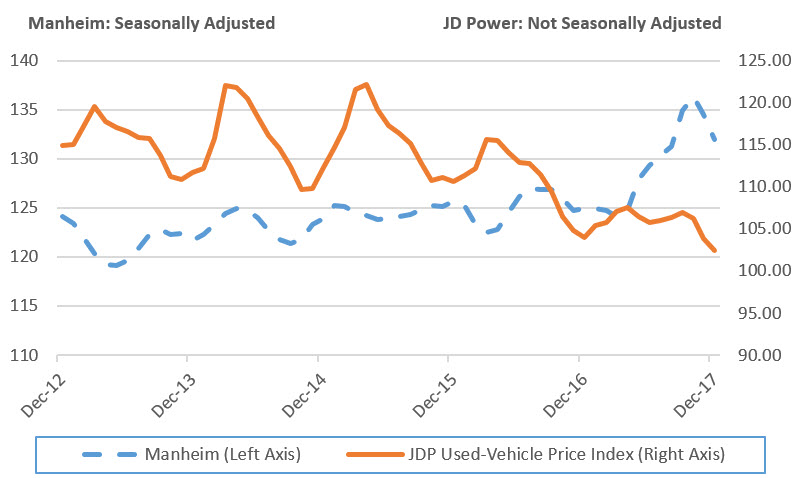
Source: Manheim Inc., as of December 31, 2017 & JP Power used-Vehicle Price Index, as of December 31, 2017
Note: Indexed to a basis of 100 at 1995 levels.
Most loans in the used auto finance space are extended to nonprime consumers, who comprise a significant portion of the U.S. population. Of the more than 300 million Americans with a credit history, 30% have Fair Isaac Corporation (FICO®) scores below 650. Although nonprime auto loans typically produce higher losses than prime loans, the Company's data-driven approach, extensive experience, and adaptive platform enhance the Company's ability to estimate future cash flows and effectively price loans for their inherent risk.
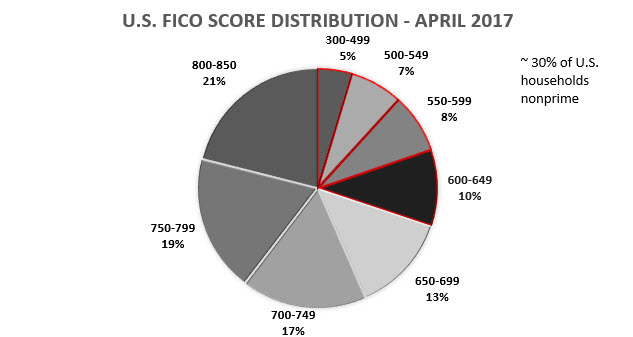
Source: FICO® Banking Analytics Blog Fair
Note: Nonprime based on FICO® Score <650
7
Through the Chrysler Capital brand, the Company is increasing its focus on the new auto finance space by providing financing for the acquisition of new FCA vehicles. In 2017, there were 17.1 million new cars sold in the U.S. In 2017, through the third quarter, approximately 86% of total new auto sales were financed. Future growth of new auto sales in the United States, and the parallel growth of consumer loans and leases to finance those sales, are driven by improving economic conditions, new automobile product offerings, and the need to replace aging automobiles. The average age of U.S. autos in 2017 remained at a record high of 11.6 years, which was reached in 2016 (Source: IHS Automotive/R. L. Polk Annual Press Release). Chrysler Capital loan and lease growth will be driven by the volume of new FCA vehicles sold in the United States.
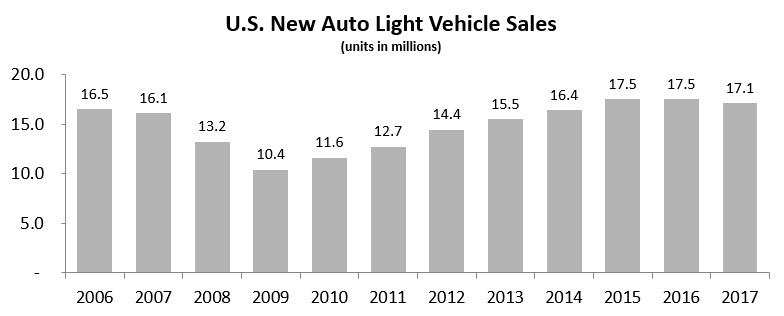
Source: Ward's Automotive Reports; U.S. Department of Commerce: Bureau of Economic Analysis
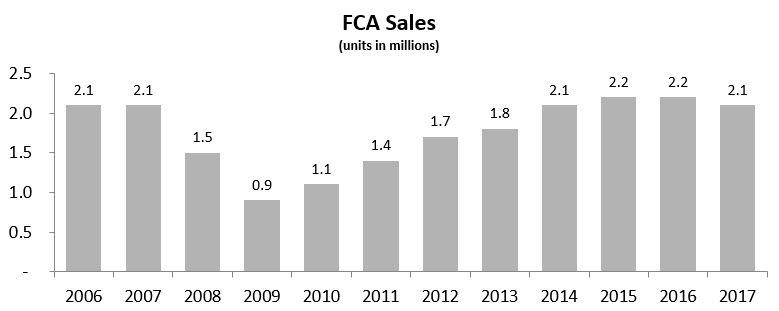
Source: FCA US LLC
8
The Company is a leading originator of nonprime auto loans. National and regional banks have historically been the largest originators of used and nonprime vehicle loans and leases due to their broad geographic footprint and wide array of vehicle finance products. The Company primarily competes against national and regional banks, as well as automobile manufacturers’ captive finance businesses, to originate loans and leases to finance consumers’ purchases of new and used cars. The Company has a significant portfolio of prime loans and leases serviced for others, as it typically originates and then sells prime assets with servicing rights retained.
Net Percent of Banks Reporting Stronger Demand for Consumer Loans
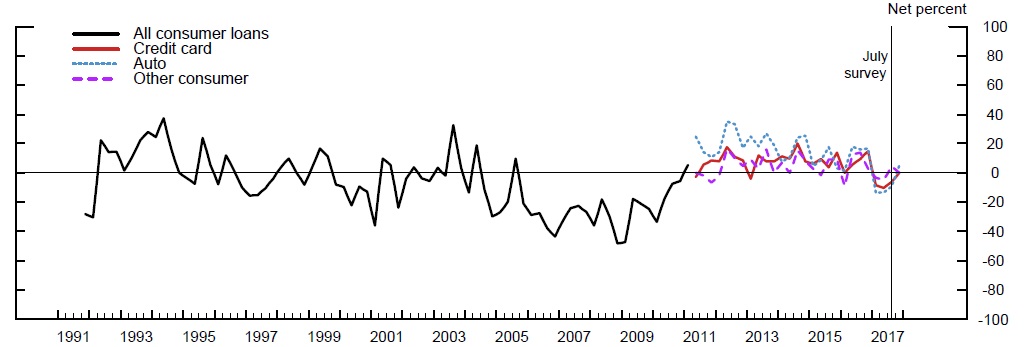
Source: Federal Reserve Board - Senior Loan Officer Survey on Bank Lending Practices
In 2015, the Company made a strategic decision to exit the personal lending market to focus on its core objectives of expanding the reach and realizing the full value of its vehicle finance and serviced for others platforms. The Company believes this shift will create other opportunities, such as diversifying funding sources and growing capital. Throughout 2016 and 2017, the Company marketed personal lending assets to potential buyers. On February 1, 2016, the Company completed a sale of substantially all assets from its personal lending portfolio to an unrelated third party. On April 14, 2017, the Company sold the remaining portfolio comprised of personal installment loans to an unrelated third-party. The portfolio was comprised solely of LendingClub installment loans. Additionally, on March 24, 2016, the Company notified certain retailers that it would no longer fund new point-of-sale credit originations effective April 11, 2016. As the Company refocuses on core objectives, it continues to perform under various other agreements under which specified volumes of personal loans originated by third parties are purchased.
In both the vehicle finance and personal lending markets, the Company generates originations indirectly and directly. The indirect model requires relationships with third parties who are generally active in the market, are looking for an additional source of financing for their customers, and agree to direct certain customers to the Company. The direct model requires an internally-managed platform through which consumers are able to make requests for credit directly to the Company. While the Company has historically focused on the indirect model, it has a presence in the direct vehicle finance market through the RoadLoans.com platform. Additionally, the Company continues to develop relationships with third parties to further broaden its origination channels.
The Company's Business Strategy
The Company's primary goal is to create stockholder value by leveraging its efficient, scalable technology and risk infrastructure and data to underwrite, originate and service profitable assets while treating customers, dealers, stockholders, employees and all stakeholders in a simple, personal and fair manner.
Expand the Company's Vehicle Finance Franchise
Organic Growth in Indirect Auto Finance. The Company has extensive data on and experience with consumer behavior across the full credit spectrum and is a key player in the U.S. vehicle finance market. The Company expects to continue to increase market penetration in the vehicle finance sector, subject to favorable market conditions, via the number and depth of its dealer relationships. The Company plans to achieve this growth in part through alliance programs with national vehicle dealer groups and financial institutions, including banks, credit unions, and other lenders, in both the prime and nonprime vehicle finance markets. The Company's technology-based platform enables the Company to integrate seamlessly with other originators and thereby benefit from their channels and brands.
9
Growth in Direct-to-Consumer Exposure. The Company is working to further diversify its vehicle finance product offerings by expanding its web-based, direct-to-consumer offerings. The Company is focused on engaging the consumer at the early stages of the car buying experience. The RoadLoans.com program is a preferred finance resource for many major vehicle shopping websites, including Cars.com and AutoTrader.com, each of which have links on their websites promoting RoadLoans.com for financing. The Company will continue to focus on securing relationships with additional vehicle-related websites. The Company anticipates that the next generation of its web-based direct-to-consumer offerings will include additional strategic relationships, an enhanced online experience, and additional products and services to assist with all stages of the vehicle ownership life cycle, including research, financing, buying, servicing, selling, and refinancing.
Expansion of Fee-Based Income Opportunities. The Company seeks opportunities to leverage its technologically sophisticated and highly adaptable servicing platform for both prime and nonprime loans, as well as other vehicle finance (including recreational and marine vehicles) and personal lending products. The Company collects fees to service loan portfolios for third parties, and handles both secured and personal loan products across the full credit spectrum. Loans and leases sold to or sourced to banks through flow agreements and off-balance sheet securitizations also provide additional opportunities to service large vehicle loan and lease pools. The Company's loan servicing business is scalable and provides an attractive return on equity. The Company intends to continue to expand fee-based income opportunities through its relationship with Santander.
The Company's Products and Services
The Company offers vehicle-related financing products, primarily consisting of consumer loans and leases, and servicing of those assets.
Consumer Vehicle Loans
The Company's primary business is to indirectly originate vehicle loans through automotive dealerships throughout the United States. The Company has a substantial dealer network, most of which consists of manufacturer-affiliated or large and reputable independent dealers. The Company uses a risk-adjusted methodology to determine the price to pay the automotive dealer for a loan, which may be above or below the principal amount of the loan depending on characteristics such as the contractual annual percentage rate (APR) and the borrower’s credit profile. The consumer is obligated to make payments in an amount equal to the principal amount of the loan plus interest at the APR negotiated with the dealer. The consumer is also responsible for charges related to past-due payments. Dealers may retain some portion of the finance charge as compensation. The Company's agreements with dealers place a limit on the amount of the finance charges they are entitled to retain. Although the Company does not own the vehicles it finances through loans, it holds a perfected security interest in those vehicles. Loans with below-market APRs are frequently offered through manufacturer incentive programs. The manufacturer will compensate the originator of these loans for the amount of the financing rate that is below market. These payments are called rate subvention. The Company is entitled to receive rate subvention payments from FCA as its preferred provider through the Chrysler Agreement.
Since 2008, the Company has also directly originated loans through its branded online RoadLoans.com platform. Additionally, the Company has acquired loans in bulk from third parties. The loans acquired in bulk acquisitions have primarily been collateralized by automobiles. However, a small amount of such loans have been collateralized by marine and recreational vehicles. The Company generates revenue on these loans through finance charges.
Vehicle Leases
The Company acquires leases primarily from FCA-affiliated automotive dealers and, as a result, becomes titleholder for leased vehicles. The acquisition cost for these leases is based on the underlying value of the vehicle, the contractual lease payments and the residual value, which is the expected future value of the vehicle at the time of the lease termination. The Company uses projected residual values that are estimated by third parties, such as Automotive Lease Guide (ALG) and internal forecasts based on current market conditions, and other relevant data points. The residual value used to determine lease payments, or the contractual residual value, may be adjusted upward as part of marketing incentives provided by the manufacturer of the vehicle. When a contractual residual value is written up, the lease payments the Company offers become more attractive to consumers. The marketing incentive payment that manufacturers pay the Company is equal to the expected difference between the projected ALG residual value and the contractual residual value. This residual support payment is a form of subvention. The Company is a preferred provider of subvented leases through Chrysler Capital. Substantially all of these leases are to prime consumers. The consumer, or lessee, is responsible for the contractual lease payments and any excessive mileage or wear and tear on the vehicle that results in a lower residual value of the vehicle at the time of the lease’s termination. The consumer is also generally responsible for charges related to past due payments. The Company's leases are primarily closed-ended, meaning the consumer does not bear the residual risk.
10
The Company generates revenue on leases through monthly lease payments and fees and, depending on the market value of the off-lease vehicle, the Company may recognize a gain or loss upon remarketing. The Company's agreement with FCA permits the Company to share any residual losses over a threshold, determined on an individual lease basis, with FCA.
Servicing for Others
The Company services a portfolio of vehicle loans originated or otherwise independently acquired by SBNA, vehicle leases originated by SBNA under terms of a flow agreement and loans sold by the Company to Santander. The Company also services loans sold through flow agreements, through Chrysler Capital off-balance sheet securitizations and several smaller loan portfolios for various third-party institutions. The Company generates revenue on these assets through servicing and other fees collected from the institutional owners and the borrowers, and may also generate a gain or loss on the sale of assets. The Company intends to continue growing this off-balance sheet portfolio and the stream of revenue it provides.
Origination and Servicing
Vehicle Finance
The Company's origination platform delivers automated 24/7 underwriting decision-making through a proprietary credit-scoring system designed to provide consistency and efficiency, with dealers receiving a decision in under ten seconds for 95% of all requests. Every loan application received is processed by the Company's credit scoring system. The Company's credit- scoring system is supported by an extensive market database that includes multiple years of historical data on the loans that the Company has acquired as well as extensive consumer finance third-party data. The Company continuously evaluates loan performance and consumer behavior to improve underwriting decisions. The Company's systems are intended to be readily adaptable and scalable, with the ability to quickly implement changes in pricing and scoring credit policy rules and modify underwriting standards to match the economic environment. The Company's credit-scoring system supports underwriting decisions for consumers across the full credit spectrum and has been designed to allow the Company to maximize modeled risk-adjusted yield for a given consumer’s credit profile.
The Company has built a servicing approach based on years of experience as a nonprime lender. The Company's servicing activities consist largely of processing customer payments, responding to customer inquiries (such as requests for payoff quotes or complaints), processing customer requests for account revisions (such as payment deferrals), seeking to maintain a perfected security interest in the financed vehicle, monitoring vehicle insurance coverage, pursuing collection of delinquent accounts, and remarketing repossessed or off-lease vehicles. The Company has made significant investments in staffing and servicing systems technology intended to make servicing activities compliant with federal and local consumer lending rules in all 50 states.
Through its servicing platform, the Company seeks to maximize collections while providing outstanding customer service. The Company's servicing practices are closely integrated with the originations platform, resulting in an efficient exchange of customer related data, market information and understanding of the latest trends in consumer behavior. The customer account management process is model-driven and utilizes predictive customer service and collection strategies. The Company validates its models with data back-testing and can be adjusted to reflect new information received throughout the Company, such as new vehicle loan and lease applications, refreshed consumer credit data, and consumer behavior observed through servicing operations. The Company's robust processes and sophisticated technology support the servicing platform to maximize efficiency, consistent loan treatment, and cost control.
To provide the best possible customer service, the Company provides multiple convenient customer communication methods and has implemented strategies to monitor and improve the customer experience. In addition to live agent assistance, the Company's customers are offered a wide range of self-service options via an interactive voice response system and through its customer website. Self-service options include demographic management (such as updating a customer’s address, phone number, and other identifying information), payment and payoff capability, and payment history reporting, as well as online chat and communication requests. Quality assurance teams perform account reviews and are responsible for grading phone calls to monitor adherence to policies and procedures as well as compliance with regulatory requirements. The Company's analytics software converts speech from every call into text so that each conversation with a customer can be analyzed and subsequently data-mined. This is used to identify inappropriate words or phrases in real-time for potential intervention from a manager and to search for the omission of words or phrases that are required for specific conversations. A quality control team provides an independent, objective assessment of the servicing department’s internal control systems and underlying business processes. These processes help identify organizational improvements while protecting the Company's franchise reputation and brand. Lastly, complaint tracking processes are designed to ensure customer complaints are addressed appropriately and that the customers receive status updates. These systems assign the account to a specialized team until the complaint is deemed to be closed. This team tracks and resolves customer complaints and is subject to a robust quality assurance program.
11
The servicing process is divided into stages based on delinquency status and the servicing agents for each stage receive specialized training. In the event that a retail installment contract becomes delinquent, the Company follows an established set of procedures that maximizes ultimate recovery on the loan or lease. Late stage account managers employ skip tracing, utilize specialized negotiation skills, and are trained to tailor their collection attempts based on the proprietary borrower behavioral score assigned to each customer. Collection efforts include calling generally within one business day when an obligor has broken a promise to make a payment on a certain date, and using alternative methods of contact such as location gathering via references, employers, landlords, credit bureaus, and cross-directories. If the borrower is qualified, the account manager may offer an extension of the maturity date, a temporary reduction in payment, or a modification permanently lowering the interest rate or principal. If attempts to work with the customer to cure the delinquency are unsuccessful, the customer is sent a “right to cure” letter in accordance with state laws, and the loan is assigned a risk score based on the Company's historical days-to-repossess data. This score is used to prioritize repossessions, and each repossession is systematically assigned to a third-party repossession agent according to the agent's recent performance. Once the vehicle has been secured, any repairs required are performed and the vehicle is remarketed as quickly as possible, typically through an auction process.
Most of the Company's servicing processes and quality-control measures serve a dual purpose in that they are both designed to ensure that the Company complies with applicable laws and regulations and that the Company delivers the best possible customer service. Additionally, the servicing platform and all of the features offered to customers are scalable and can be tailored through statistical modeling and automation.
The Company's Relationship with FCA
In February 2013, the Company entered into the Chrysler Agreement, pursuant to which the Company became the preferred provider for FCA’s consumer loans and leases and dealer loans effective May 1, 2013. Business generated under terms of the Chrysler Agreement is branded as Chrysler Capital. During 2017, the Company originated more than $6.7 billion of Chrysler Capital retail installment contracts and approximately $6.0 billion of Chrysler Capital vehicle leases.
The Chrysler Agreement requires, among other things, that the Company bears the risk of loss on loans originated pursuant to the agreement, but also that FCA shares in residual gains and losses from consumer leases over a threshold, determined on an individual lease basis. The agreement also requires that Santander maintain at least $5.0 billion in funding available for dealer inventory financing and $4.5 billion of financing dedicated to FCA retail financing. In turn, FCA must provide designated minimum threshold percentages of its subvention business to the Company.
The Chrysler Agreement has a ten-year term, subject to early termination in certain circumstances, including the failure by either party to comply with certain of their ongoing obligations. These obligations include, for the Company, meeting specified escalating penetration rates for the first five years, and, for FCA, treating the Company in a manner consistent with comparable OEMs' treatment of their captive providers, primarily regarding sales support. In addition, FCA may also terminate the agreement if, among other circumstances, (i) a person other than Santander and its affiliates or its other stockholders owns 20% or more of its common stock and Santander and its affiliates own fewer shares of common stock than such person, (ii) the Company becomes, controls, or becomes controlled by, an OEM that competes with Chrysler, or (iii) if certain of the Company's credit facilities become impaired.
In connection with entering into the Chrysler Agreement, the Company paid FCA a $150 million upfront, nonrefundable fee on May 1, 2013. This fee is considered payment for future profits generated from the Chrysler Agreement. Accordingly, the Company amortizes the Chrysler Agreement over the expected ten-year term as a component of net finance and other interest income. The Company has also executed an Equity Option Agreement with FCA, whereby FCA may elect to purchase, at any time during the term of the Chrysler Agreement, at fair market value, an equity participation of any percentage in the Chrysler Capital portion of the Company's business.
For a period of 20 business days after FCA's delivery to the Company of a notice of intent to exercise its option, the Company is to discuss with FCA, in good faith, the structure and valuation of the proposed equity participation. If the parties are unable to agree on a structure and FCA still intends to exercise its option, the Company will be required to create a new company into which the Chrysler Capital assets will be transferred and which will own and operate the Chrysler Capital business. If FCA and the Company cannot agree on a fair market value during the 20-day negotiation period, each party will engage an investment bank and the appointed banks will mutually appoint a third independent investment bank to determine the value, with the cost of the valuation divided evenly between FCA and the Company. Each party has the right to a one-time deferral of the independent valuation process for up to nine months. FCA will have a period of 90 days after a valuation has been determined, either by negotiation between the parties or by an investment bank, to deliver a binding notice of exercise. Following this notice, FCA's purchase is to be paid and settled within 10 business days, subject to a delay of up to 180 days if necessary to obtain any required consents from governmental authorities.
12
Any new company formed to effect FCA's exercise of its equity option will be a Delaware limited liability company unless otherwise agreed to by the parties. As long as each party owns at least 20% of the business, FCA and the Company will have equal voting and governance rights without regard to ownership percentage. If either party has an ownership interest in the business of less than 20%, the party with less than 20% ownership will have the right to designate a number of directors proportionate to its ownership and will have other customary minority voting rights.
Because the equity option is exercisable at fair market value, the Company could recognize a gain or loss upon exercise if the fair market value is determined to be different from book value. The Company believes that the fair market value of its Chrysler Capital financing business currently exceeds book value and therefore has not recorded a contingent liability for potential loss upon FCA's exercise.
Subsequent to the exercise of the equity option, the Company's rights under the Chrysler Agreement would be assigned to the jointly owned business. Exercise of the equity option would be considered a triggering event requiring re-evaluation of whether or not the remaining unamortized balance of the upfront fee the Company paid to FCA on May 1, 2013 should be impaired.
Until January 31, 2017, the Company had a flow agreement with Bank of America whereby the Company was committed to sell a contractually determined amount of eligible Chrysler Capital loans to Bank of America on a monthly basis, depending on the amount and credit quality of eligible current month originations and prior month sales. The agreement originally extended through May 31, 2018. On July 27, 2016, the flow agreement was amended to reduce the maximum commitment to sell eligible loans each month to $300,000. On October 27, 2016, Bank of America notified the Company that it was terminating the flow agreement effective January 31, 2017, and accordingly, the flow agreement is now terminated. For loans sold under the agreement, the Company retains the servicing rights at contractually agreed-upon rates. The Company may also receive or pay a servicer performance payment based on an agreed-upon formula if performance on the sold loans is better or worse, respectively, than expected performance at the time of sale.
The Company has sold loans to Citizens Bank of Pennsylvania (CBP) under terms of a flow agreement and other predecessor sale agreements. The Company retains servicing on the sold loans and will owe CBP a loss-sharing payment capped at 0.5% of the original pool balance if losses exceed a specified threshold, established on a pool-by-pool basis. On June 25, 2015, the Company executed an amendment to the servicing agreement with CBP, which increased the servicing fees. This amendment amended the flow agreement between CBP and the Company, effective August 1, 2015, to reduce CBP's committed purchases of Chrysler Capital prime loans from a maximum of $600 million and a minimum of $250 million per quarter to a maximum of $200 million and a minimum of $50 million per quarter. On February 13, 2017, the Company and CBP entered into a mutual agreement to terminate the flow agreement effective May 1, 2017.
Segments
The Company has one reportable segment: Consumer Finance, which includes the Company's vehicle financial products and services, including retail installment contracts, vehicle leases, and dealer loans, as well as financial products and services related to motorcycles, RVs, and marine vehicles. It also includes the Company's personal loan and point-of-sale financing operations.
Subsidiaries
The Company has two principal consolidated wholly-owned subsidiaries: Santander Consumer USA Inc. and Santander Consumer International Puerto Rico, LLC (a wholly-owned subsidiary of Santander Consumer USA Inc.).
Employees
At December 31, 2017, the Company had approximately 5,076 employees, none of whom are represented by a collective bargaining agreement.
Geographic Financial Information
For the years ended December 31, 2017, 2016 and 2015, all of the Company's revenues were derived from the United States. As of December 31, 2017 and 2016, all of the Company's long-lived assets were located in the United States.
Seasonality
The Company's origination volume is generally highest in March and April each year due to consumers receiving tax refunds, which provides additional discretionary income. The Company's delinquencies are generally highest in the period from November through January due to consumers’ holiday spending, which reduces income available for car payments.
13
Intellectual Property
The Company has the right to use the Santander name on the basis of a non-exclusive, royalty-free, and non-transferable license from Santander, which only extends to uses in connection with the Company's current and future operations within the United States. Santander may terminate the license at any time Santander ceases to own, directly or indirectly, 50% or more of the Company's common stock.
In connection with the Company's agreement with FCA, the Company has been granted a limited, non-exclusive, non-transferable, royalty-free license to use certain FCA trademarks, including the term “Chrysler Capital,” for as long as the Chrysler Agreement is in effect. The Company is required to adhere to specified guidelines and other usage instructions related to these trademarks, as well as to obtain prior written approval of any materials, including financing documents and promotional materials, using the trademarks. This license does not grant the Company any ownership rights in FCA's trademarks.
In connection with the 2008 acquisition of Roadloan.com, a direct-to-consumer online platform, the Company purchased the "Roadloan.com" trade name which constitutes an intellectual property right.
Competition
The automotive finance industry is highly competitive. The Company competes on the pricing offered on loans and leases as well as the customer service provided to automotive dealer customers. Pricing for these loans and leases is transparent because the Company, along with industry competitors, posts pricing for loans and leases on web-based credit application aggregation platforms. When dealers submit applications for consumers acquiring vehicles, they can compare the Company's pricing against competitors’ pricing. Dealer relationships are important in the automotive finance industry. Vehicle finance providers tailor product offerings to meet each individual dealer’s needs.
The Company seeks to effectively compete through its proprietary credit-scoring system and industry experience, which are used to establish appropriate risk pricing. In addition, the Company benefits from FCA subvention programs through the Chrysler Agreement. The Company seeks to develop strong dealer relationships through a nationwide sales force and a long history in the automotive finance space. Further, the Company expects to continue deepening dealer relationships through the Chrysler Capital product offerings.
The Company's primary competitors in the vehicle finance space are:
• | national and regional banks; |
• | credit unions; |
• | independent financial institutions; and |
• | the affiliated finance companies of automotive manufacturers. |
While the used car financing market is fragmented with no single lender accounting for more than 10% of the market, there are a number of competitors in both the new and used car markets that have substantial positions nationally or in the markets in which they operate. Some of the Company's competitors may have lower cost structures, or funding costs, and be less reliant on securitizations. The Company believes it can compete effectively by continuing to expand and deepen its relationships with dealers. In addition, through its Chrysler Capital brand, the Company benefits from FCA’s subvention programs and relationships with its dealers.
Supervision and Regulation
The U.S. lending industry is highly regulated under various U.S. federal laws, including the Truth-in-Lending Act (TILA); Equal Credit Opportunity Act (ECOA), Electronic Fund Transfer Act (EFTA), Fair Credit Reporting Act (FCRA), Fair Debt Collection Practices Act (FDCPA), Consumer Leasing Act, Servicemembers Civil Relief Act (SCRA), Telephone Consumer Protection Act, Financial Institutions Reform, Recovery, and Enforcement Act, Dodd-Frank Act and Gramm-Leach-Bliley Act (GLBA), as well as various state laws. The Company is subject to inspections, examinations, supervision, and regulation by the Securities and Exchange Commission (SEC), the Consumer Financial Protection Bureau (CFPB), the Federal Trade Commission (FTC), and the Department of Justice (DOJ) and by regulatory agencies in each state in which the Company is licensed. In addition, the Company is directly and indirectly, through its relationship with SHUSA, subject to certain banking and financial services regulations, including oversight by the Office of the Comptroller of the Currency (OCC), the European Central Bank (ECB), and the Federal Reserve Bank of Boston (FRBB), which has the ability to limit certain of its activities, such as the timing and amount of dividends and certain transactions that it might otherwise desire to enter into, such as merger and acquisition opportunities, or to impose other limitations on the Company's growth. Additional legal and regulatory matters affecting the Company’s activities are further discussed in Part I, Item 1A—Risk Factors of this Annual Report on Form 10-K.
14
Dodd-Frank Wall Street Reform and Consumer Protection Act
Congress enacted comprehensive financial regulatory reform legislation on July 21, 2010. A significant focus of the new law (the Dodd-Frank Act) is heightened consumer protection. The Dodd-Frank Act established the CFPB, which has regulatory, supervisory, and enforcement powers over providers of consumer financial products and services, including the Company, and explicit supervisory authority to examine and require registration of non-depository lenders and promulgate rules that can affect the practices and activities of lenders. Although the Dodd-Frank Act expressly provides that the CFPB has no authority to establish usury limits, some consumer advocacy groups have suggested that various forms of alternative financial services or specific features of consumer loan products should be a regulatory priority. It is possible that at some time in the future the CFPB could propose and adopt rules making such lending services materially less profitable or impractical, which may impact finance loans or other products that the Company offers.
In addition to granting certain regulatory powers to the CFPB, the Dodd-Frank Act gives the CFPB authority to pursue administrative proceedings or litigation for violations of federal consumer financial laws. In these proceedings, the CFPB can obtain cease and desist orders (which can include orders for restitution or rescission of contracts, as well as other kinds of affirmative relief) and monetary penalties.
The Company is also subject to risk retention rules promulgated under the Dodd-Frank Act, which generally require sponsors of Asset Backed Securitizations (ABS) to retain at least five percent of the credit risk of the assets collateralizing the ABS issuance. The rules also prohibit the transfer or hedging of the credit risk that the sponsor is required to retain.
Dividend Restrictions
The Dodd-Frank Act also requires certain banks and bank holding companies, including SHUSA, to perform a stress test and submit a capital plan to the FRBB on an annual basis and to receive a notice of non-objection, or approval, to the plan from the FRBB before taking capital actions, such as paying dividends, implementing common equity repurchase programs, or redeeming or repurchasing capital instruments. In June 2017, SHUSA announced that the FRBB did not object to the planned capital actions described in SHUSA’s 2017 Capital Plan that was submitted as part of its annual CCAR submissions. Included in SHUSA’s capital actions were proposed dividend payments for the Company’s stockholders. As a result, we made a dividend payment in 2017 and in February 2018 and, subject to Board approval, plan to pay a dividend in the second quarter of 2018.
Regulation AB II
The Company is subject to final rules adopted by SEC known as "Regulation AB II". Regulation AB II, among other things, expanded ABS disclosure requirements and modified the offering and shelf registration process. All offerings of publicly registered ABS and all reports under the Exchange Act for outstanding publicly registered ABS must comply with these rules and disclosure requirements.
Additional legal and regulatory matters affecting the Company’s activities are further discussed in Part I, Item 1A—Risk Factors.
Disclosure Pursuant to Section 219 of the Iran Threat Reduction and Syria Human Rights Act
Pursuant to Section 219 of the Iran Threat Reduction and Syria Human Rights Act of 2012, which added Section 13(r) to the Securities Exchange Act of 1934, as amended (the Exchange Act), an issuer is required to disclose in its annual or quarterly reports, as applicable, whether it or any of its affiliates knowingly engaged in certain activities, transactions or dealings relating to Iran or with individuals or entities designated pursuant to certain Executive Orders. Disclosure is generally required even where the activities, transactions or dealings were conducted in compliance with applicable law.
The following activities are disclosed in response to Section 13(r) with respect to Santander UK and certain other affiliates of Santander (collectively, the Group). During the period covered by this annual report:
• | Santander UK holds two savings accounts and one current account for two customers resident in the U.K. who are currently designated by the U.S. under the Specially Designated Global Terrorist (SDGT) sanctions program. Revenues and profits generated by Santander U.K. on these accounts in the year ended December 31, 2017 were negligible relative to the overall profits of Santander. |
• | Santander UK holds two frozen current accounts for two U.K. nationals who are designated by the U.S. under the Specially Designated Global Terrorist (SDGT) sanctions program. The accounts held by each customer have been frozen since their designation and have remained frozen through 2017. The accounts are in arrears (£1,844.73 in debit |
15
combined) and are currently being managed by Santander UK Collections & Recoveries department. No revenues or profits were generated by Santander UK on these accounts in the year ended December 31, 2017.
The Group also has certain legacy performance guarantees for the benefit of Bank Sepah and Bank Mellat (stand-by letters of credit to guarantee the obligations - either under tender documents or under contracting agreements - of contractors who participated in public bids in Iran) that were in place prior to April 27, 2007.
In the aggregate, all of the transactions described above resulted in gross revenues and net profits in the year ended December 31, 2017, which were negligible relative to the overall revenues and profits of Santander. The Group has undertaken significant steps to withdraw from the Iranian market such as closing its representative office in Iran and ceasing all banking activities therein, including correspondent relationships, deposit taking from Iranian entities and issuing export letters of credit, except for the legacy transactions described above. The Group is not contractually permitted to cancel these arrangements without either (i) paying the guaranteed amount (in the case of the performance guarantees), or (ii) forfeiting the outstanding amounts due to it (in the case of the export credits). As such, the Group intends to continue to provide the guarantees and hold these assets in accordance with company policy and applicable laws.
Available Information
All reports filed electronically by the Company with the SEC, including Annual Reports on Form 10-K, Quarterly Reports on Form 10-Q, and Current Reports on Form 8-K, as well as any amendments to those reports, are accessible on the SEC’s website at www.sec.gov. These forms are also accessible at no cost on the Company’s website at www.santanderconsumerusa.com. The information contained on the Company's website is not being incorporated herein.
16
ITEM 1A. | RISK FACTORS |
The Company is subject to a number of risks that could materially and adversely affect our business, financial condition and results of operations in addition to other possible adverse consequences. We operate in a continually changing business and regulatory environment and, therefore, new risks emerge from time to time. The following are the risks of which we are currently aware that could be material to our business.
Risks Related to our Business
Legal, Regulatory and Compliance Risks
We operate in a highly regulated industry and continually changing federal, state, and local laws and regulations could materially and adversely affect our business, financial condition and results of operations.
Due to the highly regulated nature of the consumer finance industry, we are required to comply with a wide and changing array of federal, state and local laws and regulations, including a significant number of banking, fair lending, consumer protection laws and anti-money laundering laws. These laws and regulations directly impact our origination and servicing operations and almost all other aspects of our business and require constant compliance, monitoring, and internal and external audits. Although we have an enterprise-wide compliance framework structured to continuously monitor our activities, compliance with applicable laws and regulations is costly, may create operational constraints and may not always be effective or perform as expected.
The enactment of new laws and regulations, including with respect to consumer financial protection measures and systematic risk oversight authority, could occur rapidly and unpredictably and could require us to change our business or operations, resulting in a loss of revenue or a reduction in our profitability. New laws and regulations could also result in financial loss due to regulatory fines or penalties, restrictions or suspensions of business, or costs associated with compliance or mandatory corrective action as a result of failure to adhere to applicable laws, regulations and supervisory guidance. Failure to comply with these laws and regulations could also give rise to regulatory sanctions, customer rescission rights, actions by state and local attorneys general, civil or criminal liability or damage to our reputation.
The volume, granularity, frequency and scale of regulatory and other reporting requirements necessitate a clear data strategy to enable consistent data aggregation, reporting and management. Inadequate management information systems or processes, including those relating to risk data aggregation and risk reporting, could lead to a failure to meet regulatory reporting requirements, or other internal or external information demands, and we may face supervisory measures or other liability as a result.
We are or may become involved in investigations, examinations and proceedings by government and self-regulatory agencies, which may materially and adversely affect our business, financial condition and results of operations.
From time to time, we are or may become involved in formal and informal reviews, investigations, examinations, proceedings and information-gathering requests by federal and state government and self-regulatory agencies, including, among others, the FRBB, the CFPB, the DOJ, the SEC, the FTC and various state regulatory and enforcement agencies. Given the inherent uncertainty involved in such matters, and the potentially large or indeterminate damages sought, there can be significant uncertainty regarding the liability we may incur as a result of these matters. The finding, or even the assertion of, legal liability against us could materially and adversely affect our business, financial condition and results of operations and may result in, among other actions, adverse judgments, significant settlements, fines, penalties, injunctions or substantial reputational harm.
We are and have been subject to such matters by many of these regulators in the past and have paid significant fines or provided significant other relief. We expect that regulators will continue to initiate new investigations or regulatory actions in the future and that we will continue to devote resources to complying with the requirements of consent orders, adverse judgments and other settlements to which we are subject.
We are subject to enhanced legal and regulatory scrutiny regarding credit bureau reporting and debt collection practices from regulators, courts and legislators.
Our balance sheet consists of predominantly nonprime consumers, which are associated with higher than average delinquency rates and charge-offs than prime consumers. Accordingly, we have significant involvement with credit bureau reporting and the collection and recovery of delinquent and charged-off debt, primarily through customer communications, the filing of litigation against customers in default, the periodic sale of charged-off debt and vehicle repossession. We are subject to enhanced legal
17
and regulatory scrutiny regarding credit bureau reporting and debt collection practices from regulators, courts and legislators. Any future changes to our business practices in these areas, including our debt collection practices, whether mandated by regulators, courts, legislators or otherwise, or any legal liabilities resulting from our business practices, including our debt collection practices, could materially and adversely affect our business, financial condition and results of operations.
We are subject to certain banking regulations that limit our business activities and may restrict our ability to pay dividends and enter into certain business transactions.
Because our controlling shareholder, SHUSA, is a bank holding company and because we provide third party services to banks, we are directly and indirectly subject to certain banking and financial services regulations, including oversight by the FRBB, the ECB and the OCC. We also are subject to oversight by the CFPB. Such regulations and oversight could limit the activities and the types of businesses that we may conduct. The FRBB has broad enforcement authority over bank holding companies and their subsidiaries. The FRBB could exercise its power to restrict SHUSA from having a non-bank subsidiary that is engaged in any activity that, in the FRBB’s opinion, is unauthorized or constitutes an unsafe or unsound business practice, and could exercise its power to restrict us from engaging in any such activity. This power includes the authority to prohibit or limit the payment of dividends if, in the FRBB’s opinion, such payment would constitute an unsafe or unsound practice. Moreover, certain banks and bank holding companies, including SHUSA, are required to perform a stress test and submit a capital plan to the FRBB on an annual basis, and to receive a notice of non-objection, or approval, to the plan from the FRBB before taking capital actions, such as paying dividends, implementing common equity repurchase programs, or redeeming or repurchasing capital instruments. Any future suspension of our ability to pay dividends or other limitations placed on us by the FRBB, the ECB or any other regulator and additional costs associated with regulatory compliance could materially and adversely affect us and the trading price of our common stock.
For example, due to the FRBB’s objections, based on qualitative concerns, in 2014, 2015 and 2016 to SHUSA’s capital plan submissions, we were prohibited from paying dividends until the FRBB issued a non-objection to SHUSA's next capital plan submission or otherwise approved a planned dividend payment. Also, in 2014, SHUSA and the FRBB entered into an agreement prohibiting SHUSA from allowing any of its non-wholly-owned non-bank subsidiaries, including us, to declare or pay any dividend, or to make any capital distribution, without the prior written approval of FRBB. Although the 2014 agreement was terminated in 2017 and we paid a dividend in November 2017 and in February 2018, there can be no assurance that SHUSA will not enter into similar agreements in the future or that other restrictions on the payment of dividends will not apply to us in the future.
SHUSA and the Company also are subject to stringent oversight by the FRBB due to the FRBB’s prior objections to SHUSA’s capital plan submissions, and SHUSA has made a concentrated effort to improve its and its subsidiaries' governance, oversight and internal controls, policies, procedures and functions, including as they relate to us. We have incurred, and expect to continue to incur, significant costs in connection with ensuring compliance with, and assisting SHUSA in, the CCAR process.
The FRBB, the ECB or any other regulator may also impose substantial fines and other penalties for violations that we may commit or disallow acquisitions or other activities we may contemplate, which may limit our future growth plans. These limitations could place us at a competitive disadvantage because some of our competitors are not subject to these limitations.
We are subject to enhanced prudential standards as a subsidiary of SHUSA, which could materially and adversely affect our business, financial condition and results of operations.
As a subsidiary of SHUSA, we are subject to certain enhanced prudential rules mandated by Section 165 of the Dodd-Frank Act. Among other requirements, these rules require SHUSA to maintain a sufficient quantity of highly liquid assets to survive a liquidity stress event and implement various liquidity-related corporate governance measures and imposes certain requirements, duties and qualifications for the risk committee and chief risk officers of SHUSA. SHUSA calculates its liquidity figures on a consolidated basis with certain of its subsidiaries, including us. As a result, our predicted performance under the liquidity stress event must be taken into account when SHUSA conducts its liquidity stress event analysis. Due to these requirements, we are required to have an increased amount of liquidity and will incur increased costs of funding and liquidity capacity, which could materially and adversely affect our business, financial condition and results of operations.
Our business, financial condition and results of operations may be materially and adversely affected upon our implementation of the revised capital requirements under the U.S. Basel III final rules.
SHUSA became subject to new federal banking regulations relating to capital, referred to as the U.S. Basel III final rules, beginning January 1, 2015. The U.S. Basel III final rules subject SHUSA to higher minimum risk-based capital ratios and a capital conservation buffer above these minimum ratios. SHUSA calculates its capital figures on a consolidated basis with certain of its subsidiaries, including us. Failure to comply with the capital buffer requirements, which become more stringent
18
until fully phased-in through January 2019, would result in restrictions on our ability to make capital distributions, including dividend payments and stock repurchases and redemptions, and to pay discretionary bonuses to executive officers.
If SHUSA were to fail to satisfy regulatory capital requirements, SHUSA, together with its subsidiaries, including us, may be subject to serious regulatory sanctions ranging in severity from being precluded from making acquisitions or engaging in new activities to becoming subject to informal or formal supervisory actions by the FRBB. If any of these were to occur, such actions could prevent us from successfully executing our business plan and could materially and adversely affect our business, financial condition and results of operations.
In June 2017, SHUSA announced that the FRBB did not object to the planned capital actions described in SHUSA’s 2017 Capital Plan that was submitted as part of its annual CCAR submissions. Included in SHUSA’s capital actions were proposed dividend payments for the Company’s stockholders. As a result, we made a dividend payment in November 2017 and in February 2018 and, subject to Board approval, plan to pay a dividend in the second quarter of 2018. However, there can be no assurance that the FRBB will not object to these or any of our other future planned capital actions, including as a result of the phasing-in of the more stringent capital requirements under the U.S. Basel III final rules.
The Dodd-Frank Act, and its associated rules and guidance, and CFPB supervisory audits will likely continue to increase our regulatory compliance burden and associated costs.
The Dodd-Frank Act introduced a substantial number of reforms that continue to reshape the tenor and structure of financial services industry regulation. In particular, the Dodd-Frank Act, among other things, created the CFPB, which is authorized to promulgate and enforce consumer protection regulations relating to financial products and services.
The CFPB continues to recommend that indirect vehicle lenders, a class that includes us, take steps to monitor and impose controls over dealer markup policies where dealers charge consumers higher interest rates as compensation for facilitating the loan, with the markup shared between the dealer and the lender. The CFPB has in the past, and continues to, conduct supervisory audits of large providers of vehicle financing, including us, with respect to possible ECOA “disparate impact” credit discrimination in indirect vehicle finance and other related matters. From 2013 to present, the CFPB and the DOJ have entered into consent orders, memoranda of understanding and settlements with multiple lenders pertaining to allegations of disparate impact regarding vehicle dealer markups, requiring lenders to revise their pricing and compensation systems to substantially reduce dealer discretion and other financial incentives to mark up interest rates and to pay restitution to borrowers as well as fines and penalties. For example, in November 2017, we entered into a confidential agreement with the CFPB to resolve an investigation regarding certain alleged violations by the Company of the ECOA.
If the CFPB continues to enter into consent decrees with lenders on disparate impact claims and related matters, it could negatively impact the business of the affected lenders, and potentially the business of dealers and other lenders in the vehicle finance market. This impact on dealers and lenders could increase our regulatory compliance requirements and associated costs. Unlike competitors that are banks, we are subject to the licensing and operational requirements of states and other jurisdictions, and our business would be adversely affected if we lost our licenses.
Unlike competitors that are banks, we are subject to the licensing and operational requirements of states and other jurisdictions, and our business would be adversely affected if we lost our licenses.
Because we are not a nationally-chartered depository institution, we do not benefit from exemptions to state loan servicing or debt collection licensing and regulatory requirements. To the extent that they exist, we must comply with state licensing and various operational compliance requirements in all 50 states and the District of Columbia. These include, among others, requirements regarding form and content of contracts, other documentation, collection practices and disclosures, and record keeping. We are sensitive to regulatory changes that may increase our costs through stricter licensing laws, disclosure laws or increased fees.
In addition, we are subject to periodic examinations by state and other regulators. The states that currently do not provide extensive regulation of our business may later choose to do so. The failure to comply with licensing or permit requirements and other local regulatory requirements could result in significant statutory civil and criminal penalties, monetary damages, attorneys’ fees and costs, possible review of licenses, and damage to reputation, brand and valued customer relationships.
We are subject to potential intervention by any of our regulators or supervisors.
As noted above, our business and operations are subject to increasingly significant rules and regulations applicable to conducting banking and financial services business. These apply to, among other things, financial reserves and financial reporting. These requirements are set by the relevant central banks and state and federal regulatory authorities that authorize, regulate and supervise us in the jurisdictions in which we operate.
19
In their supervisory roles, the regulators seek to maintain the safety and soundness of financial institutions and the financial system as a whole, with the aim of strengthening, but not guaranteeing, the protection of customers and the financial system. The supervisors' continuing supervision of financial institutions is conducted through a variety of regulatory tools, including the collection of information by way of prudential examinations and requests, reports obtained from skilled persons, visits to firms and regular meetings with management to discuss issues such as performance, risk management and strategy. In general, these regulators have a more outcome-focused regulatory approach that involves more proactive enforcement and more punitive penalties for infringement. As a result, we face increased supervisory intrusion and scrutiny (resulting in increasing internal compliance costs and supervision fees), and in the event we fail to meet regulatory obligations or expectations we are likely to face more stringent regulatory fines. Some of the regulators are focusing strongly on consumer protection and on conduct risk, and will continue to do so. This has included a focus on the design and operation of products, the treatment of customers and the operation of markets.
Some of the laws in the jurisdictions in which we operate give the regulators the power to make temporary product intervention rules either to improve a firm’s systems and controls in relation to product design, product management and implementation, or to address problems identified with financial products. These problems may potentially cause significant detriment to consumers because of certain product features or governance flaws or distribution strategies. Such rules may prevent institutions from entering into product agreements with customers until such problems have been solved. Some of the regulatory regimes in the relevant jurisdictions in which we operate require us to be in compliance across all aspects of our business, including the training, authorization and supervision of personnel, systems, processes and documentation. If we fail to be compliant with such regulations, there likely would be an adverse impact on our business from sanctions, fines or other actions imposed by the regulatory authorities.
Adverse outcomes to current and future litigation against us may materially and adversely affect our business, financial condition and results of operations.
We are party to various litigation claims and legal proceedings. As a consumer finance company, we are subject to various consumer claims and litigation seeking damages and statutory penalties. Some litigation against us could take the form of class action complaints by consumers or shareholder derivative complaints, and we are party to multiple purported securities class action lawsuits and shareholder derivative complaints. As the assignee of loans originated by vehicle dealers, we also may be named as a co-defendant in lawsuits filed by consumers principally against vehicle dealers.
Customers of financial services institutions, including our customers, may seek redress for loss as a result of inaccuracies or misrepresentations made during the sale of a particular product or through incorrect application of the terms and conditions of a particular product. An adverse outcome in litigation related to these matters, any penalties imposed or compensation awarded and the costs of defending the litigation could harm our reputation or materially and adversely affect our business, financial condition and results of operations.
Negative publicity associated with litigation, governmental investigations, regulatory actions and other public statements could damage our reputation.
From time to time, there are negative media stories about us or the nonprime credit industry. These stories may follow the announcement of actual or threatened litigation or regulatory actions involving us or others in our industry. Our ability to attract consumers is highly dependent upon external perceptions of our level of service, trustworthiness, business practices and financial condition. Negative publicity about such matters, our alleged or actual practices, or our industry generally could materially and adversely affect our business, financial condition and results of operations, including our ability to retain and attract employees.
Changes in taxes and other assessments may adversely affect us.
The legislatures and tax authorities in the tax jurisdictions in which we operate regularly enact reforms to the tax and other assessment regimes to which we and our customers are subject. Such reforms include changes in the rate of assessments and, occasionally, enactment of temporary taxes, the proceeds of which are earmarked for designated governmental purposes. The effects of these changes and any other changes that result from enactment of additional tax reforms, other than the Tax Cuts and Jobs Act of 2017, cannot be quantified and there can be no assurance that any such reforms would not materially and adversely affect our business, financial condition and results of operations.
Liquidity and Financing Risks
Our business, financial condition and results of operations could be materially and adversely affected if our access to funding is reduced.
20
We rely upon our ability to sell securities in the ABS market and upon our ability to access various credit facilities to fund our operations. The ABS market, along with credit markets in general, have experienced significant disruptions in the past, during which certain issuers have experienced increased risk premiums while there was a relatively lower level of investor demand for certain ABS (particularly those securities backed by nonprime collateral). Decreased demand for lower credit grade ABS could restrict our ability to access the ABS market for nonprime collateralized receivables. Also, regulatory reforms enacted under the Dodd-Frank Act generally require us to retain a minimum specified portion (5%) of the credit risk on assets collateralizing ABS issuances, reducing the amount of liquidity otherwise generally available through ABS programs. As a result of these requirements and risks, there can be no assurance that we will continue to be successful in selling securities in the ABS market. These and other adverse changes in our ABS program or in the ABS market generally could materially adversely affect our ability to securitize loans on a timely basis or upon terms acceptable to us. This could increase our cost of funding, reduce our margins or cause us to hold assets until investor demand improves.
We also depend on various credit facilities and flow agreements to fund our future liquidity needs. We cannot guarantee that these financing sources will continue to be available beyond the current maturity dates, on reasonable terms, or at all.
We expect our volume of loan acquisitions and originations to increase, especially due to our relationship with FCA. As a result of the expected increases, we will require the expanded borrowing capacity of existing or additional credit facilities and flow agreements. The availability of these financing sources depends, in part, on factors outside of our control, including regulatory capital treatment for unfunded bank lines of credit, the financial strength and strategic objectives of Santander and the other banks that participate in our credit facilities and flow agreements, and the availability of bank liquidity in general. We may also experience the occurrence of events of default or breach of financial covenants, which could reduce our access to bank funding. In the event of a sudden or unexpected shortage of funds in the banking system, we cannot be sure that we will be able to maintain necessary levels of funding without incurring high funding costs, a reduction in the term of funding instruments or the liquidation of certain assets.
We are subject to general market conditions that affect issuers of ABS and other borrowers, and we could experience increased risk premiums or funding costs in the future. In addition, if the sources of funding described above are not available to us on a regular basis for any reason, we may have to curtail or suspend our loan acquisition and origination activities. Downsizing the scale of our business could materially and adversely affect our business, financial condition and results of operations.
Poor portfolio performance may trigger credit enhancement provisions in our revolving credit facilities or secured structured financings.
Our revolving credit facilities generally have net spread, delinquency and net loss ratio limits on the receivables pledged to each facility that, if exceeded, would increase the level of credit enhancement requirements for that facility and redirect all excess cash to the credit providers. Generally, these limits are calculated based on the portfolio collateralizing the respective credit line; however, for certain of our warehouse facilities, delinquency and net loss ratios are calculated with respect to our serviced portfolio as a whole. Our facilities used to finance vehicle lease originations also have a residual loss ratio limit calculated with respect to our serviced lease portfolio as a whole.
The documents that govern our secured structured financings also contain cumulative net loss ratio limits on the receivables included in each securitization trust. If, at any measurement date, a cumulative net loss trigger with respect to any financing were to exceed the specified limits, provisions of the financing agreements would increase the level of credit enhancement requirements for that financing and redirect all excess cash to the holders of the ABS. During this period, excess cash flows, if any, from the facility would be used to fund the increased credit enhancement levels rather than being distributed to us. Once an impacted trust reaches the new requirement, we would return to receiving a residual distribution from the trust.
We apply financial leverage to our operations, which may materially adversely affect our business, financial condition and results of operations.
We currently apply financial leverage, pledging most of our assets to credit facilities and securitization trusts, and we intend to continue to apply financial leverage in our retail lending operations. Our debt-to-assets ratio is 79.0% as of December 31, 2017. Although our total borrowings are restricted by covenants in our credit facilities and market conditions, we may change our target borrowing levels at any time. Incurring substantial debt subjects us to the risk that our cash flow from operations may be insufficient to service our outstanding debt.
Our indebtedness and other obligations are significant and impose restrictions on our business.
We have a significant amount of indebtedness. At December 31, 2017 and 2016, we had $31.2 billion and $31.3 billion, respectively, in principal amount of indebtedness outstanding (including $28.2 billion and $29.7 billion, respectively, in secured
21
indebtedness). Interest expense on our indebtedness constituted 18.0% of our total net finance and other interest income, net of leased vehicle expense, for the twelve months ended December 31, 2017.
Our debt reduces operational flexibility and creates default risks. Our revolving credit facilities contain a borrowing base or advance rate formula that requires us to pledge finance contracts in excess of the amounts that we can borrow under the facilities. We are also required to hold certain funds in restricted cash accounts to provide additional collateral for borrowings under the credit facilities. In addition, certain facilities require the replacement of delinquent or defaulted collateral, and the finance contracts pledged as collateral in securitizations must be less than 31 days delinquent at the time the securitization is issued. Accordingly, increases in delinquencies or defaults resulting from weakened economic conditions would require us to pledge additional finance contracts to support the same borrowing levels and may cause us to be unable to securitize loans to the extent we desire. These outcomes could materially and adversely affect our business, financial condition, and results of operations, including our liquidity.
Additionally, the credit facilities generally contain various covenants requiring, in certain cases, minimum financial ratios, asset quality, and portfolio performance ratios (portfolio net loss and delinquency ratios, and pool level cumulative net loss ratios), as well as limits on deferral levels. Generally, these limits are calculated based on the portfolio collateralizing the respective line; however, for certain of our third-party credit facilities, delinquency and net loss ratios are calculated with respect to our serviced portfolio as a whole. Covenants in the agreements governing our debts also limit our ability to:
• incur or guarantee additional indebtedness;
• purchase large loan portfolios in bulk;
• sell assets, including our loan portfolio or the capital stock of our subsidiaries;
• enter into transactions with affiliates;
• create or incur liens; and
• consolidate, merge, sell or otherwise dispose of all or substantially all of our assets.
Additionally, certain of our credit facilities contain minimum tangible net worth requirements, and certain of our credit facilities contain covenants that require timely filing of periodic reports with the SEC. In 2016, the Company failed to timely file our periodic reports with the SEC, but the Company was able to obtain waivers under the applicable credit facilities for our failure to file such periodic reports. While the Company was able to obtain such waivers during 2016, there can be no assurance that we would be able to obtain similar waivers, if needed, in the future. Failure to meet any of these covenants could result in an event of default under these agreements. If an event of default occurs under these agreements, the lenders could elect to declare all amounts outstanding under these agreements to be immediately due and payable, enforce their interests against collateral pledged under these agreements, restrict our ability to obtain additional borrowings under these agreements and/or remove us as servicer. Such an event of default could materially and adversely affect our business, financial condition, liquidity, and results of operations.
We currently have the ability to pledge retained residuals and create additional unsecured indebtedness under our credit facilities provided by Santander. As we execute on our strategy to reduce our reliance on borrowings under commitments from Santander, we must find other funding sources. If our debt service obligations increase, whether due to the increased cost of existing indebtedness or the incurrence of additional indebtedness, we may be required to dedicate a significant portion of our cash flow from operations to the payment of principal of, and interest on, our indebtedness, which would reduce the funds available for other purposes. Our indebtedness also could limit our ability to withstand competitive pressures and reduce our flexibility in responding to changing business and economic conditions.
In addition, certain of our funding arrangements may require us to make payments to third parties if losses exceed certain thresholds, including, for example, certain of our flow agreements and arrangements with certain third-party loan originators of loans that we purchase on a periodic basis.
Credit Risks
Our business, financial condition, liquidity and results of operations depend on the credit performance of our loans.
As of December 31, 2017, more than 82% of our vehicle consumer loans are nonprime receivables with obligors who do not qualify for conventional consumer finance products as a result of, among other things, a lack of or adverse credit history, low income levels and/or the inability to provide adequate down payments. These loans experience higher default rates than a portfolio of obligations of prime obligors. In the event of a default on a vehicle loan, generally the most practical alternative for recourse by the lender is repossession of the financed vehicle, although the collateral value of the vehicle usually does not
22
cover the outstanding account balance and costs of recovery. Repossessions and foreclosure sales that do not yield sufficient proceeds to repay the receivables in full could result in losses on those receivables.
In addition, our prime portfolio has grown in proportion to our overall portfolio over the past several years. While prime portfolios typically have lower default rates than nonprime portfolios, we have less ability to make risk adjustments to the pricing of prime loans compared to nonprime loans. As a result, a larger proportion of our business will consist of loans with respect to which we have less flexibility to adjust pricing to absorb losses, and we may sustain higher losses than anticipated in our prime portfolio. Prime loan losses that are higher than anticipated could result in material underestimation of our allowance for credit losses, impacting our financial results.
We are exposed to geographic customer concentration risk. An economic downturn or catastrophic event that disproportionately affects certain geographic regions, such as the recent hurricanes affecting Texas and Florida, could materially and adversely affect our business, financial condition and results of operations, including the performance of our loan portfolio.
Our allowance for credit losses and impairments may prove to be insufficient to absorb probable losses inherent in our loan portfolio.
We maintain an allowance for credit losses, established through a provision for credit losses charged to expense, that we believe is appropriate to provide for probable losses inherent in our originated loan portfolio. The determination of the appropriate level of the allowance for credit losses necessarily involves a high degree of subjectivity and requires us to make significant estimates of current credit risks and future trends using existing quantitative and qualitative information, all of which are subject to material changes.
For receivables portfolios purchased from other lenders at a discount to the aggregate principal balance of the receivables, the portion of the discount that was attributable to credit deterioration since origination of the loans is recorded as a nonaccretable difference. Any deterioration in the performance of the purchased portfolios after acquisition results in an incremental allowance. The determination of the appropriate level of the allowance for credit losses and nonaccretable difference for portfolios purchase from other lenders necessarily involves a high degree of subjectivity and requires us to make significant estimates of current credit risks and future trends, all of which are subject to change. Changes in economic conditions affecting borrowers, new information regarding our loans, and other factors, both within and outside of our control, may require an increase in the allowance for credit losses. Furthermore, growth in our loan portfolio generally would lead to an increase in the provision for credit losses. In addition, if net charge-offs in future periods exceed the allowance for credit losses, we will need to make additional provisions to increase the allowance. There is no precisely accurate method for predicting credit losses, and we cannot provide assurance that our current or future credit loss allowance will be sufficient to cover actual losses.
The process for determining our allowance for credit losses is complex, and we may from time to time make changes to our process for determining our allowance for credit losses. In addition, regulatory agencies periodically review our allowance for credit losses, as well as our methodology for calculating our allowance for credit losses and may require an increase in the provision for loan losses or the recognition of additional loan charge-offs, based on judgments different than those of management. Changes that we make to enhance our process for determining our allowance for credit losses may lead to an increase in our allowance for credit losses. Any increase in our allowance for credit losses will result in a decrease in net income and capital, and may have a material adverse effect on us. Material changes to our methodology for determining our allowance for loan losses could result in the need to restate our financial statements or fines, penalties, potential regulatory action and damage to our reputation.
Market Risks
Adverse macroeconomic conditions in the United States and worldwide may materially and adversely affect our business, financial condition and results of operations.
We are subject to changes in macroeconomic conditions that are beyond our control. Although recently certain economic conditions in the United States have improved, the macroeconomic environment remains susceptible to global events and volatility. A significant deterioration in economic conditions in the United States or worldwide could materially and adversely affect our business, financial condition and results of operations, including periods of slow economic growth; inflation and unemployment rates; changes in the availability of consumer credit and other factors that impact consumer confidence, demand for credit, payment patterns, bankruptcies or disposable income; natural disasters, acts of war, terrorist attacks and the escalation of military activity; confidence in financial markets; the availability and cost of capital; interest rates and commodity prices (including gasoline prices); and geopolitical matters.
Some of the risks we face as a result of changes in these and other economic factors include the following:
23
• | Loss rates could increase. Our balance sheet consists of predominantly nonprime consumers, which are associated with higher than average delinquency rates. The actual rates of delinquencies, defaults, repossessions and losses from nonprime loans could be more dramatically affected by a general economic downturn than other loans. |
• | Consumer demand for, and the value of, new and used vehicles and other consumer products securing outstanding accounts could decrease, which would weaken collateral coverage and increase the amount of losses in the event of default. |
• | Servicing costs could increase without a corresponding increase in our finance charge income. |
• | Our compliance costs may increase as a result of increased regulation enacted in response to deterioration in economic conditions. |
• | Dealership closures and decreases in sales and loan volume by our existing vehicle dealer base may occur, which could result in the reduction in scale of our business. |
• | Financial market instability and volatility could negatively affect our liquidity and funding costs. |
Changes in interest rates may adversely impact our profitability and risk profile.
Our profitability may be directly affected by interest rate levels and fluctuations in interest rates. As interest rates change, our gross interest rate spread on originations either increases or decreases because the rates charged on the contracts originated or purchased from dealers are limited by market and competitive conditions, restricting our ability to pass on increased interest costs to the consumer.
While interest rates recently rose off historic lows set in July 2016, both shorter-term and longer-term interest rates remain below historical averages, as well as the yield curve, which has been relatively flat compared to recent years. A flat yield curve combined with low interest rates generally leads to lower revenue and reduced margins because it tends to limit our ability to increase the spread between asset yields and funding costs. Sustained periods of time with a flat yield curve coupled with low interest rates could have a material adverse effect on our earnings and our net interest margin.
A low interest rate environment increases our exposure to prepayment risk in our portfolio. Increased prepayments, refinancing or other factors that impact loan balances could reduce expected revenue associated with our portfolio and could also lead to a reduction in the value of our servicing rights, which could have a negative impact on our financial results. Although the Federal Reserve’s recent decisions to raise short-term interest rates may reduce prepayment risk, debt service requirements for some of our borrowers will increase, which may adversely affect those borrowers’ ability to pay as contractually obligated. This could result in additional delinquencies or charge-offs and negatively impact our results of operations.
Additionally, although the majority of our borrowers are nonprime and are not highly sensitive to interest rate movement, increases in interest rates may reduce the volume of loans we originate. While we monitor the interest rate environment and employ hedging strategies designed to mitigate the impact of increased interest rates, we cannot provide assurance that hedging strategies will fully mitigate the impact of changes in interest rates.
Our business, financial condition and results of operations could be materially and adversely affected if used vehicle values decline, resulting in lower residual values of our vehicle leases and lower recoveries in sales of repossessed vehicles.
General economic conditions, the supply of off-lease and other used vehicles to be sold, new vehicle market prices and marketing programs, vehicle brand image and strength, perceived vehicle quality, general consumer preference and confidence levels, seasonality, and overall price and price volatility of gasoline or diesel fuel, among other factors, heavily influence used vehicle prices and thus the residual value of our leased vehicles and the amount we recover in remarketing repossessed vehicles. We expect our financial results to be more sensitive to used vehicle prices as leases continue to become a larger part of our business.
Our expectation of the residual value of a leased vehicle is a critical input in determining the amount of the lease payments at the inception of a lease contract. Our lease customers are responsible only for any deviation from expected residual value that is caused by excess mileage or excess wear and tear, while we retain the obligation to absorb any general market changes in the value of the vehicle. Therefore, our operating lease expense is increased when we have to take an impairment on our residual values or when the realized residual value of a vehicle at lease termination is less than the expected residual value for the vehicle at lease inception. In addition, the timeliness, effectiveness, and quality of our remarketing of off-lease vehicles affects the net proceeds realized from the vehicle sales.
Lower used vehicle prices also reduce the amount we can recover when remarketing repossessed vehicles that serve as collateral on the underlying loans. As a result, declines in used vehicle prices could materially and adversely affect our business, financial condition and results of operations.
24
We are subject to market, operational and other related risks associated with our derivative transactions that could materially and adversely affect our business, financial condition and results of operations.
We enter into derivative transactions for economic hedging purposes. We are subject to market and operational risks associated with these transactions, including basis risk, the risk of loss associated with variations in the spread between the asset yield and the funding and/or hedge cost, credit or default risk, the risk of insolvency, or other inability of the counterparty to a particular transaction to perform its obligations thereunder, including providing sufficient collateral. Additionally, certain of our derivative agreements require us to post collateral when the fair value of the derivative is negative. Our ability to adequately monitor, analyze and report derivative transactions continues to depend, to a great extent, on our information technology systems.
General Business and Industry Risks
We face significant risks in implementing our growth strategy, some of which are outside our control.
We intend to continue our growth strategy to expand our vehicle finance franchise by increasing market penetration via the number and depth of our relationships in the vehicle finance market, pursuing additional relationships with OEMs, expanding our direct-to-consumer footprint and growing our serviced for others platform. Our ability to execute this growth strategy is subject to significant risks, some of which are beyond our control, including:
• | the inherent uncertainty regarding general economic conditions; |
• | our ability to obtain adequate financing for our expansion plans; |
• | the prevailing laws and regulatory environment of each state in which we operate or seek to operate, and, federal laws and regulations, to the extent applicable, which are subject to change at any time; |
• | the degree of competition in our markets and its effect on our ability to attract customers; |
• | our ability to recruit qualified personnel, in particular, in areas where we face a great deal of competition; and |
• | our ability to obtain and maintain any regulatory approvals, government permits, or licenses that may be required on a timely basis. |
Our agreement with FCA may not result in currently anticipated levels of growth and is subject to certain performance conditions that could result in termination of the agreement. If we fail to meet certain of these performance conditions, FCA may elect to terminate the agreement.
In February 2013, we entered into a ten-year Master Private Label Financing Agreement (the Chrysler Agreement) with FCA whereby we launched the Chrysler Capital brand, which originates private-label loans and leases to facilitate the purchase of FCA vehicles by consumers and FCA-franchised vehicle dealers and provides other related financing services. In accordance with the terms of the Chrysler Agreement, in May 2013 we paid FCA a $150 million upfront, nonrefundable payment, which will be amortized over ten years. The unamortized portion would be recognized as expense immediately if the Chrysler Agreement is terminated in accordance with its terms.
We bear the risk of loss on loans originated pursuant to the Chrysler Agreement, while FCA shares in any residual gains and losses in respect of vehicle leases, subject to specific provisions in the Chrysler Agreement, including limitations on our participation in gains and losses. In addition, under the Chrysler Agreement, FCA has the option to acquire, for fair market value, an equity participation in an operating entity through which the financial services contemplated by the Chrysler Agreement are offered and provided, through either an equity interest in the new entity or participation in a joint venture or other similar business relationship or structure. There is no maximum limit on the size of FCA’s potential equity participation. Although the Chrysler Agreement contains provisions that are designed to address a situation in which the parties disagree on the fair market value of the equity participation interest, there is a risk that we ultimately receive less than what we believe to be the fair market value for such interest.
The Chrysler Agreement is subject to early termination in certain circumstances, including the failure by either party to comply with certain of their ongoing obligations under the Chrysler Agreement. These obligations include the Company's meeting specified escalating penetration rates for the first five years of the agreement. We have not met, are not meeting and may not in the future meet these penetration rates. If we continue not to meet these specified penetration rates, FCA may elect to terminate the Chrysler Agreement. FCA may also terminate the agreement if, among other circumstances, (i) a person other than Santander and its affiliates or our other stockholders owns 20% or more of our common stock and Santander and its affiliates own fewer shares of common stock than such person, (ii) we become, control, or become controlled by, an OEM that competes with FCA or (iii) certain of our credit facilities become impaired.
The loans and leases originated through Chrysler Capital represent a significant concentration of our loan portfolio. Our ability to realize the full strategic and financial benefits of our relationship with FCA depends in part on the successful development of
25
our Chrysler Capital business, which will require a significant amount of management’s time and effort, as well as demand for FCA vehicles, which is outside of our control. The inability to realize the expected benefits of our relationship with FCA, termination of the Chrysler Agreement or a decrease in demand for FCA vehicles could materially and adversely affect our business, financial condition and results of operations, including our profitability, loan and lease volume, credit quality of our portfolio, liquidity, funding and growth, and the Company’s ability to implement its business strategy would be materially and adversely affected.
Future changes in our relationship with Santander may adversely affect our business, financial condition and results of operations.
Santander, through SHUSA, owns approximately 68.1% of our common stock. We rely on our relationship with Santander, through SHUSA, for several competitive advantages including relationships with OEMs and regulatory best practices and other commercial arrangements. Changes in our relationship with Santander, and changes affecting Santander, could materially and adversely affect our business, financial condition and results of operations.
Some of the risks we face as a result of potential changes in our relationship with, or changes affecting, Santander include the following:
• | Santander has provided and continues to provide us with significant funding support, through both committed liquidity and opportunistic extensions of credit, as well as guarantees of our obligations under the governing documents of our warehouse facilities and privately issued amortizing notes. For example, during the financial downturn, Santander and its affiliates provided us with more than $6 billion in financing that enabled us to pursue several acquisitions and/or conversions of vehicle loan portfolios at a time when most major banks were curtailing or eliminating their commercial lending activities. In addition, during 2017 we entered into a new flow agreement with Santander to sell eligible prime loans through the SPAIN securitization platform. If Santander or SHUSA elects not to provide such support, not to provide it to the same degree or not to enter into additional flow agreements, we may not be able to replace such support ourselves or to obtain substitute arrangements with third parties. We may be unable to obtain such support because of financial or other constraints, or be unable to implement substitute arrangements on a timely basis on terms that are comparable, or at all, which could materially and adversely affect our business, financial condition and results of operations. |
• | Santander may sell or otherwise reduce its equity interest in us. If Santander sells or otherwise reduces its equity interest in us, it may be less willing to provide us with the support it has provided in the past or to enter into agreements (such as our flow agreement with Santander or our origination services agreements with SBNA) with us on comparable terms, or at all, as it has in the past. In addition, our right to use the Santander name is on the basis of a non-exclusive, royalty-free, and non-transferable license from Santander, and only extends to uses in connection with our current and future operations within the United States. Santander may terminate such license at any time Santander ceases to own, directly or indirectly, 50% or more of our common stock. If we were required to change our name, we would incur the administrative costs and burden associated with revising legal documents and marketing materials, and also may experience loss of brand and loss of business or loss of funding due to consumers’ and banks’ relative lack of familiarity with our new name. Additionally, FCA may terminate the Chrysler Agreement if a person other than Santander and its affiliates or our other stockholders owns 20% or more of our common stock, and Santander and its affiliates own fewer shares of common stock than such person. |
• | Some terms of our credit agreements are influenced by, among other things, the credit ratings of Santander. If Santander were to suffer credit rating downgrades or other adverse financial developments, we could be negatively impacted, either directly or indirectly. For example, Santander’s short-term credit ratings downgrades in 2012, from A-1 to A-2 (Standard & Poor’s) and from P-1 to P-2 (Moody’s), did not directly impact our cost of funds. However, due to the contractual terms of certain of our debt agreements, these downgrades resulted in the loss of our ability to commingle funds on most facilities. The loss of commingling increased the amount of funds we were required to borrow, thereby indirectly raising our cost of funds by approximately $1 million per month. |
• | Santander applies certain standardized banking policies, procedures, and standards across its affiliated entities, including with respect to internal audit, credit approval, governance, risk management, and compensation practices. We currently follow certain of these Santander policies and may in the future become subject to additional Santander policies, procedures, and standards, which could result in changes to our practices. |
• | Our relationship with Santander or SHUSA could reduce the willingness of other banks to develop relationships with us due to general competitive dynamics among such financial institutions. |
26
Our business, financial condition and results of operations could be materially and adversely affected if we fail to manage and complete divestitures.
We regularly evaluate our portfolio in order to determine whether an asset or business may no longer be aligned with our strategic objectives. For example, in October 2015, we disclosed a decision to exit our personal lending business and to explore strategic alternatives for our existing personal lending assets. When we decide to sell assets or a business, we may encounter difficulty in finding buyers or alternative exit strategies on acceptable terms in a timely manner, which could delay the achievement of our strategic objectives. We may also experience greater costs and dissynergies than expected, and the impact of the divestiture on our revenue may be larger than projected. Additionally, we may ultimately dispose of assets or a business at a price or on terms that are less favorable than those we had originally anticipated. After reaching a definitive agreement with a buyer, we typically must satisfy pre-closing conditions and the completion of the transaction may be subject to regulatory and governmental approvals. Failure of these conditions and approvals to be satisfied or obtained may prevent us from completing the transaction. Divestitures involve a number of risks, including the diversion of management and employee attention, significant costs and expenses, and a decrease in revenues and earnings associated with the divested business. Divestitures may also involve continued financial involvement in the divested business, such as through continuing equity ownership, guarantees, indemnities or other financial obligations. Under these arrangements, performance by the divested businesses or other conditions outside of our control could materially and adversely affect our business, financial condition and results of operations.
Our two primary personal lending relationships have been with LendingClub and Bluestem. We completed the sale of substantially all of our LendingClub loans in February 2016 and the remaining portfolio was sold in April 2017. We continue to hold our Bluestem portfolio, which had a carrying balance of approximately $1.1 billion as of December 31, 2017, and we remain a party to agreements with Bluestem that obligate us, among other things, to purchase new advances originated by Bluestem and existing balances on accounts with new advances, for an initial term ending in April 2020 and renewable through April 2022 at Bluestem’s option. Although we are seeking a third party to assume this obligation, we may not be successful in finding such a party, and Bluestem may not agree to the substitution. We continue to classify the Bluestem portfolio as held-for-sale. We have recorded significant lower-of-cost-or-market adjustments on this portfolio and may continue to do so as long as we hold the portfolio, particularly due to the new volume we are committed to purchase.
Our business, financial condition and results of operations could be materially and adversely affected if we are unsuccessful in developing and maintaining relationships with vehicle dealerships.
Our ability to originate and acquire loans and vehicle leases depends on our relationships with vehicle dealers. In particular, our vehicle finance operations depend in large part upon our ability to establish and maintain relationships with reputable vehicle dealers that direct customers to our offices or originate loans at the point-of-sale, which we subsequently purchase. Although we have relationships with certain vehicle dealers, none of our relationships is exclusive and any may be terminated at any time. In addition, an economic downturn or contraction of credit affecting either dealers or their customers could result in an increase in vehicle dealership closures or a decrease in the sales and loan volume of our existing vehicle dealer base, which could materially and adversely affect our business, financial condition and results of operation.
Our business, financial condition and results of operations could be materially and adversely affected if we are unsuccessful in developing and maintaining our serviced for others portfolio.
A significant and growing portion of our business strategy is to increase the revenue stream from our serviced for others portfolio by continuing to add assets to this portfolio. If an institution for which we currently service assets chooses to terminate our rights as servicer, or if we fail to add additional institutions or portfolios to our servicing platform, we may not achieve the desired revenue or income from this strategy.
We depend on the accuracy and completeness of information about borrowers and counterparties and any misrepresented information could materially and adversely affect our business, financial condition and results of operations.
In deciding whether to approve loans or to enter into other transactions with borrowers and counterparties in our retail lending and commercial lending businesses, we may rely on information furnished to us by or on behalf of borrowers and counterparties, including financial statements and other financial information such as income. We also may rely on representations of borrowers and counterparties as to the accuracy and completeness of that information and, with respect to financial statements, on reports of independent auditors. If any of this information is intentionally or negligently misrepresented and such misrepresentation is not detected prior to loan funding, the value of the loan may be significantly lower than expected. Whether a misrepresentation is made by the loan applicant, another third party or one of our employees, we generally bear the risk of loss associated with the misrepresentation. Our controls and processes may not have detected or may not detect all
27
misrepresented information in our loan originations or from our business clients. Any such misrepresented information could materially and adversely affect our business, financial condition and results of operations.
Loss of our key management or other personnel, or an inability to attract such management and other personnel, could materially and adversely affect our business, financial condition and results of operations.
The successful implementation of our growth strategy depends in part on our ability to retain our experienced management team and key employees, attract appropriately qualified personnel and have an effective succession planning framework in place. Management turnover, including the loss of any key member of our management team or other key employees, could hinder or delay our ability to implement our growth strategy effectively. Further, if we are unable to attract appropriately qualified personnel as we expand, we may not be successful in implementing our growth strategy. In either instance, our business, financial condition and results of operations could be adversely affected. For example, during 2017, we appointed a new Chief Executive Officer and a new Chief Financial Officer and made management team changes in other key functions. The extent of our management team changes could result in disruption in our operations, negatively impact customer relationships and make recruiting for future management positions more difficult.
Due to our relationship with Santander, we also are subject to indirect regulation by the European Central Bank, which imposes compensation restrictions that may apply to certain of our executive officers and other employees under Capital Requirements Directive 2013/36/EU (also known as CRD IV). These restrictions may impact our ability to retain our experienced management team and key employees and our ability to attract appropriately qualified personnel, which could materially and adversely affect our business, financial condition and results of operations.
Negative changes in the business of the OEMs with which we have strategic relationships, including FCA, could materially and adversely affect our business, financial condition and results of operations.
A significant adverse change in FCA’s or other vehicle manufacturers’ business, including (i) significant adverse changes in their respective liquidity position and access to the capital markets, (ii) the production or sale of FCA or other vehicle manufacturers’ vehicles (including the effects of any product recalls), (iii) the quality or resale value of FCA or other vehicles, (iv) the use of marketing incentives, (v) FCA’s or other vehicle manufacturers’ relationships with their key suppliers, or (vi) FCA’s or other vehicle manufacturers’ respective relationships with the United Auto Workers and other labor unions, and other factors impacting vehicle manufacturers or their employees could materially and adversely affect our business, financial condition and results of operations.
Under the Chrysler Agreement, we originate private-label loans and leases to facilitate the purchase of FCA vehicles by consumers and FCA-franchised vehicle dealers. In the future, it is possible that FCA or other vehicle manufacturers with whom we have relationships could utilize other companies to support their financing needs, including offering products or terms that we would not or could not offer, which could materially and adversely affect our business, financial condition and results of operations. Furthermore, FCA or other vehicle manufacturers could expand, establish or acquire captive finance companies to support their financing need; thus, reducing their need for our services.
There can be no assurance that the global vehicle market, or FCA’s or our other OEM partners’ share of that market, will not suffer downturns in the future, and any negative impact could in turn materially and adversely affect our business, financial condition and results of operations.
Future significant loan, lease or personal loan repurchase requirements could materially and adversely affect our business, financial condition and results of operations.
We have repurchase obligations in our capacity as servicer in securitizations and whole-loan sales. If a servicer breaches a representation, warranty or servicing covenant with respect to the loans sold, the servicer may be required by the servicing provisions to repurchase that asset from the purchaser or otherwise compensate one or more classes of investors for losses caused by the breach. If significant repurchases of assets or other payments are required under our responsibility as servicer, it could materially and adversely affect our business, financial condition and results of operations. As we have increased the number of loans sold, the potential impact of such repurchases has increased.
We have treated sales of the debt and equity in certain of our securitizations as sales of the underlying finance receivables. The exercise of our clean-up call option on each of these securitizations when the collateral pool balance reaches 5% or 10% of its original balance (depending on the securitization structure) would result in the repurchase of the remaining underlying finance receivables, exposing us to credit performance risk for the remainder of the pool's life.
Competition with other lenders could materially and adversely affect our business, financial condition and results of operations.
28
The vehicle finance market is very competitive and is served by a variety of entities, including the captive finance affiliates of major vehicle manufacturers, banks, savings and loan associations, credit unions, and independent finance companies. The market is highly fragmented, with no individual lender capturing more than 10% of the market. Our competitors often provide financing on terms more favorable to vehicle purchasers or dealers than we offer. Many of these competitors also have long-standing relationships with vehicle dealerships and may offer dealerships or their customers other forms of financing that we do not offer. We anticipate that we will encounter greater competition as we expand our operations and as the economy continues to improve.
Certain of our competitors are not subject to the same regulatory regimes that we are. As a result, these competitors may have advantages in conducting certain businesses and providing certain services, and may be more aggressive in their loan origination activities. Increasing competition could also require us to lower the rates we charge on loans in order to maintain loan origination volume, which could materially and adversely affect our business, financial condition and results of operations.
As described above, we rely upon our ability to sell securities in the ABS market and upon our ability to access various credit facilities to fund our operations. Some of our competitors may have lower cost structures, or funding costs, and be less reliant on securitizations than we are.
We partially rely on third parties to deliver services, and failure by those parties to provide these services or meet contractual requirements could materially and adversely affect our business, financial condition and results of operations.
We depend on third-party service providers for many aspects of our business operations. For example, we depend on third parties like Experian to obtain data related to our market that we use in our origination and servicing platforms. In addition, we rely on third-party servicing centers for a portion of our servicing activities and on third-party repossession agents. If a service provider fails to provide the services that we require or expect, or fails to meet contractual requirements, such as service levels or compliance with applicable laws, a failure could negatively impact our business by adversely affecting our ability to process customers’ transactions in a timely and accurate manner, otherwise hampering our ability to service our customers, or subjecting us to litigation or regulatory risk for poor vendor oversight. Such a failure could adversely affect the perception of the reliability of our networks and services, and the quality of our brands, and could materially and adversely affect our business, financial condition and results of operations.
Goodwill and intangible asset impairments may be required in relation to acquired businesses.
We have made business acquisitions for which it is possible that the goodwill and intangible assets which have been attributed to those businesses may have to be written down if our valuation assumptions are required to be reassessed as a result of any deterioration in the business’ underlying profitability, asset quality or other relevant matters. Impairment testing with respect to goodwill and intangible assets is performed annually, or more frequently if impairment indicators are present. Goodwill and intangible asset impairment analysis and measurement is a process that requires significant judgment. Our stock price and various other factors affect the assessment of the fair value of our underlying business for purposes of performing any goodwill and intangible asset impairment assessment. We had impairment on intangible assets of zero, zero and $3.5 million during the years ended December 31, 2017, 2016 and 2015, respectively. There can be no assurance that we will not be required to record additional impairments on intangible assets in the future or that such impairments will not be material.
Technology Risks
Our information technology may not support our future volumes and business strategies.
We rely on our proprietary software, commercial systems and third parties to continuously adapt our products and services to evolving consumer behavior, changing vehicle finance and consumer loan products and third party purchaser requirements. We employ engineers, product managers, designers, analysts and technical specialists to ensure that our technology and digital capabilities remain competitive. However, due to the continued rapid changes in technology, and potential for digital market disruptors to augment consumer digital behaviors, there can be no assurance that our technology solutions will continue to be adequate for our business or provide a competitive advantage.
Our technology platforms, underlying infrastructure and infrastructure of integrated third-party services are important to our operating activities and any high severity incidents or outages could disrupt our ability to process loan applications, originate loans or service our existing loan portfolios, which could materially and adversely affect our operating activities. Outages may be caused by unforeseen catastrophic events, including natural disasters, terrorist attacks, large-scale power outages, software or hardware defects, computer viruses, cyber-attacks, external or internal security breaches, acts of vandalism, misplaced or lost data, programming or human errors, or other similar events. Although we maintain, and regularly assess the adequacy of, a business continuity plan and have designed our infrastructure for high availability to mitigate the risk of such events, we cannot be certain that our plan will function as intended, or otherwise resolve or compensate for such effects. Such a failure in business
29
continuity, if and when experienced, may materially and adversely affect our business, financial condition and results of operations, including our ability to support and service our customer base.
A security breach or a cyber-attack could materially and adversely affect our business, financial condition and results of operations.
In the normal course of business, we collect, process, and retain sensitive and confidential consumer information and may, subject to applicable law, share that information with our third-party service providers. Despite the security measures we have in place, our facilities and systems, and those of third-party service providers, could be vulnerable to external or internal security breaches, acts of vandalism, computer viruses, misplaced or lost data, programming or human errors, or other similar events. A security breach or cyber-attack of our computer systems could interrupt or damage our operations or harm our reputation. If third parties or our employees are able to penetrate our network security or otherwise misappropriate our customers’ personal information or contract information, or if we give third parties or our employees improper access to consumers’ personal information or contract information, we could be subject to liability. This liability could include investigations, fines, or penalties imposed by state or federal regulatory agencies, including the loss of necessary permits or licenses. This liability could also include identity theft or other similar fraud-related claims, claims for other misuses, or losses of personal information, including for unauthorized marketing purposes or claims alleging misrepresentation of our privacy and data security practices.
We rely on encryption and authentication technology licensed from third parties to provide the security and authentication necessary to effect secure online transmission of confidential consumer information. Advances in computer capabilities, new discoveries in the field of cryptography, or other events or developments may result in a compromise or breach of the algorithms that we use to protect sensitive consumer transaction data. A party who is able to circumvent our security measures could misappropriate proprietary information or cause interruptions in our operations. We may be required to expend capital and other resources to protect against such security breaches or cyber-attacks, or to alleviate problems caused by such breaches or attacks.
We have seen in recent years computer systems of companies and organizations being targeted, not only by cyber criminals, but also by activists and rogue states. We have been and continue to be subject to a range of cyber-attacks, such as denial of service, malware and phishing. Cyber-attacks could give rise to the loss of significant amounts of customer data and other sensitive information, as well as significant levels of liquid assets (including cash). In addition, cyber-attacks could give rise to the disablement of our information technology systems used to service our customers. As attempted attacks continue to evolve in scope and sophistication, we may incur significant costs in our attempt to modify or enhance our protective measures against such attacks, or to investigate or remediate any vulnerability or resulting breach, or in communicating cyber-attacks to our customers. If we fail to effectively manage our cyber-security risk by failing to update our systems and processes in response to new threats, this could harm our reputation and materially and adversely affect our business, financial condition and results of operations through the payment of customer compensation, regulatory penalties and fines and/or through the loss of assets. Further, successful cyber-attacks of other market participants, whether or not we are impacted, could lead to a general loss of customer confidence that could negatively affect us, including harming the market perception of the effectiveness of our security measures or the financial system in general.
We manage and hold confidential personal information of customers in the ordinary course of our business. Although we have procedures and controls to safeguard personal information in our possession, unauthorized disclosures could subject us to legal actions and administrative sanctions, as well as damages that could materially and adversely affect our business, financial condition and results of operations. Further, our business is exposed to risk from potential non-compliance with policies, employee misconduct or negligence and fraud, which could result in regulatory sanctions and serious reputational or financial harm. It is not always possible to deter or prevent employee misconduct, and the precautions we take to detect and prevent this activity may not always be effective. In addition, we may be required to report events related to information security issues (including any cyber-security issues), events where customer information may be compromised, unauthorized access and other security breaches, to the relevant regulatory authorities. Any material disruption or slowdown of our systems could cause information, including data related to customer requests, to be lost or to be delivered to our clients with delays or errors, which could reduce demand for our services and products, and could materially and adversely affect us.
Financial Reporting and Control Risks
We are required to make significant estimates and assumptions in the preparation of our financial statements, and our estimates and assumptions may not be accurate. We also rely on pricing, accounting, risk management and other models which may fail to accurately predict outcomes.
30
The preparation of our consolidated financial statements in conformity with U.S. GAAP requires our management to make significant estimates and assumptions that affect the reported amounts of assets and liabilities, and disclosures of contingent assets and liabilities, at the date of the consolidated financial statements, and the reported amounts of income and expense during the reporting periods. We also use estimates and assumptions in determining the residual values of leased vehicles. Critical estimates are made by management in determining, among other things, the allowance for credit losses, amounts of impairment, and valuation of income taxes. The process we use to estimate losses inherent in our credit exposure requires complex judgments, including forecasts of economic conditions and how those economic conditions might impair the ability of our borrowers to repay their loans. The degree of uncertainty concerning economic conditions may adversely affect the accuracy of our estimates, which may, in turn, impact the reliability of the process and the quality of our assets. If our underlying estimates and assumptions prove to be incorrect, our financial condition and results of operations may be materially and adversely affected.
We use models in various aspects of our business, including for pricing our extensions of credit, accounting determinations, risk management and other purposes and to assist with certain business decisions, and these models rely on many estimates and assumptions. The estimates and assumptions embedded in our models may prove to be inaccurate and furthermore our models may include deficiencies such as errors in coding or formulas, incorrect input or gathering of data, insufficient control over model changes and use of models other than for their intended purposes. If our models fail to accurately predict outcomes, we may not make appropriate business or financial decisions which could materially and adversely affect our financial condition and results of operations, including our capitalization and our relationships with regulators, customers and counterparties.
Furthermore, the Financial Accounting Standards Board, the SEC or other regulatory bodies may change the financial accounting and reporting standards to which we are subject, including those related to assumptions and estimates we use to prepare our financial statements. These changes may occur in ways we cannot predict and may impact our financial statements.
Lapses in internal controls including internal control over financial reporting could materially and adversely affect our business, financial condition and results of operations, including our liquidity and reputation.
We have identified control deficiencies in our financial reporting process that constitute material weaknesses and for which remediation is still in process as of December 31, 2017. These control deficiencies contributed to the restatement of the audited consolidated financial statements in our previously filed Annual Report on Form 10-K for the year ended December 31, 2015. See Part II, Item 9A, Controls and Procedures in this Annual Report on Form 10-K.
As of the filing of this Annual Report on Form 10-K, our management has completed the implementation of remediation efforts related to six of the nine previously identified material weakness and considers them remediated. In addition, the Company is currently working to remediate the remaining three material weaknesses, including assessing the need for additional remediation steps and implementing additional measures to remediate the underlying causes that gave rise to the material weaknesses. The Company is committed to maintaining a strong internal control environment and to ensure that a proper, consistent tone is communicated throughout the organization, including the expectation that previously existing deficiencies will be remediated through implementation of processes and controls to ensure strict compliance with U.S. GAAP.
However, there can be no assurance that we will be able to fully remediate our existing material weaknesses. Further, there can be no assurance that we will not suffer other material weaknesses in the future. If we fail to remediate these material weaknesses or fail to otherwise maintain effective internal controls over financial reporting in the future, such failure could result in a material misstatement of our annual or quarterly financial statements that would not be prevented or detected on a timely basis and which could cause investors and other users to lose confidence in our financial statements, limit our ability to raise capital and have a negative effect on the trading price of our common stock. Additionally, failure to remediate the material weaknesses or otherwise failing to maintain effective internal controls over financial reporting may materially and adversely affect our business, financial condition and results of operations, and could impair our ability to timely file our periodic reports with the SEC, subject us to additional litigation and regulatory actions and cause us to incur substantial additional costs in future periods relating to the implementation of remedial measures.
Internal control over financial reporting may not prevent or detect all errors or acts of fraud.
We maintain disclosure controls and procedures designed to ensure that we timely report information as specified in the rules and regulations of the SEC. We also maintain a system of internal control over financial reporting. However, these controls may not achieve, and in some cases have not achieved, their intended objectives. Control processes that involve human diligence and compliance, such as our disclosure controls and procedures and internal control over financial reporting, are subject to lapses in judgment and breakdowns resulting from human failures. Controls can also be circumvented by collusion or improper management override of such controls. Because of such limitations, there are risks that material misstatements due to error or
31
fraud may not be prevented or detected, and that information may not be reported on a timely basis. The failure of our controls to be effective could materially and adversely affect our business, financial condition and results of operations, including the market for our common stock, and could subject us to regulatory scrutiny and penalties.
We have identified material weaknesses in internal control over financial reporting for which remediation is still in process as of December 31, 2017. Certain of these material weaknesses involved the design of controls and failure of controls to operate effectively, resulting in misstatements in our publicly filed financial statements. As a result, we restated the audited consolidated financial statements in our Annual Report on Form 10-K for the year ended December 31, 2015 and the unaudited financial statements included in certain of our previously filed Quarterly Reports on Form 10-Q. As of the filing of this Annual Report on Form 10-K, our management has completed the implementation of remediation efforts related to six of the nine previously identified material weakness and considers them remediated. In addition, the Company is currently working to remediate the remaining three material weaknesses.
If we are unable to effectively remediate and adequately manage our internal controls over financial reporting in the future, we may be unable to produce accurate or timely financial information. As a result, we may be unable to meet our ongoing reporting obligations or comply with applicable legal requirements, which could lead to the imposition of sanctions or further investigation by regulatory authorities. Any such action or other negative results caused by our inability to meet our reporting requirements or comply with legal and regulatory requirements could lead investors and other users to lose confidence in our financial data and could adversely affect our business and the trading price of our common stock. Significant deficiencies or material weaknesses in our internal controls over financial reporting could also reduce our ability to obtain financing or could increase the cost of any financing we obtain.
Failure to timely satisfy obligations associated with being a public company may have adverse regulatory, economic and reputational consequences.
As a public company, we are required to prepare and file periodic reports containing our consolidated financial statements with the SEC, prepare and distribute other stockholder communications in compliance with our obligations under the federal securities laws and applicable stock exchange rules, evaluate and maintain our system of internal control over financial reporting, and report on management’s assessment thereof, in compliance with the requirements of Section 404 of the Sarbanes-Oxley Act and the related rules and regulations of the SEC and the Public Company Accounting Oversight Board (PCAOB); involve and retain outside legal counsel and accountants in connection with the activities listed above; maintain an investor relations function; and maintain internal policies, including those relating to disclosure controls and procedures.
We have previously failed to file our periodic reports timely with the SEC, including our Annual Report on Form 10-K for the fiscal year ended December 31, 2015 and our Quarterly Report on Form 10-Q for the period ended June 30, 2016, which resulted in a twelve-month suspension of our eligibility to use Form S-3 registration statements. Failure to file our periodic reports timely with the SEC or to otherwise comply with our obligations associated with being a public company may result in similar or other more significant adverse regulatory, economic and reputational consequences.
Risks Related to our Common Stock
So long as SHUSA controls us, our other stockholders will have limited ability to influence matters requiring stockholder approval, and Santander’s interest may conflict with the interests of our other stockholders.
As discussed above, Santander, through SHUSA, has significant influence over us, including control over decisions that require the approval of stockholders, which could limit your ability to influence the outcome of key transactions, including a change of control.
SHUSA owns approximately 68.1% of our common stock and, accordingly, has significant influence over us, including and pursuant to the terms of a shareholders agreement that was entered into among us and certain of our shareholders, including SHUSA (the Shareholders Agreement). Pursuant to the Shareholders Agreement, SHUSA has the right to nominate a majority of our directors so long as minimum share ownership thresholds are maintained. The CEO of SHUSA is also our CEO. Further, because SHUSA owns a majority of our common stock, it has the power to elect our entire Board. Through our Board, and through functional reporting lines of SHUSA and SC management, SHUSA controls our policies and operations, including, among other things, the appointment of management, future issuances of our common stock or other securities, the payment of dividends, if any, on our common stock, the incurrence of debt by us and the entry into extraordinary transactions. Additionally, SHUSA may elect not to permit us to undertake certain actions or activities if SHUSA were to determine that such actions or activities could or would be viewed negatively by the FRBB or other regulators.
32
In addition, the Shareholders Agreement provides the directors nominated by SHUSA with approval rights over certain specific material actions taken by us so long as minimum share ownership thresholds are maintained. These material actions include changes in material accounting policies, changes in material tax policies or positions and changes in our principal line of business.
The interests of SHUSA may conflict with the interests of our other stockholders. SHUSA’s influence and control over us may cause us to take actions that our other stockholders do not view as beneficial to them. In such circumstances, the market price of our common stock could be adversely affected. In addition, the existence of a controlling stockholder may have the effect of making it more difficult for a third party to acquire us, or may discourage a third party from seeking to acquire us.
Certain provisions of our amended and restated certificate of incorporation, and amended and restated bylaws, have anti-takeover effects, which could limit the price investors might be willing to pay in the future for our common stock. In addition, Delaware law may inhibit takeovers of us and could limit our ability to engage in certain strategic transactions our Board believes would be in the best interests of stockholders.
Certain provisions of our amended and restated certificate of incorporation, and amended and restated bylaws, could discourage unsolicited takeover proposals that stockholders might consider to be in their best interests. Among other things, our amended and restated certificate of incorporation, and amended and restated bylaws, include provisions that:
• | do not permit cumulative voting in the election of directors, which would otherwise allow less than a majority of stockholders to elect director candidates; |
• | limit the ability of our stockholders to nominate candidates for election to our Board; |
• | authorize the issuance of “blank check” preferred stock without any need for action by stockholders; |
• | limit the ability of stockholders to call special meetings of stockholders or to act by written consent in lieu of a meeting; and |
• | establish advance notice requirements for nominations for election to our Board or for proposing matters that may be acted on by stockholders at stockholder meetings. |
The foregoing factors, as well as the significant common stock ownership by SHUSA, could impede a merger, takeover, or other business combination, or discourage a potential investor from making a tender offer for our common stock, which, under certain circumstances, could reduce the market value of our common stock.
In addition, Section 203 of the Delaware General Corporation Law (DGCL) generally affects the ability of an “interested stockholder” to engage in certain business combinations, including mergers, consolidations, or acquisitions of additional shares, for a period of three years following the time that the stockholder becomes an “interested stockholder.” An “interested stockholder” is defined to include persons owning directly or indirectly 15% or more of the outstanding voting stock of a corporation. We elected in our amended and restated certificate of incorporation not to be subject to Section 203 of the DGCL. However, our amended and restated certificate of incorporation contains provisions that have the same effect as Section 203, except that they provide that each of SHUSA and its successors and affiliates and certain of its direct transferees are not deemed to be “interested stockholders,” and, accordingly, are not subject to such restrictions as long as it and its affiliates own at least 10% of our outstanding shares of common stock.
We are a “controlled company” within the meaning of the NYSE rules and, as a result, qualify for, and rely on, exemptions from certain corporate governance requirements. You will not have the same protections afforded to stockholders of companies that are subject to such requirements.
SHUSA owns a majority of the voting power of our outstanding common stock. As a result, we qualify as a “controlled company” within the meaning of the NYSE corporate governance standards. As a controlled company, we have elected to be exempt from certain NYSE corporate governance requirements, including the requirements:
• | that a majority of our Board consist of independent directors; |
• | that our executive committee (which has the responsibilities under its charter of a nominating and governance committee) be composed entirely of independent directors; and |
• | that we have a compensation committee composed entirely of independent directors. |
We have not elected to be exempt from certain other NYSE corporate governance requirements, including the requirement that we have a compensation committee with a written charter addressing the committee's purpose and responsibilities. If we elect to be exempt from this or other NYSE corporate governance requirements, which we have done at times, our stockholders would not have the same protections afforded to stockholders of companies that are subject to these NYSE corporate governance requirements.
33
ITEM 1B. | UNRESOLVED STAFF COMMENTS |
The Company currently has the following open comment letters from the Division of Corporation Finance of the SEC;
1. | Comment letter on Form 10-K for the fiscal year ended December 31, 2014, as filed on March 2, 2015, and Form 10-Q for the quarter ended September 30, 2015, as filed on October 29, 2015, with respect to estimating its credit loss allowance, including the removal of seasonality and the increase in TDR impairment during the quarterly period ended September 30, 2015, as well as certain TDR disclosures in such filings. |
2. | Comment letter on Form 10-K for the fiscal year ended December 31, 2016, as filed on February 28, 2017 and Form 10-Q for the quarter ended June 30, 2017, as filed on August 2, 2017, with respect to certain clarifications in our disclosures in the filings. |
ITEM 2. | PROPERTIES |
The Company's corporate headquarter is located in Dallas, Texas, where it leases approximately 373,000 square feet of office and operations space pursuant to a lease agreement expiring in 2026. The Company also leases a total of 482,000 square feet servicing facilities and operations space which includes;
▪ | a 200,000 square foot servicing facility in North Richland Hills, Texas, |
▪ | a 117,000 square foot servicing facility in Mesa, Arizona, |
▪ | a 73,000 square foot servicing facility in Lewisville, Texas, |
▪ | a 43,000 and an adjacent 21,000 square foot servicing facility in Englewood, Colorado, |
▪ | a 21,000 square foot servicing facility in San Juan, Puerto Rico, |
▪ | a 1,000 square foot operation in Richardson, Texas, |
▪ | a 3,000 square foot operations facility in Denton, Texas, |
▪ | a 2,000 square foot operations facility in Costa Mesa, California, and |
▪ | a 1,000 square foot operations facility in Aurora, Colorado. |
These leases expire at various dates through 2027. Management believes the terms of the leases are consistent with market standards. For additional information regarding the Company’s properties refer to Note 11— "Commitments and Contingencies" in the Notes to Consolidated Financial Statements.
ITEM 3. | LEGAL PROCEEDINGS |
Reference should be made to Note 11 to the Consolidated Financial Statements of the Company's 2017 Annual Report on Form 10-K for information regarding legal proceedings in which the Company is involved.
ITEM 4. | MINE SAFETY DISCLOSURES |
Not applicable.
34
PART II
ITEM 5. | MARKET FOR THE REGISTRANT’S COMMON EQUITY, RELATED STOCKHOLDER MATTERS AND ISSUER PURCHASES OF EQUITY SECURITIES |
The Company’s common stock is traded on the NYSE (under the symbol SC). The approximate number of record holders of the Company’s common stock as of February 15, 2018 was 9, although the Company estimates the number of beneficial stockholders to be much higher as many of its shares are held by brokers or dealers for their customers in street name.
The following table sets forth the high and low closing per share sales prices for the Company's common stock, and the cash dividends declared on common stock:
High | Low | Cash dividends paid | |
Year Ended December 31, 2016 | |||
First Quarter | $15.79 | $8.87 | — |
Second Quarter | $13.41 | $9.69 | — |
Third Quarter | $12.58 | $9.90 | — |
Fourth Quarter | $14.84 | $10.93 | — |
Year Ended December 31, 2017 | |||
First Quarter | $14.97 | $12.88 | — |
Second Quarter | $13.34 | $11.17 | — |
Third Quarter | $15.37 | $12.69 | — |
Fourth Quarter | $18.62 | $15.07 | $0.03 |
Dividends
In June 2017, SHUSA announced that the FRBB did not object to the planned capital actions described in SHUSA’s 2017 Capital Plan that was submitted as part of its annual CCAR submissions. Included in SHUSA’s capital actions were proposed dividend payments for the Company’s stockholders. As a result, we made a dividend payment in 2017 and in February 2018 and, subject to Board approval, plan to pay a further dividend in the second quarter of 2018.
35
Company Stock Performance
The following graph shows a comparison of cumulative stockholder return, calculated on a dividend reinvested basis, for the Company, the S&P 500 index, and the S&P 500 Financials index for the period from the Company's IPO date (January 23, 2014) through December 31, 2017. The graph assumes $100 was invested in each of the Company's common stock, the S&P 500 index, and the S&P 500 Financials index as of market close on January 23, 2014. Historical stock prices are not necessarily indicative of future stock price performance.
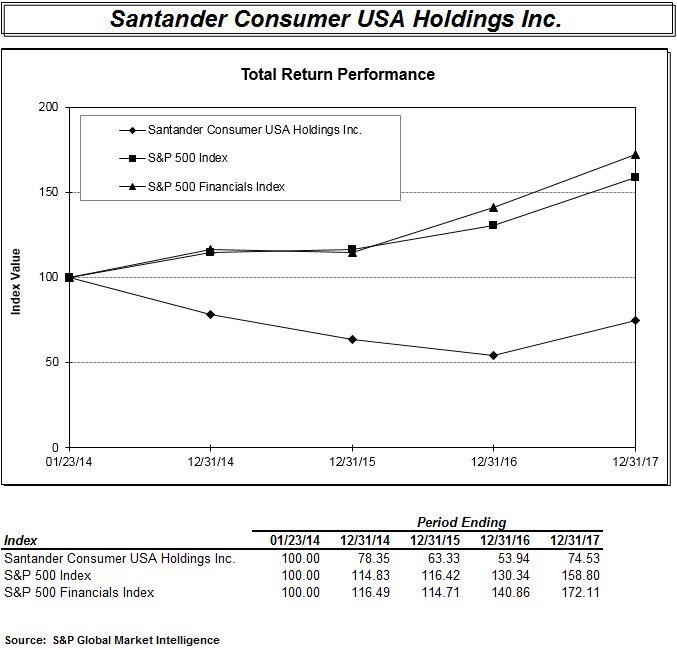
Equity Compensation Plan Information
The Company has an Omnibus Incentive Plan, which enables it to grant awards of non-qualified and incentive stock options, stock appreciation rights, restricted stock awards, restricted stock units and other awards that may be settled in or based upon the value of 5,192,641 shares of its common stock. At December 31, 2017, an aggregate of 2,976,545 shares were available for future awards under this plan.
36
The Company also manages its 2011 Management Equity Plan, under which eligible employees and directors were previously granted non-qualified stock options to purchase its common stock. Currently, no shares are available for issuance under this plan and, therefore, no future awards will be made under this plan.
Recent Sales of Unregistered Securities
None.
Issuer Purchases of Equity Securities
None.
37
ITEM 6. | SELECTED FINANCIAL DATA |
Year Ended December 31, | |||||||||||||||||||
2017 | 2016 | 2015 | 2014 | 2013 | |||||||||||||||
(Dollar amounts in thousands, except per share data) | |||||||||||||||||||
Income Statement Data | |||||||||||||||||||
Interest on individually acquired retail installment contracts | $ | 4,374,874 | $ | 4,615,459 | $ | 4,483,054 | $ | 3,941,170 | $ | 3,158,636 | |||||||||
Interest on purchased receivables portfolios | 30,129 | 69,701 | 91,157 | 199,151 | 409,895 | ||||||||||||||
Interest on receivables from dealers | 2,802 | 3,718 | 4,537 | 4,814 | 6,663 | ||||||||||||||
Interest on personal loans | 347,873 | 337,912 | 453,081 | 348,278 | 128,351 | ||||||||||||||
Interest on finance receivables and loans | 4,755,678 | 5,026,790 | 5,031,829 | 4,493,413 | 3,703,545 | ||||||||||||||
Net leased vehicle income | 489,944 | 492,212 | 311,373 | 175,340 | 33,377 | ||||||||||||||
Other finance and interest income | 19,885 | 15,135 | 18,162 | 8,068 | 6,010 | ||||||||||||||
Interest expense | 947,734 | 807,484 | 628,791 | 523,203 | 408,787 | ||||||||||||||
Net finance and other interest income | 4,317,773 | 4,726,653 | 4,732,573 | 4,153,618 | 3,334,145 | ||||||||||||||
Provision for credit losses on individually acquired retail installment contracts | 2,244,182 | 2,471,490 | 2,433,617 | 2,101,744 | 1,506,107 | ||||||||||||||
Increase (decrease) in impairment related to purchased receivables portfolios | — | (2,985 | ) | (13,818 | ) | (24,082 | ) | 13,964 | |||||||||||
Provision for credit losses on receivables from dealers | (560 | ) | 201 | 242 | (416 | ) | 1,090 | ||||||||||||
Provision for credit losses on personal loans | 10,691 | — | 324,634 | 434,030 | 192,745 | ||||||||||||||
Provision for credit losses on capital leases | 48 | (506 | ) | 41,196 | 9,991 | — | |||||||||||||
Provision for credit losses | 2,254,361 | 2,468,200 | 2,785,871 | 2,521,267 | 1,713,906 | ||||||||||||||
Profit sharing | 29,568 | 47,816 | 57,484 | 74,925 | 78,246 | ||||||||||||||
Other income | 101,106 | 93,546 | 421,643 | 559,902 | 312,578 | ||||||||||||||
Operating expenses | 1,311,436 | 1,143,472 | 1,021,249 | 996,193 | 706,264 | ||||||||||||||
Income before tax expense | 823,514 | 1,160,711 | 1,289,612 | 1,121,135 | 1,148,307 | ||||||||||||||
Income tax (benefit) / expense (a) | (364,092 | ) | 394,245 | 465,572 | 395,851 | 427,142 | |||||||||||||
Net income | 1,187,606 | 766,466 | 824,040 | 725,284 | 721,165 | ||||||||||||||
Noncontrolling interests | — | — | — | — | 1,821 | ||||||||||||||
Net income attributable to Santander Consumer USA Holdings Inc. shareholders | $ | 1,187,606 | $ | 766,466 | $ | 824,040 | $ | 725,284 | $ | 722,986 | |||||||||
Share Data | |||||||||||||||||||
Weighted-average common shares outstanding | |||||||||||||||||||
Basic | 359,613,714 | 358,280,814 | 355,102,742 | 348,723,472 | 346,177,515 | ||||||||||||||
Diluted | 360,292,330 | 359,078,337 | 356,163,076 | 355,722,363 | 346,177,515 | ||||||||||||||
Earnings per share | |||||||||||||||||||
Basic | $ | 3.30 | $ | 2.14 | $ | 2.32 | $ | 2.08 | $ | 2.09 | |||||||||
Diluted | $ | 3.30 | $ | 2.13 | $ | 2.31 | $ | 2.04 | $ | 2.09 | |||||||||
Dividend paid per share | $ | 0.03 | $ | — | $ | — | $ | 0.15 | $ | 0.84 | |||||||||
Balance Sheet Data | |||||||||||||||||||
Finance receivables held for investment, net | $ | 22,427,769 | $ | 23,481,001 | $ | 23,367,788 | $ | 23,911,649 | $ | 21,347,861 | |||||||||
Finance receivables held for sale, net | 2,210,421 | 2,123,415 | 2,859,575 | 46,586 | 81,956 | ||||||||||||||
Goodwill and intangible assets | 103,790 | 106,679 | 107,072 | 110,938 | 128,720 | ||||||||||||||
Total assets | 39,422,304 | 38,539,104 | 36,448,958 | 32,368,751 | 26,470,569 | ||||||||||||||
Total borrowings | 31,160,434 | 31,323,706 | 30,375,679 | 27,811,301 | 23,295,660 | ||||||||||||||
Total liabilities | 32,941,803 | 33,300,485 | 32,016,409 | 28,842,535 | 23,774,805 | ||||||||||||||
Total equity | 6,480,501 | 5,238,619 | 4,432,549 | 3,526,216 | 2,695,764 | ||||||||||||||
Allowance for credit losses | 3,269,506 | 3,421,767 | 3,218,208 | 2,945,608 | 2,129,488 | ||||||||||||||
(a) Refer to Note 10 "Income Tax" in Item 8, for discussion around significant change in Income tax (benefit) / expense
38
Year Ended December 31, | |||||||||||||||||||
2017 | 2016 | 2015 | 2014 | 2013 | |||||||||||||||
(Dollar amounts in thousands) | |||||||||||||||||||
Other Information | |||||||||||||||||||
Charge-offs, net of recoveries, on individually acquired retail installment contracts | $ | 2,394,102 | $ | 2,257,849 | $ | 1,795,771 | $ | 1,464,107 | $ | 985,093 | |||||||||
Charge-offs, net of recoveries, on purchased receivables portfolios | 2,055 | (17 | ) | (2,720 | ) | 59,657 | 178,932 | ||||||||||||
Charge-offs, net of recoveries, on receivables from dealers | — | 393 | — | — | — | ||||||||||||||
Charge-offs, net of recoveries, on personal loans | 8,126 | — | 673,294 | 264,720 | 13,395 | ||||||||||||||
Charge-offs, net of recoveries, on capital leases | 4,394 | 9,384 | 30,907 | 402 | — | ||||||||||||||
Total charge-offs, net of recoveries | 2,408,677 | 2,267,609 | 2,497,252 | 1,788,886 | 1,177,420 | ||||||||||||||
End of period delinquent principal over 60 days, individually acquired retail installment contracts held for investment | 1,404,620 | 1,386,218 | 1,191,567 | 1,030,580 | 855,315 | ||||||||||||||
End of period personal loans delinquent principal over 60 days | 175,659 | 176,873 | 168,906 | 138,400 | 65,360 | ||||||||||||||
End of period delinquent principal over 60 days, loans held for investment | 1,407,456 | 1,392.789 | 1,377,770 | 1,241,453 | 1,102,373 | ||||||||||||||
End of period assets covered by allowance for credit losses | 25,988,819 | 27,229,276 | 27,007,816 | 26,875,389 | 22,499,895 | ||||||||||||||
End of period gross individually acquired retail installment contracts held for investment | 25,943,288 | 27,127,973 | 26,863,946 | 24,555,106 | 21,238,281 | ||||||||||||||
End of period gross personal loans | 1,524,158 | 1,558,790 | 2,445,200 | 2,128,769 | 1,165,778 | ||||||||||||||
End of period gross finance receivables and loans held for investment | 26,009,206 | 27,427,578 | 27,368,579 | 27,721,744 | 24,542,911 | ||||||||||||||
End of period gross finance receivables, loans, and leases held for investment | 37,207,665 | 37,040,531 | 34,694,875 | 33,212,021 | 26,731,899 | ||||||||||||||
Average gross individually acquired retail installment contracts held for investment | 26,754,780 | 27,253,756 | 25,949,907 | 23,316,349 | 18,022,825 | ||||||||||||||
Average gross personal loans held for investment | 12,476 | 9,995 | 1,518,473 | 1,505,387 | 425,229 | ||||||||||||||
Average gross individually acquired retail installment contracts | 27,926,229 | 28,652,897 | 26,818,625 | 23,556,137 | 18,097,082 | ||||||||||||||
Average gross purchased receivables portfolios | 146,362 | 286,354 | 562,512 | 1,321,281 | 3,041,992 | ||||||||||||||
Average Gross receivables from dealers | 52,435 | 71,997 | 89,867 | 118,358 | 173,506 | ||||||||||||||
Average Gross personal loans | 1,419,417 | 1,413,440 | 2,229,080 | 1,505,387 | 425,229 | ||||||||||||||
Average Gross capital leases | 25,495 | 45,949 | 114,605 | 30,648 | — | ||||||||||||||
Average Gross finance receivables and loans | 29,569,938 | 30,470,637 | 29,814,689 | 26,531,811 | 21,737,809 | ||||||||||||||
Average Gross finance receivables, loans, and leases | 40,026,059 | 39,289,341 | 36,140,498 | 30,638,797 | 22,499,225 | ||||||||||||||
Average managed assets | 50,110,765 | 52,731,119 | 48,919,418 | 38,296,610 | 25,493,890 | ||||||||||||||
Average total assets | 39,163,887 | 37,944,529 | 35,050,503 | 29,827,722 | 22,561,866 | ||||||||||||||
Average debt | 31,385,153 | 31,330,686 | 29,699,885 | 26,158,708 | 19,675,851 | ||||||||||||||
Average total equity | 5,663,469 | 4,850,653 | 4,096,042 | 3,111,628 | 2,498,244 | ||||||||||||||
Ratios | |||||||||||||||||||
Yield on individually acquired retail installment contracts | 15.7 | % | 16.1 | % | 16.7 | % | 16.7 | % | 17.5 | % | |||||||||
Yield on purchased receivables portfolios | 20.6 | % | 24.3 | % | 16.2 | % | 15.1 | % | 13.5 | % | |||||||||
Yield on receivables from dealers | 5.3 | % | 5.2 | % | 5.0 | % | 4.1 | % | 3.8 | % | |||||||||
Yield on personal loans (1) | 24.5 | % | 23.9 | % | 20.3 | % | 23.1 | % | 30.2 | % | |||||||||
Yield on earning assets (2) | 13.2 | % | 14.1 | % | 14.8 | % | 15.3 | % | 16.6 | % | |||||||||
Cost of debt (3) | 3.0 | % | 2.6 | % | 2.1 | % | 2.0 | % | 2.1 | % | |||||||||
Net interest margin (4) | 10.8 | % | 12.0 | % | 13.1 | % | 13.6 | % | 14.8 | % | |||||||||
Expense ratio (5) | 2.6 | % | 2.2 | % | 2.1 | % | 2.6 | % | 2.8 | % | |||||||||
Return on average assets (6) | 3.0 | % | 2.0 | % | 2.4 | % | 2.4 | % | 3.2 | % | |||||||||
Return on average equity (7) | 21.0 | % | 15.8 | % | 20.1 | % | 23.3 | % | 28.9 | % | |||||||||
Net charge-off ratio on individually acquired retail installment contracts (8) | 8.9 | % | 8.3 | % | 6.9 | % | 6.3 | % | 5.5 | % | |||||||||
Net charge-off ratio on purchased receivables portfolios (8) | 1.4 | % | — | (0.5 | )% | 4.5 | % | 5.9 | % | ||||||||||
Net charge-off ratio on receivables from dealers (8) | — | 0.5 | % | — | — | — | |||||||||||||
Net charge-off ratio on personal loans (8) | 0.6 | % | — | 40.8 | % | 17.6 | % | 3.2 | % | ||||||||||
Net charge-off ratio (8) | 8.9 | % | 8.2 | % | 8.8 | % | 6.8 | % | 5.4 | % | |||||||||
Delinquency ratio on individually acquired retail installment contracts held for investment, end of period (9) | 5.4 | % | 5.1 | % | 4.4 | % | 4.2 | % | 4.0 | % | |||||||||
Delinquency ratio on personal loans, end of period (9) | 11.5 | % | 11.3 | % | 6.9 | % | 6.5 | % | 5.6 | % | |||||||||
Delinquency ratio on loans held for investment, end of period (9) | 5.4 | % | 5.1 | % | 4.6 | % | 4.5 | % | 4.5 | % | |||||||||
Equity to assets ratio (10) | 16.4 | % | 13.6 | % | 12.2 | % | 10.9 | % | 10.2 | % | |||||||||
Tangible common equity to tangible assets (10) | 16.2 | % | 13.4 | % | 11.9 | % | 10.6 | % | 9.7 | % | |||||||||
Common stock dividend payout ratio (11) | 0.9 | % | — | — | 7.2 | % | 40.2 | % | |||||||||||
Allowance ratio (12) | 12.6 | % | 12.6 | % | 11.9 | % | 11.0 | % | 9.5 | % | |||||||||
Common Equity Tier 1 capital ratio (13) | 16.3 | % | 13.4 | % | 11.2 | % | n/a | n/a | |||||||||||
(1) | Includes finance and other interest income; excludes fees. |
(2) | “Yield on earning assets” is defined as the ratio of Total finance and other interest income, net of Leased vehicle expense, to Average gross finance receivables, loans and leases. |
(3) | “Cost of debt” is defined as the ratio of Interest expense to Average debt. |
(4) | “Net interest margin” is defined as the ratio of Net finance and other interest income to Average gross finance receivables, loans and leases. |
(5) | "Expense ratio" is defined as the ratio of Operating expenses to Average managed assets. |
(6) | “Return on average assets” is defined as the ratio of Net income to Average total assets. |
(7) | “Return on average equity” is defined as the ratio of Net income to Average total equity. |
39
(8) | “Net charge-off ratio” is defined as the ratio of annualized Charge-offs on a recorded investment basis, net of recoveries, to average unpaid principal balance of the respective held-for-investment portfolio. Effective as of September 30, 2016, the Company records the charge-off activity for certain |
personal loans within the provision for credit losses due to the reclassification of these loans from held for sale to held for investment.
Effective as of September 30, 2015, changes in the value of the personal lending portfolio driven by customer default activity are classified in net investment gains (losses) due to the classification of the portfolio as held for sale. As there was accordingly no charge-off activity on personal loans for the three months ended December 31, 2015, the annualized charge-off rate on personal loans reported as of September 30, 2015, has been used as the full-year charge-off rate. The average gross balance of personal loans used in the full-year charge-off rate was $2,201,551. Additionally, the denominator of the aggregate Net charge-off ratios for the twelve months ended December 31, 2015, has been adjusted to $29,279,874, to exclude personal lending balances for the three months ended December 31, 2015. During the year ended December 31, 2015, the Company recorded non-recurring impairment charges on finance receivables held for sale and on finance receivables sold during the period. The associated impairment was recorded through charge-off expense. The charge-off ratios for the year ended December 31, 2015, adjusted for these non-recurring impairments, are presented in the table below:
Retail Installment Contracts Acquired Individually | Purchased Receivables | Personal Loans | Capital Lease | Receivables from Dealers Held for Investment | Total | ||||||||||||||||||
Charge-offs, net of recoveries | $ | 1,795,771 | $ | (2,720 | ) | $ | 673,294 | $ | 30,907 | $ | — | $ | 2,497,252 | ||||||||||
Less: Lower of cost or market adjustment upon transfer to held for sale | 73,388 | — | 377,598 | — | — | 450,986 | |||||||||||||||||
Adjusted charge-offs net of recoveries | $ | 1,722,383 | $ | (2,720 | ) | $ | 295,696 | $ | 30,907 | $ | — | $ | 2,046,266 | ||||||||||
Average gross balance | $ | 26,818,625 | $ | 562,512 | $ | 2,201,551 | $ | 114,605 | $ | 89,867 | $ | 29,279,874 | |||||||||||
Adjusted charge-off ratio | 6.4 | % | (0.5 | )% | 17.9 | % | 27.0 | % | — | 7.0 | % | ||||||||||||
(9) | “Delinquency ratio” is defined as the ratio of End of period Delinquent principal over 60 days to End of period Gross balance of the respective portfolio, excluding capital leases. |
(10) | "Tangible common equity to tangible assets” is defined as the ratio of Total equity, excluding Goodwill and intangible assets, to Total assets, excluding Goodwill and intangible assets. Management believes this non-GAAP financial measure is useful to assess and monitor the adequacy of the Company's capitalization. This additional information is not meant to be considered in isolation or as a substitute for the numbers prepared in accordance with U.S. GAAP and may not be comparable to similarly-titled measures used by other financial institutions. A reconciliation from GAAP to this non-GAAP measure is as follows: |
Year Ended December 31, | |||||||||||||||||||
2017 | 2016 | 2015 | 2014 | 2013 | |||||||||||||||
(Dollar amounts in thousands) | |||||||||||||||||||
Total equity | $ | 6,480,501 | $ | 5,238,619 | $ | 4,432,549 | $ | 3,526,216 | $ | 2,695,764 | |||||||||
Deduct: Goodwill and intangibles | 103,790 | 106,679 | 107,072 | 110,938 | 128,720 | ||||||||||||||
Tangible common equity | $ | 6,376,711 | $ | 5,131,940 | $ | 4,325,477 | $ | 3,415,278 | $ | 2,567,044 | |||||||||
Total assets | $ | 39,422,304 | $ | 38,539,104 | $ | 36,448,958 | $ | 32,368,751 | $ | 26,470,569 | |||||||||
Deduct: Goodwill and intangibles | 103,790 | 106,679 | 107,072 | 110,938 | 128,720 | ||||||||||||||
Tangible assets | $ | 39,318,514 | $ | 38,432,425 | $ | 36,341,886 | $ | 32,257,813 | $ | 26,341,849 | |||||||||
Equity to assets ratio | 16.4 | % | 13.6 | % | 12.2 | % | 10.9 | % | 10.2 | % | |||||||||
Tangible common equity to tangible assets | 16.2 | % | 13.4 | % | 11.9 | % | 10.6 | % | 9.7 | % | |||||||||
(11) | “Common stock dividend payout ratio” is defined as the ratio of Dividends declared per share of common stock to Earnings per share attributable to the Company's shareholders. |
(12) | “Allowance ratio” is defined as the ratio of Allowance for credit losses, which excludes impairment on purchased receivables portfolios, to End of period assets covered by allowance for credit losses. |
(13) | "Common Equity Tier 1 Capital ratio" is defined as the ratio of Total Common Equity Tier 1 Capital (CET1) to Total risk-weighted assets. |
Year ended December 31, | |||||||||||
2017 | 2016 | 2015 | |||||||||
(Dollar amounts in thousands) | |||||||||||
Total equity | $ | 6,480,501 | $ | 5,238,619 | $ | 4,432,549 | |||||
Deduct: Goodwill and other intangible assets, net of deferred tax liabilities | 172,664 | 186,930 | 201,492 | ||||||||
Deduct: Accumulated other comprehensive income, net | 44,262 | 28,259 | 2,125 | ||||||||
Tier 1 common capital | $ | 6,263,575 | $ | 5,023,430 | $ | 4,228,932 | |||||
Risk weighted assets (a) | $ | 38,473,339 | $ | 37,432,700 | $ | 37,628,938 | |||||
Common Equity Tier 1 capital ratio (b) | 16.3 | % | 13.4 | % | 11.2 | % | |||||
(a) | Under the banking agencies' risk-based capital guidelines, assets and credit equivalent amounts of derivatives and off-balance sheet exposures are assigned to broad risk categories. The aggregate dollar amount in each risk category is multiplied by the associated risk weight of the category. The resulting weighted values are added together with the measure for market risk, resulting in the Company's total Risk weighted assets. |
(b) | CET1 is calculated under Basel III regulations required as of January 1, 2015. The fully phased-in capital ratios are non-GAAP financial measures. |
40
The following tables present an analysis of net yield on interest earning assets:
Year Ended December 31, | |||||||||||||||||||||
2017 | 2016 | ||||||||||||||||||||
(Dollar amounts in thousands) | |||||||||||||||||||||
Average Balances | Interest Income/Interest Expense | Yield/Rate | Average Balances | Interest Income/Interest Expense | Yield/Rate | ||||||||||||||||
Assets | |||||||||||||||||||||
Retail installment contracts acquired individually | $ | 27,926,229 | $ | 4,374,874 | 15.7 | % | $ | 28,652,897 | $ | 4,615,459 | 16.1 | % | |||||||||
Purchased receivables | 146,362 | 30,129 | 20.6 | % | 286,354 | 69,701 | 24.3 | % | |||||||||||||
Receivables from dealers | 52,435 | 2,802 | 5.3 | % | 71,997 | 3,718 | 5.2 | % | |||||||||||||
Personal loans | 1,419,417 | 347,873 | 24.5 | % | 1,413,440 | 337,912 | 23.9 | % | |||||||||||||
Capital lease receivables | 25,495 | 3,912 | 15.3 | % | 45,949 | 9,130 | 19.9 | % | |||||||||||||
Finance receivables held for investment, net | 29,569,938 | 4,759,590 | 16.1 | % | 30,470,637 | 5,035,920 | 16.5 | % | |||||||||||||
Leased vehicles, net | 10,456,121 | 489,944 | 4.7 | % | 8,818,704 | 492,212 | 5.6 | % | |||||||||||||
Other assets | 2,665,573 | 15,973 | 0.6 | 2,118,235 | 6,005 | 0.3 | % | ||||||||||||||
Allowance for credit losses | (3,527,746 | ) | — | — | % | (3,463,047 | ) | — | — | % | |||||||||||
Total assets | $ | 39,163,887 | $ | 5,265,507 | $ | 37,944,529 | $ | 5,534,137 | |||||||||||||
Liabilities and equity | |||||||||||||||||||||
Liabilities: | |||||||||||||||||||||
Notes payable | $ | 31,385,153 | $ | 947,734 | 3.0 | % | $ | 31,330,686 | $ | 807,484 | 2.6 | % | |||||||||
Other liabilities | 2,115,265 | — | — | % | 1,763,190 | — | — | % | |||||||||||||
Total liabilities | 33,500,418 | 947,734 | 33,093,876 | 807,484 | |||||||||||||||||
Total stockholders' equity | 5,663,469 | — | 4,850,653 | — | |||||||||||||||||
Total liabilities and equity | $ | 39,163,887 | $ | 947,734 | $ | 37,944,529 | $ | 807,484 | |||||||||||||
41
ITEM 7. | MANAGEMENT'S DISCUSSION AND ANALYSIS OF FINANCIAL CONDITION AND RESULTS OF OPERATIONS |
Background and Overview
Santander Consumer USA Holdings Inc. is the holding company for Santander Consumer USA Inc., a specialized consumer finance company focused on vehicle finance, third-party servicing and delivering superior service to our more than 2.6 million customers across the full credit spectrum. The Company is majority-owned (as of December 31, 2017, approximately 68.1%) by SHUSA, a wholly-owned subsidiary of Santander.
The Company is managed through a single reporting segment, Consumer Finance, which includes its vehicle financial products and services, including retail installment contracts, vehicle leases, and dealer loans, as well as financial products and services related to motorcycles, RVs, and marine vehicles. The Consumer Finance segment also includes its personal loan and point-of-sale financing operations.
Since May 1, 2013, under terms of the Chrysler Agreement, a ten-year private-label financing agreement with FCA, the Company has been FCA's preferred provider for consumer loans and leases and dealer loans. Business generated under terms of the Chrysler Agreement is branded as Chrysler Capital. In conjunction with the Chrysler Agreement, SC offers a full spectrum of auto financing products and services to FCA customers and dealers under the Chrysler Capital brand. These products and services include consumer retail installment contracts and leases, as well as dealer loans for inventory, construction, real estate, working capital and revolving lines of credit.
Under the terms of the Chrysler Agreement, certain standards were agreed to, including SC meeting specified escalating penetration rates for the first five years, and FCA treating SC in a manner consistent with comparable OEMs' treatment of their captive providers, primarily in regard to sales support. The failure of either party to meet its respective obligations under the agreement, including SC’s failure to meet target penetration rates, could result in the agreement being terminated. The targeted penetration rates and the actual penetration rates that the Company must meet under the terms of the Chrysler Agreement are as follows as of December 31, 2017.
Program Year (a) | |||||
1 | 2 | 3 | 4 | 5 | |
Retail | 20% | 30% | 40% | 50% | 50% |
Lease | 11% | 14% | 14% | 14% | 15% |
Total | 31% | 44% | 54% | 64% | 65% |
Actual Penetration (b) | 30% | 29% | 26% | 19% | 18% |
(a) | Each Program Year runs from May 1 to April 30. Retail and lease penetration is based on a percentage of FCA retail sales. |
(b) | Actual penetration rates shown for Program Year 1, 2, 3 and 4 are as of April 30, 2014, 2015, 2016 and 2017, respectively, the end date of each of those Program Years. Actual penetration rate shown for Program Year 5, which ends April 30, 2018, is as of December 31, 2017. |
The target penetration rate as of April 30, 2018 is 65%. The Company's actual penetration rate as of December 31, 2017 was 18%, an increase from 17% as of December 31, 2016. The Company's penetration rate has been constrained due to a more competitive landscape and low interest rates, causing its subvented loan offers not to be materially more attractive than other lenders' offers. While the Company has not achieved the targeted penetration rates to date, Chrysler Capital continues to be a focal point of its strategy, the Company continues to work with FCA to improve penetration rates, and it remains committed to the Chrysler Agreement.
The Company has worked strategically and collaboratively with FCA to continue to strengthen its relationship and create value within the Chrysler Capital program. The Company has partnered with FCA to roll out two new pilot programs, including a dealer rewards program and a nonprime subvention program. During the year ended December 31, 2017, the Company originated more than $6.7 billion in Chrysler Capital loans which represents approximately 50% of total retail installment contract originations, with an approximately even share between prime and non-prime, as well as more than $6.0 billion in Chrysler Capital leases. Additionally, substantially all of the leases originated by the Company during the year ended December 31, 2017 were made under the Chrysler Capital Agreement. Since its May 1, 2013 launch, Chrysler Capital has originated more than $45.2 billion in retail loans and $23.6 billion in leases, and facilitated the origination of $3.0 billion in leases and dealer loans for an affiliate. As of December 31, 2017, the Company's auto retail installment contract portfolio consisted of $8.2 billion of Chrysler Capital loans, which represents 37% of the Company's auto retail installment contract portfolio.
The Company also originates vehicle loans through a web-based direct lending program, purchases vehicle retail installment contracts from other lenders, and services automobile and recreational and marine vehicle portfolios for other lenders.
42
Additionally, the Company has several relationships through which it has provided personal loans, private-label credit cards and other consumer finance products. In October 2015, the Company announced a planned exit from the personal lending business.
The Company has dedicated financing facilities in place for its Chrysler Capital business. The Company periodically sells consumer retail installment contracts through flow agreements and, when market conditions are favorable, it accesses the ABS market through securitizations of consumer retail installment contracts. The Company also periodically enters into bulk sales of consumer vehicle leases with a third party. The Company typically retains servicing of loans and leases sold or securitized, and may also retain some residual risk in sales of leases. The Company has also entered into an agreement with the buyer of its leases whereby the Company will periodically sell charged-off loans.
Economic and Business Environment
The U.S. economy continues to stabilize. Unemployment rates declined to pre-recession levels of 4.1% as reported by the Bureau of Labor Statistics for December 31, 2017. The Federal Reserve raised its federal funds rate by 75 basis points, to 125 - 150 basis during 2017, with the last rate increase of 25 basis points in December 2017.
Despite this stability, consumer debt levels continued to rise, specifically auto debt. As consumers assume higher debt levels, the Company may experience an increase in delinquencies and credit losses. Additionally, the Company is exposed to geographic customer concentration risk, which could have an adverse effect on the Company's business, financial position, results of operations or cash flow.
The following table shows the percentage of unpaid principal balance on the Company's retail installment contracts by state concentration. Total unpaid principal balance of retail installment contracts held for investment was $25,986,532 and $27,358,147 at December 31, 2017, and 2016, respectively.
December 31, 2017 | December 31, 2016 | ||||
Installment Contracts Held for Investment | |||||
Texas | 16 | % | 17 | % | |
Florida | 12 | % | 13 | % | |
California | 9 | % | 10 | % | |
Georgia | 6 | % | 5 | % | |
Illinois | 4 | % | 4 | % | |
North Carolina | 4 | % | 4 | % | |
New York | 4 | % | 4 | % | |
Pennsylvania | 3 | % | 3 | % | |
South Carolina | 3 | % | 2 | % | |
Louisiana | 3 | % | 3 | % | |
Ohio | 3 | % | 2 | % | |
Other states | 33 | % | 33 | % | |
100 | % | 100 | % | ||
43
How the Company Assesses its Business Performance
Net income, and the associated return on assets and equity, are the primary metrics by which the Company judges the performance of its business. Accordingly, the Company closely monitors the primary drivers of net income:
• | Net financing income — The Company tracks the spread between the interest and finance charge income earned on assets and the interest expense incurred on liabilities, and continually monitors the components of its yield and cost of funds. The Company's effective interest rate on borrowing is driven by various items including, but not limited to, credit quality of the collateral assigned, used/unused portion of facilities, and reference rate for the credit spread. These drivers, as well as external rate trends, including the swap curve spot and forward rates are monitored. |
• | Net credit losses — The Company performs net credit loss analysis at the vintage level for individually acquired retail installment contracts, loans and leases, and at the pool level for purchased portfolios, enabling it to pinpoint drivers of any unusual or unexpected trends. The Company also monitors its recovery rates as well as industry-wide rates. Additionally, because delinquencies are an early indicator of future net credit losses, the Company analyzes delinquency trends, adjusting for seasonality, to determine if the Company's loans are performing in line with original estimations. The net credit loss analysis does not include considerations of the Company's estimated allowance for credit losses. |
• | Other income (losses) — The Company's flow agreements entered into in connection with the Chrysler Agreement have resulted in a large portfolio of assets serviced for others. These assets provide a steady stream of servicing income and may provide a gain or loss on sale. The Company monitors the size of the portfolio and average servicing fee rate and gain. Additionally, due to the classification of the Company's personal lending portfolio as held for sale upon the decision to exit the personal lending line of business, adjustments to record this portfolio at the lower of cost or market are included in investment gains (losses), net, which is a component of other income (losses). |
• | Operating expenses — The Company assesses its operational efficiency using the cost-to-managed assets ratio. The Company performs extensive analysis to determine whether observed fluctuations in operating expense levels indicate a trend or are the nonrecurring impact of large projects. The operating expense analysis also includes a loan- and portfolio-level review of origination and servicing costs to assist the Company in assessing profitability by pool and vintage. |
Because volume and portfolio size determine the magnitude of the impact of each of the above factors on the Company's earnings, the Company also closely monitors origination and sales volume along with APR and discounts (including subvention and net of dealer participation).
44
Recent Developments and Other Factors Affecting The Company's Results of Operations
Changes to Board of Directors & Management Team
On August 28, 2017, the Company announced the departure of its President and Chief Executive Officer (CEO), Mr. Jason Kulas, effective August 27, 2017. Mr. Scott Powell was named successor and was also appointed to the Executive Committee of the Board. Both appointments were effective August 27, 2017. Mr. Mahesh Aditya was also elected to the Board to fill the vacancy created by the departure of Mr. Kulas effective August 27, 2017.
On October 2, 2017, the Company announced the departure of its Chief Financial Officer (CFO), Mr. Ismail Dawood, effective September 29, 2017. Mr. Juan Carlos Alvarez de Soto was named successor effective September 29, 2017. In addition, the Company announced that, on September 28, 2017, the Board appointed Sandra Broderick as Executive Vice President, Head of Operations of the Company, effective as of October 10, 2017. Further, the Company announced that the Board appointed Richard Morrin as President, Chrysler Capital and Auto Relationships of the Company, effective as of September 28, 2017.
On November 27, 2017, Mark Hurley submitted his resignation from the Board, effective as of November 27, 2017.
Impact from Hurricanes
During the third quarter of 2017, the Company's operations were impacted by Hurricanes Harvey and Irma. As a result of the hurricanes, the Company incurred costs to repair damaged assets and facilities, suffered losses under its contracts, and incurred costs to clean up and recover its operations. The Company has considered the impact of both Hurricanes in its allowance for credit losses recorded as of December 31, 2017.
Personal Lending
As a result of the strategic evaluation of its personal lending portfolio, in the third quarter of 2015, the Company began reviewing strategic alternatives for exiting the personal loan portfolios. On February 1, 2016, the Company completed the sale of substantially all LendingClub loans to a third-party buyer at an immaterial premium to par value. On April 14, 2017, the Company sold the remaining LendingClub portfolio to a third-party buyer.
The Company's other significant personal lending relationship is with Bluestem. The Company continues to perform in accordance with the terms and operative provisions of the agreements under which it is obligated to purchase personal revolving loans originated by Bluestem for a term ending in 2020, or 2022 if extended at Bluestem's option. This revolving loan portfolios is carried as held for sale in the Company's consolidated financial statements. Accordingly, the Company has recorded $374 million during 2017 in lower-of-cost-or market adjustments on this portfolio, and there may be further such adjustments required in future periods' financial statements. The Company is currently evaluating alternatives for the sale of the Bluestem portfolio, which had a carrying value of $1.1 billion at December 31, 2017.
Securitizations
On March 29, 2017, the Company entered into a Master Securities Purchase Agreement (MSPA) with Santander, whereby the Company has the option to sell a contractually determined amount of eligible prime loans to Santander, through the SPAIN securitization platform, for a term ending in December 2018. The Company provides servicing on all loans originated under the MSPA. For the year ended December 31, 2017, the Company sold approximately $1.2 billion of loans under the MSPA. Under a separate securities purchase agreement, the Company sold approximately $1.3 billion of prime loans to Santander for the year ended December 31, 2017. The Company provides servicing of these loans sold.
Dividends
In June 2017, SHUSA announced that the FRBB did not object to the planned capital actions described in SHUSA’s 2017 annual capital plan that was submitted as part of is CCAR submissions. Included in SHUSA’s capital actions were proposed dividend payments for the Company’s stockholders. As a result, we made a dividend payment in 2017 and in February 2018 and, subject to Board approval, plan to pay a further dividend in the second quarter of 2018.
Prior Flow Agreements
Until January 31, 2017, the Company had a flow agreement with Bank of America whereby it was committed to sell a contractually determined amount of eligible Chrysler Capital loans to Bank of America on a monthly basis, depending on the amount and credit quality of eligible current month originations and prior month sales. For loans sold, the Company retains the servicing rights at contractually agreed-upon rates. The Company also may receive or pay a servicer performance payment based on an agreed-upon formula if performance on the sold loans is better or worse, respectively, than expected performance
45
at the time of sale. These servicer performance payments are limited to a dollar amount known at the time of sale and are not expected to be significant to the Company's total servicing compensation from the flow agreement.
Until May 1, 2017, the Company sold loans to CBP under terms of a flow agreement and predecessor sale agreements. The Company retained servicing on the sold loans and will owe CBP a loss-sharing payment capped at 0.5% of the original pool balance if losses exceed a specified threshold, established on a pool-by-pool basis.
Reportable Segment
The Company has one reportable segment: Consumer Finance. This segment includes the Company's vehicle financial products and services, including retail installment contracts, vehicle leases, and dealer loans, as well as financial products and services related to motorcycles, RVs, and marine vehicles. It also includes the Company's personal loan and point-of-sale financing operations.
46
Volume
The Company's originations of individually acquired loans and leases, including revolving loans, average APR, and discount during the year ended December 31, 2017, 2016, and 2015 have been as follows:
For the Year Ended | |||||||||||
December 31, 2017 | December 31, 2016 | December 31, 2015 | |||||||||
Retained Originations | (Dollar amounts in thousands) | ||||||||||
Retail installment contracts | $ | 11,634,395 | $ | 12,726,912 | $ | 16,692,229 | |||||
Average APR | 16.4 | % | 15.7 | % | 16.9 | % | |||||
Average FICO® (a) | 602 | 598 | 584 | ||||||||
Discount | 0.7 | % | 0.5 | % | 1.8 | % | |||||
Personal loans (b) | $ | 1,477,249 | $ | 1,555,783 | $ | 2,189,414 | |||||
Average APR | 25.7 | % | 25.1 | % | 21.2 | % | |||||
Leased vehicles | $ | 5,987,648 | $ | 5,584,149 | $ | 5,132,053 | |||||
Capital leases | $ | 9,295 | $ | 7,401 | $ | 67,244 | |||||
Total originations retained | $ | 19,108,587 | $ | 19,874,245 | $ | 24,080,940 | |||||
Sold Originations | |||||||||||
Retail installment contracts | $ | 2,550,065 | $ | 3,573,658 | $ | 5,419,730 | |||||
Average APR | 6.2 | % | 4.3 | % | 4.2 | % | |||||
Average FICO® (c) | 727 | 745 | 743 | ||||||||
Total SC originations | $ | 21,658,652 | $ | 23,447,903 | $ | 29,500,670 | |||||
Facilitated Originations | |||||||||||
Leased vehicles | — | — | 632,471 | ||||||||
Total originations facilitated for affiliates | $ | — | $ | — | $ | 632,471 | |||||
Total originations (d) | $ | 21,658,652 | $ | 23,447,903 | $ | 30,133,141 | |||||
(a) | Unpaid principal balance excluded from the weighted average FICO score is $1.5 billion, $2.1 billion and $3.2 billion for the years ended 2017, 2016, and 2015, respectively, as the borrowers on these loans did not have FICO scores at origination. Of these amounts $164 million, $364 million, and $650 million, respectively, were commercial loans. |
(b) | Effective as of three months ended December 31, 2017, the Company revised its approach to define origination volumes for Personal Loans to include new originations, gross of paydowns and charge-offs, related to customers who took additional advances on existing accounts (including capitalized late fees, interest and other charges), and newly opened accounts. In the prior periods, the Company reported net balance increases on personal loans as origination volume. Included in the total origination volume is $264 million, $304 million, and $933 million for the years ended 2017, 2016, and 2015, respectively, related to newly opened accounts. |
(c) | Unpaid principal balance excluded from the weighted average FICO score is $318 million, $451 million, and $647 million for the years ended 2017, 2016, and 2015, respectively, as the borrowers on these loans did not have FICO scores at origination. Of these amounts $102 million, $86 million, and $108 million, respectively, were commercial loans. |
(d) | Auto originations decreased primarily attributable to the continued high competition in the auto loan originations market, particularly the prime environment. The Company continues to focus on optimizing the loan quality of its portfolio, seeking an appropriate balance of volume and risk. Chrysler Capital volume and penetration rates are influenced by strategies implemented by FCA, including product mix and incentives. |
47
The Company's originations of individually acquired retail installment contracts and leases by vehicle type during the years ended December 31, 2017, 2016 and 2015 were as follows:
Years Ended | |||||||||||||||||
December 31, 2017 | December 31, 2016 | December 31, 2015 | |||||||||||||||
(Dollar amounts in thousands) | |||||||||||||||||
Retail installment contracts | |||||||||||||||||
Car | $ | 5,724,222 | 40.4 | % | $ | 6,878,899 | 42.2 | % | $ | 10,061,801 | 45.5 | % | |||||
Truck and utility | 7,168,113 | 50.5 | % | 8,187,007 | 50.2 | % | 10,454,371 | 47.3 | % | ||||||||
Van and other (a) | 1,292,125 | 9.1 | % | 1,234,664 | 7.6 | % | 1,595,787 | 7.2 | % | ||||||||
$ | 14,184,460 | 100.0 | % | $ | 16,300,570 | 100.0 | % | $ | 22,111,959 | 100.0 | % | ||||||
Leased vehicles | |||||||||||||||||
Car | $ | 1,017,410 | 17.0 | % | $ | 668,442 | 12.0 | % | $ | 717,040 | 14.0 | % | |||||
Truck and utility | 4,582,753 | 76.5 | % | 4,294,803 | 76.9 | % | 3,975,547 | 77.5 | % | ||||||||
Van and other (a) | 387,485 | 6.5 | % | 620,904 | 11.1 | % | 439,466 | 8.5 | % | ||||||||
$ | 5,987,648 | 100.0 | % | $ | 5,584,149 | 100.0 | % | $ | 5,132,053 | 100.0 | % | ||||||
Total originations by vehicle type | |||||||||||||||||
Car | $ | 6,741,632 | 33.4 | % | $ | 7,547,341 | 34.5 | % | $ | 10,778,841 | 39.6 | % | |||||
Truck and utility | 11,750,866 | 58.3 | % | 12,481,810 | 57.0 | % | 14,429,918 | 53.0 | % | ||||||||
Van and other (a) | 1,679,610 | 8.3 | % | 1,855,568 | 8.5 | % | 2,035,253 | 7.4 | % | ||||||||
$ | 20,172,108 | 100.0 | % | $ | 21,884,719 | 100.0 | % | $ | 27,244,012 | 100.0 | % | ||||||
(a) | Other primarily consists of commercial vehicles. |
The Company's asset sales for the years ended December 31, 2017, 2016 and 2015 were as follows:
For the Year Ended | |||||||||||
December 31, 2017 | December 31, 2016 | December 31, 2015 | |||||||||
(Dollar amounts in thousands) | |||||||||||
Retail installment contracts | $ | 2,979,033 | $ | 3,694,019 | $ | 7,862,520 | |||||
Average APR | 6.2 | % | 4.2 | % | 7.2 | % | |||||
Average FICO® | 721 | 746 | 704 | ||||||||
Personal loans (b) | $ | — | $ | 869,349 | $ | — | |||||
Average APR | — | % | 17.9 | % | — | ||||||
Leased vehicles | $ | — | $ | — | $ | 1,316,958 | |||||
Total asset sales (a) | $ | 2,979,033 | $ | 4,563,368 | $ | 9,179,478 | |||||
(a) | Assets sales decreased due to the terminations of the forward flow agreements with CBP and Bank of America during the year. This was partially offset by the three new securitizations executed in 2017, whereby eligible prime loans are sold to Santander. |
48
The Company's portfolio of retail installment contracts held for investment and leases by vehicle type as of December 31, 2017 and 2016 are as follows:
December 31, 2017 | December 31, 2016 | ||||||||||
(Dollar amounts in thousands) | |||||||||||
Retail installment contracts | |||||||||||
Car | $ | 13,509,708 | 52.0 | % | $ | 14,835,303 | 54.2 | % | |||
Truck and utility | 11,144,712 | 42.9 | % | 10,967,816 | 40.1 | % | |||||
Van and other (a) | 1,332,112 | 5.1 | % | 1,555,028 | 5.7 | % | |||||
$ | 25,986,532 | 100.0 | % | $ | 27,358,147 | 100.0 | % | ||||
Leased vehicles | |||||||||||
Car | $ | 1,571,170 | 14.1 | % | $ | 1,213,371 | 12.6 | % | |||
Truck and utility | 8,704,623 | 77.9 | % | 7,447,718 | 77.5 | % | |||||
Van and other (a) | 899,809 | 8.0 | % | 951,864 | 9.9 | % | |||||
$ | 11,175,602 | 100.0 | % | $ | 9,612,953 | 100.0 | % | ||||
Total by vehicle type | |||||||||||
Car | $ | 15,080,878 | 40.6 | % | $ | 16,048,674 | 43.4 | % | |||
Truck and utility | 19,849,335 | 53.4 | % | 18,415,534 | 49.8 | % | |||||
Van and other (a) | 2,231,921 | 6.0 | % | 2,506,892 | 6.8 | % | |||||
$ | 37,162,134 | 100.0 | % | $ | 36,971,100 | 100.0 | % | ||||
(a) | Other primarily consists of commercial vehicles. |
The unpaid principal balance, average APR, and remaining unaccreted discount of the Company's held for investment portfolio as of December 31, 2017 and 2016 are as follows:
December 31, 2017 | December 31, 2016 | ||||||
(Dollar amounts in thousands) | |||||||
Retail installment contracts (a) | $ | 25,986,532 | $ | 27,358,147 | |||
Average APR | 16.5 | % | 16.4 | % | |||
Discount | 1.5 | % | 2.3 | % | |||
Personal loans | $ | 6,887 | $ | 19,361 | |||
Average APR | 31.8 | % | 31.5 | % | |||
Receivables from dealers | $ | 15,787 | $ | 69,431 | |||
Average APR | 4.2 | % | 4.9 | % | |||
Leased vehicles | $ | 11,175,602 | $ | 9,612,953 | |||
Capital leases | $ | 22,857 | $ | 31,872 | |||
(a) | Of this balance as of December 31, 2017, $8.7 billion, $6.9 billion, and $5.6 billion was originated in the years ended December 31, 2017, 2016, and 2015, respectively. |
The Company records interest income from individually acquired retail installment contracts, personal loans, and receivables from dealers in accordance with the terms of the loans, generally discontinuing and reversing accrued income once a loan becomes more than 60 days past due, except in the case of revolving personal loans, for which the Company continues to accrue interest until charge-off, in the month in which the loan becomes 180 days past due, and receivables from dealers, for which the
49
Company continues to accrue interest until the loan becomes more than 90 days past due. The Company generally does not acquire receivables from dealers and term personal loans at a discount. The Company amortizes discounts, subvention payments from manufacturers, and origination costs as adjustments to income from individually acquired retail installment contracts using the effective yield method. The Company estimates future principal prepayments specific to pools of homogeneous loans which are based on the vintage, credit quality at origination and term of the loan. Prepayments in our portfolio are sensitive to credit quality, with higher credit quality loans generally experiencing higher voluntary prepayment rates than lower credit quality loans. The impact of defaults is not considered in the prepayment rate; the prepayment rate only considers voluntary prepayments. The resulting prepayment rate specific to each pool is based on historical experience, and is used as an input in the calculation of the constant effective yield.
The Company amortizes the discount, if applicable, on revolving personal loans straight-line over the estimated period over which the receivables are expected to be outstanding. For individually acquired retail installment contracts, personal loans, capital leases, and receivables from dealers, the Company also establishes a credit loss allowance for the estimated losses inherent in the portfolio. The Company estimates probable losses based on contractual delinquency status, historical loss experience, expected recovery rates from sale of repossessed collateral, bankruptcy trends, and general economic conditions such as unemployment rates. For loans within these portfolios that are classified as TDRs, impairment is measured based on the present value of expected future cash flows discounted at the original effective interest rate. For loans that are considered collateral-dependent, such as certain bankruptcy modifications, impairment is measured based on the fair value of the collateral, less its estimated cost to sell.
The Company classifies most of its vehicle leases as operating leases. The Company records the net capitalized cost of each lease as an asset, which is depreciated straight-line over the contractual term of the lease to the expected residual value. The Company records lease payments due from customers as income until and unless a customer becomes more than 60 days delinquent, at which time the accrual of revenue is discontinued and reversed. The Company resumes and reinstates the accrual if a delinquent account subsequently becomes 60 days or less past due. The Company amortizes subvention payments from the manufacturer, down payments from the customer, and initial direct costs incurred in connection with originating the lease straight-line over the contractual term of the lease.
Historically, the Company's primary means of acquiring retail installment contracts has been through individual acquisitions immediately after origination by a dealer. The Company also periodically purchased pools of receivables and had significant volumes of these purchases during the credit crisis. While the Company continues to pursue such opportunities when available, it did not purchase any pools during the years ended December 31, 2017, 2016 and 2015. However, during the years ended December 31, 2017, 2016 and 2015, the Company did recognize certain retail installment contracts with an unpaid principal balance of $290,613, $466,050 and $95,596, respectively, held by non-consolidated securitization Trusts under optional clean-up calls. Following the initial recognition of these loans at fair value, the performing loans in the portfolio will be carried at amortized cost, net of allowance for credit losses. The Company elected the fair value option for all non-performing loans acquired (more than 60 days delinquent as of re-recognition date), for which it was probable that not all contractually required payments would be collected. All of the retail installment contracts acquired during these periods were acquired individually. For the Company's existing purchased receivables portfolios, which were acquired at a discount partially attributable to credit deterioration since origination, the Company estimates the expected yield on each portfolio at acquisition and record monthly accretion income based on this expectation. The Company periodically re-evaluates performance expectations and may increase the accretion rate if a pool is performing better than expected. If a pool is performing worse than expected, the Company is required to continue to record accretion income at the previously established rate and to record impairment to account for the worsening performance.
50
Results of Operations
This MD&A should be read in conjunction with the consolidated financial statements and the accompanying notes included elsewhere in this Report. The following table presents the Company's results of operations for the years ended December 31, 2017, 2016, and 2015:
For the Year Ended December 31, | |||||||||||
2017 | 2016 | 2015 | |||||||||
(Dollar amounts in thousands) | |||||||||||
Interest on finance receivables and loans | $ | 4,755,678 | $ | 5,026,790 | $ | 5,031,829 | |||||
Leased vehicle income | 1,788,457 | 1,487,671 | 1,037,793 | ||||||||
Other finance and interest income | 19,885 | 15,135 | 18,162 | ||||||||
Total finance and other interest income | 6,564,020 | 6,529,596 | 6,087,784 | ||||||||
Interest expense | 947,734 | 807,484 | 628,791 | ||||||||
Leased vehicle expense | 1,298,513 | 995,459 | 726,420 | ||||||||
Net finance and other interest income | 4,317,773 | 4,726,653 | 4,732,573 | ||||||||
Provision for credit losses | 2,254,361 | 2,468,200 | 2,785,871 | ||||||||
Net finance and other interest income after provision for credit losses | 2,063,412 | 2,258,453 | 1,946,702 | ||||||||
Profit sharing | 29,568 | 47,816 | 57,484 | ||||||||
Net finance and other interest income after provision for credit losses and profit sharing | 2,033,844 | 2,210,637 | 1,889,218 | ||||||||
Total other income | 101,106 | 93,546 | 421,643 | ||||||||
Total operating expenses | 1,311,436 | 1,143,472 | 1,021,249 | ||||||||
Income before income taxes | 823,514 | 1,160,711 | 1,289,612 | ||||||||
Income tax expense (benefit) | (364,092 | ) | 394,245 | 465,572 | |||||||
Net income | $ | 1,187,606 | $ | 766,466 | $ | 824,040 | |||||
Net income | $ | 1,187,606 | $ | 766,466 | $ | 824,040 | |||||
Change in unrealized gains (losses) on cash flow hedges, net of tax | 16,003 | 26,134 | (1,428 | ) | |||||||
Comprehensive income | $ | 1,203,609 | $ | 792,600 | $ | 822,612 | |||||
51
Year Ended December 31, 2017 Compared to Year Ended December 31, 2016
Interest on Finance Receivables and Loans
For the Year Ended | ||||||||||||||
December 31, | December 31, | Increase (Decrease) | ||||||||||||
2017 | 2016 | Amount | Percent | |||||||||||
(Dollar amounts in thousands) | ||||||||||||||
Interest from individually acquired retail installment contracts | $ | 4,374,874 | $ | 4,615,459 | $ | (240,585 | ) | (5 | )% | |||||
Interest from purchased receivables portfolios | 30,129 | 69,701 | (39,572 | ) | (57 | )% | ||||||||
Interest from receivables from dealers | 2,802 | 3,718 | (916 | ) | (25 | )% | ||||||||
Interest from personal loans | 347,873 | 337,912 | 9,961 | 3 | % | |||||||||
Total interest on finance receivables and loans | $ | 4,755,678 | $ | 5,026,790 | $ | (271,112 | ) | (5 | )% | |||||
Income from individually acquired retail installment contracts decreased $241 million, or 5%, from 2016 to 2017, greater than the (3)% decline in the average outstanding balance of the Company's portfolio primarily due to lower interest income accruals for specific categories of loans classified as TDRs.
Income from purchased receivables portfolios decreased $40 million, or 57%, from 2016 to 2017, due to the sale of a majority of the purchased receivables to SBNA during the period and the continued runoff of the portfolios, as the Company has made no portfolio acquisitions since 2012. The average balance of the portfolios decreased from $286 million in 2016 to $146 million, or 49%, in 2017.
Income from personal loans increased $10 million, or 3%, from 2016 to 2017, as the sale of the entire LendingClub personal loan portfolio left only higher-yielding revolving loan portfolio.
Leased Vehicle Income and Expense
For the Year Ended | ||||||||||||||
December 31, | December 31, | Increase (Decrease) | ||||||||||||
2017 | 2016 | Amount | Percent | |||||||||||
(Dollar amounts in thousands) | ||||||||||||||
Leased vehicle income | $ | 1,788,457 | $ | 1,487,671 | $ | 300,786 | 20 | % | ||||||
Leased vehicle expense | 1,298,513 | 995,459 | 303,054 | 30 | % | |||||||||
Leased vehicle income, net | $ | 489,944 | $ | 492,212 | $ | (2,268 | ) | (0.5 | )% | |||||
Leased vehicle income and expense increased from prior year due to the continual growth in the portfolio since the Company launched Chrysler Capital in 2013. Leased vehicle expense increased at a larger rate than leased vehicle income due to an increase in depreciation expense which was the result of a decrease in residual values. The average balance of the portfolios increased from $8.8 billion in 2016 to $10.5 billion, or 18.6%, in 2017. Through the Chrysler Agreement, the Company receives manufacturer incentives on new leases originated under the program in the form of lease subvention payments, which are amortized over the term of the lease and reduce depreciation expense within Leased vehicle expense.
Interest Expense
For the Year Ended | ||||||||||||||
December 31, | December 31, | Increase (Decrease) | ||||||||||||
2017 | 2016 | Amount | Percent | |||||||||||
(Dollar amounts in thousands) | ||||||||||||||
Interest expense on notes payable | $ | 950,950 | $ | 754,687 | $ | 196,263 | 26 | % | ||||||
Interest expense (income) on derivatives | (3,216 | ) | 52,797 | (56,013 | ) | (106 | )% | |||||||
Total interest expense | $ | 947,734 | $ | 807,484 | $ | 140,250 | 17 | % | ||||||
Interest expense on notes payable increased $196 million, or 26%, from 2016 to 2017, primarily due to the increased cost of funds resulting from higher market rates and wider spreads.
52
Interest expense on derivatives decreased $56 million, or 106%, from 2016 to 2017, primarily due to favorable mark-to-market impact based on interest rate changes in 2017.
Provision for Credit Losses
For the Year Ended | ||||||||||||||
December 31, | December 31, | Increase (Decrease) | ||||||||||||
2017 | 2016 | Amount | Percent | |||||||||||
(Dollar amounts in thousands) | ||||||||||||||
Provision for credit losses on individually acquired retail installment contracts | $ | 2,244,182 | $ | 2,471,490 | $ | (227,308 | ) | (9 | )% | |||||
Incremental Increase (decrease) in impairment related to purchased receivables portfolios | — | (2,985 | ) | 2,985 | (100 | )% | ||||||||
Provision for credit losses on receivables from dealers | (560 | ) | 201 | (761 | ) | (379 | )% | |||||||
Provision for credit losses on personal loans | 10,691 | — | 10,691 | 100 | % | |||||||||
Provision for credit losses on capital leases | 48 | (506 | ) | 554 | (109 | )% | ||||||||
Provision for credit losses | $ | 2,254,361 | $ | 2,468,200 | $ | (213,839 | ) | (9 | )% | |||||
During 2017, the Company changed the model used for estimating the allowance for credit losses on individually acquired retail installment contracts from a vintage loss model to a transition based Markov model. Under the vintage loss model, future losses were projected using the lifetime vintage loss curves calibrated on the historical data. The new transition based Markov model provides data on a more granular and disaggregated/segment basis as it utilizes the recently observed loan transition rates from various loan statuses to forecast future losses. Transition matrices in the Markov model are categorized based on account characteristics, such as delinquency status, TDR type (deferment, modification, etc.), internal credit risk, origination channel, months on book, thin/thick file and time since TDR event. The Company believes that this level of disaggregation is appropriate and provides a more comprehensive evaluation of the potential risks used to estimate an allowance for credit losses for non-TDR and TDR loans. The change did not have a significant impact on the amount of allowance for loan losses recognized for both TDR and non-TDR loans, during 2017.
Provision for credit losses on the Company's individually acquired retail installment contracts decreased $227 million, or 9%, from 2016 to 2017, primarily due to a lower build of the allowance for credit losses as a result of the decline in originations, stabilizing credit performance for non-TDR loans, and recovery rates. This is partially offset by the lower benefit from bankruptcy sales and to a lesser extent, the additional allowance for credit losses recorded for customers affected by Hurricanes Harvey and Irma. In addition, provision for credit losses is impacted by nonaccrual of interest income for certain TDR loans which is offset in the impairment as it reduces the carrying value of TDR loans.
Provision for credit losses on personal loans was recorded during fiscal 2017 due to the reclassification of personal loans from held for sale to held for investment effective as of the end on the third quarter of 2016.
Profit Sharing
For the Year Ended | |||||||||||||
December 31, | December 31, | Increase (Decrease) | |||||||||||
2017 | 2016 | Amount | Percent | ||||||||||
(Dollar amounts in thousands) | |||||||||||||
Profit sharing | $ | 29,568 | $ | 47,816 | $ | (18,248 | ) | (38)% | |||||
Profit sharing consists of revenue sharing related to the Chrysler Agreement and profit sharing on personal loans originated pursuant to the Company's agreements with Bluestem. Profit sharing decreased in 2017 compared to 2016, primarily because of decrease in Chrysler profit sharing expense based on increase in lease depreciation expense.
53
Other Income
For the Year Ended | ||||||||||||||
December 31, | December 31, | Increase (Decrease) | ||||||||||||
2017 | 2016 | Amount | Percent | |||||||||||
(Dollar amounts in thousands) | ||||||||||||||
Investment losses, net | $ | (366,439 | ) | $ | (444,759 | ) | $ | 78,320 | (18 | )% | ||||
Servicing fee income | 118,341 | 156,134 | (37,793 | ) | (24 | )% | ||||||||
Fees, commissions, and other | 349,204 | 382,171 | (32,967 | ) | (9 | )% | ||||||||
Total other income | $ | 101,106 | $ | 93,546 | $ | 7,560 | 8 | % | ||||||
Average serviced for others portfolio | $ | 10,118,277 | $ | 13,306,988 | $ | (3,188,711 | ) | (24 | )% | |||||
Investment losses, net for the years ended December 31, 2017 and 2016, were as follows:
For the Year Ended December 31, | |||||||
2017 | 2016 | ||||||
Gain (loss) on sale of loans and leases | $ | 17,554 | $ | (11,549 | ) | ||
Lower of cost or market adjustments | (386,060 | ) | (423,616 | ) | |||
Other gains / (losses and impairments) | 2,067 | (9,594 | ) | ||||
Total investment losses, net | $ | (366,439 | ) | $ | (444,759 | ) | |
Gain (loss) on sale of loans and leases changed from a $12 million loss in 2016 to a $18 million gain in 2017. The change was driven primarily by the $36 million gain recognized upon the sale of receivables previously acquired with deteriorated credit quality to SBNA during the year. The gain is partially offset by losses recognized from off-balance sheet securitizations and flow agreements.
The change in lower of cost or market adjustments relates to customer default activity and net changes in the unpaid principal balance on the personal lending portfolio, most of which has been classified as held for sale since September 30, 2015. Refer to Note 18 - "Investment Gains (Losses), Net".
The Company records servicing fee income on loans that it services but does not own and does not report on its balance sheet. Servicing fee income decreased 24% from 2016 to 2017, due to the decline in the Company's serviced portfolio. The Company's serviced for others portfolio as of December 31, 2017 and 2016, was as follows:
December 31, | |||||||
2017 | 2016 | ||||||
(Dollar amounts in thousands) | |||||||
SBNA and Santander retail installment contracts | $ | 2,546,255 | $ | 531,117 | |||
SBNA leases | 321,629 | 1,297,317 | |||||
Total serviced for related parties | 2,867,884 | 1,828,434 | |||||
Chrysler Capital securitizations | 1,405,168 | 2,472,757 | |||||
Other third parties | 4,365,917 | 7,644,031 | |||||
Total serviced for third parties | 5,771,085 | 10,116,788 | |||||
Total serviced for others portfolio | $ | 8,638,969 | $ | 11,945,222 | |||
The Company's serviced for others balances has decreased versus the prior year due to lower prime originations and the timing of prime asset sales.
The Company's fees, commissions, and other primarily includes late fees, miscellaneous, and other income. This income decreased 9% from 2016 to 2017, due to the discontinuance of certain revenue streams in 2017.
54
Total Operating Expenses
For the Year Ended | ||||||||||||||
December 31, | December 31, | Increase (Decrease) | ||||||||||||
2017 | 2016 | Amount | Percent | |||||||||||
(Dollar amounts in thousands) | ||||||||||||||
Compensation expense | $ | 581,017 | $ | 498,224 | $ | 82,793 | 17 | % | ||||||
Repossession expense | 275,704 | 293,355 | (17,651 | ) | (6 | )% | ||||||||
Other operating costs | 454,715 | 351,893 | 102,822 | 29 | % | |||||||||
Total operating expenses | $ | 1,311,436 | $ | 1,143,472 | $ | 167,964 | 15 | % | ||||||
Compensation expense increased by $83 million, or 17%, from 2016 to 2017, primarily due to the increase in severance expenses related to management changes, efficiency efforts and continued investment in compliance and control functions.
Repossession expense decreased 18 million, or 6%, from 2016 to 2017, primarily due to a decrease in repossessions due to the impact of Hurricanes Harvey and Irma.
Other operating costs expense increased $103 million, or 29% from 2016 to 2017, primarily due to the loss recorded for certain lawsuits, regulatory matters and other legal proceedings. Refer to Note 11-"Commitments and Contingencies" in the Notes to Consolidated Financial Statements.
Income Tax Expense (Benefit)
For the Year Ended | ||||||||||||||
December 31, | December 31, | Increase (Decrease) | ||||||||||||
2017 | 2016 | Amount | Percent | |||||||||||
(Dollar amounts in thousands) | ||||||||||||||
Income tax expense (benefit) | $ | (364,092 | ) | $ | 394,245 | $ | (758,337 | ) | (192 | )% | ||||
Income before income taxes | 823,514 | 1,160,711 | (337,197 | ) | (29 | )% | ||||||||
Effective tax rate | (44.2 | )% | 34.0 | % | ||||||||||
The significant decrease in income tax expense in 2017, is primarily due to the Tax Cuts and Jobs Act enacted on December 22, 2017 and effective January 1, 2018, including re-measurement of all deferred tax assets and deferred tax liabilities at federal tax rate of 21%. Refer to Note 10.
Other Comprehensive Income
For the Year Ended | ||||||||||||||
December 31, | December 31, | Increase (Decrease) | ||||||||||||
2017 | 2016 | Amount | Percent | |||||||||||
(Dollar amounts in thousands) | ||||||||||||||
Change in unrealized gains on cash flow hedges, net of tax | $ | 16,003 | $ | 26,134 | $ | (10,131 | ) | (39 | )% | |||||
The change in unrealized gains on cash flow hedges from 2016 to 2017, was primarily driven by interest rate movements in 2017.
55
Year Ended December 31, 2016 Compared to Year Ended December 31, 2015
Interest on Finance Receivables and Loans
For the Year Ended | ||||||||||||||
December 31, | December 31, | Increase (Decrease) | ||||||||||||
2016 | 2015 | Amount | Percent | |||||||||||
(Dollar amounts in thousands) | ||||||||||||||
Interest from individually acquired retail installment contracts | $ | 4,615,459 | $ | 4,483,054 | $ | 132,405 | 3 | % | ||||||
Interest from purchased receivables portfolios | 69,701 | 91,157 | (21,456 | ) | (24 | )% | ||||||||
Interest from receivables from dealers | 3,718 | 4,537 | (819 | ) | (18 | )% | ||||||||
Interest from personal loans | 337,912 | 453,081 | (115,169 | ) | (25 | )% | ||||||||
Total interest on finance receivables and loans | $ | 5,026,790 | $ | 5,031,829 | $ | (5,039 | ) | — | ||||||
Income from individually acquired retail installment contracts increased $132 million, or 3%, from 2015 to 2016, consistent with the 7% growth in the average outstanding balance of the Company's portfolio of these contracts and a shift in credit quality mix.
Income from purchased receivables portfolios decreased $21 million, or 24%, from 2015 to 2016 due to the continued runoff of the portfolios, as the Company has made no portfolio acquisitions since 2012. The average balance of the portfolios decreased from $0.6 billion in 2015 to $0.3 billion, or 49% in 2016.
Income from personal loans decreased $115 million, or 25%, from 2015 to 2016, less than the 37% decrease in the average outstanding portfolio, as the sale of the LendingClub loans in February 2016 left only the higher-yielding revolving loan portfolio. The average balance of the portfolios decreased from $2.2 billion in 2015 to $1.4 billion in 2016.
Leased Vehicle Income and Expense
For the Year Ended | ||||||||||||||
December 31, | December 31, | Increase (Decrease) | ||||||||||||
2016 | 2015 | Amount | Percent | |||||||||||
(Dollar amounts in thousands) | ||||||||||||||
Leased vehicle income | $ | 1,487,671 | $ | 1,037,793 | $ | 449,878 | 43 | % | ||||||
Leased vehicle expense | 995,459 | 726,420 | 269,039 | 37 | % | |||||||||
Leased vehicles income, net | $ | 492,212 | $ | 311,373 | $ | 180,839 | 58 | % | ||||||
Leased vehicle income and expense increased significantly from prior year due to the continual growth in the portfolio since the Company launched Chrysler Capital in 2013. During the year ended December 31, 2016, originations have continued to outpace the maturity (or run-off) of existing leases. Through the Chrysler Agreement, the Company receives manufacturer incentives on new leases originated under the program in the form of lease subvention payments, which are amortized over the term of the lease and reduce depreciation expense within leased vehicle expense.
Interest Expense
For the Year Ended | ||||||||||||||
December 31, | December 31, | Increase (Decrease) | ||||||||||||
2016 | 2015 | Amount | Percent | |||||||||||
(Dollar amounts in thousands) | ||||||||||||||
Interest expense on notes payable | $ | 754,687 | $ | 561,750 | $ | 192,937 | 34 | % | ||||||
Interest expense on derivatives | 52,797 | 67,041 | (14,244 | ) | (21 | )% | ||||||||
Total interest expense | $ | 807,484 | $ | 628,791 | $ | 178,693 | 28 | % | ||||||
Interest expense on notes payable increased $193 million, or 34%, from 2015 to 2016, higher than the growth in average debt outstanding of 5%. The Company's cost of funds increased due to higher market rates and wider spreads in 2016.
56
Interest expense on derivatives decreased $14 million, or 21%, from 2015 to 2016, primarily due to a decrease in the outstanding notional amounts on the Company's derivatives which was due to a favorable mark-to-market impact in 2016 versus an unfavorable mark-to-market impact in 2015 driven by interest rate changes.
Provision for Credit Losses
For the Year Ended | ||||||||||||||
December 31, | December 31, | Increase (Decrease) | ||||||||||||
2016 | 2015 | Amount | Percent | |||||||||||
(Dollar amounts in thousands) | ||||||||||||||
Provision for credit losses on individually acquired retail installment contracts | $ | 2,471,490 | $ | 2,433,617 | $ | 37,873 | 2 | % | ||||||
Incremental Increase (decrease) in impairment related to purchased receivables portfolios | (2,985 | ) | (13,818 | ) | 10,833 | (78 | )% | |||||||
Provision for credit losses on receivables from dealers | 201 | 242 | (41 | ) | (17 | )% | ||||||||
Provision for credit losses on personal loans | — | 324,634 | (324,634 | ) | (100 | )% | ||||||||
Provision for credit losses on capital leases | (506 | ) | 41,196 | (41,702 | ) | (101 | )% | |||||||
Provision for credit losses | $ | 2,468,200 | $ | 2,785,871 | $ | (317,671 | ) | (11 | )% | |||||
Provision for credit losses on the Company's individually acquired retail installment contracts increased $38 million, or 2%, from 2015 to 2016, primarily due to unfavorable variances in net charge-offs which increased by $462 million. The increases in net charge-offs were primarily attributable to portfolio aging and mix shift, lower realized recovery rates, and smaller benefit from bankruptcy sales. The increases in net charge-offs were substantially offset by a smaller build of the allowance for credit losses primarily due to higher credit quality originations during 2016 as compared to 2015.
The change in impairment related to the purchased receivables portfolios was primarily attributable to a larger release of impairment on purchased receivables in 2015 compared to 2016 as the portfolios continued to run off.
Provision for credit losses on personal loans decreased $325 million, or 100%, from 2015 to 2016, due to the reclassification of personal loans from held for investment to held for sale effective as of the end of the third quarter of 2015. Subsequently, personal loans are accounted for at the lower of cost or market, with the associated adjustments reported in investment gains (losses), net.
In early 2015, the Company ceased originations in the primary program that gave rise to the capital lease portfolio, and provisions for credit losses on this portfolio have decreased as the portfolio liquidates.
Profit Sharing
For the Year Ended | |||||||||||||
December 31, | December 31, | Increase (Decrease) | |||||||||||
2016 | 2015 | Amount | Percent | ||||||||||
(Dollar amounts in thousands) | |||||||||||||
Profit sharing | $ | 47,816 | $ | 57,484 | $ | (9,668 | ) | (17)% | |||||
Profit sharing consists of revenue sharing related to the Chrysler Agreement and profit sharing on personal loans originated pursuant to the Company's agreements with Bluestem. Profit sharing with Bluestem decreased in 2016 compared to 2015, as in 2016 the Bluestem portfolio became more seasoned and increased delinquencies and charge-offs decreased the amount of payments due to Bluestem. This was partially offset by an increase in Chrysler Capital revenue sharing due to continued growth in the portfolio.
57
Other Income
For the Year Ended | ||||||||||||||
December 31, | December 31, | Increase (Decrease) | ||||||||||||
2016 | 2015 | Amount | Percent | |||||||||||
(Dollar amounts in thousands) | ||||||||||||||
Investment gains (losses), net | $ | (444,759 | ) | $ | (95,214 | ) | $ | (349,545 | ) | 367 | % | |||
Servicing fee income | 156,134 | 131,113 | 25,021 | 19 | % | |||||||||
Fees, commissions, and other | 382,171 | 385,744 | (3,573 | ) | (1 | )% | ||||||||
Total other income | $ | 93,546 | $ | 421,643 | $ | (328,097 | ) | (78 | )% | |||||
Average serviced for others portfolio | $ | 13,306,988 | $ | 12,963,334 | $ | 343,654 | 3 | % | ||||||
Investment losses, net increased $350 million, or 367% from 2015 to 2016. Investment gains (losses), net for the years ended December 31, 2016 and 2015, were as follows:
For the Year Ended December 31, | |||||||
2016 | 2015 | ||||||
Gain (loss) on sale of loans and leases | $ | (11,549 | ) | $ | 155,408 | ||
Lower of cost or market adjustments | (423,616 | ) | (236,396 | ) | |||
Other gains / (losses and impairments) | (9,594 | ) | (14,226 | ) | |||
Total investment losses | $ | (444,759 | ) | $ | (95,214 | ) | |
Gain (loss) on sale of loans and leases changed from a $155 million gain in 2015 to a $12 million loss in 2016. This change was driven primarily by two bulk lease sales executed in 2015, whereas no such sales occurred in 2016. Additionally, the off-balance sheet securitizations in 2015 resulted in gains on sale compared to losses from securitizations in 2016.
Lower of cost or market adjustments for the year ended December 31, 2016 included $429 million in customer default activity and net favorable adjustments of $14 million related to net changes in the unpaid principal balance on the personal lending portfolio, most of which has been classified as held for sale since September 30, 2015. Additionally, the Company had net unfavorable lower of cost or market adjustments on individually acquired retail installment contracts of $9 million during the year ended December 31, 2016. This compares to lower of cost or market adjustments of $236 million on the Company's personal lending portfolio during the year ended December 31, 2015, which included $123 million related to customer defaults and $113 million related to other changes in the unpaid principal balance and market value of its held for sale portfolio.
The Company records servicing fee income on loans that it services but does not own and does not report on its balance sheet. Servicing fee income increased 19% from 2015 to 2016, despite the decrease in the serviced for other portfolio, due to the greater proportion of lower credit quality, higher servicing fee assets in the portfolio in the current year, and the result of the sale during the third quarter of 2015 of residual interests in aged securitizations. The Company's serviced for others portfolio as of December 31, 2016 and 2015, was as follows:
December 31, | |||||||
2016 | 2015 | ||||||
(Dollar amounts in thousands) | |||||||
SBNA and Santander retail installment contracts | $ | 531,117 | $ | 692,291 | |||
SBNA leases | 1,297,317 | 2,198,519 | |||||
Total serviced for related parties | 1,828,434 | 2,890,810 | |||||
Chrysler Capital securitizations | 2,472,757 | 2,663,494 | |||||
Other third parties | 7,644,031 | 9,492,350 | |||||
Total serviced for third parties | 10,116,788 | 12,155,844 | |||||
Total serviced for others portfolio | $ | 11,945,222 | $ | 15,046,654 | |||
58
Total Operating Expenses
For the Year Ended | ||||||||||||||
December 31, | December 31, | Increase (Decrease) | ||||||||||||
2016 | 2015 | Amount | Percent | |||||||||||
(Dollar amounts in thousands) | ||||||||||||||
Compensation expense | $ | 498,224 | $ | 434,041 | $ | 64,183 | 15 | % | ||||||
Repossession expense | 293,355 | 241,522 | 51,833 | 21 | % | |||||||||
Other operating costs | 351,893 | 345,686 | 6,207 | 2 | % | |||||||||
Total operating expenses | $ | 1,143,472 | $ | 1,021,249 | $ | 122,223 | 12 | % | ||||||
Compensation expense increased by $64 million, or 15%, from 2015 to 2016, primarily due to increased headcount as the Company continued to invest in enhancing the control and compliance functions. Repossession expense and other operating costs increased from 2015 to 2016 as a result of portfolio growth and higher gross losses.
Income Tax Expense
For the Year Ended | ||||||||||||||
December 31, | December 31, | Increase (Decrease) | ||||||||||||
2016 | 2015 | Amount | Percent | |||||||||||
(Dollar amounts in thousands) | ||||||||||||||
Income tax expense (benefit) | $ | 394,245 | $ | 465,572 | $ | (71,327 | ) | (15 | )% | |||||
Income before income taxes | 1,160,711 | 1,289,612 | (128,901 | ) | (10 | )% | ||||||||
Effective tax rate | 34.0 | % | 36.1 | % | ||||||||||
The Company's effective tax rate decreased from 36.1% in 2015 to 34.0% in 2016, primarily due to the decrease in pretax book income and the release of the valuation allowance for capital loss carryforwards.
Other Comprehensive Income
For the Year Ended | ||||||||||||||
December 31, | December 31, | Increase (Decrease) | ||||||||||||
2016 | 2015 | Amount | Percent | |||||||||||
(Dollar amounts in thousands) | ||||||||||||||
Change in unrealized gains on cash flow hedges, net of tax | $ | 26,134 | $ | (1,428 | ) | $ | 27,562 | (1,930 | )% | |||||
The change in unrealized gains (losses) on cash flow hedges was primarily driven by the mark to market movement associated hedges entered into during 2016 which accounted for $21.2 million of gains. Additionally, $6.4 million of the change in unrealized gains (losses) on cash flow hedges is due to the favorable movements in interest rates as a result of steepening of the forward LIBOR curve in 2016 relative to 2015. The Company pays fixed rate on interest rate swaps, as such, these movements resulted in a gain.
59
Credit Quality
Loans and Other Finance Receivables
Non-prime loans comprise 82% of the Company's retail installment contract portfolio as of December 31, 2017. The Company records an allowance for credit losses to cover the estimate of inherent losses on individually acquired retail installment contracts and other loans and receivables held for investment. The Company's held for investment portfolio of retail installment contracts acquired individually, receivables from dealers, and personal loans was comprised of the following at December 31, 2017 and 2016:
December 31, 2017 | |||||||||||||||
Retail Installment Contracts Acquired Individually | Receivables from Dealers | Personal Loans | |||||||||||||
Non- TDR | TDR | ||||||||||||||
(Dollar amounts in thousands) | |||||||||||||||
Unpaid principal balance | $ | 19,681,394 | $ | 6,261,894 | $ | 15,787 | $ | 6,887 | |||||||
Credit loss allowance - specific | — | (1,731,320 | ) | — | (2,565 | ) | |||||||||
Credit loss allowance - collective | (1,529,815 | ) | — | (164 | ) | — | |||||||||
Discount | (309,191 | ) | (74,832 | ) | — | (1 | ) | ||||||||
Capitalized origination costs and fees | 58,638 | 5,741 | — | 138 | |||||||||||
Net carrying balance | $ | 17,901,026 | $ | 4,461,483 | $ | 15,623 | $ | 4,459 | |||||||
Allowance as a percentage of unpaid principal balance | 7.8 | % | 27.6 | % | 1.0 | % | 37.2 | % | |||||||
Allowance and discount as a percentage of unpaid principal balance | 9.3 | % | 28.8 | % | 1.0 | % | 37.3 | % | |||||||
(a) As of December 31, 2017, used car financing represented 61% of our outstanding retail installment contracts acquired individually. 87% of this
used car financing consisted of nonprime auto loans.
December 31, 2016 | |||||||||||||||
Retail Installment Contracts Acquired Individually | Receivables from Dealers | Personal Loans | |||||||||||||
Non-TDR | TDR | ||||||||||||||
(Dollar amounts in thousands) | |||||||||||||||
Unpaid principal balance | $ | 21,528,406 | $ | 5,599,567 | $ | 69,431 | $ | 19,361 | |||||||
Credit loss allowance - specific | — | (1,611,295 | ) | — | |||||||||||
Credit loss allowance - collective | (1,799,760 | ) | — | (724 | ) | — | |||||||||
Discount | (467,757 | ) | (91,359 | ) | — | (7,721 | ) | ||||||||
Capitalized origination costs and fees | 56,704 | 5,218 | — | 632 | |||||||||||
Net carrying balance | $ | 19,317,593 | $ | 3,902,131 | $ | 68,707 | $ | 12,272 | |||||||
Allowance as a percentage of unpaid principal balance | 8.4 | % | 28.8 | % | 1.0 | % | — | ||||||||
Allowance and discount as a percentage of unpaid principal balance | 10.5 | % | 30.4 | % | 1.0 | % | 39.9 | % | |||||||
The Company acquired certain retail installment contracts in pools at a discount due to deterioration subsequent to their origination. The Company anticipates the expected credit losses at purchase and records income thereafter based on the expected effective yield, recording impairment if performance is worse than expected at purchase. Any deterioration in the performance of the purchased portfolios results in an incremental impairment. The balances of these purchased receivables portfolios were as follows at December 31, 2017 and 2016:
December 31, 2017 | December 31, 2016 | ||||||
(In thousands) | |||||||
Outstanding balance | $ | 43,474 | $ | 231,360 | |||
Outstanding recorded investment, net of impairment | $ | 28,069 | $ | 159,451 | |||
60
A summary of the credit risk profile of the Company's consumer loans by FICO® score, number of trade lines, and length of credit history, each as determined at origination, as of December 31, 2017 and 2016 was as follows (dollar amounts in billions, totals may not foot due to rounding):
December 31, 2017 | |||||||||||||||||||||||||||||||
Trade Lines (a) | 1 | 2 | 3 | 4+ | Total | ||||||||||||||||||||||||||
FICO | Months History | $ | % | $ | % | $ | % | $ | % | $ | % | ||||||||||||||||||||
No-FICO | <36 | $ | 2.3 | 97 | % | $ | 0.1 | 3 | % | $ | — | — | % | $ | — | — | $ | 2.4 | 9 | % | |||||||||||
36+ | 0.4 | 38 | % | 0.2 | 20 | % | 0.1 | 11 | % | 0.3 | 31 | % | 1.0 | 4 | % | ||||||||||||||||
<540 | <36 | 0.2 | 40 | % | 0.1 | 23 | % | 0.1 | 14 | % | 0.1 | 23 | % | 0.5 | 2 | % | |||||||||||||||
36+ | 0.2 | 3 | % | 0.3 | 5 | % | 0.3 | 5 | % | 4.5 | 87 | % | 5.3 | 21 | % | ||||||||||||||||
540-599 | <36 | 0.3 | 35 | % | 0.2 | 23 | % | 0.1 | 15 | % | 0.2 | 27 | % | 0.8 | 3 | % | |||||||||||||||
36+ | 0.2 | 2 | % | 0.2 | 3 | % | 0.3 | 4 | % | 6.8 | 91 | % | 7.5 | 29 | % | ||||||||||||||||
600-639 | <36 | 0.2 | 36 | % | 0.1 | 22 | % | 0.1 | 15 | % | 0.1 | 27 | % | 0.5 | 2 | % | |||||||||||||||
36+ | 0.1 | 1 | % | 0.1 | 2 | % | 0.1 | 2 | % | 3.6 | 95 | % | 3.9 | 15 | % | ||||||||||||||||
>640 | <36 | 0.3 | 42 | % | 0.1 | 21 | % | 0.1 | 13 | % | 0.1 | 24 | % | 0.6 | 2 | % | |||||||||||||||
36+ | — | — | % | 0.1 | 2 | % | 0.1 | 3 | % | 3.3 | 95 | % | 3.5 | 13 | % | ||||||||||||||||
Total | $ | 4.2 | 16 | % | $ | 1.5 | 6 | % | $ | 1.3 | 5 | % | $ | 19.0 | 73 | % | $ | 26.0 | 100 | % | |||||||||||
(a) | Trade lines represent the number of accounts or lines of credit at any financial institution at the time of origination |
December 31, 2016 | |||||||||||||||||||||||||||||||
Trade Lines (a) | 1 | 2 | 3 | 4+ | Total | ||||||||||||||||||||||||||
FICO | Months History | $ | % | $ | % | $ | % | $ | % | $ | % | ||||||||||||||||||||
No-FICO | <36 | $ | 2.8 | 97 | % | $ | 0.1 | 3 | % | $ | — | — | $ | — | — | $ | 2.9 | 11 | % | ||||||||||||
36+ | 0.5 | 42 | % | 0.2 | 17 | % | 0.1 | 8 | % | 0.4 | 33 | % | 1.2 | 4 | % | ||||||||||||||||
<540 | <36 | 0.2 | 40 | % | 0.1 | 20 | % | 0.1 | 20 | % | 0.1 | 20 | % | 0.5 | 2 | % | |||||||||||||||
36+ | 0.2 | 4 | % | 0.3 | 5 | % | 0.3 | 5 | % | 4.7 | 85 | % | 5.5 | 20 | % | ||||||||||||||||
540-599 | <36 | 0.3 | 38 | % | 0.2 | 25 | % | 0.1 | 13 | % | 0.2 | 25 | % | 0.8 | 3 | % | |||||||||||||||
36+ | 0.2 | 3 | % | 0.3 | 4 | % | 0.3 | 4 | % | 7.0 | 90 | % | 7.8 | 28 | % | ||||||||||||||||
600-639 | <36 | 0.2 | 40 | % | 0.1 | 20 | % | 0.1 | 20 | % | 0.1 | 20 | % | 0.5 | 2 | % | |||||||||||||||
36+ | 0.1 | 2 | % | 0.1 | 2 | % | 0.1 | 2 | % | 4.0 | 93 | % | 4.3 | 16 | % | ||||||||||||||||
>640 | <36 | 0.3 | 50 | % | 0.1 | 17 | % | 0.1 | 17 | % | 0.1 | 17 | % | 0.6 | 2 | % | |||||||||||||||
36+ | — | — | % | 0.1 | 3 | % | 0.1 | 3 | % | 3.1 | 94 | % | 3.3 | 12 | % | ||||||||||||||||
Total | $ | 4.8 | 18 | % | $ | 1.6 | 6 | % | $ | 1.3 | 5 | % | $ | 19.7 | 72 | % | $ | 27.4 | 100 | % | |||||||||||
(a) | Trade lines represent the number of accounts or lines of credit at any financial institution at the time of origination |
Delinquency
The Company considers an account delinquent when an obligor fails to pay the required minimum portion of the scheduled payment by the due date. The Company noted some deterioration in the performance of recent originations, particularly those loans originated in 2015, and addressed those trends with the introduction of more disciplined underwriting standards in late 2016. Based on this disciplined underwriting (among other things), the servicing practices for retail installment contracts originated after January 1, 2017 changed, such that there is an increase in the minimum payment requirements. Although these changes impact the measurement of customer delinquencies, the Company does not believe they have a significant impact on the amount or timing of the recognition of credit losses and allowance for loan losses. With respect to receivables originated by the Company through its “Chrysler Capital” channel, the required minimum payment is 90% of the scheduled payment. With respect to receivables originated by the Company or acquired by the Company from an unaffiliated third-party originator on or after January 1, 2017, the required minimum payment is 90% of the scheduled payment, whereas previous to January 1, 2017 the required minimum payment was 50% of the scheduled payment. The payment following the partial payment must be a full payment, or the account will move into delinquency status at that time.
In each case, the period of delinquency is based on the number of days payments are contractually past due. Delinquencies may vary from period to period based upon the average age or seasoning of the portfolio, seasonality within the calendar year, and economic factors. Historically, the Company's delinquencies have been highest in the period from November through January due to consumers’ holiday spending.
61
The following is a summary of delinquencies on retail installment contracts held for investment, as of December 31, 2017 and 2016:
December 31, 2017 | December 31, 2016 | |||||||||||||
Dollars (in thousands) | Percent (a) | Dollars (in thousands) | Percent (a) | |||||||||||
Principal 30-59 days past due | $ | 2,827,678 | 10.9 | % | $ | 2,925,503 | 10.7 | % | ||||||
Delinquent principal over 59 days (b) | 1,544,583 | 5.9 | % | 1,526,743 | 5.6 | % | ||||||||
Total delinquent principal | $ | 4,372,261 | 16.8 | % | $ | 4,452,246 | 16.3 | % | ||||||
(a) | Percent of unpaid principal balance of total retail installment contracts acquired individually held for investment. |
(b) | Interest is accrued until 60 days past due in accordance with the Company's accounting policy for retail installment contracts. The Company's delinquency ratio continues to be calculated using the end of period delinquent principal over 60 days. Refer to Part II, Item 6-"Selected Financial Data" for details on delinquent principal over 60 days and related delinquency ratios. |
Within the total delinquent principal above, retail installment contracts acquired individually held for investment that were placed on nonaccrual status, as of December 31, 2017 and 2016:
December 31, 2017 | December 31, 2016 | |||||||||||||
Dollars (in thousands) | Percent (a) | Dollars (in thousands) | Percent (a) | |||||||||||
Non-TDR | $ | 666,926 | 2.6 | % | $ | 721,150 | 2.6 | % | ||||||
TDR (b) | 1,390,373 | 5.4 | % | 665,068 | 2.4 | % | ||||||||
Total nonaccrual principal | $ | 2,057,299 | 7.9 | % | $ | 1,386,218 | 5.1 | % | ||||||
(a) | Percent of unpaid principal balance of total retail installment contracts acquired individually held for investment. |
(b) | Refer to "Deferrals and Troubled Debt Restructurings" section below for discussion around significant increase in nonaccrual loans |
All of the Company's receivables from dealers were current as of December 31, 2017 and 2016.
Credit Loss Experience
The following is a summary of the Company's net losses and repossession activity on finance receivables held for investment for the years ended December 31, 2017 and 2016:
For the Year Ended December 31, | |||||||
2017 | 2016 | ||||||
(Dollar amounts in thousands) | |||||||
Principal outstanding at period end | $ | 25,986,532 | $ | 27,358,147 | |||
Average principal outstanding during the period | $ | 26,901,142 | $ | 27,540,110 | |||
Number of receivables outstanding at period end | 1,705,234 | 1,706,261 | |||||
Average number of receivables outstanding during the period | 1,721,755 | 1,677,089 | |||||
Number of repossessions (a) | 303,703 | 300,526 | |||||
Number of repossessions as a percent of average number of receivables outstanding | 17.6 | % | 17.9 | % | |||
Net losses | $ | 2,396,157 | $ | 2,257,832 | |||
Net losses as a percent of average principal amount outstanding | 8.9 | % | 8.2 | % | |||
(a) | Repossessions are net of redemptions. The number of repossessions includes repossessions from the outstanding portfolio and from accounts already charged off. |
The Company had charge-offs on receivables from dealers of zero and $393 for the years ended December 31, 2017 and 2016, respectively. Net charge-offs on the capital lease receivables portfolio, which is in run-off, totaled $4,394 and $9,384 for the years ended December 31, 2017 and 2016, respectively.
Deferrals and Troubled Debt Restructurings
In accordance with the Company's policies and guidelines, the Company from time to time offers extensions (deferrals) to consumers on its retail installment contracts, whereby the consumer is allowed to defer a maximum of three payments per event to the end of the loan. More than 90% of deferrals granted are for two months. The Company's policies and guidelines limit the frequency of each new deferral that may be granted to one deferral every six months, regardless of the length of any prior
62
deferral. The maximum number of lifetime months extended for all automobile retail installment contracts is eight, while some marine and recreational vehicle contracts have a maximum of twelve months extended to reflect their longer term. Additionally, the Company generally limits the granting of deferrals on new accounts until a requisite number of payments has been received. During the deferral period, the Company continues to accrue and collect interest on the loan in accordance with the terms of the deferral agreement.
At the time a deferral is granted, all delinquent amounts may be deferred or paid. This may result in the classification of the loan as current and therefore not considered a delinquent account. However, there are instances when a deferral is granted but the loan is not brought completely current such as when the account days past due is greater than the deferment period granted. Such accounts are aged based on the timely payment of future installments in the same manner as any other account. Historically, the majority of deferrals are approved for borrowers who are either 31-60 or 61-90 days delinquent and these borrowers are typically reported as current after deferral. A customer is limited to one deferral each six months, and if a customer receives two or more deferrals over the life of the loan, the loan will advance to a TDR designation.
A loan that has been classified as a TDR remains so until the loan is liquidated through payoff or charge-off. TDRs are placed on nonaccrual status when the Company believes repayment under the revised terms is not reasonably assured and, at the latest when the account becomes past due more than 60 days, and considered for return to accrual when a sustained period of repayment performance has been achieved.
The following is a summary of deferrals on the Company's retail installment contracts held for investment as of the dates indicated:
December 31, 2017 | December 31, 2016 | ||||||||||||
(Dollar amounts in thousands) | |||||||||||||
Never deferred | $ | 16,407,960 | 63.1 | % | $ | 18,624,208 | 68.1 | % | |||||
Deferred once | 4,724,987 | 18.2 | % | 4,428,467 | 16.2 | % | |||||||
Deferred twice | 2,168,424 | 8.3 | % | 2,110,758 | 7.7 | % | |||||||
Deferred 3 - 4 times | 2,614,421 | 10.1 | % | 2,130,140 | 7.8 | % | |||||||
Deferred greater than 4 times | 70,740 | 0.3 | % | 64,574 | 0.2 | % | |||||||
Total | $ | 25,986,532 | $ | 27,358,147 | |||||||||
The Company evaluates the results of deferral strategies based upon the amount of cash installments that are collected on accounts after they have been deferred versus the extent to which the collateral underlying the deferred accounts has depreciated over the same period of time. Based on this evaluation, the Company believes that payment deferrals granted according to its policies and guidelines are an effective portfolio management technique and result in higher ultimate cash collections from the portfolio.
Changes in deferral levels do not have a direct impact on the ultimate amount of consumer finance receivables charged off. However, the timing of a charge-off may be affected if the previously deferred account ultimately results in a charge-off. To the extent that deferrals impact the ultimate timing of when an account is charged off, historical charge-off ratios, loss confirmation periods, and cash flow forecasts for loans classified as TDRs used in the determination of the adequacy of the Company's allowance for credit losses are also impacted. The change to the Company’s servicing practices (i.e. aging reflective partial
payments) did not have a significant impact to delinquencies, deferral strategies period over period, amount or timing of the
recognition of credit losses and allowance for loan losses.
Increased use of deferrals may result in a lengthening of the loss confirmation period, which would increase expectations of credit losses inherent in the portfolio and therefore increase the allowance for credit losses and related provision for credit losses. Changes in the charge-off ratios and loss confirmation periods are considered in determining the appropriate level of allowance for credit losses and related provision for credit losses, including the allowance and provision for loans that are not classified as TDRs. For loans that are classified as TDRs, the Company generally compares the present value of expected cash flows to the outstanding recorded investment of TDRs to determine the amount of TDR impairment and related provision for credit losses that should be recorded. For loans that are considered collateral-dependent, such as certain bankruptcy modifications, impairment is measured based on the fair value of the collateral, less its estimated cost to sell.
The Company also may agree, or be required by operation of law or by a bankruptcy court, to grant a modification involving one or a combination of the following: a reduction in interest rate, a reduction in loan principal balance, a temporary reduction of monthly payment, or an extension of the maturity date. The servicer of the Company's revolving personal loans also may grant modifications in the form of principal or interest rate reductions or payment plans. Similar to deferrals, the Company believes modifications are an effective portfolio management technique. Not all modifications are classified as TDRs as the
63
loan may not meet the scope of the applicable guidance or the modification may have been granted for a reason other than the borrower's financial difficulties.
A loan that has been classified as a TDR remains so until the loan is liquidated through payoff or charge-off. TDRs are placed on nonaccrual status when the Company believes repayment under the revised terms is not reasonably assured and at the latest, when the account becomes past due more than 60 days. For loans on nonaccrual status, interest income is recognized on a cash basis, however the Company continues to assess the recognition of cash received on those loans in order to identify whether certain of those loans should also be placed on a cost recovery basis. For TDR loans on nonaccrual status, the accrual of interest is resumed and reinstated if a delinquent account subsequently becomes 60 days or less past due. However, for TDR loans placed on cost recovery basis, the Company returns to accrual when a sustained period of repayment performance has been achieved (typically defined as six months). The impact to interest income of TDR loans that were on cost recovery which moved back to accrual, was insignificant as of December 31, 2017.
While the Company's nonaccrual designation remains consistent at more than 60 days past due, SC continuously assesses TDR collection performance. The recognition of interest income on impaired loans (such as TDR loans) is based on an expectation of whether the contractually due interest income is reasonably assured of collection. Prior to January 1, 2017, the collection performance of TDR loans supported classifying TDRs as nonaccrual only when past due more than 60 days, regardless of delinquency status at the time of the TDR event. However, the Company noted emerging trends related to recent TDR vintage performance that caused the Company to review whether collection of interest income was reasonably assured for certain TDRs. Accordingly, beginning January 1, 2017, based on observed TDR performance, the Company places certain additional TDRs on nonaccrual status when the Company believes repayment under the revised terms is not reasonably assured and at the latest, when the account becomes past due more than 60 days. The Company believes repayment under the revised terms is not reasonably assured for a retail installment contract that is already on nonaccrual (i.e., more than 60 days past due) and has received a modification or deferment that qualifies for a TDR event. In addition, any TDR that subsequently receives a third deferral is placed on nonaccrual status. Further, the Company has determined that certain of these loans should also be placed on a cost recovery basis. If the portfolio of TDRs with these characteristics continues to grow, this change would affect the magnitude of interest income to be recognized in the future.
TDR loans are generally measured based on the present value of expected cash flows. The recognition of interest income on TDR loans reflects management’s best estimate of the amount that is reasonably assured of collection and is consistent with the estimate of future cash flows used in the impairment measurement. Any accrued but unpaid interest is fully reserved for through the recognition of additional impairment on the recorded investment, if not expected to be collected. Accordingly, the placement of TDR loans on nonaccrual reduces the interest income recorded but that reduction is completely offset by a reduction in the impairment required for that loan; therefore the result is a net zero impact to the income statement.
As of December 31, 2017, the Company had $1,390,373 of TDRs on nonaccrual status. These loans included $790,461 of TDRs for which repayment was not reasonably assured. Accordingly, these loans were placed on nonaccrual status and followed cost recovery basis. Out of the total TDRs on cost recovery basis, $652,679 of TDRs were less than 60 days past due. The Company applied $56,740 of interest received, on these loans, towards principal (as compared to interest income), in accordance with cost recovery basis.
The following is a summary of the principal balance as of December 31, 2017 and 2016 of loans that have received these modifications and concessions:
December 31, 2017 | December 31, 2016 | ||||||
Retail Installment Contracts | |||||||
(Dollar amounts in thousands) | |||||||
Temporary reduction of monthly payment (a) | $ | 2,864,363 | $ | 2,472,432 | |||
Bankruptcy-related accounts | 77,992 | 109,494 | |||||
Extension of maturity date | 25,332 | 24,032 | |||||
Interest rate reduction | 56,764 | 64,180 | |||||
Max buy rate and fair lending (b) | 3,067,624 | 1,308,506 | |||||
Other | 176,838 | 79,554 | |||||
Total modified loans | $ | 6,268,913 | $ | 4,058,198 | |||
(a) | Reduces a customer's payment for a temporary time period (no more than six months) |
(b) | Max buy rate modifications comprises of loans modified by the Company to adjust the interest rate quoted in a dealer-arranged financing. Beginning in the third quarter of 2016, the Company reassesses the contracted APR when changes in the deal structure are made (e.g. higher down |
64
payment and lower vehicle price). If any of the changes result in a lower APR, the contracted rate is reduced. Substantially all deal structure changes occur within seven days of the date the contract is signed. These deal structure changes are made primarily to give the consumer the benefit of a lower rate due to an improved contracted deal structure compared to the deal structure that was approved during the underwriting process. Fair Lending modifications comprises of loans modified by the Company related to possible "disparate impact" credit discrimination in indirect vehicle finance. These modifications are not considered a TDR event because they do not relate to a concession provided to a customer experiencing financial difficulty.
A summary of the Company's recorded investment in TDRs as of the dates indicated is as follows:
December 31, 2017 | December 31, 2016 | ||||||
Retail Installment Contracts | |||||||
(Dollar amounts in thousands) | |||||||
Outstanding recorded investment (a) | $ | 6,261,432 | $ | 5,637,792 | |||
Impairment | (1,731,320 | ) | (1,611,295 | ) | |||
Outstanding recorded investment, net of impairment | $ | 4,530,112 | $ | 4,026,497 | |||
(a) | As of December 31, 2017, the outstanding recorded investment excludes $64.7 million of collateral-dependent bankruptcy TDRs that were written down by $29.2 million to fair value less cost to sell. |
A summary of the principal balance on the Company's delinquent TDRs as of the dates indicated is as follows:
December 31, 2017 | December 31, 2016 | ||||||
Retail Installment Contracts | |||||||
(Dollar amounts in thousands) | |||||||
Principal, 30-59 days past due | $ | 1,332,239 | $ | 1,253,848 | |||
Delinquent principal over 59 days (a) | 818,938 | 736,691 | |||||
Total delinquent TDR principal | $ | 2,151,177 | $ | 1,990,539 | |||
(a) | Interest is accrued until 60 days past due in accordance with the Company's accounting policy for retail installment contracts. The Company's delinquency ratio continues to be calculated using the end of period delinquent principal over 60 days. Refer to Part II, Item 6-"Selected Financial Data" for details on delinquent principal over 60 days and related delinquency ratios. |
As of December 31, 2017, the Company had $1,390,373 of TDRs on nonaccrual status, of which $790,461 of TDRs followed cost recovery basis. The remaining nonaccrual TDR loans follow cash basis of accounting. Out of the total TDRs on cost recovery basis, $652,679 of TDRs were less than 60 days past due. As of December 31, 2016, the Company had $665,068 of TDRs on nonaccrual status, none of which followed cost recovery basis.
As of December 31, 2017 and 2016, the Company did not have any dealer loans classified as TDRs and had not granted deferrals or modifications on any of these loans.
The following table summarizes the cumulative changes in the total outstanding recorded investment in TDRs, and its components, for retail installment contracts for the years ended December 31, 2017 and 2016:
For the Year Ended | |||||||
December 31, 2017 | December 31, 2016 | ||||||
(Dollar amounts in thousands) | |||||||
Balance — beginning of year | $ | 5,637,792 | $ | 4,601,502 | |||
New TDRs | 3,541,968 | 3,419,990 | |||||
Charge-offs | (2,011,299 | ) | (1,613,754 | ) | |||
Repurchases | 59,274 | 8,686 | |||||
Paydowns | (1,045,707 | ) | (771,693 | ) | |||
Other transfers | 79,404 | (6,939 | ) | ||||
Balance — end of year | $ | 6,261,432 | $ | 5,637,792 | |||
For loans not classified as TDRs, the Company generally estimates an appropriate allowance for credit losses based on delinquency status, its historical loss experience, estimated values of underlying collateral, and various economic factors. Once a loan has been classified as a TDR, it is generally assessed for impairment based on the present value of expected future cash flows discounted at the loan's original effective interest rate considering all available evidence. For loans that are considered collateral-dependent, such as certain bankruptcy modifications, impairment is measured based on the fair value of the
65
collateral, less its estimated cost to sell. Due to this key distinction in allowance calculations, the coverage ratio is higher for TDRs in comparison to non-TDRs.
The table below presents the Company’s allowance ratio for TDR and non-TDR individually acquired retail installment contracts as of December 31, 2017 and 2016:
December 31, 2017 | December 31, 2016 | ||||||
(Dollar amounts in thousands) | |||||||
TDR - Unpaid principal balance | $ | 6,261,894 | $ | 5,599,567 | |||
TDR - Impairment | 1,731,320 | 1,611,295 | |||||
TDR allowance ratio | 27.6 | % | 28.8 | % | |||
Non-TDR - Unpaid principal balance | $ | 19,681,394 | $ | 21,528,406 | |||
Non-TDR - Allowance | 1,529,815 | 1,799,760 | |||||
Non-TDR allowance ratio | 7.8 | % | 8.4 | % | |||
Total - Unpaid principal balance | $ | 25,943,288 | $ | 27,127,973 | |||
Total - Allowance | 3,261,135 | 3,411,055 | |||||
Total allowance ratio | 12.6 | % | 12.6 | % | |||
The allowance ratio for both TDR and non-TDR retail installment contracts decreased from December 31, 2016 to December 31, 2017. The decrease in the TDR allowance ratio is primarily driven by the nonaccrual of interest income for certain TDR loans which is offset in the impairment as it reduces the carrying value of TDR loans. The decrease in the non-TDR allowance ratio is driven by a combination of stabilizing credit performance and recovery rates.
Liquidity Management, Funding and Capital Resources
The Company requires a significant amount of liquidity to originate and acquire loans and leases, and to service debt. The Company funds its operations through lending relationships with 13 third-party banks, Santander and SHUSA, as well as through securitization in the ABS market and large flow agreements. The Company seeks to issue debt that appropriately matches the cash flows of the assets that it originates. The Company has more than $6.4 billion of stockholders’ equity that supports its access to the securitization markets, credit facilities, and flow agreements.
During the year ended December 31, 2017, the Company completed on-balance sheet funding transactions totaling approximately $15 billion, including:
• | three securitizations on the Company's SDART platform for $3.1 billion; |
• | issuance of two retained bonds on the Company's SDART platform for $155 million; |
• | five securitizations on the Company's DRIVE platform, for $5 billion; |
• | issuance of a retained bond on the Company's DRIVE platform for $339 million; |
• | four private amortizing lease facilities for $1.6 billion; |
• | ten top-ups and two re-levers of private amortizing loan and lease facilities for $3.5 billion; and |
• | one lease securitization on our SRT platform for $1.0 billion. |
The Company also completed $3.0 billion in asset sales, including $0.3 billion in recurring monthly sales with its third party flow partners, $2.5 billion in sales to Santander and $0.1 billion in sales to SBNA.
66
As of December 31, 2017, the Company's debt consisted of the following:
Third party revolving credit facilities | $ | 4,848,316 | |
Related party revolving credit facilities | 3,754,223 | ||
Total revolving credit facilities | 8,602,539 | ||
Public securitizations | 14,993,258 | ||
Privately issued amortizing notes | 7,564,637 | ||
Total secured structured financings | 22,557,895 | ||
Total debt | $ | 31,160,434 | |
Credit Facilities
Third-party Revolving Credit Facilities
Warehouse Facilities
The Company uses warehouse facilities to fund its originations. Each facility specifies the required collateral characteristics, collateral concentrations, credit enhancement, and advance rates. The Company's warehouse facilities generally are backed by auto retail installment contracts, auto leases, and, in some cases, personal loans. These facilities generally have one- or two-year commitments, staggered maturities and floating interest rates. The Company maintains daily funding forecasts for originations, acquisitions, and other large outflows such as tax payments to balance the desire to minimize funding costs with liquidity needs.
The Company's warehouse facilities generally have net spread, delinquency, and net loss ratio limits. Generally, these limits are calculated based on the portfolio collateralizing the respective line; however, for two of the Company's warehouse facilities, delinquency and net loss ratios are calculated with respect to the serviced portfolio as a whole. Failure to meet any of these covenants could trigger increased overcollateralization requirements or, in the case of limits calculated with respect to the specific portfolio underlying certain credit lines, result in an event of default under these agreements. If an event of default occurs under one of these agreements, the lenders could elect to declare all amounts outstanding under the impacted agreement to be immediately due and payable, enforce their interests against collateral pledged under the agreement, restrict the Company's ability to obtain additional borrowings under the agreement, and/or remove it as servicer. The Company has never had a warehouse facility terminated due to failure to comply with any ratio or a failure to meet any covenant. A default under one of these agreements can be enforced only with respect to the impacted facility.
The Company has two credit facilities with eight banks providing an aggregate commitment of $4.2 billion for the exclusive use of providing short-term liquidity needs to support FCA retail financing. As of December 31, 2017, there was an outstanding balance of $2.0 billion. These facilities are exclusively for lease financing and requires reduced advance rates in the event of delinquency, credit loss, or residual loss ratios exceeding specified thresholds.
Repurchase Facility
The Company obtains financing through four investment management agreements whereby the Company pledges retained subordinate bonds on its own securitizations as collateral for repurchase agreements with various borrowers and at renewable terms ranging up to one year. As of December 31, 2017, there was an outstanding balance of $744 million under these repurchase facilities.
Lines of Credit with Santander and Related Subsidiaries
Santander and certain of its subsidiaries, such as SHUSA, historically have provided, and continue to provide, the Company with significant funding support in the form of committed credit facilities. The Company's debt with these affiliated entities consisted of the following:
67
As of December 31, 2017 (amounts in thousands) | |||||||||||||||||
Counterparty | Utilized Balance | Committed Amount | Average Outstanding Balance | Maximum Outstanding Balance | |||||||||||||
Line of credit | Santander-NY | $ | — | $ | 1,000,000 | $ | 405,167 | $ | 1,000,000 | ||||||||
Line of credit | Santander-NY | 750,000 | 750,000 | 367,274 | 750,000 | ||||||||||||
Promissory Note | SHUSA | 250,000 | 250,000 | 250,000 | 250,000 | ||||||||||||
Promissory Note | SHUSA | 250,000 | 250,000 | 250,000 | 250,000 | ||||||||||||
Promissory Note | SHUSA | 300,000 | 300,000 | 300,000 | 300,000 | ||||||||||||
Promissory Note | SHUSA | 400,000 | 400,000 | 400,000 | 400,000 | ||||||||||||
Promissory Note | SHUSA | 500,000 | 500,000 | 500,000 | 500,000 | ||||||||||||
Promissory Note | SHUSA | 650,000 | 650,000 | 650,000 | 650,000 | ||||||||||||
Promissory Note | SHUSA | 650,000 | 650,000 | 650,000 | 650,000 | ||||||||||||
Line of credit | SHUSA | — | 3,000,000 | 140,746 | 750,000 | ||||||||||||
$ | 3,750,000 | $ | 7,750,000 | ||||||||||||||
Through SHUSA, Santander provides the Company with $3 billion of committed revolving credit that can be drawn on an unsecured basis. Santander, through its New York branch, provides the Company with $1.75 billion of long-term committed revolving credit facilities. The $1.75 billion of longer-term committed revolving credit facilities is composed of a $1 billion facility which permits unsecured borrowing but is generally collateralized by retained residuals and $750 million facility which is securitized by Prime retail installment loans. Both facilities have current maturity dates of December 31, 2018.
SHUSA provides the Company with $3 billion of term promissory notes with maturities ranging from March 2019 to December 2022.
Under an agreement with Santander, the Company pays a fee of 12.5 basis points per annum on certain warehouse facilities, as they renew, for which Santander provides a guarantee of the Company's servicing obligations. For revolving commitments, the guarantee fee will be paid on the total committed amount and for amortizing commitments, the guarantee fee is paid against each months ending balance. The guarantee fee only applies to additional facilities upon the execution of the counter-guaranty agreement related to a new facility or if reaffirmation is required on existing revolving or amortizing commitments as evidenced by a duly executed counter-guaranty agreement. The Company recognized guarantee fee expense of $6.0 million and $6.4 million for the years ended December 31, 2017 and 2016, respectively.
The Company entered into derivative financial instruments with Santander and certain of its affiliates as counterparty with outstanding notional amounts of $3.7 billion and $7.3 billion at December 31, 2017 and 2016, respectively. The Company had a collateral overage on derivative liabilities with Santander and affiliates of $2 million and $15 million at December 31, 2017 and 2016, respectively. Interest on these agreements totaled $1 million, $16 million, and $58 million for the years ended December 31, 2017, 2016, and 2015, respectively.
Secured Structured Financings
The Company's secured structured financings consist of both public, SEC-registered securitizations, as well as private securitizations under Rule 144A of the Securities Act and privately issued amortizing notes.
The Company obtains long-term funding for its receivables through securitization in the ABS market. ABS provides an attractive source of funding due to the cost efficiency of the market, a large and deep investor base, and tenors that appropriately match the cash flows of the debt to the cash flows of the underlying assets. The term structure of a securitization generally locks in fixed rate funding for the life of the underlying fixed rate assets, and the matching amortization of the assets and liabilities provides committed funding for the collateralized loans throughout their terms. In certain cases, SC may choose to issue floating rate securities based on market conditions. Because of prevailing market rates, the Company did not issue ABS transactions in 2008 and 2009, but began issuing ABS again in 2010.
The Company executes each securitization transaction by selling receivables to securitization Trusts that issue ABS to investors. To attain specified credit ratings for each class of bonds, these securitization transactions have credit enhancement requirements in the form of subordination, restricted cash accounts, excess cash flow, and overcollateralization, whereby more receivables are transferred to the Trusts than the amount of ABS issued by the Trusts.
68
Excess cash flows result from the difference between the finance and interest income received from the obligors on the receivables and the interest paid to the ABS investors, net of credit losses and expenses. Initially, excess cash flows generated by the Trusts are used to pay down outstanding debt in the Trusts, increasing overcollateralization until the targeted percentage has been reached. Once the targeted overcollateralization is reached it is maintained and excess cash flows generated by the Trusts are released to the holder of the residual (generally the Company) as distributions from the Trusts. The Company also receives monthly servicing fees as servicer for the Trusts. The Company's securitizations may require an increase in credit enhancement levels if Cumulative Net Losses, as defined in the documents underlying each ABS transaction, exceed a specified percentage of the pool balance. None of the Company's securitizations have Cumulative Net Loss percentages above their respective limits.
The Company's on-balance sheet securitization transactions utilize bankruptcy-remote special purpose entities, which are considered VIEs and meet the requirements to be consolidated in the Company's financial statements. Following a securitization, the finance receivables and the notes payable related to the securitized retail installment contracts remain on the consolidated balance sheets. The Company recognizes finance and interest income as well as fee income on the collateralized retail installment contracts and interest expense on the ABS issued. The Company also records a provision for credit losses to cover the estimate of inherent credit losses on the retail installment contracts. While these Trusts are consolidated in the Company's financial statements, these Trusts are separate legal entities. Thus, the finance receivables and other assets sold to these Trusts are legally owned by these Trusts, are available only to satisfy the notes payable related to the securitized retail installment contracts, and are not available to the Company's creditors or its other subsidiaries.
ABS credit spreads began widening in the second half of 2015 and continued into early 2016. However, beginning in second quarter of 2016 and through the end of the year, ABS credit spreads have improved through strong market demand. The Company completed a total of twelve securitizations in 2017, in addition to issuing several retained bonds on existing securitizations. The Company currently has 33 on-balance sheet securitizations outstanding with a cumulative ABS balance of approximately $15.3 billion. The Company's securitizations generally have several classes of notes, with principal paid sequentially based on seniority and any excess spread distributed to the residual holder. The company generally retains the lowest bond class and the residual, except in the case of off-balance sheet securitizations, which are described further below. The Company uses the proceeds from securitization transactions to repay borrowings outstanding under its credit facilities, originate and acquire loans and leases, and for general corporate purposes. The Company generally exercises clean-up call options on its securitizations when the collateral pool balance reaches 10% of its original balance.
The Company also periodically privately issues amortizing notes in transactions that are structured similarly to its public and Rule 144A securitizations but are issued to banks and conduits. The Company's securitizations and private issuances are collateralized by vehicle retail installment contracts, loans and vehicle leases.
Flow Agreements
In addition to the Company's credit facilities and secured structured financings, the Company has a flow agreement in place with a third party for charged off assets. Previously, the Company also had flow agreements with Bank of America and CBP. However, those agreements were terminated effective January 31 and May 1, 2017, respectively.
Loans and leases sold under these flow agreements are not on the Company's balance sheet but provide a stable stream of servicing fee income and may also provide a gain or loss on sale. The Company continues to actively seek additional flow agreements
Off-Balance Sheet Financing
Beginning in March 2017, the Company has the option to sell a contractually determined amount of eligible prime loans to Santander, through securitization platforms. As all of the notes and residual interests in the securitizations are issued to Santander, the Company recorded these transactions as true sales of the retail installment contracts securitized, and removed the sold assets from the Company's consolidated balance sheets.
The Company also continues to periodically execute Chrysler Capital-branded securitizations under Rule 144A of the Securities Act. Because all of the notes and residual interests in these securitizations are issued to third parties, these transactions are recorded as true sales of the retail installment contracts securitized, and the sold assets are removed from its consolidated balance sheets.
69
Cash Flow Comparison
SC has produced positive net cash from operating activities every year since 2003. The Company's investing activities primarily consist of originations and acquisitions of retail installment contracts. SC's financing activities primarily consist of borrowing, repayments of debt, and payment of dividends.
For the Year Ended December 31, | |||||||||||
2017 | 2016 | 2015 | |||||||||
(Dollar amounts in thousands) | |||||||||||
Net cash provided by operating activities | $ | 3,766,605 | $ | 4,473,117 | $ | 3,909,706 | |||||
Net cash used in investing activities | $ | (3,208,312 | ) | $ | (5,267,814 | ) | $ | (7,715,212 | ) | ||
Net cash provided by (used in) financing activities | $ | (190,668 | ) | $ | 935,984 | $ | 3,791,242 | ||||
Year Ended December 31, 2017 Compared to Year Ended December 31, 2016
Net cash provided by operating activities decreased from $4.5 billion for the year ended December 31, 2016 to $3.8 billion for the year ended December 31, 2017, primarily due to (a) decrease of $0.4 billion in outflows for originations of assets held for sale; (b) a decrease of $0.8 billion of proceeds from sales of assets held for sale, since there were no sales in the last quarter of 2017; (c) an increase of 0.4 billion in net income for the year 2017; and (d) a decrease of $0.8 billion in deferred tax expense as result of tax reform.
Net cash used in investing activities decreased by $2.1 billion from the year ended December 31, 2016 to the year ended December 31, 2017, primarily due to decrease of $1.7 billion in outflows for originations of loans held for investment.
Net cash provided by (used in) financing activities decreased by $1.1 billion from the year ended December 31, 2016 to the year ended December 31, 2017, primarily due to lower proceeds from notes payable.
Year Ended December 31, 2016 Compared to Year Ended December 31, 2015
Net cash provided by operating activities increased from $3.9 billion for the year ended December 31, 2015 to $4.5 billion for the year ended December 31, 2016, as there was a $1.5 billion decrease in outflows for originations of assets held for sale and a $265 million increase in non-cash net expenses, which was partially offset by a decrease of $757 million of proceeds from sales of assets held for sale, and a $131 million net decrease in cash due to a non-recurring $377 million tax refund in 2015 and a decrease in cash outflows from operation expenses, partially offset by an increase in collections.
Net cash used in investing activities decreased by $2.4 billion from the year ended December 31, 2015 to the year ended December 31, 2016, primarily due to a $4.0 billion decrease in outflows for originations of loans held for investment, partially offset by a $1.4 billion decrease in proceeds from sale of loans held for investment, and a $447 million increase in purchases of leased vehicles.
Net cash provided by financing activities decreased by $2.9 billion from the year ended December 31, 2015 to the year ended December 31, 2016, primarily due to $2.8 billion lower net proceeds from borrowings, as the Company decreased its use of off-balance sheet sales to finance originations.
Contingencies and Off-Balance Sheet Arrangements
Lending Arrangements
In April 2013, the Company entered into certain agreements with Bluestem. The terms of the agreements include a commitment by the Company to purchase new advances originated by Bluestem, along with existing balances on accounts with new advances, for an initial term ending in April 2020 and, based on an amendment in June 2014, renewable through April 2022 at Bluestem's option. Each customer account generated under the agreements generally is approved with a credit limit higher than the amount of the initial purchase, with each subsequent purchase automatically approved as long as it does not cause the account to exceed its limit and the customer is in good standing. The Company is required to make a monthly profit-sharing payment to Bluestem. Although the Company has classified loans originated under this agreement as held for sale, it continues to perform in accordance with the terms and operative provisions of these agreements. The Company expects seasonal origination volumes to remain consistent with historical trends.
70
Under terms of an application transfer agreement with Nissan, the Company has the first opportunity to review for its own portfolio any credit applications turned down by Nissan's captive finance company. The agreement does not require the Company to originate any loans, but for each loan originated the Company will pay Nissan a referral fee.
The Company also has agreements with SBNA to service auto and recreational and marine vehicle portfolios. These agreements call for a periodic retroactive adjustment, based on cumulative return performance, of the servicing fee rate to inception of the contract.
Flow Agreements
The Company's former retail installment contract flow agreements with Bank of America and CBP may require the Company to make servicer performance or loss-sharing payments. These agreements relate to the Company's Chrysler Capital relationship and are described in Recent Developments and Other Factors Affecting The Company's Results of Operations.
Credit Enhancement Arrangements
In connection with the sale of retail installment contracts to securitization trusts, the Company has made standard representations and warranties customary to the consumer finance industry. Violations of these representations and warranties may require the Company to repurchase loans previously sold. As of December 31, 2017, there were no loans that were the subject of a demand to repurchase or replace for breach of representations and warranties for the Company's asset-backed securities or other sales.
Chrysler Agreement-related Contingencies
Throughout the ten-year term of the Chrysler Agreement, the Company is obligated to make quarterly payments to FCA representing a percentage of gross profits earned from a portion of the Chrysler Capital consumer loan and lease platform. The Company is also obligated to make quarterly payments to FCA sharing residual gains on leases in quarters in which the Company experiences lease terminations with gains over a specified percentage threshold.
Contractual Obligations
The Company leases its headquarters in Dallas, Texas, servicing centers in Texas, Colorado, Arizona, and Puerto Rico, and operations facilities in California, Texas and Colorado under non-cancelable operating leases that expire at various dates through 2027.
The following table summarizes the Company's contractual obligations as of December 31, 2017:
Less than 1 year | 1-3 years | 3-5 years | More than 5 years | Total | |||||||||||||||
(In thousands) | |||||||||||||||||||
Operating lease obligations | $ | 12,534 | $ | 25,911 | $ | 25,189 | $ | 44,663 | $ | 108,297 | |||||||||
Notes payable - revolving facilities | 3,428,233 | 3,370,083 | 1,800,000 | — | 8,598,316 | ||||||||||||||
Notes payable - secured structured financings | 226,046 | 6,772,458 | 11,404,667 | 4,205,378 | 22,608,549 | ||||||||||||||
Contractual interest on debt | 734,554 | 781,099 | 215,070 | 26,259 | 1,756,982 | ||||||||||||||
$ | 4,401,367 | $ | 10,949,551 | $ | 13,444,926 | $ | 4,276,300 | $ | 33,072,144 | ||||||||||
Risk Management Framework
The Company has established a Board-approved Governance Framework that outlines governance principles organized into the following sections: strategic plan; risk identification and assessment; risk appetite; delegation of authority, decision making and accountability; risk management, risk taking and risk ownership; oversight and controls; monitoring, reporting and escalation; incentive compensation; and shared services. The Company also uses three lines of defense risk governance structure that assigns responsibility for risk management among front-line business personnel, an independent risk management function, and internal audit. The Chief Risk Officer (CRO), who reports to the CEO and to the Risk Committee of the Board and is independent of any business line, is responsible for developing and maintaining a risk framework designed to ensure that risks are appropriately identified and mitigated, and for reporting on the overall level of risk in the Company. The CRO is also accountable to SHUSA's Chief Risk Officer.
71
The Risk Committee is charged with responsibility for establishing the governance over the risk management process, providing oversight in managing the aggregate risk position and reporting on the comprehensive portfolio of risk categories and the potential impact these risks can have on the Company's risk profile. The Risk Committee meets no less often than quarterly and is chartered to assist the Board in promoting the best interests of the Company by overseeing policies, procedures and risk practices relating to enterprise-wide risk and compliance with regulatory guidance. Members of the Risk Committee are individuals whose experiences and qualifications can lead to broad and informed views on risk matters facing the Company and the financial services industry, including, but not limited to, risk matters that address credit, market, liquidity, operational, compliance and other general business conditions. A comprehensive risk report is submitted by the CRO to the Risk Committee and to the Board at least quarterly providing management’s view of the Company's risk position.
In addition to the Board and the Risk Committee, the CEO and CRO delegate risk responsibility to management committees. These committees include the Asset Liability Committee and the Enterprise Risk Management Committee (ERMC). The CRO participates in each of these committees and chairs the ERMC.
Additionally, the Company has established an Enterprise Risk Management (ERM) function and implemented a Board-approved Framework to manage risks across the organization in a comprehensive, consistent and effective fashion, enabling the firm to achieve its strategic priorities, including its business plan, within its expressed risk appetite. Accordingly, ERM oversees implemented the Board-approved Enterprise Risk Appetite Framework through which ERM manages SC's Risk Appetite Statement, which details the type of risk and size of risk-taking activities permissible in the course of executing business strategy.
Credit Risk
The risk inherent in the Company's loan and lease portfolios is driven by credit and collateral quality, and is affected by borrower-specific and economy-wide factors such as changes in employment. The Company manages this risk through its underwriting, pricing and credit approval guidelines and servicing policies and practices, as well as geographic and other concentration limits.
The Company's automated originations process is intended to reflect a disciplined approach to credit risk management. The Company's robust historical data on both organically originated and acquired loans is used by Company to perform advanced loss forecasting. Each applicant is automatically assigned a proprietary loss forecasting score using information such as FICO®, debt-to-income ratio, loan-to-value ratio, and more than 30 other predictive factors, placing the applicant in one of 100 pricing tiers. The Company continuously maintains and adjusts the pricing in each tier to reflect market and risk trends. In addition to the automated process, the Company maintains a team of underwriters for manual review, consideration of exceptions, and review of deal structures with dealers. The Company generally tightens its underwriting requirements in times of greater economic uncertainty to compete in the market at loss and approval rates acceptable for meeting the Company's required returns. The Company's underwriting policy has also been adjusted to meet the requirements of the Company's contracts such as the Chrysler Agreement. In both cases, the Company has accomplished this by adjusting risk-based pricing, the material components of which include interest rate, down payment, and loan-to-value.
The Company monitors early payment defaults and other potential indicators of dealer or customer fraud and uses the monitoring results to identify dealers who will be subject to more extensive requirements when presenting customer applications, as well as dealers with whom the Company will not do business at all.
Market Risk
Interest Rate Risk
The Company measures and monitors interest rate risk on at least a monthly basis. The Company borrows money from a variety of market participants to provide loans and leases to the Company's customers. The Company's gross interest rate spread, which is the difference between the income earned through the interest and finance charges on the Company's finance receivables and lease contracts and the interest paid on the Company's funding, will be negatively affected if the expense incurred on the Company's borrowings increases at a faster pace than the income generated by the Company assets.
The Company's Interest Rate Risk Policy is designed to measure, monitor, and manage the potential volatility in earnings stemming from changes in interest rates. The Company generates financing receivables which are predominantly fixed rate and borrow with a mix of fixed rate and variable rate funding. To the extent that the Company's asset and liability re-pricing characteristics are not effectively matched, the Company may utilize interest rate derivatives, such as interest rate swap agreements, to achieve the desired risk tolerance. As of December 31, 2017, the notional value of the Company's interest rate
72
swap agreements was $6.7 billion. The Company also enters into Interest Rate Cap agreements as required under certain lending agreements. In order to mitigate any interest rate risk assumed in the Cap agreement required under the lending agreement, the Company may enter into a second interest rate cap (Back-to-Back). As of December 31, 2017 the notional value of the Company’s interest rate cap agreements was $21.8 billion, under which, all notional was executed Back-to-Back.
The Company monitors its interest rate exposure by conducting interest rate sensitivity analysis. For purposes of reflecting a possible impact to earnings, the twelve-month net interest income impact of an instantaneous 100 basis point parallel shift in prevailing interest rates is measured. As of December 31, 2017, the twelve-month impact of a 100 basis point parallel increase in the interest rate curve would decrease the Company's net interest income by $11 million. In addition to the sensitivity analysis on net interest income, the Company also measures Market Value of Equity (MVE) to view the interest rate risk position. MVE measures the change in value of balance sheet instruments in response to an instantaneous 100 basis point parallel increase, including and beyond the net interest income twelve-month horizon. As of December 31, 2017, the impact of a 100 basis point parallel increase in the interest rate curve would decrease the Company's MVE by $50 million.
Collateral Risk
The Company's lease portfolio presents an inherent risk that residual values recognized upon lease termination will be lower than those used to price the contracts at inception. Although the Company has elected not to purchase residual value insurance at the present time, the Company's residual risk is somewhat mitigated by the residual risk-sharing agreement with FCA. Under the agreement, the Company is responsible for incurring the first portion of any residual value gains or losses up to the first 8%. The Company and FCA then equally share the next 4% of any residual value gains or losses (i.e., those gains or losses that exceed 8% but are less than 12%). Finally, FCA is responsible for residual value gains or losses over 12%, capped at a certain limit, after which the Company incurs any remaining gains or losses. From the inception of the agreement with FCA through the year ended December 31, 2017, approximately 85% of full term leases have not exceeded the first and second portions of any residual losses under the agreement. The Company also utilizes industry data, including the ALG benchmark for residual values, and employ a team of individuals experienced in forecasting residual values.
Similarly, lower used vehicle prices also reduce the amount that can be recovered when remarketing repossessed vehicles that serve as collateral underlying loans. The Company manages this risk through loan-to-value limits on originations, monitoring of new and used vehicle values using standard industry guides, and active, targeted management of the repossession process.
The Company does not currently have material exposure to currency fluctuations or inflation.
Liquidity Risk
The Company views liquidity as integral to other key elements such as capital adequacy, asset quality and profitability. The Company’s primary liquidity risk relates to the ability to finance new originations through the Bank and ABS securitization markets. The Company has a robust liquidity policy that is intended to manage this risk. The liquidity policy establishes the following guidelines:
• | that the Company maintains at least eight external credit providers (as of December 31, 2017, it had thirteen); |
• | that the Company relies on Santander and affiliates for no more than 30% of its funding (as of December 31, 2017, Santander and affiliates provided 12% of its funding); |
• | that no single lender's commitment should comprise more than 33% of the overall committed external lines (as of December 31, 2017, the highest single lender's commitment was 21% (not including repo)); |
• | that no more than 35% of the Company's debt mature in the next six months and no more than 65% of the Company's debt mature in the next twelve months (as of December 31, 2017, only 11.31% and 32.41%, respectively, of its debt is scheduled to mature in these time frames); and |
• | that the Company maintains unused capacity of at least $6.0 billion, including flow agreements, in excess of the Company's expected peak usage over the following twelve months (as of December 31, 2017, the Company had twelve-month rolling unused capacity of $9.8 billion). |
The Company's liquidity policy also requires that the Company's Asset Liability Committee monitor many indicators, both market-wide and company-specific, to determine if action may be necessary to maintain the Company's liquidity position. The Company's liquidity management tools include daily, monthly and twelve-month rolling cash requirements forecasts, long term strategic planning forecasts, monthly funding usage and availability reports, daily sources and uses reporting, structural liquidity risk exercises, key risk indicators, and the establishment of liquidity contingency plans. The Company also performs monthly stress tests in which it forecasts the impact of various negative scenarios (alone and in combination), including
73
reduced credit availability, higher funding costs, lower advance rates, lending covenant breaches, lower dealer discount rates, and higher credit losses.
The Company generally looks for funding first from structured secured financings, second from third-party credit facilities, and last from Santander. The Company believes this strategy helps reduce its reliance on borrowings under funding commitments from Santander and SHUSA. Additionally, the Company can reduce originations to significantly lower levels if necessary during times of limited liquidity.
The Company has established a qualified like-kind exchange program to defer tax liability on gains on sale of vehicle assets at lease termination. If the Company does not meet the safe harbor requirements of IRS Revenue Procedure 2003-39, the Company may be subject to large, unexpected tax liabilities, thereby generating immediate liquidity needs. The Company believes that its compliance monitoring policies and procedures are adequate to enable the Company to remain in compliance with the program requirements. The Tax Cuts and Jobs Act permanently eliminated the ability to exchange personal property after January 1, 2018 which will result in the like-kind exchange program being discontinued in 2018.
Operational Risk
The Company is exposed to operational risk loss arising from failures in the execution of our business activities. These relate to failures arising from inadequate or failed processes, failures in its people or systems, or from external events. The Company's operational risk management program Third Party Risk Management, Business Continuity Management, Information Risk Management, Information Risk Management, Fraud Risk Management, and Operational Risk Management, with key program elements covering Loss Event, Issue Management, Risk Reporting and Monitoring, and Risk Control Self-Assessment (RCSA).
To mitigate operational risk, the Company maintains an extensive compliance, internal control, and monitoring framework, which includes the gathering of corporate control performance threshold indicators, Sarbanes-Oxley testing, monthly quality control tests, ongoing compliance monitoring with applicable regulations, internal control documentation and review of processes, and internal audits. The Company also utilizes internal and external legal counsel for expertise when needed. Upon hire and annually, all associates receive comprehensive mandatory regulatory compliance training. In addition, the Board receives annual regulatory and compliance training. The Company uses industry-leading call mining that assist the Company in analyzing potential breaches of regulatory requirements and customer service. The Company's call mining software analyzes all customer service calls, converting speech to text, and mining for specific words and phrases that may indicate inappropriate comments by a representative. The software also detects escalated voice volume, enabling a supervisor to intervene if necessary. This tool is intended to enable the Company to effectively manage and identify training opportunities for associates, as well as track and resolve customer complaints through a robust quality assurance program.
Model Risk
The Company mitigates model risk through a robust model validation process, which includes committee governance and a series of tests and controls. The Company utilizes SHUSA's Model Risk Management group for all model validation to verify models are performing as expected and in line with their design objectives and business uses.
Critical Accounting Estimates
Accounting policies are integral to understanding the Company's Management's Discussion and Analysis of Financial Condition and Results of Operations. The preparation of financial statements in accordance with U.S. Generally Accepted Accounting Principles (U.S. GAAP) requires management to make certain judgments and assumptions, on the basis of information available at the time of the financial statements, in determining accounting estimates used in the preparation of these statements. The Company's significant accounting policies are described in Note 1 to the Consolidated Financial Statements; critical accounting estimates are described in this section. An accounting estimate is considered critical if the estimate requires management to make assumptions about matters that were highly uncertain at the time the accounting estimate was made. If actual results differ from the Company's judgments and assumptions, then it may have an adverse impact on the results of operations, financial condition, and cash flows. The Company's management has discussed the development, selection, and disclosure of these critical accounting estimates with the Audit Committee of the Board, and the Audit Committee has reviewed the Company's disclosure relating to these estimates.
Credit Loss Allowance
The Company maintains a credit loss allowance (the allowance) for the Company's held-for-investment portfolio, excluding those loans measured at fair value in accordance with applicable accounting standards. For loans not classified as TDRs, the
74
allowance is maintained at a level estimated to be adequate to absorb losses of recorded investment inherent in the portfolio, based upon a holistic assessment including both quantitative and qualitative considerations. For impaired loans, including those classified as TDRs, the allowance is comprised of impairment measured using a discounted cash flow model.
The quantitative framework is supported by credit models that consider several credit quality indicators including, but not limited to, historical loss experience and current portfolio trends. The transition based Markov model provides data on a granular and disaggregated/segment basis as it utilizes the recently observed loan transition rates from various loan statuses to forecast future losses. Transition matrices in the Markov model are categorized based on account characteristics, such as delinquency status, TDR type (deferment, modification, etc.), internal credit risk, origination channel, months on book, thin/thick file and time since TDR event. The credit models utilized differ among the Company's individually acquired retail installment contracts, personal loans, capital leases and receivables from dealers. The credit models are adjusted by management through qualitative reserves to incorporate information reflective of the current business environment.
Management uses the qualitative framework to exercise judgment about matters that are inherently uncertain and that are not considered by the quantitative framework. These adjustments are documented and reviewed through the Company's risk management processes. Furthermore, management reviews, updates, and validates its process and loss assumptions on a periodic basis. This process involves an analysis of data integrity, review of loss and credit trends, a retrospective evaluation of actual loss information to loss forecasts, and other analyses.
Accretion of Discounts and Subvention on Retail Installment Contracts
Finance receivables held for investment consist largely of nonprime automobile finance receivables, which are primarily acquired individually from dealers at a nonrefundable discount from the contractual principal amount. The Company also pays dealer participation on certain receivables. The amortization of discounts, subvention payments from manufacturers, and other origination costs are recognized as adjustments to the yield of the related contracts. The Company applies significant assumptions including prepayment speeds in estimating the accretion rates used to approximate effective yield. The Company estimates future principal prepayments specific to pools of homogenous loans which are based on the vintage, credit quality at origination and term of the loan. Prepayments in our portfolio are sensitive to credit quality, with higher credit quality loans generally experiencing higher voluntary prepayment rates than lower credit quality loans. The impact of defaults is not considered in the prepayment rate; the prepayment rate only considers voluntary prepayments. The resulting prepayment rate specific to each pool is based on historical experience, and is used as an input in the calculation of the constant effective yield.
Valuation of Automotive Lease Assets and Residuals
The Company has significant investments in vehicles in the Company's operating lease portfolio. In accounting for operating leases, management must make a determination at the beginning of the lease contract of the estimated realizable value (i.e., residual value) of the vehicle at the end of the lease. Residual value represents an estimate of the market value of the vehicle at the end of the lease term, which typically ranges from two to four years. At contract inception, the Company determines the projected residual value based on an internal evaluation of the expected future value. This evaluation is based on a proprietary model using internally-generated data that is compared against third party, independent data for reasonableness. The customer is obligated to make payments during the term of the lease for the difference between the purchase price and the contract residual value plus a finance charge. However, since the customer is not obligated to purchase the vehicle at the end of the contract, the Company is exposed to a risk of loss to the extent the value of the vehicle is below the residual value estimated at contract inception. Management periodically performs a detailed review of the estimated realizable value of leased vehicles to assess the appropriateness of the carrying value of lease assets.
To account for residual risk, the Company depreciates automotive operating lease assets to estimated realizable value on a straight-line basis over the lease term. The estimated realizable value is initially based on the residual value established at contract inception. Periodically, the Company revises the projected value of the lease vehicle at termination based on current market conditions, and other relevant data points, and adjusts depreciation expense appropriately over the remaining term of the lease.
The Company periodically evaluates its investment in operating leases for impairment if circumstances, such as a systemic and material decline in used vehicle values, indicates that an impairment may exist. These circumstances could include, for example, shocks to oil and gas prices (which may have a pronounced impact on certain models of vehicles) or pervasive manufacturer defects (which may systemically affect the value of a particular vehicle brand or model). Impairment is determined to exist if fair value of the leased asset is less than carrying value and it is determined that the net carrying value is not recoverable. The net carrying value of a leased asset is not recoverable if it exceeds the sum of the undiscounted expected future cash flows expected to result from the lease payments and the estimated residual value upon eventual disposition. If our operating lease assets are considered to be impaired, the impairment is measured as the amount by which the carrying amount
75
of the assets exceeds the fair value as estimated by discounted cash flows. No impairment was recognized in 2017, 2016, or 2015.
The Company's depreciation methodology for operating lease assets considers management's expectation of the value of the vehicles upon lease termination, which is based on numerous assumptions and factors influencing used vehicle values. The critical assumptions underlying the estimated carrying value of automotive lease assets include: (1) estimated market value information obtained and used by management in estimating residual values, (2) proper identification and estimation of business conditions, (3) SC's remarketing abilities, and (4) automotive manufacturer vehicle and marketing programs. Changes in these assumptions could have a significant impact on the value of the lease residuals. Expected residual values include estimates of payments from automotive manufacturers related to residual support and risk-sharing agreements, if any. To the extent an automotive manufacturer is not able to fully honor its obligation relative to these agreements, the Company's depreciation expense would be negatively impacted.
Provision for Income Taxes
In determining taxable income, the Company must make certain estimates and judgments. These estimates and judgments affect the calculation of certain tax liabilities and the determination of the recoverability of certain of the deferred tax assets, which arise from temporary differences between the tax and financial statement recognition of revenue and expense.
The Company's largest deferred tax liability relates to leased vehicles. This liability is primarily due to the acceleration of depreciation and the deferral of tax gains through like-kind exchange transactions on the leased auto portfolio. The Tax Cuts and Jobs Act permanently eliminated the ability to exchange personal property after January 1, 2018 which will result in the like-kind exchange program being discontinued in 2018.
Because the volume of the Company's loan sales exceeds the “negligible sales” exception under section 475 of the Internal Revenue Code, the Company is classified as a dealer in securities for tax purposes. Accordingly, the Company must report its finance receivables and loans at fair value in the SC's tax returns. Changes in the fair value of SC's receivables and loans portfolios have a significant impact on the size of deferred tax assets and liabilities. Estimated fair value is dependent on key assumptions including prepayment rates, expected recovery rates, charge off rates and timing, and discount rates.
In evaluating the Company's ability to recover deferred tax assets, the Company considers all available positive and negative evidence including past operating results and the Company's forecast of future taxable income. In estimating future taxable income, the Company develops assumptions including the amount of future pre-tax operating income, the reversal of temporary differences and the implementation of feasible and prudent tax planning strategies. These assumptions require significant judgment about the forecasts of future taxable income and are consistent with the plans and estimates the Company is using to manage SC's underlying businesses.
Changes in tax laws and rates could also affect recorded deferred tax assets and liabilities in the future. Management records the effect of a tax rate or law change on the Company's deferred tax assets and liabilities in the period of enactment. Future tax rate or law changes could have a material effect on the Company's results of operations, financial condition or cash flows.
In addition, the calculation of the Company's tax liabilities involves dealing with uncertainties in the application of complex tax regulations in the United States (including Puerto Rico). The Company recognizes potential liabilities and records tax liabilities for anticipated tax audit issues in the United States and other tax jurisdictions based on estimates of whether, and the extent to which, additional taxes will be due in accordance with the authoritative guidance regarding the accounting for uncertain tax positions. The Company adjusts these reserves in light of changing facts and circumstances; however, due to the complexity of some of these uncertainties, the ultimate resolution may result in a payment that is materially different from the current estimate of the tax liabilities. If the Company's estimate of tax liabilities proves to be less than the ultimate assessment, an additional charge to expense would result. If payment of these amounts ultimately proves to be less than the recorded amounts, the reversal of the liabilities would result in tax benefits being recognized in the period when the Company determines the liabilities are no longer necessary.
For additional information regarding the Company's provision for income taxes, refer to Note 10 to the Consolidated Financial Statements.
Fair Value of Financial Instruments
The Company uses fair value measurements to determine fair value adjustments to certain instruments and fair value disclosures. Refer to Note 15 to the Consolidated Financial Statements for a description of valuation methodologies used to measure material assets and liabilities at fair value and details of the valuation models, key inputs to those models, and significant assumptions utilized. The Company follows the fair value hierarchy set forth in Note 15 to the Consolidated
76
Financial Statements in order to prioritize the inputs utilized to measure fair value. The Company reviews and modifies, as necessary, the fair value hierarchy classifications on a quarterly basis. As such, there may be reclassifications between hierarchy levels due to changes in inputs to the valuation techniques used to measure fair value.
The Company has numerous internal controls in place to ensure the appropriateness of fair value measurements. Additionally, a number of internal controls are in place to ensure the fair value measurements are reasonable, including controls over the inputs into and the outputs from the fair value measurements. Certain valuations will also be benchmarked to market indices when appropriate and available.
Considerable judgment is used in forming conclusions from market observable data used to estimate the Company's Level 2 fair value measurements and in estimating inputs to the Company's internal valuation models used to estimate Level 3 fair value measurements. Level 3 inputs such as interest rate movements, prepayment speeds, credit losses, recovery rates and discount rates are inherently difficult to estimate. Changes to these inputs can have a significant effect on fair value measurements. Accordingly, the Company's estimates of fair value are not necessarily indicative of the amounts that could be realized or would be paid in a current market exchange.
Recent Accounting Pronouncements
Information concerning the Company’s implementation and impact of new accounting standards issued by the Financial Accounting Standards Board (FASB) is discussed in Note 1 to the Consolidated Financial Statements under “Recent Accounting Pronouncements.”
Market Data
Market data used in this Annual Report on Form 10-K has been obtained from independent industry sources and publications, such as the Federal Reserve Bank of New York; the Federal Reserve Bank of Philadelphia; the Federal Reserve Board; The Conference Board; the CFPB; Equifax Inc.; Experian Automotive; FCA; Fair Isaac Corporation; FICO® Banking Analytics Blog; Polk Automotive; the United States Department of Commerce: Bureau of Economic Analysis; J.D. Power; and Ward’s Automotive Reports. Forward-looking information obtained from these sources is subject to the same qualifications and the additional uncertainties regarding the other forward-looking statements in this Annual Report on Form 10-K.
For purposes of this Annual Report on Form 10-K, the Company categorizes the prime segment as borrowers with FICO® scores of 640 and above and the non-prime segment as borrowers with FICO® scores below 640.
Other Information
Further information on risk factors can be found under Part II, Item 1A - “Risk Factors.”
77
ITEM 7(A). | QUANTITATIVE AND QUALITATIVE DISCLOSURES ABOUT MARKET RISK |
Incorporated by reference from Part II, Item 7 - “Management’s Discussion and Analysis of Financial Conditions and Results of Operations —Risk Management Framework” above.
ITEM 8. | FINANCIAL STATEMENTS AND SUPPLEMENTARY DATA |
INDEX TO FINANCIAL STATEMENTS
78
Report of Independent Registered Public Accounting Firm
To Board of Directors and Stockholders of
Santander Consumer USA Holdings Inc.
Opinions on the Financial Statements and Internal Control over Financial Reporting
We have audited the accompanying consolidated balance sheets of Santander Consumer USA Holdings Inc. and its subsidiaries as of December 31, 2017 and December 31, 2016, and the related consolidated statements of income and comprehensive income, equity and cash flows for each of the two years in the period ended December 31, 2017, including the related notes (collectively referred to as the “consolidated financial statements”). We also have audited the Company's internal control over financial reporting as of December 31, 2017, based on criteria established in Internal Control - Integrated Framework (2013) issued by the Committee of Sponsoring Organizations of the Treadway Commission (COSO).
In our opinion, the consolidated financial statements referred to above present fairly, in all material respects, the financial position of the Company as of December 31, 2017 and December 31, 2016, and the results of their operations and their cash flows for each of the two years in the period ended December 31, 2017 in conformity with accounting principles generally accepted in the United States of America. Also in our opinion, the Company did not maintain, in all material respects, effective internal control over financial reporting as of December 31, 2017, based on criteria established in Internal Control - Integrated Framework (2013) issued by the COSO because material weaknesses in internal control over financial reporting related to deficiencies in the Control Environment, Risk Assessment, Control Activities and Monitoring and additional material weaknesses in the Company’s Development, Approval, and Monitoring of Models Used to Estimate the Credit Loss Allowance; and Identification, Governance, and Monitoring of Models Used to Estimate Accretion existed as of that date.
A material weakness is a deficiency, or a combination of deficiencies, in internal control over financial reporting, such that there is a reasonable possibility that a material misstatement of the annual or interim financial statements will not be prevented or detected on a timely basis. The material weaknesses referred to above are described in Management's Annual Report on Internal Control over Financial Reporting appearing under Item 9A. We considered these material weaknesses in determining the nature, timing, and extent of audit tests applied in our audit of the December 31, 2017 consolidated financial statements, and our opinion regarding the effectiveness of the Company’s internal control over financial reporting does not affect our opinion on these consolidated financial statements.
Basis for Opinions
The Company's management is responsible for these consolidated financial statements, for maintaining effective internal control over financial reporting, and for its assessment of the effectiveness of internal control over financial reporting included in management's report referred to above. Our responsibility is to express opinions on the Company’s consolidated financial statements and on the Company's internal control over financial reporting based on our audits. We are a public accounting firm registered with the Public Company Accounting Oversight Board (United States) ("PCAOB") and are required to be independent with respect to the Company in accordance with the U.S. federal securities laws and the applicable rules and regulations of the Securities and Exchange Commission and the PCAOB.
We conducted our audits in accordance with the standards of the PCAOB. Those standards require that we plan and perform the audits to obtain reasonable assurance about whether the consolidated financial statements are free of material misstatement, whether due to error or fraud, and whether effective internal control over financial reporting was maintained in all material respects.
Our audits of the consolidated financial statements included performing procedures to assess the risks of material misstatement of the consolidated financial statements, whether due to error or fraud, and performing procedures that respond to those risks. Such procedures included examining, on a test basis, evidence regarding the amounts and disclosures in the consolidated financial statements. Our audits also included evaluating the accounting principles used and significant estimates made by management, as well as evaluating the overall presentation of the consolidated financial statements. Our audit of internal control over financial reporting included obtaining an understanding of internal control over financial reporting, assessing the risk that a material weakness exists, and testing and evaluating the design and operating effectiveness of internal control based on the assessed risk. Our audits also included performing such other procedures as we considered necessary in the circumstances. We believe that our audits provide a reasonable basis for our opinions.
79
Definition and Limitations of Internal Control over Financial Reporting
A company’s internal control over financial reporting is a process designed to provide reasonable assurance regarding the reliability of financial reporting and the preparation of financial statements for external purposes in accordance with generally accepted accounting principles. A company’s internal control over financial reporting includes those policies and procedures that (i) pertain to the maintenance of records that, in reasonable detail, accurately and fairly reflect the transactions and dispositions of the assets of the company; (ii) provide reasonable assurance that transactions are recorded as necessary to permit preparation of financial statements in accordance with generally accepted accounting principles, and that receipts and expenditures of the company are being made only in accordance with authorizations of management and directors of the company; and (iii) provide reasonable assurance regarding prevention or timely detection of unauthorized acquisition, use, or disposition of the company’s assets that could have a material effect on the financial statements.
Because of its inherent limitations, internal control over financial reporting may not prevent or detect misstatements. Also, projections of any evaluation of effectiveness to future periods are subject to the risk that controls may become inadequate because of changes in conditions, or that the degree of compliance with the policies or procedures may deteriorate.
/s/ PricewaterhouseCoopers LLP
Dallas, Texas
February 28, 2018
We have served as the Company’s auditor since 2016.
80
Report of Independent Registered Public Accounting Firm
To the Board of Directors and Stockholders of
Santander Consumer USA Holdings Inc.
Dallas, Texas
We have audited the accompanying consolidated statements of income and comprehensive income, equity, and cash flows of Santander Consumer USA Holdings Inc. and subsidiaries (the "Company") for the year ended December 31, 2015. These financial statements are the responsibility of the Company's management. Our responsibility is to express an opinion on these financial statements based on our audit.
We conducted our audit in accordance with the standards of the Public Company Accounting Oversight Board (United States). Those standards require that we plan and perform the audit to obtain reasonable assurance about whether the financial statements are free of material misstatement. An audit includes examining, on a test basis, evidence supporting the amounts and disclosures in the financial statements. An audit also includes assessing the accounting principles used and significant estimates made by management, as well as evaluating the overall financial statement presentation. We believe that our audit provides a reasonable basis for our opinion.
In our opinion, such consolidated financial statements referred to above present fairly, in all material respects, the results of operations and the cash flows of Santander Consumer USA Holdings Inc. and subsidiaries for the year ended December 31, 2015, in conformity with accounting principles generally accepted in the United States of America.
As discussed in Note 19 to the consolidated financial statements, the accompanying 2015 consolidated financial statements have been restated to correct misstatements.
/s/ Deloitte & Touche LLP
Dallas, Texas
March 30, 2016 (October 27, 2016 as to the effects of the restatement discussed in Note 19)
81
SANTANDER CONSUMER USA HOLDINGS INC. AND SUBSIDIARIES
CONSOLIDATED BALANCE SHEETS
(Dollar amounts in thousands, except per share data)
December 31, 2017 | December 31, 2016 | ||||||
Assets | |||||||
Cash and cash equivalents — $106,295 and $98,536 held at affiliates, respectively | $ | 527,805 | $ | 160,180 | |||
Finance receivables held for sale, net | 2,210,421 | 2,123,415 | |||||
Finance receivables held for investment, net | 22,427,769 | 23,481,001 | |||||
Restricted cash — $2,529 and $11,629 held at affiliates, respectively | 2,553,902 | 2,757,299 | |||||
Accrued interest receivable | 326,640 | 373,274 | |||||
Leased vehicles, net | 10,160,327 | 8,564,628 | |||||
Furniture and equipment, net of accumulated depreciation of $55,525 and $47,365, respectively | 69,609 | 67,509 | |||||
Federal, state and other income taxes receivable | 95,060 | 87,352 | |||||
Related party taxes receivable | 467 | 1,087 | |||||
Goodwill | 74,056 | 74,056 | |||||
Intangible assets, net of amortization of $36,616 and $33,652, respectively | 29,734 | 32,623 | |||||
Due from affiliates | 33,270 | 31,270 | |||||
Other assets | 913,244 | 785,410 | |||||
Total assets | $ | 39,422,304 | $ | 38,539,104 | |||
Liabilities and Equity | |||||||
Liabilities: | |||||||
Notes payable — credit facilities | $ | 4,848,316 | $ | 6,739,817 | |||
Notes payable — secured structured financings | 22,557,895 | 21,608,889 | |||||
Notes payable — related party | 3,754,223 | 2,975,000 | |||||
Accrued interest payable | 38,529 | 33,346 | |||||
Accounts payable and accrued expenses | 429,531 | 379,021 | |||||
Deferred tax liabilities, net | 897,121 | 1,278,064 | |||||
Due to affiliates | 82,382 | 50,620 | |||||
Other liabilities | 333,806 | 235,728 | |||||
Total liabilities | 32,941,803 | 33,300,485 | |||||
Commitments and contingencies (Notes 6 and 11) | |||||||
Equity: | |||||||
Common stock, $0.01 par value — 1,100,000,000 shares authorized; | |||||||
360,779,465 and 359,002,145 shares issued and 360,527,463 and 358,907,550 shares outstanding, respectively | 3,605 | 3,589 | |||||
Additional paid-in capital | 1,681,558 | 1,657,611 | |||||
Accumulated other comprehensive income, net | 44,262 | 28,259 | |||||
Retained earnings | 4,751,076 | 3,549,160 | |||||
Total stockholders’ equity | 6,480,501 | 5,238,619 | |||||
Total liabilities and equity | $ | 39,422,304 | $ | 38,539,104 | |||
See notes to audited consolidated financial statements.
82
SANTANDER CONSUMER USA HOLDINGS INC. AND SUBSIDIARIES
CONSOLIDATED BALANCE SHEETS
(Dollar amounts in thousands)
The assets of consolidated VIEs, presented based upon the legal transfer of the underlying assets in order to reflect legal ownership, that can be used only to settle obligations of the consolidated VIE and the liabilities of these entities for which creditors (or beneficial interest holders) do not have recourse to our general credit were as follows:
December 31, 2017 | December 31, 2016 | ||||||
Assets | |||||||
Restricted cash | $ | 1,995,557 | $ | 2,087,177 | |||
Finance receivables held for sale, net | 1,106,393 | 1,012,277 | |||||
Finance receivables held for investment, net | 21,715,365 | 22,919,312 | |||||
Leased vehicles, net | 10,160,327 | 8,564,628 | |||||
Various other assets | 733,123 | 686,253 | |||||
Total assets | $ | 35,710,765 | $ | 35,269,647 | |||
Liabilities | |||||||
Notes payable | $ | 28,467,942 | $ | 31,659,203 | |||
Various other liabilities | 197,969 | 91,234 | |||||
Total liabilities | $ | 28,665,911 | $ | 31,750,437 | |||
Certain amounts shown above are greater than the amounts shown in the corresponding line items in the accompanying consolidated balance sheets due to intercompany eliminations between the VIEs and other entities consolidated by the Company. For example, for most of its securitizations, the Company retains one or more of the lowest tranches of bonds. Rather than showing investment in bonds as an asset and the associated debt as a liability, these amounts are eliminated in consolidation as required by U.S. GAAP.
See notes to audited consolidated financial statements.
83
SANTANDER CONSUMER USA HOLDINGS INC. AND SUBSIDIARIES
CONSOLIDATED STATEMENTS OF INCOME AND COMPREHENSIVE INCOME
(Dollar amounts in thousands, except per share data)
For the Year Ended December 31, | |||||||||||
2017 | 2016 | 2015 | |||||||||
Interest on finance receivables and loans | $ | 4,755,678 | $ | 5,026,790 | $ | 5,031,829 | |||||
Leased vehicle income | 1,788,457 | 1,487,671 | 1,037,793 | ||||||||
Other finance and interest income | 19,885 | 15,135 | 18,162 | ||||||||
Total finance and other interest income | 6,564,020 | 6,529,596 | 6,087,784 | ||||||||
Interest expense — Including $148,345, $119,277, and $162,353 to affiliates, respectively | 947,734 | 807,484 | 628,791 | ||||||||
Leased vehicle expense | 1,298,513 | 995,459 | 726,420 | ||||||||
Net finance and other interest income | 4,317,773 | 4,726,653 | 4,732,573 | ||||||||
Provision for credit losses | 2,254,361 | 2,468,200 | 2,785,871 | ||||||||
Net finance and other interest income after provision for credit losses | 2,063,412 | 2,258,453 | 1,946,702 | ||||||||
Profit sharing | 29,568 | 47,816 | 57,484 | ||||||||
Net finance and other interest income after provision for credit losses and profit sharing | 2,033,844 | 2,210,637 | 1,889,218 | ||||||||
Investment gains (losses), net — Including $22,900, $346, and ($5,654) from affiliates, respectively | (366,439 | ) | (444,759 | ) | (95,214 | ) | |||||
Servicing fee income — Including $24,529, $16,733, and $16,453 from affiliates, respectively | 118,341 | 156,134 | 131,113 | ||||||||
Fees, commissions, and other — Including $900, $900, and $9,331 from affiliates, respectively | 349,204 | 382,171 | 385,744 | ||||||||
Total other income | 101,106 | 93,546 | 421,643 | ||||||||
Compensation expense | 581,017 | 498,224 | 434,041 | ||||||||
Repossession expense | 275,704 | 293,355 | 241,522 | ||||||||
Other operating costs — Including $5,253, $2,480, and $9,195 to affiliates, respectively | 454,715 | 351,893 | 345,686 | ||||||||
Total operating expenses | 1,311,436 | 1,143,472 | 1,021,249 | ||||||||
Income before income taxes | 823,514 | 1,160,711 | 1,289,612 | ||||||||
Income tax expense (benefit) | (364,092 | ) | 394,245 | 465,572 | |||||||
Net income | $ | 1,187,606 | $ | 766,466 | $ | 824,040 | |||||
Net income | $ | 1,187,606 | $ | 766,466 | $ | 824,040 | |||||
Other comprehensive income (loss): | |||||||||||
Change in unrealized gains (losses) on cash flow hedges, net of tax of $270, $15,647, and $872, respectively | 16,003 | 26,134 | (1,428 | ) | |||||||
Comprehensive income | $ | 1,203,609 | $ | 792,600 | $ | 822,612 | |||||
Net income per common share (basic) | $ | 3.30 | $ | 2.14 | $ | 2.32 | |||||
Net income per common share (diluted) | $ | 3.30 | $ | 2.13 | $ | 2.31 | |||||
Dividends paid per common share | $ | 0.03 | $ | — | $ | — | |||||
Weighted average common shares (basic) | 359,613,714 | 358,280,814 | 355,102,742 | ||||||||
Weighted average common shares (diluted) | 360,292,330 | 359,078,337 | 356,163,076 | ||||||||
See notes to audited consolidated financial statements.
84
SANTANDER CONSUMER USA HOLDINGS INC. AND SUBSIDIARIES
CONSOLIDATED STATEMENTS OF EQUITY
(In thousands, except per share amounts)
Common Stock | Additional Paid-In Capital | Accumulated Other Comprehensive Income (Loss), net | Retained Earnings | Total Stockholders’ Equity | ||||||||||||||||||
Shares | Amount | |||||||||||||||||||||
Balance — January 1, 2015 | 348,978 | $ | 3,490 | $ | 1,560,519 | $ | 3,553 | $ | 1,958,654 | $ | 3,526,216 | |||||||||||
Stock issued in connection with employee incentive compensation plans | 8,985 | 89 | 74,139 | — | — | 74,228 | ||||||||||||||||
Purchase of treasury stock | (17 | ) | — | (267 | ) | — | — | (267 | ) | |||||||||||||
Stock-based compensation | — | — | 10,686 | — | — | 10,686 | ||||||||||||||||
Tax sharing with affiliate | — | — | (926 | ) | — | — | (926 | ) | ||||||||||||||
Net income | — | — | — | — | 824,040 | 824,040 | ||||||||||||||||
Other comprehensive (loss), net of taxes | — | — | — | (1,428 | ) | — | (1,428 | ) | ||||||||||||||
Balance — December 31, 2015 | 357,946 | $ | 3,579 | $ | 1,644,151 | $ | 2,125 | $ | 2,782,694 | $ | 4,432,549 | |||||||||||
Stock issued in connection with employee incentive compensation plans | 988 | 10 | 5,697 | — | — | 5,707 | ||||||||||||||||
Purchase of treasury stock | (26 | ) | — | (350 | ) | — | — | (350 | ) | |||||||||||||
Stock based compensation expense | — | — | 9,537 | — | — | 9,537 | ||||||||||||||||
Tax sharing with affiliate | — | — | (1,424 | ) | — | — | (1,424 | ) | ||||||||||||||
Net income | — | — | — | — | 766,466 | 766,466 | ||||||||||||||||
Other comprehensive income, net of taxes | — | — | — | 26,134 | — | 26,134 | ||||||||||||||||
Balance — December 31, 2016 | 358,908 | $ | 3,589 | $ | 1,657,611 | $ | 28,259 | $ | 3,549,160 | $ | 5,238,619 | |||||||||||
Cumulative-effect adjustment upon adoption of ASU 2016-09 (Note 1) | — | — | 1,439 | — | 25,113 | 26,552 | ||||||||||||||||
Stock issued in connection with employee incentive compensation plans | 1,776 | 18 | 9,086 | — | — | 9,104 | ||||||||||||||||
Purchase of treasury stock | (157 | ) | (2 | ) | (3,768 | ) | — | — | (3,770 | ) | ||||||||||||
Stock based compensation expense | — | — | 18,494 | — | — | 18,494 | ||||||||||||||||
Tax sharing with affiliate | — | — | (1,304 | ) | — | — | (1,304 | ) | ||||||||||||||
Dividends paid | — | — | — | — | (10,803 | ) | (10,803 | ) | ||||||||||||||
Net income | — | — | — | — | 1,187,606 | 1,187,606 | ||||||||||||||||
Other comprehensive income, net of taxes | — | — | — | 16,003 | — | 16,003 | ||||||||||||||||
Balance — December 31, 2017 | 360,527 | $ | 3,605 | $ | 1,681,558 | $ | 44,262 | $ | 4,751,076 | $ | 6,480,501 | |||||||||||
See notes to audited consolidated financial statements.
85
SANTANDER CONSUMER USA HOLDINGS INC. AND SUBSIDIARIES
CONSOLIDATED STATEMENTS OF CASH FLOWS
(Dollar amounts in thousands)
For the Year Ended December 31, | |||||||||||
2017 | 2016 | 2015 | |||||||||
Cash flows from operating activities: | |||||||||||
Net income | $ | 1,187,606 | $ | 766,466 | $ | 824,040 | |||||
Adjustments to reconcile net income to net cash provided by operating activities: | |||||||||||
Derivative mark to market | (8,723 | ) | 169 | (1,650 | ) | ||||||
Provision for credit losses | 2,254,361 | 2,468,200 | 2,785,871 | ||||||||
Depreciation and amortization | 1,403,653 | 1,094,774 | 821,782 | ||||||||
Accretion of discount | (246,038 | ) | (355,961 | ) | (362,573 | ) | |||||
Originations and purchases of receivables held for sale | (3,624,718 | ) | (4,019,155 | ) | (5,472,995 | ) | |||||
Proceeds from sales of and repayments on receivables originated as held for sale | 3,099,258 | 3,905,622 | 4,662,778 | ||||||||
Change in revolving unsecured consumer loans | (329,167 | ) | (317,506 | ) | (107,947 | ) | |||||
Investment losses, net | 366,439 | 444,759 | 95,214 | ||||||||
Stock-based compensation | 18,494 | 9,537 | 10,686 | ||||||||
Deferred tax expense (benefit) | (355,789 | ) | 379,753 | 427,283 | |||||||
Changes in assets and liabilities: | |||||||||||
Accrued interest receivable | 23,925 | 5,358 | (93,089 | ) | |||||||
Accounts receivable | (16,196 | ) | 5,315 | (8,587 | ) | ||||||
Federal income tax and other taxes | (7,262 | ) | 175,075 | 233,313 | |||||||
Other assets | (88,537 | ) | (55,765 | ) | (20,628 | ) | |||||
Accrued interest payable | 2,767 | 9,559 | 4,204 | ||||||||
Other liabilities | 50,700 | (58,944 | ) | 59,736 | |||||||
Due to/from affiliates | 35,832 | 15,861 | 52,268 | ||||||||
Net cash provided by operating activities | 3,766,605 | 4,473,117 | 3,909,706 | ||||||||
Cash flows from investing activities: | |||||||||||
Originations of and disbursements on finance receivables held for investment | (10,659,617 | ) | (12,333,767 | ) | (16,910,010 | ) | |||||
Purchases of portfolios of finance receivables held for investment | (292,891 | ) | (568,009 | ) | — | ||||||
Collections on finance receivables held for investment | 10,186,369 | 10,295,849 | 10,178,209 | ||||||||
Proceeds from sale of loans originated as held for investment | 135,577 | 823,877 | 2,187,328 | ||||||||
Leased vehicles purchased | (6,007,775 | ) | (5,596,639 | ) | (5,149,481 | ) | |||||
Manufacturer incentives received | 888,532 | 1,210,779 | 979,183 | ||||||||
Proceeds from sale of leased vehicles | 2,274,238 | 1,548,186 | 1,931,957 | ||||||||
Change in revolving personal loans | (18,761 | ) | (93,194 | ) | (438,785 | ) | |||||
Purchases of furniture and equipment | (16,556 | ) | (23,290 | ) | (18,798 | ) | |||||
Proceeds from sales of furniture and equipment | 722 | 1,844 | 511 | ||||||||
Change in restricted cash | 309,029 | (525,433 | ) | (466,497 | ) | ||||||
Other investing activities | (7,179 | ) | (8,017 | ) | (8,829 | ) | |||||
Net cash used in investing activities | (3,208,312 | ) | (5,267,814 | ) | (7,715,212 | ) | |||||
Cash flows from financing activities: | |||||||||||
Proceeds from notes payable related to secured structured financings — net of debt issuance costs | 14,625,565 | 13,756,342 | 15,232,692 | ||||||||
Payments on notes payable related to secured structured financings | (13,700,149 | ) | (12,941,849 | ) | (11,113,459 | ) | |||||
Proceeds from unsecured notes payable | 7,065,000 | 4,491,153 | 6,150,000 | ||||||||
Payments on unsecured notes payable | (4,885,577 | ) | (4,076,571 | ) | (7,390,631 | ) | |||||
Proceeds from notes payable | 19,678,467 | 25,256,469 | 27,379,570 | ||||||||
Payments on notes payable | (22,978,275 | ) | (25,557,686 | ) | (26,554,425 | ) | |||||
Proceeds from stock option exercises, gross | 15,104 | 8,126 | 87,762 | ||||||||
Repurchase of stock - employee tax withholding | — | — | (267 | ) | |||||||
Dividends paid | (10,803 | ) | — | — | |||||||
Net cash provided by (used in) financing activities | (190,668 | ) | 935,984 | 3,791,242 | |||||||
Net increase (decrease) in cash and cash equivalents | 367,625 | 141,287 | (14,264 | ) | |||||||
Cash — Beginning of year | 160,180 | 18,893 | 33,157 | ||||||||
Cash — End of year | $ | 527,805 | $ | 160,180 | $ | 18,893 | |||||
Noncash investing and financing transactions (Refer to Note 13) | |||||||||||
See notes to audited consolidated financial statements.
86
SANTANDER CONSUMER USA HOLDINGS INC. AND SUBSIDIARIES
NOTES TO CONSOLIDATED FINANCIAL STATEMENTS
(Dollar amounts in thousands, except per share data)
1. | Description of Business, Basis of Presentation, and Significant Accounting Policies and Practices |
Santander Consumer USA Holdings Inc., a Delaware corporation (together with its subsidiaries, SC or the Company), is the holding company for Santander Consumer USA Inc., an Illinois corporation (SC Illinois), and its subsidiaries, a specialized consumer finance company focused on vehicle finance and third-party servicing. The Company’s primary business is the indirect origination and securitization of retail installment contracts principally through manufacturer-franchised dealers in connection with their sale of new and used vehicles to retail consumers.
In conjunction with a ten-year private label financing agreement (the Chrysler Agreement) with Fiat Chrysler Automobiles US LLC (FCA) that became effective May 1, 2013, the Company offers a full spectrum of auto financing products and services to FCA customers and dealers under the Chrysler Capital brand. These products and services include consumer retail installment contracts and leases, as well as dealer loans for inventory, construction, real estate, working capital and revolving lines of credit. Retail installment contracts and vehicle leases entered into with FCA customers, as part of the Chrysler Agreement, represent a significant concentration of those portfolios and there is a risk that the Chrysler Agreement could be terminated prior to its expiration date. Termination of the Chrysler Agreement could result in a decrease in the amount of new retail installment contracts and vehicle leases entered into with FCA customers.
The Company also originates vehicle loans through a web-based direct lending program, purchases vehicle retail installment contracts from other lenders, and services automobile and recreational and marine vehicle portfolios for other lenders. Additionally, the Company has other relationships through which it provides personal loans, private-label revolving lines and other consumer finance products.
As of December 31, 2017, the Company was owned approximately 68.1% by Santander Holdings USA, Inc. (SHUSA), a subsidiary of Banco Santander, S.A. (Santander) and approximately 31.9% by other shareholders.
Basis of Presentation
The accompanying consolidated financial statements include the accounts of the Company and its subsidiaries, including certain Trusts, which are considered variable interest entities (VIEs). The Company also consolidates other VIEs for which it was deemed to be the primary beneficiary. All intercompany balances and transactions have been eliminated in consolidation.
The preparation of financial statements in conformity with U.S. GAAP requires management to make estimates and assumptions that affect the reported amounts of assets and liabilities, and the disclosures of contingent assets and liabilities, as of the date of the financial statements, and the amount of revenue and expenses during the reporting periods. Actual results could differ from those estimates and those differences may be material. These estimates include the determination of credit loss allowance, discount accretion, fair value, impairment, expected end-of-term lease residual values, values of repossessed assets, and income taxes. These estimates, although based on actual historical trends and modeling, may potentially show significant variances over time.
Business Segment Information
The Company has one reportable segment: Consumer Finance, which includes the Company’s vehicle financial products and services, including retail installment contracts, vehicle leases, and dealer loans, as well as financial products and services related to motorcycles, recreational vehicles, and marine vehicles. It also includes the Company’s personal loan and point-of-sale financing operations.
Accounting Policies
Finance Receivables
Finance receivables are comprised of retail installment contracts individually acquired, purchased receivables, receivables from dealer, personal loans, and capital lease receivables. Finance receivables are classified as either held for sale or held for investment, depending on the Company’s intent and ability to hold the underlying contract for the
87
foreseeable future or until maturity or payoff. Most of the Company’s retail installment contracts held for investment are pledged under its warehouse facilities or securitization transactions.
Retail Installment Contracts
Retail installment contracts consist largely of nonprime automobile finance receivables, which are acquired individually from dealers at a nonrefundable discount from the contractual principal amount. Retail installment contracts also include receivables originated through a direct lending program and loan portfolios purchased from other lenders. Retail installment contracts acquired individually or originated directly are primarily classified as held for investment and carried at amortized cost, net of allowance for credit losses.
The Company has elected the fair value option for certain non-performing loans acquired through the exercise of a clean-up call. Accordingly, changes in the fair value of these finance receivables, which are based upon fair value estimates (Note 15), are reported in investment gains (losses), net, in the consolidated statements of income and comprehensive income.
Interest is accrued when earned in accordance with the terms of the retail installment contract. The accrual of interest is discontinued and reversed once a retail installment contract becomes more than 60 days past due, and is resumed and reinstated if a delinquent account subsequently becomes 60 days or less past due. For loans on nonaccrual status, interest income is recognized on a cash basis, however the Company continues to assess the recognition of cash received on those loans in order to identify whether certain of those loans should also be placed on a cost recovery basis. For TDR loans on nonaccrual status, the accrual of interest is resumed and reinstated if a delinquent account subsequently becomes 60 days or less past due. However, for TDR loans placed on cost recovery basis, the Company returns to accrual when a sustained period of repayment performance has been achieved (typically defined as six months), which were insignificant as of December 31, 2017.
Beginning January 1, 2017, based on observed TDR performance, the Company places certain additional TDRs on nonaccrual status when the Company believes repayment under the revised terms is not reasonably assured and at the latest, when the account becomes past due more than 60 days. The Company believes repayment under the revised terms is not reasonably assured for a retail installment contract that is already on nonaccrual (i.e., more than 60 days past due) and has received a modification or deferment that qualifies for a TDR event. In addition, any TDR that subsequently receives a third deferral is placed on nonaccrual status. Further, the Company has determined that certain of these loans should also be placed on a cost recovery basis.
The Company noted some deterioration in the performance of recent originations, particularly those loans originated in 2015, and addressed those trends with the introduction of more disciplined underwriting standards in late 2016. Based on this disciplined underwriting (among other things), the servicing practices for retail installment contracts originated after January 1, 2017 changed, such that there is an increase in the minimum payment requirements. Although these changes impact the measurement of customer delinquencies, the Company does not believe they have a significant impact on the amount or timing of the recognition of credit losses and allowance for loan losses. With respect to receivables originated by the Company through its “Chrysler Capital” channel, the required minimum payment is 90% of the scheduled payment. With respect to receivables originated by the Company or acquired by the Company from an unaffiliated third-party originator on or after January 1, 2017, the required minimum payment is 90% of the scheduled payment, whereas previous to January 1, 2017 the required minimum payment was 50% of the scheduled payment. The payment following the partial payment must be a full payment, or the account will move into delinquency status at that time. Payments generally are applied to interest first, then principal, then fees, regardless of a contract's accrual status.
The amortization of discounts, subvention payments from manufacturers, and other origination costs on retail installment contracts held for investment acquired individually, or through a direct lending program, are recognized as adjustments to the yield of the related contract using the effective interest method. The Company estimates future principal prepayments specific to pools of homogenous loans which are based on the vintage, credit quality at origination and term of the loan. Prepayments in our portfolio are sensitive to credit quality, with higher credit quality loans generally experiencing higher voluntary prepayment rates than lower credit quality loans. The impact of defaults is not considered in the prepayment rate; the prepayment rate only considers voluntary prepayments. The resulting prepayment rate specific to each pool is based on historical experience, and is used as an input in the calculation of the constant effective yield. Our estimated weighted average prepayment rates ranged from 6.1% to10.4% as of December 31, 2017, and 6.0% to 10.5% as of December 31, 2016.
88
Purchased Receivables Portfolios
Receivables portfolios purchased from other lenders or pursuant to a repurchased obligation that are purchased at amounts less than the principal amount of those receivables, resulting in a discount to par, are accounted for in accordance with ASC 310-30, Loans and Debt Securities Acquired with Deteriorated Credit Quality, if the discount was attributable, at least in part, to the expectation that not all contractual cash flows will be received from borrowers, which did not exist at the origination of the loans. The excess of the estimated undiscounted principal, interest, and other cash flows expected to be collected over the initial investment in the acquired loans, or accretable yield, is accreted to interest income over the expected life of the loans using the effective interest rate method.
The nonaccretable difference is the excess between the contractually required payments and the amount of cash flows, considering the impact of prepayments, expected to be collected. The nonaccretable difference is not accreted into income.
Any deterioration in the performance of the purchased portfolios results in an incremental impairment. Improvements in performance of the purchased pools that significantly increase actual or expected cash flows result in first a reversal of previously recorded impairment and then in a transfer of the excess from nonaccretable difference to accretable yield, which will be recorded as finance income over the remaining life of the receivables.
Personal Loans, Net
Personal loans, net, primarily consist of both revolving and amortizing term finance receivables acquired individually under terms of the Company’s agreements with certain third parties who originate and continue to service the loans. Personal loans also include private-label revolving lines of credit originated through the Company’s relationship with a point-of-sale lending technology company. Certain of the revolving receivables were acquired at a discount.
Interest is accrued when earned in accordance with the terms of the contract. The accrual of interest on amortizing term receivables is discontinued and reversed once a receivable becomes past due more than 60 days, and is resumed and reinstated if a delinquent account subsequently becomes 60 days or less past due. The accrual of interest on revolving personal loans continues until the receivable becomes 180 days past due, at which point the principal amount and interest are charged off. The amortization of discounts is recognized on a straight-line basis over the estimated period over which the receivables held for investment, are expected to be outstanding.
Receivables from Dealers
Receivables from dealers include floorplan loans provided to dealerships to finance new and used vehicles for their inventory. Receivables from dealers also include real estate loans and working capital revolving lines of credit. Interest on these loans is accrued when earned in accordance with the agreement with the dealer.
Finance Receivables Held for Sale, Net
Finance receivables, which may include any of the receivables described above, that the Company does not have the intent and ability to hold for the foreseeable future or until maturity or payoff, including those previously designated as held for investment and subsequently identified for sale, are classified as held for sale, at origination or at the time a decision to sell is made. Finance receivables designated as held for sale are carried at the lower of cost or market, as determined on an aggregate basis. Cost, or recorded investment, includes deferred net origination fees and costs, premium or discounts, accrued interest, manufacturer subvention (if any) and any direct write-down of the investment. When loans are transferred from held for investment, if the recorded investment of a loan exceeds its market value at the time of initial designation as held for sale, the Company will recognize a direct write-down of the excess of the recorded investment over market as a charge-off against the credit loss allowance. Subsequent to the initial measurement of retail installment contracts and personal loans held for sale, market declines in the recorded investment, whether due to credit or market risk, are recorded through investment gains (losses), net of lower of cost or market adjustments.
Provision for Credit Losses
Provisions for credit losses are charged to operations in amounts sufficient to support the credit loss allowance in accordance with the Company's estimate. The Company estimates an allowance on individually acquired retail installment contracts and personal loans held for investment not classified as TDRs at a level considered adequate to cover expected net credit losses inherent in the recorded investment of that portfolio. Probable losses are estimated based on contractual delinquency status and historical loss experience, in addition to the Company’s judgment of estimates of the value of the underlying collateral, changes in the used vehicle value index, delinquency status,
89
historical collection rates and other information in order to make the necessary judgments as to probable loan losses. For loans classified as TDRs, impairment is generally measured based on the present value of expected future cash flows discounted at the original effective interest rate. For loans that are considered collateral-dependent, such as certain bankruptcy modifications, impairment is measured based on the fair value of the collateral, less its estimated cost to sell. Provisions for credit losses are also charged to operations for impairment on TDRs.
Retail installment contracts acquired individually are charged off against the allowance in the month in which the account becomes greater than 120 days contractually delinquent if the Company has not repossessed the related vehicle. The Company charges off accounts in repossession when the automobile is repossessed and legally available for disposition. A net charge-off represents the difference between the estimated sales proceeds and the Company's recorded investment in the related contract. Costs to sell the vehicle are presented in repossession expense. Accounts in repossession that have been charged off and are pending liquidation are removed from retail installment contracts and the related repossessed automobiles are included in other assets in the Company’s consolidated balance sheets.
Term and revolving personal loans are charged off against the allowance in the month in which the accounts become 120 days and 180 days contractually delinquent, respectively.
In addition to maintaining a general allowance based on risk ratings, receivables from dealers are evaluated individually for impairment with allowances established for receivables determined to be individually impaired. Receivables from dealers are charged off against these allowances at the time that the credit is considered uncollectable and of such little value that it does not warrant consideration as an active asset.
Troubled Debt Restructurings
A modification of finance receivable terms is considered a troubled debt restructuring (TDR) if the Company grants a concession it would not otherwise have considered to a borrower for economic or legal reasons related to the debtor's financial difficulties. The Company considers TDRs to include all individually acquired retail installment contracts or personal revolving loans that have been modified at least once, deferred for a period of 90 days or more, or deferred at least twice. Additionally, restructurings through bankruptcy proceedings are deemed to be TDRs. The purchased receivables portfolio, operating and capital leases, and loans held for sale are excluded from the scope of the applicable guidance, and none of the Company's personal term loans or dealer loans have been modified or deferred.
For TDRs, impairment is generally measured based on the difference between the recorded investment of the loan and the present value of the expected future cash flows of the loan. The loan may also be measured for impairment based on the fair value of the underlying collateral less costs to sell for loans that are collateral dependent. TDRs are evaluated for impairment individually or in aggregate for those loans with similar risk characteristics.
Leased Vehicles, Net
Most vehicles for which the Company is the lessor are classified as operating leases, as they do not meet the accounting requirements to be classified as a capital lease. The net capitalized cost of each lease is recorded as an asset and depreciated on a straight-line basis over the contractual term of the lease to the expected residual value. The expected residual value and, accordingly, the monthly depreciation expense may change throughout the term of the lease. The Company estimates expected residual values using independent data sources and internal statistical models that take into consideration economic conditions, current auction results, the Company’s remarketing abilities, and manufacturer vehicle and marketing programs. Over the life of the lease, the Company evaluates the adequacy of the estimate of the residual value and may make adjustments to the depreciation rates to the extent the expected value of the vehicle at lease termination changes.
Lease payments due from customers are recorded as income until and unless a customer becomes more than 60 days delinquent, at which time the accrual of revenue is discontinued and reversed. The accrual is resumed and reinstated if a delinquent account subsequently becomes 60 days or less past due. Subvention payments from the manufacturer, down payments from the customer, and initial direct costs incurred in connection with originating the lease are treated as a reduction to the cost basis of the underlying lease asset and are amortized on a straight-line basis over the contractual term of the lease. The amortization of manufacturer subvention payments is reflected as a reduction to depreciation expense over the life of the contract.
The Company periodically evaluates its investment in operating leases for impairment if circumstances, such as a systemic and material decline in used vehicle values, indicates that an impairment may exist. These circumstances could include, for example, shocks to oil and gas prices (which may have a pronounced impact on certain models of vehicles) or pervasive manufacturer defects (which may systemically affect the value of a particular vehicle brand or
90
model). Impairment is determined to exist if fair value of the leased asset is less than carrying value and it is determined that the net carrying value is not recoverable. The net carrying value of a leased asset is not recoverable if it exceeds the sum of the undiscounted expected future cash flows expected to result from the lease payments and the estimated residual value upon eventual disposition. If our operating lease assets are considered to be impaired, the impairment is measured as the amount by which the carrying amount of the assets exceeds the fair value as estimated by discounted cash flows. No impairment was recognized in 2017, 2016, or 2015.
Capital Lease Receivables, net
Leases classified as capital leases are accounted for as direct financing leases. Minimum lease payments plus the estimated residual value of the leased vehicle are recorded as the gross investment. The difference between the gross investment and the cost of the leased vehicle is recorded as unearned income. Direct financing leases are reported at the aggregate of gross investments, net of unearned income and allowance for lease losses. Income for direct financing leases is recognized using the effective interest method, which provides a constant periodic rate of return on the outstanding investment on the lease.
Fees, commissions, and other
Fees, commissions, and other primarily include late fees, miscellaneous, and other income, and are generally recorded when there is no doubt as to the collectability of the related receivable.
Repossessed Vehicles and Repossession Expense
Repossessed vehicles represent vehicles the Company has repossessed due to the borrowers’ default on the payment terms of the retail installment contracts, loans or leases. The Company generally begins repossession activity once a customer has reached 60 days past due. The customer has an opportunity to redeem the repossessed vehicle by paying all outstanding balances, including finance charges and fees. Any vehicles not redeemed are sold at auction. The Company records the vehicles currently in its inventory at the lower of cost or estimated fair value, net of estimated costs to sell (See Notes 9 and 15).
Repossession expense includes the costs to repossess and sell vehicles obtained due to borrower default. These costs include transportation, storage, rekeying, condition reports, legal fees, the fees paid to repossession agents and auction fees.
Sales of Finance Receivables and Leases
The Company transfers retail installment contracts into newly formed Trusts, which then issue one or more classes of notes payable backed by the retail installment contracts.
The Company’s continuing involvement with the credit facilities and Trusts are in the form of servicing loans held by the special purpose entities (SPEs) and, generally, through holding a residual interest in the SPE. These transactions are structured without recourse. The Trusts are considered VIEs under U.S. GAAP and are consolidated when the Company has: (a) power over the significant activities of the entity and (b) an obligation to absorb losses or the right to receive benefits from the VIE which are potentially significant to the VIE.
The Company has power over the significant activities of those Trusts as servicer of the financial assets held in the Trust. Servicing fees are not considered significant variable interests in the Trusts; however, when the Company also retains a residual interest in the Trust, either in the form of a debt security or equity interest, the Company has an obligation to absorb losses or the right to receive benefits that are potentially significant to the SPE. Accordingly, these Trusts are consolidated within the consolidated financial statements, and the associated retail installment contracts, borrowings under credit facilities and securitization notes payable remain on the consolidated balance sheets. Securitizations involving Trusts in which the Company does not retain a residual interest or any other debt or equity interests are treated as sales of the associated retail installment contracts.
While these Trusts are included in the consolidated financial statements, these Trusts are separate legal entities; thus, the finance receivables and other assets sold to these Trusts are legally owned by these Trusts, are available only to satisfy the notes payable related to the securitized retail installment contracts, and are not available to the Company's creditors or other subsidiaries.
The Company also sells retail installment contracts and leases to VIEs or directly to third parties, which the Company may determine meet sale accounting treatment in accordance with the applicable guidance. Due to the nature, purpose,
91
and activity of these transactions, the Company either does not hold potentially significant variable interests or is not the primary beneficiary as a result of the Company's limited further involvement with the financial assets. The transferred financial assets are removed from the Company's consolidated balance sheets at the time the sale is completed. The Company generally remains the servicer of the financial assets and receives servicing fees. The Company also recognizes a gain or loss for the difference between the fair value, as measured based on sales proceeds plus (or minus) the value of any servicing asset (or liability) retained and carrying value of the assets sold.
Cash and Cash Equivalents
The Company considers all highly liquid investments with original maturities of three months or less to be cash equivalents. The Company has maintained balances in various operating and money market accounts in excess of federally insured limits.
Restricted Cash
Cash deposited to support securitization transactions, lockbox collections, and the related required reserve accounts is recorded in the Company’s consolidated balance sheet as restricted cash. Excess cash flows generated by the securitization trusts are added to the restricted cash reserve account, creating additional over-collateralization until the contractual securitization requirement has been reached. Once the targeted reserve requirement is satisfied, additional excess cash flows generated by the Trusts are released to the Company as distributions from the Trusts. Lockbox collections are added to restricted cash and released when transferred to the appropriate warehouse facility or Trust.
The Company has several limited guarantees with Santander that provide explicit performance guarantees on certain servicer obligations related to the Company’s warehouse facilities and certain securitizations. As a result of those guarantees, the Company was permitted to commingle funds received on contracts that have been included in the securitizations and certain warehouse facilities, and retain and remit cash to the respective collection accounts once a month prior to the distribution dates.
Income Taxes
Income tax expense consists of income taxes currently payable and deferred income taxes computed using the asset and liability method. Under the asset and liability method, deferred tax assets and liabilities are recognized for the future tax consequences attributable to differences between the financial statement carrying amounts of existing assets and liabilities and their respective tax basis. The deferred tax asset is subject to reduction by a valuation allowance in certain circumstances. This valuation allowance is recognized if it is more likely than not that some portion or all of the deferred tax asset will not be realized based on a review of available evidence. Deferred tax assets and liabilities are measured using enacted tax rates expected to apply to taxable income in the years in which those temporary differences are expected to be recovered or settled. The effect on deferred tax assets and liabilities of a change in tax rates is recognized in income in the period that includes the enactment date.
The Company records the benefit of uncertain tax positions in the consolidated financial statements when such positions (1) meet a more-likely-than-not threshold, (2) are settled through negotiation or litigation, or (3) the statute of limitations for the taxing authority to examine the position has expired. Tax benefits associated with an uncertain tax position are derecognized in the period in which the more-likely-than-not recognition threshold is no longer satisfied.
Furniture and Equipment
Furniture and equipment are stated at cost, less accumulated depreciation and amortization. Depreciation is computed using the straight-line method over the estimated useful lives of the respective assets, which range from three to ten years. Leasehold improvements are amortized over the shorter of the lease term or the estimated useful lives of the improvements. Depreciation and amortization on furniture and equipment for the years ended December 31, 2017, 2016, and 2015 totaled $17,682, $16,357, and $16,111, respectively. Expenditures for major renewals and betterments are capitalized. Repairs and maintenance expenditures are charged to operations as incurred.
Goodwill and Intangibles
Goodwill represents the excess of consideration paid over fair value of net assets acquired in business combinations. Intangibles represent intangible assets purchased or acquired through business combinations, including trade names and software development costs. Intangibles are amortized over their estimated useful lives. The Company tests goodwill for impairment annually in accordance with the provisions of ASC 350, Intangibles-Goodwill and Other.
92
Derivative Financial Instruments
Derivative financial instruments are recognized as either assets or liabilities in the consolidated balance sheets at fair value. The accounting for changes in the fair value of each derivative financial instrument depends on whether it has been designated and qualifies as a hedge for accounting purposes, as well as the type of hedging relationship identified. The Company does not use derivative instruments for trading or speculative purposes.
Interest Rate Swap Agreements — The Company uses interest rate swaps to hedge the variability of cash flows on securities issued by securitization Trusts and borrowings under the Company’s warehouse facilities. Certain interest rate swap agreements are designated and qualify as cash flow hedges, and are highly effective in reducing exposure to interest rate risk from both an accounting and an economic perspective.
At hedge inception and at least quarterly, the interest rate swap agreements designated as accounting hedges are assessed to determine their effectiveness in offsetting changes in the cash flows of the hedged items and whether those interest rate swap agreements may be expected to remain highly effective in future periods.
The Company uses the hypothetical derivative method to assess hedge effectiveness of cash flow hedges on a prospective and retrospective basis. At December 31, 2017, all of the Company’s interest rate swap agreements designated as cash flow hedges are deemed to be effective hedges for accounting purposes. The Company uses the hypothetical derivative method to measure the amount of ineffectiveness and a net earnings impact occurs when the cumulative change in the value of a derivative, as adjusted, differs from the cumulative change in value of the perfect hypothetical derivative. The excess change in value (the ineffectiveness) is recognized in interest expense on the consolidated statements of income and comprehensive income.
The effective portion of the changes in the fair value of the interest rate swaps qualifying as cash flow hedges is included as a component of other comprehensive loss, net of estimated income taxes, as an unrealized gain or loss on cash flow hedges. These unrealized gains or losses are recognized as adjustments to income over the same period in which cash flows from the related hedged item affect earnings. The Company discontinues hedge accounting prospectively when it is determined that an interest rate swap agreement has ceased to be effective as an accounting hedge or if the underlying hedged cash flow is no longer probable of occurring.
The Company has also entered into interest rate swap agreements related to its securitization trusts and warehouse facilities that are not designated as hedges. These agreements are intended to reduce the risk of interest rate fluctuations. For the interest rate swap agreements not designated as hedges, any gains or losses are included in the Company’s earnings as a component of operating expense.
Interest Rate Cap Agreements — The Company purchases interest rate cap agreements to limit floating rate exposures on securities issued in credit facilities. As part of the interest rate risk management strategy, and when economically feasible, the Company may simultaneously sell a corresponding written option to offset the premium paid to purchase the interest rate cap agreement and thus retain the interest rate risk. Because these instruments entered into directly by the Company or through SPEs are not designated for hedge accounting, changes in the fair value of interest rate cap agreements purchased by the SPEs and written option sold by the Company are recorded in operating expenses on the consolidated statements of income and comprehensive income.
Warrants — The Company is the holder of a warrant that gives it the right, if certain vesting conditions are satisfied, to purchase additional shares in a company in which it has a cost method investment. This warrant would allow the Company to increase its ownership to approximately 22% in the investee company.
Stock-Based Compensation
The Company measures the compensation cost of stock-based awards using the estimated fair value of those awards on the grant date, and recognizes the cost as expense over the vesting period of the awards (see Note 16).
Earnings per Share
Basic earnings per share is computed by dividing income available to common stockholders by the weighted average number of common shares outstanding for the period. Diluted earnings per share reflects the potential dilution that could occur if securities or other contracts to issue common stock were exercised. It is computed after giving consideration to the weighted average dilutive effect of the Company’s stock options and restricted stock grants. Because the Company has issued participating securities in the form of unvested restricted stock that has dividend rights, the Company applies the two-class method when computing earnings per share.
93
Recently Adopted Accounting Standards
The Company adopted the following Financial Accounting Standards Board (FASB) Accounting Standards Updates (ASUs):
• | ASU 2016-09, Compensation - Stock Compensation (Topic 718). This new guidance simplifies certain aspects related to income taxes, the Statement of Cash Flows (SCF), and forfeitures when accounting for share-based payment transactions. ASU 2016-09 eliminates the requirement to recognize excess tax benefits in APIC pools, and instead requires companies to record all excess tax benefits and deficiencies at settlement, vesting or expiration in the income statement as provision for income taxes. At adoption of ASU 2016-09 on January 1, 2017, the cumulative-effect for previously unrecognized excess tax benefits totaled $26,552 net of tax, and was recognized, as an increase, through an adjustment in beginning retained earnings. The Company recorded excess tax deficiency, net of tax of $796 in the provision for income taxes rather than as a decrease to additional paid-in capital for the year ended December 31, 2017, on a prospective basis. All excess tax benefits along with other income tax cash flows are now being classified as operating activities rather than financing activities in the SCF on a prospective basis. |
In addition, the Company changed its accounting policy on forfeitures from previously recognizing forfeitures based on estimating the number of awards expected to be forfeited to electing to recognize forfeiture of awards as they occur to simplify the accounting for forfeitures. This resulted in a cumulative adjustment, as a decrease to, beginning retained earnings of $1,439.
• | ASU 2017-04, Intangibles - Goodwill and Other (Topic 350): Simplifying the Test for Goodwill Impairment. This new guidance removes Step 2 of the goodwill impairment test, which requires a hypothetical purchase price allocation. The guidance provides that a goodwill impairment is the amount by which a reporting unit’s carrying value exceeds its fair value, not to exceed the carrying amount of goodwill. All other goodwill impairment guidance remains largely unchanged. The same one-step impairment test will be applied to goodwill at all reporting units. The Company early adopted this ASU as of October 1, 2017. The adoption of this ASU did not have a material impact on the Company’s financial position, results of operations or cash flows. |
The adoption of the following ASUs did not have material impact on the Company's financial position, results of operations or cash flows.
• | ASU 2016-05, Derivatives and Hedging (Topic 815): Effect of Derivative Contract Novations on Existing Hedge Accounting Relationships. |
• | ASU 2016-06, Derivatives and Hedging (Topic 815): Contingent Put and Call Options in Debt Instruments. |
• | ASU 2016-07, Investments-Equity Method and Joint Ventures (Topic 323). |
• | ASU 2016-17, Consolidation (Topic 810), Interest Held Through Related Parties That Are Under Common Control. |
Recent Accounting Pronouncements
In May 2014, the FASB issued ASU 2014-09, Revenue from Contracts with Customers (Topic 606). This ASU, as amended, requires an entity to recognize revenue for the transfer of promised goods or services to customers in an amount that reflects the consideration to which the entity expects to be entitled in exchange for those goods or services. The amendment includes a five-step process to assist an entity in achieving the main principle(s) of revenue recognition under ASC 606. The amended standard is effective for the Company for the annual reporting periods (including interim reporting periods within those periods) beginning after December 15, 2017. It should be applied retrospectively to each prior reporting period presented or as a cumulative effect adjustment as of the date of adoption.
Because the ASU does not apply to revenue associated with leases and financial instruments (including loans and securities), this ASU will not have a material impact on the elements of its Consolidated Statements of Income most closely associated with leases and financial instruments (such as interest income, interest expense and investment gain and losses) as well as other revenue streams that are not material in nature. The Company will adopt this ASU in the first quarter of 2018 using a modified retrospective approach with a cumulative-effect adjustment to opening retained earnings. The Company does not anticipate having any adjustments to the opening retained earnings as of January 1, 2018. The Company is also in the process of developing additional quantitative and qualitative disclosures that are required for 2018 SEC filings.
94
In February 2016, the FASB issued ASU 2016-02, Leases, which will, among other impacts, change the criteria under which leases are identified and accounted for as on- or off-balance sheet. The guidance will be effective for the fiscal year beginning after December 15, 2018, including interim periods within that year. Once effective, the new guidance must be applied for all periods presented. The Company is in the process of reviewing its existing property and equipment lease contracts as well as service contracts that may include embedded lease. Upon adoption, the Company will gross up its balance sheet by the present value of future minimum lease payments for these operating leases. The Company does not intend to early adopt this ASU.
In June 2016, the FASB issued ASU 2016-13, Financial Instruments-Credit Losses, which changes the criteria under which credit losses are measured. The amendment introduces a new credit reserving model known as the Current Expected Credit Loss (CECL) model, which replaces the incurred loss impairment methodology in current U.S. GAAP with a methodology that reflects expected credit losses and requires consideration of a broader range of reasonable and supportable information to establish credit loss estimates. The guidance will be effective for the fiscal year beginning after December 15, 2019, including interim periods within that year. The Company does not intend to adopt the new standard early and is currently evaluating the impact the new guidance will have on its financial position, results of operations and cash flows; however, it is expected that the new CECL model will alter the assumptions used in calculating the Company's credit losses, given the change to estimated losses for the estimated life of the financial asset, and will likely result in material changes to the Company’s credit and capital reserves.
In November 2016, the FASB issued ASU 2016-18, Statement of Cash Flows (Topic 230): Restricted Cash (A consensus of the FASB Emerging Issues Task Force), which requires that the statement of cash flows include restricted cash in the beginning and end-of-period total amounts shown on the statement of cash flows and that the statement of cash flows explain changes in restricted cash during the period. The guidance will be effective for the Company for annual periods beginning after December 15, 2017, including interim periods within those fiscal years. Early adoption is permitted, however, adjustments should be reflected as of the beginning of the fiscal year that includes that interim period. The amendments will not impact financial results, but will result in a change in the presentation of restricted cash and restricted cash equivalents within the statement of cash flows. The Company currently plans to adopt these amendments on January 1, 2018, and expect to use the retrospective approach as required.
In August 2017, the FASB issued ASU 2017-12, Derivatives and Hedging: Targeted Improvements to Accounting for Hedging Activities. The new guidance amends the hedge accounting model to enable entities to more accurately reflect their risk management activities in the financial statements. The amendments expand an entity’s ability to hedge nonfinancial and financial risk components and reduce complexity in hedges of interest rate risk. The guidance eliminates the requirement to separately measure and report hedge ineffectiveness and generally requires the entire change in the fair value of a hedging instrument to be presented in the same income statement line in which the earnings effect of the hedged item is reported. The new guidance is effective for public business entities for fiscal years beginning after December 15, 2018, with early adoption, including adoption in an interim period, permitted. The Company plans to early adopt this standard in 2018 and does not expect to have a material impact on opening balance of retained earnings for cumulative-effect adjustment related to eliminating the separate measurement of ineffectiveness.
In February 2018, the FASB issued ASU 2018-02, Reclassification of Certain Tax Effects from Accumulated Other Comprehensive Income. The amendments in this ASU allow a reclassification from accumulated other comprehensive income to retained earnings for stranded tax effects resulting from the Tax Cuts and Jobs Act. The amendments in this ASU are effective for all entities for fiscal years beginning after December 15, 2018, and interim periods within those fiscal years. Early adoption is permitted, including adoption in any interim period, for public business entities for reporting periods for which financial statements have not yet been issued. The Company has $6,100 stranded income tax benefits as of December 31, 2017. The Company has decided to not early adopt this ASU in 2017.
In addition to those described in detail above, the Company is also in the process of evaluating the following ASUs and does not expect them to have a material impact on the Company's business, financial position, results of operations or disclosures:
• | ASU 2016-01, Financial Instruments - Overall (Subtopic 825-10): Recognition and Measurement of Financial Assets and Financial Liabilities. |
• | ASU 2016-15, Statement of Cash Flows (Topic 230), Classification of Certain Cash Receipts and Cash Payments. |
• | ASU 2016-16, Income Taxes (Topic 740), Intra-Entity Transfers of Assets Other Than Inventory. |
95
• | ASU 2017-01, Business Combinations (Topic 805): Clarifying the Definition of a Business. |
• | ASU 2017-05, Other Income - Gains and Losses from the Derecognition of Nonfinancial Assets (Subtopic 610-20): Clarifying the Scope of Asset Derecognition Guidance and Accounting for Partial Sales of Nonfinancial Assets |
• | ASU 2017-06, Plan Accounting: Defined Benefit Pension Plans (Topic 960), Defined Contribution Pension Plans (Topic 962), Health and Welfare Benefit Plans (Topic 965): Employee Benefit Plan Master Trust Reporting (a consensus of the Emerging Issues Task Force) |
• | ASU 2017-07, Compensation - Retirement Benefits (Topic 715): Improving the Presentation of Net Periodic Pension Cost and Net Periodic Postretirement Benefit Cost |
• | ASU 2017-08, Receivables - Nonrefundable Fees and Other Costs (Subtopic 310-20): Premium Amortization on Purchased Callable Debt Securities |
• | ASU 2017-09, Compensation-Stock Compensation (Topic 718): Scope of Modification Accounting. |
• | ASU 2017-11, Earnings Per Share (Topic 260); Distinguishing Liabilities from Equity (Topic 480); Derivatives and Hedging (Topic 815): (Part I) Accounting for Certain Financial Instruments with Down Round Features, (Part II) Replacement of the Indefinite Deferral for Mandatorily Redeemable Financial Instruments of Certain Nonpublic Entities and Certain Mandatorily Redeemable Noncontrolling Interests with a Scope Exception. |
2. | Finance Receivables |
Held For Investment
Finance receivables held for investment, net is comprised of the following at December 31, 2017 and 2016:
December 31, 2017 | December 31, 2016 | ||||||
Retail installment contracts acquired individually (a) | $ | 22,362,509 | $ | 23,219,724 | |||
Purchased receivables | 27,839 | 158,264 | |||||
Receivables from dealers | 15,623 | 68,707 | |||||
Personal loans | 4,459 | 12,272 | |||||
Capital lease receivables (Note 3) | 17,339 | 22,034 | |||||
Finance receivables held for investment, net | $ | 22,427,769 | $ | 23,481,001 | |||
(a) The Company has elected the fair value option for certain retail installment contracts reported in finance receivables held for investment, net. As of December 31, 2017 and December 31, 2016, $22,124 and $24,495 of loans were recorded at fair value (Note 15).
The Company's held for investment portfolio of retail installment contracts acquired individually, receivables from dealers, and personal loans is comprised of the following at December 31, 2017 and 2016:
December 31, 2017 | ||||||||||||||||
Retail Installment Contracts Acquired Individually | Receivables from Dealers | Personal Loans | ||||||||||||||
Non- TDR | TDR | |||||||||||||||
Unpaid principal balance | $ | 19,681,394 | $ | 6,261,894 | $ | 15,787 | $ | 6,887 | ||||||||
Credit loss allowance - specific | — | (1,731,320 | ) | — | (2,565 | ) | ||||||||||
Credit loss allowance - collective | (1,529,815 | ) | — | (164 | ) | — | ||||||||||
Discount | (309,191 | ) | (74,832 | ) | — | (1 | ) | |||||||||
Capitalized origination costs and fees | 58,638 | 5,741 | 6 | — | 138 | |||||||||||
Net carrying balance | $ | 17,901,026 | $ | 4,461,483 | $ | 15,623 | $ | 4,459 | ||||||||
96
December 31, 2016 | |||||||||||||||
Retail Installment Contracts Acquired Individually | Receivables from Dealers | Personal Loans (a) | |||||||||||||
Non-TDR | TDR | ||||||||||||||
Unpaid principal balance | $ | 21,528,406 | $ | 5,599,567 | $ | 69,431 | $ | 19,361 | |||||||
Credit loss allowance - specific | — | (1,611,295 | ) | — | — | ||||||||||
Credit loss allowance - collective | (1,799,760 | ) | — | (724 | ) | — | |||||||||
Discount | (467,757 | ) | (91,359 | ) | — | (7,721 | ) | ||||||||
Capitalized origination costs and fees | 56,704 | 5,218 | — | 632 | |||||||||||
Net carrying balance | $ | 19,317,593 | $ | 3,902,131 | $ | 68,707 | $ | 12,272 | |||||||
(a) As of December 31, 2016, there were lower of cost or market adjustments of $7,521 included in the discount on personal loans.
Retail installment contracts
Retail installment contracts are collateralized by vehicle titles, and the Company has the right to repossess the vehicle in the event the consumer defaults on the payment terms of the contract. Most of the Company’s retail installment contracts held for investment are pledged against warehouse facilities or securitization bonds (Note 6). Most of the borrowers on the Company’s retail installment contracts are retail consumers; however, $641,003 and $848,918 of the unpaid principal balance represented fleet contracts with commercial borrowers as of December 31, 2017 and 2016, respectively.
During the years ended December 31, 2017 and 2016, the Company originated $6,713,239 and $8,050,653, respectively, in Chrysler Capital loans which represented 47% and 49%, respectively, of the Company's total retail installment contract originations. Additionally, during the years ended December 31, 2017 and 2016, the Company originated $5,987,648 and $5,584,149, respectively, in Chrysler Capital leases. As of December 31, 2017 and 2016, the Company's auto retail installment contract portfolio consisted of $8,234,653 and $7,365,444, respectively, of Chrysler loans which represents 37% and 32%, respectively, of the Company's auto retail installment contract portfolio. Retail installment contracts and vehicle leases entered into with FCA customers, as part of the Chrysler Agreement, represent a significant concentration of those portfolios and there is a risk that the Chrysler Agreement could be terminated prior to its expiration date. Termination of the Chrysler Agreement could result in a decrease in the amount of new retail installment contracts and vehicle leases entered into with FCA customers.
As of December 31, 2017, borrowers on the Company’s retail installment contracts held for investment are located in Texas (16%), Florida (12%), California (9%), Georgia (6%) and other states each individually representing less than 5% of the Company’s total.
Purchased receivables
Purchased receivables portfolios, which were acquired with deteriorated credit quality, is comprised of the following at December 31, 2017 and 2016:
December 31, 2017 | December 31, 2016 | ||||||
Outstanding balance | $ | 43,474 | $ | 231,360 | |||
Outstanding recorded investment, net of impairment | 28,069 | 159,451 | |||||
During the year ended December 31, 2017, the Company sold receivables previously acquired with deteriorated credit quality to SBNA (Note 12). Carrying value of the receivables at the date of sale was $99,301. No such sales occurred during the years ended December 31, 2016 and 2015.
Changes in accretable yield on the Company’s purchased receivables portfolios for the periods indicated is as follows:
97
For the Year Ended December 31, | |||||||||||
2017 | 2016 | 2015 | |||||||||
Balance — beginning of year | $ | 107,041 | $ | 178,582 | $ | 268,927 | |||||
Accretion of accretable yield | (30,129 | ) | (69,701 | ) | (91,157 | ) | |||||
Disposals/transfers | (62,183 | ) | — | — | |||||||
Reclassifications from (to) nonaccretable difference (a) | 4,735 | (1,840 | ) | 812 | |||||||
Balance — end of year | $ | 19,464 | $ | 107,041 | $ | 178,582 | |||||
(a) Reclassifications from (to) nonaccretable difference represents the increases (decreases) in accretable yield resulting from higher (lower) estimated undiscounted cash flows.
During the years ended December 31, 2017, 2016, and 2015, the Company did not acquire any vehicle loan portfolios for which it was probable at acquisition that not all contractually required payments would be collected. However, during the years ended December 31, 2017, 2016, and 2015, and the Company recognized certain retail installment loans with an unpaid principal balance of $290,613 and $466,050, and $95,596, respectively, which were previously held by non-consolidated securitization Trusts, under optional clean-up calls (Note 7). Following the initial recognition of these loans at fair value, the performing loans in the portfolio will be carried at amortized cost, net of allowance for credit losses. The Company elected the fair value option for all non-performing loans acquired (more than 60 days delinquent as of the re-recognition date), for which it was probable that not all contractually required payments would be collected (Note 15).
Receivable from Dealers
The receivables from dealers held for investment all arose from the Chrysler Agreement. As of December 31, 2017, borrowers on these dealer receivables are located in Virginia (62%), New York (27%), Missouri (10%) and Wisconsin (1.0%). The Company previously held a term loan with a third-party vehicle dealer and lender that operates in multiple states. The loan allowed committed borrowings of $50,000 at December 31, 2016. During the year ended December 31, 2017, the unpaid principal balance of the facility of $50,000 along with accrued interest was repaid.
Personal Loans
At September 30, 2016, the Company determined that its intent to sell certain personal revolving loans had changed and now expects to hold these loans through their maturity. The Company recorded a lower of cost or market adjustment through investment gains (losses), net, immediately prior to transferring the loans to finance receivables held for investment at their new recorded investment. The carrying value of these loans was $4,459 and $11,733 at December 31, 2017 and 2016, respectively.
Held For Sale
The carrying value of the Company's finance receivables held for sale was comprised of the following at December 31, 2017 and 2016:
December 31, 2017 | December 31, 2016 | ||||||
Retail installment contracts acquired individually | $ | 1,148,332 | $ | 1,045,815 | |||
Personal loans | 1,062,089 | 1,077,600 | |||||
Total assets held for sale | $ | 2,210,421 | $ | 2,123,415 | |||
Sales of retail installment contracts to third parties and proceeds from sales of charged-off assets for the years ended December 31, 2017, 2016, and 2015 were as follows:
For the Year Ended December 31, | |||||||||||
2017 | 2016 | 2015 | |||||||||
Sales of retail installment contracts to third parties | $ | 260,568 | $ | 3,694,019 | $ | 7,862,520 | |||||
Proceeds from sales of charged-off assets | 93,619 | 64,847 | 122,436 | ||||||||
98
The Company retains servicing of retail installment contracts sold to third parties. Total contracts sold to unrelated third parties and serviced as of December 31, 2017 and 2016 were as follows:
December 31, 2017 | December 31, 2016 | ||||||
Serviced balance of retail installment contracts and leases sold to third parties | $ | 5,771,085 | $ | 10,116,788 | |||
3. Leases
The Company has both operating and capital leases, which are separately accounted for and recorded on the Company's consolidated balance sheets. Operating leases are reported as leased vehicles, net, while capital leases are included in finance receivables held for investment, net.
Operating Leases
Leased vehicles, net, which is comprised of leases originated under the Chrysler Agreement, consisted of the following as of December 31, 2017 and 2016:
December 31, 2017 | December 31, 2016 | ||||||
Leased vehicles | $ | 14,285,769 | $ | 11,939,295 | |||
Less: accumulated depreciation | (3,110,167 | ) | (2,326,342 | ) | |||
Depreciated net capitalized cost | 11,175,602 | 9,612,953 | |||||
Manufacturer subvention payments, net of accretion | (1,042,477 | ) | (1,066,531 | ) | |||
Origination fees and other costs | 27,202 | 18,206 | |||||
Net book value | $ | 10,160,327 | $ | 8,564,628 | |||
Historically, the Company executed bulk sales of Chrysler Capital leases to a third party. The Company has retained servicing on the sold leases. During the years ended December 31, 2016 and 2017, the Company did not execute any bulk sales of leases originated under the Chrysler Capital program.
The following summarizes the future minimum rental payments due to the Company as lessor under operating leases as of December 31, 2017:
2018 | $ | 1,650,271 | |
2019 | 1,034,470 | ||
2020 | 374,598 | ||
2021 | 12,317 | ||
Thereafter | — | ||
Total | $ | 3,071,656 | |
Capital Leases
Certain leases originated by the Company are accounted for as capital leases, as the contractual residual values are nominal amounts. Capital lease receivables, net consisted of the following as of December 31, 2017 and 2016:
December 31, 2017 | December 31, 2016 | ||||||
Gross investment in capital leases | $ | 27,234 | $ | 39,417 | |||
Origination fees and other | 124 | 150 | |||||
Less unearned income | (4,377 | ) | (7,545 | ) | |||
Net investment in capital leases before allowance | 22,981 | 32,022 | |||||
Less: allowance for lease losses | (5,642 | ) | (9,988 | ) | |||
Net investment in capital leases | $ | 17,339 | $ | 22,034 | |||
99
The following summarizes the future minimum lease payments due to the Company as lessor under capital leases as of December 31, 2017:
2018 | $ | 11,050 | |
2019 | 6,809 | ||
2020 | 4,417 | ||
2021 | 2,960 | ||
Thereafter | 1,998 | ||
Total | $ | 27,234 | |
4. Credit Loss Allowance and Credit Quality
Credit Loss Allowance
The Company estimates the allowance for credit losses on individually acquired retail installment contracts and personal loans held for investment not classified as TDRs based on delinquency status, historical loss experience, estimated values of underlying collateral, when applicable, and various economic factors. In developing the allowance, the Company utilizes a loss emergence period assumption, a loss given default assumption applied to recorded investment, and a probability of default assumption based on a loss forecasting model. The loss emergence period assumption represents the average length of time between when a loss event is first estimated to have occurred and when the account is charged off. The recorded investment represents unpaid principal balance adjusted for unaccreted net discounts, subvention from manufacturers, and origination costs. Under this approach, the resulting allowance represents the expected net losses of recorded investment inherent in the portfolio.
The Company uses a transition based Markov model for estimating the allowance for credit losses on individually acquired retail installment contracts. This model utilizes the recently observed loan transition rates from various loan statuses to forecast future losses.
For loans classified as TDRs, impairment is generally measured based on the present value of expected future cash flows discounted at the original effective interest rate. For loans that are considered collateral-dependent, such as certain bankruptcy modifications, impairment is measured based on the fair value of the collateral, less its estimated cost to sell. The amount of the allowance is equal to the difference between the loan’s impaired value and the recorded investment.
The Company maintains a general credit loss allowance for receivables from dealers based on risk ratings, and individually evaluates loans for specific impairment as necessary. As of December 31, 2017 and 2016, the credit loss allowance for receivables from dealers is comprised entirely of general allowances as none of these receivables have been determined to be individually impaired.
The activity in the credit loss allowance for individually acquired loans for the years ended December 31, 2017, 2016, and 2015 were as follows:
Year Ended December 31, 2017 | |||||||||||
Retail Installment Contracts Acquired Individually | Receivables from Dealers | Personal Loans | |||||||||
Balance — beginning of year | $ | 3,411,055 | $ | 724 | $ | — | |||||
Provision for credit losses | 2,244,182 | (560 | ) | 10,691 | |||||||
Charge-offs (a) | (4,796,216 | ) | — | (8,945 | ) | ||||||
Recoveries | 2,402,114 | — | 819 | ||||||||
Balance — end of year | $ | 3,261,135 | $ | 164 | $ | 2,565 | |||||
(a) For the year ended December 31, 2017, charge-offs for retail installment contracts acquired individually includes approximately $75 million for the partial write-down of loans to the collateral value less estimated costs to sell, for which a bankruptcy notice was received. There is no additional credit loss allowance on these loans. No such charge-offs were recorded for the years ended December 31, 2016 and December 31, 2015.
100
Year Ended December 31, 2016 | |||||||
Retail Installment Contracts Acquired Individually | Receivables from Dealers | ||||||
Balance — beginning of year | $ | 3,197,414 | $ | 916 | |||
Provision for credit losses | 2,471,490 | 201 | |||||
Charge-offs | (4,723,649 | ) | (393 | ) | |||
Recoveries | 2,465,800 | — | |||||
Balance — end of year | $ | 3,411,055 | $ | 724 | |||
Year Ended December 31, 2015 | |||||||||||
Retail Installment Contracts Acquired Individually | Receivables from Dealers | Personal Loans | |||||||||
Balance — beginning of year | $ | 2,586,685 | $ | 674 | $ | 348,660 | |||||
Provision for credit losses | 2,433,617 | 242 | 324,634 | ||||||||
Charge-offs (a) | (3,897,480 | ) | — | (695,918 | ) | ||||||
Recoveries | 2,101,709 | — | 22,624 | ||||||||
Impact of loans transferred to held for sale | (27,117 | ) | — | — | |||||||
Balance — end of year | $ | 3,197,414 | $ | 916 | $ | — | |||||
(a) Charge-offs of retail installment contracts acquired individually and personal loans include lower of cost or market adjustments of $73,388 and $377,598, respectively, which were charged off against the credit loss allowance.
The Company estimates lease losses on the capital lease receivable portfolio based on delinquency status and loss experience to date, as well as various economic factors. The activity in the lease loss allowance for capital leases for the years ended December 31, 2017, 2016, and 2015 was as follows:
For the Year Ended December 31, | |||||||||||
2017 | 2016 | 2015 | |||||||||
Balance — beginning of year | $ | 9,988 | $ | 19,878 | $ | 9,589 | |||||
Provision for credit losses | 48 | (506 | ) | 41,196 | |||||||
Charge-offs | (11,069 | ) | (33,476 | ) | (64,209 | ) | |||||
Recoveries | 6,675 | 24,092 | 33,302 | ||||||||
Balance — end of year | $ | 5,642 | $ | 9,988 | $ | 19,878 | |||||
There was no impairment activity noted for purchased receivable portfolio for the years ended December 31, 2017 and December 31, 2016.
Delinquencies
Retail installment contracts and personal amortizing term loans are classified as non-performing (or nonaccrual) when they are greater than 60 days past due as to contractual principal or interest payments. See discussion of TDR under the "Troubled Debt Restructurings" section below. Dealer receivables are classified as non-performing when they are greater than 90 days past due. At the time a loan is placed in non-performing (nonaccrual) status, previously accrued and uncollected interest is reversed against interest income. If an account is returned to a performing (accrual) status, the Company returns to accruing interest on the contract.
The Company considers an account delinquent when an obligor fails to pay the required minimum portion of the scheduled payment by the due date. With respect to receivables originated by the Company through its “Chrysler Capital” channel, the required minimum payment is 90% of the scheduled payment. With respect to receivables originated by the Company or acquired by the Company from an unaffiliated third-party originator on or after January 1, 2017, the required minimum payment is 90% of the scheduled payment, whereas previous to January 1, 2017 the
101
required minimum payment was 50% of the scheduled payment. In each case, the period of delinquency is based on the number of days payments are contractually past due.
The accrual of interest on revolving personal loans continues until the loan is charged off. The unpaid principal balance on revolving personal loans 90 days past due and still accruing totaled $130,034 and $129,974 as of December 31, 2017 and 2016, respectively.
A summary of delinquencies as of December 31, 2017 and 2016 is as follows:
December 31, 2017 | |||||||||||
Retail Installment Contracts Held for Investment | |||||||||||
Loans Acquired Individually | Purchased Receivables Portfolios | Total | |||||||||
Principal, 30-59 days past due | $ | 2,822,686 | $ | 4,992 | $ | 2,827,678 | |||||
Delinquent principal over 59 days (a) | 1,541,728 | 2,855 | 1,544,583 | ||||||||
Total delinquent principal | $ | 4,364,414 | $ | 7,847 | $ | 4,372,261 | |||||
December 31, 2016 | |||||||||||
Retail Installment Contracts Held for Investment | |||||||||||
Loans Acquired Individually | Purchased Receivables Portfolios | Total | |||||||||
Principal, 30-59 days past due | $ | 2,911,800 | $ | 13,703 | $ | 2,925,503 | |||||
Delinquent principal over 59 days (a) | 1,520,105 | 6,638 | 1,526,743 | ||||||||
Total delinquent principal | $ | 4,431,905 | $ | 20,341 | $ | 4,452,246 | |||||
(a) Interest is accrued until 60 days past due in accordance with the Company's accounting policy for retail installment contracts. The Company's delinquency ratio continues to be calculated using the end of period delinquent principal over 60 days. Refer to Part II, Item 6 " Selected Financial Data" for details on delinquent principal over 60 days and related delinquency ratios.
Within the total delinquent principal above, retail installment contracts acquired individually held for investment that were placed on nonaccrual status, as of December 31, 2017 and 2016:
December 31, 2017 | December 31, 2016 | |||||||||||||
Dollars (in thousands) | Percent (a) | Dollars (in thousands) | Percent (a) | |||||||||||
Non-TDR | $ | 666,926 | 2.6 | % | $ | 721,150 | 2.6 | % | ||||||
TDR (b) | 1,390,373 | 5.4 | % | 665,068 | 2.4 | % | ||||||||
Total nonaccrual principal | $ | 2,057,299 | 7.9 | % | $ | 1,386,218 | 5.1 | % | ||||||
(a) Percent of unpaid principal balance of total retail installment contracts acquired individually held for investment.
(b) Refer to "Troubled Debt Restructurings" section below for discussion around significant increase in nonaccrual loans
The balances in the above tables reflect total unpaid principal balance rather than recorded investment before allowance.
As of December 31, 2017 and 2016, there were no receivables from dealers that were 30 days or more delinquent. As of December 31, 2017 and 2016, there were $1,701 and $33,886, respectively, of retail installment contracts held for sale that were 30 days or more delinquent.
Credit Quality Indicators
FICO® Distribution - A summary of the credit risk profile of the Company's consumer loans by FICO® distribution, determined at origination, as of December 31, 2017 and 2016 was as follows:
102
FICO® Band | December 31, 2017 (b) | December 31, 2016 (b) | ||
Commercial (a) | 2.5% | 3.1% | ||
No-FICOs | 11.2% | 12.2% | ||
<540 | 21.8% | 22.1% | ||
540-599 | 32.0% | 31.4% | ||
600-639 | 17.4% | 17.4% | ||
>640 | 15.1% | 13.8% | ||
(a) | No FICO score is obtained on loans to commercial borrowers. |
(b) | Percentages are based on unpaid principal balance |
Commercial Lending Credit Quality Indicators — The credit quality of receivables from dealers, which are considered commercial loans, is summarized according to standard regulatory classifications as follows:
Pass — Asset is well-protected by the current net worth and paying capacity of the obligor or guarantors, if any, or by the fair value less costs to sell any underlying collateral in a timely manner.
Special Mention — Asset has potential weaknesses that deserve management’s close attention, which, if left uncorrected, may result in deterioration of the repayment prospects for an asset at some future date. Special Mention assets are not adversely classified.
Substandard — Asset is inadequately protected by the current net worth and paying capacity of the obligor or by the collateral pledged, if any. A well-defined weakness or weaknesses exist that jeopardize the liquidation of the debt. The loans are characterized by the distinct possibility that the Company will sustain some loss if deficiencies are not corrected.
Doubtful — Exhibits the inherent weaknesses of a substandard credit. Additional characteristics exist that make collection or liquidation in full highly questionable and improbable, on the basis of currently known facts, conditions and values. Possibility of loss is extremely high, but because of certain important and reasonable specific pending factors which may work to the advantage and strengthening of the credit, an estimated loss cannot yet be determined.
Loss — Credit is considered uncollectable and of such little value that it does not warrant consideration as an active asset. There may be some recovery or salvage value, but there is doubt as to whether, how much or when the recovery would occur.
The Company's risk department performs a commercial analysis and classifies certain loans over an internal threshold based on the classifications above. Fleet loan credit quality indicators for retail installment contracts held for
investment with commercial borrowers as of December 31, 2017 and 2016 were as follows:
December 31, 2017 | December 31, 2016 | ||||||
Pass | $ | 12,276 | $ | 17,585 | |||
Special Mention | 5,324 | 2,790 | |||||
Substandard | 715 | 1,488 | |||||
Doubtful | — | — | |||||
Loss | — | — | |||||
Total (Unpaid principal balance) | $ | 18,315 | $ | 21,863 | |||
Commercial loan credit quality indicators for receivables from dealers held for investment as of December 31, 2017 and 2016 were as follows:
103
December 31, 2017 | December 31, 2016 | ||||||
Pass | $ | 14,130 | $ | 67,681 | |||
Special Mention | 1,657 | — | |||||
Substandard | — | 1,750 | |||||
Doubtful | — | — | |||||
Loss | — | — | |||||
Total (Unpaid principal balance) | $ | 15,787 | $ | 69,431 | |||
Troubled Debt Restructurings
In certain circumstances, the Company modifies the terms of its finance receivables to troubled borrowers. Modifications may include a reduction in interest rate, an extension of the maturity date, rescheduling of future cash flows, or a combination thereof. A modification of finance receivable terms is considered a TDR if the Company grants a concession to a borrower for economic or legal reasons related to the debtor’s financial difficulties that would not otherwise have been considered. Management considers TDRs to include all individually acquired retail installment contracts that have been modified at least once, deferred for a period of 90 days or more, or deferred at least twice. Additionally, restructurings through bankruptcy proceedings are deemed to be TDRs. The purchased receivables portfolio, operating and capital leases, and loans held for sale, including personal loans, are excluded from the scope of the applicable guidance. The Company's TDR balance as of December 31, 2017 and 2016 primarily consisted of loans that had been deferred or modified to receive a temporary reduction in monthly payment. As of December 31, 2017 and 2016, there were no receivables from dealers classified as a TDR.
For loans not classified as TDRs, the Company generally estimates an appropriate allowance for credit losses based on delinquency status, the Company’s historical loss experience, estimated values of underlying collateral, and various economic factors. Once a loan has been classified as a TDR, it is generally assessed for impairment based on the present value of expected future cash flows discounted at the loan's original effective interest rate considering all available evidence. For loans that are considered collateral-dependent, such as certain bankruptcy modifications, impairment is measured based on the fair value of the collateral, less its estimated cost to sell.
A loan that has been classified as a TDR remains so until the loan is liquidated through payoff or charge-off. TDRs are placed on nonaccrual status when the Company believes repayment under the revised terms is not reasonably assured and at the latest, when the account becomes past due more than 60 days. For loans on nonaccrual status, interest income is recognized on a cash basis, however the Company continues to assess the recognition of cash received on those loans in order to identify whether certain of those loans should also be placed on a cost recovery basis. For TDR loans on nonaccrual status, the accrual of interest is resumed and reinstated if a delinquent account subsequently becomes 60 days or less past due. However, for TDR loans placed on cost recovery basis, the Company returns to accrual when a sustained period of repayment performance has been achieved (typically defined as six months). The impact to interest income of TDR loans that were on cost recovery which moved back to accrual, was insignificant as of December 31, 2017.
While the Company's nonaccrual designation remains consistent at more than 60 days past due, SC continuously assesses TDR collection performance. The recognition of interest income on impaired loans (such as TDR loans) is based on an expectation of whether the contractually due interest income is reasonably assured of collection. Prior to January 1, 2017, the collection performance of TDR loans supported classifying TDRs as nonaccrual only when past due more than 60 days, regardless of delinquency status at the time of the TDR event. However, the Company noted emerging trends related to recent TDR vintage performance that caused the Company to review whether collection of interest income was reasonably assured for certain TDRs. Accordingly, beginning January 1, 2017, based on observed TDR performance, the Company places certain additional TDRs on nonaccrual status when the Company believes repayment under the revised terms is not reasonably assured and at the latest, when the account becomes past due more than 60 days. The Company believes repayment under the revised terms is not reasonably assured for a retail installment contract that is already on nonaccrual (i.e., more than 60 days past due) and has received a modification or deferment that qualifies for a TDR event. In addition, any TDR that subsequently receives a third deferral is placed on nonaccrual status. Further, the Company has determined that certain of these loans should also be placed on a cost recovery basis. If the portfolio of TDRs with these characteristics continues to grow, this change would affect the magnitude of interest income to be recognized in the future.
TDR loans are generally measured based on the present value of expected cash flows. The recognition of interest income on TDR loans reflects management’s best estimate of the amount that is reasonably assured of collection and is consistent with the estimate of future cash flows used in the impairment measurement. Any accrued but unpaid interest
104
is fully reserved for through the recognition of additional impairment on the recorded investment, if not expected to be collected.
As of December 31, 2017, the Company had $1,390,373 of TDRs on nonaccrual status. These loans included $790,461 of TDRs for which repayment was not reasonably assured. Accordingly, these loans were placed on nonaccrual status and followed cost recovery basis. The Company applied $56,740 of interest received, on these loans, towards principal (as compared to interest income), in accordance with cost recovery method.
The table below presents the Company’s loans modified in TDRs as of December 31, 2017 and 2016:
December 31, 2017 | December 31, 2016 | ||||||
Retail Installment Contracts | |||||||
Outstanding recorded investment (a) | $ | 6,261,432 | $ | 5,637,792 | |||
Impairment | (1,731,320 | ) | (1,611,295 | ) | |||
Outstanding recorded investment, net of impairment | $ | 4,530,112 | $ | 4,026,497 | |||
(a) As of December 31, 2017, the outstanding recorded investment excludes $64.7 million of collateral-dependent bankruptcy TDRs that has been written down by $29.2 million to fair value less cost to sell.
A summary of the Company’s delinquent TDRs at December 31, 2017 and 2016, is as follows:
December 31, 2017 | December 31, 2016 | ||||||
Retail Installment Contracts (a) | |||||||
Principal, 30-59 days past due | $ | 1,332,239 | $ | 1,253,848 | |||
Delinquent principal over 59 days | 818,938 | 736,691 | |||||
Total delinquent TDR principal | $ | 2,151,177 | $ | 1,990,539 | |||
(a) The balances in the above table reflects total unpaid principal balance rather than net recorded investment before allowance.
As of December 31, 2017, the Company had $1,390,373 of TDRs on nonaccrual status, of which $790,461 of TDRs followed cost recovery basis. The remaining nonaccrual TDR loans follow cash basis of accounting. Out of the total TDRs on cost recovery basis, $652,679 of TDRs were less than 60 days past due. As of December 31, 2016, the Company had $665,068 of TDRs on nonaccrual status, none of which followed cost recovery basis.
Average recorded investment and income recognized on TDR loans are as follows:
For the Year Ended | |||||||||||||||
December 31, 2017 | December 31, 2016 | December 31, 2015 | |||||||||||||
Retail Installment Contracts | Retail Installment Contracts | Retail Installment Contracts | Personal Loans | ||||||||||||
Average outstanding recorded investment in TDRs | $ | 6,002,715 | $ | 5,079,782 | $ | 4,361,962 | $ | 17,150 | |||||||
Interest income recognized | 946,606 | 802,048 | 716,054 | 2,220 | |||||||||||
The following table summarizes the financial effects, excluding impacts related to credit loss allowance and impairment, of TDRs that occurred for the years ended December 31, 2017, 2016, and 2015:
For the Year Ended | |||||||||||||||
December 31, 2017 | December 31, 2016 | December 31, 2015 | |||||||||||||
Retail Installment Contracts | Retail Installment Contracts | Retail Installment Contracts | Personal Loans | ||||||||||||
Outstanding recorded investment before TDR | $ | 3,547,456 | $ | 3,394,308 | $ | 3,417,884 | $ | 15,418 | |||||||
Outstanding recorded investment after TDR | $ | 3,541,968 | $ | 3,419,990 | $ | 3,445,103 | $ | 15,340 | |||||||
Number of contracts (not in thousands) | 204,775 | 191,385 | 198,325 | 12,501 | |||||||||||
105
A TDR is considered to have subsequently defaulted upon charge off, which for retail installment contracts is at the earlier of the date of repossession or 120 days past due and for revolving personal loans is generally the month in which the receivable becomes 180 days past due. Loan restructurings accounted for as TDRs within the previous twelve months that subsequently defaulted for the years ended December 31, 2017, 2016, and 2015 are summarized in the following table:
For the Year Ended | |||||||||||||||
December 31, 2017 | December 31, 2016 | December 31, 2015 | |||||||||||||
Retail Installment Contracts | Retail Installment Contracts | Retail Installment Contracts | Personal Loans | ||||||||||||
Recorded investment in TDRs that subsequently defaulted (a) | $ | 820,765 | $ | 788,933 | $ | 788,297 | $ | 5,346 | |||||||
Number of contracts (not in thousands) | 46,600 | 44,972 | 45,840 | 4,919 | |||||||||||
(a) For TDR modifications and TDR modifications that subsequently default, while the allowance methodology remains unchanged, transition rates of the TDR loans are adjusted to reflect the respective risks.
106
5. | Goodwill and Intangibles |
The Company has identified one operating segment which is also the reporting unit, Consumer Finance. Management tests goodwill for impairment annually and in interim, if an event or circumstance occurs that would “more likely than not” reduce the fair value of the reporting unit to an amount below its carrying value. The Company determines if impairment exists by estimating the fair value of the Consumer Finance reporting unit using the market capitalization method at the measurement date and comparing it to the carrying value. If the fair value is greater than the carrying value, then no goodwill impairment has occurred. The Company completed its test of goodwill for impairment during the fourth quarter of 2017 and concluded that goodwill was not impaired. The carrying amount of goodwill for the years ended December 31, 2017, 2016, and 2015, was unchanged at $74,056. For each of the years ended December 31, 2017, 2016, and 2015, goodwill amortization of $5,463, was deductible for tax purposes.
The components of intangible assets at December 31, 2017 and 2016 were as follows:
December 31, 2017 | |||||||||||||
Useful Life | Gross Carrying Amount | Accumulated Amortization | Net Carrying Value | ||||||||||
Amortized intangible assets: | |||||||||||||
Customer relationships | 10 years | $ | 12,400 | $ | (11,883 | ) | $ | 517 | |||||
Software and technology | 3 years | 33,603 | (20,286 | ) | 13,317 | ||||||||
Trademarks | 3 - 15 years | 20,347 | (4,447 | ) | 15,900 | ||||||||
Total | $ | 66,350 | $ | (36,616 | ) | $ | 29,734 | ||||||
December 31, 2016 | |||||||||||||
Useful Life | Gross Carrying Amount | Accumulated Amortization | Net Carrying Value | ||||||||||
Amortized intangible assets: | |||||||||||||
Customer relationships | 10 years | $ | 12,400 | $ | (10,643 | ) | $ | 1,757 | |||||
Software and technology | 3 years | 33,528 | (19,762 | ) | 13,766 | ||||||||
Trademarks | 3 - 15 years | 20,347 | (3,247 | ) | 17,100 | ||||||||
Total | $ | 66,275 | $ | (33,652 | ) | $ | 32,623 | ||||||
Effective April 1, 2016, the Company changed its estimate of the useful life of its trademark intangible to better reflect the estimated periods during which the asset is expected to generate cash flows. The estimated remaining useful life of the intangible asset that previously was considered indefinite was reduced to 15 years. The effect of this change in estimate was to increase amortization expense by $900 for the period ended December 31, 2016.
The Company recognized impairment on intangible assets of zero, zero, and $3,500 during the years ended December 31, 2017, 2016, and 2015, respectively. Amortization expense on the assets was $9,240, $8,411, and $6,742 for the years ended December 31, 2017, 2016, and 2015, respectively. Estimated future amortization expense is as follows:
2018 | $ | 8,400 | |
2019 | 5,746 | ||
2020 | 3,288 | ||
2021 | 1,200 | ||
2022 and thereafter | 11,100 | ||
Total | $ | 29,734 | |
The weighted average remaining useful life for the Company's amortizing intangible assets was 8.1 years, 8.5 years, and 2.9 years at December 31, 2017, 2016, and 2015, respectively.
107
6. | Debt |
Revolving Credit Facilities
The following table presents information regarding credit facilities as of December 31, 2017 and 2016:
December 31, 2017 | |||||||||||||||||||
Maturity Date(s) | Utilized Balance | Committed Amount | Effective Rate | Assets Pledged | Restricted Cash Pledged | ||||||||||||||
Facilities with third parties: | |||||||||||||||||||
Warehouse line (a) | January 2018 | $ | 336,484 | $ | 500,000 | 2.87% | $ | 473,208 | $ | — | |||||||||
Warehouse line | Various (b) | 339,145 | 1,250,000 | 2.53% | 461,353 | 12,645 | |||||||||||||
Warehouse line (c) | August 2019 | 2,044,843 | 3,900,000 | 2.96% | 2,929,890 | 53,639 | |||||||||||||
Warehouse line | December 2018 | — | 300,000 | 1.49% | — | — | |||||||||||||
Warehouse line | October 2019 | 226,577 | 1,800,000 | 4.95% | 311,336 | 6,772 | |||||||||||||
Repurchase facility (e) | Various (d) | 325,775 | 325,775 | 3.24% | — | 13,842 | |||||||||||||
Repurchase facility (e) | April 2018 | 202,311 | 202,311 | 2.67% | — | — | |||||||||||||
Repurchase facility (e) | March 2018 | 147,500 | 147,500 | 3.91% | — | — | |||||||||||||
Repurchase facility (e) | March 2018 | 68,897 | 68,897 | 3.04% | — | — | |||||||||||||
Warehouse line | November 2019 | 403,999 | 1,000,000 | 2.66% | 546,782 | 14,729 | |||||||||||||
Warehouse line | October 2019 | 81,865 | 400,000 | 4.09% | 114,021 | 3,057 | |||||||||||||
Warehouse line | November 2019 | 435,220 | 500,000 | 1.92% | 521,365 | 16,866 | |||||||||||||
Warehouse line | October 2018 | 235,700 | 300,000 | 2.84% | 289,634 | 10,474 | |||||||||||||
Total facilities with third parties | 4,848,316 | 10,694,483 | 5,647,589 | 132,024 | |||||||||||||||
Lines of credit with Santander and related subsidiaries (f): | |||||||||||||||||||
Line of credit | December 2018 | — | 1,000,000 | 3.09% | — | — | |||||||||||||
Promissory Note | December 2021 | 250,000 | 250,000 | 3.70% | — | — | |||||||||||||
Promissory Note | December 2022 | 250,000 | 250,000 | 3.95% | — | — | |||||||||||||
Promissory Note | March 2019 | 300,000 | 300,000 | 2.67% | — | — | |||||||||||||
Promissory Note | October 2020 | 400,000 | 400,000 | 3.10% | — | — | |||||||||||||
Promissory Note | May 2020 | 500,000 | 500,000 | 3.49% | — | — | |||||||||||||
Promissory Note (g) | March 2022 | 650,000 | 650,000 | 4.20% | — | — | |||||||||||||
Promissory Note | August 2021 | 650,000 | 650,000 | 3.44% | — | — | |||||||||||||
Line of credit | December 2018 | 750,000 | 750,000 | 1.33% | — | — | |||||||||||||
Line of credit | March 2019 | — | 3,000,000 | 3.94% | — | — | |||||||||||||
Total facilities with Santander and related subsidiaries | 3,750,000 | 7,750,000 | — | — | |||||||||||||||
Total revolving credit facilities | $ | 8,598,316 | $ | 18,444,483 | $ | 5,647,589 | $ | 132,024 | |||||||||||
(a) | The maturity of this warehouse line was extended to August 2019. |
(b) | Half of the outstanding balance on this facility matures in March 2018 and remaining balance matures in March 2019. |
(c) | This line is held exclusively for financing of Chrysler Capital leases. |
(d) | The maturity of this repurchase facility ranges from February 2018 to July 2018 |
(e) | The repurchase facilities are collateralized by securitization notes payable retained by the Company. These facilities have rolling maturities of up to one year. |
(f) | These lines are also collateralized by securitization notes payable and residuals retained by the Company. As of December 31, 2017 and December 31, 2016, $3,000,000 and $1,316,568, respectively, of the aggregate outstanding balances on these facilities were unsecured. |
(g) | During the year, the Company entered into an interest rate swap to hedge the interest rate risk on this fixed rate debt. This derivative was designated as fair value hedge at inception. This was later terminated and the fair value hedge adjustment was $4.2 million, the amortization of which will reduce interest expense over the remaining life of the fixed rate debt. |
108
December 31, 2016 | |||||||||||||||||||
Maturity Date(s) | Utilized Balance | Committed Amount | Effective Rate | Assets Pledged | Restricted Cash Pledged | ||||||||||||||
Facilities with third parties: | |||||||||||||||||||
Warehouse line | January 2018 | $ | 153,784 | $ | 500,000 | 3.17% | $ | 213,578 | $ | — | |||||||||
Warehouse line | Various | 462,085 | 1,250,000 | 2.52% | 653,014 | 14,916 | |||||||||||||
Warehouse line | August 2018 | 534,220 | 780,000 | 1.98% | 608,025 | 24,520 | |||||||||||||
Warehouse line | August 2018 | 3,119,943 | 3,120,000 | 1.91% | 4,700,774 | 70,991 | |||||||||||||
Warehouse line | October 2018 | 702,377 | 1,800,000 | 2.51% | 994,684 | 23,378 | |||||||||||||
Repurchase facility | December 2017 | 507,800 | 507,800 | 2.83% | — | 22,613 | |||||||||||||
Repurchase facility | April 2017 | 235,509 | 235,509 | 2.04% | — | — | |||||||||||||
Warehouse line | November 2018 | 578,999 | 1,000,000 | 1.56% | 850,758 | 17,642 | |||||||||||||
Warehouse line | October 2018 | 202,000 | 400,000 | 2.22% | 290,867 | 5,435 | |||||||||||||
Warehouse line | November 2018 | — | 500,000 | 2.07% | — | — | |||||||||||||
Warehouse line | October 2017 | 243,100 | 300,000 | 2.38% | 295,045 | 9,235 | |||||||||||||
Total facilities with third parties | 6,739,817 | 10,393,309 | 8,606,745 | 188,730 | |||||||||||||||
Lines of credit with Santander and related subsidiaries: | |||||||||||||||||||
Line of credit | December 2017 | 500,000 | 500,000 | 3.04% | — | — | |||||||||||||
Line of credit | December 2018 | 175,000 | 500,000 | 3.87% | — | — | |||||||||||||
Line of credit | December 2017 | 1,000,000 | 1,000,000 | 2.86% | — | — | |||||||||||||
Line of credit | December 2018 | 1,000,000 | 1,000,000 | 2.88% | — | — | |||||||||||||
Line of credit | March 2017 | 300,000 | 300,000 | 2.25% | — | — | |||||||||||||
Line of credit | March 2019 | — | 3,000,000 | 3.74% | — | — | |||||||||||||
Total facilities with Santander and related subsidiaries | 2,975,000 | 6,300,000 | — | — | |||||||||||||||
Total revolving credit facilities | $ | 9,714,817 | $ | 16,693,309 | $ | 8,606,745 | $ | 188,730 | |||||||||||
Facilities with Third Parties
The warehouse lines and repurchase facility are fully collateralized by a designated portion of the Company’s retail installment contracts (Note 2), leased vehicles (Note 3), securitization notes payables and residuals retained by the Company.
Facilities with Santander and Related Subsidiaries
Lines of Credit
Through SHUSA, Santander provides the Company with $3,000,000 of committed revolving credit that can be drawn on an unsecured basis. Through its New York branch, Santander provides the Company with $1,750,000 of long-term committed revolving credit facilities. The $1,750,000 of longer-term committed revolving credit facilities is composed of a $1,000,000 facility which permits unsecured borrowing but is generally collateralized by retained residuals and $750,000 facility which is securitized by Prime retail installment loans. Both facilities have current maturity dates of December 31, 2018.
Promissory Notes
Through SHUSA, Santander provides the Company with $3,000,000 of promissory notes. Santander Consumer ABS Funding 2, LLC (a subsidiary of the Company) established a committed facility of $300 million with SHUSA on March 6, 2014. This facility matured on March 6, 2017 and was replaced on the same day with a $300 million term promissory note executed by SC Illinois as the borrower and SHUSA as the lender. Interest accrues on this note at a rate equal to three-month LIBOR plus 1.35%. The note has a maturity date of March 6, 2019.
In addition, SC Illinois as borrower executed the following promissory notes with SHUSA during 2017;
109
•a $500 million term promissory note on May 11, 2017. Interest accrues on this note at the rate of 3.49%. The note has a maturity date of May 11, 2020.
•a $650 million term promissory note on March 31, 2017. Interest accrues on this note at the rate of 4.20%. The note has a maturity date of March 31, 2022.
•a $650 million term promissory note on August 3, 2017. Interest accrues on this note at the rate of 3.44%. The note has a maturity date of August 3, 2021.
•a $250 million term promissory note on December 19, 2017. Interest accrues on this note at the rate of 3.95%. The note has a maturity date of December 2022.
•a $250 million term promissory note on December 19, 2017. Interest accrues on this note at the rate of 3.70%. The note has a maturity date of December 2021.
•a $400 million term promissory note on October 10, 2017. Interest accrues on this note at the rate of 3.10%. The note has a maturity date of October 2020.
Secured Structured Financings
The following table presents information regarding secured structured financings as of December 31, 2017 and 2016:
December 31, 2017 | |||||||||||||||||||
Estimated Maturity Date(s) | Balance | Initial Note Amounts Issued | Initial Weighted Average Interest Rate | Collateral (b) | Restricted Cash | ||||||||||||||
2013 Securitizations | January 2019 - March 2021 | $ | 418,806 | $ | 4,239,700 | 0.89%-1.59% | $ | 544,948 | $ | 125,696 | |||||||||
2014 Securitizations | February 2020 - April 2022 | 1,150,422 | 6,391,020 | 1.16%-1.72% | 1,362,814 | 210,937 | |||||||||||||
2015 Securitizations | September 2019 - January 2023 | 2,484,051 | 9,171,332 | 1.33%-2.29% | 3,465,671 | 366,062 | |||||||||||||
2016 Securitizations | April 2022 - March 2024 | 3,596,822 | 7,462,790 | 1.63%-2.80% | 4,798,807 | 344,899 | |||||||||||||
2017 Securitizations | April 2023 - September 2024 | 7,343,157 | 9,535,800 | 2.01%-2.52% | 9,701,381 | 422,865 | |||||||||||||
Public securitizations (a) | 14,993,258 | 36,800,642 | 19,873,621 | 1,470,459 | |||||||||||||||
2011 Private issuance | September 2028 | 281,946 | 1,700,000 | 1.46% | 398,051 | 20,356 | |||||||||||||
2013 Private issuances | August 2021 - September 2024 | 2,292,279 | 2,044,054 | 1.28%-1.38% | 3,719,148 | 155,066 | |||||||||||||
2014 Private issuances | March 2018 - November 2021 | 117,730 | 1,538,087 | 1.05%-1.40% | 231,997 | 9,552 | |||||||||||||
2015 Private issuances | November 2018 - September 2021 | 2,009,627 | 2,305,062 | 0.88%-4.09% | 988,247 | 55,451 | |||||||||||||
2016 Private issuances | May 2020 - September 2024 | 1,489,464 | 3,050,000 | 1.55%-2.86% | 2,147,988 | 89,460 | |||||||||||||
2017 Private issuances | April 2021 - September 2021 | 1,373,591 | 1,641,079 | 1.85%-2.27% | 1,747,227 | 47,415 | |||||||||||||
Privately issued amortizing notes | 7,564,637 | 12,278,282 | 9,232,658 | 377,300 | |||||||||||||||
Total secured structured financings | $ | 22,557,895 | $ | 49,078,924 | $ | 29,106,279 | $ | 1,847,759 | |||||||||||
(a)Securitizations executed under Rule 144A of the Securities Act are included within this balance.
(b)Secured structured financings may be collateralized by the Company's collateral overages of other issuances.
110
December 31, 2016 | |||||||||||||||||||
Estimated Maturity Date(s) | Balance | Initial Note Amounts Issued | Initial Weighted Average Interest Rate | Collateral | Restricted Cash | ||||||||||||||
2012 Securitizations | September 2018 | $ | 197,470 | $ | 2,525,540 | 0.92%-1.23% | $ | 312,710 | $ | 73,733 | |||||||||
2013 Securitizations | January 2019 - January 2021 | 1,172,904 | 6,689,700 | 0.89%-1.59% | 1,484,014 | 222,187 | |||||||||||||
2014 Securitizations | February 2020 - January 2021 | 1,858,600 | 6,391,020 | 1.16%-1.72% | 2,360,939 | 250,806 | |||||||||||||
2015 Securitizations | September 2019 - January 2023 | 4,326,292 | 9,317,032 | 1.33%-2.29% | 5,743,884 | 468,787 | |||||||||||||
2016 Securitizations | April 2022 - March 2024 | 5,881,216 | 7,462,790 | 1.63%-2.46% | 7,572,977 | 408,086 | |||||||||||||
Public securitizations | 13,436,482 | 32,386,082 | 17,474,524 | 1,423,599 | |||||||||||||||
2010 Private issuance | June 2017 | 113,157 | 516,000 | 1.29% | 213,235 | 6,270 | |||||||||||||
2011 Private issuance | December 2018 | 342,369 | 1,700,000 | 1.46% | 617,945 | 31,425 | |||||||||||||
2013 Private issuances | September 2018-September 2020 | 2,375,964 | 2,693,754 | 1.13%-1.38% | 4,122,963 | 164,740 | |||||||||||||
2014 Private issuances | March 2018 - December 2021 | 643,428 | 3,271,175 | 1.05%-1.40% | 1,129,506 | 68,072 | |||||||||||||
2015 Private issuances | December 2016 - July 2019 | 2,185,166 | 2,855,062 | 0.88%-2.81% | 2,384,661 | 140,269 | |||||||||||||
2016 Private issuances | May 2020 - September 2024 | 2,512,323 | 3,050,000 | 1.55%-2.86% | 3,553,577 | 90,092 | |||||||||||||
Privately issued amortizing notes | 8,172,407 | 14,085,991 | 12,021,887 | 500,868 | |||||||||||||||
Total secured structured financings | $ | 21,608,889 | $ | 46,472,073 | $ | 29,496,411 | $ | 1,924,467 | |||||||||||
Notes Payable — Secured Structured Financings
The principal and interest on secured structured financings are paid using the cash flows from the underlying retail installment contracts, loans and leases, which serve as collateral for the notes. Accordingly, the timing of the principal payments on these notes is dependent on the payments received on the underlying retail installment contracts, which back the notes. The final contractual maturity and weighted average interest rate (net of interest income earned on retained bonds) by year on these notes at December 31, 2017, were as follows:
2018, 0.44% | $ | 226,046 | |
2019, 1.74% | 2,327,186 | ||
2020, 2.15% | 4,445,272 | ||
2021, 2.70% | 8,118,119 | ||
2022, 3.21% | 3,286,548 | ||
Thereafter, 3.19% | 4,205,379 | ||
$ | 22,608,550 | ||
Less: unamortized costs | (50,655 | ) | |
Notes payable - secured structured financings | $ | 22,557,895 | |
The Company’s secured structured financings consist of both public, SEC-registered securitizations, as well as private securitizations under Rule 144A of the Securities Act and privately issued amortizing notes. The Company also executes private securitizations under Rule 144A of the Securities Act and periodically issues private term amortizing notes, which are structured similarly to securitizations but are acquired by banks and conduits. The Company’s securitizations and private issuances are collateralized by vehicle retail installment contracts and loans or leases. As of December 31, 2017 and 2016, the Company had private issuances of notes backed by vehicle leases totaling $3,710,377 and $3,862,274, respectively.
Unamortized debt issuance costs are amortized as interest expense over the terms of the related notes payable using a method that approximates the effective interest method and are classified as a discount to the related recorded debt
111
balance. Amortized debt issuance costs were $34,510, $27,111, and $23,338 for the years ended December 31, 2017, 2016, and 2015, respectively. For securitizations, the term takes into consideration the expected execution of the contractual call option, if applicable. Amortization of premium or accretion of discount on acquired notes payable is also included in interest expense using a method that approximates the effective interest method over the estimated remaining life of the acquired notes. Total interest expense on secured structured financings for the years ended December 31, 2017, 2016, and 2015 was $554,663, $420,153, and $291,247, respectively.
7. Variable Interest Entities
The Company transfers retail installment contracts and leased vehicles into newly formed Trusts that then issue one or more classes of notes payable backed by the collateral. The Company’s continuing involvement with these Trusts is in the form of servicing the assets and, generally, through holding residual interests in the Trusts. Generally, these transactions are structured without recourse. The Trusts are considered VIEs under U.S. GAAP and, when the Company holds the residual interest, are consolidated because the Company has: (a) power over the significant activities of each entity as servicer of its financial assets and (b) through the residual interest and in some cases debt securities held by the Company, an obligation to absorb losses or the right to receive benefits from each VIE that are potentially significant to the VIE. When the Company does not retain any debt or equity interests in its securitizations or subsequently sells such interests it records these transactions as sales of the associated retail installment contracts.
The collateral, borrowings under credit facilities and securitization notes payable of the Company's consolidated VIEs remain on the consolidated balance sheets. The Company recognizes finance charges, fee income, and provision for credit losses on the retail installment contracts, and leased vehicles and interest expense on the debt. All of the Trusts are separate legal entities and the collateral and other assets held by these subsidiaries are legally owned by them and are not available to other creditors.
Revolving credit facilities generally also utilize entities that are considered VIEs which are included on the consolidated balance sheets.
The Company also uses a titling trust to originate and hold its leased vehicles and the associated leases, in order to facilitate the pledging of leases to financing facilities or the sale of leases to other parties without incurring the costs and administrative burden of retitling the leased vehicles. This titling trust is considered a VIE.
On-balance sheet variable interest entities
The Company retains servicing for receivables transferred to the Trusts and receives a monthly servicing fee on the outstanding principal balance. Supplemental fees, such as late charges, for servicing the receivables are reflected in fees, commissions and other income. As of December 31, 2017 and 2016, the Company was servicing $26,250,482 and $27,802,971, respectively, of gross retail installment contracts that have been transferred to consolidated Trusts. The remainder of the Company’s retail installment contracts remain unpledged.
A summary of the cash flows received from consolidated securitization trusts for the years ended December 31, 2017, 2016, and 2015, is as follows:
For the Year Ended December 31, | |||||||||||
2017 | 2016 | 2015 | |||||||||
Assets securitized | $ | 18,442,793 | $ | 15,828,921 | $ | 18,516,641 | |||||
Net proceeds from new securitizations (a) | $ | 14,126,211 | $ | 13,319,530 | $ | 15,232,692 | |||||
Net proceeds from sale of retained bonds | 499,354 | 436,812 | — | ||||||||
Cash received for servicing fees (b) | 866,210 | 787,778 | 700,156 | ||||||||
Net distributions from Trusts (b) | 2,613,032 | 1,748,013 | 1,960,418 | ||||||||
Total cash received from Trusts | $ | 18,104,807 | $ | 16,292,133 | $ | 17,893,266 | |||||
(a) | Includes additional advances on existing securitizations. |
(b) | These amounts are not reflected in the accompanying consolidated statements of cash flows because the cash flows are between the VIEs and other entities included in the consolidation. |
112
Off-balance sheet variable interest entities
The Company has completed sales to VIEs that met sale accounting treatment in accordance with the applicable guidance. Due to the nature, purpose, and activity of the transactions, the Company determined for consolidation purposes that it either does not hold potentially significant variable interests or is not the primary beneficiary as a result of the Company's limited further involvement with the financial assets. For such transactions, the transferred financial assets are removed from the Company's consolidated balance sheets. In certain situations, the Company remains the servicer of the financial assets and receives servicing fees that represent adequate compensation. The Company also recognizes a gain or loss for the difference between the cash proceeds and carrying value of the assets sold.
During the years ended December 31, 2017, 2016, and 2015 the Company sold $2,583,341, $886,288, and $1,557,099, respectively, of gross retail installment contracts to VIEs in off-balance sheet securitizations for a gain (loss) of $(13,026), $(10,511), and $59,983, respectively, recorded in investment gains (losses), net, in the accompanying consolidated statements of income. Beginning in 2017, the transactions are executed under the Company's securitization platforms with Santander. Santander, as a majority owned affiliate, will hold eligible vertical interest in the Notes and Certificates of not less than 5% to comply with the Dodd-Frank Act risk retention rules.
As of December 31, 2017 and 2016, the Company was servicing $3,428,248 and $2,741,101, respectively, of gross retail installment contracts that have been sold in these and other off-balance sheet securitizations and were subject to an optional clean-up call. The portfolio was comprised as follows:
Year ended December 31, | |||||||
2017 | 2016 | ||||||
SPAIN | $ | 2,024,016 | $ | — | |||
Total serviced for related parties | 2,024,016 | — | |||||
Chrysler Capital securitizations | 1,404,232 | 2,472,756 | |||||
Other third parties | — | 268,345 | |||||
Total serviced for third parties | 1,404,232 | 2,741,101 | |||||
Total serviced for others portfolio | $ | 3,428,248 | $ | 2,741,101 | |||
Other than repurchases of sold assets due to standard representations and warranties, the Company has no exposure to loss as a result of its involvement with these VIEs.
A summary of the cash flows received from these off-balance sheet securitization trusts for the years ended December 31, 2017, 2016, and 2015, is as follows:
For the Year Ended December 31, | |||||||||||
2017 | 2016 | 2015 | |||||||||
Receivables securitized (a) | $ | 2,583,341 | $ | 904,108 | $ | 1,557,099 | |||||
Net proceeds from new securitizations | $ | 2,588,227 | $ | 876,592 | $ | 1,578,320 | |||||
Cash received for servicing fees | 35,682 | 47,804 | 23,848 | ||||||||
Total cash received from securitization trusts | $ | 2,623,909 | $ | 924,396 | $ | 1,602,168 | |||||
(a) | Represents the unpaid principal balance at the time of original securitization. |
During the year ended December 31, 2015, the Company settled transactions to sell residual interests in certain Trusts and certain retained bonds in those Trusts to an unrelated third party. The Company received cash proceeds of $661,675 for the year ended December 31, 2015 related to the sale of these residual interests and retained bonds.
Each of these Trusts was previously determined to be a VIE. Prior to the sale of these residual interests, the associated Trusts were consolidated by the Company because the Company held a variable interest in each VIE and had determined that it was the primary beneficiary of the VIEs. The Company will continue to service the loans of these Trusts and may reacquire certain retail installment loans from the Trusts through the exercise of an optional clean-up call, as permitted through the respective servicing agreements. Although the Company will continue to service the
113
loans in the associated Trusts and, therefore, will have the power to direct the activities that most significantly impact the economic performance of the trust, the Company concluded that it was no longer the primary beneficiary of the Trusts upon the sale of the Company's residual interests. As a result, the Company deconsolidated the assets and liabilities of the corresponding trusts upon their sale.
Upon settlement of these transactions, the Company derecognized $1,919,171 in assets and $1,183,792 in notes payable and other liabilities of the trust. For the year ended December 31, 2015 the sale of these interests resulted in a net decrease to provision for credit losses of $112,804, after giving effect to lower of cost or market adjustments of $73,388.
8. Derivative Financial Instruments
The Company manages its exposure to changing interest rates using derivative financial instruments. In certain circumstances, the Company is required to hedge its interest rate risk on its secured structured financings and the borrowings under its revolving credit facilities. The Company uses both interest rate swaps and interest rate caps to satisfy these requirements and to hedge the variability of cash flows on securities issued by securitization Trusts and borrowings under the Company's warehouse facilities. Certain of the Company’s interest rate swap agreements are designated as cash flow hedges for accounting purposes. Changes in the fair value of derivatives designated as cash flow hedges are recorded as a component of accumulated other comprehensive income (AOCI), to the extent that the hedge relationships are effective, and amounts are reclassified from AOCI to earnings as the forecasted transactions impact earnings. Ineffectiveness, if any, associated with changes in the fair value of derivatives designated as cash flow hedges is recorded currently in earnings.
The Company’s remaining interest rate swap agreements, as well as its interest rate cap agreements, the corresponding options written to offset the interest rate cap agreements, total return swaps and a total return settlement agreement were not designated as hedges for accounting purposes. Changes in the fair value and settlements of derivative instruments not designated as hedges for accounting purposes are reflected in earnings as a component of interest expense.
The underlying notional amounts and aggregate fair values of these agreements at December 31, 2017 and 2016, were as follows:
December 31, 2017 | |||||||||||||||
Notional | Fair Value | Asset | Liability | ||||||||||||
Interest rate swap agreements designated as cash flow hedges | $ | 4,926,900 | $ | 45,986 | $ | 45,986 | $ | — | |||||||
Interest rate swap agreements not designated as hedges | 1,736,400 | 9,596 | 9,596 | — | |||||||||||
Interest rate cap agreements | 10,906,081 | 103,721 | 135,830 | (32,109 | ) | ||||||||||
Options for interest rate cap agreements | 10,906,081 | (103,659 | ) | 32,165 | (135,824 | ) | |||||||||
December 31, 2016 | |||||||||||||||
Notional | Fair Value | Asset | Liability | ||||||||||||
Interest rate swap agreements designated as cash flow hedges | $ | 7,854,700 | $ | 44,618 | $ | 45,551 | $ | (933 | ) | ||||||
Interest rate swap agreements not designated as hedges | 1,019,900 | 1,939 | 2,076 | (137 | ) | ||||||||||
Interest rate cap agreements | 9,463,935 | 76,269 | 76,269 | — | |||||||||||
Options for interest rate cap agreements | 9,463,935 | (76,281 | ) | — | (76,281 | ) | |||||||||
Total return settlement | 658,471 | (30,618 | ) | — | (30,618 | ) | |||||||||
During the second quarter of 2017, the Company entered into an interest rate swap to hedge the interest rate risk on a certain fixed rate debt. This derivative was designated as a fair value hedge at inception and was accounted for by recording the change in the fair value of the derivative instrument and the related hedged item attributable to interest rate risk on the Consolidated Balance Sheets, with the corresponding income or expense recorded in the Consolidated Statements of Operations. During the third quarter of 2017, the Company terminated the interest rate swap.
The Company purchased a loan portfolio for which it was obligated to make purchase price holdback payments and total return settlement payments that were considered to be derivatives, collectively referred to herein as “total return settlement,” and accordingly were marked to fair value each reporting period. The Company was obligated to make purchase price holdback payments on a periodic basis to a third-party originator of loans that the Company has purchased, when losses are lower than originally expected. The Company also was obligated to make total return
114
settlement payments to this third-party originator in 2016 and 2017 if returns on the purchased loans are greater than originally expected. All purchase price holdback payments and all total return settlement payments due in 2016 and 2017 have been made and as of December 31, 2017, the derivative instrument has been settled.
The Company is the holder of a warrant that gives it the right, if certain vesting conditions are satisfied, to purchase additional shares in a company in which it has a cost method investment. This warrant was issued in 2012 and is carried at its estimated fair value of zero at December 31, 2017 and 2016.
The aggregate fair value of the interest rate swap agreements was included on the Company’s consolidated balance sheets in other assets and other liabilities, as appropriate. The interest rate cap agreements were included in other assets and the related options in other liabilities on the Company’s consolidated balance sheets. The fair value of the total return swap was included in other liabilities on the Company's consolidated balance sheets. See Note 15 for additional disclosure of fair value and balance sheet location of the Company's derivative financial instruments.
The Company enters into legally enforceable master netting agreements that reduce risk by permitting netting of transactions, such as derivatives and collateral posting, with the same counterparty on the occurrence of certain events. A master netting agreement allows two counterparties the ability to net-settle amounts under all contracts, including any related collateral posted, through a single payment. The right to offset and certain terms regarding the collateral process, such as valuation, credit events and settlement, are contained in ISDA master agreements. The Company has elected to present derivative balances on a gross basis even if the derivative is subject to a legally enforceable master netting (ISDA) agreement. Collateral that is received or pledged for these transactions is disclosed within the “Gross amounts not offset in the Consolidated Balance Sheet” section of the tables below. Information on the offsetting of derivative assets and derivative liabilities due to the right of offset was as follows, as of December 31, 2017 and 2016:
Gross Amounts Not Offset in the Consolidated Balance Sheet | |||||||||||
Assets Presented in the Consolidated Balance Sheet | Cash Collateral Received (a) | Net Amount | |||||||||
December 31, 2017 | |||||||||||
Interest rate swaps - Santander & affiliates | $ | 8,621 | $ | (3,461 | ) | $ | 5,160 | ||||
Interest rate swaps - third party | 46,961 | (448 | ) | 46,513 | |||||||
Interest rate caps - Santander & affiliates | 18,201 | (12,240 | ) | 5,961 | |||||||
Interest rate caps - third party | 149,794 | (55,835 | ) | 93,959 | |||||||
Total derivatives subject to a master netting arrangement or similar arrangement | 223,577 | (71,984 | ) | 151,593 | |||||||
Total derivatives not subject to a master netting arrangement or similar arrangement | — | — | — | ||||||||
Total derivative assets | $ | 223,577 | $ | (71,984 | ) | $ | 151,593 | ||||
Total financial assets | $ | 223,577 | $ | (71,984 | ) | $ | 151,593 | ||||
December 31, 2016 | |||||||||||
Interest rate swaps - Santander & affiliates | $ | 5,372 | $ | — | $ | 5,372 | |||||
Interest rate swaps - third party | 42,254 | (22,100 | ) | 20,154 | |||||||
Interest rate caps - Santander & affiliates | 7,593 | — | 7,593 | ||||||||
Interest rate caps - third party | 68,676 | — | 68,676 | ||||||||
Total derivatives subject to a master netting arrangement or similar arrangement | 123,895 | (22,100 | ) | 101,795 | |||||||
Total derivatives not subject to a master netting arrangement or similar arrangement | — | — | — | ||||||||
Total derivative assets | $ | 123,895 | $ | (22,100 | ) | $ | 101,795 | ||||
Total financial assets | $ | 123,895 | $ | (22,100 | ) | $ | 101,795 | ||||
(a) Cash collateral received is reported in Other liabilities or Due to affiliate, as applicable, in the consolidated balance sheet.
115
Gross Amounts Not Offset in the Consolidated Balance Sheet | |||||||||||
Liabilities Presented in the Consolidated Balance Sheet | Cash Collateral Pledged (a) | Net Amount | |||||||||
December 31, 2017 | |||||||||||
Back to back - Santander & affiliates | 18,201 | (18,201 | ) | — | |||||||
Back to back - third party | 149,732 | (133,540 | ) | 16,192 | |||||||
Total derivatives subject to a master netting arrangement or similar arrangement | 167,933 | (151,741 | ) | 16,192 | |||||||
Total derivatives not subject to a master netting arrangement or similar arrangement | — | — | — | ||||||||
Total derivative liabilities | $ | 167,933 | $ | (151,741 | ) | $ | 16,192 | ||||
Total financial liabilities | $ | 167,933 | $ | (151,741 | ) | $ | 16,192 | ||||
December 31, 2016 | |||||||||||
Interest rate swaps - Santander & affiliates | $ | 546 | $ | (546 | ) | $ | — | ||||
Interest rate swaps - third party | 524 | (524 | ) | — | |||||||
Back to back - Santander & affiliates | 7,593 | (7,593 | ) | — | |||||||
Back to back - third party | 68,688 | (68,688 | ) | — | |||||||
Total derivatives subject to a master netting arrangement or similar arrangement | 77,351 | (77,351 | ) | — | |||||||
Total return settlement | 30,618 | — | 30,618 | ||||||||
Total derivatives not subject to a master netting arrangement or similar arrangement | 30,618 | — | 30,618 | ||||||||
Total derivative liabilities | $ | 107,969 | $ | (77,351 | ) | $ | 30,618 | ||||
Total financial liabilities | $ | 107,969 | $ | (77,351 | ) | $ | 30,618 | ||||
(a) Cash collateral pledged is reported in Other assets or Due from affiliate, as applicable, in the consolidated balance sheet. In certain instances, the Company is over-collateralized since the actual amount of cash pledged as collateral exceeds the associated financial liability, as such, the actual amount of cash collateral pledged that is reported in Other assets or Due from affiliates may be greater than the amount shown in the table above.
The gross amount reclassified from accumulated other comprehensive income to net income, are included as components of interest expense. The Company’s derivative instruments had effects on its consolidated statements of income and comprehensive income for the years ended December 31, 2017, 2016, and 2015 as follows:
December 31, 2017 | |||||||||||
Recognized in Earnings | Gross Gains Recognized in Accumulated Other Comprehensive Income | Gross amount Reclassified From Accumulated Other Comprehensive Income To Interest Expense | |||||||||
Interest rate swap agreements designated as cash flow hedges | $ | 112 | $ | 22,333 | $ | 6,060 | |||||
Derivative instruments not designated as hedges: | |||||||||||
Gains (losses) recognized in operating expense | $ | (6,835 | ) | ||||||||
December 31, 2016 | |||||||||||
Recognized in Earnings | Gross Gains (Losses) Recognized in Accumulated Other Comprehensive Income | Gross Gains (Losses) Reclassified From Accumulated Other Comprehensive Income To Interest Expense | |||||||||
Interest rate swap agreements designated as cash flow hedges | $ | 1,131 | $ | (2,118 | ) | $ | (43,898 | ) | |||
Derivative instruments not designated as hedges: | |||||||||||
Gains (losses) recognized in operating expenses | $ | (1,593 | ) | ||||||||
116
December 31, 2015 | |||||||||||
Recognized in Earnings | Gross Gains (Losses) Recognized in Accumulated Other Comprehensive Income | Gross Gains (Losses) Reclassified From Accumulated Other Comprehensive Income To Interest Expense | |||||||||
Interest rate swap agreements designated as cash flow hedges | $ | 223 | $ | (53,160 | ) | $ | (50,860 | ) | |||
Derivative instruments not designated as hedges: | |||||||||||
Gains (losses) recognized in interest expense | $ | (11,880 | ) | ||||||||
Gains (losses) recognized in operating expenses | $ | (10,973 | ) | ||||||||
The ineffectiveness related to the interest rate swap agreements designated as cash flow hedges was insignificant for the years ended December 31, 2017, 2016, and 2015. The Company estimates that approximately $16,798 of unrealized losses included in accumulated other comprehensive income will be reclassified to interest expense within the next twelve months.
9. Other Assets
Other assets at December 31, 2017 and December 31, 2016, were as follows:
December 31, 2017 | December 31, 2016 | ||||||
Upfront fee (a) | $ | 80,000 | $ | 95,000 | |||
Vehicles (b) | 293,546 | 257,382 | |||||
Manufacturer subvention payments receivable (a) | 83,910 | 161,447 | |||||
Accounts receivable | 38,583 | 22,480 | |||||
Prepaids | 40,830 | 46,177 | |||||
Derivative assets at fair value (c) | 196,755 | 110,930 | |||||
Derivative-third party collateral | 149,805 | 75,089 | |||||
Other | 29,815 | 16,905 | |||||
Total | $ | 913,244 | $ | 785,410 | |||
(a) | These amounts relate to the Chrysler Agreement. The Company paid a $150,000 upfront fee upon the May 2013 inception of the agreement. The fee is being amortized into finance and other interest income over a ten-year term. As the preferred financing provider for FCA, the Company is entitled to subvention payments on loans and leases with below-market customer payments. |
(b) | Includes vehicles obtained through repossession as well as vehicles obtained due to lease terminations. |
(c) | Derivative assets at fair value represent the gross amount of derivatives presented in the consolidated financial statements. Refer to Note 8 to these Consolidated Financial Statements for the detail of these amounts. |
117
10. | Income Taxes |
The components of the provision for income taxes for the years ended December 31, 2017, 2016, and 2015, were as follows:
For the Year Ended December 31, | |||||||||||
2017 | 2016 | 2015 | |||||||||
Income before income taxes: | |||||||||||
Domestic | $ | 717,496 | $ | 942,436 | $ | 1,289,612 | |||||
Foreign | 106,018 | 218,275 | — | ||||||||
Total | $ | 823,514 | $ | 1,160,711 | $ | 1,289,612 | |||||
Current income tax expense (benefit): | |||||||||||
Federal | $ | (6,140 | ) | $ | 2,481 | $ | 33,798 | ||||
State | (6,436 | ) | 3,273 | 4,491 | |||||||
Foreign | 4,273 | 8,738 | — | ||||||||
Total current income tax expense (benefit) | $ | (8,303 | ) | $ | 14,492 | $ | 38,289 | ||||
Deferred income tax expense (benefit): | |||||||||||
Federal | (386,703 | ) | 343,816 | 387,686 | |||||||
State | 30,953 | 35,944 | 39,597 | ||||||||
Foreign | (39 | ) | (7 | ) | — | ||||||
Total deferred income tax expense (benefit) | (355,789 | ) | 379,753 | 427,283 | |||||||
Total income tax expense (benefit) | $ | (364,092 | ) | $ | 394,245 | $ | 465,572 | ||||
In December 2015, the Company formed a wholly-owned foreign subsidiary that is licensed in Puerto Rico as an IFE ("International Financial Entity") under the Government approved Act Number 273. This classification results in the granting of a tax decree securing a 4% fixed income tax rate and a number of non income tax benefits for an initial period of fifteen (15) years.
The Company provides U.S. income taxes on earnings of foreign subsidiaries unless the subsidiaries' earnings are considered indefinitely reinvested outside of the United States. The Company has historically provided deferred taxes under ASC 740-30-25, formerly APB 23, for the presumed repatriation to the United States earnings from the Company’s Puerto Rican subsidiary, SCI. In June 2017, the Company asserted that undistributed net earnings of SCI would be indefinitely reinvested outside the United States. This change in assertion was primarily driven by the Company's future United States cash projections and the Company’s intent to indefinitely reinvest the earnings outside of the United States. The Company had $156.7 million of undistributed net earnings and a $52.8 million unrecorded deferred tax liability at September 30, 2017.
During the three months ended December 31, 2017, the Company changed its assertion to reflect a change in management’s strategic objective to no longer permanently reinvest the earnings. Under ASC 740-30 (formerly APB 23), unremitted earnings that are no longer permanently invested would become subject to deferred income taxes under United States law. As a result of this change, the Company recognized $55.7 million of additional income tax expense during the three months ended December 31, 2017 to record the applicable U.S. deferred income tax liability.
As of December 31, 2017 and 2016, the Company has no earnings which are considered indefinitely reinvested.
The reconciliation of the federal statutory income tax rate to the Company’s effective income tax rates for the years ended December 31, 2017, 2016, and 2015, is as follows:
118
For the Year Ended December 31, | ||||||||
2017 | 2016 | 2015 | ||||||
Federal statutory rate | 35.0 | % | 35.0 | % | 35.0 | % | ||
State and local income taxes — net of federal income tax benefit | 2.3 | 2.5 | 2.3 | |||||
Valuation allowance | — | (2.2 | ) | (0.2 | ) | |||
Electric vehicle credit | (2.9 | ) | (2.3 | ) | (1.8 | ) | ||
Tax reform - deferred impact | (82.3 | ) | — | — | ||||
Tax reform - transition tax | 3.1 | — | — | |||||
Other | 0.6 | 1.0 | 0.8 | |||||
Effective income tax rate | (44.2 | )% | 34.0 | % | 36.1 | % | ||
On December 22, 2017, H.R.1, known as the "Tax Cuts and Jobs Act," was signed into law. The Tax Cuts and Jobs Act permanently lowered the corporate tax rate from the previous rate of 35 percent to 21 percent, effective for tax years beginning January 1, 2018. As a result of the reduction of the corporate tax rate, U.S. GAAP require companies to revalue their deferred tax assets and liabilities with resulting tax effects accounted for in the reporting period of enactment. The Company recorded a one-time $677,509 benefit primarily due to the revaluation of its U.S. deferred tax liabilities at the lower 21% U.S. federal corporate income tax rate. The Tax Cuts and Jobs Act also created a territorial tax system with a one-time mandatory tax on previously deferred foreign earnings of U.S. subsidiaries. The Company recorded a $25,143 expense related to its Puerto Rican subsidiary, SCI.
Due to the complexities involved in accounting for the enactment of the Tax Cuts and Jobs Act, SEC Staff Accounting Bulletin (SAB) 118 clarifies accounting for income taxes under ASC Topic 740, Income Taxes (ASC 740), if information is not yet available or complete and provides for up to a one-year period in which to complete the required analyses and accounting (the measurement period). SAB 118 describes three scenarios (or buckets) associated with a company’s status of accounting for income tax reform: (1) a company is complete with its accounting for certain effects of tax reform, (2) a company is able to determine a reasonable estimate for certain effects of tax reform and records that estimate as a provisional amount, or (3) a company is not able to determine a reasonable estimate and therefore continues to apply ASC 740, based on the provisions of the tax laws that were in effect immediately prior to the Tax Cuts and Jobs Act being enacted.
The Company has obtained and analyzed all currently available information to record the effect of the change in tax law. However, should the Internal Revenue Service (IRS) issue further guidance or interpretation of relevant aspects of the new tax law, we may adjust these amounts.
The Tax Cuts and Jobs Act also requires a U.S. shareholder of a controlled foreign corporation (CFC) to include in income, as a deemed dividend, the global intangible low-taxed income (GILTI) of the CFC. This provision is effective for taxable years of foreign corporations beginning after December 31, 2017, and to taxable years of United States shareholders in which or with which such taxable years of foreign corporations end. The Company has elected to treat taxes due on future U.S. inclusions in taxable income under the GILTI provision as a current period expense when incurred.
The Company is a party to a tax sharing agreement requiring that the unitary state tax liability among affiliates included in unitary state tax returns be allocated using the hypothetical separate company tax calculation method. Under the hypothetical separate company method, the Company recorded a deemed contribution from affiliates in the amount of $1,304, which is included in additional paid-in capital section in the accompanying consolidated balance sheets. At December 31, 2017 and 2016, the Company had a net receivable from affiliates under the tax sharing agreement of $467 and $1,087, respectively, which was included in Related party taxes receivable in the consolidated balance sheet.
119
The tax effects of temporary differences between the financial reporting and income tax basis of assets and liabilities at December 31, 2017 and 2016, are as follows:
December 31, 2017 | December 31, 2016 | ||||||
Deferred tax assets: | |||||||
Debt issuance costs | $ | 4,181 | $ | 5,001 | |||
Receivables | 512,177 | 474,366 | |||||
Net operating loss carryforwards | 356,030 | 603,136 | |||||
Equity-based compensation | 14,258 | 23,042 | |||||
Credit carryforwards | 163,140 | 127,933 | |||||
Other | 32,264 | 34,257 | |||||
Total gross deferred tax assets | 1,082,050 | 1,267,735 | |||||
Deferred tax liabilities: | |||||||
Capitalized origination costs | (4,229 | ) | (10,804 | ) | |||
Goodwill | (11,278 | ) | (15,375 | ) | |||
Leased vehicles | (1,942,273 | ) | (2,421,114 | ) | |||
Furniture and equipment | (7,201 | ) | (9,638 | ) | |||
Derivatives | (9,966 | ) | (17,635 | ) | |||
Unremitted foreign earnings | — | (67,720 | ) | ||||
Other | (925 | ) | (1,012 | ) | |||
Total gross deferred tax liabilities | (1,975,872 | ) | (2,543,298 | ) | |||
Valuation allowance | (3,299 | ) | (2,501 | ) | |||
Net deferred tax asset (liability) | $ | (897,121 | ) | $ | (1,278,064 | ) | |
At December 31, 2017 and 2016, the Company’s largest deferred tax liability was leased vehicles of $1,942,273 and $2,421,114, respectively. The decrease in this liability is primarily due to the enactment of the Tax Cuts and Jobs Act of 2017.
The Company has a like-kind exchange program for the leased auto portfolio. Pursuant to the program, the Company disposes of vehicles and acquires replacement vehicles in a form whereby tax gains on disposal of eligible vehicles are deferred. To qualify for like-kind exchange treatment, the Company exchanges through a qualified intermediary eligible vehicles being disposed of with vehicles being acquired, allowing SC to generally carryover the tax basis of the vehicles sold (“like-kind exchanges”). The program results in a material deferral of federal and state income taxes, and a decrease in cash taxes in periods when the Company is not in a net operating loss (NOL) position. As part of the program, the proceeds from the sale of eligible vehicles are restricted for the acquisition of replacement vehicles and other specified applications. The Tax Cuts and Jobs Act permanently eliminated the ability to exchange personal property after January 1, 2018 which will result in the like-kind exchange program being discontinued in 2018.
The Company began generating qualified plug-in electric vehicle credits in 2013; the credit carryforwards will begin expiring in 2034.
At adoption of ASU 2016-09 on January 1, 2017, the cumulative-effect for previously unrecognized excess tax benefits totaled $26,552 net of tax, and was recognized, as an increase, through an adjustment in beginning retained earnings. The Company recorded excess tax deficiency, net of tax of $796 in the provision for income taxes rather than as a decrease to additional paid-in capital for the year ended December 31, 2017, on a prospective basis. Therefore, the prior period presented has not been adjusted.
At December 31, 2017, the Company has federal net operating loss carryforwards of $1,561,870, which may be offset against future taxable income. If not utilized in future years, these will expire in varying amounts through 2037. The Company has state net operating loss carryforwards of $432,877, which may be used against future taxable income. If not utilized in future years, these will expire in varying amounts through 2037.
As of December 31, 2017, the Company had recorded a valuation allowance for state tax net operating loss carryforwards for which it does not have a tax-planning strategy in place. A rollforward of the valuation allowance for the years ended December 31, 2017, 2016, and 2015 is as follows:
120
For the Year Ended December 31, | |||||||||||
2017 | 2016 | 2015 | |||||||||
Valuation allowance, beginning of year | $ | 2,501 | $ | 30,489 | $ | 32,901 | |||||
Provision (release) | 798 | (27,988 | ) | (2,412 | ) | ||||||
Valuation allowance, end of year | $ | 3,299 | $ | 2,501 | $ | 30,489 | |||||
A reconciliation of the beginning and ending balances of gross unrecognized tax benefits for each of the years ended December 31, 2017, 2016, and 2015 is as follows:
For the Year Ended December 31, | |||||||||||
2017 | 2016 | 2015 | |||||||||
Gross unrecognized tax benefits balance, January 1 | $ | 16,736 | $ | 225 | $ | 166 | |||||
Additions for tax positions taken in the current year | — | 16,606 | — | ||||||||
Additions for tax positions of prior years | 473 | — | 70 | ||||||||
Reductions for tax positions of prior years | (589 | ) | (34 | ) | (11 | ) | |||||
Reductions as a result of a lapse of the applicable statute of limitations | (1,874 | ) | — | — | |||||||
Settlements | — | (61 | ) | — | |||||||
Gross unrecognized tax benefits balance, December 31 | $ | 14,746 | $ | 16,736 | $ | 225 | |||||
At December 31, 2017, 2016, and 2015, there were $14,615, $16,606 and $95, respectively, of net unrecognized tax benefits that, if recognized, would affect the annual effective tax rate. Accrued interest and penalties associated with uncertain tax positions are recognized as a component of the income tax provision. Accrued interest and penalties of $653, $1,551, and $85 are included with the related tax liability line in the accompanying consolidated balance sheets as of December 31, 2017, 2016, 2015, respectively.
At December 31, 2017, the Company believes that it is reasonably possible that a portion of the balance of the gross unrecognized tax benefits could decrease to zero in the next twelve months due to ongoing activities with various taxing jurisdictions that the Company expects may give rise to settlements or the expiration of statute of limitations. The Company continually evaluates expiring statutes of limitations, audits, proposed settlements, changes in tax law, and new authoritative rulings.
The Company is subject to examination by federal and state taxing authorities. Periods subsequent to December 31, 2010 are open for audit by the IRS. The SHUSA consolidated return, of which the Company is a part through December 31, 2011, is currently under IRS examination for 2011. The Company's separate returns for 2012, 2013, and 2014 are also under IRS examination. Periods subsequent to December 31, 2008, are open for audit by various state taxing authorities.
11. Commitments and Contingencies
The following table summarizes liabilities recorded for commitments and contingencies as of December 31, 2017 and 2016, all of which are included in accounts payable and accrued expenses in the accompanying consolidated balance sheets:
Agreement or Legal Matter | Commitment or Contingency | December 31, 2017 | December 31, 2016 | |||||||||
Chrysler Agreement | Revenue-sharing and gain-sharing payments | $ | 6,580 | $ | 10,134 | |||||||
Agreement with Bank of America | Servicer performance fee | 8,072 | 9,797 | |||||||||
Agreement with CBP | Loss-sharing payments | 5,625 | 4,563 | |||||||||
Other Contingencies | Consumer arrangements | 6,326 | — | |||||||||
Legal and regulatory proceedings | Aggregate legal and regulatory liabilities | 108,800 | 39,200 | |||||||||
121
Following is a description of the agreements and legal matters pursuant to which the liabilities in the preceding table were recorded.
Chrysler Agreement
Under terms of the Chrysler Agreement, the Company must make revenue sharing payments to FCA and also must make gain-sharing payments to FCA when residual gains on leased vehicles exceed a specified threshold. The Company had accrued $6,580 and $10,134 at December 31, 2017 and 2016, respectively, related to these obligations.
The Chrysler Agreement requires, among other things, that SC bears the risk of loss on loans originated pursuant to the agreement, but also that FCA shares in any residual gains and losses from consumer leases. The agreement also requires that SC maintains at least $5.0 billion in funding available for dealer inventory financing and $4.5 billion of financing dedicated to FCA retail financing. In turn, FCA must provide designated minimum threshold percentages of its subvention business to the Company. The Chrysler Agreement is subject to early termination in certain circumstances, including the failure by either party to comply with certain of their ongoing obligations under the Chrysler Agreement. These obligations include the Company's meeting specified escalating penetration rates for the first five years of the agreement. The Company has not met these penetration rates at December 31, 2017. If the Chrysler Agreement were to terminate, there could be a materially adverse impact to the Company's financial condition and results of operations.
Agreement with Bank of America
Until January 31, 2017, the Company had a flow agreement with Bank of America whereby the Company was committed to sell up to a specified amount of eligible loans to the bank each month. On July 27, 2016, the Company and Bank of America amended the flow agreement to reduce the maximum commitment to sell eligible loans each month to $300,000. On October 27, 2016, Bank of America notified the Company that it was terminating the flow agreement effective January 31, 2017, and accordingly, the flow agreement is terminated. The Company retains servicing on all sold loans and may receive or pay a servicer performance payment based on an agreed-upon formula if performance on the sold loans is better or worse, respectively, than expected performance at time of sale. Servicer performance payments are due six years from the cut-off date of each loan sale. The Company had accrued $8,072 and $9,797 at December 31, 2017 and 2016, respectively, related to this obligation.
Agreement with CBP
Until May 1, 2017, the Company sold loans to CBP under terms of a flow agreement and predecessor sale agreements. Under the flow agreement, as amended, CBP's committed purchases of Chrysler Capital prime loans were a maximum of $200,000 and a minimum of $50,000 per quarter. The Company retained servicing on the sold loans and will owe CBP a loss-sharing payment capped at 0.5% of the original pool balance if losses exceed a specified threshold, established on a pool-by-pool basis. Loss-sharing payments are due the month in which net losses exceed the established threshold of each loan sale. The Company had accrued $5,625 and $4,563 at December 31, 2017 and 2016, respectively, related to the loss-sharing obligation.
Other Contingencies
The Company is or may be subject to potential liability under various other contingent exposures. The Company had accrued $6,326 and zero at December 31, 2017 and 2016, respectively, for other miscellaneous contingencies.
Legal and regulatory proceedings
Periodically, the Company is party to, or otherwise involved in, various lawsuits and other legal proceedings that arise in the ordinary course of business. In view of the inherent difficulty of predicting the outcome of any such lawsuit, regulatory matter and legal proceeding, particularly where the claimants seek very large or indeterminate damages or where the matters present novel legal theories or involve a large number of parties, the Company generally cannot predict the eventual outcome of the pending matters, the timing of the ultimate resolution of the matters, or the eventual loss, fines or penalties related to the matter. Further, it is reasonably possible that actual outcomes or losses may differ materially from the Company's current assessments and estimates and any adverse resolution of any of these matters against it could materially and adversely affect the Company's business, financial condition and results of operation.
In accordance with applicable accounting guidance, the Company establishes an accrued liability for litigation, regulatory matters and other legal proceedings when those matters present material loss contingencies that are both
122
probable and estimable. In such cases, there may be an exposure to loss in excess of any amounts accrued. When a loss contingency is not both probable and estimable, the Company does not establish an accrued liability. As a litigation, regulatory matter or other legal proceeding develops, the Company, in conjunction with any outside counsel handling the matter, evaluates on an ongoing basis whether the matter presents a material loss contingency that is probable and estimable. If a determination is made during a given quarter that a material loss contingency is probable and estimable, an accrued liability is established during such quarter with respect to such loss contingency. The Company continues to monitor the matter for further developments that could affect the amount of the accrued liability previously established.
As of December 31, 2017, the Company has accrued aggregate legal and regulatory liabilities of $108,800. Further, the Company believes that the estimate of the aggregate range of reasonably possible losses, in excess of reserves established, for legal and regulatory proceedings is up to $207,000 as of December 31, 2017. Set forth below are descriptions of the material lawsuits, regulatory matters and other legal proceedings to which the Company is subject.
Securities Class Action and Shareholder Derivative Lawsuits
•Deka Lawsuit: We are a defendant in a purported securities class action lawsuit (the Deka Lawsuit) in the United States District Court, Northern District of Texas, captioned Deka Investment GmbH et al. v. Santander Consumer USA Holdings Inc. et al., No. 3:15-cv-2129-K. The Deka Lawsuit, which was filed in August 26, 2014, was brought against the Company, certain of its current and former directors and executive officers and certain institutions that served as underwriters in the Company’s IPO on behalf of a class consisting of those who purchased or otherwise acquired our securities between January 23, 2014 and June 12, 2014. The complaint alleges, among other things, that our IPO registration statement and prospectus and certain subsequent public disclosures violated federal securities laws by containing misleading statements concerning the Company’s ability to pay dividends and the adequacy of the Company’s compliance systems and oversight. On December 18, 2015, the Company and the individual defendants moved to dismiss the lawsuit, which was denied. On December 2, 2016, the plaintiffs moved to certify the proposed classes. On July 11, 2017, the court entered an order staying the Deka Lawsuit pending the resolution of the appeal of a class certification order in In re Cobalt Int’l Energy, Inc. Sec. Litig., No. H-14-3428, 2017 U.S. Dist. LEXIS 91938 (S.D. Tex. June 15, 2017).
•Feldman Lawsuit: On October 15, 2015, a shareholder derivative complaint was filed in the Court of Chancery of the State of Delaware, captioned Feldman v. Jason A. Kulas, et al., C.A. No. 11614 (the Feldman Lawsuit). The Feldman Lawsuit names as defendants current and former members of the Board, and names the Company as a nominal defendant. The complaint alleges, among other things, that the current and former director defendants breached their fiduciary duties in connection with overseeing the Company’s nonprime vehicle lending practices, resulting in harm to the Company. The complaint seeks unspecified damages and equitable relief. On December 29, 2015, the Feldman Lawsuit was stayed pending the resolution of the Deka Lawsuit.
•Parmelee Lawsuit: We are a defendant in two purported securities class actions lawsuits that were filed in March and April 2016 in the United States District Court, Northern District of Texas. The lawsuits were consolidated and are now captioned Parmelee v. Santander Consumer USA Holdings Inc. et al., No. 3:16-cv-783. The lawsuits were filed against the Company and certain of its current and former directors and executive officers on behalf of a class consisting of all those who purchased or otherwise acquired our securities between February 3, 2015 and March 15, 2016. The complaint alleges that the Company violated federal securities laws by making false or misleading statements, as well as failing to disclose material adverse facts, in its periodic reports filed under the Exchange Act and certain other public disclosures, in connection with, among other things, the Company’s change in its methodology for estimating its allowance for credit losses and correction of such allowance for prior periods. On March 14, 2017, the Company filed a motion to dismiss the lawsuit. On January 3, 2018, the court granted the Company’s motion as to defendant Ismail Dawood (the Company’s former Chief Financial Officer) and denied the motion as to all other defendants.
•Jackie888 Lawsuit: On September 27, 2016, a shareholder derivative complaint was filed in the Court of Chancery of the State of Delaware, captioned Jackie888, Inc. v. Jason Kulas, et al., C.A. # 12775 (the Jackie888 Lawsuit). The Jackie888 Lawsuit names as defendants current and former members of the Board, and names the Company as a nominal defendant. The complaint alleges, among other things, that the defendants breached their fiduciary duties in connection with the Company’s accounting practices and controls. The complaint seeks unspecified damages and equitable relief. On April 13, 2017, the Jackie888 Lawsuit was stayed pending the resolution of the Deka Lawsuit.
123
Consumer Lending Cases
The Company is also party to various lawsuits pending in federal and state courts alleging violations of state and federal consumer lending laws, including, without limitation, the Equal Credit Opportunity Act, the Fair Debt Collection Practices Act, Fair Credit Reporting Act, Section 5 of the Federal Trade Commission Act, the Telephone Consumer Protection Act, the Truth in Lending Act, wrongful repossession laws, usury laws and laws related to unfair and deceptive acts or practices. In general, these cases seek damages and equitable and/or other relief.
Regulatory Proceedings
The Company is party to, or is periodically otherwise involved in, reviews, investigations, examinations and proceedings (both formal and informal), and information-gathering requests, by government and self-regulatory agencies, including the FRBB, the CFPB, the DOJ, the SEC, the FTC and various state regulatory and enforcement agencies.
Currently, such matters include, but are not limited to, the following:
• | We received a civil subpoena from the DOJ, under FIRREA, requesting the production of documents and communications that, among other things, relate to the underwriting and securitization of nonprime vehicle loans, and also from the SEC requesting the production of documents and communications that, among other things, relate to the underwriting and securitization of nonprime vehicle loans. The Company has responded to these requests within the deadlines specified in the subpoenas and has otherwise cooperated with the DOJ and SEC with respect to these matters. |
• | In October 2014, May 2015, July 2015 and February 2017, the Company received subpoenas and/or Civil Investigative Demands (CIDs) from the Attorneys General of California, Illinois, Oregon, New Jersey, Maryland and Washington under the authority of each state's consumer protection statutes. The Company has been informed that these states will serve as an executive committee on behalf of a group of 30 state Attorneys General. The subpoenas and/or CIDs from the executive committee states contain broad requests for information and the production of documents related to the Company’s underwriting, securitization, servicing and collection of nonprime vehicle loans. The Company has responded to these requests within the deadlines specified in the CIDs and has otherwise cooperated with the Attorneys General with respect to this matter. |
• | In July 2015, the CFPB notified the Company that it had referred to the DOJ certain alleged violations by the Company of the ECOA regarding statistical disparities in markups charged by vehicle dealers to protected groups on loans originated by those dealers and purchased by the Company and the treatment of certain types of income in the Company’s underwriting process. In September 2015, the DOJ notified the Company that it has initiated, based on the referral from the CFPB, an investigation under the ECOA of the Company’s pricing of vehicle loans. The Company has resolved the investigation pursuant to a confidential agreement with the CFPB. |
• | In February 2016, the CFPB issued a supervisory letter relating to its investigation of the Company’s compliance systems, Board and senior management oversight, consumer complaint handling, marketing of GAP coverage and loan deferral disclosure practices. The Company subsequently received a series of CIDs from the CFPB requesting information and testimony regarding the Company’s marketing of GAP coverage and loan deferral disclosure practices. The Company has responded to these requests within the deadlines specified in the CIDs and has otherwise cooperated with the CFPB with respect to this matter. |
• | In August 2017, we received a CID from the CFPB. The stated purpose of the CID is to determine whether the Company has complied with the Fair Credit Reporting Act and related regulations. The Company has responded to these requests within the deadlines specified in the CIDs and has otherwise cooperated with the CFPB with respect to this matter. |
These matters are ongoing and could in the future result in the imposition of damages, fines or other penalties. No assurance can be given that the ultimate outcome of these matters or any resulting proceedings would not materially and adversely affect the Company’s business, financial condition and results of operations.
124
•2017 Written Agreement with the Federal Reserve
On March 21, 2017, the Company and SHUSA entered into a written agreement (the 2017 Written Agreement) with the FRBB. Under the terms of the 2017 Written Agreement, the Company is required to enhance its compliance risk management program, board oversight of risk management and senior management oversight of risk management, and SHUSA is required to enhance its oversight of SC’s management and operations.
•Mississippi Attorney General Lawsuit
On January 10, 2017, the Attorney General of Mississippi filed a lawsuit against the Company in the Chancery Court of the First Judicial District of Hinds County, Mississippi, captioned State of Mississippi ex rel. Jim Hood, Attorney General of the State of Mississippi v. Santander Consumer USA Inc., C.A. # G-2017-28. The complaint alleges that the Company engaged in unfair and deceptive business practices to induce Mississippi consumers to apply for loans that they could not afford. The complaint asserts claims under the Mississippi Consumer Protection Act (the MCPA) and seeks unspecified civil penalties, equitable relief and other relief. On March 31, 2017, the Company filed motions to dismiss the lawsuit and subsequently filed a motion to stay the lawsuit pending the resolution of an interlocutory appeal relating to the MCPA before the Mississippi Supreme Court in Purdue Pharma, L.P., et al. v. State, No. 2017-IA- 00300-SCT. On September 25, 2017, the court granted the motion to stay and ordered a stay of all proceedings, excluding discovery and final briefing on motions to dismiss.
•SCRA Consent Order
In February 2015, the Company entered into a consent order with the DOJ, approved by the United States District Court for the Northern District of Texas, that resolves the DOJ’s claims against the Company that certain of its repossession and collection activities during the period of time between January 2008 and February 2013 violated the SCRA. The consent order requires the Company to pay a civil fine in the amount of $55, as well as at least $9,360 to affected servicemembers consisting of $10 per servicemember plus compensation for any lost equity (with interest) for each repossession by the Company, and $5 per servicemember for each instance where the Company sought to collect repossession-related fees on accounts where a repossession was conducted by a prior account holder. The consent order also provides for monitoring by the DOJ for the Company’s SCRA compliance for a period of five years and requires the Company to undertake certain additional remedial measures.
Agreements
The Company is party to agreements with Bluestem whereby the Company is committed to purchase certain new advances on personal revolving financings receivables, along with existing balances on accounts with new advances, originated by Bluestem for an initial term ending in April 2020 and renewable through April 2022 at Bluestem's option. As of December 31, 2017, the total unused credit available to customers was $3.9 billion. In 2017, the Company purchased $1.2 billion of receivables, out of the $4.0 billion unused credit available to customers as of December 31, 2016. In addition, the Company purchased $263,831 of receivables related to newly opened customer accounts in 2017. Each customer account generated under the agreements generally is approved with a credit limit higher than the amount of the initial purchase, with each subsequent purchase automatically approved as long as it does not cause the account to exceed its limit and the customer is in good standing. As of December 31, 2017 and 2016, the Company was obligated to purchase $11,539 and $12,634, respectively, in receivables that had been originated by Bluestem but not yet purchased by the Company. The Company also is required to make a profit-sharing payment to Bluestem each month if performance exceeds a specified return threshold. During the year ended December 31, 2015, the Company and Bluestem executed an amendment that, among other provisions, increased the profit-sharing percentage retained by the Company, gives the retailer the right to repurchase up to 9.99% of the existing portfolio at any time during the term of the agreement, and, provided that repurchase right is exercised, gives Bluestem the right to retain up to 20% of new accounts subsequently originated.
Under terms of an application transfer agreement with Nissan, the Company has the first opportunity to review for its own portfolio any credit applications turned down by the Nissan's captive finance company. The agreement does not require the Company to originate any loans, but for each loan originated the Company will pay the Nissan a referral fee.
The Company also has agreements with SBNA to service recreational and marine vehicle portfolios. These agreements call for a periodic retroactive adjustment, based on cumulative return performance, of the servicing fee rate to
125
inception of the contract. Adjustments for the years ended December 31, 2017 and 2016 totaled a net adjustment of zero and net upward adjustment of $836, respectively.
In connection with the sale of retail installment contracts through securitizations and other sales, the Company has made standard representations and warranties customary to the consumer finance industry. Violations of these representations and warranties may require the Company to repurchase loans previously sold to on- or off-balance sheet Trusts or other third parties. As of December 31, 2017, there were no loans that were the subject of a demand to repurchase or replace for breach of representations and warranties for the Company's asset-backed securities or other sales. In the opinion of management, the potential exposure of other recourse obligations related to the Company’s retail installment contract sales agreements is not expected to have a material adverse effect on the Company’s business, financial position, results of operations, or cash flows.
Santander has provided guarantees on the covenants, agreements, and obligations of the Company under the governing documents of its warehouse lines and privately issued amortizing notes. These guarantees are limited to the obligations of the Company as servicer.
The Company provided SBNA with the first right to review and approve consumer vehicle lease applications, subject to volume constraints, under terms of a flow agreement that was terminated on May 9, 2015. The Company has indemnified SBNA for potential credit and residual losses on $48,226 of leases that had been originated by SBNA under this program but were subsequently determined not to meet SBNA’s underwriting requirements. This indemnification agreement is supported by an equal amount of cash collateral posted by the Company in an SBNA bank account. The collateral account balance is included in restricted cash in the Company's consolidated balance sheets. As of December 31, 2017, the balance in the collateral account is $18. In January 2015, the Company additionally agreed to indemnify SBNA for residual losses, up to a cap, on certain leases originated under the flow agreement between September 24, 2014 and May 9, 2015 for which SBNA and the Company had differing residual value expectations at lease inception. As of December 31, 2017 and 2016, the Company had a recorded liability of $2,206 and $2,691, respectively, related to the residual losses covered under the agreement.
On March 31, 2015, the Company executed a forward flow asset sale agreement with a third party under terms of which the Company committed to sell charged off loan receivables in bankruptcy status on a quarterly basis until sales total at least $200,000 in proceeds. On June 29, 2015, the Company and the third party executed an amendment to the forward flow asset sale agreement, which increased the committed sales of charged off loan receivables in bankruptcy status to $275,000. On September 30, 2015, the Company and the third party executed a second amendment to the forward flow asset sale agreement, which required sales to occur quarterly. On November 13, 2015, the Company and the third party executed a third amendment to the forward flow asset sale agreement, which increased the committed sales of charged off loan receivables in bankruptcy status to $350,000. However, any sale more than $275,000 is subject to a market price check. As of December 31, 2017 and 2016, the remaining aggregate commitment was $98,858 and $166,167, respectively.
Leases
The Company has entered into various operating leases, primarily for office space and computer equipment. Lease expense incurred totaled $10,901, $11,328 and $8,965 for the years ended December 31, 2017, 2016, and 2015, respectively. The remaining obligations under lease commitments at December 31, 2017 are as follows:
2018 | $ | 12,642 | |
2019 | 12,771 | ||
2020 | 13,032 | ||
2021 | 12,907 | ||
2022 | 12,282 | ||
Thereafter | 44,663 | ||
Total | $ | 108,297 | |
12. Related-Party Transactions
126
Related-party transactions not otherwise disclosed in these footnotes to the consolidated financial statements include the following:
Interest expense, including unused fees, for affiliate debt facilities for the years ended December 31, 2017, 2016, and 2015 was as follows:
For the Year Ended December 31, | |||||||||||
2017 | 2016 | 2015 | |||||||||
Line of credit agreement with Santander - New York Branch (Note 6) | $ | 51,735 | $ | 69,877 | $ | 96,753 | |||||
Debt facilities with SHUSA (Note 6) | 90,988 | 24,050 | 5,299 | ||||||||
Accrued interest for affiliate debt facilities at December 31, 2017 and 2016, were comprised as follows:
December 31, 2017 | December 31, 2016 | ||||||
Line of credit agreement with Santander - New York Branch (Note 6) | $ | 1,435 | $ | 6,297 | |||
Debt facilities with SHUSA (Note 6) | 18,670 | 1,737 | |||||
In August 2015, under a new agreement with Santander, the Company agreed to begin incurring a fee of 12.5 basis points (per annum) on certain warehouse facilities, as they renew, for which Santander provides a guarantee of the Company's servicing obligations. The Company recognized guarantee fee expense of $5,979 and $6,402 for the years ended December 31, 2017 and 2016, respectively. As of December 31, 2017 and 2016, the Company had $7,598 and $1,620 of fees payable to Santander under this arrangement.
Derivatives
The Company has derivative financial instruments with Santander and affiliates with outstanding notional amounts of $3,734,400 and $7,259,400 at December 31, 2017 and 2016, respectively (Note 8). The Company had a collateral overage on derivative liabilities with Santander and affiliates of $1,622 and $15,092 at December 31, 2017 and 2016, respectively. Interest and mark-to-market adjustments on these agreements includes amounts totaling $1,333, $16,078, and $58,019 for the years ended December 31, 2017, 2016, and 2015, respectively.
Originations
The Company is required to permit SBNA a first right to review and assess Chrysler Capital dealer lending opportunities, and SBNA is required to pay the Company a relationship management fee based upon the performance and yields of Chrysler Capital dealer loans held by SBNA. On April 15, 2016, the relationship management fee was replaced with an origination fee and annual renewal fee for each loan. The Company recognized zero, $419 and $6,976 of relationship management fee income for the years ended December 31, 2017, 2016 and 2015, respectively. As of December 31, 2017 and 2016, the Company had relationship management fees receivable from SBNA of zero. The Company recognized $1,660 and $3,314 of origination fee income for the years ended December 31, 2017 and 2016, respectively, and $1,476 and $610 of renewal fee income for the years ended December 31, 2017 and 2016, respectively. As of December 31, 2017 and 2016, the Company had origination and renewal fees receivable from SBNA of $369 and $552. These agreements also transferred the servicing of all Chrysler Capital receivables from dealers, including receivables held by SBNA and by SC, from SC to SBNA. Servicing fee expense under this new agreement totaled $97, $110 and $253 for the years ended December 31, 2017, 2016 and 2015, respectively. As of December 31, 2017 and 2016, the Company had $9 and $21, respectively, of servicing fees payable to SBNA. The Company may provide advance funding for dealer loans originated by SBNA, which is reimbursed to the Company by SBNA. The Company had no outstanding receivable from SBNA as of December 31, 2017 or 2016 for such advances.
Under the agreement with SBNA, the Company may originate retail consumer loans in connection with sales of vehicles that are collateral held against floorplan loans by SBNA. Upon origination, the Company remits payment to SBNA, who settles the transaction with the dealer. The Company owed SBNA $4,481 and $2,761 related to such originations as of December 31, 2017 and 2016, respectively.
The Company received a $9,000 referral fee in connection with the original arrangement and was amortizing the fee into income over the ten-year term of the agreement. The remaining balance of the referral fee SBNA paid to the Company in connection with the original sourcing and servicing agreement is considered a referral fee in connection with the new agreements and will continue to be amortized into income through the July 1, 2022 termination date of
127
the new agreements. As of December 31, 2017 and 2016, the unamortized fee balance was $4,950 and $5,850, respectively. The Company recognized $900, $900, and $900 of income related to the referral fee for the years ended December 31, 2017, 2016, and 2015, respectively.
The Company also has agreements with SBNA to service auto retail installment contracts and recreational and marine vehicle portfolios. Servicing fee income recognized under these agreements totaled $3,381, $5,154, and $2,500 for the years ended December 31, 2017, 2016, and 2015, respectively. Other information on the serviced auto loan and retail installment contract portfolios for SBNA as of December 31, 2017 and 2016 is as follows:
December 31, 2017 | December 31, 2016 | ||||||
Total serviced portfolio | $ | 400,788 | $ | 531,117 | |||
Cash collections due to owner | 11,870 | 21,427 | |||||
Servicing fees receivable | 839 | 1,123 | |||||
During the year ended December 31, 2017, the Company sold certain receivables previously acquired with deteriorated credit quality to SBNA. These loans were sold with a gain of $35,927 recognized in investment losses, net in the consolidated statements of income. The Company will continue to perform the servicing of these assets and has recorded $548 of servicing fee income from SBNA during the period ended December 31, 2017. There were no such sales of receivables previously acquired with deteriorated credit quality to SBNA during 2016 and 2015.
Other information on the serviced receivables for SBNA as of December 31, 2017 is as follows:
December 31, 2017 | |||
Total serviced portfolio | $ | 121,431 | |
Cash collections due to owner | 436 | ||
Servicing fees receivable | 104 | ||
Beginning in 2016, the Company agreed to pay SBNA a market rate-based fee expense for payments made at SBNA retail branch locations for accounts originated/serviced by the Company and the costs associated with modifying the Advanced Teller platform to the payments. The Company incurred $225 and $473 for these services during the years ended December 31, 2017 and 2016, respectively.
Beginning in 2018, the Company has agreed to provide SBNA with origination support services in connection with the processing, underwriting and purchase of retail loans, primarily from Chrysler dealers. In addition, the Company has agreed to perform the servicing for any loans originated on SBNA’s behalf.
Flow Agreements
Until May 9, 2015, the Company was party to a flow agreement with SBNA whereby SBNA had the first right to review and approve Chrysler Capital consumer vehicle lease applications. The Company could review any applications declined by SBNA for the Company’s own portfolio. The Company received an origination fee on all leases originated under this agreement and continues to service these vehicles leases. Pursuant to the Chrysler Agreement, the Company pays FCA on behalf of SBNA for residual gains and losses on the flowed leases. Origination fee income recognized under the agreement totaled zero, zero and $8,431 for the years ended December 31, 2017, 2016 and 2015, respectively. Servicing fee income recognized on leases serviced for SBNA totaled $4,894, $7,707 and $6,977 for the years ended December 31, 2017, 2016 and 2015, respectively.
Other information on the consumer vehicle lease portfolio serviced for SBNA as of December 31, 2017 and 2016 is as follows:
December 31, 2017 | December 31, 2016 | ||||||
Total serviced portfolio | $ | 321,629 | $ | 1,297,317 | |||
Cash collections due to owner | — | 78 | |||||
Origination and servicing fees receivable | 2,067 | 926 | |||||
Revenue share reimbursement receivable | 1,548 | 612 | |||||
128
On June 30, 2014, the Company entered into an indemnification agreement with SBNA whereby the Company indemnifies SBNA for any credit or residual losses on a pool of $48,226 in leases originated under the flow agreement. The covered leases are non-conforming units because they did not meet SBNA’s credit criteria at origination. At the time of the agreement, the Company established a $48,226 collateral account with SBNA in restricted cash that will be released over time to SBNA, in the case of losses, and the Company, in the case of payments and sale proceeds. As of December 31, 2017 and 2016, the balance in the collateral account was $18 and $11,329, respectively. For the years ended December 31, 2017, 2016, and 2015, the Company recognized indemnification expense of $272, zero, and 3,142, respectively.
Also, in January 2015, the Company agreed to indemnify SBNA for residual losses, up to a cap, on certain leases originated under the Company's prior flow agreement with SBNA between September 24, 2014 and May 9, 2015 for which SBNA and the Company had differing residual value expectations at lease inception. At the time of the agreement, the Company established a collateral account held by SBNA to cover the expected losses, as of December 31, 2017 and 2016, the balance in the collateral account was $2,210 and $2,706, respectively. As of December 31, 2017 and 2016, the Company had a recorded liability of $2,206 and $2,691 respectively, related to the residual losses covered under the agreement.
On September 16, 2014, the Company sold $18,227 of receivables from dealers to SBNA, resulting in a gain of $347. The Company was entitled to additional proceeds on this sale totaling $694 if certain conditions, including continued existence and performance of the sold loans, are met at the first and second anniversaries of the sale. At the first and second anniversary dates of the sale, which occurred during the years ended December 31, 2015 and 2016, respectively, the Company received $347 and $347, respectively, in additional proceeds related to the sale due to the satisfaction of conditions specified at the time of the sale.
Securitizations
On March 29, 2017, the Company entered into a Master Securities Purchase Agreement (MSPA) with Santander, whereby the Company has the option to sell a contractually determined amount of eligible prime loans to Santander, through the SPAIN securitization platform, for a term ending in December 2018. The Company will provide servicing on all loans originated under the MSPA. As of December 31, 2017, the Company sold $1,236,331 of loans at fair value under this MSPA. Under a separate securities purchase agreement, the Company sold $1,347,010 of prime loans at fair value to Santander during the year ended December 31, 2017. A total loss of $13,026 was recognized for the year ended December 31, 2017, which is included in investment losses, net in the consolidated statements of income. Servicing fee income recognized totaled $12,346 for the year ended December 31, 2017. The Company had $12,961 of collections due to Santander as of December 31, 2017.
Employment Agreements
On July 2, 2015, the Company announced the departure of Thomas G. Dundon from his roles as Chairman of the Board and CEO of the Company, effective as of the close of business on July 2, 2015. In connection with his departure, and subject to the terms and conditions of his Employment Agreement, including Mr. Dundon's execution of a release of claims against the Company, Mr. Dundon became entitled to receive certain payments and benefits under his Employment Agreement.
Mr. Dundon also entered into a separation agreement (the Separation Agreement) with the Company providing Mr. Dundon with certain other payments and benefits. Mr. Dundon, the Company, DDFS LLC (an affiliate of Mr. Dundon), SHUSA and Santander also entered into a Second Amendment to the Shareholders Agreement (the Second Amendment). Pursuant to the Second Amendment, the parties agreed that the price per share to be paid in the event that a call or put option was exercised under the Shareholders Agreement with respect to the shares of Company Common Stock owned by DDFS LLC would be $26.83.
Pursuant to the Separation Agreement, SHUSA was deemed to have delivered as of July 3, 2015 an irrevocable notice to exercise a call option under the Shareholders Agreement with respect to all 34,598,506 shares of the Company's Common Stock owned by DDFS LLC, subject to the receipt of required bank regulatory approvals and any other approvals required by law (the Call Transaction). The parties to the Separation Agreement agreed that interest would accrue on the call price, commencing after October 15, 2015 (the Call End Date). In addition, pursuant to the Separation Agreement, DDFS LLC and Santander entered into an amendment to the Amended and Restated Loan Agreement, dated as of July 16, 2014, between DDFS LLC and Santander (the Loan Agreement). The Loan Agreement provided for a $300,000 revolving loan which, as of the maturity date, had a $290,000 unpaid principal balance.
129
In the amendment to the Loan Agreement, among other things, the parties agreed that the outstanding balance under the Loan Agreement would become due and payable upon the consummation of the Call Transaction and that the amount otherwise payable to DDFS LLC pursuant the Call Transaction would be reduced by the amount outstanding under the Loan Agreement, including principal, interest and fees, and further that any net cash proceeds received by DDFS LLC on account of sales of Company Common Stock after the Call End Date would be applied to the outstanding balance under the Loan Agreement.
On August 31, 2016, Mr. Dundon, DDFS LLC, the Company, Santander and SHUSA entered into a Second Amendment to the Separation Agreement, and Mr. Dundon, DDFS LLC, Santander and SHUSA entered into a Third Amendment to the Shareholders Agreement, whereby the price per share to be paid to DDFS LLC in connection with the Call Transaction was reduced from $26.83 to $26.17.
On November 15, 2017, Mr. Dundon entered into a Settlement Agreement with Santander, SHUSA, SC, SC Illinois, and DDFS LLC (the Settlement Agreement) pursuant to which Mr. Dundon received cash payments from the Company totaling $66,115, of which $52,799 was paid in satisfaction of Mr. Dundon’s previous exercise of certain stock options that was the subject of the Separation Agreement (see Note 16). The $66,115 cash payment is recorded as compensation expense in the Company’s consolidated statement of income and comprehensive income. The Settlement Agreement also modifies the terms of certain equity-based awards previously granted to Mr. Dundon. In addition, pursuant to the Settlement Agreement, the parties agreed to consummate the Call Transaction. The Call Transaction was consummated on November 15, 2017, pursuant to which Santander purchased the 34,598,506 shares of the Company's Common Stock owned by DDFS LLC for an aggregate price of $941,945, representing the aggregate of the previously agreed price per share of the Company's Common Stock of $26.17, as set forth in the Third Amendment, interest accruing after the Call End Date. The net proceeds to DDFS LLC from the Call Transaction were reduced by all amounts outstanding and/or accrued under the Loan Agreement, including principal, interest (including default interest), and fees, through the closing of the Call Transaction, which totaled $294,501.
CEO compensation
On August 28, 2017, the Board of Directors of the Company announced that Scott Powell would succeed Jason Kulas as President and CEO, effective immediately. During the year 2017, the Company paid $795 to Mr. Powell as its share of compensation expense based on time allocation between the Company and SHUSA.
Other related-party transactions
As of December 31, 2017, Mr. Kulas and Mr. Dundon, both being former members of the Board and CEOs of the Company, along with a Santander employee who was a member of the SC Board until the second quarter of 2015, each had a minority equity investment in a property in which the Company leases approximately 373,000 square feet as its corporate headquarters. During the years ended December 31, 2017, 2016, and 2015, the Company recorded $4,970, $4,945 and $4,612, respectively, in lease expenses on this property. The Company subleases approximately 13,000 square feet of its corporate office space to SBNA. For the years ended December 31, 2017, 2016, and 2015, the Company recorded $163, $161 and $204, respectively, in sublease revenue on this property. Future minimum lease payments over the remainder of the 9-year term of the lease, which extends through 2026, total $62,381.
The Company's wholly-owned subsidiary, Santander Consumer International Puerto Rico, LLC (SCI), opened deposit accounts with Banco Santander Puerto Rico, an affiliated entity. As of December 31, 2017 and 2016, SCI had cash of $106,596 and $98,836, respectively, on deposit with Banco Santander Puerto Rico.
During 2015, Santander Investment Securities Inc. (SIS), an affiliated entity, purchased a portion of the Class B notes of SDART 2013-3, a consolidated securitization Trust, with a principal balance of $725. As of December 31, 2017 and 2016, the unpaid note balance of the Class B notes owned by SIS was zero and zero, respectively. In addition, SIS purchased an investment of $2,000 in the Class A3 notes of CCART 2013-A, a securitization Trust formed by the Company in 2013. Although CCART 2013-A is not a consolidated entity of the Company, the Company continues to service the assets of the associated trust. SIS also serves as co-manager on certain of the Company’s securitizations. Amounts paid to SIS as co-manager for the years ended December 31, 2017, 2016, and 2015 totaled $1,359, $1,149, and $550, respectively, and are included in debt issuance costs in the accompanying consolidated financial statements.
Produban Servicios Informaticos Generales S.L., a Santander affiliate, is under contract with the Company to provide professional services, telecommunications, and internal and/or external applications. Expenses incurred, which are
130
included as a component of other operating costs in the accompanying consolidated statements of income, totaled zero, $93, and $161 for the years ended December 31, 2017, 2016, and 2015, respectively.
The Company is party to a Master Service Agreement (MSA) with a company in which it has a cost method investment and holds a warrant to increase its ownership if certain vesting conditions are satisfied. The MSA enables SC to review point-of-sale credit applications of retail store customers. Under terms of the MSA, the Company originated personal revolving loans of zero, zero, and $23,504 during the years ended December 31, 2017, 2016, and 2015, respectively. During the year ended December 31, 2015, the Company fully impaired its cost method investment in this entity and recorded a loss of $6,000 in investment gains (losses), net in the accompanying consolidated statement of income and comprehensive income. Effective August 17, 2016, the Company ceased funding new originations from all of the retailers for which it reviews credit applications under this MSA.
Beginning in 2017, the Company and SBNA entered into a Credit Card Agreement (Card Agreement) whereby SBNA will provide credit card services for travel and related business expenses and for vendor payments. This service is at zero cost but generate rebates based on purchases made. As at December 31, 2017, the activities associated with the program were insignificant.
Effective April 1, 2017, the Company contracted Aquanima, a Santander affiliate, to provide procurement services. Expenses incurred totaled $637 for the year ended December 31, 2017.
The Company partners with SHUSA to place Cyber Liability Insurance in which participating national entities share $150 million aggregate limits. The Company repays SHUSA for the Company’s equitably allocated portion of insurance premiums and fees. Expenses incurred totaled $312 and $294 for the year ended December 31, 2017 and December 31, 2016, respectively.
13. | Supplemental Cash Flow Information |
Supplemental cash flow information for the year ended December 31, 2017 and December 31, 2016, was as follows:
For the Year Ended December 31, | |||||||||||
2017 | 2016 | 2015 | |||||||||
Cash paid (received) during the year for: | |||||||||||
Interest | $ | 942,551 | $ | 796,682 | $ | 635,558 | |||||
Income taxes | 1,856 | (180,323 | ) | (190,663 | ) | ||||||
Noncash investing and financing transactions: | |||||||||||
Transfer of revolving credit facilities to secured structured financings | 495,991 | 146,864 | 193,180 | ||||||||
Transfer of personal loans to held for sale | — | — | 1,883,251 | ||||||||
During the year ended December 31, 2015, the Company deconsolidated certain Trusts from the consolidated balance sheet following the sale of its retained interests in the respective Trusts (Note 7). Upon deconsolidation, the Company derecognized $1,919,171 in assets, including $170,144 in restricted cash, and $1,183,792 in notes payable and other liabilities of the Trusts.
14. | Computation of Basic and Diluted Earnings per Common Share |
Earnings per common share (EPS) is computed using the two-class method required for participating securities. Restricted stock awards are considered to be participating securities because holders of such shares have non-forfeitable dividend rights in the event of a declaration of a dividend on the Company’s common shares.
The calculation of earnings per share excludes 367,880, 1,387,656, and 926,242 employee stock options and 626,551, 1,106,187, and zero RSUs for the years ended December 31, 2017, 2016, and 2015, respectively, as the effect of those securities would be anti-dilutive. The following table represents EPS numbers for the years ended December 31, 2017, 2016 and 2015:
131
For the Year Ended December 31, | |||||||||||
2017 | 2016 | 2015 | |||||||||
Earnings per common share | |||||||||||
Net income attributable to Santander Consumer USA Holdings Inc. shareholders | $ | 1,187,606 | $ | 766,466 | $ | 824,040 | |||||
Weighted average number of common shares outstanding before restricted participating shares (in thousands) | 359,614 | 358,032 | 354,636 | ||||||||
Weighted average number of participating restricted common shares outstanding (in thousands) | — | 249 | 467 | ||||||||
Weighted average number of common shares outstanding (in thousands) | 359,614 | 358,281 | 355,103 | ||||||||
Earnings per common share | $ | 3.30 | $ | 2.14 | $ | 2.32 | |||||
Earnings per common share - assuming dilution | |||||||||||
Net income attributable to Santander Consumer USA Holdings Inc. shareholders | $ | 1,187,606 | $ | 766,466 | $ | 824,040 | |||||
Weighted average number of common shares outstanding (in thousands) | 359,614 | 358,281 | 355,103 | ||||||||
Effect of employee stock-based awards (in thousands) | 678 | 797 | 1,060 | ||||||||
Weighted average number of common shares outstanding - assuming dilution (in thousands) | 360,292 | 359,078 | 356,163 | ||||||||
Earnings per common share - assuming dilution | $ | 3.30 | $ | 2.13 | $ | 2.31 | |||||
15. Fair Value of Financial Instruments
Fair value measurement requires that valuation techniques maximize the use of observable inputs and minimize the use of unobservable inputs and also establishes a fair value hierarchy that categorizes into three levels the inputs to valuation techniques used to measure fair value as follows:
Level 1 inputs are quoted prices in active markets for identical assets or liabilities that can be accessed as of the measurement date. Active markets are those in which transactions for the asset or liability occur in sufficient frequency and volume to provide pricing information on an ongoing basis.
Level 2 inputs are those other than quoted prices included within Level 1 that are observable for the asset or liability, either directly or indirectly. These include quoted prices for similar assets or liabilities in active markets and quoted prices for identical or similar assets or liabilities in markets that are not active.
Level 3 inputs are those that are unobservable for the asset or liability and are used to measure fair value to the extent relevant observable inputs are not available.
Financial Instruments Disclosed, But Not Carried, At Fair Value
The following tables present the carrying value and estimated fair value of the Company’s financial assets and liabilities disclosed, but not carried, at fair value at December 31, 2017 and December 31, 2016, and the level within the fair value hierarchy:
December 31, 2017 | |||||||||||||||||||
Carrying Value | Estimated Fair Value | Level 1 | Level 2 | Level 3 | |||||||||||||||
Assets: | |||||||||||||||||||
Cash and cash equivalents (a) | $ | 527,805 | $ | 527,805 | $ | 527,805 | $ | — | $ | — | |||||||||
Finance receivables held for investment, net (b) | 22,284,068 | 24,340,739 | — | — | 24,340,739 | ||||||||||||||
Restricted cash (a) | 2,553,902 | 2,553,902 | 2,553,902 | — | — | ||||||||||||||
Total | $ | 25,365,775 | $ | 27,422,446 | $ | 3,081,707 | $ | — | $ | 24,340,739 | |||||||||
Liabilities: | |||||||||||||||||||
Notes payable — credit facilities (c) | $ | 4,848,316 | $ | 4,848,316 | $ | — | $ | — | $ | 4,848,316 | |||||||||
Notes payable — secured structured financings (d) | 22,557,895 | 22,688,381 | — | 12,275,408 | 10,412,973 | ||||||||||||||
Notes payable — related party (e) | 3,754,223 | 3,754,223 | — | — | 3,754,223 | ||||||||||||||
Total | $ | 31,160,434 | $ | 31,290,920 | $ | — | $ | 12,275,408 | $ | 19,015,512 | |||||||||
132
December 31, 2016 | |||||||||||||||||||
Carrying Value | Estimated Fair Value | Level 1 | Level 2 | Level 3 | |||||||||||||||
Assets: | |||||||||||||||||||
Cash and cash equivalents (a) | $ | 160,180 | $ | 160,180 | $ | 160,180 | $ | — | $ | — | |||||||||
Finance receivables held for investment, net (b) | 23,456,506 | 24,630,599 | 24,630,599 | ||||||||||||||||
Restricted cash (a) | 2,757,299 | 2,757,299 | 2,757,299 | — | — | ||||||||||||||
Total | $ | 26,373,985 | $ | 27,548,078 | $ | 2,917,479 | $ | — | $ | 24,630,599 | |||||||||
Liabilities: | |||||||||||||||||||
Notes payable — credit facilities (c) | $ | 6,739,817 | $ | 6,739,817 | $ | — | $ | — | $ | 6,739,817 | |||||||||
Notes payable — secured structured financings (d) | 21,608,889 | 21,712,691 | — | 13,530,045 | 8,182,646 | ||||||||||||||
Notes payable — related party (e) | 2,975,000 | 2,975,000 | — | — | 2,975,000 | ||||||||||||||
Total | $ | 31,323,706 | $ | 31,427,508 | $ | — | $ | 13,530,045 | $ | 17,897,463 | |||||||||
(a) | Cash and cash equivalents and restricted cash — The carrying amount of cash and cash equivalents, including restricted cash, is at an approximated fair value as the instruments mature within 90 days or less and bear interest at market rates. |
(b) | Finance receivables held for investment, net — Finance receivables held for investment, net are carried at amortized cost, net of an allowance. The estimated fair value for the underlying financial instruments are determined as follows: |
• | Retail installment contracts held for investment, net — The estimated fair value is calculated based on a DCF in which the Company uses significant unobservable inputs on key assumptions, including historical default rates and adjustments to reflect prepayment rates, expected recovery rates, discount rates reflective of the cost of funding, and credit loss expectations. |
• | Receivables from dealers held for investment and Capital lease receivables, net — Receivables from dealers held for investment and capital lease receivables are carried at amortized cost, net of credit loss allowance and gross investments, net of unearned income and allowance for lease losses, respectively. Management believes that the terms of these credit agreements approximate market terms for similar credit agreements. |
(c) | Notes payable — credit facilities — The carrying amount of notes payable related to revolving credit facilities is estimated to approximate fair value. Management believes that the terms of these credit agreements approximate market terms for similar credit agreements as the facilities are subject to short-term floating interest rates that approximate rates available to the Company. |
(d) | Notes payable — secured structured financings — The estimated fair value of notes payable related to public securitizations is calculated based on market observable prices and spreads for the Company’s publicly traded debt and market observed prices of similar notes issued by the Company, or recent market transactions involving similar debt with similar credit risks, which are considered level 2 inputs. The estimated fair value of notes payable related to privately issued amortizing notes is calculated based on a combination of discounted cash flow analysis and market observable spreads for similar liabilities in which the Company uses significant unobservable inputs on key assumptions, including historical default rates and adjustments to reflect prepayment rates, discount rates reflective of the cost of funding, and credit loss expectations, which are considered level 3 inputs. |
(e) | Notes payable — related party — The carrying amount of notes payable to a related party is estimated to approximate fair value as the facilities are subject to short-term floating interest rates that approximate rates available to the Company. |
Financial Instruments Measured At Fair Value On A Recurring Basis
The following table presents the Company’s assets and liabilities that are measured at fair value on a recurring basis at December 31, 2017 and 2016, and are categorized using the fair value hierarchy:
133
Fair Value Measurements at December 31, 2017 | |||||||||||||||
Total | Quoted Prices in Active Markets for Identical Assets (Level 1) | Significant Other Observable Inputs (Level 2) | Significant Unobservable Inputs (Level 3) | ||||||||||||
Other assets — trading interest rate caps (a) | $ | 129,718 | $ | — | $ | 129,718 | $ | — | |||||||
Due from affiliates — trading interest rate caps (a) | 6,112 | — | 6,112 | — | |||||||||||
Other assets — cash flow hedging interest rate swaps (a) | 39,036 | — | 39,036 | — | |||||||||||
Due from affiliates — cash flow hedging interest rate swaps (a) | 6,950 | — | 6,950 | — | |||||||||||
Other assets — trading interest rate swaps (a) | 7,925 | — | 7,925 | — | |||||||||||
Due from affiliates — trading interest rate swaps (a) | 1,671 | — | 1,671 | — | |||||||||||
Other assets — trading options for interest rate caps (a) | 20,075 | — | 20,075 | — | |||||||||||
Due from affiliates — trading options for interest rate caps (a) | 12,090 | — | 12,090 | — | |||||||||||
Other liabilities — trading options for interest rate caps (a) | 129,712 | — | 129,712 | — | |||||||||||
Due to affiliates — trading options for interest rate caps (a) | 6,112 | — | 6,112 | — | |||||||||||
Other liabilities — trading interest rate caps (a) | 20,019 | — | 20,019 | — | |||||||||||
Due to affiliates — trading interest rate caps (a) | 12,090 | — | 12,090 | — | |||||||||||
Retail installment contracts acquired individually (c) | 22,124 | — | — | 22,124 | |||||||||||
Fair Value Measurements at December 31, 2016 | |||||||||||||||
Total | Quoted Prices in Active Markets for Identical Assets (Level 1) | Significant Other Observable Inputs (Level 2) | Significant Unobservable Inputs (Level 3) | ||||||||||||
Other assets — trading interest rate caps (a) | $ | 68,676 | $ | — | $ | 68,676 | $ | — | |||||||
Due from affiliates — trading interest rate caps (a) | 7,593 | — | 7,593 | — | |||||||||||
Other assets — cash flow hedging interest rate swaps (a) | 41,471 | — | 41,471 | — | |||||||||||
Due from affiliates — cash flow hedging interest rate swaps (a) | 4,080 | — | 4,080 | — | |||||||||||
Other assets — trading interest rate swaps (a) | 783 | — | 783 | — | |||||||||||
Due from affiliates — trading interest rate swaps (a) | 1,292 | — | 1,292 | — | |||||||||||
Other liabilities — trading options for interest rate caps (a) | 68,688 | — | 68,688 | — | |||||||||||
Due to affiliates — trading options for interest rate caps (a) | 7,593 | — | 7,593 | — | |||||||||||
Other liabilities — cash flow hedging interest rate swaps (a) | 482 | — | 482 | — | |||||||||||
Due to affiliates — cash flow hedging interest rate swaps (a) | 451 | — | 451 | — | |||||||||||
Other liabilities — trading interest rate swaps (a) | 42 | — | 42 | — | |||||||||||
Due to affiliates — trading interest rate swaps (a) | 95 | — | 95 | — | |||||||||||
Other liabilities — total return settlement (a,b) | 30,618 | — | — | 30,618 | |||||||||||
Retail installment contracts acquired individually (c) | 24,495 | — | — | 24,495 | |||||||||||
(a) | The valuation is determined using widely accepted valuation techniques including a DCF on the expected cash flows of each derivative. This analysis reflects the contractual terms of the derivative, including the period to maturity, and uses observable market-based inputs. The Company incorporates credit valuation adjustments to appropriately reflect both its own nonperformance risk and the respective counterparty’s nonperformance risk in the fair value measurement of its derivatives. In adjusting the fair value of its derivative contracts for the effect of nonperformance risk, the Company has considered the impact of netting and any applicable credit enhancements, such as collateral postings and guarantees. The Company utilizes the exception in ASC 820-10-35-18D (commonly referred to as the “portfolio exception”) with respect to measuring counterparty credit risk for instruments (Note 8). |
(b) | The significant unobservable inputs for total return settlement derivative contracts used in the fair value measurement of the Company's liabilities are discount percentages, which are based on comparable financial instruments. |
(c) | For certain retail installment contracts reported in finance receivables held for investment, net, the Company has elected the fair value option. The fair values of the retail installment contracts are estimated using a DCF model. When estimating the fair value using this model, the Company uses significant unobservable inputs on key assumptions, which includes historical default rates and adjustments to reflect prepayment rates based on available data from a comparable market securitization of similar assets, discount rates reflective of the cost of funding of debt issuance and recent historical equity yields, and recovery rates based on the average severity utilizing reported severity rates and loss severity utilizing available market data from a comparable securitized pool. Accordingly, retail installment |
134
contracts held for investment are classified as Level 3. Changes in the fair value are recorded in investment gains (losses), net in the consolidated statement of income.
The following table presents the changes in retail installment contracts held for investment balances classified as Level 3 for the years ended December 31, 2017, 2016 and 2015:
Year Ended | |||||||||||
December 31, 2017 | December 31, 2016 | December 31, 2015 | |||||||||
Fair value, beginning of year | $ | 24,495 | $ | 6,770 | $ | — | |||||
Additions / issuances | 21,672 | 36,623 | 6,770 | ||||||||
Net collection activities | (28,598 | ) | (18,850 | ) | — | ||||||
Loans sold | — | (48 | ) | — | |||||||
Gains recognized in earnings | 4,555 | — | — | ||||||||
Fair value, end of year | $ | 22,124 | $ | 24,495 | $ | 6,770 | |||||
The following table presents the changes in the total return settlement balance, which is classified as Level 3, for the years ended December 31, 2017, 2016, and 2015:
Year Ended | |||||||||||
December 31, 2017 | December 31, 2016 | December 31, 2015 | |||||||||
Fair value, beginning of year | $ | 30,618 | $ | 53,432 | $ | 48,893 | |||||
Losses recognized in earnings | 505 | 4,365 | 10,973 | ||||||||
Settlements | (31,123 | ) | (27,179 | ) | (6,434 | ) | |||||
Fair value, end of year | $ | — | $ | 30,618 | $ | 53,432 | |||||
The Company did not have any transfers between Levels 1 and 2 during the years ended December 31, 2017, 2016, and 2015. There were no amounts transferred into or out of Level 3 during the years ended December 31, 2017, 2016, and 2015.
Financial Instruments Measured At Fair Value On A Nonrecurring Basis
The following table presents the Company’s assets and liabilities that are measured at fair value on a nonrecurring basis at December 31, 2017 and 2016, and are categorized using the fair value hierarchy:
Fair Value Measurements at December 31, 2017 | |||||||||||||||||||
Total | Quoted Prices in Active Markets for Identical Assets (Level 1) | Significant Other Observable Inputs (Level 2) | Significant Unobservable Inputs (Level 3) | Lower of cost or fair value expense for the year ended December 31, 2017 | |||||||||||||||
Other assets — vehicles (a) | $ | 293,546 | $ | — | $ | 293,546 | $ | — | $ | — | |||||||||
Personal loans held for sale (b) | 1,062,089 | — | — | 1,062,089 | 374,374 | ||||||||||||||
Retail installment contracts held for sale (c) | 1,148,332 | — | — | 1,148,332 | 11,686 | ||||||||||||||
Auto loans impaired due to bankruptcy (d) | 121,578 | — | 121,578 | — | 75,194 | ||||||||||||||
135
Fair Value Measurements at December 31, 2016 | |||||||||||||||||||
Total | Quoted Prices in Active Markets for Identical Assets (Level 1) | Significant Other Observable Inputs (Level 2) | Significant Unobservable Inputs (Level 3) | Lower of cost or fair value expense for the year ended December 31, 2016 | |||||||||||||||
Other assets — vehicles (a) | $ | 257,382 | $ | — | $ | 257,382 | $ | — | $ | — | |||||||||
Personal loans held for sale (b) | 1,077,600 | — | — | 1,077,600 | 414,703 | ||||||||||||||
Retail installment contracts held for sale (c) | 1,045,815 | — | — | 1,045,815 | 8,913 | ||||||||||||||
(a) The Company estimates the fair value of its vehicles, which are obtained either through repossession or lease termination, using historical auction rates and current market levels of used car prices.
(b) Represents the portion of the portfolio specifically impaired as of period-end. The estimated fair value for personal loans held for sale is calculated based on the lower of market participant view and a DCF analysis in which the Company uses significant unobservable inputs on key assumptions, including historical default rates and adjustments to reflect prepayment rates, discount rates reflective of the cost of funding, and credit loss expectations. The lower of cost or fair value adjustment for personal loans held for sale includes customer default activity and adjustments related to the net change in the portfolio balance during the reporting period.
(c) The estimated fair value is calculated based on a DCF analysis in which the Company uses significant unobservable inputs on key assumptions, including expected default rates, prepayment rates, recovery rates, and discount rates reflective of the cost of funds and appropriate rate of returns.
(d) For loans that are considered collateral-dependent, such as certain bankruptcy loans, impairment is measured based on the fair value of the collateral, less its estimated cost to sell. For the underlying collateral, the estimated fair value is obtained using historical auction rates and current market levels of used car prices.
Quantitative Information about Level 3 Fair Value Measurements
The following table presents quantitative information about the significant unobservable inputs for assets and liabilities measured at fair value on a recurring and nonrecurring basis at December 31, 2017:
Financial Instruments | Fair Value at December 31, 2017 | Valuation Technique | Unobservable Inputs | Range | ||||
Financial Assets: | ||||||||
Retail installment contracts held for investment | $22,124 | Discounted Cash Flow | Discount Rate | 8% - 10% | ||||
Default Rate | 15% - 20% | |||||||
Prepayment Rate | 6% - 8% | |||||||
Loss Severity Rate | 50% - 60% | |||||||
Personal loans held for sale | $1,062,089 | Lower of Market or Income Approach | Market Approach | |||||
Market Participant View | 70% - 80% | |||||||
Income Approach | ||||||||
Discount Rate | 15% - 20% | |||||||
Default Rate | 30% - 40% | |||||||
Net Principal Payment Rate | 50% - 70% | |||||||
Loss Severity Rate | 90% - 95% | |||||||
Retail installment contracts held for sale | $1,148,332 | Discounted Cash Flow | Discount Rate | 3% - 6% | ||||
Default Rate | 3% - 4% | |||||||
Prepayment Rate | 15% - 20% | |||||||
Loss Severity Rate | 50% - 60% | |||||||
The following table presents quantitative information about the significant unobservable inputs for assets and liabilities measured at fair value on a recurring and nonrecurring basis at December 31, 2016:
136
Financial Instruments | Fair Value at December 31, 2016 | Valuation Technique | Unobservable Inputs | Range | ||||
Financial Assets: | ||||||||
Retail installment contracts held for investment | $24,495 | Discounted Cash Flow | Discount Rate | 8% - 10% | ||||
Default Rate | 15% - 20% | |||||||
Prepayment Rate | 6% - 8% | |||||||
Loss Severity Rate | 50% - 60% | |||||||
Personal loans held for sale | $1,077,600 | Lower of Market or Income Approach | Market Approach | |||||
Market Participant View | 70% - 80% | |||||||
Income Approach | ||||||||
Discount Rate | 15% - 20% | |||||||
Default Rate | 30% - 40% | |||||||
Net Principal Payment Rate | 50% - 70% | |||||||
Loss Severity Rate | 90% - 95% | |||||||
Retail installment contracts held for sale | $1,045,815 | Discounted Cash Flow | Discount Rate | 3% - 6% | ||||
Default Rate | 3% - 4% | |||||||
Prepayment Rate | 15% - 20% | |||||||
Loss Severity Rate | 50% - 60% | |||||||
Total return settlement | $30,618 | Discounted Cash Flow | Discount Rate | 6.4% | ||||
16. Employee Benefit Plans
SC Compensation Plans — Prior to its expiration on January 31, 2015, the Company granted stock options to certain executives, other employees, and independent directors under the 2011 Management Equity Plan (the MEP). It enabled the Company to make stock awards up to a total of approximately 29 million common shares. No further awards will be made under this plan. In December 2013, the Board established the Omnibus Incentive Plan (the Omnibus Plan), which was amended and restated as of June 2016. The Omnibus Plan enables the Company to grant awards of non-qualified and incentive stock options, stock appreciation rights, restricted stock awards, restricted stock units (RSUs), and other awards that may be settled in or based upon the value of the Company's common stock up to a total of 5,192,641 common shares.
Stock options granted have an exercise price based on the fair market value of the Company’s common stock on the grant date. The stock options expire after ten years and include both time vesting options and performance vesting options. The fair value of the stock options is amortized into income over the vesting period as time and performance vesting conditions are met. Under the Management Shareholders Agreement entered into by certain employees, no shares obtained through exercise of stock options under the MEP could be transferred until the later of December 31, 2016, and the Company’s execution of an IPO (the later date of which is referred to as the Lapse Date). Until the Lapse Date, if an employee were to leave the Company, the Company would have the right to repurchase any or all of the stock obtained by the employee through option exercise. If the employee were terminated for cause (as defined in the MEP) or voluntarily left the Company without good reason (as defined in the Plan), in each case, prior to the Lapse Date the repurchase price would be the lower of the strike price or fair market value at the date of repurchase. If the employee were terminated without cause or voluntarily left the Company with good reason, in each case, prior to the Lapse Date the repurchase price is the fair market value at the date of repurchase. Management believes the Company’s repurchase right caused the IPO event to constitute an implicit vesting condition and therefore did not record any stock compensation expense until the date of the IPO.
On December 28, 2013, the Board approved certain changes to the MEP and the Management Shareholders Agreement, including acceleration of vesting for certain employees, removal of transfer restrictions for shares underlying a portion of the options outstanding under the Plan, and addition of transfer restrictions for shares underlying another portion of the outstanding options. All of the changes were contingent on, and effective upon, the Company’s execution of an IPO and, as such, became effective upon pricing of the IPO on January 22, 2014. Also, on December 28, 2013, the Company granted 583,890 shares of restricted stock to certain executives under terms of the Omnibus Plan. Compensation expense related to this restricted stock is recognized over a five-year vesting period, with $5,457, $725, and $8,851 recorded for the years ended December 31, 2017, 2016, and 2015, respectively.
137
Also, in connection with the IPO, the Company granted additional stock options under the MEP to certain executives, other employees, and an independent director with an estimated compensation cost of $10,216, which is being recognized over the awards' vesting period of five years for the employees and three years for the director. Additional stock option grants have been made to employees under the Omnibus Plan during the year ended December 31, 2016. The estimated compensation cost associated with these additional grants was $727 and will be recognized over the vesting periods of the awards.
A summary of the Company’s stock options and related activity as of and for the year ended December 31, 2017 is as follows:
Shares | Weighted Average Exercise Price | Weighted Average Remaining Contractual Term (Years) | Aggregate Intrinsic Value | |||||||||
Options outstanding at January 1, 2017 | 4,295,830 | $ | 12.70 | 5.6 | $ | 12,982 | ||||||
Exercised | (1,435,606 | ) | 9.51 | 8,047 | ||||||||
Expired | (470,276 | ) | 20.28 | |||||||||
Forfeited | (694,940 | ) | 14.94 | |||||||||
Options outstanding at December 31, 2017 | 1,695,008 | $ | 12.39 | 4.7 | $ | 12,058 | ||||||
Options exercisable at December 31, 2017 | 1,455,170 | $ | 10.91 | 4.3 | $ | 11,851 | ||||||
Options expected to vest at December 31, 2017 | 239,838 | $ | 21.35 | 6.7 | ||||||||
In connection with compensation restrictions imposed on certain executive officers and other employees by the European Central Bank under the Capital Requirements Directive IV (CRD IV) prudential rules, which require a portion of such officers' and employees' variable compensation to be paid in the form of equity, the Company granted RSUs in February and April 2015. Pursuant to the applicable award agreements under the Omnibus Plan, a portion of the RSUs vested immediately upon grant, and a portion will vest annually over the first three anniversaries of the grant date. In June 2015, as part of a separate grant under the Omnibus Incentive Plan, the Company granted certain officers RSUs that vest over a three-year period, with vesting dependent on Santander performance over that time. After vesting, stock obtained by employees and officers through RSUs must be held for one year. In October 2015, the Company granted, under the Omnibus Plan, certain directors RSUs that vest upon the earlier of the first anniversary of the grant date or the first annual meeting following the grant date. In December 2015, the Company granted a new officer RSUs that will vest in equal portions on each of the first three anniversaries of the grant date.
In February, June and November 2016, the Company granted certain new employees RSUs that will vest annually over a three-year period. In March, April and November 2016, RSUs that vest annually over a three-year period were granted to certain officers and employees as retention awards. The RSUs granted as retention awards to officers and employees whose variable compensation is subject to the provisions of CRD IV must be held for one year after vesting. In accordance with the provisions of CRD IV, in April 2016, the Company granted RSUs to certain officers and employees, a portion of which vested immediately upon grant and a portion that vest annually over a three-year period, and all of which must be held for one year after vesting. In November 2016, the Company granted certain officers RSUs that vest over a three-year period, with vesting dependent on Santander performance over that time and which must be held for one year after vesting. In November and December 2016, the Company granted certain directors RSUs that vest upon the earlier of the first anniversary of the grant date or the first annual meeting following the grant date. All RSU grants during the year ended December 31, 2016 were made under the Omnibus Plan.
In March, May, August, and October 2017, the Company granted to certain employees subject to CRD IV, RSUs that vest annually over three-year periods. In March 2017, the company granted RSUs to certain officers and employees in connection with the 2016 annual bonus. For the RSUs granted to officers and employees subject to CRD IV, except for the CEO, 60% of the RSUs vested immediately upon grant and 40% of the RSUs will vest ratably over three-year periods, all of which must be held for one year after vesting. For the RSUs granted to the CEO, half of the RSUs vested immediately upon grant and half of the RSUs will vest ratably over a five-year period, subject to the achievement of certain performance conditions. For employees not subject to the CRD IV, the RSUs will vest annually over three-year periods. In June 2017, the Company granted certain directors RSUs that vest upon the earlier of the first anniversary of the grant date or the first annual meeting following the grant date. All RSU grants during the year ended December 31, 2017 were made under the Omnibus Plan.
On November 15, 2017, Mr. Dundon (former Chairman of the Board and CEO of the Company), the Company, SC Illinois, SHUSA, Santander and DDFS LLC (an affiliate of Mr. Dundon), entered into the Settlement Agreement that,
138
among other things, amended the terms of a prior settlement agreement entered into between the parties in connection with Mr. Dundon’s departure from the Company. Pursuant to the Settlement Agreement, among other things, Mr. Dundon received payments from the Company totaling $66,115, of which $52,799 was paid in satisfaction of Mr. Dundon’s previous exercise of certain stock options that was the subject of the Separation Agreement entered into by Mr. Dundon in connection with his departure from the Company. The Settlement Agreement also modifies the terms of certain equity-based awards previously granted to Mr. Dundon.
A summary of the status and changes of the Company's nonvested stock options as of and for the year ended December 31, 2017, is presented below:
Shares | Weighted Average Grant Date Fair Value | |||||
Non-vested at January 1, 2017 | 1,151,067 | $ | 7.02 | |||
Granted | — | — | ||||
Vested | (216,289 | ) | 7.66 | |||
Forfeited or expired | (694,940 | ) | 6.73 | |||
Non-vested at December 31, 2017 | 239,838 | $ | 7.29 | |||
At December 31, 2017, total unrecognized compensation expense for nonvested stock options was $1,198, which is expected to be recognized over a weighted average period of 2.2 years.
There were no stock options granted to employees in 2017. The following summarizes the assumptions used for estimating the fair value of stock options granted to employees for the years ended December 31, 2016, and 2015.
For the Year Ended December 31, | |||
2016 | 2015 | ||
Assumption | |||
Risk-free interest rate | 1.79% | 1.64% - 1.97% | |
Expected life (in years) | 6.5 | 6.0 - 6.5 | |
Expected volatility | 33% | 32% - 48% | |
Dividend yield | 3.69% | 1.6% - 2.7% | |
Weighted average grant date fair value | $3.14 | $6.92 - $9.67 | |
Defined Contribution Plan— The Company sponsors a defined contribution plan offered to qualifying employees. Employees participating in the plan may contribute up to 75% of their base salary, subject to federal limitations on absolute amounts contributed. The Company will match up to 6% of their base salary, with matching contributions of 100% of employee contributions. The total amount contributed by the Company in 2017, 2016, and 2015, was $12,370, $11,805, and $9,498, respectively.
17. Shareholders' Equity
Treasury Stock
The Company had 252,002 and 94,595 shares of treasury stock outstanding with a cost of $5,370 and $1,600 as of December 31, 2017 and 2016, respectively. Prior to the IPO, the Company repurchased 3,154 shares as a result of an employee leaving the company. Additionally, as of December 31, 2017 and 2016, 248,848 and 91,441 shares were withheld to cover income taxes related to stock issued in connection with employee incentive compensation plans respectively, including 157,407 and 25,590 shares withheld during the years ended December 31, 2017 and 2016, respectively. The value of the treasury stock is immaterial and included within additional paid-in-capital.
Accumulated Other Comprehensive Income (Loss)
A summary of changes in accumulated other comprehensive income (loss), net of tax, for the years ended December 31, 2017, 2016, and 2015 is as follows:
139
Unrealized gains (losses) on cash flow hedges | |||
Balance - January 1, 2015 | $ | 3,553 | |
Other comprehensive income (loss) before reclassifications (gross) | (34,182 | ) | |
Amounts (gross) reclassified out of accumulated other comprehensive income | 32,754 | ||
Balance - December 31, 2015 | 2,125 | ||
Other comprehensive income (loss) before reclassifications (gross) | (1,324 | ) | |
Amounts (gross) reclassified out of accumulated other comprehensive income | 27,458 | ||
Balance - December 31, 2016 | 28,259 | ||
Other comprehensive income (loss) before reclassifications (gross) | 21,962 | ||
Amounts (gross) reclassified out of accumulated other comprehensive income | (5,959 | ) | |
Balance - December 31, 2017 | $ | 44,262 | |
Amounts (gross) reclassified out of accumulated other comprehensive income (loss) consist of the following:
Year Ended December 31, 2017 | Year Ended December 31, 2016 | Year Ended December 31, 2015 | |||||||||||||||
Reclassification | Amount reclassified | Income statement line item | Amount reclassified | Income statement line item | Amount reclassified | Income statement line item | |||||||||||
Cash flow hedges | $ | (6,060 | ) | Interest Expense | $ | 43,898 | Interest Expense | $ | 50,860 | Interest Expense | |||||||
Tax expense (benefit) | 101 | (16,440 | ) | (18,106 | ) | ||||||||||||
Net of tax | $ | (5,959 | ) | $ | 27,458 | $ | 32,754 | ||||||||||
Dividends
The Company made a dividend payment in 2017 and in February 2018 and, subject to Board approval, plan to pay a dividend in the second quarter of 2018.
18. Investment Gains (Losses), Net
When the Company sells retail installment contracts acquired individually, personal loans or leases to unrelated third parties or to VIEs and determines that such sale meets the applicable criteria for sale accounting, the Company recognizes a gain or loss for the difference between the cash proceeds and carrying value of the assets sold. The gain or loss is recorded in investment gains (losses), net. Lower of cost or market adjustments on the recorded investment of finance receivables held for sale are also recorded in investment gains (losses), net.
Investment gains (losses), net was comprised of the following for the years ended December 31, 2017, 2016, and 2015:
For the Year Ended December 31, | |||||||||||
2017 | 2016 | 2015 | |||||||||
Gain (loss) on sale of loans and leases | $ | 17,554 | $ | (11,549 | ) | $ | 155,408 | ||||
Lower of cost or market adjustments | (386,060 | ) | (423,616 | ) | (236,396 | ) | |||||
Other gains / (losses and impairments) | 2,067 | (9,594 | ) | (14,226 | ) | ||||||
$ | (366,439 | ) | $ | (444,759 | ) | $ | (95,214 | ) | |||
The lower of cost or market adjustments for the year ended December 31, 2017 included $451,672 in customer default activity and net favorable adjustments of $65,612 related to net changes in the unpaid principal balance on the personal lending portfolio, most of which has been classified as held for sale since September 30, 2015. The lower of cost or market adjustments for the year ended December 31, 2016 included $429,106 in customer default activity and net favorable adjustments of $14,403 related to net changes in the unpaid principal balance on the personal lending portfolio, most of which has been classified as held for sale since September 30, 2015. The key driver to continued write-downs due to customer default activity, is the lower of cost or market adjustment recorded for each new originated loan, based on forecasted lifetime loss.
140
19. | Correction of Errors |
On October 27, 2016, the Company filed an amended Annual Report on Form 10-K/A for the year ended December 31, 2015 in which the Company restated its audited financial statements for the year ended December 31, 2015 to correct certain errors which are reflected herein, the most significant of which were as follows:
• | The methodology for estimating the credit loss allowance for individually acquired retail installment contracts held for investment and the identification of the population of loans that should be classified and disclosed as TDRs. |
• | The effective rate used to discount expected cash flows to determine TDR impairment. |
• | The classification of subvention payments within the income statement related to leased vehicles. |
• | The application of the retrospective effective interest method for accreting discounts, subvention payments from manufacturers, and other origination costs (collectively "discount") on individually acquired retail installment contracts held for investment. |
• | The consideration of net unaccreted discounts when estimating the allowance for credit losses for the non-TDR portfolio of individually acquired retail installment loans held for investment. |
• | The recognition of and disclosure of severance and stock compensation expenses, a deferred tax asset, and a liability for certain benefits payable to the former CEO. |
141
20. Quarterly Financial Data (unaudited)
The following is a summary of quarterly financial results:
First Quarter | Second Quarter | Third Quarter | Fourth Quarter | ||||||||||||
Year Ended December 31, 2017 | |||||||||||||||
Total finance and other interest income | $ | 1,631,244 | $ | 1,666,721 | $ | 1,649,376 | $ | 1,616,679 | |||||||
Net finance and other interest income | 1,113,984 | 1,135,126 | 1,059,121 | 1,009,542 | |||||||||||
Provision for credit losses | 635,013 | 520,555 | 536,447 | 562,346 | |||||||||||
Income (loss) before income taxes | 221,428 | 348,108 | 277,773 | (23,795 | ) | ||||||||||
Net income (loss) | 143,427 | 264,675 | 199,388 | 580,116 | |||||||||||
Net income (loss) per common share (basic) | $ | 0.40 | $ | 0.74 | $ | 0.55 | $ | 1.61 | |||||||
Net income (loss) per common share (diluted) | $ | 0.40 | $ | 0.74 | $ | 0.55 | $ | 1.61 | |||||||
Allowance for credit losses | $ | 3,453,075 | $ | 3,458,410 | $ | 3,380,763 | $ | 3,269,506 | |||||||
Finance receivables held for investment, net | 23,444,625 | 23,634,914 | 22,667,203 | 22,427,769 | |||||||||||
Total assets | 39,061,940 | 39,507,482 | 38,765,557 | 39,422,304 | |||||||||||
Total equity | 5,418,998 | 5,678,733 | 5,885,234 | 6,480,501 | |||||||||||
Year Ended December 31, 2016 | |||||||||||||||
Total finance and other interest income | $ | 1,619,899 | $ | 1,643,989 | $ | 1,638,525 | $ | 1,627,183 | |||||||
Net finance and other interest income | 1,213,804 | 1,202,255 | 1,178,620 | 1,131,974 | |||||||||||
Provision for credit losses | 660,170 | 511,921 | 610,398 | 685,711 | |||||||||||
Income before income taxes | 328,942 | 437,563 | 304,020 | 90,186 | |||||||||||
Net income | 208,299 | 283,345 | 213,547 | 61,275 | |||||||||||
Net income per common share (basic) | $ | 0.58 | $ | 0.79 | $ | 0.60 | $ | 0.17 | |||||||
Net income per common share (diluted) | $ | 0.58 | $ | 0.79 | $ | 0.59 | $ | 0.17 | |||||||
Allowance for credit losses | $ | 3,337,490 | $ | 3,436,325 | $ | 3,412,977 | $ | 3,421,767 | |||||||
Finance receivables held for investment, net | 23,961,903 | 23,477,426 | 23,686,391 | 23,481,001 | |||||||||||
Total assets | 37,768,959 | 38,490,611 | 38,771,636 | 38,539,104 | |||||||||||
Total equity | 4,604,739 | 4,876,712 | 5,117,657 | 5,238,619 | |||||||||||
142
ITEM 9. | CHANGES IN AND DISAGREEMENTS WITH ACCOUNTANTS ON ACCOUNTING AND FINANCIAL DISCLOSURE |
None.
143
ITEM 9A. | CONTROLS AND PROCEDURES |
Evaluation of Disclosure Controls and Procedures
Our management, with the participation of our Chief Executive Officer (CEO) and Chief Financial Officer (CFO), has evaluated the effectiveness of our disclosure controls and procedures as defined in Rules 13a- 15(e) and 15d- 15(e) under the Securities Exchange Act of 1934, as amended (the “Exchange Act”), as of the end of the period covered by this Annual Report on Form 10-K. Based on such evaluation, our CEO and CFO have concluded that as of December 31, 2017, we did not maintain effective disclosure controls and procedures because of the material weaknesses in internal control over financial reporting described below. In light of these material weaknesses, management completed additional procedures and analysis to validate the accuracy and completeness of the financial results impacted by the control deficiencies including the validation of data underlying key financial models and the addition of substantive logic inspection, fluctuation analysis and testing procedures. In addition, management engaged the Audit Committee directly, in detail, to discuss the procedures and analysis performed to ensure the reliability of the Company's financial reporting. Notwithstanding these material weaknesses, based on additional analyses and other procedures performed, management concluded that the financial statements included in this report fairly present in all material respects our financial position, results of operations, capital position, and cash flows for the periods presented, in conformity with U.S. GAAP.
Management's Annual Report on Internal Control over Financial Reporting
Management is responsible for establishing and maintaining adequate internal control over financial reporting, as such term is defined in Exchange Act Rules 13a-15(f) and 15d-15(f). The Company’s internal control over financial reporting is a process designed under the supervision of the Company's CEO and CFO to provide reasonable assurance regarding the reliability of financial reporting and the preparation of the Company’s financial statements for external purposes in accordance with U.S. GAAP.
Management’s internal control over financial reporting includes those policies and procedures that (i) pertain to the maintenance of records that, in reasonable detail, accurately and fairly reflect the transactions and dispositions of the assets of the Company; (ii) provide reasonable assurance that transactions are recorded as necessary to permit preparation of financial statements in accordance with U.S. GAAP and that receipts and expenditures of the Company are being made only in accordance with authorizations of management and directors of the Company; and (iii) provide reasonable assurance regarding prevention or timely detection of unauthorized acquisition, use or disposition of the Company’s assets that could have a material effect on the financial statements.
As of December 31, 2017, management assessed the effectiveness of the Company’s internal control over financial reporting based on the criteria established in “Internal Control - Integrated Framework,” issued by the Committee of Sponsoring Organizations (COSO) of the Treadway Commission (the 2013 framework). A material weakness (as defined in Rule 12b-2 under the Exchange Act) is a deficiency or combination of deficiencies, in internal control over financial reporting such that there is a reasonable possibility that a material misstatement in our annual or interim financial statements will not be prevented or detected on a timely basis.
Based on the assessment, management determined that the Company did not maintain effective internal control over financial reporting as of December 31, 2017, because of the material weaknesses noted below. These deficiencies could result in misstatements of the accounts and disclosures noted below that in turn, would result in a material misstatement of the annual or interim consolidated financial statements that would not be prevented or detected.
1. Control Environment, Risk Assessment, Control Activities and Monitoring
We did not maintain effective internal control over financial reporting related to the following areas: control environment, risk assessment, control activities and monitoring:
• | Management did not effectively execute a strategy to hire and retain a sufficient complement of personnel with an appropriate level of knowledge, experience, and training in certain areas important to financial reporting. |
• | The tone at the top was insufficient to ensure there were adequate mechanisms and oversight to ensure accountability for the performance of internal control over financial reporting responsibilities and to ensure corrective actions were appropriately prioritized and implemented in a timely manner. |
• | There was not adequate management oversight of accounting and financial reporting activities in implementing certain accounting practices to conform to the Company’s policies and U.S. GAAP. |
144
• | There was not an adequate assessment of changes in risks by management that could significantly impact internal control over financial reporting or an adequate determination and prioritization of how those risks should be managed. |
• | There was not adequate management oversight and identification of models, spreadsheets and completeness and accuracy of data material to financial reporting. |
• | There were insufficiently documented Company accounting policies and insufficiently detailed Company procedures to put policies into effective action. |
• | There was a lack of appropriate tone at the top in establishing an effective control owner risk and controls self-assessment process which contributed to a lack of clarity about ownership of risks assessments and control design and effectiveness. There was insufficient governance, oversight and monitoring of the credit loss allowance and accretion processes and a lack of defined roles and responsibilities in monitoring functions. |
This material weakness in control environment contributes to each of the following identified material weaknesses:
2. Development, Approval, and Monitoring of Models Used to Estimate the Credit Loss Allowance
Various deficiencies were identified in the credit loss allowance process related to review, monitoring and approval processes over models and model changes that aggregated to a material weakness. The following controls did not operate effectively:
• | Review controls over completeness and accuracy of data, inputs and assumptions in models and spreadsheets used for estimating credit loss allowance and related model changes were not effective and management did not adequately challenge significant assumptions. |
• | Review and approval controls over the development of new models to estimate credit loss allowance and related model changes were ineffective. |
• | Adequate and comprehensive performance monitoring over related model output results was not performed and we did not maintain adequate model documentation. |
This material weakness relates to the following financial statement line items: the credit loss allowance, provision for credit losses, and the related disclosures within Note 2 - Finance Receivables and Note 4 - Credit Loss Allowance and Credit Quality.
3. Identification, Governance, and Monitoring of Models Used to Estimate Accretion
Various deficiencies were identified in the accretion process related to review, monitoring and governance processes over models that aggregated to a material weakness. The following controls did not operate effectively:
• | Review controls over completeness and accuracy of data, inputs, calculation and assumptions in models and spreadsheets used for estimating accretion were not effective and management did not adequately challenge significant assumptions. |
• | Review and approval controls over the development of new models to estimate accretion and related model changes were ineffective. |
• | Adequate and comprehensive performance monitoring over related model output results was not performed and we did not maintain adequate model documentation. |
This material weakness relates to the following financial statement line items: finance receivables held for investment, net, finance receivables held for sale, net, interest on finance receivables and loans, provision for credit losses, investment gains and losses, net, and the related disclosures within Note 2 - Finance Receivables, Note 4 - Credit Loss Allowance and Credit Quality and Note 18 - Investment Gains (Losses), Net.
PricewaterhouseCoopers LLP, our independent registered public accounting firm, has audited the effectiveness of the Company’s internal control over financial reporting as of December 31, 2017, as stated in their report which appears herein.
Remediation Status of Reported Material Weaknesses
The Company is currently working to remediate the material weaknesses described above, including assessing the need for additional remediation steps and implementing additional measures to remediate the underlying causes that gave rise to the material weaknesses. The Company is committed to maintaining a strong internal control environment and to ensure that a proper, consistent tone is communicated throughout the organization, including the expectation that previously existing deficiencies will be remediated through implementation of processes and controls to ensure strict compliance with U.S. GAAP.
To address the material weakness in the Control Environment, Risk Assessment, Control Activities and Monitoring (Material Weakness 1, noted above), the Company has taken the following measures:
145
• | Appointed an additional independent director to the Audit Committee of the Board with extensive experience as a financial expert in our industry to provide further experience on the committee. |
• | Established regular working group meetings, with appropriate oversight by management of both the Company and its parent to strengthen accountability for performance of internal control over financial reporting responsibilities and prioritization of corrective actions. |
• | Hired a Chief Accounting Officer and other key personnel with significant public-company financial reporting experience and the requisite skillsets in areas important to financial reporting. |
• | Developed and implemented a plan to enhance its risk assessment processes, control procedures and documentation. |
• | Reallocated additional Company resources to improve the oversight for certain financial models. |
• | Increased accounting resources with qualified permanent resources to ensure sufficient staffing to conduct enhanced financial reporting procedures and to continue the remediation efforts. Improved management documentation, review controls and oversight of accounting and financial reporting activities to ensure accounting practices conform to the Company’s policies and U.S. GAAP. |
• | Increased accounting participation in critical governance activities to ensure an adequate assessment of risk activities which may impact financial reporting or the related internal controls. |
• | Completed a comprehensive review and update of all accounting policies, process descriptions and control activities. |
• | Developed and implemented additional documentation, controls and governance for the credit loss allowance and accretion processes. |
To address the material weaknesses related to the Development, Approval, and Monitoring of Models Used to Estimate the Credit Loss Allowance (Material Weakness 2, noted above), the Company has taken the following measures:
• | Completed a comprehensive design effectiveness review and augmentation of the controls to ensure all critical risks are addressed. |
• | Implemented a more comprehensive monitoring plan for credit loss allowance with a specific focus on model inputs, changes in model assumptions and model outputs to ensure an effective execution of the Company’s risk strategy. |
• | Implemented improved controls over the development of new models or changes to models used to estimate credit loss allowance. |
• | Implemented enhanced on going performance monitoring procedures. |
• | Developed comprehensive model documentation. |
• | Enhanced the Company’s communication on related issues with its senior leadership team and the Board, including the Risk Committee and the Audit Committee. |
• | Increased resources dedicated to the analysis, review and documentation to ensure compliance with U.S. GAAP and the Company’s policy. |
To address the material weaknesses related to the Identification, Governance and Monitoring of Models Used to Estimate Accretion (Material Weakness 3, noted above), the Company has taken the following measures:
• | Developed a comprehensive accretion model documentation manual and implemented on-going performance monitoring to ensure compliance with required standards. |
• | Automated the process for the application of the effective interest rate method for accreting discounts, subvention payments from manufacturers and other origination costs on individually acquired retail installment contracts. |
• | Implemented a comprehensive review controls over data, inputs and assumptions used in the models. |
• | Strengthened review controls and change management procedures over the models used to estimate accretion. |
• | Increased accounting resources with qualified, permanent resources to ensure an adequate level of review and execution of control activities. |
While progress has been made to remediate all of these areas, as of December 31, 2017, we are still in the process of implementing the enhanced processes and procedures and testing the operating effectiveness of these improved controls. We believe our actions will be effective in remediating the material weaknesses, and we continue to devote significant time and attention to these efforts. In addition, the material weaknesses will not be considered remediated until the applicable remedial processes and procedures have been in place for a sufficient period of time and management has concluded, through testing, that these controls are effective. Accordingly, the material weaknesses are not remediated as of December 31, 2017.
Remediation Status of Previously Reported Material Weaknesses
Management has completed the implementation of remediation efforts related to the following previously reported material weaknesses and considers the following remediated:
146
Application of Effective Interest Method for Accretion
The Company’s policies and controls related to the methodology used for applying the effective interest rate method in accordance with U.S. GAAP, specifically as it relates the review of key assumptions over prepayment curves, pool segmentation and presentation in financial statements either were not designed appropriately or failed to operate effectively. Additionally the resources dedicated to the reviews were not sufficient to identify all relevant instances of non-compliance with policies and U.S. GAAP and did not sufficiently review supporting methodologies and practices to identify variances from the Company’s policy and U.S. GAAP.
To remediate this material weakness, we formalized a process for documenting assumptions related to the accretion methodology and added additional review procedures of key assumptions to ensure the Company's accretion methodology conforms to Company policy and U.S. GAAP. Additionally, we increased accounting resources with qualified, permanent employees to ensure an adequate level of review and execution of control activities.
Methodology to Estimate Credit Loss Allowance
The Company’s policies and controls related to the methodology used for estimating the credit loss allowance in accordance with U.S. GAAP, specifically as it relates to the calculation of impairment for TDRs separately from the general allowance on loans not classified as TDRs, the consideration of net discounts and the calculation of selling costs when estimating the allowance either were not designed appropriately or failed to operate effectively. Additionally the resources dedicated to the reviews were not sufficient to identify all relevant instances of non-compliance with policies and U.S. GAAP and did not sufficiently review supporting methodologies and practices to identify variances from the Company’s policy and U.S. GAAP.
To remediate this material weakness, we conducted a comprehensive design effectiveness review and augmentation of the controls to ensure all critical risks were addressed. Additionally, we enhanced the documentation and review controls over the estimation of the credit loss allowance to ensure the Company’s policies and procedures align with U.S. GAAP. Specifically, the enhanced controls ensure that the calculation of impairment for TDRs is evaluated separately from the general allowance on loans not classified as TDRs and that net discounts and selling costs are considered when estimating the allowance. In addition, we formalized controls for documenting assumptions and decisions related to the credit loss allowance.
Loans Modified as TDRs
The following controls over the identification of TDRs and inputs used to estimate TDR impairment did not operate effectively:
• | Review controls of the TDR footnote disclosures and supporting information did not effectively identify that parameters used to query the loan data were incorrect. |
• | A review of inputs used to estimate the expected and present value of cash flows of loans modified in TDRs did not identify errors in types of cash flows included and in the assumed timing and amount of defaults and did not identify that the discount rate was incorrect. |
To remediate this material weakness, management implemented a comprehensive monitoring plan for TDRs with a specific focus on new and enhanced controls over the completeness and accuracy of the population of TDRs, inputs and assumptions to the model used to estimate expected and present value of cash flows and enhanced disclosure controls. In addition, we increased resources dedicated to the analysis, review and documentation over TDRs to ensure compliance with U.S. GAAP and the Company’s polices. Finally, we implemented enhanced controls over the review of financial statements disclosures for TDRs to ensure compliance with the Company's policies and U.S. GAAP.
Review of New, Unusual or Significant Transactions
Management identified an error in the accounting treatment of certain transactions related to separation agreements with the former Chairman of the Board and CEO of the Company. Specifically, controls over the review of new, unusual or significant transactions related to application of the appropriate accounting and tax treatment to this transaction in accordance with U.S. GAAP did not operate effectively in that management failed to detect as part of the review procedures that regulatory approval was a prerequisite to recording the transaction and that approval had not been obtained prior to recording the transaction and therefore should have not been recorded.
147
To remediate this material weakness, we formalized controls to identify and evaluate all new, unusual or significant transactions, including instituting regular periodic meetings with key members of management to ensure that such transactions are recorded in accordance with Company's policies and U.S. GAAP.
Review of Financial Statement Disclosures
Management identified errors relating to financial statement disclosures. Specifically, the Company's controls over both the preparation and review and over the completeness and accuracy of financial statement disclosures did not operate effectively to ensure complete, accurate, and proper presentation of the financial statement disclosures in accordance with U.S. GAAP.
To remediate this material weakness, we improved the controls over the preparation and review of the financial statements and the related disclosures to include a more comprehensive documentation of key issues and matters considered complex. Additionally, we enhanced our disclosure checklist and strengthened review procedures performed by key members of management.
Preparation and Review of Consolidated Statement of Cash Flows
The controls over the review of the impact of significant and unusual transactions on the classification and presentation of the Consolidated Statement of Cash Flows (SCF) did not operate effectively, which led to the misclassification of cash flows between operating activities and investing activities in the preliminary SCF for certain proceeds from loan sales. The misclassification was corrected prior to the issuance of our Quarterly Report on Form 10-Q for the period ended June 30, 2015 and had no impact to previously issued interim or annual financial statements of the Company.
To remediate this material weakness, we strengthened the controls over reconciliation, variance and trend analyses and review related to the SCF.
Changes in Internal Control over Financial Reporting
Except as described above under Remediation of Previously Reported Material Weaknesses, there were no changes in the Company's internal control over financial reporting identified in connection with the evaluation required by Rule 13a-15(d) and 15d-15(d) of the Exchange Act that occurred during the three months ended December 31, 2017 that have materially affected, or are reasonably likely to materially affect, our internal control over financial reporting.
Limitations on Effectiveness of Disclosure Controls and Procedures
In designing and evaluating the disclosure controls and procedures, management recognizes that any controls and procedures, no matter how well designed and operated, can provide only reasonable assurance of achieving the desired control objectives. In addition, the design of disclosure controls and procedures must reflect the fact that there are resource constraints and that management is required to apply judgment in evaluating the benefits of possible controls and procedures relative to their costs.
148
ITEM 9B. | OTHER INFORMATION |
As previously disclosed, effective as of August 27, 2017, the Board appointed Scott Powell as President and CEO of the Company. Mr. Powell also serves as the President and CEO and a director of SHUSA. At the time of Mr. Powell’s appointment as the Company’s President and CEO, the Board had not yet determined his compensation arrangements, including the allocation of his compensation between SHUSA and the Company in light of Mr. Powell’s dual roles.
On February 23, 2018, the Compensation Committee of the Company recommended and approved, and the Board approved, Mr. Powell’s final compensation amounts and allocations for 2017. Mr. Powell’s 2017 compensation is comprised of a mix of base salary and both cash- and equity-based incentive compensation. The Company and SHUSA have agreed that for 2017, all of the cash compensation earned by Mr. Powell through August will be allocated to SHUSA, and the cash compensation earned by Mr. Powell from September through December will be allocated approximately 69% to the Company and 31% to SHUSA, based on working days spent at each entity. The Company and SHUSA have also agreed that Mr. Powell’s equity-based incentive compensation for 2017 will be allocated 50% to the Company (paid in the form of stock-settled RSUs) and 50% to SHUSA (paid in the form of Santander ADRs), irrespective of the number of working days spent at each company, in order to establish Mr. Powell’s initial ownership stake in the Company and further align his interests with the Company’s stockholders.
Under the compensation arrangement described above, the following compensation payable to Mr. Powell for 2017 will be allocated to the Company. The amounts below do not include compensation payable to Mr. Powell for 2017 that will be allocated to SHUSA.
• | Base salary of approximately $455,400 for the period of September 1 through December 31, 2017. |
• | A payment of $272,670 in settlement of the cash portion of Mr. Powell’s 2017 annual bonus attributed to the Company. This cash payment will be made under the terms of the Company’s Omnibus Incentive Plan and annual bonus plan, and structured to comply with CRD IV-50% will be paid immediately and 50% will be deferred and payable over five years based on a mix of time- and performance-based vesting conditions. |
• | Stock-settled RSUs with a grant date value of $598,750, payable in settlement of the equity portion of Mr. Powell’s 2017 annual bonus allocated to the Company. These RSUs will be granted under the Company’s Omnibus Incentive Plan and annual bonus plan, and structured to comply with CRD IV-50% will be settled immediately and 50% will become earned and payable over five years based on a mix of time- and performance-based vesting conditions. |
• | A payment of $56,600 in settlement of the cash portion of Mr. Powell’s 2017 award under SHUSA’s Special Regulatory Incentive Plan (SRIP) attributed to the Company. This cash payment will be made under the terms of the SRIP and the Company’s Omnibus Incentive Plan, and structured to comply with CRD IV-50% will be paid immediately and 50% will be deferred and payable over five years based on a mix of time- and performance-based vesting conditions. |
• | Stock-settled RSUs with a grant date value of $125,000, payable in settlement of the equity portion of Mr. Powell’s 2017 SRIP award allocated to the Company. These RSUs will be granted under the SRIP and the Company’s Omnibus Incentive Plan, and structured to comply with CRD IV-50% will be settled immediately and 50% will become earned and payable over five years based on a mix of time- and performance-based vesting conditions. |
Please see the Executive Compensation section of SHUSA’s Annual Report on 10-K for the fiscal year ended December 31, 2017 for complete information regarding compensation paid to Mr. Powell for 2017 by both SHUSA and the Company for his dual service to SHUSA and the Company.
PART III
ITEM 10. | DIRECTORS, EXECUTIVE OFFICERS, AND CORPORATE GOVERNANCE |
The information required by this Item is incorporated by reference to the Company's Proxy Statement for its 2018 Annual meeting of stockholders to be filed with the Securities and Exchange Commission within 120 days after the end of the fiscal year ended December 31, 2017.
ITEM 11. | EXECUTIVE COMPENSATION |
The information required by this Item is incorporated by reference to the Company's Proxy Statement for its 2018 Annual meeting of stockholders to be filed with the Securities and Exchange Commission within 120 days after the end of the fiscal year ended December 31, 2017.
ITEM 12. | SECURITY OWNERSHIP OF CERTAIN BENEFICIAL OWNERS AND MANAGEMENT AND RELATED STOCKHOLDER MATTERS |
149
The information required by this Item is incorporated by reference to the Company's Proxy Statement for its 2018 Annual meeting of stockholders to be filed with the Securities and Exchange Commission within 120 days after the end of the fiscal year ended December 31, 2017.
ITEM 13. | CERTAIN RELATIONSHIPS AND RELATED TRANSACTIONS, AND DIRECTOR INDEPENDENCE |
The information required by this Item is incorporated by reference to the Company's Proxy Statement for its 2018 Annual meeting of stockholders to be filed with the Securities and Exchange Commission within 120 days after the end of the fiscal year ended December 31, 2017.
ITEM 14. | PRINCIPAL ACCOUNTING FEES AND SERVICES |
The information required by this Item is incorporated by reference to the Company's Proxy Statement for its 2018 Annual meeting of stockholders to be filed with the Securities and Exchange Commission within 120 days after the end of the fiscal year ended December 31, 2017.
PART IV
ITEM 15. | EXHIBITS AND FINANCIAL STATEMENT SCHEDULES |
1. The following Consolidated Financial Statements as set forth in Part II, Item 8 of this report are filed herein:
Consolidated Financial Statements
Consolidated Balance Sheets
Consolidated Statements of Income and Comprehensive Income
Consolidated Statements of Equity
Consolidated Statements of Cash Flows
Notes to Consolidated Financial Statements
2. All other schedules for which provision is made in the applicable accounting regulation of the Securities and Exchange Commission are omitted because the required information is either not applicable, not required or is shown in the respective financial statements or in the notes thereto.
3. See the Exhibit Index immediately following the signatures page of this Annual Report on Form 10-K.
ITEM 16. | FORM 10-K SUMMARY |
Not applicable
150
SIGNATURES
Pursuant to the requirements of Section 13 or 15(d) of the Securities Exchange Act of 1934, the registrant has duly caused this report to be signed on its behalf by the undersigned, thereunto duly authorized.
Santander Consumer USA Holdings Inc. (Registrant) | ||
By: | /s/ Scott Powell | |
Name: Scott Powell | ||
Title: President and Chief Executive Officer | ||
Pursuant to the requirements of the Securities Exchange Act of 1934, this report has been signed below by the following persons on behalf of the registrant and in the capacities and on the dates indicated:
Signature | Title | Date | ||
/s/ Scott Powell | Chief Executive Officer & Director | February 28, 2018 | ||
Scott Powell | (Principal Executive Officer) | |||
/s/ Juan Carlos Alvarez de Soto | Chief Financial Officer | February 28, 2018 | ||
Juan Carlos Alvarez de Soto | (Principal Financial and Accounting Officer) | |||
/s/ William Rainer | Chairman of the Board | February 28, 2018 | ||
William Rainer | ||||
/s/ José Doncel | Director | February 28, 2018 | ||
José Doncel | ||||
/s/ Stephen A. Ferriss | Director | February 28, 2018 | ||
Stephen A. Ferriss | ||||
/s/ Brian Gunn | Director | February 28, 2018 | ||
Brian Gunn | ||||
/s/ Victor Hill | Director | February 28, 2018 | ||
Victor Hill | ||||
/s/ Edith E. Holiday | Director | February 28, 2018 | ||
Edith E. Holiday | ||||
/s/ Javier Maldonado | Director | February 28, 2018 | ||
Javier Maldonado | ||||
/s/ Robert J. McCarthy | Director | February 28, 2018 | ||
Robert J. McCarthy | ||||
/s/ William F. Muir | Director | February 28, 2018 | ||
William F. Muir | ||||
/s/ Mahesh Aditya | Director | February 28, 2018 | ||
Mahesh Aditya | ||||
151
Exhibit Number | Description | |
2.1 | ||
3.1 | ||
3.2 | ||
4.1 | ||
4.2 | ||
4.3 | ||
4.4 | ||
4.5 | ||
4.6 | ||
4.7 | ||
4.8 | ||
4.9 | ||
10.1 | ||
10.2 | ||
10.3 | ||
10.4 | ||
10.5 | ||
10.6 | ||
10.7 | ||
10.8 | ||
10.9 | ||
10.10 | ||
10.11 | ||
10.12 | ||
10.13 | ||
10.14 | ||
10.15 | ||
10.16 | ||
10.17 | ||
10.18 | ||
152
10.19 | ||
10.20 | ||
10.21 | ||
10.22 | ||
10.23 | ||
10.24 | ||
10.25 | ||
10.26 | ||
10.27 | ||
10.28 | ||
10.29 | ||
10.30* | ||
21.1* | ||
23.1* | ||
23.2* | ||
31.1* | ||
31.2* | ||
32.1* | ||
32.2* | ||
101.INS* | XBRL Instance Document | |
101.SCH* | XBRL Taxonomy Extension Schema | |
101.CAL* | XBRL Taxonomy Extension Calculation Linkbase | |
101.DEF* | XBRL Taxonomy Extension Definition Linkbase | |
101.LAB* | XBRL Taxonomy Extension Label Linkbase | |
101.PRE* | XBRL Taxonomy Extension Presentation Linkbase | |
# | Indicates management contract or compensatory plan or arrangement |
† | Confidential treatment has been granted to portions of this exhibit by the Securities and Exchange Commission. |
* | Furnished herewith. |
153