Attached files
| file | filename |
|---|---|
| 8-K - FIRST NATIONAL CORP /VA/ | fncform8k013019.htm |
Exhibit 99.1

Investor Presentation 3rd Quarter 2018
Forward-Looking Statements The Company makes forward-looking statements in this presentation that are
subject to risks and uncertainties. These forward-looking statements may include statements regarding profitability, liquidity, adequacy of capital, the allowance for loan losses, interest rate sensitivity, market risk, growth strategy, and
financial and other goals. The words, “believes,” “expects,” “may,” “will,” “should,” “projects,” “contemplates,” “anticipates,” “forecasts,” “intends,” or other similar words or terms are intended to identify forward-looking statements. These
forward-looking statements are subject to significant uncertainties. Because of these uncertainties, actual future results may be materially different from the results indicated by these forward-looking statements. In addition, past results of
operations do not necessarily indicate future results. The following presentation should be read in conjunction with the consolidated financial statements and related notes included in Part II, Item 8, and Item 1A. Risk Factors of the Company’s
Form 10-K for the year ended December 31, 2017. 2
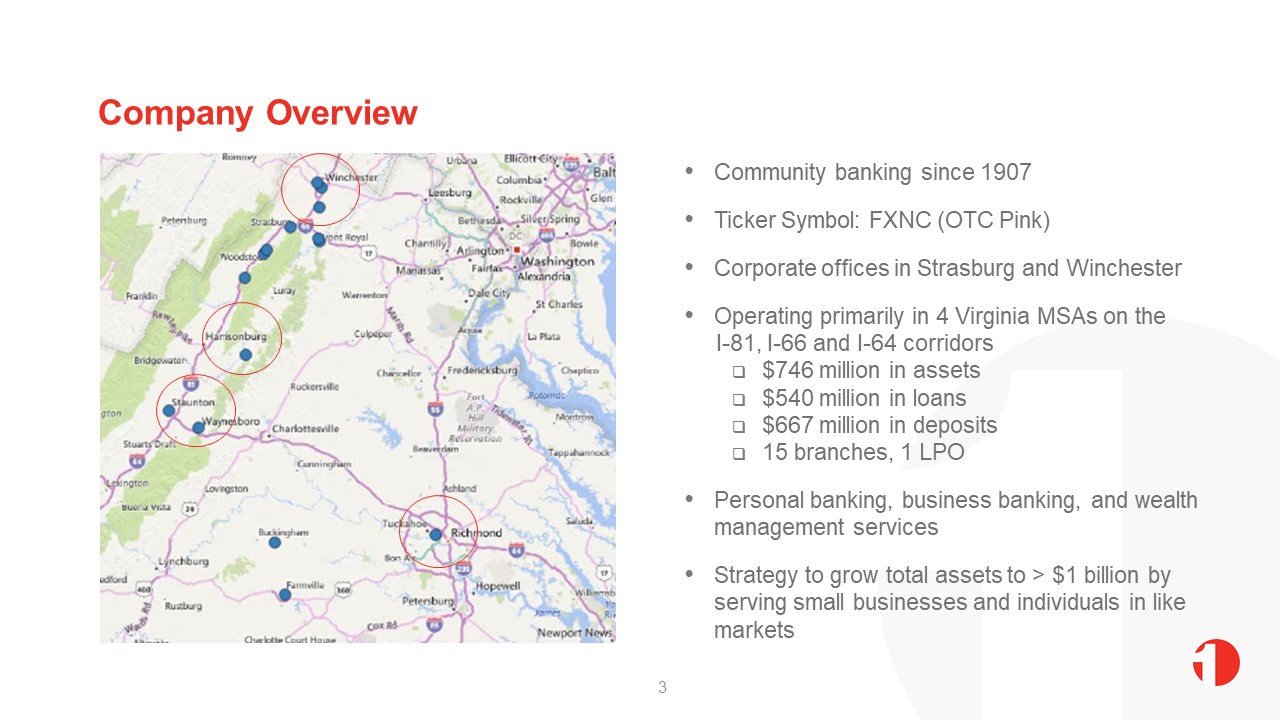
Company Overview 3 Community banking since 1907Ticker Symbol: FXNC (OTC Pink)Corporate offices in
Strasburg and WinchesterOperating primarily in 4 Virginia MSAs on the I-81, I-66 and I-64 corridors$746 million in assets$540 million in loans$667 million in deposits15 branches, 1 LPOPersonal banking, business banking, and wealth management
servicesStrategy to grow total assets to > $1 billion by serving small businesses and individuals in like markets
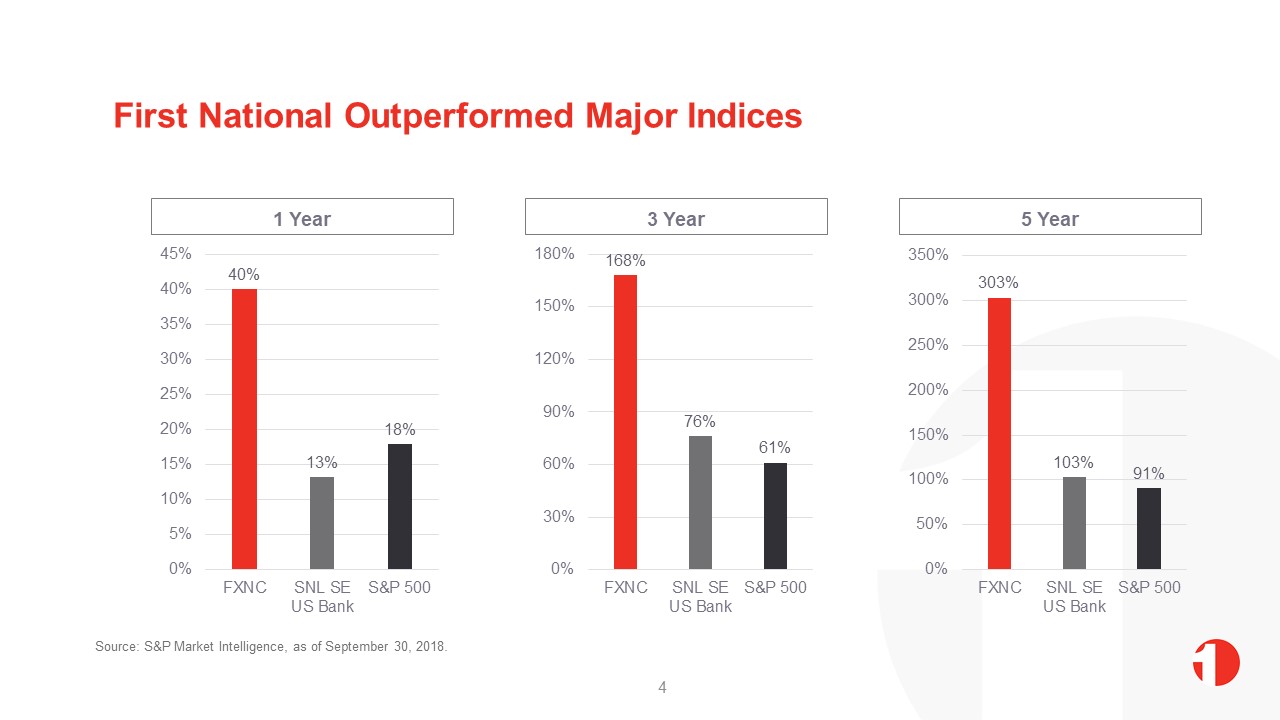
First National Outperformed Major Indices Source: S&P Market Intelligence, as of September 30,
2018. 4
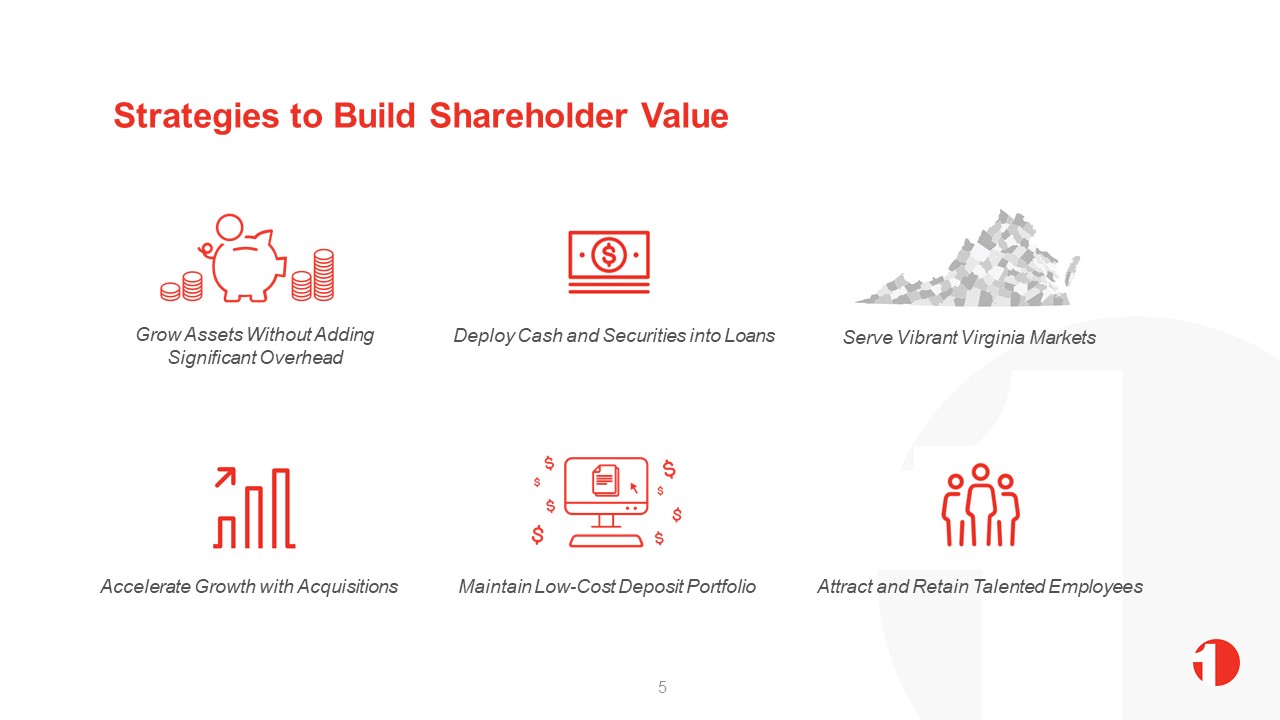
Strategies to Build Shareholder Value Deploy Cash and Securities into Loans Serve Vibrant Virginia
Markets Maintain Low-Cost Deposit Portfolio Attract and Retain Talented Employees Accelerate Growth with Acquisitions 5 Grow Assets Without Adding Significant Overhead
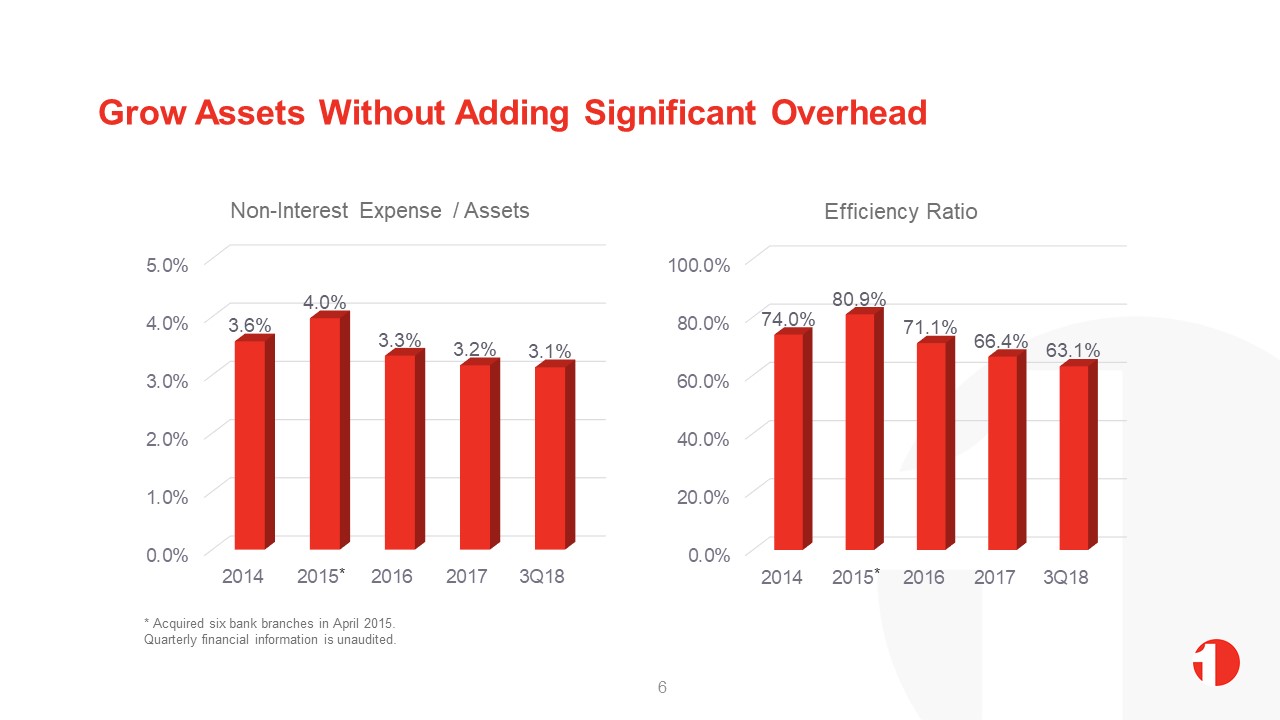
Grow Assets Without Adding Significant Overhead 6 * Acquired six bank branches in April 2015.Quarterly
financial information is unaudited. * *
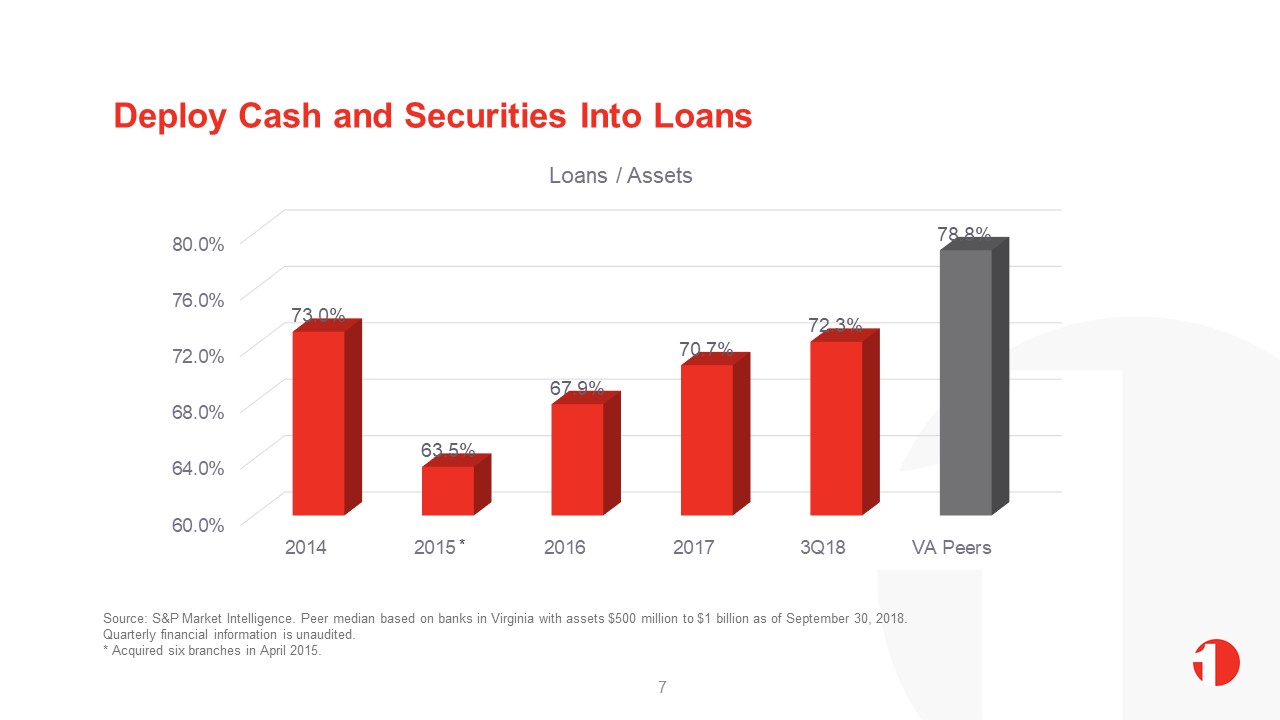
Deploy Cash and Securities Into Loans Source: S&P Market Intelligence. Peer median based on banks in
Virginia with assets $500 million to $1 billion as of September 30, 2018.Quarterly financial information is unaudited.* Acquired six branches in April 2015. 7 *
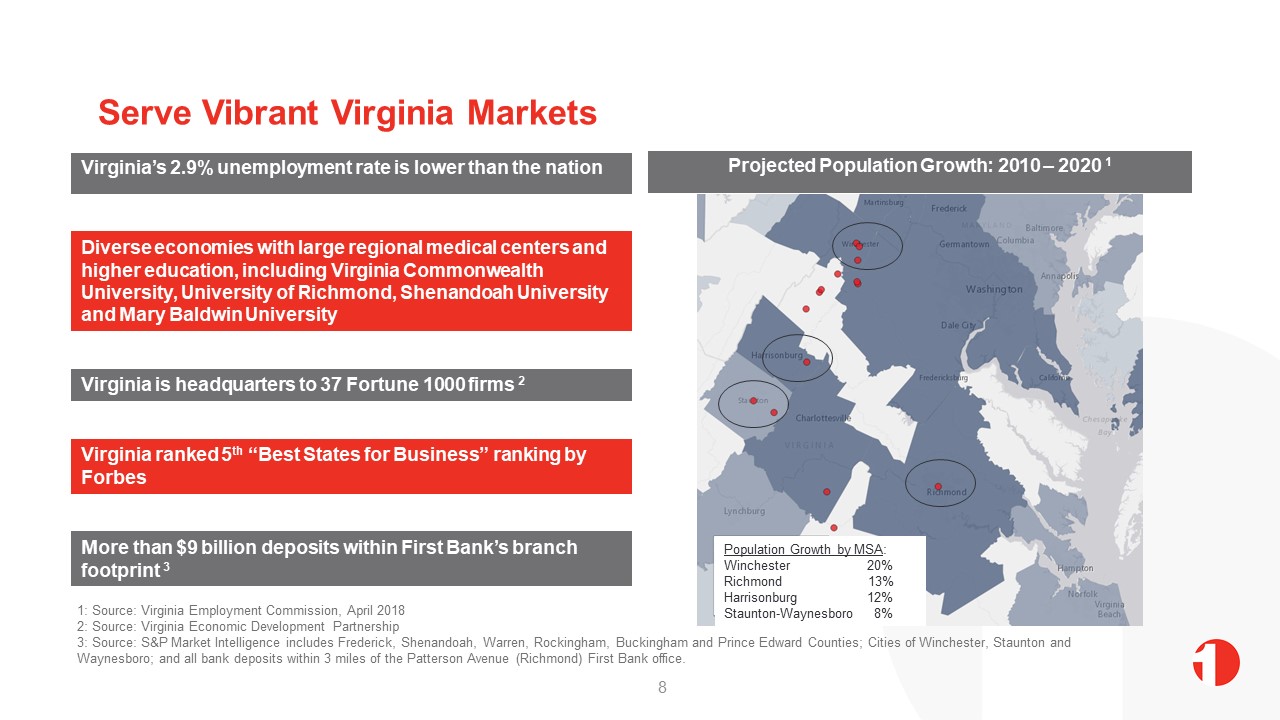
Serve Vibrant Virginia Markets Virginia’s 2.9% unemployment rate is lower than the nation 1: Source:
Virginia Employment Commission, April 20182: Source: Virginia Economic Development Partnership3: Source: S&P Market Intelligence includes Frederick, Shenandoah, Warren, Rockingham, Buckingham and Prince Edward Counties; Cities of
Winchester, Staunton and Waynesboro; and all bank deposits within 3 miles of the Patterson Avenue (Richmond) First Bank office. Diverse economies with large regional medical centers and higher education, including Virginia Commonwealth
University, University of Richmond, Shenandoah University and Mary Baldwin University Projected Population Growth: 2010 – 2020 1 Virginia is headquarters to 37 Fortune 1000 firms 2 Virginia ranked 5th “Best States for Business” ranking by
Forbes More than $9 billion deposits within First Bank’s branch footprint 3 8 Population Growth by MSA:Winchester 20%Richmond 13%Harrisonburg 12%Staunton-Waynesboro 8%

Accelerate Growth with Acquisitions Acquisition Opportunities in Virginia Branch Acquisition
Success Six branches acquired in 2015 including $186 million in deposits Hired Regional President and a market executive to deploy deposits into loans in Staunton - Waynesboro market area Opened Loan Production Office and hired a market
executive in Harrisonburg 22 thousand deposit accounts with 0.19% cost of deposits at closing 1 Source: S&P Market Intelligence as of September 30, 2018. 9

Maintain Low Cost Deposit Portfolio 10 1 Peer median based on banks in Virginia with assets $500
million to $1 billion as of September 30, 2018. Quarterly financial information is unaudited.
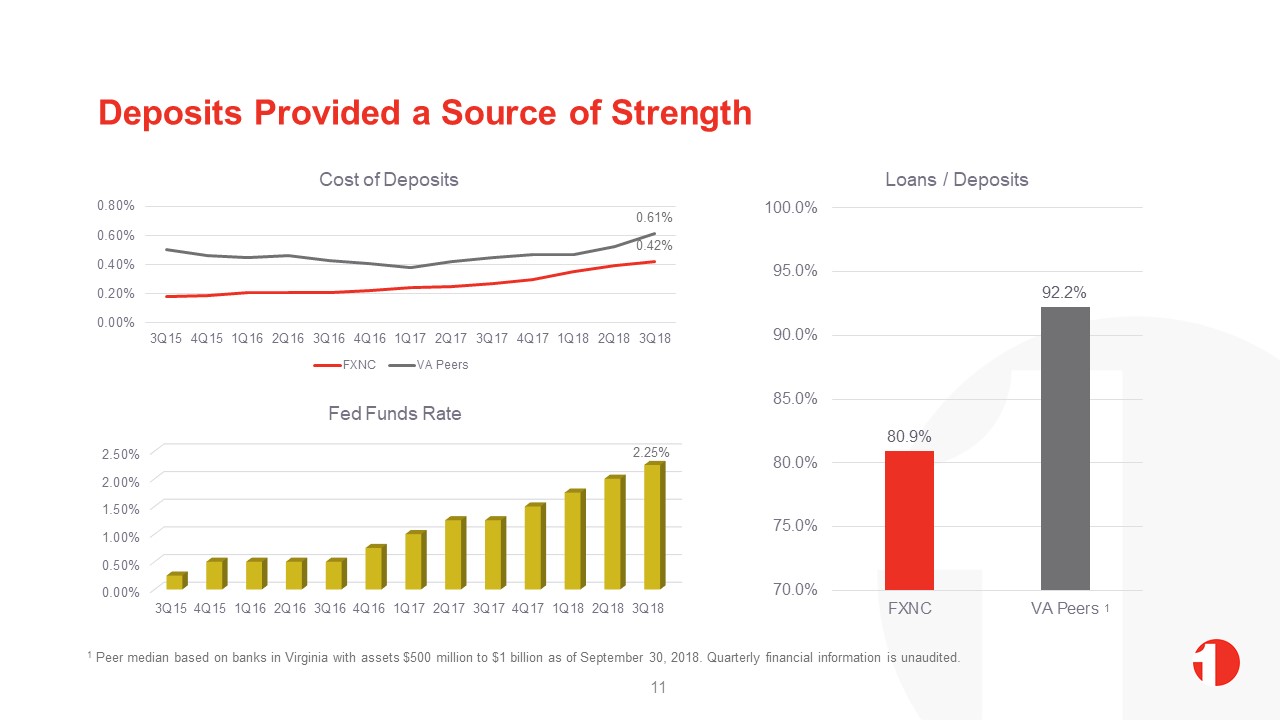
Deposits Provided a Source of Strength 11 1 Peer median based on banks in Virginia with assets $500
million to $1 billion as of September 30, 2018. Quarterly financial information is unaudited. 1
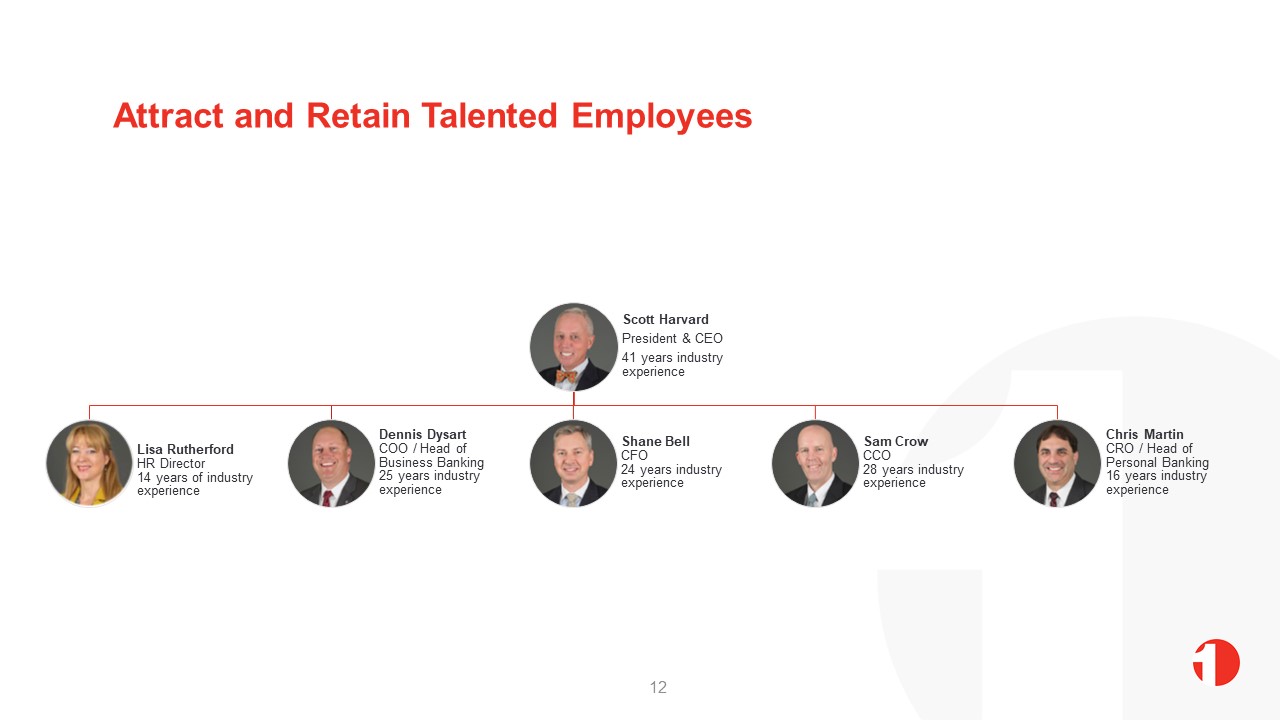
Attract and Retain Talented Employees 12

Tangible Book Value Per Share and Earnings Per Share TBVPS EPS 13 * Acquired six branches in April
2015.Quarterly financial information is unaudited.
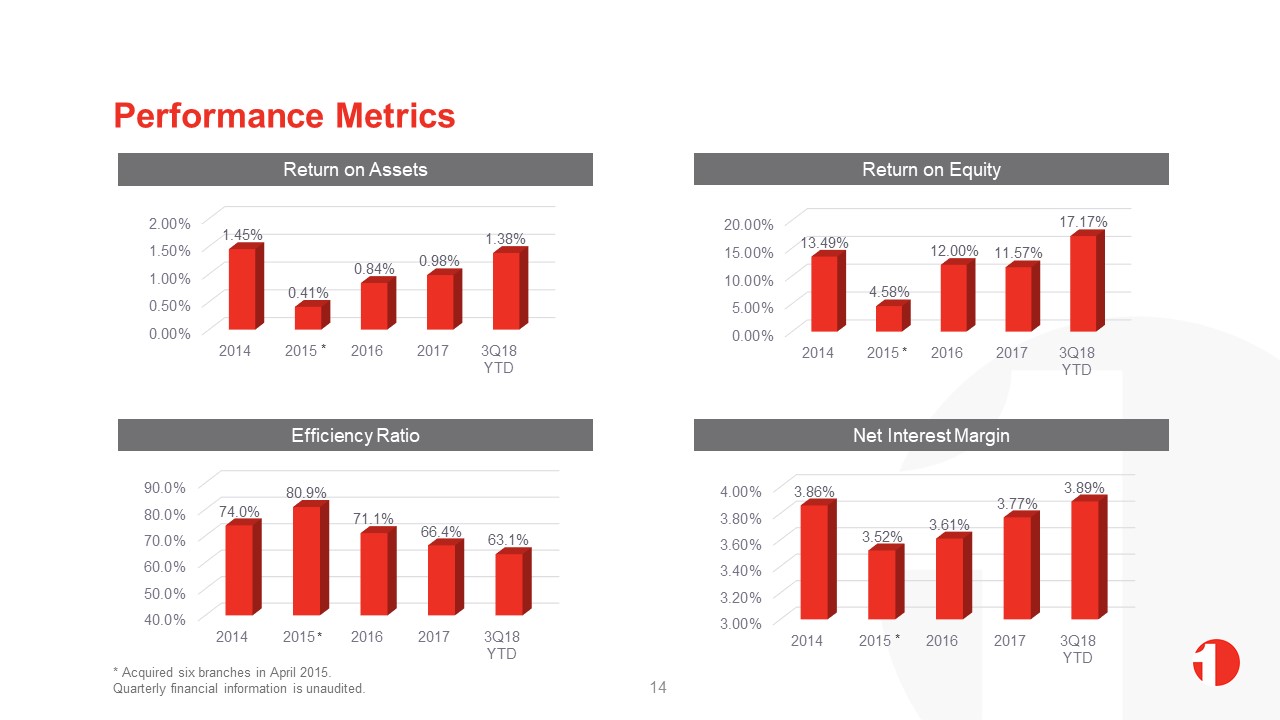
Performance Metrics Return on Assets Return on Equity Efficiency Ratio * Acquired six branches in
April 2015. Quarterly financial information is unaudited. Net Interest Margin * * * * 14
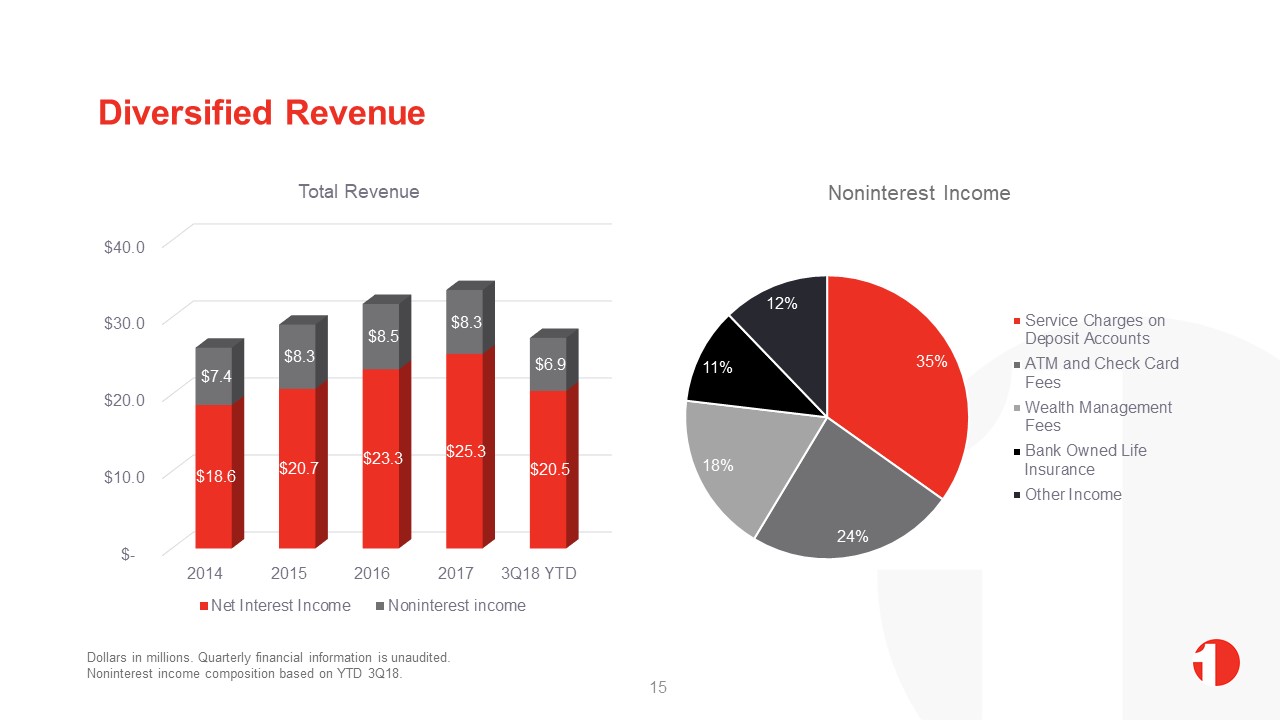
Diversified Revenue 15 Dollars in millions. Quarterly financial information is unaudited.Noninterest
income composition based on YTD 3Q18.

Loan Portfolio and Improved Yield 16 1 Peer median based on banks in Virginia with assets $500 million
to $1 billion as of September 30, 2018. Quarterly financial information is unaudited. 1
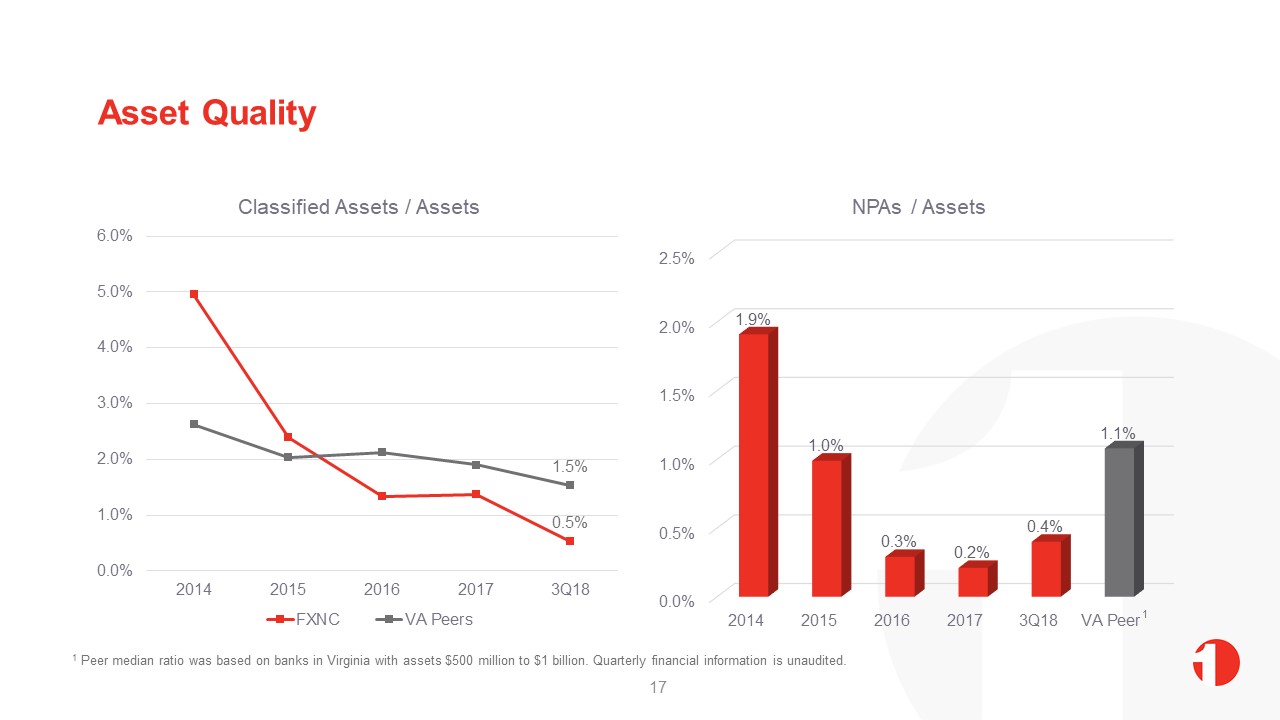
Asset Quality 1 Peer median ratio was based on banks in Virginia with assets $500 million to $1 billion.
Quarterly financial information is unaudited. 17 1
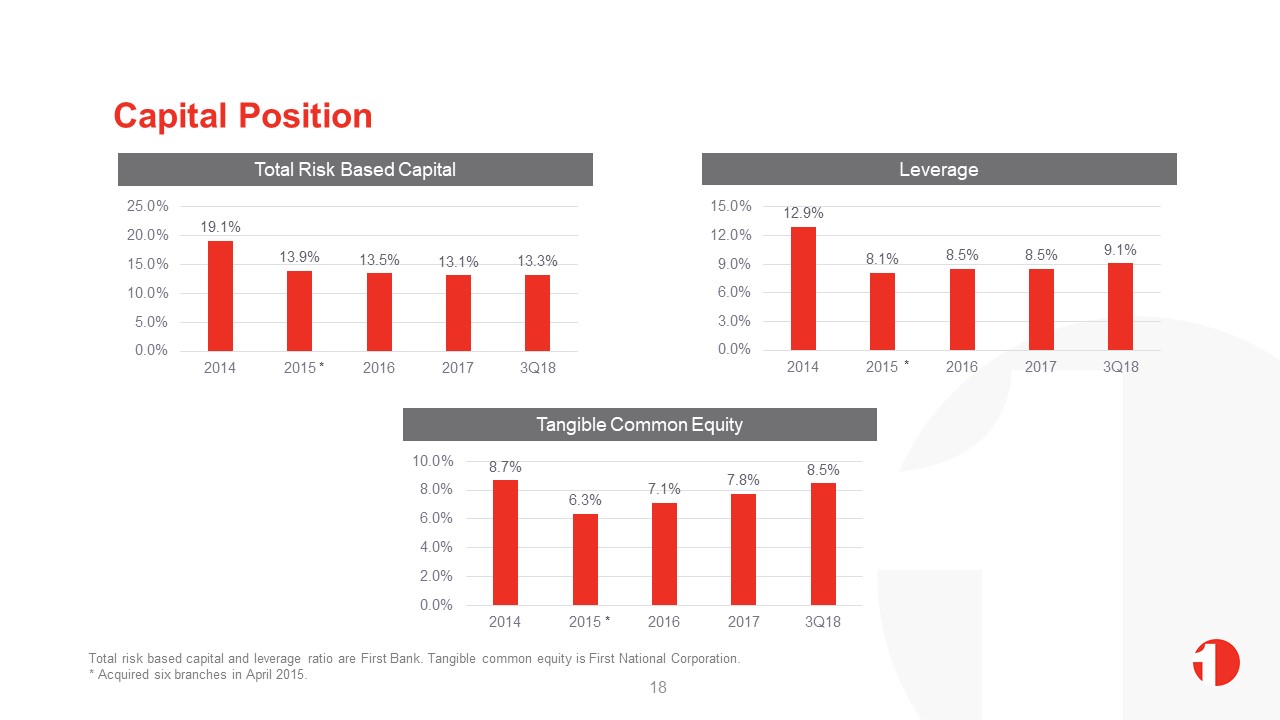
Capital Position Total Risk Based Capital Tangible Common Equity Leverage Total risk based capital
and leverage ratio are First Bank. Tangible common equity is First National Corporation.* Acquired six branches in April 2015. * * * 18
Investment Thesis First National is among the most profitable banking companies headquartered in
Virginia by ROA and ROEStrong liquidity and a low cost deposit portfolio has been a source of strength Branch offices primarily are located in 4 Virginia MSAs, with recent entry into Richmond, the third largest MSA in the State Largest deposit
market share in Shenandoah County, its legacy market 19

Appendix 20
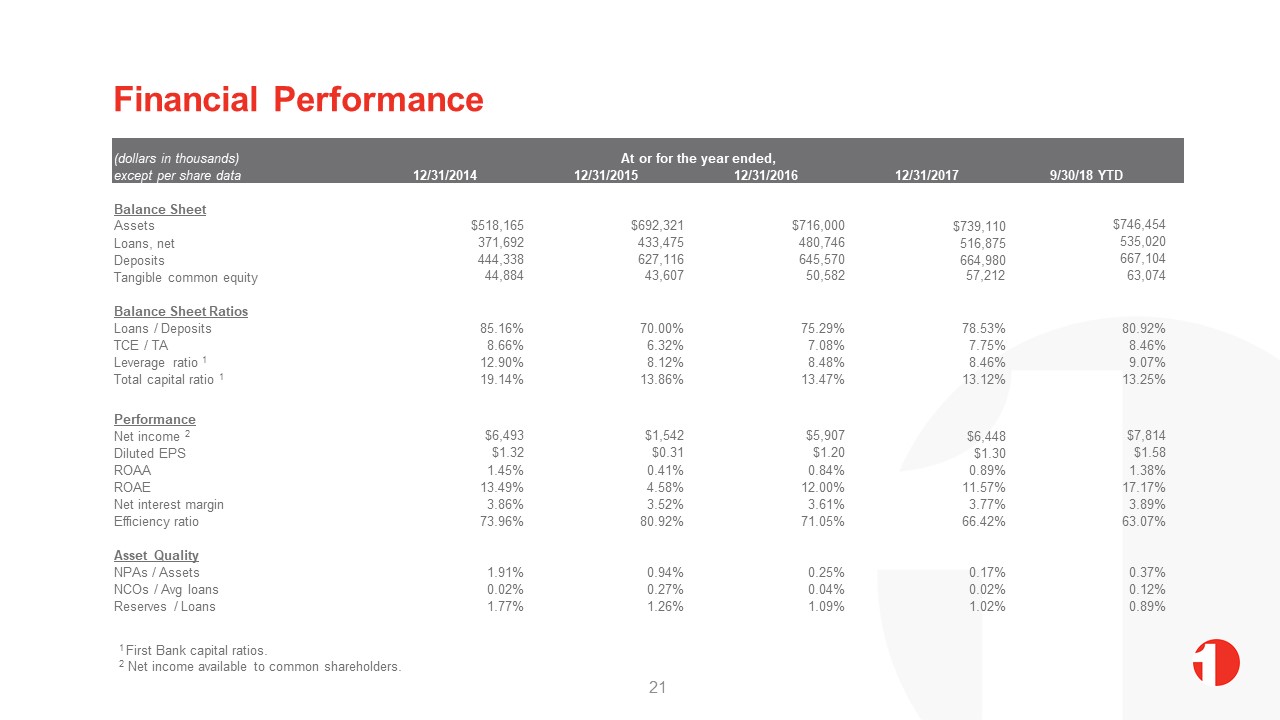
Financial Performance (dollars in thousands) At or for the year ended, except per share
data 12/31/2014 12/31/2015 12/31/2016 12/31/2017 9/30/18 YTD Balance Sheet Assets $518,165 $692,321 $716,000 $739,110 $746,454 Loans, net 371,692 433,475 480,746 516,875
535,020 Deposits 444,338 627,116 645,570 664,980 667,104 Tangible common equity 44,884 43,607 50,582 57,212 63,074 Balance Sheet Ratios Loans /
Deposits 85.16% 70.00% 75.29% 78.53% 80.92% TCE / TA 8.66% 6.32% 7.08% 7.75% 8.46% Leverage ratio 1 12.90% 8.12% 8.48% 8.46% 9.07% Total capital ratio
1 19.14% 13.86% 13.47% 13.12% 13.25% Performance Net income 2 $6,493 $1,542 $5,907 $6,448 $7,814 Diluted EPS $1.32 $0.31 $1.20 $1.30 $1.58
ROAA 1.45% 0.41% 0.84% 0.89% 1.38% ROAE 13.49% 4.58% 12.00% 11.57% 17.17% Net interest margin 3.86% 3.52% 3.61% 3.77% 3.89% Efficiency ratio 73.96% 80.92% 71.05% 66.42% 63.07% Asset
Quality NPAs / Assets 1.91% 0.94% 0.25% 0.17% 0.37% NCOs / Avg loans 0.02% 0.27% 0.04% 0.02% 0.12% Reserves / Loans 1.77% 1.26% 1.09% 1.02% 0.89% 21 1 First Bank capital ratios.2 Net income
available to common shareholders.
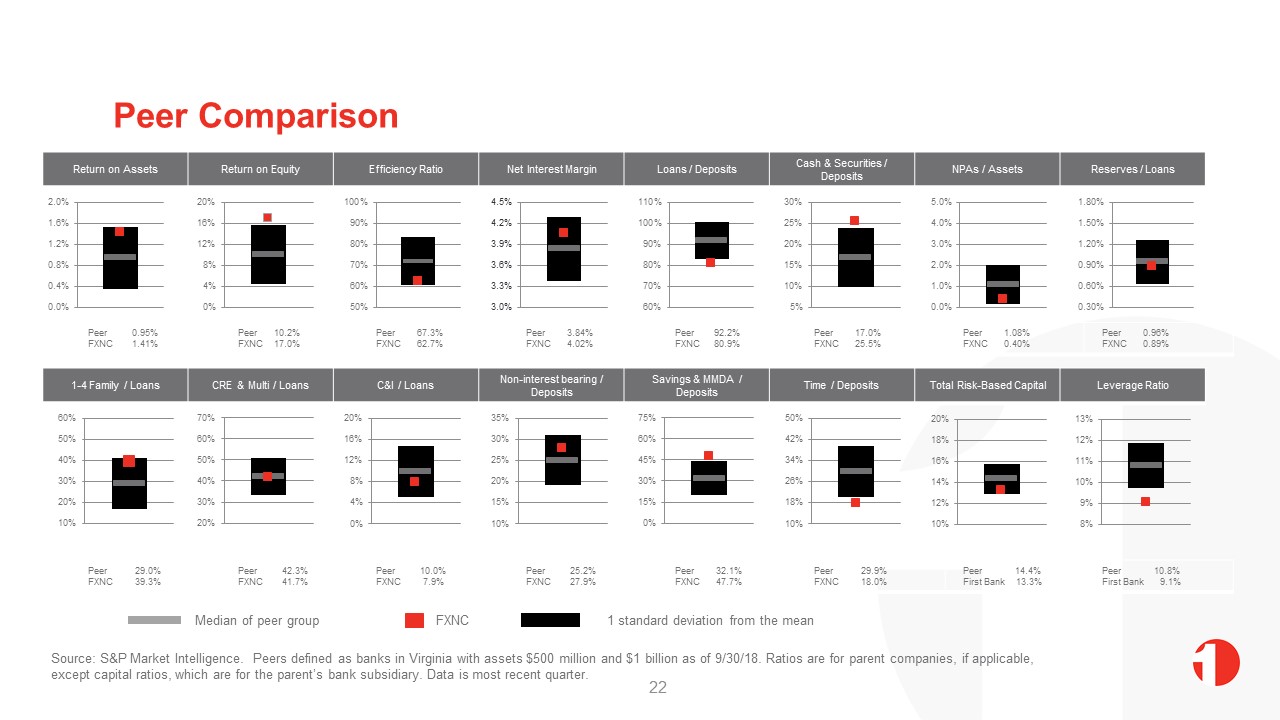
Peer Comparison 22 Source: S&P Market Intelligence. Peers defined as banks in Virginia with assets
$500 million and $1 billion as of 9/30/18. Ratios are for parent companies, if applicable, except capital ratios, which are for the parent’s bank subsidiary. Data is most recent quarter. Return on Assets Return on Equity Efficiency
Ratio Net Interest Margin Loans / Deposits Cash & Securities / Deposits NPAs / Assets Reserves / Loans Peer 0.95% FXNC 1.41% Peer 10.2% FXNC 17.0% Peer 67.3% FXNC 62.7% Peer 3.84% FXNC 4.02% Peer 92.2% FXNC 80.9% Peer
17.0% FXNC 25.5% Peer 1.08% FXNC 0.40% Peer 0.96% FXNC 0.89% Median of peer group FXNC 1 standard deviation from the mean 1-4 Family / Loans CRE & Multi / Loans C&I / Loans Non-interest bearing / Deposits Savings &
MMDA / Deposits Time / Deposits Total Risk-Based Capital Leverage Ratio Peer 29.0% FXNC 39.3% Peer 42.3% FXNC 41.7% Peer 10.0% FXNC 7.9% Peer 25.2% FXNC 27.9% Peer 32.1% FXNC 47.7% Peer 29.9% FXNC 18.0% Peer 14.4% First Bank
13.3% Peer 10.8% First Bank 9.1%
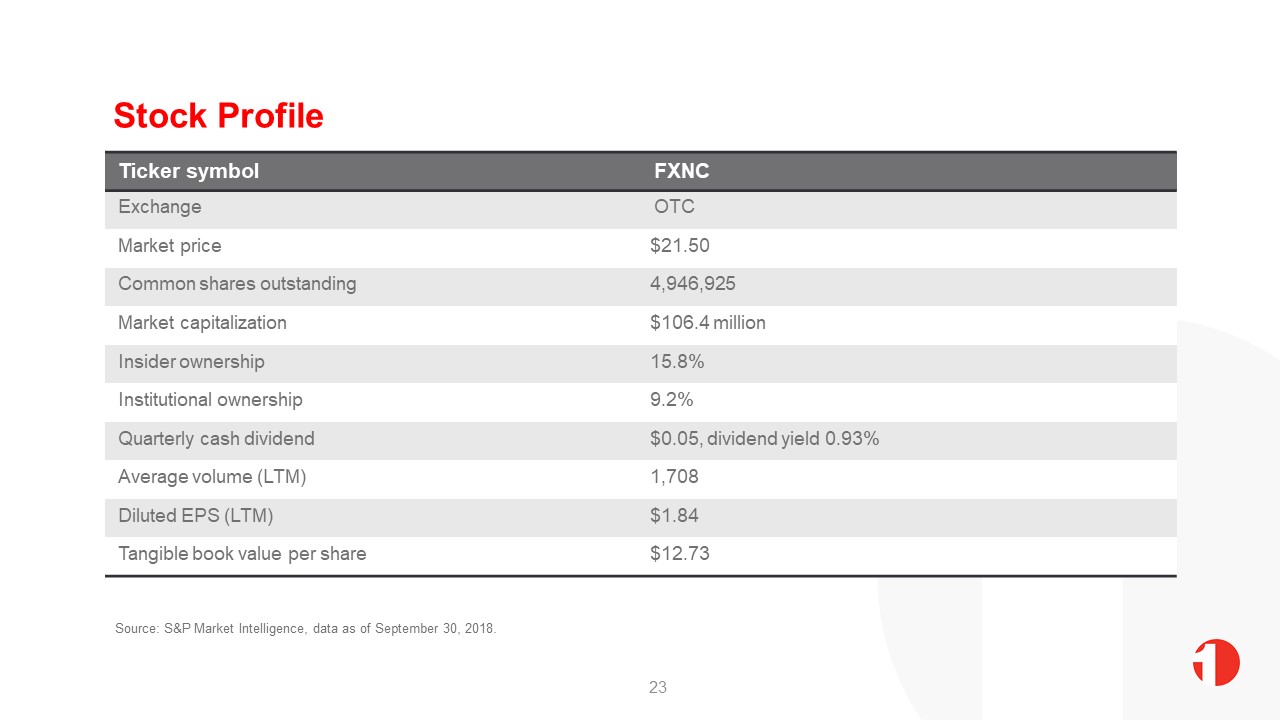
Stock Profile Source: S&P Market Intelligence, data as of September 30, 2018. Ticker
symbol FXNC Exchange OTC Market price $21.50 Common shares outstanding 4,946,925 Market capitalization $106.4 million Insider ownership 15.8% Institutional ownership 9.2% Quarterly cash dividend $0.05, dividend yield
0.93% Average volume (LTM) 1,708 Diluted EPS (LTM) $1.84 Tangible book value per share $12.73 23

Scott Harvard, President and CEO(540) 465-6121sharvard@fbvirginia.comShane Bell, Executive VP and
CFO(540) 465-6130sbell@fbvirginia.com