Attached files
| file | filename |
|---|---|
| EX-99.1 - EXHIBIT 99.1 - FIRST NATIONAL CORP /VA/ | dex991.htm |
| EX-21.1 - EXHIBIT 21.1 - FIRST NATIONAL CORP /VA/ | dex211.htm |
| EX-99.2 - EXHIBIT 99.2 - FIRST NATIONAL CORP /VA/ | dex992.htm |
| EX-23.1 - EXHIBIT 23.1 - FIRST NATIONAL CORP /VA/ | dex231.htm |
| EX-31.2 - EXHIBIT 31.2 - FIRST NATIONAL CORP /VA/ | dex312.htm |
| EX-32.1 - EXHIBIT 32.1 - FIRST NATIONAL CORP /VA/ | dex321.htm |
| EX-31.1 - EXHIBIT 31.1 - FIRST NATIONAL CORP /VA/ | dex311.htm |
| EX-32.2 - EXHIBIT 32.2 - FIRST NATIONAL CORP /VA/ | dex322.htm |
Table of Contents
UNITED STATES
SECURITIES AND EXCHANGE COMMISSION
Washington, D.C. 20549
FORM 10-K
| x | ANNUAL REPORT PURSUANT TO SECTION 13 OR 15(d) OF THE SECURITIES EXCHANGE ACT OF 1934 |
For the fiscal year ended December 31, 2010
or
| ¨ | TRANSITION REPORT PURSUANT TO SECTION 13 OR 15(d) OF THE SECURITIES EXCHANGE ACT OF 1934 |
For the transition period from to
Commission file number 0-23976

(Exact name of registrant as specified in its charter)
| Virginia | 54-1232965 | |
| (State or other jurisdiction of incorporation or organization) |
(I.R.S. Employer Identification No.) | |
| 112 West King Street, Strasburg, Virginia | 22657 | |
| (Address of principal executive offices) | (Zip Code) | |
Registrant’s telephone number, including area code: (540) 465-9121
Securities registered pursuant to Section 12(b) of the Act: None
Securities registered pursuant to Section 12(g) of the Act:
Common Stock, $1.25 par value
(Title of class)
Indicate by check mark if the registrant is a well-known seasoned issuer, as defined in Rule 405 of the Securities Act. Yes ¨ No x
Indicate by check mark if the registrant is not required to file reports pursuant to Section 13 or Section 15(d) of the Act. Yes ¨ No x
Indicate by check mark whether the registrant (1) has filed all reports required to be filed by Section 13 or 15(d) of the Securities Exchange Act of 1934 during the preceding 12 months (or for such shorter period that the registrant was required to file such reports), and (2) has been subject to such filing requirements for the past 90 days. Yes x No ¨
Indicate by check mark whether the registrant has submitted electronically and posted on its corporate Website, if any, every Interactive Data File required to be submitted and posted pursuant to Rule 405 of Regulation S-T during the preceding 12 months (or for such shorter period that the registrant was required to submit and post such files). Yes ¨ No ¨
Indicate by check mark if disclosure of delinquent filers pursuant to Item 405 of Regulation S-K is not contained herein, and will not be contained, to the best of registrant’s knowledge, in definitive proxy or information statements incorporated by reference in Part III of this Form 10-K or any amendment to this Form 10-K. ¨
Indicate by check mark whether the registrant is a large accelerated filer, an accelerated filer, a non-accelerated filer, or a smaller reporting company. See the definitions of “large accelerated filer, “accelerated filer” and “smaller reporting company” in Rule 12b-2 of the Exchange Act. (Check one):
| Large accelerated filer | ¨ | Accelerated filer | ¨ | |||
| Non-accelerated filer | ¨ | Smaller reporting company | x | |||
Indicate by check mark whether the registrant is a shell company (as defined in Rule 12b-2 of the Act). Yes ¨ No x
The aggregate market value of the voting and non-voting common equity held by non-affiliates computed by reference to the closing sales price on June 30, 2010 was $32,464,468.
The number of outstanding shares of common stock as of March 23, 2011 was 2,948,901.
DOCUMENTS INCORPORATED BY REFERENCE
Proxy Statement for the 2011 Annual Meeting of Shareholders – Part III
Table of Contents
2
Table of Contents
Cautionary Statement Regarding Forward-Looking Statements
First National Corporation (the Company) makes forward-looking statements in this Form 10-K that are subject to risks and uncertainties. These forward-looking statements include statements regarding profitability, liquidity, allowance for loan losses, interest rate sensitivity, market risk, growth strategy and financial and other goals. The words “believes,” “expects,” “may,” “will,” “should,” “projects,” “contemplates,” “anticipates,” “forecasts,” “intends,” or other similar words or terms are intended to identify forward-looking statements. These forward-looking statements are subject to significant uncertainties because they are based upon or are affected by factors including:
| • | the Company may be adversely affected by economic conditions in the market area; |
| • | risks inherent in the loan portfolio such as repayment risks, fluctuating collateral values and concentrations; |
| • | the adequacy of the allowance for loan losses related to changes in general economic and business conditions in the market area; |
| • | successful management of credit risk including certain concentrations in loans secured by real estate or to certain industry; |
| • | the adequacy of the valuation allowance for other real estate owned related to changes in economic conditions and local real estate activity; |
| • | the reliance on secondary sources, such as Federal Home Loan Bank advances, sales of securities and loans, federal funds lines of credit from correspondent banks and out-of-market time deposits, to meet liquidity needs; |
| • | the ability to raise capital as needed; |
| • | the successful management of interest rate risk; |
| • | potential impact on the Company of legislation; |
| • | difficult market conditions in the Company’s industry; and |
| • | other factors identified in Item 1A, “Risk Factors”, below. |
Because of these uncertainties, actual future results may be materially different from the results indicated by these forward-looking statements. In addition, past results of operations do not necessarily indicate future results.
General
First National Corporation is the bank holding company of:
| • | First Bank (the Bank). The Bank owns: |
| • | First Bank Financial Services, Inc. |
| • | Shen-Valley Land Holdings, LLC |
| • | First National (VA) Statutory Trust I (Trust I) |
| • | First National (VA) Statutory Trust II (Trust II) |
| • | First National (VA) Statutory Trust III (Trust III) |
First Bank Financial Services, Inc. invests in partnerships that provide title insurance and investment services. Shen-Valley Land Holdings, LLC was formed to hold other real estate owned and future office sites. The Trusts were formed for the purpose of issuing redeemable capital securities, commonly known as trust preferred securities.
The Bank first opened for business on July 1, 1907 under the name The Peoples National Bank of Strasburg. On January 10, 1928, the Bank changed its name to The First National Bank of Strasburg. On April 12, 1994, the Bank received approval from the Federal Reserve Bank of Richmond (the Federal Reserve) and the Virginia State Corporation Commission’s Bureau of Financial Institutions to convert to a state chartered bank with membership in the Federal Reserve System. On June 1, 1994, the Bank consummated such conversion and changed its name to First Bank.
Access to Filings
The Company’s internet address is www.therespowerinone.com. The Company’s Annual Reports on Form 10-K, Quarterly Reports on Form 10-Q and Current Reports on Form 8-K, and amendments to those reports, as filed with or furnished to the Securities and Exchange Commission (the SEC), are available free of charge at www.therespowerinone.com as soon as reasonably practicable after being filed with or furnished to the SEC. A copy of any of the Company’s filings will be sent, without charge, to any shareholder upon written request to: M. Shane Bell, Chief Financial Officer, at 112 West King Street, Strasburg, Virginia 22657.
Products and Services
The Bank’s primary market area is located within the northern Shenandoah Valley region of Virginia, including Shenandoah County, Warren County, Frederick County and the City of Winchester. Within the market area there are various types of industry including medical and professional services, manufacturing, retail and higher education. Customers include individuals, small and medium-sized businesses, local governmental entities and non-profit organizations.
The Bank provides loan, deposit, investment, trust and asset management and other products and services in the northern Shenandoah Valley region of Virginia. Loan products and services include personal loans, residential mortgages, home equity loans and commercial loans. Deposit products and services include checking, savings, NOW accounts, money market accounts, IRA accounts, certificates of deposit, and cash management accounts. The Bank offers other services, including internet banking, mobile banking, remote deposit capture and other traditional banking services.
3
Table of Contents
The Bank’s Trust and Asset Management Department offers a variety of trust and asset management services including estate planning, investment management of assets, trustee under an agreement, trustee under a will, individual retirement accounts, estate settlement and benefit plans. The Bank offers financial planning and brokerage services for its customers through its investment division, First Financial Advisors.
The Bank’s products and services are provided through 11 branch offices, 31 ATMs and its website, www.therespowerinone.com. The Bank operates six of its offices under the “Financial Center” concept. A Financial Center offers all of the Bank’s financial services at one location. This concept allows loan, deposit, trust and investment advisory personnel to be readily available to serve customers throughout the Bank’s market area. For the location of each of these Financial Centers, see Item 2 of this Form 10-K below.
Competition
The Company competes with other community banks, large financial institutions, savings banks, consumer finance companies, insurance companies, credit unions, internet-based banks and money market mutual funds. Competition has increased from out-of-state banks through their acquisition of Virginia-based banks and branches and from other financial institutions through use of internet banking.
The financial services industry is highly competitive and could become more competitive as a result of recent and ongoing legislative, regulatory and technological changes, and continued consolidation and economic turmoil within the financial services industry. Advantages larger financial institutions may have over the Company include more efficient operations from economies of scale, the ability to support wide-ranging advertising campaigns, raise larger amounts of capital and have substantially higher lending limits. Credit unions have a competitive advantage because of a more favorable tax treatment than the Company and can pass those savings on to their customers through lower loan rates and higher deposit rates.
Factors affecting the competition for loans and deposits are interest rates and terms offered, the number and location of branches and types of products offered, as well as the reputation of the institution. Advantages the Company has over the competition include long-term customer relationships, a commitment to excellent customer service, dedicated and loyal employees, local management and directors, and the support and involvement in the communities that the Company serves. The Company focuses on providing products and services to individuals, small to medium-sized businesses and local governmental entities within its communities. According to Federal Deposit Insurance Corporation (FDIC) deposit data as of June 30, 2010, the Bank was ranked first in Shenandoah County with $212.3 million in deposits, representing 28% of the total deposit market; third in Warren County with $64.8 million or 13% of the market; fourth in Frederick County with $67.9 million or 14% of the market; and sixth in the City of Winchester with $97.2 million or 7% of the market. The Bank was ranked third overall in its market area with 14% of the total deposit market.
No material part of the business of the Company is dependent upon a single or a few customers, and the loss of any single customer would not have a materially adverse effect upon the business of the Company.
Employees
At December 31, 2010, the Company and the Bank employed a total of 155 full-time equivalent employees. The Company considers relations with its employees to be excellent.
SUPERVISION AND REGULATION
General
As a bank holding company, the Company is subject to regulation under the Bank Holding Company Act of 1956, as amended, and the supervision, examination and reporting requirements of the Board of Governors of the Federal Reserve System. As a state-chartered commercial bank, the Bank is subject to regulation, supervision and examination by the Virginia State Corporation Commission’s Bureau of Financial Institutions and the Federal Reserve. Other federal and state laws, including various consumer and compliance laws, govern the activities of the Bank, the investments that it makes and the aggregate amount of loans that it may grant to one borrower. Laws and regulations administered by the regulatory agencies also affect corporate practices, including business practices related to payment and charging of interest, documentation and disclosures, and affect the ability to open and close offices or purchase other entities.
The following description summarizes the significant federal and state laws applicable to the Company’s industry. To the extent that statutory or regulatory provisions are described, the description is qualified in its entirety by reference to that particular statutory or regulatory provision.
4
Table of Contents
The Bank Holding Company Act
Under the Bank Holding Company Act, the Company is subject to periodic examination by the Federal Reserve and required to file periodic reports regarding its operations and any additional information that the Federal Reserve may require. Activities at the bank holding company are limited to:
| • | banking, managing or controlling banks; |
| • | furnishing services to or performing services for its subsidiaries; and |
| • | engaging in other activities that the Federal Reserve has determined by regulation or order to be so closely related to banking as to be a proper incident to these activities. |
Some of the activities that the Federal Reserve Board has determined by regulation to be closely related to the business of a bank holding company include making or servicing loans and specific types of leases, performing specific data processing services and acting in some circumstances as a fiduciary or investment or financial adviser.
With some limited exceptions, the Bank Holding Company Act requires every bank holding company to obtain the prior approval of the Federal Reserve before:
| • | acquiring substantially all the assets of any bank; |
| • | acquiring direct or indirect ownership or control of any voting shares of any bank if after such acquisition it would own or control more than 5% of the voting shares of such bank (unless it already owns or controls the majority of such shares); or |
| • | merging or consolidating with another bank holding company. |
In addition, and subject to some exceptions, the Bank Holding Company Act and the Change in Bank Control Act, together with their regulations, require Federal Reserve approval prior to any person or company acquiring “control” of a bank or bank holding company. Control is conclusively presumed to exist if an individual or company acquires 25% or more of any class of voting securities of the bank holding company. Control is rebuttably presumed to exist if a person acquires 10% or more, but less than 25%, of any class of voting securities and either the company has registered securities under Section 12 of the Securities Exchange Act of 1934 or no other person owns a greater percentage of that class of voting securities immediately after the transaction. The regulations provide a procedure for challenging this rebuttable control presumption.
Capital Requirements
The Federal Reserve Board has issued risk-based and leverage capital guidelines applicable to banking organizations that it supervises. Under the risk-based capital requirements, the Company and the Bank are each generally required to maintain a minimum ratio of total capital to risk-weighted assets (including certain off-balance sheet activities, such as standby letters of credit) of 8%. At least half of the total capital must be composed of “Tier 1 Capital,” which is defined as common equity, retained earnings and qualifying perpetual preferred stock, less certain intangibles. The remainder may consist of “Tier 2 Capital,” which is defined as specific subordinated debt, some hybrid capital instruments and other qualifying preferred stock and a limited amount of the loan loss allowance. Trust preferred securities may be included in Tier 1 capital for regulatory capital adequacy purposes as long as their amount does not exceed 25% of Tier 1 capital, including trust preferred securities. The portion of the trust preferred securities not considered as Tier 1 capital, if any, may be included in Tier 2 capital. In addition, each of the federal banking regulatory agencies has established minimum leverage capital requirements for banking organizations. Under these requirements, banking organizations must maintain a minimum ratio of Tier 1 capital to adjusted average quarterly assets equal to 3% to 5%, subject to federal bank regulatory evaluation of an organization’s overall safety and soundness.
In sum, the capital measures used by the federal banking regulators are:
| • | the Total Capital ratio, which includes Tier 1 Capital and Tier 2 Capital; |
| • | the Tier 1 Capital ratio; and |
| • | the leverage ratio. |
Under these regulations, a bank will be:
| • | “well capitalized” if it has a Total Capital ratio of 10% or greater, a Tier 1 Capital ratio of 6% or greater, and a leverage ratio of 5% or greater and is not subject to any written agreement, order, capital directive, or prompt corrective action directive by a federal bank regulatory agency to meet and maintain a specific capital level for any capital measure; |
| • | “adequately capitalized” if it has a Total Capital ratio of 8% or greater, a Tier 1 Capital ratio of 4% or greater, and a leverage ratio of 4% or greater – or 3% in certain circumstances – and is not well capitalized; |
| • | “undercapitalized” if it has a Total Capital ratio of less than 8%, a Tier 1 Capital ratio of less than 4% - or 3% in certain circumstances; |
| • | “significantly undercapitalized” if it has a Total Capital ratio of less than 6%, a Tier 1 Capital ratio of less than 3%, or a leverage ratio of less than 3%; or |
| • | “critically undercapitalized” if its tangible equity is equal to or less than 2% of average quarterly tangible assets. |
The risk-based capital standards of the Federal Reserve Board explicitly identify concentrations of credit risk and the risk arising from non-traditional activities, as well as an institution’s ability to manage these risks, as important factors to be taken into account by the agency in assessing an institution’s overall capital adequacy. The capital guidelines also provide that an institution’s exposure to a decline in the economic value of its capital due to changes in interest rates be considered by the agency as a factor in evaluating a banking organization’s capital adequacy.
5
Table of Contents
The FDIC and the Federal Reserve may take various corrective actions against any undercapitalized bank and any bank that fails to submit an acceptable capital restoration plan or fails to implement a plan accepted by the FDIC. These powers include, but are not limited to, requiring the institution to be recapitalized, prohibiting asset growth, restricting interest rates paid, requiring prior approval of capital distributions by any bank holding company that controls the institution, requiring divestiture by the institution of its subsidiaries or by the holding company of the institution itself, requiring new election of directors, and requiring the dismissal of directors and officers. The Company and the Bank presently maintain sufficient capital to remain in compliance with these capital requirements.
On March 13, 2009, the Company received an investment in the Company’s preferred stock totaling $13.9 million from the Company’s participation in the Troubled Asset Relief Program (TARP) Capital Purchase Program (Capital Purchase Program) under the Emergency Economic Stabilization Act of 2008 (EESA).
The Dodd-Frank Act contains a number of provisions dealing with capital adequacy of insured depository institutions and their holding companies, which may result in more stringent capital requirements. Under the Collins Amendment to the Dodd-Frank Act, federal regulators have been directed to establish minimum leverage and risk-based capital requirements for, among other entities, banks and bank holding companies on a consolidated basis. These minimum requirements cannot be less than the generally applicable leverage and risk-based capital requirements established for insured depository institutions nor quantitatively lower than the leverage and risk-based capital requirements established for insured depository institutions that were in effect as of July 21, 2010. These requirements in effect create capital level floors for bank holding companies similar to those in place currently for insured depository institutions. The Collins Amendment also excludes trust preferred securities issued after May 19, 2010 from being included in Tier 1 capital unless the issuing company is a bank holding company with less than $500 million in total assets. Trust preferred securities issued prior to that date will continue to count as Tier 1 capital for bank holding companies with less than $15 billion in total assets, and such securities will be phased out of Tier 1 capital treatment for bank holding companies with over $15 billion in total assets over a three-year period beginning in 2013. The Collins Amendment did not exclude preferred stock issued to the U.S. Treasury through the Capital purchase Program from Tier 1 capital treatment. Accordingly, the Company’s trust preferred securities and preferred stock issued to the U.S. Treasury through the Capital Purchase Program will continue to qualify as Tier 1 capital.
Dividends
The Company is a legal entity separate and distinct from its banking and other subsidiaries. The majority of the Company’s revenues are from dividends paid to the Company by the Bank. The Bank is subject to laws and regulations that limit the amount of dividends it can pay. In addition, both the Company and the Bank are subject to various regulatory restrictions relating to the payment of dividends, including requirements to maintain capital at or above regulatory minimums. Banking regulators have indicated that banking organizations should generally pay dividends only if the organization’s net income available to common shareholders over the past year has been sufficient to fully fund the dividends and the prospective rate of earnings retention appears consistent with the organization’s capital needs, asset quality and overall financial condition. In addition, the Federal Reserve has issued guidelines that bank holding companies should inform and consult with the Federal Reserve in advance of declaring or paying a dividend that exceeds earnings for the period (e.g., quarter) for which the dividend is being paid or that could result in a material adverse change to the organization’s capital structure. During the year ended December 31, 2010, the Bank transferred $2.6 million in dividends to the Company. The net loss available to common shareholders totaled $4.5 million for the year ended December 31, 2010 compared to common dividends paid to shareholders totaling $1.6 million during the same period. As a result, the Bank could not transfer funds to the Company without prior regulatory approval at December 31, 2010. The Bank received approval in February 2011 for a dividend declaration totaling $550 thousand from the Bank to the Company.
The FDIC has the general authority to limit the dividends paid by insured banks if the payment is deemed an unsafe and unsound practice. The FDIC has indicated that paying dividends that deplete a bank’s capital base to an inadequate level would be an unsound and unsafe banking practice.
In connection with the Company’s participation in the Capital Purchase Program established by the U.S. Department of the Treasury (the Treasury) under the EESA, the Company issued preferred stock to the Treasury on March 13, 2009. The Preferred Stock is in a superior ownership position compared to common stock. Dividends must be paid to the preferred stock holder before they can be paid to the common shareholders. In addition, prior to March 13, 2012, unless the Company has redeemed the Preferred Stock or the Treasury has transferred the Preferred Stock to a third party, the consent of the Treasury will be required for the Company to increase its common stock dividend or repurchase its common stock or other equity or capital securities, other than in certain circumstances specified in the purchase agreement with the Treasury. If the dividends on the Preferred Stock have not been paid for an aggregate of six (6) quarterly dividend periods or more, whether or not consecutive, the Company’s authorized number of directors will be automatically increased by two (2) and the holders of the Preferred Stock will have the right to elect those directors at the Company’s next annual meeting or at a special meeting called for that purpose; these two directors will be elected annually and will serve until all accrued and unpaid dividends for all past dividend periods have been declared and paid in full.
Deposit Insurance and Assessments
The deposits of the Bank are insured by an insurance fund administered by the FDIC, in general up to a maximum of $250,000 per insured account. Under federal banking regulations, insured banks are required to pay quarterly assessments to the FDIC for deposit insurance. The FDIC’s risk based assessment system requires members to pay varying assessment
6
Table of Contents
rates depending on the level of the institution’s capital and the degree of supervisory concern over the institution. As a result of the Federal Deposit Insurance Reform Act of 2005 (FDIRA), signed into law February 8, 2006, the FDIC assessment is now separated into two parts. The first part is the FDIC Insurance, and the second part is the assessment for the Financing Corporation (FICO).
Pursuant to the Dodd-Frank Act, the maximum deposit insurance amount was permanently increased from $100,000 to $250,000. In addition, the FDIC will provide temporary unlimited coverage on all noninterest-bearing transaction accounts through December 31, 2012.
In an effort to restore capitalization levels and to ensure the Deposit Insurance Fund (DIF) will adequately cover projected losses from future bank failures, the FDIC, on February 27, 2009, issued a final rule to alter the way in which it differentiates for risk in the risk-based assessment system and to revise deposit insurance assessment rates, including base assessment rates. The risk-based premium system provides for quarterly assessments based on an insured institution’s ranking in one of four risk categories based upon supervisory and capital evaluations. The assessment rate for an individual institution is determined according to a formula based on a weighted average of the institution’s individual CAMELS component ratings plus six financial ratios. Well-capitalized institutions (generally those with CAMELS composite ratings of 1 or 2) are grouped in Risk Category I and their initial base assessment rate for deposit insurance is set at an annual rate of between 12 and 16 basis points. The initial base assessment rate for institutions in Risk Categories II, III and IV is set at annual rates or 22, 32 and 50 basis points, respectively. These initial base assessment rates are adjusted to determine an institution’s final assessment rate based on its brokered deposits, secured liabilities and unsecured debt.
In addition, all FDIC-insured institutions are required to pay assessment to the FDIC to fund interest payments on bonds issued by FICO, an agency of the Federal government established to recapitalize the predecessor to the Savings Association Insurance Fund (SAIF). The FICO assessments rates are adjusted quarterly to reflect changes in the assessment bases of the FDIC’s insurance funds and do not vary depending on a depository institution’s capitalization or supervisory evaluations. These assessments will continue until the FICO bonds mature in 2017.
In November 2010, the FDIC issued a notice of proposed rulemaking to change the deposit insurance assessment base from total domestic deposits to average total assets minus average tangible equity, as required by the Dodd-Frank Act, effective April 1, 2011. This proposal was made final on February 7, 2011. Under the final rule, effective April 1, 2011, the initial base assessment rate will range from 5 to 35 basis points on an annualized basis. After the effect of potential base-rate adjustments, the total base assessment rate could range from 2.5 to 45 basis points on an annualized basis. The potential adjustments to an institution’s initial base assessment rate include (i) a potential decrease of up to 5 basis points for certain long-term unsecured debt and (ii) a potential increase of up to 10 basis points for brokered deposits in excess of 10% of domestic deposits. As the DIF reserve ratio grows, the rate schedule will be adjusted downward. The Company cannot provide any assurance as to the effect of any proposed change in its deposit insurance premium rate, should such a change occur, as such changes are dependent upon a variety of factors, some of which are beyond the Company’s control.
The FDIC may terminate a depository institution’s deposit insurance upon a finding that the institution’s financial condition is unsafe or unsound or that the institution has engaged in unsafe or unsound practices or has violated any applicable rule, regulation, order or condition enacted or imposed by the institution’s regulatory agency.
USA Patriot Act
The USA Patriot Act became effective on October 26, 2001 and provides for the facilitation of information sharing among governmental entities and financial institutions for the purpose of combating terrorism and money laundering. Among other provisions, the USA Patriot Act permits financial institutions, upon providing notice to the United States Treasury, to share information with one another in order to better identify and report to the federal government concerning activities that may involve money laundering or terrorism. The USA Patriot Act is considered a significant banking law in terms of information disclosure regarding certain customer transactions. Although it does create a reporting obligation, the USA Patriot Act has not materially affected the Bank’s products, services or other business activities.
Safety and Soundness Standards
The Federal Deposit Insurance Corporation Improvement Act of 1991 (FDICIA), as amended by the Riegle Community Development and Regulatory Improvement Act of 1994, requires the federal bank regulatory agencies to prescribe standards, by regulations or guidelines, relating to internal controls, information systems and internal audit systems, loan documentation, credit underwriting, interest rate risk exposure, asset growth, asset quality, earnings, stock valuation and compensation, fees and benefits, and such other operational and managerial standards as the agencies deem appropriate. Guidelines adopted by the federal bank regulatory agencies establish general standards relating to internal controls and information systems, internal audit systems, loan documentation, credit underwriting, interest rate exposure, asset growth and compensation, fees and benefits. In general, the guidelines require, among other things, appropriate systems and practices to identify and manage the risk and exposures specified in the guidelines. The guidelines prohibit excessive compensation as an unsafe and unsound practice and describe compensation as excessive when the amounts paid are unreasonable or disproportionate to the services performed by an executive officer, employee, director or principal stockholder. In addition, the agencies adopted regulations that authorize, but do not require, an agency to order an institution that has been given notice by an agency that it is not satisfying any of such safety and soundness standards to submit a compliance plan. If, after being so notified, an institution fails to submit an acceptable compliance plan or fails in any material respect to implement an acceptable compliance plan, the agency must issue an order directing action to correct the deficiency and may issue an order directing other actions of the types to which an undercapitalized institution is subject under the “prompt corrective action” provisions of FDIA. If an institution fails to comply with such an order, the agency may seek to enforce such order in judicial proceedings and to impose civil money penalties.
7
Table of Contents
Community Reinvestment Act
Under the Community Reinvestment Act and related regulations, depository institutions have an affirmative obligation to assist in meeting the credit needs of their market areas, including low and moderate-income areas, consistent with safe and sound banking practice. The Community Reinvestment Act requires the adoption by each institution of a Community Reinvestment Act statement for each of its market areas describing the depository institution’s efforts to assist in its community’s credit needs. Depository institutions are periodically examined for compliance with the Community Reinvestment Act and are periodically assigned ratings in this regard. Banking regulators consider a depository institution’s Community Reinvestment Act rating when reviewing applications to establish new branches, undertake new lines of business, and/or acquire part or all of another depository institution. An unsatisfactory rating can significantly delay or even prohibit regulatory approval of a proposed transaction by a bank holding company or its depository institution subsidiaries.
Privacy Legislation
Several regulations issued by federal banking agencies also provide protections against the transfer and use of customer information by financial institutions. A financial institution must provide to its customers information regarding its policies and procedures with respect to the handling of customers’ personal information. Each institution must conduct an internal risk assessment of its ability to protect customer information. These privacy provisions generally prohibit a financial institution from providing a customer’s personal financial information to unaffiliated parties without prior notice and approval from the customer.
Capital Purchase Program Regulations
As a result of the Company’s participation in the TARP Capital Purchase Program (CPP), it is subject to certain provisions under EESA. On February 10, 2009, the Treasury announced the Financial Stability Plan under the EESA (the Financial Stability Plan) which was intended to further stabilize financial institutions and stimulate lending across a broad range of economic sectors. On February 18, 2009, President Obama signed the American Reinvestment and Recovery Act of 2009 (ARRA), a broad economic stimulus package that included additional restrictions on, and potential additional regulation of, financial institutions.
On June 10, 2009, under the authority granted to it under ARRA and EESA, the Treasury issued an interim final rule under Section 111 of EESA, as amended by ARRA, regarding compensation and corporate governance restrictions that would be imposed on CPP recipients, effective June 15, 2009. As a CPP recipient with currently outstanding CPP obligations, the Company is subject to the compensation and corporate governance restrictions and requirements set forth in the interim final rule, which, among other things: (1) prohibit the Company from paying or accruing bonuses, retention awards or incentive compensation, except for certain long-term stock awards, to the Company’s most highly compensated employee; (2) prohibit us from making severance payments to any of the senior executive officers or next five most highly compensated employees; (3) require the Company to conduct semi-annual risk assessments to assure that compensation arrangements do not encourage “unnecessary and excessive risks” or the manipulation of earnings to increase compensation; (4) require the Company to recoup or “clawback” any bonus, retention award or incentive compensation paid by the Company to a senior executive officer or any of the next 20 most highly compensated employees, if the payment was based on financial statements or other performance criteria that are later found to be materially inaccurate; (5) prohibit the Company from providing tax gross-ups to any of the senior executive officers or next 20 most highly compensated employees; (6) require the Company to provide enhanced disclosure of perquisites, and the use and role of compensation consultants; (7) require the Company to adopt a corporate policy on luxury and excessive expenditures; (8) require the chief executive officer and chief financial officer to provide periodic certifications about compensation practices and compliance with the interim final rule; (9) require the Company to provide enhanced disclosure of the relationship between the Company’s compensation plans and the risk posed by those plans; and (10) require the Company to provide an annual non-binding shareholder vote, or “say-on-pay” proposal, to approve the compensation of our executives, consistent with regulations promulgated by the Securities and Exchange Commission (SEC). On January 12, 2010, the SEC adopted final regulations setting forth the parameters for such say-on-pay proposals for public company CPP participants.
Under EESA, Congress has the ability to impose “after-the-fact” terms and conditions on participants in Treasury’s TARP Capital Purchase Program. As a participant in the TARP Capital Purchase Program, the Company is subject to any such retroactive legislation. Additional regulations applicable to CPP recipients adopted as part of EESA, the Financial Stability Plan, ARRA, or other legislation may subject the Company to additional regulatory requirements. The impact of these additional requirements may put us at competitive disadvantage in comparison to financial institutions that have either repaid all CPP funds or never accepted CPP funds and may materially adversely affect our business and results of operations.
Evolving Legislation
On July 21, 2010, the Dodd-Frank Act was signed into law. The Dodd-Frank Act implements far-reaching changes across the financial regulatory landscape, including provisions that, among other things, will:
| • | Centralize responsibility for consumer financial protection by creating a new agency, the Consumer Financial Protection Bureau, responsible for implementing, examining and enforcing compliance with federal consumer financial laws. |
| • | Restrict the preemption of state law by federal law. |
| • | Apply the same leverage and risk-based capital requirements that apply to insured depository institutions to most bank holding companies. |
8
Table of Contents
| • | Require bank holding companies and banks to be well-capitalized and well-managed in order to acquire banks located outside their home state. |
| • | Change the assessment base for federal deposit insurance from the amount of insured deposits to consolidated assets less tangible capital, eliminate the ceiling on the size of the DIF and increase the floor of the size of the DIF. |
| • | Impose comprehensive regulation of the over-the-counter derivatives market, which would include certain provisions that would effectively prohibit insured depository institutions from conducting certain derivatives businesses in the institution itself. |
| • | Implement corporate governance revisions, including with regard to executive compensation and proxy access by shareholders that apply to all public companies, not just financial institutions. |
| • | Make permanent the $250 thousand limit for federal deposit insurance and increase the cash limit of Securities Investor Protection Corporation protection from $100 thousand to $250 thousand and provide unlimited federal deposit insurance until December 31, 2012 for noninterest-bearing demand transaction accounts at all insured depository institutions. |
| • | Repeal the federal prohibitions on the payment of interest on demand deposits, thereby permitting depository institutions to pay interest on business transaction and other accounts. |
| • | Amend the Electronic Fund Transfer Act (EFTA) to, among other things, give the Federal Reserve the authority to establish rules regarding interchange fees charged for electronic debit transactions by payment card issuers having assets over $10 billion and to enforce a new statutory requirement that such fees be reasonable and proportional to the actual cost of a transaction to the issuer. |
| • | Increase the authority of the Federal Reserve to examine the Company and its non-bank subsidiaries. |
Many aspects of the Dodd-Frank Act are subject to rulemaking and will take effect over several years, making it difficult to anticipate the overall financial impact on the Company, its customers or the financial industry in general. In the future, management expects that legislative changes will continue to be introduced from time to time in Congress. This legislation may change banking statutes and the Company’s operating environment in substantial and unpredictable ways. If enacted, this legislation could increase or decrease the cost of doing business, limit or expand permissible activities, or affect the competitive balance among banks, savings associations, credit unions and other financial institutions. The Company cannot predict whether any of this potential legislation will be enacted, and if enacted, the effect that it or any implementing regulations could have on the business, results of operations or financial condition of the Company or its subsidiaries.
Consumer Protection Regulations
Retail activities of banks are subject to a variety of statutes and regulations designed to protect consumers. Interest and other charges collected or contracted for by banks are subject to state usury laws and federal laws concerning interest rates.
Loan operations are also subject to federal laws applicable to credit transactions, such as:
| • | the federal Truth-In-Lending Act and Regulation Z issued by the Federal Reserve Board, governing disclosures of credit terms to consumer borrowers; |
| • | the Home Mortgage Disclosure Act and Regulation C issued by the Federal Reserve Board, requiring financial institutions to provide information to enable the public and public officials to determine whether a financial institution is fulfilling its obligation to help meet the housing needs of the community it serves; |
| • | the Equal Credit Opportunity Act and Regulation B issued by the Federal Reserve Board, prohibiting discrimination on the basis of race, creed or other prohibited factors in extending credit; |
| • | the Fair Credit Reporting Act and Regulation V issued by the Federal Reserve Board, governing the use and provision of information to consumer reporting agencies; |
| • | the Fair Debt Collection Act, governing the manner in which consumer debts may be collected by collection agencies; and |
| • | the guidance of the various federal agencies charged with the responsibility of implementing such federal laws. |
Deposit operations are also subject to:
| • | the Truth in Savings Act and Regulation DD issued by the Federal Reserve Board, which requires disclosure of deposit terms to consumers; |
| • | Regulation CC issued by the Federal Reserve Board, which relates to the availability of deposit funds to consumers; |
| • | the Right to Financial Privacy Act, which imposes a duty to maintain confidentiality of consumer financial records and prescribes procedures for complying with administrative subpoenas of financial records; and |
| • | the Electronic Funds Transfer Act and Regulation E issued by the Federal Reserve Board, which governs automatic deposits to and withdrawals from deposit accounts and customers’ rights and liabilities arising from the use of automated teller machines and other electronic banking services. |
The Federal Reserve and FDIC have recently enacted consumer protection regulations related to automated overdraft payment programs offered by financial institutions. In November 2009, the Federal Reserve amended its Regulation E to prohibit financial institutions, including the Bank, from charging consumers fees for paying overdrafts on automated teller machine and one-time debit card transactions, unless a consumer consents, or opts in, to the overdraft service for those types of transactions. The Regulation E amendments also require financial institutions to provide consumers with a notice that explains the financial institution’s overdraft services, including the fees associated with the service and the consumer’s choices. The amendments to Regulation E became effective on August 1, 2010.
9
Table of Contents
Many of the foregoing laws and regulations are subject to change resulting from the provisions in the Dodd-Frank Act, which in many cases calls for revisions to implementing regulations. We cannot predict the effect that being regulated by a new, additional regulatory authority focused on consumer financial protection, or any new implementing regulations or revisions to existing regulations that may result from the establishment of this new authority, will have on the Company’s businesses. Additional regulations resulting from the Dodd-Frank Act may materially adversely affect the Company’s business, financial condition or results of operations.
An investment in the Company’s common stock involves significant risks, including the following risks and uncertainties. These risk factors should be read carefully and considered before deciding to invest in the Company’s common stock. These risk factors may adversely affect the Company’s financial condition and future earnings. In that event, the trading price of the Company’s common stock could decline and you could lose a part or all of your investment. This section should be read together with the other information, including the consolidated financial statements and related notes to the consolidated financial statements included in Item 8 of this Form 10-K.
The Company may be further adversely affected by economic conditions in its market area.
The Company is headquartered in the northern Shenandoah Valley region of Virginia. Because our lending is concentrated in this market, the Company is affected by the general economic conditions in the region. Changes in the economy may influence the growth rate of loans and deposits, the quality of the loan portfolio and loan and deposit pricing. A continued decline in general economic conditions caused by inflation, recession, unemployment or other factors beyond the Company’s control would further impact these local economic conditions and the demand for banking products and services generally, which could negatively affect the Company’s performance and financial condition.
Deteriorating credit quality, particularly in real estate loans, has adversely impacted the Company and may continue to adversely impact the Company.
During 2008 the Company began to experience a downturn in the overall credit performance of the loan portfolio, as well as acceleration in the deterioration of general economic conditions. This deterioration, including a significant increase in national and regional unemployment levels, is negatively impacting some borrowers’ ability to repay. During the year ended December 31, 2008, these conditions resulted in a $13.9 million increase in nonperforming assets and loans over 90 days past due. At December 31, 2010 and 2009, nonperforming assets and loans over 90 days past due remained at elevated levels, totaling $15.4 million and $14.8 million, respectively. The allowance for loan losses increased $8.9 million to $16.0 million at December 31, 2010, compared to $7.1 million at December 31, 2009. The allowance increased $1.4 million during the year ended December 31, 2009. Additional increases in loan loss reserves may be necessary in the future. Continued deterioration in the quality of the loan portfolio can have a material adverse effect on earnings, liquidity and capital.
If the Bank’s allowance for loan losses becomes inadequate, results of operations may be adversely affected.
The Bank maintains an allowance for loan losses that it believes is a reasonable estimate of known and inherent losses in the loan portfolio. Through a quarterly review of the loan portfolio, management determines the amount of the allowance for loan losses by considering economic conditions, credit quality of the loan portfolio, collateral supporting the loans, performance of customers relative to their financial obligations and the quality of the Bank’s loan administration. The amount of future losses is susceptible to changes in economic, operating and other conditions, including changes in interest rates that may be beyond the Bank’s control, and these losses may exceed current estimates. Although the Company believes the allowance for loan losses is a reasonable estimate of known and inherent losses in the loan portfolio, such losses and the adequacy of the allowance for loan losses cannot be fully predicted. Excessive loan losses could have a material impact on financial performance through additions to the allowance for loan losses.
Federal and state regulators periodically review the allowance for loan losses and may require an increase to the provision for loan losses or recognition of further loan charge-offs, based on judgments different than those of management. Any increase in the amount of provision or loans charged-off as required by these regulatory agencies could have a negative effect on operating results.
The Bank’s concentrations of loans could result in higher than normal risk of loan defaults and losses.
The Bank offers a variety of secured loans, including commercial lines of credit, commercial term loans, real estate, construction, home equity, consumer and other loans. The majority of the loans are secured by real estate (both residential and commercial) in the market area. At December 31, 2010, these loans totaled $381.5 million, or 88%, of total loans. The Bank has a concentration of credit risk within the loan portfolio involving loans secured by hotels. This concentration totaled $41.6 million at December 31, 2010, representing 86% of total equity and 10% of total loans. A major change in the real estate market, such as further deterioration in the value of this collateral, or in the local or national economy, could adversely affect customers’ ability to pay these loans, which in turn could impact the Bank. Risk of loan defaults and foreclosures are unavoidable in the banking industry, and the Bank tries to limit exposure to this risk by monitoring extensions of credit carefully. The Bank cannot fully eliminate credit risk, and as a result credit losses may occur in the future.
10
Table of Contents
The Bank will realize additional future losses if our levels of nonperforming assets do not moderate and if the proceeds we receive upon liquidation of assets are less than the carrying value of such assets.
The Company expects to focus on reducing nonperforming asset levels during 2011 by selling other real estate owned (OREO) and restructuring its problem loans and potential problem loans. The actual volume of future distressed asset sales could increase based on regulatory directives, the level of migration of performing loans to problem loan status, as well as opportunities to sell such assets, thus resulting in higher credit costs. The continuing weakness in the residential and commercial real estate markets may negatively impact the ability to dispose of distressed assets, and may result in higher credit losses on sales of distressed assets. Nonperforming assets are recorded on the financial statements at the estimated fair value, which considers management’s plans for disposition. The Company will realize additional future losses if the proceeds received upon dispositions of assets are less than the recorded carrying value of such assets. If market conditions continue to decline, the magnitude of losses realized upon the disposition of nonperforming assets may increase, which could materially adversely affect the Company’s business, financial condition and results of operations.
If the Bank’s valuation allowance on OREO becomes inadequate, results of operations may be adversely affected.
The Bank maintains a valuation allowance that it believes is a reasonable estimate of known losses in OREO. The Bank obtains appraisals on all OREO properties on an annual basis and adjusts the valuation allowance accordingly. The carrying value of OREO is susceptible to changes in economic and real estate market conditions. Although the Company believes the valuation allowance is a reasonable estimate of known losses, such losses and the adequacy of the allowance cannot be fully predicted. Excessive declines in market values could have a material impact on financial performance.
The Company relies on secondary sources, such as Federal Home Loan Bank advances, sales of securities and loans, federal funds lines of credit from correspondent banks and out-of-market time deposits, to meet liquidity needs.
In managing the Company’s consolidated balance sheet, the Company depends on secondary sources to provide sufficient liquidity to meet our commitments and business needs, and to accommodate the transaction and cash management needs of clients. Other sources of funding available to us, and upon which we rely as regular components of our liquidity risk management strategy, include federal funds lines of credit, sales of securities and loans, brokered deposits and borrowings from the Federal Home Loan Bank system. Any occurrence that may limit our access to these sources, such as a decline in the confidence of debt purchasers, or our depositors or counterparties, may adversely affect the Company’s liquidity.
If the Company needs additional capital in the future, it may not be able to obtain it on terms that are favorable. This could negatively affect the Company’s performance and the value of its common stock.
The Company anticipates that it will have sufficient capital to support asset growth and potential loan charge-offs. However, additional capital may be needed in the future to maintain capital levels. The ability to raise capital through the sale of additional securities will depend primarily upon the Company’s financial condition and the condition of financial markets at that time. The Company may not be able to obtain additional capital in amounts or on terms that are satisfactory. The Company’s ability to grow its balance sheet may be constrained if it is unable to raise additional capital as needed.
The Company may incur losses if it is unable to successfully manage interest rate risk.
The Company’s profitability will depend substantially upon the spread between the interest rates earned on investments and loans and interest rates paid on deposits and other interest-bearing liabilities. Changes in interest rates, including the shape of the treasury yield curve, will affect the Company’s financial performance and condition through the pricing of securities, loans, deposits and borrowings. The Company attempts to minimize exposure to interest rate risk, but will be unable to eliminate it. Our net interest spread will depend on many factors that are partly or entirely outside of the Company’s control, including competition, federal economic, monetary and fiscal policies and general economic conditions.
Regulation by federal and state agencies could adversely affect the profitability of the business.
The Company is heavily regulated by federal and state agencies. This regulation is to protect depositors, the federal deposit insurance fund and the banking system as a whole. Congress and state legislatures and federal and state regulatory agencies continually review banking laws, regulations, and policies for possible changes. Changes to statutes, regulations, or regulatory policies, including interpretation or implementation of statutes, regulations, or policies, could affect the Company adversely, including limiting the types of financial services and products it may offer and/or increasing the ability of non-banks to offer competing financial services and products. If the Company does not comply with laws, regulations, or policies, it could receive regulatory sanctions and damage to its reputation.
Regulation of the financial services industry is undergoing major changes, and future legislation could increase our cost of doing business or harm our competitive position.
Many government programs were enacted in 2008 in response to the financial crisis and the recession. In 2009 and 2010, these programs slowed and global regulatory and legislative focus has generally moved to a second phase of broader reform and a restructuring of financial institution regulation. Emergency programs that are winding down include TARP, which Treasury extended until October 3, 2010 in order to retain an adequate financial stability reserve if financial conditions worsen and threaten the economy. Also, the Debt Guarantee Program expired on October 31, 2009, with the guarantee
11
Table of Contents
period on such debt expiring on December 31, 2012. The Transaction Account Guarantee portion of the program, which guarantees non-interest bearing bank transaction accounts on an unlimited basis was extended until December 31, 2010 and recent amendments to the Federal Deposit Insurance Act provide full deposit insurance coverage for noninterest-bearing transaction accounts and Interest on Lawyer Trust Accounts or IOLTAs beginning December 31, 2010, for a two-year period. In addition, the Federal Reserve has begun to sell off its portfolio of mortgage-backed securities, which it previously purchased in order to stabilize the residential mortgage market. We cannot predict the effect that the wind-down of these various governmental programs will have on current financial market conditions, or on our business, financial condition, results of operations, access to credit and the trading price of our common stock.
On July 21, 2010, President Obama signed into law the Dodd-Frank Act, which will substantially change the legal and regulatory framework under which the Company operates over the next several years. The Dodd-Frank Act represents a significant overhaul of many aspects of the regulation of the financial-services industry, addressing, among other things, systemic risk, capital adequacy, deposit insurance assessments, consumer financial protection, interchange fees, derivatives, lending limits, mortgage lending practices, registration of investment advisors and changes among the bank regulatory agencies. Among the provisions that may affect the operations of the Bank or the Company are the following:
| • | Centralize responsibility for consumer financial protection by creating a new agency, the Consumer Financial Protection Bureau, responsible for implementing, examining and enforcing compliance with federal consumer financial laws. |
| • | Restrict the preemption of state law by federal law. |
| • | Apply the same leverage and risk-based capital requirements that apply to insured depository institutions to most bank holding companies. |
| • | Require bank holding companies and banks to be well-capitalized and well-managed in order to acquire banks located outside their home state. |
| • | Change the assessment base for federal deposit insurance from the amount of insured deposits to consolidated assets less tangible capital, eliminate the ceiling on the size of the DIF and increase the floor of the size of the DIF. |
| • | Impose comprehensive regulation of the over-the-counter derivatives market, which would include certain provisions that would effectively prohibit insured depository institutions from conducting certain derivatives businesses in the institution itself. |
| • | Implement corporate governance revisions, including with regard to executive compensation and proxy access by shareholders that apply to all public companies, not just financial institutions. |
| • | Make permanent the $250 thousand limit for federal deposit insurance and increase the cash limit of Securities Investor Protection Corporation protection from $100 thousand to $250 thousand and provide unlimited federal deposit insurance until December 31, 2012 for noninterest-bearing demand transaction accounts at all insured depository institutions. |
| • | Repeal the federal prohibitions on the payment of interest on demand deposits, thereby permitting depository institutions to pay interest on business transaction and other accounts. |
| • | Amend the Electronic Fund Transfer Act (EFTA) to, among other things, give the Federal Reserve the authority to establish rules regarding interchange fees charged for electronic debit transactions by payment card issuers having assets over $10 billion and to enforce a new statutory requirement that such fees be reasonable and proportional to the actual cost of a transaction to the issuer. |
| • | Increase the authority of the Federal Reserve to examine the Company and its non-bank subsidiaries. |
Some of these and other major changes could materially impact the profitability of the Company’s business, the value of assets held or the collateral available for loans, require changes to business practices or force the Company to discontinue businesses and expose it to additional costs, taxes, liabilities, enforcement actions and reputational risk. Many of these provisions became effective upon enactment of the Dodd-Frank Act, while others are subject to further study, rulemaking, and the discretion of regulatory bodies. The Company cannot predict the effect that compliance with the Dodd-Frank Act or any implementing regulations will have on the Company’s business or its ability to pursue future business opportunities. Additional regulations resulting from the Dodd-Frank Act may materially adversely affect the Company’s business, financial condition or results of operations.
Increases in FDIC insurance premiums could adversely affect the Company’s profitability.
The Dodd-Frank Act directs the FDIC to amend its regulations to re-define the method of calculation of an insured depository institution’s insurance fund assessment. The Dodd-Frank Act requires the assessment base to be an amount equal to the average consolidated total assets of the insured depository institution during the assessment period, minus the sum of the average tangible equity of the insured depository institution during the assessment period and an amount the FDIC determines is necessary to establish assessments consistent with the risk-based assessment system found in the Federal Deposit Insurance Act. The FDIC has issued final rules outlining this new insurance assessment methodology, which will impact the amount of the Bank’s insurance assessment. In addition, the FDIC may make additional changes to the way in which it calculates insurance premiums. We cannot predict the timing of any future changes, and if made, the effect that these changes could have on our insurance assessment.
12
Table of Contents
The Company could reduce or discontinue dividends on common shares.
Holders of the Company’s common shares are only entitled to receive such dividends as the Board of Directors may declare out of funds legally available for such payments. In addition, under Federal Reserve regulations, the Bank may not declare a dividend if the total amount of all dividends, including the proposed dividend, declared by it in any calendar year exceeds the total of its retained net income of that year to date, combined with its retained net income of the two preceding years, unless the dividend is approved by the Federal Reserve. The net loss available to common shareholders totaled $4.5 million for the year ended December 31, 2010 compared to common dividends paid to shareholders totaling $1.6 million during the same period. As a result, the Bank could not transfer funds to the Company without prior regulatory approval. The Bank received approval of a February 2011 dividend declaration totaling $550 thousand from the Bank to the Company. Although the Company has historically declared cash dividends on common shares, it is not required to do so and may reduce or eliminate common share dividends in the future. This could adversely affect the market price of the Company’s common shares. Also, the Company’s ability to increase its dividend or to make other distributions is restricted due to participation in the Capital Purchase Program, which limits (without the consent of the Treasury) its ability to increase its dividend or to repurchase common shares for so long as any securities issued under such program remain outstanding.
Difficult market conditions have adversely affected the Company’s industry.
Dramatic declines in the housing market over the past three years, with falling home prices and increasing foreclosures and unemployment, have negatively impacted the credit performance of real estate related loans and resulted in significant write-downs of asset values by financial institutions. These write-downs, initially of mortgage-backed securities (MBS) but spreading to other securities and loans have caused many financial institutions to seek additional capital, to reduce or eliminate dividends, to merge with larger and stronger institutions and, in some cases, to fail. Reflecting concern about the stability of the financial markets generally and the strength of counterparties, many lenders and institutional investors have reduced or ceased providing funding to borrowers, including to other financial institutions. This market turmoil and tightening of credit have led to an increased level of commercial and consumer delinquencies, lack of consumer confidence, increased market volatility and widespread reduction of business activity generally. The resulting economic pressure on consumers and lack of confidence in the financial markets has adversely affected the Company’s business, financial condition and results of operations. Market developments may affect consumer confidence levels and may cause adverse changes in payment patterns, causing increases in delinquencies and default rates, which may impact charge-offs and the provision for loan losses. A worsening of these conditions would likely have an adverse effect on the Company and others in the financial services industry.
There is a limited trading market for the Company’s common stock; it may be difficult to sell shares after they have been purchased.
Shares of the Company’s common stock are traded on the over-the-counter (OTC) market and quoted in the OTC Bulletin Board under the symbol “FXNC.” The volume of trading activity in the stock is relatively limited. Even if a more active market develops, there can be no assurance that such market will continue, or that shares will be able to be sold at or above the investment price. The lack of liquidity of the investment in the common shares should be carefully considered when making an investment decision.
The soundness of other financial institutions could adversely affect the Company.
The Company’s ability to engage in routine funding transactions could be adversely affected by the actions and commercial soundness of other financial institutions. Financial services institutions are interrelated as a result of trading, clearing, counterparty, or other relationships. As a result, defaults by, or even rumors or questions about, one or more financial services institutions, or the financial services industry generally, have led to market-wide liquidity problems and could lead to losses or defaults by the Company or by other institutions. Many of these transactions expose the Company to credit risk in the event of default of its counterparty or client. There is no assurance that any such losses would not materially and adversely affect the Company’s results of operations.
The Company relies heavily on its management team and the unexpected loss of any of those personnel could adversely affect operations; the Company depends on the ability to attract and retain key personnel.
The Company’s future operating results depend substantially upon the continued service of its executive officers and key personnel. The Company’s future operating results also depend in significant part upon its ability to attract and retain qualified management, financial, technical, marketing, sales and support personnel. Competition for qualified personnel is intense, and the Company cannot ensure success in attracting or retaining qualified personnel. There may be only a limited number of persons with the requisite skills to serve in these positions, and it may be increasingly difficult for the Company to hire personnel over time. In December 2010 and January 2011, the Company lost its Executive Vice President – Loan Administration and its President and Chief Executive Officer. We do not believe that the loss of these executive officers has adversely affected operations.
Our ability to retain key officers and employees may be further impacted by legislation and regulation affecting the financial services industry. For example, Section 7001 of the ARRA amended Section 111 of the EESA in its entirety, significantly expanded the executive compensation restrictions. These restrictions apply to the Company as a participant in the Capital Purchase Program and shall generally continue to apply for as long as any Senior Preferred shares are outstanding. Such restrictions and standards may further impact management’s ability to compete with financial institutions that are not subject to the same limitations as the Company under Section 7001 of the ARRA.
13
Table of Contents
Future success is dependent on the ability to compete effectively in the highly competitive banking industry.
The Company faces vigorous competition from other financial institutions, including other commercial banks, savings and loan associations, savings banks, finance companies and credit unions for deposits, loans and other financial services in its market area. A number of these other financial institutions are significantly larger than the Company and have substantially greater access to capital and other resources, as well as larger lending limits and branch systems, and offer a wider array of banking services. To a limited extent the Company also competes with other providers of financial services, such as money market mutual funds, brokerage firms, insurance companies and governmental organizations which may offer more favorable products and services than the Company. Many of the non-bank competitors are not subject to the same extensive regulations that govern the Company. As a result, the non-bank competitors have advantages over the Company in providing certain services. This competition may reduce or limit profit margins and market share and may adversely affect the results of operations and financial condition.
Changes in the Company’s accounting policies or in accounting standards could materially affect how it reports financial results and condition.
From time to time, the Financial Accounting Standards Board (FASB) and SEC change the financial accounting and reporting standards that govern the preparation of our financial statements. These changes can be hard to predict and can materially impact how the Company records and reports its financial condition and results of operations. In some cases, the Company could be required to apply a new or revised standard retroactively, resulting in restating prior period financial statements.
Negative public opinion could damage our reputation and adversely impact business and revenues.
As a financial institution, the Company’s earnings, liquidity, and capital are subject to risks associated with negative public opinion of the Company and of the financial services industry as a whole. Negative public opinion could result from our actual or alleged conduct in any number of activities, including lending practices, the failure of any product or service sold by us to meet our clients’ expectations or applicable regulatory requirements, corporate governance and acquisitions, or from actions taken by government regulators and community organizations in response to those activities. Negative public opinion can adversely affect our ability to keep, attract and/or retain clients and can expose us to litigation and regulatory action. Actual or alleged conduct by one of our businesses can result in negative public opinion about our other businesses. Negative public opinion could also affect our ability to borrow funds in the unsecured wholesale debt markets.
As a result of the Company’s participation in the Capital Purchase Program (CPP), the Company may become subject to additional regulation, and the costs or effects of compliance cannot be predicted at this time.
In connection with its participation in the CPP administered under the TARP, the Company may face additional regulations and/or reporting requirements, including, but not limited to, the following:
| • | Congress has the ability to impose “after-the-fact” terms and conditions on participants in the CPP. As a participant in the CPP, the Company would be subject to any such retroactive legislation. We cannot predict whether or in what form any proposed regulation or statute will be adopted or the extent to which our business may be affected by any new regulation or statute. |
| • | Participation in the CPP will limit our ability to increase the dividend on our common stock above $0.14 per share, or to repurchase, our common stock without the consent of the Treasury until the earlier of March 13, 2012 or until the Preferred Stock has been redeemed in whole. |
Item 1B. Unresolved Staff Comments
Not applicable.
14
Table of Contents
The following describes the location and general character of the principal offices of the Company.
The Company owns the headquarters building located at 112 West King Street, in Strasburg, Virginia. This location also serves as the Bank’s Strasburg Financial Center, which primarily serves the banking needs of northern Shenandoah County customers. This three story building also houses administrative employees, including human resources and marketing. Loan and deposit operations, data processing and information technology employees are housed in the Operations Center. Financial accounting is housed in the Winchester Financial Center. Financial centers provide full service banking, including loan, deposit, trust and investment advisory services, while the bank branches primarily focus on depository and consumer lending functions. The following table provides the name, location, year opened and type of the Company’s locations:
| Name |
Location |
Year |
Type |
Owned/Leased | ||||
| Strasburg Financial Center | 112 West King Street Strasburg, Virginia |
1927 | Financial Center | Owned | ||||
| Front Royal Express | 508 North Commerce Avenue Front Royal, Virginia |
1985 | Branch | Leased | ||||
| Kernstown | 3143 Valley Pike Winchester, Virginia |
1994 | Branch | Owned | ||||
| South Woodstock | 860 South Main Street Woodstock, Virginia |
1995 | Branch | Owned | ||||
| North Woodstock | 496 North Main Street Woodstock, Virginia |
1999 | Branch | Leased | ||||
| Front Royal Financial Center | 1717 Shenandoah Avenue Front Royal, Virginia |
2002 | Financial Center | Owned | ||||
| Winchester Financial Center | 1835 Valley Avenue Winchester, Virginia |
2003 | Financial Center | Owned | ||||
| Mount Jackson Financial Center | 5304 Main Street Mount Jackson, Virginia |
2004 | Financial Center | Owned | ||||
| Sherando Financial Center | 695 Fairfax Pike Stephens City, Virginia |
2006 | Financial Center | Owned | ||||
| Winchester West Financial Center | 208 Crock Wells Mill Drive Winchester, Virginia |
2006 | Financial Center | Owned | ||||
| Operations Center | 406 Borden Mowery Drive Strasburg, Virginia |
2008 | Operations Center | Owned | ||||
| Woodstock West | 300 West Reservoir Road Woodstock, Virginia |
2009 | Branch | Owned | ||||
Rental expense for the leased locations totaled $45 thousand for the year ended December 31, 2010. The lease for the Front Royal Express property expired on April 30, 2009 with an automatic renewal option through April 30, 2013. The lease for the North Woodstock property expires on May 31, 2016, without a renewal option. The Bank plans to close the Woodstock West property on April 15, 2011 and transfer its customer accounts to the South Woodstock branch.
All of the Company’s properties are in good operating condition and are adequate for the Company’s present and future needs.
There are no material pending legal proceedings to which the Company is a party or to which the property of the Company is subject.
15
Table of Contents
Item 5. Market for Registrant’s Common Equity, Related Stockholder Matters and Issuer Purchases of Equity Securities
Market Prices and Dividends
Shares of the common stock of the Company are traded on the over-the-counter (OTC) market and quoted in the OTC Bulletin Board under the symbol “FXNC.” As of March 18, 2011 the Company had 667 shareholders of record and approximately 549 additional beneficial owners of shares of common stock.
Following are the high and low prices of sales of common stock known to the Company, along with the dividends that were paid quarterly in 2010 and 2009.
| Market Prices and Dividends (per share) | ||||||||||||
| Sales Price ($) | Dividends ($) | |||||||||||
| High | Low | |||||||||||
| 2010: |
||||||||||||
|
1st quarter |
12.00 | 10.00 | 0.14 | |||||||||
|
2nd quarter |
17.85 | 11.40 | 0.14 | |||||||||
|
3rd quarter |
14.00 | 12.20 | 0.14 | |||||||||
|
4th quarter |
13.50 | 12.21 | 0.14 | |||||||||
| 2009: |
||||||||||||
|
1st quarter |
17.25 | 11.50 | 0.14 | |||||||||
|
2nd quarter |
17.25 | 15.00 | 0.14 | |||||||||
|
3rd quarter |
16.10 | 12.80 | 0.14 | |||||||||
|
4th quarter |
14.00 | 9.25 | 0.14 | |||||||||
Dividend Policy
The Company’s future dividend policy is subject to the discretion of its Board of Directors and will depend upon a number of factors, including future earnings, financial condition, liquidity and capital requirements of both the Company and the Bank, applicable governmental regulations and policies and other factors deemed relevant by its Board of Directors.
The Company is organized under the Virginia Stock Corporation Act, which prohibits the payment of a dividend if, after giving it effect, the corporation would not be able to pay its debts as they become due in the usual course of business. The payment of a dividend is also prohibited if the corporation’s total assets would be less than the sum of its total liabilities plus the amount that would be needed, if the corporation were to be dissolved, to satisfy the preferential rights upon dissolution of any preferred shareholders.
The Company is subject to certain regulatory requirements to maintain capital at or above regulatory minimums. These regulatory requirements regarding capital affect its dividend policies. The Federal Reserve has indicated that a bank holding company should generally pay dividends only if its earnings for the current period are sufficient to fully fund the dividends, and the prospective rate of earnings retention appears consistent with the organization’s capital needs, asset quality and overall financial condition.
The Company is a legal entity separate and distinct from its subsidiaries. Its ability to distribute cash dividends will depend primarily on the ability of the Bank to pay dividends to it, and the Bank is subject to laws and regulations that limit the amount of dividends that it can pay. As a state member bank, the Bank is subject to certain restrictions imposed by the reserve and capital requirements of federal and Virginia banking statutes and regulations. Under Virginia law, a bank may not declare a dividend in excess of its undivided profits. Additionally, under Federal Reserve regulations, the Bank may not declare a dividend if the total amount of all dividends, including the proposed dividend, declared by it in any calendar year exceeds the total of its retained net income of that year to date, combined with its retained net income of the two preceding years, unless the dividend is approved by the Federal Reserve. The Bank received approval in February 2011 for a dividend declaration totaling $550 thousand from the Bank to the Company. The Federal Reserve and the Commonwealth of Virginia have the general authority to limit the dividends paid by insured banks if the payment is deemed an unsafe and unsound practice. Both the Commonwealth of Virginia and the Federal Reserve have indicated that paying dividends that deplete a bank’s capital base to an inadequate level would be an unsound and unsafe banking practice.
In connection with its participation in the Capital Purchase Program established by the Treasury under the EESA, the Company issued preferred stock to the Treasury on March 13, 2009. The Preferred Stock is in a superior ownership position compared to common stock. Dividends must be paid to the preferred stock holder before they can be paid to the common shareholders. In addition, prior to March 13, 2012, unless the Company has redeemed the Preferred Stock or the Treasury has transferred the Preferred Stock to a third party, the consent of the Treasury will be required for the Company to increase its common stock dividend or repurchase its common stock or other equity or capital securities, other than in certain circumstances specified in the Purchase Agreement. If the dividends on the Preferred Stock have not been paid for an aggregate of six (6) quarterly dividend periods or more, whether or not consecutive, the Company’s authorized number of directors will be automatically increased by two (2) and the holders of the Preferred Stock will have the right to elect those directors at the Company’s next annual meeting or at a special meeting called for that purpose; these two directors will be elected annually and will serve until all accrued and unpaid dividends for all past dividend periods have been declared and paid in full.
16
Table of Contents
Stock Repurchases
The Company did not repurchase any shares of its common stock during the fourth quarter of 2010.
Stock Performance Graph
The following graph compares the cumulative total return to the shareholders of the Company for the last five fiscal years with the total return on the S&P 500, NASDAQ-Total U.S. and the SNL Bank Index $500M-$1B, assuming an investment of $100 in shares of Common Stock on December 31, 2005, and the reinvestment of dividends.
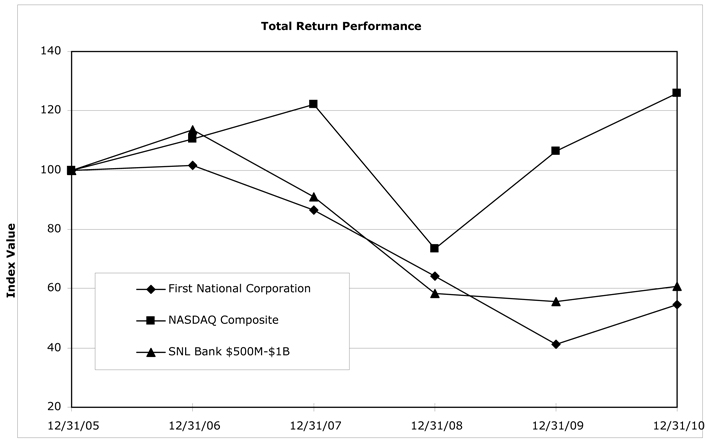
| Period Ending | ||||||||||||||||||||||||
| Index |
12/31/05 | 12/31/06 | 12/31/07 | 12/31/08 | 12/31/09 | 12/31/10 | ||||||||||||||||||
| First National Corporation |
100.00 | 101.65 | 86.52 | 64.21 | 41.17 | 54.62 | ||||||||||||||||||
| NASDAQ Composite |
100.00 | 110.39 | 122.15 | 73.32 | 106.57 | 125.91 | ||||||||||||||||||
| SNL Bank $500M-$1B |
100.00 | 113.73 | 91.14 | 58.40 | 55.62 | 60.72 | ||||||||||||||||||
17
Table of Contents
Item 6. Selected Financial Data
The following is selected financial data for the Company for the last five years. This information has been derived from audited financial information included in Item 8 of this Form 10-K.
| Years Ended December 31, (in thousands except ratios and per share amounts) |
||||||||||||||||||||
| 2010 | 2009 | 2008 | 2007 | 2006 | ||||||||||||||||
| Results of Operations |
||||||||||||||||||||
| Interest and dividend income |
$ | 27,215 | $ | 27,414 | $ | 30,913 | $ | 35,501 | $ | 32,947 | ||||||||||
| Interest expense |
6,814 | 9,084 | 12,793 | 17,401 | 15,392 | |||||||||||||||
| Net interest income |
20,401 | 18,330 | 18,120 | 18,100 | 17,555 | |||||||||||||||
| Provision for loan losses |
11,731 | 2,300 | 1,994 | 398 | 378 | |||||||||||||||
| Net interest income after provision for loan losses |
8,670 | 16,030 | 16,126 | 17,702 | 17,177 | |||||||||||||||
| Noninterest income |
6,063 | 5,577 | 5,951 | 6,072 | 5,170 | |||||||||||||||
| Noninterest expense |
20,542 | 18,703 | 16,014 | 15,286 | 13,783 | |||||||||||||||
| Income (loss) before income taxes |
(5,809 | ) | 2,904 | 6,063 | 8,488 | 8,564 | ||||||||||||||
| Income tax expense (benefit) |
(2,206 | ) | 755 | 1,840 | 2,741 | 2,766 | ||||||||||||||
| Net income (loss) |
(3,603 | ) | 2,149 | 4,223 | 5,747 | 5,798 | ||||||||||||||
| Effective dividend and accretion on preferred stock |
887 | 704 | — | — | — | |||||||||||||||
| Net income (loss) available to common shareholders |
$ | (4,490 | ) | $ | 1,445 | $ | 4,223 | $ | 5,747 | $ | 5,798 | |||||||||
| Key Performance Ratios |
||||||||||||||||||||
| Return on average assets |
(0.66 | %) | 0.39 | % | 0.78 | % | 1.09 | % | 1.15 | % | ||||||||||
| Return on average equity |
(6.52 | %) | 4.27 | % | 10.65 | % | 16.52 | % | 18.49 | % | ||||||||||
| Net interest margin |
4.07 | % | 3.62 | % | 3.63 | % | 3.71 | % | 3.74 | % | ||||||||||
| Efficiency ratio(1) |
66.77 | % | 73.10 | % | 65.37 | % | 62.22 | % | 59.95 | % | ||||||||||
| Dividend payout |
(36.64 | %) | 113.09 | % | 38.61 | % | 26.79 | % | 24.65 | % | ||||||||||
| Equity to assets |
8.90 | % | 9.92 | % | 7.15 | % | 6.99 | % | 6.17 | % | ||||||||||
| Per Common Share Data |
||||||||||||||||||||
| Net income (loss), basic and diluted |
$ | (1.53 | ) | $ | 0.49 | $ | 1.45 | $ | 1.98 | $ | 1.99 | |||||||||
| Cash dividends |
0.56 | 0.56 | 0.56 | 0.53 | 0.49 | |||||||||||||||
| Book value at period end |
11.66 | 13.92 | 13.41 | 12.95 | 11.14 | |||||||||||||||
| Financial Condition |
||||||||||||||||||||
| Assets |
$ | 544,629 | $ | 552,674 | $ | 548,237 | $ | 541,565 | $ | 527,944 | ||||||||||
| Loans, net |
418,994 | 436,129 | 446,327 | 445,380 | 423,151 | |||||||||||||||
| Securities |
60,420 | 60,129 | 54,791 | 54,117 | 56,948 | |||||||||||||||
| Deposits |
463,500 | 463,886 | 447,493 | 445,142 | 435,044 | |||||||||||||||
| Shareholders’ equity |
48,498 | 54,807 | 39,185 | 37,859 | 32,555 | |||||||||||||||
| Average shares outstanding, diluted |
2,940 | 2,921 | 2,913 | 2,906 | 2,917 | |||||||||||||||
| Capital Ratios |
||||||||||||||||||||
| Leverage |
10.54 | % | 11.50 | % | 9.10 | % | 9.53 | % | 8.76 | % | ||||||||||
| Risk-based capital ratios: |
||||||||||||||||||||
| Tier 1 capital |
12.91 | % | 13.70 | % | 10.52 | % | 10.89 | % | 10.43 | % | ||||||||||
| Total capital |
14.18 | % | 14.96 | % | 11.72 | % | 11.80 | % | 11.34 | % | ||||||||||
| (1) | The efficiency ratio is computed by dividing noninterest expense excluding the provision for other real estate owned by the sum of net interest income on a tax equivalent basis and non-interest income excluding securities and premises and equipment gains and losses. This is a non-GAAP financial measure that the Company believes provides investors with important information regarding operational efficiency. Such information is not prepared in accordance with U.S. generally accepted accounting principles (GAAP) and should not be construed as such. Noninterest expense excluding the provision for other real estate owned was $17,902, $17,709, $16,014, $15,286 and $13,783 for 2010, 2009, 2008, 2007 and 2006, respectively. Net interest income on a tax equivalent basis was $20,723, $18,668, $18,442, $18,391 and $17,824 for 2010, 2009, 2008, 2007 and 2006, respectively. Non-interest income excluding securities and premises and equipment gains and losses was $6,089, $5,558, $6,055, $5,812 and $5,167 for 2010, 2009, 2008, 2007 and 2006, respectively. Management believes such financial information is meaningful to the reader in understanding operating performance, but cautions that such information not be viewed as a substitute for GAAP. The Company, in referring to its net income, is referring to income under generally accepted accounting principles, or “GAAP.” See “Non-GAAP Financial Measures” included in Item 7 of this Form 10-K. |
18
Table of Contents
Item 7. Management’s Discussion and Analysis of Financial Condition and Results of Operation
The following discussion and analysis of the financial condition and results of operations of the Company for the years ended December 31, 2010, 2009 and 2008 should be read in conjunction with the consolidated financial statements and related notes to the consolidated financial statements included in Item 8 of this Form 10-K.
Executive Overview
The Company
First National Corporation (the Company) is the bank holding company of:
| • | First Bank (the Bank). The Bank owns: |
| • | First Bank Financial Services, Inc. |
| • | Shen-Valley Land Holdings, LLC |
| • | First National (VA) Statutory Trust I (Trust I) |
| • | First National (VA) Statutory Trust II (Trust II) |
| • | First National (VA) Statutory Trust III (Trust III) |
First Bank Financial Services, Inc. invests in partnerships that provide title insurance and investment services. Shen-Valley Land Holdings, LLC was formed to hold other real estate owned and future office sites. The Trusts were formed for the purpose of issuing redeemable capital securities, commonly known as trust preferred securities.
Products, Services, Customers and Locations
The Bank offers loan, deposit, trust and investment products and services through 11 offices, 31 ATMs and its website, www.therespowerinone.com, for both individuals and businesses. Customers include individuals, small and medium-sized businesses, governmental entities and non-profit organizations in the northern Shenandoah Valley region of Virginia.
Revenue Sources and Expense Factors
The primary source of revenue is from net interest income earned by the Bank. Net interest income is the difference between interest income and interest expense and typically represents between 75% to 80% of the Company’s total revenue. Interest income is determined by the amount of interest-earning assets outstanding during the period and the interest rates earned on those assets. The Bank’s interest expense is a function of the amount of interest-bearing liabilities outstanding during the period and the interest rates paid. In addition to net interest income, noninterest income is the other source of revenue for the Company. Noninterest income is derived primarily from service charges on loans and deposits and fees earned from other services. The Bank generates fee income from other services that include trust and investment advisory services and through the origination and sale of residential mortgages.
The provision for loan losses and noninterest expense are the two major expense categories. The provision is determined by factors that include loan growth, asset quality, net charge-offs and economic conditions. Changing economic conditions caused by inflation, recession, unemployment or other factors beyond the Company’s control have a direct correlation with asset quality, net charge-offs and ultimately the required provision for loan losses. The largest component of noninterest expense for the year ended December 31, 2010 is salaries and employee benefits, comprising 44% of noninterest expenses, followed by occupancy and equipment expense and provision for other real estate owned, each comprising 13% of expenses.
Financial Performance
For the year ended December 31, 2010, net loss totaled $3.6 million compared to net income of $2.1 million in 2009. After the effective dividend on preferred stock, net loss available to common shareholders was $4.5 million, or $1.53 per basic and diluted share compared to net income available to common shareholders of $1.4 million, or $0.49 per basic and diluted share, for the same period in 2009. The decrease in earnings was primarily the result of an $11.1 million increase in credit-related charges (provision for loan losses and provision for other real estate owned), which were partially offset by a $2.1 million increase in net interest income and a $486 thousand increase in noninterest income. Noninterest expense, excluding the provision for other real estate owned, increased $193 thousand when comparing the two periods. Return on assets and return on equity were -0.66% and -6.52%, respectively, for 2010 compared to 0.39% and 4.27% for 2009.
Net interest income increased 11% to $20.4 million for the year ended December 31, 2010, compared to $18.3 million for the same period in 2009. The net interest margin increased 45 basis points to 4.07% for 2010 compared to 3.62% for 2009 while average interest-earning assets were $6.9 million lower when comparing the two periods. The improvement in the net interest margin resulted primarily from a 49 basis point decrease in the cost of funds, driven by lower rates paid on time deposits during 2010.
The provision for loan losses totaled $11.7 million in 2010 compared to $2.3 million in 2009. The higher provision for loan losses was primarily attributable to allocating specific reserves on impaired loans. Management regularly evaluates the loan portfolio, economic conditions and other factors to determine an appropriate allowance for loan losses. As a result of continued weak economic conditions in its market area, the Company focused on aggressively identifying and reserving for problem loans in 2010. The allowance for loan losses increased to $16.0 million or 3.69% of gross loans at December 31,
19
Table of Contents
2010, from $7.1 million or 1.60% of gross loans at December 31, 2009. Based on the most recent evaluation, management believes that the allowance for loan losses was raised to a level that provided prudent coverage of the risks in the loan portfolio at December 31, 2010.
Noninterest income increased 9% to $6.1 million for 2010 compared to $5.6 million for 2009. The increase resulted primarily from higher trust and investment advisory fee income and ATM and check card fee income. Noninterest expense increased 10% to $20.5 million for 2010 compared to $18.7 million for 2009. The increase in noninterest expense was primarily the result of higher provision for other real estate owned that totaled $2.6 million in 2010 compared to $994 thousand in 2009. Excluding the provision for other real estate owned, noninterest expense increased 1% when comparing the same periods.
Core operating results increased 38% to $8.6 million for 2010, up from $6.2 million for 2009. Core operating results are measured by income before taxes plus the provision for loan losses and the provision for other real estate owned. See reconciliation of “Non-GAAP Financial Measures” in this report. Revenues were 11% higher driven by a strong net interest margin and higher fee income. Expense control efforts also contributed to financial performance as noninterest expenses increased only slightly, excluding the provision for other real estate owned for both periods.
Management Outlook
The Company expects no significant change in net interest income, noninterest income or noninterest expense when compared to 2010. Average earning asset balances are expected to remain stable while the net interest margin is expected to decrease slightly from a change in the earning asset mix. Loan balances are expected to continue decreasing over the next 12 months while securities and federal funds sold balances are expected to increase. The Company is not planning for economic conditions to improve significantly in the local market, resulting in low loan demand and deposit growth.
Management believes that the allowance for loan losses has been raised to a level that provides prudent coverage of the risks in the loan portfolio, and that other real estate owned has been charged down to reflect current market conditions. However, the amount of provision for loan losses and provision for other real estate owned will be influenced by collateral values, economic conditions, among other factors. In addition, gains or losses that are generated from the sale of other real estate owned would be impacted by changes in market values.
Non-GAAP Financial Measures
This report refers to the efficiency ratio, which is computed by dividing noninterest expense by the sum of net interest income on a tax-equivalent basis and noninterest income excluding securities gains and losses. This is a non-GAAP financial measure that the Company believes provides investors with important information regarding operational efficiency. Such information is not prepared in accordance with U.S. generally accepted accounting principles (GAAP) and should not be construed as such. Management believes, however, such financial information is meaningful to the reader in understanding operating performance, but cautions that such information not be viewed as a substitute for GAAP. The Company, in referring to its net income, is referring to income under GAAP. The components of the efficiency ratio calculation are summarized in the table below.
| Efficiency Ratio | ||||||||
| (in thousands) | ||||||||
| 2010 | 2009 | |||||||
| Noninterest expense |
$ | 20,542 | $ | 18,703 | ||||
| Less: provision for other real estate owned |
2,640 | 994 | ||||||
| $ | 17,902 | $ | 17,709 | |||||
| Tax-equivalent net interest income |
$ | 20,723 | $ | 18,668 | ||||
| Noninterest income |
6,063 | 5,577 | ||||||
| Less: securities gains (losses) |
(7 | ) | 10 | |||||
| Less: premises and equipment gains (losses) |
— | 9 | ||||||
| Less: other real estate owned gains (losses) |
(19 | ) | — | |||||
| $ | 26,812 | $ | 24,226 | |||||
| Efficiency ratio |
66.77 | % | 73.10 | % | ||||
20
Table of Contents
This report also refers to net interest margin, which is calculated by dividing tax equivalent net interest income by total average earning assets. Because a portion of interest income earned by the Company is nontaxable, the tax equivalent net interest income is considered in the calculation of this ratio. Tax equivalent net interest income is calculated by adding the tax benefit realized from interest income that is nontaxable to total interest income then subtracting total interest expense. The tax rate utilized in calculating the tax benefit for each of 2010 and 2009 is 34%. The reconciliation of tax equivalent net interest income, which is not a measurement under GAAP, to net interest income, is reflected in the table below.
| Reconciliation of Net Interest Income to Tax-Equivalent Net Interest Income |
||||||||
| (in thousands) | ||||||||
| 2010 | 2009 | |||||||
| GAAP measures: |
||||||||
| Interest income - loans |
$ | 24,874 | $ | 24,691 | ||||
| Interest income - investments and other |
2,341 | 2,723 | ||||||
| Interest expense - deposits |
5,903 | 7,753 | ||||||
| Interest expense - other borrowings |
460 | 824 | ||||||
| Interest expense - other |
451 | 507 | ||||||
| Total net interest income |
$ | 20,401 | $ | 18,330 | ||||
| Non-GAAP measures: |
||||||||
| Tax benefit realized on non-taxable interest income - loans |
$ | 47 | $ | 41 | ||||
| Tax benefit realized on non-taxable interest income - municipal securities |
275 | 297 | ||||||
| Total tax benefit realized on non-taxable interest income |
$ | 321 | $ | 338 | ||||
| Total tax-equivalent net interest income |
$ | 20,723 | $ | 18,668 | ||||
This report also refers to core operating results. A reconciliation of this amount, which is not a measurement under GAAP, is shown in the table below.
| Core Operating Results | ||||||||
| (in thousands) | ||||||||
| 2010 | 2009 | |||||||
| Net income (loss) |
$ | (3,603 | ) | $ | 2,149 | |||
| Add: Income tax provision (benefit) |
(2,206 | ) | 755 | |||||
| Add: Provision for loan losses |
11,731 | 2,300 | ||||||
| Add: Provision for other real estate owned |
2,640 | 994 | ||||||
| Core operating results |
$ | 8,562 | $ | 6,198 | ||||
Critical Accounting Policies
General
The Company’s consolidated financial statements and related notes are prepared in accordance with GAAP. The financial information contained within the statements is, to a significant extent, financial information that is based on measures of the financial effects of transactions and events that have already occurred. A variety of factors could affect the ultimate value that is obtained either when earning income, recognizing an expense, recovering an asset or relieving a liability. The Bank uses historical loss factors as one factor in determining the inherent loss that may be present in the loan portfolio. Actual losses could differ significantly from the historical factors used. In addition, GAAP itself may change from one previously acceptable method to another. Although the economics of transactions would be the same, the timing of events that would impact transactions could change. For further information about the Bank’s loans and the allowance for loan losses, see Notes 3 and 4 to the consolidated financial statements, included in Item 8 of this Form 10-K.
Presented below is a discussion of those accounting policies that management believes are the most important (“Critical Accounting Policies”) to the portrayal and understanding of the Bank’s financial condition and results of operations. The Critical Accounting Policies require management’s most difficult, subjective and complex judgments about matters that are inherently uncertain. In the event that different assumptions or conditions were to prevail, and depending upon the severity of such changes, the possibility of materially different financial condition or results of operations is a reasonable likelihood.
21
Table of Contents
Allowance for Loan Losses
The allowance for loan losses is established as losses are estimated to have occurred through a provision for loan losses charged to earnings. Loan losses are charged against the allowance when management believes the uncollectability of a loan balance is confirmed. Subsequent recoveries, if any, are credited to the allowance.
The allowance for loan losses is evaluated on a quarterly basis by management and is based upon management’s periodic review of the collectability of the loans in light of historical experience, the nature and volume of the loan portfolio, adverse situations that may affect the borrower’s ability to repay, estimated value of any underlying collateral and prevailing economic conditions. This evaluation is inherently subjective as it requires estimates that are susceptible to significant revision as more information becomes available.
The allowance consists of specific and general components. The specific allowance is used to individually allocate an allowance for impaired loans. For impaired loans, an allowance is established when the discounted cash flows (or net collateral value or observable market price) of the impaired loan is lower than the carrying value of that loan. A loan is considered impaired when, based on current information and events, it is probable that the Company will be unable to collect all the scheduled payments of principal or interest when due according to the contractual terms of the loan agreement. Factors considered by management in determining impairment include payment status, collateral value (net of selling costs), and the probability of collecting scheduled principal and interest payments when due. Loans that experience insignificant payment delays and payment shortfalls generally are not classified as impaired. Management determines the significance of payment delays and payment shortfalls on a case-by-case basis, taking into consideration all of the circumstances surrounding the loan and the borrower, including the length of the delay, the reasons for the delay, the borrower’s prior payment record, and the amount of the shortfall in relation to the principal and interest owed. Impairment is measured on a loan-by-loan basis for commercial and construction loans by either the present value of expected future cash flows discounted at the loan’s effective interest rate, the loan’s obtainable market price, or the fair value of the collateral, net of selling costs, if the loan repayment is collateral dependent. The Company does not separately identify individual consumer and residential loans for impairment disclosures.
The general component covers loans that are not considered impaired and is based on historical loss experience adjusted for qualitative factors. These loans are segregated by loan type and allowance factors are assigned by management based on delinquencies, loss history, national and local economic trends, effects of the changes in the value of underlying collateral, trends in volume and terms of loans, effects of changes in lending policy, the experience and depth of management, concentrations of credit, quality of the loan review system and the effect of external factors such as competition and regulatory requirements. The factors assigned differ by loan type. The general allowance recognizes potential losses whose impact on the portfolio has yet to be recognized by a specific allowance. Allowance factors and the overall size of the allowance may change from period to period based on management’s assessment of the above described factors and the relative weights given to each factor. For further information regarding the allowance for loan losses see Notes 1 and 4 to the Consolidated Financial Statements
Lending Policies
General
The principal risk associated with each of the categories of loans in the Bank’s portfolio is the creditworthiness of its borrowers. Within each category, such risk is increased or decreased, depending on prevailing economic conditions. The risk associated with real estate mortgage loans, commercial and consumer loans varies, based on economic conditions, fluctuations in the value of real estate and other conditions that affect the ability of borrowers to repay indebtedness. The risk associated with real estate construction loans varies, based on the supply and demand for the type of real estate under construction.
In an effort to manage risk, the Bank’s loan policy gives loan amount approval limits to individual loan officers based on their position within the Bank and level of experience. The Management Loan Committee can approve secured loans up to $1.5 million and unsecured loans up to $1.2 million. The Management Loan Committee consists of the Chief Executive Officer (CEO), Executive Vice President (EVP) – Loan Administration and the Senior Vice President (SVP) – Credit Administration. The Board Loan Committee approves all loans which exceed the authority of the Management Loan Committee. The Board Loan Committee consists of five non-management directors. The Board Loan Committee approves the Bank’s Loan Policy and reviews loans that have been charged-off. It also reviews the loan watch list, concentrations of credit and other management reports. The Board Loan Committee meets on a monthly basis and the Chairman of the Committee then reports to the Board of Directors.
Residential loan originations are primarily generated by Bank loan officer solicitations, referrals by real estate professionals and customers. Commercial real estate loan originations are obtained through broker referrals, direct solicitation of developers and continued business from customers. All completed loan applications are reviewed by the Bank’s loan officers. As part of the application process, information is obtained concerning the income, financial condition, employment and credit history of the applicant. If commercial real estate is involved, information is also obtained concerning cash flow available for debt service. Loan quality is analyzed based on the Bank’s experience and credit underwriting guidelines as well as the guidelines issued by the purchasers of loans, depending on the type of loan involved. Real estate collateral is appraised by independent fee appraisers who have been pre-approved by the Board Loan Committee.
22
Table of Contents
In the normal course of business, the Bank makes various commitments and incurs certain contingent liabilities which are disclosed but not reflected in its financial statements, including commitments to extend credit. At December 31, 2010, commitments to extend credit, stand-by letters of credit and rate lock commitments totaled $60.4 million.
Commercial Business Lending
Commercial business loans generally have a higher degree of risk than loans secured by real estate, but typically have higher yields. Commercial business loans typically are made on the basis of the borrower’s ability to make repayment from cash flow from its business and are secured by business assets, such as accounts receivable, equipment and inventory. As a result, the availability of funds for the repayment of commercial business loans is substantially dependent on the success of the business itself. Furthermore, the collateral for commercial business loans may depreciate over time and generally cannot be appraised with as much precision as residential real estate. To manage these risks, the Bank generally obtains appropriate collateral and personal guarantees from the borrower’s principal owners and monitors the financial condition of its business borrowers. At December 31, 2010, commercial loans not secured by real estate totaled $37.4 million, or 9% of the total loan portfolio, as compared to $48.7 million, or 11% at December 31, 2009.
Commercial Real Estate Lending
Commercial real estate loans are secured by various types of commercial real estate typically in the Bank’s market area, including multi-family residential buildings, commercial buildings and offices, hotels, small shopping centers, farms and churches. Commercial real estate loan originations are obtained through broker referrals, direct solicitation of developers and continued business from customers. At December 31, 2010, commercial real estate loans aggregated $207.4 million, or 48% of the Bank’s gross loans, as compared to $201.3 million, or 45% at December 31, 2009. In its underwriting of commercial real estate, the Bank may lend, under federal regulation, up to 85% of the secured property’s appraised value, although the Bank’s loan to original appraised value ratio on such properties is typically 80% or less. The valuation of commercial collateral is provided by independent fee appraisers who have been approved by the Board Loan Committee. Commercial real estate lending entails significant additional risk, compared with residential mortgage lending. Commercial real estate loans typically involve larger loan balances concentrated with single borrowers or groups of related borrowers. Additionally, the payment experience on loans secured by income producing properties is typically dependent on the successful operation of a business or a real estate project and thus may be subject, to a greater extent, to adverse conditions in the real estate market or in the economy, in general. The Bank’s commercial real estate loan underwriting criteria require an examination of debt service coverage ratios, the borrower’s creditworthiness, prior credit history and reputation. The Bank typically requires personal guarantees of the borrowers’ principal owners and carefully evaluates the location and environmental condition of the real estate collateral.
Construction Lending
The Bank makes local construction loans, including residential and land acquisition and development loans. These loans are secured by the property under construction and the underlying land for which the loan was obtained. Construction and land development loans outstanding at December 31, 2010 and 2009 were $52.6 million, or 12% of gross loans, and $55.1 million, or 12% of gross loans, respectively. The majority of these loans have an average life of approximately one year and reprice monthly as key rates change. Construction lending entails significant additional risks, compared with residential mortgage lending. Construction loans often involve larger loan balances concentrated with single borrowers or groups of related borrowers. Another risk involved in construction lending is attributable to the fact that loan funds are advanced upon the security of the land or property under construction, which value is estimated prior to the completion of construction. Thus, it is more difficult to evaluate accurately the total loan funds required to complete a project and related loan-to-value ratios. To mitigate the risks associated with construction lending, the Bank generally limits loan amounts to 80% of appraised value, in addition to analyzing the creditworthiness of its borrowers. The Bank typically obtains a first lien on the property as security for its construction loans, typically requires personal guarantees from the borrower’s principal owners, and monitors the progress of the construction project during the draw period.
Residential Real Estate Lending
Residential lending activity may be generated by Bank loan officer solicitations, referrals by real estate professionals and existing or new bank customers. Loan applications are taken by a Bank loan officer. As part of the application process, information is gathered concerning income, employment and credit history of the applicant. Residential mortgage loans generally are made on the basis of the borrower’s ability to make repayment from employment and other income and are secured by real estate whose value tends to be readily ascertainable. In addition to the Bank’s underwriting standards, loan quality may be analyzed based on guidelines issued by a secondary market investor. The valuation of residential collateral is provided by independent fee appraisers who have been approved by the Board Loan Committee. Typically, the Bank originates fixed rate mortgage loans with the intent to sell to correspondent lenders. Depending on the financial goals of the Company, the Bank occasionally originates and retains these loans. At December 31, 2010, $121.5 million, or 28% of the Bank’s loan portfolio consisted of one-to-four family loans secured by residential real estate, as compared to $118.7 million, or 27%, at December 31, 2009.
In connection with residential real estate loans, the Bank requires title insurance, hazard insurance and, if required, flood insurance. Flood determination letters with life of loan tracking are obtained on all federally related transactions with improvements serving as security for the transaction. The Bank requires escrows for real estate taxes and insurance for secondary market loans.
23
Table of Contents
The Company does not participate in sub-prime lending practices so issues in the residential mortgage market from sub-prime lending are not expected to have a direct impact on earnings. Nevertheless, the Company is subject to risks associated with general economic and business conditions in its market area, as well as the condition of the regional residential mortgage market, each of which has been impacted by sub-prime lending and related issues.
Consumer Lending
The Bank offers various secured and unsecured consumer loans, including unsecured personal loans and lines of credit, automobile loans, deposit account loans and installment and demand loans. At December 31, 2010, consumer loans, including deposit overdraft balances, were $12.9 million, or 3% of gross loans, as compared to $13.8 million, or 3%, at December 31, 2009. Consumer loans may entail greater risk than residential mortgage loans, particularly in the case of consumer loans which are unsecured, such as lines of credit, or secured by rapidly depreciable assets such as automobiles. In such cases, any repossessed collateral for a defaulted consumer loan may not provide an adequate source of repayment of the outstanding loan balance as a result of the greater likelihood of damage, loss or depreciation. Consumer loan collections are dependent on the borrower’s continuing financial stability, and thus are more likely to be adversely affected by job loss, divorce, illness or personal bankruptcy. Furthermore, the application of various federal and state laws, including federal and state bankruptcy and insolvency laws, may limit the amount which can be recovered on such loans.
The underwriting standards employed by the Bank for consumer loans include a determination of the applicant’s payment history on other debts and an assessment of ability to meet existing obligations and payments on a proposed loan. The stability of the applicant’s monthly income may be determined by verification of gross monthly income from primary employment, and additionally from any verifiable secondary income. Although creditworthiness of the applicant is of primary consideration, the underwriting process also includes an analysis of the value of the collateral in relation to the proposed loan amount.
Results of Operations
General
Net interest income represents the primary source of earnings for the Company. Net interest income equals the amount by which interest income on interest-earning assets, predominantly loans and securities, exceeds interest expense on interest-bearing liabilities, including deposits, other borrowings and trust preferred securities. Changes in the volume and mix of interest-earning assets and interest-bearing liabilities, as well as their respective yields and rates, are the components that impact the level of net interest income. The net interest margin is calculated by dividing tax-equivalent net interest income by average earning assets. The provision for loan losses, noninterest income and noninterest expense are the other components that determine net income. Noninterest income and expense primarily consists of income from service charges on deposit accounts; fees charged for other customer services, including trust and investment advisory services; gains and losses from the sale of assets, including loans held for sale, securities, premises and equipment and other real estate owned; general and administrative expenses; and income tax expense.
For the year ended December 31, 2010, net loss totaled $3.6 million. After the effective dividend and accretion on preferred stock, net loss available to common shareholders was $4.5 million, or $1.53 per basic and diluted share compared to net income of $1.4 million, or $0.49 per basic and diluted share, for the same period in 2009. The decrease in earnings was primarily the result of an $11.1 million increase in credit-related charges (provision for loan losses and provision for other real estate owned), which were partially offset by a $2.1 million increase in net interest income and a $486 thousand increase in noninterest income. Noninterest expense, excluding the provision for other real estate owned, increased $193 thousand when comparing the two periods. Return on assets was -0.66% for the year ended December 31, 2010 compared to 0.39% for the same period in 2009, and return on equity was -6.52% for the year ended December 31, 2010 compared to 4.27% for the same period in 2009.
Net Interest Income
Net interest income increased 11% to $20.4 million for the year ended December 31, 2010, compared to $18.3 million for the same period in 2009. The net interest margin was 45 basis points higher while average interest-earning assets were $6.9 million lower when comparing the periods. The net interest margin for 2010 was 4.07% compared to 3.62% for 2009. In 2009, net interest income totaled $18.3 million, a slight increase from $18.1 million for the same period in 2008.
The net interest margin was 4.07% in 2010, 3.62% in 2009 and 3.63% in 2008. Interest income as a percent of average earning assets was 5.41% in 2010, 5.38% in 2009 and 6.15% in 2008. Interest expense as a percent of average interest-bearing assets was 1.34% in 2010, 1.76% in 2009 and 2.52% in 2008. The interest rate spread was 3.73% in 2010, 3.21% in 2009 and 3.12% in 2008.
The Company expects no significant change in net interest income in 2011 when compared to 2010. Average earning asset balances are expected to remain stable while the net interest margin is expected to decrease slightly from a change in the earning asset mix. Loan balances are expected to continue decreasing over the next 12 months while securities and federal funds sold balances are expected to increase. The Company is not planning for economic conditions to improve significantly in the local market, resulting in low loan demand and deposit growth.
24
Table of Contents
The following table provides information on average interest-earning assets and interest-bearing liabilities for the years ended December 31, 2010, 2009 and 2008, as well as amounts and rates of tax equivalent interest earned and interest paid. The volume and rate analysis table analyzes the changes in net interest income for the periods broken down by their rate and volume components.
| Average Balances, Income and Expense, Yields and Rates | ||||||||||||||||||||||||||||||||||||
| (dollars in thousands) Years Ending December 31, |
||||||||||||||||||||||||||||||||||||
| 2010 | 2009 | 2008 | ||||||||||||||||||||||||||||||||||
| Interest | Interest | Interest | ||||||||||||||||||||||||||||||||||
| Assets | Average Balance |
Income/ Expense |
Yield/ Rate |
Average Balance |
Income/ Expense |
Yield/ Rate |
Average Balance |
Income/ Expense |
Yield/ Rate |
|||||||||||||||||||||||||||
| Interest-bearing deposits in other banks |
$ | 6,273 | $ | 15 | 0.24 | % | $ | 2,037 | $ | 1 | 0.02 | % | $ | 2,055 | $ | 34 | 1.66 | % | ||||||||||||||||||
| Securities: |
||||||||||||||||||||||||||||||||||||
| Taxable |
42,678 | 1,722 | 4.04 | % | 45,894 | 2,095 | 4.39 | % | 39,935 | 2,051 | 5.14 | % | ||||||||||||||||||||||||
| Tax-exempt (1) |
13,681 | 819 | 5.99 | % | 14,125 | 873 | 6.18 | % | 13,469 | 827 | 6.14 | % | ||||||||||||||||||||||||
| Restricted |
3,338 | 58 | 1.72 | % | 2,862 | 46 | 1.61 | % | 3,318 | 133 | 4.00 | % | ||||||||||||||||||||||||
| Total securities |
59,697 | 2,599 | 4.35 | % | 62,881 | 3,014 | 4.79 | % | 56,722 | 3,011 | 5.31 | % | ||||||||||||||||||||||||
| Loans: (2) |
||||||||||||||||||||||||||||||||||||
| Taxable |
439,942 | 24,785 | 5.63 | % | 446,643 | 24,611 | 5.51 | % | 446,520 | 28,051 | 6.28 | % | ||||||||||||||||||||||||
| Tax-exempt (1) |
2,145 | 136 | 6.34 | % | 2,004 | 121 | 6.02 | % | 2,141 | 128 | 6.01 | % | ||||||||||||||||||||||||
| Total loans |
442,087 | 24,921 | 5.64 | % | 448,647 | 24,732 | 5.51 | % | 448,661 | 28,179 | 6.28 | % | ||||||||||||||||||||||||
| Federal funds sold |
1,167 | 2 | 0.19 | % | 2,582 | 5 | 0.17 | % | 682 | 11 | 1.62 | % | ||||||||||||||||||||||||
| Total earning assets |
509,224 | 27,537 | 5.41 | % | 516,147 | 27,752 | 5.38 | % | 508,120 | 31,235 | 6.15 | % | ||||||||||||||||||||||||
| Less: allowance for loan losses |
(7,836 | ) | (6,621 | ) | (4,547 | ) | ||||||||||||||||||||||||||||||
| Total nonearning assets |
43,752 | 40,072 | 35,452 | |||||||||||||||||||||||||||||||||
| Total assets |
$ | 545,140 | $ | 549,598 | $ | 539,025 | ||||||||||||||||||||||||||||||
| Liabilities and Shareholders’ Equity |
||||||||||||||||||||||||||||||||||||
| Interest-bearing deposits: |
||||||||||||||||||||||||||||||||||||
| Checking |
$ | 44,641 | $ | 231 | 0.52 | % | $ | 38,206 | $ | 190 | 0.50 | % | $ | 56,977 | $ | 778 | 1.37 | % | ||||||||||||||||||
| Money market accounts |
33,788 | 274 | 0.81 | % | 23,690 | 255 | 1.08 | % | 16,636 | 304 | 1.83 | % | ||||||||||||||||||||||||
| Savings accounts |
81,394 | 478 | 0.59 | % | 77,854 | 539 | 0.69 | % | 87,928 | 1,233 | 1.40 | % | ||||||||||||||||||||||||
| Certificates of deposit: |
||||||||||||||||||||||||||||||||||||
| Less than $100,000 |
96,251 | 2,488 | 2.59 | % | 104,464 | 3,391 | 3.25 | % | 98,231 | 3,820 | 3.89 | % | ||||||||||||||||||||||||
| Greater than $100,000 |
82,625 | 2,091 | 2.53 | % | 78,280 | 2,509 | 3.21 | % | 78,859 | 3,190 | 4.04 | % | ||||||||||||||||||||||||
| Brokered deposits |
36,294 | 341 | 0.94 | % | 58,995 | 869 | 1.47 | % | 28,019 | 974 | 3.48 | % | ||||||||||||||||||||||||
| Total interest-bearing deposits |
374,993 | 5,903 | 1.57 | % | 381,489 | 7,753 | 2.03 | % | 366,650 | 10,299 | 2.81 | % | ||||||||||||||||||||||||
| Federal funds purchased |
1,715 | 12 | 0.73 | % | 3,692 | 37 | 1.01 | % | 4,575 | 112 | 2.44 | % | ||||||||||||||||||||||||
| Company obligated mandatorily redeemable capital securities |
9,279 | 439 | 4.73 | % | 9,279 | 470 | 5.07 | % | 9,997 | 642 | 6.42 | % | ||||||||||||||||||||||||
| Other borrowings |
19,478 | 460 | 2.36 | % | 24,683 | 824 | 3.34 | % | 41,241 | 1,740 | 4.22 | % | ||||||||||||||||||||||||
| Total interest-bearing liabilities |
405,465 | 6,814 | 1.68 | % | 419,143 | 9,084 | 2.17 | % | 422,463 | 12,793 | 3.03 | % | ||||||||||||||||||||||||
| Noninterest-bearing liabilities |
||||||||||||||||||||||||||||||||||||
| Demand deposits |
80,696 | 75,570 | 74,883 | |||||||||||||||||||||||||||||||||
| Other liabilities |
3,737 | 4,574 | 2,019 | |||||||||||||||||||||||||||||||||
| Total liabilities |
489,898 | 499,287 | 499,365 | |||||||||||||||||||||||||||||||||
| Shareholders’ equity |
55,242 | 50,311 | 39,660 | |||||||||||||||||||||||||||||||||
| Total liabilities and shareholders’ equity |
$ | 545,140 | $ | 549,598 | $ | 539,025 | ||||||||||||||||||||||||||||||
| Net interest income |
$ | 20,723 | $ | 18,668 | $ | 18,442 | ||||||||||||||||||||||||||||||
| Interest rate spread |
3.73 | % | 3.21 | % | 3.12 | % | ||||||||||||||||||||||||||||||
| Interest expense as a percent of average earning assets |
1.34 | % | 1.76 | % | 2.52 | % | ||||||||||||||||||||||||||||||
| Net interest margin |
4.07 | % | 3.62 | % | 3.63 | % |
| (1) | Income and yields are reported on a taxable-equivalent basis assuming a federal tax rate of 34%. The tax-equivalent adjustment was $322 thousand, $338 thousand and $322 thousand for 2010, 2009 and 2008, respectively. |
| (2) | Loans placed on a non-accrual status are reflected in the balances. |
25
Table of Contents
| Volume and Rate (in thousands) Years Ending December 31, |
||||||||||||||||||||||||
| 2010 | 2009 | |||||||||||||||||||||||
| Volume Effect |
Rate Effect |
Change in Income/ Expense |
Volume Effect |
Rate Effect |
Change in Income/ Expense |
|||||||||||||||||||
| Interest-bearing deposits in other banks |
$ | 2 | $ | 12 | $ | 14 | $ | (1 | ) | $ | (32 | ) | $ | (33 | ) | |||||||||
| Loans |
(383 | ) | 557 | 174 | 8 | (3,448 | ) | (3,440 | ) | |||||||||||||||
| Loans, tax-exempt |
9 | 6 | 15 | (7 | ) | — | (7 | ) | ||||||||||||||||
| Securities |
(175 | ) | (198 | ) | (373 | ) | 2,007 | (1,963 | ) | 44 | ||||||||||||||
| Securities, tax-exempt |
(27 | ) | (27 | ) | (54 | ) | 41 | 5 | 46 | |||||||||||||||
| Securities, restricted |
9 | 3 | 12 | (16 | ) | (71 | ) | (87 | ) | |||||||||||||||
| Federal funds sold |
(3 | ) | — | (3 | ) | (9 | ) | 3 | (6 | ) | ||||||||||||||
| Total earning assets |
$ | (568 | ) | $ | 353 | $ | (215 | ) | $ | 2,023 | $ | (5,506 | ) | $ | (3,483 | ) | ||||||||
| Checking |
$ | 33 | $ | 8 | $ | 41 | $ | (201 | ) | $ | (387 | ) | $ | (588 | ) | |||||||||
| Money market accounts |
44 | (25 | ) | 19 | (1,443 | ) | 1,394 | (49 | ) | |||||||||||||||
| Savings accounts |
28 | (89 | ) | (61 | ) | (128 | ) | (566 | ) | (694 | ) | |||||||||||||
| Certificates of deposits: |
||||||||||||||||||||||||
| Less than $100,000 |
(252 | ) | (651 | ) | (903 | ) | 270 | (699 | ) | (429 | ) | |||||||||||||
| Greater than $100,000 |
148 | (566 | ) | (418 | ) | (24 | ) | (657 | ) | (681 | ) | |||||||||||||
| Brokered deposits |
(272 | ) | (256 | ) | (528 | ) | (105 | ) | — | (105 | ) | |||||||||||||
| Federal funds purchased |
(16 | ) | (9 | ) | (25 | ) | (19 | ) | (56 | ) | (75 | ) | ||||||||||||
| Company obligated mandatorily redeemable capital securities |
— | (31 | ) | (31 | ) | (44 | ) | (128 | ) | (172 | ) | |||||||||||||
| Other borrowings |
(152 | ) | (212 | ) | (364 | ) | (603 | ) | (313 | ) | (916 | ) | ||||||||||||
| Total interest-bearing liabilities |
$ | (439 | ) | $ | (1,831 | ) | $ | (2,270 | ) | $ | (2,297 | ) | $ | (1,412 | ) | $ | (3,709 | ) | ||||||
| Change in net interest income |
$ | (129 | ) | $ | 2,184 | $ | 2,055 | $ | 3,872 | $ | (3,646 | ) | $ | 226 | ||||||||||
Provision for Loan Losses
The provision for loan losses represents management’s analysis of the existing loan portfolio and related credit risks. The provision for loan losses is based upon management’s estimate of the amount required to maintain an adequate allowance for loan losses reflective of the risks in the loan portfolio. The provision for loan losses increased to $11.7 million in 2010 compared to $2.3 million in 2009. The higher provision for loan losses was primarily attributable to allocating specific reserves on impaired loans. Management regularly evaluates the loan portfolio, economic conditions and other factors to determine an appropriate allowance for loan losses. As a result of continued weak economic conditions in its market area, the Company focused on aggressively identifying and reserving for problem loans in 2010. At December 31, 2009, the provision for loan losses totaled $2.3 million compared to $2.0 million for the year ended December 31, 2008. The increase in the provision for loan losses during 2009 was a result of higher specific reserves on impaired loans, higher net charge-offs, less favorable economic conditions and lower collateral values during 2009 when compared to 2008.
Management believes that the allowance for loan losses has been raised to a level that provides prudent coverage of the risks in the loan portfolio. However, the amount of provision for loan losses will be influenced by collateral values, economic conditions, net charge-offs and the regulatory environment, among other factors.
Noninterest Income
Noninterest income increased 9% to $6.1 million for the year ended December 31, 2010 from $5.6 million for the same period in 2009. ATM and check card fees increased 20% to $1.4 million for 2010, compared to $1.2 million for 2009. Fee income from trust and investment advisory services increased 10% to $1.2 million for 2010, compared to $1.1 million for 2009. This increase was attributable to more fees generated from higher average assets under management during 2010 when compared to 2009. In 2009, noninterest income decreased 6% to $5.6 million from $6.0 million in 2008.
Recent overdraft protection legislation, which was effective after August 15, 2010, did not have a significant impact on overdraft income during the last half of the third quarter and during the fourth quarter of 2010. As a result, it does not appear that a considerable change in noninterest income will occur for 2011.
26
Table of Contents
Noninterest Expense
Noninterest expense increased 10% to $20.5 million for the year ended December 31, 2010, compared to $18.7 million for the same period in 2009. The increase in noninterest expense was primarily the result of higher provisions for other real estate owned. The provision for other real estate owned totaled $2.6 million for the year ended December 31, 2010 compared to $994 thousand in 2009. In 2009, noninterest expense increased 17% over 2008, primarily as a result of expenses related to other real estate owned and higher FDIC assessments.
The Company expects no significant change in noninterest expense, excluding provision for other real estate owned, for 2011. The Company plans to contain noninterest expense as part of its efforts to improve profitability. Management believes that other real estate owned has been charged down to reflect current market conditions. However, the amount of provision for other real estate owned for future periods will be influenced by factors including collateral values and economic conditions. In addition, gains or losses that are generated from the sale of other real estate owned would be impacted by changes in market values.
Income Taxes
The Company’s income tax provision differed from the amount of income tax determined by applying the U.S. federal income tax rate to pretax income for the years ended December 31, 2010 and 2009. The difference was a result of net permanent tax deductions, primarily comprised of tax-exempt interest income. For a more detailed discussion of the Company’s tax calculation, see Note 9 to the consolidated financial statements, included in Item 8 of this Form 10-K.
Financial Condition
General
Total assets were $544.6 million at December 31, 2010 compared to $552.7 million at December 31, 2009. The Company’s trust and investment advisory group had assets under management of $205.5 million at December 31, 2010 compared to $208.8 million at December 31, 2009. Assets managed by the trust and investment advisory group are not held on the Company’s balance sheet.
Management expects loan balances to continue decreasing over the next 12 months while securities and federal funds sold are expected to increase. The Company is not planning for economic activity in its market area to improve significantly during 2011, and as a result, expects low loan demand and deposit growth.
Loans
The Bank is an active lender with a loan portfolio that includes commercial and residential real estate loans, commercial loans, consumer loans, construction loans and home equity loans. The Bank’s lending activity is concentrated on individuals, small and medium-sized businesses and local governmental entities in its market area. As a provider of community-oriented financial services, the Bank does not attempt to geographically diversify its loan portfolio by undertaking significant lending activity outside its market area. The Bank’s loan portfolio is summarized in the table below for the periods indicated.
| Loan Portfolio | ||||||||||||||||||||
| (in thousands) | ||||||||||||||||||||
| At December 31, | ||||||||||||||||||||
| 2010 | 2009 | 2008 | 2007 | 2006 | ||||||||||||||||
| Commercial, financial, and agricultural |
$ | 39,796 | $ | 52,276 | $ | 56,354 | $ | 55,172 | $ | 53,004 | ||||||||||
| Real estate - construction |
52,591 | 55,057 | 63,744 | 73,478 | 60,913 | |||||||||||||||
| Real estate - mortgage: |
||||||||||||||||||||
| Residential (1-4 family) |
121,506 | 118,675 | 116,821 | 106,378 | 112,323 | |||||||||||||||
| Secured by farmland |
6,207 | 1,281 | 1,702 | 1,789 | 2,507 | |||||||||||||||
| Other real estate loans |
201,164 | 200,001 | 196,163 | 192,616 | 168,754 | |||||||||||||||
| Consumer |
12,879 | 13,776 | 16,202 | 18,778 | 24,655 | |||||||||||||||
| All other loans |
887 | 2,169 | 991 | 1,376 | 4,973 | |||||||||||||||
| Total loans |
$ | 435,030 | $ | 443,235 | $ | 451,977 | $ | 449,587 | $ | 427,129 | ||||||||||
| Less: allowance for loan losses |
16,036 | 7,106 | 5,650 | 4,207 | 3,978 | |||||||||||||||
| Loans, net of allowance for loan losses |
$ | 418,994 | $ | 436,129 | $ | 446,327 | $ | 445,380 | $ | 423,151 | ||||||||||
27
Table of Contents
The Company has a credit concentration in mortgage loans on real estate. These loans totaled $381.5 million, or 88% of total loans and $375.0 million, or 85% of total loans at December 31, 2010 and 2009, respectively. Although the Company believes that its underwriting standards are generally conservative, the ability of its borrowers to meet their mortgage obligations is influenced by certain factors including local economic conditions.
The Company has a concentration of credit risk within the loan portfolio involving loans secured by hotels. This concentration totaled $41.6 million at December 31, 2010, representing 86% of total shareholders’ equity and 10% of total loans. At December 31, 2009, this concentration totaled $42.9 million representing 78% of total shareholders’ equity and 10% of total loans. These loans are included in other real estate loans in the above table. The Company experienced no loan losses related to this identified risk during the years ended December 31, 2009 and 2008 and charged down $147 thousand related to these loans during the year ended December 31, 2010. The Company monitors risk in this concentration by performing interest rate and vacancy rate stress tests on a quarterly basis.
There was no category of loans that exceeded 10% of outstanding loans at December 31, 2010 that were not disclosed in the above table. The following table sets forth the maturities of the loan portfolio at December 31, 2010:
| Remaining Maturities of Selected Loans | ||||||||||||||||
| (in thousands) | ||||||||||||||||
| At December 31, 2010 | ||||||||||||||||
| Less than One Year |
One to Five Years |
Greater than Five Years |
Total | |||||||||||||
| Commercial, financial, and agricultural |
$ | 24,863 | $ | 14,194 | $ | 739 | $ | 39,796 | ||||||||
| Real estate construction |
31,437 | 19,496 | 1,658 | 52,591 | ||||||||||||
| Real estate - mortgage: |
||||||||||||||||
| Residential (1-4 family) |
27,951 | 57,431 | 36,124 | 121,506 | ||||||||||||
| Secured by farmland |
164 | 5,950 | 93 | 6,207 | ||||||||||||
| Other real estate loans |
39,352 | 157,374 | 4,438 | 201,164 | ||||||||||||
| Consumer |
1,118 | 11,363 | 398 | 12,879 | ||||||||||||
| All other loans |
248 | 252 | 387 | 887 | ||||||||||||
| Total loans |
$ | 125,133 | $ | 266,060 | $ | 43,837 | $ | 435,030 | ||||||||
| For maturities over one year: |
||||||||||||||||
| Fixed rates |
$ | 243,069 | ||||||||||||||
| Variable rates |
66,828 | |||||||||||||||
| $ | 309,897 | |||||||||||||||
Asset Quality
Management classifies as nonperforming assets non-accrual loans and other real estate owned (OREO). OREO represents real property taken by the Bank either through foreclosure or through a deed in lieu thereof from the borrower. OREO is recorded at the lower of cost or market, less estimated selling costs, and is actively marketed by the Bank through brokerage channels. The Bank had $4.0 million in other real estate owned, net of valuation allowance, at December 31, 2010 and $6.3 million at December 31, 2009. The valuation allowance for other real estate owned totaled $3.3 million at December 31, 2010 compared to $994 thousand at December 31, 2009.
Nonperforming assets were $14.8 million and $14.5 million at December 31, 2010 and 2009, representing 2.71% and 2.63% of total assets, respectively. Nonperforming assets included $10.8 million in non-accrual loans and $4.0 million in OREO.
The higher levels of nonperforming assets in 2010 and 2009 were primarily attributable to weaker local economic conditions that negatively impacted the ability of certain borrowers to service debt. Borrowers that have not been able to meet their debt requirements are primarily business customers involved in retail operations and residential real estate development. At December 31, 2010, 60% of nonperforming assets related to residential development loans, 35% related to commercial real estate loans and 5% related to residential real estate loans. Nonperforming assets could increase due to other potential problem loans identified by management. Other potential problem loans are defined as performing loans that possess certain risks, including the borrower’s ability to pay and the collateral value securing the loan, that management has identified that may result in the loans not being repaid in accordance with their terms. At December 31, 2010, other potential problem loans totaled $73.3 million, of which $39.6 million are currently performing and are generally considered well-secured. Other potential problem loans totaled $36.8 million at December 31, 2009. The increase in other potential problem loans during 2010 was due to management’s decision to downgrade certain loans. These loans were primarily downgraded because of declining trends in the borrowers’ financial condition. The amount of other potential problem loans in future periods will be dependent on economic conditions.
The allowance for loan losses represents management’s analysis of the existing loan portfolio and related credit risks. The provision for loan losses is based upon management’s estimate of the amount required to maintain an adequate allowance for loan losses reflective of the risks in the loan portfolio. The allowance for loan losses totaled $16.0 million at December 31, 2010 and $7.1 million at December 31, 2009, representing 3.69% and 1.60% of total loans, respectively.
28
Table of Contents
Impaired loans totaled $43.9 million and $8.1 million at December 31, 2010 and 2009, respectively. The related allowance for loan losses provided for these loans totaled $8.6 million and $1.5 million at December 31, 2010 and 2009. The average recorded investment in impaired loans during 2010 and 2009 was $22.3 million and $11.2 million, respectively. Included in the impaired loans total at December 31, 2010 are loans classified as troubled debt restructurings (TDRs) totaling $14.4 million. These loans represent situations in which a modification to the contractual interest rate or repayment structure has been granted to address a financial hardship. TDRs totaled 3% of the loan portfolio and consisted mainly of commercial real estate loans that are currently performing under the restructured terms. TDRs are not considered nonperforming assets.
Non-accrual loans excluded from impaired loan disclosure amounted to $2 thousand, $196 thousand and $36 thousand at December 31, 2010, 2009 and 2008, respectively. If interest on these loans had been accrued, such income would have approximated $6 thousand and $2 thousand for 2009 and 2008, respectively. For 2010, there was no interest that would have been accrued on these loans. Loan payments received on non-accrual loans are applied to principal. When a loan is placed on non-accrual status there are several negative implications. First, all interest accrued but unpaid at the time of the classification is deducted from the interest income totals for the Bank. Second, accruals of interest are discontinued until it becomes certain that both principal and interest can be repaid. Third, there may be actual losses that necessitate additional provisions for credit losses charged against earnings. These loans were included in the nonperforming loan totals listed below.
Management believes, based upon its review and analysis, that the Bank has sufficient reserves to cover losses inherent within the loan portfolio. For each period presented, the provision for loan losses charged to expense was based on management’s judgment after taking into consideration all factors connected with the collectability of the existing portfolio. Management considers loss experience over a one-year period, economic conditions, asset quality, collateral values and other relevant factors when evaluating the loan portfolio. There can be no assurance, however, that additional provisions for loan losses will not be required in the future, including as a result of changes in the economic assumptions underlying management’s estimates and judgments, adverse developments in the economy, on a national basis or in the Company’s market area, or changes in the circumstances of particular borrowers. For further discussion regarding the allowance for loan losses, see “Critical Accounting Policies” above. The following table shows a detail of loans charged-off, recovered and the changes in the allowance for loan losses.
| Allowance for Loan Losses | ||||||||||||||||||||
| (in thousands) | ||||||||||||||||||||
| At December 31, | ||||||||||||||||||||
| 2010 | 2009 | 2008 | 2007 | 2006 | ||||||||||||||||
| Balance, beginning of period |
$ | 7,106 | $ | 5,650 | $ | 4,207 | $ | 3,978 | $ | 3,528 | ||||||||||
| Loans charged-off: |
||||||||||||||||||||
| Commercial, financial and agricultural |
387 | 128 | 198 | 44 | 12 | |||||||||||||||
| Real estate-construction |
1,225 | 333 | 111 | — | — | |||||||||||||||
| Real estate-mortgage |
||||||||||||||||||||
| Residential (1-4 family) |
132 | 351 | 149 | — | — | |||||||||||||||
| Non-farm, non-residential |
978 | 12 | — | — | — | |||||||||||||||
| Secured by farmland |
— | — | — | — | — | |||||||||||||||
| Consumer |
340 | 318 | 346 | 338 | 236 | |||||||||||||||
| All other loans |
— | — | — | — | — | |||||||||||||||
| Total loans charged off |
$ | 3,062 | $ | 1,142 | $ | 804 | $ | 382 | $ | 248 | ||||||||||
| Recoveries: |
||||||||||||||||||||
| Commercial, financial and agricultural |
$ | 1 | $ | — | $ | — | $ | — | $ | — | ||||||||||
| Real estate-construction |
— | — | — | — | — | |||||||||||||||
| Real estate-mortgage |
||||||||||||||||||||
| Residential (1-4 family) |
8 | — | — | — | — | |||||||||||||||
| Non-farm, non-residential |
— | — | — | — | — | |||||||||||||||
| Secured by farmland |
— | — | — | — | — | |||||||||||||||
| Consumer |
252 | 298 | 253 | 213 | 320 | |||||||||||||||
| All other loans |
— | — | — | — | — | |||||||||||||||
| Total recoveries |
$ | 261 | $ | 298 | $ | 253 | $ | 213 | $ | 320 | ||||||||||
| Net charge-offs (recoveries) |
$ | 2,801 | $ | 844 | $ | 551 | $ | 169 | $ | (72 | ) | |||||||||
| Provision for loan losses |
11,731 | 2,300 | 1,994 | 398 | 378 | |||||||||||||||
| Balance, end of period |
$ | 16,036 | $ | 7,106 | $ | 5,650 | $ | 4,207 | $ | 3,978 | ||||||||||
29
Table of Contents
The following table shows the balance and percentage of the Bank’s allowance for loan losses allocated to each major category of loans.
| Allocation of Allowance for Loan Losses (dollars in thousands) |
||||||||||||||||||||||||||||||||||||||||
| At December 31, | ||||||||||||||||||||||||||||||||||||||||
| 2010 | 2009 | 2008 | 2007 | 2006 | ||||||||||||||||||||||||||||||||||||
| Commercial, financial and agricultural |
$ | 858 | 14.50 | % | $ | 1,167 | 16.42 | % | $ | 964 | 17.06 | % | $ | 743 | 17.66 | % | $ | 718 | 18.05 | % | ||||||||||||||||||||
| Real estate-construction |
4,050 | 12.89 | % | 878 | 12.35 | % | 719 | 12.72 | % | 568 | 13.50 | % | 489 | 12.29 | % | |||||||||||||||||||||||||
| Real estate- mortgage |
10,868 | 70.99 | % | 4,848 | 68.23 | % | 3,665 | 64.87 | % | 2,524 | 60.00 | % | 2,235 | 56.19 | % | |||||||||||||||||||||||||
| Consumer |
248 | 1.53 | % | 186 | 2.61 | % | 286 | 5.07 | % | 349 | 8.29 | % | 448 | 11.26 | % | |||||||||||||||||||||||||
| All other |
12 | 0.09 | % | 27 | 0.39 | % | 16 | 0.28 | % | 23 | 0.55 | % | 88 | 2.21 | % | |||||||||||||||||||||||||
| $ | 16,036 | 100.00 | % | $ | 7,106 | 100.00 | % | $ | 5,650 | 100.00 | % | $ | 4,207 | 100.00 | % | $ | 3,978 | 100.00 | % | |||||||||||||||||||||
The following table provides information on the Bank’s nonperforming assets at the dates indicated.
| Nonperforming Assets (dollars in thousands) |
||||||||||||||||||||
| At December 31, | ||||||||||||||||||||
| 2010 | 2009 | 2008 | 2007 | 2006 | ||||||||||||||||
| Non-accrual loans |
$ | 10,817 | $ | 8,273 | $ | 10,058 | $ | 382 | $ | 210 | ||||||||||
| Foreclosed property |
3,961 | 6,261 | 4,300 | 377 | — | |||||||||||||||
| Total nonperforming assets |
$ | 14,778 | $ | 14,534 | $ | 14,358 | $ | 759 | $ | 210 | ||||||||||
| Loans past due 90 days accruing interest |
598 | 237 | 1,824 | 1,507 | 511 | |||||||||||||||
| Total nonperforming assets and past due loans |
$ | 15,376 | $ | 14,771 | $ | 16,182 | $ | 2,266 | $ | 721 | ||||||||||
| Allowance for loan losses to period end loans |
3.69 | % | 1.60 | % | 1.25 | % | 0.94 | % | 0.93 | % | ||||||||||
| Nonperforming assets to period end loans |
3.40 | % | 3.28 | % | 3.18 | % | 0.17 | % | 0.05 | % | ||||||||||
| Net charge-offs (recoveries) to average loans |
0.63 | % | 0.19 | % | 0.12 | % | 0.04 | % | (0.02 | %) | ||||||||||
Securities
Securities at December 31, 2010 were $60.4 million, a slight increase from $60.1 million at the end of 2009. Investment securities are comprised of U.S. agency and mortgage-backed securities, obligations of state and political subdivisions and corporate equity securities. As of December 31, 2010, neither the Company nor the Bank held any derivative financial instruments in their respective investment security portfolios.
The following table summarizes the fair value of the Company’s securities portfolio on the dates indicated.
| Securities Portfolio (in thousands) |
||||||||||||
| At December 31, | ||||||||||||
| 2010 | 2009 | 2008 | ||||||||||
| Securities, available for sale |
||||||||||||
| U.S. agency and mortgage-backed securities |
$ | 46,924 | $ | 44,215 | $ | 40,199 | ||||||
| Obligations of state and political subdivisions |
13,301 | 15,706 | 14,311 | |||||||||
| Other securities |
195 | 208 | 281 | |||||||||
| Total securities |
$ | 60,420 | $ | 60,129 | $ | 54,791 | ||||||
30
Table of Contents
The following table shows the maturities of available for sale debt and equity securities at amortized cost and market value at December 31, 2010 and approximate weighted average yields of such securities. Yields on state and political subdivision securities are shown on a tax equivalent basis, assuming a 34% federal income tax rate. The Company attempts to maintain diversity in its portfolio and maintain credit quality and re-pricing terms that are consistent with its asset/liability management and investment practices and policies. For further information on securities available for sale, see Note 2 to the consolidated financial statements, included in Item 8 of this Form 10-K.
| Securities Portfolio Maturity Distribution/Yield Analysis | ||||||||||||||||||||
| (dollars in thousands) | ||||||||||||||||||||
| At December 31, 2010 | ||||||||||||||||||||
| Less than One Year |
One to Five Years |
Five to Ten Years |
Greater than Ten Years and Other Securities |
Total | ||||||||||||||||
| Available for sale securities: |
||||||||||||||||||||
| U.S. agency and mortgage-backed securities |
||||||||||||||||||||
| Amortized cost |
$ | 3 | $ | 1,695 | $ | 14,792 | $ | 29,137 | $ | 45,627 | ||||||||||
| Market value |
$ | 3 | $ | 1,749 | $ | 15,065 | $ | 30,107 | $ | 46,924 | ||||||||||
| Weighted average yield |
6.00 | % | 5.05 | % | 3.87 | % | 4.22 | % | ||||||||||||
| Obligations of state and political subdivisions |
||||||||||||||||||||
| Amortized cost |
$ | 405 | $ | 1,493 | $ | 4,068 | $ | 7,324 | $ | 13,290 | ||||||||||
| Market value |
$ | 406 | $ | 1,531 | $ | 4,205 | $ | 7,159 | $ | 13,301 | ||||||||||
| Weighted average yield |
6.04 | % | 5.84 | % | 5.98 | % | 6.10 | % | ||||||||||||
| Other securities |
||||||||||||||||||||
| Amortized cost |
$ | — | $ | — | $ | — | $ | 23 | $ | 23 | ||||||||||
| Market value |
$ | — | $ | — | $ | — | $ | 195 | $ | 195 | ||||||||||
| Weighted average yield |
0.00 | % | 0.00 | % | 0.00 | % | 1.67 | % | ||||||||||||
| Total portfolio |
||||||||||||||||||||
| Amortized cost |
$ | 408 | $ | 3,188 | $ | 18,860 | $ | 36,484 | $ | 58,940 | ||||||||||
| Market value |
$ | 409 | $ | 3,280 | $ | 19,270 | $ | 37,461 | $ | 60,420 | ||||||||||
| Weighted average yield (1) |
6.04 | % | 5.42 | % | 4.32 | % | 4.58 | % | ||||||||||||
| (1) | Yields on tax-exempt securities have been calculated on a tax-equivalent basis. |
The above table was prepared using the contractual maturities for all securities with the exception of mortgage-backed securities (MBS) and collateralized mortgage obligations (CMO). Both MBS and CMO securities were recorded using the Espiel prepayment model that considers many factors including rate and spread projections, housing turnover and borrower characteristics to create anticipated speeds.
Deposits
Deposits at December 31, 2010 were $463.5 million, a slight decrease from $463.9 million at December 31, 2009. Savings and interest-bearing demand deposits increased $32.6 million or 22% when comparing the same periods. Time deposits, which included brokered deposits, decreased $30.8 million or 13% during 2010 to $205.9 million compared to $236.7 million at December 31, 2009. Non-interest bearing demand deposits decreased $2.1 million or 3% during 2010. The following tables include a summary of average deposits and average rates paid and maturities of CD’s greater than $100,000.
31
Table of Contents
| Average Deposits and Rates Paid | ||||||||||||||||||||||||
| (dollars in thousands) | ||||||||||||||||||||||||
| Year Ended December 31, | ||||||||||||||||||||||||
| 2010 | 2009 | 2008 | ||||||||||||||||||||||
| Amount | Rate | Amount | Rate | Amount | Rate | |||||||||||||||||||
| Noninterest-bearing deposits |
$ | 80,696 | — | $ | 75,570 | — | $ | 74,883 | — | |||||||||||||||
| Interest-bearing deposits: |
||||||||||||||||||||||||
| Interest checking |
$ | 44,641 | 0.52 | % | $ | 38,206 | 0.50 | % | $ | 56,977 | 1.37 | % | ||||||||||||
| Money market |
33,788 | 0.81 | % | 23,690 | 1.08 | % | 16,636 | 1.83 | % | |||||||||||||||
| Savings |
81,394 | 0.59 | % | 77,854 | 0.69 | % | 87,928 | 1.40 | % | |||||||||||||||
| Time deposits: |
||||||||||||||||||||||||
| Less than $100,000 |
96,251 | 2.59 | % | 104,464 | 3.25 | % | 98,231 | 3.89 | % | |||||||||||||||
| Greater than $100,000 |
82,625 | 2.53 | % | 78,280 | 3.21 | % | 78,859 | 4.04 | % | |||||||||||||||
| Brokered deposits |
36,294 | 0.94 | % | 58,995 | 1.47 | % | 28,019 | 3.48 | % | |||||||||||||||
| Total interest-bearing deposits |
$ | 374,993 | 1.57 | % | $ | 381,489 | 2.03 | % | $ | 366,650 | 2.81 | % | ||||||||||||
| Total deposits |
$ | 455,689 | $ | 457,059 | $ | 441,533 | ||||||||||||||||||
| Maturities of CD’s Greater than $100,000 (in thousands) |
||||||||||||||||||||
| Less than Three Months |
Three to Six Months |
Six to Twelve Months |
Greater than One Year |
Total | ||||||||||||||||
| At December 31, 2010 |
$ | 18,914 | $ | 15,640 | $ | 46,812 | $ | 32,775 | $ | 114,141 | ||||||||||
Liquidity
Liquidity represents the ability to meet present and future financial obligations through either the sale or maturity of existing assets or with borrowings from correspondent banks or other deposit markets. The Company classifies cash, interest-bearing and noninterest-bearing deposits with banks, federal funds sold, investment securities and loans maturing within one year as liquid assets. As a result of the Bank’s management of liquid assets and the ability to generate liquidity through liability funding, management believes that the Bank maintains overall liquidity sufficient to satisfy its depositors’ requirements and to meet its customers’ borrowing needs.
At December 31, 2010, cash, interest-bearing and noninterest-bearing deposits with banks, federal funds sold, securities and loans maturing within one year were $149.0 million. At the end of 2010, approximately 34% or $149.9 million of the loan portfolio would mature or re-price within a one-year period. Non-deposit sources of available funds totaled $127.7 million at December 31, 2010, which included $83.4 million available from FHLB, $40.0 million of unsecured federal funds lines of credit with other correspondent banks and $4.3 million available through the Federal Reserve Discount Window. During 2010, other borrowing activity included repayment of two fixed rate advances from FHLB totaling $10.0 million and borrowing two adjustable rate advances from FHLB totaling $10.0 million. The Bank also borrowed and repaid Daily Rate Credit advances as an alternative to purchasing federal funds.
Company Obligated Mandatorily Redeemable Capital Securities
See Note 8 to the consolidated financial statements, included in Item 8 of this Form 10-K, for discussion of company obligated mandatorily redeemable capital securities.
32
Table of Contents
Contractual Obligations
The impact that contractual obligations as of December 31, 2010 are expected to have on liquidity and cash flow in future periods is as follows:
| Contractual Obligations | ||||||||||||||||||||
| (in thousands) | ||||||||||||||||||||
| Total | Less than one year |
1-3 years | 3-5 years | More than 5 years |
||||||||||||||||
| Other borrowings |
$ | 20,122 | $ | 10,023 | $ | 10,047 | $ | 52 | $ | — | ||||||||||
| Operating leases |
807 | 192 | 338 | 192 | 85 | |||||||||||||||
| Total |
$ | 20,929 | $ | 10,215 | $ | 10,385 | $ | 244 | $ | 85 | ||||||||||
The Company does not have any capital lease obligations or other purchase or long-term obligations.
Off-Balance Sheet Arrangements
The Company, through the Bank, is a party to credit related financial instruments with risk not reflected in the consolidated financial statements in the normal course of business to meet the financing needs of its customers. These financial instruments include commitments to extend credit, standby letters of credit and commercial letters of credit. Such commitments involve, to varying degrees, elements of credit and interest rate risk in excess of the amount recognized in the consolidated balance sheets. The Bank’s exposure to credit loss is represented by the contractual amount of these commitments. The Bank follows the same credit policies in making commitments as it does for on-balance-sheet instruments.
At December 31, 2010 and 2009, the following financial instruments were outstanding whose contract amounts represent credit risk:
| (in thousands) | ||||||||
| 2010 | 2009 | |||||||
| Commitments to extend credit and unfunded commitments under lines of credit |
$ | 53,494 | $ | 46,211 | ||||
| Stand-by letters of credit |
6,917 | 6,002 | ||||||
Commitments to extend credit are agreements to lend to a customer as long as there is no violation of any condition established in the contract. Commitments generally have fixed expiration dates or other termination clauses and may require payment of a fee. The commitments for lines of credit may expire without being drawn upon. Therefore, the total commitment amounts do not necessarily represent future cash requirements. The amount of collateral obtained, if it is deemed necessary by the Bank, is based on management’s credit evaluation of the customer.
Unfunded commitments under commercial lines of credit, revolving credit lines and overdraft protection agreements are commitments for possible future extensions of credit to existing customers. These lines of credit are collateralized as deemed necessary and usually do not contain a specified maturity date and may not be drawn upon to the total extent to which the Bank is committed.
Commercial and standby letters of credit are conditional commitments issued by the Bank to guarantee the performance of a customer to a third party. Those letters of credit are primarily issued to support public and private borrowing arrangements. Essentially all letters of credit issued have expiration dates within one year. The credit risk involved in issuing letters of credit is essentially the same as that involved in extending loan facilities to customers. The Bank generally holds collateral supporting those commitments if deemed necessary.
At December 31, 2010, the Bank had no locked-rate commitments to originate mortgage loans. Risks arise from the possible inability of counterparties to meet the terms of their contracts. The Bank does not expect any counterparty to fail to meet its obligations.
Capital Resources
The adequacy of the Company’s capital is reviewed by management on an ongoing basis with reference to the size, composition, and quality of the Company’s asset and liability levels and consistent with regulatory requirements and industry standards. Management seeks to maintain a capital structure that will assure an adequate level of capital to support asset growth and absorb potential losses.
The Board of Governors of the Federal Reserve System has adopted capital guidelines to supplement the existing definitions of capital for regulatory purposes and to establish minimum capital standards. Specifically, the guidelines categorize assets and off-balance sheet items into four risk-weighted categories. The minimum ratio of qualifying total capital to risk-weighted assets is 8.00%, of which at least 4.00% must be Tier 1 capital, composed of common equity, retained earnings and a limited amount of perpetual preferred stock, less certain intangible items. Under present regulations, trust preferred
33
Table of Contents
securities may be included in Tier 1 capital for regulatory capital adequacy purposes as long as their amount does not exceed 25% of Tier 1 capital, including total trust preferred securities. The portion of the trust preferred securities not considered as Tier 1 capital, if any, may be included in Tier 2 capital. The Company had a ratio of risk-weighted assets to total capital of 14.18% at December 31, 2010 and a ratio of risk-weighted assets to Tier 1 capital of 12.91%. Both of these exceed both the minimum capital requirement and the minimum to be well capitalized under prompt corrective action provisions adopted by the federal regulatory agencies.
The following table summarizes the Company’s Tier 1 capital, Tier 2 capital, risk-weighted assets and capital ratios at December 31, 2010, 2009 and 2008.
| Analysis of Capital | ||||||||||||
| (dollars in thousands) | ||||||||||||
| At December 31, | ||||||||||||
| 2010 | 2009 | 2008 | ||||||||||
| Tier 1 capital: |
||||||||||||
| Preferred stock |
$ | 14,127 | $ | 13,998 | $ | — | ||||||
| Common stock |
3,686 | 3,664 | 3,653 | |||||||||
| Surplus |
1,582 | 1,418 | 1,409 | |||||||||
| Retained earnings |
28,969 | 35,104 | 35,196 | |||||||||
| Trust preferred securities |
9,279 | 9,279 | 9,279 | |||||||||
| Intangible assets |
(176 | ) | (345 | ) | (68 | ) | ||||||
| Total Tier 1 Capital |
$ | 57,467 | $ | 63,118 | $ | 49,469 | ||||||
| Tier 2 capital: |
||||||||||||
| Allowance for loan losses |
5,696 | 5,774 | 5,650 | |||||||||
| Total Risk-Based Capital |
$ | 63,163 | $ | 68,892 | $ | 55,119 | ||||||
| Risk-weighted assets |
$ | 445,301 | $ | 460,605 | $ | 470,110 | ||||||
| Capital ratios: |
||||||||||||
| Tier 1 Risk-Based Capital Ratio |
12.91 | % | 13.70 | % | 10.52 | % | ||||||
| Total Risk-Based Capital Ratio |
14.18 | % | 14.96 | % | 11.72 | % | ||||||
| Tier 1 Capital to Average Assets |
10.54 | % | 11.50 | % | 9.10 | % | ||||||
On March 13, 2009, the Company received an investment in the Company’s preferred stock totaling $13.9 million from the Company’s participation in the TARP Capital Purchase Program. As a result of this investment, capital ratios increased during 2009. The Preferred Stock pays a dividend of 5% per annum for the first five years and 9% thereafter. The Warrant Preferred Stock pays a dividend of 9% per annum.
Recent Accounting Pronouncements
See Note 1 to the consolidated financial statements, included in Item 8 of this Form 10-K, for discussion of recent accounting pronouncements.
34
Table of Contents
Quarterly Results
The table below lists the Company’s quarterly performance for the years ended December 31, 2010, 2009 and 2008.
| 2010 | ||||||||||||||||||||
| (in thousands, except per share data) | ||||||||||||||||||||
| Fourth | Third | Second | First | Total | ||||||||||||||||
| Interest and dividend income |
$ | 6,717 | $ | 6,790 | $ | 6,821 | $ | 6,887 | $ | 27,215 | ||||||||||
| Interest expense |
1,543 | 1,614 | 1,719 | 1,938 | 6,814 | |||||||||||||||
| Net interest income |
5,174 | 5,176 | 5,102 | 4,949 | 20,401 | |||||||||||||||
| Provision for loan losses |
9,120 | 1,200 | 1,000 | 411 | 11,731 | |||||||||||||||
| Net interest income (loss) after provision for loan losses |
(3,946 | ) | 3,976 | 4,102 | 4,538 | 8,670 | ||||||||||||||
| Noninterest income |
1,716 | 1,537 | 1,489 | 1,321 | 6,063 | |||||||||||||||
| Noninterest expense |
7,085 | 4,535 | 4,525 | 4,397 | 20,542 | |||||||||||||||
| Income (loss) before income taxes |
(9,315 | ) | 978 | 1,066 | 1,462 | (5,809 | ) | |||||||||||||
| Income tax expense (benefit) |
(3,250 | ) | 284 | 313 | 447 | (2,206 | ) | |||||||||||||
| Net income (loss) |
(6,065 | ) | 694 | 753 | 1,015 | (3,603 | ) | |||||||||||||
| Net income (loss) available to common shareholders |
(6,289 | ) | 473 | 532 | 794 | (4,490 | ) | |||||||||||||
| Net income (loss) per share, basic and diluted |
$ | (2.14 | ) | $ | 0.16 | $ | 0.18 | $ | 0.27 | $ | (1.53 | ) | ||||||||
| 2009 | ||||||||||||||||||||
| Fourth | Third | Second | First | Total | ||||||||||||||||
| Interest and dividend income |
$ | 6,999 | $ | 6,949 | $ | 6,749 | $ | 6,717 | $ | 27,414 | ||||||||||
| Interest expense |
2,107 | 2,175 | 2,278 | 2,524 | 9,084 | |||||||||||||||
| Net interest income |
4,892 | 4,774 | 4,471 | 4,193 | 18,330 | |||||||||||||||
| Provision for loan losses |
246 | 394 | 489 | 1,171 | 2,300 | |||||||||||||||
| Net interest income after provision for loan losses |
4,646 | 4,380 | 3,982 | 3,022 | 16,030 | |||||||||||||||
| Noninterest income |
1,565 | 1,376 | 1,409 | 1,227 | 5,577 | |||||||||||||||
| Noninterest expense |
4,740 | 4,591 | 5,109 | 4,263 | 18,703 | |||||||||||||||
| Income before income taxes |
1,471 | 1,165 | 282 | (14 | ) | 2,904 | ||||||||||||||
| Income tax expense |
414 | 347 | 45 | (51 | ) | 755 | ||||||||||||||
| Net income |
1,057 | 818 | 237 | 37 | 2,149 | |||||||||||||||
| Net income per share, basic and diluted |
837 | 598 | 17 | (7 | ) | 1,445 | ||||||||||||||
| $ | 0.28 | $ | 0.20 | $ | 0.01 | $ | 0.00 | $ | 0.49 | |||||||||||
| 2008 | ||||||||||||||||||||
| Fourth | Third | Second | First | Total | ||||||||||||||||
| Interest and dividend income |
$ | 7,257 | $ | 7,652 | $ | 7,564 | $ | 8,440 | $ | 30,913 | ||||||||||
| Interest expense |
2,987 | 3,034 | 2,984 | 3,788 | 12,793 | |||||||||||||||
| Net interest income |
4,270 | 4,618 | 4,580 | 4,652 | 18,120 | |||||||||||||||
| Provision for loan losses |
1,255 | 385 | 84 | 270 | 1,994 | |||||||||||||||
| Net interest income after provision for loan losses |
3,015 | 4,233 | 4,496 | 4,382 | 16,126 | |||||||||||||||
| Noninterest income |
1,420 | 1,496 | 1,535 | 1,500 | 5,951 | |||||||||||||||
| Noninterest expense |
4,368 | 3,852 | 3,977 | 3,817 | 16,014 | |||||||||||||||
| Income before income taxes |
67 | 1,877 | 2,054 | 2,065 | 6,063 | |||||||||||||||
| Income tax expense |
(57 | ) | 593 | 654 | 650 | 1,840 | ||||||||||||||
| Net income |
124 | 1,284 | 1,400 | 1,415 | 4,223 | |||||||||||||||
| Net income per share, basic and diluted |
$ | 0.04 | $ | 0.44 | $ | 0.48 | $ | 0.49 | $ | 1.45 | ||||||||||
35
Table of Contents
Item 8. Financial Statements and Supplementary Data
| Page | ||||
| Management’s Report Regarding the Effectiveness of Internal Controls Over Financial Reporting |
37 | |||
| 38 | ||||
| 39 | ||||
| 40 | ||||
| 42 | ||||
| 44 | ||||
| 46 | ||||
36
Table of Contents
| To the Shareholders | March 2011 | |
| First National Corporation | ||
| Strasburg, Virginia |
MANAGEMENT’S REPORT REGARDING THE EFFECTIVENESS OF INTERNAL CONTROLS
OVER FINANCIAL REPORTING
The management of First National Corporation (the Corporation) is responsible for the preparation, integrity and fair presentation of the financial statements included in the annual report as of December 31, 2010. The financial statements have been prepared in conformity with accounting principles generally accepted in the United States of America and reflect management’s judgments and estimates concerning the effects of events and transactions that are accounted for or disclosed.
Management is also responsible for establishing and maintaining an effective internal control structure over financial reporting. The Corporation’s internal control over financial reporting includes those policies and procedures that pertain to the Corporation’s ability to record, process, summarize and report reliable financial data. The internal control system contains monitoring mechanisms, and appropriate actions are taken to correct identified deficiencies. Management believes that internal controls over financial reporting, which are subject to scrutiny by management and the Corporation’s internal auditor, support the integrity and reliability of the financial statements. Management recognizes that there are inherent limitations in the effectiveness of any internal control system, including the possibility of human error and the circumvention or overriding of internal controls. Accordingly, even effective internal control over financial reporting can provide only reasonable assurance with respect to financial statement preparation. In addition, because of changes in conditions and circumstances, the effectiveness of internal control over financial reporting may vary over time.
In order to insure that the Corporation’s internal control structure over financial reporting is effective, management assessed these controls as they conformed to accounting principles generally accepted in the United States of America and related call report instructions as of December 31, 2010. This assessment was based on criteria for effective internal control over financial reporting as described in “Internal Control - Integrated Framework” issued by the Committee of Sponsoring Organizations (COSO) of the Treadway Commission. Based on this assessment, management believes that the Corporation maintained effective internal controls over financial reporting as of December 31, 2010. Management’s assessment did not determine any material weakness within the Corporation’s internal control structure. The Corporation’s annual report does not include an attestation report of the Corporation’s registered public accounting firm, Yount, Hyde & Barbour. P.C. (YHB), regarding internal control over financial reporting. Management’ report was not subject to attestation by YHB pursuant to temporary rules of the Securities and Exchange Commission that permit the Corporation to provide only management’s report in its annual report.
The 2010 end of year financial statements have been audited by the independent accounting firm of Yount, Hyde & Barbour, P.C. (YHB). Personnel from YHB were given unrestricted access to all financial records and related data, including minutes of all meetings of the Board of Directors and Committees thereof.
Management believes that all representations made to the independent auditors were valid and appropriate. The resulting report from YHB accompanies the financial statements.
The Board of Directors of the Corporation, acting through its Audit and Compliance Committee (the Committee), is responsible for the oversight of the Corporation’s accounting policies, financial reporting and internal control. The Audit and Compliance Committee of the Board of Directors is comprised entirely of outside directors who are independent of management. The Audit and Compliance Committee is responsible for the appointment and compensation of the independent auditors and approves decisions regarding the appointment or removal of members of the internal audit function. The Committee meets periodically with management, the independent auditors, and the internal auditor to insure that they are carrying out their responsibilities. The Committee is also responsible for performing an oversight role by reviewing and monitoring the financial, accounting, and auditing procedures of the Corporation in addition to reviewing the Corporation’s financial reports. The independent auditors and the internal auditor have full and unlimited access to the Audit and Compliance Committee, with or without the presence of the management of the Corporation, to discuss the adequacy of internal control over financial reporting, and any other matters which they believe should be brought to the attention of the Audit and Compliance Committee.
| /s/ Dennis A. Dysart |
/s/ M. Shane Bell | |||
| Dennis A. Dysart | M. Shane Bell | |||
| Interim Chief Executive Officer | Executive Vice President | |||
| Chief Financial Officer |
37
Table of Contents

REPORT OF INDEPENDENT REGISTERED PUBLIC ACCOUNTING FIRM
To the Shareholders and Board of Directors
First National Corporation
Strasburg, Virginia
We have audited the accompanying consolidated balance sheets of First National Corporation and subsidiaries as of December 31, 2010 and 2009, and the related consolidated statements of operations, changes in shareholders’ equity, and cash flows for the years ended December 31, 2010, 2009 and 2008. These financial statements are the responsibility of the Company’s management. Our responsibility is to express an opinion on these financial statements based on our audits.
We conducted our audits in accordance with the standards of the Public Company Accounting Oversight Board (United States). Those standards require that we plan and perform the audit to obtain reasonable assurance about whether the financial statements are free of material misstatement. The Company is not required to have, nor were we engaged to perform an audit of its internal control over financial reporting. Our audit included consideration of internal control over financial reporting as a basis for designing audit procedures that are appropriate in the circumstances, but not for the purpose of expressing an opinion on the effectiveness of the Company’s internal control over financial reporting. Accordingly, we express no such opinion. An audit also includes examining, on a test basis, evidence supporting the amounts and disclosures in the financial statements, assessing the accounting principles used and significant estimates made by management, as well as evaluating the overall financial statement presentation. We believe that our audits provide a reasonable basis for our opinion.
In our opinion, the consolidated financial statements referred to above present fairly, in all material respects, the financial position of First National Corporation and subsidiaries as of December 31, 2010 and 2009, and the results of their operations and their cash flows for the years ended December 31, 2010, 2009 and 2008, in conformity with U.S. generally accepted accounting principles.

|
| Winchester, Virginia |
| March 24, 2011 |
38
Table of Contents
Consolidated Balance Sheets
December 31, 2010 and 2009
(in thousands, except share and per share data)
| 2010 | 2009 | |||||||
| Assets |
||||||||
| Cash and due from banks |
$ | 5,048 | $ | 6,100 | ||||
| Interest-bearing deposits in banks |
10,949 | 8,877 | ||||||
| Federal funds sold |
7,500 | — | ||||||
| Securities available for sale, at fair value |
60,420 | 60,129 | ||||||
| Restricted securities, at cost |
3,153 | 3,426 | ||||||
| Loans held for sale |
271 | 210 | ||||||
| Loans, net of allowance for loan losses, 2010, $16,036, 2009, $7,106 |
418,994 | 436,129 | ||||||
| Other real estate owned, net of valuation allowance, 2010, $3,341, 2009, $994 |
3,961 | 6,261 | ||||||
| Premises and equipment, net |
20,302 | 21,148 | ||||||
| Interest receivable |
1,667 | 1,710 | ||||||
| Other assets |
12,364 | 8,684 | ||||||
| Total assets |
$ | 544,629 | $ | 552,674 | ||||
| Liabilities & Shareholders’ Equity |
||||||||
| Liabilities |
||||||||
| Deposits: |
||||||||
| Noninterest-bearing demand deposits |
$ | 78,964 | $ | 81,101 | ||||
| Savings and interest-bearing demand deposits |
178,685 | 146,056 | ||||||
| Time deposits |
205,851 | 236,729 | ||||||
| Total deposits |
$ | 463,500 | $ | 463,886 | ||||
| Other borrowings |
20,122 | 20,186 | ||||||
| Company obligated mandatorily redeemable capital securities |
9,279 | 9,279 | ||||||
| Accrued interest and other liabilities |
3,230 | 4,516 | ||||||
| Commitments and contingencies |
— | — | ||||||
| Total liabilities |
$ | 496,131 | $ | 497,867 | ||||
| Shareholders’ Equity |
||||||||
| Preferred stock, $1,000 liquidation preference; 14,595 shares issued and outstanding |
$ | 14,127 | $ | 13,998 | ||||
| Common stock, par value $1.25 per share; authorized 8,000,000 shares; issued and outstanding, 2010, 2,948,901 shares, 2009, 2,931,721 shares |
3,686 | 3,664 | ||||||
| Surplus |
1,582 | 1,418 | ||||||
| Retained earnings |
28,969 | 35,104 | ||||||
| Unearned ESOP shares |
— | (42 | ) | |||||
| Accumulated other comprehensive income, net |
134 | 665 | ||||||
| Total shareholders’ equity |
$ | 48,498 | $ | 54,807 | ||||
| Total liabilities and shareholders’ equity |
$ | 544,629 | $ | 552,674 | ||||
See Notes to Consolidated Financial Statements
39
Table of Contents
Consolidated Statement of Operations
Three Years Ended December 31, 2010
(in thousands, except per share data)
| 2010 | 2009 | 2008 | ||||||||||
| Interest and Dividend Income |
||||||||||||
| Interest and fees on loans |
$ | 24,874 | $ | 24,691 | $ | 28,136 | ||||||
| Interest on federal funds sold |
2 | 5 | 11 | |||||||||
| Interest on deposits in banks |
15 | 1 | 34 | |||||||||
| Interest and dividends on securities available for sale: |
||||||||||||
| Taxable interest |
1,722 | 2,092 | 2,051 | |||||||||
| Tax-exempt interest |
541 | 576 | 545 | |||||||||
| Dividends |
61 | 49 | 136 | |||||||||
| Total interest and dividend income |
$ | 27,215 | $ | 27,414 | $ | 30,913 | ||||||
| Interest Expense |
||||||||||||
| Interest on deposits |
$ | 5,903 | $ | 7,753 | $ | 10,299 | ||||||
| Interest on federal funds purchased |
12 | 37 | 112 | |||||||||
| Interest on company obligated mandatorily redeemable capital securities |
439 | 470 | 642 | |||||||||
| Interest on other borrowings |
460 | 824 | 1,740 | |||||||||
| Total interest expense |
$ | 6,814 | $ | 9,084 | $ | 12,793 | ||||||
| Net interest income |
$ | 20,401 | $ | 18,330 | $ | 18,120 | ||||||
| Provision for loan losses |
11,731 | 2,300 | 1,994 | |||||||||
| Net interest income after provision for loan losses |
$ | 8,670 | $ | 16,030 | $ | 16,126 | ||||||
| Noninterest Income |
||||||||||||
| Service charges on deposit accounts |
$ | 2,618 | $ | 2,539 | $ | 2,878 | ||||||
| ATM and check card fees |
1,432 | 1,196 | 1,136 | |||||||||
| Trust and investment advisory fees |
1,244 | 1,126 | 1,329 | |||||||||
| Fees for other customer services |
327 | 333 | 361 | |||||||||
| Net gains (losses) on sale of securities available for sale |
(7 | ) | 10 | 2 | ||||||||
| Net gains (losses) on sale of premises and equipment |
— | 9 | (106 | ) | ||||||||
| Net (losses) on sale of other real estate owned |
(19 | ) | — | — | ||||||||
| Net gains on sale of loans |
263 | 210 | 119 | |||||||||
| Other operating income |
205 | 154 | 232 | |||||||||
| Total noninterest income |
$ | 6,063 | $ | 5,577 | $ | 5,951 | ||||||
See Notes to Consolidated Financial Statements
40
Table of Contents
FIRST NATIONAL CORPORATION
Consolidated Statements of Operations
(Continued)
Three years ended December 31, 2010
(in thousands, except per share data)
| 2010 | 2009 | 2008 | ||||||||||
| Noninterest Expense |
||||||||||||
| Salaries and employee benefits |
$ | 9,080 | $ | 8,697 | $ | 8,485 | ||||||
| Occupancy |
1,389 | 1,348 | 1,175 | |||||||||
| Equipment |
1,372 | 1,416 | 1,391 | |||||||||
| Marketing |
503 | 532 | 510 | |||||||||
| Stationery and supplies |
375 | 507 | 457 | |||||||||
| Legal and professional fees |
802 | 880 | 696 | |||||||||
| ATM and check card fees |
827 | 734 | 657 | |||||||||
| FDIC assessment |
730 | 973 | 253 | |||||||||
| Provision for other real estate owned |
2,640 | 994 | — | |||||||||
| Bank franchise tax |
426 | 331 | 363 | |||||||||
| Other operating expense |
2,398 | 2,291 | 2,027 | |||||||||
| Total noninterest expense |
$ | 20,542 | $ | 18,703 | $ | 16,014 | ||||||
| (Loss) income before income taxes |
$ | (5,809 | ) | $ | 2,904 | $ | 6,063 | |||||
| Income tax (benefit) provision |
(2,206 | ) | 755 | 1,840 | ||||||||
| Net (loss) income |
$ | (3,603 | ) | $ | 2,149 | $ | 4,223 | |||||
| Effective dividend and accretion on preferred stock |
887 | 704 | — | |||||||||
| Net (loss) income available to common shareholders |
$ | (4,490 | ) | $ | 1,445 | $ | 4,223 | |||||
| (Loss) earnings per common share, basic and diluted |
$ | (1.53 | ) | $ | 0.49 | $ | 1.45 | |||||
See Notes to Consolidated Financial Statements
41
Table of Contents
Consolidated Statements of Cash Flows
Three years ended December 31, 2010
(in thousands)
| 2010 | 2009 | 2008 | ||||||||||
| Cash Flows from Operating Activities |
||||||||||||
| Net income (loss) |
$ | (3,603 | ) | $ | 2,149 | $ | 4,223 | |||||
| Adjustments to reconcile net income (loss) to net cash and cash equivalents provided by operating activities: |
||||||||||||
| Depreciation and amortization |
1,225 | 1,274 | 1,201 | |||||||||
| Origination of loans held for sale |
(16,371 | ) | (16,795 | ) | (8,393 | ) | ||||||
| Proceeds from sale of loans held for sale |
16,573 | 16,795 | 8,782 | |||||||||
| Net gains on sales of loans |
(263 | ) | (210 | ) | (119 | ) | ||||||
| Provision for loan losses |
11,731 | 2,300 | 1,994 | |||||||||
| Provision for other real estate owned |
2,640 | 994 | — | |||||||||
| Net (gains) losses on sale of securities available for sale |
7 | (10 | ) | (2 | ) | |||||||
| Net (gains) losses on sale of premises and equipment |
— | (9 | ) | 106 | ||||||||
| Net losses on sale of other real estate owned |
19 | — | — | |||||||||
| Accretion of security discounts |
(40 | ) | (65 | ) | (51 | ) | ||||||
| Amortization of security premiums |
370 | 302 | 78 | |||||||||
| Compensation expense for ESOP shares allocated |
42 | 190 | 147 | |||||||||
| Deferred income tax benefit |
(3,986 | ) | (1,850 | ) | (659 | ) | ||||||
| Changes in assets and liabilities: |
||||||||||||
| Decrease in interest receivable |
43 | 53 | 464 | |||||||||
| (Increase) decrease in other assets |
435 | (1,611 | ) | (667 | ) | |||||||
| Increase (decrease) in accrued expenses and other liabilities |
(1,521 | ) | 788 | (244 | ) | |||||||
| Net cash provided by operating activities |
$ | 7,301 | $ | 4,295 | $ | 6,860 | ||||||
| Cash Flows from Investing Activities |
||||||||||||
| Proceeds from sales of securities available for sale |
$ | 1,509 | $ | — | $ | — | ||||||
| Proceeds from sale of Federal Home Loan Bank stock |
273 | 2,070 | 4,793 | |||||||||
| Proceeds from maturities, calls, and principal payments of securities available for sale |
12,716 | 15,269 | 10,938 | |||||||||
| Purchases of securities available for sale |
(15,278 | ) | (19,653 | ) | (11,246 | ) | ||||||
| Purchases of Federal Home Loan Bank stock |
— | (2,049 | ) | (4,943 | ) | |||||||
| Increase in federal funds sold |
(7,500 | ) | — | — | ||||||||
| Purchase of premises and equipment |
(379 | ) | (1,116 | ) | (3,421 | ) | ||||||
| Proceeds from sale of premises and equipment |
— | 225 | — | |||||||||
| Proceeds from sale of other real estate owned |
2,506 | 187 | — | |||||||||
| Net (increase) decrease in loans |
2,539 | 4,756 | (6,864 | ) | ||||||||
| Net cash used in investing activities |
$ | (3,614 | ) | $ | (311 | ) | $ | (10,743 | ) | |||
See Notes to Consolidated Financial Statements
42
Table of Contents
FIRST NATIONAL CORPORATION
Consolidated Statements of Cash Flows
(Continued)
Three years ended December 31, 2010
(in thousands)
| 2010 | 2009 | 2008 | ||||||||||
| Cash Flows from Financing Activities |
||||||||||||
| Net increase (decrease) in demand deposits and savings accounts |
$ | 30,492 | $ | 13,043 | $ | (42,036 | ) | |||||
| Net increase (decrease) in time deposits |
(30,878 | ) | 3,350 | 44,387 | ||||||||
| Proceeds from other borrowings |
23,602 | 46,000 | 131,500 | |||||||||
| Principal payments on other borrowings |
(23,666 | ) | (71,211 | ) | (126,667 | ) | ||||||
| Principal payments on company obligated mandatorily redeemable capital securities |
— | — | (3,093 | ) | ||||||||
| Proceeds from issuance of preferred stock |
— | 13,900 | — | |||||||||
| Cash dividends paid on common stock |
(1,433 | ) | (1,529 | ) | (1,630 | ) | ||||||
| Cash dividends paid on preferred stock |
(758 | ) | (509 | ) | — | |||||||
| Shares issued to leveraged ESOP |
(26 | ) | (85 | ) | (44 | ) | ||||||
| Decrease in federal funds purchased |
— | (2,456 | ) | (953 | ) | |||||||
| Net cash provided by (used in) financing activities |
$ | (2,667 | ) | $ | 503 | $ | 1,464 | |||||
| Increase (decrease) in cash and cash equivalents |
$ | 1,020 | $ | 4,487 | $ | (2,419 | ) | |||||
| Cash and cash equivalents, beginning of year |
14,977 | 10,490 | 12,909 | |||||||||
| Cash and cash equivalents, end of year |
$ | 15,997 | $ | 14,977 | $ | 10,490 | ||||||
| Supplemental Disclosures of Cash Flow Information |
||||||||||||
| Cash payments for: |
||||||||||||
| Interest |
$ | 7,088 | $ | 9,381 | $ | 12,883 | ||||||
| Income taxes |
$ | 3,671 | $ | 515 | $ | 3,019 | ||||||
| Supplemental Disclosures of Noncash Transactions |
||||||||||||
| Unrealized gains (losses) on securities available for sale |
$ | (425 | ) | $ | 1,181 | $ | 302 | |||||
| Transfer from loans to other real estate owned |
$ | 2,865 | $ | 3,142 | $ | 3,923 | ||||||
| Change in pension liability |
$ | 379 | $ | (1,101 | ) | $ | 1,306 | |||||
| Split dollar liability |
$ | — | $ | — | $ | 986 | ||||||
| Issuance of common stock, dividend reinvestment plan |
$ | 212 | $ | 105 | $ | — | ||||||
See Notes to Consolidated Financial Statements
43
Table of Contents
Consolidated Statements of Changes in Shareholders’ Equity
Three years ended December 31, 2010
(in thousands, except share and per share data)
| Preferred Stock |
Common Stock |
Surplus | Retained Earnings |
Unearned ESOP Shares |
Accumulated Other Comprehensive Income (Loss) |
Comprehensive Income (Loss) |
Total | |||||||||||||||||||||||||
| Balance, December 31, 2007 |
$ | — | $ | 3,653 | $ | 1,453 | $ | 33,311 | $ | (379 | ) | $ | (179 | ) | $ | 37,859 | ||||||||||||||||
| Comprehensive income: |
||||||||||||||||||||||||||||||||
| Net income |
— | — | — | 4,223 | — | — | $ | 4,223 | 4,223 | |||||||||||||||||||||||
| Other comprehensive loss, net of tax: |
||||||||||||||||||||||||||||||||
| Unrealized holding gains arising during the period (net of tax, $103) |
— | — | — | — | — | — | 201 | — | ||||||||||||||||||||||||
| Reclassification adjustment (net of tax, $1) |
— | — | — | — | — | — | (1 | ) | — | |||||||||||||||||||||||
| Pension liability adjustment (net of tax, $444) |
(862 | ) | ||||||||||||||||||||||||||||||
| Other comprehensive loss (net of tax, $342) |
— | — | — | — | — | (662 | ) | $ | (662 | ) | (662 | ) | ||||||||||||||||||||
| Total comprehensive income |
$ | 3,561 | ||||||||||||||||||||||||||||||
| Effect of recognition of split dollar postretirement benefits (net of tax, $335) |
— | — | — | (651 | ) | — | — | (651 | ) | |||||||||||||||||||||||
| Effect of changing pension plan measurement date pursuant to accounting rule change |
— | — | — | (57 | ) | — | — | (57 | ) | |||||||||||||||||||||||
| Shares acquired by leveraged ESOP |
— | — | (44 | ) | 147 | — | 103 | |||||||||||||||||||||||||
| Cash dividends ($0.56 per share) |
— | — | — | (1,630 | ) | — | — | (1,630 | ) | |||||||||||||||||||||||
| Balance, December 31, 2008 |
$ | — | $ | 3,653 | $ | 1,409 | $ | 35,196 | $ | (232 | ) | $ | (841 | ) | $ | 39,185 | ||||||||||||||||
|
|
||||||||||||||||||||||||||||||||
| Preferred Stock |
Common Stock |
Surplus | Retained Earnings |
Unearned ESOP Shares |
Accumulated Other Comprehensive Income (Loss) |
Comprehensive Income (Loss) |
Total | |||||||||||||||||||||||||
| Balance, December 31, 2008 |
$ | — | $ | 3,653 | $ | 1,409 | $ | 35,196 | $ | (232 | ) | $ | (841 | ) | $ | 39,185 | ||||||||||||||||
| Comprehensive income: |
||||||||||||||||||||||||||||||||
| Net income |
— | — | — | 2,149 | — | — | $ | 2,149 | 2,149 | |||||||||||||||||||||||
| Other comprehensive income, net of tax: |
||||||||||||||||||||||||||||||||
| Unrealized holding gains arising during the period (net of tax, $405) |
— | — | — | — | — | — | 786 | — | ||||||||||||||||||||||||
| Reclassification adjustment (net of tax, $3) |
— | — | — | — | — | — | (7 | ) | — | |||||||||||||||||||||||
| Pension liability adjustment (net of tax, $374) |
727 | |||||||||||||||||||||||||||||||
| Other comprehensive income (net of tax, $776) |
— | — | — | — | — | 1,506 | $ | 1,506 | 1,506 | |||||||||||||||||||||||
| Total comprehensive income |
$ | 3,655 | ||||||||||||||||||||||||||||||
| Shares acquired by leveraged ESOP |
— | — | (85 | ) | — | 190 | — | 105 | ||||||||||||||||||||||||
| Cash dividends on common stock ($0.56 per share) |
— | — | — | (1,634 | ) | — | — | (1,634 | ) | |||||||||||||||||||||||
| Issuance of 8,861 shares common stock, dividend reinvestment plan |
— | 11 | 94 | — | — | — | 105 | |||||||||||||||||||||||||
| Issuance of 13,900 shares of preferred stock |
13,900 | — | — | — | — | — | 13,900 | |||||||||||||||||||||||||
| Cash dividends on preferred stock |
— | — | — | (509 | ) | — | — | (509 | ) | |||||||||||||||||||||||
| Accretion on preferred stock discount |
98 | — | — | (98 | ) | — | — | — | ||||||||||||||||||||||||
| Balance, December 31, 2009 |
$ | 13,998 | $ | 3,664 | $ | 1,418 | $ | 35,104 | $ | (42 | ) | $ | 665 | $ | 54,807 | |||||||||||||||||
44
Table of Contents
FIRST NATIONAL CORPORATION
Consolidated Statements of Changes in Shareholders’ Equity
(Continued)
Three years ended December 31, 2010
(in thousands, except share and per share data)
| Preferred Stock |
Common Stock |
Surplus | Retained Earnings |
Unearned ESOP Shares |
Accumulated Other Comprehensive Income (Loss) |
Comprehensive Income (Loss) |
Total | |||||||||||||||||||||||||
| Balance, December 31, 2009 |
$ | 13,998 | $ | 3,664 | $ | 1,418 | $ | 35,104 | $ | (42 | ) | $ | 665 | $ | 54,807 | |||||||||||||||||
| Comprehensive loss: |
||||||||||||||||||||||||||||||||
| Net loss |
— | — | — | (3,603 | ) | — | — | $ | (3,603 | ) | (3,603 | ) | ||||||||||||||||||||
| Other comprehensive loss, net of tax: |
||||||||||||||||||||||||||||||||
| Unrealized holding losses arising during the period (net of tax, $146) |
— | — | — | — | — | — | (286 | ) | — | |||||||||||||||||||||||
| Reclassification adjustment (net of tax, $2) |
— | — | — | — | — | — | 5 | — | ||||||||||||||||||||||||
| Pension liability adjustment (net of tax, $129) |
(250 | ) | ||||||||||||||||||||||||||||||
| Other comprehensive loss (net of tax, $273) |
— | — | — | — | — | (531 | ) | $ | (531 | ) | (531 | ) | ||||||||||||||||||||
| Total comprehensive loss |
$ | (4,134 | ) | |||||||||||||||||||||||||||||
| Shares acquired by leveraged ESOP |
— | — | (26 | ) | — | 42 | — | 16 | ||||||||||||||||||||||||
| Cash dividends on common stock ($0.56 per share) |
— | — | — | (1,645 | ) | — | — | (1,645 | ) | |||||||||||||||||||||||
| Issuance of 17,180 shares common stock, dividend reinvestment plan |
— | 22 | 190 | — | — | — | 212 | |||||||||||||||||||||||||
| Cash dividends on preferred stock |
— | — | — | (758 | ) | — | — | (758 | ) | |||||||||||||||||||||||
| Accretion on preferred stock discount |
129 | — | — | (129 | ) | — | — | — | ||||||||||||||||||||||||
| Balance, December 31, 2010 |
$ | 14,127 | $ | 3,686 | $ | 1,582 | $ | 28,969 | $ | — | $ | 134 | $ | 48,498 | ||||||||||||||||||
See Notes to Consolidated Financial Statements
45
Table of Contents
Notes to Consolidated Financial Statements
Note 1. Nature of Banking Activities and Significant Accounting Policies
First National Corporation (the Company) is the financial holding company of First Bank (the Bank), First National (VA) Statutory Trust I (Trust I), First National (VA) Statutory Trust II (Trust II) and First National (VA) Statutory Trust III (Trust III). The Trusts were formed for the purpose of issuing redeemable capital securities, commonly known as trust preferred securities. The Bank owns First Bank Financial Services, Inc., which invests in partnerships that provide title insurance and investment services. The Bank owns Shen-Valley Land Holdings, LLC which holds other real estate owned and future office sites. The Bank provides commercial and personal loans, residential mortgages, credit cards, a variety of deposit products and personal trust and investment services to its customers in the northern Shenandoah Valley region of Virginia.
The accounting and reporting policies of the Company conform to accounting principles generally accepted in the United States of America and to accepted practices within the banking industry.
Principles of Consolidation
The consolidated financial statements of First National Corporation include the accounts of all five companies. All material intercompany balances and transactions have been eliminated in consolidation, except for balances and transactions related to the Trusts. The subordinated debt of these Trusts is reflected as a liability of the Company.
Use of Estimates
In preparing consolidated financial statements in conformity with accounting principles generally accepted in the United States, management is required to make estimates and assumptions that affect the reported amounts of assets and liabilities as of the date of the balance sheet and reported amounts of revenues and expenses during the reporting period. Actual results could differ from those estimates. Material estimates that are particularly susceptible to significant change in the near term relate to the determination of the allowance for loan losses, fair value, deferred tax assets and liabilities, and other real estate owned.
Significant Group Concentrations of Credit Risk
Most of the Company’s activities are with customers located within the northern Shenandoah Valley region of Virginia. The types of lending that the Company engages in are included in Note 3. The Company has identified a concentration of credit risk in the hotel industry and mortgage loans on real estate. See Note 3 for further information on this concentration of credit risk. The Company does not have a significant concentration to any one customer.
Cash and Cash Equivalents
For purposes of the consolidated statements of cash flows, the Company has defined cash equivalents as those amounts included in the balance sheet captions “Cash and due from banks” and “Interest-bearing deposits in banks.”
Securities
Investments in debt securities with readily determinable fair values are classified as either held to maturity, available for sale (AFS) or trading based on management’s intent. Currently all of the Company’s debt securities are classified as AFS. Equity investments in the FHLB, the Federal Reserve Bank of Richmond and Community Bankers Bank are separately classified as restricted securities and are carried at cost. AFS securities are carried at estimated fair value with the corresponding unrealized gains and losses excluded from earnings and reported in other comprehensive income. Purchase premiums and discounts are recognized in interest income using the interest method over the terms of the securities.
Impairment of securities occurs when the fair value of a security is less than its amortized cost. For debt securities, impairment is considered other-than-temporary and recognized in its entirety in net income if either the Company (1) intends to sell the security or (2) it is more likely than not that it will be required to sell the security before recovery of its amortized cost basis. If, however, the Company intends to sell the security and it is not more-than-likely that it will be required to sell the security before recovery, the Company must determine what portion of the impairment is attributable to a credit loss, which occurs when the amortized cost of the security exceeds the present value of the cash flows expected to be collected from the security. If there is no credit loss, there is no other-than-temporary impairment. If there is a credit loss, other-than-temporary impairment exists, and the credit loss must be recognized in net income and the remaining portion of impairment must be recognized in other comprehensive income.
46
Table of Contents
For equity securities carried at cost as restricted securities, impairment is considered to be other-than-temporary based on the Company’s ability and intent to hold the investment until a recovery of fair value. Other-than-temporary impairment of an equity security results in a write-down that must be included in income. The Company regularly reviews each security for other-than-temporary impairment based on criteria that include the extent to which costs exceeds market price, the duration of that market decline, the financial health of and specific prospects for the issuer, the best estimate of the present value of cash flows expected to be collected from debt securities, the Company’s intention with regard to holding the security to maturity and the likelihood that the Company would be required to sell the security before recovery.
Loans Held for Sale
Loans originated and intended for sale in the secondary market are carried at the lower of aggregate cost or estimated fair value. The Company, through its banking subsidiary, requires a firm purchase commitment from a permanent investor before a loan can be closed, thus limiting interest rate risk. Net unrealized losses, if any, are recognized through a valuation allowance by charges to income.
The Bank enters into commitments to originate mortgage loans whereby the interest rate on the loan is determined prior to funding (rate lock commitments). Rate lock commitments on mortgage loans that are intended to be sold are considered to be derivatives. The period of time between issuance of a loan commitment and closing and sale of the loan generally ranges from 30 to 60 days. The Bank protects itself from changes in interest rates through the use of best efforts forward delivery commitments, whereby the Bank commits to sell a loan at the time the borrower commits to an interest rate with the intent that the buyer has assumed interest rate risk on the loan. As a result, the Bank is not exposed to losses nor will it realize significant gains related to its rate lock commitments due to changes in interest rates. The correlation between the rate lock commitments and the best efforts contracts is very high due to their similarity.
The market value of rate lock commitments and best efforts contracts is not readily ascertainable with precision because rate lock commitments and best efforts contracts are not actively traded in stand-alone markets. The Bank determines the fair value of rate lock commitments and best efforts contracts by measuring the change in the value of the underlying asset while taking into consideration the probability that the rate lock commitments will close. Because of the high correlation between rate lock commitments and best efforts contracts, no gain or loss occurs on the rate lock commitments.
Loans
The Company, through its banking subsidiary, grants mortgage, commercial and consumer loans to customers. The bank segments its loan portfolio into real estate loans, commercial loans, and consumer loans. Real estate loans are further divided into the following classes: Construction; 1-4 family residential; and Other Real Estate Loans. Descriptions of the Company’s loan classes are as follows:
Commercial Loans: Commercial loans are typically secured with non-real estate commercial property. The Company makes commercial loans primarily to businesses located within our market area.
Real Estate Loans – Construction: The Company originates construction loans for the acquisition and development of land and construction of condominiums, townhomes, and one-to-four family residences.
Real Estate Loans – 1-4 Family: This class of loans includes loans secured by one to four family homes. Typically, the Bank originates fixed rate mortgage loans with the intent to sell to correspondent lenders. Depending on the financial goals of the Company, the Bank occasionally originates and retains these loans.
Real Estate Loans – Other: This loan class consists primarily of loans secured by various types of commercial real estate typically in the Bank’s market area, including multi-family residential buildings, commercial buildings and offices, hotels, small shopping centers, farms and churches.
Consumer Loans: Consumer loans include all loans made to individuals for consumer or personal purposes. They include new and used automobile loans, unsecured loans and lines of credit.
A substantial portion of the loan portfolio is represented by residential and commercial loans secured by real estate throughout the northern Shenandoah Valley region of Virginia. The ability of the Bank’s debtors to honor their contracts is subject to the real estate and general economic conditions in this area.
Loans that management has the intent and ability to hold for the foreseeable future or until maturity or pay-off generally are reported at their outstanding unpaid principal balances less the allowance for loan losses and any deferred fees or costs on originated loans. Interest income is accrued and credited to income based on the unpaid principal balance. Loan origination fees, net of certain origination costs, are deferred and recognized as an adjustment of the related loan yield using the interest method.
A loan’s past due status is based on the contractual due date of the most delinquent payment due. Loans are generally placed on nonaccrual status when the collection of principal or interest is 90 days or more past due, or earlier, if collection is uncertain based on an evaluation of the net realizable value of the collateral and the financial strength of the borrower. Loans greater than 90 days past due may remain on accrual status if management determines it has adequate collateral to cover the principal and interest. For those loans that are carried on nonaccrual status, payments are first applied to principal
47
Table of Contents
outstanding. A loan may be returned to accrual status if the borrower has demonstrated a sustained period of repayment performance in accordance with the contractual terms of the loan and there is reasonable assurance the borrower will continue to make payments as agreed. These policies are applied consistently across the loan portfolio.
All interest accrued but not collected for loans that are placed on non-accrual or charged off is reversed against interest income. The interest on these loans is accounted for on the cost-recovery method, until qualifying for return to accrual. Loans are returned to accrual status when all the principal and interest amounts contractually due are brought current and future payments are reasonably assured.
Any unsecured loan that is over 120 days past due is charged-off in full. Any secured loan that is 120 days delinquent and is considered by management to be uncollectible is partially charged-off and carried at the fair value of the collateral less estimated selling costs. This charge-off policy applies to all loan segments.
A loan is considered impaired when, based on current information and events, it is probable that the Company will be unable to collect all scheduled payments of principal or interest when due according to the contractual terms of the loan agreement. Factors considered by management in determining impairment include payment status, collateral value (net of selling costs), and the probability of collecting scheduled principal and interest payments when due. Additionally, management’s policy is to evaluate substandard and doubtful loans greater than $500 thousand for impairment. Loans that experience insignificant payment delays and payment shortfalls generally are not classified as impaired. Management determines the significance of payment delays and payment shortfalls on a case-by-case basis, taking into consideration all of the circumstances surrounding the loan and the borrower, including the length of the delay, the reasons for the delay, the borrower’s prior payment record, and the amount of the shortfall in relation to the principal and interest owed. Impairment is measured on a loan-by-loan basis by either the present value of expected future cash flows discounted at the loan’s effective interest rate, the loan’s obtainable market price, or the fair market value of the collateral, net of selling costs, if the loan is collateral dependent. Large groups of smaller balance homogeneous loans are collectively evaluated for impairment. Accordingly, the Company does not separately identify individual consumer, residential and certain small commercial loans that are less than $500 thousand for impairment disclosures, except for troubled debt restructurings (TDRs) as noted below.
In situations where, for economic or legal reasons related to a borrower’s financial condition, management may grant a concession to the borrower that it would not otherwise consider, the related loan is classified as a TDR. TDRs are considered impaired loans. Upon designation as a TDR, the Company evaluates the borrower’s payment history, past due status and ability to make payments based on the revised terms of the loan. If a loan was accruing prior to being modified as a TDR and if the Company concludes that the borrower is able to make such payments, and there are no other factors or circumstances that would cause it to conclude otherwise, the loan will remain on an accruing status. If a loan was on nonaccrual status at the time of the TDR, the loan will remain on nonaccrual status following the modification and may be returned to accrual status based on the policy for returning loans to accrual status as noted above. There were $14.4 million and $5.6 million classified as TDRs as of December 31, 2010 and 2009, respectively.
Allowance for Loan Losses
The allowance for loan losses is established as losses are estimated to have occurred through a provision for loan losses charged to earnings. Loan losses are charged against the allowance when management believes the uncollectability of a loan balance is confirmed. Subsequent recoveries, if any, are credited to the allowance. For further information about the Company’s loans and the allowance for loan losses, see Notes 3 and 4.
The allowance for loan losses is evaluated on a quarterly basis by management and is based upon management’s periodic review of the collectability of the loans in light of historical experience, the nature and volume of the loan portfolio, adverse situations that may affect the borrower’s ability to repay, estimated value of any underlying collateral and prevailing economic conditions. This evaluation is inherently subjective as it requires estimates that are susceptible to significant revision as more information becomes available.
The allowance represents an amount that, in management’s judgment, will be adequate to absorb any losses on existing loans that may become uncollectible. Management’s judgment in determining the level of the allowance is based on evaluations of the collectability of loans while taking into consideration such factors as trends in delinquencies and charge-offs, changes in the nature and volume of the loan portfolio, current economic conditions that may affect a borrower’s ability to repay and the value of the collateral, overall portfolio quality and review of specific potential losses. This evaluation is inherently subjective, as it requires estimates that are susceptible to significant revisions as more information becomes available. The evaluation also considers the following risk characteristics of each loan portfolio:
| • | Residential mortgage loans carry risks associated with the continued credit-worthiness of the borrower and changes in the value of the collateral. |
| • | Real estate construction loans carry risks that the project will not be finished according to schedule, the project will not be finished according to budget and the value of the collateral may, at any point in time, be less than the principal amount of the loan; Construction loans also bear the risk that the general contractor, who may or may not by a loan customer, may be unable to finish the construction project as planned because of financial pressure unrelated to the project. |
| • | Commercial real estate and commercial and industrial loans carry risks associated with the successful operation of a business or a real estate project, in addition to other risks associated with the ownership of real estate, because repayment of these loans may be dependent upon the profitability and cash flows of the business or project. In addition, there is risk associated with the value of collateral other than real estate which may depreciate over time and cannot be appraised with as much precision. |
48
Table of Contents
| • | Consumer loans carry risk associated with the continued credit-worthiness of the borrower and the value of the collateral (i.e., rapidly depreciating assets such as automobiles), or lack thereof. Consumer loans are more likely than real estate loans to be immediately adversely affected by job loss, divorce, illness or personal bankruptcy. |
The allowance for loan losses consists of specific and general components. The specific component relates to loans that are classified as impaired, and is established when the discounted cash flows, collateral value or observable market price of the impaired loan is lower than the carrying value of that loan. For collateral dependent loans, an updated appraisal will be ordered if a current one is not on file. Appraisals are performed by independent third-party appraisers with relevant industry experience. Adjustments to the appraised value may be made based on recent sales of like properties or general market conditions when appropriate.
The general component relates to loans that are not considered impaired. These unimpaired loans are segregated by loan type and allowance factors are assigned by management based on a one-year loss history, delinquencies, national and local economic trends, trends in volume and terms of loans, effects of changes in lending policy, the experience and depth of management, concentrations of credit, quality of the loan review system and the effect of external factors such as competition and regulatory requirements. The factors assigned differ by loan segment. The general component recognizes potential losses whose impact on the portfolio has yet to be recognized by a specific allowance. Allowance factors and the overall size of the allowance may change from period to period based on management’s assessment of the above described factors and the relative weights given to each factor.
Premises and Equipment
Land is carried at cost. Premises and equipment are stated at cost, less accumulated depreciation and amortization. Premises and equipment are depreciated over their estimated useful lives ranging from three years to forty years; leasehold improvements are amortized over the lives of the respective leases or the estimated useful life of the leasehold improvement, whichever is less. Software is amortized over its estimated useful life ranging from three to seven years. Depreciation and amortization are recorded on the straight-line method.
Costs of maintenance and repairs are charged to expense as incurred. Costs of replacing structural parts of major units are considered individually and are expensed or capitalized as the facts dictate. Gains and losses on routine dispositions are reflected in current operations.
Other Real Estate Owned
Assets acquired through, or in lieu of, loan foreclosure are held for sale and are initially recorded at lower of cost or fair value less cost to sell at the date of foreclosure. Subsequent to foreclosure, valuations are periodically performed by management and the assets are carried at the lower of carrying amount or fair value less cost to sell. Revenue and expenses from operations and changes in the valuation allowance are included in net expenses from other real estate owned. The Company had $4.0 million in other real estate owned at December 31, 2010 and $6.3 million at December 31, 2009.
Transfers of Financial Assets
Transfers of financial assets, including loan participations, are accounted for as sales, when control over the assets has been surrendered. Control over transferred assets is deemed to be surrendered when (1) the assets have been isolated from the Company, (2) the transferee obtains the right (free of conditions that constrain it from taking advantage of that right) to pledge or exchange the transferred assets, and (3) the Company does not maintain effective control over the transferred assets through an agreement to repurchase them before maturity.
Income Taxes
Deferred income tax assets and liabilities are determined using the liability method. Under this method, the net deferred tax asset or liability is determined based on the tax effects of the temporary differences between the book and tax bases of the various balance sheet assets and liabilities and gives current recognition to changes in tax rates and laws.
When tax returns are filed, it is highly certain that some positions taken would be sustained upon examination by the taxing authorities, while others are subject to uncertainty about the merits of the position taken or the amount of the position that would be ultimately sustained. The benefit of a tax position is recognized in the financial statements in the period during which, based on all available evidence, management believes it is more likely than not that the position will be sustained upon examination, including the resolution of appeals or litigation processes, if any. Tax positions taken are not offset or aggregated with other positions. Tax positions that meet the more-likely-than-not recognition threshold are measured as the largest amount of tax benefit that is more than 50 percent likely of being realized upon settlement with the applicable taxing authority. The portion of the benefits associated with tax positions taken that exceeds the amount measured as described above is reflected as a liability for unrecognized tax benefits in the accompanying balance sheet along with any associated interest and penalties that would be payable to the taxing authorities upon examination. Interest and penalties associated with unrecognized tax benefits are classified as additional income taxes in the statement of income.
49
Table of Contents
Trust and Asset Management Department
Securities and other property held by the Trust and Asset Management Department in a fiduciary or agency capacity are not assets of the Company and are not included in the accompanying consolidated financial statements.
Earnings Per Share
Basic earnings per share represents income available to common shareholders divided by the weighted-average number of common shares outstanding during the period. Diluted earnings per share reflects additional common shares that would have been outstanding if dilutive potential common shares had been issued, as well as any adjustment to income that would result from the assumed issuance. There are no potential common shares that would have a dilutive effect. Shares not committed to be released under the Company’s leveraged Employee Stock Ownership Plan (ESOP) are not considered to be outstanding. See Note 11 for further information on the Company’s ESOP. The average number of common shares outstanding used to calculate basic and diluted earnings per share were 2,939,561, 2,921,129 and 2,913,011 for the years ended December 31, 2010, 2009 and 2008, respectively.
Advertising Costs
The Company follows the policy of charging the production costs of advertising to expense as incurred. Total advertising expense incurred for 2010, 2009 and 2008 was $398 thousand, $442 thousand and $371 thousand, respectively.
Reclassifications
Certain reclassifications have been made to prior period balances to conform to the current year presentation.
Recent Accounting Pronouncements
In June 2009, the FASB issued new guidance relating to the accounting for transfers of financial assets. The new guidance, which was issued as SFAS No. 166, “Accounting for Transfers of Financial Assets, an amendment to SFAS No. 140”, was adopted into Codification in December 2009 through the issuance of Accounting Standards Update (ASU) 2009-16. The new standard provides guidance to improve the relevance, representational faithfulness, and comparability of the information that an entity provides in its financial statements about a transfer of financial assets; the effects of a transfer on its financial position, financial performance, and cash flows; and a transferor’s continuing involvement, if any, in transferred financial assets. ASU 2009-16 was effective for transfers on or after January 1, 2010. The adoption of the new guidance did not have a material impact on the Company’s consolidated financial statements.
In June 2009, the FASB issued new guidance relating to variable interest entities. The new guidance, which was issued as SFAS No. 167, “Amendments to FASB Interpretation No. 46(R),” was adopted into Codification in December 2009. The objective of the guidance is to improve financial reporting by enterprises involved with variable interest entities and to provide more relevant and reliable information to users of financial statements. SFAS No. 167 was effective as of January 1, 2010. The adoption of the new guidance did not have a material impact on the Company’s consolidated financial statements.
In January 2010, the FASB issued ASU 2010-04, “Accounting for Various Topics – Technical Corrections to SEC Paragraphs.” ASU 2010-04 makes technical corrections to existing SEC guidance including the following topics: accounting for subsequent investments, termination of an interest rate swap, issuance of financial statements - subsequent events, use of residential method to value acquired assets other than goodwill, adjustments in assets and liabilities for holding gains and losses, and selections of discount rate used for measuring defined benefit obligation. The adoption of the new guidance did not have a material impact on the Company’s consolidated financial statements.
In January 2010, the FASB issued ASU 2010-06, “Fair Value Measurements and Disclosures (Topic 820): Improving Disclosures about Fair Value Measurements.” ASU 2010-06 amends Subtopic 820-10 to clarify existing disclosures, require new disclosures, and includes conforming amendments to guidance on employers’ disclosures about postretirement benefit plan assets. ASU 2010-06 is effective for interim and annual periods beginning after December 15, 2009, except for disclosures about purchases, sales, issuances, and settlements in the roll forward of activity in Level 3 fair value measurements. Those disclosures are effective for fiscal years beginning after December 15, 2010 and for interim periods within those fiscal years. The adoption of the new guidance did not have a material impact on the Company’s consolidated financial statements.
In February 2010, the FASB issued ASU 2010-09, “Subsequent Events (Topic 855): Amendments to Certain Recognition and Disclosure Requirements.” ASU 2010-09 addresses both the interaction of the requirements of Topic 855 with the SEC’s reporting requirements and the intended breadth of the reissuance disclosures provisions related to subsequent events. An entity that is an SEC filer is not required to disclose the date through which subsequent events have been evaluated. ASU 2010-09 is effective immediately. The adoption of the new guidance did not have a material impact on the Company’s consolidated financial statements.
In July 2010, the FASB issued ASU 2010-20, “Disclosures about the Credit Quality of Financing Receivables and the Allowance for Credit Losses.” The new disclosure guidance will significantly expand the existing requirements and will lead to greater transparency into a company’s exposure to credit losses from lending arrangements. The extensive new disclosures of information as of the end of a reporting period will become effective for both interim and annual reporting
50
Table of Contents
periods ending on or after December 15, 2010. Specific disclosures regarding activity that occurred before the issuance of the ASU, such as the allowance rollforward and modification disclosures, will be required for periods beginning on or after December 15, 2010. The Company has included the required disclosures in its consolidated financial statements.
On September 15, 2010, the SEC issued Release No. 33-9142, “Internal Control Over Financial Reporting In Exchange Act Periodic Reports of Non-Accelerated Filers.” This release issued a final rule adopting amendments to its rules and forms to conform them to Section 404(c) of the Sarbanes-Oxley Act of 2002 (SOX), as added by Section 989G of the Dodd-Frank Wall Street Reform and Consumer Protection Act. SOX Section 404(c) provides that Section 404(b) shall not apply with respect to any audit report prepared for an issuer that is neither an accelerated filer nor a large accelerated filer as defined in Rule 12b-2 under the Securities Exchange Act of 1934. Release No. 33-9142 was effective September 21, 2010.
On September 17, 2010, the SEC issued Release No. 33-9144, “Commission Guidance on Presentation of Liquidity and Capital Resources Disclosures in Management’s Discussion and Analysis.” This interpretive release is intended to improve discussion of liquidity and capital resources in Management’s Discussion and Analysis of Financial Condition and Results of Operations in order to facilitate understanding by investors of the liquidity and funding risks facing the registrant. This release was issued in conjunction with a proposed rule, “Short-Term Borrowings Disclosures,” that would require public companies to disclose additional information to investors about their short-term borrowing arrangements. Release No. 33-9144 was effective on September 28, 2010.
In January 2011, the FASB issued ASU 2011-01, “Deferral of the Effective Date of Disclosures about Troubled Debt Restructurings in Update No. 2010-20.” The amendments in this ASU temporarily delay the effective date of the disclosures about troubled debt restructurings in ASU 2010-20 for public entities. The delay is intended to allow the FASB time to complete its deliberations on what constitutes a troubled debt restructuring. The effective date of the new disclosures about troubled debt restructurings for public entities and the guidance for determining what constitutes a troubled debt restructuring will then be coordinated. Currently, that guidance is anticipated to be effective for interim and annual periods ending after June 15, 2011. The Company is currently assessing the impact that ASU 2011-01 will have on its consolidated financial statements.
The SEC has issued Final Rule No. 33-9002, “Interactive Data to Improve Financial Reporting”, which requires companies to submit financial statements in XBRL (extensible business reporting language) format with their SEC filings on a phased-in schedule. Large accelerated filers and foreign large accelerated filers using U.S. GAAP were required to provide interactive data reports starting with their first quarterly report for fiscal periods ending on or after June 15, 2010. All remaining filers are required to provide interactive data reports starting with their first quarterly report for fiscal periods ending on or after June 15, 2011.
Note 2. Securities
The Company invests in U.S. agency and mortgage-backed securities, obligations of states and political subdivisions, corporate equity securities and restricted securities. Restricted securities include required equity investments in certain correspondent banks which have no readily determinable market value. Amortized costs and fair values of securities available for sale at December 31, 2010 and 2009, were as follows:
| 2010 | ||||||||||||||||
| (in thousands) | ||||||||||||||||
| Amortized Cost |
Gross Unrealized Gains |
Gross Unrealized (Losses) |
Fair Value |
|||||||||||||
| U.S. agency and mortgage-backed securities |
$ | 45,627 | $ | 1,508 | $ | (211 | ) | $ | 46,924 | |||||||
| Obligations of states and political subdivisions |
13,290 | 225 | (214 | ) | 13,301 | |||||||||||
| Corporate equity securities |
23 | 172 | — | 195 | ||||||||||||
| $ | 58,940 | $ | 1,905 | $ | (425 | ) | $ | 60,420 | ||||||||
| 2009 | ||||||||||||||||
| (in thousands) | ||||||||||||||||
| Amortized Cost |
Gross Unrealized Gains |
Gross Unrealized (Losses) |
Fair Value |
|||||||||||||
| U.S. agency and mortgage-backed securities |
$ | 42,654 | $ | 1,593 | $ | (32 | ) | $ | 44,215 | |||||||
| Obligations of states and political subdivisions |
15,551 | 326 | (171 | ) | 15,706 | |||||||||||
| Corporate equity securities |
19 | 189 | — | 208 | ||||||||||||
| $ | 58,224 | $ | 2,108 | $ | (203 | ) | $ | 60,129 | ||||||||
51
Table of Contents
At December 31, 2010 and 2009, investments in an unrealized loss position that are temporarily impaired were as follows:
| 2010 | ||||||||||||||||||||||||
| (in thousands) | ||||||||||||||||||||||||
| Less than 12 months | 12 months or more | Total | ||||||||||||||||||||||
| Fair Value |
Unrealized (Loss) |
Fair Value |
Unrealized (Loss) |
Fair Value |
Unrealized (Loss) |
|||||||||||||||||||
| U.S. agency and mortgage- backed securities |
$ | 11,286 | $ | (211 | ) | $ | — | $ | — | $ | 11,286 | $ | (211 | ) | ||||||||||
| Obligations of states and political subdivisions |
2,923 | (128 | ) | 893 | (86 | ) | 3,816 | (214 | ) | |||||||||||||||
| $ | 14,209 | $ | (339 | ) | $ | 893 | $ | (86 | ) | $ | 15,102 | $ | (425 | ) | ||||||||||
| 2009 | ||||||||||||||||||||||||
| (in thousands) | ||||||||||||||||||||||||
| Less than 12 months | 12 months or more | Total | ||||||||||||||||||||||
| Fair Value |
Unrealized (Loss) |
Fair Value |
Unrealized (Loss) |
Fair Value |
Unrealized (Loss) |
|||||||||||||||||||
| U.S. agency and mortgage-backed securities |
$ | 2,101 | $ | (32 | ) | $ | — | $ | — | $ | 2,101 | $ | (32 | ) | ||||||||||
| Obligations of states and political subdivisions |
1,558 | (17 | ) | 1,785 | (154 | ) | 3,343 | (171 | ) | |||||||||||||||
| $ | 3,659 | $ | (49 | ) | $ | 1,785 | $ | (154 | ) | $ | 5,444 | $ | (203 | ) | ||||||||||
The tables above provide information about securities that have been in an unrealized loss position for less than twelve consecutive months and securities that have been in an unrealized loss position for twelve consecutive months or more. Management evaluates securities for other-than-temporary impairment at least on a quarterly basis, and more frequently when economic or market concerns warrant such evaluation. Impairment is considered to be other-than temporary if the Company (1) intends to sell the security, (2) more likely than not will be required to sell the security before recovering its cost, or (3) does not expect to recover the security’s entire amortized cost basis. Presently, the Company does not intend to sell any of these securities, will not be required to sell these securities, and expects to recover the entire amortized cost of all the securities.
At December 31, 2010, there were seven U.S. agency and mortgage-backed securities and eight obligations of state and political subdivisions in an unrealized loss position. One hundred percent of the Company’s investment portfolio is considered investment grade. The weighted-average re-pricing term of the portfolio was 3.9 years at December 31, 2010.
The amortized cost and fair value of securities available for sale at December 31, 2010 by contractual maturity are shown below. Expected maturities of mortgage-backed securities will differ from contractual maturities because borrowers may have the right to prepay obligations with or without call or prepayment penalties. Corporate equity securities are not included in the maturity categories in the following maturity summary because they do not have a stated maturity date.
| (in thousands) | ||||||||
| Amortized Cost |
Fair Value |
|||||||
| Due within one year |
$ | 408 | $ | 409 | ||||
| Due after one year through five years |
3,188 | 3,280 | ||||||
| Due after five years through ten years |
18,860 | 19,270 | ||||||
| Due after ten years |
36,461 | 37,266 | ||||||
| Corporate equity securities |
23 | 195 | ||||||
| $ | 58,940 | $ | 60,420 | |||||
Proceeds from sales and calls of securities available for sale during 2010, 2009 and 2008 were $4.4 million, $6.0 million and $4.8 million, respectively. Gross gains of $13 thousand, $10 thousand and $2 thousand were realized on those sales during 2010, 2009 and 2008, respectively. Gross losses of $20 thousand were realized on those sales during 2010.
Securities having a book value of $26.0 million and $34.9 million at December 31, 2010 and 2009 were pledged to secure other borrowings, public deposits and for other purposes required by law.
The Company’s investment in FHLB stock totaled $2.3 million at December 31, 2010. FHLB stock is generally viewed as a long-term investment and as a restricted security, which is carried at cost, because there is a minimal market for the stock. Therefore, when evaluating FHLB stock for impairment, its value is based on the ultimate recoverability of the par
52
Table of Contents
value rather than by recognizing temporary declines in value. The Company does not consider this investment to be other-than-temporarily impaired at December 31, 2010, and no impairment has been recognized. FHLB stock is shown in restricted securities on the balance sheet and is not part of the AFS securities portfolio.
Note 3. Loans
Loans at December 31, 2010 and 2009 are summarized as follows:
| (in thousands) | ||||||||
| 2010 | 2009 | |||||||
| Real estate loans: |
||||||||
| Construction |
$ | 52,591 | 55,057 | |||||
| Secured by 1-4 family residential |
121,506 | 118,675 | ||||||
| Other real estate loans |
207,371 | 201,282 | ||||||
| Commercial and industrial |
40,683 | 54,445 | ||||||
| Consumer loans |
12,879 | 13,776 | ||||||
| Total loans |
$ | 435,030 | $ | 443,235 | ||||
| Allowance for loan losses |
16,036 | 7,106 | ||||||
| Loans, net |
$ | 418,994 | $ | 436,129 | ||||
Consumer loans included $231 thousand and $157 thousand of demand deposit overdrafts at December 31, 2010 and 2009, respectively.
The Company has a credit concentration in mortgage loans on real estate. These loans totaled $381.5 million, or 88% of total loans and $375.0 million, or 85% of total loans, at December 31, 2010 and 2009, respectively. Although the Company believes that its underwriting standards are generally conservative, the ability of its borrowers to meet their mortgage obligations is dependent upon local economic conditions.
The Company has a concentration of credit risk within the loan portfolio involving loans secured by hotels. This concentration totaled $41.6 million at December 31, 2010, representing 86% of total equity and 10% of total loans. At December 31, 2009, this concentration totaled $42.9 million representing 78% of total equity and 10% of total loans. These loans are included in other real estate loans in the above table. The Company experienced no loan losses related to this identified risk during the years ended December 31, 2009 and 2008 and charged down $147 thousand related to these loans during the year ended December 31, 2010.
The following table provides a summary of loan classes and an aging of past due loans as of December 31, 2010:
| (in thousands) | ||||||||||||||||||||||||||||
| 30-59 Days Past Due |
60-89 Days Past Due |
90 Days or More Past Due and Accruing |
Nonaccrual loans |
Total Past Due |
Current | Total Loans |
||||||||||||||||||||||
| Real estate loans: |
||||||||||||||||||||||||||||
| Construction |
$ | 525 | $ | — | $ | — | $ | 5,780 | $ | 6,305 | $ | 46,286 | $ | 52,591 | ||||||||||||||
| Secured by 1-4 family residential |
2,549 | 178 | 315 | 628 | 3,670 | 117,836 | 121,506 | |||||||||||||||||||||
| Other real estate loans |
10,033 | 2,662 | 283 | 4,407 | 17,385 | 189,986 | 207,371 | |||||||||||||||||||||
| Commercial and industrial |
1,048 | 3 | — | — | 1,048 | 39,632 | 40,683 | |||||||||||||||||||||
| Consumer |
152 | 10 | — | 2 | 164 | 12,715 | 12,879 | |||||||||||||||||||||
| Total |
$ | 14,307 | $ | 2,853 | $ | 598 | $ | 10,817 | $ | 28,575 | $ | 406,455 | $ | 435,030 | ||||||||||||||
Loans past due greater than ninety days and still accruing interest at December 31, 2009 and 2008 totaled $237 thousand and $3.4 million, respectively.
Credit Quality Indicators
As part of the on-going monitoring of the credit quality of the Company’s loan portfolio, management tracks certain credit quality indicators including trends related to the risk grading of specified classes of loans.
The Company utilizes a risk grading matrix to assign a rating to each of its loans. The loan ratings are summarized into the following categories: pass, special mention, substandard, doubtful and loss. Pass rated loans include all risk rated credits other than those included in special mention, substandard or doubtful. Loans classified as loss are charged-off. Loan officers assign risk grades to loans at origination and as renewals arise. The Bank’s Credit Administration department reviews risk grades for accuracy on a quarterly basis and as delinquency issues arise. In addition, a certain amount of loans are reviewed each year through the Company’s internal and external loan review process. A description of the general characteristics of the loan grading categories is as follows:
Special Mention – Loans classified as special mention have a potential weakness that deserves management’s close attention. If left uncorrected, these potential weaknesses may result in deterioration of the repayment prospects for the loan or the Bank’s credit position at some future date.
53
Table of Contents
Substandard – Loans classified as substandard are inadequately protected by the current net worth and payment capacity of the obligor or of the collateral pledged, if any. Loans so classified have a well-defined weakness or weaknesses that jeopardize the liquidation of the debt. They are characterized by the distinct possibility that the institution will sustain some loss if the deficiencies are not corrected.
Doubtful – Loans classified as doubtful have all the weakness inherent in those classified as substandard, with the added characteristic that the weaknesses make collection or liquidation in full, on the basis of currently existing facts, conditions and values, highly questionable and improbable. The Company considers all doubtful loans to be impaired and places the loan on nonaccrual status.
The following table provides an analysis of the credit risk profile of each loan class as of December 31, 2010:
| (in thousands) | ||||||||||||||||||||
| Pass | Special Mention |
Substandard | Doubtful | Total | ||||||||||||||||
| Real estate loans: |
||||||||||||||||||||
| Construction |
$ | 21,212 | $ | 5,237 | $ | 21,471 | $ | 4,671 | $ | 52,591 | ||||||||||
| Secured by 1-4 family residential |
106,722 | 4,435 | 10,349 | — | 121,506 | |||||||||||||||
| Other real estate loans |
143,874 | 17,915 | 43,443 | 2,139 | 207,371 | |||||||||||||||
| Commercial and industrial |
34,619 | 4,033 | 2,031 | — | 40,683 | |||||||||||||||
| Consumer |
12,864 | 13 | 1 | 1 | 12,879 | |||||||||||||||
| Total |
$ | 319,291 | $ | 31,633 | $ | 77,295 | $ | 6,811 | $ | 435,030 | ||||||||||
Note 4. Allowance for Loan Losses
Transactions in the allowance for loan losses for the years ended December 31, 2010, 2009 and 2008 were as follows:
| (in thousands) | ||||||||||||
| 2010 | 2009 | 2008 | ||||||||||
| Balance at beginning of year |
$ | 7,106 | $ | 5,650 | $ | 4,207 | ||||||
| Provision charged to operating expense |
11,731 | 2,300 | 1,994 | |||||||||
| Loan recoveries |
261 | 298 | 253 | |||||||||
| Loan charge-offs |
(3,062 | ) | (1,142 | ) | (804 | ) | ||||||
| Balance at end of year |
$ | 16,036 | $ | 7,106 | $ | 5,650 | ||||||
The following table presents, as of December 31, 2010, the total allowance for loan losses, the allowance by impairment methodology and loans by impairment methodology.
| (in thousands) | ||||||||||||||||||||||||
| Commercial and Industrial |
Other Real Estate |
Construction | Secured by 1-4 Family Residential |
Consumer Loans |
Total | |||||||||||||||||||
| Allowance for loan losses: |
||||||||||||||||||||||||
| Ending Balance |
$ | 858 | $ | 9,187 | $ | 4,050 | $ | 1,681 | $ | 260 | $ | 16,036 | ||||||||||||
| Ending Balance: |
||||||||||||||||||||||||
| Individually evaluated for impairment |
36 | 5,020 | 3,006 | 536 | — | 8,597 | ||||||||||||||||||
| Collectively evaluated for impairment |
822 | 4,167 | 1,044 | 1,145 | 260 | 7,439 | ||||||||||||||||||
| Loans: |
||||||||||||||||||||||||
| Ending Balance |
40,683 | 207,371 | 52,591 | 121,506 | 12,879 | 435,030 | ||||||||||||||||||
| Ending Balance: |
||||||||||||||||||||||||
| Individually evaluated for impairment |
48 | 28,426 | 9,709 | 5,682 | — | 43,865 | ||||||||||||||||||
| Collectively evaluated for impairment |
40,635 | 178,945 | 42,882 | 115,824 | 12,879 | 391,165 | ||||||||||||||||||
54
Table of Contents
Impaired loans, which include TDR’s of $14.4 million, and the related allowance at December 31, 2010 and 2009, were as follows:
| (in thousands) | ||||||||||||||||||||||||||||
| Unpaid Principal Balance |
Recorded Investment with No Allowance |
Recorded Investment with Allowance |
Total Recorded Investment |
Related Allowance |
Average Recorded Investment |
Interest Income Recognized |
||||||||||||||||||||||
| Real estate loans: |
||||||||||||||||||||||||||||
| Construction |
$ | 10,440 | $ | 1,217 | $ | 8,492 | $ | 9,709 | $ | 3,006 | $ | 2,920 | $ | 374 | ||||||||||||||
| Secured by 1-4 family |
5,701 | 595 | 5,087 | 5,682 | 536 | 795 | 222 | |||||||||||||||||||||
| Other real estate loans |
29,480 | 7,904 | 20,522 | 28,426 | 5,020 | 18,432 | 1,345 | |||||||||||||||||||||
| Commercial and industrial |
48 | — | 48 | 48 | 36 | 163 | 4 | |||||||||||||||||||||
| Consumer |
— | — | — | — | — | — | — | |||||||||||||||||||||
| Total |
$ | 45,669 | $ | 9,716 | $ | 34,149 | $ | 43,865 | $ | 8,597 | $ | 22,310 | $ | 1,945 | ||||||||||||||
The “Recorded Investment” amounts in the table above represent the outstanding principal balance on each loan represented in the table. The “Unpaid Principal Balance” represents the outstanding principal balance on each loan represented in the table plus any amounts that have been charged off on each loan and/or payments that have been applied towards principal on nonaccrual loans.
The balance of impaired loans was $8.1 million, including TDR’s of $5.6 million, at December 31, 2009, for which there were specific valuation allowances of $1.5 million. The average balance of impaired loans for 2009 was $11.2 million.
Non-accrual loans excluded from impaired loan disclosure amounted to $2 thousand, $196 thousand and $36 thousand at December 31, 2010, 2009 and 2008, respectively. If interest on these loans had been accrued, such income would have approximated $6 thousand and $2 thousand for 2009 and 2008, respectively. For 2010, there was no income that would have been accrued on these loans.
Note 5. Premises and Equipment
Premises and equipment are summarized as follows at December 31, 2010 and 2009:
| (in thousands) | ||||||||
| 2010 | 2009 | |||||||
| Land |
$ | 4,664 | $ | 5,061 | ||||
| Buildings and leasehold improvements |
16,031 | 15,680 | ||||||
| Furniture and equipment |
9,617 | 9,382 | ||||||
| Construction in process |
485 | 532 | ||||||
| $ | 30,797 | $ | 30,655 | |||||
| Less accumulated depreciation |
10,495 | 9,507 | ||||||
| $ | 20,302 | $ | 21,148 | |||||
Depreciation expense included in operating expenses for 2010, 2009 and 2008 was $1.2 million, $1.3 million and $1.2 million, respectively.
Note 6. Deposits
The aggregate amount of time deposits, in denominations of $100 thousand or more, was $114.1 million and $125.2 million at December 31, 2010 and 2009, respectively.
The Bank obtains certain deposits through the efforts of third-party brokers. At December 31, 2010 and 2009, brokered deposits totaled $35.6 million and $42.9 million, respectively, and were included in time deposits on the Company’s financial statements.
55
Table of Contents
At December 31, 2010, the scheduled maturities of time deposits were as follows:
| (in thousands) | ||||
| 2011 |
$ | 129,352 | ||
| 2012 |
31,936 | |||
| 2013 |
20,426 | |||
| 2014 |
11,075 | |||
| 2015 |
13,062 | |||
| $ | 205,851 | |||
Note 7. Other Borrowings
The Bank had unused lines of credit totaling $127.7 million and $124.8 million available with non-affiliated banks at December 31, 2010 and 2009, respectively. These amounts primarily consist of a blanket floating lien agreement with the Federal Home Loan Bank of Atlanta in which the Bank can borrow up to 19% of its assets.
At December 31, 2010 and 2009, the Bank had borrowings from the Federal Home Loan Bank system totaling $20.0 million for both periods, which mature through March 28, 2013. The interest rate on these borrowings ranged from 1.25% to 2.44% and the weighted average rate was 2.01% at December 31, 2010. The Bank had collateral pledged on these borrowings at December 31, 2010 including real estate loans totaling $64.1 million and Federal Home Loan Bank stock with a book value of $2.3 million.
At December 31, 2010, the Bank had a $122 thousand note payable, secured by a deed of trust, for land purchased to construct a banking office, which requires monthly payments of $2 thousand, and matures January 3, 2016. The fixed interest rate on this loan is 4.00%.
The contractual maturities of other borrowings at December 31, 2010 were as follows:
| (in thousands) | ||||
| 2011 |
$ | 10,023 | ||
| 2012 |
5,023 | |||
| 2013 |
5,024 | |||
| 2014 |
25 | |||
| 2015 |
27 | |||
| $ | 20,122 | |||
Note 8. Company Obligated Mandatorily Redeemable Capital Securities
On June 8, 2004, First National (VA) Statutory Trust II (Trust II), a wholly-owned subsidiary of the Company, was formed for the purpose of issuing redeemable capital securities, commonly known as trust preferred securities. On June 17, 2004, $5.0 million of trust preferred securities were issued through a pooled underwriting. The securities have a LIBOR-indexed floating rate of interest. The interest rate at December 31, 2010 was 2.90%. The securities have a mandatory redemption date of June 17, 2034, and were subject to varying call provisions beginning June 17, 2009. The principal asset of Trust II is $5.2 million of the Company’s junior subordinated debt securities with maturities and interest rates comparable to the trust preferred securities. The Trust’s obligations under the trust preferred securities are fully and unconditionally guaranteed by the Company.
On July 24, 2006, First National (VA) Statutory Trust III (Trust III), a wholly-owned subsidiary of the Company, was formed for the purpose of issuing redeemable capital securities. On July 31, 2006, $4.0 million of trust preferred securities were issued through a pooled underwriting. The securities have a fixed rate of interest of 7.26% until July 31, 2011. The securities then have a LIBOR-indexed floating rate of interest. The securities have a mandatory redemption date of October 1, 2036, and are subject to varying call provisions beginning October 1, 2011. The principal asset of Trust III is $4.1 million of the Company’s junior subordinated debt securities with maturities and interest rates comparable to the trust preferred securities. The Trust’s obligations under the trust preferred securities are fully and unconditionally guaranteed by the Company.
While these securities are debt obligations of the Company, they are included in capital for regulatory capital ratio calculations. Under present regulations, the trust preferred securities may be included in Tier 1 capital for regulatory capital adequacy purposes as long as their amount does not exceed 25% of Tier 1 capital, including total trust preferred securities. The portion of the trust preferred securities not considered as Tier 1 capital, if any, may be included in Tier 2 capital. At December 31, 2010, the total amount of trust preferred securities issued by the Trusts was included in the Company’s Tier 1 capital.
56
Table of Contents
Note 9. Income Taxes
The Company files income tax returns in the U.S. federal jurisdiction and the state of Virginia. With few exceptions, the Company is no longer subject to U.S. federal, state and local income tax examinations by tax authorities for years prior to 2007.
Net deferred tax assets consisted of the following components at December 31, 2010 and 2009:
| (in thousands) | ||||||||
| 2010 | 2009 | |||||||
| Deferred Tax Assets |
||||||||
| Allowance for loan losses |
$ | 5,452 | $ | 2,416 | ||||
| Allowance for other real estate owned |
1,136 | 338 | ||||||
| Interest on non-accrual loans |
194 | 186 | ||||||
| Unfunded pension liability |
434 | 305 | ||||||
| Split dollar liability |
363 | 335 | ||||||
| Gain on other real estate owned |
710 | 763 | ||||||
| Other |
124 | 78 | ||||||
| $ | 8,413 | $ | 4,421 | |||||
| Deferred Tax Liabilities |
||||||||
| Depreciation |
$ | 713 | $ | 772 | ||||
| Prepaid pension |
92 | 112 | ||||||
| Securities available for sale |
445 | 648 | ||||||
| Discount accretion |
9 | 10 | ||||||
| Loan origination costs, net |
124 | 123 | ||||||
| Other |
— | 44 | ||||||
| $ | 1,383 | $ | 1,709 | |||||
| Net deferred tax assets |
$ | 7,030 | $ | 2,712 | ||||
The provision for income taxes for the years ended December 31, 2010, 2009 and 2008 consisted of the following:
| (in thousands) | ||||||||||||
| 2010 | 2009 | 2008 | ||||||||||
| Current tax expense |
$ | 1,780 | $ | 2,605 | $ | 2,499 | ||||||
| Deferred tax (benefit) |
(3,986 | ) | (1,850 | ) | (659 | ) | ||||||
| $ | (2,206 | ) | $ | 755 | $ | 1,840 | ||||||
The income tax provision (benefit) differs from the amount of income tax determined by applying the U.S. federal income tax rate to pretax income for the years ended December 31, 2010, 2009 and 2008, due to the following:
| (in thousands) | ||||||||||||
| 2010 | 2009 | 2008 | ||||||||||
| Computed tax expense (benefit) at statutory federal rate |
$ | (1,975 | ) | $ | 988 | $ | 2,061 | |||||
| Decrease in income taxes resulting from: |
||||||||||||
| Tax-exempt interest and dividend income |
(197 | ) | (202 | ) | (188 | ) | ||||||
| Other |
(34 | ) | (31 | ) | (33 | ) | ||||||
| $ | (2,206 | ) | $ | 755 | $ | 1,840 | ||||||
Note 10. Funds Restrictions and Reserve Balance
Transfers of funds from the banking subsidiary to the parent company in the form of loans, advances and cash dividends are restricted by federal and state regulatory authorities. The net loss available to common shareholders totaled $4.5 million for the year ended December 31, 2010 compared to common dividends paid to shareholders totaling $1.6 million during the same period. As a result, the Bank could not transfer funds to the Company without prior regulatory approval at December 31, 2010.
57
Table of Contents
The Bank must maintain a reserve against its deposits in accordance with Regulation D of the Federal Reserve Act. For the final weekly reporting period in the years ended December 31, 2010 and 2009, the aggregate amounts of daily average required balances were approximately $1.1 million and $710 thousand, respectively.
Note 11. Benefit Plans
Pension Plan
The Bank has a noncontributory, defined benefit pension plan for all full-time employees over 21 years of age with at least one year of credited service. Benefits are generally based upon years of service and average compensation for the five highest-paid consecutive years of service. The Bank’s funding practice has been to make at least the minimum required annual contribution permitted by the Employee Retirement Income Security Act of 1974, as amended, and the Internal Revenue Code of 1986, as amended.
In 2008, the Company adopted a change in accounting guidance for defined benefit pension and other postretirement plans. This guidance requires that defined benefit plan assets and obligations are to be measured as of the date of the employer’s fiscal year-end. As a result of this adoption, the Company was required to change the measurement date for the pension plan assets and benefit obligations from October 1 to December 31 beginning in 2008. The following table provides a reconciliation of the changes in the plan benefit obligation and the fair value of assets for the periods ended December 31, 2010, 2009 and 2008.
| (in thousands) | ||||||||||||
| 2010 | 2009 | 2008 | ||||||||||
| Change in Benefit Obligation |
||||||||||||
| Benefit obligation, beginning of year |
$ | 4,747 | $ | 4,522 | $ | 4,272 | ||||||
| Service cost |
307 | 305 | 377 | |||||||||
| Interest cost |
284 | 271 | 333 | |||||||||
| Actuarial (gain) loss |
565 | (328 | ) | (381 | ) | |||||||
| Benefits paid |
(315 | ) | (23 | ) | (79 | ) | ||||||
| Benefit obligation, end of year |
$ | 5,588 | $ | 4,747 | $ | 4,522 | ||||||
| Changes in Plan Assets |
||||||||||||
| Fair value of plan assets, beginning of year |
$ | 3,921 | $ | 2,851 | $ | 4,192 | ||||||
| Actual return on plan assets |
478 | 923 | (1,262 | ) | ||||||||
| Employer contributions |
200 | 170 | — | |||||||||
| Benefits paid |
(315 | ) | (23 | ) | (79 | ) | ||||||
| Fair value of assets, end of year |
$ | 4,284 | $ | 3,921 | $ | 2,851 | ||||||
| Funded Status, end of year |
$ | (1,303 | ) | $ | (826 | ) | $ | (1,671 | ) | |||
| Amount Recognized in Other Liabilities |
$ | (1,303 | ) | $ | (826 | ) | $ | (1,671 | ) | |||
| Amounts Recognized in Accumulated Other Comprehensive Loss, net of tax |
||||||||||||
| Net loss |
$ | 1,271 | $ | 893 | $ | 1,997 | ||||||
| Prior service cost |
6 | 9 | 12 | |||||||||
| Net obligation at transition |
— | (4 | ) | (10 | ) | |||||||
| Deferred income tax benefit |
(434 | ) | (305 | ) | (680 | ) | ||||||
| Amount recognized |
$ | 843 | $ | 593 | $ | 1,319 | ||||||
| Weighted Average Assumptions Used to Determine Benefit Obligation |
||||||||||||
| Discount rate used for disclosure |
5.50 | % | 6.00 | % | 6.00 | % | ||||||
| Expected return on plan assets |
8.00 | % | 8.00 | % | 8.50 | % | ||||||
| Rate of compensation increase |
4.00 | % | 4.00 | % | 4.00 | % | ||||||
58
Table of Contents
| (in thousands) | ||||||||||||
| 2010 | 2009 | 2008 | ||||||||||
| Components of Net Periodic Benefit Cost |
||||||||||||
| Service cost |
$ | 307 | $ | 306 | $ | 302 | ||||||
| Interest cost |
284 | 271 | 266 | |||||||||
| Expected return on plan assets |
(313 | ) | (227 | ) | (351 | ) | ||||||
| Amortization of prior service cost |
3 | 3 | 4 | |||||||||
| Amortization of net obligation at transition |
(4 | ) | (6 | ) | (6 | ) | ||||||
| Recognized net actuarial loss |
21 | 79 | 13 | |||||||||
| Net periodic benefit cost |
$ | 298 | $ | 426 | $ | 228 | ||||||
| Other Changes in Plan Assets and Benefit Obligations Recognized in Accumulated Other Comprehensive (Income) Loss |
||||||||||||
| Net (gain) loss |
$ | 378 | $ | (1,103 | ) | $ | 1,303 | |||||
| Amortization of prior service cost |
(3 | ) | (3 | ) | (4 | ) | ||||||
| Amortization of net obligation at transition |
4 | 5 | 7 | |||||||||
| Total recognized in accumulated other comprehensive (income) loss |
$ | 379 | $ | (1,101 | ) | $ | 1,306 | |||||
| Total Recognized in Net Periodic Benefit Cost and Accumulated Other Comprehensive (Income) Loss |
$ | 677 | $ | (675 | ) | $ | 1,534 | |||||
| Adjustment to Retained Earnings due to Change in Measurement Date |
||||||||||||
| Service cost |
N/A | N/A | $ | 75 | ||||||||
| Interest cost |
N/A | N/A | 67 | |||||||||
| Expected return on plan assets |
N/A | N/A | (88 | ) | ||||||||
| Amortization of prior service cost |
N/A | N/A | 1 | |||||||||
| Amortization of net obligation at transition |
N/A | N/A | (1 | ) | ||||||||
| Recognized net actuarial loss |
N/A | N/A | 3 | |||||||||
| Net periodic benefit cost |
N/A | N/A | $ | 57 | ||||||||
| Weighted Average Assumptions Used to Determine Net Periodic Benefit Cost |
||||||||||||
| Discount rate |
6.00 | % | 6.00 | % | 6.25 | % | ||||||
| Expected return on plan assets |
8.00 | % | 8.00 | % | 8.50 | % | ||||||
| Rate of compensation increase |
4.00 | % | 4.00 | % | 4.00 | % | ||||||
The plan sponsor selects the expected long-term rate of return on assets assumption in consultation with their investment advisors and actuary. This rate is intended to reflect the average rate of earnings expected to be earned on the funds invested or to be invested to provide plan benefits. Historical performance is reviewed, especially with respect to real rates of return (net of inflation), for the major asset classes held or anticipated to be held by the trust, and for the trust itself. Undue weight is not given to recent experience, which may not continue over the measurement period, with higher significance placed on current forecasts of future long-term economic conditions.
Because assets are held in a qualified trust, anticipated returns are not reduced for taxes. Further, solely for this purpose, the plan is assumed to continue in force and not terminate during the period during which assets are invested. However, consideration is given to the potential impact of current and future investment policy, cash flow into and out of the trust, and expenses (both investment and non-investment) typically paid from plan assets (to the extent such expenses are not explicitly estimated within periodic cost).
The process used to select the discount rate assumption takes into account the benefit cash flow and the segmented yields on high-quality corporate bonds that would be available to provide for the payment of the benefit cash flow. A single effective discount rate, rounded to the nearest .25%, is then established that produces an equivalent discounted present value.
The pension plan’s weighted-average asset allocations at the end of the plan year for 2010 and 2009, by asset category were as follows:
| 2010 | 2009 | |||||||
| Asset Category |
||||||||
| Mutual funds - fixed income |
36 | % | 38 | % | ||||
| Mutual funds - equity |
64 | % | 61 | % | ||||
| Other |
0 | % | 1 | % | ||||
| Total |
100 | % | 100 | % | ||||
The trust fund is sufficiently diversified to maintain a reasonable level of risk without imprudently sacrificing return, with a targeted asset allocation of 40% fixed income and 60% equities. The Investment Manager selects investment fund managers with demonstrated experience and expertise, and funds with demonstrated historical performance for the implementation of the plan’s investment strategy. The investment manager will consider both actively and passively managed investment strategies and will allocate funds across the asset classes to develop an efficient investment structure.
It is the responsibility of the trustee to administer the investments of the trust within reasonable costs, being careful to avoid sacrificing quality. These costs include, but are not limited to, management and custodial fees, consulting fees, transaction costs and other administrative costs chargeable to the trust.
59
Table of Contents
Following is a description of the valuation methodologies used for assets measured at fair value.
Fixed income and equity funds: Valued at the net asset value of shares held at year-end.
Cash and cash equivalents: Valued at cost which approximates fair value.
The following tables set forth by level, within the fair value hierarchy, the Company’s pension plan assets at fair value as of December 31, 2010 and 2009:
| Fair Value Measurements at December 31, 2010 (in thousands) |
||||||||||||||||
| Total | Level 1 | Level 2 | Level 3 | |||||||||||||
| Fixed income funds |
$ | 1,563 | $ | 1,563 | — | — | ||||||||||
| Equity funds |
2,721 | 2,721 | — | — | ||||||||||||
| Total |
$ | 4,284 | $ | 4,284 | $ | — | $ | — | ||||||||
| Fair Value Measurements at December 31, 2009 (in thousands) |
||||||||||||||||
| Total | Level 1 | Level 2 | Level 3 | |||||||||||||
| Cash and cash equivalents |
$ | 38 | $ | 38 | $ | — | $ | — | ||||||||
| Fixed income funds |
1,494 | 1,494 | — | — | ||||||||||||
| Equity funds |
2,389 | 2,389 | — | — | ||||||||||||
| Total |
$ | 3,921 | $ | 3,921 | $ | — | $ | — | ||||||||
The Company made cash contributions of $240 thousand and $200 thousand for the 2010 and 2009 plan years, respectively, and expects to contribute $366 thousand for the 2011 plan year. The accumulated benefit obligation for the defined benefit pension plan was $3.8 million and $3.2 million at December 31, 2010 and 2009, respectively.
Estimated future benefit payments, which reflect expected future service, as appropriate, were as follows at December 31, 2010:
| (in thousands) | ||||
| 2011 |
$ | 24 | ||
| 2012 |
24 | |||
| 2013 |
45 | |||
| 2014 |
54 | |||
| 2015 |
83 | |||
| Years 2016-2020 |
1,236 | |||
401(k) Plan
The Company maintains a 401(k) plan for all eligible employees. Participating employees may elect to contribute up to the maximum percentage allowed by the Internal Revenue Service, as defined in the plan. The Company makes matching contributions up to the first three percent of an employee’s compensation contributed to the Plan. The amount that the Company matches is contributed for the benefit of the respective employee to the employee stock ownership plan (ESOP). All employees who are age nineteen or older are eligible. Employee contributions vest immediately. Employer matching contributions vest after three plan service years with the Company. The Company has the discretion to make a profit sharing contribution to the plan each year based on overall performance, profitability, and other economic factors. For the years ended December 31, 2010, 2009 and 2008, expense attributable to the Plan amounted to $164 thousand, $103 thousand and $150 thousand, respectively.
Employee Stock Ownership Plan
On January 1, 2000, the Company established an employee stock ownership plan. The ESOP provides an opportunity for the Company to award shares of First National Corporation stock to employees at its discretion. Employees are eligible to participate in the ESOP effective immediately upon beginning service with the Company. Participants become 100% vested after three years of credited service. In addition to the 401(k) matching contributions made by the Company to the ESOP, the Board of Directors may make discretionary contributions, within certain limitations prescribed by federal tax regulations.
Until April 26, 2010, the ESOP operated as a leveraged ESOP. The ESOP’s debt was incurred when the Company loaned the ESOP $570 thousand from the proceeds the Company received from its bank note payable. The ESOP shares initially were pledged as collateral for its debt. As the debt was repaid, shares were released from collateral and allocated to employees, based on the proportion of debt service paid in the year. The shares were deducted from shareholders’ equity as unearned ESOP shares in the accompanying balance sheets. As shares were released from collateral, the Company reported compensation expense equal to the current market price of the shares, and the shares became outstanding for EPS computations. Dividends on allocated ESOP shares were recorded as a reduction of retained earnings; dividends on unallocated ESOP shares were recorded as a reduction of debt and accrued interest. The ESOP’s debt was repaid on April 26, 2010. Therefore, the ESOP is no longer operating as a leveraged ESOP.
60
Table of Contents
There was no compensation expense for the ESOP for the years ended December 31, 2010, 2009 and 2008.
Shares of the Company held by the ESOP at December 31, 2010, 2009 and 2008, are as follows:
| 2010 | 2009 | 2008 | ||||||||||
| Allocated shares |
53,167 | 44,014 | 36,980 | |||||||||
| Unreleased shares |
— | 1,543 | 8,618 | |||||||||
| Total ESOP shares |
53,167 | 45,557 | 45,598 | |||||||||
| Fair value of unreleased shares (in thousands) |
$ | — | $ | 15 | $ | 140 | ||||||
Split Dollar Life Insurance Plan
On January 6, 1999, the Bank adopted a Director Split Dollar Life Insurance Plan. This Plan provides life insurance coverage to insurable outside directors of the Bank. The Bank owns the policies and is entitled to all values and proceeds. The Plan provides retirement benefits and the payment of benefits at the death of the insured director. The amount of benefits will be determined by the performance of the policies over the director’s life.
Accounting guidance requires a company to recognize an obligation over the director’s service period based upon the substantive agreement with the director such as the promise to maintain a life insurance policy or provide a death benefit postretirement. The Company adopted new accounting guidance on January 1, 2008 as a change in accounting principle through a cumulative-effect adjustment to retained earnings totaling $651 thousand. The related effect on net income recognized during the years ended December 31, 2010 and 2009 was expense of $36 thousand and a benefit of $42 thousand, respectively.
Note 12. Commitments and Unfunded Credits
The Company, through its banking subsidiary is a party to credit related financial instruments with risk not reflected in the consolidated financial statements in the normal course of business to meet the financing needs of its customers. These financial instruments include commitments to extend credit, standby letters of credit and commercial letters of credit. Such commitments involve, to varying degrees, elements of credit and interest rate risk in excess of the amount recognized in the consolidated balance sheets.
The Bank’s exposure to credit loss is represented by the contractual amount of these commitments. The Bank follows the same credit policies in making commitments as it does for on-balance-sheet instruments.
At December 31, 2010 and 2009, the following financial instruments were outstanding whose contract amounts represent credit risk:
| (in thousands) | ||||||||
| 2010 | 2009 | |||||||
| Commitments to extend credit and unfunded commitments under lines of credit |
$ | 53,494 | $ | 46,211 | ||||
| Stand-by letters of credit |
6,917 | 6,002 | ||||||
Commitments to extend credit are agreements to lend to a customer as long as there is no violation of any condition established in the contract. Commitments generally have fixed expiration dates or other termination clauses and may require payment of a fee. The commitments for lines of credit may expire without being drawn upon. Therefore, the total commitment amounts do not necessarily represent future cash requirements. The amount of collateral obtained, if it is deemed necessary by the Bank, is based on management’s credit evaluation of the customer.
Unfunded commitments under commercial lines of credit, revolving credit lines and overdraft protection agreements are commitments for possible future extensions of credit to existing customers. These lines of credit are collateralized as deemed necessary and usually do not contain a specified maturity date and may not be drawn upon to the total extent to which the Bank is committed.
Commercial and standby letters of credit are conditional commitments issued by the Bank to guarantee the performance of a customer to a third party. Those letters of credit are primarily issued to support public and private borrowing arrangements. Essentially all letters of credit issued have expiration dates within one year. The credit risk involved in issuing letters of credit is essentially the same as that involved in extending loan facilities to customers. The Bank generally holds collateral supporting those commitments if deemed necessary.
61
Table of Contents
At December 31, 2010, the Bank had no locked-rate commitments to originate mortgage loans and had $271 thousand in loans held for sale. Risks arise from the possible inability of counterparties to meet the terms of their contracts. The Bank does not expect any counterparty to fail to meet its obligations.
The Bank has cash accounts in other commercial banks. The amount on deposit at these banks at December 31, 2010 exceeded the insurance limits of the Federal Deposit Insurance Corporation by $28 thousand.
Note 13. Transactions with Related Parties
During the year, executive officers and directors (and companies controlled by them) were customers of and had transactions with the Company in the normal course of business. These transactions were made on substantially the same terms as those prevailing for other customers.
At December 31, 2010 and 2009, these loans totaled $11.7 million and $11.1 million, respectively. During 2010, total principal additions were $1.3 million and total principal payments were $660 thousand.
Deposits from related parties held by the Bank at December 31, 2010 and 2009 amounted to $4.2 million and $3.1 million, respectively.
Note 14. Lease Commitments
The Company was obligated under noncancelable leases for banking premises. Total rental expense for operating leases for 2010, 2009 and 2008 was $242 thousand, $227 thousand and $162 thousand, respectively. Minimum rental commitments under noncancelable leases with terms in excess of one year as of December 31, 2010 were as follows:
| (in thousands) | ||||
| Operating Leases |
||||
| 2011 |
$ | 192 | ||
| 2012 |
181 | |||
| 2013 |
157 | |||
| 2014 |
101 | |||
| 2015 |
91 | |||
| 2016 and thereafter |
85 | |||
| Total minimum payments |
$ | 807 | ||
Note 15. Dividend Reinvestment Plan
The Company has in effect a Dividend Reinvestment Plan (DRIP) which provides an automatic conversion of dividends into common stock for enrolled shareholders. Stock was purchased on the open market on each dividend payable date during the first two quarters of 2009. On August 5, 2009, the Board of Directors of the Company passed a resolution authorizing the Company to issue common shares to the DRIP, beginning on the next dividend payment date, September 11, 2009. Common shares are purchased at a price which is based on the average closing prices of the shares as quoted on the Over-the-Counter Bulletin Board Market for the 10 business days immediately preceding the dividend payment date.
The Company issued 17,180 and 8,861 common shares to the DRIP during the years ended December 31, 2010 and 2009, respectively. The Company purchased 6,631 and 10,193 shares on the open market for the years ended December 31, 2009 and 2008, respectively.
Note 16. Fair Value Measurements
Determination of Fair Value
The Company uses fair value measurements to record fair value adjustments to certain assets and liabilities and to determine fair value disclosures. In accordance with the “Fair Value Measurement and Disclosures” topic of FASB ASC, the fair value of a financial instrument is the price that would be received to sell an asset or paid to transfer a liability in an orderly transaction between market participants at the measurement date. Fair value is best determined based upon quoted market prices. However, in many instances, there are no quoted market prices for the Company’s various financial instruments. In cases where quoted market prices are not available, fair values are based on estimates using present value or other valuation techniques. Those techniques are significantly affected by the assumptions used, including the discount rate and estimates of future cash flows. Accordingly, the fair value estimates may not be realized in an immediate settlement of the instrument.
The recent fair value guidance provides a consistent definition of fair value, which focuses on exit price in an orderly transaction (that is, not a forced liquidation or distressed sale) between market participants at the measurement date under current market conditions. If there has been a significant decrease in the volume and level of activity for the asset or liability, a change in valuation technique or the use of multiple valuation techniques may be appropriate. In such instances,
62
Table of Contents
determining the price at which willing market participants would transact at the measurement date under current market conditions depends on the facts and circumstances and requires the use of significant judgment. The fair value is a reasonable point within the range that is most representative of fair value under current market conditions.
Fair Value Hierarchy
In accordance with this guidance, the Company groups its financial assets and financial liabilities generally measured at fair value in three levels, based on the markets in which the assets and liabilities are traded and the reliability of the assumptions used to determine fair value.
| Level 1 – | Valuation is based on quoted prices in active markets for identical assets or liabilities that the reporting entity has the ability to access at the measurement date. Level 1 assets and liabilities generally include debt and equity securities that are traded in an active exchange market. Valuations are obtained from readily available pricing sources for market transactions involving identical assets or liabilities. | |
| Level 2 – | Valuation is based on inputs other than quoted prices included within Level 1 that are observable for the asset or liability, either directly or indirectly. The valuation may be based on quoted prices for similar assets or liabilities; quoted prices in markets that are not active; or other inputs that are observable or can be corroborated by observable market data for substantially the full term of the asset or liability. | |
| Level 3 – | Valuation is based on unobservable inputs that are supported by little or no market activity and that are significant to the fair value of the assets or liabilities. Level 3 assets and liabilities include financial instruments whose value is determined using pricing models, discounted cash flow methodologies, or similar techniques, as well as instruments for which determination of fair value requires a significant management judgment or estimation. | |
A financial instrument’s categorization within the valuation hierarchy is based upon the lowest level of input that is significant to the fair value measurement.
The following describes the valuation techniques used by the Company to measure certain financial assets and liabilities recorded at fair value on a recurring basis in the financial statements:
Securities available for sale
Securities available for sale are recorded at fair value on a recurring basis. Fair value measurement is based upon quoted market prices, when available (Level 1). If quoted market prices are not available, fair values are measured utilizing independent valuation techniques of identical or similar securities for which significant assumptions are derived primarily from or corroborated by observable market data. Third party vendors compile prices from various sources and may determine the fair value of identical or similar securities by using pricing models that considers observable market data (Level 2).
The following tables present the balances of financial assets measured at fair value on a recurring basis as of December 31, 2010 and 2009.
| Fair Value Measurements at December 31, 2010 Using (in thousands) |
||||||||||||||||
| Description |
Balance as of December 31, 2010 |
Quoted Prices in Active Markets for Identical Assets (Level 1) |
Significant Other Observable Inputs (Level 2) |
Significant Unobservable Inputs (Level 3) |
||||||||||||
| Assets |
||||||||||||||||
| Securities available for sale |
||||||||||||||||
| U.S. agency and mortgage-backed securities |
$ | 46,924 | $ | — | $ | 46,924 | — | |||||||||
| Obligations of states and political subdivisions |
13,301 | — | 13,301 | — | ||||||||||||
| Corporate equity securities |
195 | 195 | — | — | ||||||||||||
| $ | 60,420 | $ | 195 | $ | 60,225 | $ | — | |||||||||
63
Table of Contents
| Fair Value Measurements at December 31, 2009 Using (in thousands) |
||||||||||||||||
| Description |
Balance as of December 31, 2009 |
Quoted Prices in Active Markets for Identical Assets (Level 1) |
Significant Other Observable Inputs (Level 2) |
Significant Unobservable Inputs (Level 3) |
||||||||||||
| Assets |
||||||||||||||||
| Securities available for sale |
||||||||||||||||
| U.S. agency and mortgage-backed securities |
$ | 44,215 | $ | — | $ | 44,215 | $ | — | ||||||||
| Obligations of states and political subdivisions |
15,706 | — | 15,706 | — | ||||||||||||
| Corporate equity securities |
208 | 208 | — | — | ||||||||||||
| $ | 60,129 | $ | 208 | $ | 59,921 | $ | — | |||||||||
Certain assets are measured at fair value on a nonrecurring basis in accordance with GAAP. Adjustments to the fair value of these assets usually result from the application of lower-of-cost-or-market accounting or write-downs of individual assets.
The following describes the valuation techniques used by the Company to measure certain assets recorded at fair value on a nonrecurring basis in the financial statements:
Loans held for sale
Loans held for sale are carried at the lower of cost or market value. These loans currently consist of one-to-four family residential loans originated for sale in the secondary market. Fair value is based on the price secondary markets are currently offering for similar loans using observable market data which is not materially different than cost due to the short duration between origination and sale (Level 2). As such, the Company records any fair value adjustments on a nonrecurring basis. No nonrecurring fair value adjustments were recorded on loans held for sale during the years ended December 31, 2010 and 2009.
Impaired Loans
Loans are designated as impaired when, in the judgment of management based on current information and events, it is probable that all amounts due according to the contractual terms of the loan agreement will not be collected. The measurement of loss associated with impaired loans can be based on either the net present value of expected future cash flows, the observable market price of the loan or the fair value of the collateral. Fair value is measured based on the value of the collateral securing the loans. Collateral may be in the form of real estate or business assets including equipment, inventory, and accounts receivable. The vast majority of the collateral is real estate. The value of real estate collateral is determined utilizing an income or market valuation approach based on an appraisal conducted by an independent, licensed appraiser outside of the Company using observable market data (Level 2). However, if the collateral is a house or building in the process of construction or if an appraisal of the real estate property is over two years old, then the fair value is considered Level 3. The value of business equipment is based upon an outside appraisal if deemed significant, or the net book value on the applicable business’s financial statements if not considered significant using observable market data. Likewise, values for inventory and accounts receivables collateral are based on financial statement balances or aging reports (Level 3). Impaired loans allocated to the Allowance for Loan Losses are measured at fair value on a nonrecurring basis. Any fair value adjustments are recorded in the period incurred as provision for loan losses on the Consolidated Statements of Operations.
Other real estate owned
Loans are transferred to other real estate owned when the collateral securing them is foreclosed on or acquired through a deed in lieu of foreclosure. The measurement of loss associated with other real estate owned is based on the fair value of the collateral compared to the unpaid loan balance and anticipated costs to sell the property. If there is a contract for the sale of a property, and management reasonably believes the contract will be executed, fair value is based on the sale price in that contract (Level 1). Lacking such a contract, the value of real estate collateral is determined utilizing an income or market valuation approach based on an appraisal conducted by an independent, licensed appraiser outside of the Company using observable market data (Level 2). However, if the collateral is a house or building in the process of construction or if an appraisal of the real estate property is over two years old, then the fair value is considered Level 3. Any fair value adjustments to other real estate owned are recorded in the period incurred and expensed against current earnings.
64
Table of Contents
The following tables summarize the Company’s financial assets that were measured at fair value on a nonrecurring basis as of December 31, 2010 and 2009.
| Carrying Value at December 31, 2010 (in thousands) |
||||||||||||||||
| Description |
Balance as of December 31, 2010 |
Quoted Prices in Active Markets for Identical Assets (Level 1) |
Significant Other Observable Inputs (Level 2) |
Significant Unobservable Inputs (Level 3) |
||||||||||||
| Assets |
||||||||||||||||
| Impaired loans |
$ | 25,552 | $ | — | $ | 17,584 | $ | 7,968 | ||||||||
| Carrying Value at December 31, 2009 (in thousands) |
||||||||||||||||
| Description |
Balance as of December 31, 2009 |
Quoted Prices in Active Markets for Identical Assets (Level 1) |
Significant Other Observable Inputs (Level 2) |
Significant Unobservable Inputs (Level 3) |
||||||||||||
| Assets |
||||||||||||||||
| Impaired loans |
$ | 5,806 | $ | — | $ | 5,771 | $ | 35 | ||||||||
The following table summarizes the Company’s nonfinancial assets that were measured at fair value on a nonrecurring basis as of December 31, 2010.
| Carrying Value at December 31, 2010 (in thousands) |
||||||||||||||||
| Description |
Balance as of December 31, 2010 |
Quoted Prices in Active Markets for Identical Assets (Level 1) |
Significant Other Observable Inputs (Level 2) |
Significant Unobservable Inputs (Level 3) |
||||||||||||
| Assets |
||||||||||||||||
| Other real estate owned |
$ | 3,961 | $ | — | $ | 3,961 | $ | — | ||||||||
| Carrying Value at December 31, 2009 (in thousands) |
||||||||||||||||
| Description |
Balance as of December 31, 2009 |
Quoted Prices in Active Markets for Identical Assets (Level 1) |
Significant Other Observable Inputs (Level 2) |
Significant Unobservable Inputs (Level 3) |
||||||||||||
| Assets |
||||||||||||||||
| Other real estate owned |
$ | 6,261 | $ | — | $ | 6,261 | $ | — | ||||||||
The fair value of a financial instrument is the current amount that would be exchanged between willing parties, other than in a forced liquidation. Fair value is best determined based upon quoted market prices. However, in many instances, there are no quoted market prices for the Company’s various financial instruments. In cases where quoted market prices are not available, fair values are based on estimates using present value or other valuation techniques. Those techniques are significantly affected by the assumptions used, including the discount rate and estimates of future cash flows. Accordingly, the fair value estimates may not be realized in an immediate settlement of the instrument. Certain financial instruments and all nonfinancial instruments are excluded from disclosure requirements. Accordingly, the aggregate fair value amounts presented may not necessarily represent the underlying fair value of the Company.
65
Table of Contents
Accounting guidance requires disclosure of the fair value of financial assets and financial liabilities, including those financial assets and financial liabilities that are not measured and reported at fair value on a recurring basis or non-recurring basis. The methodologies for estimating the fair value of financial assets and financial liabilities that are measured at fair value on a recurring or non-recurring basis are discussed above. The methodologies for other financial assets and financial liabilities are discussed below:
Cash and Cash Equivalents and Federal Funds Sold
The carrying amounts of cash and short-term instruments approximate fair values.
Loans
For variable-rate loans that re-price frequently and with no significant change in credit risk, fair values are based on carrying values. Fair values for all other loans are estimated using discounted cash flow analyses, using interest rates currently being offered for loans with similar terms to borrowers of similar credit quality. Fair values for nonperforming loans are estimated using discounted cash flow analyses or underlying collateral values, where applicable.
Deposit Liabilities
The fair value of demand deposits, savings accounts, and certain money market deposits is the amount payable on demand at the reporting date. The fair value of fixed-maturity certificates of deposit is estimated using the rates currently offered for deposits of similar remaining maturities.
Accrued Interest
The carrying amounts of accrued interest approximate fair value.
Borrowings
The carrying amounts of federal funds purchased and other short-term borrowings maturing within ninety days approximate their fair values. Fair values of all other borrowings are estimated using discounted cash flow analyses based on the Company’s current incremental borrowing rates for similar types of borrowing arrangements.
Commitments and Unfunded Credits
The fair value of commitments to extend credit is estimated using the fees currently charged to enter into similar agreements, taking into account the remaining terms of the agreements and the present creditworthiness of the counterparties. For fixed-rate loan commitments, fair value also considers the difference between current levels of interest rates and the committed rates.
The fair value of stand-by letters of credit is based on fees currently charged for similar agreements or on the estimated cost to terminate them or otherwise settle the obligations with the counterparties at the reporting date. At December 31, 2010 and 2009, fair value of loan commitments and standby letters of credit was immaterial.
The estimated fair values of the Company’s financial instruments at December 31, 2010 and 2009 were as follows:
| (in thousands) | ||||||||||||||||
| 2010 | 2009 | |||||||||||||||
| Carrying Amount |
Fair Value |
Carrying Amount |
Fair Value |
|||||||||||||
| Financial Assets |
||||||||||||||||
| Cash and short-term investments |
$ | 23,497 | $ | 23,497 | $ | 14,977 | $ | 14,977 | ||||||||
| Securities available for sale |
60,420 | 60,420 | 60,129 | 60,129 | ||||||||||||
| Loans, net |
418,994 | 420,011 | 436,129 | 434,457 | ||||||||||||
| Loans held for sale |
271 | 271 | 210 | 210 | ||||||||||||
| Accrued interest receivable |
1,667 | 1,667 | 1,710 | 1,710 | ||||||||||||
| Financial Liabilities |
||||||||||||||||
| Deposits |
$ | 463,500 | $ | 433,300 | $ | 463,886 | $ | 421,115 | ||||||||
| Other borrowings |
20,122 | 20,400 | 20,186 | 20,527 | ||||||||||||
| Company obligated mandatorily redeemable capital securities |
9,279 | 9,279 | 9,279 | 9,784 | ||||||||||||
| Accrued interest payable |
551 | 551 | 824 | 824 | ||||||||||||
66
Table of Contents
The Company assumes interest rate risk (the risk that general interest rate levels will change) as a result of its normal operations. As a result, the fair values of the Company’s financial instruments will change when interest rate levels change and that change may be either favorable or unfavorable to the Company. Management attempts to match maturities of assets and liabilities to the extent believed necessary to minimize interest rate risk. However, borrowers with fixed rate obligations are less likely to prepay in a rising rate environment and more likely to prepay in a falling rate environment. Conversely, depositors who are receiving fixed rates are more likely to withdraw funds before maturity in a rising rate environment and less likely to do so in a falling rate environment. Management monitors rates and maturities of assets and liabilities and attempts to minimize interest rate risk by adjusting terms of new loans and deposits and by investing in securities with terms that mitigate the Company’s overall interest rate risk.
Note 17. Regulatory Matters
The Company (on a consolidated basis) and the Bank are subject to various regulatory capital requirements administered by the federal banking agencies. Failure to meet minimum capital requirements can initiate certain mandatory and possibly additional discretionary actions by regulators that, if undertaken, could have a direct material effect on the Company’s and the Bank’s financial statements. Under capital adequacy guidelines and the regulatory framework for prompt corrective action, the Company and the Bank must meet specific capital guidelines that involve quantitative measures of their assets, liabilities, and certain off-balance-sheet items as calculated under regulatory accounting practices. The capital amounts and classification are also subject to qualitative judgments by the regulators about components, risk weightings and other factors. Prompt corrective action provisions are not applicable to bank holding companies.
Quantitative measures established by regulation to ensure capital adequacy require the Company and the Bank to maintain minimum amounts and ratios (set forth in the following table) of total (as defined in the regulations) and Tier 1 capital (as defined) to risk-weighted assets (as defined), and of Tier 1 capital to average assets. Management believes, as of December 31, 2010 and 2009, that the Company and the Bank met all capital adequacy requirements to which they are subject.
As of December 31, 2010, the most recent notification from the Federal Reserve Bank categorized the Bank as well capitalized under the regulatory framework for prompt corrective action. To be categorized as well capitalized, the Bank must maintain minimum total risk-based, Tier 1 risk-based, and Tier 1 leverage ratios as set forth in the following table. There are no conditions or events since that notification that management believes have changed the Bank’s category.
The Company’s and the Bank’s actual capital amounts and ratios are also presented in the following table.
| (amounts in thousands) | Minimum To Be Well | |||||||||||||||||||||||
| Actual | Minimum
Capital Requirement |
Capitalized Under Prompt Corrective Action Provisions |
||||||||||||||||||||||
| Amount | Ratio | Amount | Ratio | Amount | Ratio | |||||||||||||||||||
| December 31, 2010: |
||||||||||||||||||||||||
| Total Capital (to Risk Weighted Assets): |
||||||||||||||||||||||||
| Company |
$ | 63,163 | 14.18 | % | 35,624 | 8.00 | % | N/A | N/A | |||||||||||||||
| Bank |
$ | 62,550 | 14.06 | % | 35,584 | 8.00 | % | $ | 44,480 | 10.00 | % | |||||||||||||
| Tier 1 Capital (to Risk Weighted Assets): |
||||||||||||||||||||||||
| Company |
$ | 57,467 | 12.91 | % | 17,812 | 4.00 | % | N/A | N/A | |||||||||||||||
| Bank |
$ | 56,861 | 12.78 | % | 17,792 | 4.00 | % | $ | 26,688 | 6.00 | % | |||||||||||||
| Tier 1 Capital (to Average Assets): |
||||||||||||||||||||||||
| Company |
$ | 57,467 | 10.54 | % | 21,810 | 4.00 | % | N/A | N/A | |||||||||||||||
| Bank |
$ | 56,861 | 10.40 | % | 21,859 | 4.00 | % | $ | 27,324 | 5.00 | % | |||||||||||||
| December 31, 2009: |
||||||||||||||||||||||||
| Total Capital (to Risk Weighted Assets): |
||||||||||||||||||||||||
| Company |
$ | 68,892 | 14.96 | % | 36,848 | 8.00 | % | N/A | N/A | |||||||||||||||
| Bank |
$ | 68,296 | 14.84 | % | 36,815 | 8.00 | % | $ | 46,019 | 10.00 | % | |||||||||||||
| Tier 1 Capital (to Risk Weighted Assets): |
||||||||||||||||||||||||
| Company |
$ | 63,118 | 13.70 | % | 18,424 | 4.00 | % | N/A | N/A | |||||||||||||||
| Bank |
$ | 62,527 | 13.59 | % | 18,408 | 4.00 | % | $ | 27,611 | 6.00 | % | |||||||||||||
| Tier 1 Capital (to Average Assets): |
||||||||||||||||||||||||
| Company |
$ | 63,118 | 11.50 | % | 21,961 | 4.00 | % | N/A | N/A | |||||||||||||||
| Bank |
$ | 62,527 | 11.37 | % | 21,995 | 4.00 | % | $ | 27,494 | 5.00 | % | |||||||||||||
67
Table of Contents
Note 18. Capital Purchase Program
On March 13, 2009, the Company entered into a Letter Agreement and Securities Purchase Agreement—Standard Terms (collectively, the Purchase Agreement) with the Treasury Department, pursuant to which the Company sold (i) 13,900 shares of its Fixed Rate Cumulative Perpetual Preferred Stock, Series A, par value $1.25 per share and liquidation preference $1,000 per share (the Preferred Stock) and (ii) a warrant (the Warrant) to purchase 695 shares of its Fixed Rate Cumulative Perpetual Preferred Stock, Series B (the Warrant Preferred Stock), at an exercise price of $1.25 per share, for an aggregate purchase price of $13.9 million in cash. The Treasury immediately exercised the Warrant and, after net settlement, received 695 shares of the Company’s Warrant Preferred Stock, which has a liquidation preference amount of $1,000 per share. Closing of the sale occurred on March 13, 2009 and increased Tier 1 and total capital by $13.9 million. The Preferred Stock pays cumulative dividends at a rate of 5% per annum for the first five years, and thereafter at a rate of 9% per annum. The Warrant Preferred Stock pays cumulative dividends at a rate of 9% per annum from the date of issuance. The discount on the Preferred Stock is amortized over a five year period using the constant effective yield method.
68
Table of Contents
Note 19. Parent Company Only Financial Statements
FIRST NATIONAL CORPORATION
(Parent Company Only)
Balance Sheets
December 31, 2010 and 2009
(in thousands)
| 2010 | 2009 | |||||||
| Assets |
||||||||
| Cash |
$ | 91 | $ | 110 | ||||
| Investment in subsidiaries, at cost, plus undistributed net income |
57,058 | 63,413 | ||||||
| Other assets |
693 | 684 | ||||||
| Total assets |
$ | 57,842 | $ | 64,207 | ||||
| Liabilities and Shareholders’ Equity |
||||||||
| Deferred income tax liability |
$ | 59 | $ | 64 | ||||
| Note payable |
— | 42 | ||||||
| Company obligated mandatorily redeemable capital securities |
9,279 | 9,279 | ||||||
| Other liabilities |
6 | 15 | ||||||
| Total liabilities |
$ | 9,344 | $ | 9,400 | ||||
| Preferred stock |
$ | 14,127 | $ | 13,998 | ||||
| Common stock |
3,686 | 3,664 | ||||||
| Surplus |
1,582 | 1,418 | ||||||
| Retained earnings, which are substantially undistributed earnings of subsidiaries |
28,969 | 35,104 | ||||||
| Unearned ESOP shares |
— | (42 | ) | |||||
| Accumulated other comprehensive income, net |
134 | 665 | ||||||
| Total shareholders’ equity |
$ | 48,498 | $ | 54,807 | ||||
| Total liabilities and shareholders’ equity |
$ | 57,842 | $ | 64,207 | ||||
69
Table of Contents
FIRST NATIONAL CORPORATION
(Parent Company Only)
Statements of Operations
Three Years Ended December 31, 2010
(in thousands)
| 2010 | 2009 | 2008 | ||||||||||
| Income |
||||||||||||
| Dividends from subsidiary |
$ | 2,575 | $ | 2,575 | $ | 5,118 | ||||||
| Other |
11 | (30 | ) | 3 | ||||||||
| $ | 2,586 | $ | 2,545 | $ | 5,121 | |||||||
| Expense |
||||||||||||
| Interest expense |
$ | 439 | $ | 470 | $ | 642 | ||||||
| Stationery and supplies |
18 | 34 | 24 | |||||||||
| Legal and professional fees |
20 | 75 | 59 | |||||||||
| Other |
53 | 62 | 118 | |||||||||
| Total expense |
$ | 530 | $ | 641 | $ | 843 | ||||||
| Income before allocated tax benefits and undistributed income of subsidiary |
$ | 2,056 | $ | 1,904 | $ | 4,278 | ||||||
| Allocated income tax benefits |
176 | 228 | 286 | |||||||||
| Income before equity in undistributed income of subsidiary |
$ | 2,232 | $ | 2,132 | $ | 4,564 | ||||||
| Equity in (distributions in excess of) undistributed income of subsidiary |
(5,835 | ) | 17 | (341 | ) | |||||||
| Net (loss) income |
$ | (3,603 | ) | $ | 2,149 | $ | 4,223 | |||||
| Effective dividend and accretion on preferred stock |
887 | 704 | — | |||||||||
| Net (loss) income available to common shareholders |
$ | (4,490 | ) | $ | 1,445 | $ | 4,223 | |||||
70
Table of Contents
FIRST NATIONAL CORPORATION
(Parent Company Only)
Statements of Cash Flows
Three Years Ended December 31, 2010
(in thousands)
| 2010 | 2009 | 2008 | ||||||||||
| Cash Flows from Operating Activities |
||||||||||||
| Net income (loss) |
$ | (3,603 | ) | $ | 2,149 | $ | 4,223 | |||||
| Adjustments to reconcile net income (loss) to net cash provided by operating activities: |
||||||||||||
| (Undistributed) distributions in excess of earnings of subsidiaries |
5,835 | (17 | ) | 341 | ||||||||
| Compensation expense for ESOP shares allocated |
42 | 190 | 147 | |||||||||
| (Increase) decrease in other assets |
(23 | ) | 42 | 184 | ||||||||
| Increase (decrease) in other liabilities |
(9 | ) | 7 | (13 | ) | |||||||
| Net cash provided by operating activities |
$ | 2,240 | $ | 2,371 | $ | 4,882 | ||||||
| Cash Flows from Financing Activities |
||||||||||||
| Principal payments on company obligated mandatorily redeemable capital securities |
$ | — | $ | — | $ | (3,093 | ) | |||||
| Principal payments on other borrowings |
(42 | ) | (190 | ) | (147 | ) | ||||||
| Proceeds from issuance of preferred stock |
— | 13,900 | — | |||||||||
| Distribution of capital to subsidiary |
— | (13,900 | ) | — | ||||||||
| Cash dividends paid on common stock |
(1,433 | ) | (1,529 | ) | (1,630 | ) | ||||||
| Cash dividends paid on preferred stock |
(758 | ) | (509 | ) | — | |||||||
| Shares issued to leveraged ESOP |
(26 | ) | (85 | ) | (44 | ) | ||||||
| Net cash used in financing activities |
$ | (2,259 | ) | $ | (2,313 | ) | $ | (4,914 | ) | |||
| Increase (decrease) in cash and cash equivalents |
$ | (19 | ) | $ | 58 | $ | (32 | ) | ||||
| Cash and Cash Equivalents |
||||||||||||
| Beginning |
110 | 52 | 84 | |||||||||
| Ending |
$ | 91 | $ | 110 | $ | 52 | ||||||
71
Table of Contents
Item 9. Changes in and Disagreements with Accountants on Accounting and Financial Disclosure
None.
Item 9A. Controls and Procedures
The Company’s management has evaluated, under the supervision and with the participation of the Chief Executive Officer and Chief Financial Officer, the effectiveness of disclosure controls and procedures as of December 31, 2010 pursuant to Rule 13a-15(b) under the Securities Exchange Act of 1934 (the Exchange Act). Based on that evaluation, the Chief Executive Officer and Chief Financial Officer have concluded that, as of December 31, 2010, the disclosure controls and procedures are effective in ensuring that the information required to be disclosed in Exchange Act reports is (1) recorded, processed, summarized and reported in a timely manner and (2) accumulated and communicated to the Company’s management, including the Chief Executive Officer and Chief Financial Officer, as appropriate to allow timely decisions regarding required disclosure. Refer to Item 8 of this report for the “Management’s Report on the Effectiveness of Internal Controls over Financial Reporting.”
There were no changes in the Company’s internal control over financial reporting identified in connection with the evaluation of it that occurred during the Company’s last fiscal quarter that materially affected, or is reasonably likely to materially affect, internal control over financial reporting.
None.
Item 10. Directors, Executive Officers and Corporate Governance
Information required by this Item is set forth under the headings “Election of Directors – Nominees,” “Executive Officers Who Are Not Directors,” “Section 16(a) Beneficial Ownership Reporting Compliance,” “Code of Conduct and Ethics,” “Committees” and “Director Selection Process” in the Company’s Proxy Statement for the 2011 Annual Meeting of Shareholders (the “Proxy Statement”), which information is incorporated herein by reference.
Item 11. Executive Compensation
Information required by this Item is set forth under the headings “Executive Compensation” and “Director Compensation” in the Proxy Statement, which information is incorporated herein by reference.
Item 12. Security Ownership of Certain Beneficial Owners and Management and Related Stockholder Matters
Information required by this Item is set forth under the heading “Stock Ownership of Directors and Executive Officers” and “Stock Ownership of Certain Beneficial Owners” in the Proxy Statement, which information is incorporated herein by reference.
The Company does not have any compensation plans or other arrangements under which equity securities are authorized for issuance.
Item 13. Certain Relationships and Related Transactions, and Director Independence
Information required by this Item is set forth under the headings “Certain Relationships and Related Party Transactions” and “Director Independence” in the Proxy Statement, which information is incorporated herein by reference.
Item 14. Principal Accounting Fees and Services
Information required by this Item is set forth under the headings “Auditor Fees and Services” and “Policy for Approval of Audit and Permitted Non-Audit Services” in the Proxy Statement, which information is incorporated herein by reference.
72
Table of Contents
Item 15. Exhibits, Financial Statement Schedules
(a) (1) The response to this portion of Item 15 is included in Item 8 above.
| (2) | The response to this portion of Item 15 is included in Item 8 above. |
| (3) | The following documents are attached hereto or incorporated herein by reference to Exhibits: |
| 3.1 | Amended and Restated Articles of Incorporation, as amended and restated on March 3, 2009 (incorporated herein by reference to Exhibit 3.1 to the Company’s Form 10-K for the year ended December 31, 2008). | |||||
| 3.2 | Articles and Amendment to the Articles of Incorporation (incorporated herein by reference to Exhibit 3.1 to the Company’s Current Report on Form 8-K filed with the SEC on March 17, 2009). | |||||
| 3.3 | Bylaws, as restated in electronic format only as of January 28, 2011 (incorporated herein by reference to Exhibit 3.2 to the Company’s Current Report on Form 8-K filed with the SEC on January 28, 2011). | |||||
| 4.1 | Specimen of Common Stock Certificate (incorporated herein by reference to Exhibit 1 to the Company’s Form 10 filed with SEC on May 2, 1994). | |||||
| 4.2 | Form of Certificate for Fixed Rate Cumulative Perpetual Preferred Stock, Series A (incorporated herein by reference to Exhibit 4.1 to the Company’s Current Report on Form 8-K filed with the SEC on March 17, 2009). | |||||
| 4.3 | Form of Certificate for Fixed Rate Cumulative Perpetual Preferred Stock, Series B (incorporated herein by reference to Exhibit 4.3 to the Company’s Current Report on Form 8-K filed with the SEC on March 17, 2009). | |||||
| 10.3 | Amended and Restated Employment Agreement, dated as of June 1, 2007, between the Company and Dennis A. Dysart (incorporated by reference to Exhibit 10.1 to the Company’s Form 10-Q for the quarter ended September 30, 2007). | |||||
| 10.4 | Amended and Restated Employment Agreement, dated as of June 1, 2007, between the Company and M. Shane Bell (incorporated by reference to Exhibit 10.2 to the Company’s Form 10-Q for the quarter ended June 30, 2007). | |||||
| 10.5 | Amended and Restated Employment Agreement, dated as of June 1, 2007, between the Company and Marshall J. Beverley, Jr. (incorporated by reference to Exhibit 10.3 to the Company’s Form 10-Q for the quarter ended June 30, 2007). | |||||
| 10.6 | Amendment to Employment Agreement between the Company and Dennis A. Dysart and M. Shane Bell (incorporated by reference to Exhibit 10.6 to the Company’s Form 10-K for the year ended December 31, 2008). | |||||
| 10.7 | Amendment to Employment Agreement between the Company and Marshall J. Beverley, Jr. (incorporated by reference to Exhibit 10.7 to the Company’s Form 10-K for the year ended December 31, 2008). | |||||
| 10.8 | Letter Agreement, dated as of March 13, 2009, by and between the Company and the United States Department of the Treasury (incorporated herein by reference to Exhibit 10.1 to the Company’s Current Report on Form 8-K filed with the SEC on March 17, 2009). | |||||
| 10.9 | Side Letter Agreement, dated as of March 13, 2009, by and between the Company and the United States Department of the Treasury (incorporated herein by reference to Exhibit 10.2 to the Company’s Current Report on Form 8-K filed with the SEC on March 17, 2009). | |||||
| 10.10 | Form of Waiver agreement between the Senior Executive Officers and the Company (incorporated herein by reference to Exhibit 10.3 to the Company’s Current Report on Form 8-K filed with the SEC on March 17, 2009). | |||||
| 10.11 | Form of Consent agreement between the Senior Executive Officers and the Company (incorporated herein by reference to Exhibit 10.4 to the Company’s Current Report on Form 8-K filed with the SEC on March 17, 2009). | |||||
| 14.1 | Code of Conduct and Ethics (incorporated herein by reference to Exhibit 14.1 to the Company’s Current Report on Form 8-K, filed on April 11, 2008). | |||||
| 21.1 | Subsidiaries of the Company. | |||||
73
Table of Contents
| 23.1 | Consent of Yount, Hyde & Barbour, P.C. | |||
| 31.1 | Certification of Chief Executive Officer, Section 302 Certification. | |||
| 31.2 | Certification of Chief Financial Officer, Section 302 Certification. | |||
| 32.1 | Certification of Chief Executive Officer Pursuant to 18 U.S.C. Section 1350. | |||
| 32.2 | Certification of Chief Financial Officer Pursuant to 18 U.S.C. Section 1350. | |||
| 99.1 | TARP Certification of Chief Executive Officer | |||
| 99.2 | TARP Certification of Chief Financial Officer | |||
| (b) | Exhibits |
See Item 15(a)(3) above.
| (c) | Financial Statement Schedules |
See Item 15(a)(2) above.
74
Table of Contents
SIGNATURES
Pursuant to the requirements of Section 13 or 15(d) of the Securities Exchange Act of 1934, the registrant has duly caused this report to be signed on its behalf by the undersigned, thereunto duly authorized.
FIRST NATIONAL CORPORATION
| By: | /s/ Dennis A. Dysart | |
| Interim Chief Executive Officer (on behalf of the registrant and as principal executive officer) | ||
| Date: | March 23, 2011 | |
Pursuant to the requirements of the Securities Exchange Act of 1934, this report has been signed below by the following persons on behalf of the registrant and in the capacities and on the dates indicated.
| /s/ Dennis A. Dysart Interim Chief Executive Officer (principal executive officer) |
Date: March 23, 2011 | |||
| /s/ M. Shane Bell Executive Vice President & Chief Financial Officer (principal financial officer and principal accounting officer) |
Date: March 23, 2011 | |||
| /s/ Douglas C. Arthur Chairman of the Board of Directors |
Date: March 23, 2011 | |||
| /s/ Byron A. Brill Vice Chairman of the Board of Directors |
Date: March 23, 2011 | |||
| /s/ Elizabeth H. Cottrell Director |
Date: March 23, 2011 | |||
| /s/ Dr. James A. Davis Director |
Date: March 23, 2011 | |||
| /s/ Christopher E. French Director |
Date: March 23, 2011 | |||
| /s/ John K. Marlow Director |
Date: March 23, 2011 | |||
| /s/ W. Allen Nicholls Director |
Date: March 23, 2011 | |||
| /s/ Henry L. Shirkey Director |
Date: March 23, 2011 | |||
| /s/ Gerald F. Smith, Jr. Director |
Date: March 23, 2011 | |||
| /s/ James R. Wilkins, III Director |
Date: March 23, 2011 | |||
75
Table of Contents
EXHIBIT INDEX
| Number |
Document | |
| 3.1 | Amended and Restated Articles of Incorporation, as amended and restated on March 3, 2009 (incorporated herein by reference to Exhibit 3.1 to the Company’s Form 10-K for the year ended December 31, 2008). | |
| 3.2 | Articles and Amendment to the Articles of Incorporation (incorporated herein by reference to Exhibit 3.1 to the Company’s Current Report on Form 8-K filed with the SEC on March 17, 2009). | |
| 3.3 | Bylaws, as restated in electronic format only as of January 28, 2011 (incorporated herein by reference to Exhibit 3.2 to the Company’s Current Report on Form 8-K filed with the SEC on January 28, 2011). | |
| 4.1 | Specimen of Common Stock Certificate (incorporated herein by reference to Exhibit 1 to the Company’s Form 10 filed with SEC on May 2, 1994). | |
| 4.2 | Form of Certificate for Fixed Rate Cumulative Perpetual Preferred Stock, Series A (incorporated herein by reference to Exhibit 4.1 to the Company’s Current Report on Form 8-K filed with the SEC on March 17, 2009). | |
| 4.3 | Form of Certificate for Fixed Rate Cumulative Perpetual Preferred Stock, Series B (incorporated herein by reference to Exhibit 4.3 to the Company’s Current Report on Form 8-K filed with the SEC on March 17, 2009). | |
| 10.3 | Amended and Restated Employment Agreement, dated as of June 1, 2007, between the Company and Dennis A. Dysart (incorporated by reference to Exhibit 10.1 to the Company’s Form 10-Q for the quarter ended September 30, 2007). | |
| 10.4 | Amended and Restated Employment Agreement, dated as of June 1, 2007, between the Company and M. Shane Bell (incorporated by reference to Exhibit 10.2 to the Company’s Form 10-Q for the quarter ended June 30, 2007). | |
| 10.5 | Amended and Restated Employment Agreement, dated as of June 1, 2007, between the Company and Marshall J. Beverley, Jr. (incorporated by reference to Exhibit 10.3 to the Company’s Form 10-Q for the quarter ended June 30, 2007). | |
| 10.6 | Amendment to Employment Agreement between the Company and Dennis A. Dysart and M. Shane Bell (incorporated by reference to Exhibit 10.6 to the Company’s Form 10-K for the year ended December 31, 2008). | |
| 10.7 | Amendment to Employment Agreement between the Company and Marshall J. Beverley, Jr. (incorporated by reference to Exhibit 10.7 to the Company’s Form 10-K for the year ended December 31, 2008). | |
| 10.8 | Letter Agreement, dated as of March 13, 2009, by and between the Company and the United States Department of the Treasury (incorporated herein by reference to Exhibit 10.1 to the Company’s Current Report on Form 8-K filed with the SEC on March 17, 2009). | |
| 10.9 | Side Letter Agreement, dated as of March 13, 2009, by and between the Company and the United States Department of the Treasury (incorporated herein by reference to Exhibit 10.2 to the Company’s Current Report on Form 8-K filed with the SEC on March 17, 2009). | |
| 10.10 | Form of Waiver agreement between the Senior Executive Officers and the Company (incorporated herein by reference to Exhibit 10.3 to the Company’s Current Report on Form 8-K filed with the SEC on March 17, 2009). | |
| 10.11 | Form of Consent agreement between the Senior Executive Officers and the Company (incorporated herein by reference to Exhibit 10.4 to the Company’s Current Report on Form 8-K filed with the SEC on March 17, 2009). | |
| 14.1 | Code of Conduct and Ethics (incorporated herein by reference to Exhibit 14.1 to the Company’s Current Report on Form 8-K, filed on April 11, 2008). | |
| 21.1 | Subsidiaries of the Company. | |
| 23.1 | Consent of Yount, Hyde & Barbour, P.C. | |
| 31.1 | Certification of Chief Executive Officer, Section 302 Certification. | |
| 31.2 | Certification of Chief Financial Officer, Section 302 Certification. | |
76
Table of Contents
| 32.1 | Certification of Chief Executive Officer Pursuant to 18 U.S.C. Section 1350. | |
| 32.2 | Certification of Chief Financial Officer Pursuant to 18 U.S.C. Section 1350. | |
| 99.1 | TARP Certification of Chief Executive Officer | |
| 99.2 | TARP Certification of Chief Financial Officer | |
77