Attached files
| file | filename |
|---|---|
| EX-99.2 - EXHIBIT 99.2 - SEACOAST BANKING CORP OF FLORIDA | tv511876_ex99-2.htm |
| EX-99.1 - EXHIBIT 99.1 - SEACOAST BANKING CORP OF FLORIDA | tv511876_ex99-1.htm |
| 8-K - FORM 8-K - SEACOAST BANKING CORP OF FLORIDA | tv511876_8k.htm |
Exhibit 99.3
Earnings Presentation FOURTH QUARTER AND FULL - YEAR RESULTS 2018

Cautionary Notice Regarding Forward - Looking Statements This press release contains "forward - looking statements" within the meaning, and protections, of Section 27 A of the Securities Act of 1933 and Section 21 E of the Securities Exchange Act of 1934 , including, without limitation, statements about future financial and operating results, cost savings, enhanced revenues, economic and seasonal conditions in our markets, and improvements to reported earnings that may be realized from cost controls, tax law changes, and for integration of banks that we have acquired, or expect to acquire, as well as statements with respect to Seacoast's objectives, strategic plans, including Vision 2020 , expectations and intentions and other statements that are not historical facts . Actual results may differ from those set forth in the forward - looking statements . Forward - looking statements include statements with respect to our beliefs, plans, objectives, goals, expectations, anticipations, estimates and intentions, and involve known and unknown risks, uncertainties and other factors, which may be beyond our control, and which may cause the actual results, performance or achievements of Seacoast to be materially different from future results, performance or achievements expressed or implied by such forward - looking statements . You should not expect us to update any forward - looking statements . You can identify these forward - looking statements through our use of words such as “may,” “will,” “anticipate,” “assume,” “should,” “support”, “indicate,” “would,” “believe,” “contemplate,” “expect,” “estimate,” “continue,” “further”, “point to,” “project,” “could,” “intend” or other similar words and expressions of the future . These forward - looking statements may not be realized due to a variety of factors, including, without limitation : the effects of future economic and market conditions, including seasonality ; governmental monetary and fiscal policies, as well as legislative, tax and regulatory changes ; changes in accounting policies, rules and practices ; the risks of changes in interest rates on the level and composition of deposits, loan demand, liquidity and the values of loan collateral, securities, and interest sensitive assets and liabilities ; interest rate risks, sensitivities and the shape of the yield curve ; the effects of competition from other commercial banks, thrifts, mortgage banking firms, consumer finance companies, credit unions, securities brokerage firms, insurance companies, money market and other mutual funds and other financial institutions operating in our market areas and elsewhere, including institutions operating regionally, nationally and internationally, together with such competitors offering banking products and services by mail, telephone, computer and the Internet ; and the failure of assumptions underlying the establishment of reserves for possible loan losses . from The risks of mergers and acquisitions, include, without limitation : unexpected transaction costs, including the costs of integrating operations ; the risks that the businesses will not be integrated successfully or that such integration may be more difficult, time - consuming or costly than expected ; the potential failure to fully or timely realize expected revenues and revenue synergies, including as the result of revenues following the merger being lower than expected ; the risk of deposit and customer attrition ; any changes in deposit mix ; unexpected operating and other costs, which may differ or change from expectations ; the risks of customer and employee loss and business disruption, including, without limitation, as the result of difficulties in maintaining relationships with employees ; increased competitive pressures and solicitations of customers by competitors ; as well as the difficulties and risks inherent with entering new markets . All written or oral forward - looking statements attributable to us are expressly qualified in their entirety by this cautionary notice, including, without limitation, those risks and uncertainties described in our annual report on Form 10 - K for the year ended December 31 , 2017 under “Special Cautionary Notice Regarding Forward - Looking Statements” and “Risk Factors”, and otherwise in our SEC reports and filings . Such reports are available upon request from the Company, or from the Securities and Exchange Commission, including through the SEC’s Internet website at http : //www . sec . gov . 2

Seacoast Bank [NASDAQ: SBCF] 3 Valuable Florida Franchise With Balanced Growth Strategy, Benefiting from Attractive Geography, Investments in Digital Transformation and Commercial Loan Platform, and Disciplined Acquisition Strategy Seacoast Customer Map • $6.7 billion in assets as of December 31, 2018, operating in the nation’s third - most populous state • Strong and growing presence in four of Florida’s most attractive MSAs • #1 Florida - based bank in the Orlando MSA • Growing share in West Palm Beach • #2 share in Port St Lucie MSA • Growing presence in Tampa MSA • Investing in business banking and innovative customer analytics • Growth - oriented culture, engaged associate base, strong customer advocacy • Active board with diverse range of experience and expertise • Market Cap: $1.3 billion (12/31/2018)

Fourth Quarter Highlights 4 With a growing presence in Florida’s most attractive markets, Seacoast is one of Florida’s top - performing banking franchises. • Earnings per share totaled $0.31 on a GAAP basis, and $0.47 on an adjusted basis 1 . • On a GAAP basis, ended the quarter at 1.05% Return on Tangible Assets (ROTA), 10.9% Return on Average Tangible Common Equity, and 65.8% efficiency ratio. On an adjusted basis, fourth quarter results were 1.49% adjusted ROTA 1 , 15.4% adjusted ROTCE 1 , and 54.2% adjusted efficiency ratio 1 . • Record commercial originations of $159 million in the fourth quarter, up 22% sequentially. • Fourth quarter annualized organic loan growth of 13%. • Net interest m ar gin expanded 18 basis points to 4.00% quarter - over - quarter, driven by loan yield expansion of 29 basis points to 5.12% and securities yield expansion of 11 basis points to 3.11%, partially offset by higher deposit costs, which expanded 11 basis points to 0.54%. • Completed the First Green Bancorp acquisition. 1 Non - GAAP measure, see “Explanation of Certain Unaudited Non - GAAP Financial Measures”
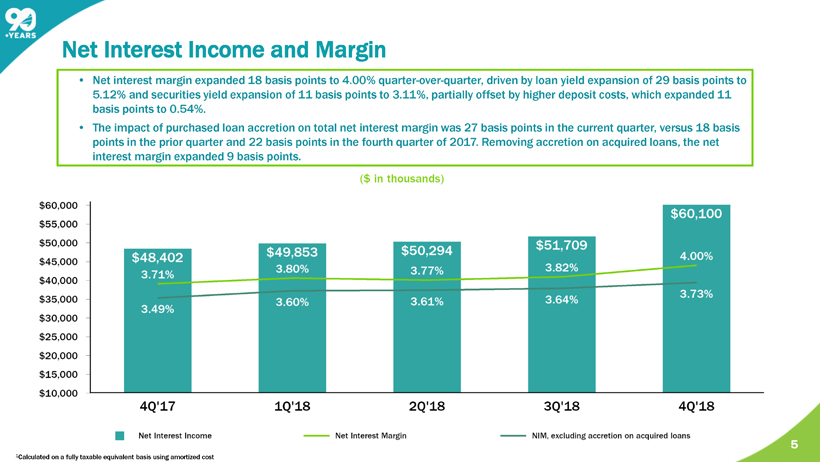
Net Interest Income and Margin 5 • Net interest margin expanded 18 basis points to 4.00% quarter - over - quarter, driven by loan yield expansion of 29 basis points to 5.12% and securities yield expansion of 11 basis points to 3.11%, partially offset by higher deposit costs, which expanded 11 basis points to 0.54%. • The impact of purchased loan accretion on total net interest margin was 27 basis points in the current quarter, versus 18 bas is points in the prior quarter and 22 basis points in the fourth quarter of 2017. Removing accretion on acquired loans, the net interest margin expanded 9 basis points. 1 Calculated on a fully taxable equivalent basis using amortized cost

Adjusted Noninterest Income 1 6 • Adjusted noninterest income 1 totaled $12.9 million, up $0.5 million or 4% from the prior quarter and up $1.5 million or 13% compared to the prior year quarter. • Other income, service charges on deposits, and interchange income were higher as a result of continued customer acquisition a nd engagement in conjunction with the acquisition of First Green. Other income benefited from increases in SBA related income, S BIC investment income, and other customer fees. • Mortgage banking fees continued to face headwinds, impacted by lower inventory levels and increased customer demand for new construction across our markets. 1 Non - GAAP measure, see “Explanation of Certain Unaudited Non - GAAP Financial Measures” 2 Other income includes gains on sale of SBA loans, marine finance fees, swap related income and other fees related to customer ac tivity.

Adjusted Noninterest Expense 1 7 • As a percentage of average tangible assets, adjusted noninterest expense in the current quarter was 2.46% compared to 2.48% in the prior quarter. • During the fourth quarter, the Company continued to make investments in talent to scale the organization, including 10 new C& I small business and commercial bankers, and personnel in our risk and compliance functions. • A discretionary bonus of $0.8 million was accrued in the fourth quarter for second level leadership given the successful execution of the First Green integration, all while driving expense reduction and growth initiatives. 1 Non - GAAP measure, see “Explanation of Certain Unaudited Non - GAAP Financial Measures” 2 Other expense includes legal and professional fees, marketing expenses and other expenses associated with ongoing business op era tions.
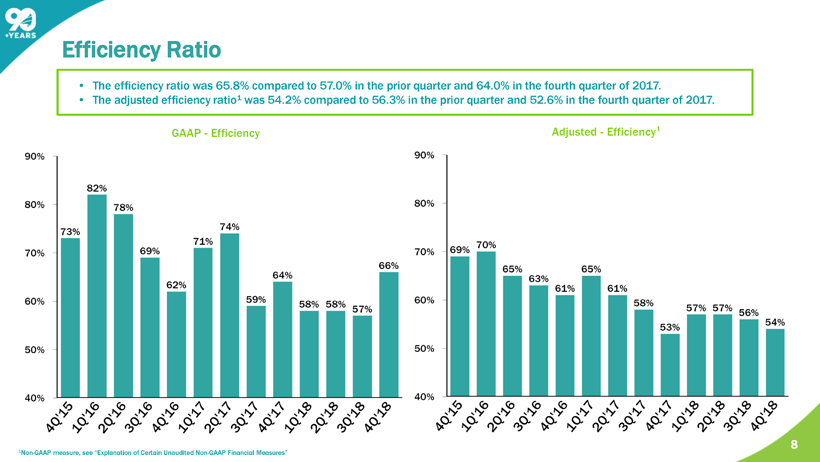
Efficiency Ratio 8 • The efficiency ratio was 65.8% compared to 57.0% in the prior quarter and 64.0% in the fourth quarter of 2017. • The adjusted efficiency ratio 1 was 54.2% compared to 56.3% in the prior quarter and 52.6% in the fourth quarter of 2017. 2 1 Non - GAAP measure, see “Explanation of Certain Unaudited Non - GAAP Financial Measures” 1

Loan Growth Momentum Continues, Supported by a Strong Florida Economy, and Prudent Guardrails 9 • Fourth quarter loans totaled $4.8 billion, an increase of $1.0 billion or 26% from year - ago levels. Adjusting for acquisitions, loans grew $376 million or 10% year over year. • Full year consumer and small business originations were $443 million, up 25% compared to prior year. • Commercial originations were a record for the fourth quarter, with $159 million in originations. Full year commercial originations were $553 million, up 15% compared to prior year. • Pipelines exiting 2018 were $164 million in commercial, $44 million in residential, and $53 million in consumer and small business. • Purchased loan accretion was 35 basis points in 4Q 2018 versus 25 basis points in the prior quarter, and 31 basis points in the fourth quarter of 2017. (Yields presented above do not reflect FTE adjustments)

The Deposit Franchise Continues to Perform Well and Serves as a Source of Earnings Strength 10 • Total deposits increased 13% year - over - year. • Transaction accounts represented 50% of total deposits and increased 5% year - over - year. • Cost of deposits was 0.54%, up 11 basis points from the prior quarter, and up 25 basis points from the fourth quarter of 2017 . Excluding the impact of the First Green acquisition, cost of deposits increased 6 basis points sequentially. 50%

Average Deposit Balances and Cost 11 Our focus on organic growth and relationship - based funding, in combination with our innovative analytics platform, supports a well - diversified low - cost deposit portfolio. Our deposit beta continues to perform within our expectations. 4Q'17 - 4Q'18 Interest Bearing Deposits Cumulative Beta 1 Savings 24 bps Interest Bearing Demand 6 bps Money Market 42 bps Time Deposits 67 bps Brokered CDs 80 bps Total Interest Bearing 37 bps Total Deposits 25 bps Fed Fund Change 100 bps 1 Beta calculated using the change in deposit costs 4Q'18 vs 4Q'17 divided by the 100 bps change in Fed Funds rate from December 31, 2017 to December 31, 2018 0.29% 0.33% 0.39% 0.43% 0.54%

Credit Quality ($ in thousands) 12 Non - Acquired 1 1 Includes charge off of $3.0 million for a single impaired loan.

Maintaining Strong Capital to Support Balanced Growth Opportunities 13 1 1 Non - GAAP measure, see “Explanation of Certain Unaudited Non - GAAP Financial Measures.”

On - track to Achieve Our Vision 2020 Objectives 14 Vision 2020 Targets Return on Tangible Assets 1.30% + Return on Tangible Common Equity 16% + Efficiency Ratio Below 50%

Contact Details: Seacoast Banking Corporation of Florida 15

16

Explanation of Certain Unaudited Non - GAAP Financial Measures This presentation contains financial information determined by methods other than Generally Accepted Accounting Principles (“GAAP”) . The financial highlights provide reconciliations between GAAP net income and adjusted net income, GAAP income and adjusted pretax, preprovision income . Management uses these non - GAAP financial measures in its analysis of the Company’s performance and believes these presentations provide useful supplemental information, and a clearer understanding of the Company’s performance . The Company believes the non - GAAP measures enhance investors’ understanding of the Company’s business and performance and if not provided would be requested by the investor community . These measures are also useful in understanding performance trends and facilitate comparisons with the performance of other financial institutions . The limitations associated with operating measures are the risk that persons might disagree as to the appropriateness of items comprising these measures and that different companies might calculate these measures differently . The Company provides reconciliations between GAAP and these non - GAAP measures . These disclosures should not be considered an alternative to GAAP . 17

GAAP to Non - GAAP Reconciliation 18 Quarterly Trend Twelve Months Ended December 31, (Dollars in thousands except per share data) 4Q'18 3Q'18 2Q'18 1Q'18 4Q'17 2018 2017 Net income (loss) $ 15,962 $ 16,322 $ 16,964 $ 18,027 $ 13,047 $ 67,275 $ 42,865 Gain on sale of VISA Stock — — — — (15,153 ) — (15,153 ) Securities (gains)/losses, net 425 48 48 102 (112 ) 623 (86 ) BOLI benefits on death (included in other income) (280 ) — — — — (280 ) — Total Adjustments to Revenue 145 48 48 102 (15,265 ) 343 (15,239 ) Merger related charges 8,034 482 695 470 6,817 9,681 12,922 Amortization of intangibles 1,303 1,004 1,004 989 963 4,300 3,360 Business continuity expenses - Hurricane Irma — — — — — — 352 Branch reductions and other expense initiatives 587 — — — — 587 4,321 Total Adjustments to Noninterest Expense 9,924 1,486 1,699 1,459 7,780 14,568 20,955 Tax effect of adjustments (2,623 ) (230 ) (443 ) (538 ) 3,147 (3,834 ) (1,792 ) Taxes and tax penalties on acquisition - related BOLI redemption 485 — — — — 485 — Effect of change in corporate tax rate — — — 248 8,552 248 8,552 Adjusted Net Income $ 23,893 $ 17,626 $ 18,268 $ 19,298 $ 17,261 $ 79,085 $ 55,341 Earnings per diluted share, as reported 0.31 0.34 0.35 0.38 0.28 1.38 0.99 Adjusted earnings per diluted share 0.47 0.37 0.38 0.40 0.37 1.62 1.28 Average shares outstanding 51,237 48,029 47,974 47,688 46,473 48,748 43,350 Revenue 72,698 63,853 62,928 62,058 74,868 261,537 234,765 Total Adjustments to Revenue 145 48 48 102 (15,265 ) 343 (15,239 ) Adjusted Revenue 72,843 63,901 62,976 62,160 59,603 261,880 219,526 Noninterest Expense 49,464 37,399 38,246 37,164 39,184 162,273 149,916 Total Adjustments to Noninterest Expense 9,924 1,486 1,699 1,459 7,780 14,568 20,955 Adjusted Noninterest Expense 39,540 35,913 36,547 35,705 31,404 147,705 128,961 Foreclosed property expense and net (gain)/loss on sale — (137 ) 405 192 (7 ) 461 (302 ) Net Adjusted Noninterest Expense $ 39,540 $ 36,050 $ 36,142 $ 35,513 $ 31,411 $ 147,244 $ 129,263

GAAP to Non - GAAP Reconciliation 19 Quarterly Trend Twelve Months Ended December 31, (Dollars in thousands except per share data) 4Q'18 3Q'18 2Q'18 1Q'18 4Q'17 2018 2017 Adjusted Revenue $ 72,843 $ 63,901 $ 62,976 $ 62,160 $ 59,603 $ 261,880 $ 219,526 Impact of FTE adjustment 116 147 87 91 174 441 706 Adjusted Revenue on a fully taxable equivalent basis 72,959 64,048 63,063 62,251 59,777 262,321 220,232 Adjusted Efficiency Ratio 54.19 % 56.29 % 57.31 % 57.05 % 52.55 % 56.13 % 58.69 % Average Assets $ 6,589,870 $ 5,903,327 $ 5,878,035 $ 5,851,688 $ 5,716,230 $ 6,057,335 $ 5,206,617 Less average goodwill and intangible assets (213,713 ) (165,534 ) (166,393 ) (167,136 ) (149,432 ) (178,287 ) (115,511 ) Average Tangible Assets $ 6,376,157 $ 5,737,793 $ 5,711,642 $ 5,684,552 $ 5,566,798 $ 5,879,048 $ 5,091,106 Return on Average Assets (ROA) 0.96 % 1.10 % 1.16 % 1.25 % 0.91 % 1.11 % 0.82 % Impact of removing average intangible assets and related amortization 0.09 % 0.08 % 0.08 % 0.09 % 0.06 % 0.09 % 0.06 % Return on Tangible Average Assets (ROTA) 1.05 % 1.18 % 1.24 % 1.34 % 0.97 % 1.20 % 0.88 % Impact of other adjustments for Adjusted Net Income 0.44 % 0.04 % 0.04 % 0.04 % 0.26 % 0.15 % 0.21 % Adjusted Return on Average Tangible Assets 1.49 % 1.22 % 1.28 % 1.38 % 1.23 % 1.35 % 1.09 % Average Shareholders' Equity $ 827,759 $ 728,290 $ 709,674 $ 695,240 $ 657,100 $ 740,571 $ 570,399 Less average goodwill and intangible assets (213,713 ) (165,534 ) (166,393 ) (167,136 ) (149,432 ) (178,287 ) (115,511 ) Average Tangible Equity $ 614,046 $ 562,756 $ 543,281 $ 528,104 $ 507,668 $ 562,284 $ 454,888 Return on Average Shareholders' Equity 7.7 % 8.9 % 9.6 % 10.5 % 7.9 % 9.1 % 7.5 % Impact of removing average intangible assets and related amortization 3.2 % 3.1 % 3.5 % 3.9 % 2.8 % 3.4 % 2.4 % Return on Average Tangible Common Equity (ROTCE) 10.9 % 12.0 % 13.1 % 14.4 % 10.7 % 12.5 % 9.9 % Impact of other adjustments for Adjusted Net Income 4.5 % 0.4 % 0.4 % 0.4 % 2.8 % 1.6 % 2.3 % Adjusted Return on Average Tangible Common Equity 15.4 % 12.4 % 13.5 % 14.8 % 13.5 % 14.1 % 12.2 %