Attached files
| file | filename |
|---|---|
| 8-K - FORM 8-K - SIMMONS FIRST NATIONAL CORP | f8k_012819.htm |
Exhibit 99.1
NASDAQ - GS: SFNC Investor Presentation

Forward - Looking Statements and Non - GAAP Financial Measures 2 Certain statements contained in this presentation may not be based on historical facts and are "forward - looking statements" within the meaning of Section 27 A of the Securities Act of 1933 , as amended, and Section 21 E of the Securities Exchange Act of 1934 , as amended . These forward - looking statements may be identified by reference to a future period(s) or by the use of forward - looking terminology, such as "anticipate," "estimate," "expect," "foresee," "may," "might," "will," "would," "could" or "intend," future or conditional verb tenses, and variations or negatives of such terms . These forward - looking statements include, without limitation, those relating to the Company's future growth, revenue, assets, asset quality, profitability and customer service, critical accounting policies, net interest margin, non - interest revenue, market conditions related to the Company's common stock repurchase program, allowance for loan losses, the effect of certain new accounting standards on the Company's financial statements, income tax deductions, credit quality, the level of credit losses from lending commitments, net interest revenue, interest rate sensitivity, loan loss experience, liquidity, capital resources, market risk, earnings, effect of pending litigation, acquisition strategy, legal and regulatory limitations and compliance and competition . Readers are cautioned not to place undue reliance on the forward - looking statements contained in this presentation in that actual results could differ materially from those indicated in such forward - looking statements, due to a variety of factors . These factors include, but are not limited to, changes in the Company's operating or expansion strategy, availability of and costs associated with obtaining adequate and timely sources of liquidity, the ability to maintain credit quality, possible adverse rulings, judgments, settlements and other outcomes of pending litigation, the ability of the Company to collect amounts due under loan agreements, changes in consumer preferences, effectiveness of the Company's interest rate risk management strategies, laws and regulations affecting financial institutions in general or relating to taxes, the effect of pending or future legislation, the ability of the Company to repurchase its common stock on favorable terms, the ability of the Company to successfully implement its acquisition strategy, changes in interest rates and capital markets, inflation, customer acceptance of the Company's products and services, and other risk factors . Other relevant risk factors may be detailed from time to time in the Company's press releases and filings with the Securities and Exchange Commission . Any forward - looking statement speaks only as of the date of this Report, and we undertake no obligation to update these forward - looking statements to reflect events or circumstances that occur after the date of this Report . Annualized, pro forma, projected and estimated numbers are used for illustrative purpose only, are not forecasts and may not reflect actual results . Non - GAAP Financial Measures This document contains financial information determined by methods other than in accordance with generally accepted accounting principles (GAAP) . The Company's management uses these non - GAAP financial measures in their analysis of the company's performance . These measures typically adjust GAAP performance measures to include the tax benefit associated with revenue items that are tax - exempt, as well as adjust income available to common shareholders for certain significant activities or nonrecurring transactions . Since the presentation of these GAAP performance measures and their impact differ between companies, management believes presentations of these non - GAAP financial measures provide useful supplemental information that is essential to a proper understanding of the operating results of the company's core businesses . These non - GAAP disclosures should not be viewed as a substitute for operating results determined in accordance with GAAP, nor are they necessarily comparable to non - GAAP performance measures that may be presented by other companies .
Additional Information & Where to Find It 3 In connection with the proposed merger with Reliance Bancshares, Inc . ("RLBS"), Simmons First National Corporation "SFNC" has filed with the SEC a Registration Statement on Form S - 4 that includes a proxy statement of RLBS, and a prospectus of SFNC, as well as other relevant documents concerning the proposed transaction . This communication does not constitute an offer to sell or the solicitation of an offer to buy any securities or a solicitation of any vote or approval . SHAREHOLDERS OF RLBS ARE URGED TO READ THE REGISTRATION STATEMENT AND THE PROXY STATEMENT/PROSPECTUS REGARDING THE MERGER THAT IS AVAILABLE AND ANY OTHER RELEVANT DOCUMENTS FILED WITH THE SEC BY SFNC, AS WELL AS ANY AMENDMENTS OR SUPPLEMENTS TO THOSE DOCUMENTS, BECAUSE THEY CONTAIN IMPORTANT INFORMATION . A free copy of the proxy statement/prospectus, as well as other filings containing information about SFNC, may be obtained at the SEC’s Internet site (http : //www . sec . gov) . You may also obtain these documents free of charge from SFNC at www . simmonsbank . com under the heading “Investor Relations” . Copies of the proxy statement/prospectus can also be obtained free of charge by directing a request to Simmons First National Corporation, 501 Main Street, Pine Bluff, Arkansas 71601 , Attention : Stephen C . Massanelli, Investor Relations Officer, Telephone : ( 870 ) 541 - 1000 or to Reliance Bancshares, Inc . , 10401 Clayton Road, Frontenac, Missouri 63131 , Attention : Allan Ivie , Telephone : ( 314 ) 569 - 7209 . SFNC, RLBS, and certain of their respective directors, executive officers and other members of their management and employees may be deemed to be participants in the solicitation of proxies in connection with the proposed transaction . Information about the directors and executive officers of SFNC, and their respective ownership of SFNC common stock, is set forth in the proxy statement for SFNC’s 2017 annual meeting of shareholders, as filed with the SEC on Schedule 14 A on March 14 , 2018 . Additional information regarding all of the participants in the solicitation may be obtained by reading the proxy statement/prospectus regarding the proposed merger . Free copies of this document may be obtained as described in the preceding paragraph .

(1) Based on December 31, 2018 closing stock price of $24.13. (2) As of December 31, 2018. Company Profile 4 SOUTHEAST DIVISION SOUTHWEST DIVISION NORTH TEXAS DIVISION Arkansas SW Missouri (Springfield) Tennessee South Texas St. Louis Kansas City Colorado Kansas Oklahoma Dallas / Fort Worth Metroplex Loans (2) $3.1 billion Deposits (2) $1.4 billion Loans (2) $5.0 billion Deposits (2) $6.6 billion Loans (2) $2.6 billion Deposits (2) $1.9 billion BRANCHES BY STATE Tennessee Oklahoma Texas Arkansas Colorado Missouri Kansas 77 41 3 6 27 17 20 Total 191 TICKER: SFNC Founded Footprint (2) Total Assets (2) Market Cap (1) 1903 $2.2 billion $16.5 billion 7 States

Q4 2018 Non - Banking Business Units 5 ▪ $184.3 million nationwide credit card portfolio ▪ Loan yield (including fees): 16.4% ▪ History of excellent credit quality (1.65% net charge - off ratio) TRUST ▪ $5.2 billion in trust assets ($3.2 billion AUM) ▪ Profit Margin: ~26.3% ▪ Growing investment management business ROYALTY TRUST ▪ Revenue: $2.1 million ▪ NIBT Margin: 30.6% INVESTMENTS ▪ Retail Group: $1.3 billion AUM – $189.8 million in fee - based / advisory assets INSURANCE (EMPLOYEE BENEFITS & LIFE) ▪ Revenue: $2.9 million ▪ Profit Margin: 43.7% ▪ FY 2018 Mortgage Originations: $815 million ▪ 76% Purchase vs. 24% Refinance

Note: Per share information has been adjusted to reflect the effects of the Company’s two - for - one stock split, which occurred o n February 8, 2018. Note: Core excludes non - core income and expense items (e.g., gain on sale of insurance lines of business, donation to Simmons F oundation, one - time tax adjustment, merger related costs and branch right - sizing costs). Core NIM excludes purchase accounting interest accretion. Core results are non - GAAP measurements. See Appendix for non - GAAP reconciliatio ns. (1) Efficiency ratio is non - interest expense before foreclosed property expense and amortization of intangibles as a percent of net interest income (fully taxable equivalent) and non - interest revenues, excluding gains and losses from securities transactions and non - core items. See Appendix for non - GAAP reconciliations. Financial Highlights 6 QTD Results Q4 2017 Q4 2018 Change Q4 2017 Q4 2018 Change $ in millions, except per share data Earnings Earnings $ % Diluted EPS Diluted EPS $ % GAAP Results 18.90$ 55.65$ 36.74$ 194.4% 0.22$ 0.60$ 0.38$ 172.7% Non-Core Items 23.12 0.81 (22.31) (96.5%) 0.26 0.01 (0.25) (96.2%) Non-GAAP Core Results 42.02$ 56.45$ 14.43$ 34.3% 0.48$ 0.61$ 0.13$ 27.1% ROA 0.54% 1.35% Core ROA 1.20% 1.37% ROTCE 7.53% 17.96% Core ROTCE 15.97% 18.21% Efficiency Ratio⁽¹⁾ 51.36% 51.99% NIM 4.21% 3.76% Core NIM 3.70% 3.66% YTD Results 2017 2018 Change 2017 2018 Change $ in millions, except per share data Earnings Earnings $ % Diluted EPS Diluted EPS $ % GAAP Results 92.94$ 215.71$ 122.77$ 132.1% 1.33$ 2.32$ 0.99$ 74.4% Non-Core Items 26.11 4.52 (21.59) (82.7%) 0.37 0.05 (0.32) (86.5%) Non-GAAP Core Results 119.05$ 220.23$ 101.18$ 85.0% 1.70$ 2.37$ 0.67$ 39.4% ROA 0.92% 1.37% Core ROA 1.18% 1.40% ROTCE 11.26% 18.44% Core ROTCE 14.28% 18.81% Efficiency Ratio⁽¹⁾ 55.27% 52.85% NIM 4.07% 3.97% Core NIM 3.76% 3.72%

(1) Core excludes non - core income and expense items (e.g., gain on sale of insurance lines of business, donation to Simmons Foundati on, one - time tax adjustment, merger related costs and branch right - sizing costs). Core results are non - GAAP measurements. See Appendix for non - GA AP reconciliations. 2018 Financial Highlights 7 NON - RECURRING ITEMS SELECTED HIGHLIGHTS (1) ▪ Merger - related and branch right - sizing costs: $6.1 million pre - tax, $4.5 million after - tax ▪ Loan balances increased $943 million from 2017 ▪ Deposits increased $1.3 billion from 2017 ▪ Total assets were $16.5 billion ▪ ROAA of 1.37% and Core ROAA of 1.40% ▪ ROACE of 10.00% and Core ROACE of 10.21% ▪ ROTCE of 18.44% and Core ROTCE of 18.81% ▪ NIM of 3.97% and Core NIM of 3.72% ▪ Diluted EPS of $2.32 and Core Diluted EPS of $2.37 ▪ Equity to asset ratio of 13.58% and tangible common equity to tangible asset ratio of 8.39% ▪ Book value per share was $24.33 and tangible book value per share was $14.18 2 - FOR - 1 STOCK SPLIT ▪ Board approved a two - for - one stock split in the form of a 100% stock dividend ▪ Record date of January 30, 2018 and payable date occurred on February 8, 2018 ▪ All per share information has been restated for the stock split

26.66% 25.36% 33.30% 28.11% 20.66% 23.79% 26.49% 33.16% 27.52% 20.66% 10.0% 15.0% 20.0% 25.0% 30.0% 35.0% 2014 2015 2016 2017 2018 GAAP Core $- $2.0 $4.0 $6.0 $8.0 $10.0 $12.0 $14.0 2014 2015 2016 2017 FY18 Q4 Loans Deposits 67.2% 59.0% 56.3% 55.3% 52.9% 20.0% 25.0% 30.0% 35.0% 40.0% 45.0% 50.0% 55.0% 60.0% 65.0% 70.0% 2014 2015 2016 2017 2018 $4.6 $7.6 $8.4 $15.1 $16.5 $- $2.0 $4.0 $6.0 $8.0 $10.0 $12.0 $14.0 $16.0 $18.0 2014 2015 2016 2017 2018 (1) Efficiency ratio is non - interest expense before foreclosed property expense and amortization of intangibles as a percent of net interest income (fully taxable equivalent) and non - interest revenues, excluding gains and losses from securities transactions and non - core items. See Appendix for non - GAAP re conciliations. Note: Core excludes non - core income and expense items (e.g., gain on sale of insurance lines of business, donation to Simmons Founda tion, one - time tax adjustment, merger related costs and branch right - sizing costs). Core results are non - GAAP measurements. See Appendix for non - GAAP reconciliations. Performance Trends 8 TOTAL ASSETS ($ IN BILLIONS) EFFICIENCY RATIO (1) NON - INTEREST INCOME / REVENUE TOTAL LOANS & DEPOSITS ($ IN BILLIONS) Deposits 12.4$ Loans 11.7$

$1.05 $1.31 $1.56 $1.33 $2.32 $1.14 $1.59 $1.64 $1.70 $2.37 $- $0.50 $1.00 $1.50 $2.00 $2.50 2014 2015 2016 2017 FY18 Q4 (LTM) GAAP Core $35.7 $74.1 $96.8 $92.9 $215.7 $38.7 $89.6 $101.4 $119.0 $220.2 $- $25.0 $50.0 $75.0 $100.0 $125.0 $150.0 $175.0 $200.0 $225.0 $250.0 2014 2015 2016 2017 2018 GAAP Core 10.99% 12.53% 13.92% 11.26% 18.44% 11.89% 15.05% 14.56% 14.28% 18.81% 0.00% 2.00% 4.00% 6.00% 8.00% 10.00% 12.00% 14.00% 16.00% 18.00% 20.00% 2014 2015 2016 2017 2018 GAAP Core 0.80% 1.03% 1.25% 0.92% 1.37% 0.86% 1.25% 1.31% 1.18% 1.40% 0.00% 0.20% 0.40% 0.60% 0.80% 1.00% 1.20% 1.40% 1.60% 2014 2015 2016 2017 2018 GAAP Core (1) Per share information has been adjusted to reflect the effects of the Company’s two - for - one stock split, which occurred on Febr uary 8, 2018. Note: Core excludes non - core income and expense items (e.g., gain on sale of insurance lines of business, donation to Simmons Founda tion, one - time tax adjustment, merger related costs and branch right - sizing costs). Core results are non - GAAP measurements. See Appendix for non - GA AP reconciliations. Performance Trends 9 ROA DILUTED EPS (1) NET INCOME ($ IN MILLIONS) ROTCE
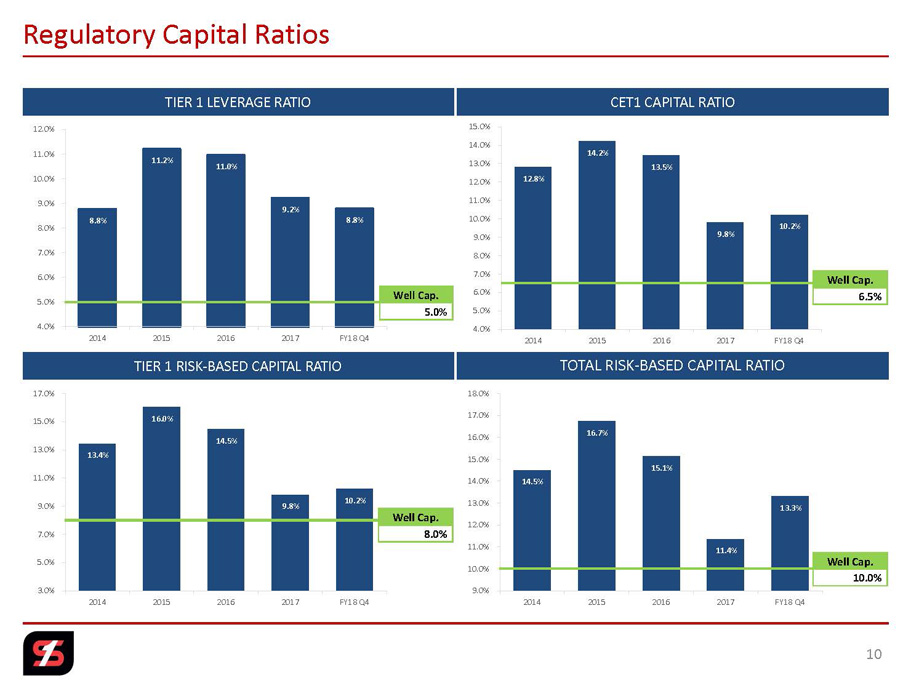
14.5% 16.7% 15.1% 11.4% 13.3% 9.0% 10.0% 11.0% 12.0% 13.0% 14.0% 15.0% 16.0% 17.0% 18.0% 2014 2015 2016 2017 FY18 Q4 12.8% 14.2% 13.5% 9.8% 10.2% 4.0% 5.0% 6.0% 7.0% 8.0% 9.0% 10.0% 11.0% 12.0% 13.0% 14.0% 15.0% 2014 2015 2016 2017 FY18 Q4 13.4% 16.0% 14.5% 9.8% 10.2% 3.0% 5.0% 7.0% 9.0% 11.0% 13.0% 15.0% 17.0% 2014 2015 2016 2017 FY18 Q4 8.8% 11.2% 11.0% 9.2% 8.8% 4.0% 5.0% 6.0% 7.0% 8.0% 9.0% 10.0% 11.0% 12.0% 2014 2015 2016 2017 FY18 Q4 Regulatory Capital Ratios 10 TIER 1 LEVERAGE RATIO TOTAL RISK - BASED CAPITAL RATIO TIER 1 RISK - BASED CAPITAL RATIO CET1 CAPITAL RATIO Well Cap. 5.0% Well Cap. 6.5% Well Cap. 8.0% Well Cap. 10.0%

(1) As of December 31, 2018. (2) Includes credit card, indirect, and equipment finance (nationwide). Loan Portfolio (1) 11 TOTAL LOAN PORTFOLIO $11.7 billion Agriculture 1.4% Credit Card 1.7% Consumer 1.8% Construction 14.8% Single Family Residential 17.0% Commercial Real Estate 43.3% Commercial 18.7% Other 1.2% Total % of $ in billions Loans Total Southeast Division 5.0$ 42.4% Southwest Division 2.6 22.6% North Texas Division 3.1 26.6% Other⁽²⁾ 1.0 8.4% % of Re-Pricing Total Variable, Adj. or Fixed < 1 Yr. Maturity 52% Fixed Rate 48% % of CRE-Loans Total Owner Occupied 25% Non-Owner Occupied 75% % of Loan Concentration Total Capital C&D 99% CRE 297%

Loan Growth 12 Linked Quarter Growth On a linked - quarter basis (December 31, 2018 compared to September 30, 2018), total loans decreased $135 million, or 1.14%. The decrease was due to: ▪ $86 million decrease in agricultural portfolios and mortgage warehouse lines of credit ▪ $19 million decrease in liquidating portfolios (indirect lending and consumer finance) ▪ Remaining decline due to loan payoffs greater than new loan funding during the quarter Quarter-over-Quarter Growth Linked Quarter Growth Q4 Q4 Change Change Q3 Q4 Change Change $ in millions 2017 2018 $ % 2018 2018 $ % Legacy Loans, including acquired migrated 5,706$ 8,430$ 2,725$ 47.76% 8,123$ 8,430$ 307$ 3.78% Acquired Loans, net of discounts 5,074 3,293 (1,782) (35.11%) 3,735 3,293 (442) (11.84%) Total Loans, net of discounts 10,780$ 11,723$ 943$ 8.75% 11,858$ 11,723$ (135)$ (1.14%)
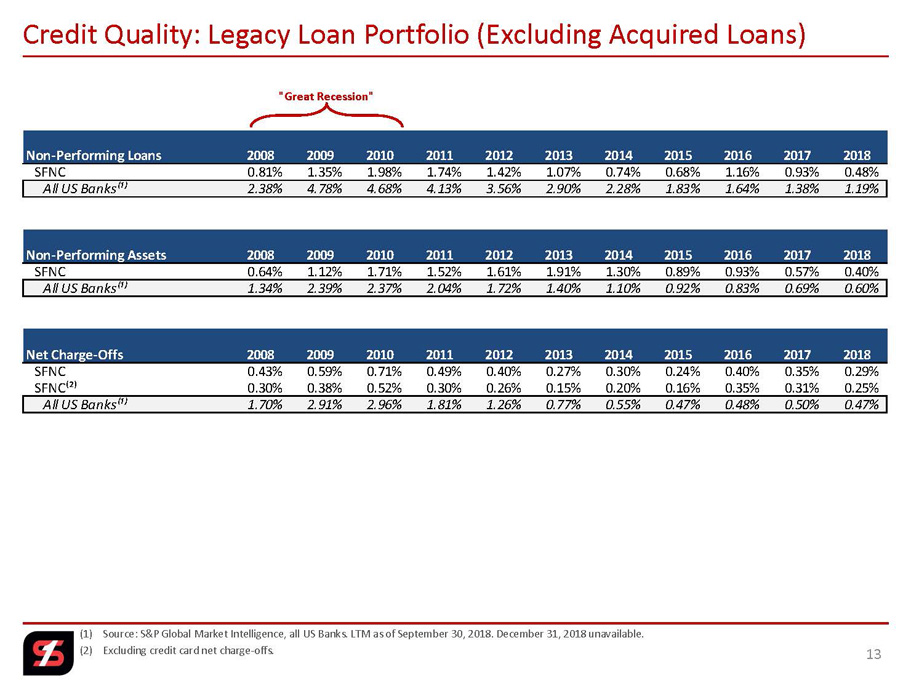
(1) Source: S&P Global Market Intelligence, all US Banks. LTM as of September 30, 2018. December 31, 2018 unavailable. (2) Excluding credit card net charge - offs. Credit Quality: Legacy Loan Portfolio (Excluding Acquired Loans) 13 "Great Recession" Non-Performing Loans 2008 2009 2010 2011 2012 2013 2014 2015 2016 2017 2018 SFNC 0.81% 1.35% 1.98% 1.74% 1.42% 1.07% 0.74% 0.68% 1.16% 0.93% 0.48% All US Banks⁽¹⁾ 2.38% 4.78% 4.68% 4.13% 3.56% 2.90% 2.28% 1.83% 1.64% 1.38% 1.19% Non-Performing Assets 2008 2009 2010 2011 2012 2013 2014 2015 2016 2017 2018 SFNC 0.64% 1.12% 1.71% 1.52% 1.61% 1.91% 1.30% 0.89% 0.93% 0.57% 0.40% All US Banks⁽¹⁾ 1.34% 2.39% 2.37% 2.04% 1.72% 1.40% 1.10% 0.92% 0.83% 0.69% 0.60% Net Charge-Offs 2008 2009 2010 2011 2012 2013 2014 2015 2016 2017 2018 SFNC 0.43% 0.59% 0.71% 0.49% 0.40% 0.27% 0.30% 0.24% 0.40% 0.35% 0.29% SFNC⁽²⁾ 0.30% 0.38% 0.52% 0.30% 0.26% 0.15% 0.20% 0.16% 0.35% 0.31% 0.25% All US Banks⁽¹⁾ 1.70% 2.91% 2.96% 1.81% 1.26% 0.77% 0.55% 0.47% 0.48% 0.50% 0.47%

1991 Recession 4.55% 2002 Recession 6.41% 2009 "Great Recession" 9.42% 1.42% 2.10% * 2.61% * 0.0% 1.0% 2.0% 3.0% 4.0% 5.0% 6.0% 7.0% 8.0% 9.0% 10.0% 11.0% Net Charge - off % History of Strong Asset Quality (Net Charge - offs) * Federal bankruptcy reform impacted charge - offs in 2005 Source: Federal Reserve Board Note: Industry data as of September 30, 2018. Data as of December 31, 2018 not yet published by the Federal Reserve Board. Credit Quality: Credit Card Portfolio 14 SFNC 1.86% Industry 3.67%

Credit Quality: Loan & Credit Coverage 15 Upon acquisition of a portfolio, all loans are considered acquired and have a credit mark (loan discount) in place to cover potential exposure . When an acquired, non - impaired loan is renewed or otherwise is re - underwritten for a formal modification or change in terms, the loan is then considered as a legacy credit (migrated loan) and is expected to conform to current policy guidelines . Acquired, impaired loans remain in the acquired pools for the life of the loan regardless of renewal or modification status . Migrated loans that convert to the legacy portfolio are considered to be of acceptable risk to the bank and are subject to ALLL methodology . As with newly originated loans, acceptable credit risk loans require a lower ALLL allocation than those with a higher level of risk . Therefore, our ALLL to total loans ratio has declined, as the quality of loans subject to our ALLL methodology has improved . When acquired loan credit mark is included, our total coverage ratio remains 0 . 90 % . Acquired Loan Migration Actual $ in millions Dec 31, '18 Coverage Legacy Loan Portfolio 8,430$ Allowance for Loan Loss (56.6) 0.67% Loans acquired 3,342$ Loan discount / acquired ALLL (49.4) 1.48% Total Loans, before discounts 11,773$ Total allowance for loan loss and loan discount (106.0) 0.90%
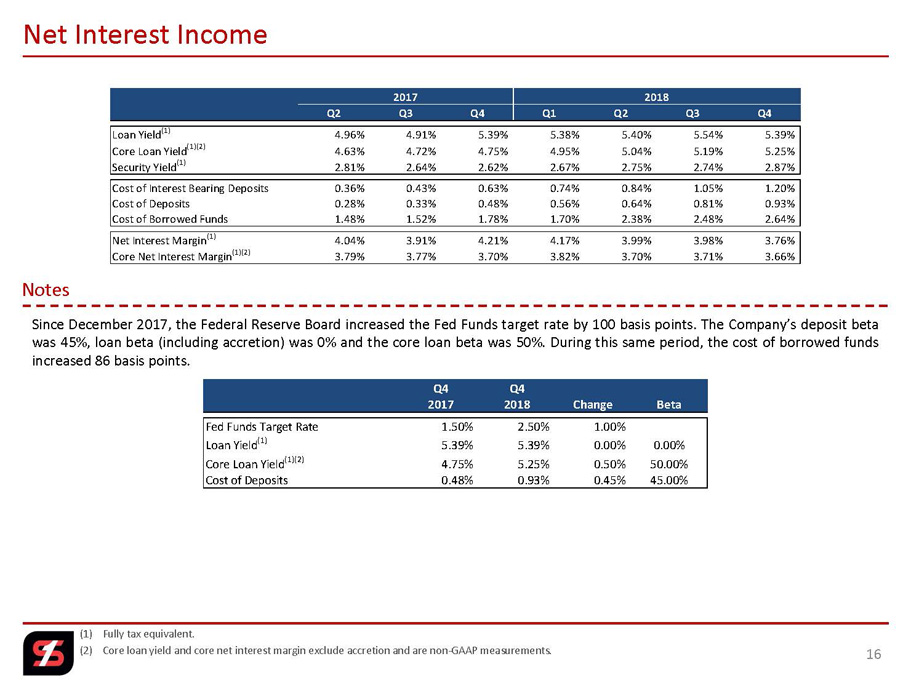
(1) Fully tax equivalent. (2) Core loan yield and core net interest margin exclude accretion and are non - GAAP measurements. Net Interest Income 16 Since December 2017 , the Federal Reserve Board increased the Fed Funds target rate by 100 basis points . The Company’s deposit beta was 45 % , loan beta (including accretion) was 0 % and the core loan beta was 50 % . During this same period, the cost of borrowed funds increased 86 basis points . Notes 2017 2018 Q2 Q3 Q4 Q1 Q2 Q3 Q4 Loan Yield (1) 4.96% 4.91% 5.39% 5.38% 5.40% 5.54% 5.39% Core Loan Yield (1)(2) 4.63% 4.72% 4.75% 4.95% 5.04% 5.19% 5.25% Security Yield (1) 2.81% 2.64% 2.62% 2.67% 2.75% 2.74% 2.87% Cost of Interest Bearing Deposits 0.36% 0.43% 0.63% 0.74% 0.84% 1.05% 1.20% Cost of Deposits 0.28% 0.33% 0.48% 0.56% 0.64% 0.81% 0.93% Cost of Borrowed Funds 1.48% 1.52% 1.78% 1.70% 2.38% 2.48% 2.64% Net Interest Margin (1) 4.04% 3.91% 4.21% 4.17% 3.99% 3.98% 3.76% Core Net Interest Margin (1)(2) 3.79% 3.77% 3.70% 3.82% 3.70% 3.71% 3.66% Q4 Q4 2017 2018 Change Beta Fed Funds Target Rate 1.50% 2.50% 1.00% Loan Yield (1) 5.39% 5.39% 0.00% 0.00% Core Loan Yield (1)(2) 4.75% 5.25% 0.50% 50.00% Cost of Deposits 0.48% 0.93% 0.45% 45.00%
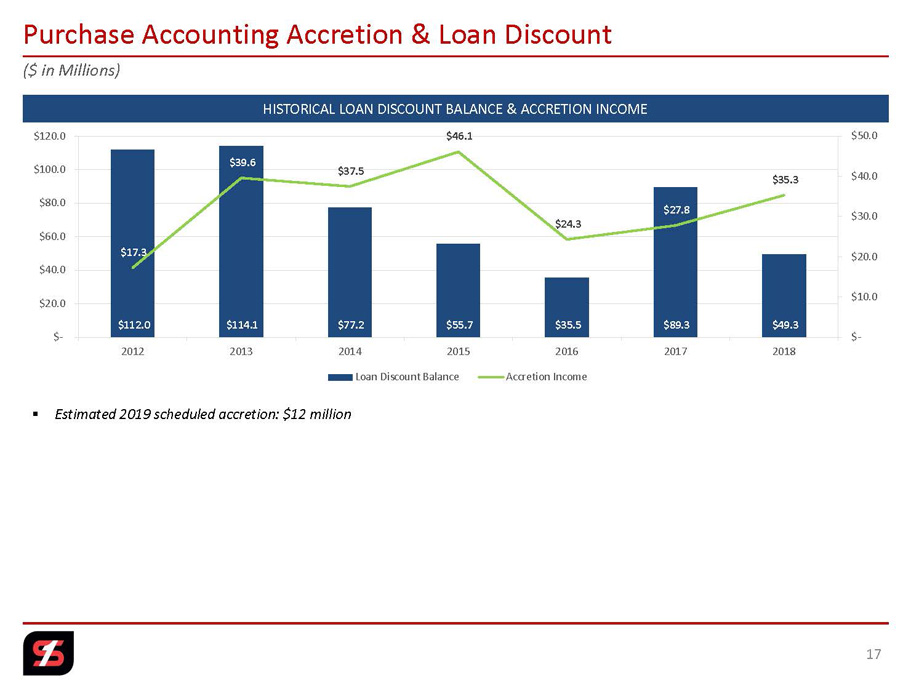
$112.0 $114.1 $77.2 $55.7 $35.5 $89.3 $49.3 $17.3 $39.6 $37.5 $46.1 $24.3 $27.8 $35.3 $- $10.0 $20.0 $30.0 $40.0 $50.0 $- $20.0 $40.0 $60.0 $80.0 $100.0 $120.0 2012 2013 2014 2015 2016 2017 2018 Loan Discount Balance Accretion Income ($ in Millions) Purchase Accounting Accretion & Loan Discount 17 HISTORICAL LOAN DISCOUNT BALANCE & ACCRETION INCOME ▪ Estimated 2019 scheduled accretion: $12 million

(1) Purchase price and ratios as of closed date, except for Reliance Bancshares, Inc. Source: S&P Global Market Intelligence. (2) Metropolitan was acquired from Section 363 Bankruptcy. (3) Expected close date. Acquisitions Since 2013 18 2013 – 2014 Consolidated eight charters to one National to State Charter Conversion (Fed Member Bank) 2015 2016 2017 2018 $ in millions System Total Trust Purchase Price / Estimated Bank Announced Closed Conversion Assets AUM Price⁽¹⁾ Earnings⁽¹⁾ Book Value⁽¹⁾ TBV⁽¹⁾ Cost Savings Metropolitan National Bank⁽²⁾ Sep-13 Nov-13 Mar-14 920$ 370$ 54$ 12.5 x 88% 89% 40% Delta Trust & Bank Mar-14 Aug-14 Oct-14 420 815 67 14.9 x 153% 157% 35% First State Bank May-14 Feb-15 Sep-15 1,915 - 272 12.2 x 167% 170% 20% Liberty Bank May-14 Feb-15 Apr-15 1,065 - 213 12.1 x 191% 198% 25% Trust Company of the Ozarks Apr-15 Oct-15 Jan-16 15 1,000 24 NA NA NA 15% Citizens National Bank May-16 Sep-16 Oct-16 585 200 82 18.0 x 130% 130% 25% Hardeman County Investments Nov-16 May-17 Sep-17 462 - 71 17.4 x 138% 179% 30% Southwest Bancorp, Inc (OKSB) Dec-16 Oct-17 May-18 2,468 - 532 24.7 x 180% 190% 35% First Texas BHC, Inc. Jan-17 Oct-17 Feb-18 2,019 430 461 23.2 x 192% 228% 32% Reliance Bancshares, Inc.⁽³⁾ Nov-18 Apr-19 Apr-19 1,493 - 172 19.1 x 187% 187% 30%

$10 Billion Threshold 19 AUDIT & COMPLIANCE REGULATORY COST To strengthen the Audit and Regulatory Compliance groups, as well as to prepare for the increased regulatory requirements ass oci ated with exceeding $10 billion in assets, the Company has incurred the following costs: DURBIN AMENDMENT The Durbin amendment, passed as part of the Dodd - Frank Act, required the Federal Reserve to limit fees charged to retailers for debit card processing . For financial institutions with total assets of $ 10 billion or more as of December 31 st of a given year, the debit card fees are reduced beginning on July 1 st of the following year . Due to the acquisitions of Southwest Bancorp, Inc . and First Texas BHC, Inc . , SFNC exceeded the $ 10 billion threshold as of December 31 , 2017 . The effective date for the impact of the Durbin Amendment was July 1 , 2018 . Due to the impact of the Durbin amendment, debit card fees decreased by $ 5 . 9 million in 2018 . The Company’s estimated reduction in debit card fees for 2019 is an additional $ 7 million pre - tax, which will impact the first and second quarter of 2019 . ▪ 2017 - $0 ▪ 2018 - $7 million pre - tax ▪ 2019 - $14 million pre - tax $ in millions 2015 2016 2017 2018 Audit & Compliance Cost 4.1$ 7.0$ 10.4$ 10.1$ FDIC Insurance & State Assessment 4.7 4.0 4.7 10.5 Total Regulatory Cost 8.8$ 11.0$ 15.0$ 20.6$
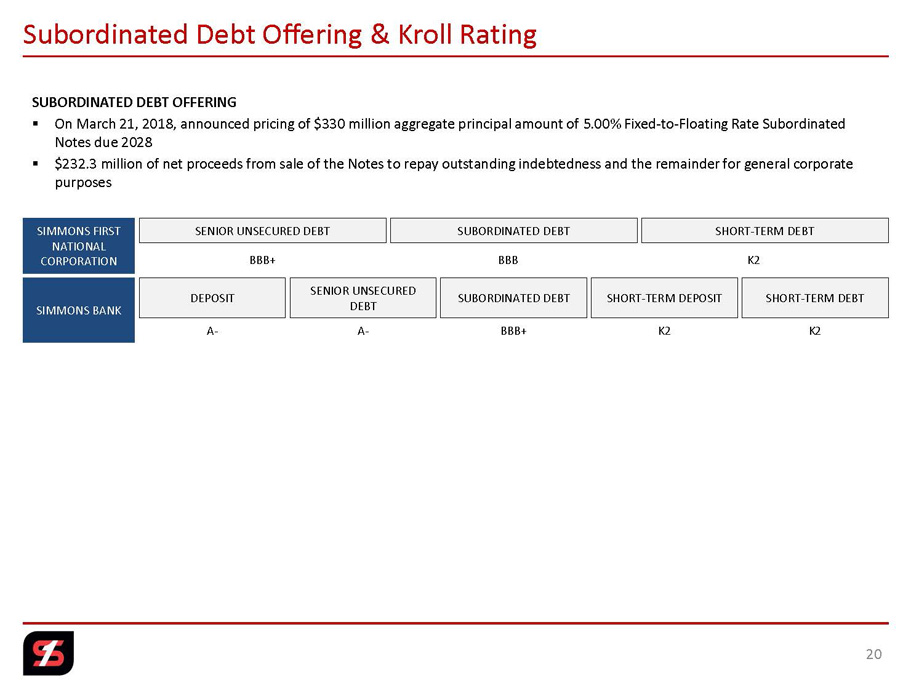
Subordinated Debt Offering & Kroll Rating 20 SENIOR UNSECURED DEBT SHORT - TERM DEBT SUBORDINATED DEBT SENIOR UNSECURED DEBT SHORT - TERM DEBT SUBORDINATED DEBT SHORT - TERM DEPOSIT DEPOSIT BBB+ BBB K2 SIMMONS FIRST NATIONAL CORPORATION SIMMONS BANK A - A - BBB+ K2 K2 SUBORDINATED DEBT OFFERING ▪ On March 21, 2018, announced pricing of $330 million aggregate principal amount of 5.00% Fixed - to - Floating Rate Subordinated Notes due 2028 ▪ $232.3 million of net proceeds from sale of the Notes to repay outstanding indebtedness and the remainder for general corpora te purposes
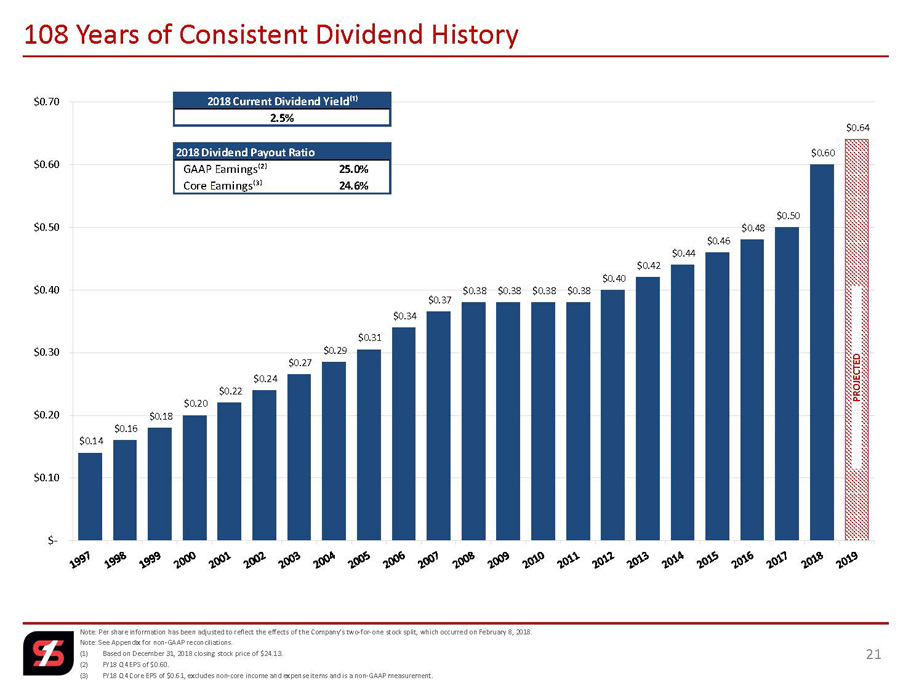
$0.14 $0.16 $0.18 $0.20 $0.22 $0.24 $0.27 $0.29 $0.31 $0.34 $0.37 $0.38 $0.38 $0.38 $0.38 $0.40 $0.42 $0.44 $0.46 $0.48 $0.50 $0.60 $0.64 $- $0.10 $0.20 $0.30 $0.40 $0.50 $0.60 $0.70 Note: Per share information has been adjusted to reflect the effects of the Company’s two - for - one stock split, which occurred on February 8, 2018. Note: See Appendix for non - GAAP reconciliations. (1) Based on December 31, 2018 closing stock price of $24.13. (2) FY18 Q4 EPS of $0.60. (3) FY18 Q4 Core EPS of $0.61, excludes non - core income and expense items and is a non - GAAP measurement. 108 Years of Consistent Dividend History 21 PROJECTED 2018 Current Dividend Yield⁽¹⁾ 2.5% 2018 Dividend Payout Ratio GAAP Earnings⁽²⁾ 25.0% Core Earnings⁽³⁾ 24.6%
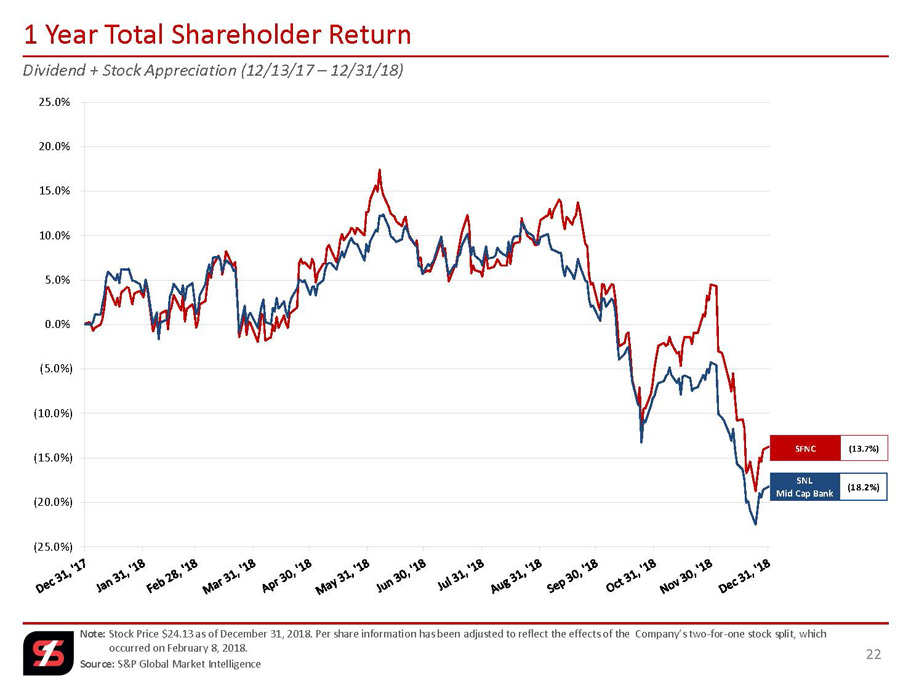
(25.0%) (20.0%) (15.0%) (10.0%) (5.0%) 0.0% 5.0% 10.0% 15.0% 20.0% 25.0% Dividend + Stock Appreciation (12/13/17 – 12/31/18) Note: Stock Price $24.13 as of December 31, 2018. Per share information has been adjusted to reflect the effects of the Company’s two - for - one stock split, which occurred on February 8, 2018. Source: S&P Global Market Intelligence 1 Year Total Shareholder Return 22 SNL Mid Cap Bank (18.2%) SFNC (13.7%)
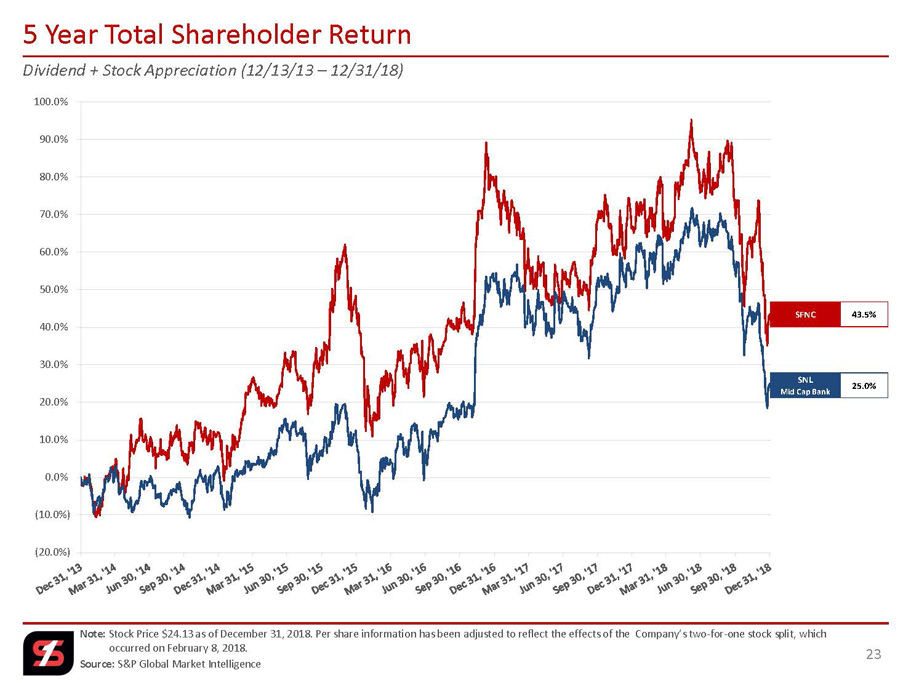
(20.0%) (10.0%) 0.0% 10.0% 20.0% 30.0% 40.0% 50.0% 60.0% 70.0% 80.0% 90.0% 100.0% Dividend + Stock Appreciation (12/13/13 – 12/31/18) Note: Stock Price $24.13 as of December 31, 2018. Per share information has been adjusted to reflect the effects of the Company’s two - for - one stock split, which occurred on February 8, 2018. Source: S&P Global Market Intelligence 5 Year Total Shareholder Return 23 SFNC 43.5% SNL Mid Cap Bank 25.0%

(75.0%) (55.0%) (35.0%) (15.0%) 5.0% 25.0% 45.0% 65.0% 85.0% 105.0% 125.0% 145.0% 165.0% 185.0% 205.0% 225.0% Dividend + Stock Appreciation (12/31/07 – 12/31/18) Note: Stock Price $24.13 as of December 31, 2018. Per share information has been adjusted to reflect the effects of the Company’s two - for - one stock split, which occurred on February 8, 2018. Source: S&P Global Market Intelligence Long - term Shareholder Return 24 SFNC 139.7% SNL Mid Cap Bank (5.8%)

Note: Per share information has been adjusted to reflect the effects of the Company’s two - for - one stock split, which occurred o n February 8, 2018. (1) LTM Core EPS excludes non - core income and expense items and is a non - GAAP measurement. See Appendix for non - GAAP reconciliations . (2) Based upon the Company’s average five analyst consensus EPS of $2.38 for 2018 and $2.52 for 2019, as of January 15, 2019. EPS es timates adjusted for stock split. (3) Tangible Book Value is a non - GAAP measurement. See Appendix for non - GAAP reconciliations. Source: S&P Global Market Intelligence Investment Profile 25 Market Data as of 12/31/18 SFNC Stock Price 24.13$ 52-Week High 33.45$ 52-Week Low 22.64$ Common Shares Outstanding (millions) 92.3 Market Capitalization (millions) 2,228.3$ % Institutional Ownership 66% Valuation & Per Share Data Price / LTM EPS 10.4 x Price / LTM Core EPS⁽¹⁾ 10.1 x Price / 2018 Consensus EPS⁽²⁾ 10.1 x Price / 2019 Consensus EPS⁽²⁾ 9.6 x Price / Book Value 1.0 x Price / Tangible Book Value⁽³⁾ 1.7 x

Strategic Focus 26 ▪ "Table Stakes" – Asset Quality – Regulatory Compliance ▪ Internal revenue opportunities ▪ Efficiency initiatives ▪ Branding in new markets and product enhancements ▪ Acquisitions – Traditional banking – enhance current footprint and consider expanding into adjoining states (inside - out strategy) – Non - banking – trust, investments, insurance and credit card

Why Simmons First? 27 ▪ Multiple paths to potential above - average earnings growth – M&A accretion, cost savings and revenue enhancements – Continued efficiency initiatives – Organic legacy loan growth ▪ Experienced and deep management ▪ Exceptional balance sheet ▪ Consistent historical earnings performance ▪ Attractive dividend yield and total shareholder return Committed to delivering a sophisticated and diverse range of products with the service level of a community bank

Appendix 28

Non - GAAP Reconciliations 29 YTD Q4 Q4 $ in thousands 2015 2016 2017 2018 2017 2018 Calculation of Core Return on Average Assets Net income available to common stockholders 74,107$ 96,790$ 92,940$ 215,713$ 18,903$ 55,646$ Net non-core items, net of taxes, adjustment 15,515 4,619 26,109 4,520 23,115 805 Core earnings 89,622$ 101,409$ 119,049$ 220,233$ 42,018$ 56,451$ Average total assets 7,164,788$ 7,760,233$ 10,074,951$ 15,771,362$ 13,897,778$ 16,357,753$ Return on average assets 1.03% 1.25% 0.92% 1.37% 0.54% 1.35% Core return on average assets 1.25% 1.31% 1.18% 1.40% 1.20% 1.37% Calculation of Return on Tangible Common Equity Net income available to common stockholders 74,107$ 96,790$ 92,940$ 215,713$ 18,903$ 55,646$ Amortization of intangibles, net of taxes 2,972 3,611 4,659 8,132 1,725 1,952 Total income available to common stockholders 77,079$ 100,401$ 97,599$ 223,845$ 20,628$ 57,598$ Net non-core items, net of taxes 15,515 4,619 26,109 4,520 23,115 805 Core earnings 89,622 101,409 119,049 220,233 42,018 56,451 Amortization of intangibles, net of taxes 2,972 3,611 4,659 8,132 1,725 1,952 Total core income available to common stockholders 92,594$ 105,020$ 123,708$ 228,365$ 43,743$ 58,403$ Average common stockholders' equity 938,521$ 1,105,775$ 1,390,815$ 2,157,097$ 1,931,804$ 2,211,217$ Average intangible assets: Goodwill (281,133) (332,974) (455,453) (845,308) (731,661) (845,687) Other intangibles (42,104) (51,710) (68,896) (97,820) (113,770) (92,990) Total average intangibles (323,237) (384,684) (524,349) (943,128) (845,431) (938,677) Average tangible common stockholders' equity 615,284$ 721,091$ 866,466$ 1,213,969$ 1,086,373$ 1,272,540$ Return on average common equity 7.90% 8.75% 6.68% 10.00% 3.88% 9.98% Return on tangible common equity (non-GAAP) 12.53% 13.92% 11.26% 18.44% 7.53% 17.96% Core return on average common equity (non-GAAP) 9.55% 9.17% 8.56% 10.21% 8.63% 10.13% Core return on tangible common equity (non-GAAP) 15.05% 14.56% 14.28% 18.81% 15.97% 18.21%
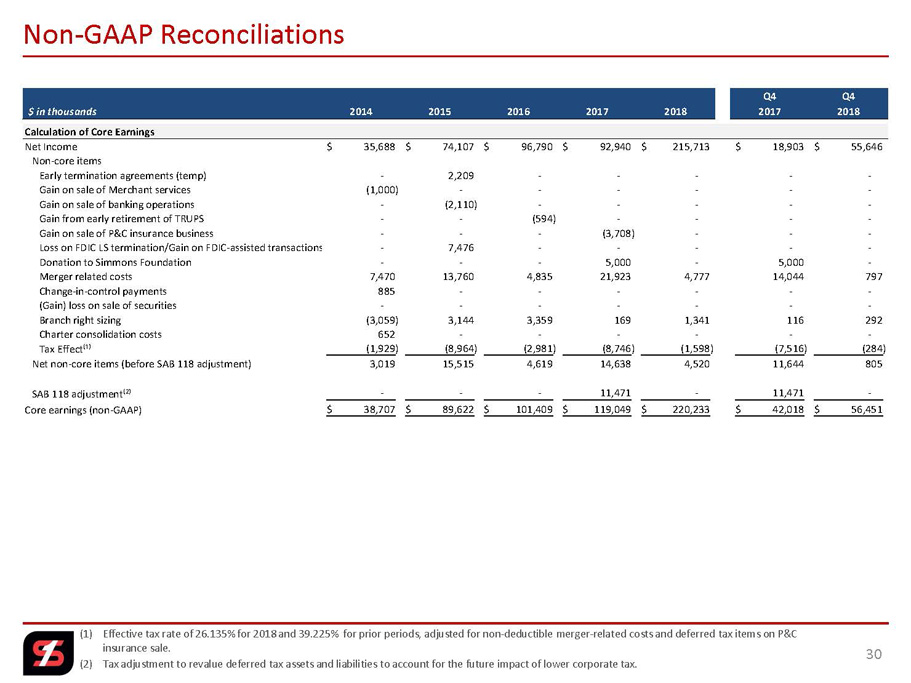
(1) Effective tax rate of 26.135% for 2018 and 39.225% for prior periods, adjusted for non - deductible merger - related costs and defe rred tax items on P&C insurance sale. (2) Tax adjustment to revalue deferred tax assets and liabilities to account for the future impact of lower corporate tax. Non - GAAP Reconciliations 30 Q4 Q4 $ in thousands 2014 2015 2016 2017 2018 2017 2018 Calculation of Core Earnings Net Income 35,688$ 74,107$ 96,790$ 92,940$ 215,713$ 18,903$ 55,646$ Non-core items Early termination agreements (temp) - 2,209 - - - - - Gain on sale of Merchant services (1,000) - - - - - - Gain on sale of banking operations - (2,110) - - - - - Gain from early retirement of TRUPS - - (594) - - - - Gain on sale of P&C insurance business - - - (3,708) - - - Loss on FDIC LS termination/Gain on FDIC-assisted transactions - 7,476 - - - - - Donation to Simmons Foundation - - - 5,000 - 5,000 - Merger related costs 7,470 13,760 4,835 21,923 4,777 14,044 797 Change-in-control payments 885 - - - - - - (Gain) loss on sale of securities - - - - - - - Branch right sizing (3,059) 3,144 3,359 169 1,341 116 292 Charter consolidation costs 652 - - - - - - Tax Effect⁽¹⁾ (1,929) (8,964) (2,981) (8,746) (1,598) (7,516) (284) Net non-core items (before SAB 118 adjustment) 3,019 15,515 4,619 14,638 4,520 11,644 805 SAB 118 adjustment⁽²⁾ - - - 11,471 - 11,471 - Core earnings (non-GAAP) 38,707$ 89,622$ 101,409$ 119,049$ 220,233$ 42,018$ 56,451$

Note: Per share information has been adjusted to reflect the effects of the Company’s two - for - one stock split, which occurred o n February 8, 2018. (1) Effective tax rate of 26.135% for 2018 and 39.225% for prior periods, adjusted for non - deductible merger - related costs and defe rred tax items on P&C insurance sale. (2) Tax adjustment to revalue deferred tax assets and liabilities to account for the future impact of lower corporate tax. Non - GAAP Reconciliations 31 Q4 Q4 $ per Share 2014 2015 2016 2017 2018 2017 2018 Calculation of Diluted Earnings per Share (EPS) Diluted earnings per share 1.05$ 1.31$ 1.56$ 1.33$ 2.32$ 0.22$ 0.60$ Non-core items Early termination agreements (temp) - 0.04 - - - - - Gain on sale of Merchant services (0.03) - - - - - - Gain on sale of banking operations - (0.04) - - - - - Gain from early retirement of TRUPS - - (0.01) - - - - Gain on sale of P&C insurance business - - - (0.04) - - - Loss on FDIC LS termination/Gain on FDIC-assisted transactions - 0.14 - - - - - Donation to Simmons Foundation - - - 0.07 - 0.06 - Merger related costs 0.22 0.25 0.08 0.31 0.05 0.17 0.01 Change-in-control payments 0.03 - - - - - - (Gain) loss on sale of securities - - - - - - - Branch right sizing (0.08) 0.06 0.06 - 0.02 - - Charter consolidation costs 0.02 - - - - - - Tax effect⁽¹⁾ (0.07) (0.17) (0.05) (0.13) (0.02) (0.10) - Net non-core items (before SAB 118 adjustment) 0.09 0.28 0.08 0.21 0.05 0.13 0.01 SAB 118 adjustment⁽²⁾ - - - 0.16 - 0.13 - Diluted core earnings per share (non-GAAP) 1.14$ 1.59$ 1.64$ 1.70$ 2.37$ 0.48$ 0.61$

(1) Efficiency ratio is noninterest expense before foreclosed property expense and amortization of intangibles as a percent of ne t i nterest income (fully taxable equivalent) and noninterest revenues, excluding gains and losses from securities transactions and non - core items. Non - GAAP Reconciliations 32 YTD Q4 Q4 $ in thousands 2015 2016 2017 2018 2017 2018 Calculation of Efficiency Ratio Non-interest expense 256,970$ 255,085$ 312,379$ 392,229$ 108,490$ 95,396$ Non-core non-interest expense adjustment (18,747) (8,435) (27,357) (6,118) (19,160) (1,089) Other real estate and foreclosure expense adjustment (4,861) (4,389) (3,042) (4,240) (865) (1,300) Amortization of intangibles adjustment (4,889) (5,942) (7,666) (11,009) (2,839) (2,642) Efficiency ratio numerator 228,473$ 236,319$ 274,314$ 370,862$ 85,626$ 90,365$ Net-interest income 278,595$ 279,206$ 354,930$ 552,552$ 126,919$ 137,781$ Non-interest income 94,661 139,382 138,765 143,896 36,629 34,588 Non-core non-interest income adjustment 5,731 (835) (3,972) - - - Fully tax-equivalent adjustment 8,517 7,722 7,723 5,297 1,925 1,466 (Gain) loss on sale of securities (307) (5,848) (1,059) (61) 1,243 (8) Efficiency ratio denominator 387,197$ 419,627$ 496,387$ 701,684$ 166,716$ 173,827$ Efficiency ratio⁽¹⁾ 59.01% 56.32% 55.27% 52.85% 51.36% 51.99%

Note: Per share information has been adjusted to reflect the effects of the Company’s two - for - one stock split, which occurred o n February 8, 2018. Non - GAAP Reconciliations 33 YTD Q4 Q4 $ in thousands, except per share and share count 2015 2016 2017 2018 2017 2018 Calculation of Core Net Interest Margin Net interest income 278,595$ 279,206$ 354,930$ 552,552$ 126,919$ 137,781$ Fully tax-equivalent adjustment 8,517 7,722 7,723 5,297 1,925 1,466 Fully tax-equivalent net interest income 287,112 286,928 362,653 557,849 128,844 139,247 Total accretable yield (46,131) (24,257) (27,793) (35,263) (15,684) (3,850) Core net interest income 240,981$ 262,671$ 334,860$ 522,586$ 113,160$ 135,397$ Average earning assets 6,305,966$ 6,855,322$ 8,908,418$ 14,036,614$ 12,145,003$ 14,686,038$ Net interest margin 4.55% 4.19% 4.07% 3.97% 4.21% 3.76% Core net interest margin (non-GAAP) 3.82% 3.83% 3.76% 3.72% 3.70% 3.66% December 31, 2018 Calculation of Tangible Book Value per Share Total common stockholders' equity 2,246,434$ Intangible assets: Goodwill (845,687) Other intangible assets (91,334) Total intangibles (937,021) Tangible common stockholders' equity 1,309,413$ Shares of common stock outstanding 92,347,643 Book value per common share 24.33$ Tangible book value per common share (non-GAAP) 14.18$ Stock Price as of December 31, 2018 24.13$ Price / Book Value per Share 1.0 x Price / Tangible Book Value per Share 1.7 x

34