Attached files
| file | filename |
|---|---|
| EX-99.1 - Entegra Financial Corp. | e19023_ex99-1.htm |
| EX-2.1 - Entegra Financial Corp. | e19023_ex2-1.htm |
| 8-K - Entegra Financial Corp. | e19023_enfc-8k.htm |

Transformative Merger of Equals January 15, 2019

2 Compliance Disclosures Important Information for Shareholders and Investors This presentation shall not constitute an offer to sell, the solicitation of an offer to sell, or the solicitation of an offer to buy any securities or the solicitation of any vote or approval of the SmartFinancial, Inc. (“SmartFinancial”, “SMBK”) or Entegra Financial Corp. (“Entegra”, “ENFC”) shareholders, nor shall there be any sale of securities in any jurisdiction in which such offer, solicitation, or sale would be unlawful prior to registration or qualification under the securities laws of any such jurisdiction. In connection with the proposed transaction, SmartFinancial will file a registration statement on Form S-4 with the Securities and Exchange Commission (the “SEC”), which will contain the joint proxy statement of SmartFinancial and Entegra and a prospectus of SmartFinancial. Shareholders of Entegra and SmartFinancial are encouraged to read the registration statement, including the joint proxy statement/prospectus that will be part of the registration statement, because it will contain important information about the proposed transaction, Entegra, and SmartFinancial. After the registration statement is filed with the SEC, the joint proxy statement/prospectus and other relevant documents will be mailed to Entegra and SmartFinancial shareholders and will be available for free on the SEC’s website (www.sec.gov). The joint proxy statement/prospectus will also be made available for free by contacting Ron Gorczynski, SmartFinancial’s Chief Administrative Officer, at (865) 437-5724 or David Bright, the Chief Financial Officer of Entegra, at (828) 524-7000. No offer of securities shall be made except by means of a prospectus meeting the requirements of Section 10 of the Securities Act of 1933, as amended (the “Securities Act”). Participants in the Solicitation SmartFinancial, Entegra and certain of their respective directors and executive officers may be deemed to be participants in the solicitation of proxies from Entegra and SmartFinancial shareholders in connection with the proposed transaction under the rules of the SEC. Information about the directors and executive officers of SmartFinancial may be found in the definitive proxy statement for SmartFinancial’s 2018 annual meeting of shareholders, filed with the SEC by SmartFinancial on April 2, 2018, and other documents subsequently filed by SmartFinancial with the SEC. Information about the directors and executive officers of Entegra may be found in the definitive proxy statement for Entegra’s 2018 annual meeting of shareholders, filed by Entegra with the SEC on April 2, 2018. Additional information regarding the interests of these participants will also be included in the joint proxy statement/prospectus regarding the proposed transaction when it becomes available. Free copies of these documents may be obtained as described in the paragraph above.

3 Legal Disclaimer Forward-Looking Statements Certain of the statements made in this investor presentation may constitute forward-looking statements within the meaning of the Private Securities Litigation Reform Act of 1995, Section 27A of the Securities Act of 1933 and Section 21E of the Securities Exchange Act of 1934, as amended. The words “expect,” “anticipate,” “intend,” “plan,” “believe,” “seek,” and “estimate,” and similar expressions, are intended to identify such forward-looking statements, but other statements not based on historical information may also be considered forward-looking, including statements about the benefits to SmartFinancial and Entegra of the proposed merger, SmartFinancial’s and Entegra’s future financial and operating results and their respective plans, objectives, and intentions. All forward-looking statements are subject to risks, uncertainties, and other factors that may cause the actual results, performance, or achievements of SmartFinancial and Entegra to differ materially from any results, performance, or achievements expressed or implied by such forward-looking statements. Such risks, uncertainties, and other factors include, among others, (1) the risk that the cost savings and any revenue synergies from the proposed merger may not be realized or take longer than anticipated to be realized, (2) the risk that the cost savings and any revenue synergies from recently completed mergers may not be realized or may take longer than anticipated to realize, (3) disruption from the proposed merger, or recently completed mergers, with customer, supplier, or employee relationships, (4) the occurrence of any event, change, or other circumstances that could give rise to the termination of the merger agreement, (5) the failure to obtain necessary shareholder or regulatory approvals for the merger, (6) the possibility that the amount of the costs, fees, expenses, and charges related to the merger may be greater than anticipated, including as a result of unexpected or unknown factors, events, or liabilities, (7) the failure of the conditions to the merger to be satisfied, (8) the risk of successful integration of the two companies’ businesses, including the risk that the integration of Entegra’s operations with those of SmartFinancial will be materially delayed or will be more costly or difficult than expected, (9) the risk of expansion into new geographic or product markets, (10) reputational risk and the reaction of the parties’ customers to the merger, (11) the risk of potential litigation or regulatory action related to the merger, (12) the dilution caused by SmartFinancial’s issuance of additional shares of its common stock in the merger, and (13) general competitive, economic, political, and market conditions. Additional factors which could affect the forward-looking statements can be found in SmartFinancial’s annual report on Form 10-K, quarterly reports on Form 10-Q, and current reports on Form 8-K, or Entegra’s annual report on Form 10-K, quarterly reports on Form 10-Q, and current reports on Form 8-K, in each case filed with the SEC and available on the SEC’s website at http://www.sec.gov. SmartFinancial and Entegra disclaim any obligation to update or revise any forward-looking statements contained in this communication, which speak only as of the date hereof, whether as a result of new information, future events, or otherwise. Non-GAAP Financial Measures Statements included in this presentation include non-GAAP financial measures and should be read along with the accompanying tables, which provide a reconciliation of non-GAAP financial measures to GAAP financial measures. The non-GAAP financial measures used in this presentation include: (i) tangible common equity, (ii) tangible book value per share, (iii) core net interest margin, (iv) operating efficiency ratio, (v) operating return on average assets, (vi) operating earnings per share, and (vii) operating return on tangible common equity. Tangible common equity excludes total preferred stock, preferred stock paid in capital, goodwill, and other intangible assets, and tangible book value per share reflects the per share value of tangible common equity. Core net interest margin adjusts net interest margin to exclude the impact of purchase accounting. The operating efficiency ratio excludes securities gains and losses and merger related expenses from the efficiency ratio. Net operating income excludes securities gains and losses and merger related expenses, and the effect of the December, 2017 tax law change on deferred tax assets, and the income tax effect of adjustments, and operating return on average assets is net operating income divided by GAAP total average assets. Operating earnings per share is net operating income divided by GAAP total average assets. Operating return on tangible common equity is net operating income divided by tangible common equity. Management believes that non-GAAP financial measures provide additional useful information that allows readers to evaluate the ongoing performance of the company and provide meaningful comparisons to its peers. Non-GAAP financial measures should not be considered as an alternative to any measure of performance or financial condition as promulgated under GAAP, and investors should consider SmartFinancial's performance and financial condition as reported under GAAP and all other relevant information when assessing the performance or financial condition of the company. Non-GAAP financial measures have limitations as analytical tools, and investors should not consider them in isolation or as a substitute for analysis of the results or financial condition as reported under GAAP.

4 To maximize the combined ~$4.0B platform – ▪ Build upon both teams’ integration experience to support the foundation for continued efficient, intelligent growth ▪ Leverage ENFC’s operational expertise/mortgage platform and SMBK’s lending/sales culture and brand across the entire footprint ▪ SmartFinancial, Inc. and SmartBank brands to be adopted ▪ Combined company will be headquartered in Knoxville, TN ▪ Significant portion of bank operations will be based in Franklin, NC ▪ Perpetuate a consistent culture and environment where top performers want to work ▪ Leverage scale to recruit additional top sales talent in key markets ▪ Focus on EPS growth, core deposits and credit quality Creating a Premier Southeastern Partnership ▪ The proposed merger of equals (“MOE”) creates a premier ~$4.0 billion asset banking franchise with an attractive pro forma Southeast footprint* ▪ The fully integrated combined company will be a strong financial performer amongst its peers ▪ Advances combined entity into the top 20 largest publicly traded banks headquartered in its combined states of operation** ▪ Poised for continued organic and strategic growth as a partner of choice ▪ Combined size and improved earnings growth profile supports the potential for trading multiple expansion over time from current standalone valuations ▪ Delivering on meaningful EPS accretion in excess of 20% once fully integrated *Southeast defined as Alabama, Arkansas, Florida, Georgia, Louisiana, Mississippi, North Carolina, South Carolina and Tennessee **Defined as Alabama, Florida, Georgia, North Carolina, South Carolina and Tennessee Source: S&P Global Market Intelligence Stronger Company Enhanced Profile

5 Enhancing Value for Both Shareholder Bases ▪ $2.3 billion asset bank holding company(2) – Headquartered in Knoxville, TN – Founded in 2007 – NASDAQ traded under ticker “SMBK” ▪ Double digit annual organic growth complemented by track record of strategic partnerships – 6 multi-state strategic partnerships since 2012 – Experience integrating MOE partnership via the Cornerstone Bancshares, Inc. merger completed in 2015 ▪ Consistent earnings growth and momentum – 5-year Operating EPS growth(3)(4) : 87% – Delivering ~1.00% Operating Return on Average Assets(4) to shareholders ▪ $1.7 billion asset bank holding company – Headquartered in Franklin, NC – Founded in 1922 – NASDAQ traded under ticker “ENFC” ▪ Complementary mix of stable legacy and high-growth MSAs – Dominant market share in Cullowhee and Brevard, NC MSAs – Growth opportunities in Atlanta, GA, Greenville, SC and Asheville, NC MSAs ▪ Seasoned mortgage and SBA lending contributes to diversified fee income ▪ Approximately 0.90% Adjusted Return on Average Assets ▪ 5-year Operating EPS growth(4) : 200% ~$4.0 billion asset banking footprint across six states in desirable Southeast markets +20% EPS accretion(1) Return on Average Assets ~1.2%(1) Return on Average Common Equity >10%(1) Disciplined use of capital with sub-2.5 year tangible book value earn-back period Increased scale and scarcity value, creating one of the top 20 largest banks by total assets in combined states of operation* Furthers strategic positioning and solidifies company as a future partner of choice Improved stock liquidity with significant upside to current respective standalone trading prices Retention of strong capital position *Defined as Alabama, Florida, Georgia, North Carolina, South Carolina and Tennessee (1) Assumes first full year of operations in 2020 vs. SMBK standalone (2) Including pro forma impact of SMBK’s acquisition of Foothills Bancorp, Inc. on 11/01/18 (3) Year-to-date 2018 operating EPS of $1.12 annualized (4) Operating EPS and Operating return on average assets are Non-GAAP measures. Refer to appendix for GAAP to Non-GAAP reconciliation. Sources: S&P Global Market Intelligence, FDIC
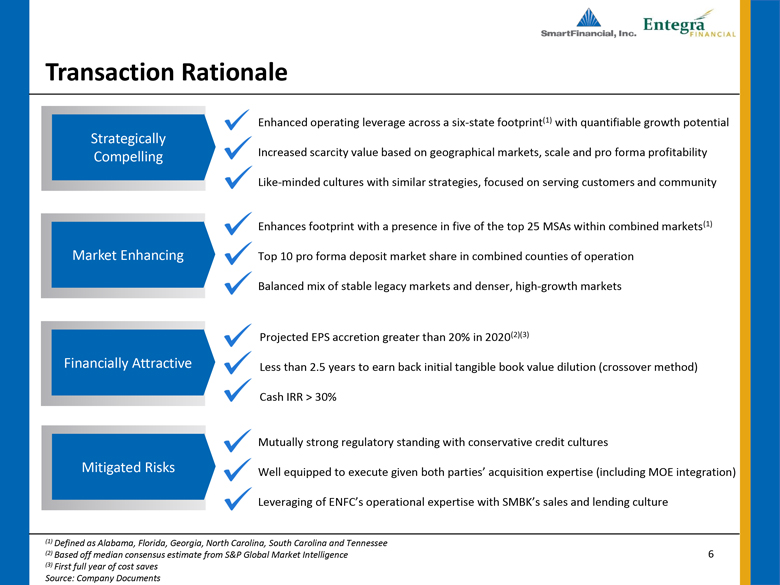
6 Transaction Rationale Mutually strong regulatory standing with conservative credit cultures Well equipped to execute given both parties’ acquisition expertise (including MOE integration) Leveraging of ENFC’s operational expertise with SMBK’s sales and lending culture Enhanced operating leverage across a six-state footprint(1) with quantifiable growth potential Increased scarcity value based on geographical markets, scale and pro forma profitability Like-minded cultures with similar strategies, focused on serving customers and community Projected EPS accretion greater than 20% in 2020(2)(3) Less than 2.5 years to earn back initial tangible book value dilution (crossover method) Cash IRR > 30% Enhances footprint with a presence in five of the top 25 MSAs within combined markets(1) Top 10 pro forma deposit market share in combined counties of operation Balanced mix of stable legacy markets and denser, high-growth markets (1) Defined as Alabama, Florida, Georgia, North Carolina, South Carolina and Tennessee (2) Based off median consensus estimate from S&P Global Market Intelligence (3) First full year of cost saves Source: Company Documents Strategically Compelling Market Enhancing Financially Attractive Mitigated Risks
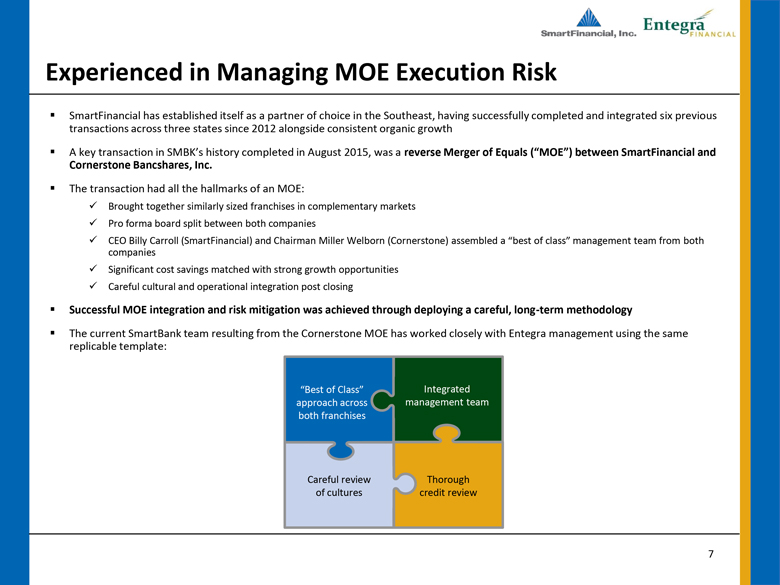
7 Experienced in Managing MOE Execution Risk ▪ SmartFinancial has established itself as a partner of choice in the Southeast, having successfully completed and integrated six previous transactions across three states since 2012 alongside consistent organic growth ▪ A key transaction in SMBK’s history completed in August 2015, was a reverse Merger of Equals (“MOE”) between SmartFinancial and Cornerstone Bancshares, Inc. ▪ The transaction had all the hallmarks of an MOE: Brought together similarly sized franchises in complementary markets Pro forma board split between both companies CEO Billy Carroll (SmartFinancial) and Chairman Miller Welborn (Cornerstone) assembled a “best of class” management team from both companies Significant cost savings matched with strong growth opportunities Careful cultural and operational integration post closing ▪ Successful MOE integration and risk mitigation was achieved through deploying a careful, long-term methodology ▪ The current SmartBank team resulting from the Cornerstone MOE has worked closely with Entegra management using the same replicable template: “Best of Class” approach across both franchises Integrated management team Thorough credit review Careful review of cultures

8 Calculated deal price per share of $22.36 Aggregate transaction value of $158.2 million(2) Transaction Terms SMBK to make $1 million contribution within 3-year period to qualifying charities serving legacy ENFC markets as directed by the Carolina Advisory Board* Consideration 100% Stock; fixed exchange ratio 1.215 shares of SMBK common stock for each share of ENFC common stock Foundation Contribution Pro forma Board of Directors to consist of 12 SMBK / 5 ENFC Key ENFC Management Retention Roger Plemens, David Bright and Ryan Scaggs to join SMBK leadership Pro Forma Ownership SMBK: 62% ENFC: 38% Required Approvals Shareholder approvals for both SMBK and ENFC Customary regulatory approvals Expected Closing Mid-year 2019 Estimated Transaction Multiples(3) Price/YTD ’18 EPS (Annualized): 11.6x Price/ TBVPS(4) : 119.4% Core Deposit Premium: 2.8% TBVPS(4) Impact: 7% initial dilution earned back in less than 2.5 years Board Representation Announced Transaction Value(1) *Anticipate formation at close (1) Based on SMBK’s closing price of $18.40 as of 01/14/19 (2) Inclusive of the value of rolled Entegra options (3) Based on Entegra Financial Corp.’s unaudited financial statements as of 09/30/18; TBVPS earn back period calculated utilizing crossover method (4) Tangible book value per share is a Non-GAAP measure. Refer to appendix for GAAP to Non-GAAP reconciliation. Sources: Definitive Agreement, Company Documents Contingent Value Right (“CVR”) ENFC shareholders will receive one CVR for each share of ENFC common stock for aftertax proceeds from pending resolution of ongoing dispute with unrelated third-parties

9 Expected Cost Savings Treatment of Options Merger & Integration Costs Revenue Synergies Purchase Accounting & Other Adjustments ▪ $10 million, or 25% of ENFC’s annual Noninterest Expense base ▪ 50% realized in 2019 ▪ 100% realized thereafter ▪ Approximately $15 million in combined pre-tax merger expenses ▪ Total gross loan fair value mark of -$37.0 million (3.5% of total loans*) ▪ Core Deposit Intangible = 2.0% of non-time deposits, S/L over 10 years ▪ Other Marks: +$0.6 million to other assets and liabilities ▪ ENFC’s Goodwill to be tested for impairment ▪ Identified but not included in financial model ▪ 472,060 ENFC stock options with a weighted average strike price of $20.15 rolled at fixed exchange ratio of 1.215 Key Transaction Assumptions *Total loans includes ENFC loans receivable and held for sale for the quarter ended 09/30/18 Sources: Definitive Agreement, Company Documents

10 Loan Concentration Ratios C&D/ Total Capital CRE/ Total Capital Estimated Pro Forma Capital Ratios and Concentrations TCE/ TA Leverage Ratio Common Equity Tier 1 Ratio Tier 1 Ratio Total Risk-Based Ratio Capital Ratios 268% 9.2% 9.3% 10.7% 10.7% 13.3% 78% 8.2% 8.7% 10.7% 11.1% 12.1% 88% 269% ▪ Standalone and pro forma organizations to remain “Well Capitalized” in excellent regulatory standing with CRE exposure below supervisory guidelines SMBK Standalone(1) ENFC Standalone(1) Pro Forma at Close(2) 248% 7.9% 9.1% 11.3% 12.6% 13.6% 91% (1) Consolidated capital ratios as of 09/30/18 (2) Includes pro forma impact of SMBK’s acquisition of Foothills Bancorp, Inc. on 11/01/18 (3) Bank-level and estimated pro forma concentration ratios as of 09/30/18 Source: S&P Global Market Intelligence, Company Documents SMBK Standalone (2) (3) ENFC Standalone (1) Pro Forma(3) SMBK Standalone(3) ENFC Standalone(3) Pro Forma(2)(3)

11 Our Combined Leadership Team David Bright Chief Financial Officer Billy Carroll, Jr. President & CEO Greg Davis Chief Lending Officer Bill Yoder Chief Banking Officer Ryan Scaggs Chief Operations Officer Gary Petty Chief Risk Officer Rhett Jordan Chief Credit Officer Ron Gorczynski Chief Administrative Officer Diane Short Chief HR Officer 12 SMBK Directors 5 ENFC Directors Miller Welborn Chairman Roger Plemens President of the Carolinas Legacy SMBK Legacy ENFC

12 Due Diligence Highlights ▪ Significant collaboration between SMBK and ENFC to carefully plan and structure: ▪ Optimal organizational structure ▪ Combined leadership team and Board of Directors ▪ Right-sized Risk Management and Compliance functions ▪ Comprehensive, reciprocal review of cultures, processes, core systems and business plans ▪ In-depth credit due diligence, using experienced in-house and third-party specialists ▪ Like-minded conservative underwriting methodology ▪ Extremely granular portfolio, averaging $135.7 thousand per credit ▪ Reviewed 54% of entire portfolio and 68% of watch list loans: ▪ 24% of 1-4 family credits ▪ 68% of commercial real estate ▪ 56% of acquisition, development and construction

13 Building Significant Scarcity Value ▪ Increases depth of executive leadership team and Board of Directors highly capable of running a pro forma ~$4.0 billion asset, NASDAQ-traded financial institution *Most recent quarter (MRQ) pro forma for acquisitions (whole-bank and branch) and branch divestitures; including pro forma impact of SMBK’s acquisition of Foothills Bancorp, Inc. on 11/01/18 **Defined as Alabama, Florida, Georgia, North Carolina, South Carolina and Tennessee Source: S&P Global Market Intelligence ▪ Advances combined entity into the top 20 largest publicly traded banks headquartered in its combined states of operation** Rank (#) Institution Name Pro Forma Assets (MRQ) ($000s) 1 Bank of America Corporation 2,338,833,000 2 BB&T Corporation 222,885,000 3 SunTrust Banks, Inc. 211,276,000 4 Regions Financial Corporation 124,578,000 5 Synovus Financial Corp.* 44,508,476 6 First Horizon National Corporation 40,635,924 7 First Citizens BancShares, Inc.* 36,346,131 8 BankUnited, Inc. 31,513,636 9 Pinnacle Financial Partners, Inc. 24,557,545 10 CenterState Bank Corporation* 16,377,710 11 Ameris Bancorp* 16,241,050 12 South State Corporation 14,522,215 13 United Community Banks, Inc. 12,405,132 14 Mercantil Bank Holding Corporation 8,435,802 15 ServisFirst Bancshares, Inc. 7,517,833 16 Seacoast Banking Corporation of Florida* 6,729,612 17 First Bancorp 5,711,630 18 FB Financial Corporation* 5,449,767 19 Franklin Financial Network, Inc. 4,167,813 SmartFinancial, Inc.* / Entegra Financial Corp. 3,939,747 21 Carolina Financial Corporation 3,721,485 22 Live Oak Bancshares, Inc. 3,444,757 23 HomeTrust Bancshares, Inc. 3,353,959 24 Capital City Bank Group, Inc. 2,819,190 25 Southern BancShares (N.C.), Inc. 2,674,603 26 Atlantic Capital Bancshares, Inc.* 2,491,121 27 Wilson Bank Holding Co. 2,460,097 SmartFinancial, Inc.* 2,270,181 Ranked by total assets as of 09/30/18, pro forma for acquisitions
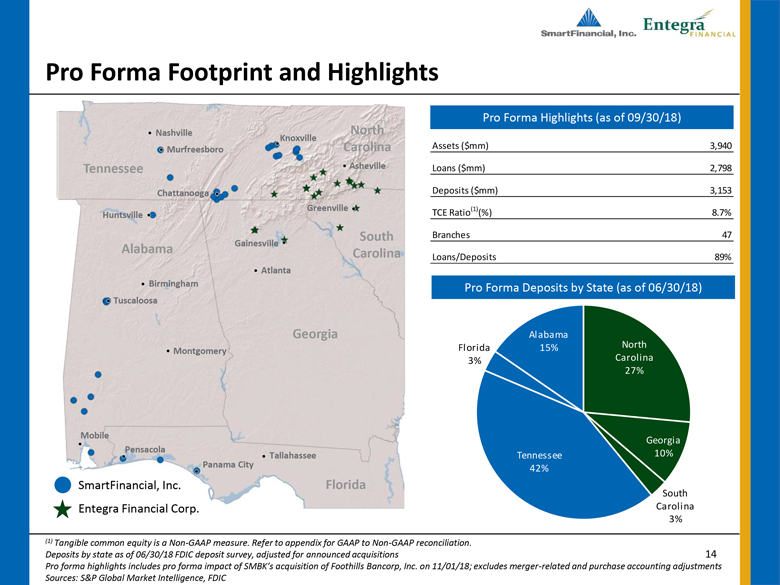
14 Pro Forma Footprint and Highlights Pro Forma Deposits by State (as of 06/30/18) Pro Forma Highlights (as of 09/30/18) (1) Tangible common equity is a Non-GAAP measure. Refer to appendix for GAAP to Non-GAAP reconciliation. Deposits by state as of 06/30/18 FDIC deposit survey, adjusted for announced acquisitions Pro forma highlights includes pro forma impact of SMBK’s acquisition of Foothills Bancorp, Inc. on 11/01/18; excludes merger-related and purchase accounting adjustments Sources: S&P Global Market Intelligence, FDIC Assets ($mm) 3,940 Loans ($mm) 2,798 Deposits ($mm) 3,153 TCE Ratio(1)(%) 8.7% Branches 47 Loans/Deposits 89% North Carolina 27% Georgia 10% South Carolina 3% Tennessee 42% Florida 3% Alabama 15% Chattanooga Greenville Huntsville Panama City Pensacola Mobile Murfreesboro Tennessee North Carolina South Carolina Georgia Florida Alabama Birmingham Tuscaloosa Knoxville Gainesville Asheville Montgomery Tallahassee Nashville Atlanta SmartFinancial, Inc. Entegra Financial Corp.

15 Pro Forma Deposit Market Share Pro Forma Counties of Operation Rank Institution Market Share (%) Deposits in Market ($000) Number of Branches 1 Regions Financial Corp. (AL) 10.27 9,206,647 131 2 SunTrust Banks Inc. (GA) 8.44 7,560,434 79 3 Wells Fargo & Co. (CA) 7.55 6,762,338 73 4 First Horizon National Corp. (TN) 7.06 6,325,140 60 5 BB&T Corp. (NC) 6.15 5,508,294 76 6 Bank of America Corp. (NC) 5.92 5,307,656 46 7 Pinnacle Financial Partners Inc. (TN) 3.74 3,349,074 23 8 SMBK/ENFC 3.50 3,133,913 47 9 Hancock Whitney Corp. (MS) 3.08 2,756,285 15 10 Synovus Financial Corp. (GA) 2.93 2,625,173 33 Total for Institutions in Market 89,607,143 1,291 South Carolina Pro Forma County Market Share #1 to #5 #6 to #15 Greater than #15 Alabama Birmingham Florida Georgia North Carolina Tennessee Tuscaloosa Montgomery Tallahassee Panama City Pensacola Mobile Huntsville Atlanta Gainesville Greenville Asheville Chattanooga Nashville Murfreesboro Knoxville Note: Deposits for market share analysis are as of 06/30/18 FDIC deposit survey, adjusted for acquisitions Sources: S&P Global Market Intelligence, FDIC

16 Overview of Entegra Financial Corp. Entegra Company Highlights * Nonperforming assets excluding restructured loans (nonaccrual loans, real estate owned and repossessed assets) as a percent of total assets Note: Deposits for market share analysis are as of 06/30/18 FDIC deposit survey, adjusted for announced acquisitions Source: S&P Global Market Intelligence Deposit Market Share by Counties of Operation Rank Institution Market Share (%) Deposits in Market ($000) Number of Branches 1 Wells Fargo & Co. (CA) 16.24 5,714,441 54 2 Bank of America Corp. (NC) 10.20 3,588,035 34 3 BB&T Corp. (NC) 9.93 3,494,584 41 4 First Citizens BancShares Inc. (NC) 9.22 3,241,800 53 5 SunTrust Banks Inc. (GA) 8.18 2,879,249 33 6 Toronto-Dominion Bank (Canada) 6.92 2,435,720 24 7 United Community Banks Inc. (GA) 5.44 1,914,899 33 8 Entegra Financial Corp. (NC) 3.48 1,224,255 18 9 South State Corp. (SC) 2.75 966,002 12 10 HomeTrust Bancshares Inc. (NC) 2.63 923,639 12 Total for Institutions in Market 35,178,670 473 ▪ 96-year-old bank with deep relationships ▪ Dominant legacy deposit market share ▪ Strong asset quality and profitability improvement ▪ Healthy economies and growth in the Carolinas Company Name Entegra Financial Corp. Headquarters Franklin, NC Dollars in Thousands (Consolidated as of 09/30/18) Total Assets 1,669,566 Net Loans 1,060,236 Total Deposits 1,256,032 Tangible Common Equity 129,077 Net Income, 2017 2,579 Net Income, LTM 6,898 Percentages (Consolidated as of 09/30/18) Adjusted ROAA 0.88 Adjusted ROAE 9.19 Net Interest Margin (Tax Equivalent) 3.26 Adjusted Efficiency Ratio 66.25 NPAs Excl. TDRs* /Assets 0.43 Leverage Ratio 9.09 Total Capital Ratio 13.56 Noninterest Bearing Deposits/ Deposits 15.86

17 907 1,439 1,500 1,717 1,897 830 1,162 1,206 1,221 1,256 0 400 800 1,200 1,600 2,000 YE 2016 YE 2017 Q1'18 Q2'18 Q3'18* 1,062 1,721 1,760 2,062 2,270 1,293 1,581 1,625 1,628 1,670 0 500 1,000 1,500 2,000 2,500 YE 2016 YE 2017 Q1'18 Q2'18 Q3'18* Balance Sheet Trends *Includes pro forma impact of SMBK’s acquisition of Foothills Bancorp, Inc. on 11/01/18 **Nonperforming assets excluding restructured loans (nonaccrual loans, real estate owned and repossessed assets) as a percent of total assets Sources: S&P Global Market Intelligence, SMBK and ENFC SEC filings Total Assets ($mm) Net Loans ($mm) 808 1,317 1,368 1,568 1,735 740 998 1,029 1,046 1,060 0 400 800 1,200 1,600 2,000 YE 2016 YE 2017 Q1'18 Q2'18 Q3'18* Total Deposits ($mm) NPAs Excluding TDRS** / Assets 0.43% 0.30% 0.27% 0.25% 0.27% 0.79% 0.47% 0.44% 0.45% 0.43% 0.00% 0.25% 0.50% 0.75% 1.00% YE 2016 YE 2017 Q1'18 Q2'18 Q3'18* SMBK* ENFC

18 Performance Trends (1) Excludes non-recurring and merger-related items (2) SMBK figures presented reflect Core Net Interest Margin, which excludes purchase accounting adjustments. Refer to appendix for GAAP to Non-GAAP reconciliation Sources: S&P Global Market Intelligence, SMBK and ENFC SEC filings Operating Return on Average Assets(1) Operating Return on Average Tangible Common Equity(1) 0.56% 0.79% 0.89% 1.01% 0.98% 0.61% 0.75% 0.94% 0.92% 0.88% 0.00% 0.25% 0.50% 0.75% 1.00% 1.25% YE 2016 YE 2017 Q1'18 Q2'18 Q3'18 5.86% 7.07% 9.04% 11.04% 10.84% 5.34% 8.18% 12.18% 11.80% 11.18% 0.00% 2.50% 5.00% 7.50% 10.00% 12.50% 15.00% YE 2016 YE 2017 Q1'18 Q2'18 Q3'18 Net Interest Margin (Tax Equivalent)(2) Operating Efficiency Ratio(1) 76.9% 71.7% 69.1% 64.8% 67.2% 72.7% 66.5% 64.6% 64.9% 66.3% 55.0% 60.0% 65.0% 70.0% 75.0% 80.0% YE 2016 YE 2017 Q1'18 Q2'18 Q3'18 SMBK ENFC 3.84% 4.05% 4.04% 3.94% 3.85% 3.28% 3.39% 3.49% 3.36% 3.26% 3.00% 3.25% 3.50% 3.75% 4.00% 4.25% YE 2016 YE 2017 Q1'18 Q2'18 Q3'18

19 Combined Presence in Several Key Markets ▪ Creates a combined presence in five of the top 25 largest MSAs in a region covering Alabama, Florida, Georgia, North Carolina, South Carolina and Tennessee ▪ Outside of top 25 MSAs, the combined company enhances total deposit market share from existing legacy footprints and incremental growth in less competitive markets Rank MSA Name 2019 Total Population (actual) SMBK 2018 In-Market Deposits ($000) ENFC 2018 In-Market Deposits ($000) Pro Forma 2018 Deposits ($000) 2018 Total Market Deposits ($000) 2018 Total Deposit Market Share (%) 1 Miami-Fort Lauderdale-West Palm Beach, FL 6,283,790 - - - 2 Atlanta-Sandy Springs-Roswell, GA 6,017,552 - 164,061 164,061 168,492,164 0.10 3 Tampa-St. Petersburg-Clearwater, FL 3,171,289 - - - 4 Charlotte-Concord-Gastonia, NC-SC 2,591,118 - - - 5 Orlando-Kissimmee-Sanford, FL 2,589,416 - - - 6 Nashville-Davidson--Murfreesboro--Franklin, TN 1,955,604 25,551 - 25,551 61,450,649 0.04 7 Virginia Beach-Norfolk-Newport News, VA-NC 1,740,113 - - - 8 Jacksonville, FL 1,549,094 - - - 9 Raleigh, NC 1,366,959 - - - 10 Memphis, TN-MS-AR 1,351,871 - - - 11 Birmingham-Hoover, AL 1,154,278 - - - 12 Greenville-Anderson-Mauldin, SC 912,621 - 44,917 44,917 16,978,025 0.26 13 Knoxville, TN 887,454 303,487 - 303,487 17,147,660 1.77 14 Columbia, SC 837,258 - - - 15 North Port-Sarasota-Bradenton, FL 825,378 - - - 16 Charleston-North Charleston, SC 799,117 - - - 17 Greensboro-High Point, NC 769,635 - - - 18 Cape Coral-Fort Myers, FL 757,170 - - - 19 Lakeland-Winter Haven, FL 705,037 - - - 20 Winston-Salem, NC 674,337 - - - 21 Deltona-Daytona Beach-Ormond Beach, FL 663,125 - - - 22 Augusta-Richmond County, GA-SC 607,827 - - - 23 Palm Bay-Melbourne-Titusville, FL 602,191 - - - 24 Durham-Chapel Hill, NC 578,696 - - - 25 Chattanooga, TN-GA 562,664 352,609 - 352,609 9,740,525 3.62 TOTAL 39,953,594 681,647 208,978 890,625 273,809,023 0.33 Includes pro forma impact of SMBK’s acquisition of Foothills Bancorp, Inc. on 11/01/18 Ranked by 2019 total population Source: S&P Global Market Intelligence

20 Demand 16% Transaction 17% MMDA & Savings 34% Retail CD 25% Jumbo CD Demand 8% 17% Transaction 17% MMDA & Savings 34% Retail CD 25% Jumbo CD 7% Demand 16% Transaction 17% MMDA & Savings 34% Retail CD 24% Jumbo CD 9% ADC 11% 1-4 23% Owner CRE 21% Other CRE 22% C&I 16% Other 7% ADC 14% 1-4 35% Owner CRE 22% Other CRE 20% C&I 3% Other 6% ADC 12% 1-4 28% Owner CRE 21% Other CRE 21% C&I 11% Other 7% Pro Forma Loan and Deposit Composition *Includes pro forma impact of SMBK’s acquisition of Foothills Bancorp, Inc. on 11/01/18 Bank-level regulatory data as of 09/30/18 Source: S&P Global Market Intelligence SMBK* ENFC Combined Average Loan Yield: 5.39% Cost of Deposits: 0.91% Average Loan Yield: 4.77% Cost of Deposits: 0.75% Average Loan Yield: 5.15% Cost of Deposits: 0.85%

Appendix

22 Non-GAAP Reconciliations - SMBK 3Q18 2Q18 1Q18 2017 2016 Net income (GAAP) $ 4,324 $ 3,931 $ 3,415 $ 5,015 $ 5,798 Securities (gains) losses and other - 1 - (94) (127) Merger-related expenses 642 912 395 1,999 - Revaluation of deferred tax asset due to tax rate change - - - 2,440 - Net operating income (Non-GAAP) $ 4,966 $ 4,844 $ 3,810 $ 9,361 $ 5,671 Diluted earnings per share (GAAP) $ 0.34 $ 0.32 $ 0.30 $ 0.55 $ 0.78 Securities (gains) losses and other - - - (0.01) (0.02) Merger-related expenses 0.05 0.07 0.04 0.23 - Revaluation of deferred tax asset due to tax rate change - - - 0.28 - Operating diluted earnings per share (Non-GAAP) $ 0.39 $ 0.39 $ 0.34 $ 1.04 $ 0.76 Efficiency ratio (GAAP) 71.37% 72.34% 72.97% 76.17% 76.56% Securities (gains) losses and other (0.17%) (0.17%) (0.09%) 0.22% 0.36% Merger-related expenses (3.99%) (7.35%) (3.76%) (4.73%) - Operating efficiency ratio (Non-GAAP) 67.21% 64.82% 69.12% 71.66% 76.93% Shareholders' equity (GAAP) $ 251,642 $ 247,487 $ 208,949 $ 205,852 $ 105,240 Goodwill and intangibles (68,254) (68,449) (50,660) (50,837) (6,635) Tangible common equity (Non-GAAP) $ 183,388 $ 179,038 $ 158,289 $ 155,015 $ 98,605 Return on average assets (GAAP) 0.85% 0.82% 0.80% 0.42% 0.57% Securities (gains) losses and other - - - (0.01%) (0.01%) Merger-related expenses 0.13% 0.19% 0.09% 0.17% - Revaluation of deferred tax asset due to tax rate change - - - 0.21% - Operating return on average assets (non-GAAP) 0.98% 1.01% 0.89% 0.79% 0.56% Return on average equity (GAAP) 6.86% 6.76% 6.25% 3.44% 5.60% Securities (gains) losses and other - - - (0.07%) (0.13%) Merger-related expenses 1.40% 2.08% 0.94% 1.51% - Revaluation of deferred tax asset due to tax rate change - - - 1.84% - Effrect of goodwill and intangibles 2.58% 2.20% 1.86% 0.35% 0.39% Operating return on average tangible common equity (non-GAAP) 10.84% 11.04% 9.04% 7.07% 5.86% Net interest income (GAAP) $ 18,860 $ 19,538 $ 16,811 $ 46,329 $ 38,265 Taxable equivalent adjustment 36 16 22 90 55 Net interest income tax equivalent adjustment 18,896 19,554 16,833 46,419 38,320 Purchase accounting adjustments (1,208) (2,583) (1,273) (4,338) (2,018) Core net interest income (non-GAAP) $ 17,688 $ 16,971 $ 15,560 $ 42,081 $ 36,302

23 Non-GAAP Reconciliations - ENFC 3Q18 2Q18 1Q18 2017 2016 Net income (GAAP) $ 3,523 $ 3,087 $ 3,582 $ 2,579 $ 6,376 Securities (gains) losses and other - 402 9 1,208 (713) Merger-related expenses 76 215 - 2,006 1,428 Revaluation of deferred tax asset due to tax rate change - - 155 4,854 - Net operating income (Non-GAAP) $ 3,599 $ 3,704 $ 3,746 $ 10,647 $ 7,091 Diluted earnings per share (GAAP) $ 0.50 $ 0.44 $ 0.51 $ 0.39 $ 0.98 Securities (gains) losses and other - 0.06 - 0.18 (0.12) Merger-related expenses 0.01 0.03 0.02 0.30 0.22 Revaluation of deferred tax asset due to tax rate change - - - 0.73 - Operating diluted earnings per share (Non-GAAP) $ 0.51 $ 0.53 $ 0.53 $ 1.60 $ 1.08 Efficiency ratio (GAAP) 66.92% 69.36% 66.07% 75.40% 76.04% Securities (gains) losses and other - (2.51%) (0.06%) (3.74%) 1.80% Merger-related expenses (0.67%) (1.91%) (1.40%) (5.12%) (5.19%) Operating efficiency ratio (Non-GAAP) 66.25% 64.94% 64.61% 66.54% 72.65% Shareholders' equity (GAAP) $ 156,730 $ 154,786 $ 151,876 $ 151,313 $ 133,068 Goodwill and intangibles (27,653) (27,826) (27,999) (28,172) (3,044) Tangible common equity (Non-GAAP) $ 129,077 $ 126,960 $ 123,877 $ 123,141 $ 130,024 Return on average assets (GAAP) 0.86% 0.76% 0.90% 0.18% 0.55% Securities (gains) losses and other - 0.10% - 0.08% (0.06%) Merger-related expenses 0.02% 0.06% 0.04% 0.14% 0.12% Revaluation of deferred tax asset due to tax rate change - - - 0.35% - Operating return on average assets (non-GAAP) 0.88% 0.92% 0.94% 0.75% 0.61% Return on average equity (GAAP) 9.00% 8.04% 9.48% 1.82% 4.71% Securities (gains) losses and other - 1.05% 0.03% 0.85% (0.52%) Merger-related expenses 0.19% 0.56% 0.41% 1.41% 1.05% Revaluation of deferred tax asset due to tax rate change - - - 3.42% - Effrect of goodwill and intangibles 1.99% 2.15% 2.26% 0.68% 0.10% Operating return on average tangible common equity (non-GAAP) 11.18% 11.80% 12.18% 8.18% 5.34%

24 Investor Contacts Miller Welborn Chairman Miller.Welborn@SmartBank.com Billy Carroll President and CEO Billy.Carroll@SmartBank.com Phone: (865) 437-5700 Roger Plemens President and CEO RPlemens@EntegraBank.com David Bright Chief Financial Officer and Treasurer DBright@EntegraBank.com Phone: (828) 524-7000