Attached files
| file | filename |
|---|---|
| EX-32 - Entegra Financial Corp. | e17116_ex32.htm |
| EX-31.2 - Entegra Financial Corp. | e17116_ex31-2.htm |
| EX-31.1 - Entegra Financial Corp. | e17116_ex31-1.htm |
| EX-23.1 - Entegra Financial Corp. | e17116_ex23-1.htm |
| EX-21 - Entegra Financial Corp. | e17116_ex21.htm |
UNITED STATES
SECURITIES AND EXCHANGE COMMISSION
Washington, D.C. 20549
FORM 10-K
Annual
Report Pursuant to Section 13 or 15(d)
of the Securities Exchange Act of 1934
For the fiscal year ended:
December 31, 2016
Commission File Number: 001-35302
Entegra Financial Corp.
(Exact name of Registrant as specified in its Charter)
| North Carolina | 45-2460660 |
| (State of Incorporation) | (I.R.S. Employer Identification No.) |
| 14 One Center Court, | |
| Franklin, North Carolina | 28734 |
| (Address of principal executive offices) | (Zip Code) |
(828) 524-7000
(Registrant’s telephone number, including area code)
Securities registered pursuant to Section 12(b) of the Act:
Title of each class |
Name of each exchange on which registered | |
| Common stock, no par value per share | NASDAQ Global Market |
Securities registered pursuant to section 12(g) of the Act: None
Indicate by check mark if the registrant is a well-known seasoned issuer, as defined in Rule 405 of the Securities Act. Yes o No x
Indicate by check mark if the registrant is not required to file reports pursuant to Section 13 or Section 15(d) of the Act. Yes o No x
Indicate by check mark whether the registrant (1) has filed all reports required to be filed by Section 13 or 15(d) of the Securities Exchange Act of 1934 during the preceding 12 months (or for such shorter period that the registrant was required to file such reports), and (2) has been subject to such filing requirements for the past 90 days. Yes x No o
Indicate by check mark whether the Registrant has submitted electronically and posted on its corporate Website, if any, every Interactive Data File required to be submitted and posted pursuant to Rule 405 of Regulation S-T during the preceding 12 months (or for such shorter period that the Registrant was required to submit and post such files). Yes x No o
Indicate by check mark if disclosure of delinquent filers pursuant to Item 405 of Regulation S-K (§ 229.405 of this chapter) is not contained herein, and will not be contained, to the best of registrant’s knowledge, in definitive proxy or information statements incorporated by reference in Part III of this Form 10-K or any amendment to this Form 10-K. x
Indicate by check mark whether the registrant is a large accelerated filer, an accelerated filer, a non-accelerated filer, or a smaller reporting company. See the definition of “large accelerated filer”, “accelerated filer” and “smaller reporting company” in Rule 12b-2 of the Exchange Act. (Check One)
| Large accelerated filer o | Accelerated filer x | Non-accelerated filer o | Smaller reporting company o |
Indicate by check mark whether the registrant is a shell company (as defined in Rule 12b-2 of the Exchange Act) Yes o No x
As of June 30, 2016, the aggregate market value of the registrant’s common stock held by non-affiliates of the registrant was $109.7 million. On March 8, 2017, 6,467,946 shares of the issuer’s common stock (no par value), were issued and outstanding.
Documents Incorporated by Reference:
| Portions of the Proxy Statement for the Annual Meeting of Shareholders to be held on May 18, 2017. | Part III (Portions of Items 10-14) |
TABLE OF CONTENTS
CAUTIONARY STATEMENT REGARDING
FORWARD-LOOKING STATEMENTS
This report, including information included or incorporated by reference in this document, contains statements which constitute “forward-looking statements” within the meaning of Section 27A of the Securities Act of 1933 (the “Securities Act”) and Section 21E of the Securities Exchange Act of 1934 (the “Exchange Act”). Forward-looking statements may relate to, among other matters, the financial condition, results of operations, plans, objectives, future performance, and business of our Company. Forward-looking statements are based on many assumptions and estimates and are not guarantees of future performance. Our actual results may differ materially from those anticipated in any forward-looking statements, as they will depend on many factors about which we are unsure, including many factors which are beyond our control. The words “may,” “would,” “could,” “should,” “will,” “expect,” “anticipate,” “predict,” “project,” “potential,” “continue,” “assume,” “believe,” “intend,” “plan,” “forecast,” “goal,” and “estimate,” as well as similar expressions, are meant to identify such forward-looking statements. Potential risks and uncertainties that could cause our actual results to differ materially from those anticipated in our forward-looking statements include, without limitation:
| · | The value of our deferred tax asset could be significantly reduced if corporate tax rates in the U.S. decline or as a result of other changes in the U.S. corporate tax system; |
| · | We may not be able to utilize all of our deferred tax asset; |
| · | Our ability to realize our deferred tax asset and deduct certain future losses could be limited if we experience an ownership change as defined in the Code; |
| · | We may not be able to implement aspects of our growth strategy; |
| · | Future expansion involves risks; |
| · | New bank office facilities and other facilities may not be profitable; |
| · | Acquisition of assets and assumption of liabilities may expose us to intangible asset risk, which could impact our results of operations and financial condition; |
| · | The success of our growth strategy depends on our ability to identify and retain individuals with experience and relationships in the markets in which we intend to expand; |
| · | Our return on equity may be low until we are able to leverage the capital we received from the stock offering; |
| · | We may need additional access to capital, which we may be unable to obtain on attractive terms or at all; |
| · | Our estimate for losses in our loan portfolio may be inadequate, which would cause our results of operations and financial condition to be adversely affected; |
| · | Our commercial real estate loans generally carry greater credit risk than one-to-four family residential mortgage loans; |
| · | Our concentration of construction financing may expose us to a greater risk of loss and hurt our earnings and profitability; |
| · | Repayment of our commercial business loans is primarily dependent on the cash flows of the borrower, which may be unpredictable, and the collateral securing these loans may fluctuate in value; |
| · | Our level of home equity loans and lines of credit lending may expose us to increased credit risk; |
| · | We continue to hold and acquire other real estate, which has led to operating expenses and vulnerability to additional declines in real property values; |
| · | A significant portion of our loan portfolio is secured by real estate, and events that negatively impact the real estate market could hurt our business; |
| · | Concentration of collateral in our primary market area may increase the risk of increased non-performing assets; |
| · | Income from secondary mortgage market operations is volatile, and we may incur losses with respect to our secondary mortgage market operations that could negatively affect our earnings; |
| · | We rely on the mortgage secondary market for some of our liquidity; |
| · | Future changes in interest rates could reduce our profits; |
| · | Strong competition within our market areas may limit our growth and profitability; |
| · | Our stock-based benefit plan will increase our costs, which will reduce our income; |
| · | The implementation of stock-based benefit plans may dilute your ownership interest; |
| 1 |
| · | We are subject to extensive regulation and oversight, and, depending upon the findings and determinations of our regulatory authorities, we may be required to make adjustments to our business, operations or financial position and could become subject to formal or informal regulatory action; |
| · | Financial reform legislation enacted by Congress and resulting regulations have increased and are expected to continue to increase our costs of operations; |
| · | We face a risk of noncompliance and enforcement action with the Bank Secrecy Act and other anti-money laundering statutes and regulations; |
| · | We are subject to more stringent capital requirements, which may adversely impact our return on equity, require us to raise additional capital, or constrain us from paying dividends or repurchasing shares; |
| · | We depend on our management team to implement our business strategy and execute successful operations and we could be harmed by the loss of their services; |
| · | The fair value of our investments could decline; |
| · | Liquidity risk could impair our ability to fund operations and jeopardize our financial condition, results of operations and cash flows; |
| · | Changes in accounting standards could affect reported earnings; |
| · | We are subject to environmental liability risk associated with our lending activities; |
| · | A failure in or breach of our operational or security systems or infrastructure, or those of our third party vendors and other service providers or other third parties, including as a result of cyber-attacks, could disrupt our businesses, result in the disclosure or misuse of confidential or proprietary information, damage our reputation, increase our costs, and cause losses; |
| · | We are party to various lawsuits incidental to our business. Litigation is subject to many uncertainties such that the expenses and ultimate exposure with respect to many of these matters cannot be ascertained; |
| · | Our stock price may be volatile, which could result in losses to our shareholders and litigation against us; |
| · | The trading volume in our common stock is lower than that of other larger companies; future sales of our stock by our shareholders or the perception that those sales could occur may cause our stock price to decline; |
| · | There may be future sales of additional common stock or preferred stock or other dilution of our equity, which may adversely affect the market price of our common stock; |
| · | We may issue additional debt and equity securities or securities convertible into equity securities, any of which may be senior to our common stock as to distributions and in the event of liquidation, which could negatively affect the value of our common stock; |
| · | Negative public opinion surrounding our company and the financial institutions industry generally could damage our reputation and adversely impact our earnings; and |
| · | Severe weather, natural disasters, acts of war or terrorism, and other external events could significantly impact our business. |
Because of these and other risks and uncertainties, our actual future results may be materially different from the results indicated by any forward-looking statements. For additional information with respect to factors that could cause actual results to differ from the expectations stated in the forward-looking statements, see “Risk Factors” under Part I, Item 1A of this Annual Report on Form 10-K. In addition, our past results of operations do not necessarily indicate our future results. Therefore, we caution you not to place undue reliance on our forward-looking information and statements. We undertake no obligation to update or otherwise revise any forward-looking statements, whether as a result of new information, future events, or otherwise.
| 2 |
General
Entegra Financial Corp. (“Entegra” or the “Company”), headquartered in Franklin, North Carolina, was incorporated on May 31, 2011 to be the holding company for Entegra Bank (the “Bank”). On September 30, 2014, the mutual to stock conversion was completed and the Bank became the wholly owned subsidiary of the Company. Also on that date, the Company sold and issued 6,546,375 shares of its common stock at a price of $10.00 per share, through which the Company received net offering proceeds of $63.7 million.
The Company has one non-bank subsidiary, Macon Capital Trust I (“Macon Trust”), a Delaware statutory trust, formed to facilitate the issuance of trust preferred securities. Macon Trust is not consolidated in the Company’s financial statements.
Entegra Bank is a North Carolina chartered savings bank founded in 1922. Our business consists primarily of accepting deposits from individuals and small businesses and investing those deposits, together with funds generated from operations and borrowings, primarily in loans secured by real estate, including commercial real estate loans, one-to-four family residential loans, construction loans, and home equity loans and lines of credit. We also originate commercial business loans and invest in investment securities. Through our mortgage loan production operations we originate loans for sale in the secondary markets to Fannie Mae and others, generally retaining the servicing rights in order to generate servicing income, supplement our core deposits with escrow deposits and maintain relationships with local borrowers. We offer a variety of deposit accounts, including savings accounts, certificates of deposit, money market accounts, commercial and regular checking accounts, and individual retirement accounts.
The Bank has one wholly-owned subsidiary, Entegra Services, Inc., which was formerly used to operate an investment real estate property acquired in settlement of loans. The property was sold during 2015 and the subsidiary was inactive as of December 31, 2016.
Market Area
The Bank was organized as a mutual savings and loan association, or “thrift,” for the primary purpose of promoting home ownership through mortgage lending, financed by locally gathered deposits. Surviving the Great Depression of the 1930’s, we remained a single-office bank until we opened a second office in downtown Murphy, North Carolina in 1981. Between 1993 and 2002, we added eight more branches in North Carolina, including a second office in Franklin, one in each of Highlands, Brevard, Sylva, Cashiers and Arden, and two in Hendersonville. In 2007, we opened two more branches in Columbus and Saluda, North Carolina. During 2015, we opened a branch in Greenville, South Carolina and acquired two branches in Anderson and Chesnee, South Carolina. In 2016, we acquired a branch and a loan production office in Waynesville and Asheville, North Carolina, respectively and opened a loan production office in Clemson, South Carolina. In February 2017, we acquired two branches in Jasper, Georgia.
As of December 31, 2016, we had 15 branches and two loan production offices located throughout the western North Carolina counties of Cherokee, Haywood, Henderson, Jackson, Macon, Polk and Transylvania and the Upstate South Carolina counties of Anderson, Greenville, Pickens, and Spartanburg, which we consider our primary market area. We also regularly extend loans to customers located in neighboring counties, including Buncombe, Clay, Rutherford and Swain in North Carolina; Fannin, Rabun, Towns and Union in Georgia; and Cherokee and Oconee, in South Carolina, which we consider our secondary market area.
The primary economic drivers of our primary market area in North Carolina are tourism and a vacation and retirement home industry. This area has numerous small- to mid-sized businesses, which are our primary business customers. These businesses include agricultural producers, artisans and specialty craft manufacturers, small industrial manufacturers, and a variety of service oriented industries. The largest employers in Macon County include Drake Software, a national tax software provider, based in Franklin.
| 3 |
Our primary market area in South Carolina is economically diverse with major industries including the automobile industry, health and pharmaceuticals, manufacturing, and academic institutions. Located adjacent to major transportation corridors such as Interstates 85 and 26 and centrally located between Charlotte, North Carolina and Atlanta, Georgia, the Upstate South Carolina market is consistently recognized nationally as an area for business growth and relocation.
Unemployment data is one of the most significant indicators of the economic health in our market areas and is monitored by management on a regular basis. As reflected in the table below, the unemployment rate in each of the counties in our primary market area was elevated subsequent to the Great Recession, but have significantly improved since 2013.
| Unemployment Rate (1) | ||||||||||||||||||||
| December 31, | ||||||||||||||||||||
| County | 2016 | 2015 | 2014 | 2013 | 2012 | |||||||||||||||
| North Carolina: | ||||||||||||||||||||
| Macon | 5.1 | % | 5.6 | % | 7.3 | % | 11.1 | % | 11.3 | % | ||||||||||
| Henderson | 4.1 | 4.0 | 4.9 | 7.2 | 7.6 | |||||||||||||||
| Haywood | 4.5 | 4.7 | 5.0 | 6.2 | 9.0 | |||||||||||||||
| Jackson | 5.1 | 4.7 | 5.8 | 9.6 | 9.4 | |||||||||||||||
| Polk | 4.4 | 4.0 | 4.6 | 7.8 | 7.7 | |||||||||||||||
| Transylvania | 4.9 | 5.6 | 6.6 | 10.1 | 9.6 | |||||||||||||||
| Cherokee | 5.4 | 7.2 | 9.0 | 12.8 | 12.9 | |||||||||||||||
| South Carolina: | ||||||||||||||||||||
| Anderson | 3.7 | 4.6 | 5.8 | 5.5 | 8.0 | |||||||||||||||
| Greenville | 3.5 | 4.3 | 5.2 | 4.9 | 6.7 | |||||||||||||||
| Spartanburg | 3.8 | 4.9 | 6.0 | 6.0 | 8.4 | |||||||||||||||
| National: | 4.7 | 4.8 | 5.4 | 6.5 | 7.6 | |||||||||||||||
(1) - Unemployment rate per the United States Department of Labor | ||||||||||||||||||||
Competition
The banking business is highly competitive. We have significant competition in our primary and secondary market areas. We compete with commercial banks, savings institutions, finance companies, credit unions and other financial services companies. Many of our larger commercial bank competitors have greater name recognition and offer certain services that we do not. However, we believe that our long-time presence in our primary market area and focus on superior service distinguish us from our competitors, many of whom operate under different names or are under different leadership as a consequence of the effects of the recent recession and a series of mergers and acquisitions.
Market Share
As of June 30, 2016, the most recent date for which market data is available, total deposits in the Bank’s North Carolina primary market area, Cherokee, Haywood, Henderson, Jackson, Macon, Polk and Transylvania counties, were over $5.3 billion. At June 30, 2016, our deposits represented 14.6% of the market ranking us second in deposit market share within our North Carolina primary market area.
As of June 30, 2016, total deposits in the Bank’s South Carolina primary market area, Anderson, Greenville, and Spartanburg counties, were over $18.1 billion. We acquired two branches in Anderson and Spartanburg counties from another financial institution during December 2015. In addition, we opened a full service branch in Greenville County during the fourth quarter of 2015. As of June 30, 2016, our $53.7 million of deposits held at South Carolina branches represented less than 1.0% of total deposits in this market.
| 4 |
Employees
At December 31, 2016, we had a total of 245 employees, of which 228 were full-time and 17 were part-time, all of whom were compensated by the Bank. None of our employees are represented by a collective bargaining unit, and we have not recently experienced any type of strike or labor dispute. We consider our relationship with our employees to be good.
Lending Activities
Our primary lending activities are the origination of commercial real estate loans, one-to-four family residential mortgage loans, other construction and land loans, commercial business loans and home equity loans and lines of credit. Our largest category of loans is commercial real estate followed by one-to-four family, and other construction and land loans. At December 31, 2016, our top 25 relationships represented a lending exposure of $132.2 million with the largest single relationship totaling $9.3 million. These loans are primarily for commercial business purposes and collateralized by real estate, primarily commercial, and construction and land development loans.
Commercial Real Estate Loans. At December 31, 2016, $292.9 million, or 39.2% of our loan portfolio consisted of commercial real estate loans. Properties securing our commercial real estate loans primarily comprise business owner-occupied properties, small office buildings and office suites, and income-producing real estate.
In the underwriting of commercial real estate loans, we generally lend up to the lesser of 80% of the appraised value or purchase price of the property. We base our decision to lend primarily on the economic viability of the property and the creditworthiness of the borrower. In evaluating a proposed commercial real estate loan, we emphasize the ratio of the property’s projected net cash flow to the loan’s debt service requirement (generally requiring a preferred ratio of 1.25x), computed after deduction for an appropriate vacancy factor and reasonable expenses. Individuals owning 20% or more of the business and/or real estate are generally required to sign the note as co-borrowers or provide personal guarantees. We require title insurance, fire and extended coverage casualty insurance, and, if appropriate, flood insurance, in order to protect our security interest in the underlying property. Almost all of our commercial real estate loans are generated internally by our loan officers.
One-to–Four Family Residential Mortgage Loans. At December 31, 2016, $278.4 million, or 37.3% of our loan portfolio consisted of one-to-four family residential mortgage loans. We offer fixed-rate and adjustable-rate residential mortgage loans with maturities generally up to 30 years. We generally sell 30-year fixed rate loans in the secondary market.
Our one-to-four family residential mortgage loans originated for sale are underwritten according to Fannie Mae underwriting guidelines. We refer to loans that conform to such guidelines as “conforming loans.” We originate both fixed- and adjustable-rate mortgage loans in amounts up to the maximum conforming loan limits as established by the Office of Federal Housing Enterprise Oversight, which increased from $417,000 in 2016 to $424,000 in 2017 for single-family homes. Loans in excess of the maximum conforming loan limit (referred to as “jumbo loans”) may be originated for retention in our loan portfolio. We generally underwrite jumbo loans in the same manner as conforming loans.
We originate loans with loan-to-value ratios in excess of 80% for sale into the secondary market. We require private mortgage insurance for loans with loan-to-value ratios in excess of 80%.
We generally retain the servicing rights on loans sold in the secondary market in order to generate cash flow, supplement our core deposits with escrow deposits, and maintain relationships with local borrowers.
Other than loans for the construction of one-to-four family residential mortgage loans (described under “—One-to Four-Family Residential Construction, Other Construction and Land, and Consumer Loans”) and home equity loans and lines of credit (described under “—Home Equity Loans and Lines of Credit”), presently we do not offer “interest only” mortgage loans (where the borrower pays only interest for an initial period, after which the loan converts to a fully amortizing loan) on one-to-four family residential properties.
| 5 |
We do not offer loans that provide for negative amortization of principal, such as “Option ARM” loans, where the borrower may pay less than the interest owed on the loan, resulting in an increased principal balance during the life of the loan.
Home Equity Loans and Lines of Credit. At December 31, 2016, $50.3 million, or 6.7% of our loan portfolio, consisted of home equity loans and lines of credit. In addition to traditional one-to-four family residential mortgage loans, we offer home equity loans and lines of credit that are secured by the borrower’s primary or secondary residence. Our home equity loans and lines of credit are currently originated with fixed or adjustable rates of interest. Home equity loans and lines of credit are generally underwritten with the same criteria that we use to underwrite one-to-four family residential mortgage loans. For a borrower’s primary residence, home equity loans and lines of credit may be underwritten with a loan-to-value ratio of 80% when combined with the principal balance of the existing mortgage loan, while the maximum loan-to-value ratio on secondary residences is 70% when combined with the principal balance of the existing mortgage loan. We require appraisals or internally prepared real estate evaluations on home equity loans and lines of credit. At the time we close a home equity loan or line of credit, we record a deed of trust to perfect our security interest in the underlying collateral.
Commercial Loans. At December 31, 2016, $41.3 million, or 5.5% of our loan portfolio, consisted of commercial loans. We make various types of secured and unsecured commercial loans to customers in our market areas in order to provide customers with working capital and for other general business purposes. The terms of these loans generally range from less than one year to a maximum of 10 years. These loans bear either a fixed interest rate or an interest rate linked to a variable market index. We seek to originate loans to small- to medium-sized businesses with principal balances between $150,000 and $750,000; however, we also originate government-guaranteed Small Business Administration, or SBA, loans with higher balances with the intent of selling the guaranteed portion into the secondary market. We also purchase the guaranteed portion of SBA loans in the secondary market to supplement our commercial loan originations.
Commercial credit decisions are based upon our credit assessment of each applicant. We evaluate the applicant’s ability to repay in accordance with the proposed terms of the loan and assess the risks involved. Individuals owning 20% or more of the business and/or real estate are generally required to sign the note as co-borrowers or provide personal guarantees. In addition to evaluating the applicant’s financial statements, we consider the adequacy of the primary and secondary sources of repayment for the loan. Credit agency reports of the applicant’s personal credit history supplement our analysis of the applicant’s creditworthiness. In addition, collateral supporting a secured transaction is analyzed to determine its marketability. Commercial business loans generally have higher interest rates than residential loans of similar duration because they have a higher risk of default with repayment generally depending on the successful operation of the borrower’s business and the sufficiency of any collateral.
One-to-Four Family Residential Construction, Other Construction and Land, and Consumer Loans. At December 31, 2016, $18.5 million, or 2.5% of our loan portfolio consisted of one-to-four family residential construction loans. Other construction and land loans comprised $60.6 million, or 8.1% of our loan portfolio. Consumer loans totaled $4.6 million, or 0.7% of our loan portfolio, and included automobile and other consumer loans. We make construction loans to owner-occupiers of residential properties, and to businesses for commercial properties. In the past, we made loans to developers for speculative residential construction; however, following the recession we have limited our speculative construction lending. Advances on construction loans are made in accordance with a schedule reflecting the cost of construction, but are generally limited to an 80% loan-to-value ratio based on the appraised value upon completion. Repayment of construction loans on non-residential properties is normally attributable to rental income, income from the borrower’s operating entity or the sale of the property. Repayment of loans on income-producing property is normally scheduled following completion of construction, when permanent financing is obtained. We typically provide permanent mortgage financing on our construction loans for income-producing property. Construction loans are interest-only during the construction period, which typically does not exceed 12 months, and convert to permanent, fully-amortizing financing following the completion of construction.
Generally, before making a commitment to fund a construction loan, we require an appraisal of the property by a state-certified or state-licensed appraiser. We review and inspect properties before disbursement of funds during the term of the construction loan.
| 6 |
At December 31, 2016, our largest other construction and land loan had a principal balance of $5.2 million and was secured by a first mortgage on single family residential real estate, as well as additional residential building lots. At December 31, 2016, this loan was performing in accordance with its terms.
Loan Originations, Purchases, Sales, Participations and Servicing. All residential loans that we originate are underwritten pursuant to our policies and procedures, which incorporate standard Fannie Mae underwriting guidelines, as applicable. We originate both adjustable-rate and fixed-rate loans. Our loan origination and sales activity may be adversely affected by a rising interest rate environment that typically results in decreased loan demand. Most of our one-to-four family residential mortgage loans are originated by our loan officers.
Historically, we have sold most of our 15-year and longer residential loans to Fannie Mae or non-government purchasers. During the years ended December 31, 2016, 2015, and 2014, we sold $34.5 million, $29.0 million, and $20.9 million, respectively, of conforming residential loans, primarily with terms of 15 years and longer. We sell our loans with the servicing rights retained on residential mortgage loans, and have no immediate plans to change this practice.
At December 31, 2016, we were servicing residential loans owned by third parties with an aggregate principal balance of $235.2 million. Loan servicing includes collecting and remitting loan payments, accounting for principal and interest, contacting delinquent borrowers, supervising foreclosures, making certain insurance and tax payments on behalf of the borrowers and generally administering the loans. We retain a portion of the interest paid by the borrower on the loans we service as consideration for performing these servicing activities.
At December 31, 2016, we were servicing SBA loans having a gross loan amount of $26.4 million, of which the unguaranteed portion of $6.6 million has been retained by us and the guaranteed portion of $19.8 million has been sold in the secondary market.
At December 31, 2016, we were servicing commercial loan participations having a gross loan amount of $18.7 million, of which $16.0 million was retained by us and $2.7 million was owned by our co-participants.
From time to time, we have participated in loans originated by other financial institutions that service and remit payments to us. At December 31, 2016, the unpaid balance of these loans was $20.6 million.
Loan Approval Procedures and Authority. Our lending activities follow written, non-discriminatory underwriting standards and loan origination procedures established by the board of directors of the Bank (“Bank Board”). The loan approval process is intended to assess the borrower’s ability to repay the loan and value of the collateral that will secure the loan. To assess the borrower’s ability to repay, we review the borrower’s employment and credit history and information on the historical and projected income and expenses of the borrower.
Our policies and loan approval limits are established by the Bank Board. Loans in amounts up to individual loan authority limits set annually by management and the Bank Board can be approved by designated individual officers or officers acting together pursuant to our loan policy. Relationships in excess of these amounts require the approval of the Officers Loan Committee, Executive Loan Committee, or Directors Loan Committee within the authority limits set by the Bank Board. The Bank Board may approve loans up to the internal loans-to-one-borrower policy limit of $10.0 million, which is below the Bank’s regulatory loans-to-one-borrower limit of $22.2 million as of December 31, 2016.
We require appraisals or internally prepared evaluations of all real property securing one-to-four family residential and commercial real estate loans and home equity loans and lines of credit. All appraisers are state-licensed or state-certified, and our practice is to have local appraisers approved on an annual basis by the Bank Board. Internal evaluations are prepared only by individuals possessing the necessary skill and experience to meet regulatory competency requirements. Evaluations are reviewed by staff who report directly to the Chief Risk Officer to ensure independence from the loan production process.
| 7 |
Investments
The Bank’s Asset/Liability Management Committee (“ALCO”) is primarily responsible, subject to the ultimate approval of the Bank Board, for implementing our investment policy. The general investment strategies are developed and authorized by the ALCO Committee in consultation with the Bank Board. The ALCO Committee is responsible for the execution of specific investment actions by our Chief Financial Officer, Chief Accounting Officer or Chief Executive Officer, for all sales, purchases, or trades executed in the investment portfolio. All our investment transactions are periodically reported to the ALCO Committee and the Bank Board. The investment policy is reviewed annually by the ALCO Committee, and any changes to the policy are subject to approval by the full Bank Board. The overall objectives of our investment policy are to maintain a portfolio of high quality and diversified investments to maximize interest income over the long term and to minimize risk, to provide collateral for borrowings, to provide additional earnings when loan production is low, and, when appropriate, to reduce our tax liability. The policy dictates that investment decisions give consideration to the safety of principal, liquidity requirements and interest rate risk management.
Our current investment policy permits investments that meet certain quality guidelines in direct U.S. Government obligations and securities, U.S. Government agencies, municipal securities, mortgage-backed securities and collateralized mortgage obligations, corporate issues, certain commercial paper, agency structured notes, trust preferred securities, subordinated debt, and bank owned life insurance. We only hold securities classified as “trading” in a Rabbi Trust established to generate returns that seek to offset changes in liabilities related to market risk of certain deferred compensation agreements. In accordance with Accounting Standards Codification (“ASC”) Topic 802-10-35-01 investment securities “available-for-sale” are recorded at fair value on a recurring basis and investment securities “held-to-maturity” are held at amortized cost. Fair value measurement is based upon quoted prices of like or similar securities, if available, and these securities are classified as Level 1 or Level 2. If quoted prices are not available, fair values are measured using independent pricing models or other model-based valuation techniques such as the present value of future cash flows, adjusted for the security’s credit rating, prepayment assumptions and other factors such as credit loss assumptions and are classified as Level 3.
We purchase mortgage-backed securities insured or guaranteed by Fannie Mae, Freddie Mac or the Government National Mortgage Association. We invest in quality securities to obtain yields higher than we can receive from holding in overnight cash or other short term cash accounts, and to meet our Asset/Liability objectives which focus on liquidity and interest rate risk in our portfolio as a whole.
Sources of Funds
General. Deposits traditionally have been our primary source of funds for our investment and lending activities. Our primary outside borrowing source is the Federal Home Loan Bank of Atlanta (“FHLB” or “FHLB of Atlanta”). We have in the past used both brokered deposits and internet generated deposits to fund loan growth and to manage interest rate risk. Our additional sources of funds are scheduled loan payments, maturing investments, loan repayments, security repurchase agreements, retained earnings, income on other earning assets and the proceeds of loan sales.
Deposits. We accept deposits primarily from within our primary market area. As noted, we have also used brokered and internet deposits as a source of funds. We rely on our competitive pricing and products, convenient locations and quality customer service to attract and retain deposits. Our branch network is well established in our primary market area. We offer a variety of deposit accounts with a range of interest rates and terms. Our deposit accounts consist of savings accounts, certificates of deposit, regular checking accounts, money market accounts and individual retirement accounts.
Interest rates paid, maturity terms, service fees and withdrawal penalties are revised on a periodic basis. Deposit rates and terms are based primarily on current operating strategies and market interest rates, liquidity requirements and our deposit growth goals.
Borrowings. Our borrowings consist of advances from the FHLB of Atlanta. At December 31, 2016, FHLB advances totaled $298.5 million, or 25.7% of total liabilities. At December 31, 2016, we had unused borrowing capacity with the FHLB of $13.9 million based on collateral pledged at that date. We had total additional credit availability with FHLB of $56.8 million as of December 31, 2016 if additional collateral was pledged. Advances from the FHLB of Atlanta are secured by our investment in the common stock of the FHLB of Atlanta, securities in our investment portfolio, and approved loans in our one-to-four family residential and commercial loan portfolios.
| 8 |
SUPERVISION AND REGULATION
Bank holding companies and state savings banks are extensively regulated under both federal and state law. Set forth below is a brief description of certain regulatory requirements that are or will be applicable to us. The description below is limited to certain material aspects of the statutes and regulations addressed, and is not intended to be a complete description of such statutes and regulations and their effects on us. Supervision, regulation and examination by the bank regulatory agencies are intended primarily for the protection of depositors rather than shareholders of banks and bank holding companies. Statutes and regulations which contain wide-ranging proposals for altering the structures, regulations and competitive relationship of financial institutions are introduced regularly. We cannot predict whether, or in what form, any proposed statute or regulation will be adopted or the extent to which our business or the business of the Bank may be affected by such statute or regulation.
Holding Company Regulation
General. As a bank holding company, Entegra is subject to the Bank Holding Company Act of 1956 (the “BHCA”), and subject to certain regulations of the Board of Governors of the Federal Reserve System (the “Federal Reserve”). Under the BHCA, a bank holding company such as Entegra, which does not qualify as a financial holding company, is prohibited from engaging in activities other than banking, managing or controlling banks or other permissible subsidiaries, furnishing services to or performing services for its subsidiaries or engaging in any other activity that the Federal Reserve determines to be so closely related to banking or managing or controlling banks as to be a proper incident thereto.
The BHCA prohibits Entegra from acquiring direct or indirect control of more than 5% of the outstanding voting stock or substantially all of the assets of any bank or savings bank, or merging or consolidating with another bank holding company without prior approval of the Federal Reserve. Additionally, the BHCA prohibits Entegra from engaging in, or acquiring ownership or control of more than 5% of the outstanding voting stock of any company engaged in, a non-banking business unless such business is determined by the Federal Reserve to be so closely related to banking as to be properly incident thereto. The BHCA does not place territorial restrictions on the activities of such non-banking related activities.
State and federal law restricts the amount of voting stock of a savings bank or bank holding company that a person may acquire without prior regulatory approval. Pursuant to North Carolina law, no person may directly or indirectly purchase or acquire voting stock of any savings bank or bank holding company which would result in the change in control of that savings bank or bank holding company unless the North Carolina Commissioner of Banks (“Commissioner”) approves the proposed acquisition. Under North Carolina law, a person will be deemed to have acquired “control” of a savings bank or bank holding company if the person directly or indirectly (i) owns, controls or has power to vote 10% or more of the voting stock of the savings bank or bank holding company, or (ii) otherwise possesses the power to direct or cause the direction of the management and policy of the savings bank or bank holding company. As a result of Entegra’s ownership of the Bank, Entegra is also registered under the bank holding company laws of North Carolina, and as such is subject to the regulation and supervision of the Commissioner.
Federal law imposes additional restrictions on acquisitions of stock of banks and bank holding companies. Under the BHCA, and the Change in Bank Control Act of 1978 (the “CBCA”), as amended, and regulations adopted thereunder and under the BHCA, a person or group acting in concert must give advance notice to the applicable banking regulator before directly or indirectly acquiring “control” of a federally-insured bank or bank holding company. Under applicable federal law, control is conclusively deemed to have been acquired upon the acquisition of 25% or more of any class of voting securities of any federally-insured bank or bank holding company. Both the BHCA and CBCA generally create a rebuttable presumption of a change in control if a person or group acquires ownership or control of or the power to vote 10% or more of any class of a bank or bank holding company’s voting securities, and either (i) the bank or bank holding company has a class of outstanding securities that are subject to registration under the Exchange Act, or (ii) no other person will own, control, or have the power to vote a greater percentage of that class of voting securities immediately after the transaction. This presumption can, in certain cases, be rebutted by entering into “passivity commitments” with the Federal Reserve or Federal Deposit Insurance Corporation (“FDIC”), as applicable. Upon receipt of a notice of a change in control, the FDIC or the Federal Reserve, as applicable, may approve or disapprove the acquisition.
| 9 |
Prior approval of the Federal Reserve and the Commissioner would be required for any acquisition of control of either Entegra or the Bank by any bank holding company under the BHCA and the North Carolina Bank Holding Company Act (“NCBHCA”), respectively. Control for purposes of the BHCA and the NCBHCA would be based on whether the holding company (i) owns, controls or has power to vote 25% or more of our voting stock or the voting stock of the Bank, (ii) controls the election of a majority of our Board of Directors (the “Board”) or the Bank Board, or (iii) the Federal Reserve or the Commissioner, as applicable, determines that the holding company directly or indirectly exercises a controlling influence over our management or policies or the management or policies of the Bank. As part of such acquisition, the holding company (unless already so registered) would be required to register as a bank holding company under the BHCA and the NCBHCA.
There are a number of obligations and restrictions imposed on bank holding companies and their depository institution subsidiaries by law and regulatory policy that are designed to minimize potential loss to the depositors of such depository institutions and the FDIC’s deposit insurance fund in the event the depository institution becomes in danger of default or is in default. For example, to avoid receivership of an insured depository institution subsidiary, a bank holding company is required to guarantee the compliance of any insured depository institution subsidiary that has become “undercapitalized” with the terms of any capital restoration plan filed by such subsidiary with its appropriate federal banking agency up to the lesser of (i) an amount equal to 5% of the institution’s total assets at the time the institution became undercapitalized, or (ii) the amount which is necessary to bring the institution into compliance with all acceptable capital standards as of the time the institution initially fails to comply with such capital restoration plan. Under a policy of the Federal Reserve with respect to bank holding company operations, a bank holding company is required to serve as a source of financial strength to its subsidiary depository institutions and to commit resources to support such institutions in circumstances where it might not do so absent such policy. The Federal Reserve under the BHCA also has the authority to require a bank holding company to terminate any activity or to relinquish control of a nonbank subsidiary (other than a nonbank subsidiary of a bank) upon the Federal Reserve’s determination that such activity or control constitutes a serious risk to the financial soundness and stability of any bank subsidiary of the bank holding company.
In addition, the “cross-guarantee” provisions of the Federal Deposit Insurance Act, as amended, require insured depository institutions under common control to reimburse the FDIC for any loss suffered as a result of the default of a commonly controlled insured depository institution or for any assistance provided by the FDIC to a commonly controlled insured depository institution in danger of default. The FDIC may decline to enforce the cross-guarantee provisions if it determines that a waiver is in the best interest of the FDIC’s deposit insurance fund. The FDIC’s claim for damages is superior to claims of shareholders of the insured depository institution or any affiliate but is subordinate to claims of depositors, secured creditors and holders of subordinated debt (other than affiliates) of the commonly controlled insured depository institutions.
Capital Adequacy Guidelines for Holding Companies. The Federal Reserve has adopted capital adequacy guidelines for bank holding companies and banks that are members of the Federal Reserve System and have consolidated assets of $500 million or more. Bank holding companies subject to the Federal Reserve’s capital adequacy guidelines are required to comply with the Federal Reserve’s risk-based capital guidelines. Under these regulations, the minimum ratio of total capital to risk-weighted assets (including certain off-balance sheet activities, such as standby letters of credit) is 8.0%. At least half of the total capital is required to be “tier 1 capital,” principally consisting of common shareholders’ equity, non-cumulative perpetual preferred stock, a limited amount of cumulative perpetual preferred stock and minority interests in the equity accounts of consolidated subsidiaries, less goodwill and certain other intangible assets. The remainder (“tier 2 capital”) may consist of a limited amount of subordinated debt, certain hybrid capital instruments and other debt securities, perpetual preferred stock, and a limited amount of the general loan loss allowance.
In addition to the risk-based capital guidelines, the Federal Reserve has adopted a minimum tier 1 capital (leverage) ratio, under which a bank holding company must maintain a minimum level of tier 1 capital to average total consolidated assets of at least 3% in the case of a bank holding company which has the highest regulatory examination rating and is not contemplating significant growth or expansion. All other bank holding companies are expected to maintain a tier 1 capital (leverage) ratio of at least 4%.
| 10 |
In July 2013, the Federal Reserve approved a new rule that implements the “Basel III” regulatory capital reforms and changes required by the Dodd-Frank Act. The final rule includes new risk-based capital and leverage ratios, which became effective January 1, 2015, and revise the definition of what constitutes “capital” for purposes of calculating those ratios. See “—Net Worth and Capital Adequacy Requirements Applicable to the Bank” below.
The Company exceeded all applicable minimum capital adequacy guidelines as of December 31, 2016.
Dividend and Repurchase Limitations. The Federal Reserve has the power to prohibit dividends by bank holding companies if their actions constitute unsafe or unsound practices. The Federal Reserve has issued a policy statement on the payment of cash dividends by bank holding companies, and which expresses the Federal Reserve’s view that a holding company should pay cash dividends only to the extent that the company’s net income for the past year is sufficient to cover both the cash dividends and a rate of earnings retention that is consistent with the company’s capital needs, asset quality and overall financial condition. The Federal Reserve also indicated that it would be inappropriate for a holding company experiencing serious financial problems to borrow funds to pay dividends. Under the prompt corrective action regulations, the Federal Reserve may prohibit a bank holding company from paying any dividends if the holding company’s bank subsidiary is classified as “undercapitalized.”
Federal Reserve policy also provides that a holding company should inform the Federal Reserve supervisory staff prior to redeeming or repurchasing common stock or perpetual preferred stock if the holding company is experiencing financial weaknesses or if the repurchase or redemption would result in a net reduction, as of the end of a quarter, in the amount of such equity instruments outstanding compared with the beginning of the quarter in which the redemption or repurchase occurred.
Pursuant to Federal Reserve regulations, the Company may not make a distribution that would constitute a return of capital during the three years following the completion of the conversion and offering.
The Company’s ability to pay dividends or repurchase shares may also be dependent upon its receipt of dividends from the Bank. The Company’s payment of dividends and repurchase of stock will also be subject to the requirements and limitations of North Carolina corporate law.
Dodd-Frank Wall Street Reform and Consumer Protection Act (the “Dodd-Frank Act”). The Dodd-Frank Act significantly changed bank regulation and has affected the lending, investment, trading and operating activities of depository institutions and their holding companies.
The Dodd-Frank Act also created a new Consumer Financial Protection Bureau (“CFPB”) with extensive powers to supervise and enforce consumer protection laws. The CFPB has broad rule-making authority for a wide range of consumer protection laws that apply to all banks and savings institutions, including the authority to prohibit “unfair, deceptive or abusive” acts and practices. The CFPB also has examination and enforcement authority over all banks and savings institutions with more than $10 billion in assets. Banks and savings institutions with $10 billion or less in assets, such as the Bank, will continue to be examined by their applicable federal bank regulators. The Dodd-Frank Act also gave state attorneys general the ability to enforce applicable federal consumer protection laws.
The Dodd-Frank Act broadened the base for FDIC assessments for deposit insurance, permanently increasing the maximum amount of deposit insurance to $250,000 per depositor. The legislation also, among other things, requires originators of certain securitized loans to retain a portion of the credit risk, stipulates regulatory rate-setting for certain debit card interchange fees, repealed restrictions on the payment of interest on commercial demand deposits and contains a number of reforms related to mortgage originations. The Dodd-Frank Act increased the ability of shareholders to influence boards of directors by requiring companies to give shareholders a non-binding vote on executive compensation and so-called “golden parachute” payments. However, as an “emerging growth company” under the Jumpstart Our Business Startups Act (the “JOBS Act”), we are exempt from the shareholder vote requirement until one year after we cease to be an “emerging growth company.” The legislation also directed the Federal Reserve to promulgate rules prohibiting excessive compensation paid to company executives, regardless of whether the company is publicly traded or not. Many of the provisions of the Dodd-Frank Act are subject to further rulemaking, guidance and interpretation by the applicable federal regulators. We will continue to evaluate the impact of any changes in law and any new regulations promulgated.
| 11 |
Gramm-Leach-Bliley Act. The federal Gramm-Leach-Bliley Act, enacted in 1999 (the “GLB Act”), dramatically changed various federal laws governing the banking, securities and insurance industries. The GLB Act expanded opportunities for banks and bank holding companies to provide services and engage in other revenue-generating activities that previously were prohibited to them. In doing so, it increased competition in the financial services industry, presenting greater opportunities for our larger competitors who were more able to expand their services and products than smaller, community-oriented financial institutions.
USA Patriot Act of 2001. The USA Patriot Act of 2001 was enacted in response to the terrorist attacks that occurred in New York, Pennsylvania and Washington, D.C. on September 11, 2001. The Act was intended to strengthen the ability of U.S. law enforcement and the intelligence community to work cohesively to combat terrorism on a variety of fronts. The impact of the Act on financial institutions of all kinds has been significant and wide ranging. The Act, which was largely extended in 2015 by the USA Freedom Act, contains sweeping anti-money laundering and financial transparency laws and requires various regulations, including standards for verifying customer identification at account opening, and rules to promote cooperation among financial institutions, regulators, and law enforcement entities in identifying parties that may be involved in terrorism or money laundering.
Sarbanes-Oxley Act of 2002. The Sarbanes-Oxley Act of 2002 addresses, among other issues, corporate governance, auditing and accounting, executive compensation, and enhanced and timely disclosure of corporate information. As directed by the Sarbanes-Oxley Act, our Chief Executive Officer and Chief Financial Officer are required to certify that our quarterly and annual reports do not contain any untrue statement of a material fact. The rules adopted by the SEC under the Sarbanes-Oxley Act have several requirements, including having these officers certify that: they are responsible for establishing, maintaining and regularly evaluating the effectiveness of our internal control over financial reporting; they have made certain disclosures to our auditors and the audit committee of our Board about our internal control over financial reporting; and they have included information in our quarterly and annual reports about their evaluation and whether there have been changes in our internal control over financial reporting or in other factors that could materially affect internal control over financial reporting.
Federal Securities Laws. The Company filed with the SEC a registration statement under the Securities Act for the registration of the shares of common stock that were issued pursuant to the offering. Upon completion of the offering, the common stock was registered with the SEC under the Exchange Act. The Company is now subject to the information, proxy solicitation, insider trading restrictions and other requirements under the Exchange Act.
The registration under the Securities Act of shares of common stock does not cover the resale of those shares. Shares of common stock purchased by persons who are not the Company’s affiliates may be resold without registration. Shares purchased by the Company’s affiliates are subject to the resale restrictions of Rule 144 under the Securities Act. If the Company meets the current public information requirements of Rule 144 under the Securities Act, each affiliate that complies with the other conditions of Rule 144, including those that require the affiliate’s sale to be aggregated with those of other persons, would be able to sell in the public market, without registration, a number of shares not to exceed, in any three-month period, the greater of 1% of our outstanding shares, or the average weekly volume of trading in the shares during the preceding four calendar weeks. In the future, the Company may permit affiliates to have their shares registered for sale under the Securities Act.
Emerging Growth Company Status. On April 5, 2012, the JOBS Act was signed into law. The JOBS Act made numerous changes to the federal securities laws to facilitate access to capital markets. Under the JOBS Act, a company with total annual gross revenues of less than $1.0 billion during its most recently completed fiscal year qualifies as an “emerging growth company.” We qualify as an “emerging growth company” and believe that we will continue to qualify as an “emerging growth company” for five years from the completion of our stock offering.
As an “emerging growth company,” we have elected to use the transition period to delay adoption of new or revised accounting pronouncements applicable to public companies until such pronouncements were made applicable to private companies. Accordingly, our financial statements may not be comparable to the financial statements of public companies that comply with such new or revised accounting standards. As of December 31, 2016, there is not a significant difference in the presentation of our financial statements as compared to other public companies as a result of this transition guidance.
| 12 |
Subject to certain conditions set forth in the JOBS Act, if, as an “emerging growth company,” we choose to rely on such exemptions we may not be required to, among other things, (i) provide an auditor’s attestation report on our system of internal controls over financial reporting, (ii) provide all of the compensation disclosure that may be required of non-emerging growth public companies under the Dodd-Frank Act, (iii) hold non-binding shareholder votes regarding annual executive compensation or executive compensation payable in connection with a merger or similar corporate transaction, (iv) comply with any requirement that may be adopted by the PCAOB regarding mandatory audit firm rotation or a supplement to the auditor’s report providing additional information about the audit and the financial statements (auditor discussion and analysis), and (v) disclose certain executive compensation related items such as the correlation between executive compensation and performance and comparisons of the chief executive officer’s compensation to median employee compensation. These exemptions will apply for a period of five years following the completion of our initial public offering or until we are no longer an “emerging growth company,” whichever is earlier.
We could remain an “emerging growth company” for up to five years, or until the earliest of (i) the last day of the first fiscal year in which our annual gross revenues exceed $1.0 billion, (ii) the date that we become a “large accelerated filer” as defined in Rule 12b-2 under the Exchange Act, which would occur if the market value of our common stock that is held by non-affiliates exceeds $700 million as of the last business day of our most recently completed second fiscal quarter, or (iii) the date on which we have issued more than $1.0 billion in non-convertible debt during the preceding three-year period.
Bank Regulation
General. The Bank is a North Carolina chartered savings bank. Its deposits are insured through the FDIC’s deposit insurance fund, and it is subject to supervision and examination by and the regulations and reporting requirements of the Commissioner and the FDIC.
Subject to limitations established by the Commissioner, North Carolina chartered savings banks may make any loan or investment or engage in any activity that is permitted to federally-chartered institutions. In addition to such lending authority, North Carolina chartered savings banks are authorized to invest funds, in excess of loan demand, in certain statutorily permitted investments, including but not limited to (i) obligations of the U.S. Government, or those guaranteed by it; (ii) obligations of the State of North Carolina; (iii) bank demand or time deposits; (iv) stock or obligations of the FDIC’s deposit insurance fund or a FHLB; (v) savings accounts of any savings institution as approved by the Bank Board; and (vi) stock or obligations of any agency of the State of North Carolina or of the U.S. Government or of any corporation doing business in North Carolina whose principal business is to make education loans. However, a North Carolina chartered savings bank cannot invest more than 15% of its total assets in business, commercial, corporate and agricultural loans, and cannot directly or indirectly acquire or retain any corporate debt security that is not of investment grade (generally referred to as “junk bonds”).
As a federally insured depository institution, the Bank is prohibited from engaging as principal in any activity, or acquiring or retaining any equity investment of a type or in an amount, that is not permitted for national banks unless (i) the FDIC determines that the activity or investment would pose no significant risk to the deposit insurance fund, and (ii) the Bank is, and continues to be, in compliance with all applicable capital standards.
In addition, the Bank is subject to various regulations promulgated by the Federal Reserve including, without limitation, Regulation B (Equal Credit Opportunity), Regulation D (Reserves), Regulation E (Electronic Fund Transfers), Regulation O (Loans to Executive Officers, Directors and Principal Shareholders), Regulation W (Transactions Between Member Banks and Affiliates), Regulation Z (Truth in Lending), and Regulation CC (Availability of Funds).
The FDIC and Commissioner have broad powers to enforce laws and regulations applicable to the Bank. Among others, these powers include the ability to assess civil money penalties, to issue cease and desist or removal orders, and to initiate injunctive actions. In general, these enforcement actions may be initiated in response to violations of laws and regulations and the conduct of unsafe and unsound practices.
| 13 |
Transactions with Affiliates. Under current federal law, depository institutions are subject to the restrictions contained in Section 22(h) of the Federal Reserve Act with respect to loans to directors, executive officers and principal shareholders. Under Section 22(h), loans to directors, executive officers and shareholders who own more than 10% of a depository institution (18% in the case of institutions located in an area with less than 30,000 in population), and certain affiliated entities of any of the foregoing, may not exceed, together with all other outstanding loans to such person and affiliated entities, the institution’s loans-to-one-borrower limit (as discussed below). Section 22(h) also prohibits loans above amounts prescribed by the appropriate federal banking agency to directors, executive officers and shareholders who own more than 10% of an institution, and their respective affiliates, unless such loans are approved in advance by a majority of the board of directors of the institution. Any “interested” director may not participate in the voting. The FDIC has prescribed the loan amount (which includes all other outstanding loans to such person), as to which such prior board of directors approval is required, as being the greater of $25,000 or 5% of capital and surplus (up to $500,000). Further, pursuant to Section 22(h), the Federal Reserve requires that loans to directors, executive officers, and principal shareholders be made on terms substantially the same as offered in comparable transactions with non-executive employees of the Bank. The FDIC has imposed additional limits on the amount a bank can loan to an executive officer.
Deposit Insurance. The deposit accounts of the Bank are insured by the FDIC’s deposit insurance fund. The Dodd-Frank Act permanently increased the maximum amount of deposit insurance for banks, savings institutions and credit unions to $250,000 per depositor.
The FDIC issues regulations and conducts periodic examinations, requires the filing of reports and generally supervises the operations of its insured banks. This supervision and regulation is intended primarily for the protection of depositors. Any insured bank that is not operated in accordance with or does not conform to FDIC regulations, policies and directives may be sanctioned for noncompliance. Civil and criminal proceedings may be instituted against any insured bank or any director, officer or employee of such bank for the violation of applicable laws and regulations, breaches of fiduciary duties or engaging in any unsafe or unsound practice. The FDIC has the authority to terminate insurance of accounts pursuant to procedures established for that purpose.
The Bank is subject to insurance assessments imposed by the FDIC. The FDIC imposes a risk-based deposit premium assessment system, which was amended pursuant to the Federal Deposit Insurance Reform Act of 2005. Under this system, as amended, the assessment rates for an insured depository institution vary according to the level of risk incurred in its activities. To arrive at an assessment rate for a banking institution, the FDIC places it in one of four risk categories determined by reference to its capital levels and supervisory ratings. In addition, in the case of those institutions in the lowest risk category, the FDIC further determines its assessment rate based on certain specified financial ratios or, if applicable, its long-term debt ratings.
The Dodd-Frank Act required the FDIC to revise its procedures to base its assessments upon each insured institution’s total assets less tangible equity instead of deposits. The FDIC finalized a rule, effective April 1, 2011, that set the assessment range at 2.5 to 45 basis points of total assets less tangible equity. In 2016, the FDIC adopted a rule increasing the deposit insurance fund’s minimum reserve ratio from 1.15% to 1.35% by September 30, 2020, the cost of which increase is to be borne by depository institutions with total consolidated assets of $10 billion or more.
Community Reinvestment. Under the Community Reinvestment Act (“CRA”), as implemented by regulations of the FDIC, an insured institution has a continuing and affirmative obligation, consistent with its safe and sound operation, to help meet the credit needs of its entire community, including low and moderate income neighborhoods. The CRA does not establish specific lending requirements or programs for financial institutions, nor does it limit an institution’s discretion to develop, consistent with the CRA, the types of products and services that it believes are best suited to its particular community. The CRA requires the federal banking regulators, in connection with their examinations of insured institutions, to assess the institutions’ records of meeting the credit needs of their communities, using the ratings “outstanding,” “satisfactory,” “needs to improve,” or “substantial noncompliance,” and to take that record into account in its evaluation of certain applications by those institutions. All institutions are required to make public disclosure of their CRA performance ratings. The Bank received a “satisfactory” rating in its last CRA examination, which was completed during March 2014.
| 14 |
Standards for Safety and Soundness. Federal law requires each federal banking agency to prescribe certain standards for all insured depository institutions. These standards relate to, among other things, internal controls, information systems and audit systems, loan documentation, credit underwriting, interest rate risk exposure, asset growth, compensation, and other operational and managerial standards as the agency deems appropriate. Interagency guidelines set forth the safety and soundness standards that the federal banking agencies use to identify and address problems at insured depository institutions before capital becomes impaired. If the appropriate federal banking agency determines that an institution fails to meet any standard prescribed by the guidelines, the agency may require the institution to submit to the agency an acceptable plan to achieve compliance with the standard. Failure to implement such a plan can result in further enforcement action, including the issuance of a cease and desist order or the imposition of civil money penalties.
Net Worth and Capital Adequacy Requirements Applicable to the Bank. The Bank is required to comply with the capital adequacy standards established by state and federal laws and regulations. The Commissioner requires that a savings bank maintains net worth not less than 5% of its total assets. Intangible assets must be deducted from net worth and assets when computing compliance with this requirement. The Bank complied with the net worth requirements as of December 31, 2016.
In addition, the FDIC has promulgated risk-based capital and leverage capital guidelines for determining the adequacy of a bank’s capital, and all applicable capital standards must be satisfied for the Bank to be considered in compliance with the FDIC’s requirements. Under the FDIC’s risk-based capital measure, the minimum ratio (total risk-based capital ratio) of a bank’s total capital to its risk-weighted assets (including certain off-balance-sheet items, such as standby letters of credit) is 8.0%. At least half of total capital must be composed of common equity, undivided profits, minority interests in the equity accounts of consolidated subsidiaries, qualifying non-cumulative perpetual preferred stock, a limited amount of cumulative perpetual preferred stock, less goodwill and certain other intangible assets (tier 1 capital). The remainder may consist of certain subordinated debt, certain hybrid capital instruments and other qualifying preferred stock, a limited amount of loan loss reserves, and net unrealized holding gains on equity securities (tier 2 capital). At December 31, 2016, the Bank’s total risk- based capital ratio and tier 1 risk-based capital ratio were 17.43% and 16.33%, respectively, each was well above the FDIC’s minimum risk-based capital guidelines.
Under the FDIC’s leverage capital measure, the minimum ratio (the “tier 1 leverage capital ratio”) of tier 1 capital to total assets is 3.0% for banks that meet certain specified criteria, including having the highest regulatory rating. All other banks generally are required to maintain an additional cushion of 100 to 200 basis points above the stated minimum. The FDIC’s guidelines also provide that banks experiencing internal growth or making acquisitions will be expected to maintain strong capital positions substantially above the minimum levels without significant reliance on intangible assets, and the FDIC has indicated that it will consider a bank’s “tangible leverage ratio” (deducting all intangible assets) and other indicia of capital strength in evaluating proposals for expansion or new activities. At December 31, 2016, the Bank’s tier 1 leverage capital ratio was 11.06%, which was well above the FDIC’s minimum leverage capital guidelines.
Failure to meet the FDIC’s capital guidelines could subject a bank to a variety of enforcement remedies, including issuance of a capital directive, the termination of deposit insurance by the FDIC, a prohibition on the taking of brokered deposits, and certain other restrictions on its business. As described below, substantial additional restrictions can be imposed upon FDIC-insured depository institutions that fail to meet applicable capital requirements. See “– Prompt Corrective Action”. The FDIC also considers interest rate risk (arising when the interest rate sensitivity of an institution’s assets does not match the sensitivity of its liabilities or its off-balance-sheet position) in the evaluation of a bank’s capital adequacy.
In July 2013, the Federal Reserve and the FDIC approved revisions to their capital adequacy guidelines and prompt corrective action rules that implement the revised standards of the Basel Committee on Banking Supervision, commonly called Basel III, and address relevant provisions of the Dodd-Frank Act. “Basel III” refers to two consultative documents released by the Basel Committee on Banking Supervision in December 2009, the rules text released in December 2010, and loss absorbency rules issued in January 2011, which include significant changes to bank capital, leverage and liquidity requirements.
| 15 |
The new rules include new risk-based capital and leverage ratios, which became effective January 1, 2015, and revise the definition of what constitutes “capital” for purposes of calculating those ratios. The new minimum capital level requirements applicable to the Company and the Bank are: (i) a new common equity tier 1 capital ratio of 4.5%; (ii) a tier 1 capital ratio of 6% (increased from 4%); (iii) a total capital ratio of 8% (unchanged from prior rules); and (iv) a tier 1 leverage ratio of 4% for all institutions. The new rules eliminate the inclusion of certain instruments, such as trust preferred securities, from tier 1 capital. Instruments issued prior to May 19, 2010 are grandfathered for companies with consolidated assets of $15 billion or less. The new rules also established a “capital conservation buffer” of 2.5% above the new regulatory minimum capital requirements, which must consist entirely of common equity tier 1 capital and will result in the following minimum ratios: (i) a common equity tier 1 capital ratio of 7.0%; (ii) a tier 1 capital ratio of 8.5%; and (iii) a total capital ratio of 10.5%. The new capital conservation buffer requirement was phased in beginning in January 2016 at 0.625% of risk-weighted assets and will increase by that amount each year until fully implemented in January 2019. An institution will be subject to limitations on paying dividends, engaging in share repurchases, and paying discretionary bonuses if its capital level falls below the buffer amount. These limitations will establish a maximum percentage of eligible retained income that could be utilized for such actions. At December 31, 2016, all of the Company’s and Bank’s capital ratios were well above the capital guidelines.
Loans-To-One-Borrower. The Bank is subject to the Commissioner’s loans-to-one-borrower limits on savings banks. Under these limits, no loans and extensions of credit to any borrower outstanding at one time and not fully secured by readily marketable collateral shall exceed 15% of the net worth of the savings bank. Loans and extensions of credit fully secured by readily marketable collateral may not exceed 10% of the net worth of the savings bank. This second limitation is separate from, and in addition to, the first limitation. These limits also authorize savings banks to make loans-to-one-borrower, for any purpose, in an amount not to exceed $500,000. A savings bank also is authorized to make loans-to-one-borrower to develop domestic residential housing units, not to exceed the lesser of $30 million or 30% of the savings bank’s net worth, provided that the purchase price of each single-family dwelling in the development does not exceed $500,000 and the aggregate amount of loans made pursuant to this authority does not exceed 150% of the savings bank’s net worth. These limits also authorize a savings bank to make loans-to-one-borrower to finance the sale of real property acquired in satisfaction of debts in an amount up to 50% of the savings bank’s net worth.
As of December 31, 2016, our legal loans-to-one borrower limit was $22.2 million, and at that date the largest aggregate amount of loans that the Bank had to any one borrower was $9.3 million.
Limits on Rates Paid on Deposits and Brokered Deposits. Regulations enacted by the FDIC place limitations on the ability of insured depository institutions to accept, renew or roll-over deposits by offering rates of interest which are significantly higher than the prevailing rates of interest on deposits offered by other insured depository institutions in the depository institution’s normal market area. Under these regulations, “well capitalized” depository institutions may accept, renew or roll-over such deposits without restriction, “adequately capitalized” depository institutions may accept, renew or roll-over such deposits with a waiver from the FDIC (subject to certain restrictions on payments of rates) and “undercapitalized” depository institutions may not accept, renew, or roll-over such deposits. The regulations contemplate that the definitions of “well capitalized,” “adequately capitalized” and “undercapitalized” will be the same as the definitions adopted by the FDIC to implement the corrective action provisions discussed below. See “– Prompt Corrective Action,” below. As of December 31, 2016, the Bank exceeded all of the applicable regulatory capital ratios to be considered “well capitalized” under the regulatory framework for prompt corrective action.
FHLB System. The FHLB System provides a central credit facility for member institutions. As a member of the FHLB of Atlanta, the Bank is required to own capital stock in the FHLB of Atlanta in an amount at least equal to 0.20% of the Bank’s total assets at the end of each calendar year, plus 4.5% of its outstanding advances (borrowings) from the FHLB of Atlanta. At December 31, 2016, the Bank was in compliance with these requirements.
Reserve Requirements. Pursuant to regulations of the Federal Reserve, all insured depository institutions must maintain average daily reserves against their transaction accounts equal to specified percentages of the balances of such accounts. These percentages are subject to adjustment by the Federal Reserve. Because the Bank’s reserves are required to be maintained in the form of vault cash or in a noninterest-bearing account at a Federal Reserve bank, one effect of the reserve requirement is to reduce the amount of the Bank’s interest-earning assets. At December 31, 2016, the Bank met these reserve requirements.
| 16 |
Liquidity. The Bank is subject to the liquidity requirements established by the Commissioner. North Carolina law requires savings banks to maintain cash and readily marketable investments of not less than 10% of the savings bank’s total assets. The computation of liquidity under North Carolina regulation allows the inclusion of mortgage-backed securities and investments that, in the judgment of the Commissioner, have a readily marketable value, including investments with maturities in excess of five years. On December 31, 2016, the Bank’s liquidity ratio, calculated in accordance with North Carolina regulations, was approximately 15.9%.
Prompt Corrective Action. Federal law establishes a system of prompt corrective action to resolve the problems of undercapitalized institutions. Under this system, the FDIC has established five capital categories (“well capitalized,” “adequately capitalized,” “undercapitalized,” “significantly undercapitalized,” and “critically undercapitalized”). The FDIC is required to take certain mandatory supervisory actions and is authorized to take other discretionary actions with respect to institutions in the three undercapitalized categories. The severity of any action taken will depend upon the capital category in which an institution is placed. Generally, subject to a narrow exception, current federal law requires the FDIC to appoint a receiver or conservator for an institution that is critically undercapitalized.
Under the FDIC’s rules implementing the prompt corrective action provisions, an insured, state-chartered savings bank that (i) has a total risk-based capital ratio of 10.0% or greater, a tier 1 risk-based capital ratio of 8.0% or greater, a common equity tier 1 risk-based ratio of 6.5% or greater, and a leverage capital ratio of 5.0% or greater, and (ii) is not subject to any written agreement, order, capital directive, or prompt corrective action directive issued by the FDIC, is deemed to be “well capitalized.” A savings bank with a total risk-based capital ratio of 8.0% or greater, a tier 1 risk-based capital ratio of 6.0% or greater, a common equity tier 1 risk-based ratio of 4.5% or greater, and a leverage capital ratio of 4.0% or greater (or 3.0% or greater in the case of an institution with the highest examination rating), is considered to be “adequately capitalized.” A savings bank that has a total risk-based capital ratio of less than 8.0%, a tier 1 risk-based capital ratio of less than 6.0%, or a leverage capital ratio of less than 4.0% (or 3.0% in the case of an institution with the highest examination rating), is considered to be “undercapitalized.” A savings bank that has a total risk-based capital ratio of less than 6.0%, a tier 1 risk-based capital ratio of less than 3.0%, a common equity tier 1 risk-based ratio of less than 4.5%, or a leverage capital ratio of less than 3.0%, is considered to be “significantly undercapitalized,” and a savings bank that has a ratio of tangible equity capital to assets equal to or less than 2.0% is deemed to be “critically undercapitalized.” For purposes of these rules, the term “tangible equity” includes core capital elements counted as tier 1 capital for purposes of the risk-based capital standards (see “—Net Worth and Capital Adequacy Requirements Applicable to the Bank” above), plus the amount of outstanding cumulative perpetual preferred stock (including related surplus), minus all intangible assets (with certain exceptions). A savings bank may be deemed to be in a capitalization category lower than indicated by its actual capital position if it receives an unsatisfactory examination rating.
A savings bank that is categorized as “undercapitalized,” “significantly undercapitalized,” or “critically undercapitalized,” is required to submit an acceptable capital restoration plan to the FDIC. An “undercapitalized” savings bank also is generally prohibited from increasing its average total assets, making acquisitions, establishing any branches, or engaging in any new line of business, except in accordance with an accepted capital restoration plan or with the approval of the FDIC. In addition, the FDIC is given authority with respect to any “undercapitalized” savings bank to take any of the actions it is required to or may take with respect to a “significantly undercapitalized” savings bank if it determines that those actions are necessary to carry out the purpose of the law.
As of December 31, 2016, the Bank exceeded all of the applicable regulatory capital ratios to be considered “well capitalized” under the regulatory framework for prompt corrective action.
| 17 |
Restrictions on Dividends and Other Capital Distributions. A North Carolina chartered stock savings bank may not declare or pay a cash dividend on, or repurchase any of, its capital stock if after making such distribution, the institution would become, or if it already is, “undercapitalized” (as such term is defined in the applicable law and regulations) or such transaction would reduce the net worth of the institution to an amount which is less than the minimum amount required by applicable federal and state regulations.
In addition, the Bank is not permitted to declare or pay a cash dividend or repurchase any of its capital stock if the effect thereof would be to cause its net worth to be reduced below the amount required for its liquidation account.
Other Federal and North Carolina Regulations. The federal banking agencies, including the FDIC, have developed joint regulations requiring disclosure of contingent assets and liabilities and, to the extent feasible and practicable, supplemental disclosure of the estimated fair market value of assets and liabilities. Additional joint regulations require annual examinations of all insured depository institutions by the appropriate federal banking agency, with some exceptions for small, well-capitalized institutions and state-chartered institutions examined by state regulators, and establish operational and managerial, asset quality, earnings and stock valuation standards for insured depository institutions, as well as compensation standards when such compensation would endanger the insured depository institution or would constitute an unsafe practice.
The grounds for appointment of a conservator or receiver for a North Carolina savings bank on the basis of an institution’s financial condition include: (i) insolvency, in that the assets of the savings bank are less than its liabilities to depositors and others; (ii) substantial dissipation of assets or earnings through violations of law or unsafe or unsound practices; (iii) existence of an unsafe or unsound condition to transact business; (iv) likelihood that the savings bank will be unable to meet the demands of its depositors or to pay its obligations in the normal course of business; and (v) insufficient capital or the incurring or likely incurring of losses that will deplete substantially all of the institution’s capital with no reasonable prospect of replenishment of capital without federal assistance.
North Carolina law provides a procedure by which savings institutions may consolidate or merge, subject to approval of the Commissioner. The approval is conditioned upon findings by the Commissioner that, among other things, such merger or consolidation will promote the best interests of the members or shareholders of the merging institutions.
| 18 |
TAXATION
Federal Taxation
General. We are subject to federal income taxation in the same general manner as other corporations, with some exceptions discussed below. The following discussion of federal taxation is intended only to summarize material federal income tax matters and is not a comprehensive description of the tax rules applicable to us.
Method of Accounting. For federal income tax purposes, the Company files a consolidated tax return with the Bank, and reports its income and expenses on the accrual method of accounting and uses a calendar year ending December 31 for filing its consolidated federal income tax returns.
Minimum Tax. The Internal Revenue Code of 1986, as amended (the “Code”), imposes an alternative minimum tax at a rate of 20% on a base of regular taxable income plus certain tax preferences, referred to as “alternative minimum taxable income.” The alternative minimum tax is payable to the extent alternative minimum taxable income is in excess of an exemption amount. Net operating losses can, in general, offset no more than 90% of alternative minimum taxable income. Certain payments of alternative minimum tax may be used as credits against regular tax liabilities in future years. At December 31, 2016, the Company had an alternative minimum tax credit carryforward of approximately $0.4 million.
Net Operating Loss Carryovers. Generally, a financial institution may carry back federal net operating losses to the preceding two taxable years and carryforward to the succeeding 20 taxable years. At December 31, 2016, the Company had a $24.5 million net operating loss carryforward for federal income tax purposes and a $28.5 million net operating loss carryforward for North Carolina income tax purposes. See “Management’s Discussion and Analysis of Consolidated Financial Condition and Results of Operations – Net Deferred Tax Assets”.
Corporate Dividends. The Company is able to exclude from its income 100% of the dividends received from the Bank as a member of the same affiliated group of corporations.
Audit of Tax Returns. The Company’s federal income tax returns have not been audited in the most recent five-year period.
State Taxation
The State of North Carolina imposes an income tax on income measured substantially the same as federally taxable income, except that U.S. Government interest is not fully taxable. During the third quarter of 2013, North Carolina reduced its corporate income tax rate from 6.9% to 6.0% effective January 1, 2014, and to 5.0% effective January 1, 2015. The rate was further reduced to 4.0% for the 2016 tax year and to 3.0% effective January 2, 2017. Our state income tax returns have not been audited in the most recent five-year period. Under North Carolina law, we are also subject to an annual franchise tax at a rate of 0.15% of equity. Effective for tax periods beginning January 1, 2017, the North Carolina franchise tax related to the holding company will increase to a maximum of $150,000 from $75,000 for prior periods. There is no maximum amount for the North Carolina franchise tax related to the Bank.
AVAILABLE INFORMATION
We make our Annual Report on Form 10-K, Quarterly Reports on Form 10-Q, Current Reports on Form 8-K and amendments to those reports available free of charge on www.entegrabank.com as soon as reasonably practicable after the reports are electronically filed with the SEC. Our Annual Reports on Form 10-K and Quarterly Reports on Form 10-Q are also available our internet website in interactive data format using the eXtensible Business Reporting Language (XBRL), which allows financial statement information to be downloaded directly into spreadsheets, analyzed in a variety of ways using commercial off-the-shelf software and used within investment models in other software formats. Any materials that we file with the SEC may be read and/or copied at the SEC’s Public Reference Room at 100 F Street, NE, Washington, DC 20549. Information on the operation of the Public Reference Room may be obtained by calling the SEC at 1-800-SEC-0330. These filings are also accessible on the SEC’s website at www.sec.gov.
Additionally, our corporate governance policies, including the charters of the Executive, Audit and Risk, Compensation, and Corporate Governance and Nominating Committees, the Corporate Governance Guidelines, Code of Business Conduct and Ethics, and Code of Business Conduct and Ethics for Senior Financial Officers may also be found under the “Investor Relations” section of our website. A written copy of the foregoing corporate governance policies is available upon written request.
| 19 |
The value of our deferred tax asset could be significantly reduced if corporate tax rates in the U.S. decline or as a result of other changes in the U.S. corporate tax system. Over the past several years, there have been discussions regarding decreasing the U.S. federal corporate tax rate, and such discussions have taken on a new focus and prominence given the new U.S. presidential administration and Congress. While we may benefit on a prospective net income basis from any decrease in corporate tax rates, proposals being discussed currently—such as lowering the corporate tax rate—could result in a material decrease in the value of our deferred tax asset, which would also result in a material reduction to our net income during the period in which the change is enacted. Our regulatory capital could also be reduced if the decrease in the value of our deferred tax asset exceeds certain levels. Given the number of uncertainties relating to the ultimate form any corporate tax reform may take, it is not possible to quantify the potential negative impact our income or regulatory capital that could result from corporate tax reform.
We may not be able to utilize all of our deferred tax asset. As of December 31, 2016, we had a net deferred tax asset of $19.0 million. Our ability to use our deferred tax asset is dependent on our ability to generate future earnings within the operating loss carry-forward periods, which are generally 20 years. Some or all of our deferred tax asset could expire unused if we are unable to generate taxable income in the future sufficient to utilize the deferred tax asset, or we enter into transactions that limit our right to use it. If a material portion of our deferred tax asset expires unused, it could have a material adverse effect on our future business, results of operations, financial condition and the value of our common stock. Our ability to realize the deferred tax asset is periodically reviewed and any necessary valuation allowance is adjusted accordingly.
Our ability to realize our deferred tax asset and deduct certain future losses could be limited if we experience an ownership change as defined in the Code. Section 382 of the Code may limit the benefit of both net operating losses incurred to date and future “built-in-losses” which may exist at the time of an “ownership change” for federal income tax purposes. A Section 382 “ownership change” occurs if a shareholder or a group of shareholders who are deemed to own at least 5% of our common stock increase their ownership in aggregate by more than 50% over their lowest ownership percentage within a testing period which is generally a rolling three-year period. If an “ownership change” occurs, Section 382 would impose an annual limit on the amount of losses we can use to reduce our taxable income equal to the product of the total value of our outstanding equity (potentially subject to certain adjustments) immediately prior to the “ownership change” and the federal long-term tax-exempt interest rate in effect for the month of the “ownership change.” A number of special rules apply to calculating this limit.
The relevant calculations under Section 382 are technical and highly complex. Whether an “ownership change” occurs in the future is largely outside of our control, and there can be no assurance that such a change will not occur. If an “ownership change” were to occur, it is possible that the limitations imposed could cause a net increase in our federal income tax liability and cause federal income taxes to be paid earlier than if such limitations were not in effect. An ownership change could also eliminate a portion of the federal tax loss carryforward if the limitation is low and causes our net operating losses to expire unutilized. Any such “ownership change” could have a material adverse effect on our future business, results of operations, financial condition and the value of our common stock.
We may not be able to implement aspects of our growth strategy. Our growth strategy contemplates the future expansion of our business and operations both organically and by selective acquisitions of banks and the establishment of banking offices within our market areas and other contiguous markets in the Southeast. Implementing these aspects of our growth strategy depends, in part, on our ability to successfully identify acquisition opportunities and strategic partners that will complement our operating philosophy and to successfully integrate their operations, as well as generate loans and deposits of acceptable risk and expense. To successfully acquire or establish banks or banking offices, we must be able to correctly identify profitable or growing markets, as well as attract the necessary relationships and high caliber banking personnel to make these new banking offices profitable. In addition, we may not be able to identify suitable opportunities for further growth and expansion or, if it does, we may not be able to successfully integrate these new operations into its business.
| 20 |
As consolidation of the financial services industry continues, the competition for suitable acquisition candidates may further increase. We will compete with other financial services companies for acquisition opportunities, and many of these competitors have greater financial resources than us and may be able to pay more for an acquisition than we are able or willing to pay.
We can offer no assurance that we will have opportunities to acquire other financial institutions or acquire or establish any new branches or loan production offices, or that we will be able to negotiate, finance and complete any opportunities available to us.
If we are unable to effectively implement our growth strategies, our business, results of operations and stock price may be materially and adversely affected.
Future expansion involves risks. Our acquisition of other financial institutions or parts of those institutions, or the establishment of de novo branch offices and loan production offices, involves a number of risks, including the risk that:
| · | We may incur substantial costs in identifying and evaluating potential acquisitions and merger partners, or in evaluating new markets, hiring experienced local managers, and opening new offices; |
| · | Estimates and judgments used to evaluate credit, operations, management and market risks relating to target institutions may not be accurate; |
| · | The institutions we acquire may have distressed assets and there can be no assurance that we will be able to realize the value we predict from those assets or that we will make sufficient provisions or have sufficient capital for future losses; |
| · | We may be required to take writedowns or writeoffs, restructuring and impairment, or other charges related to the institutions we acquire that could have a significant negative effect on our financial condition and results of operations; |
| · | There may be substantial lag-time between completing an acquisition or opening a new office and generating sufficient assets and deposits to support costs of the expansion; |
| · | We may not be able to finance an acquisition, or the financing we obtain may have an adverse effect on our results of operations or result in dilution to our existing shareholders; |
| · | Our management’s attention in negotiating a transaction and integrating the operations and personnel of the combining businesses may be diverted from our existing business and we may not be able to successfully integrate such operations and personnel; |
| · | If we experience problems with system conversions, financial losses could be sustained from transactions processed incorrectly or not at all; |
| · | We may not be able to obtain regulatory approval for an acquisition; |
| · | We may enter new markets where we lack local experience or that introduce new risks to our operations, or that otherwise result in adverse effects on our results of operations; |
| · | We may introduce new products and services we are not equipped to manage or that introduce new risks to our operations, or that otherwise result in adverse effects on our results of operations; |
| · | We may incur intangible assets in connection with an acquisition, or the intangible assets we incur may become impaired, which results in adverse short-term effects on our results of operations; |
| 21 |
| · | We may assume liabilities in connection with an acquisition, including unrecorded liabilities that are not discovered at the time of the transaction, and the repayment of those liabilities may have an adverse effect on our results of operations, financial condition and stock price; or |
| · | We may lose key employees and customers. |
We cannot assure you that we will be able to successfully integrate any banking offices that we acquire into our operations or retain the customers of those offices. If any of these risks occur in connection with our expansion efforts, it may have a material and adverse effect on our results of operations and financial condition.
New bank office facilities and other facilities may not be profitable. We may not be able to organically expand into new markets that are profitable for our franchise. The costs to start up bank branches and loan production offices in new markets, other than through acquisitions, and the additional costs to operate these facilities would increase our noninterest expense and may decrease our earnings. It may be difficult to adequately and profitably manage our growth through the establishment of bank branches or loan production offices in new markets. In addition, we can provide no assurance that our expansion into any such new markets will successfully attract enough new business to offset the expenses of their operation. If we are not able to do so, our earnings and stock price may be negatively impacted.
Acquisition of assets and assumption of liabilities may expose us to intangible asset risk, which could impact our results of operations and financial condition. In connection with any acquisitions, as required by accounting principles generally accepted in the United States (“GAAP”), we will record assets acquired and liabilities assumed at their fair value, and, as such, acquisitions may result in us recording intangible assets, including deposit intangibles and goodwill. We will perform a goodwill valuation at least annually to test for goodwill impairment. Impairment testing is a two-step process that first compares the fair value of goodwill with its carrying amount, and second measures impairment loss by comparing the implied fair value of goodwill with the carrying amount of that goodwill. Adverse conditions in its business climate, including a significant decline in future operating cash flows, a significant change in our stock price or market capitalization, or a deviation from our expected growth rate and performance may significantly affect the fair value of any goodwill and may trigger impairment losses, which could be materially adverse to our results of operations, financial condition and stock price.
The success of our growth strategy depends on our ability to identify and retain individuals with experience and relationships in the markets in which we intend to expand. Our growth strategy contemplates that we may expand our business and operations to other contiguous markets in the Southeast through organic growth and selective acquisitions. We intend to primarily target market areas that we believe possess attractive demographic, economic or competitive characteristics. To expand into new markets successfully, we must identify and retain experienced key management members with local expertise and relationships in these markets. Competition for qualified personnel in the markets in which we may expand may be intense, and there may be a limited number of qualified persons with knowledge of and experience in the commercial banking industry in these markets. Even if we identify individuals that we believe could assist it in establishing a presence in a new market, we may be unable to recruit these individuals away from other banks or be unable to do so at a reasonable cost. In addition, the process of identifying and recruiting individuals with the combination of skills and attributes required to carry out our strategy is often lengthy. Our inability to identify, recruit and retain talented personnel to manage new offices effectively would limit our growth and could materially adversely affect our business, financial condition, results of operations and stock price.
Our return on equity may be low until we are able to leverage the capital we received from the stock offering. Net income divided by average equity, known as “return on equity,” is a ratio many investors use to compare the performance of a financial institution to its peers. We expect our return on equity to remain low until we are able to fully leverage the capital we received from the stock offering. Until we can increase our net interest income and noninterest income and fully leverage the capital raised in the stock offering, we expect our return on equity to remain low, which may reduce the value of our shares of common stock.
| 22 |
We may need additional access to capital, which we may be unable to obtain on attractive terms or at all. We may need to incur additional debt or equity financing in the future to make strategic acquisitions or investments, for future growth or to fund losses or additional provision for loan losses in the future. Our ability to raise additional capital, if needed, will depend in part on conditions in the capital markets at that time, which are outside our control, and on our financial performance. Accordingly, we may be unable to raise additional capital, if and when needed, on terms acceptable to it, or at all. If we cannot raise additional capital when needed, our ability to further expand our operations through internal growth and acquisitions could be materially impaired and our stock price negatively affected.
Our estimate for losses in our loan portfolio may be inadequate, which would cause our results of operations and financial condition to be adversely affected. We maintain an allowance for loan losses, which is a reserve established through a provision for possible loan losses charged to our expenses and represents management’s best estimate of probable losses within our existing portfolio of loans. Our allowance for loan losses amounted to $9.3 million at December 31, 2016, as compared to $9.5 million as of December 31, 2015. The level of the allowance reflects management’s estimates and judgments as to specific credit risks, evaluation of industry concentrations, loan loss experience, current loan portfolio quality, present economic, political and regulatory conditions and unidentified losses inherent in the current loan portfolio, which have been elevated in light of recent economic conditions. The determination of the appropriate level of the allowance for loan losses inherently involves a high degree of subjectivity and requires management to make significant estimates of current credit risks and future trends, all of which may undergo material changes. In addition, bank regulatory agencies review our allowance for loan losses during their periodic examinations, and may require an increase in the provision for possible loan losses or the recognition of further loan charge-offs. Any such increases may have a material adverse effect on our future business, results of operations, financial condition and the value of our common stock.
Our commercial real estate loans generally carry greater credit risk than one-to-four family residential mortgage loans. At December 31, 2016, we had commercial real estate loans of $292.9 million, or 39.2% of total loans. These types of loans generally have higher risk-adjusted returns and shorter maturities than one-to-four family residential mortgage loans. Further, loans secured by commercial real estate properties are generally for larger amounts and involve a greater degree of risk than one-to-four family residential mortgage loans. Also, many of our borrowers have more than one of these types of loans outstanding. Consequently, an adverse development with respect to one loan or one credit relationship can expose us to a significantly greater risk of loss compared to an adverse development with respect to a one-to-four family residential mortgage loan. Payments on loans secured by these properties are often dependent on the income produced by the underlying properties which, in turn, depends on the successful operation and management of the properties. Accordingly, repayment of these loans can be negatively impacted by adverse conditions in the real estate market or the local economy. If loans that are collateralized by commercial real estate become troubled and the value of the collateral has been significantly impaired, then we may not be able to recover the full contractual amount of principal and interest that we anticipated at the time we originated the loan, which could cause us to increase our provision for loan losses which would in turn adversely affect our operating results and financial condition. While we seek to minimize these risks in a variety of ways, there can be no assurance that these measures will protect against credit-related losses.
Our concentration of construction financing may expose us to a greater risk of loss and hurt our earnings and profitability. At December 31, 2016, we had other construction and land loans of $60.6 million, or 8.1% of total loans, and one-to four-family residential construction loans of $18.5 million, or 2.5% of total loans outstanding, to finance construction and land development. These loans are dependent on the successful completion of the projects they finance; however, in recent years many construction and development projects in our primary market area have not been completed in a timely manner, if at all.
Construction financing typically involves a higher degree of credit risk than financing on improved, owner-occupied real estate. Risk of loss on a construction loan is largely dependent upon the accuracy of the initial estimate of the property’s value at completion of construction and the bid price and estimated cost (including interest) of construction. If the estimate of construction costs proves to be inaccurate, we may be required to advance funds beyond the amount originally committed to permit completion of the project. If the estimate of the value proves to be inaccurate, we may be confronted, at or prior to the maturity of the loan, with a project whose value is insufficient to assure full repayment. When lending to builders, the cost of construction breakdown is provided by the builder, as well as supported by the appraisal. Although our underwriting criteria are designed to evaluate and minimize the risks of each construction loan, there can be no guarantee that these practices will safeguard against material delinquencies and losses to our operations.
| 23 |
Repayment of our commercial business loans is primarily dependent on the cash flows of the borrower, which may be unpredictable, and the collateral securing these loans may fluctuate in value. We offer different types of commercial loans to a variety of small- to medium-sized businesses, and intend to increase our commercial business loan portfolio in the future. The types of commercial loans offered are business lines of credit and term equipment financing. Our commercial business loans are primarily underwritten based on the cash flow of the borrowers and secondarily on the underlying collateral, including real estate. The borrowers’ cash flow may be unpredictable, and collateral securing these loans may fluctuate in value. Some of our commercial business loans are collateralized by equipment, inventory, accounts receivable or other business assets, and the liquidation of collateral in the event of default is often an insufficient source of repayment because accounts receivable may be uncollectible and inventories may be obsolete or of limited use. As of December 31, 2016, our commercial business loans totaled $41.3 million, or 5.5% of our total loan portfolio.
Our level of home equity loans and lines of credit lending may expose us to increased credit risk. At December 31, 2016, we had home equity loans and lines of credit of $50.3 million, or 6.7% of total loans. Home equity loans and lines of credit typically involve a greater degree of risk than one-to-four family residential mortgage loans. Equity line lending allows customer to access an amount up to his or her line of credit limit for the term specified in their agreement. At the expiration of the term of an equity line, a customer may have the entire principal balance outstanding as opposed to a one-to-four family residential mortgage loan where the principal is disbursed entirely at closing and amortizes throughout the term of the loan. We cannot predict when and to what extent our customers will access their equity lines. While we seek to minimize this risk in a variety of ways, including attempting to employ conservative underwriting criteria, there can be no assurance that these measures will protect against credit-related losses.
We continue to hold and acquire other real estate, which has led to operating expenses and vulnerability to additional declines in real property values. We foreclose on and take title to real estate serving as collateral for many of our loans as part of our business. Real estate owned by us and not used in the ordinary course of our operations is referred to as “real estate owned” or “REO.” At December 31, 2016, we had REO with an aggregate book value of $4.2 million. We obtain appraisals prior to taking title to real estate and periodically thereafter. However, in the event of deterioration in real estate prices in our market areas, there can be no assurance that such valuations will reflect the amount which may be paid by a willing purchaser in an arms-length transaction at the time of the final sale. Moreover, we cannot assure investors that the losses associated with REO will not exceed the estimated amounts, which would adversely affect future results of our operations.
The calculation for the adequacy of write-downs of our REO is based on several factors, including the appraised value of the real property, economic conditions in the property’s sub-market, comparable sales, current buyer demand, availability of financing, entitlement and development obligations and costs and historic loss experience. All of these factors have caused significant write-downs in recent years and can change without notice based on market and economic conditions. Since 2007, higher REO balances have led to greater expenses as we have incurred costs to manage and dispose of the properties. We expect that our earnings will continue to be negatively affected by various expenses associated with REO, including personnel costs, insurance and taxes, completion and repair costs, valuation adjustments and other expenses associated with property ownership, as well as by the funding costs associated with assets that are utilized in REO. Moreover, our ability to sell REO is affected by public perception that banks are inclined to accept large discounts from market value in order to quickly liquidate properties. Any material decrease in market prices may lead to further REO write-downs, with a corresponding expense in our statement of operations. Further write-downs on REO or an inability to sell REO properties could have a material adverse effect on our future business, results of operations, financial condition and the value of our common stock. Furthermore, the management and resolution of non-performing assets, which include REO, increases our costs and requires significant commitments of time from our management and directors, which can be detrimental to the performance of their other responsibilities. The expenses associated with REO and any further property write-downs could have a material adverse effect on our future business, results of operations, financial condition and the value of our common stock.
| 24 |
A significant portion of our loan portfolio is secured by real estate, and events that negatively impact the real estate market could hurt our business. A significant portion of our loan portfolio is secured by real estate. As of December 31, 2016, 93.8% of our loans had real estate as a primary or secondary component of collateral. The real estate collateral in each case provides an alternate source of repayment in the event of default by the borrower and may deteriorate in value during the time the credit is extended. A weakening of the real estate market in our market areas could result in an increase in the number of borrowers who default on their loans and a reduction in the value of the collateral securing their loans, which in turn could have an adverse effect on our profitability and asset quality. If we are required to liquidate the collateral securing a loan to satisfy the debt during a period of reduced real estate values, our results of operations, financial condition and the value of our common stock could be adversely affected.
Concentration of collateral in our primary market area may increase the risk of increased non-performing assets. Our primary market area consists of the western North Carolina counties of Cherokee, Haywood, Henderson, Jackson, Macon, Polk and Transylvania and Upstate South Carolina counties of Anderson, Greenville, Pickens, and Spartanburg. At December 31, 2016, approximately $563.1 million, or 75.4%, of our loans were secured by real estate located within our primary area. A decline in real estate values in our primary market area would lower the value of the collateral securing loans on properties in this area, and may increase our level of non-performing assets.
Income from secondary mortgage market operations is volatile, and we may incur losses with respect to our secondary mortgage market operations that could negatively affect our earnings. A key component of our existing business is to sell in the secondary market longer term, conforming fixed-rate residential mortgage loans that we originate, earning non-interest income in the form of gains on sale. When interest rates rise, the demand for mortgage loans tends to fall and may reduce the number of loans we can originate for sale. Weak or deteriorating economic conditions also tend to reduce loan demand. Although we originate, and intend to continue originating, loans on a “best efforts” basis, and we sell, and intend to continue selling, most loans in the secondary market with limited or no recourse, we are required, and will continue to be required, to give customary representations and warranties to the buyers relating to compliance with applicable law. If we breach those representations and warranties, the buyers will be able to require us to repurchase the loans and we may incur a loss on the repurchase that could negatively affect our earnings.
We rely on the mortgage secondary market for some of our liquidity. In 2016, we sold __% of the mortgage loans we originated in the secondary markets to Fannie Mae and others. We rely on Fannie Mae and others to purchase loans that meet their conforming loan requirements in order to reduce our credit risk and provide funding for additional loans we desire to originate. We cannot provide assurance that these purchasers will not materially limit their purchases of conforming loans due to capital constraints, a change in the criteria for conforming loans or other factors. Additionally, various proposals have been made to reform the U.S. residential mortgage finance market, including the role of Fannie Mae and other agencies. The exact effects of any such reforms are not yet known, but they may limit our ability to sell conforming loans to Fannie Mae and others. If we are unable to continue to sell conforming loans to these agencies, our ability to fund, and thus originate, additional mortgage loans may be adversely affected, which would adversely affect our results of operations.
Future changes in interest rates could reduce our profits. Our ability to make a profit largely depends on our net interest income, which could be negatively affected by changes in interest rates. Net interest income is the difference between:
| • | the interest income we earn on our interest-earning assets, such as loans and securities; and |
| • | the interest expense we pay on our interest-bearing liabilities, such as deposits and borrowings. |
Timing differences that can result from our interest-earning assets not repricing at the same time as our interest-bearing liabilities can negatively impact our net interest income. In addition, the amount of change in interest-earning assets and interest-bearing liabilities can also vary and present a risk to the amount of net interest margin earned. We generally employ market indexes when making portfolio loans in order to reduce the interest rate risk in our loan portfolio. Those indexes may not move in tandem with changes in rates of our funding sources, depending on market demand. As part of our achieving a balanced earning asset portfolio and earning acceptable yields, we also invest in longer term fixed rate municipal securities and in securities which have issuer callable features. These securities could reduce our net interest income or lengthen the average life during periods of high interest rate volatility. We also employ forecasting models to measure and manage the risk within stated policy guidelines. Notwithstanding these tools and practices, we are not assured that we can reprice our assets commensurately to interest rate changes in our funding sources, particularly during periods of high interest rate volatility. The difference in the timing of repricing our assets and liabilities may result in a decline in our earnings.
| 25 |
Strong competition within our market areas may limit our growth and profitability. Competition in the banking and financial services industry is intense. In our market areas, we compete with credit unions, commercial banks, savings institutions, mortgage brokerage firms, finance companies, mutual funds, insurance companies, and brokerage and investment banking firms operating locally and elsewhere. Some of our competitors have greater name recognition and market presence that benefit them in attracting business, and offer certain services that we do not or cannot provide. In addition, larger competitors may be able to price loans and deposits more aggressively than we do, which could affect our ability to grow and remain profitable on a long-term basis. Our profitability depends upon our continued ability to successfully compete in our market areas. If we must raise interest rates paid on deposits or lower interest rates charged on our loans, our net interest margin and profitability could be adversely affected.
The financial services industry could become even more competitive as a result of continuing technological changes and increasing consolidation. Technology has lowered barriers to entry and made it possible for non-banks to offer products and services traditionally provided by banks, such as automatic transfer and automatic payment systems. Many of our competitors have fewer regulatory constraints and may have lower cost structures. Additionally, due to their size, many competitors may be able to achieve economies of scale and, as a result, may offer a broader range of products and services as well as better pricing for those products and services than we can.
Our stock-based benefit plan will increase our costs, which will reduce our income. We have adopted a stock-based benefit plan through which we can award participants shares of our common stock (at no cost to them), options to purchase shares of our common stock and/or other equity-based compensation. The number of shares of restricted stock or stock options reserved for issuance under the plan will not exceed 3% and 7%, respectively, of our total outstanding shares. We may grant shares of common stock and stock options in excess of these amounts if an additional stock-based benefit plan is adopted in the future. The stock options and shares of restricted stock granted under our stock-based benefit plan are expensed by us over their vesting period at the fair market value of the shares on the date they are awarded. Accordingly, further grants made under the plan will increase our costs, which will reduce our net income.
The implementation of stock-based benefit plans may dilute your ownership interest. We have adopted a stock-based benefit plan through which we can award participants shares of our common stock (at no cost to them), options to purchase shares of our common stock and/or other equity-based compensation. The stock-based benefit plans will be funded through either open market purchases of shares of common stock and/or from the issuance of authorized but unissued shares of common stock. Our ability to repurchase shares of common stock to fund these plans will be subject to many factors, including, but not limited to, applicable regulatory restrictions on stock repurchases, the availability of stock in the market, the trading price of the stock, our capital levels, alternative uses for our capital and our financial performance. Although our current intention is to fund these plans with stock repurchases, we may not be able to conduct such repurchases. If we do not repurchase shares of common stock to fund these plans, then shareholders would experience a reduction in their ownership interest.
We are subject to extensive regulation and oversight, and, depending upon the findings and determinations of our regulatory authorities, we may be required to make adjustments to our business, operations or financial position and could become subject to formal or informal regulatory action. We are subject to extensive regulation and supervision, including examination by federal and state banking regulators. Federal and state regulators have the ability to impose substantial sanctions, restrictions and requirements on us if they determine, upon conclusion of their examination or otherwise, violations of laws with which we must comply or weaknesses or failures with respect to general standards of safety and soundness, including, for example, in respect of any financial concerns that the regulators may identify and desire for us to address. Such enforcement may be formal or informal and can include directors’ resolutions, memoranda of understanding, consent orders, civil money penalties and termination of deposit insurance and bank closure. Enforcement actions may be taken regardless of the capital levels of the institutions, and regardless of prior examination findings. In particular, institutions that are not sufficiently capitalized in accordance with regulatory standards may also face capital directives or prompt corrective actions. Enforcement actions may require certain corrective steps (including staff additions or changes), impose limits on activities (such as lending, deposit taking, acquisitions, paying dividends or branching), prescribe lending parameters (such as loan types, volumes and terms) and require additional capital to be raised, any of which could adversely affect our financial condition and results of operations. The imposition of regulatory sanctions, including monetary penalties, may have a material impact on our financial condition and results of operations and/or damage our reputation. In addition, compliance with any such action could distract management’s attention from our operations, cause us to incur significant expenses, restrict us from engaging in potentially profitable activities and limit our ability to raise capital.
| 26 |
Financial reform legislation enacted by Congress and resulting regulations have increased and are expected to continue to increase our costs of operations. In 2010, Congress enacted the Dodd-Frank Act. This law has significantly changed the structure of the bank regulatory system and affects the lending, deposit, investment, trading and operating activities of financial institutions and their holding companies. The Dodd-Frank Act requires various federal agencies to adopt a broad range of new implementing rules and regulations, and to prepare numerous studies and reports for Congress. The federal agencies are given significant discretion in drafting the implementing rules and regulations. Although many of these regulations have been promulgated, many additional regulations are expected to be issued in 2017 and thereafter.
The Dodd-Frank Act created the CFPB with broad powers to supervise and enforce consumer protection laws. The Bureau has broad rule-making authority for a wide range of consumer protection laws that apply to all banks and savings institutions, including the authority to prohibit “unfair, deceptive or abusive” acts and practices. It also has examination and enforcement authority over all banks and savings institutions with more than $10 billion in assets. Banks and savings institutions with $10 billion or less in assets will be examined by their applicable bank regulators. The Dodd-Frank Act also weakens the federal preemption rules that have been applicable for national banks and federal savings associations, and gives state attorneys general the ability to enforce federal consumer protection laws.
It is difficult to quantify what specific impact the Dodd-Frank Act and related regulations have had on the Bank to date and what impact yet to be written regulations will have on us in the future. However, it is expected that at a minimum these measures will increase our costs of doing business and increase our costs related to regulatory compliance, and may have a significant adverse effect on our lending activities, financial performance and operating flexibility.
We face a risk of noncompliance and enforcement action with the Bank Secrecy Act and other anti-money laundering statutes and regulations. The federal Bank Secrecy Act, the USA Patriot Act and other laws and regulations require financial institutions, among other duties, to institute and maintain effective anti-money laundering programs and file suspicious activity and currency transaction reports as appropriate. The federal Financial Crimes Enforcement Network, established by the U.S. Treasury to administer the Bank Secrecy Act, is authorized to impose significant civil money penalties for violations of those requirements and has recently engaged in coordinated enforcement efforts with the individual federal banking regulators, as well as the U.S. Department of Justice, Drug Enforcement Administration and Internal Revenue Service. There is also increased scrutiny of compliance with the rules enforced by the Office of Foreign Assets Control (“OFAC”). Federal and state bank regulators also focus on compliance with Bank Secrecy Act and anti-money laundering regulations. If our policies, procedures and systems are deemed deficient or the policies, procedures and systems of any financial institutions that we may acquire in the future are deficient, we would be subject to liability, including fines and regulatory actions such as restrictions on our ability to pay dividends and the necessity to obtain regulatory approvals to proceed with certain aspects of our business plan, including any acquisition plans, which would negatively impact our business, financial condition and results of operations. Failure to maintain and implement adequate programs to combat money laundering and terrorist financing could also have serious reputational consequences for us.
We are subject to more stringent capital requirements, which may adversely impact our return on equity, require us to raise additional capital, or constrain us from paying dividends or repurchasing shares. In July 2013, the Federal Reserve and the FDIC approved new rules that substantially amended the regulatory risk-based capital rules applicable to the Bank. The final rule implements the “Basel III” regulatory capital reforms and changes required by the Dodd-Frank Act.
| 27 |
The final rule includes new minimum risk-based capital and leverage ratios, which became effective for the Bank and the Company on January 1, 2015, and revises the definition of what constitutes “capital” for purposes of calculating those ratios. The new minimum capital requirements are: (i) a new common equity tier 1 capital ratio of 4.5%; (ii) a tier 1 to risk-based assets capital ratio of 6% (increased from 4%); (iii) a total capital ratio of 8% (unchanged from current rules); and (iv) a tier 1 leverage ratio of 4%. These rules also establish a “capital conservation buffer” of 2.5%, and will result in the following minimum ratios: (i) a common equity tier 1 capital ratio of 7.0%, (ii) a tier 1 to risk-based assets capital ratio of 8.5%, and (iii) a total capital ratio of 10.5%. The new capital conservation buffer requirement was phased in beginning in January 2016 at 0.625% of risk-weighted assets and will increase each year until fully implemented in January 2019. An institution will be subject to limitations on paying dividends, engaging in share repurchases, and paying discretionary bonuses if its capital level falls below the buffer amount. These limitations will establish a maximum percentage of eligible retained income that can be utilized for such actions.
In addition to the higher required capital ratios and the new deductions and adjustments, the final rules increase the risk weights for certain assets, meaning that we will have to hold more capital against these assets. For example, commercial real estate loans that do not meet certain new underwriting requirements must be risk-weighted at 150%, rather than the current 100%. There are also new risk weights for unsettled transactions and derivatives.
The application of more stringent capital requirements for the Bank could, among other things, result in lower returns on equity, require the raising of additional capital, and result in regulatory actions constraining us from paying dividends or repurchasing shares if we were to be unable to comply with such requirements.
We depend on our management team to implement our business strategy and execute successful operations and we could be harmed by the loss of their services. We are dependent upon the services of our management team. Our strategy and operations are directed by the executive management team. Any loss of the services of our President and Chief Executive Officer or other members of our management team could impact our ability to implement our business strategy, and have a material adverse effect on our future business, results of operations, financial condition and the value of our common stock.
The fair value of our investments could decline. As of December 31, 2016, all of our investment portfolio was designated as available-for-sale. Unrealized gains and losses in the estimated value of the available-for-sale portfolio must be “marked to market” and reflected as a separate item in shareholders’ equity (net of tax) as accumulated other comprehensive income. Shareholders’ equity will continue to reflect the unrealized gains and losses (net of tax) of these investments. The fair value of our investment portfolio may decline, causing a corresponding decline in shareholders’ equity.
Liquidity risk could impair our ability to fund operations and jeopardize our financial condition, results of operations and cash flows. Liquidity is essential to our business. Our ability to implement our business strategy will depend on our ability to obtain funding for loan originations, working capital, possible acquisitions and other general corporate purposes. An inability to raise funds through deposits, borrowings, securities sold under repurchase agreements, the sale of loans and other sources could have a substantial negative effect on our liquidity. From time to time we rely on deposits obtained through intermediaries, FHLB advances, securities sold under agreements to repurchase and other wholesale funding sources to obtain the funds necessary to manage our balance sheet.
Our access to funding sources in amounts adequate to finance our activities or on terms which are acceptable to us could be impaired by factors that affect us specifically or the financial services industry or economy in general, including a decrease in the level of our business activity as a result of a downturn in the markets in which our loans are concentrated or adverse regulatory action against us. Our ability to borrow could also be impaired by factors that are not specific to us, such as a disruption in the financial markets or negative views and expectations about the prospects for the financial services industry. To the extent we are not successful in obtaining such funding, we will be unable to implement our strategy as planned which could have a material adverse effect on our financial condition, results of operations and cash flows.
| 28 |
Changes in accounting standards could affect reported earnings. The accounting standard setters, including the PCAOB, the FASB, the SEC and other regulatory bodies, periodically change the financial accounting and reporting standards that govern the preparation of our consolidated financial statements. These changes can be hard to predict and can materially impact how we record and report our financial condition and results of operations. In some cases, we could be required to apply new or revised guidance retroactively.
The FASB issued the current expected credit losses (CECL) standard which will be effective in 2020, which changes the manner in which the allowance for credit losses is established and evaluated from the concept of incurred losses to that of expected losses. The effect of this change in accounting standard on our financial position and results of operations has not been quantified; however, if it results in a material increase in our allowance and future provisions for credit losses, this could have a material adverse effect on our financial condition and results of operations.
We are subject to environmental liability risk associated with our lending activities. A significant portion of our loan portfolio is secured by real property. During the ordinary course of business, we may foreclose on and take title to properties securing certain loans. In doing so, there is a risk that hazardous or toxic substances could be found on these properties. If hazardous or toxic substances are found, we may be liable for remediation costs, as well as for personal injury and property damage. Environmental laws may require us to incur substantial expenses and may materially reduce the affected property’s value or limit our ability to use or sell the affected property. In addition, future laws or more stringent interpretations of enforcement policies with respect to existing laws may increase our exposure to environmental liability. Although we have policies and procedures to perform an environmental review before initiating any foreclosure action on real property, these reviews may not be sufficient to detect all potential environmental hazards. The remediation costs and any other financial liabilities associated with an environmental hazard could have a material adverse effect on our future business, results of operations, financial condition and the value of our common stock.
A failure in or breach of our operational or security systems or infrastructure, or those of our third party vendors and other service providers or other third parties, including as a result of cyber-attacks, could disrupt our businesses, result in the disclosure or misuse of confidential or proprietary information, damage our reputation, increase our costs, and cause losses. We rely heavily on communications and information systems to conduct our business. Information security risks for financial institutions such as ours have generally increased in recent years in part because of the proliferation of new technologies; the use of the internet and telecommunications technologies to conduct financial transactions; and the increased sophistication and activities of organized crime, hackers, terrorists, activists, and other external parties. As customer, public, and regulatory expectations regarding operational and information security have increased, our operating systems and infrastructure must continue to be safeguarded and monitored for potential failures, disruptions, and breakdowns. Our business, financial, accounting, and data processing systems, or other operating systems and facilities may stop operating properly or become disabled or damaged as a result of a number of factors, including events that are wholly or partially beyond our control. For example, there could be electrical or telecommunication outages; natural disasters such as earthquakes, tornadoes, and hurricanes; disease pandemics; events arising from local or larger scale political or social matters, including terrorist acts; and as described below, cyber-attacks.
As noted above, our business relies on our digital technologies, computer and email systems, software and networks to conduct its operations. Although we have information security procedures and controls in place, our technologies, systems, networks, and our customers’ devices may become the target of cyber-attacks or information security breaches that could result in the unauthorized release, gathering, monitoring, misuse, loss, or destruction of our or our customers’ or other third parties’ confidential information. Third parties with whom we do business or that facilitate our business activities, including financial intermediaries, or vendors that provide service or security solutions for our operations, and other unaffiliated third parties could also be sources of operational and information security risk to us, including from breakdowns or failures of their own systems or capacity constraints.
| 29 |
While we have disaster recovery and other policies and procedures designed to prevent or limit the effect of the failure, interruption or security breach of our information systems, there can be no assurance that any such failures, interruptions or security breaches will not occur or, if they do occur, that they will be adequately addressed. Our risk and exposure to these matters remains heightened because of the evolving nature of these threats. As a result, cyber security and the continued development and enhancement of our controls, processes, and practices designed to protect our systems, computers, software, data, and networks from attack, damage or unauthorized access remain a focus for us. As threats continue to evolve, we may be required to expend additional resources to continue to modify or enhance our protective measures or to investigate and remediate information security vulnerabilities. Disruptions or failures in the physical infrastructure or operating systems that support our businesses and clients, or cyber-attacks or security breaches of the networks, systems or devices that our customers use to access our products and services could result in client attrition, regulatory fines, penalties or intervention, reputation damage, reimbursement or other compensation costs, and/or additional compliance costs, any of which could have a material effect on our results of operations or financial condition.
We are party to various lawsuits incidental to our business. Litigation is subject to many uncertainties such that the expenses and ultimate exposure with respect to many of these matters cannot be ascertained. From time to time, customers and others make claims and take legal action pertaining to our performance of fiduciary responsibilities. Whether claims and legal actions are legitimate or unfounded, if such claims and legal actions are not resolved in our favor, they may result in significant financial liability and/or adversely affect the market perception of us and our products and services as well as impact customer demand for those products and services. Any financial liability or reputation damage could have a material adverse effect on our business, which, in turn, could have a material adverse effect on our financial condition and results of operations.
Our stock price may be volatile, which could result in losses to our shareholders and litigation against us. Our stock price has been volatile in the past and several factors could cause the price to fluctuate substantially in the future. These factors include but are not limited to: actual or anticipated variations in earnings, changes in analysts’ recommendations or projections, our announcement of developments related to our businesses, operations and stock performance of other companies deemed to be peers, new technology used or services offered by traditional and non-traditional competitors, news reports of trends, irrational exuberance on the part of investors, new federal banking regulations, and other issues related to the financial services industry. Our stock price may fluctuate significantly in the future, and these fluctuations may be unrelated to our performance. General market declines or market volatility in the future, especially in the financial institutions sector, could adversely affect the price of our common stock, and the current market price may not be indicative of future market prices. Stock price volatility may make it more difficult for you to resell your common stock when you want and at prices you find attractive. Moreover, in the past, securities class action lawsuits have been instituted against some companies following periods of volatility in the market price of its securities. We could in the future be the target of similar litigation. Securities litigation could result in substantial costs and divert management’s attention and resources from our normal business.
The trading volume in our common stock is lower than that of other larger companies; future sales of our stock by our shareholders or the perception that those sales could occur may cause our stock price to decline. Although our common stock is listed for trading on the NASDAQ Global Market, the trading volume in our common stock is lower than that of other larger financial services companies. A public trading market having the desired characteristics of depth, liquidity and orderliness depends on the presence in the marketplace of willing buyers and sellers of our common stock at any given time. This presence depends on the individual decisions of investors and general economic and market conditions over which we have no control. Given the relatively low trading volume of our common stock, significant sales of our common stock in the public market, or the perception that those sales may occur, could cause the trading price of our common stock to decline or to be lower than it otherwise might be in the absence of those sales or perceptions.
There may be future sales of additional common stock or preferred stock or other dilution of our equity, which may adversely affect the market price of our common stock. We may issue additional common stock or preferred stock, including any securities that are convertible into or exchangeable for, or that represent the right to receive, common stock or preferred stock or any substantially similar securities. The market value of our common stock could decline as a result of sales by us of a large number of shares of common stock or preferred stock or similar securities in the market or the perception that such sales could occur.
| 30 |
We may issue additional debt and equity securities or securities convertible into equity securities, any of which may be senior to our common stock as to distributions and in the event of liquidation, which could negatively affect the value of our common stock. In the future, we may issue additional debt or equity securities, including securities convertible into equity securities. In the event of our liquidation, the holders of our debt and preferred securities must be satisfied before any distributions can be made on our common stock. Because our decision to incur debt and issue securities in our future offerings will depend on market conditions and other factors beyond our control, we cannot predict or estimate with certainty the amount, timing or nature of our future offerings and debt financings. Further, market conditions could require us to accept less favorable terms for the issuance of our securities in the future.
Negative public opinion surrounding our company and the financial institutions industry generally could damage our reputation and adversely impact our earnings. Reputation risk, or the risk to our business, earnings and capital from negative public opinion surrounding our company and the financial institutions industry generally, is inherent in our business. Negative public opinion can result from our actual or alleged conduct in any number of activities, including lending practices, corporate governance and acquisitions, and from actions taken by government regulators and community organizations in response to those activities. Negative public opinion can adversely affect our ability to keep and attract clients and employees and can expose us to litigation and regulatory action. Although we take steps to minimize reputation risk in dealing with our clients and communities, this risk will always be present given the nature of our business.
Severe weather, natural disasters, acts of war or terrorism, and other external events could significantly impact our business. Severe weather, natural disasters, acts of war or terrorism, and other adverse external events could have a significant impact on our ability to conduct business. Such events could affect the stability of our deposit base, impair the ability of borrowers to repay outstanding loans, impair the value of collateral securing loans, cause significant property damage, result in loss of revenue, and/or cause us to incur additional expenses. Although management has established disaster recovery plans and procedures, the occurrence of any such event could have a material adverse effect on our future business, results of operations, financial condition and the value of our common stock.
Item 1B. Unresolved Staff Comments
None
We operate from our corporate headquarters and, as of December 31, 2016, 15 branches located in our primary market area within western North Carolina and Upstate South Carolina. The net book value of our premises, land and equipment was $20.2 million at December 31, 2016. The following table sets forth information with respect to our full-service banking offices and other locations as of December 31, 2016.
| 31 |
| Banking Center (1) | Location | Year Established | Owned/ Leased | Deposits at December 31, 2016 (in thousands) | ||||||||||
| Franklin Main | 50 West Main Street, Franklin, NC | 1922 | Owned | $ | 223,499 | |||||||||
| Murphy | 12 Peachtree Street, Murphy, NC | 1981 | Owned | 56,227 | ||||||||||
| Franklin Holly Springs Plaza | 30 Hyatt Road, Franklin, NC | 1993 | Owned | 50,881 | ||||||||||
| Highlands | 473 Carolina Way, Highlands, NC | 1995 | Owned | 45,272 | ||||||||||
| Sylva | 498 East Main Street, Sylva, NC | 1999 | Owned | 49,001 | ||||||||||
| Hendersonville—Laurel Park | 640 North Main Street, Hendersonville, NC | 1996 | Owned | 67,815 | ||||||||||
| Brevard Branch | 2260 Asheville Highway, Brevard, NC | 1997 | Owned | 52,462 | ||||||||||
| Hendersonville—Eastside | 1617 Spartanburg Highway, Hendersonville, NC | 1997 | Leased | 37,066 | ||||||||||
| Cashiers Branch | 500 U.S. Highway 64, Cashiers, NC | 2002 | Owned | 45,955 | ||||||||||
| Columbus Branch | 160 W. Mill Street, Columbus, NC | 2007 | Owned | 46,595 | ||||||||||
| Saluda | 108 East Main Street, Saluda, NC | 2007 | Leased | 27,047 | ||||||||||
| Waynesville (2) | 2045 S. Main Street, Waynesville, NC | 2016 | Owned | 68,843 | ||||||||||
| Greenville | 501 Roper Mountain Road, Greenville, SC | 2015 | Owned | 10,783 | ||||||||||
| Anderson (3) | 602 North Main Street, Anderson, SC | 2015 | Owned | 12,182 | ||||||||||
| Chesnee (3) | 110 South Alabama Avenue, Chesnee, SC | 2015 | Owned | 36,385 | ||||||||||
| $ | 830,013 | |||||||||||||
| Other offices | ||||||||||||||
| Corporate Office and Operations | 14 One Center Court, Franklin, NC | 2004 | Owned | N/A | ||||||||||
| Mortgage Processing Office | 3640 East 1st Street, Suite 202, Blue Ridge, GA | 2013 | Leased | N/A | ||||||||||
| Loan Production Office | 133 Thomas Green Blvd., Suite 200, Clemson, SC | 2016 | Leased | N/A | ||||||||||
| Loan Production Office (2) | 1200 Ridgefield Blvd., Suite 258, Asheville, NC | 2016 | Leased | N/A | ||||||||||
(1) - In February 2017, we acquired two branches in Jasper, Georgia, increasing our branch network to 17 full-service banking offices and two loan production offices.
(2) - Acquired on April 1, 2016.
(3) - Acquired on December 11, 2015.
In the ordinary course of operations, we may be a party to various legal proceedings from time to time. We do not believe that there is any pending or threatened proceeding against us, which, if determined adversely, would have a material effect on our business, results of operations, or financial condition.
Item 4. Mine Safety Disclosures
Not applicable.
| 32 |
Item 5. Market for Registrant’s Common Equity, Related Stockholder Matters, and Issuer Purchases of Equity Securities.
Our common stock is listed on the Nasdaq Global Market under the symbol “ENFC.” The common stock was issued at a price of $10.00 per share in connection with the mutual to stock conversion of Macon Bancorp and the initial public offering of our common stock. The common stock commenced trading on the Nasdaq Global Market on October 1, 2014. As of the close of business on March 8, 2017, there were 6,467,946 shares of common stock outstanding held by approximately 360 holders of record.
The following table sets forth the high and low closing sales prices of our common stock as reported by the Nasdaq Global Market for the periods indicated.
| High | Low | |||||||
| 2016 | ||||||||
| First quarter | $ | 18.91 | $ | 16.24 | ||||
| Second quarter | 17.83 | 17.16 | ||||||
| Third quarter | 18.43 | 17.40 | ||||||
| Fourth quarter | 20.60 | 18.00 | ||||||
| 2015 | ||||||||
| First quarter | $ | 15.86 | $ | 14.30 | ||||
| Second quarter | 18.24 | 15.50 | ||||||
| Third quarter | 18.45 | 17.34 | ||||||
| Fourth quarter | 19.59 | 16.87 | ||||||
The Company did not declare any dividends to its shareholders during the years ended December 31, 2016 or 2015. See Item 1, “Business—Supervision and Regulation,” for more information regarding the restrictions on the Company’s and the Bank’s abilities to pay dividends.
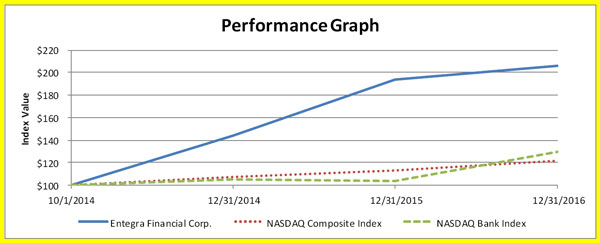
| Cumulative Total Return (1) | ||||||||||||||||
| 10/1/2014 (2) | 12/31/2014 | 12/31/2015 | 12/31/2016 | |||||||||||||
| Entegra Financial Corp. | $ | 100 | $ | 144 | $ | 194 | $ | 206 | ||||||||
| NASDAQ Composite Index | 100 | 107 | 113 | 122 | ||||||||||||
| NASDAQ Bank Index | 100 | 105 | 103 | 130 | ||||||||||||
(1) Total return includes reinvestment of dividends.
(2) Date of initial public offering.
| 33 |
The graph and table compare our cumulative total shareholders return on our common stock with the NASDAQ Composite Index and the NASDAQ Bank Index. Returns are calculated on a total return basis, assuming the reinvestment of dividends and assuming that $100 was originally invested on October 1, 2014, the first day our common stock was traded.
The following sets forth information regarding our common stock repurchases during the fourth quarter of 2016.
| Period | Total Number of Shares Purchased | Average Price Paid per Share | Total Number of Shares Purchased as Part of Publicly Announced Plans or Programs (1) | Maximum Number of Shares that May Yet Be Purchased Under the Plans or Programs (2) | ||||||||||||
| October 1, 2016 to October 31, 2016 | 24,568 | $ | 18.10 | 24,568 | 222,750 | |||||||||||
| November 1, 2016 to November 31, 2016 | — | — | — | 222,750 | ||||||||||||
| December 1, 2016 to December 31, 2016 | — | — | — | 222,750 | ||||||||||||
| Total | 24,568 | $ | 18.10 | 24,568 | 222,750 | |||||||||||
(1) - On January 28, 2016, we announced the authorization to repurchase up to 327,318 shares of our common stock through January 27, 2017. On February 24, 2017, we announced the extension of the stock repurchase program through February 23, 2018.
(2) - Approximately 104,568 shares have been repurchased to date, leaving a balance of 222,750 shares that may be purchased under the stock repurchase program, as extended.
The following table sets forth certain information regarding shares issuable upon exercise of outstanding options and rights under equity compensation plans, and shares remaining available for future issuance under equity compensation plans, in each case as of December 31, 2016.
| Number of Shares to be Issued Upon Exercise of Outstanding Options, Warrants and Rights | Weighted Average Exercise Price of Outstanding Options, Warrants and Rights | Number of Shares Remaining Available for Future Issuance under Equity Compensation Plans (excluding shares reflected in column (a)) | ||||||||||
| Plan Category | (a) | (b) | (c) | |||||||||
| Equity Compensation Plans Approved by Shareholders | 101,857 | |||||||||||
| Stock Options | 407,200 | $ | 18.41 | |||||||||
| Restricted Stock Units | 145,580 | — | ||||||||||
| Equity Compensation Plans Not Approved by Shareholders | — | — | — | |||||||||
| Total | 552,780 | $ | 13.56 | 101,857 | ||||||||
| 34 |
Item 6. Selected Financial Data
The following tables should be read in conjunction with “Item 7 - Management’s Discussion and Analysis of Financial Condition and Results of Operations” and “Item 8 - Financial Statements and Supplementary Data,” below.
| (Dollars in thousands, except per share data) | 2016 | 2015 | 2014 | 2013 | 2012 | |||||||||||||||
| Selected Financial Condition Data: | ||||||||||||||||||||
| Total assets | $ | 1,292,877 | $ | 1,031,416 | $ | 903,648 | $ | 784,893 | $ | 769,939 | ||||||||||
| Cash and cash equivalents | 43,294 | 40,650 | 58,982 | 34,281 | 25,362 | |||||||||||||||
| Investment securities | 403,502 | 284,740 | 249,144 | 176,472 | 131,091 | |||||||||||||||
| Loans receivable, net | 735,056 | 614,611 | 529,407 | 507,623 | 545,850 | |||||||||||||||
| Bank owned life insurance | 31,347 | 20,858 | 20,417 | 19,961 | 19,479 | |||||||||||||||
| Real estate owned | 4,226 | 5,369 | 4,425 | 10,506 | 19,755 | |||||||||||||||
| Deposits | 830,013 | 716,617 | 703,117 | 684,226 | 675,098 | |||||||||||||||
| FHLB advances | 298,500 | 153,500 | 60,000 | 40,000 | 25,000 | |||||||||||||||
| Junior subordinated debt | 14,433 | 14,433 | 14,433 | 14,433 | 14,433 | |||||||||||||||
| Total equity | 133,068 | 131,469 | 107,319 | 32,518 | 42,294 | |||||||||||||||
| Selected Operating Data: | ||||||||||||||||||||
| Interest income | $ | 40,520 | $ | 33,144 | $ | 32,445 | $ | 31,451 | $ | 34,567 | ||||||||||
| Interest expense | 6,032 | 5,723 | 6,573 | 6,988 | 9,635 | |||||||||||||||
| Net interest income | 34,488 | 27,421 | 25,872 | 24,463 | 24,932 | |||||||||||||||
| Provision for loan losses | 274 | (1,500 | ) | 33 | 4,358 | 7,878 | ||||||||||||||
| Net interest income after provision for loan losses | 34,214 | 28,921 | 25,839 | 20,105 | 17,054 | |||||||||||||||
| Noninterest income | 7,846 | 5,795 | 6,079 | 6,134 | 7,926 | |||||||||||||||
| Noninterest expense | 32,189 | 27,630 | 23,767 | 26,179 | 25,058 | |||||||||||||||
| Income (loss) before income tax expense (benefit) | 9,871 | 7,086 | 8,151 | 60 | (78 | ) | ||||||||||||||
| Income tax expense (benefit) | 3,495 | (16,739 | ) | 2,208 | 475 | (1,011 | ) | |||||||||||||
| Net income (loss) | $ | 6,376 | $ | 23,825 | $ | 5,943 | $ | (415 | ) | $ | 933 | |||||||||
| 35 |
| (Dollars in thousands, except per share data) | 2016 | 2015 | 2014 | 2013 | 2012 | |||||||||||||||
| Selected Financial Ratios and Other Data: | ||||||||||||||||||||
| Performance Ratios: | ||||||||||||||||||||
| Return on average assets | 0.55 | % | 2.51 | % | 0.71 | % | (0.05 | )% | 0.11 | % | ||||||||||
| Return on average equity (1) | 4.71 | 19.78 | 10.39 | (1.02 | ) | 2.18 | ||||||||||||||
| Tax equivalent net interest rate spread | 3.16 | 2.96 | 3.19 | 3.33 | 3.23 | |||||||||||||||
| Tax equivalent net interest margin | 3.28 | 3.11 | 3.32 | 3.43 | 3.43 | |||||||||||||||
| Efficiency ratio (2) | 76.04 | 83.18 | 74.42 | 85.59 | 76.26 | |||||||||||||||
| Noninterest expense to average total assets | 2.76 | 2.91 | 2.85 | 3.37 | 3.07 | |||||||||||||||
| Average interest-earning assets to average interest-bearing liabilities | 121.77 | 123.99 | 115.89 | 110.47 | 108.75 | |||||||||||||||
| Tangible equity to tangible assets (3)(6) | 10.08 | 12.64 | 11.88 | 4.14 | 5.49 | |||||||||||||||
| Average equity to average assets | 11.63 | 12.71 | 6.85 | 5.21 | 5.24 | |||||||||||||||
| Asset Quality Ratios: | ||||||||||||||||||||
| Non-performing loans to total loans (4) | 0.81 | % | 1.17 | % | 3.10 | % | 2.99 | % | 3.16 | % | ||||||||||
| Non-performing assets to total assets (5) | 0.79 | 1.23 | 2.35 | 3.33 | 4.87 | |||||||||||||||
| Allowance for loan losses to non-performing loans | 154.03 | 129.96 | 65.98 | 91.19 | 83.91 | |||||||||||||||
| Allowance for loan losses to total loans | 1.25 | 1.52 | 2.05 | 2.73 | 2.65 | |||||||||||||||
| Net charge-offs to average loans | 0.06 | 0.02 | 0.60 | 0.93 | 1.66 | |||||||||||||||
| Loan loss provision/ net charge-offs | 63.72 | (1,351.35 | ) | 1.03 | 87.49 | 81.10 | ||||||||||||||
| Capital Ratios (Bank level only): | ||||||||||||||||||||
| Total capital (to risk-weighted assets) | 17.43 | % | 19.34 | % | 21.15 | % | 11.97 | % | 11.49 | % | ||||||||||
| Tier I capital (to risk-weighted assets) | 16.33 | 18.07 | 19.89 | 10.70 | 10.22 | |||||||||||||||
| Common Equity Tier 1 capital (to risk-weighted assets) | 16.33 | 18.07 | N/A | N/A | N/A | |||||||||||||||
| Tier I capital (to average assets) | 11.06 | 12.05 | 11.91 | 7.02 | 7.16 | |||||||||||||||
| Capital Ratios (Company): | ||||||||||||||||||||
| Total capital (to risk-weighted assets) | 17.72 | % | 22.04 | % | 24.50 | % | 11.79 | % | 11.31 | % | ||||||||||
| Tier I capital (to risk-weighted assets) | 16.62 | 20.78 | 23.24 | 10.52 | 10.04 | |||||||||||||||
| Common Equity Tier 1 capital (to risk-weighted assets) | 15.33 | 19.55 | N/A | N/A | N/A | |||||||||||||||
| Tier I capital (to average assets) | 11.28 | 13.85 | 13.94 | 6.90 | 7.03 | |||||||||||||||
| Per Share Data: | ||||||||||||||||||||
| Earnings per share - basic | $ | 0.98 | $ | 3.64 | $ | 0.91 | N/A | N/A | ||||||||||||
| Earnings per share - diluted | 0.98 | 3.64 | 0.91 | N/A | N/A | |||||||||||||||
| Cash dividends declared | — | — | — | N/A | N/A | |||||||||||||||
| Book value at end of year | 20.57 | 20.08 | 16.39 | N/A | N/A | |||||||||||||||
| Tangible book value at end of year (6) | 20.10 | 19.88 | 16.39 | N/A | N/A | |||||||||||||||
| Other Data: | ||||||||||||||||||||
| Number of offices | 15 | 14 | 11 | 11 | 11 | |||||||||||||||
| Full time equivalent employees | 239 | 213 | 187 | 185 | 169 | |||||||||||||||
(1)-Return on average equity for the year ended December 31, 2014 reflects our actual average equity, and would have been adversely impacted had the $63.7 million in net stock offering proceeds been outstanding for the entire year.
(2)-The efficiency ratio represents noninterest expense divided by the sum of net interest income and noninterest income.
(3)-Mortgage servicing rights are included in tangible assets and tangible equity.
(4)-Non-performing loans include non-accruing loans.
(5)-Non-performing assets include non-performing loans and REO.
(6)-Non-GAAP measure, see page 38 for a reconcilation of GAAP to non-GAAP measures.
| 36 |
Item 7. Management’s Discussion and Analysis of Financial Condition and Results of Operations
Entegra Financial Corp. was incorporated on May 31, 2011 and became the holding company for Entegra Bank (the “Bank”) on September 30, 2014 upon the completion of Macon Bancorp’s merger with and into Entegra Financial Corp., pursuant to which Macon Bancorp converted from the mutual to stock form of organization. Prior to the completion of the conversion, Entegra Financial Corp. did not engage in any significant activities other than organizational activities. Also on September 30, 2014, Entegra Financial Corp. completed the initial public offering of its common stock. In this Discussion and Analysis section, terms such as “we,” “us,” “our” and the “Company” refer to Entegra Financial Corp. and, for periods prior to September 30, 2014, Macon Bancorp.
The following presents management’s discussion and analysis of the Company’s financial condition and results of operations and should be read in conjunction with the consolidated financial statements and related notes included elsewhere in this Annual Report on Form 10-K. This discussion may contain forward-looking statements that involve risks and uncertainties. Our actual results could differ significantly from those anticipated in forward-looking statements as a result of various factors. The following discussion is intended to assist in understanding the financial condition and results of operations of the Company.
Statements included in this Management’s Discussion and Analysis of Financial Condition and Results of Operations section include financial measures that do not conform to U.S. generally accepted accounting principles, or GAAP and should be read along with the accompanying tables, which provide a reconciliation of non-GAAP financial measures to GAAP financial measures. This Management’s Discussion and Analysis of Financial Condition and Results of Operations section and the accompanying tables discuss financial measures, such as core net interest income, core noninterest expense, core net income, core return on average assets, core return on average equity, and core efficiency ratio, which are non-GAAP measures. We believe that such non-GAAP measures are useful because they enhance the ability of investors and management to evaluate and compare the Company’s operating results from period to period in a meaningful manner. Non-GAAP measures should not be considered as an alternative to any measure of performance as promulgated under GAAP. Investors should consider the Company’s performance and financial condition as reported under GAAP and all other relevant information when assessing the performance or financial condition of the company. Non-GAAP measures have limitations as analytical tools, and investors should not consider them in isolation or as a substitute for analysis of the Company’s results or financial condition as reported under GAAP.
| 37 |
RECONCILIATION OF NON-GAAP MEASURES
| Year Ended December 31, | ||||||||||||||||||||
| 2016 | 2015 | 2014 | 2013 | 2012 | ||||||||||||||||
| (Dollars in thousands, except per share data) | ||||||||||||||||||||
| Core Net Interest Income | ||||||||||||||||||||
| Net Interest income (GAAP) | $ | 34,488 | $ | 27,421 | $ | 25,872 | $ | 24,463 | $ | 24,932 | ||||||||||
| One-time deferred interest and discounts | — | — | (1,125 | ) | — | — | ||||||||||||||
| Core net interest income (Non-GAAP) | $ | 34,488 | $ | 27,421 | $ | 24,747 | $ | 24,463 | $ | 24,932 | ||||||||||
| Core Noninterest Expense | ||||||||||||||||||||
| Noninterest expense (GAAP) | $ | 32,189 | $ | 27,630 | $ | 23,767 | $ | 26,179 | $ | 25,058 | ||||||||||
| FHLB prepayment penalty | (118 | ) | (1,762 | ) | — | — | — | |||||||||||||
| Merger-related expenses | (2,197 | ) | (329 | ) | — | — | — | |||||||||||||
| Core noninterest expense (Non-GAAP) | $ | 29,874 | $ | 25,539 | $ | 23,767 | $ | 26,179 | $ | 25,058 | ||||||||||
| Core Net Income (Loss) | ||||||||||||||||||||
| Net income (loss) (GAAP) | $ | 6,376 | $ | 23,825 | $ | 5,943 | $ | (415 | ) | $ | 933 | |||||||||
| One-time deferred interest and discounts | — | — | (1,125 | ) | — | — | ||||||||||||||
| Negative provision for loan losses | — | (1,500 | ) | — | — | — | ||||||||||||||
| FHLB prepayment penalty | 118 | 1,762 | — | — | — | |||||||||||||||
| Merger-related expenses | 2,197 | 329 | — | — | — | |||||||||||||||
| Adjust actual income tax expense (benefit) to 35% estimated effective tax rate (1) | (810 | ) | (19,426 | ) | (251 | ) | 454 | (984 | ) | |||||||||||
| Core net income (Non-GAAP) | $ | 7,881 | $ | 4,990 | $ | 4,567 | $ | 39 | $ | (51 | ) | |||||||||
| Core Earnings Per Share | ||||||||||||||||||||
| Earnings per share (GAAP) | $ | 0.98 | $ | 3.64 | $ | 0.91 | N/A | N/A | ||||||||||||
| One-time deferred interest and discounts | — | — | (0.17 | ) | N/A | N/A | ||||||||||||||
| Negative provision for loan losses | — | (0.23 | ) | — | N/A | N/A | ||||||||||||||
| FHLB prepayment penalty | 0.02 | 0.27 | — | N/A | N/A | |||||||||||||||
| Merger-related expenses | 0.34 | 0.05 | — | N/A | N/A | |||||||||||||||
| Adjust actual income tax expense (benefit) to 35% estimated effective tax rate (1) | (0.12 | ) | (2.97 | ) | (0.04 | ) | N/A | N/A | ||||||||||||
| Core earnings per share (Non-GAAP) | $ | 1.21 | $ | 0.76 | $ | 0.70 | N/A | N/A | ||||||||||||
| Core Return on Average Assets | ||||||||||||||||||||
| Return on Average Assets (GAAP) | 0.55 | % | 2.51 | % | 0.71 | % | -0.05 | % | 0.11 | % | ||||||||||
| Effect to adjust for one-time deferred interest and discounts | — | — | (0.13 | ) | — | — | ||||||||||||||
| Effect to adjust for negative provision for loan losses | — | (0.16 | ) | — | — | — | ||||||||||||||
| Effect to adjust for FHLB prepayment penalty | 0.01 | 0.18 | — | — | — | |||||||||||||||
| Effect to adjust for merger-related expenses | 0.12 | 0.03 | — | — | — | |||||||||||||||
| Effect to adjust for actual income tax expense (benefit) to 35% effective tax rate | (0.09 | ) | (2.05 | ) | (0.03 | ) | 0.06 | (0.12 | ) | |||||||||||
| Core Return on Average Assets (Non-GAAP) | 0.60 | % | 0.53 | % | 0.55 | % | 0.01 | % | -0.01 | % | ||||||||||
| Core Return on Average Equity (2) | ||||||||||||||||||||
| Return on Average Equity (GAAP) | 4.71 | % | 19.78 | % | 10.39 | % | -1.02 | % | 2.18 | % | ||||||||||
| Effect to adjust for one-time deferred interest and discounts | — | — | (1.97 | ) | — | — | ||||||||||||||
| Effect to adjust for negative provision for loan losses | 0.00 | (1.24 | ) | — | — | — | ||||||||||||||
| Effect to adjust for FHLB prepayment penalty | 0.10 | 1.46 | — | — | — | |||||||||||||||
| Effect to adjust for merger-related expenses | 1.05 | 0.27 | — | — | — | |||||||||||||||
| Effect to adjust for actual income tax expense (benefit) to 35% effective tax rate | — | (16.13 | ) | (0.44 | ) | 1.12 | (2.29 | ) | ||||||||||||
| Core Return on Average Equity (Non-GAAP) | 5.86 | % | 4.14 | % | 7.98 | % | 0.10 | % | -0.11 | % | ||||||||||
| Core Efficiency Ratio | ||||||||||||||||||||
| Efficiency ratio (GAAP) | 76.04 | % | 83.18 | % | 74.44 | % | 85.59 | % | 76.26 | % | ||||||||||
| Effect to adjust for one-time deferred interest and discounts | — | — | 2.71 | — | — | |||||||||||||||
| Effect to adjust for FHLB prepayment penalty | (0.28 | ) | (5.30 | ) | — | — | — | |||||||||||||
| Effect to adjust for merger-related expenses | (5.19 | ) | (0.99 | ) | — | — | — | |||||||||||||
| Core Efficiency Ratio (Non-GAAP) | 70.56 | % | 76.89 | % | 77.15 | % | 85.59 | % | 76.26 | % | ||||||||||
| Tangible Book Value Per Share | ||||||||||||||||||||
| Book Value (GAAP) | $ | 133,068 | $ | 131,469 | $ | 107,319 | N/A | N/A | ||||||||||||
| Goodwill and intangibles | (3,044 | ) | (1,301 | ) | — | N/A | N/A | |||||||||||||
| Book Value (Tangible) | 130,024 | 130,168 | 107,319 | N/A | N/A | |||||||||||||||
| Outstanding shares | 6,467,550 | 6,546,375 | 6,546,375 | N/A | N/A | |||||||||||||||
| Tangible Book Value Per Share | $ | 20.10 | $ | 19.88 | $ | 16.39 | N/A | N/A | ||||||||||||
(1) - The Company maintained a valuation allowance on a portion of its net deferred tax asset during the periods presented and therefore only recognized tax expense (benefit) for adjustments to its tax planning strategies and reversal of valuation allowance on net deferred tax assets. Core net income is reflected to adjust the income tax expense to an estimated 35% effective tax rate after the other adjustments have been applied.
(2) - Core return on average equity and return on average equity for the year ended December 31, 2014 reflects our actual average equity, and would have been adversely impacted had the $63.7 million in net stock offering proceeds raised on September 30, 2014 been outstanding during the entire period.
| 38 |
Overview
We are a bank holding company with assets of $1.29 billion at December 31, 2016. We provide a full range of financial services through 15 full-service banking offices located in Cherokee, Haywood, Henderson, Jackson, Macon, Polk and Transylvania counties, North Carolina and Anderson, Greenville, and Spartanburg counties, South Carolina and loan production offices in Asheville, North Carolina and Clemson, South Carolina. Additionally, in February 2017, we acquired two branches in Jasper, Georgia, increasing our branch network to 17 full-service banking offices and two loan production offices. We provide full service retail and commercial banking products as well as wealth management services through a third party.
We earn revenue primarily from interest on loans and securities, and fees charged for financial services provided to our customers. Offsetting these revenues are the cost of deposits and other funding sources, provisions for loan losses and other operating costs such as salaries and employee benefits, data processing, occupancy and tax expense.
Our mission is to become the financial services provider of choice within the markets that we serve. We plan to do this by delivering exceptional service and value.
During the year ended December 31, 2016, we continued to successfully execute our key strategic initiatives of stabilizing the loan portfolio and improving asset quality, while generating earnings and increasing capital. Building on our acquisition of two South Carolina branches from Arthur State Bank in December, 2015, we completed our first whole bank acquisition in the second quarter of 2016 when we acquired Old Town Bank of Waynesville, North Carolina. Our continued focus will be on loan growth to increase our net interest income, implementing opportunities to increase fee income, improving asset quality and closely monitoring operating expenses. We strive to be well-positioned for changes in both the economy and interest rates, regardless of the timing or direction of these changes. Management regularly assesses our balance sheet, capital, liquidity and operational infrastructure in order to be positioned to take advantage of opportunities for growth as they may arise.
Our results of operations are significantly affected by general economic and competitive conditions in our market areas and nationally, as well as changes in interest rates, sources of funding, government policies and actions of regulatory authorities. Future changes in applicable laws, regulations or government policies may materially affect our financial condition and results of operations.
Strategic Plan
We continue to execute on our strategic plan which includes the following key components:
| · | Building a franchise that will provide above-average shareholder returns; |
| · | Seeking acquisition opportunities that have reasonable earn-back periods and are accretive to return on equity while minimizing book value dilution; |
| · | Building long-term franchise value by diversifying into high growth markets geographically contiguous to our current markets; |
| · | Building deposits in rural markets; |
| · | Maximizing our capital leverage through organic and acquired asset growth; and |
| · | Rational use of share repurchases to supplement shareholder returns and return excess capital to shareholders, but not at the expense of building long-term value. |
Recent Events
On February 24, 2017, the we announced the extension of our previously announced stock repurchase program (the “Stock Repurchase Program”) through February 23, 2018. The Stock Repurchase Program allows for the repurchase of up to 327,318 shares of our common stock, representing approximately 5% of our outstanding shares. Approximately 104,568 shares have been repurchased under the Stock Repurchase Program through December 31, 2016, leaving a balance of 222,750 shares that may be purchased under the Stock Repurchase Program, as extended.
On February 24, 2017, we completed the acquisition of two branches in Jasper, Georgia from Stearns Bank, N.A. (“Stearns”). In accordance with the Purchase and Assumption Agreement, dated October 19, 2016, by and between us and Stearns, we acquired the bank facilities and certain other assets and assumed approximately $153.0 million of deposits, paying a deposit premium of 3.65%. Following a system conversion the two branches opened as Entegra Bank on February 27, 2017.
Critical Accounting Policies
We consider accounting policies that require management to exercise significant judgment or discretion or make significant assumptions that have, or could have, a material impact on the carrying value of certain assets or on income to be critical accounting policies. Our significant accounting policies are discussed in detail in Note 2 of the Notes to Consolidated Financial Statements included in this Annual Report on Form 10-K.
| 39 |
The JOBS Act contains provisions that, among other things, reduce certain reporting requirements for qualifying public companies. As an “emerging growth company,” we have elected to use the transition period to delay adoption of new or revised accounting pronouncements applicable to public companies until such pronouncements are made applicable to private companies. Accordingly, our financial statements may not be comparable to the financial statements of public companies that comply with such new or revised accounting standards. As of December 31, 2016, there is not a significant difference in the presentation of our financial statements as compared to other public companies as a result of this transition guidance.
We consider the following to be our critical accounting policies.
Allowance for Loan Losses. We maintain an allowance for loan losses at an amount estimated to equal all credit losses inherent in our loan portfolio that are both probable and reasonable to estimate at a balance sheet date. Management’s determination of the adequacy of the allowance is based on evaluations, at least quarterly, of the loan portfolio and other relevant factors. However, this evaluation is inherently subjective, as it requires an estimate of the loss content for each risk rating and for each impaired loan, an estimate of the amounts and timing of expected future cash flows, and an estimate of the value of collateral. Based on our estimate of the level of allowance for loan losses required, we record a provision for loan losses to maintain the allowance for loan losses at an appropriate level.
All loan losses are charged to the allowance for loan losses and all recoveries are credited to it. Additions to the allowance for loan losses are provided by charges to income based on various factors which in our judgment deserve current recognition in estimating probable losses. When any loan or portion thereof is classified “doubtful” or “loss,” the loan will be charged down or charged off against the allowance for loan losses. Loans are deemed “doubtful” or “loss” based on a variety of credit, collateral, documentation and other issues. When collateral is foreclosed or repossessed, any principal charge-off related to that transaction, based upon the most current appraisal or evaluation, along with estimated sales expenses is taken at that time.
The determination of the allowance for loan losses is based on management’s current judgments about the loan portfolio credit quality and management’s consideration of all known relevant internal and external factors that affect loan collectability, as of the reporting date. We cannot predict with certainty the amount of loan charge-offs that will be incurred. We value impaired loans in our portfolio for specific impairment based primarily on appraised values less selling costs or discounted cash flows. We value non-impaired loans based on our historical loss experience within individual loan types. Qualitative and environmental factors are used to account for trends in economic conditions not captured in historical loss experience. In addition, our various regulatory agencies, as part of their examination processes, periodically review our allowance for loan losses. Such agencies may require that we recognize additions to the allowance for loan losses based on their judgments about information available to them at the time of their examination.
Troubled Debt Restructurings (“TDRs”). In accordance with accounting standards, we classify loans as TDRs when certain modifications are made to the loan terms and concessions are granted to borrowers whom we consider to have a defined financial difficulty. A defined financial difficulty includes a deficient global cash flow coverage ratio, a significant decline in a credit score, defaults with creditors and other increases in the borrower’s risk profile that signify the borrower is experiencing financial difficulty. Our practice is to only restructure loans for borrowers in financial difficulty that have designed a viable business plan to fully pay off all outstanding debt, interest and fees post-restructure either by generating additional income from the business or through liquidation of assets. Generally, these loans are restructured to provide the borrower additional time to execute its business plan. With respect to TDRs, we grant concessions by reducing the stated interest rate for a specific time period, providing an interest-only period, or extending the maturity date at a stated interest rate lower than the current market rate for new debt with similar risk.
From time to time, in the normal course of business, we modify the interest rate and/or the amortization period of performing loans upon the request of the borrower. This is often done for competitive reasons in order to retain the borrower’s business. Where the borrower does not have a defined financial difficulty, such modifications are not classified as TDRs. Also, when we receive a material credit enhancement, such as an additional guarantee, additional collateral or a principal curtailment, in exchange for a concession, we may not classify the modification as a TDR.
| 40 |
Impaired loans. A loan is considered impaired when, based on current information and events, it is probable that we will be unable to collect the scheduled payments of principal or interest when due according to the contractual terms of the loan agreement. Factors considered by management in determining impairment include payment status, collateral value, and the probability of collecting scheduled principal and interest payments when due. Management determines the significance of payment delays and payment shortfalls on a case-by-case basis, taking into consideration all of the circumstances surrounding the loan and the borrower, including the length of the delay, the reasons for the delay, the borrower’s prior payment record, and the amount of the shortfall in relation to the principal and interest owed. Impairment is measured on a loan-by-loan basis by either the present value of expected future cash flows discounted at the loan’s effective interest rate, the loan’s obtainable market price, or the fair value of the collateral if the loan is collateral dependent. All TDRs are classified as impaired loans. However, we may also remove a loan from TDR and impaired status if the TDR is subsequently restructured and at the time of the subsequent restructuring the borrower is not experiencing financial difficulties and, under the terms of the subsequent restructuring agreement, no concession has been granted to the borrower.
We monitor collateral values of collateral-dependent impaired loans and periodically update our determination of the fair value of the collateral. Appraisals and evaluations are performed for collateral-dependent impaired loans at least every 12 to 18 months. In determining the fair value of collateral, market values are discounted to take into account typical selling expenses and closing costs if foreclosure of the property is deemed likely. We generally discount current market values by 10% to reflect the typical selling expenses, inclusive of real estate commissions charged on the sale by brokers in our markets. The discount applied for legal fees varies depending on the nature and anticipated complexity of the foreclosure, with a higher discount applied when the foreclosure is expected to be complex.
Evaluations are used predominately for residential-use properties for which market data is readily available or where we have recently liquidated a comparable property in close proximity to the subject real estate. We also use a service comparable to an automated valuation model to support internal evaluations. This service provides subject property and comparable data by compiling public information such as assessed tax values. We generally rely on external appraisers to value more complex income-producing property and other construction and land loans which require discounted cash flow assessments based on more complex market data research than what is normally available to us.
We adjust collateral values if we receive market data or evidence from recent sales of similar properties indicating that the appraised value of the collateral exceeds the value we can reasonably expect to receive upon its sale. Adjustments to increase appraised values are not permitted. We use realtors and market data to estimate the potential deficiency when we suspect the fair value of the collateral is less than the outstanding principal balance on a loan and an updated appraisal has not yet been received.
Deferred Tax Assets. Deferred tax assets and liabilities are recognized for the future tax consequences attributable to differences between the financial statement carrying amounts of existing assets and liabilities and their respective tax bases. Deferred tax assets and liabilities are measured using enacted tax rates expected to apply to taxable income in the years in which those temporary differences are expected to be recovered or settled. The effect of a change in tax rates on our deferred tax assets and liabilities is recognized as income or expense in the period that includes the enactment date. A valuation allowance is required to be recognized if it is more likely than not that a deferred tax asset will not be realized. The determination as to whether we will be able to realize a deferred tax asset is highly subjective and dependent upon judgments concerning our evaluation of both positive and negative evidence, our forecasts of future income, applicable tax planning strategies, and assessments of current and future economic and business conditions. Positive evidence includes the existence of taxes paid in available carryback years as well as the probability that taxable income will be generated in future periods, while negative evidence includes any cumulative losses in the current year and prior two years and general business and economic trends.
| 41 |
Real Estate Owned (“REO”). REO, consisting of properties obtained through foreclosure or through a deed in lieu of foreclosure in satisfaction of loans, is reported at the lower of cost or fair value, determined on the basis of current appraisals, comparable sales, and other estimates of value obtained principally from independent sources. The cost or fair value is then reduced by estimated selling costs. Management also considers other factors, including changes in absorption rates, length of time a property has been on the market and anticipated sales values, which may result in adjustments to the collateral value estimates. At the time of foreclosure or initial possession of collateral, any excess loan balance over the fair value of the REO is treated as a charge against the allowance for loan losses.
Subsequent declines in the fair value of REO below the new cost basis are recorded through valuation adjustments. Significant judgments and complex estimates are required in estimating the fair value of REO, and the period of time within which such estimates can be considered current is significantly shortened during periods of market volatility. In response to market conditions and other economic factors, management may utilize liquidation sales as part of its problem asset disposition strategy. As a result of the significant judgments required in estimating fair value and the variables involved in different methods of disposition, the net proceeds realized from sales transactions could differ significantly from appraisals, comparable sales, and other estimates used to determine the fair value of REO. Management reviews the value of REO each quarter and adjusts the values as appropriate. Appraisals are obtained no less frequently than every 12 to 18 months. Any subsequent adjustments to the value, gains or losses on sales, and REO expenses are recorded in “Net cost of operation of real estate owned” which is a component of noninterest expense.
Stock-based Compensation. We account for stock-based compensation in accordance with ASC 718, Compensation-Stock Compensation. Under ASC 718, stock-based compensation expense reflects the fair value of stock-based awards measured at grant date, is recognized over the relevant vesting period on a straight-line basis, and adjusted each period for anticipated forfeitures. Stock-based compensation is recognized only for awards that vest, and our periodic accrual of compensation cost is based on the estimated number of awards expected to vest. We measure the fair value of compensation cost related to restricted stock awards based on the closing market price of our common stock on the grant date.
Tax benefits realized upon the vesting of restricted shares that exceed the expense previously recognized for reporting purposes are recorded through the income statement as income tax benefit. If the tax benefit upon vesting is less than the expense previously recorded, the shortfall is recorded through the income statement as income tax expense.
Comparison of Financial Condition at December 31, 2016 and 2015
Total assets increased $261.5 million, or 25.3%, to $1.29 billion at December 31, 2016 from $1.03 billion at December 31, 2015. Excluding assets totaling $110.0 million acquired from Old Town Bank in the second quarter of 2016, we experienced organic growth in 2016 of $151.5 million, or 14.7%, as we continued to leverage our capital with loans and investment securities.
Total liabilities increased $259.9 million, or 28.9%, to $1.2 billion at December 31, 2016 from $899.9 million at December 31, 2015, due primarily to the $145.0 million increase in FHLB advances and $113.4 million increase in deposits including $88.7 million assumed in the Old Town Bank acquisition.
Total equity increased $1.6 million, or 1.2%, to $133.1 million at December 31, 2016 from $131.5 million at December 31, 2015. This 2016 increase was primarily attributable to $6.4 million of net income and $0.9 million of stock-based compensation, partially offset by a $3.7 million decline in the market value of investment securities and $1.9 million of share repurchases.
Cash and Cash Equivalents
Total cash and cash equivalents increased $2.6 million, or 6.5%, to $43.3 million at December 31, 2016 from $40.7 million at December 31, 2015. We continue to hold adequate levels of liquid and short-term assets.
| 42 |
Loans
The following table presents our loan portfolio composition and the corresponding percentage of total loans as of the dates indicated. Other construction and land loans include residential acquisition and development loans, commercial undeveloped land and one-to-four family improved and unimproved lots. Commercial real estate includes non-residential owner occupied and non-owner occupied real estate, multi-family, and owner-occupied investment property. Commercial business loans include unsecured commercial loans and commercial loans secured by business assets.
| December 31, | ||||||||||||||||||||||||||||||||||||||||
| 2016 | 2015 | 2014 | 2013 | 2012 | ||||||||||||||||||||||||||||||||||||
| (Dollars in thousands) | Balance | Percent | Balance | Percent | Balance | Percent | Balance | Percent | Balance | Percent | ||||||||||||||||||||||||||||||
| Real estate loans: | ||||||||||||||||||||||||||||||||||||||||
| One- to four-family residential | $ | 278,437 | 37.3 | % | $ | 248,633 | 39.7 | % | $ | 227,209 | 41.8 | % | $ | 225,520 | 43.1 | % | $ | 227,726 | 40.5 | % | ||||||||||||||||||||
| Commercial | 292,879 | 39.2 | 214,413 | 34.2 | 179,435 | 33.0 | 155,633 | 29.7 | 173,529 | 30.8 | ||||||||||||||||||||||||||||||
| Home equity loans and lines of credit | 50,334 | 6.7 | 53,446 | 8.5 | 56,561 | 10.4 | 56,836 | 10.9 | 62,090 | 11.0 | ||||||||||||||||||||||||||||||
| Residential construction | 18,531 | 2.5 | 7,848 | 1.3 | 7,823 | 1.4 | 8,952 | 1.7 | 10,309 | 1.8 | ||||||||||||||||||||||||||||||
| Other construction and land | 60,605 | 8.1 | 57,316 | 9.1 | 50,298 | 9.3 | 64,927 | 12.4 | 76,788 | 13.6 | ||||||||||||||||||||||||||||||
| Commercial | 41,306 | 5.5 | 41,046 | 6.6 | 19,135 | 3.5 | 8,285 | 1.6 | 9,771 | 1.8 | ||||||||||||||||||||||||||||||
| Consumer | 4,594 | 0.7 | 3,639 | 0.6 | 3,200 | 0.6 | 3,654 | 0.7 | 2,676 | 0.5 | ||||||||||||||||||||||||||||||
| Total loans, gross | 746,686 | 100 | % | 626,341 | 100 | % | 543,661 | 100 | % | 523,807 | 100 | % | 562,889 | 100 | % | |||||||||||||||||||||||||
| Less: Net deferred loan fees | (923 | ) | (1,388 | ) | (1,695 | ) | (1,933 | ) | (2,165 | ) | ||||||||||||||||||||||||||||||
| Fair value discount | (857 | ) | (72 | ) | — | — | — | |||||||||||||||||||||||||||||||||
| Unamortized premium | 605 | 557 | — | — | — | |||||||||||||||||||||||||||||||||||
| Unamortized discount | (1,150 | ) | (1,366 | ) | (1,487 | ) | — | — | ||||||||||||||||||||||||||||||||
| Total loans, net | $ | 744,361 | $ | 624,072 | $ | 540,479 | $ | 521,874 | $ | 560,724 | ||||||||||||||||||||||||||||||
| Percentage of total assets | 57.6 | % | 60.5 | % | 59.8 | % | 66.5 | % | 72.8 | % | ||||||||||||||||||||||||||||||
In mid-2007, as economic conditions began to deteriorate, management recognized the need to reduce our concentration in higher risk loans, especially other construction and land development loans. Since then we have continued to reduce the concentration in other construction and land loans. As of December 31, 2016, other construction and land loans had fallen to 8.1% of total loans, compared to 13.6% as of December 31, 2012. Reductions have been achieved through payoffs of maturing loans, controlled loan originations, and foreclosure of non-performing loans.
Prior to 2014, our loan portfolio declined due to a number of factors including: (i) management’s desire to reduce the loan portfolio due to capital limitations during that period; (ii) weak market conditions and soft loan demand from qualified borrowers; and (iii) an increased rate of foreclosures and charge-offs. During 2014, we began to experience moderate growth in loan demand within our primary market area which continued in 2015 and 2016. During 2016, net loans increased $120.3 million, or 19.3%, to $744.4 million at December 31, 2016 compared to $624.1 million at December 31, 2015, positively impacted by the Old Town Bank acquisition which accounted for $64.8 million of loans.
Our loan growth has also been enhanced by our new loan production offices in Clemson, SC and Asheville, NC and the hiring of additional commercial lenders. We believe that economic conditions in our primary market area are continuing to improve, albeit at a moderate pace, and that these improving conditions are contributing to an increase in loan demand. The amount of commercial real estate loans as a percentage of total loans continues to increase as we continue to shift our lending focus to these loan types as we develop stronger commercial relationships in all of our markets.
Included in loans receivable and other borrowings at December 31, 2016 are $2.7 million in participated loans that did not qualify for sale accounting. Interest expense on the other borrowings accrues at the same rate as the interest income recognized on the loans receivable, resulting in no effect to net income.
As of December 31, 2016, our largest lending relationship was with a local municipality located in our primary market area. As of December 31, 2016, the borrower had an outstanding principal loan balance of $9.3 million. The loan is collateralized by a special obligation bond and was performing as of December 31, 2016. The next nine largest lending relationships accounted for 44 loans and had an aggregate principal loan balance of $62.1 million as of December 31, 2016. All of the loans within these nine relationships were performing as of December 31, 2016.
| 43 |
Maturities and Sensitivity of Loans to Changes in Interest Rates
The information in the following table is based on the contractual maturities of individual loans, including loans which may be subject to renewal at their contractual maturity. Renewal of such loans is subject to the same credit approval and underwriting standards as new loans, and the terms of the loan may be modified upon renewal. Actual repayments of loans may differ from the maturities reflected below because borrowers have the right to prepay obligations with or without prepayment penalties.
| December 31, 2016 | ||||||||||||||||
| (Dollars in thousands) | One year or less | Over one year to five years | Over five years | Total | ||||||||||||
| Real estate loans: | ||||||||||||||||
| One- to four-family residential | $ | 4,250 | $ | 24,387 | $ | 249,800 | $ | 278,437 | ||||||||
| Commercial | 16,928 | 66,136 | 209,815 | 292,879 | ||||||||||||
| Home equity loans and lines of credit | 3,801 | 19,269 | 27,264 | 50,334 | ||||||||||||
| Residential construction | 8,151 | 4,381 | 5,999 | 18,531 | ||||||||||||
| Other construction and land | 7,709 | 23,182 | 29,714 | 60,605 | ||||||||||||
| Commercial | 4,298 | 16,495 | 20,513 | 41,306 | ||||||||||||
| Consumer | 133 | 3,214 | 1,247 | 4,594 | ||||||||||||
| Total loans, gross | $ | 45,270 | $ | 157,064 | $ | 544,352 | $ | 746,686 | ||||||||
Longer term one-to-four family residential, construction, commercial real estate, and home equity loans and lines of credit typically carry interest rates which adjust to U.S. Treasury indices or The Wall Street Journal Prime Rate. Longer term one-to-four family residential construction loans represent construction-permanent loans which, upon completion of the construction phase, become one-to-four family residential real estate loans.
The following table sets forth the dollar amount of all loans at December 31, 2016 that have contractual maturities after December 31, 2017 and have either fixed interest rates or floating or adjustable interest rates. The amounts shown below exclude unearned loan origination fees.
| December 31, 2016 | ||||||||||||
| (Dollars in thousands) | Fixed | Floating or adjustable | Total | |||||||||
| Real estate loans: | ||||||||||||
| One- to four-family residential | $ | 122,297 | $ | 151,890 | $ | 274,187 | ||||||
| Commercial | 105,304 | 170,647 | 275,951 | |||||||||
| Home equity loans and lines of credit | 5,714 | 40,819 | 46,533 | |||||||||
| Residential construction | 6,238 | 4,142 | 10,380 | |||||||||
| Other construction and land | 27,502 | 25,394 | 52,896 | |||||||||
| Commercial | 20,953 | 16,055 | 37,008 | |||||||||
| Consumer | 4,220 | 241 | 4,461 | |||||||||
| Total | $ | 292,228 | $ | 409,188 | $ | 701,416 | ||||||
| 44 |
Delinquent Loans
When a loan becomes 15 days past due, we contact the borrower to inquire as to why the loan is past due. When a loan becomes 30 days or more past due, we increase collection efforts to include all available forms of communication. Once a loan becomes 45 days past due, we generally issue a demand letter and further explore the reasons for non-repayment, discuss repayment options, and inspect the collateral. In the event the loan officer or collections staff has reason to believe restructuring will be mutually beneficial to the borrower and the Bank, the borrower will be referred to the Bank’s Credit Administration staff to explore restructuring alternatives to foreclosure. Once the demand period has expired and it has been determined that restructuring is not a viable option, the Bank’s counsel is instructed to pursue foreclosure.
The accrual of interest on loans is discontinued at the time a loan becomes 90 days delinquent or when it becomes impaired, whichever occurs first, unless the loan is well secured and in the process of collection. All interest accrued but not collected for loans that are placed on nonaccrual is reversed. Interest payments received on nonaccrual loans are generally applied as a direct reduction to the principal outstanding until the loan is returned to accrual status. Interest payments received on nonaccrual loans may be recognized as income on a cash basis if recovery of the remaining principal is reasonably assured. Loans are returned to accrual status when all the principal and interest amounts contractually due are brought current and future payments are reasonably assured. Interest payments applied to principal while the loan was on nonaccrual may be recognized in income over the remaining life of the loan after the loan is returned to accrual status.
If a loan is modified in a TDR, the loan is generally placed on non-accrual until there is a period of satisfactory payment performance by the borrower (either immediately before or after the restructuring), generally six consecutive months, and the ultimate collectability of all amounts contractually due is not in doubt.
The following table sets forth certain information with respect to our loan portfolio delinquencies at the dates indicated. We had no loans past due 90 days or more that are still accruing interest at December 31, 2016.
| 45 |
| Delinquent loans | ||||||||||||||||
| 30-59 Days | 60-89 Days | 90 Days and over | Total | |||||||||||||
| (Dollars in thousands) | ||||||||||||||||
| At December 31, 2016 | ||||||||||||||||
| Real estate loans: | ||||||||||||||||
| One- to four-family residential | $ | 4,931 | $ | 1,116 | $ | 554 | $ | 6,601 | ||||||||
| Commercial | 1,383 | 1,800 | 1,681 | 4,864 | ||||||||||||
| Home equity loans and lines of credit | 126 | 44 | 233 | 403 | ||||||||||||
| One- to four-family residential construction | 180 | — | — | 180 | ||||||||||||
| Other construction and land | 467 | — | 919 | 1,386 | ||||||||||||
| Commercial | 368 | — | — | 368 | ||||||||||||
| Consumer | 62 | 1 | — | 63 | ||||||||||||
| Total loans | $ | 7,517 | $ | 2,961 | $ | 3,387 | $ | 13,865 | ||||||||
| % of total loans, net | 1.01 | % | 0.40 | % | 0.45 | % | 1.86 | % | ||||||||
| At December 31, 2015 | ||||||||||||||||
| Real estate loans: | ||||||||||||||||
| One- to four-family residential | $ | 5,610 | $ | 1,260 | $ | 1,205 | $ | 8,075 | ||||||||
| Commercial | 1,585 | — | 605 | 2,190 | ||||||||||||
| Home equity loans and lines of credit | 369 | 38 | 322 | 729 | ||||||||||||
| One- to four-family residential construction | — | — | — | — | ||||||||||||
| Other construction and land | 208 | 397 | 138 | 743 | ||||||||||||
| Commercial | 625 | — | — | 625 | ||||||||||||
| Consumer | 12 | 4 | — | 16 | ||||||||||||
| Total loans | $ | 8,409 | $ | 1,699 | $ | 2,270 | $ | 12,378 | ||||||||
| % of total loans, net | 1.35 | % | 0.27 | % | 0.36 | % | 1.98 | % | ||||||||
| At December 31, 2014 | ||||||||||||||||
| Real estate loans: | ||||||||||||||||
| One- to four-family residential | $ | 6,298 | $ | 448 | $ | 2,669 | $ | 9,415 | ||||||||
| Commercial | 2,136 | 909 | 1,006 | 4,051 | ||||||||||||
| Home equity loans and lines of credit | 557 | 528 | 759 | 1,844 | ||||||||||||
| One- to four-family residential construction | — | — | 65 | 65 | ||||||||||||
| Other construction and land | 1,530 | 964 | 473 | 2,967 | ||||||||||||
| Commercial | — | 22 | — | 22 | ||||||||||||
| Consumer | 247 | 4 | 1 | 252 | ||||||||||||
| Total loans | $ | 10,768 | $ | 2,875 | $ | 4,973 | $ | 18,616 | ||||||||
| % of total loans, net | 1.99 | % | 0.53 | % | 0.92 | % | 3.44 | % | ||||||||
| At December 31, 2013 | ||||||||||||||||
| Real estate loans: | ||||||||||||||||
| One- to four-family residential | $ | 5,539 | $ | 669 | $ | 2,587 | $ | 8,795 | ||||||||
| Commercial | 4,746 | 53 | 722 | 5,521 | ||||||||||||
| Home equity loans and lines of credit | 313 | 29 | 350 | 692 | ||||||||||||
| One- to four-family residential construction | 120 | — | — | 120 | ||||||||||||
| Other construction and land | 499 | 185 | 970 | 1,654 | ||||||||||||
| Commercial | — | 35 | — | 35 | ||||||||||||
| Consumer | 18 | 9 | — | 27 | ||||||||||||
| Total loans | $ | 11,235 | $ | 980 | $ | 4,629 | $ | 16,844 | ||||||||
| % of total loans, net | 2.15 | % | 0.19 | % | 0.89 | % | 3.23 | % | ||||||||
| At December 31, 2012 | ||||||||||||||||
| Real estate loans: | ||||||||||||||||
| One- to four-family residential | $ | 5,903 | $ | 1,510 | $ | 4,018 | $ | 11,431 | ||||||||
| Commercial | 7,178 | 1,783 | 2,372 | 11,333 | ||||||||||||
| Home equity loans and lines of credit | 359 | 576 | 785 | 1,720 | ||||||||||||
| One- to four-family residential construction | — | 302 | 194 | 496 | ||||||||||||
| Other construction and land | 1,141 | 136 | 6,234 | 7,511 | ||||||||||||
| Commercial | 55 | — | 12 | 67 | ||||||||||||
| Consumer | 15 | — | — | 15 | ||||||||||||
| Total loans | $ | 14,651 | $ | 4,307 | $ | 13,615 | $ | 32,573 | ||||||||
| % of total loans, net | 2.61 | % | 0.77 | % | 2.43 | % | 5.81 | % | ||||||||
| 46 |
Total delinquencies as a percentage of net loans have decreased from 5.81% at December 31, 2012 to 1.86% at December 31, 2016, representing a decrease of 68.7% over the period. Loans past due 90 days and over and on non-accrual have experienced a greater decline, decreasing from 2.43% at December 31, 2012, to 0.45% at December 31, 2016, a decrease of 82.7% over the period. The decrease in delinquencies is consistent with the improving economic health of our primary market area.
Non-Performing Assets
Non-performing loans include all loans past due 90 days and over, certain impaired loans (some of which may be contractually current), and TDR loans that have not yet established a satisfactory period of payment performance (some of which may be contractually current). Non-performing assets include non-performing loans and REO. The table below sets forth the amounts and categories of our non-performing assets as of the dates indicated.
| December 31, | ||||||||||||||||||||
| 2016 | 2015 | 2014 | 2013 | 2012 | ||||||||||||||||
| (Dollars in thousands) | ||||||||||||||||||||
| Non-accrual loans: | ||||||||||||||||||||
| Real estate loans: | ||||||||||||||||||||
| One- to four-family residential | $ | 1,125 | $ | 2,893 | $ | 5,661 | $ | 2,794 | $ | 5,367 | ||||||||||
| Commercial | 3,536 | 3,628 | 7,011 | 10,212 | 4,664 | |||||||||||||||
| Home equity loans and lines of credit | 250 | 320 | 1,347 | 350 | 852 | |||||||||||||||
| Residential construction | — | — | 65 | — | 655 | |||||||||||||||
| Other construction and land | 1,042 | 384 | 2,679 | 2,068 | 6,176 | |||||||||||||||
| Commercial | 41 | 55 | 15 | 190 | 12 | |||||||||||||||
| Consumer | 47 | — | 2 | 13 | 1 | |||||||||||||||
| Total non-performing loans | 6,041 | 7,280 | 16,780 | 15,627 | 17,727 | |||||||||||||||
| REO: | ||||||||||||||||||||
| One- to four-family residential | 1,336 | 1,384 | 220 | 1,076 | 3,779 | |||||||||||||||
| Commercial | 722 | 1,123 | 774 | 2,988 | 5,049 | |||||||||||||||
| Residential construction | — | — | — | 210 | 1,176 | |||||||||||||||
| Other construction and land | 2,168 | 2,862 | 3,431 | 6,232 | 9,751 | |||||||||||||||
| Total foreclosed real estate | 4,226 | 5,369 | 4,425 | 10,506 | 19,755 | |||||||||||||||
| Total non-performing assets | $ | 10,267 | $ | 12,649 | $ | 21,205 | $ | 26,133 | $ | 37,482 | ||||||||||
| Troubled debt restructurings still accruing | $ | 9,882 | $ | 11,206 | $ | 18,760 | $ | 23,015 | $ | 21,408 | ||||||||||
| Ratios: | ||||||||||||||||||||
| Non-performing loans to total loans | 0.81 | % | 1.17 | % | 3.10 | % | 2.99 | % | 3.16 | % | ||||||||||
| Non-performing assets to total assets | 0.79 | % | 1.23 | % | 2.35 | % | 3.33 | % | 4.87 | % | ||||||||||
Non-performing loans as a percentage of total loans decreased from 3.16% at December 31, 2012, to 0.81% at December 31, 2016, representing a decrease of 74.4% over the period. Similarly, non-performing assets as a percentage of total assets decreased from 4.87% at December 31, 2012, to 0.80% at December 31, 2016, representing a decrease of 83.6% over the period. This decrease in non-performing loans and non-performing assets is due to a combination of the improving economy and the Bank’s aggressive resolution and disposal of non-performing loans and non-performing assets by means of restructure, foreclosure, deed in lieu of foreclosure and short sales for less than the amount of the indebtedness, in which cases the deficiency is charged-off.
Non-performing loans decreased $1.2 million, or 16.7%, to $6.0 million at December 31, 2016 compared to $7.3 million at December 31, 2015. This decrease in non-performing loans is attributable to loan payoffs, transfers to REO, charge-offs, and the return of loans to accrual status upon the determination that ultimate collectability of all amounts contractually due is not in doubt.
| 47 |
REO decreased $1.1 million, or 21.3%, to $4.2 million at December 31, 2016 from $5.4 million at December 31, 2015. Most of the transfers to REO during 2016 were one-to-four family residential properties which are normally sold at a faster pace than other property types. We have experienced a significant decrease in the number and dollar amount of additions to REO and have had moderate success in liquidating the properties. Our policy continues to be to aggressively market REO for sale, including recording write-downs when necessary.
Troubled Debt Restructurings (“TDRs”)
In situations where, for economic or legal reasons related to a borrower’s financial difficulties, we grant a concession that we would not otherwise consider, for other than an insignificant period of time, the related loan is classified as a TDR. We strive to identify borrowers in financial difficulty early so that we may work with them to modify their loans before they reach nonaccrual status. Modified terms generally include extensions of maturity dates at a stated interest rate lower than the current market rate for a new loan with similar risk characteristics, reductions in contractual interest rates, periods of interest-only payments, and principal deferments. While unusual, there may be instances of forgiveness of loan principal. We individually evaluate all substandard loans that experienced a modification of terms to determine if a TDR has occurred.
All TDRs are considered to be impaired loans and are reported as such for the remaining life of the loan, unless the restructuring agreement specifies an interest rate equal to or greater than the rate that would be accepted at the time of the restructuring for a new loan with comparable risk and the ultimate collectability of all amounts contractually due is not in doubt. We may also remove a loan from TDR and impaired status if the TDR is subsequently restructured and at the time of the subsequent restructuring the borrower is not experiencing financial difficulties and, under the terms of the subsequent restructuring agreement, no concession has been granted to the borrower.
The following table presents our TDRs by accrual status as of the dates indicated.
| December 31, | ||||||||
| (Dollars in thousands) | 2016 | 2015 | ||||||
| TDRs still accruing interest | $ | 9,882 | $ | 11,206 | ||||
| TDRs not accruing interest | 2,782 | 3,395 | ||||||
| Total TDRs | $ | 12,664 | $ | 14,601 | ||||
As noted in the above table, the majority of our borrowers with restructured loans have been able to comply with the revised payment terms for at least six consecutive months, resulting in their respective loans being restored to accrual status.
The following table presents details of TDRs made in each of the periods indicated:
| Year Ended December 31, | Modification Type | Number of TDR Loans | Pre-Modification Recorded Investment | Post-Modification Recorded Investment | |||||||||||
| (Dollars in thousands) | |||||||||||||||
| 2016 | None | — | $ | — | $ | — | |||||||||
| 2015 | Forgiveness of principal | 1 | $ | 1,988 | $ | 1,693 | |||||||||
| Extended payment terms | 1 | 833 | 833 | ||||||||||||
| Total | 2 | $ | 2,821 | $ | 2,526 | ||||||||||
| 2014 | Interest rate concessions | 6 | $ | 968 | $ | 875 | |||||||||
| Extended payment terms | 10 | 7,508 | 5,940 | ||||||||||||
| Total | 16 | $ | 8,476 | $ | 6,815 | ||||||||||
| 48 |
During 2016, we continued to be proactive in working with borrowers to identify potential issues and restructure certain loans to prevent future losses.
Classification of Loans
Our policies, consistent with regulatory guidelines, provide for the classification of loans and other assets that are considered to be of lesser quality including “substandard,” “doubtful”, or “loss.” An asset is considered “substandard” if it displays an identifiable weakness without appropriate mitigating factors where there is the distinct possibility that we will sustain some loss if deficiencies are not corrected. “Substandard” loans may include some deterioration in repayment capacity and/or loan-to-value of underlying collateral. Assets classified as “doubtful” have all of the weaknesses inherent in those classified “substandard,” with the added characteristic that collection in full is highly questionable or improbable. Assets classified as “loss” are those considered uncollectible and of such little value that their continuance as assets is not warranted. Assets that do not expose us to risk sufficient to warrant classification in one of the aforementioned categories, but which possess potential weaknesses that deserve our close attention, are designated as “special mention.”
We maintain an allowance for loan losses at an amount estimated to equal all credit losses incurred in our loan portfolio that are both probable and reasonable to estimate at the balance sheet date. We review our asset portfolio no less frequently than quarterly to determine whether any assets require classification in accordance with applicable regulatory guidelines.
The following table sets forth amounts of classified and criticized loans at the dates indicated. As indicated in the table, loans classified as “doubtful” or “loss” are charged off immediately.
| December 31, | ||||||||||||||||||||
| 2016 | 2015 | 2014 | 2013 | 2012 | ||||||||||||||||
| (Dollars in thousands) | ||||||||||||||||||||
| Classified loans: | ||||||||||||||||||||
| Substandard | $ | 12,353 | $ | 19,196 | $ | 31,205 | $ | 47,019 | $ | 58,864 | ||||||||||
| Doubtful | — | — | — | — | — | |||||||||||||||
| Loss | — | — | — | — | — | |||||||||||||||
| Total classified loans | 12,353 | 19,196 | 31,205 | 47,019 | 58,864 | |||||||||||||||
| As a % of total loans | 1.65 | % | 3.08 | % | 5.77 | % | 9.01 | % | 10.50 | % | ||||||||||
| Special mention | 17,158 | 19,195 | 31,283 | 37,670 | 61,698 | |||||||||||||||
| Total criticized loans | $ | 29,511 | $ | 38,391 | $ | 62,488 | $ | 84,689 | $ | 120,562 | ||||||||||
| As a % of total loans | 3.95 | % | 6.15 | % | 11.56 | % | 16.23 | % | 21.50 | % | ||||||||||
Total classified loans decreased $6.8 million, or 35.6%, to $12.4 million at December 31, 2016 from $19.2 million at December 31, 2015. Total criticized loans decreased $8.9 million, or 23.1%, to $29.5 million at December 31, 2016 from $38.4 million at December 31, 2015. The reductions since 2012 reflect an improving economy and an increasing number of criticized loans being paid off or upgraded as a consequence of improvements in our borrowers’ cash flows and payment performance. Management continues to dedicate significant resources toward monitoring and resolving classified and criticized loans.
Management continuously monitors non-performing, classified and past due loans to identify any deterioration in the condition of these loans. As of December 31, 2016, we had not identified any potential problem loans that we did not already classify as non-performing.
| 49 |
Allowance for Loan Losses
The allowance for loan losses reflects our estimates of probable losses inherent in our loan portfolio at the balance sheet date. The allowance for loan losses is evaluated on a regular basis by management and is based upon management’s periodic review of the collectability of our loans in light of historical experience, the nature and volume of our loan portfolio, adverse situations that may affect our borrowers’ abilities to repay, the estimated value of any underlying collateral and prevailing economic conditions. This evaluation is inherently subjective as it requires estimates that are susceptible to significant revision as more information becomes available. The methodology for determining the allowance for loan losses has two main components: the evaluation of individual loans for impairment and the evaluation of certain groups of homogeneous loans with similar risk characteristics.
A loan is considered impaired when it is probable that we will be unable to collect all principal and interest payments due according to the original contractual terms of the loan. We individually evaluate loans classified as “substandard” or nonaccrual and greater than $350,000 for impairment. If the impaired loan is considered collateral dependent, a charge-off is taken based upon the appraised value of the property (less an estimate of selling costs if foreclosure or sale of the property is anticipated). If the impaired loan is not collateral dependent, a specific reserve is established based upon an estimate of the future discounted cash flows after consideration of modifications and the likelihood of future default and prepayment.
The allowance for homogenous loans consists of a base loss reserve and a qualitative reserve. The base loss reserve utilizes an average loss rate for the last 16 quarters. Prior to the first quarter of 2015, we more heavily weighted the most recent four quarters than the least recent four quarters. Beginning in the first quarter of 2015, we no longer weight any quarters to calculate our average loss rates. This change in weighting did not have a material impact on our allowance for loan losses methodology. The loss rates for the base loss reserve are segmented into 13 loan categories and contain loss rates ranging from approximately 0.50% to 5.45%.
The qualitative reserve adjusts the weighted average loss rates utilized in the base loss reserve for trends in the following internal and external factors:
| • | Non-accrual and classified loans |
| • | Collateral values |
| • | Loan concentrations |
| • | Economic conditions – including unemployment rates, building permits, and a regional economic index. |
Qualitative reserve adjustment factors are decreased for favorable trends and increased for unfavorable trends. These factors are subject to further adjustment as economic and other conditions change.
| 50 |
The following table presents the activity in and balances of our allowance for loan losses as of and for the periods indicated:
| As of or for the Year Ended December 31, | ||||||||||||||||||||
| 2016 | 2015 | 2014 | 2013 | 2012 | ||||||||||||||||
| ( Dollars in thousands) | ||||||||||||||||||||
| Balance at beginning of period | $ | 9,461 | $ | 11,072 | $ | 14,251 | $ | 14,874 | $ | 16,710 | ||||||||||
| Charge-offs: | ||||||||||||||||||||
| Real Estate: | ||||||||||||||||||||
| One- to four-family residential | 133 | 536 | 702 | 1,283 | 2,511 | |||||||||||||||
| Commercial | 431 | 52 | 2,415 | 2,209 | 1,850 | |||||||||||||||
| Home equity loans and lines of credit | 158 | 540 | 598 | 760 | 1,617 | |||||||||||||||
| One- to four-family residential construction | — | — | — | 193 | 391 | |||||||||||||||
| Other construction and land | 560 | 137 | 566 | 1,512 | 4,151 | |||||||||||||||
| Commercial | 63 | 9 | 133 | 17 | 295 | |||||||||||||||
| Consumer | 201 | 48 | 140 | 675 | 821 | |||||||||||||||
| Total charge-offs | 1,546 | 1,322 | 4,554 | 6,649 | 11,636 | |||||||||||||||
| Recoveries: | ||||||||||||||||||||
| Real Estate: | ||||||||||||||||||||
| One- to four-family residential | 77 | 259 | 193 | 433 | 479 | |||||||||||||||
| Commercial | 173 | 168 | 364 | 125 | 249 | |||||||||||||||
| Home equity loans and lines of credit | 224 | 104 | 41 | 22 | 107 | |||||||||||||||
| One- to four-family residential construction | 32 | 3 | — | 111 | 51 | |||||||||||||||
| Other construction and land | 130 | 342 | 218 | 539 | 642 | |||||||||||||||
| Commercial | 144 | 32 | 163 | 31 | 124 | |||||||||||||||
| Consumer | 336 | 303 | 363 | 407 | 270 | |||||||||||||||
| Total recoveries | 1,116 | 1,211 | 1,342 | 1,668 | 1,922 | |||||||||||||||
| Net charge-offs | 430 | 111 | 3,212 | 4,981 | 9,714 | |||||||||||||||
| Provision for loan losses | 274 | (1,500 | ) | 33 | 4,358 | 7,878 | ||||||||||||||
| Balance at end of period | $ | 9,305 | $ | 9,461 | $ | 11,072 | $ | 14,251 | $ | 14,874 | ||||||||||
| Ratios: | ||||||||||||||||||||
| Net charge-offs to average loans outstanding | 0.06 | % | 0.02 | % | 0.60 | % | 0.93 | % | 1.66 | % | ||||||||||
| Allowance to non-performing loans at period end | 154.03 | % | 129.96 | % | 65.98 | % | 91.19 | % | 83.91 | % | ||||||||||
| Allowance to total loans at period end | 1.25 | % | 1.52 | % | 2.05 | % | 2.73 | % | 2.65 | % | ||||||||||
As indicated in the above table, our net charge-offs to average loans have declined from 1.66% for the year ended December 31, 2012, to 0.06% for the year ended December 31, 2016, representing a decrease of 96.4% over the period. The reduction in net charge-offs is attributable to the continued improvement in quality of our loan portfolio and the continued collection of payments on loans previously charged-off.
Our nonperforming loan coverage ratio has continued to increase since 2012. The increase in our coverage ratio is mainly attributable to the reduction in nonperforming loans of $11.7 million, or 65.9%, to $6.0 million at December 31, 2016 from $17.7 million at December 31, 2012.
Our allowance as a percentage of total loans decreased to 1.25% at December 31, 2016 from 1.52% at December 31, 2015. The historical loss rates used in our allowance for loan losses calculation continue to decline as previous quarters with larger loss rates are eliminated from the calculation as time passes.
| 51 |
Allocation of Allowance for Loan Losses
The table below summarizes the allowance for loan losses balance and percent of total loans by loan category.
| December 31, | ||||||||||||||||||||||||||||||||||||||||
| 2016 | 2015 | 2014 | 2013 | 2012 | ||||||||||||||||||||||||||||||||||||
| Allowance | %
of Loans to Total Loans | Allowance | %
of Loans to Total Loans | Allowance | %
of Loans to Total Loans | Allowance | %
of Loans to Total Loans | Allowance | %
of Loans to Total Loans | |||||||||||||||||||||||||||||||
| (Dollars in thousands) | ||||||||||||||||||||||||||||||||||||||||
| Real estate loans: | ||||||||||||||||||||||||||||||||||||||||
| One- to four-family residential | $ | 2,812 | 37.2 | % | $ | 2,455 | 39.7 | % | $ | 2,983 | 41.8 | % | $ | 3,693 | 43.1 | % | $ | 4,620 | 40.5 | % | ||||||||||||||||||||
| Commercial | 3,979 | 39.3 | 3,221 | 34.2 | 2,717 | 33.0 | 4,360 | 29.7 | 2,973 | 30.8 | ||||||||||||||||||||||||||||||
| Home equity loans and lines of credit | 677 | 6.7 | 1,097 | 8.5 | 1,333 | 10.4 | 1,580 | 10.9 | 2,002 | 11.0 | ||||||||||||||||||||||||||||||
| One- to four-family residential construction | 185 | 2.5 | 278 | 1.3 | 510 | 1.4 | 501 | 1.7 | 429 | 1.8 | ||||||||||||||||||||||||||||||
| Other construction and land | 848 | 8.0 | 1,400 | 9.1 | 2,936 | 9.3 | 3,516 | 12.4 | 4,059 | 13.6 | ||||||||||||||||||||||||||||||
| Commercial business | 599 | 5.6 | 603 | 6.6 | 308 | 3.5 | 336 | 1.6 | 379 | 1.8 | ||||||||||||||||||||||||||||||
| Consumer | 205 | 0.7 | 407 | 0.6 | 285 | 0.6 | 265 | 0.7 | 412 | 0.5 | ||||||||||||||||||||||||||||||
| Total | $ | 9,305 | 100 | % | $ | 9,461 | 100 | % | $ | 11,072 | 100 | % | $ | 14,251 | 100 | % | $ | 14,874 | 100 | % | ||||||||||||||||||||
We compute our allowance either through a specific allowance to individually impaired loans or through a general allowance applied to homogeneous loans by loan type. The above allocation represents the allocation of the allowance by loan type regardless of specific or general calculations. The largest allocation has been made to one-to-four family, commercial real estate, and other construction and land as a result of the elevated risk in those categories of loans.
The table below summarizes balances, charge-offs, and specific allowances related to impaired loans as of the dates indicated.
| As of December 31, | Recorded Balance | Unpaid Principal Balance | Partial Charge- Offs | Specific Allowance | % of Specific Allowance & Partial Charge-off to Unpaid Principal Balance | |||||||||||||||
| (Dollars in thousands) | ||||||||||||||||||||
| 2016 | ||||||||||||||||||||
| Loans without a valuation allowance | $ | 9,770 | $ | 11,672 | $ | 1,902 | $ | — | 16.3 | % | ||||||||||
| Loans with a valuation allowance | 4,536 | 4,536 | — | 584 | 12.9 | |||||||||||||||
| Total | $ | 14,306 | $ | 16,208 | $ | 1,902 | $ | 584 | 15.3 | % | ||||||||||
| 2015 | ||||||||||||||||||||
| Loans without a valuation allowance | $ | 12,386 | $ | 14,358 | $ | 1,973 | $ | — | 13.7 | % | ||||||||||
| Loans with a valuation allowance | 5,082 | 5,082 | — | 510 | 10.0 | |||||||||||||||
| Total | $ | 17,468 | $ | 19,440 | $ | 1,973 | $ | 510 | 12.8 | % | ||||||||||
As indicated in the above table, during the periods presented, we have consistently maintained between 10.0% and 16.0% of impaired loans in a reserve, either through a direct charge-off or in a specific reserve included as part of the allowance for loan losses. The total dollar amount of impaired loans decreased $3.8 million, or 21.7%, to $14.3 million at December 31, 2016 compared to $17.5 million at December 31, 2015. The decrease in impaired loans is attributable to loan payoffs, transfers to REO, charge-offs, and the return of loans to non-impaired status upon changes to borrowers’ status that ultimate collectability of all amounts contractually due is not in doubt.
| 52 |
Real Estate Owned (“REO”)
The tables below summarize the balances and activity in REO as of the dates and for the periods indicated.
| As of December 31, | ||||||||
| 2016 | 2015 | |||||||
| (Dollars in thousands) | ||||||||
| One- to four-family residential | $ | 1,336 | $ | 1,384 | ||||
| Commercial real estate | 722 | 1,123 | ||||||
| Residential construction | — | — | ||||||
| Other construction and Land | 2,168 | 2,862 | ||||||
| Total | $ | 4,226 | $ | 5,369 | ||||
| For the Year Ended December 31, | ||||||||
| 2016 | 2015 | |||||||
| (Dollars in thousands) | ||||||||
| Balance, beginning of year | $ | 5,369 | $ | 4,425 | ||||
| Additions | 748 | 3,350 | ||||||
| Disposals | (2,159 | ) | (2,235 | ) | ||||
| Writedowns | (655 | ) | (171 | ) | ||||
| Other - acquired | 923 | — | ||||||
| Balance, end of year | $ | 4,226 | $ | 5,369 | ||||
As indicated in the above table, the balance in REO has decreased by $1.1 million, or 21.3%, to $4.2 million at December 31, 2016 from a balance of $5.4 million at December 31, 2015. Excluding the $0.9 million of REO acquired from old Town Bank, total REO decreased by $2.0 million in 2016. We have experienced a significant decrease in the number and dollar amount of additions to REO and have had moderate success in liquidating the properties. Most of the transfers to REO during the year were one-to-four family residential properties which are normally sold at a faster pace than other property types. We continue to write-down REO as needed and maintain focus on aggressively disposing of our remaining properties.
As of December 31, 2016, our REO property with the largest balance of $1.2 million consisted of approximately 10 acres of commercial land with frontage on US Highway 441 in Franklin, North Carolina. The land is located in close proximity to our corporate office. The property was acquired in September 2009 and most recently valued in December 2016.
Investment Securities
During the fourth quarter of 2015, the Company funded a trading account which is held in a Rabbi Trust to generate returns to offset the market risk of liabilities related certain deferred compensation agreements.
The following table presents the holdings of our trading account as of December 31 for the periods indicated:
| 2016 | 2015 | |||||||
| (Dollars in thousands) | ||||||||
| Exchange traded mutual funds | $ | 5,211 | $ | 4,714 | ||||
The remainder of our investment securities portfolio is classified “available-for-sale”. The Company’s held-to-maturity investment portfolio was transferred to available-for-sale during the third quarter of 2016 in order to provide the Company more flexibility managing its investment portfolio. As a result of the transfer, the Company is prohibited from classifying any investment securities as held-to-maturity for two years from the date of the transfer.
| 53 |
Available-for-sale securities are carried at fair value. The following table shows the amortized cost and fair value for our available-for-sale investment portfolio at the dates indicated.
| At December 31, | At December 31, | |||||||||||||||
| 2016 | 2015 | |||||||||||||||
| Amortized Cost | Fair value | Amortized Cost | Fair value | |||||||||||||
| (Dollars in thousands) | ||||||||||||||||
| Investment securities available-for-sale: | ||||||||||||||||
| U.S. Government and agency securities: | ||||||||||||||||
| U.S. Government and agency obligations | $ | 12,076 | $ | 12,107 | $ | 25,633 | $ | 25,720 | ||||||||
| U.S. Treasury Notes & Bonds | 2,501 | 2,514 | 1,500 | 1,510 | ||||||||||||
| Municipal obligations | 152,208 | 146,771 | 39,751 | 39,858 | ||||||||||||
| Mortgage-backed securities: | ||||||||||||||||
| U.S. Government agency | 128,820 | 126,766 | 112,857 | 112,010 | ||||||||||||
| SBA securities | 30,002 | 29,712 | 47,768 | 47,582 | ||||||||||||
| Collateralized mortgage obligations | 62,524 | 61,459 | 11,702 | 11,582 | ||||||||||||
| Corporate Bonds | 18,354 | 18,358 | — | — | ||||||||||||
| Mutual funds | 616 | 604 | 602 | 600 | ||||||||||||
| Total securities available-for-sale | $ | 407,101 | $ | 398,291 | $ | 239,813 | $ | 238,862 | ||||||||
Available-for-sale investment securities increased $129.0 million, or 54.0%, excluding the $30.4 million transfer from the held-to-maturity portfolio, to $398.3 million at December 31, 2016 from $238.9 million at December 31, 2015. We continue to grow our investment portfolio as we seek to better leverage our capital.
Held-to-maturity investment securities are carried at amortized cost. The following table shows the amortized cost and fair value for our held-to-maturity investment portfolio as of December 31, 2016 and 2015:
| At December 31, | At December 31, | |||||||||||||||
| 2016 | 2015 | |||||||||||||||
| Amortized Cost | Fair value | Amortized Cost | Fair value | |||||||||||||
| (Dollars in thousands) | (Dollars in thousands) | |||||||||||||||
| Investment securities held-to-maturity: | ||||||||||||||||
| U.S. Government and agency securities: | ||||||||||||||||
| U.S. Government and agency obligations | $ | — | $ | — | $ | 5,729 | $ | 5,706 | ||||||||
| U.S. Government structured agency obligations | — | — | 10,148 | 10,793 | ||||||||||||
| U.S. Treasury Notes & Bonds | — | — | 1,002 | 995 | ||||||||||||
| Municipal tax exempt | — | — | 7,641 | 7,825 | ||||||||||||
| Municipal taxable | — | — | 4,787 | 4,709 | ||||||||||||
| Collateralized mortgage obligations | — | — | 4,834 | 4,776 | ||||||||||||
| Corporate debt securities | — | — | 7,023 | 7,008 | ||||||||||||
| Total securities held-to-maturity | $ | — | $ | — | $ | 41,164 | $ | 41,812 | ||||||||
In prior years, the Company reclassified certain municipal securities from available-for-sale to held-to-maturity. The difference between the book values and fair values at the date of the transfer continued to be reported in a separate component of accumulated other comprehensive income (loss), and were amortized into income over the remaining life of the securities as an adjustment of yield in a manner consistent with the amortization of a premium. Concurrently, the revised book values of the transferred securities (represented by the market value on the date of transfer) were amortizing back to their par values over the remaining life of the securities as an adjustment of yield in a manner consistent with the amortization of a discount. All held-to-maturity securities were reclassified as available-for-sale and carried at fair value during the third quarter of 2016. At the time of the transfer the remaining unamortized amount in AOCI was offset by the remaining discount of the revised book values.
As indicated in the table below, the number and dollar amount of securities in an unrealized loss position for more than 12 consecutive months decreased slightly between December 31, 2015 and December 31, 2016. We believe that this decrease in the number of securities in an unrealized loss position is due entirely to decreases in interest rates from the time that many of these securities were originally purchased over the past few years. We regularly review our investment portfolio for “other than temporary impairment”, or OTTI, and concluded that no OTTI existed during the years ended December 31, 2016 and 2015. In addition, we do not intend to sell these securities, nor is it more likely than not that we would be required to sell these securities, before their anticipated recovery of amortized cost.
| 54 |
| 12 Months or Less | More Than 12 Months | Total | ||||||||||||||||||||||||||||||||||
| Number of Securities | Fair Value | Unrealized Losses | Number of Securities | Fair Value | Unrealized Losses | Number of Securities | Fair Value | Unrealized Losses | ||||||||||||||||||||||||||||
| (Dollar in Thousands) | ||||||||||||||||||||||||||||||||||||
| 2016 | 240 | $ | 300,919 | $ | 9,188 | 15 | $ | 17,925 | $ | 312 | 255 | $ | 318,844 | $ | 9,500 | |||||||||||||||||||||
| 2015 | 146 | $ | 153,774 | $ | 1,365 | 17 | $ | 21,852 | $ | 531 | 163 | $ | 175,626 | $ | 1,896 | |||||||||||||||||||||
We closely monitor the financial condition of the issuers of our municipal securities. As of December 31, 2016, the fair value of our municipal securities portfolio balance consists of approximately 55.0% of general obligation bonds and 45.0% of revenue bonds. As of December 31, 2016 and 2015, all municipal securities were performing. The table below presents the ratings for our municipal securities by either Standard and Poor’s or Moody’s as of the dates indicated.
| December 31, | ||||||||||||||||
| 2016 | 2015 | |||||||||||||||
| (Dollars in thousands) | Number of Securities | Fair Value | Number of Securities | Fair Value | ||||||||||||
| AA- or better | 171 | $ | 145,661 | 105 | $ | 50,770 | ||||||||||
| BBB+ | 1 | 501 | 1 | 501 | ||||||||||||
| BBB | 1 | 367 | — | — | ||||||||||||
| BBB- | — | — | 1 | 375 | ||||||||||||
| Not Rated | 1 | 242 | 2 | 746 | ||||||||||||
Investment Portfolio Maturities and Yields
The composition and maturities of the available-for-sale investment securities portfolio at December 31, 2016 are summarized in the following table. Maturities are based on the final contractual payment dates, and do not reflect the impact of prepayments or early redemptions that may occur.
| Less than one year | More
than one year through five years | More
than five years through ten years | More than ten years | Total securities | ||||||||||||||||||||||||||||||||||||
| (Dollars in thousands) | Amortized Cost | Weighted Average Yield | Amortized
Cost | Weighted
Average Yield | Amortized
Cost | Weighted
Average Yield | Amortized
Cost | Weighted Average Yield | Amortized
Cost | Weighted Average Yield | ||||||||||||||||||||||||||||||
| U.S. government and agency securities: | ||||||||||||||||||||||||||||||||||||||||
| Agency securities | $ | 5,012 | 1.09 | % | $ | 6,064 | 1.77 | % | $ | 1,000 | 1.38 | % | $ | — | — | $ | 12,076 | 1.46 | % | |||||||||||||||||||||
| Treasury notes & bonds | — | — | 2,501 | 1.48 | — | — | — | — | 2,501 | 1.48 | ||||||||||||||||||||||||||||||
| Municipal tax exempt (1) | 568 | 1.48 | 654 | 2.65 | 3,272 | 2.68 | 112,208 | 4.09 | 116,702 | 4.03 | ||||||||||||||||||||||||||||||
| Municipal taxable | 177 | 1.10 | 7,035 | 2.21 | 10,770 | 2.76 | 17,524 | 3.19 | 35,506 | 2.85 | ||||||||||||||||||||||||||||||
| Mortgage-backed securities: | ||||||||||||||||||||||||||||||||||||||||
| Agency | — | 15,166 | 1.86 | 42,783 | 2.21 | 70,867 | 1.79 | 128,816 | 1.94 | |||||||||||||||||||||||||||||||
| SBA | — | 585 | 1.55 | 1,877 | 2.12 | 27,540 | 1.57 | 30,002 | 1.60 | |||||||||||||||||||||||||||||||
| CMO | — | — | — | 2,961 | 3.68 | 59,567 | 2.27 | 62,528 | 2.34 | |||||||||||||||||||||||||||||||
| Corporate bonds | — | — | 1,591 | 4.60 | 15,742 | 5.44 | 1,021 | 5.76 | 18,354 | 5.38 | ||||||||||||||||||||||||||||||
| Mutual funds | 616 | 2.18 | — | — | — | — | — | — | 616 | 2.18 | ||||||||||||||||||||||||||||||
| Total securities available-for-sale | $ | 6,373 | 1.23 | % | $ | 33,596 | 2.03 | % | $ | 78,405 | 3.00 | % | $ | 288,727 | 2.86 | % | $ | 407,101 | 2.79 | % | ||||||||||||||||||||
(1) - Tax exempt municipal obligations are shown on a tax equivalent basis using a 35% federal tax rate.
| 55 |
Other Investments
As of December 31, 2016, we held $15.2 million in other investments accounted for at cost which was an increase of $6.4 million, or 72.8%, compared to $8.8 million at December 31, 2015. The following table summarizes other investments as of the dates indicated:
| December 31, | ||||||||
| 2016 | 2015 | |||||||
| (Dollars in thousands) | ||||||||
| FHLB stock | $ | 13.7 | $ | 7.3 | ||||
| Correspondent banks stock | 0.7 | 0.7 | ||||||
| Certificates of deposit with other banks | 0.4 | 0.4 | ||||||
| Investment in Macon Capital Trust I | 0.4 | 0.4 | ||||||
| Total other investments | $ | 15.2 | $ | 8.8 | ||||
The amount of FHLB stock required to be owned by the Bank is determined by the amount of FHLB advances outstanding. The increase in our FHLB stock to $13.7 million at December 31, 2016 compared to $7.3 million at December 31, 2015, was the result of higher FHLB borrowings outstanding which increased from $153.5 million at December 31, 2015 to $298.5 million at December 31, 2016.
Bank Owned Life Insurance (“BOLI”)
These policies are recorded at fair value based on cash surrender values provided by a third party administrator. The assets of the separate BOLI account are invested in the PIMCO Mortgage-backed Securities Account which is composed primarily of U.S. Treasury and U.S. Government agency sponsored mortgage-backed securities with a rating of Aaa and repurchase agreements with a rating of P-1. The assets in the general account are invested in six insurance carriers with ratings ranging from A+ to A++.
BOLI increased $10.4 million to $31.3 million at December 31, 2016 from $20.9 million at December 31, 2015 as a result of additional policy purchases.
The following table summarizes the composition of BOLI as of the dates indicated:
| December 31, | ||||||||
| 2016 | 2015 | |||||||
| (Dollars in thousands) | ||||||||
| Separate account | $ | 12,548 | $ | 12,388 | ||||
| General account | 17,944 | 7,636 | ||||||
| Hybrid | 855 | 834 | ||||||
| Total | $ | 31,347 | $ | 20,858 | ||||
Net Deferred Tax Assets
Deferred income tax assets and liabilities are determined using the asset and liability method and are reported net in the Consolidated Balance Sheets. Under this method, the net deferred tax asset or liability is based on the tax effects of the differences between the book and tax basis of assets and liabilities and recognizes enacted changes in tax rate and laws. When deferred tax assets are recognized, they are subject to a valuation allowance based on management’s judgment as to whether realization is more likely than not. In determining the need for a valuation allowance, we considered the following sources of taxable income:
| • | future reversals of existing taxable temporary differences; |
| • | future taxable income exclusive of reversing temporary differences and carryforwards; |
| • | taxable income in prior carryback years; and |
| • | tax planning strategies that would, if necessary, be implemented. |
| 56 |
During 2015, we completed an analysis of all positive and negative evidence in assessing the need to maintain the valuation allowance against its net deferred tax asset. As a result of this analysis, we determined that significant positive evidence existed that would support the reversal of $18.9 million of the valuation allowance including the following:
| • | A pattern of sustained profitability, excluding non-recurring items, since the first quarter of 2014; |
| • | A three year cumulative profit; |
| • | Forecasted earnings sufficient to utilize all remaining net operating losses prior to expiration beginning in 2024 for North Carolina income taxes and 2027 for Federal income taxes; |
| • | Significant improvements in asset quality; |
| • | Resolution of all remaining regulatory orders; and |
| • | A strong capital position enabling future earnings investments. |
Deposits
The following table presents average deposits by category, percentage of total average deposits and average rates for the periods indicated.
| For the Year Ended December 31, | ||||||||||||||||||||||||||||||||||||
| 2016 | 2015 | 2014 | ||||||||||||||||||||||||||||||||||
| Average Balance | Percent of Total Average Balance | Weighted Average Rate | Average Balance | Percent of Total Average Balance | Weighted Average Rate | Average Balance | Percent of Total Average Balance | Weighted Average Rate | ||||||||||||||||||||||||||||
| (Dollars in thousands) | ||||||||||||||||||||||||||||||||||||
| Deposit type: | ||||||||||||||||||||||||||||||||||||
| Savings accounts | $ | 37,470 | 4.7 | % | 0.13 | % | $ | 30,033 | 4.3 | % | 0.11 | % | $ | 27,009 | 3.8 | % | 0.13 | % | ||||||||||||||||||
| Time deposits | 291,930 | 36.3 | 1.01 | 294,148 | 42.3 | 1.20 | 315,028 | 44.4 | 1.32 | |||||||||||||||||||||||||||
| Brokered CDs | 4,526 | 0.6 | 1.13 | 3,836 | 0.6 | 1.64 | 9,833 | 1.4 | 3.81 | |||||||||||||||||||||||||||
| Money market accounts | 227,838 | 28.3 | 0.34 | 174,481 | 25.1 | 0.32 | 184,821 | 26.0 | 0.53 | |||||||||||||||||||||||||||
| Interest-bearing demand accounts | 112,805 | 14.0 | 0.14 | 95,856 | 13.8 | 0.14 | 86,857 | 12.2 | 0.16 | |||||||||||||||||||||||||||
| Noninterest-bearing demand accounts | 129,219 | 16.2 | — | 96,251 | 14.0 | — | 86,229 | 12.2 | — | |||||||||||||||||||||||||||
| Total deposits | $ | 803,788 | 100.0 | % | 0.49 | % | $ | 694,605 | 100.0 | % | 0.62 | % | $ | 709,777 | 100.0 | % | 0.75 | % | ||||||||||||||||||
As indicated in the above table, average deposit balances increased approximately $109.2 million, or 15.7%, for the year ended December 31, 2016 compared to 2015. The increase in total average deposits was mainly attributable to $88.7 million in deposits assumed from Old Town Bank on April 1, 2016, with the deposits included in our average balances from the date of the acquisition through December 31, 2016.
During 2016, we continued to reduce rates paid on time deposit accounts with a corresponding focus on developing lower cost transaction accounts. This strategy assisted with reducing our overall cost of deposits to 49 basis points in 2016 compared to 62 basis points in 2015.
| 57 |
The following table presents details of the applicable interest rates on our certificates of deposit at the dates indicated. The decrease in higher cost certificates of deposit is due to a combination of existing certificates of deposit maturing without renewal, and the re-pricing of retail certificates at lower rates.
| December 31, | ||||||||
| 2016 | 2015 | |||||||
| (Dollars in thousands) | ||||||||
| Interest Rate: | ||||||||
| Less than 1.00% | $ | 145,562 | $ | 128,882 | ||||
| 1.00% to 2.00% | 109,296 | 96,939 | ||||||
| 2.00% to 3.00% | 34,347 | 50,321 | ||||||
| Greater than 3.00% | — | — | ||||||
| Total | $ | 289,205 | $ | 276,142 | ||||
The following table presents contractual maturities for certificates of deposit in amounts equal to or greater than $100 thousand.
| December 31, 2016 | ||||
| (Dollars in thousands) | ||||
| Three months or less | $ | 18,430 | ||
| Over three months through six months | 20,560 | |||
| Over six months through one year | 34,244 | |||
| Over one year | 73,586 | |||
| Total | $ | 146,820 | ||
The following table presents contractual maturities for certificates of deposit in amounts equal to or greater than $250 thousand.
| December 31, 2016 | ||||
| (Dollars in thousands) | ||||
| Three months or less | $ | 2,803 | ||
| Over three months through six months | 5,610 | |||
| Over six months through one year | 12,522 | |||
| Over one year | 25,926 | |||
| Total | $ | 46,861 | ||
Borrowings
We have traditionally maintained a balance of borrowings from the FHLB of Atlanta using a combination of fixed and variable borrowings. From time to time, we also borrow overnight funds from the FHLB of Atlanta, but had no overnight borrowings outstanding at December 31, 2016. FHLB advances are secured by qualifying one-to-four family permanent and commercial loans, by investment securities, and by a blanket collateral agreement with the FHLB of Atlanta. At December 31, 2016, the Company had unused borrowing capacity with the FHLB of $13.9 million based on collateral pledged at that date. The Company had total additional credit availability with FHLB of $56.8 million as of December 31, 2016 if additional collateral was pledged.
| 58 |
The following tables detail the composition of our FHLB borrowings between fixed and adjustable rate advances as of the dates indicated:
| December 31, 2016 | ||||||||||||
| Balance | Type | Rate | Maturity | |||||||||
| (Dollars in thousands) | ||||||||||||
| $ | 5,000 | Fixed Rate | 0.58 | % | 1/3/2017 | |||||||
| 5,000 | Fixed Rate | 0.44 | % | 1/3/2017 | ||||||||
| 50,000 | Fixed Rate | 0.49 | % | 1/5/2017 | ||||||||
| 30,000 | Fixed Rate | 0.64 | % | 1/15/2017 | ||||||||
| 15,000 | Fixed Rate | 0.63 | % | 1/17/2017 | ||||||||
| 25,000 | Fixed Rate | 0.64 | % | 1/23/2017 | ||||||||
| 20,000 | Fixed Rate | 0.56 | % | 2/7/2017 | ||||||||
| 5,000 | Fixed Rate | 0.58 | % | 3/28/2017 | ||||||||
| 15,000 | Adjustable Rate | 0.56 | % | 3/29/2017 | ||||||||
| 5,000 | Fixed Rate | 0.80 | % | 3/31/2017 | ||||||||
| 5,000 | Fixed Rate | 0.60 | % | 4/3/2017 | ||||||||
| 10,000 | Fixed Rate | 0.60 | % | 4/6/2017 | ||||||||
| 1,000 | Fixed Rate | 0.87 | % | 5/11/2017 | ||||||||
| 20,500 | Adjustable Rate | 0.73 | % | 5/23/2017 | ||||||||
| 5,000 | Fixed Rate | 0.82 | % | 6/6/2017 | ||||||||
| 2,000 | Fixed Rate | 1.02 | % | 6/12/2017 | ||||||||
| 5,000 | Fixed Rate | 0.76 | % | 6/30/2017 | ||||||||
| 25,000 | Fixed Rate | 0.77 | % | 8/7/2017 | ||||||||
| 10,000 | Fixed Rate | 0.82 | % | 9/28/2017 | ||||||||
| 10,000 | Fixed Rate | 0.77 | % | 12/29/2017 | ||||||||
| 5,000 | Fixed Rate | 0.78 | % | 12/30/2017 | ||||||||
| 5,000 | Fixed Rate | 1.26 | % | 6/5/2018 | ||||||||
| 10,000 | Fixed Rate | 0.84 | % | 6/29/2018 | ||||||||
| 5,000 | Fixed Rate | 1.40 | % | 7/1/2018 | ||||||||
| 5,000 | Fixed Rate | 1.51 | % | 12/31/2018 | ||||||||
| $ | 298,500 | 0.68 | % | |||||||||
| 59 |
| December 31, 2015 | ||||||||||||
| Balance | Type | Rate | Maturity | |||||||||
| (Dollars in thousands) | ||||||||||||
| $ | 45,000 | Fixed Rate | 0.30 | % | 2/5/2016 | |||||||
| 5,000 | Fixed Rate | 0.39 | % | 3/28/2016 | ||||||||
| 5,000 | Fixed Rate | 0.52 | % | 3/30/2016 | ||||||||
| 10,000 | Fixed Rate | 0.47 | % | 3/31/2016 | ||||||||
| 5,000 | Fixed Rate | 0.49 | % | 6/6/2016 | ||||||||
| 5,000 | Fixed Rate | 0.69 | % | 6/30/2016 | ||||||||
| 5,000 | Fixed Rate | 0.51 | % | 6/30/2016 | ||||||||
| 5,000 | Fixed Rate | 0.74 | % | 7/1/2016 | ||||||||
| 20,000 | Daily Rate | 0.49 | % | 7/21/2016 | ||||||||
| 10,000 | Fixed Rate | 0.58 | % | 9/28/2016 | ||||||||
| 5,000 | Fixed Rate | 0.79 | % | 12/5/2016 | ||||||||
| 5,000 | Fixed Rate | 0.98 | % | 12/30/2016 | ||||||||
| 5,000 | Fixed Rate | 0.74 | % | 12/30/2016 | ||||||||
| 1,000 | Fixed Rate | 0.87 | % | 5/11/2017 | ||||||||
| 2,000 | Fixed Rate | 1.02 | % | 6/12/2017 | ||||||||
| 5,000 | Fixed Rate | 1.38 | % | 12/29/2017 | ||||||||
| 2,000 | Fixed Rate | 1.25 | % | 5/11/2018 | ||||||||
| 10,000 | Fixed Rate | 1.83 | % | 4/10/2019 | ||||||||
| 2,500 | Fixed Rate | 1.77 | % | 6/11/2019 | ||||||||
| 1,000 | Fixed Rate | 1.78 | % | 5/11/2020 | ||||||||
| $ | 153,500 | 0.65 | % | |||||||||
The following table sets forth information concerning balances and interest rates on our FHLB advances as of or for the periods indicated.
| As of or for the Year Ended December 31, | ||||||||
| 2016 | 2015 | |||||||
| (Dollars in thousands) | ||||||||
| Balance at end of period | $ | 298,500 | $ | 153,500 | ||||
| Average balance during period | 194,662 | 102,627 | ||||||
| Maximum outstanding at any month end | 298,500 | 153,500 | ||||||
| Weighted average interest rate at end of period | 0.68 | % | 0.65 | % | ||||
| Weighted average interest rate during period | 0.73 | % | 0.80 | % | ||||
FHLB advances increased $145.0 million, or 94.5%, to $298.5 million at December 31, 2016, from $153.5 million at December 31, 2015. The additional funds were used to invest in loans and investment securities and to provide funding for future cash needs. The advances had a weighted average rate of 0.68% as of December 31, 2016 compared to 0.65% at December 31, 2015. The use of FHLB advances as a funding source continues to be a low cost complement to core deposits.
| 60 |
To add stability to net interest revenue and manage our exposure to interest rate movement on our adjustable rate FHLB advances, we entered into two FHLB advance interest rate swaps in 2016. The swap contracts involve the payment of fixed-rate amounts to a counterparty in exchange for our receipt of variable-rate payments over the two year lives of the contracts. The effective interest rates were 0.76% and 1.15% at December 31, 2016 for the adjustable rate advances maturing March 29, 2017 and May 23, 2017, respectively.
The Company also had other borrowings at December 31, 2016 of $2.7 million which is comprised of participated loans that did not qualify for sale accounting. Interest expense on the other borrowings accrues at the same rate as the interest income recognized on the loans receivable, resulting in no effect to net income.
Junior Subordinated Notes
We had $14.4 million in junior subordinated notes outstanding at December 31, 2016 and 2015, payable to an unconsolidated subsidiary. These notes accrue interest at 2.80% above the 90-day LIBOR, adjusted quarterly. To add stability to net interest revenue and manage our exposure to interest rate movement, we entered into an interest rate swap in June 2016. The swap contract involves the payment of fixed-rate amounts to a counterparty in exchange for our receipt of variable-rate payments over the four year life of the contract. The effective interest rate was 3.76% and 3.34%, at December 31, 2016 and 2015, respectively. The notes mature on March 30, 2034.
Equity
Total equity increased $1.6 million, or 1.2%, to $133.1 million at December 31, 2016 from $131.5 million at December 31, 2015. This increase was primarily the result of $6.4 million of net income for the period partially offset by a $3.7 million decline in the market value of investment securities and $1.9 million of share repurchases.
Average Balances and Net Interest Income Analysis
Like most financial institutions, net interest income is our primary source of revenue. Net interest income is the difference between income earned on assets and interest paid on deposits and borrowings used to support such assets. Net interest income is determined by the rates earned on our interest-earning assets and the rates paid on our interest-bearing liabilities, the relative amounts of interest-earning assets and interest-bearing liabilities, and the degree of mismatch and the maturity and repricing characteristics of the interest-earning assets and interest-bearing liabilities.
| 61 |
The following table sets forth the average balances of assets and liabilities, the total dollar amounts of interest income and dividends from average interest-earning assets on a tax-equivalent basis, the total dollar amounts of interest expense on average interest-bearing liabilities, and the resulting annualized average tax-equivalent yields and cost for the periods indicated. All average balances are daily average balances. Non-accrual loans were included in the computation of average balances, but have been reflected in the table as loans carrying a zero yield. The yields set forth below include the effect of deferred fees, discounts and premiums that are amortized or accreted to interest income or expense.
| For the Year Ended December 31, | ||||||||||||||||||||||||||||||||||||
| 2016 | 2015 | 2014 | ||||||||||||||||||||||||||||||||||
| Average Outstanding Balance | Interest | Yield/ Rate | Average Outstanding Balance | Interest | Yield/ Rate | Average
Outstanding Balance | Interest | Yield/ Rate | ||||||||||||||||||||||||||||
| (Dollars in thousands) | ||||||||||||||||||||||||||||||||||||
| Interest-earning assets: | ||||||||||||||||||||||||||||||||||||
| Loans, including loans held for sale | $ | 693,743 | $ | 32,324 | 4.65 | % | $ | 580,106 | $ | 27,027 | 4.66 | % | $ | 535,949 | $ | 27,597 | 5.15 | % | ||||||||||||||||||
| Loans, tax exempt (1) | 13,516 | 518 | 3.83 | % | 4,970 | 214 | 4.30 | % | 2,044 | 103 | 5.04 | % | ||||||||||||||||||||||||
| Investments - taxable | 259,036 | 5,628 | 2.17 | % | 253,774 | 5,223 | 2.06 | % | 195,536 | 4,139 | 2.12 | % | ||||||||||||||||||||||||
| Investment tax exempt (1) | 60,685 | 2,323 | 3.83 | % | 11,949 | 574 | 4.81 | % | 8,123 | 526 | 6.47 | % | ||||||||||||||||||||||||
| Interest earning deposits | 41,762 | 210 | 0.50 | % | 31,875 | 75 | 0.24 | % | 40,476 | 95 | 0.23 | % | ||||||||||||||||||||||||
| Other investments, at cost | 10,351 | 511 | 4.92 | % | 6,682 | 299 | 4.47 | % | 3,738 | 199 | 5.32 | % | ||||||||||||||||||||||||
| Total interest-earning assets | 1,079,093 | 41,515 | 3.84 | % | 889,356 | 33,412 | 3.76 | % | 785,866 | 32,659 | 4.16 | % | ||||||||||||||||||||||||
| Noninterest-earning assets | 85,126 | 58,515 | 48,586 | |||||||||||||||||||||||||||||||||
| Total assets | $ | 1,164,219 | $ | 947,871 | $ | 834,452 | ||||||||||||||||||||||||||||||
| Interest-bearing liabilities: | ||||||||||||||||||||||||||||||||||||
| Savings accounts | $ | 37,470 | $ | 49 | 0.13 | % | $ | 30,033 | $ | 33 | 0.11 | % | $ | 27,009 | $ | 36 | 0.13 | % | ||||||||||||||||||
| Time deposits | 296,456 | 2,985 | 1.00 | % | 297,984 | 3,607 | 1.21 | % | 324,861 | 4,193 | 1.29 | % | ||||||||||||||||||||||||
| Money market accounts | 227,838 | 770 | 0.34 | % | 174,481 | 558 | 0.32 | % | 184,821 | 983 | 0.53 | % | ||||||||||||||||||||||||
| Interest bearing transaction accounts | 112,805 | 160 | 0.14 | % | 95,856 | 136 | 0.14 | % | 86,857 | 149 | 0.17 | % | ||||||||||||||||||||||||
| Total interest bearing deposits | 674,569 | 3,964 | 0.59 | % | 598,354 | 4,334 | 0.72 | % | 623,548 | 5,361 | 0.86 | % | ||||||||||||||||||||||||
| FHLB advances | 194,662 | 1,419 | 0.73 | % | 102,627 | 826 | 0.80 | % | 40,109 | 703 | 1.75 | % | ||||||||||||||||||||||||
| Junior subordinated debentures | 14,433 | 532 | 3.68 | % | 14,433 | 458 | 3.17 | % | 14,433 | 509 | 3.53 | % | ||||||||||||||||||||||||
| Other borrowings | 2,528 | 117 | 4.62 | % | 1,863 | 105 | 5.64 | % | — | — | 0.00 | % | ||||||||||||||||||||||||
| Total interest-bearing liabilities | 886,192 | 6,032 | 0.68 | % | 717,277 | 5,723 | 0.80 | % | 678,090 | 6,573 | 0.97 | % | ||||||||||||||||||||||||
| Noninterest-bearing deposits | 129,219 | 96,251 | 86,229 | |||||||||||||||||||||||||||||||||
| Other non interest bearing liabilities | 13,353 | 13,890 | 12,937 | |||||||||||||||||||||||||||||||||
| Total liabilities | 1,028,764 | 827,418 | 777,256 | |||||||||||||||||||||||||||||||||
| Total equity | 135,455 | 120,453 | 57,196 | |||||||||||||||||||||||||||||||||
| Total liabilities and equity | $ | 1,164,219 | $ | 947,871 | $ | 834,452 | ||||||||||||||||||||||||||||||
| Tax-equivalent net interest income | $ | 35,483 | $ | 27,689 | $ | 26,086 | ||||||||||||||||||||||||||||||
| Net interest-earning assets (2) | $ | 192,901 | $ | 172,079 | $ | 107,776 | ||||||||||||||||||||||||||||||
| Average interest-earning assets to interest-bearing liabilities | 121.77 | % | 123.99 | % | 115.89 | % | ||||||||||||||||||||||||||||||
| Tax-equivalent net interest rate spread (3) | 3.16 | % | 2.96 | % | 3.19 | % | ||||||||||||||||||||||||||||||
| Tax-equivalent net interest margin (4) | 3.28 | % | 3.11 | % | 3.32 | % | ||||||||||||||||||||||||||||||
(1) Tax exempt loans and investments are calculated giving effect to a 35% federal tax rate.
(2) Net interest-earning assets represents total interest-earning assets less total interest-bearing liabilities.
(3) Tax-equivalent net interest rate spread represents the difference between the tax equivalent yield on average interest-earning assets and the cost of average interest-bearing liabilities.
(4) Tax-equivalent net interest margin represents tax equivalent net interest income divided by average total interest-earning assets.
| 62 |
The following table presents the effects of changing rates and volumes on our net interest income for the period indicated. The rate column shows the effects attributable to changes in rate (changes in rate multiplied by prior volume). The volume column shows the effects attributable to change in volume (changes in volume multiplied by prior rate). The total column represents the sum of the prior columns. For purposes of this table, changes attributable to both rate and volume, which cannot be segregated, have been allocated proportionately, based on the absolute values of changes due to rate and the changes due to volume.
| For the Year Ended December 31, 2016 Compared to the Year Ended December 31, 2015 | For the Year Ended December 31, 2015 Compared to the Year Ended December 31, 2014 | For the Year Ended December 31, 2014 Compared to the Year Ended December 31, 2013 | ||||||||||||||||||||||||||||||||||
| Increase (decrease) due to: | Increase (decrease) due to: | Increase (decrease) due to: | ||||||||||||||||||||||||||||||||||
| Volume | Rate | Total | Volume | Rate | Total | Volume | Rate | Total | ||||||||||||||||||||||||||||
| (Dollars in thousands) | (Dollars in thousands) | (Dollars in thousands) | ||||||||||||||||||||||||||||||||||
| Interest-earning assets: | ||||||||||||||||||||||||||||||||||||
| Loans, including loans held for sale (1) | $ | 5,369 | $ | (72 | ) | $ | 5,297 | $ | 2,173 | $ | (2,743 | ) | $ | (570 | ) | $ | 187 | $ | (58 | ) | $ | 129 | ||||||||||||||
| Loans, tax exempt (2) | 330 | (25 | ) | 305 | 128 | (17 | ) | 111 | 15 | (13 | ) | 2 | ||||||||||||||||||||||||
| Investment - taxable | 109 | 296 | 405 | 1,202 | (118 | ) | 1,084 | 719 | (25 | ) | 694 | |||||||||||||||||||||||||
| Investments - tax exempt (2) | 1,890 | (141 | ) | 1,749 | 206 | (158 | ) | 48 | (42 | ) | 7 | (35 | ) | |||||||||||||||||||||||
| Interest-earning deposits | 29 | 106 | 135 | (20 | ) | 0 | (20 | ) | 62 | 2 | 64 | |||||||||||||||||||||||||
| Other investments, at cost | 179 | 33 | 212 | 136 | (36 | ) | 100 | 16 | 113 | 129 | ||||||||||||||||||||||||||
| Total interest-earning assets | 7,906 | 197 | 8,103 | 3,825 | (3,072 | ) | 753 | 957 | 26 | 983 | ||||||||||||||||||||||||||
| Interest-bearing liabilities: | ||||||||||||||||||||||||||||||||||||
| Savings accounts | $ | 9 | $ | 7 | $ | 16 | $ | 4 | $ | (7 | ) | $ | (3 | ) | $ | 2 | $ | (2 | ) | $ | — | |||||||||||||||
| Time deposits | (9 | ) | (613 | ) | (622 | ) | (335 | ) | (251 | ) | (586 | ) | (53 | ) | (288 | ) | (341 | ) | ||||||||||||||||||
| Money market accounts | 180 | 32 | 212 | (52 | ) | (373 | ) | (425 | ) | 20 | (159 | ) | (139 | ) | ||||||||||||||||||||||
| Interest bearing transaction accounts | 24 | — | 24 | 14 | (27 | ) | (13 | ) | 16 | (1 | ) | 15 | ||||||||||||||||||||||||
| FHLB advances | 680 | (87 | ) | 593 | 656 | (533 | ) | 123 | 290 | (259 | ) | 31 | ||||||||||||||||||||||||
| Junior subordinated debentures | — | 73 | 73 | — | (51 | ) | (51 | ) | — | 19 | 19 | |||||||||||||||||||||||||
| Other borrowings | 32 | (19 | ) | 13 | 105 | — | 105 | — | — | — | ||||||||||||||||||||||||||
| Total interest-bearing liabilities | 916 | (607 | ) | 309 | 392 | (1,242 | ) | (850 | ) | 275 | (690 | ) | (415 | ) | ||||||||||||||||||||||
| Change in tax-equivalent net interest income | $ | 6,990 | $ | 804 | $ | 7,794 | $ | 3,433 | $ | (1,830 | ) | $ | 1,603 | $ | 682 | $ | 716 | $ | 1,398 | |||||||||||||||||
(1) Non-accrual loans are included in the above analysis.
(2) Interest income on tax exempt loans and investments are adjusted for based on a 35% federal tax rate.
Comparison of Operating Results for the Fiscal Years Ended December 31, 2016 and 2015
General
Net income for the year ended December 31, 2016 was $6.4 million compared to $23.8 million for the same period in 2015. The decrease in net income for the period was primarily the result of a non-cash income tax benefit resulting from the $19.8 million reversal of substantially all of the valuation allowance on the Company’s net deferred tax asset and a negative provision for loan losses of $1.5 million in 2015, with no corresponding reversal of negative provision in 2016. These items were partially offset by an increase in net interest income of $7.1 million and an increase in noninterest income of $2.1 million for the year ended December 31, 2016 as compared to the year ended December 31, 2015. Furthermore, there was an increase in noninterest expense of $4.6 million for the year ended December 31, 2016 as compared to the same period in 2015.
| 63 |
Net Interest Income
Our tax-equivalent net interest income increased by $7.8 million, or 28.15%, to $35.5 million for the year ended December 31, 2016, compared to $27.7 million for the year ended December 31, 2015. This improvement was the result of increases in average loan and investment balances along with a reduction in rates on interest-bearing liabilities of 12 basis points for the year ended December 31, 2016 compared to 2015. Our tax-equivalent net interest margin increased 17 basis points to 3.28% for 2016 compared to 3.11% for 2015.
Our average interest-earning assets increased $189.7 million, or 13.2%, to $1.1 billion in 2016 compared to $889.4 million in 2015. This increase was mainly attributable to $103.5 million in interest earning assets acquired from Old Town Bank on April 1, 2016, with those assets included in our average balances from the date of acquisition through December 31, 2016.
Our average interest-bearing liabilities increased $168.9 million, or 23.5%, to $886.2 million in 2016 compared to $717.3 million in 2015. This increase was mainly attributable to $88.7 million in deposits assumed from Old Town Bank on April 1, 2016, with the deposits included in our average balances from the date of acquisition through December 31, 2016. In addition, average FHLB advances increased $92.0 million, or 89.7%, in 2016 primarily to fund investments. Although our average interest-bearing liabilities increased during 2016, we were able to reduce the overall related cost by 12 basis points which resulted in a decrease in interest expense due to rate of approximately $0.6 million in 2016 compared 2015.
Provision for Loan Losses
The Company continues to experience a low level of net charge-offs and non-performing loans. A provision for loan losses of $0.3 million was recorded for the year ended December 31, 2016 compared to a negative provision of $1.5 million for the year ended December 31, 2015. The relatively insignificant 2016 provision and 2015 reversal of the provision for loan losses reflect improved asset quality and reduced loss rates during the two periods.
Noninterest Income
The following table summarizes the components of noninterest income and the corresponding change between the years ended December 31, 2016 and 2015:
| For the Year Ended December 31, | ||||||||||||
| 2016 | 2015 | Change | ||||||||||
| (Dollars in thousands) | ||||||||||||
| Servicing income, net | $ | 487 | $ | 341 | $ | 146 | ||||||
| Mortgage banking | 904 | 774 | 130 | |||||||||
| Gain on sale of SBA loans | 928 | 823 | 105 | |||||||||
| Gain on sale of investments, net | 1,216 | 403 | 813 | |||||||||
| Service charges on deposit accounts | 1,537 | 1,269 | 268 | |||||||||
| Interchange fees | 1,507 | 1,278 | 229 | |||||||||
| Bank owned life insurance | 489 | 457 | 32 | |||||||||
| Other | 778 | 450 | 328 | |||||||||
| Total | $ | 7,846 | $ | 5,795 | $ | 2,051 | ||||||
The $0.1 million net increase in servicing income was primarily the result of an increase in the fair value of the corresponding loan servicing rights.
Mortgage banking increased $0.1 million primarily as a result of increased loan volume.
Gains on sales of SBA loans increased $0.1 million as a result of a larger balance of SBA loans being sold during the 2016 period as we continued to increase our SBA lending efforts.
Net gains on sales of investments increased $0.8 million due to a significant drop in interest rates in the first nine months of 2016 which provided favorable market conditions for sales.
Service charges on deposit accounts and interchange fees increased $0.3 million and $0.2 million, respectively, primarily as a result of the increase in deposits following the Old Town acquisition and a continued focus on core deposits.
Other noninterest income increased $0.3 million primarily as a result of increases in trading securities revenue.
| 64 |
Noninterest Expense
The following table summarizes the components of noninterest expense and the corresponding change between the years ended December 31, 2016 and 2015:
| For the Year Ended December 31, | ||||||||||||
| 2016 | 2015 | Change | ||||||||||
| (Dollars in thousands) | ||||||||||||
| Compensation and employee benefits | $ | 17,164 | $ | 14,625 | $ | 2,539 | ||||||
| Net occupancy | 3,534 | 2,986 | 548 | |||||||||
| Federal Home Loan Bank prepayment penalties | 118 | 1,762 | (1,644 | ) | ||||||||
| Federal deposit insurance | 562 | 905 | (343 | ) | ||||||||
| Professional and advisory | 959 | 1,005 | (46 | ) | ||||||||
| Data processing | 1,554 | 1,213 | 341 | |||||||||
| Marketing and advertising | 1,070 | 535 | 535 | |||||||||
| Merger-related expenses | 2,197 | 329 | 1,868 | |||||||||
| Net cost of operation of real estate owned | 730 | 505 | 225 | |||||||||
| Other | 4,301 | 3,765 | 536 | |||||||||
| Total noninterest expenses | $ | 32,189 | $ | 27,630 | $ | 4,559 | ||||||
Compensation and employee benefits increased by $2.5 million, or 17.4%, for 2016 compared to 2015. The additional expense is related to increases in the number of employees primarily as the result of the addition of three new branches and the Old Town acquisition, annual raises, employee benefits, incentives and commissions.
Net occupancy increased $0.5 million, or 18.4%, in 2016 compared to 2015 primarily as the result of the addition of three branches and the Old Town acquisition.
During the fourth quarter of 2016, we prepaid $20.5 million of FHLB advances and incurred $0.1 million in prepayment penalties. In the second quarter of 2015, we prepaid a $15.0 million FHLB advance and incurred a prepayment penalty of $1.8 million.
Marketing and advertising expenses increased $0.5 million, or 100.0%, in 2016 compared to 2015 primarily as the result of increased advertising in the Upstate South Carolina market.
Expenses for FDIC deposit insurance decreased $0.3 million, or 37.9%, for 2016 compared to 2015 as a result of a reduction in our assessment rates due to an improving risk profile.
Merger-related expenses of $2.2 million related primarily to the Old Town acquisition.
Other noninterest expense increased $0.5 million, or 14.2%, for 2016 compared to 2015 primarily as a result of increases in stock-based benefits of $0.2 million as part of the 2015 Long-term Stock Incentive Plan and telecommunication expense of $0.2 million partially offset by reduced franchise taxes of $0.1 million.
Income Taxes
We recorded $3.5 million of income tax expense for the year ended December 31, 2016, or an effective tax rate of 35.4%, compared to a $16.7 million income tax benefit for the same period in 2015. As mentioned above, the reversal of $19.8 million in deferred tax asset valuation allowance resulted in the tax benefit for 2015. As of December 31, 2016 and 2015, $0.2 million and $0.6 million in valuation allowance related to net deferred tax assets on investment securities remains in accumulated other comprehensive income. This valuation allowance will be recognized as tax expense on a security-by-security basis upon the sale or maturity of the individual securities. The tax expense is expected to be recognized over the remaining life of the securities of approximately 1 year.
The Company recognized reductions in its net deferred tax assets of approximately $0.4 million during both the years ended December 31, 2016 and 2015 as a result of reductions in the North Carolina income tax rate from 5.0% to 3.0%.
| 65 |
We continue to be in a net operating loss position for federal and state income tax purposes and do not have a material current tax liability or receivable.
Comparison of Operating Results for the Fiscal Years Ended December 31, 2015 and 2014
General
Net income increased $17.9 million to $23.8 million for the year ended December 31, 2015, compared to net income of $5.9 million for the year ended December 31, 2014. The increase in net income for the period was primarily the result of a non-cash income tax benefit of $18.9 million resulting from the reversal of all of the valuation allowance on the Company’s net deferred tax asset, a reduction in the net cost of operation of REO of $2.5 million, a negative provision for loan losses of $1.5 million, and an increase in net interest income of $1.5 million, which were partially offset by a FHLB advance prepayment penalty of $1.8 million and increased compensation of $2.8 million.
Income before taxes decreased $1.1 million, or 13.1%, to $7.1 million for the year ended December 31, 2015 compared to $8.2 million for the year ended December 31, 2014. The decrease was primarily attributable to $1.1 million of deferred interest and discounts due to the favorable resolution and restructuring of two commercial loans in 2014 and not 2015, an FHLB advance prepayment penalty of $1.8 million, and an increase in compensation related expenses of $2.8 million which were partially offset by an increase in net interest income of $1.5 million, a negative provision for loan losses of $1.5 million, and a decrease in real estate owned costs of $2.5 million.
Core net income increased $0.4 million, or 9.3%, to $5.0 million in 2015 compared to $4.6 million in 2014. The increase in core net income is primarily attributable to an increase in core net interest income of $2.7 million and a reduction in net cost of operation of REO of $2.5 million, which were partially offset by an increase in compensation of $2.8 million.
Net Interest Income
Our tax-equivalent net interest income increased by $1.6 million, or 6.1%, to $27.7 million for the year ended December 31, 2015, compared to $26.1 million for the year ended December 31, 2014. This improvement was the result of increases in average loan and investment balances along with a reduction in rates on interest-bearing liabilities of 17 basis points for the year ended December 31, 2015 compared to 2014. Our tax-equivalent net interest margin decreased 21 basis points to 3.11% for 2015 compared to 3.32% for 2014.
The yield on taxable loans decreased 49 basis points in 2015 compared to 2014. The yield on taxable loans for 2014 included the recognition of approximately $1.1 million of deferred interest and discounts due to the favorable resolution and restructuring of two commercial loans. Excluding the $1.1 million interest income recognized from the resolution of these loans, our yield on taxable loans would have been 4.94% for the year ended December 31, 2014, reflecting a decrease of 28 basis points for the year ended December 31, 2015 compared to 2014.
Our average interest-earning assets increased $103.5 million, or 13.2%, to $889.4 million in 2015 compared to $785.9 million in 2014. The substantial increase in interest earning-assets was primarily due to continued investing in loans and investments as we leverage the capital received from our stock offering in 2014. Our average balance in taxable investments increased $58.2 million, or 29.8%, to $253.8 million for 2015 compared to $195.5 million for 2014. This increase in the average balance of our taxable investments provided an additional $1.2 million in interest income compared to the average balance in 2014. Our average balance in taxable loans increased $44.2 million, or 8.2%, to $580.1 million in 2015 compared to $535.9 million in 2014. The increase in the average balance of our taxable loans provided an addition $2.2 million in interest income compared to the average balance in 2014.
Our average interest-bearing liabilities increased $39.2 million, or 5.8%, to $717.3 million in 2015 compared to $678.1 million in 2014. The increase in average interest-bearing liabilities is a result of increased average FHLB advances in 2015, partially offset by a decrease in average interest-bearing deposits. During 2015, the average interest-bearing deposit balance decreased $25.2 million, or 4.0%, and the average outstanding FHLB advances increased $62.5 million, or 155.9%. Although our average interest-bearing liabilities increased during 2015, we were able to reduce the overall related cost by 17 basis points which resulted in a decrease in interest expense due to rate of approximately $1.2 million in 2015 compared 2014.
| 66 |
Provision for Loan Losses
For the year ended December 31, 2015, we had a negative provision for loan losses of $1.5 million compared to a provision of $33,000 for the same period in the prior year. The decrease in the provision for loan losses was the result of improvements in asset quality, significantly reduced charge-off amounts, and a continued reduction in decline in the overall loss rates used in our allowance for loan losses model.
Noninterest Income
The following table summarizes the components of noninterest income and the corresponding change between the years ended December 31, 2015 and 2014:
| For the Year Ended December 31, | ||||||||||||
| 2015 | 2014 | Change | ||||||||||
| (Dollars in thousands) | ||||||||||||
| Servicing income, net | $ | 341 | $ | 565 | $ | (224 | ) | |||||
| Mortgage banking | 774 | 800 | (26 | ) | ||||||||
| Gain on sale of SBA loans | 823 | 629 | 194 | |||||||||
| Gain on sale of investments, net | 403 | 657 | (254 | ) | ||||||||
| Other than temporary impairment | (3 | ) | (76 | ) | 73 | |||||||
| Service charges on deposit accounts | 1,269 | 1,203 | 66 | |||||||||
| Interchange fees | 1,278 | 1,126 | 152 | |||||||||
| Bank owned life insurance | 457 | 456 | 1 | |||||||||
| Other | 453 | 719 | (266 | ) | ||||||||
| Total | $ | 5,795 | $ | 6,079 | $ | (284 | ) | |||||
The $0.2 million net decrease in servicing income was primarily the result of a decrease in the fair value of the corresponding loan servicing rights. The fair value of our loan servicing rights has decreased in recent quarters due to an increase in expected prepayment speeds.
Mortgage banking income remained unchanged at $0.8 million in 2015 compared to 2014 which is consistent with the continued industry-wide slowdown in refinancing activity.
Gain on sale of SBA loans increased $0.2 million for 2015 compared to 2014. The increase in gain on sale of SBA loans is attributable to increased sales of SBA loans during 2015 as we have hired additional lenders and increased our focus on SBA lending.
Net gains on sales of investments decreased $0.3 million for 2015 compared to 2014. The decrease in net gains on sales of investments is a result of increasing bond rates in 2015 compared to 2014 which resulted in less of our investment securities maintaining a gain position during the year.
Other income decreased by $0.3 million for 2015 compared to 2014 primarily attributable to reduced returns on our investments in Small Business Investment Company funds and lower commissions on wealth management balances.
| 67 |
Noninterest Expense
The following table summarizes the components of noninterest expense and the corresponding change between the years ended December 31, 2015 and 2014:
| For the Year Ended December 31, | ||||||||||||
| 2015 | 2014 | Change | ||||||||||
| (Dollars in thousands) | ||||||||||||
| Compensation and employee benefits | $ | 14,625 | $ | 11,843 | $ | 2,782 | ||||||
| Net occupancy | 2,986 | 2,697 | 289 | |||||||||
| Federal Home Loan Bank prepayment penalties | 1,762 | — | 1,762 | |||||||||
| Federal deposit insurance | 905 | 1,265 | (360 | ) | ||||||||
| Professional and advisory | 1,005 | 722 | 283 | |||||||||
| Data processing | 1,213 | 1,082 | 131 | |||||||||
| Merger-related expenses | 329 | — | 329 | |||||||||
| Net cost of operation of real estate owned | 505 | 2,970 | (2,465 | ) | ||||||||
| Other | 4,300 | 3,188 | 1,112 | |||||||||
| Total noninterest expenses | $ | 27,630 | $ | 23,767 | $ | 3,863 | ||||||
Total noninterest expense increased $3.9 million in 2015 compared to 2014, primarily as a result of increased compensation related expenses and FHLB prepayment penalties which were partially offset by reduced REO related expenses which decreased $2.5 million in 2015 compared to 2014. The significant decrease in REO related expenses is a result of our improved asset quality and fewer additions of large properties to REO during 2015.
Core noninterest expense, which excludes FHLB prepayment penalties and merger-related expenses, increased $1.8 million in 2015 compared to 2014, primarily as a result of increased compensation related costs of $2.8 million and partially offset by reduced REO related expenses of $2.5 million.
Compensation and employee benefits increased by $2.8 million, or 23.5%, for 2015 compared to 2014. This additional expense is related to increases in our number of employees, annual raises, employee benefits, incentives and commissions. The number of our full-time equivalent employees increased to 213 at December 31, 2015, as compared to 187 at December 31, 2014.
During the second quarter of 2015, we prepaid a $15.0 million FHLB advance and incurred a prepayment penalty of $1.8 million. The advance, which carried an interest rate equal to 90-day LIBOR plus 2.56% and reset quarterly, was replaced with a $15.0 million three month fixed rate advance. As a result of the restructuring, the interest rate on the advance was reduced by 2.58% resulting in expected incremental pre-tax annual earnings of approximately $0.4 million.
Expenses for FDIC deposit insurance decreased $0.4 million, or 28.5%, for 2015 compared to 2014 as a result of a reduction in our assessment rates due to an improving risk profile.
During 2015, we recognized $0.3 million in merger-related expenses for our completed acquisition of two branch locations in South Carolina and our pending acquisition of Old Town Bank. We did not have any merger related expenses during 2014.
Other expenses increased $1.1 million, or 34.9%, for 2015 compared to 2014 primarily as a result of increased expenses for rebranding the Bank as Entegra Bank and increased franchise taxes for the state of North Carolina due to our increased amount of equity compared to prior years.
Income Taxes
We recorded $16.7 million of income tax benefit for the year ended December 31, 2015, primarily reflecting the reversal of $18.9 million in valuation allowance which was partially offset by deferred tax expense. We continue to be in a net operating loss position for federal and state income tax purposes and do not have a material current tax liability or receivable.
| 68 |
Off-Balance Sheet Arrangements
In the normal course of operations, we engage in a variety of financial transactions that, in accordance with GAAP, are not recorded in the financial statements, or are recorded in amounts that differ from the notional amounts. These transactions involve, to varying degrees, elements of credit, interest rate, and liquidity risk. Such transactions are used by the company for general corporate purposes or for customer needs. General corporate purpose transactions include transactions to help manage credit, interest rate, and liquidity risk or to optimize capital. Customer transactions include transactions to manage customers’ requests for funding. Please refer to Note 25 of the Notes to Consolidated Financial Statements for a discussion of our off-balance sheet arrangements.
Liquidity and Capital Resources
Liquidity is the ability to meet current and future financial obligations. Our primary sources of funds consist of deposit inflows, loan repayments, advances from the FHLB, proceeds from the sale of loans originated for sale, and principal repayments and the sale of available-for-sale securities. While maturities and scheduled amortization of loans and securities are predictable sources of funds, deposit flows and mortgage prepayments are greatly influenced by general interest rates, economic conditions and competition. Our Asset/Liability Management Committee, under the direction of our Chief Financial Officer, is responsible for establishing and monitoring our liquidity targets and strategies in order to ensure that sufficient liquidity exists for meeting the borrowing needs and deposit withdrawals of our customers as well as unanticipated contingencies. We believe that we have enough sources of liquidity to satisfy our short- and long-term liquidity needs as of December 31, 2016.
We regularly monitor and adjust our investments in liquid assets based upon our assessment of expected loan demand, expected deposit flows and borrowing maturities, yields available on interest-earning deposits and securities, and the objectives of our asset/liability management program. Excess liquid assets are invested generally in FHLB and Federal Reserve Bank (“FRB”) interest-earning deposits and investment securities and are also used to pay off short-term borrowings. At December 31, 2016, cash and cash equivalents totaled $43.3 million. Included in this total was $28.9 million held at FRB and $2.8 million held at the FHLB in interest-earning accounts.
| 69 |
Our cash flows are derived from operating activities, investing activities and financing activities as reported in our Consolidated Statements of Cash Flows included in our Consolidated Financial Statements. The following summarizes the most significant sources and uses of liquidity during the years ended December 31, 2016 and 2015:
| Year Ended December 31, | ||||||||
| 2016 | 2015 | |||||||
| (Dollars in thousands) | ||||||||
| Operating activities: | ||||||||
| Loans originated for sale | $ | (40,288 | ) | $ | (35,649 | ) | ||
| Proceeds from loans originated for sale | 45,884 | 39,659 | ||||||
| Investing activities: | ||||||||
| Purchases of investments | $ | (267,263 | ) | $ | (129,960 | ) | ||
| Maturities and principal repayments of investments | 46,246 | 56,638 | ||||||
| Sales of investments | 124,823 | 39,022 | ||||||
| Net increase in loans | (56,829 | ) | (59,002 | ) | ||||
| Purchase of loans | — | (25,189 | ) | |||||
| Net cash received in branch acquisition | — | 31,878 | ||||||
| Net cash paid in business combination | (5,912 | ) | — | |||||
| Purchase of bank owned life insurance | (10,000 | ) | — | |||||
| Financing activities: | ||||||||
| Net increase (decrease) in deposits | $ | 24,973 | $ | (26,372 | ) | |||
| Proceeds from FHLB advances | 795,600 | 245,600 | ||||||
| Repayment of FHLB advances | (659,625 | ) | (152,100 | ) | ||||
| Purchase of common stock | (1,922 | ) | — | |||||
At December 31, 2016, we had $34.6 million in outstanding commitments to originate loans. In addition to commitments to originate loans, we had $112.1 million in unused lines of credit.
Depending on market conditions, we may be required to pay higher rates on our deposits or other borrowings than we currently pay on certificates of deposit. Based on historical experience and current market interest rates, we anticipate that following their maturity we will retain a large portion of our retail certificates of deposit with maturities of one year or less as of December 31, 2016.
In addition to loans, we invest in securities that provide a source of liquidity, both through repayments and as collateral for borrowings. Our securities portfolio includes both callable securities (which allow the issuer to exercise call options) and mortgage-backed securities (which allow borrowers to prepay loans). Accordingly, a decline in interest rates would likely prompt issuers to exercise call options and borrowers to prepay higher-rate loans, producing higher than otherwise scheduled cash flows.
Liquidity management is both a daily and long-term function of management. If we require more funds than we are able to generate locally, we have borrowing agreements with the FHLB and the FRB discount window. The following summarizes our borrowing capacity as of December 31, 2016:
| Total | Used | Unused | ||||||||||
| (Dollars in thousands) | Capacity | Capacity | Capacity | |||||||||
| FHLB | $ | 312,423 | $ | 298,500 | $ | 13,923 | ||||||
| FRB | 48,882 | — | 48,882 | |||||||||
| Fed funds lines | 15,000 | — | 15,000 | |||||||||
| Unpledged Marketable Securities | 398,291 | 237,099 | 161,192 | |||||||||
| $ | 774,596 | $ | 535,599 | $ | 238,997 | |||||||
In July 2013, federal bank regulatory agencies issued final rules to revise their risk-based capital requirements and the method for calculating risk-weighted assets to make them consistent with agreements that were reached by the Basel Committee on Banking Supervision and certain provisions of the Dodd-Frank Act (“Basel III”). On January 1, 2015, the Basel III rules became effective and include transition provisions which implement certain portions of the rules through January 1, 2019.
| 70 |
The final rule also includes changes in what constitutes regulatory capital, some of which are subject to a transition period. These changes include the phasing-out of certain instruments as qualifying capital. In addition, Tier 2 capital is no longer limited to the amount of Tier 1 capital included in total capital. Mortgage servicing rights, certain deferred tax assets and investments in unconsolidated subsidiaries over designated percentages of common stock are required to be deducted from capital, subject to a transition period. Finally, common equity Tier 1 capital includes accumulated other comprehensive income (which includes all unrealized gains and losses on available-for-sale debt and equity securities), subject to a transition period and a one-time opt-out election. The Bank elected to opt-out of this provision. As such, accumulated comprehensive income is not included in the Bank’s Tier 1 capital.
The Bank is subject to various regulatory capital requirements, including a risk-based capital measure. The risk-based guidelines and framework under prompt corrective action provisions include both a definition of capital and a framework for calculating risk-weighted assets by assigning balance sheet assets and off-balance sheet items to broad risk categories.
When Basel III is fully phased in on January 1, 2019, the Company and the Bank will be required to maintain a 2.5% capital conservation buffer which is designed to absorb losses during periods of economic distress. This capital conservation buffer is comprised entirely of Common Equity Tier 1 Capital and is in addition to minimum risk-weighted asset ratios. See “Net Worth and Capital Adequacy Requirements Applicable to the Bank”.
The tables below summarize capital ratios and related information in accordance with Basel III as measured at December 31, 2016 and December 31, 2015, and in accordance with the previous rules at December 31, 2014.
The following table summarizes the required and actual capital ratios of the Bank as of the dates indicated:
| Actual | For Capital Adequacy Purposes | To Be Well- Capitalized Under Prompt Corrective Action Provisions | ||||||||||||||||||||||
| (Dollars in thousands) | Amount | Ratio | Amount | Ratio (1) | Amount | Ratio | ||||||||||||||||||
| As of December 31, 2016: | ||||||||||||||||||||||||
| Tier 1 Leverage Capital | $ | 138,402 | 11.06 | % | $ | 50,034 | >4.0 | % | $ | 62,542 | >5 | % | ||||||||||||
| Common Equity Tier 1 Capital | $ | 138,402 | 16.33 | % | $ | 38,150 | >5.125 | % | $ | 55,106 | >6.5 | % | ||||||||||||
| Tier 1 Risk-based Capital | $ | 138,402 | 16.33 | % | $ | 50,867 | >6.625 | % | $ | 67,823 | >8 | % | ||||||||||||
| Total Risk-based Capital | $ | 147,807 | 17.43 | % | $ | 67,823 | >8.625 | % | $ | 84,778 | >10 | % | ||||||||||||
| As of December 31, 2015: | ||||||||||||||||||||||||
| Tier 1 Leverage Capital | $ | 118,251 | 12.05 | % | $ | 39,270 | >4 | % | $ | 49,087 | >5 | % | ||||||||||||
| Common Equity Tier 1 Capital | $ | 118,251 | 18.07 | % | $ | 29,443 | >4.5 | % | $ | 42,529 | >6.5 | % | ||||||||||||
| Tier 1 Risk-based Capital | $ | 118,251 | 18.07 | % | $ | 39,257 | >6 | % | $ | 52,343 | >8 | % | ||||||||||||
| (1) | – As of December 31, 2016, includes capital conservation buffer of 0.625%. On a fully phased in basis, effective January 1, 2019, under Basel III, minimum capital ratios to be considered “adequately capitalized” including the capital conservation buffer of 2.5% will be as follows: Tier 1 Leverage Capital – 4.0%; Common Equity Tier 1 Capital – 7.0%; Tier 1 Risk-based Capital – 8.5%; and Total Risk-based Capital – 10.5%. |
| 71 |
The following table summarizes the required and actual capital ratios of the Company as of the dates indicated:
| Actual | For Capital Adequacy Purposes | |||||||||||||||
| (Dollars in thousands) | Amount | Ratio | Amount | Ratio (1) | ||||||||||||
| As of December 31, 2016: | ||||||||||||||||
| Tier I Leverage Capital | $ | 141,013 | 11.28 | % | $ | 50,220 | >4.0 | % | ||||||||
| Common Equity Tier 1 Capital | $ | 130,079 | 15.33 | % | $ | 38,188 | >5.125 | % | ||||||||
| Tier I Risk-based Capital | $ | 141,013 | 16.62 | % | $ | 50,918 | >6.625 | % | ||||||||
| Total Risk Based Capital | $ | 150,418 | 17.72 | % | $ | 67,891 | >8.625 | % | ||||||||
| As of December 31, 2015: | ||||||||||||||||
| Tier I Leverage Capital | $ | 136,063 | 13.85 | % | $ | 39,291 | >4 | % | ||||||||
| Common Equity Tier 1 Capital | $ | 128,007 | 19.55 | % | $ | 29,468 | >4.5 | % | ||||||||
| Tier I Risk-based Capital | $ | 136,063 | 20.78 | % | $ | 39,291 | >6 | % | ||||||||
| Total Risk Based Capital | $ | 144,343 | 22.04 | % | $ | 52,388 | >8 | % | ||||||||
| (1) | – As of December 31, 2016, includes capital conservation buffer of 0.625%. On a fully phased in basis, effective January 1, 2019, under Basel III, minimum capital ratios to be considered “adequately capitalized” including the capital conservation buffer of 2.5% will be as follows: Tier 1 Leverage Capital – 4.0%; Common Equity Tier 1 Capital – 7.0%; Tier 1 Risk-based Capital – 8.5%; and Total Risk-based Capital – 10.5%. |
Contractual Obligations
The following table presents payment schedules for certain of our contractual obligations as of December 31, 2016. Long-term obligations totaling $312.9 million include junior subordinated debt. Operating lease obligations of $0.05 million pertain to banking facilities.
| (Dollars in thousands) | Total | Less than 1 year | 1-3 years | 3-5 years | More than 5 years | |||||||||||||||
| Long-term debt obligations* | $ | 312,933 | $ | 273,500 | $ | 25,000 | $ | — | $ | 14,433 | ||||||||||
| Operating lease obligations | 49 | 49 | — | — | — | |||||||||||||||
| Total | $ | 312,982 | $ | 273,549 | $ | 25,000 | $ | — | $ | 14,433 | ||||||||||
* - Represents principal maturities
Item 7A. Quantitative and Qualitative Disclosure About Market Risk
General
One of the most significant forms of market risk is interest rate risk because, as a financial institution, the majority of our assets and liabilities are sensitive to changes in interest rates. Interest rate fluctuations affect earnings by changing net interest income and other interest –sensitive income and expense levels. Interest rate changes affect economic value of equity (“EVE”) by changing the net present value of a bank’s future cash flows, and the cash flows themselves as rates change. Accepting this risk is a normal part of banking and can be an important source of profitability and shareholder value. However, excessive risk can threaten a bank’s earnings, capital, liquidity and solvency. Therefore, a principal part of our operations is to manage interest rate risk and limit the exposure of our net interest income to changes in market interest rates. The Board of Directors of the Bank have established an Asset/Liability Management Committee (“ALCO”), which is responsible for evaluating the interest rate risk inherent in our assets and liabilities, for determining the level of risk that is appropriate, given our business strategy, operating environment, capital, liquidity and performance objectives, and for managing this risk consistent with the guidelines approved by the Board. Our ALCO monitors and manages market risk through rate shock analyses, economic value of equity, or EVE, analyses and simulations in order to avoid unacceptable earnings and market value fluctuations due to changes in interest rates.
| 72 |
One of the primary ways we manage interest rate risk is by selling the majority of our long-term fixed rate mortgages into the secondary markets, obtaining commitments to sell at locked-in interest rates prior to issuing a loan commitment. From a funding perspective, we expect to satisfy the majority of our future requirements with retail deposit growth, including checking and savings accounts, money market accounts and certificates of deposit generated within our primary markets. Deposits, exclusive of brokered certificates of deposit, increased to $815.2 million at December 31, 2016, from $716.6 million at December 31, 2015. Brokered deposits increased to $14.8 million at December 31, 2016 from zero at December 31, 2015. If our funding needs exceed our deposits, we will utilize our excess funding capacity with the FHLB and the FRB.
We have taken the following steps to reduce our interest rate risk:
| • | increased our personal and business checking accounts and our money market accounts, which are less rate-sensitive than certificates of deposit and which provide us with a stable, low-cost source of funds; |
| • | limited the fixed rate period on loans within our portfolio |
| • | utilized our securities portfolio for positioning based on projected interest rate environments; |
| • | priced certificates of deposit to encourage customers to extend to longer terms; |
| • | engaged in interest rate swap agreements; |
| • | utilized FHLB advances for positioning. |
We have not conducted speculative hedging activities, such as engaging in futures or options.
Economic Value of Equity (EVE)
EVE is the difference between the present value of an institution’s assets and liabilities (the institution’s EVE) that would change in the event of a range of assumed changes in market interest rates. EVE is used to monitor interest rate risk beyond the 12 month time horizon of income simulations. The simulation model uses a discounted cash flow analysis and an option-based pricing approach to measure the interest rate sensitivity of EVE. The model estimates the economic value of each type of asset, liability and off-balance sheet contract using the current interest rate yield curve with instantaneous increases or decreases of 100 to 400 basis points in 100 basis point increments. A basis point equals one-hundredth of one percent, and 100 basis points equals one percent. An increase in interest rates from 3% to 4% would mean, for example, a 100 basis point increase in the “Change in Interest Rates” column below. Given the current relatively low level of market interest rates, an NPV calculation for an interest rate decrease of greater than 100 basis points has not been prepared.
Certain shortcomings are inherent in the methodologies used in determining interest rate risk through changes in EVE. Modeling changes in EVE require making certain assumptions that may or may not reflect the manner in which actual yields and costs, or loan repayments and deposit decay, respond to changes in market interest rates. In this regard, the EVE information presented assumes that the composition of our interest-sensitive assets and liabilities existing at the beginning of a period remains constant over the period being measured and assumes that a particular change in interest rates is reflected across the yield curve regardless of the duration or repricing of specific assets and liabilities. Accordingly, although the EVE information provides an indication of our interest rate risk exposure at a particular point in time, such measurements are not intended to and do not provide a precise forecast of the effect of changes in market interest rates on our net interest income and will differ from actual results.
Net Interest Income
In addition to an EVE analysis, we analyze the impact of changing rates on our net interest income. Using our balance sheet as of a given date, we analyze the repricing components of individual assets, and adjusting for changes in interest rates at 100 basis point increments, we analyze the impact on our net interest income. Changes to our net interest income are shown in the following table based on immediate changes to interest rates in 100 basis point increments.
| 73 |
The table below reflects the impact of an immediate increase in interest rates in 100 basis point increments on Pretax Net Interest Income (NII) and Economic Value of Equity (EVE).
| December 31, 2016 | December 31, 2015 | ||||||||||||||||
| Change in Interest Rates (basis points) | % Change in Pretax Net Interest Income | % Change in Economic Value of Equity | % Change in Pretax Net Interest Income | % Change in Economic Value of Equity | |||||||||||||
| +400 | (9.2 | ) | (15.2 | ) | 4.9 | (14.5 | ) | ||||||||||
| +300 | (6.6 | ) | (11.7 | ) | 3.5 | (11.6 | ) | ||||||||||
| +200 | (4.2 | ) | (7.9 | ) | 2.0 | (9.1 | ) | ||||||||||
| +100 | (2.1 | ) | (4.7 | ) | 0.8 | (5.9 | ) | ||||||||||
| — | — | — | — | — | |||||||||||||
| -100 | (1.7 | ) | 8.7 | (2.5 | ) | 10.7 | |||||||||||
The results from the rate shock analysis on NII are consistent with having a liability sensitive balance sheet. Having a liability sensitive balance sheet means liabilities will reprice at a faster pace than assets during the short-term horizon. The implications of a liability sensitive balance sheet will differ depending upon the change in market rates. For example, with a liability sensitive balance sheet in a declining interest rate environment, the interest rate on liabilities will decrease at a faster pace than assets. This situation generally results in an increase in NII and operating income. Conversely, with a liability sensitive balance sheet in a rising interest rate environment, the interest rate on liabilities will increase at a faster pace than assets. This situation generally results in a decrease in NII and operating income. As indicated in the table above, a 200 basis point increase in rates would result in a 4.2% decrease in NII as of December 31, 2016 as compared to a 2.0% increase in NII as of December 31, 2015, suggesting that there is no benefit for the Company to net interest income in rising interest rates The Company generally seeks to remain neutral to the impact of changes in interest rates by maximizing current earnings while balancing the risk of changes in interest rates.
The results from the rate shock analysis on EVE are consistent with a balance sheet whose assets have a longer maturity than its liabilities. Like most financial institutions, we generally invest in longer maturity assets as compared to our liabilities in order to earn a higher return on our assets than we pay on our liabilities. This is because interest rates generally increase as the time to maturity increases, assuming a normal, upward sloping yield curve. In a rising interest rate environment, this results in a negative EVE because higher interest rates will reduce the present value of longer term assets more than it will reduce the present value of shorter term liabilities, resulting in a negative impact on equity. As noted in the table above, our exposure to higher interest rates from an EVE or present value perspective has decreased slightly from December 31, 2015 to December 31, 2016 in the event interest rates decline by 100 basis points and increase by 100 and 200 basis points. For example, a 200 basis point increase in rates would result in a 7.9% decrease in EVE as of December 31, 2016 as compared to a 9.1% decrease in EVE as of December 31, 2015. Our exposure increases slightly with 300 or 400 basis point increase in rates. This is indicative of a longer maturity or repricing asset base.
| 74 |
Item 8. Financial Statements and Supplementary Data

REPORT OF INDEPENDENT REGISTERED PUBLIC ACCOUNTING FIRM
The
Board of Directors
Entegra Financial Corp. and Subsidiary
Franklin, North Carolina
We have audited the accompanying consolidated financial statements of Entegra Financial Corp. and Subsidiary (the “Company”) which comprise the consolidated balance sheets as of December 31, 2016 and 2015, and the related consolidated statements of operations, comprehensive income (loss), shareholders’ equity, and cash flows for each of the years in the three year period ended December 31, 2016. These consolidated financial statements are the responsibility of the Company’s management. Our responsibility is to express an opinion on these consolidated financial statements based on our audits.
We conducted our audits in accordance with standards of the Public Company Accounting Oversight Board (United States). Those standards require that we plan and perform the audit to obtain reasonable assurance about whether the financial statements are free of material misstatement. An audit includes examining, on a test basis, evidence supporting the amounts and disclosures in the financial statements, assessing the accounting principles used and significant estimates made by management, as well as evaluating the overall financial statement presentation. We believe that our audits provide a reasonable basis for our opinion.
In our opinion, the consolidated financial statements referred to above present fairly, in all material respects, the financial position of Entegra Financial Corp and Subsidiary as of December 31, 2016 and 2015, and the results of their operations and their cash flows for each of the years in the three-year period ended December 31, 2016, in conformity with accounting principles generally accepted in the United States of America.
/s/ Dixon Hughes Goodman LLP
Atlanta,
Georgia
March 15, 2017
| 75 |
ENTEGRA FINANCIAL CORP. AND SUBSIDIARY
(Dollars in thousands)
| December 31, | ||||||||
| 2016 | 2015 | |||||||
| Assets | ||||||||
| Cash and due from banks | $ | 10,709 | $ | 8,421 | ||||
| Interest-earning deposits | 32,585 | 32,229 | ||||||
| Cash and cash equivalents | 43,294 | 40,650 | ||||||
| Investments - trading | 5,211 | 4,714 | ||||||
| Investments - available for sale | 398,291 | 238,862 | ||||||
| Investments - held to maturity (fair value of $41,812 at December 31, 2015 ) | — | 41,164 | ||||||
| Other investments, at cost | 15,261 | 8,834 | ||||||
| Loans held for sale | 4,584 | 8,348 | ||||||
| Loans receivable, net | 744,361 | 624,072 | ||||||
| Allowance for loan losses | (9,305 | ) | (9,461 | ) | ||||
| Fixed assets, net | 20,209 | 17,673 | ||||||
| Real estate owned | 4,226 | 5,369 | ||||||
| Interest receivable | 5,012 | 3,554 | ||||||
| Bank owned life insurance | 31,347 | 20,858 | ||||||
| Net deferred tax asset | 18,985 | 18,830 | ||||||
| Loan servicing rights | 2,603 | 2,344 | ||||||
| Goodwill | 2,065 | 711 | ||||||
| Core deposit intangible | 979 | 590 | ||||||
| Other assets | 5,754 | 4,304 | ||||||
| Total assets | $ | 1,292,877 | $ | 1,031,416 | ||||
| Liabilities and Shareholders’ Equity | ||||||||
| Liabilities: | ||||||||
| Deposits | $ | 830,013 | $ | 716,617 | ||||
| Federal Home Loan Bank advances | 298,500 | 153,500 | ||||||
| Junior subordinated notes | 14,433 | 14,433 | ||||||
| Other borrowings | 2,725 | 2,198 | ||||||
| Post employment benefits | 10,211 | 10,224 | ||||||
| Accrued interest payable | 254 | 213 | ||||||
| Other liabilities | 3,673 | 2,762 | ||||||
| Total liabilities | 1,159,809 | 899,947 | ||||||
| Commitments and contingencies (Notes 8 and 25) | ||||||||
| Shareholders’ Equity: | ||||||||
| Preferred stock - no par value, 10,000,000 shares authorized; none issued and outstanding | — | — | ||||||
| Common stock - no par value, 50,000,000 shares authorized; 6,467,550 and 6,546,375 shares issued and outstanding as of December 31, 2016 and 2015, respectively | — | — | ||||||
| Common stock held by Rabbi Trust, at cost; 14,000 shares at December 31, 2016 and 2015 | (279 | ) | (279 | ) | ||||
| Additional paid in capital | 62,664 | 63,722 | ||||||
| Retained earnings | 76,139 | 69,763 | ||||||
| Accumulated other comprehensive loss | (5,456 | ) | (1,736 | ) | ||||
| Total shareholders’ equity | 133,068 | 131,469 | ||||||
| Total liabilities and shareholders’ equity | $ | 1,292,877 | $ | 1,031,416 | ||||
The accompanying notes are an integral part of the consolidated financial statements
| 76 |
ENTEGRA FINANCIAL CORP. AND SUBSIDIARY
CONSOLIDATED STATEMENTS OF OPERATIONS
(Dollars in thousands, except per share data)
| Years Ended December 31, | ||||||||||||
| 2016 | 2015 | 2014 | ||||||||||
| Interest income: | ||||||||||||
| Interest and fees on loans | $ | 32,324 | $ | 27,027 | $ | 27,597 | ||||||
| Interest on tax exempt loans | 337 | 141 | 68 | |||||||||
| Taxable securities | 5,628 | 5,223 | 4,139 | |||||||||
| Tax-exempt securities | 1,510 | 379 | 347 | |||||||||
| Interest-earning deposits | 210 | 75 | 95 | |||||||||
| Other | 511 | 299 | 199 | |||||||||
| Total interest and dividend income | 40,520 | 33,144 | 32,445 | |||||||||
| Interest expense: | ||||||||||||
| Deposits | 3,964 | 4,334 | 5,361 | |||||||||
| Federal Home Loan Bank advances | 1,419 | 826 | 703 | |||||||||
| Junior subordinated notes | 532 | 458 | 509 | |||||||||
| Other borrowings | 117 | 105 | — | |||||||||
| Total interest expense | 6,032 | 5,723 | 6,573 | |||||||||
| Net interest income | 34,488 | 27,421 | 25,872 | |||||||||
| Provision for loan losses | 274 | (1,500 | ) | 33 | ||||||||
| Net interest income after provision for loan losses | 34,214 | 28,921 | 25,839 | |||||||||
| Noninterest income: | ||||||||||||
| Servicing income, net | 487 | 341 | 565 | |||||||||
| Mortgage banking | 904 | 774 | 800 | |||||||||
| Gain on sale of SBA loans | 928 | 823 | 629 | |||||||||
| Gain on sale of investments, net | 1,216 | 403 | 657 | |||||||||
| Other than temporary impairment on cost method investment | — | (3 | ) | (76 | ) | |||||||
| Service charges on deposit accounts | 1,537 | 1,269 | 1,203 | |||||||||
| Interchange fees | 1,507 | 1,278 | 1,126 | |||||||||
| Bank owned life insurance | 489 | 457 | 456 | |||||||||
| Other | 778 | 453 | 719 | |||||||||
| Total noninterest income | 7,846 | 5,795 | 6,079 | |||||||||
| Noninterest expenses: | ||||||||||||
| Compensation and employee benefits | 17,164 | 14,625 | 11,843 | |||||||||
| Net occupancy | 3,534 | 2,986 | 2,697 | |||||||||
| Federal Home Loan Bank prepayment penalties | 118 | 1,762 | — | |||||||||
| Marketing and advertising | 1,070 | 535 | 333 | |||||||||
| Federal deposit insurance | 562 | 905 | 1,265 | |||||||||
| Professional and advisory | 959 | 1,005 | 722 | |||||||||
| Data processing | 1,554 | 1,213 | 1,082 | |||||||||
| Merger-related expenses | 2,197 | 329 | — | |||||||||
| Net cost of operation of real estate owned | 730 | 505 | 2,970 | |||||||||
| Other | 4,301 | 3,765 | 2,855 | |||||||||
| Total noninterest expenses | 32,189 | 27,630 | 23,767 | |||||||||
| Income before taxes | 9,871 | 7,086 | 8,151 | |||||||||
| Income tax expense (benefit) | 3,495 | (16,739 | ) | 2,208 | ||||||||
| Net income | $ | 6,376 | $ | 23,825 | $ | 5,943 | ||||||
| Earnings per common share: | ||||||||||||
| Basic | $ | 0.98 | $ | 3.64 | $ | 0.91 | ||||||
| Diluted | $ | 0.98 | $ | 3.64 | $ | 0.91 | ||||||
| Weighted average common shares outstanding: | ||||||||||||
| Basic | 6,477,284 | 6,546,375 | 6,546,375 | |||||||||
| Diluted | 6,489,931 | 6,546,375 | 6,546,375 | |||||||||
The accompanying notes are an integral part of the consolidated financial statements
| 77 |
ENTEGRA FINANCIAL CORP. AND SUBSIDIARY
CONSOLIDATED STATEMENTS OF COMPREHENSIVE INCOME
(Dollars in thousands)
| Years Ended December 31, | ||||||||||||
| 2016 | 2015 | 2014 | ||||||||||
| Net income | $ | 6,376 | $ | 23,825 | $ | 5,943 | ||||||
| Other comprehensive income (loss): | ||||||||||||
| Change in unrealized holding gains and losses on securities available for sale | (6,652 | ) | (166 | ) | 5,665 | |||||||
| Reclassification adjustment for securities gains realized in net income | (1,216 | ) | (403 | ) | (657 | ) | ||||||
| Amortization of unrealized loss on securities transferred to held to maturity | 578 | 984 | 199 | |||||||||
| Reduction in unrealized loss related to held to maturity securities transferred to available-for-sale | 325 | — | — | |||||||||
| Change in deferred tax valuation allowance attributable to unrealized gains and losses on investment securities available for sale | 377 | 289 | 1,992 | |||||||||
| Change in unrealized holding gains and losses on cash flow hedge | 476 | |||||||||||
| Other comprehensive income (loss), before tax | (6,112 | ) | 704 | 7,199 | ||||||||
| Income tax effect related to items of other comprehensive income (loss) | 2,392 | (171 | ) | (1,992 | ) | |||||||
| Other comprehensive income (loss), after tax | (3,720 | ) | 533 | 5,207 | ||||||||
| Comprehensive income | $ | 2,656 | $ | 24,358 | $ | 11,150 | ||||||
The accompanying notes are an integral part of the consolidated financial statements
| 78 |
ENTEGRA FINANCIAL CORP. AND SUBSIDIARY
CONSOLIDATED STATEMENTS OF CHANGES IN SHAREHOLDERS’ EQUITY
(Dollars in thousands)
| Common Stock | ||||||||||||||||||||||||||||
| Shares | Amount | Additional
Paid in Capital | Retained
Earnings | Accumulated Other Comprehensive Income (loss) | Common
Stock held by Rabbi Trust | Total | ||||||||||||||||||||||
| Balance, December 31, 2013 | — | $ | — | $ | — | $ | 39,994 | $ | (7,476 | ) | $ | — | $ | 32,518 | ||||||||||||||
| Net income | — | — | — | 5,943 | — | — | 5,943 | |||||||||||||||||||||
| Other comprehensive income, net of tax | — | — | — | — | 5,207 | — | 5,207 | |||||||||||||||||||||
| Issuance of common stock | 6,546,375 | — | 65,464 | — | — | — | 65,464 | |||||||||||||||||||||
| Common stock issuance costs | — | — | (1,813 | ) | — | — | — | (1,813 | ) | |||||||||||||||||||
| Balance, December 31, 2014 | 6,546,375 | $ | — | $ | 63,651 | $ | 45,937 | $ | (2,269 | ) | $ | — | $ | 107,319 | ||||||||||||||
| Net income | — | — | — | 23,825 | — | — | 23,825 | |||||||||||||||||||||
| Other comprehensive income, net of tax | — | — | — | — | 533 | — | 533 | |||||||||||||||||||||
| Stock compensation expense | — | — | 71 | — | — | — | 71 | |||||||||||||||||||||
| Purchase of stock to fund Rabbi Trust | — | — | — | — | — | (279 | ) | (279 | ) | |||||||||||||||||||
| Balance, December 31, 2015 | 6,546,375 | $ | — | $ | 63,722 | $ | 69,763 | $ | (1,736 | ) | $ | (279 | ) | $ | 131,469 | |||||||||||||
| Net income | — | — | — | 6,376 | — | — | 6,376 | |||||||||||||||||||||
| Other comprehensive income (loss), net of tax | — | — | — | — | (3,720 | ) | — | (3,720 | ) | |||||||||||||||||||
| Stock compensation expense | — | — | 864 | — | — | — | 864 | |||||||||||||||||||||
| Vesting of restricted stock units, net of 4,477 shares surrendered | 25,743 | — | (87 | ) | — | — | — | (87 | ) | |||||||||||||||||||
| Repurchase of common stock | (104,568 | ) | — | (1,835 | ) | — | — | — | (1,835 | ) | ||||||||||||||||||
| Balance, December 31, 2016 | 6,467,550 | $ | — | $ | 62,664 | $ | 76,139 | $ | (5,456 | ) | $ | (279 | ) | $ | 133,068 | |||||||||||||
The accompanying notes are an integral part of the consolidated financial statements
| 79 |
ENTEGRA FINANCIAL CORP. AND SUBSIDIARY
CONSOLIDATED STATEMENTS OF CASH FLOWS
(Dollars in thousands)
| For the Years Ended December 31, | ||||||||||||
| 2016 | 2015 | 2014 | ||||||||||
| Cash flows from operating activities: | ||||||||||||
| Net income | $ | 6,376 | $ | 23,825 | $ | 5,943 | ||||||
| Adjustments to reconcile net income to net cash provided by operating activities: | ||||||||||||
| Depreciation and amortization | 1,096 | 1,002 | 875 | |||||||||
| Security amortization, net | 2,445 | 2,046 | 1,159 | |||||||||
| Trading account income | (328 | ) | — | — | ||||||||
| Provision for loan losses | 274 | (1,500 | ) | 33 | ||||||||
| Provision for real estate owned | 655 | 250 | 2,349 | |||||||||
| Share-based compensation expense | 864 | 71 | — | |||||||||
| Change in net deferred tax asset | 2,922 | (16,437 | ) | 2,121 | ||||||||
| Net increase (decrease) in deferred loan fees | (465 | ) | (307 | ) | 237 | |||||||
| Gain on sales of securities available for sale | (1,216 | ) | (403 | ) | (657 | ) | ||||||
| Other than temporary impairment on cost method investment | — | 3 | 76 | |||||||||
| Loss on disposal of fixed assets | — | 3 | 8 | |||||||||
| Income on bank owned life insurance, net | (489 | ) | (441 | ) | (456 | ) | ||||||
| Mortgage banking income, net | (904 | ) | (774 | ) | (800 | ) | ||||||
| Gain on sales of SBA loans | (928 | ) | (823 | ) | (629 | ) | ||||||
| Net realized (gain) loss on sale of real estate owned | (222 | ) | (71 | ) | 49 | |||||||
| Loans originated for sale | (40,288 | ) | (35,649 | ) | (31,939 | ) | ||||||
| Proceeds from sale of loans originated for sale | 45,884 | 39,659 | 28,295 | |||||||||
| Net change in operating assets and liabilities: | ||||||||||||
| Interest receivable | (906 | ) | (629 | ) | (252 | ) | ||||||
| Loan servicing rights | (259 | ) | (157 | ) | (304 | ) | ||||||
| Other assets | 1,500 | (1,439 | ) | (544 | ) | |||||||
| Postemployment benefits | (13 | ) | 465 | (440 | ) | |||||||
| Accrued interest payable | 11 | (110 | ) | (1,700 | ) | |||||||
| Other liabilities | 628 | 1,225 | 18 | |||||||||
| Net cash provided by operating activities | $ | 16,637 | $ | 9,809 | $ | 3,442 | ||||||
The accompanying notes are an integral part of the consolidated financial statements
| 80 |
ENTEGRA FINANCIAL CORP. AND SUBSIDIARY
CONSOLIDATED STATEMENTS OF CASH FLOWS (continued)
(Dollars in thousands)
| For the Years Ended December 31, | ||||||||||||
| 2016 | 2015 | 2014 | ||||||||||
| Cash flows from investing activities: | ||||||||||||
| Activity for investment securities: | ||||||||||||
| Purchases | $ | (267,263 | ) | $ | (129,960 | ) | $ | (115,617 | ) | |||
| Maturities/calls and principal repayments | 46,246 | 56,638 | 30,484 | |||||||||
| Sales | 124,823 | 39,022 | 19,170 | |||||||||
| Purchase of trading securities | — | (4,714 | ) | — | ||||||||
| Net (increase) decrease in loans | (56,829 | ) | (59,002 | ) | (17,477 | ) | ||||||
| Purchased loans | — | (25,189 | ) | — | ||||||||
| Net cash received in branch acquisition | — | 31,878 | — | |||||||||
| Proceeds from sale of real estate owned | 2,173 | 1,495 | 4,355 | |||||||||
| Real estate cost capitalized | — | (83 | ) | (68 | ) | |||||||
| Purchase of fixed assets | (357 | ) | (3,556 | ) | (881 | ) | ||||||
| Disposal of real estate held for investments | — | 2,430 | — | |||||||||
| Purchase of other investments, at cost | (5,873 | ) | (4,076 | ) | (1,462 | ) | ||||||
| Redemptions of other investments, at cost | — | 150 | 213 | |||||||||
| Net cash paid in business combination | (5,913 | ) | — | — | ||||||||
| Purchase of bank owned life insurance | (10,000 | ) | — | — | ||||||||
| Net cash used in investing activities | $ | (172,993 | ) | $ | (94,967 | ) | $ | (81,283 | ) | |||
| Cash flows from financing activities: | ||||||||||||
| Net increase (decrease) in deposits | $ | 24,973 | $ | (26,372 | ) | $ | 18,855 | |||||
| Net increase (decrease) in escrow deposits | (26 | ) | (23 | ) | 36 | |||||||
| Proceeds from FHLB advances | 795,600 | 245,600 | 20,000 | |||||||||
| Repayment of FHLB advances | (659,625 | ) | (152,100 | ) | — | |||||||
| Purchase of common stock for Rabbi Trust | — | (279 | ) | — | ||||||||
| Proceeds from sale of common stock | — | — | 63,651 | |||||||||
| Repurchase of common stock | (1,922 | ) | — | — | ||||||||
| Net cash provided by financing activities | $ | 159,000 | $ | 66,826 | $ | 102,542 | ||||||
| Increase(decrease) in cash and cash equivalents | 2,644 | (18,332 | ) | 24,701 | ||||||||
| Cash and cash equivalents, beginning of year | $ | 40,650 | $ | 58,982 | $ | 34,281 | ||||||
| Cash and cash equivalents, end of year | $ | 43,294 | $ | 40,650 | $ | 58,982 | ||||||
| Supplemental disclosures of cash flow information: | ||||||||||||
| Cash paid during the year for: | ||||||||||||
| Interest on deposits and other borrowings | $ | 6,021 | $ | 5,833 | $ | 8,273 | ||||||
| Income taxes | $ | 150 | $ | — | $ | 150 | ||||||
| Acquisitions | ||||||||||||
| Assets acquired | $ | 110,010 | $ | — | $ | — | ||||||
| Liabilities assumed | $ | 97,878 | $ | — | $ | — | ||||||
| Net assets | $ | 12,132 | $ | — | $ | — | ||||||
| Noncash investing and financing activities: | ||||||||||||
| Real estate acquired in satisfaction of mortgage loans | $ | 748 | $ | 3,350 | $ | 2,200 | ||||||
| Loans originated for disposition of real estate owned | 208 | 3,260 | 1,596 | |||||||||
| Transfer of investment securities available for sale to held to maturity | — | — | 4,473 | |||||||||
| Purchased loans and investments to be settled | 532 | — | 7,185 | |||||||||
| Transfer held to maturity investment securities to available for sale investment securities | 30,368 | — | — | |||||||||
The accompanying notes are an integral part of the consolidated financial statements
| 81 |
| NOTE 1. ORGANIZATION | |
Entegra Financial Corp. (the “Company”) was incorporated on May 31, 2011 and became the holding company for Entegra Bank (the “Bank”) on September 30, 2014 upon the completion of Macon Bancorp’s merger with and into Entegra Financial Corp., pursuant to which Macon Bancorp converted from the mutual to stock form of organization. The Company’s primary operation is its investment in the Bank. The Company also owns 100% of the common stock of Macon Capital Trust I (the “Trust”), a Delaware statutory trust formed in 2003 to facilitate the issuance of trust preferred securities. The Bank is a North Carolina state-chartered savings bank and has a wholly owned subsidiary, Entegra Services, Inc., which previously owned a real estate investment property but was inactive as of December 31, 2016. The consolidated financials are presented in these financial statements.
The Bank operates as a community-focused retail bank, originating primarily real estate based mortgage, consumer and commercial loans and accepting deposits from consumers and small businesses.
| NOTE 2. SUMMARY OF SIGNIFICANT ACCOUNTING POLICIES | |
The accounting and reporting policies of the Company conform, in all material respects, to U.S. generally accepted accounting principles, or GAAP, and to general practices within the banking industry. The following summarizes the more significant of these policies and practices.
Estimates – The preparation of consolidated financial statements requires management to make estimates and assumptions that affect the reported amounts of assets and liabilities and disclosure of contingent assets and liabilities at the date of the financial statements and the reported amounts of revenues and expenses during the reporting period. Actual results could differ from those estimates.
Material estimates that are particularly susceptible to significant change, in the near term, relate to the determination of the allowance for loan losses and the valuation of real estate acquired in connection with foreclosures or in satisfaction of loans. In connection with the determination of the allowance for loan losses and the valuation of foreclosed real estate, management obtains independent appraisals for significant properties.
Principles of Consolidation – The accompanying consolidated financial statements include the accounts of the Company, the Bank, and its wholly owned subsidiary. The accounts of the Trust are not consolidated with the Company. In consolidation all significant intercompany accounts and transactions have been eliminated.
Reclassification – Certain amounts in the prior years’ financial statements may have been reclassified to conform to the current year’s presentation. The reclassifications had no significant effect on our results of operations or financial condition.
Business Combinations - Business combinations are accounted for using the acquisition method of accounting. Under the acquisition method of accounting, acquired assets and assumed liabilities are included with the acquirer’s accounts as of the date of acquisition at estimated fair value, with any excess of purchase price over the fair value of the net assets acquired (including identifiable core deposit intangibles) capitalized as goodwill. The core deposit intangible asset is recognized as an asset apart from goodwill when it arises from contractual or other legal rights or if it is capable of being separated or divided from the acquired entity and sold, transferred, licensed, rented or exchanged. In addition, acquisition-related costs and restructuring costs are recognized as period expenses as incurred.
Cash and Cash Equivalents – Cash and cash equivalents as presented in the Consolidated Balance Sheets and Consolidated Statements of Cash Flows include vault cash and demand deposits at other institutions including the Federal Home Loan Bank (“FHLB”) and the Federal Reserve Bank (“FRB”). A portion of the cash on hand and on deposit with the FRB was required to meet regulatory reserve requirements.
Trading Assets - We use quoted market prices to determine the fair value of our trading assets. Our trading assets are held in a Rabbi Trust and seek to generate returns that will offset the changes in liabilities related to market risk of certain deferred compensation agreements. Unrealized gains and losses and realized gains and losses on the sales of trading assets are included in Other noninterest income in the Consolidated Statements of Operations.
| 82 |
Securities Available-for-Sale (“AFS”) and Held-to-Maturity (“HTM”) – We determine the appropriate classification of securities at the time of purchase. Available-for-sale securities represent those securities that that we intend to hold for an indefinite period of time, but that may be sold in response to changes in interest rates, prepayment risk, liquidity needs or other factors. Such securities are carried at fair value with net unrealized gains and losses deemed to be temporary reported as a component of accumulated other comprehensive income, net of tax.
Held-to-maturity securities represent those securities that we have the positive intent and ability to hold to maturity and are carried at amortized cost.
Realized gains and losses on the sale of securities and other-than-temporary impairment (“OTTI”) charges are recorded as a component of noninterest income in the Consolidated Statements of Operations. Realized gains and losses on the sale of securities are determined using the specific-identification method. Bond premiums are amortized to the call date and bond discounts are accreted to the maturity date, both on a level yield basis.
We perform a quarterly review of our securities to identify those that may indicate OTTI. Our policy for OTTI within the debt securities portfolio is based upon a number of factors, including, but not limited to, the length of time and extent to which the estimated fair value has been less than cost, the financial condition of the underlying issuer and the ability of the issuer to meet contractual obligations. Other factors include the likelihood of the security’s ability to recover any decline in its estimated fair value and whether management intends to sell the security, or if it is more likely than not that management will be required to sell the investment security prior to the security’s recovery.
The Company reclassified certain of its securities from available-for-sale to held-to-maturity during the years ended December 31, 2014 and 2013 in an effort to minimize the impact of future interest rate changes on Accumulated Other Comprehensive Income (Loss). The difference between the book values and fair values at the date of the transfer was reported in a separate component of Accumulated Other Comprehensive Income (Loss), and amortized into income over the remaining life of the securities as an adjustment of yield in a manner consistent with the amortization of a premium. Concurrently, the revised book values of the transferred securities (represented by the market value on the date of transfer) are amortized back to their par values over the remaining life of the security as an adjustment of yield in a manner consistent with the amortization of a discount.
In the third quarter of 2016, the Company transferred its held-to-maturity investment portfolio to available-for-sale in order to provide more flexibility managing its investment portfolio. As a result, the Company is prohibited from classifying any investment securities as held-to-maturity for two years from the date of the transfer.
Loans Held for Sale – Loans originated and intended for sale in the secondary market are carried at the lower of aggregate cost or fair value. Net unrealized losses are recognized by charges to Mortgage Banking income. When a loan is placed in the held-for-sale category, we stop amortizing the related deferred fees and costs. The remaining unamortized fees and costs are recognized as part of the cost basis of the loan at the time it is sold. Gains and losses on sales of loans held for sale are included in the Consolidated Statements of Operations in Mortgage Banking income for residential loans and Gains on sale of Small Business Administration (“SBA”) loans for SBA loans. Loans held for sale primarily represent loans on one-to-four family dwellings and the portion of SBA loans intended to be sold.
We generally sell the guaranteed portion of SBA loans in the secondary market and retain the unguaranteed portion in our portfolio. Upon sale of the guaranteed portion of an SBA loan, we recognize a portion of the gain on sale into income and defer a portion of the gain related to the relative fair value of the unguaranteed loan balance we retain. The deferred gain is amortized into income over the remaining life of the loan.
Loans Receivable – Loans that management has the intent and ability to hold for the foreseeable future or until maturity or pay-off are reported at their outstanding unpaid principal balances less any charge-offs and adjusted unamortized premiums and discounts and any net deferred fees or costs on originated loans. Interest income is accrued on the unpaid principal balance. Loan origination fees, net of certain direct origination costs, are deferred and recognized as an adjustment of interest income over the respective lives of the loans using the interest method without consideration of anticipated prepayments.
| 83 |
Generally, consumer loans are charged down to their estimated collateral value after reaching 90 days past due. The number of days past due is determined by the amount of time from when the payment was due based on contractual terms. Commercial loans are charged off as management becomes aware of facts and circumstances that raise doubt as to the collectability of all or a portion of the principal and when we believe a confirmed loss exists.
The Company began originating and selling the guaranteed portion of SBA loans into the secondary market during the year ended December 31, 2013. When the Company retains the right to service a sold SBA loan, the previous carrying amount is allocated between the guaranteed portion of the loan sold, the unguaranteed portion of the loan retained and the retained SBA servicing right based on their relative fair values on the date of transfer.
Nonaccrual Loans – The accrual of interest on loans is discontinued at the time the loan is 90 days delinquent or when it becomes impaired, whichever occurs first, unless the loan is well secured and in the process of collection. All interest accrued but not collected for loans that are placed on nonaccrual is reversed against interest income. Interest payments received on nonaccrual loans are generally applied as a direct reduction to the principal outstanding until qualifying for return to accrual status. Interest payments received on nonaccrual loans may be recognized as income on a cash basis if recovery of the remaining principal is reasonably assured. Loans are returned to accrual status when all the principal and interest amounts contractually due are brought current and future payments are reasonably assured. Interest payments applied to principal while the loan was on nonaccrual may be recognized in income over the remaining life of the loan after the loan is returned to accrual status.
For loans modified in a troubled debt restructuring, the loan is generally placed on non-accrual until there is a period of satisfactory payment performance by the borrower (either immediately before or after the restructuring), generally defined as six months, and the ultimate collectability of all amounts contractually due is not in doubt.
Troubled Debt Restructurings (“TDR”) – In situations where, for economic or legal reasons related to a borrower’s financial difficulties, we grant a concession to the borrower, for other than an insignificant period of time, that we would not otherwise grant, the related loan is classified as a TDR. We strive to identify borrowers in financial difficulty early and work with them to modify to more affordable terms before their loan reaches nonaccrual status. These modified terms generally include extensions of maturity dates at a stated interest rate lower than the current market rate for a new loan with similar risk characteristics, reductions in contractual interest rates, periods of interest only payments, and principal deferment. While unusual, there may be instances of loan principal forgiveness. We also may have borrowers classified as a TDR wherein their debt obligation has been discharged by a chapter 7 bankruptcy without reaffirmation of debt. We individually evaluate all substandard loans that experienced a modification of terms to determine if a TDR has occurred.
All TDRs are considered to be impaired loans and will be reported as an impaired loan for the remaining life of the loan, unless the restructuring agreement specifies an interest rate equal to or greater than the rate that would be accepted at the time of the restructuring for a new loan with comparable risk and it is fully expected that the original principal and interest will be collected according to the restructured agreement. We may also remove a loan from TDR and impaired status if the TDR is subsequently restructured and at the time of the subsequent restructuring the borrower is not experiencing financial difficulties and, under the terms of the subsequent restructuring agreement, no concession has been granted to the borrower.
Allowance for Loan Losses (“ALL”) – The ALL reflects our estimates of probable losses inherent in the loan portfolio at the balance sheet date. The allowance for loan losses is evaluated on a regular basis by management and is based upon management’s periodic review of the collectability of the loans in light of historical experience, the nature and volume of the loan portfolio, adverse situations that may affect the borrower’s ability to repay, estimated value of any underlying collateral and prevailing economic conditions. This evaluation is inherently subjective as it requires estimates that are susceptible to significant revision as more information becomes available. The methodology for determining the ALL has two main components: the evaluation of individual loans for impairment and the evaluation of certain groups of homogeneous loans with similar risk characteristics.
| 84 |
A loan is considered impaired when it is probable that we will be unable to collect all principal and interest payments due according to the original contractual terms of the loan agreement. We individually evaluate all loans classified as substandard or nonaccrual greater than $350,000 for impairment. If the impaired loan is considered collateral dependent, a charge-off is taken based upon the appraised value of the property (less an estimate of selling costs if foreclosure is anticipated). If the impaired loan is not collateral dependent, a specific reserve is established based upon an estimate of the future discounted cash flows after consideration of modifications and the likelihood of future default and prepayment.
The allowance for non-impaired loans consists of a base historical loss reserve and a qualitative reserve. Prior to the first quarter of 2015, we more heavily weighted the most recent four quarters than the least recent four quarters. Beginning in the first quarter of 2015, we no longer weight any quarters to calculate our average loss rates. This change in weighting did not have a material impact on our allowance for loan losses methodology. The loss rates for the base loss reserve are segmented into 13 loan categories and contain loss rates ranging from approximately 0.5% to 5%.
The qualitative reserve adjusts the average loss rates utilized in the base loss reserve for trends in the following internal and external factors:
| · | Non-accrual and classified loans |
| · | Collateral values |
| · | Loan concentrations and loan growth |
| · | Economic conditions – including unemployment rates, building permits, and a regional economic index. | |
Qualitative reserve adjustment factors are decreased for favorable trends and increased for unfavorable trends. These factors are subject to further adjustment as economic and other conditions change.
Fixed Assets – Land is stated at cost. Office properties and equipment are stated at cost less accumulated depreciation. Depreciation is recorded using the straight-line method for financial reporting purposes and accelerated methods for income tax purposes over the estimated useful lives of the assets ranging from 4 to 30 years. The cost of maintenance and repairs is charged to expense as incurred while expenditures greater than $1,000 that increase a property’s life are capitalized. When assets are retired or otherwise disposed of, the cost and accumulated depreciation are removed from the accounts and any resulting gain or loss is reflected in income. Leasehold improvements are amortized over the shorter of the asset’s useful life or the remaining lease term, including renewal periods when reasonably assured.
Real Estate Owned – Real estate properties acquired through loan foreclosure are initially recorded at the lower of the recorded investment in the loan or fair value less costs to sell. Losses arising from the initial foreclosure of property are charged against the ALL.
Subsequent to foreclosure, real estate owned is recorded at the lower of carrying amount or fair value less estimated costs to sell. Valuations are periodically performed by management, but not less than every eighteen months, and an additional allowance for losses is established by a charge to Net Cost of Operation of Real Estate Owned in the Consolidated Statements of Operations, if necessary.
Other Investments, at cost – Other investments, at cost, include investments in FHLB stock, stock in other correspondent banks, and certificates of deposits.
FHLB stock is carried at cost and evaluated for impairment based on the ultimate recoverability of the par value. The Company has evaluated its FHLB stock and concluded that it is not impaired because the FHLB Atlanta is currently paying cash dividends and redeeming stock at par. The FHLB requires members to purchase and hold a specified level of stock based upon on the members asset value, level of borrowings and participation in other programs offered. Stock in the FHLB is non-marketable and is redeemable at the discretion of the FHLB. Members do not purchase stock in the FHLB for the same reasons that traditional equity investors acquire stock in an investor-owned enterprise. Rather, members purchase stock to obtain access to the low-cost products and services offered by the FHLB. Unlike equity securities of traditional for-profit enterprises, the stock of the FHLB does not provide its holders with an opportunity for capital appreciation because, by regulation, FHLB stock can only be purchased, redeemed and transferred at par value. Both cash and stock dividends are reported as Other interest income in the Consolidated Statements of Operations.
| 85 |
Bank Owned Life Insurance (“BOLI”) – BOLI is recorded at its net cash surrender value. Changes in net cash surrender value are recognized in noninterest income in the Consolidated Statements of Operations.
Loan Servicing Rights (“LSR”) – The Company follows the fair value method for accounting for its LSR’s. The LSR is established at estimated fair value, which represents the present value of estimated future net servicing cash flows, considering expected loan prepayment rates, discount rates, servicing costs and other economic factors, which are determined based on assumptions that a market participant would utilize. The expected rate of loan prepayments is the most significant factor driving the value of LSRs. Increases in mortgage loan prepayments reduce estimated future net servicing cash flows because the life of the underlying loan is reduced. In determining the estimated fair value of LSRs, interest rates, which are used to determine prepayment rates, are held constant over the estimated life of the portfolio. The Company periodically adjusts the recorded amount of its LSR’s to fair value as determined by a third party valuation.
Servicing fee income is recorded for fees earned for servicing loans. The fees are based on a contractual percentage of the outstanding principal (generally 25 basis points for residential mortgage loans and 100 basis points for SBA loans) or a fixed amount per loan, and are recorded as income when earned. Changes in fair value of LSR’s are netted against loan servicing fee income and reported as Servicing income (expense), net in the Consolidated Statements of Operations.
Goodwill and Other Intangible Assets - Goodwill represents the cost in excess of the fair value of net assets acquired (including identifiable intangibles) in transactions accounted for as business combinations. Goodwill has an indefinite useful life and is evaluated for impairment annually, or more frequently if events and circumstances indicate that the asset might be impaired. An impairment loss is recognized to the extent that the carrying amount exceeds the asset’s fair value.
The goodwill impairment analysis is a two-step test. The first, used to identify potential impairment, involves comparing each reporting unit’s estimated fair value to its carrying value, including goodwill. If the estimated fair value of a reporting unit exceeds its carrying value, goodwill is not considered to be impaired. If the carrying value exceeds estimated fair value, there is an indication of potential impairment and the second step is performed to measure the amount of impairment. Authoritative guidance gives entities the option of first performing a qualitative assessment to test goodwill for impairment on a reporting-unit basis. If, after performing the qualitative assessment, an entity concludes that it is more likely than not that the fair value of a reporting unit is less than its carrying amount, the entity would perform the two-step goodwill impairment test. However, if, after applying the qualitative assessment, the entity concludes that it is not more likely than not that the fair value is less than the carrying amount, the two-step goodwill impairment test is not required.
Core deposit intangibles are amortized over the estimated useful lives of the deposit accounts acquired (generally seven years on a straight line basis).
Derivative Financial Instruments and Hedging Activities – Interest Rate Lock Commitments and Forward Sale Contracts – In the normal course of business, we sell originated mortgage loans into the secondary mortgage loan market. We also offer interest rate lock commitments to potential borrowers. The commitments guarantee a specified interest rate for a loan if underwriting standards are met, but the commitment does not obligate the potential borrower to close on the loan. Accordingly, some commitments expire prior to becoming loans. We can encounter pricing risks if interest rates rise significantly before the loan can be closed and sold. As a result, forward sale contracts are utilized in order to mitigate this pricing risk. Whenever a customer desires an interest rate lock commitment, a mortgage originator quotes a secondary market rate guaranteed for that day by the investor. The interest rate lock is executed between the mortgagee and the Company and in turn a forward sale contract may be executed between the Company and an investor (generally Fannie Mae). Both the interest rate lock commitment with the customer and the corresponding forward sale contract with the investor are considered derivatives, but are not accounted for using hedge accounting. As such, changes in the estimated fair value of the derivatives during the commitment period are recorded in current earnings and included in Mortgage banking income in the Consolidated Statements of Operations. The fair value of the interest rate lock commitments and forward sale contracts are recorded as assets or liabilities and included in Other assets and Other liabilities in the Consolidated Balance Sheets.
| 86 |
Our interest rate risk management strategy incorporates the use of derivative instruments to minimize fluctuations in net income that are caused by interest rate volatility. The goal is to manage interest rate sensitivity by modifying the repricing or maturity characteristics of certain balance sheet assets and liabilities so that net interest revenue is not, on a material basis, adversely affected by movements in interest rates. We view this strategy as a prudent management of interest rate risk, such that net income is not exposed to undue risk presented by changes in interest rates.
In carrying out this part of its interest rate risk management strategy, we use interest rate derivative contracts; primarily interest rate swaps. Interest rate swaps generally involve the exchange of fixed- and variable-rate interest payments between two parties, based on a common notional principal amount and maturity date.
We classify our derivative financial instruments as either (1) a hedge of an exposure to changes in the fair value of a recorded asset or liability (“fair value hedge”), (2) a hedge of an exposure to changes in the cash flows of a recognized asset, liability or forecasted transaction (“cash flow hedge”), or (3) derivatives not designated as accounting hedges. Changes in the fair value of derivatives not designated as hedges are recognized in current period earnings.
Our interest rate swaps are classified as cash flow hedges and as such, adjustments to fair value are recorded in Accumulated Other Comprehensive Income.
Small Business Investment Company Investments – Small Business Investment Company (“SBIC”) investments are included in other assets at cost which approximates fair value as there is no ready market for such investments.
Advertising Expense – Advertising costs are expensed as incurred. The Company’s advertising expenses were $1.1 million, $0.5 million, and $0.3 million for the years ended December 31, 2016, 2015, and 2014, respectively.
Income Taxes – We estimate income tax expense based on amounts expected to be owed to the tax jurisdictions where we conduct business. On a quarterly basis, management assesses the reasonableness of our effective tax rate based upon our current estimate of the amount and components of net income, tax credits and the applicable statutory tax rates expected for the full year.
Deferred income tax assets and liabilities are determined using the asset and liability method and are reported net in the Consolidated Balance Sheets. Under this method, the net deferred tax asset or liability is based on the tax effects of the differences between the book and tax basis of assets and liabilities and recognizes enacted changes in tax rate and laws. When deferred tax assets are recognized, they are subject to a valuation allowance based on management’s judgment as to whether realization is more likely than not. In determining the need for a valuation allowance, the Company considers the following sources of taxable income:
| · | Future reversals of existing taxable temporary differences |
| · | Future taxable income exclusive of reversing temporary differences and carry forwards |
| · | Taxable income in prior carryback years |
| · | Tax planning strategies that would, if necessary, be implemented | |
As a result of the analysis above, the Company concluded that a valuation allowance was not necessary as of December 31, 2016 and 2015. The Company maintained a full valuation allowance as of December 31, 2014 except for consideration of certain tax planning strategies.
Accrued taxes represent the net estimated amount due to taxing jurisdictions and are reported in other assets or other liabilities, as appropriate, in the Consolidated Balance Sheets. We evaluate and assess the relative risks and appropriate tax treatment of transactions and filing positions after considering statutes, regulations, judicial precedent and other information and maintain tax accruals consistent with the evaluation of these relative risks and merits. Changes to the estimate of accrued taxes occur periodically due to changes in tax rates, interpretations of tax laws, the status of examinations being conducted by taxing authorities and changes to statutory, judicial and regulatory guidance. These changes, when they occur, can affect deferred taxes and accrued taxes, as well as the current period’s income tax expense and can be significant to our operating results.
| 87 |
Tax positions are recognized as a benefit only if it is “more likely than not” that the tax position would be sustained in a tax examination, with a tax examination being presumed to occur. The amount recognized is the largest amount of tax benefit that is greater than 50 percent likely of being realized on examination. For tax positions not meeting the “more likely than not” test, no tax benefit is recorded.
Allowance for Unfunded Commitments – In the normal course of business, we offer off-balance sheet credit arrangements to enable our customers to meet their financing objectives. These instruments involve, to varying degrees, elements of credit and interest rate risk in excess of the amount recognized in the financial statements. Our exposure to credit loss, in the event the customer does not satisfy the terms of the agreement, equals the contractual amount of the obligation less the value of any collateral. We apply the same credit policies in making commitments and standby letters of credit that we use for the underwriting of loans to customers. Commitments generally have fixed expiration dates, annual renewals or other termination clauses and may require payment of a fee. Since many of the commitments are expected to expire without being drawn upon, the total commitment amounts do not necessarily represent future cash requirements. The reserve is calculated by applying historical loss rates from our ALL model to the estimated future utilization of our unfunded commitments. The allowance for unfunded commitments is included in Other liabilities in the Consolidated Balance Sheets and amounted to $0.1 million at December 31, 2016 and 2015.
Junior Subordinated Notes – The Trust is considered to be a variable interest entity since its common equity is not at risk. The Company does not hold a variable interest in the Trust, and therefore, is not considered to be the Trust’s primary beneficiary. As a result, the Company accounts for the junior subordinated notes issued to the Trust and its equity investment in the Trust on an unconsolidated basis. Debt issuance costs of the junior subordinated notes are being amortized over the term of the debt and amounted to $0.1 million as of December 31, 2016, 2015, and 2014.
Stock-based Compensation - We account for stock-based compensation in accordance with Accounting Standard Codification (“ASC”) 718, Compensation-Stock Compensation. Under ASC 718, stock-based compensation expense reflects the fair value of stock-based awards measured at grant date, is recognized over the relevant vesting period on a straight-line basis, and adjusted each period for anticipated forfeitures. Stock-based compensation is recognized only for awards that vest, and our periodic accrual of compensation cost is based on the estimated number of awards expected to vest. We measure the fair value of compensation cost related to restricted stock awards based on the closing market price of our common stock on the grant date.
Tax benefits realized upon the vesting of restricted shares that exceed the expense previously recognized for reporting purposes are recorded through the income statement as income tax benefit. If the tax benefit upon vesting is less than the expense previously recorded, the shortfall is recorded through the income statement as income tax expense.
Segments – The Company operates and manages itself within one retail banking segment and has, therefore, not provided segment disclosures.
Subsequent Events – Subsequent events are events or transactions that occur after the balance sheet date but before financial statements are issued. Recognized subsequent events are events or transactions that provide additional evidence about conditions that existed at the date of the balance sheet including the estimates inherent in the process of preparing financial statements. Unrecognized subsequent events are events that provide evidence about conditions that did not exist at the date of the balance sheet but arose after that date. The Company has reviewed events occurring through the issuance date of the Consolidated Financial Statements and no subsequent events have occurred requiring accrual or disclosure in these financial statements other than those included in this Annual Report on Form 10-K.
| 88 |
Recently Issued Accounting Standards
In January 2016, the Financial Accounting Standards Board (“FASB”) amended the Financial Instruments topic of the ASC to address certain aspects of recognition, measurement, presentation, and disclosure of financial instruments. The amendments will be effective for fiscal years beginning after December 15, 2017, including interim periods within those fiscal years. The Company will apply the guidance by means of a cumulative-effect adjustment to the balance sheet as of the beginning of the fiscal year of adoption. The amendments related to equity securities without readily determinable fair values will be applied prospectively to equity investments that exist as of the date of adoption of the amendments. The Company is currently evaluating the impact on its financial statements.
In March 2016, the FASB amended the Revenue from Contracts with Customers topic of the Accounting Standards Codification to clarify the implementation guidance on principal versus agent considerations and address how an entity should assess whether it is the principal or the agent in contracts that include three or more parties. The amendments will be effective for the Company for reporting periods beginning after December 15, 2017. The Company does not expect these amendments to have a material effect on its financial statements.
In March 2016, the FASB issued guidance to simplify several aspects of the accounting for share-based payment award transactions including the income tax consequences, the classification of awards as either equity or liabilities, and the classification on the statement of cash flows. Additionally, the guidance simplifies two areas specific to entities other than public business entities allowing them to apply a practical expedient to estimate the expected term for all awards with performance or service conditions that have certain characteristics and also allowing them to make a one-time election to switch from measuring all liability-classified awards at fair value to measuring them at intrinsic value. The guidance will be effective for the Company for annual periods beginning after December 15, 2016 and interim periods within those annual periods. The Company does not expect this guidance to have a material effect on its financial statements.
In June 2016, the FASB issued amendments to Accounting Standards Update (“ASU”) 2016-13 Financial Instruments – Credit Losses (Topic 326): Measurement of Credit Losses on Financial Instruments. The amendments in the Update require a financial asset (or a group of financial assets) measured at amortized cost basis to be presented at the net amount expected to be collected thereby providing financial statement users with more decision-useful information about the expected credit losses on financial instruments and other commitments to extend credit held by the reporting entity. The amendments will be effective for the Company for reporting periods beginning after December 15, 2019. The Company is currently evaluating the impact on its financial statements.
In March 2016, the FASB issued ASU No. 2016-09 “Stock Compensation (Topic 718) – Improvements to Employee Share-Based Payment Accounting (“ASU 2016-09”) which simplifies several aspects of the accounting for employee share-based payment transactions, including the accounting for income taxes, forfeitures and statutory withholding requirements, as well as the classification of share-based payment transactions on the statement of cash flows. The standard becomes effective in the first quarter of 2017. As early adoption of ASU 2016-09 is permitted, the Company adopted the standard in the fourth quarter of 2016. The election to adopt ASU 2016-09 early requires any adjustments to be made as of January 1, 2016, the beginning of the annual period that includes the interim period of adoption. ASU 2016-09 had no material impact to the Company’s financial statements for any of the periods presented.
In August 2016, the FASB issued ASU No. 2016-15, “Classification of Certain Cash Receipts and Cash Payments.” GAAP is unclear or does not include specific guidance on how to classify certain transactions in the statement of cash flows. This ASU is intended to reduce diversity in practice in how eight particular transactions are classified in the statement of cash flows. ASU No. 2016-15 is effective for interim and annual reporting periods beginning after December 15, 2017. Early adoption is permitted, provided that all of the amendments are adopted in the same period. Entities will be required to apply the guidance retrospectively. If it is impracticable to apply the guidance retrospectively for an issue, the amendments related to that issue would be applied prospectively. As this guidance only affects the classification within the statement of cash flows, ASU No. 2016-15 is not expected to have a material impact on the Company’s financial statements.
In September 2015, the FASB issued ASU No. 2015-16, Business Combinations (Topic 805): Simplifying the Accounting for Measurement Period Adjustments (“ASU 2015-16”). The update simplifies the accounting for adjustments made to provisional amounts recognized in a business combination by eliminating the requirement to retrospectively account for those adjustments. For public companies, this update became effective for interim and annual periods beginning after December 15, 2015, and is to be applied prospectively. ASU 2015-16 became effective for the Company on January 1, 2016 and did not have a significant impact on the Company’s financial statements.
| 89 |
In August 2014, the FASB issued ASU No. 2014-15, Disclosure of Uncertainties about an Entity’s Ability to Continue as a Going Concern. ASU 2014-15 requires management to assess a company’s ability to continue as a going concern and to provide related footnote disclosures in certain circumstances. Before this new standard, there was minimal guidance in U.S. GAAP specific to going concern. Under the new standard, disclosures are required when conditions give rise to substantial doubt about a company’s ability to continue as a going concern within one year from the financial statement issuance date. The new standard applies to all companies and is effective for the annual period ending after December 15, 2016, and all annual and interim periods thereafter. ASU 2014-15 became effective for the Company on December 31, 2016 and did not have an impact on the financial statements.
Other accounting standards that have been issued or proposed by the FASB or other standards-setting bodies are not expected to have a material impact on the Company’s financial position, results of operations or cash flows.
| NOTE 3. STOCK CONVERSION AND CHANGE IN CORPORATE FORM | |
On January 23, 2014, the Board of Directors of Macon Bancorp adopted a Plan of Conversion (the “Plan of Conversion”) which provided for the reorganization of Macon Bancorp from a North Carolina chartered mutual holding company into a stock holding company, Entegra Financial Corp., incorporated under the laws of the State of North Carolina (the “Conversion”).
In connection with the Conversion, the Company sold 6,546,375 shares of common stock at an offering price of $10.00 per share and received gross sales proceeds of $65.5 million. The Company recognized $1.8 million in reorganization and stock issuance costs which have been deducted from the gross sales proceeds. Of the $63.7 million in net sales proceeds, $44.6 million, or approximately 70%, was contributed to the capital of the Bank upon completion of the Conversion on September 30, 2014.
| Common Stock Offering Summary | ||||
| (Dollars in thousands) | ||||
| Gross proceeds | $ | 65,464 | ||
| Issuance costs | (1,813 | ) | ||
| Net proceeds | $ | 63,651 | ||
| Contributed to the Bank | $ | 44,581 | ||
| Retained by the Company | 19,070 | |||
| $ | 63,651 | |||
On September 30, 2014, liquidation accounts were established by the Company and the Bank for the benefit of eligible depositors of the Bank as defined in the Plan of Conversion. Each eligible depositor will have a pro rata interest in the liquidation accounts for each of his or her deposit accounts based upon the proportion that the balance of each such account bears to the balance of all deposit accounts of the Bank as of the dates specified in the Plan of Conversion. The liquidation accounts will be maintained for the benefit of eligible depositors who continue to maintain their deposit accounts in the Bank. The liquidation accounts will be reduced annually to the extent that eligible depositors reduce their qualifying deposits. In the unlikely event of a complete liquidation of the Bank or the Company or both, and only in such event, eligible depositors who continue to maintain accounts will be entitled to receive a distribution from the liquidation accounts before any distribution may be made with respect to common stock. Neither the Company nor the Bank may declare or pay a cash dividend if the effect thereof would cause its equity to be reduced below either the amount required for the liquidation accounts or the regulatory capital requirements imposed by the Company’s or the Bank’s regulators.
| 90 |
| NOTE 4. ACQUISITIONS | |
The Company has determined that the acquisitions described below constitute a business combination as defined in ASC Topic 805, Business Combinations. Accordingly, as of the date of the acquisitions, the Company recorded the assets acquired and liabilities assumed at fair value. The Company determined fair values in accordance with the guidance provided in ASC Topic 820, Fair Value Measurements. Fair value is established by discounting the expected future cash flows with a market discount rate for like maturity and risk instruments. The estimation of expected future cash flows requires significant assumptions about appropriate discount rates, expected future cash flows, market conditions and other future events. Actual results could differ materially. The Company made the determinations of fair value using the best information available at the time; however, the assumptions used are subject to change and, if changed, could have a material effect on the Company’s financial position and results of operations.
On April 1, 2016, the Bank acquired Old Town Bank of Waynesville, North Carolina. In connection with the acquisition, the Bank acquired $110.0 million of assets and assumed $97.9 million of liabilities. Total consideration transferred was $13.5 million of cash. The fair value of consideration paid exceeded the fair value of the identifiable assets and liabilities acquired and resulted in the establishment of goodwill in the amount of $1.4 million, none of which is deductible for tax purposes. Loans purchased with evidence of credit impairment were not material.
The purchased assets and assumed liabilities were recorded at their acquisition date fair values, and are summarized in the table below (in thousands.)
As recorded by Old Town Bank | Fair Value Adjustments | As recorded by the Company | ||||||||||
| Assets | ||||||||||||
| Cash and cash equivalents | $ | 7,573 | $ | — | $ | 7,573 | ||||||
| Investments | 30,882 | 246 | 31,128 | |||||||||
| Loans | 64,573 | 272 | 64,845 | |||||||||
| Fixed assets | 3,414 | (22 | ) | 3,392 | ||||||||
| Interest receivable | 552 | — | 552 | |||||||||
| Core deposit intangible | — | 530 | 530 | |||||||||
| Other real estate owned | 880 | 43 | 923 | |||||||||
| Deferred tax asset | 259 | 207 | 466 | |||||||||
| Other assets | 938 | (337 | ) | 601 | ||||||||
| Total assets acquired | $ | 109,071 | $ | 939 | $ | 110,010 | ||||||
| Liabilities | ||||||||||||
| Deposits | $ | 88,059 | $ | 648 | $ | 88,707 | ||||||
| FHLB advances | 9,000 | 25 | 9,025 | |||||||||
| Accrued Interest payable | 30 | — | 30 | |||||||||
| Other liabilities | 125 | (9 | ) | 116 | ||||||||
| Total liabilities assumed | 97,214 | 664 | 97,878 | |||||||||
| Excess of assets acquired over liabities assumed | $ | 11,857 | $ | 275 | $ | 12,132 | ||||||
| Purchase price | 13,486 | |||||||||||
| Goodwill | $ | 1,354 | ||||||||||
On December 11, 2015, the Bank completed its acquisition of two branches from Arthur State Bank (“ASB”). In accordance with the Purchase and Assumption Agreement, dated August 13, 2015, by and between the Bank and ASB (the “P&A Agreement”), the Bank acquired approximately $39.9 million of deposits, approximately $4.7 million of performing loans, and the bank facilities and certain other assets. In consideration of the purchased assets and transferred liabilities, the Bank paid (1) the recorded investment of the loans acquired, (2) the fair value, or approximately $2.1 million, for the branch facilities and certain assets, and (3) a deposit premium of $1.2 million, equal to 2.87% of the average daily deposits for the 30- day period immediately prior to the acquisition date.
| 91 |
The following table summarizes the assets acquired and liabilities assumed at the date of acquisition and their initial fair values:
| (Dollars in thousands) | As
Recorded by ASB | Fair
Value Adjustments | As
Recorded by the Company | |||||||||
| Assets | ||||||||||||
| Cash and cash equivalents | $ | 33,076 | $ | — | $ | 33,076 | ||||||
| Loans | 4,717 | (72 | )(a) | 4,645 | ||||||||
| Premises and equipment | 2,080 | — | 2,080 | |||||||||
| Core deposit intangible | — | 590 | (b) | 590 | ||||||||
| Other assets | 16 | — | 16 | |||||||||
| Total assets acquired | $ | 39,889 | $ | 518 | $ | 40,407 | ||||||
| Liabilities | ||||||||||||
| Deposits: | ||||||||||||
| Noninterest-bearing demand | $ | 22,084 | $ | — | 22,084 | |||||||
| Interest-bearing demand | 15 | — | 15 | |||||||||
| Money market | 2,556 | — | 2,556 | |||||||||
| Savings | 7,242 | — | 7,242 | |||||||||
| Time deposits | 7,967 | 31 | (c) | 7,998 | ||||||||
| Total deposits | 39,864 | 31 | 39,895 | |||||||||
| Other liabilities | 25 | — | 25 | |||||||||
| Total liabilities assumed | 39,889 | 31 | 39,920 | |||||||||
| Excess of assets acquired over liabilities assumed | $ | — | $ | 487 | $ | 487 | ||||||
| Purchase price | 1,198 | |||||||||||
| Goodwill | $ | 711 | ||||||||||
Fair values are subject to refinement for a period not to exceed one year after the closing date of an acquisition as information relative to closing date fair values becomes available. In particular, the fair value of collateral dependent loans and other real estate owned may change to the extent that the Company receives updated appraisals indicating changes in valuation assumptions at acquisition.
Pro forma disclosures are not significant and not meaningful.
On October 19, 2016, the Bank entered into a definitive agreement with Stearns Bank, N.A. (Stearns) pursuant to which the Bank acquired two branches in northern Georgia on February 24, 2017. The Bank assumed approximately $150.0 million in deposits and paid a deposit premium of 3.65%.
| 92 |
| NOTE 5. INVESTMENT SECURITIES | |
The following table presents the holdings of our trading account as of December 31, 2016 and December 31, 2015:
| December 31, | ||||||||
| 2016 | 2015 | |||||||
| (Dollars in thousands) | ||||||||
| Trading account | $ | 5,211 | $ | 4,714 | ||||
The trading account is held in a Rabbi Trust and seeks to generate returns that will offset the change in liabilities related to market risk of certain deferred compensation agreements. There were $0.5 million of realized gains for the year ended December 31, 2016, and no changes in 2015.
The Company’s HTM investment portfolio was transferred to available-for-sale during the third quarter of 2016 in order to provide the Company more flexibility managing its investment portfolio. As a result of the transfer, the Company is prohibited from classifying any investment securities as held-to-maturity for two years from the date of the transfer.
The amortized cost and estimated fair values of securities classified as AFS are summarized as follows:
December 31, 2016 | ||||||||||||||||
| Gross | Gross | Estimated | ||||||||||||||
| Amortized | Unrealized | Unrealized | Fair | |||||||||||||
| Cost | Gains | Losses | Value | |||||||||||||
| (Dollars in thousands) | ||||||||||||||||
| U.S. government agencies | $ | 12,076 | $ | 31 | $ | — | $ | 12,107 | ||||||||
| Municipal securities | 152,208 | 337 | (5,774 | ) | 146,771 | |||||||||||
| Mortgage-backed securities | — | |||||||||||||||
| U.S. government agencies | 128,820 | 107 | (2,161 | ) | 126,766 | |||||||||||
| SBA securities | 30,002 | 13 | (303 | ) | 29,712 | |||||||||||
| Collateralized mortgage obligations | 62,524 | 16 | (1,081 | ) | 61,459 | |||||||||||
| U.S. Treasury securities | 2,501 | 15 | (2 | ) | 2,514 | |||||||||||
| Corporate bonds | 18,354 | 171 | (167 | ) | 18,358 | |||||||||||
| Mutual funds | 616 | — | (12 | ) | 604 | |||||||||||
| $ | 407,101 | $ | 690 | $ | (9,500 | ) | $ | 398,291 | ||||||||
| 93 |
| December 31, 2015 | ||||||||||||||||
| Gross | Gross | Estimated | ||||||||||||||
| Amortized | Unrealized | Unrealized | Fair | |||||||||||||
| Cost | Gains | Losses | Value | |||||||||||||
| (Dollars in thousands) | ||||||||||||||||
| U.S. government agencies | $ | 25,633 | $ | 123 | $ | (36 | ) | $ | 25,720 | |||||||
| Municipal securities | 39,751 | 311 | (204 | ) | 39,858 | |||||||||||
| Mortgage-backed securities | ||||||||||||||||
| U.S. government agencies | 112,857 | 178 | (1,025 | ) | 112,010 | |||||||||||
| SBA securities | 47,768 | 86 | (272 | ) | 47,582 | |||||||||||
| Collateralized mortgage obligations | 11,702 | 12 | (132 | ) | 11,582 | |||||||||||
| U.S. Treasury securities | 1,500 | 10 | — | 1,510 | ||||||||||||
| Mutual funds | 602 | — | (2 | ) | 600 | |||||||||||
| $ | 239,813 | $ | 720 | $ | (1,671 | ) | $ | 238,862 | ||||||||
The amortized cost and estimated fair values of securities HTM as of December 31, 2015 are summarized below. As of December 31, 2016, the Company did not hold any securities classified as HTM.
| December 31, 2015 | ||||||||||||||||
| Gross | Gross | Estimated | ||||||||||||||
| Amortized | Unrealized | Unrealized | Fair | |||||||||||||
| Cost | Gains | Losses | Value | |||||||||||||
| (Dollars in thousands) | ||||||||||||||||
| U.S. government agencies | $ | 15,877 | $ | 645 | $ | (23 | ) | $ | 16,499 | |||||||
| Municipal securities | 12,428 | 199 | (93 | ) | 12,534 | |||||||||||
| Mortgage-backed securities | ||||||||||||||||
| Collateralized mortgage obligations | 4,834 | 4 | (62 | ) | 4,776 | |||||||||||
| U.S. Treasury securities | 1,002 | — | (7 | ) | 995 | |||||||||||
| Corporate debt securities | 7,023 | 25 | (40 | ) | 7,008 | |||||||||||
| $ | 41,164 | $ | 873 | $ | (225 | ) | $ | 41,812 | ||||||||
Information pertaining to the activity of unrealized losses related to HTM securities (before the impact of income taxes) previously recognized in accumulated other comprehensive income (“AOCI”) is summarized below:
| 94 |
| Year Ended December 31, | ||||||||||||
| (Dollars in thousands) | 2016 | 2015 | 2014 | |||||||||
| Beginning unrealized loss related to HTM securities previously recognized in AOCI | $ | 903 | $ | 1,887 | $ | 2,012 | ||||||
| Additions for transfers to HTM | — | — | 74 | |||||||||
| Amortization of unrealized losses on HTM securities previously recognized in AOCI | (578 | ) | (984 | ) | (199 | ) | ||||||
| Reduction from transfers to AFS | (325 | ) | — | — | ||||||||
| Ending unrealized loss related to HTM securities previously recognized in AOCI | $ | — | $ | 903 | $ | 1,887 | ||||||
Information pertaining to securities with gross unrealized losses, aggregated by investment category and length of time that individual securities have been in a continuous loss position, follows:
| December 31, 2016 | ||||||||||||||||||||||||
| Less Than 12 Months | More Than 12 Months | Total | ||||||||||||||||||||||
| Fair Value | Unrealized
Losses | Fair Value | Unrealized
Losses | Fair Value | Unrealized
Losses | |||||||||||||||||||
| (Dollars in thousands) | ||||||||||||||||||||||||
| Held-to-Maturity: | $ | — | $ | — | $ | — | $ | — | $ | — | $ | — | ||||||||||||
| Available-for-Sale: | ||||||||||||||||||||||||
| Municipal securities | $ | 122,468 | $ | 5,759 | $ | 331 | $ | 15 | $ | 122,799 | $ | 5,774 | ||||||||||||
| Mortgage-backed securities | ||||||||||||||||||||||||
| U.S. government agencies | 101,382 | 2,068 | 5,102 | 93 | 106,484 | 2,161 | ||||||||||||||||||
| SBA | 15,199 | 145 | 11,434 | 158 | 26,633 | 303 | ||||||||||||||||||
| Collateralized mortgage obligations | 53,513 | 1,035 | 1,058 | 46 | 54,571 | 1,081 | ||||||||||||||||||
| U.S. Treasury securities | 1,000 | 2 | — | — | 1,000 | 2 | ||||||||||||||||||
| Corporate debt securities | 6,741 | 167 | — | — | 6,741 | 167 | ||||||||||||||||||
| Mutual funds | 616 | 12 | — | — | 616 | 12 | ||||||||||||||||||
| $ | 300,919 | $ | 9,188 | $ | 17,925 | $ | 312 | $ | 318,844 | $ | 9,500 | |||||||||||||
| 95 |
| December 31, 2015 | ||||||||||||||||||||||||
| Less Than 12 Months | More Than 12 Months | Total | ||||||||||||||||||||||
| Fair Value | Unrealized
Losses | Fair Value | Unrealized
Losses | Fair Value | Unrealized
Losses | |||||||||||||||||||
| (Dollars in thousands) | ||||||||||||||||||||||||
| Held to Maturity: | ||||||||||||||||||||||||
| U.S. government agencies | $ | 5,705 | $ | 23 | $ | — | $ | — | $ | 5,705 | $ | 23 | ||||||||||||
| Municipal securities | 4,365 | 93 | — | — | 4,365 | 93 | ||||||||||||||||||
| Mortgage-backed securities | ||||||||||||||||||||||||
| Collateralized mortgage obligation | 2,693 | 62 | 2,693 | 62 | ||||||||||||||||||||
| U.S. Treasury securities | 995 | 7 | — | — | 995 | 7 | ||||||||||||||||||
| Corporate debt securities | 4,911 | 40 | — | — | 4,911 | 40 | ||||||||||||||||||
| $ | 18,669 | $ | 225 | $ | — | $ | — | $ | 18,669 | $ | 225 | |||||||||||||
| Available for Sale: | ||||||||||||||||||||||||
| U.S. government agencies | $ | 13,317 | $ | 36 | $ | — | $ | — | $ | 13,317 | $ | 36 | ||||||||||||
| Municipal securities | 18,769 | 176 | 947 | 28 | 19,716 | 204 | ||||||||||||||||||
| Mortgage-backed securities | ||||||||||||||||||||||||
| U.S. government agencies | 73,476 | 662 | 13,892 | 363 | 87,368 | 1,025 | ||||||||||||||||||
| SBA | 23,012 | 190 | 5,730 | 82 | 28,742 | 272 | ||||||||||||||||||
| Collateralized mortgage obligations | 5,931 | 74 | 1,283 | 58 | 7,214 | 132 | ||||||||||||||||||
| Mutual funds | 600 | 2 | — | — | 600 | 2 | ||||||||||||||||||
| $ | 135,105 | $ | 1,140 | $ | 21,852 | $ | 531 | $ | 156,957 | $ | 1,671 | |||||||||||||
Information pertaining to the number of securities with unrealized losses is detailed in the table below. Management of the Company believes all unrealized losses as of December 31, 2016 and 2015 represent temporary impairment. The unrealized losses have resulted from temporary changes in the interest rate market and not as a result of credit deterioration. We do not intend to sell and it is not likely that we will be required to sell any of the securities referenced in the table below before recovery of their amortized cost.
| December 31, 2016 | ||||||||||||
| Less Than 12 Months | More Than 12 Months | Total | ||||||||||
| Municipal securities | 129 | 1 | 130 | |||||||||
| Mortgage-backed securities | ||||||||||||
| U.S. government agencies | 66 | 5 | 71 | |||||||||
| SBA | 11 | 8 | 19 | |||||||||
| Collateralized mortgage obligations | 25 | 1 | 26 | |||||||||
| U.S. Treasury securities | 1 | — | 1 | |||||||||
| Corporate debt securities | 8 | — | 8 | |||||||||
| 240 | 15 | 255 | ||||||||||
| December 31, 2015 | ||||||||||||
| Less Than 12 Months | More Than 12 Months | Total | ||||||||||
| U.S. government agencies | 13 | — | 13 | |||||||||
| Municipal securities | 51 | 2 | 53 | |||||||||
| Mortgage-backed securities | ||||||||||||
| U.S. government agencies | 52 | 9 | 61 | |||||||||
| SBA | 14 | 5 | 19 | |||||||||
| Collateralized mortgage obligations | 5 | 1 | 6 | |||||||||
| U.S. Treasury securities | 1 | — | 1 | |||||||||
| Corporate debt securities | 9 | — | 9 | |||||||||
| Mutual funds | 1 | — | 1 | |||||||||
| 146 | 17 | 163 | ||||||||||
| 96 |
The Company received proceeds from sales of securities classified as AFS and corresponding gross realized gains and losses as follows:
| For the Year Ended December 31, | ||||||||||||
| 2016 | 2015 | 2014 | ||||||||||
| (Dollars in thousands) | ||||||||||||
| Gross proceeds | $ | 124,823 | $ | 39,022 | $ | 19,170 | ||||||
| Gross realized gains | 1,261 | 423 | 680 | |||||||||
| Gross realized losses | 45 | 20 | — | |||||||||
The Company had securities pledged against deposits and borrowings of approximately $237.1 million and $69.6 million at December 31, 2016 and 2015, respectively.
The amortized cost and estimated fair value of investments in debt securities at December 31, 2016, by contractual maturity, is shown below. Mortgage-backed securities have not been scheduled because expected maturities will differ from contractual maturities when borrowers have the right to prepay the obligations.
| Available for Sale | ||||||||
| Amortized Cost | Fair Value | |||||||
| (Dollars in thousands) | ||||||||
| Less than 1 year | $ | 6,373 | $ | 6,369 | ||||
| Over 1 year through 5 years | 17,845 | 17,846 | ||||||
| After 5 years through 10 years | 30,784 | 30,638 | ||||||
| Over 10 years | 130,753 | 125,501 | ||||||
| 185,755 | 180,354 | |||||||
| Mortgage-backed securities | 221,346 | 217,937 | ||||||
| Total | $ | 407,101 | $ | 398,291 | ||||
| 97 |
| NOTE 6. LOANS RECEIVABLE | |
Loans receivable balances are summarized as follows:
| December 31, | ||||||||
| 2016 | 2015 | |||||||
| (Dollars in thousands) | ||||||||
| Real estate mortgage loans: | ||||||||
| One-to four-family residential | $ | 278,437 | $ | 248,633 | ||||
| Commercial real estate | 292,879 | 214,413 | ||||||
| Home equity loans and lines of credit | 50,334 | 53,446 | ||||||
| Residential construction | 18,531 | 7,848 | ||||||
| Other construction and land | 60,605 | 57,316 | ||||||
| Total real estate loans | 700,786 | 581,656 | ||||||
| Commercial and industrial | 41,306 | 41,046 | ||||||
| Consumer | 4,594 | 3,639 | ||||||
| Total commercial and consumer | 45,900 | 44,685 | ||||||
| Loans receivable, gross | 746,686 | 626,341 | ||||||
| Less: Net deferred loan fees | (923 | ) | (1,388 | ) | ||||
| Fair value discount | (857 | ) | (72 | ) | ||||
| Unamortized premium | 605 | 557 | ||||||
| Unamortized discount | (1,150 | ) | (1,366 | ) | ||||
| Loans receivable, net of deferred fees | $ | 744,361 | $ | 624,072 | ||||
The Bank had $144.3 million and $119.5 million of loans pledged as collateral to secure funding with FHLB at December 31, 2016 and 2015, respectively. The Bank also had $89.1 million and $88.4 million of loans pledged as collateral to secure funding with the FRB Discount Window at December 31, 2016 and 2015, respectively.
Included in loans receivable and other borrowings at December 31, 2016 and 2015 are $2.7 million and $2.2 million in participated loans, respectively, that did not qualify for sale accounting. Interest expense on the other borrowings accrues at the same rate as the interest income recognized on the loans receivable, resulting in no effect to net income.
| 98 |
The following table presents the activity related to the discount on individually purchased loans:
| For the Year Ended December 31, | ||||||||||||
| (Dollars in thousands) | 2016 | 2015 | 2014 | |||||||||
| Discount on purchased loans, beginning of period | $ | 1,366 | $ | 1,487 | $ | — | ||||||
| Additional discount for new purchases | — | 485 | 2,607 | |||||||||
| Accretion | (216 | ) | (311 | ) | (365 | ) | ||||||
| Discount applied to charge-offs | — | (295 | ) | — | ||||||||
| Interest income recognized for repayments and restructurings | — | — | (755 | ) | ||||||||
| Discount on purchased loans, end of period | $ | 1,150 | $ | 1,366 | $ | 1,487 | ||||||
The following table presents the activity related to the fair value discount on acquired loans:
| For the Year Ended December 31, | ||||||||||||
| (Dollars in thousands) | 2016 | 2015 | 2014 | |||||||||
| Fair value discount, beginning of period | $ | 72 | $ | — | $ | — | ||||||
| Additional discount for acquisitions | 960 | 72 | — | |||||||||
| Accretion | (175 | ) | — | — | ||||||||
| Discount on purchased loans, end of period | $ | 857 | $ | 72 | $ | — | ||||||
There were no purchase credit impaired loans as of December 31, 2016.
The aggregate principal amounts outstanding to executive officers and directors of the Company made in the ordinary course of business as of and for the years ended December 31 is detailed in the table below:
| December 31, | ||||||||
| 2016 | 2015 | |||||||
| Beginning of year | $ | 8,930 | $ | 9,307 | ||||
| New loans | 51 | 30 | ||||||
| Repayments | (759 | ) | (407 | ) | ||||
| End of year | $ | 8,222 | $ | 8,930 | ||||
| 99 |
| NOTE 7. ALLOWANCE FOR LOAN LOSSES | |
The following tables present, by portfolio segment, the activity in the allowance for loan losses:
| Year Ended December 31, 2016 | ||||||||||||||||||||||||||||||||
| One-to
four Family Residential | Commercial
Real Estate | Home
Equity and Lines of Credit | Residential
Construction | Other
Construction and Land | Commercial | Consumer | Total | |||||||||||||||||||||||||
| (Dollars in thousands) | ||||||||||||||||||||||||||||||||
| Beginning balance | $ | 2,455 | $ | 3,221 | $ | 1,097 | $ | 278 | $ | 1,400 | $ | 603 | $ | 407 | $ | 9,461 | ||||||||||||||||
| Provision | 413 | 1,016 | (486 | ) | (125 | ) | (122 | ) | (85 | ) | (337 | ) | 274 | |||||||||||||||||||
| Charge-offs | (133 | ) | (431 | ) | (158 | ) | — | (560 | ) | (63 | ) | (201 | ) | (1,546 | ) | |||||||||||||||||
| Recoveries | 77 | 173 | 224 | 32 | 130 | 144 | 336 | 1,116 | ||||||||||||||||||||||||
| Ending balance | $ | 2,812 | $ | 3,979 | $ | 677 | $ | 185 | $ | 848 | $ | 599 | $ | 205 | $ | 9,305 | ||||||||||||||||
| Year Ended December 31, 2015 | ||||||||||||||||||||||||||||||||
| One-to
four Family Residential | Commercial
Real Estate | Home
Equity and Lines of Credit | Residential
Construction | Other
Construction and Land | Commercial | Consumer | Total | |||||||||||||||||||||||||
| (Dollars in thousands) | ||||||||||||||||||||||||||||||||
| Beginning balance | $ | 2,983 | $ | 2,717 | $ | 1,333 | $ | 510 | $ | 2,936 | $ | 308 | $ | 285 | $ | 11,072 | ||||||||||||||||
| Provision | (251 | ) | 388 | 200 | (235 | ) | (1,741 | ) | 272 | (133 | ) | (1,500 | ) | |||||||||||||||||||
| Charge-offs | (536 | ) | (52 | ) | (540 | ) | — | (137 | ) | (9 | ) | (48 | ) | $ | (1,322 | ) | ||||||||||||||||
| Recoveries | 259 | 168 | 104 | 3 | 342 | 32 | 303 | 1,211 | ||||||||||||||||||||||||
| Ending balance | $ | 2,455 | $ | 3,221 | $ | 1,097 | $ | 278 | $ | 1,400 | $ | 603 | $ | 407 | $ | 9,461 | ||||||||||||||||
| Year Ended December 31, 2014 | ||||||||||||||||||||||||||||||||
| One-to
four Family Residential | Commercial
Real Estate | Home
Equity and Lines of Credit | Residential
Construction | Other
Construction and Land | Commercial | Consumer | Total | |||||||||||||||||||||||||
| (Dollars in thousands) | ||||||||||||||||||||||||||||||||
| Beginning balance | $ | 3,693 | $ | 4,360 | $ | 1,580 | $ | 501 | $ | 3,516 | $ | 336 | $ | 265 | $ | 14,251 | ||||||||||||||||
| Provision | (201 | ) | 408 | 310 | 9 | (232 | ) | (58 | ) | (203 | ) | 33 | ||||||||||||||||||||
| Charge-offs | (702 | ) | (2,415 | ) | (598 | ) | — | (566 | ) | (133 | ) | (140 | ) | (4,554 | ) | |||||||||||||||||
| Recoveries | 193 | 364 | 41 | — | 218 | 163 | 363 | 1,342 | ||||||||||||||||||||||||
| Ending balance | $ | 2,983 | $ | 2,717 | $ | 1,333 | $ | 510 | $ | 2,936 | $ | 308 | $ | 285 | $ | 11,072 | ||||||||||||||||
The following tables present, by portfolio segment and reserving methodology, the allocation of the allowance for loan losses and the gross investment in loans:
| December 31, 2016 | ||||||||||||||||||||||||||||||||
| One-to
four Family Residential | Commercial
Real Estate | Home
Equity and Lines of Credit | Residential
Construction | Other
Construction and Land | Commercial | Consumer | Total | |||||||||||||||||||||||||
| (Dollars in thousands) | ||||||||||||||||||||||||||||||||
| Allowance for loan losses | ||||||||||||||||||||||||||||||||
| Individually evaluated for impairment | $ | 201 | $ | 178 | $ | 2 | $ | — | $ | 175 | $ | 28 | $ | — | $ | 584 | ||||||||||||||||
| Collectively evaluated for impairment | 2,611 | 3,801 | 675 | 185 | 673 | 571 | 205 | 8,721 | ||||||||||||||||||||||||
| $ | 2,812 | $ | 3,979 | $ | 677 | $ | 185 | $ | 848 | $ | 599 | $ | 205 | $ | 9,305 | |||||||||||||||||
| Loans Receivable | ||||||||||||||||||||||||||||||||
| Individually evaluated for impairment | $ | 3,814 | $ | 8,153 | $ | 313 | $ | — | $ | 1,720 | $ | 306 | $ | — | $ | 14,306 | ||||||||||||||||
| Collectively evaluated for impairment | 274,623 | 284,726 | 50,021 | 18,531 | 58,885 | 41,000 | 4,594 | 732,380 | ||||||||||||||||||||||||
| $ | 278,437 | $ | 292,879 | $ | 50,334 | $ | 18,531 | $ | 60,605 | $ | 41,306 | $ | 4,594 | $ | 746,686 | |||||||||||||||||
| 100 |
| December 31, 2015 | ||||||||||||||||||||||||||||||||
| One-to
four Family Residential | Commercial
Real Estate | Home
Equity and Lines of Credit | Residential
Construction | Other
Construction and Land | Commercial | Consumer | Total | |||||||||||||||||||||||||
| (Dollars in thousands) | ||||||||||||||||||||||||||||||||
| Allowance for loan losses | ||||||||||||||||||||||||||||||||
| Individually evaluated for impairment | $ | 344 | $ | 61 | $ | 6 | $ | — | $ | 61 | $ | 38 | $ | — | $ | 510 | ||||||||||||||||
| Collectively evaluated for impairment | 2,111 | 3,160 | 1,091 | 278 | 1,339 | 565 | 407 | 8,951 | ||||||||||||||||||||||||
| $ | 2,455 | $ | 3,221 | $ | 1,097 | $ | 278 | $ | 1,400 | $ | 603 | $ | 407 | $ | 9,461 | |||||||||||||||||
| Loans Receivable | ||||||||||||||||||||||||||||||||
| Individually evaluated for impairment | $ | 6,315 | $ | 9,013 | $ | 313 | $ | — | $ | 1,509 | $ | 318 | $ | — | $ | 17,468 | ||||||||||||||||
| Collectively evaluated for impairment | 242,318 | 205,400 | 53,133 | 7,848 | 55,807 | 40,728 | 3,639 | 608,873 | ||||||||||||||||||||||||
| $ | 248,633 | $ | 214,413 | $ | 53,446 | $ | 7,848 | $ | 57,316 | $ | 41,046 | $ | 3,639 | $ | 626,341 | |||||||||||||||||
Portfolio Quality Indicators
The Company’s portfolio grading analysis estimates the capability of the borrower to repay the contractual obligations of the loan agreements as scheduled. The Company’s internal credit risk grading system is based on experiences with similarly graded loans, industry best practices, and regulatory guidance. Credit risk grades are refreshed each quarter, at which time management analyzes the resulting information, as well as other external statistics and factors, to track loan performance.
The Company’s internally assigned grades pursuant to the Board-approved lending policy are as follows:
| · | Pass (1-5) – Acceptable loans with any identifiable weaknesses appropriately mitigated. |
| · | Special Mention (6) – Potential weakness or identifiable weakness present without appropriate mitigating factors; however, loan continues to perform satisfactorily with no material delinquency noted. This may include some deterioration in repayment capacity and/or loan-to-value of securing collateral. |
| · | Substandard (7) – Significant weakness that remains unmitigated, most likely due to diminished repayment capacity, serious delinquency, and/or marginal performance based upon restructured loan terms. |
| · | Doubtful (8) – Significant weakness that remains unmitigated and collection in full is highly questionable or improbable. |
| · | Loss (9) – Collectability is unlikely resulting in immediate charge-off. | |
Beginning as of March 31, 2015, we no longer risk grade consumer purposed loans within all categories for which the individual loan balance is less than $417,000. These loan types provide limited credit information subsequent to origination and therefore may not be properly risk graded within our standard risk grading system. All of our consumer purposed loans are now considered ungraded and will be analyzed on a performing versus non-performing basis. The non-performing ungraded loans will be deemed substandard when determining our classified assets. Consumer purposed loans may include residential loans, home equity loans and lines of credit, residential lot loans, and other consumer loans. This change in risk grading methodology did not have any material impact on our allowance for loan losses calculation.
Description of segment and class risks
Each of our portfolio segments and the classes within those segments are subject to risks that could have an adverse impact on the credit quality of our loan portfolio. Management has identified the most significant risks as described below which are generally similar among our segments and classes. While the list in not exhaustive, it provides a description of the risks that management has determined are the most significant.
One-to-four family residential
We centrally underwrite each of our one-to-four family residential loans using credit scoring and analytical tools consistent with the Board-approved lending policy and internal procedures based upon industry best practices and regulatory directives. Loans to be sold to secondary market investors must also adhere to investor guidelines. We also evaluate the value and marketability of that collateral. Common risks to each class of non-commercial loans, including one-to-four family residential, include risks that are not specific to individual transactions such as general economic conditions within our markets, particularly unemployment and potential declines in real estate values. Personal events such as death, disability or change in marital status also add risk to non-commercial loans.
| 101 |
Commercial real estate
Commercial mortgage loans are primarily dependent on the ability of our customers to achieve business results consistent with those projected at loan origination resulting in cash flow sufficient to service the debt. To the extent that a customer’s business results are significantly unfavorable versus the original projections, the ability for our loan to be serviced on a basis consistent with the contractual terms may be at risk. While these loans are secured by real property and possibly other business assets such as inventory or accounts receivable, it is possible that the liquidation of the collateral will not fully satisfy the obligation. Other commercial real estate loans consist primarily of loans secured by multifamily housing and agricultural loans. The primary risk associated with multifamily loans is the ability of the income-producing property that collateralizes the loan to produce adequate cash flow to service the debt. High unemployment or generally weak economic conditions may result in our customer having to provide rental rate concessions to achieve adequate occupancy rates. The performance of agricultural loans are highly dependent on favorable weather, reasonable costs for seed and fertilizer, and the ability to successfully market the product at a profitable margin. The demand for these products is also dependent on macroeconomic conditions that are beyond the control of the borrower.
Home equity and lines of credit
Home equity loans are often secured by first or second liens on residential real estate, thereby making such loans particularly susceptible to declining collateral values. A substantial decline in collateral value could render our second lien position to be effectively unsecured. Additional risks include lien perfection inaccuracies and disputes with first lienholders that may further weaken our collateral position. Further, the open-end structure of these loans creates the risk that customers may draw on the lines in excess of the collateral value if there have been significant declines since origination.
Residential construction and other construction and land
Residential mortgage construction loans are typically secured by undeveloped or partially developed land with funds to be disbursed as home construction is completed contingent upon receipt and satisfactory review of invoices and inspections. Declines in real estate values can result in residential mortgage loan borrowers having debt levels in excess of the collateral’s current market value. Non-commercial construction and land development loans can experience delays in completion and/or cost overruns that exceed the borrower’s financial ability to complete the project. Cost overruns can result in foreclosure of partially completed collateral with unrealized value and diminished marketability. Commercial construction and land development loans are dependent on the supply and demand for commercial real estate in the markets we serve as well as the demand for newly constructed residential homes and building lots. Deterioration in demand could result in significant decreases in the underlying collateral values and make repayment of the outstanding loans more difficult for our customers.
Commercial
We centrally underwrite each of our commercial loans based primarily upon the customer’s ability to generate the required cash flow to service the debt in accordance with the contractual terms and conditions of the loan agreement. We strive to gain a complete understanding of our borrower’s businesses including the experience and background of the principals. To the extent that the loan is secured by collateral, which is a predominant feature of the majority of our commercial loans, or other assets including accounts receivable and inventory, we gain an understanding of the likely value of the collateral and what level of strength it brings to the loan transaction. To the extent that the principals or other parties are obligated under the note or guaranty agreements, we analyze the relative financial strength and liquidity of each guarantor. Common risks to each class of commercial loans include risks that are not specific to individual transactions such as general economic conditions within our markets, as well as risks that are specific to each transaction including volatility or seasonality of cash flows, changing demand for products and services, personal events such as death, disability or change in marital status, and reductions in the value of our collateral.
| 102 |
Consumer
The consumer loan portfolio includes loans secured by personal property such as automobiles, marketable securities, other titled recreational vehicles including boats and motorcycles, as well as unsecured consumer debt. The value of underlying collateral within this class is especially volatile due to potential rapid depreciation in values since date of loan origination in excess of principal repayment.
The following tables present the gross investment in loans by loan grade:
| December 31, 2016 | ||||||||||||||||||||||||||||||||
| Loan Grade | One-to-Four
Family Residential | Commercial
Real Estate | Home
Equity and Lines of Credit | Residential
Construction | Other
Construction and Land | Commercial | Consumer | Total | ||||||||||||||||||||||||
| (Dollars in thousands) | ||||||||||||||||||||||||||||||||
| 1 | $ | — | $ | 9,867 | $ | — | $ | — | $ | — | $ | 429 | $ | — | $ | 10,296 | ||||||||||||||||
| 2 | — | 4,290 | — | — | — | 1,463 | — | 5,753 | ||||||||||||||||||||||||
| 3 | 28,129 | 24,744 | 1,812 | 587 | 2,163 | 2,772 | — | 60,207 | ||||||||||||||||||||||||
| 4 | 75,542 | 131,117 | 3,393 | 10,686 | 22,374 | 21,824 | 51 | 264,987 | ||||||||||||||||||||||||
| 5 | 26,474 | 95,447 | 3,471 | 2,370 | 17,942 | 11,092 | 325 | 157,121 | ||||||||||||||||||||||||
| 6 | 2,594 | 11,537 | — | 286 | 2,473 | 268 | — | 17,158 | ||||||||||||||||||||||||
| 7 | 1,747 | 7,346 | — | — | 1,218 | 429 | — | 10,740 | ||||||||||||||||||||||||
| $ | 134,486 | $ | 284,348 | $ | 8,676 | $ | 13,929 | $ | 46,170 | $ | 38,277 | $ | 376 | $ | 526,262 | |||||||||||||||||
| Ungraded Loan Exposure: | ||||||||||||||||||||||||||||||||
| Performing | $ | 142,889 | $ | 8,531 | $ | 41,406 | $ | 4,602 | $ | 14,182 | $ | 3,029 | $ | 4,172 | $ | 218,811 | ||||||||||||||||
| Nonperforming | 1,062 | — | 252 | — | 253 | — | 46 | 1,613 | ||||||||||||||||||||||||
| Subtotal | $ | 143,951 | $ | 8,531 | $ | 41,658 | $ | 4,602 | $ | 14,435 | $ | 3,029 | $ | 4,218 | $ | 220,424 | ||||||||||||||||
| Total | $ | 278,437 | $ | 292,879 | $ | 50,334 | $ | 18,531 | $ | 60,605 | $ | 41,306 | $ | 4,594 | $ | 746,686 | ||||||||||||||||
| 103 |
| December 31, 2015 | ||||||||||||||||||||||||||||||||
| Loan Grade | One-to-Four
Family Residential | Commercial
Real Estate | Home
Equity and Lines of Credit | Residential
Construction | Other
Construction and Land | Commercial | Consumer | Total | ||||||||||||||||||||||||
| (Dollars in thousands) | ||||||||||||||||||||||||||||||||
| 1 | $ | — | $ | 65 | $ | — | $ | — | $ | — | $ | 10,336 | $ | — | $ | 10,401 | ||||||||||||||||
| 2 | — | 4,446 | — | — | — | 99 | — | 4,545 | ||||||||||||||||||||||||
| 3 | 18,518 | 11,396 | 1,358 | 525 | 1,479 | 1,734 | — | 35,010 | ||||||||||||||||||||||||
| 4 | 46,942 | 74,542 | 1,961 | 2,036 | 13,850 | 18,586 | 1 | 157,918 | ||||||||||||||||||||||||
| 5 | 33,886 | 97,469 | 6,648 | 1,347 | 22,864 | 9,274 | 592 | 172,080 | ||||||||||||||||||||||||
| 6 | 2,903 | 13,171 | — | 1,106 | 1,718 | 297 | — | 19,195 | ||||||||||||||||||||||||
| 7 | 3,335 | 13,106 | — | — | 579 | 458 | — | 17,478 | ||||||||||||||||||||||||
| $ | 105,584 | $ | 214,195 | $ | 9,967 | $ | 5,014 | $ | 40,490 | $ | 40,784 | $ | 593 | $ | 416,627 | |||||||||||||||||
| Ungraded Loan Exposure: | ||||||||||||||||||||||||||||||||
| Performing | $ | 141,771 | $ | 218 | $ | 43,158 | $ | 2,834 | $ | 16,707 | $ | 262 | $ | 3,046 | $ | 207,996 | ||||||||||||||||
| Nonperforming | 1,278 | — | 321 | — | 119 | — | — | 1,718 | ||||||||||||||||||||||||
| Subtotal | $ | 143,049 | $ | 218 | $ | 43,479 | $ | 2,834 | $ | 16,826 | $ | 262 | $ | 3,046 | $ | 209,714 | ||||||||||||||||
| Total | $ | 248,633 | $ | 214,413 | $ | 53,446 | $ | 7,848 | $ | 57,316 | $ | 41,046 | $ | 3,639 | $ | 626,341 | ||||||||||||||||
Delinquency Analysis of Loans by Class
The following tables include an aging analysis of the gross investment of past-due financing receivables by class. The Company does not accrue interest on loans greater than 90 days past due.
| December 31, 2016 | ||||||||||||||||||||||||
| 30-59
Days Past Due | 60-89
Days Past Due | 90
Days and Over Past Due | Total Past Due | Current | Total
Loans Receivable | |||||||||||||||||||
| (Dollars in thousands) | ||||||||||||||||||||||||
| One-to-four family residential | $ | 4,931 | $ | 1,116 | $ | 554 | $ | 6,601 | $ | 271,836 | $ | 278,437 | ||||||||||||
| Commercial real estate | 1,383 | 1,800 | 1,681 | 4,864 | 288,015 | 292,879 | ||||||||||||||||||
| Home equity and lines of credit | 126 | 44 | 233 | 403 | 49,931 | 50,334 | ||||||||||||||||||
| Residential construction | 180 | — | — | 180 | 18,351 | 18,531 | ||||||||||||||||||
| Other construction and land | 467 | — | 919 | 1,386 | 59,219 | 60,605 | ||||||||||||||||||
| Commercial | 368 | — | — | 368 | 40,938 | 41,306 | ||||||||||||||||||
| Consumer | 62 | 1 | — | 63 | 4,531 | 4,594 | ||||||||||||||||||
| Total | $ | 7,517 | $ | 2,961 | $ | 3,387 | $ | 13,865 | $ | 732,821 | $ | 746,686 | ||||||||||||
| December 31, 2015 | ||||||||||||||||||||||||
| 30-59
Days Past Due | 60-89
Days Past Due | 90
Days and Over Past Due | Total Past Due | Current | Total
Loans Receivable | |||||||||||||||||||
| (Dollars in thousands) | ||||||||||||||||||||||||
| One-to-four family residential | $ | 5,610 | $ | 1,260 | $ | 1,205 | $ | 8,075 | $ | 240,558 | $ | 248,633 | ||||||||||||
| Commercial real estate | 1,585 | — | 605 | 2,190 | 212,223 | 214,413 | ||||||||||||||||||
| Home equity and lines of credit | 369 | 38 | 322 | 729 | 52,717 | 53,446 | ||||||||||||||||||
| Residential construction | — | — | — | — | 7,848 | 7,848 | ||||||||||||||||||
| Other construction and land | 208 | 397 | 138 | 743 | 56,573 | 57,316 | ||||||||||||||||||
| Commercial | 625 | — | — | 625 | 40,421 | 41,046 | ||||||||||||||||||
| Consumer | 12 | 4 | — | 16 | 3,623 | 3,639 | ||||||||||||||||||
| Total | $ | 8,409 | $ | 1,699 | $ | 2,270 | $ | 12,378 | $ | 613,963 | $ | 626,341 | ||||||||||||
| 104 |
Impaired Loans
The following table presents investments in loans considered to be impaired and related information on those impaired loans:
| December 31, 2016 | December 31, 2015 | |||||||||||||||||||||||
| Recorded Balance | Unpaid
Principal Balance | Specific
Allowance | Recorded Balance | Unpaid
Principal Balance | Specific
Allowance | |||||||||||||||||||
| (Dollars in thousands) | ||||||||||||||||||||||||
| Loans without a valuation allowance | ||||||||||||||||||||||||
| One-to four-family residential | $ | 2,670 | $ | 2,723 | $ | — | $ | 4,289 | $ | 4,403 | $ | — | ||||||||||||
| Commercial real estate | 6,078 | 7,710 | — | 7,226 | 8,809 | — | ||||||||||||||||||
| Home equity and lines of credit | 213 | 328 | — | 213 | 328 | — | ||||||||||||||||||
| Other construction and land | 809 | 911 | — | 658 | 818 | — | ||||||||||||||||||
| Commercial | — | — | — | — | — | — | ||||||||||||||||||
| $ | 9,770 | $ | 11,672 | $ | — | $ | 12,386 | $ | 14,358 | $ | — | |||||||||||||
| Loans with a valuation allowance | ||||||||||||||||||||||||
| One-to four-family residential | $ | 1,144 | $ | 1,144 | $ | 201 | $ | 2,026 | $ | 2,026 | $ | 344 | ||||||||||||
| Commercial real estate | 2,075 | 2,075 | 178 | 1,787 | 1,787 | 61 | ||||||||||||||||||
| Home equity and lines of credit | 100 | 100 | 2 | 100 | 100 | 6 | ||||||||||||||||||
| Other construction and land | 911 | 911 | 175 | 851 | 851 | 61 | ||||||||||||||||||
| Commercial | 306 | 306 | 28 | 318 | 318 | 38 | ||||||||||||||||||
| $ | 4,536 | $ | 4,536 | $ | 584 | $ | 5,082 | $ | 5,082 | $ | 510 | |||||||||||||
| Total | ||||||||||||||||||||||||
| One-to four-family residential | $ | 3,814 | $ | 3,867 | $ | 201 | $ | 6,315 | $ | 6,429 | $ | 344 | ||||||||||||
| Commercial real estate | 8,153 | 9,785 | 178 | 9,013 | 10,596 | 61 | ||||||||||||||||||
| Home equity and lines of credit | 313 | 428 | 2 | 313 | 428 | 6 | ||||||||||||||||||
| Other construction and land | 1,720 | 1,822 | 175 | 1,509 | 1,669 | 61 | ||||||||||||||||||
| Commercial | 306 | 306 | 28 | 318 | 318 | 38 | ||||||||||||||||||
| $ | 14,306 | $ | 16,208 | $ | 584 | $ | 17,468 | $ | 19,440 | $ | 510 | |||||||||||||
| 105 |
The following table presents average impaired loans and interest income recognized on those impaired loans, by class segment, for the periods indicated:
| For the Year Ended December 31, | ||||||||||||||||||||||||
| 2016 | 2015 | 2014 | ||||||||||||||||||||||
| Average
Investment in Impaired Loans | Interest Income Recognized | Average
Investment in Impaired Loans | Interest Income Recognized | Average
Investment in Impaired Loans | Interest Income Recognized | |||||||||||||||||||
| (Dollars in thousands) | ||||||||||||||||||||||||
| Loans without a valuation allowance | ||||||||||||||||||||||||
| One-to-four family residential | $ | 2,758 | $ | 117 | $ | 6,072 | $ | 174 | $ | 6,079 | $ | 242 | ||||||||||||
| Commercial real estate | 7,834 | 116 | 7,999 | 299 | 14,255 | 664 | ||||||||||||||||||
| Home equity and lines of credit | 328 | 10 | 213 | 9 | 1,728 | 53 | ||||||||||||||||||
| Other construction and land | 923 | 27 | 668 | 30 | 2,332 | 70 | ||||||||||||||||||
| Commercial | — | — | — | — | — | — | ||||||||||||||||||
| $ | 11,843 | $ | 270 | $ | 14,952 | $ | 512 | $ | 24,394 | $ | 1,029 | |||||||||||||
| Loans with a valuation allowance | ||||||||||||||||||||||||
| One-to-four family residential | $ | 1,162 | $ | 48 | $ | 2,056 | $ | 88 | $ | 4,048 | $ | 137 | ||||||||||||
| Commercial real estate | 2,098 | 82 | 1,808 | 82 | 3,715 | 152 | ||||||||||||||||||
| Home equity and lines of credit | 100 | 4 | 100 | 4 | 149 | 6 | ||||||||||||||||||
| Other construction and land | 1,027 | 37 | 1,502 | 37 | 2,042 | 81 | ||||||||||||||||||
| Commercial | 312 | 19 | 323 | 19 | 334 | 20 | ||||||||||||||||||
| $ | 4,699 | $ | 190 | $ | 5,789 | $ | 230 | $ | 10,288 | $ | 396 | |||||||||||||
| Total | ||||||||||||||||||||||||
| One-to-four family residential | $ | 3,920 | $ | 165 | $ | 8,128 | $ | 262 | $ | 10,127 | $ | 379 | ||||||||||||
| Commercial real estate | 9,932 | 198 | 9,807 | 381 | 17,970 | 816 | ||||||||||||||||||
| Home equity and lines of credit | 428 | 14 | 313 | 13 | 1,877 | 59 | ||||||||||||||||||
| Other construction and land | 1,950 | 64 | 2,170 | 67 | 4,374 | 151 | ||||||||||||||||||
| Commercial | 312 | 19 | 323 | 19 | 334 | 20 | ||||||||||||||||||
| $ | 16,542 | $ | 460 | $ | 20,741 | $ | 742 | $ | 34,682 | $ | 1,425 | |||||||||||||
Nonperforming Loans
The following table summarizes the balances of nonperforming loans. Certain loans classified as Troubled Debt Restructurings (“TDRs”) and impaired loans may be on non-accrual status even though they are not contractually delinquent.
| December 31, | ||||||||
| 2016 | 2015 | |||||||
| (Dollars in thousands) | ||||||||
| One-to-four family residential | $ | 1,125 | $ | 2,893 | ||||
| Commercial real estate | 3,536 | 3,628 | ||||||
| Home equity loans and lines of credit | 250 | 320 | ||||||
| Other construction and land | 1,042 | 384 | ||||||
| Commercial | 41 | 55 | ||||||
| Consumer | 47 | — | ||||||
| Non-performing loans | $ | 6,041 | $ | 7,280 | ||||
| 106 |
Troubled Debt Restructurings (TDRs)
The following tables summarize TDRs as of the dates indicated:
| December 31, 2016 | ||||||||||||
| Performing | Nonperforming | Total | ||||||||||
| TDRs | TDRs | TDRs | ||||||||||
| (Dollars in thousands) | ||||||||||||
| One-to-four family residential | $ | 3,560 | $ | 210 | $ | 3,770 | ||||||
| Commercial real estate | 4,327 | 2,366 | 6,693 | |||||||||
| Home equity and lines of credit | 313 | — | 313 | |||||||||
| Other construction and land | 1,377 | 206 | 1,583 | |||||||||
| Commercial | 305 | — | 305 | |||||||||
| $ | 9,882 | $ | 2,782 | $ | 12,664 | |||||||
| December 31, 2015 | ||||||||||||
| Performing | Nonperforming | Total | ||||||||||
| TDRs | TDRs | TDRs | ||||||||||
| (Dollars in thousands) | ||||||||||||
| One-to-four family residential | $ | 4,182 | $ | 211 | $ | 4,393 | ||||||
| Commercial real estate | 5,134 | 2,922 | 8,056 | |||||||||
| Home equity and lines of credit | 313 | — | 313 | |||||||||
| Residential construction | — | — | — | |||||||||
| Other construction and land | 1,259 | 250 | 1,509 | |||||||||
| Commercial | 318 | 12 | 330 | |||||||||
| $ | 11,206 | $ | 3,395 | $ | 14,601 | |||||||
| 107 |
Loan modifications that were deemed TDRs at the time of the modification during the period presented are summarized in the table below:
| For the Year Ended December 31, 2015 | ||||||||||||
| (Dollars in thousands) | Number
of Loans | Pre-modification
Outstanding Recorded Investment | Post-modification
Outstanding Recorded Investment | |||||||||
| Forgiveness of principal: | ||||||||||||
| Commercial real estate | 1 | $ | 1,988 | $ | 1,693 | |||||||
| 1 | $ | 1,988 | $ | 1,693 | ||||||||
| Extended payment terms: | ||||||||||||
| Commercial real estate | 1 | $ | 833 | $ | 833 | |||||||
| 1 | $ | 833 | $ | 833 | ||||||||
There were no loan modifications that were deemed TDRs at the time of modification during the year ended December 31, 2016.
There were no TDRs that defaulted during the years ending December 31, 2016 or December 31, 2015 and which were modified as TDRs within the previous 12 months.
| 108 |
| NOTE 8. CONCENTRATIONS OF CREDIT RISK | |
A substantial portion of the Company’s loan portfolio is represented by loans in western North Carolina, northern Georgia, and Upstate South Carolina. The capacity and willingness of the Company’s debtors to honor their contractual obligations is dependent upon general economic conditions and the health of the real estate market within its general lending area. The majority of the Company’s loans, commitments, and lines of credit have been granted to customers in its primary market area and substantially all of these instruments are collateralized by real estate or other assets.
The Company, as a matter of policy, does not extend credit to any single borrower or group of related borrowers in excess of its legal lending limit which was $22.2 million at December 31, 2016 and $19.1 million at December 31, 2015.
The Company’s loans were concentrated in the following categories:
| December 31, | ||||||||
| 2016 | 2015 | |||||||
| One-to-four family residential | 37.3 | % | 39.7 | % | ||||
| Commercial real estate | 39.2 | 34.2 | ||||||
| Home equity and lines of credit | 6.7 | 8.5 | ||||||
| Residential construction | 2.5 | 1.3 | ||||||
| Other construction and land | 8.1 | 9.1 | ||||||
| Commercial | 5.5 | 6.6 | ||||||
| Consumer | 0.7 | 0.6 | ||||||
| Total loans | 100.0 | % | 100.0 | % | ||||
| 109 |
| NOTE 9. FIXED ASSETS | |
Fixed assets are summarized as follows:
| December 31, | ||||||||
| 2016 | 2015 | |||||||
| (Dollars in thousands) | ||||||||
| Land and improvements | $ | 9,201 | $ | 8,181 | ||||
| Buildings | 18,696 | 16,826 | ||||||
| Furniture, fixtures, and equipment | 8,429 | 7,569 | ||||||
| Construction in process | — | 31 | ||||||
| Total fixed assets | 36,326 | 32,607 | ||||||
| Less accumulated depreciation | (16,117 | ) | (14,934 | ) | ||||
| Fixed assets, net | $ | 20,209 | $ | 17,673 | ||||
Depreciation and leasehold amortization expense was $1.2 million, $1.0 million, and $0.9 million for the years ended December 31, 2016, 2015, and 2014, respectively.
The Bank has entered into operating leases in connection with its retail branch operations. These leases expire at various dates through December 2017. Total rental expense was approximately $0.1 million for the each of the years ended December 31, 2016, 2015 and 2014.
Following is a schedule of approximate annual future minimum lease payments under operating leases that have initial or remaining lease terms in excess of one year (in thousands):
| 2017 | $ | 49 | ||
| Total minimum lease commitments | $ | 49 |
| 110 |
| NOTE 10. REAL ESTATE OWNED | |
The following tables summarizes real estate owned and changes in the valuation allowance for real estate owned as of and for the periods indicated:
| As of December 31, | ||||||||||||
| (Dollars in thousands) | 2016 | 2015 | ||||||||||
| Real estate owned, gross | $ | 5,650 | $ | 6,741 | ||||||||
| Less: Valuation allowance | 1,424 | 1,372 | ||||||||||
| Real estate owned, net | $ | 4,226 | $ | 5,369 | ||||||||
| Year Ended December 31, | ||||||||||||
| (Dollars in thousands) | 2016 | 2015 | 2014 | |||||||||
| Valuation allowance, beginning | $ | 1,372 | $ | 1,760 | $ | 5,560 | ||||||
| Provision charged to expense | 655 | 171 | 2,349 | |||||||||
| Reduction due to disposal | (603 | ) | (559 | ) | (6,149 | ) | ||||||
| Valuation allowance, ending | $ | 1,424 | $ | 1,372 | $ | 1,760 | ||||||
As of December 31, 2016, the Company had $0.1 million in loans secured by residential real estate properties for which formal foreclosure proceedings were in process. As of December 31, 2016, the Company had $1.3 million of residential real estate properties included in real estate owned.
| 111 |
| NOTE 11. BANK OWNED LIFE INSURANCE (“BOLI”) | |
The following table summarizes the composition of our BOLI:
| December 31, | ||||||||
| 2016 | 2015 | |||||||
| (Dollars in thousands) | ||||||||
| Separate account | $ | 12,548 | $ | 12,388 | ||||
| General account | 17,944 | 7,636 | ||||||
| Hybrid | 855 | 834 | ||||||
| Total | $ | 31,347 | $ | 20,858 | ||||
The assets of the separate account are invested in the PIMCO Mortgage-backed Securities Account which is composed primarily of Treasury and Agency mortgage-backed securities with a rating of Aaa and repurchase agreements with a rating of P-1. The assets of the general account are invested in six different insurance carriers with ratings ranging from A+ to A++.
| NOTE 12. LOAN SERVICING | |
Loans serviced for others are not included in the accompanying consolidated balance sheets. The unpaid principal balances of mortgage and SBA loans serviced for others is detailed below.
| December 31, | ||||||||||
| 2016 | 2015 | 2014 | ||||||||
| (Dollars in thousands) | ||||||||||
| $ | 264,264 | $ | 251,492 | $ | 246,348 | |||||
The following summarizes the activity in the balance of loan servicing rights:
| December 31, | ||||||||||||
| 2016 | 2015 | 2014 | ||||||||||
| (Dollars in thousands) | ||||||||||||
| Loan servicing rights, beginning of period | $ | 2,344 | $ | 2,187 | $ | 1,883 | ||||||
| Capitalization from loans sold | 604 | 544 | 385 | |||||||||
| Fair value adjustment | (345 | ) | (387 | ) | (81 | ) | ||||||
| Loan servicing rights, end of period | $ | 2,603 | $ | 2,344 | $ | 2,187 | ||||||
The Company held custodial escrow deposits of $0.4 and $0.6 million for loan servicing accounts at December 31, 2016 and 2015, respectively.
| 112 |
| NOTE 13. GOODWILL AND OTHER INTANGIBLE ASSETS | |
The Company had $2.1 million and $0.7 million of goodwill as of December 31, 2016 and 2015, respectively. The following is a summary of changes in the carrying amounts of goodwill:
| Year Ended December 31, | ||||||||
| 2016 | 2015 | |||||||
| Dollars in thousands | ||||||||
| Balance at beginning of period | $ | 711 | $ | — | ||||
| Additions: | ||||||||
| Goodwill from acquisitions | 1,354 | 711 | ||||||
| Balance at end of period | $ | 2,065 | $ | 711 | ||||
The Company’s other intangible assets consist of core deposit intangibles related to core deposits acquired in the ASB branch and Old Town Bank acquisitions. The following is a summary of gross carrying amounts and accumulated amortization of core deposit intangibles:
| Years Ended December 31, | ||||||||
| 2016 | 2015 | |||||||
| Dollars in thousands | ||||||||
| Gross balance at beginning of period | $ | 590 | $ | — | ||||
| Additions from acquisitions | 530 | 590 | ||||||
| Gross balance at end of period | 1,120 | 590 | ||||||
| Less accumulated amortization | (141 | ) | — | |||||
| Core deposit intangible, net | $ | 979 | $ | 590 | ||||
Core deposit intangibles are amortized using the straight-line method over their estimated useful lives of seven years. Estimated amortization expense for core deposit intangibles for each of the next five years is $0.2 million per year.
| NOTE 14. DERIVATIVE FINANCIAL INSTRUMENTS AND HEDGING ACTIVITIES | |
The Company is exposed to certain risks arising from both its business operations and economic conditions. The Company principally manages its exposure to business and operational risks through management of its core business activities. The Company manages interest rate risk primarily by managing the amount, sources, and duration of its investment securities portfolio and borrowings and through the use of derivative financial instruments. Specifically, the Company enters into derivative financial instruments to manage exposures that arise from business activities that result in the receipt or payment of future known and uncertain cash amounts, the value of which are determined by interest rates. Derivative financial instruments are used to manage differences in the amount, timing, and duration of known or expected cash receipts or payments principally related to loans and borrowings.
| 113 |
The table below presents the fair value of the Company’s derivative financial instruments as of the dates indicated as well as their classification on the consolidated balance sheet (in thousands).
| Fair Value | ||||||||||
| Balance Sheet Location | December
31, 2016 | December
31, 2015 | ||||||||
| Designated as hedges: | ||||||||||
| Cash flow hedge of borrowings - interest rate swap | Other assets | $ | 476 | $ | — | |||||
| Total | $ | 476 | $ | — | ||||||
| Not designated as hedges: | ||||||||||
| Mortgage banking - loan commitment | Other assets | $ | 41 | $ | 30 | |||||
| Mortgage banking - forward sales commitment | Other assets | 19 | 15 | |||||||
| Total | $ | 60 | $ | 45 | ||||||
Derivative contracts that are not accounted for as hedging instruments under ASC 815, Derivatives and Hedging, are related to the Company’s mortgage loan origination activities. Between the time that the Company enters into an interest-rate lock commitment to originate a mortgage loan that is to be held for sale and the time the loan is funded and eventually sold, the Company is subject to the risk of variability in market prices. The Company enters into forward sale agreements to mitigate risk and to protect the expected gain on the eventual loan sale. This activity is on a matched basis, with a loan sale commitment hedging a specific loan. The commitments to originate mortgage loans and forward loan sales commitments are freestanding derivative instruments. The underlying loans are accounted for under the lower of cost or fair value method and are not reflected in the table above. Fair value adjustment on these derivative instruments are recorded within mortgage banking income in the Consolidated Statement of Income.
The Company’s objectives in using interest rate derivatives are to add stability to net interest revenue and to manage its exposure to interest rate movements. To accomplish this objective, the Company uses interest rate swaps as part of its interest rate risk management strategy. The structure of the swap agreements is described in the table below:
| Underlyings | Designation | Notional | Payment Provision | Life
of Swap Contract | ||||||
| Junior Subordinated Debt | Cash Flow Hedge | $ | 14,000 | Pay 0.958%/Receive 3 month LIBOR | 4 yrs | |||||
| FHLB Variable Rate Advance | Cash Flow Hedge | $ | 15,000 | Pay 1.054%/Receive 3 month LIBOR | 2 yrs | |||||
| FHLB Variable Rate Advance | Cash Flow Hedge | $ | 20,500 | Pay 1.354%/Receive 3 month LIBOR | 2 yrs | |||||
The swap contracts involve the payment of fixed-rate amounts to a counterparty in exchange for the Company receiving variable-rate payments without exchange of the underlying notional amounts.
The effective portion of changes in the fair value of derivatives designated and that qualify as cash flow hedges is recorded in accumulated other comprehensive income and is subsequently reclassified into earnings in the period that the hedged forecasted transaction affects earnings. The ineffectiveness of the cash flow hedge is recognized through earnings. There was no ineffectiveness in 2016.
The table below presents the effect of the Company’s cash flow hedge on the Consolidated Statement of Income (in thousands).
| Amount
of Gain(Loss) Recognized in Other Comprehensive Income on Derivative (Effective Portion) | Gain(Loss)
Reclassified from Accumulated Other Comprehensive Income into Income (Effective Portion) | |||||||||||||||||
| December 31, | December 31, | |||||||||||||||||
| 2016 | 2015 | Location | 2016 | 2015 | ||||||||||||||
| Interest rate swap | $ | 476 | $ | — | Interest Expense | $ | 32 | $ | — | |||||||||
| 114 |
The Company may be exposed to credit risk in the event of non-performance by the counterparties to its interest rate derivative agreements. The Company assesses the credit risk of its financial institution counterparties by monitoring publicly available credit rating and financial information. The Company manages dealer credit risk by entering into interest rate derivatives only with primary and highly rated counterparties, the use of ISDA master agreements and counterparty limits. The agreements contain collateral arrangements with the amount of collateral to be posted generally governed by the settlement value of outstanding swaps. The Company does not currently anticipate any losses from failure of interest rate derivative counterparties to honor their obligations.
The Company has agreements with its derivative counterparties that contain a provision in which if the Company defaults on any of its indebtedness, including default where repayment of the indebtedness has not been accelerated by the lender, the Company could also be declared in default on its derivative obligations. Furthermore, certain agreements covering the Company’s derivative instruments contain provisions that require the Company to maintain its status as a well / adequately capitalized institution. These provisions enable the counterparties to the derivative instruments to request immediate payment or require the Company to post additional collateral.
| NOTE 15. DEPOSITS | |
The following table summarizes deposit balances and the related interest expense by type of deposit:
| As of and for the Year Ended December 31, | ||||||||||||||||||||||||
| 2016 | 2015 | 2014 | ||||||||||||||||||||||
| (Dollars in thousands) | Balance | Interest
Expense | Balance | Interest
Expense | Balance | Interest
Expense | ||||||||||||||||||
| Noninterest-bearing demand | $ | 139,136 | $ | — | $ | 121,062 | $ | — | $ | 86,110 | $ | — | ||||||||||||
| Interest-bearing demand | 122,271 | 160 | 103,198 | 136 | 92,877 | 149 | ||||||||||||||||||
| Money market | 239,387 | 770 | 180,377 | 558 | 178,320 | 983 | ||||||||||||||||||
| Savings | 40,014 | 49 | 35,838 | 33 | 27,591 | 36 | ||||||||||||||||||
| Time deposits | 289,205 | 2,985 | 276,142 | 3,607 | 318,219 | 4,193 | ||||||||||||||||||
| $ | 830,013 | $ | 3,964 | $ | 716,617 | $ | 4,334 | $ | 703,117 | $ | 5,361 | |||||||||||||
Contractual maturities of time deposit accounts are summarized as follows:
| December 31, 2016 | ||||
| (Dollars in thousands) | ||||
| 2017 | $ | 151,236 | ||
| 2018 | 68,287 | |||
| 2019 | 31,093 | |||
| 2020 | 14,434 | |||
| 2021 | 11,789 | |||
| Thereafter | 12,366 | |||
| $ | 289,205 | |||
The following table presents the activity related to the fair value premium on acquired time deposits:
| For the Year Ended December 31, | ||||||||||||
| (Dollars in thousands) | 2016 | 2015 | 2014 | |||||||||
| Time deposit premium, beginning of period | $ | 30 | $ | — | $ | — | ||||||
| Additional premium for acquisitions | 648 | 30 | — | |||||||||
| Accretion | (258 | ) | — | — | ||||||||
| Time deposit premium, end of period | $ | 420 | $ | 30 | $ | — | ||||||
| 115 |
The Company had time deposit accounts in amounts of $250 thousand or more totaling $46.9 million and $26.4 million at December 31, 2016 and 2015, respectively.
The Company held brokered deposits of approximately $11.8 million at December 31, 2016 and held no brokered deposits at December 31, 2015.
The Company had deposits from related parties of $2.2 million and $1.7 million at December 31, 2016 and 2015, respectively.
| NOTE 16. BORROWINGS | |
The Company has total credit availability with the FHLB of up to 30% of assets, subject to the availability of qualified collateral. As collateral for these borrowings, the Company pledges certain investment securities, its FHLB stock, and its entire loan portfolio of qualifying mortgages (as defined) under a blanket collateral agreement with the FHLB. At December 31, 2016, the Company had unused borrowing capacity with the FHLB of $13.9 million based on collateral pledged at that date. The Company had total additional credit availability with FHLB of $56.8 million as of December 31, 2016 if additional collateral was pledged.
| 116 |
The following tables summarize the outstanding FHLB advances as of the dates indicated:
| December 31, 2016 | ||||||||||||
| Balance | Type | Rate | Maturity | |||||||||
| (Dollars in thousands) | ||||||||||||
| $ | 5,000 | Fixed Rate | 0.58 | % | 1/3/2017 | |||||||
| 5,000 | Fixed Rate | 0.44 | % | 1/3/2017 | ||||||||
| 50,000 | Fixed Rate | 0.49 | % | 1/5/2017 | ||||||||
| 30,000 | Fixed Rate | 0.64 | % | 1/15/2017 | ||||||||
| 15,000 | Fixed Rate | 0.63 | % | 1/17/2017 | ||||||||
| 25,000 | Fixed Rate | 0.64 | % | 1/23/2017 | ||||||||
| 20,000 | Fixed Rate | 0.56 | % | 2/7/2017 | ||||||||
| 5,000 | Fixed Rate | 0.58 | % | 3/28/2017 | ||||||||
| 15,000 | Adjustable Rate | 0.56 | % | 3/29/2017 | ||||||||
| 5,000 | Fixed Rate | 0.80 | % | 3/31/2017 | ||||||||
| 5,000 | Fixed Rate | 0.60 | % | 4/3/2017 | ||||||||
| 10,000 | Fixed Rate | 0.60 | % | 4/6/2017 | ||||||||
| 1,000 | Fixed Rate | 0.87 | % | 5/11/2017 | ||||||||
| 20,500 | Adjustable Rate | 0.73 | % | 5/23/2017 | ||||||||
| 5,000 | Fixed Rate | 0.82 | % | 6/6/2017 | ||||||||
| 2,000 | Fixed Rate | 1.02 | % | 6/12/2017 | ||||||||
| 5,000 | Fixed Rate | 0.76 | % | 6/30/2017 | ||||||||
| 25,000 | Fixed Rate | 0.77 | % | 8/7/2017 | ||||||||
| 10,000 | Fixed Rate | 0.82 | % | 9/28/2017 | ||||||||
| 10,000 | Fixed Rate | 0.77 | % | 12/29/2017 | ||||||||
| 5,000 | Fixed Rate | 0.78 | % | 12/30/2017 | ||||||||
| 5,000 | Fixed Rate | 1.26 | % | 6/5/2018 | ||||||||
| 10,000 | Fixed Rate | 0.84 | % | 6/29/2018 | ||||||||
| 5,000 | Fixed Rate | 1.40 | % | 7/1/2018 | ||||||||
| 5,000 | Fixed Rate | 1.51 | % | 12/31/2018 | ||||||||
| $ | 298,500 | 0.68 | % | |||||||||
| December 31, 2015 | ||||||||||||
| Balance | Type | Rate | Maturity | |||||||||
| (Dollars in thousands) | ||||||||||||
| $ | 45,000 | Fixed Rate | 0.30 | % | 2/5/2016 | |||||||
| 5,000 | Fixed Rate | 0.39 | % | 3/28/2016 | ||||||||
| 5,000 | Fixed Rate | 0.52 | % | 3/30/2016 | ||||||||
| 10,000 | Fixed Rate | 0.47 | % | 3/31/2016 | ||||||||
| 5,000 | Fixed Rate | 0.49 | % | 6/6/2016 | ||||||||
| 5,000 | Fixed Rate | 0.69 | % | 6/30/2016 | ||||||||
| 5,000 | Fixed Rate | 0.51 | % | 6/30/2016 | ||||||||
| 5,000 | Fixed Rate | 0.74 | % | 7/1/2016 | ||||||||
| 20,000 | Daily Rate | 0.49 | % | 7/21/2016 | ||||||||
| 10,000 | Fixed Rate | 0.58 | % | 9/28/2016 | ||||||||
| 5,000 | Fixed Rate | 0.79 | % | 12/5/2016 | ||||||||
| 5,000 | Fixed Rate | 0.98 | % | 12/30/2016 | ||||||||
| 5,000 | Fixed Rate | 0.74 | % | 12/30/2016 | ||||||||
| 1,000 | Fixed Rate | 0.87 | % | 5/11/2017 | ||||||||
| 2,000 | Fixed Rate | 1.02 | % | 6/12/2017 | ||||||||
| 5,000 | Fixed Rate | 1.38 | % | 12/29/2017 | ||||||||
| 2,000 | Fixed Rate | 1.25 | % | 5/11/2018 | ||||||||
| 10,000 | Fixed Rate | 1.83 | % | 4/10/2019 | ||||||||
| 2,500 | Fixed Rate | 1.77 | % | 6/11/2019 | ||||||||
| 1,000 | Fixed Rate | 1.78 | % | 5/11/2020 | ||||||||
| $ | 153,500 | 0.65 | % | |||||||||
| 117 |
To add stability to net interest revenue and manage our exposure to interest rate movement on our adjustable rate advances, we entered into two FHLB advance interest rate swaps in 2016. The swap contracts involve the payment of fixed-rate amounts to a counterparty in exchange for our receipt of variable-rate payments over the two year lives of the contracts. The effective interest rates were 0.76% and 1.15% at December 31, 2016 for the adjustable rate advances maturing March 29, 2017 and May 23, 2017, respectively.
The scheduled annual maturities of FHLB advances and respective weighted average rates, are as follows:
| December 31, 2016 | ||||||||||
| Year | Balance | Weighted
Average Rate | ||||||||
| (Dollars in thousands) | ||||||||||
| 2017 | 273,500 | 0.64 | % | |||||||
| 2018 | 25,000 | 1.17 | % | |||||||
| $ | 298,500 | 0.68 | % | |||||||
The Company also maintained approximately $48.9 million and $48.2 million in borrowing capacity with the FRB discount window as of December 31, 2016 and 2015, respectively. The Company had no FRB discount window borrowings outstanding at December 31, 2016 or 2015. The rate charged on discount window borrowings is currently the Fed Funds target rate plus 0.50% (i.e.,1.25% as of December 31, 2016).
| 118 |
| NOTE 17. JUNIOR SUBORDINATED DEBT | |
The Company issued $14.4 million of junior subordinated notes to its wholly owned subsidiary, Macon Capital Trust I, to fully and unconditionally guarantee the trust preferred securities issued by the Trust. These notes qualify as Tier I capital for the Company. The notes accrue interest quarterly at 2.80% above the 90-day LIBOR, adjusted quarterly. To add stability to net interest revenue and manage our exposure to interest rate movement, we entered into an interest rate swap in June 2016. The swap contract involves the payment of fixed-rate amounts to a counterparty in exchange for our receipt of variable-rate payments over the four year life of the contract. The effective interest rate was 3.76% and 3.34% at December 31, 2016 and 2015, respectively. The notes mature on March 30, 2034.
The Company has the right to redeem the notes, in whole or in part, on or after March 30, 2009 at a price equal to 100% of the principal amount plus accrued and unpaid interest. In addition, the Company may redeem the notes in whole (but not in part) upon the occurrence of a capital disqualification event, an investment company event, or a tax event at a specified redemption price as defined in the indenture.
The Company also may, at its option, defer the payment of interest on the notes for a period up to 20 consecutive quarters, provided that interest will also accrue on the deferred payments of interest. As of December 31, 2016, the Company was current on all interest payments due.
| NOTE 18. EMPLOYEE BENEFIT PLANS | |
The Company maintains an employee savings plan under Section 401(k) of the Internal Revenue Code. This plan covers substantially all full-time employees who have attained the age of 21. Employees may contribute a percentage of their annual gross salary as limited by the federal tax laws. The Company matches employee contributions based on the plan guidelines. The Company contribution totaled $0.5 million, $0.4 million, and $0.2 million for the years ended December 31, 2016, 2015, and 2014.
The Company has a compensated expense policy that allows employees to accrue paid time off for vacation, sick or other unexcused absences up to a specified number of days each year. Employees may sell back a limited amount of unused time at the end of each year or convert the time to an accrued sick time account which is forfeited if unused at termination, but no carry-over or payout of unused time is permitted.
| NOTE 19. POST-EMPLOYMENT BENEFITS | |
The Company has established several nonqualified deferred compensation and post-employment programs providing benefits to certain directors and key management employees. No new participants have been admitted to any of the plans since 2009 and existing benefit levels have been frozen.
A summary of the key terms and accounting for each plan are as follows:
| · | Supplemental Executive Retirement Plan (“SERP”) – provides a post-retirement income stream to several current and former executives. The estimated present value of the future benefits to be paid during a post-retirement period of 216 months is accrued over the period from the effective date of the agreement to the expected date of retirement. The SERP is an unfunded plan and is considered a general contractual obligation of the Company. For the years ended December 31, 2016, 2015, and 2014, the Company recorded expense related to the SERP utilizing a discount rate of 4.0%, 4.0%, and 7.0%, respectively. |
| · | CAP Equity Plan – provides a post-retirement benefit payable in cash to several current and former officers and directors. During 2015, the Company funded a Rabbi Trust to seek to generate returns that will offset the market risk of certain deferred compensation agreements associated with the Plan. Some Plan participants elected to have their benefits tied to the value of specific assets, including, for example, the Company’s common stock. The remaining participants elected to continue receiving interest of 8% which is accrued on such participant’s unpaid balance after termination from the Company, subject to the terms of the Plan. The Plan was frozen in 2009, and no additional deferrals are allowed. |
| 119 |
| · | Director Consultation Plan – provides a post-retirement monthly benefit for continuing to provide consulting services as needed. The gross amounts of the future payments are accrued. |
| · | Life Insurance Plan – provides an endorsement split dollar benefit to several current and former executives, under which the Company has agreed to maintain an insurance policy during the executive’s retirement and to provide the executive with a death benefit. The estimated cost of insurance for the portion of the policy expected to be paid as a split dollar death benefit in each post-retirement year is measured for the period between expected retirement age and the earlier of (a) expected mortality and (b) age 95. The resulting amount is then allocated on a present value basis to the period ending on the participant’s full eligibility date. A discount rate of 4% and life expectancy based on the 2001 Valuation Basic Table has been assumed. |
The following table summarizes the liabilities for each plan as of the dates indicated:
| December 31, | ||||||||
| 2016 | 2015 | |||||||
| (Dollars in thousands) | ||||||||
| SERP | $ | 4,417 | $ | 4,435 | ||||
| CAP Equity | 4,718 | 4,890 | ||||||
| Director Consultation | 252 | 258 | ||||||
| Life Insurance | 824 | 641 | ||||||
| $ | 10,211 | $ | 10,224 | |||||
The expense related to the plans noted above totaled $0.8 million, $1.4 million, and $0.6 million for the years ended December 31, 2016, 2015, and 2014, respectively.
| NOTE 20. SHARE-BASED COMPENSATION | |
The Company provides stock-based awards through its 2015 Long-Term Stock Incentive Plan which provides for awards of restricted stock, restricted stock units, stock options, and performance units to directors, officers, and employees. The cost of equity-based awards under the 2015 Long-Term Stock Incentive Plan generally is based on the fair value of the awards on their grant date. The maximum number of shares that may be utilized for awards under the plan is 654,637, including 458,246 for stock options and 196,391 for awards of restricted stock and restricted stock units. Shares of common stock awarded under the 2015 Long-Term Stock Incentive Plan may be issued from authorized but unissued shares or shares purchased on the open market.
Share-based compensation expense related to stock options and restricted stock units recognized was $0.9 million and $0.1 million for the years ended December 31, 2016 and 2015, respectively.
| 120 |
The table below presents stock option activity and related information:
| Restricted Stock | Options | |||||||||||||||||||||||
| (Dollars in thousands, except per share data) | Shares | Weighted Average Grant Date Fair Value | Options Outstanding | Weighted Average Exercise Price | Weighted Average Remaining Contractual Life (Years) | Aggregate Intrinsic Value (000’s) | ||||||||||||||||||
| December 31, 2014 | — | $ | — | — | $ | — | ||||||||||||||||||
| Granted | 157,100 | 18.55 | 366,000 | 18.55 | ||||||||||||||||||||
| Vested | — | — | — | |||||||||||||||||||||
| Forfeited | — | — | — | |||||||||||||||||||||
| December 31, 2015 | 157,100 | 18.55 | 366,000 | 18.55 | ||||||||||||||||||||
| Granted | 26,300 | 17.49 | 57,400 | 17.52 | ||||||||||||||||||||
| Vested/Exercised | (30,220 | ) | 18.55 | — | — | |||||||||||||||||||
| Forfeited | (7,600 | ) | 18.55 | (16,200 | ) | 18.55 | ||||||||||||||||||
| December 31, 2016 | 145,580 | 18.36 | 407,200 | 18.41 | 9.00 | $ | 890 | |||||||||||||||||
| Vested/Exercisable at December 31, 2016 | — | — | 70,600 | 18.55 | 8.92 | 143 | ||||||||||||||||||
The following is a summary of stock options outstanding at December 31, 2016:
| Options Outstanding | Options Exercisable | |||||||||||||||||||||||||
| Shares | Range | Wtd Ave Price | Ave Remaining Life | Shares | Wtd Ave Price | Ave Remaining Life | ||||||||||||||||||||
| 5,000 | $ | 16.00-17.00 | $ | 16.75 | 9.14 | — | $ | — | — | |||||||||||||||||
| 40,500 | 17.01-18.00 | 17.45 | 9.41 | — | — | — | ||||||||||||||||||||
| 361,700 | 18.01-18.55 | 18.54 | 8.95 | 70,600 | 18.55 | 8.92 | ||||||||||||||||||||
| 407,200 | 18.41 | 9.00 | 70,600 | 18.55 | 8.92 | |||||||||||||||||||||
The weighted average fair value of options granted in 2016 and 2015 was $3.02 and $3.37, respectively. The fair value of each option award is estimated on the date of the grant using the Black-Scholes option pricing model. The risk-free interest rate is based on a U.S. Treasury instrument with a life that is similar to the expected life of the option grant. The Company is a newly public company as defined by SEC Staff Accounting Bulletin No. 110. As such, the expected term of the options is based on a calculated average life using the “simplified method” and expected volatility is estimated based on the trading history for a composite index of U.S. Thrifts of similar size.
The following table illustrates the assumptions for the Black-Scholes model used in determining the fair value of options granted:
| 2016 | 2015 | |||||||
| Fair value per option | $ | 3.02 | $ | 3.37 | ||||
| Expected life (years) | 6.5 years | 6.5 years | ||||||
| Expected stock price volatility | 12 | % | 12 | % | ||||
| Expected dividend yield | 0.00 | % | 0.00 | % | ||||
| Risk-free interest rate | 1.57 | % | 1.85 | % | ||||
| Expected forfeiture rate | 0.00 | % | 0.00 | % | ||||
At December 31, 2016, the Company had $3.7 million of unrecognized compensation expense related to stock options and restricted stock. The remaining period over which compensation cost related to unvested stock options and restricted stock is expected to be recognized is 4.01 years at December 31, 2016. No stock options or restricted stock were vested as of December 31, 2015. All unexercised options expire ten years after the grant date.
| 121 |
| NOTE 21. INCOME TAXES | |
Income tax expense (benefit) is summarized as follows:
| For the Year Ended December 31, | ||||||||||||
| 2016 | 2015 | 2014 | ||||||||||
| (Dollars in thousands) | ||||||||||||
| Current | ||||||||||||
| Federal | $ | 549 | $ | (150 | ) | $ | 112 | |||||
| State | 24 | — | (25 | ) | ||||||||
| Deferred | ||||||||||||
| Federal | 2,370 | 2,252 | 2,348 | |||||||||
| State | 552 | 109 | 504 | |||||||||
| Change in valuation allowance | — | (18,950 | ) | (731 | ) | |||||||
| Total income tax expense (benefit) | $ | 3,495 | $ | (16,739 | ) | $ | 2,208 | |||||
The differences between actual income tax expense and the amount computed by applying the federal statutory income tax rate of 35% to income before income taxes for the periods indicated is reconciled as follows:
| For the Year Ended December 31, | ||||||||||||
| 2016 | 2015 | 2014 | ||||||||||
| (Dollars in thousands) | ||||||||||||
| Computed income tax expense | $ | 3,455 | $ | 2,480 | $ | 2,853 | ||||||
| Deferred tax valuation allowance | — | (18,950 | ) | (731 | ) | |||||||
| State income tax, net of federal benefit | 218 | 165 | 271 | |||||||||
| Nontaxable municipal security income | (544 | ) | (126 | ) | (115 | ) | ||||||
| Nontaxable BOLI income | (107 | ) | (160 | ) | (182 | ) | ||||||
| Other | 473 | (148 | ) | 112 | ||||||||
| Actual income tax expense (benefit) | $ | 3,495 | $ | (16,739 | ) | $ | 2,208 | |||||
| Effective tax rate | 35.4 | % | -236.2 | % | 27.1 | % | ||||||
| 122 |
The components of net deferred taxes as of the periods indicated are summarized as follows:
| As of December 31, | ||||||||
| 2016 | 2015 | |||||||
| (Dollars in thousands) | ||||||||
| Deferred tax assets: | ||||||||
| Allowance for loan losses | $ | 3,245 | $ | 3,557 | ||||
| Deferred compensation and post employment benefits | 3,365 | 3,498 | ||||||
| Non-accrual interest | 375 | 286 | ||||||
| Valuation reserve for other real estate | 693 | 516 | ||||||
| North Carolina NOL carryover | 557 | 988 | ||||||
| Federal NOL carryover | 8,560 | 10,750 | ||||||
| Unrealized losses on securities | 3,079 | 697 | ||||||
| Loan basis differences | 238 | — | ||||||
| Deposit premium | 155 | — | ||||||
| Other | 1,160 | 772 | ||||||
| Total deferred tax assets | 21,427 | 21,064 | ||||||
| Deferred tax liabilities: | ||||||||
| Fixed assets | 263 | 499 | ||||||
| Loan servicing rights | 962 | 881 | ||||||
| Core deposit intangible | 158 | — | ||||||
| Deferred loan costs | 1,002 | 708 | ||||||
| Prepaid expenses | 57 | 146 | ||||||
| Total deferred tax liabilities | 2,442 | 2,234 | ||||||
| Net deferred tax asset | $ | 18,985 | $ | 18,830 | ||||
Upon exercise or vesting of a share-based award, if the tax deduction exceeds the compensation cost that was previously recorded for financial statement purposes this will result in an excess tax benefit. ASU 2016-09, “Compensation-Stock Compensation (718) Improvements to Employee Share-based Payment Accounting” requires the Company to recognize all excess tax benefits or tax deficiencies through the income statement as income tax expense or tax benefit. Under previous GAAP, any excess tax benefits were recognized in additional paid-in capital to offset current-period and subsequent-period tax deficiencies. The Company chose to adopt ASU 2016-09 early for which early adoption should be applied using the modified retrospective transition method by means of a cumulative-effect adjustment to equity as of the beginning of the period in which guidance was adopted. A tax benefit of $0.03 million was recorded during the year ended December 31, 2016 as a result of share awards vesting during the year.
During 2015, the Company completed an analysis of all positive and negative evidence in assessing the need to maintain the valuation allowance against its net deferred tax asset. As a result of this analysis, the Company determined that significant positive evidence existed that would support the reversal of the valuation allowance including the following:
| 123 |
| · | A pattern of sustained profitability, excluding non-recurring items, since the first quarter of 2014; |
| · | A 3 year cumulative profit; |
| · | Forecasted earnings sufficient to utilize all remaining net operating losses prior to expiration beginning in 2024 for North Carolina and 2027 for federal; |
| · | Significant improvements in asset quality; |
| · | Resolution of all remaining regulatory orders; and |
| · | A strong capital position enabling future earnings investments. | |
As of December 31, 2016 and 2015, $0.2 million and $0.6 million in valuation allowance related to net deferred tax assets on investment securities remains in accumulated other comprehensive income. This valuation allowance will be recognized as tax expense on a security-by-security basis upon the sale or maturity of the individual securities. The tax expense is expected to be recognized over the remaining life of the securities of approximately 1 year.
The following table summarizes the amount and expiration dates of the Company’s unused net operating losses:
| As of December 31, 2016 | ||||||||
| (Dollars in thousands) | Amount | Expiration Dates | ||||||
| Federal | $ | 24,458 | 2027-2034 | |||||
| North Carolina | $ | 28,425 | 2024-2028 | |||||
The Company recognized reductions in its net deferred tax assets of approximately $0.4 million during both the years ended December 31, 2016 and 2015 as a result of a reduction in the expected North Carolina income tax rate from 4.0% to 3.0% and from 5.0% to 4.0%, respectively.
The Company is subject to examination for federal and state purposes for the tax years 2013 through 2016. As of December 31, 2016 and 2015, the Company does not have any material unrecognized tax positions.
| NOTE 22. EARNINGS PER SHARE | |
The following is a reconciliation of the numerator and denominator of basic and diluted net income per share of common stock:
| For the Year Ended December 31, | ||||||||
| (Dollars in thousands, except per share amounts) | 2016 | 2015 | ||||||
| Numerator: | ||||||||
| Net income | $ | 6,376 | $ | 23,825 | ||||
| Denominator: | ||||||||
| Weighted-average common shares outstanding - basic | 6,477,284 | 6,546,375 | ||||||
| Effect of dilutive restricted stock units | 12,647 | — | ||||||
| Weighted-average common shares outstanding - diluted | 6,489,931 | 6,546,375 | ||||||
| Earnings per share - basic | $ | 0.98 | $ | 3.64 | ||||
| Earnings per share - diluted | $ | 0.98 | $ | 3.64 | ||||
The average market price used in calculating the assumed number of dilutive shares issued related to stock options for the years ended December 31, 2016 and 2015 was $17.93 and $16.87, respectively. As a result of the average stock price being less than the exercise price of all options in the years ended December 31, 2016 and 2015, the stock options are not deemed dilutive in calculating diluted earnings per share for the period.
As of December 31, 2015, all 157,100 restricted stock units issued were deemed to be anti-dilutive based on the treasury stock method.
| 124 |
| NOTE 23. ACCUMULATED OTHER COMPREHENSIVE INCOME (LOSS) | |
The following table summarizes the components of accumulated other comprehensive income (loss) and changes in those components as of and for the years ended December 31:
| (Dollars in thousands) | Available for Sale Securities | Held to Maturity Securities Transferred from AFS | Deferred Tax Valuation Allowance on AFS | Cash Flow Hedge | Total | |||||||||||||||
| Balance, December 31, 2013 | $ | (3,374 | ) | $ | (1,242 | ) | $ | (2,860 | ) | $ | — | $ | (7,476 | ) | ||||||
| Change in deferred tax valuation allowance attributable to net unrealized losses on investment securities | — | — | 1,992 | — | 1,992 | |||||||||||||||
| Change in unrealized holding gains/losses on securities available for sale | 5,665 | — | — | — | 5,665 | |||||||||||||||
| Reclassification adjustment for net securities gains included in net income | (657 | ) | — | — | — | (657 | ) | |||||||||||||
| Transfer of net unrealized loss from available for sale to held to maturity | 74 | (74 | ) | — | — | — | ||||||||||||||
| Amortization of unrealized losses on securities transferred to held to maturity | — | 199 | — | — | 199 | |||||||||||||||
| Income tax expense (benefit) | (1,944 | ) | (48 | ) | — | — | (1,992 | ) | ||||||||||||
| Balance, December 31, 2014 | $ | (236 | ) | $ | (1,165 | ) | $ | (868 | ) | $ | — | $ | (2,269 | ) | ||||||
| Change in deferred tax valuation allowance attributable to net unrealized losses on investment securities | — | — | 289 | — | 289 | |||||||||||||||
| Change in unrealized holding gains/losses on securities available for sale | (166 | ) | — | — | — | (166 | ) | |||||||||||||
| Reclassification adjustment for net securities gains included in net income | (403 | ) | — | — | — | (403 | ) | |||||||||||||
| Amortization of unrealized losses on securities transferred to held to maturity | — | 984 | — | — | 984 | |||||||||||||||
| Income tax expense (benefit) | 211 | (382 | ) | — | — | (171 | ) | |||||||||||||
| Balance, December 31, 2015 | $ | (594 | ) | $ | (563 | ) | $ | (579 | ) | $ | — | $ | (1,736 | ) | ||||||
| Change in deferred tax valuation allowance attributable to net unrealized losses on investment securities | — | — | 377 | — | 377 | |||||||||||||||
| Change in unrealized holding gains/losses on securities available for sale | (6,652 | ) | — | — | — | (6,652 | ) | |||||||||||||
| Reclassification adjustment for net securities gains included in net income | (1,216 | ) | — | — | — | (1,216 | ) | |||||||||||||
| Amortization of unrealized losses on securities transferred to held to maturity | — | 578 | — | — | 578 | |||||||||||||||
| Reduction in unrealized losses related to held to maturity securities transferred to available-for-sale | — | 325 | — | — | 325 | |||||||||||||||
| Change in unrealized holding gains/losses on cash flow hedge | — | — | — | 476 | 476 | |||||||||||||||
| Income tax expense (benefit) | 2,908 | (340 | ) | — | (176 | ) | 2,392 | |||||||||||||
| Balance, December 31, 2016 | $ | (5,554 | ) | $ | — | $ | (202 | ) | $ | 300 | $ | (5,456 | ) | |||||||
| 125 |
The following table shows the line items in the Consolidated Statements of Operations affected by amounts reclassified from accumulated other comprehensive income (loss):
| (Dollars in thousands) | 2016 | 2015 | 2014 | Line Item Affected | ||||||||||
| Available-for-sale securities | ||||||||||||||
| Gains recognized | $ | 1,216 | $ | 403 | $ | 657 | Gain on sale of investments, net of loss | |||||||
| Income tax effect | (449 | ) | (152 | ) | (247 | ) | Income tax expense | |||||||
| Reclassified out of AOCI, net of tax | 767 | 251 | 410 | Net income | ||||||||||
| Held-to-maturity securities | ||||||||||||||
| Amortization of unrealized losses | (578 | ) | (984 | ) | (199 | ) | Interest income - taxable securities | |||||||
| Increase related to transfer from AFS | — | — | 74 | Interest income - taxable securities | ||||||||||
| Reduction related to transfer to AFS | (325 | ) | — | — | Interest income - taxable securities | |||||||||
| Income tax effect | 340 | 382 | 48 | Income tax expense | ||||||||||
| Reclassified out of AOCI, net of tax | (563 | ) | (602 | ) | (77 | ) | Net income | |||||||
| Cash flow hedge | ||||||||||||||
| Interest expense - effective portion | (16 | ) | — | — | Interest expense - FHLB advances | |||||||||
| Interest expense - effective portion | (16 | ) | — | — | Interest expense - Junior subordinated notes | |||||||||
| Income tax effect | 12 | — | — | Income tax expense | ||||||||||
| Reclassified out of AOCI, net of tax | (20 | ) | — | — | Net income | |||||||||
| Deferred tax valuation allowance | ||||||||||||||
| Recognition of reversal of valuation allowance | 377 | 289 | — | Income tax expense | ||||||||||
| Total reclassified out of AOCI, net of tax | $ | 561 | $ | (62 | ) | $ | 333 | Net income | ||||||
| NOTE 24. REGULATORY MATTERS | |
The Company and the Bank are subject to various regulatory capital requirements administered by their respective federal and state banking regulators. Failure to satisfy minimum capital requirements may result in certain mandatory and additional discretionary actions by regulators that, if undertaken, could have a direct material effect on the Company’s consolidated financial statements.
Quantitative measures established by regulation to ensure capital adequacy require the Bank to maintain minimum amounts and ratios (set forth in the table below) of total and Tier I capital (as defined in the regulations) to risk-weighted assets (as defined), and of Tier I capital to average assets (as defined).
In July 2013, federal bank regulatory agencies issued final rules to revise their risk-based capital requirements and the method for calculating risk-weighted assets to make them consistent with agreements that were reached by the Basel Committee on Banking Supervision and certain provisions of the Dodd-Frank Act (“Basel III”). On January 1, 2015, the Basel III rules became effective and include transition provisions which implement certain portions of the rules through January 1, 2019.
The rule also includes changes in what constitutes regulatory capital, some of which are subject to a transition period. These changes include the phasing-out of certain instruments as qualifying capital. In addition, Tier 2 capital is no longer limited to the amount of Tier 1 capital included in total capital. Mortgage servicing rights, certain deferred tax assets and investments in unconsolidated subsidiaries over designated percentages of common stock are required to be deducted from capital, subject to a transition period. Finally, common equity Tier 1 capital includes accumulated other comprehensive income (which includes all unrealized gains and losses on available-for-sale debt and equity securities), subject to a transition period and a one-time opt-out election. The Bank elected to opt-out of this provision. As such, accumulated comprehensive income is not included in the Bank’s Tier 1 capital.
The Bank is subject to various regulatory capital requirements, including a risk-based capital measure. The risk-based guidelines and framework under prompt corrective action provisions include both a definition of capital and a framework for calculating risk-weighted assets by assigning balance sheet assets and off-balance sheet items to broad risk categories.
| 126 |
When Basel III is fully phased in on January 1, 2019, the Company and the Bank will be required to maintain a 2.5% capital conservation buffer which is designed to absorb losses during periods of economic distress. This capital conservation buffer is comprised entirely of Common Equity Tier 1 Capital and is in addition to minimum risk-weighted asset ratios.
The tables below summarize capital ratios and related information in accordance with Basel III as measured at December 31, 2016 and December 31, 2015.
Following are the required and actual capital amounts and ratios for the Bank:
| Actual | For Capital Adequacy Purposes | To Be Well- Capitalized Under Prompt Corrective Action Provisions | ||||||||||||||||||||||
| (Dollars in thousands) | Amount | Ratio | Amount | Ratio (1) | Amount | Ratio | ||||||||||||||||||
| As of December 31, 2016: | ||||||||||||||||||||||||
| Tier 1 Leverage Capital | $ | 138,402 | 11.06 | % | $ | 50,034 | >4.0% | $ | 62,542 | >5% | ||||||||||||||
| Common Equity Tier 1 Capital | $ | 138,402 | 16.33 | % | $ | 38,150 | >5.125% | $ | 55,106 | >6.5% | ||||||||||||||
| Tier 1 Risk-based Capital | $ | 138,402 | 16.33 | % | $ | 50,867 | >6.625% | $ | 67,823 | >8% | ||||||||||||||
| Total Risk-based Capital | $ | 147,807 | 17.43 | % | $ | 67,823 | >8.625% | $ | 84,778 | >10% | ||||||||||||||
| As of December 31, 2015: | ||||||||||||||||||||||||
| Tier 1 Leverage Capital | $ | 118,251 | 12.05 | % | $ | 39,270 | >4% | $ | 49,087 | >5% | ||||||||||||||
| Common Equity Tier 1 Capital | $ | 118,251 | 18.07 | % | $ | 29,443 | >4.5% | $ | 42,529 | >6.5% | ||||||||||||||
| Tier 1 Risk-based Capital | $ | 118,251 | 18.07 | % | $ | 39,257 | >6% | $ | 52,343 | >8% | ||||||||||||||
| Total Risk-based Capital | $ | 126,524 | 19.34 | % | $ | 52,343 | >8% | $ | 65,429 | >10% | ||||||||||||||
(1) – As of December 31, 2016, includes capital conservation buffer of 0.625%. On a fully phased in basis, effective January 1, 2019, under Basel III, minimum capital ratios to be considered “adequately capitalized” including the capital conservation buffer of 2.5% will be as follows: Tier 1 Leverage Capital – 4.0%; Common Equity Tier 1 Capital – 7.0%; Tier 1 Risk-based Capital – 8.5%; and Total Risk-based Capital – 10.5%.
| 127 |
Following are the required and actual capital amounts and ratios for the Company:
| Actual | For Capital Adequacy Purposes | |||||||||||||||
| (Dollars in thousands) | Amount | Ratio | Amount | Ratio (1) | ||||||||||||
| As of December 31, 2016: | ||||||||||||||||
| Tier I Leverage Capital | $ | 141,013 | 11.28 | % | $ | 50,200 | >4.0% | |||||||||
| Common Equity Tier 1 Capital | $ | 130,079 | 15.33 | % | $ | 38,188 | >5.125% | |||||||||
| Tier I Risk-based Capital | $ | 141,013 | 16.62 | % | $ | 50,918 | >6.625% | |||||||||
| Total Risk Based Capital | $ | 150,418 | 17.72 | % | $ | 67,891 | >8.625% | |||||||||
| As of December 31, 2015: | ||||||||||||||||
| Tier I Leverage Capital | $ | 136,063 | 13.85 | % | $ | 39,291 | >4% | |||||||||
| Common Equity Tier 1 Capital | $ | 128,007 | 19.55 | % | $ | 29,468 | >4.5% | |||||||||
| Tier I Risk-based Capital | $ | 136,063 | 20.78 | % | $ | 39,291 | >6% | |||||||||
| Total Risk Based Capital | $ | 144,343 | 22.04 | % | $ | 52,388 | >8% | |||||||||
(1) – As of December 31, 2016, includes capital conservation buffer of 0.625%. On a fully phased in basis, effective January 1, 2019, under Basel III, minimum capital ratios to be considered “adequately capitalized” including the capital conservation buffer of 2.5% will be as follows: Tier 1 Leverage Capital – 4.0%; Common Equity Tier 1 Capital – 7.0%; Tier 1 Risk-based Capital – 8.5%; and Total Risk-based Capital – 10.5%.
| NOTE 25. COMMITMENTS AND CONTINGENCIES | |
To accommodate the financial needs of its customers, the Company makes commitments under various terms to lend funds. These commitments include revolving credit agreements, term loan commitments and short-term borrowing agreements. Commitments to extend credit are agreements to lend to a customer as long as there is no violation of any condition established in the contract. Commitments generally have fixed expiration dates or other termination clauses and may require payment of a fee. Since many of the commitments are expected to expire without being drawn upon, the total commitment amounts do not necessarily represent future cash requirements. The Company evaluates each customer’s creditworthiness. The amount of collateral obtained, if it is deemed necessary by the Company upon extension of credit, is based on management’s credit evaluation of the counterparty. Collateral held includes first and second mortgages on one-to-four family dwellings, accounts receivable, inventory, and commercial real estate. Certain lines of credit are unsecured.
The following summarizes the Company’s approximate commitments to extend credit:
| December 31, 2016 | ||||
| (Dollars in thousands) | ||||
| Lines of credit | $ | 111,263 | ||
| Standby letters of credit | 800 | |||
| $ | 112,063 | |||
| 128 |
The Company had outstanding commitments to originate loans as follows:
| December 31, 2016 | ||||||||
| Amount | Range of Rates | |||||||
| (Dollar in thousands) | ||||||||
| Fixed | $ | 24,855 | 1.99% to 7.99% | |||||
| Variable | 9,755 | 3.25% to 6.25% | ||||||
| $ | 34,610 | |||||||
The allowance for unfunded commitments was $0.1 million at December 31, 2016 and 2015.
The Company is exposed to loss as a result of its obligation for representations and warranties on loans sold to Fannie Mae and maintained a reserve of $0.3 million as of December 31, 2016 and 2015.
In the normal course of business, the Company is periodically involved in litigation. In the opinion of the Company’s management, none of this litigation is expected to have a material adverse effect on the accompanying consolidated financial statements.
| NOTE 26. FAIR VALUE DISCLOSURES | |
We use fair value measurements when recording and disclosing certain financial assets and liabilities. Securities classified as AFS, loan servicing rights and mortgage derivatives are recorded at fair value on a recurring basis. Additionally, from time to time, we may be required to record other assets at fair value on a nonrecurring basis, such as loans held for sale, impaired loans and real estate owned.
Fair value is the price that would be received to sell an asset or paid to transfer a liability in the principal or most advantageous market in an orderly transaction between market participants at the measurement date. An orderly transaction is a transaction that assumes exposure to the market for a period prior to the measurement date to allow for marketing activities that are usual and customary for transactions involving such assets or liabilities; it is not a forced transaction. In determining fair value, we use various valuation approaches, including market, income and cost approaches. The fair value standard establishes a hierarchy for inputs used in measuring fair value that maximizes the use of observable inputs and minimizes the use of unobservable inputs by requiring that observable inputs be used when available. Observable inputs are inputs that market participants would use in pricing an asset or liability, which is developed, based on market data we have obtained from independent sources. Unobservable inputs reflect our estimate of assumptions that market participants would use in pricing an asset or liability, which are developed based on the best information available in the circumstances.
The fair value hierarchy gives the highest priority to unadjusted quoted market prices in active markets for identical assets or liabilities (Level 1 measurement) and the lowest priority to unobservable inputs (Level 3 measurement). The fair value hierarchy is broken down into three levels based on the reliability of inputs as follows:
| · | Level 1: valuation is based upon unadjusted quoted market prices for identical instruments traded in active markets. |
| · | Level 2: valuation is based upon quoted market prices for similar instruments traded in active markets, quoted market prices for identical or similar instruments traded in markets that are not active and model-based valuation techniques for which all significant assumptions are observable in the market or can be corroborated by market data. |
| · | Level 3: valuation is derived from other valuation methodologies, including discounted cash flow models and similar techniques that use significant assumptions not observable in the market. These unobservable assumptions reflect estimates of assumptions that market participants would use in determining fair value. |
| 129 |
A financial instrument’s level within the fair value hierarchy is based on the lowest level of input that is significant to the fair value measurement.
Fair value estimates are made at a specific point of time, based on relevant market information and information about the financial instrument. These estimates do not reflect any premium or discount that could result from offering for sale the Company’s entire holdings of a particular financial instrument. Because no active market exists for a significant portion of the Company’s financial instruments, fair value estimates are based on judgments regarding future expected loss experience, current economic conditions, current interest rates and prepayment trends, risk characteristics of various financial instruments, and other factors. These estimates are subjective in nature and involve uncertainties and matters of significant judgment and therefore cannot be determined with precision. Changes in any of these assumptions used in calculating fair value also would affect significantly the estimates. In addition, the tax ramifications related to the realization of the unrealized gains and losses can have a significant effect on fair value estimates and have not been considered in any of these estimates.
Following is a description of valuation methodologies used for assets and liabilities recorded at fair value on a recurring basis:
Investment Securities
We obtain fair values for debt securities from a third-party pricing service, which utilizes several sources for valuing fixed-income securities. The market evaluation sources for debt securities available-for-sale include observable inputs rather than significant unobservable inputs and are classified as Level 2. The service provider utilizes pricing models that vary by asset class and include available trade, bid and other market information. Generally, the methodologies include broker quotes, proprietary models, vast descriptive terms and conditions databases, as well as extensive quality control programs.
Included in securities are investments in an exchange traded bond fund and U.S. Treasury bonds which are valued by reference to quoted market prices and considered a Level 1 security.
Also included in securities are corporate bonds which are valued using significant unobservable inputs and are classified as Level 3.
Trading securities represent investments in exchange traded mutual funds which are valued by reference to quoted market prices and considered a Level 1 security.
Loan Servicing Rights
Loan servicing rights are carried at fair value as determined by a third party valuation firm. The valuation model utilizes a discounted cash flow analysis using discount rates and prepayment speed assumptions used by market participants. The Company classifies loan servicing rights fair value measurements as Level 3.
Derivative Instruments
Derivative instruments include interest rate lock commitments, forward sale commitments, and interest rate swaps. Interest rate lock commitments and forward sale commitments are valued based on the change in the value of the underlying loan between the commitment date and the end of the period. The Company classifies these instruments as Level 3.
Interest rate swaps are valued by a third party using significant assumptions that are observable in the market and can be corroborated by market data. The Company classifies interest rate swaps as Level 2.
Following is a description of valuation methodologies used for assets and liabilities recorded at fair value on a nonrecurring basis:
| 130 |
Loans Held for Sale
Loans held for sale are carried at the lower of cost or fair value. The fair value of loans held for sale is based on what secondary markets are currently offering for portfolios with similar characteristics. Loans held for sale carried at fair value are classified as Level 2.
Impaired Loans
Impaired loans are carried at the lower of recorded investment or fair value. The fair value of collateral dependent impaired loans is estimated using the value of the collateral less selling costs if repayment is expected from liquidation of the collateral. Appraisals may be discounted based on our historical knowledge, changes in market conditions from the time of appraisal or our knowledge of the borrower and the borrower’s business. Impaired loans carried at fair value are classified as Level 3. Impaired loans measured using the present value of expected future cash flows are not deemed to be measured at fair value.
Real Estate Owned
Real estate owned, obtained in partial or total satisfaction of a loan is recorded at the lower of recorded investment in the loan or fair value less cost to sell. Subsequent to foreclosure, these assets are carried at the lower of the amount recorded at acquisition date or fair value less cost to sell. Accordingly, it may be necessary to record nonrecurring fair value adjustments. Fair value, when recorded, is generally based upon appraisals by approved, independent, state certified appraisers. Like impaired loans, appraisals may be discounted based on our historical knowledge, changes in market conditions from the time of appraisal or other information available to us. Real estate owned carried at fair value is classified as Level 3.
In addition to financial instruments recorded at fair value in our financial statements, fair value accounting guidance requires disclosure of the fair value of all of an entity’s assets and liabilities that are considered financial instruments. The majority of our assets and liabilities are considered financial instruments. Many of these instruments lack an available trading market as characterized by a willing buyer and willing seller engaged in an exchange transaction. Also, it is our general practice and intent to hold our financial instruments to maturity and to not engage in trading or sales activities. For fair value disclosure purposes, we substantially utilize the fair value measurement criteria as required and explained above. In cases where quoted fair values are not available, we use present value methods to determine the fair value of our financial instruments.
Following is a description of valuation methodologies used for the disclosure of the fair value of financial instruments not carried at fair value:
Cash and Cash Equivalents
The carrying amount of such instruments is deemed to be a reasonable estimate of fair value.
Loans
The fair value of variable rate performing loans is based on carrying values adjusted for credit risk. The fair value of fixed rate performing loans is estimated using discounted cash flow analyses, utilizing interest rates currently being offered for loans with similar terms, adjusted for credit risk. The fair value of nonperforming loans is based on their carrying values less any specific reserve. A prepayment assumption is used to estimate the portion of loans that will be repaid prior to their scheduled maturity. No adjustment has been made for the illiquidity in the market for loans as there is no active market for many of the Company’s loans on which to reasonably base this estimate.
Bank Owned Life Insurance
Fair values approximate net cash surrender values.
Other Investments, at cost
No ready market exists for this stock and it has no quoted market value. However, redemption of this stock has historically been at par value. Accordingly, the carrying amount is deemed to be a reasonable estimate of fair value.
| 131 |
Small Business Investment Company Holdings
No ready market exists for our Small Business Investment Company (“SBIC”) holdings and it has no quoted market value. Accordingly, the carrying amount is deemed to be a reasonable estimate of fair value.
Deposits
The fair values disclosed for demand deposits are equal to the amounts payable on demand at the reporting date. The fair value of certificates of deposit are estimated by discounting the amounts payable at the certificate rates using the rates currently offered for deposits of similar remaining maturities.
Advances from the FHLB
The fair values disclosed for fixed rate long-term borrowings are determined by discounting their contractual cash flows using current interest rates for long-term borrowings of similar remaining maturities. The carrying amounts of variable rate long-term borrowings approximate their fair values.
Junior Subordinated Notes
The carrying amount approximates fair value because the debt is variable rate tied to LIBOR.
Other Borrowings
The fair values disclosed for fixed rate long-term borrowings are determined by discounting their contractual cash flows using current interest rates for long-term borrowings of similar remaining maturities.
Accrued Interest Receivable and Payable
Since these financial instruments will typically be received or paid within three months, the carrying amounts of such instruments are deemed to be a reasonable estimate of fair value.
Loan Commitments
Estimates of the fair value of these off-balance sheet items are not made because of the short-term nature of these arrangements and the credit standing of the counterparties.
Assets and Liabilities Recorded at Fair Value on a Recurring Basis
Below is a table that presents information about certain assets and liabilities measured at fair value on a recurring basis:
| 132 |
| December 31, 2016 | ||||||||||||||||
| Level 1 | Level 2 | Level 3 | Total | |||||||||||||
| (Dollars in thousands) | ||||||||||||||||
| Trading account assets | $ | 5,211 | $ | — | $ | — | $ | 5,211 | ||||||||
| Securities available for sale: | ||||||||||||||||
| U.S. government agencies | — | 12,107 | — | 12,107 | ||||||||||||
| Municipal securities | — | 146,771 | — | 146,771 | ||||||||||||
| Mortgage-backed securities | — | 217,937 | — | 217,937 | ||||||||||||
| U.S. Treasury securities | 2,514 | — | — | 2,514 | ||||||||||||
| Corporate bonds | 16,214 | 2,144 | 18,358 | |||||||||||||
| Mutual funds | 604 | — | — | 604 | ||||||||||||
| 8,329 | 393,029 | 2,144 | 403,502 | |||||||||||||
| Loan servicing rights | — | — | 2,603 | 2,603 | ||||||||||||
| Derivative assets | — | 476 | — | 476 | ||||||||||||
| Forward sales commitments | — | — | 19 | 19 | ||||||||||||
| Interest rate lock commitments | — | — | 41 | 41 | ||||||||||||
| Total assets | $ | 8,329 | $ | 393,505 | $ | 4,807 | $ | 406,641 | ||||||||
| December 31, 2015 | ||||||||||||||||
| Level 1 | Level 2 | Level 3 | Total | |||||||||||||
| (Dollars in thousands) | ||||||||||||||||
| Trading account assets | $ | 4,714 | $ | — | $ | — | $ | 4,714 | ||||||||
| Securities available for sale: | ||||||||||||||||
| U.S. government agencies | — | 25,720 | — | 25,720 | ||||||||||||
| Municipal securities | — | 39,858 | — | 39,858 | ||||||||||||
| Mortgage-backed securities | — | 171,174 | — | 171,174 | ||||||||||||
| U.S. Treasury securities | 1,510 | — | — | 1,510 | ||||||||||||
| Mutual funds | 600 | — | — | 600 | ||||||||||||
| 6,824 | 236,752 | — | 243,576 | |||||||||||||
| Loan servicing rights | — | — | 2,344 | 2,344 | ||||||||||||
| Forward sales commitments | — | — | 16 | 16 | ||||||||||||
| Interest rate lock commitments | — | — | 30 | 30 | ||||||||||||
| Total assets | $ | 6,824 | $ | 236,752 | $ | 2,390 | $ | 245,966 | ||||||||
There were no liabilities measured at fair value on a recurring basis as of December 31, 2016 and 2015.
| 133 |
The following table presents the changes in assets measured at fair value on a recurring basis for which we have utilized Level 3 inputs to determine fair value:
| Year Ended December 31, | ||||||||||||
| 2016 | 2015 | 2014 | ||||||||||
| (Dollars in thousands) | ||||||||||||
| Balance at beginning of year | $ | 2,390 | $ | 2,248 | $ | 1,888 | ||||||
| Corporate bonds | ||||||||||||
| Transfers from HTM | 2,144 | — | — | |||||||||
| Loan servicing right activity, included in servicing income, net | ||||||||||||
| Capitalization from loans sold | 604 | 544 | 385 | |||||||||
| Fair value adjustment | (345 | ) | (387 | ) | (81 | ) | ||||||
| Mortgage derivative gains (losses) included in other income | 14 | (15 | ) | 56 | ||||||||
| Balance at end of year | $ | 4,807 | $ | 2,390 | $ | 2,248 | ||||||
Assets and Liabilities Recorded at Fair Value on a Nonrecurring Basis
The table below presents information about certain assets and liabilities measured at fair value on a nonrecurring basis. There were no loans held for sale carried at fair value at either December 31, 2016 or 2015.
| 134 |
| December 31, 2016 | ||||||||||||||||
| Level 1 | Level 2 | Level 3 | Total | |||||||||||||
| (Dollars in thousands) | ||||||||||||||||
| Collateral dependent impaired loans: | ||||||||||||||||
| One-to four family residential | $ | — | $ | — | $ | 2,205 | $ | 2,205 | ||||||||
| Commercial real estate | — | — | 6,329 | 6,329 | ||||||||||||
| Home equity loans and lines of credit | — | — | 213 | 213 | ||||||||||||
| Other construction and land | — | — | 809 | 809 | ||||||||||||
| Real estate owned: | ||||||||||||||||
| One-to four family residential | — | — | 1,336 | 1,336 | ||||||||||||
| Commercial real estate | — | — | 722 | 722 | ||||||||||||
| Other construction and land | — | — | 2,168 | 2,168 | ||||||||||||
| Total assets | $ | — | $ | — | $ | 13,782 | $ | 13,782 | ||||||||
| December 31, 2015 | ||||||||||||||||
| Level 1 | Level 2 | Level 3 | Total | |||||||||||||
| (Dollars in thousands) | ||||||||||||||||
| Collateral dependent impaired loans: | ||||||||||||||||
| One-to four family residential | $ | — | $ | — | $ | 4,163 | $ | 4,163 | ||||||||
| Commercial real estate | — | — | 7,226 | 7,226 | ||||||||||||
| Home equity loans and lines of credit | — | — | 213 | 213 | ||||||||||||
| Other construction and land | — | — | 658 | 658 | ||||||||||||
| Real estate owned: | ||||||||||||||||
| One-to four family residential | — | — | 1,384 | 1,384 | ||||||||||||
| Commercial real estate | — | — | 1,123 | 1,123 | ||||||||||||
| Other construction and land | — | — | 2,862 | 2,862 | ||||||||||||
| Total assets | $ | — | $ | — | $ | 17,629 | $ | 17,629 | ||||||||
There were no liabilities measured at fair value on a nonrecurring basis as of December 31, 2016 or 2015.
Impaired loans totaling $4.6 million at December 31, 2016 and $5.2 million at December 31, 2015, were measured using the present value of expected future cash flows. These impaired loans were not deemed to be measured at fair value on a nonrecurring basis.
The following table provides information describing the unobservable inputs used in Level 3 fair value measurements at December 31, 2016.
| 135 |
| Valuation Technique | Unobservable Input | General Range | ||||
| Impaired loans | Discounted Appraisals | Collateral discounts and estimated selling cost | 0 – 30% | |||
| Real estate owned | Discounted Appraisals | Collateral discounts and estimated selling cost | 0 – 30% | |||
| Corporate bonds | Discounted Cash Flows | Recent trade pricing | 0-8% | |||
| Loan servicing rights | Discounted Cash Flows | Prepayment speed | 5 – 35% | |||
| Discount rate | 12-14% | |||||
The approximate carrying and estimated fair value of financial instruments are summarized below:
| Carrying | Fair Value Measurements at December 31, 2016 | |||||||||||||||||||
| (Dollars in thousands) | Amount | Total | Level 1 | Level 2 | Level 3 | |||||||||||||||
| Assets: | ||||||||||||||||||||
| Cash and equivalents | $ | 43,294 | $ | 43,294 | $ | 43,294 | $ | — | $ | — | ||||||||||
| Trading securities | 5,211 | 5,211 | 5,211 | — | — | |||||||||||||||
| Securities available for sale | 398,291 | 398,291 | 3,118 | 393,029 | 2,144 | |||||||||||||||
| Loans held for sale | 4,584 | 5,093 | — | 5,093 | — | |||||||||||||||
| Loans receivable, net | 744,361 | 741,612 | — | — | 741,612 | |||||||||||||||
| Other investments, at cost | 15,261 | 15,261 | — | 15,261 | — | |||||||||||||||
| Interest receivable | 5,012 | 5,012 | — | 5,012 | — | |||||||||||||||
| Bank owned life insurance | 31,347 | 31,347 | — | 31,347 | — | |||||||||||||||
| Loan servicing rights | 2,603 | 2,603 | — | — | 2,603 | |||||||||||||||
| Forward sales commitments | 19 | 19 | — | — | 19 | |||||||||||||||
| Interest rate lock commitments | 41 | 41 | — | — | 41 | |||||||||||||||
| Derivative asset | 476 | 476 | — | 476 | — | |||||||||||||||
| SBIC investments | 1,666 | 1,666 | — | — | 1,666 | |||||||||||||||
| Liabilities: | ||||||||||||||||||||
| Demand deposits | $ | 540,808 | 540,808 | $ | — | $ | 540,808 | $ | — | |||||||||||
| Time deposits | 289,205 | 286,611 | — | — | 286,611 | |||||||||||||||
| Federal Home Loan Bank advances | 298,500 | 298,667 | — | 298,667 | — | |||||||||||||||
| Junior subordinated debentures | 14,433 | 14,433 | — | 14,433 | — | |||||||||||||||
| Other borrowings | 2,725 | 2,907 | — | 2,907 | — | |||||||||||||||
| Accrued interest payable | 254 | 254 | — | 254 | — | |||||||||||||||
| 136 |
| Carrying | Fair Value Measurements at December 31, 2015 | |||||||||||||||||||
| (Dollars in thousands) | Amount | Total | Level 1 | Level 2 | Level 3 | |||||||||||||||
| Assets: | ||||||||||||||||||||
| Cash and equivalents | $ | 40,650 | $ | 40,650 | $ | 40,650 | $ | — | $ | — | ||||||||||
| Trading securities | 4,714 | 4,714 | 4,714 | — | — | |||||||||||||||
| Securities available for sale | 238,862 | 238,862 | 2,110 | 236,752 | — | |||||||||||||||
| Securities held to maturity | 41,164 | 41,812 | 995 | 40,817 | — | |||||||||||||||
| Loans held for sale | 8,348 | 8,952 | — | 8,952 | — | |||||||||||||||
| Loans receivable, net | 624,072 | 620,516 | — | — | 620,516 | |||||||||||||||
| Other investments, at cost | 8,834 | 8,834 | — | 8,834 | — | |||||||||||||||
| Interest receivable | 3,554 | 3,554 | — | 3,554 | — | |||||||||||||||
| Bank owned life insurance | 20,858 | 20,858 | — | 20,858 | — | |||||||||||||||
| Loan servicing rights | 2,344 | 2,344 | — | — | 2,344 | |||||||||||||||
| Forward sales commitments | 16 | 16 | — | — | 16 | |||||||||||||||
| Interest rate lock commitments | 30 | 30 | — | — | 30 | |||||||||||||||
| SBIC investments | 1,025 | 1,025 | 1,025 | |||||||||||||||||
| Liabilities: | ||||||||||||||||||||
| Demand deposits | $ | 440,475 | 440,475 | $ | — | $ | 440,475 | $ | — | |||||||||||
| Time deposits | 276,142 | 275,403 | — | — | 275,403 | |||||||||||||||
| Federal Home Loan Bank advances | 153,500 | 153,441 | — | 153,441 | — | |||||||||||||||
| Junior subordinated debentures | 14,433 | 14,433 | — | 14,433 | — | |||||||||||||||
| Other borrowings | 2,198 | 2,198 | — | — | 2,198 | |||||||||||||||
| Accrued interest payable | 213 | 213 | — | 213 | — | |||||||||||||||
| NOTE 27. SHARE REPURCHASES | |
On January 28, 2016, the Company announced that the Board of Directors had authorized the repurchase of up to 327,318 shares of the Company’s common stock through January 27, 2017. The authorization represented approximately 5% of the Company’s shares outstanding as of December 31, 2015.
The following table summarizes share repurchase activity through December 31, 2016:
| Period | Total Number of Shares Purchased | Average Price Paid per Share | Total Number of Shares Purchased as Part of Publicly Announced Plans or Programs | Maximum Number of Shares that May Yet Be Purchased Under the Plans or Programs | ||||||||||||
| January 1, 2016 to January 31, 2016 | — | $ | — | — | — | |||||||||||
| February 1, 2016 to February 29, 2016 | 40,621 | $ | 17.04 | 40,621 | 286,697 | |||||||||||
| March 1, 2016 to March 31, 2016 | 33,382 | $ | 17.70 | 33,382 | 253,315 | |||||||||||
| April 1, 2016 to April 30, 2016 | 5,997 | $ | 17.65 | 5,997 | 247,318 | |||||||||||
| May 1, 2016 to September 30, 2016 | — | $ | — | — | 247,318 | |||||||||||
| October 1, 2016 to October 31, 2016 | 24,568 | $ | 18.10 | 24,568 | 222,750 | |||||||||||
| November 1, 2016 to November 31, 2016 | — | $ | — | — | 222,750 | |||||||||||
| December 1, 2016 to December 31, 2016 | — | $ | — | — | 222,750 | |||||||||||
| Total year-to-date 2016 | 104,568 | $ | 17.55 | 104,568 | 222,750 | |||||||||||
| 137 |
| NOTE 28. SUBSEQUENT EVENTS | |
On February 24, 2017, the Company announced the extension of its previously announced stock repurchase program (the “Stock Repurchase Program”) through February 23, 2018. The Stock Repurchase Program allows for the repurchase of up to 327,318 shares of the Company’s common stock, representing approximately 5% of the Company’s outstanding shares. Approximately 104,568 shares have been repurchased under the Stock Repurchase Program through December 31, 2016, leaving a balance of 222,750 shares that may be purchased under the Stock Repurchase Program, as extended.
On February 24, 2017, the Company completed its acquisition of two branches in Jasper, Georgia from Stearns Bank, N.A.. The acquisition added approximately $147.6 million to the Company’s assets, and $153.0 million to the Company’s deposits. The Company paid a deposit premium of approximately $5.7 million. The conversion of the core operating systems is complete. However, the initial accounting for the business combination is not complete. In accordance with ASC 805, Business Combinations, fair values are subject to refinement for a period not to exceed one year after the closing date of an acquisition as information relative to closing date fair values becomes available. There were no loans or REO purchased in this acquisition.
| NOTE 29. PARENT COMPANY FINANCIAL INFORMATION | |
Following is condensed financial information of Entegra Financial Corp. (parent company only):
Condensed Balance Sheets
| December 31, | ||||||||
| 2016 | 2015 | |||||||
| (Dollars in thousands) | ||||||||
| Assets | ||||||||
| Cash | $ | 3,137 | $ | 17,545 | ||||
| Equity investment in subsidiary | 144,011 | 128,090 | ||||||
| Equity investment in trust | 433 | 433 | ||||||
| Other assets | 508 | 188 | ||||||
| Total assets | $ | 148,089 | $ | 146,256 | ||||
| Liabilities and Shareholders’ Equity | ||||||||
| Junior subordinated debentures | $ | 14,433 | $ | 14,433 | ||||
| Other liabilities | 588 | 354 | ||||||
| Shareholders’ equity | 133,068 | 131,469 | ||||||
| Total liabilities and shareholders’ equity | $ | 148,089 | $ | 146,256 | ||||
| 138 |
Condensed Statements of Operations
| Year Ended December 31, | ||||||||||||
| 2016 | 2015 | 2014 | ||||||||||
| (Dollars in thousands) | ||||||||||||
| Income | ||||||||||||
| Interest income | $ | 81 | $ | 190 | $ | 78 | ||||||
| Dividends from subsidiary | 510 | 114 | — | |||||||||
| 591 | 304 | 78 | ||||||||||
| Expenses | ||||||||||||
| Interest | 532 | 458 | 509 | |||||||||
| Other | 358 | 259 | 29 | |||||||||
| 890 | 717 | 538 | ||||||||||
| Loss before income taxes and equity | ||||||||||||
| in undistributed income of subsidiary | (299 | ) | (413 | ) | (460 | ) | ||||||
| Income tax benefit allocated from | ||||||||||||
| consolidated income tax return | 283 | 180 | 180 | |||||||||
| Loss before equity in undistributed | ||||||||||||
| income of subsidiary | (16 | ) | (233 | ) | (280 | ) | ||||||
| Equity in undistributed income of subsidiary | 6,392 | 24,058 | 6,223 | |||||||||
| Net income | $ | 6,376 | $ | 23,825 | $ | 5,943 | ||||||
| 139 |
Condensed Statements of Cash Flows
| Year Ended December 31, | ||||||||||||
| 2016 | 2015 | 2014 | ||||||||||
| (Dollars in thousands) | ||||||||||||
| Operating activities: | ||||||||||||
| Net income | $ | 6,376 | $ | 23,825 | $ | 5,943 | ||||||
| Adjustments to reconcile net income to net | ||||||||||||
| cash provided by (used in) operating activities: | ||||||||||||
| Equity in undistributed earnings of subsdiary | (6,392 | ) | (24,058 | ) | (6,223 | ) | ||||||
| (Increase) decrease in other assets | 55 | (19 | ) | (46 | ) | |||||||
| Increase (decrease) in other liablilities | 97 | 75 | (1,567 | ) | ||||||||
| Net cash provided by (used in) operating activities | $ | 136 | $ | (177 | ) | $ | (1,893 | ) | ||||
| Investing activities: | ||||||||||||
| Investment in subsidiary | $ | (13,486 | ) | $ | — | $ | (44,581 | ) | ||||
| Net cash used in investing activities | $ | (13,486 | ) | $ | — | $ | (44,581 | ) | ||||
| Financing activities: | ||||||||||||
| Proceeds from sale of common stock | $ | — | $ | — | $ | 63,651 | ||||||
| Purchase of stock | (1,922 | ) | — | — | ||||||||
| Reimbursement from bank subsidiary for share-based compensation | 864 | 70 | — | |||||||||
| Net cash provided by (used in) financing activities | $ | (1,058 | ) | $ | 70 | $ | 63,651 | |||||
| (Decrease)/increase in cash and cash equivalents | (14,408 | ) | (107 | ) | 17,177 | |||||||
| Cash and cash equivalents, beginning of year | 17,545 | 17,652 | 475 | |||||||||
| Cash and cash equivalents, end of year | $ | 3,137 | $ | 17,545 | $ | 17,652 | ||||||
| 140 |
Item 9. Changes in and Disagreements with Accountants on Accounting and Financial Disclosure.
None.
Item 9A. Controls and Procedures.
The Company’s management has carried out an evaluation, under the supervision and with the participation of the Company’s principal executive officer and principal financial officer, of the effectiveness of its “disclosure controls and procedures,” as such term is defined in Rule 13a-15(e) promulgated under the Securities Exchange Act of 1934, as amended (the “Exchange Act”). Based on this evaluation, the Company’s principal executive officer and principal financial officer concluded that, as of the end of the period covered by this report, the Company maintained effective disclosure controls and procedures.
There have been no significant changes in our internal controls over financial reporting during the fourth fiscal quarter ended December 31, 2016 that have materially affected, or are reasonably likely to materially affect, our internal controls over financial reporting.
The design of any system of controls and procedures is based in part upon certain assumptions about the likelihood of future events. There can be no assurance that any design will succeed in achieving its stated goals under all potential future conditions, regardless of how remote.
Report of Management on Internal Control over Financial Reporting The management of the Company is responsible for establishing and maintaining adequate internal control over financial reporting. The internal control process has been designed under our supervision to provide reasonable assurance regarding the reliability of financial reporting and the preparation of the Company’s financial statements for external reporting purposes in accordance with accounting principles generally accepted in the United States of America.
Management conducted an assessment of the effectiveness of the Company’s internal control over financial reporting as of December 31, 2016, utilizing the framework established in Internal Control – Integrated Framework 2013 issued by the Committee of Sponsoring Organizations of the Treadway Commission (“COSO”). Based on this assessment, management has determined that the Company’s internal control over financial reporting as of December 31, 2016 was effective.
Our internal control over financial reporting includes policies and procedures that pertain to the maintenance of records that accurately and fairly reflect, in reasonable detail, transactions and dispositions of assets; and provide reasonable assurances that: (1) transactions are recorded as necessary to permit preparation of financial statements in accordance with accounting principles generally accepted in the United States; (2) receipts and expenditures are being made only in accordance with authorizations of management and the directors of the Company; and (3) unauthorized acquisition, use, or disposition of the Company’s assets that could have a material effect on the Company’s financial statements are prevented or timely detected.
All internal control systems, no matter how well designed, have inherent limitations. Therefore, even those systems determined to be effective can provide only reasonable assurance with respect to financial statement preparation and presentation. Also, projections of any evaluation of effectiveness to future periods are subject to the risk that controls may become inadequate because of changes in conditions, or that the degree of compliance with the policies or procedures may deteriorate.
This annual report does not include an attestation report of the Company’s independent registered public accounting firm regarding internal control over financial reporting. As an emerging growth company, management’s report was not subject to attestation by the Company’s independent registered public accounting firm in accordance with the JOBS Act of 2012.
None
| 141 |
Item 10. Directors, Executive Officers and Corporate Governance.
(a) Directors and Executive Officers – The information required by this Item regarding directors, nominees and executive officers of the Company is set forth in the Proxy Statement under the sections captioned “Proposal 1 – Election of Directors” and “Executive Officers of the Company,” which sections are incorporated herein by reference.
(b) Section 16(a) Compliance – The information required by this Item regarding compliance with Section 16(a) of the Exchange Act is set forth in the Proxy Statement under the section captioned “Section 16(a) Beneficial Ownership Reporting Compliance,” which section is incorporated herein by reference.
(c) Audit Committee – The information required by this Item regarding the Company’s audit committee, including the audit committee financial expert, is set forth in the Company’s Proxy Statement under the sections captioned “Board Committees – Audit Committee” and “Board Committees – Audit Committee – Audit Committee Report,” which sections are incorporated herein by reference.
(d) Code of Ethics – The information required by this Item regarding the Company’s code of ethics is set forth in the Proxy Statement under the section captioned “Code of Business Conduct and Ethics,” which section is incorporated herein by reference.
Item 11. Executive Compensation.
The information required by this Item is set forth in the Proxy Statement under the sections captioned “Compensation Discussion,” “Summary Compensation Table,” “Outstanding Equity Awards at Fiscal Year-End,” “Changes in Control/Related Entity Dispositions,” “Director Compensation,” and “Directors’ Fees and Practices,” which sections are incorporated herein by reference.
Item 12. Security Ownership of Certain Beneficial Owners and Management and Related Stockholder Matters.
The information required by this Item is set forth in the Proxy Statement under the sections captioned “Security Ownership of Certain Beneficial Owners” and “How Much Common Stock do our Directors and Executive Officers Own?” which sections and Item are incorporated herein by reference.
Item 13. Certain Relationships and Related Transactions, and Director Independence.
The information required by this Item is set forth in the Proxy Statement under the sections captioned “Proposal 1 – Election of Directors,” “Certain Relationships and Related Transactions,” “Board Committees,” and “Related Party Matters,” which sections are incorporated herein by reference.
Item 14. Principal Accounting Fees and Services.
The information required by this Item is set forth in the Proxy Statement under the section captioned “Audit Fees Paid to Independent Auditor,” which section is incorporated herein by reference.
| 142 |
Item 15. Exhibits, Financial Statement Schedules.
| (1) | The financial statements required in response to this item are incorporated herein by reference from Item 8 of this Annual Report on Form 10-K. |
| (2) | All financial statement schedules are omitted because they are not required or applicable, or the required information is shown in the consolidated financial statements or the notes thereto. |
| (3) | Exhibits |
| Exhibit No. |
Description |
| 2 | Plan of Conversion, incorporated by reference to Exhibit 2 of the Registration Statement on Form S-1, filed with the SEC on March 18, 2014 (SEC File No. 333-194641). |
| 3.1 | Articles of Incorporation of Entegra Financial Corp., as amended and restated, incorporated by reference to Exhibit 3.1 of the Registration Statement on Form S-1, filed with the SEC on March 18, 2014 (SEC File No. 333-194641). |
| 3.2 | Bylaws of Entegra Financial Corp., as amended and restated, incorporated by reference to Exhibit 3.2 of the Registration Statement on Form S-1, filed with the SEC on March 18, 2014 (SEC File No. 333-194641). |
| 3.3 | Articles of Amendment of Entegra Financial Corp., incorporated by reference to Exhibit 3.1 of the Current Report on Form 8-K, filed with the SEC on November 16, 2015 (SEC File No. 001-35302) |
| 4 | Form of Common Stock Certificate of Entegra Financial Corp., incorporated by reference to Exhibit 4 of the Registration Statement on Form S-1/A, filed with the SEC on June 27, 2014 (SEC File No. 333-194641). |
| 10.1 | Employment and Change of Control Agreement, dated as of October 9, 2014, by and among Entegra Financial Corp., Macon Bank, Inc., and Roger D. Plemens, incorporated by reference to Exhibit 10.1 of the Current Report on Form 8-K, filed with the SEC on October 15, 2014 (SEC File No. 001-35302)* |
| 10.2 | Employment and Change of Control Agreement, dated as of November 1, 2014, by and among Entegra Financial Corp., Macon Bank, Inc., and Ryan M. Scaggs, incorporated by reference to Exhibit 10.1 of the Current Report on Form 8-K, filed with the SEC on November 6, 2014 (SEC File No. 001-35302)* |
| 10.3 | Employment and Change of Control Agreement, dated as of November 1, 2014, by and among Entegra Financial Corp., Macon Bank, Inc., and David A. Bright, incorporated by reference to Exhibit 10.2 of the Current Report on Form 8-K, filed with the SEC on November 6, 2014 (SEC File No. 001-35302)* |
| 10.4 | Form of Macon Bank, Inc. Severance and Non-Competition Agreement between Macon Bank, Inc. and each of (i) Carolyn H. Huscusson, (ii) Bobby D. Sanders, II, (iii) Laura W. Clark, and (iv) Marcia J. Ringle, incorporated by reference to Exhibit 10.4 of the Registration Statement on Form S-1, filed with the SEC on March 18, 2014 (SEC File No. 333-194641).* |
| 10.5 | Amended and Restated Trust Agreement, regarding Trust Preferred Securities, dated as of December 30, 2003 incorporated by reference to Exhibit 10.6 of the Registration Statement on Form S-1, filed with the SEC on March 18, 2014 (SEC File No. 333-194641). |
| 10.6 | Guarantee Agreement, regarding Trust Preferred Securities, dated as of December 30, 2003 incorporated by reference to Exhibit 10.7 of the Registration Statement on Form S-1, filed with the SEC on March 18, 2014 (SEC File No. 333-194641). |
| 143 |
| 10.7 | Junior Subordinated Indenture, regarding Trust Preferred Securities, dated as of December 30, 2003 incorporated by reference to Exhibit 10.8 of the Registration Statement on Form S-1, filed with the SEC on March 18, 2014 (SEC File No. 333-194641). |
| 10.8 | Salary Continuation Agreement between Macon Bank, Inc. and Carolyn H. Huscusson, dated November 6, 2007, incorporated by reference to Exhibit 10.11 of the Registration Statement on Form S-1/A, filed with the SEC on May 14, 2014 (SEC File No. 333-194641).* |
| 10.9 | Salary Continuation Agreement between Macon Bank, Inc. and Roger D. Plemens, dated June 23, 2003, incorporated by reference to Exhibit 10.12 of the Registration Statement on Form S-1/A, filed with the SEC on May 14, 2014 (SEC File No. 333-194641).* |
| 10.10 | Entegra Financial Corp. 2015 Long-Term Stock Incentive Plan incorporated by reference to Exhibit 10.1 of the Current Report on Form 8-K, filed with the SEC on May 21, 2015. (SEC File No. 001-35302).* |
| 10.11 | Tax Benefits Preservation Plan, dated as of November 16, 2015, incorporated by reference to Exhibit 4.1 of the Current Report on Form 8-K, filed with the SEC on November 16, 2015 (SEC File No. 001-35302) |
| 10.12 | Macon Bank, Inc. Long-Term Capital Appreciation Plan, as amended and restated, dated December 15, 2004, incorporated by reference to Exhibit 10.12 of the Annual Report on Form 10-K, filed with the SEC on March 15, 2016. (SEC File No. 001-35302). |
| 10.13 | First Amendment to the Macon Bank, Inc. Amended and Restated Long-Term Capital Appreciation Plan, dated December 10, 2008, incorporated by reference to Exhibit 10.13 of the Annual Report on Form 10-K, filed with the SEC on March 15, 2016. (SEC File No. 001-35302). |
| 10.14 | Second Amendment to the Macon Bank, Inc. Amended and Restated Long-Term Capital Appreciation Plan, dated March 16, 2011, incorporated by reference to Exhibit 10.14 of the Annual Report on Form 10-K, filed with the SEC on March 15, 2016. (SEC File No. 001-35302). |
| 10.15 | Third Amendment to the Macon Bank, Inc. Amended and Restated Long-Term Capital Appreciation Plan, dated February 26, 2015, incorporated by reference to Exhibit 10.15 of the Annual Report on Form 10-K, filed with the SEC on March 15, 2016. (SEC File No. 001-35302). |
| 21 | Schedule of Subsidiaries. |
| 23.1 | Consent of Dixon Hughes Goodman LLP. |
| 31.1 | Certification Pursuant to Section 302 of the Sarbanes-Oxley Act of 2002. |
| 31.2 | Certification Pursuant to Section 302 of the Sarbanes-Oxley Act of 2002. |
| 32 | Certifications Pursuant to Section 906 of the Sarbanes-Oxley Act of 2002. |
| 101 | Financial Statements filed in XBRL format. |
| * | Management contract or compensatory plan, contract or arrangement. |
| 144 |
Pursuant to the requirements of Section 13 or 15(d) of the Securities Exchange Act of 1934, the registrant has duly caused this report to be signed on its behalf by the undersigned, thereunto duly authorized.
| ENTEGRA FINANCIAL CORP. | ||
| Date: | March 15, 2017 | /s/ Roger D. Plemens |
| Roger D. Plemens | ||
| President and Chief Executive Officer | ||
Pursuant to the requirements of the Securities Exchange Act of 1934, this report has been signed below by the following persons on behalf of the registrant and in the capacities and on the dates indicated.
| Signature | Title | Date | ||
| /s/ Roger D. Plemens | President, Chief Executive Officer and Director | March 15, 2017 | ||
| Roger D. Plemens | (Principal Executive Officer) | |||
| /s/ David A. Bright | Executive Vice President and Chief Financial Officer | March 15, 2017 | ||
| David A. Bright | (Principal Financial and Accounting Officer) | |||
| /s/ Fred H. Jones | Chairman of the Board | March 15, 2017 | ||
| Fred H. Jones | ||||
| /s/ Stan M. Jeffress | Vice Chairman of the Board | March 15, 2017 | ||
| Stan M. Jeffress | ||||
| /s/ Ronald D. Beale | Director | March 15, 2017 | ||
| Ronald D. Beale | ||||
| /s/ Louis E. Buck, Jr. | Director | March 15, 2017 | ||
| Louis E. Buck, Jr. | ||||
| /s/ Adam W. Burrell | Director | March 15, 2017 | ||
| Adam W. Burrell | ||||
| /s/ R. Matthew Dunbar | Director | March 15, 2017 | ||
| R. Matthew Dunbar | ||||
| /s/ Charles M. Edwards | Director | March 15, 2017 | ||
| Charles M. Edwards | ||||
| /s/ Jim M. Garner | Director | March 15, 2017 | ||
| Jim M. Garner | ||||
| /s/ Beverly W. Mason | Director | March 15, 2017 | ||
| Beverly W. Mason | ||||
| /s/ Craig A. Fowler | Director | March 15, 2017 | ||
| Craig A. Fowler |
| 145 |