Attached files
| file | filename |
|---|---|
| 8-K - FORM 8-K - Prestige Consumer Healthcare Inc. | tv510960_8k.htm |
| EX-99.1 - EXHIBIT 99.1 - Prestige Consumer Healthcare Inc. | tv510960_ex99-1.htm |
Exhibit 99.2
ICR Conference January 14 th , 2019
ICR Conference, January 2019 2 Safe Harbor Disclosure This presentation contains certain “forward - looking” statements within the meaning of the Private Securities Litigation Reform A ct of 1995, such as statements regarding the Company’s expected financial performance, including revenue growth, adjusted EPS, and adjusted free cas h flow; the market position and consumption trends for the Company’s brands; the Company’s investment in e - commerce; the Company’s ability to continue to generate cash flows, gain market share and generate growth, and to de - lever; brand - building efforts; the timing and impact of the packaging rollout for BC & Goody’s. Words such as “trend,” “continue,” “will,” “expect,” “project,” “anticipate,” “likely,” “estimate,” “may,” “should,” “could,” “w ould,” and similar expressions identify forward - looking statements. Such forward - looking statements represent the Company’s expectation s and beliefs and involve a number of known and unknown risks, uncertainties and other factors that may cause actual results to differ material ly from those expressed or implied by such forward - looking statements. These factors include, among others, completion of quarter - end financial reporting processes and review, general economic and business conditions, regulatory matters, competitive pressures, supplier issues, consumer acceptance of new packaging, disruptions to distribution, unexpected costs or liabilities, and other risks set forth in Part I, Item 1A. Ri sk Factors in the Company’s Annual Report on Form 10 - K for the year ended March 31, 2018. You are cautioned not to place undue reliance on these forward - loo king statements, which speak only as of the date this presentation. Except to the extent required by applicable law, the Company undertakes no ob ligation to update any forward - looking statement contained in this presentation, whether as a result of new information, future events, or otherwis e. All adjusted GAAP numbers presented are footnoted and reconciled to their closest GAAP measurement in the attached reconcilia tio n schedules or in our November 1, 2018 and January 14, 2019 earnings releases in the “About Non - GAAP Financial Measures” section.
ICR Conference, January 2019 3 Contents I. Introduction to Prestige Consumer Healthcare II. Value Creation Model III. Financial Review and Outlook Ron Lombardi Chairman & Chief Executive Officer Christine Sacco Chief Financial Officer Phil Terpolilli Director, Investor Relations Attendees
I. Introduction to Prestige Consumer Healthcare
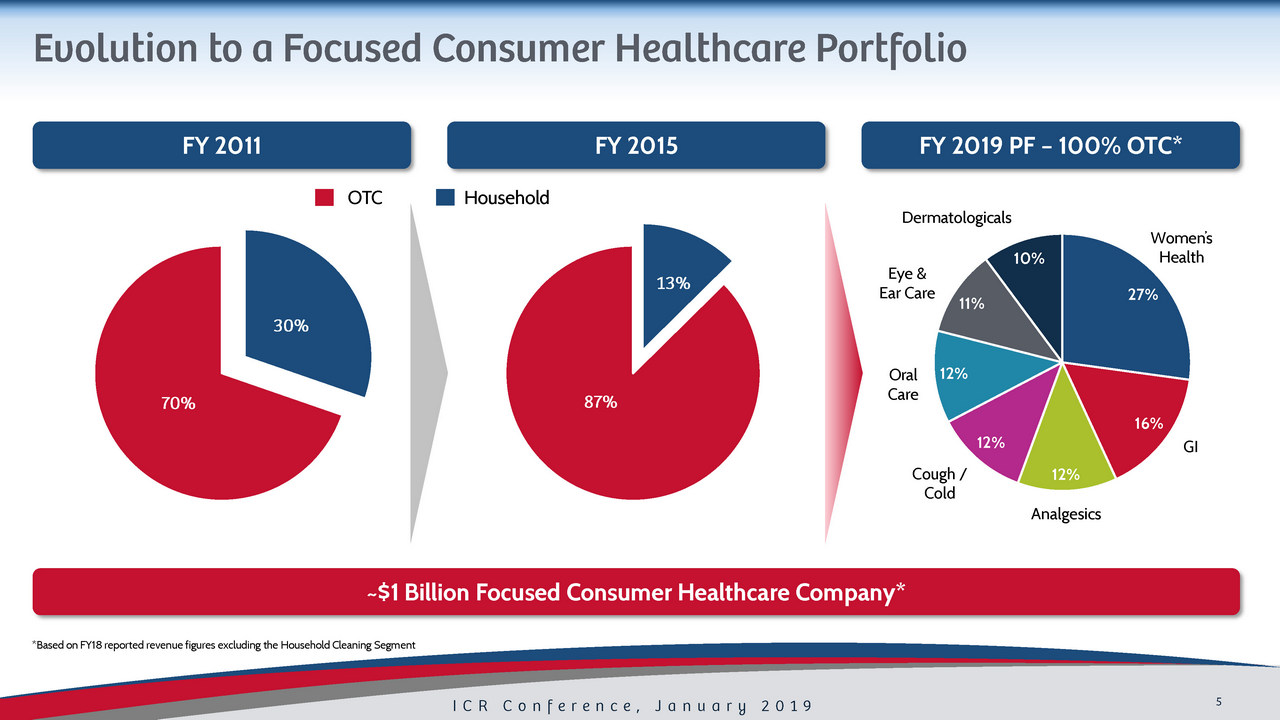
ICR Conference, January 2019 5 Evolution to a Focused Consumer Healthcare Portfolio FY 2011 ~$1 Billion Focused Consumer Healthcare Company* FY 2015 FY 2019 PF – 100% OTC* 30% 70% 13% 87% OTC Household 27% 16% 12% 12% 12% 11% 10% Women’s Health GI Analgesics Cough / Cold Oral Care Eye & Ear Care Dermatologicals *Based on FY18 reported revenue figures excluding the Household Cleaning Segment

ICR Conference, January 2019 6
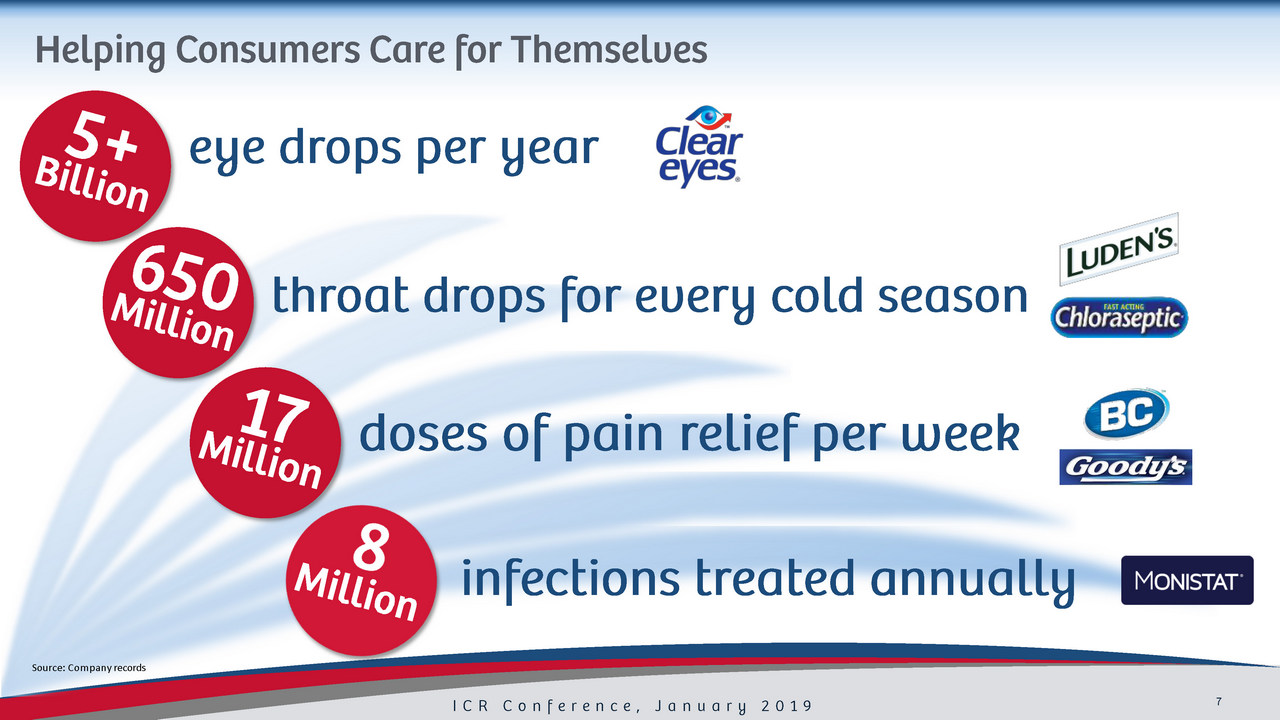
ICR Conference, January 2019 7 Source: Company records Helping Consumers Care for Themselves infections treated annually doses of pain relief per week throat drops for every cold season eye drops per year
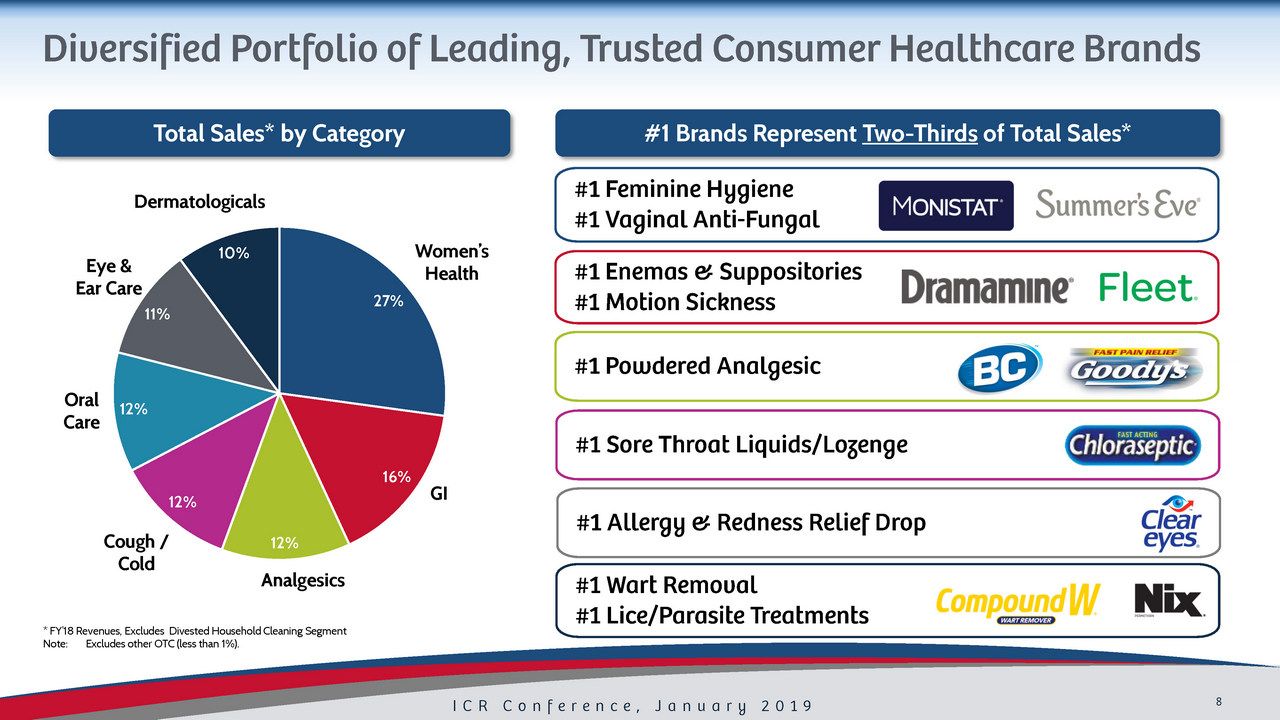
ICR Conference, January 2019 8 Diversified Portfolio of Leading, Trusted Consumer Healthcare Brands * FY’18 Revenues, Excludes Divested Household Cleaning Segment Note: E xcludes other OTC (less than 1%). Total Sales* by Category 27% 16% 12% 12% 12% 11% 10% Women’s Health GI Analgesics Cough / Cold Oral Care Eye & Ear Care Dermatologicals #1 Brands Represent Two - Thirds of Total Sales* #1 Feminine Hygiene #1 Vaginal Anti - Fungal #1 Enemas & Suppositories #1 Motion Sickness #1 Powdered Analgesic #1 Sore Throat Liquids/Lozenge #1 Allergy & Redness Relief Drop #1 Wart Removal #1 Lice/Parasite Treatments
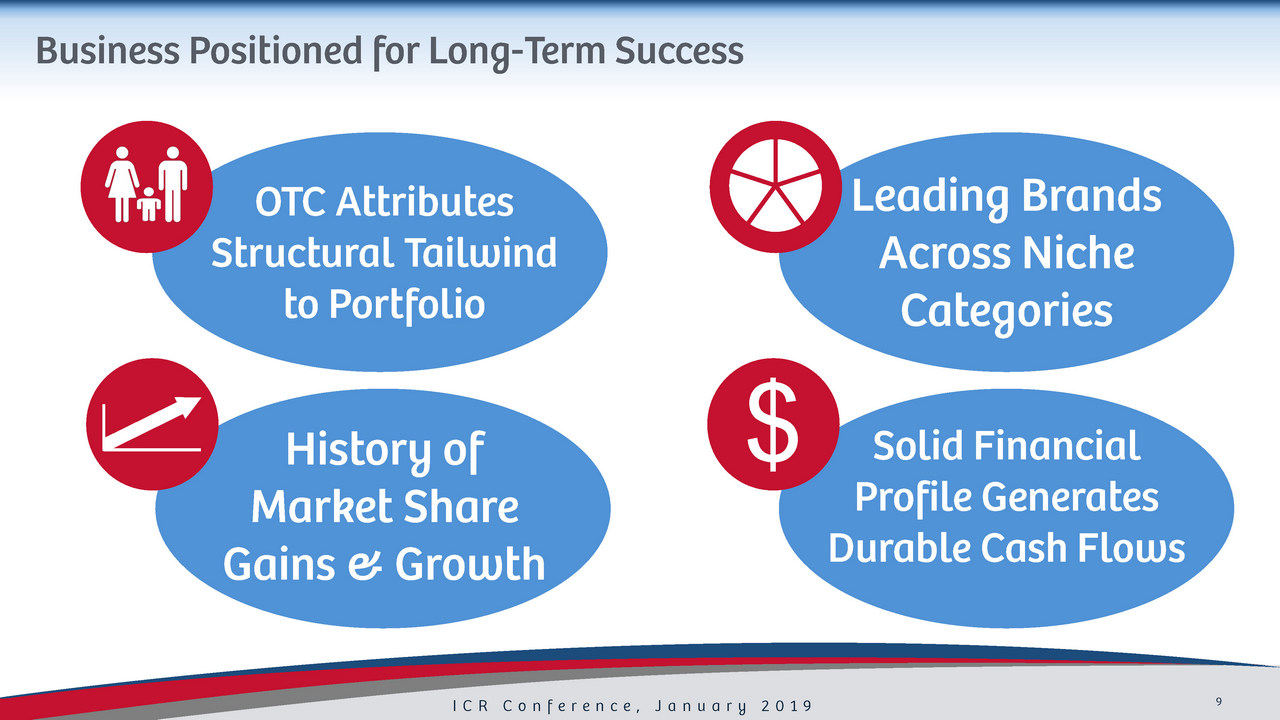
ICR Conference, January 2019 9 $ Business Positioned for Long - Term Success History of Market Share Gains & Growth 78% (1) Solid Financial Profile Generates Durable Cash Flows OTC Attributes Structural Tailwind to Portfolio Leading Brands Across Niche Categories
II. Value Creation Model
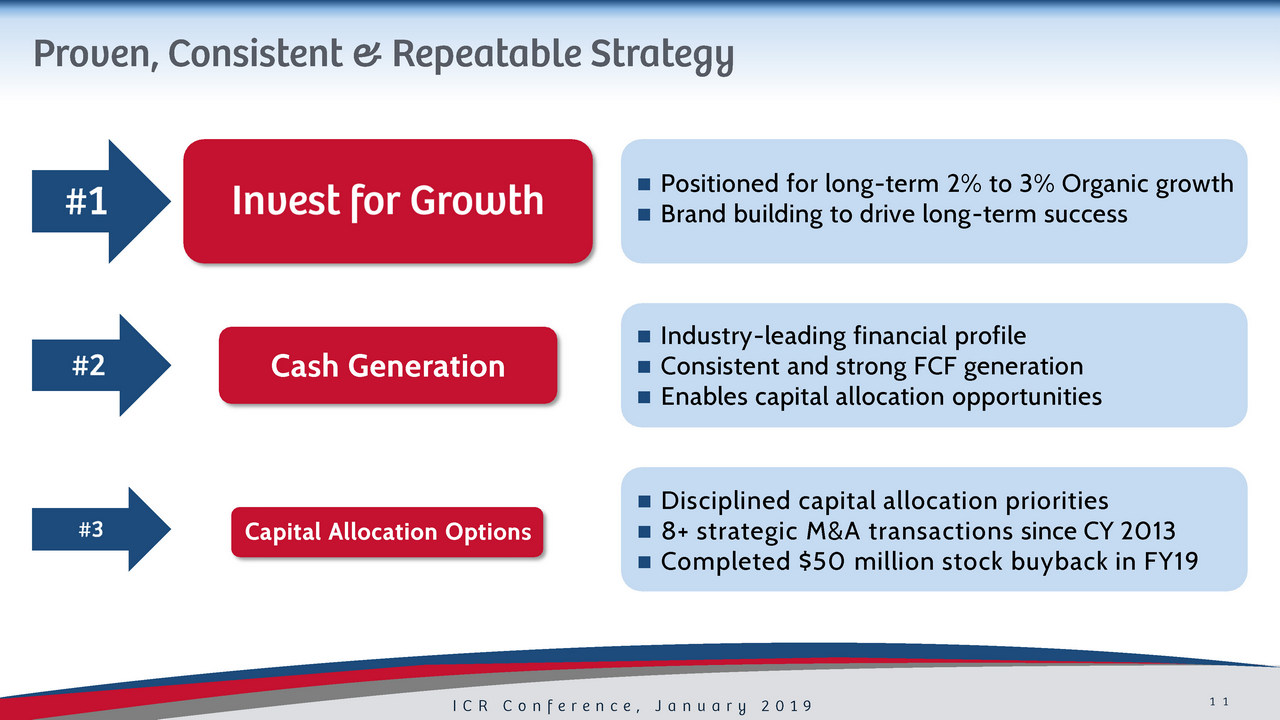
ICR Conference, January 2019 11 Industry - leading financial profile Consistent and strong FCF generation Enables capital allocation opportunities Disciplined capital allocation priorities 8+ strategic M&A transactions since CY 20 1 3 Completed $50 million stock buyback in FY19 Proven, Consistent & Repeatable Strategy Positioned for long - term 2% to 3% Organic growth Brand building to drive long - term success Cash Generation Capital Allocation Options
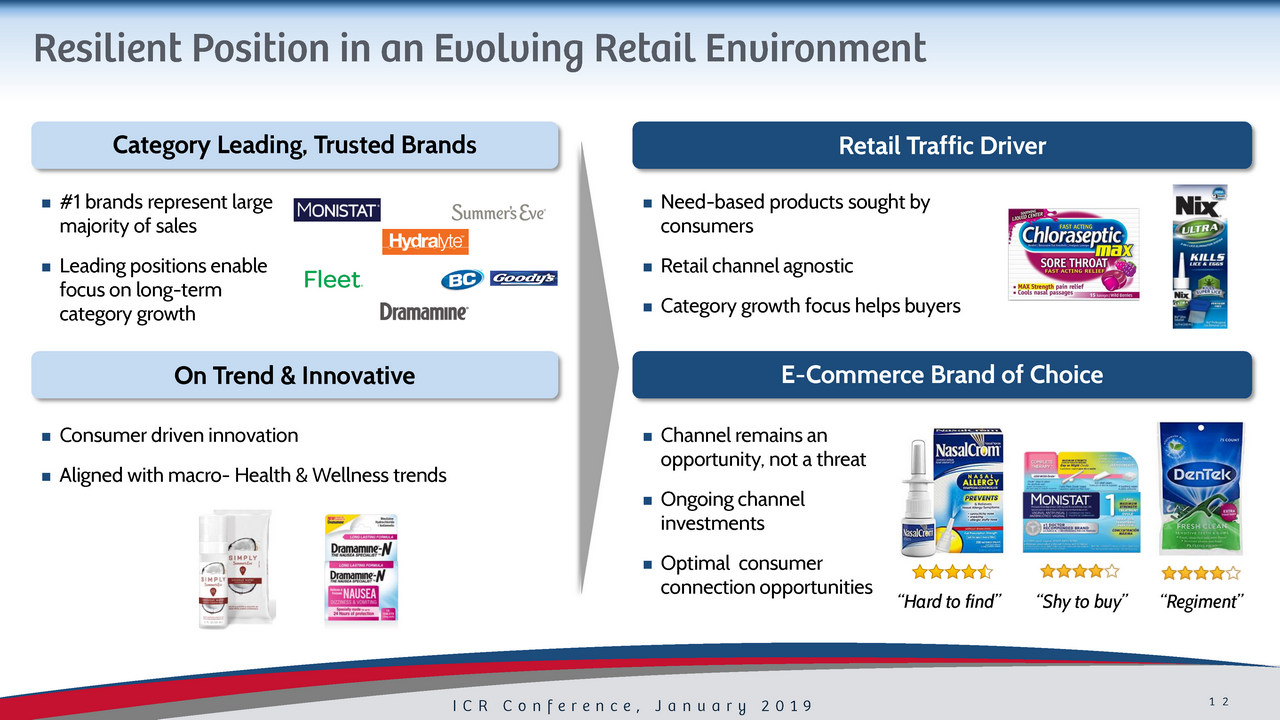
ICR Conference, January 2019 12 Resilient Position in an Evolving Retail Environment Category Leading, Trusted Brands On Trend & Innovative Retail Traffic Driver E - Commerce Brand of Choice #1 brands represent large majority of sales Leading positions enable focus on long - term category growth Consumer driven innovation Aligned with macro - Health & Wellness trends Need - based products sought by consumers Retail channel agnostic Category growth focus helps buyers Channel remains an opportunity, not a threat Ongoing channel investments Optimal consumer connection opportunities “Hard to find” “Shy to buy” “Regiment”
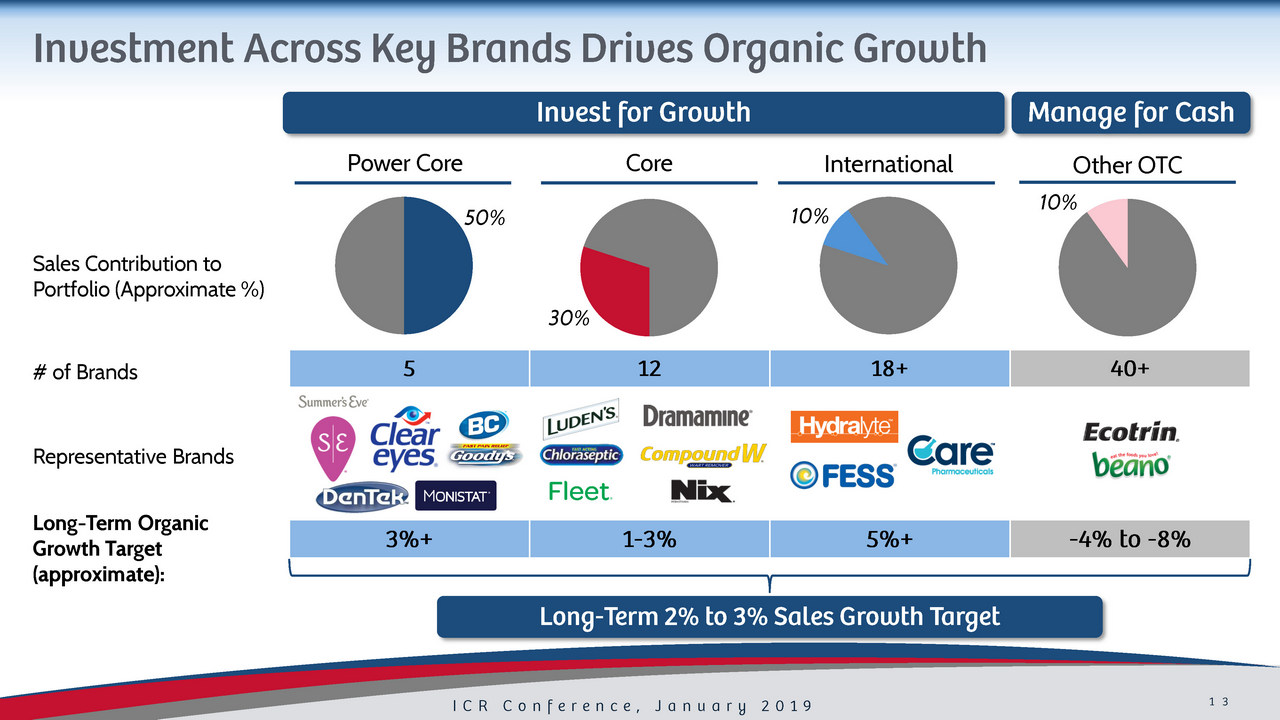
ICR Conference, January 2019 13 Investment Across Key Brands Drives Organic Growth Long - Term 2% to 3% Sales Growth Target Long - Term Organic Growth Target (approximate): # of Brands Sales Contribution to Portfolio (Approximate %) Invest for Growth Manage for Cash Power Core Core International Other OTC 10% 50% 3 0% 10% 3%+ 1 - 3% 5%+ - 4% to - 8% 5 12 18+ 40+ Representative Brands
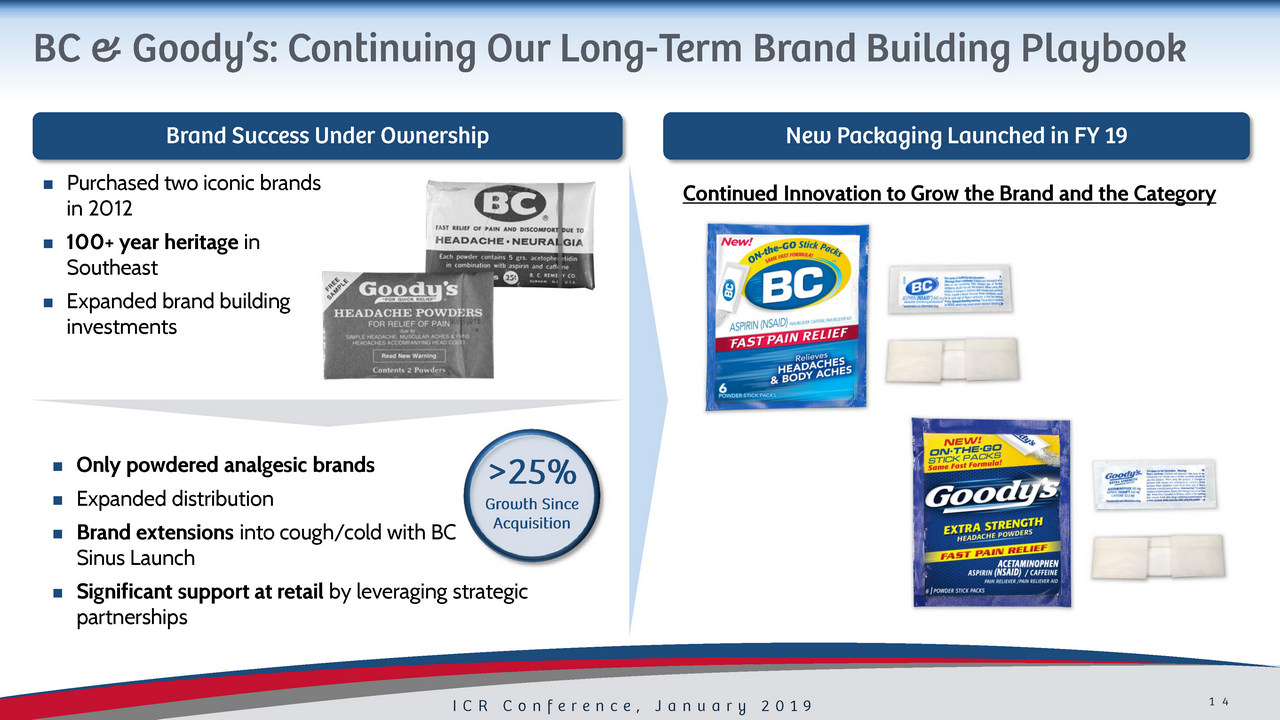
ICR Conference, January 2019 14 BC & Goody’s: Continuing Our Long - Term Brand Building Playbook Only p owdered analgesic brands Expanded distribution Brand extensions into cough/cold with BC Sinus Launch Significant support at retail by leveraging strategic partnerships Brand Success Under Ownership Purchased two iconic brands in 2012 100 + year heritage in Southeast Expanded brand building investments New Packaging Launched in FY 19 >25% Growth Since Acquisition Continued I nnovation to Grow the Brand and the Category
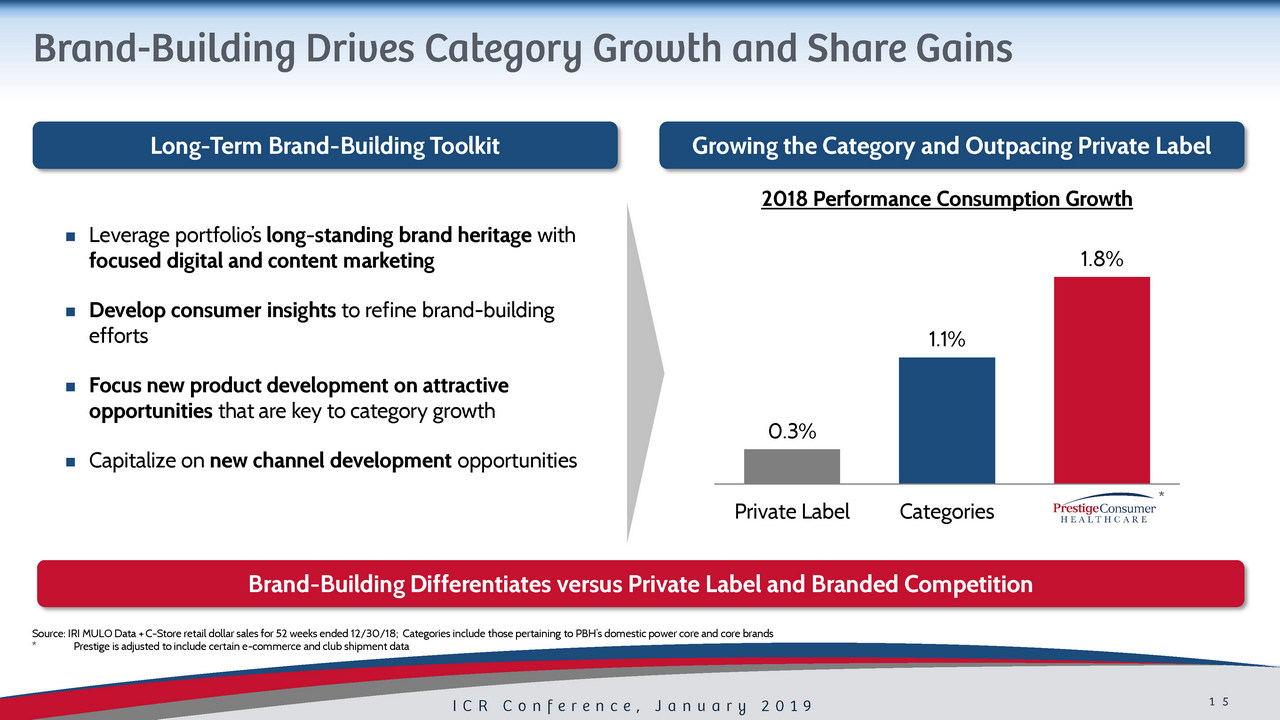
ICR Conference, January 2019 15 Brand - Building Drives Category Growth and Share Gains Long - Term Brand - Building Toolkit Source: IRI MULO Data + C - Store retail dollar sales for 52 weeks ended 12/30/18 ; Categories include those pertaining to PBH’s domestic power core and core brands * Prestige is adjusted to include certain e - commerce and club shipment data 0.3% 1.1% 1.8% Private Label Categories Growing the Category and Outpacing Private Label * Brand - Building Differentiates versus Private Label and Branded Competition 2018 Performance Consumption Growth Leverage portfolio’s long - standing brand heritage with focused digital and content marketing Develop consumer insights to refine brand - building efforts Focus new product development on attractive opportunities that are key to category growth Capitalize on new channel development opportunities
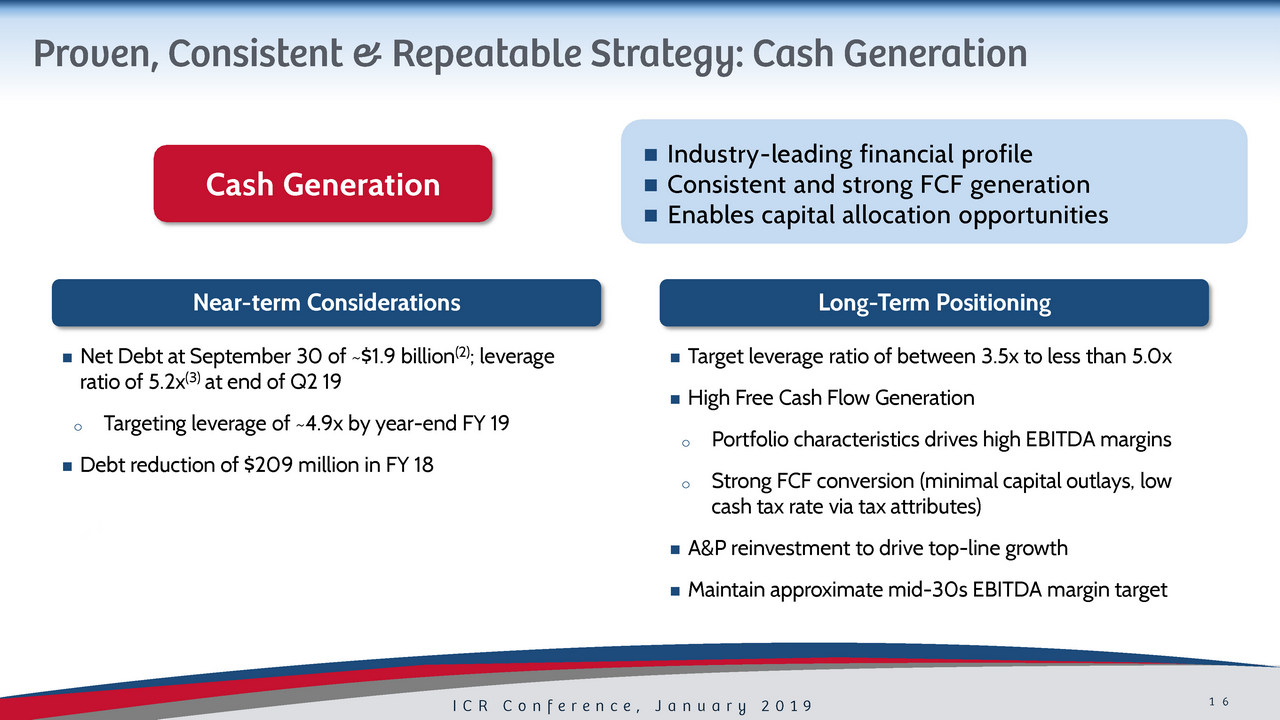
ICR Conference, January 2019 16 Near - term Considerations Long - Term Positioning T arget leverage ratio of between 3.5x to less than 5.0x High Free Cash Flow Generation o Portfolio characteristics drives high EBITDA margins o Strong FCF conversion (minimal capital outlays, low cash tax rate via tax attributes) A&P reinvestment to drive top - line growth Maintain approximate mid - 30s EBITDA margin target Net Debt at September 30 of ~$1.9 billion (2) ; leverage ratio of 5.2x (3) at end of Q2 19 o Targeting leverage of ~4.9x by year - end FY 19 Debt reduction of $ 209 million in FY 18 Cash Generation Proven, Consistent & Repeatable Strategy: Cash Generation Industry - leading financial profile Consistent and strong FCF generation Enables capital allocation opportunities
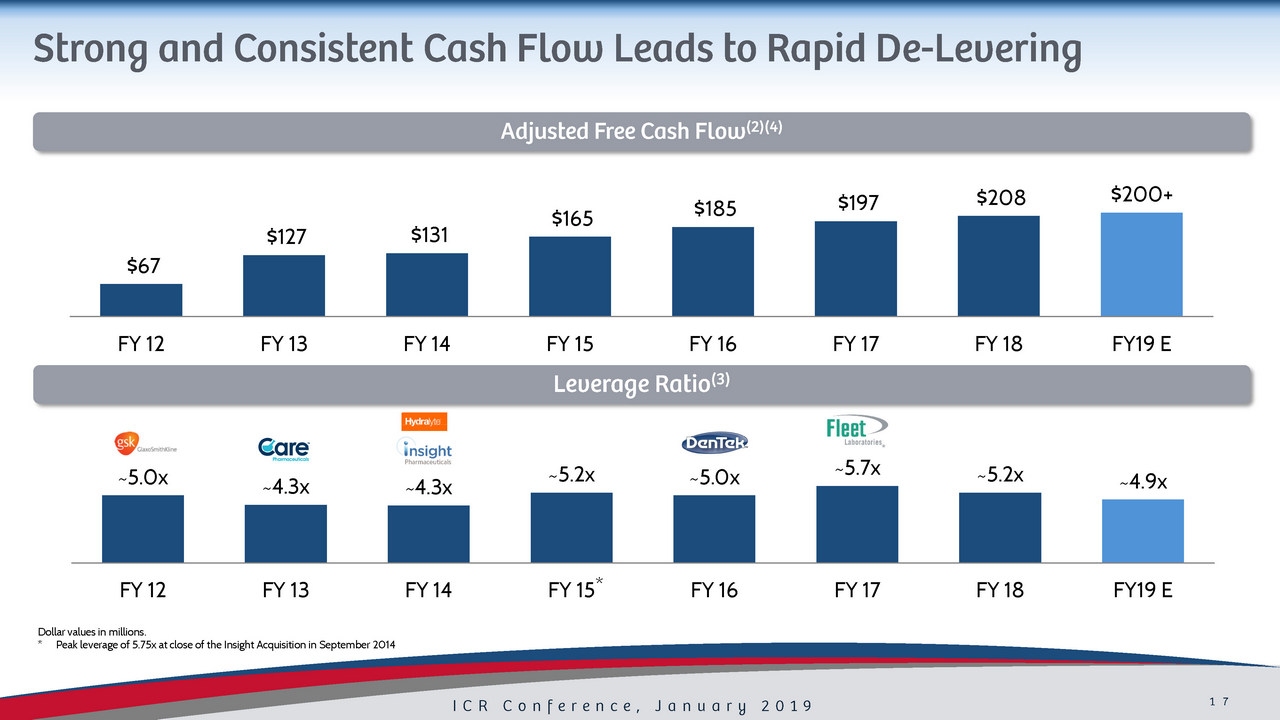
ICR Conference, January 2019 17 ~5.0x ~4.3x ~4.3x ~5.2x ~5.0x ~5.7x ~5.2x ~ 4.9x FY 12 FY 13 FY 14 FY 15 FY 16 FY 17 FY 18 FY19 E Leverage Ratio (3) $67 $127 $131 $165 $185 $197 $208 $200+ FY 12 FY 13 FY 14 FY 15 FY 16 FY 17 FY 18 FY19 E Strong and Consistent Cash Flow Leads to Rapid De - Levering Dollar values in millions . * Peak leverage of 5.75x at close of the Insight Acquisition in September 2014 Adjusted Free Cash Flow (2)(4) *
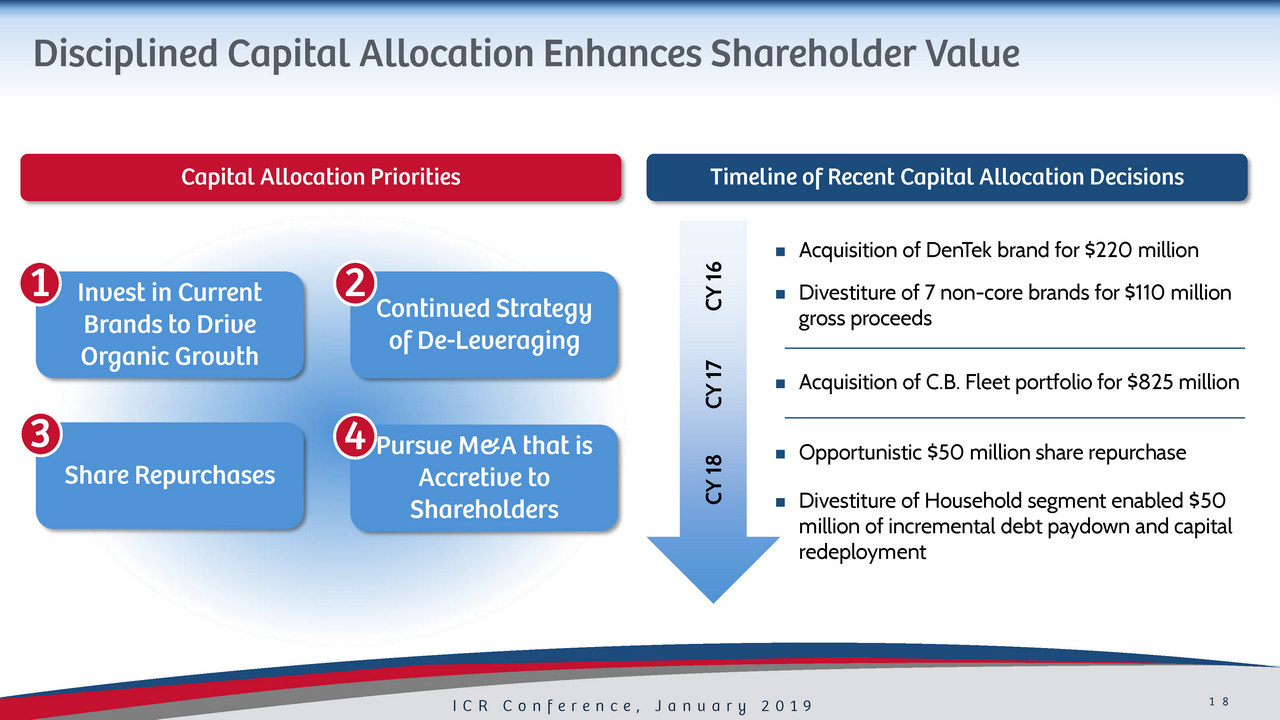
ICR Conference, January 2019 18 Disciplined Capital Allocation Enhances Shareholder Value Capital Deployment Share Repurchases 3 Pursue M&A that is Accretive to Shareholders 4 Continued Strategy of De - Leveraging 2 Invest in Current Brands to Drive Organic Growth 1 CY 16 CY 17 CY 18 Timeline of Recent Capital Allocation Decisions Acquisition of DenTek brand for $220 million Acquisition of C.B. Fleet portfolio for $825 million Divestiture of Household segment enabled $50 million of incremental debt paydown and capital redeployment Divestiture of 7 non - core brands for $110 million gross proceeds Opportunistic $50 million share repurchase Capital Allocation Priorities
III. Financial Review and FY 19 Outlook
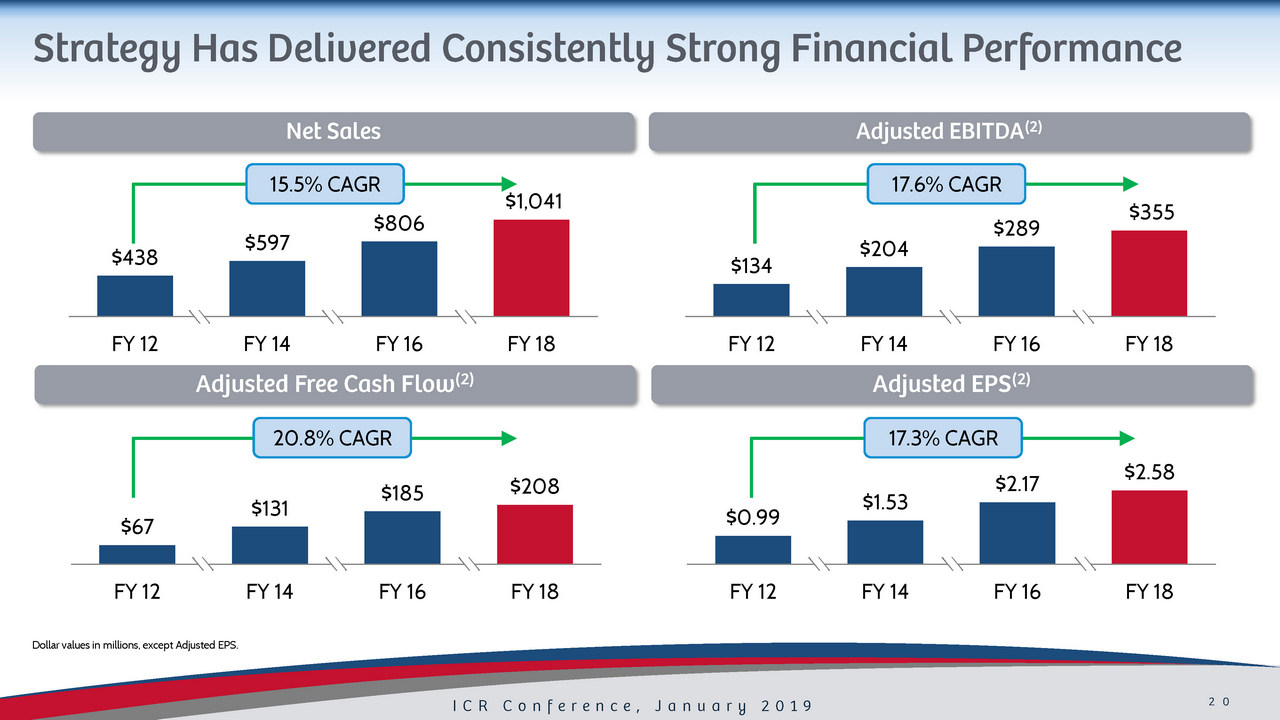
ICR Conference, January 2019 20 $67 $131 $185 $208 FY 12 FY 14 FY 16 FY 18 $134 $204 $289 $355 FY 12 FY 14 FY 16 FY 18 $438 $597 $806 $1,041 FY 12 FY 14 FY 16 FY 18 Strategy Has Delivered Consistently Strong Financial Performance 15.5% CAGR 17.6% CAGR 20.8% CAGR Adjusted EBITDA (2) Net Sales $0.99 $1.53 $2.17 $2.58 FY 12 FY 14 FY 16 FY 18 Adjusted EPS (2) 17.3% CAGR Adjusted Free Cash Flow (2) Dollar values in millions, except Adjusted EPS.
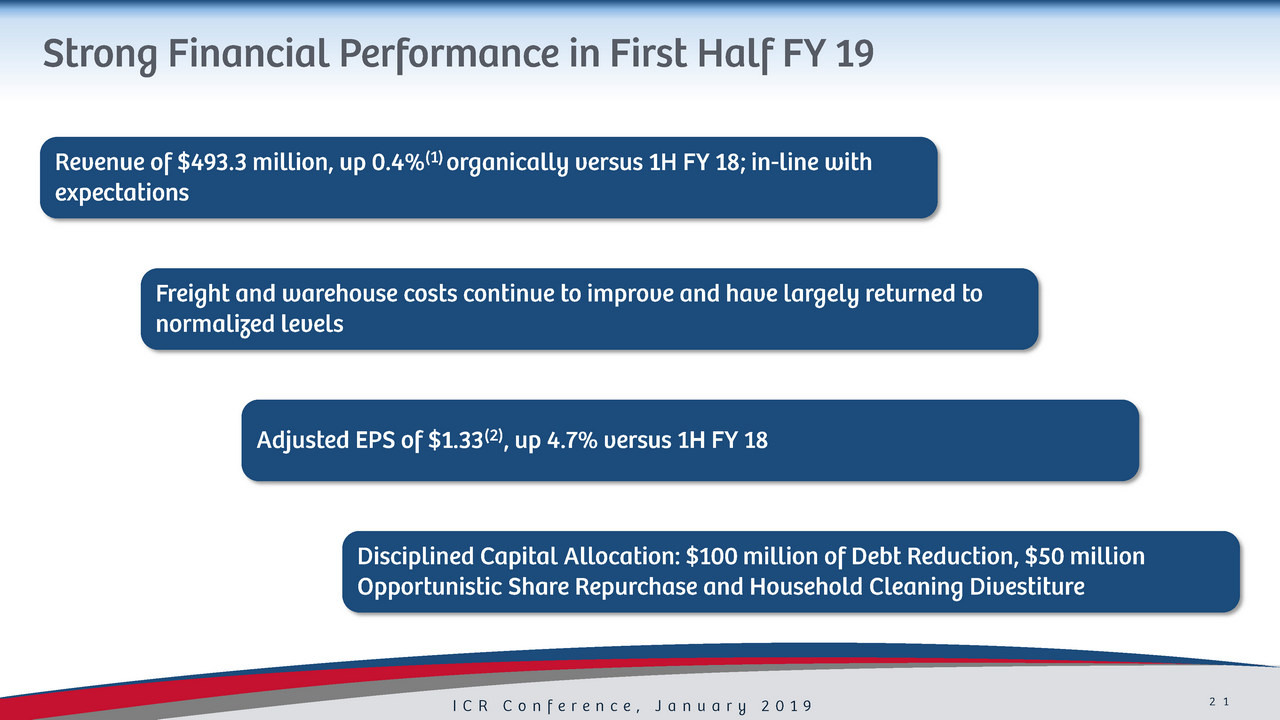
ICR Conference, January 2019 21 Strong Financial Performance in First Half FY 19 Revenue of $493.3 million , up 0.4 % (1) organically versus 1H FY 18; in - line with expectations Adjusted EPS of $1.33 (2) , up 4.7% versus 1H FY 18 Freight and warehouse costs continue to improve and have largely returned to normalized levels Disciplined Capital Allocation: $100 million of Debt Reduction, $50 million Opportunistic Share Repurchase and Household Cleaning Divestiture
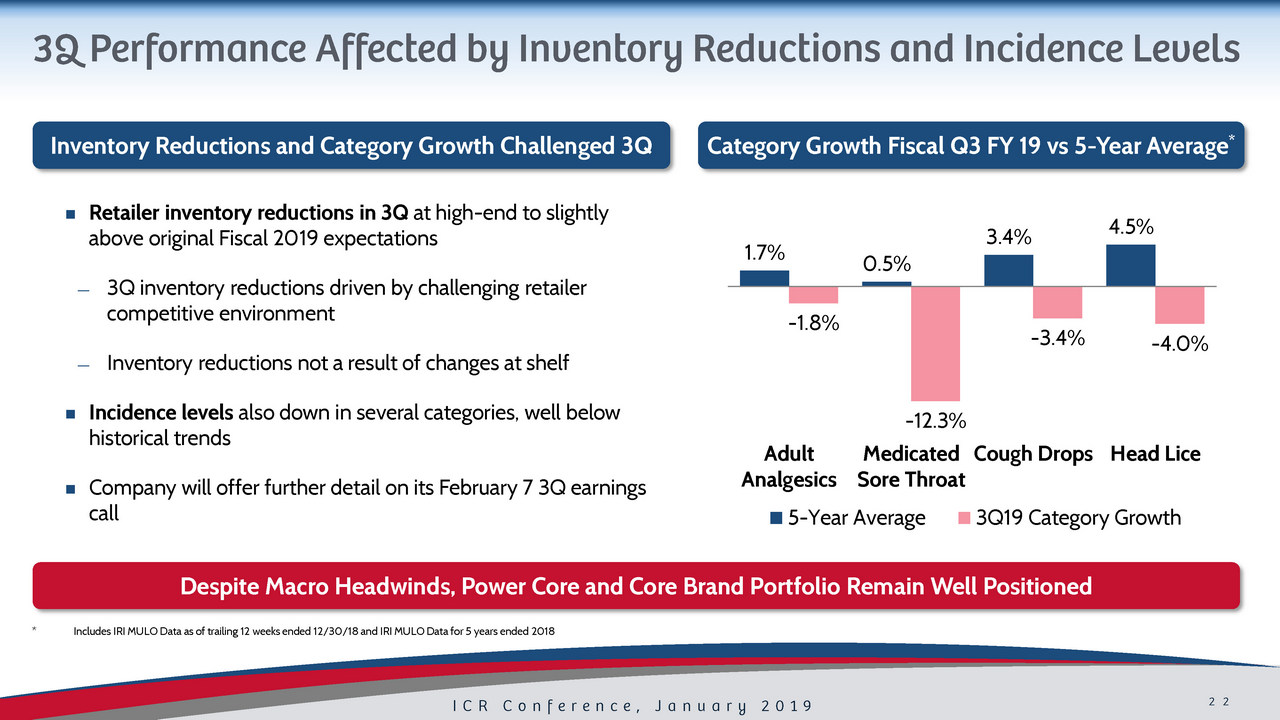
ICR Conference, January 2019 22 3Q Performance Affected by Inventory Reductions and Incidence Levels Inventory Reductions and Category Growth Challenged 3Q * Includes IRI MULO Data as of trailing 12 weeks ended 12/30/18 and IRI MULO Data for 5 years ended 2018 1.7% 0.5% 3.4% 4.5% - 1.8% - 12.3% - 3.4% - 4.0% Adult Analgesics Medicated Sore Throat Cough Drops Head Lice 5-Year Average 3Q19 Category Growth Category Growth Fiscal Q3 FY 19 vs 5 - Year Average * Despite Macro Headwinds, Power Core and Core Brand Portfolio Remain Well Positioned R etailer inventory reductions in 3Q at high - end to slightly above original Fiscal 2019 expectations — 3Q inventory reductions driven by challenging retailer competitive environment — Inventory reductions not a result of changes at shelf Incidence levels also down in several categories, well below historical trends Company will offer further detail on its February 7 3Q earnings call
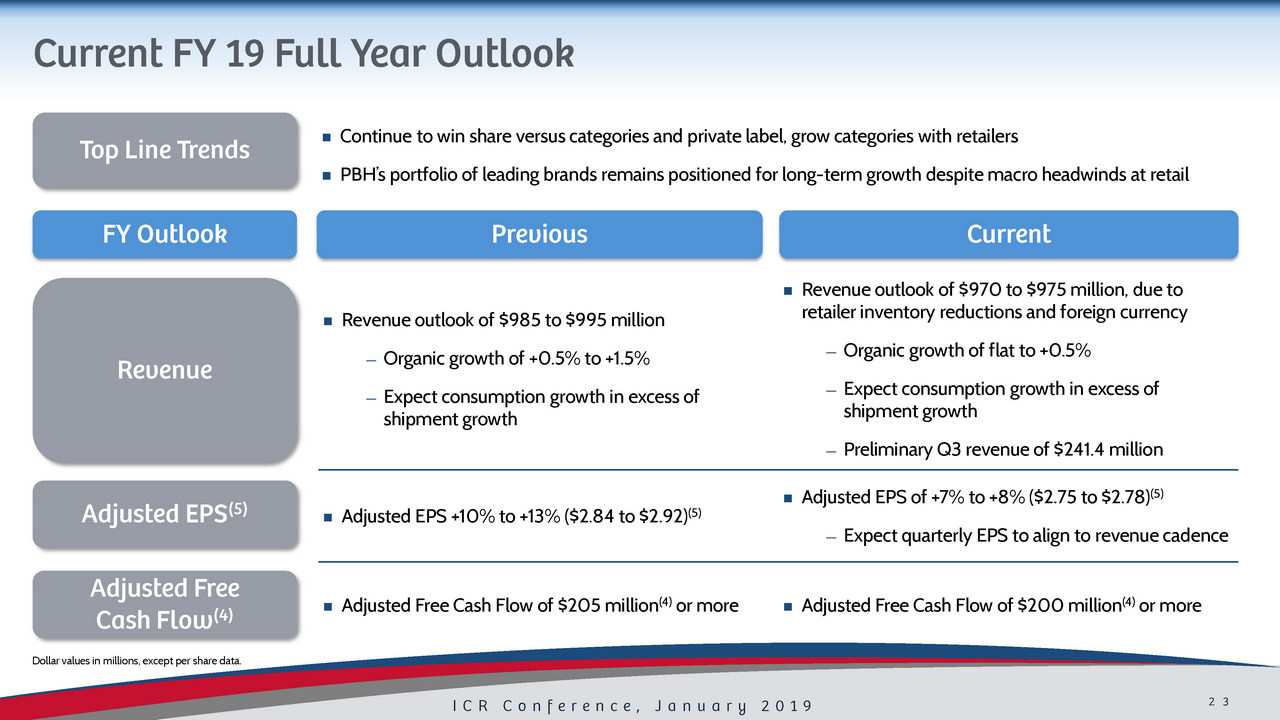
ICR Conference, January 2019 23 Current FY 19 Full Year Outlook Continue to win share versus categories and private label, grow categories with retailers PBH’s portfolio of leading brands remains positioned for long - term growth despite macro headwinds at retail Top Line Trends Adjusted Free Cash Flow (4) Adjusted EPS (5) Revenue Dollar values in millions, except per share data . Revenue outlook of $985 to $995 million — Organic g rowth of +0.5% to +1.5% — Expect consumption growth in excess of shipment growth Revenue outlook of $970 to $975 million, due to retailer inventory reductions and foreign currency — Organic growth of flat to +0.5% — Expect consumption growth in excess of shipment growth — Preliminary Q3 revenue of $241.4 millio n Adjusted EPS +10% to +13% ($2.84 to $2.92) (5) Adjusted EPS of +7% to +8% ($2.75 to $2.78) (5) — Expect quarterly EPS to align to revenue cadence Adjusted Free Cash Flow of $205 million (4) or more Adjusted Free Cash Flow of $200 million (4) or more Previous Current FY Outlook
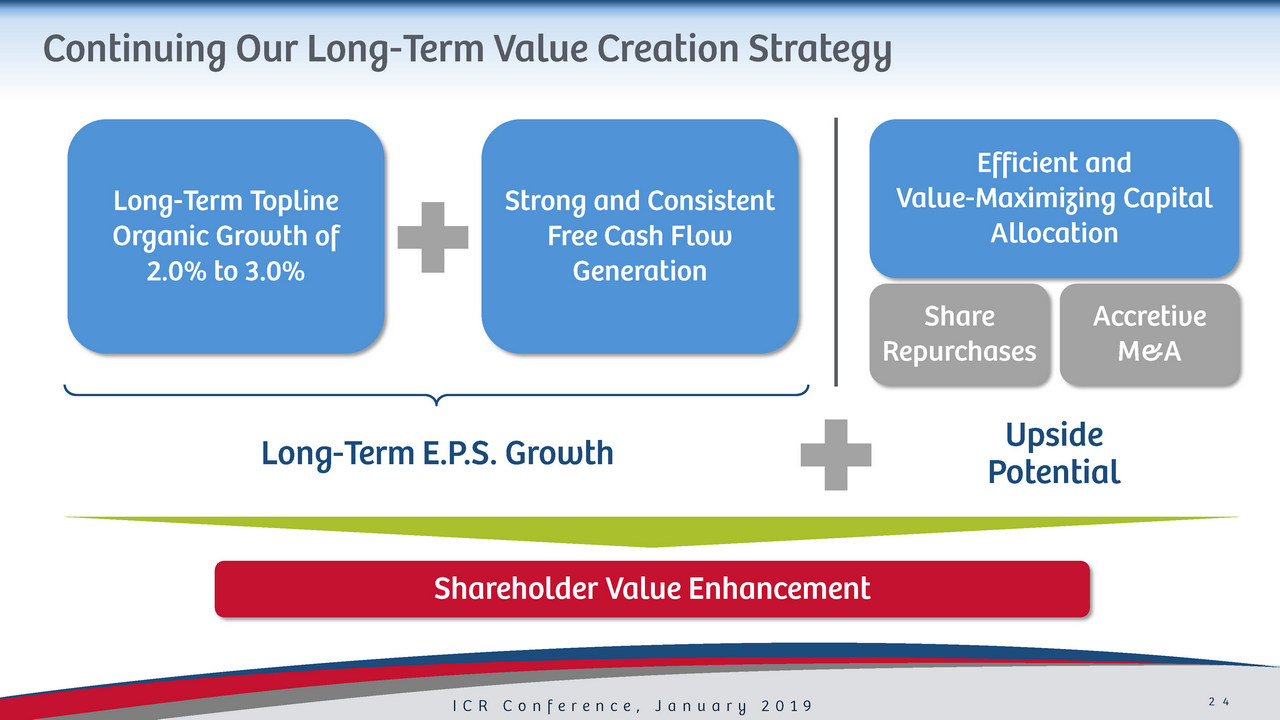
ICR Conference, January 2019 24 Continuing Our Long - Term Value Creation Strategy Strong and Consistent Free Cash Flow Generation Long - Term Topline Organic Growth of 2 .0% to 3.0% Efficient and Value - Maximizing Capital Allocation Shareholder Value Enhancement Long - Term E.P.S. Growth Upside Potential Share Repurchases Accretive M&A
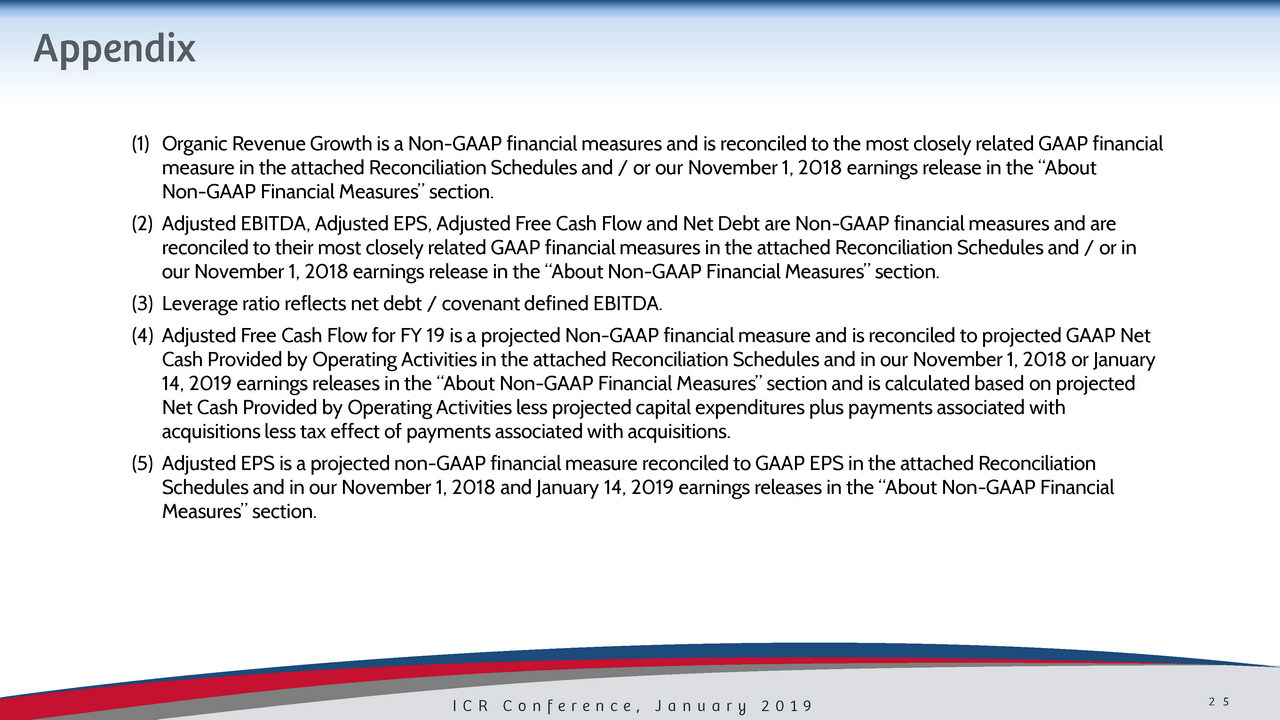
ICR Conference, January 2019 25 Appendix (1) Organic Revenue Growth is a Non - GAAP financial measures and is reconciled to the most closely related GAAP financial measure in the attached Reconciliation Schedules and / or our November 1, 2018 earnings release in the “About Non - GAAP Financial Measures” section . (2) Adjusted EBITDA, Adjusted EPS , Adjusted Free Cash Flow and Net Debt are Non - GAAP financial measures and are reconciled to their most closely related GAAP financial measures in the attached Reconciliation Schedules and / or in our November 1, 2018 earnings release in the “About Non - GAAP Financial Measures” section. (3) Leverage ratio reflects net debt / covenant defined EBITDA. (4) Adjusted Free Cash Flow for FY 19 is a projected Non - GAAP financial measure and is reconciled to projected GAAP Net Cash Provided by Operating Activities in the attached Reconciliation Schedules and in our November 1, 2018 or January 14, 2019 earnings releases in the “About Non - GAAP Financial Measures” section and is calculated based on projected Net Cash Provided by Operating Activities less projected capital expenditures plus payments associated with acquisitions less tax effect of payments associated with acquisitions . (5) Adjusted EPS is a projected non - GAAP financial measure reconciled to GAAP EPS in the attached Reconciliation Schedules and in our November 1, 2018 and January 14, 2019 earnings releases in the “About Non - GAAP Financial Measures” section.
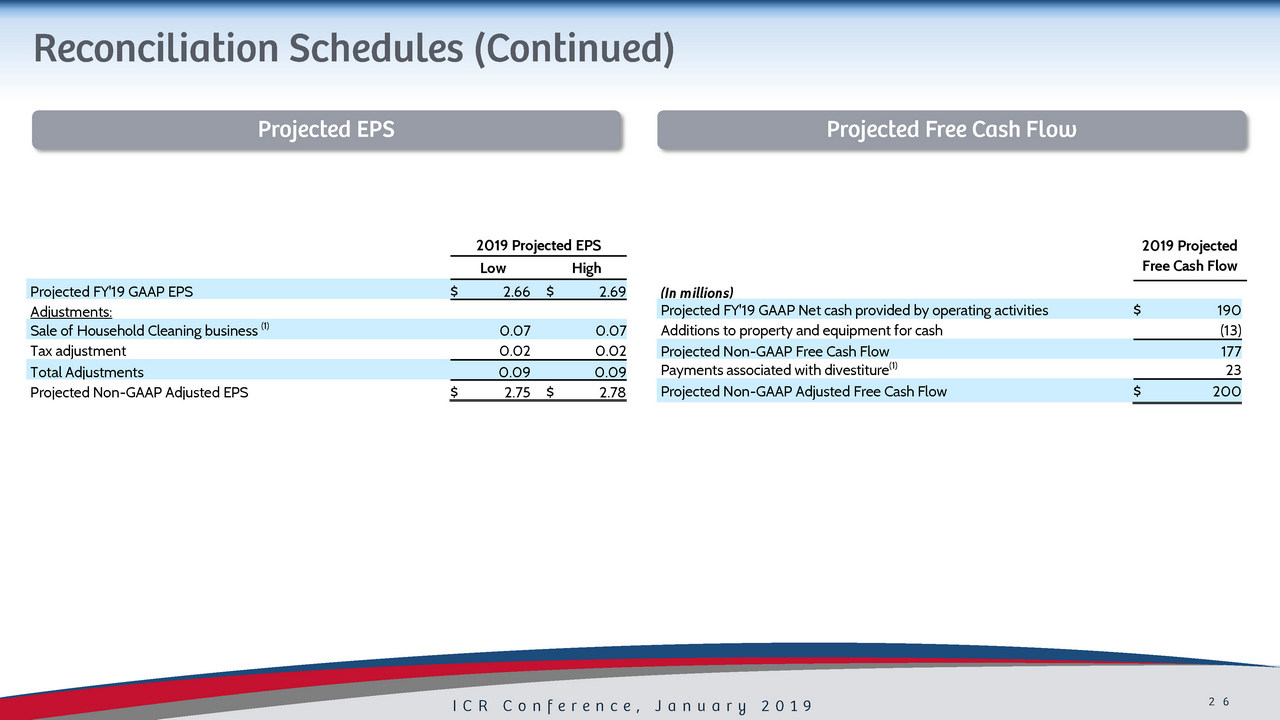
ICR Conference, January 2019 26 Reconciliation Schedules (Continued) Projected EPS Projected Free Cash Flow 2019 Projected EPS Low High Projected FY'19 GAAP EPS $ 2.66 $ 2.69 Adjustments: Sale of Household Cleaning business (1) 0.07 0.07 Tax adjustment 0.02 0.02 Total Adjustments 0.09 0.09 Projected Non-GAAP Adjusted EPS $ 2.75 $ 2.78 2019 Projected Free Cash Flow (In millions) Projected FY'19 GAAP Net cash provided by operating activities $ 190 Additions to property and equipment for cash (13) Projected Non-GAAP Free Cash Flow 177 Payments associated with divestiture (1) 23 Projected Non-GAAP Adjusted Free Cash Flow $ 200
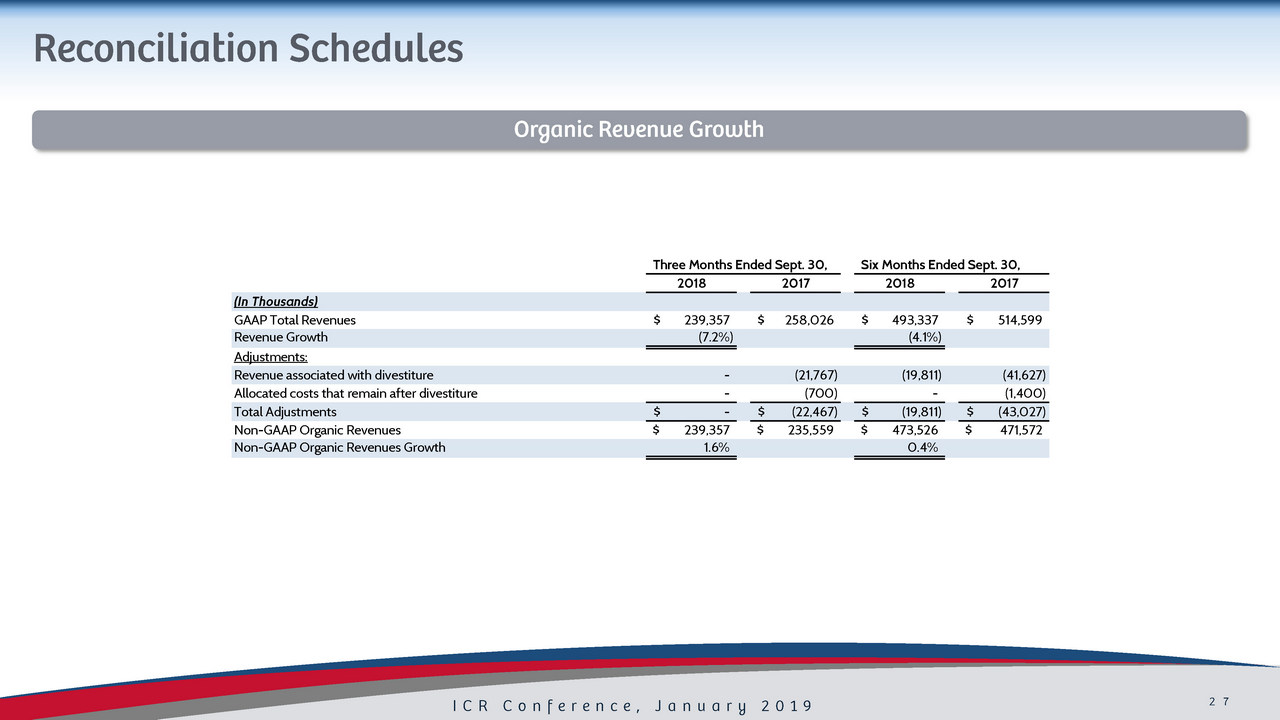
ICR Conference, January 2019 27 Reconciliation Schedules Organic Revenue Growth Three Months Ended Sept. 30, Six Months Ended Sept. 30, 2018 2017 2018 2017 (In Thousands) GAAP Total Revenues 239,357$ 258,026$ 493,337$ 514,599$ Revenue Growth (7.2%) (4.1%) Adjustments: Revenue associated with divestiture - (21,767) (19,811) (41,627) Allocated costs that remain after divestiture - (700) - (1,400) Total Adjustments -$ (22,467)$ (19,811)$ (43,027)$ Non-GAAP Organic Revenues 239,357$ 235,559$ 473,526$ 471,572$ Non-GAAP Organic Revenues Growth 1.6% 0.4%
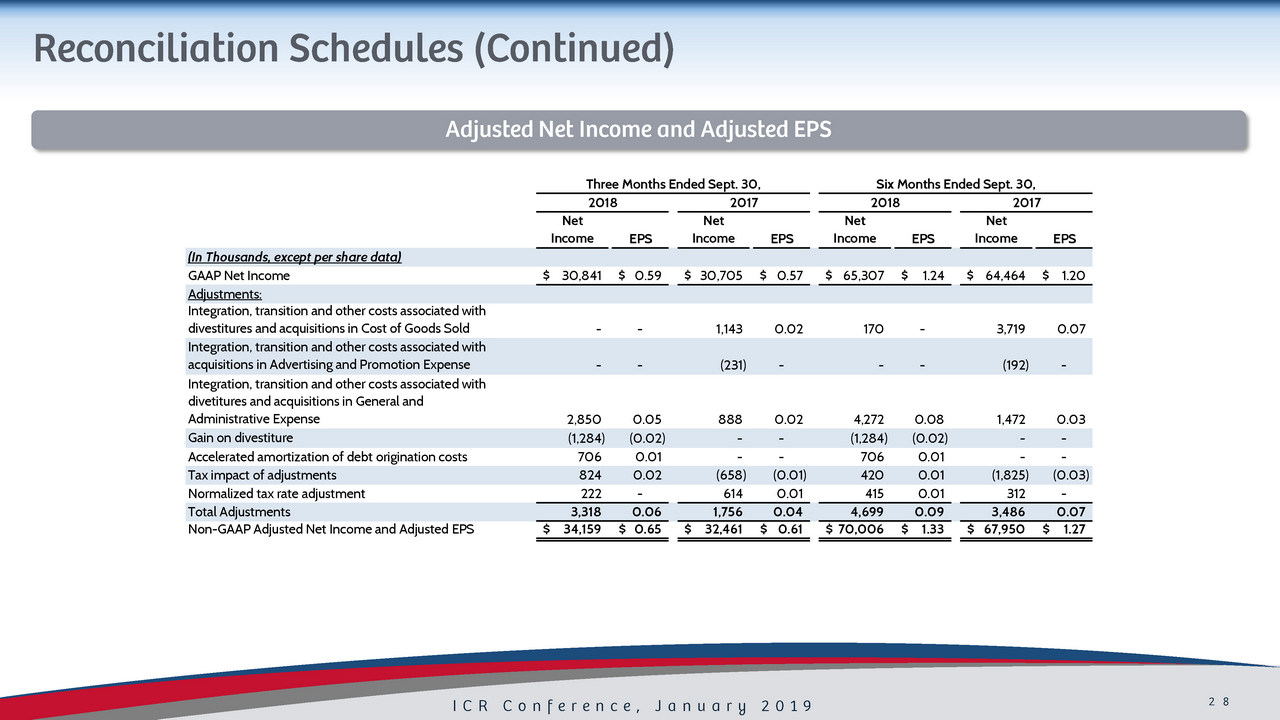
ICR Conference, January 2019 28 Adjusted Net Income and Adjusted EPS Reconciliation Schedules (Continued) Three Months Ended Sept. 30, Six Months Ended Sept. 30, 2018 2017 2018 2017 Net Income EPS Net Income EPS Net Income EPS Net Income EPS (In Thousands, except per share data) GAAP Net Income 30,841$ 0.59$ 30,705$ 0.57$ 65,307$ 1.24$ 64,464$ 1.20$ Adjustments: Integration, transition and other costs associated with divestitures and acquisitions in Cost of Goods Sold - - 1,143 0.02 170 - 3,719 0.07 Integration, transition and other costs associated with acquisitions in Advertising and Promotion Expense - - (231) - - - (192) - Integration, transition and other costs associated with divetitures and acquisitions in General and Administrative Expense 2,850 0.05 888 0.02 4,272 0.08 1,472 0.03 Gain on divestiture (1,284) (0.02) - - (1,284) (0.02) - - Accelerated amortization of debt origination costs 706 0.01 - - 706 0.01 - - Tax impact of adjustments 824 0.02 (658) (0.01) 420 0.01 (1,825) (0.03) Normalized tax rate adjustment 222 - 614 0.01 415 0.01 312 - Total Adjustments 3,318 0.06 1,756 0.04 4,699 0.09 3,486 0.07 Non-GAAP Adjusted Net Income and Adjusted EPS 34,159$ 0.65$ 32,461$ 0.61$ 70,006$ 1.33$ 67,950$ 1.27$
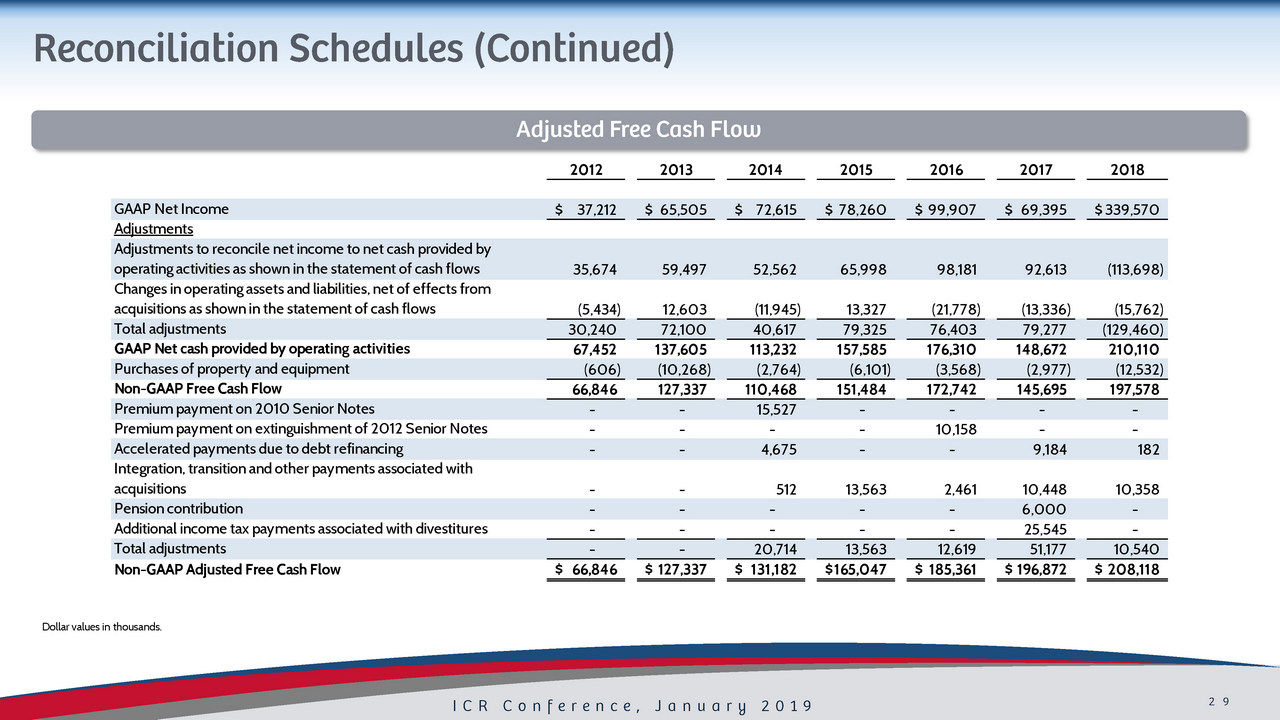
ICR Conference, January 2019 29 Reconciliation Schedules (Continued) Dollar values in thousands. Adjusted Free Cash Flow 2012 2013 2014 2015 2016 2017 2018 GAAP Net Income 37,212$ 65,505$ 72,615$ 78,260$ 99,907$ 69,395$ 339,570$ Adjustments Adjustments to reconcile net income to net cash provided by operating activities as shown in the statement of cash flows 35,674 59,497 52,562 65,998 98,181 92,613 (113,698) Changes in operating assets and liabilities, net of effects from acquisitions as shown in the statement of cash flows (5,434) 12,603 (11,945) 13,327 (21,778) (13,336) (15,762) Total adjustments 30,240 72,100 40,617 79,325 76,403 79,277 (129,460) GAAP Net cash provided by operating activities 67,452 137,605 113,232 157,585 176,310 148,672 210,110 Purchases of property and equipment (606) (10,268) (2,764) (6,101) (3,568) (2,977) (12,532) Non-GAAP Free Cash Flow 66,846 127,337 110,468 151,484 172,742 145,695 197,578 Premium payment on 2010 Senior Notes - - 15,527 - - - - Premium payment on extinguishment of 2012 Senior Notes - - - - 10,158 - - Accelerated payments due to debt refinancing - - 4,675 - - 9,184 182 Integration, transition and other payments associated with acquisitions - - 512 13,563 2,461 10,448 10,358 Pension contribution - - - - - 6,000 - Additional income tax payments associated with divestitures - - - - - 25,545 - Total adjustments - - 20,714 13,563 12,619 51,177 10,540 Non-GAAP Adjusted Free Cash Flow 66,846$ 127,337$ 131,182$ 165,047$ 185,361$ 196,872$ 208,118$
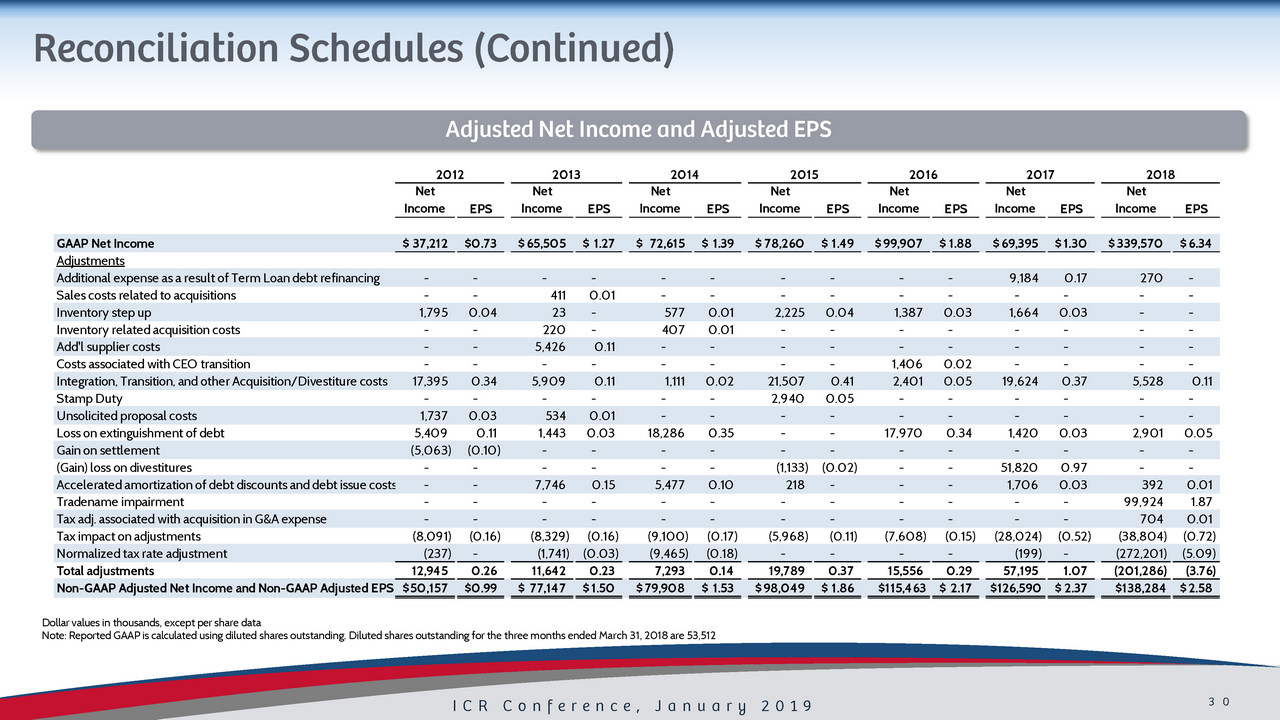
ICR Conference, January 2019 30 Reconciliation Schedules (Continued) Adjusted Net Income and Adjusted EPS 2012 2013 2014 2015 2016 2017 2018 Net Income EPS Net Income EPS Net Income EPS Net Income EPS Net Income EPS Net Income EPS Net Income EPS GAAP Net Income 37,212$ 0.73$ 65,505$ 1.27$ 72,615$ 1.39$ 78,260$ 1.49$ 99,907$ 1.88$ 69,395$ 1.30$ 339,570$ 6.34$ Adjustments Additional expense as a result of Term Loan debt refinancing - - - - - - - - - - 9,184 0.17 270 - Sales costs related to acquisitions - - 411 0.01 - - - - - - - - - - Inventory step up 1,795 0.04 23 - 577 0.01 2,225 0.04 1,387 0.03 1,664 0.03 - - Inventory related acquisition costs - - 220 - 407 0.01 - - - - - - - - Add'l supplier costs - - 5,426 0.11 - - - - - - - - - - Costs associated with CEO transition - - - - - - - - 1,406 0.02 - - - - Integration, Transition, and other Acquisition/Divestiture costs 17,395 0.34 5,909 0.11 1,111 0.02 21,507 0.41 2,401 0.05 19,624 0.37 5,528 0.11 Stamp Duty - - - - - - 2,940 0.05 - - - - - - Unsolicited proposal costs 1,737 0.03 534 0.01 - - - - - - - - - - Loss on extinguishment of debt 5,409 0.11 1,443 0.03 18,286 0.35 - - 17,970 0.34 1,420 0.03 2,901 0.05 Gain on settlement (5,063) (0.10) - - - - - - - - - - - - (Gain) loss on divestitures - - - - - - (1,133) (0.02) - - 51,820 0.97 - - Accelerated amortization of debt discounts and debt issue costs - - 7,746 0.15 5,477 0.10 218 - - - 1,706 0.03 392 0.01 Tradename impairment - - - - - - - - - - - - 99,924 1.87 Tax adj. associated with acquisition in G&A expense - - - - - - - - - - - - 704 0.01 Tax impact on adjustments (8,091) (0.16) (8,329) (0.16) (9,100) (0.17) (5,968) (0.11) (7,608) (0.15) (28,024) (0.52) (38,804) (0.72) Normalized tax rate adjustment (237) - (1,741) (0.03) (9,465) (0.18) - - - - (199) - (272,201) (5.09) Total adjustments 12,945 0.26 11,642 0.23 7,293 0.14 19,789 0.37 15,556 0.29 57,195 1.07 (201,286) (3.76) Non-GAAP Adjusted Net Income and Non-GAAP Adjusted EPS50,157$ 0.99$ 77,147$ 1.50$ 79,908$ 1.53$ 98,049$ 1.86$ $115,463 2.17$ $126,590 2.37$ $138,284 2.58$ Dollar values in thousands, except per share data Note: Reported GAAP is calculated using diluted shares outstanding. Diluted shares outstanding for the three months ended Mar ch 31, 2018 are 53,512
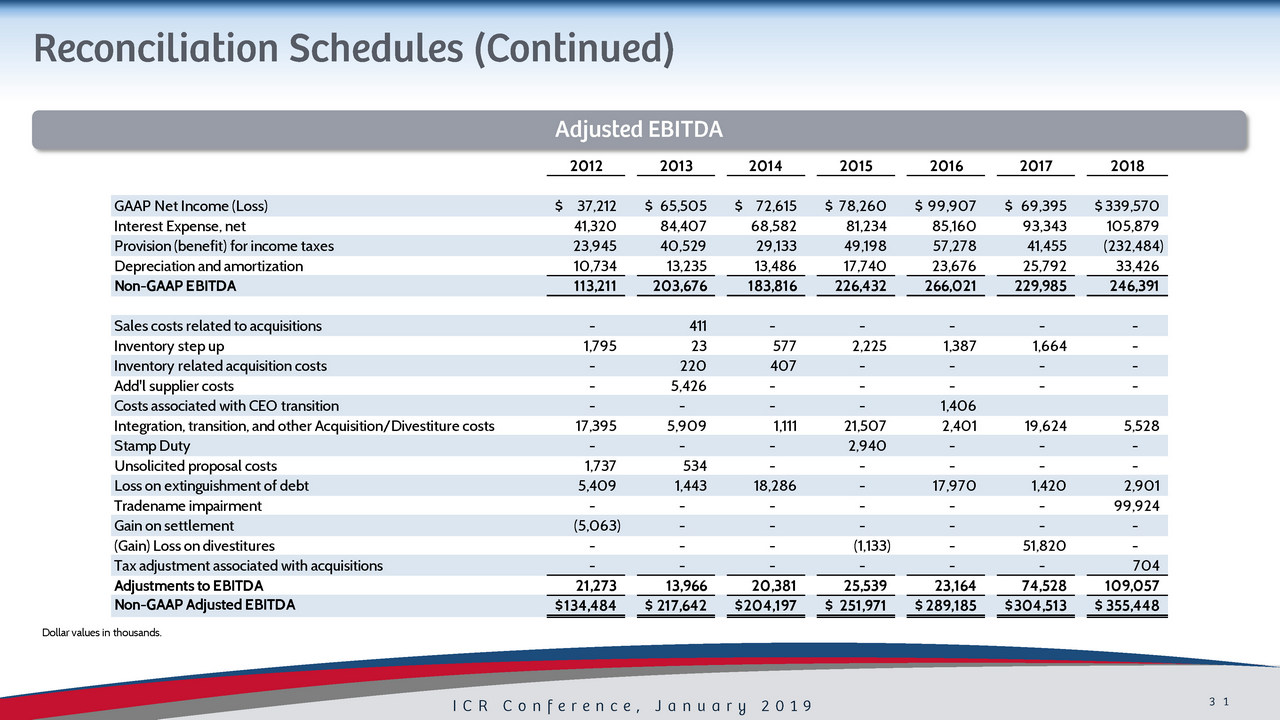
ICR Conference, January 2019 31 Reconciliation Schedules (Continued) Dollar values in thousands. Adjusted EBITDA 2012 2013 2014 2015 2016 2017 2018 GAAP Net Income (Loss) 37,212$ 65,505$ 72,615$ 78,260$ 99,907$ 69,395$ 339,570$ Interest Expense, net 41,320 84,407 68,582 81,234 85,160 93,343 105,879 Provision (benefit) for income taxes 23,945 40,529 29,133 49,198 57,278 41,455 (232,484) Depreciation and amortization 10,734 13,235 13,486 17,740 23,676 25,792 33,426 Non-GAAP EBITDA 113,211 203,676 183,816 226,432 266,021 229,985 246,391 Sales costs related to acquisitions - 411 - - - - - Inventory step up 1,795 23 577 2,225 1,387 1,664 - Inventory related acquisition costs - 220 407 - - - - Add'l supplier costs - 5,426 - - - - - Costs associated with CEO transition - - - - 1,406 Integration, transition, and other Acquisition/Divestiture costs 17,395 5,909 1,111 21,507 2,401 19,624 5,528 Stamp Duty - - - 2,940 - - - Unsolicited proposal costs 1,737 534 - - - - - Loss on extinguishment of debt 5,409 1,443 18,286 - 17,970 1,420 2,901 Tradename impairment - - - - - - 99,924 Gain on settlement (5,063) - - - - - - (Gain) Loss on divestitures - - - (1,133) - 51,820 - Tax adjustment associated with acquisitions - - - - - - 704 Adjustments to EBITDA 21,273 13,966 20,381 25,539 23,164 74,528 109,057 Non-GAAP Adjusted EBITDA 134,484$ 217,642$ 204,197$ 251,971$ 289,185$ 304,513$ 355,448$