Attached files
| file | filename |
|---|---|
| EX-99.1 - EX-99.1 - Del Taco Restaurants, Inc. | d641663dex991.htm |
| 8-K - 8-K - Del Taco Restaurants, Inc. | d641663d8k.htm |

Exhibit 99.2Exhibit 99.2
22

33

44

(1) Based on unit count (2) Represents FY2018 sales data and unit counts as of FY2018 st (3) Represents system-wide sales for fiscal 2018 and unit count as of January 1 , 2019. Mexican QSR competitive unit counts / system-wide sales are from the 5 Technomic Top 500 2018 report reflecting 2017 results(1) Based on unit count (2) Represents FY2018 sales data and unit counts as of FY2018 st (3) Represents system-wide sales for fiscal 2018 and unit count as of January 1 , 2019. Mexican QSR competitive unit counts / system-wide sales are from the 5 Technomic Top 500 2018 report reflecting 2017 results
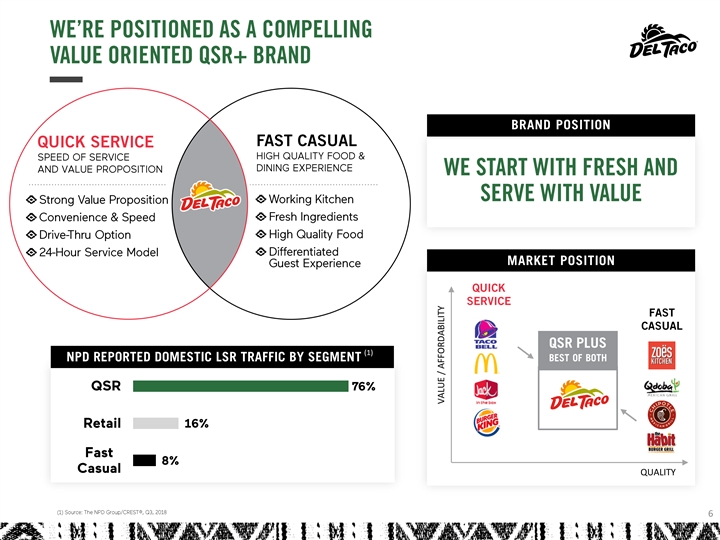
( (1 1) ) QUALITY 6 VALUE / AFFORDABILITY( (1 1) ) QUALITY 6 VALUE / AFFORDABILITY

77
88
99

1010

1111

1212

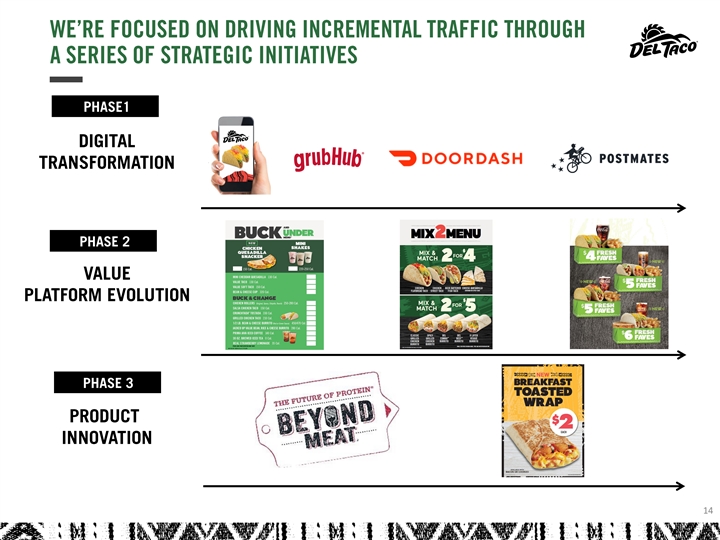
3.5% 2.6% 2.6% 2.4% 2.3% 2.2% 2.0% 1.9% 1.8% 1.6% 1.5% 1.3% 1.2% 0.1% 1.1% 1.0% 0.8% 0.7% 0.6% Q1 2014 Q2 2014 Q3 2014 Q4 2014 Q1 2015 Q2 2015 Q3 2015 Q4 2015 Q1 2016 Q2 2016 Q3 2016 Q4 2016 Q1 2017 Q2 2017 Q3 2017 Q4 2017 Q1 2018 Q2 2018 Q3 2018 Q4 2018 (1) 133.5% 2.6% 2.6% 2.4% 2.3% 2.2% 2.0% 1.9% 1.8% 1.6% 1.5% 1.3% 1.2% 0.1% 1.1% 1.0% 0.8% 0.7% 0.6% Q1 2014 Q2 2014 Q3 2014 Q4 2014 Q1 2015 Q2 2015 Q3 2015 Q4 2015 Q1 2016 Q2 2016 Q3 2016 Q4 2016 Q1 2017 Q2 2017 Q3 2017 Q4 2017 Q1 2018 Q2 2018 Q3 2018 Q4 2018 (1) 13
1414

1515

1616

1717
1818

(1) Technomic Top 500 2018 report reflecting 2017 results (2) Represents FY2018 unit counts 19 (3) Based on internal analysis and a study prepared by a leading national consulting firm.(1) Technomic Top 500 2018 report reflecting 2017 results (2) Represents FY2018 unit counts 19 (3) Based on internal analysis and a study prepared by a leading national consulting firm.

(1) 20(1) 20

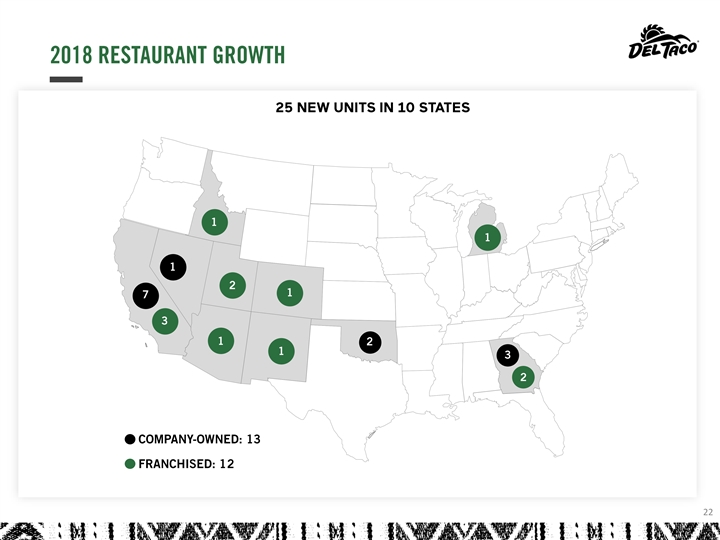
25 20 12 8 15 5 10 6 6 13 12 5 8 6 5 0 2125 20 12 8 15 5 10 6 6 13 12 5 8 6 5 0 21
2222
2323

2424

2525

2626

(3) $75.0 $70.0 $65.0 $60.0 $55.0 $50.0 $45.0 $40.0 (3) 27(3) $75.0 $70.0 $65.0 $60.0 $55.0 $50.0 $45.0 $40.0 (3) 27

2828

$1.60 22% $1.40 21% $1.20 20% 19.5% $1.00 $0.80 19% $0.60 17.2% 18% $0.40 17% $0.20 $0.00 16% 29$1.60 22% $1.40 21% $1.20 20% 19.5% $1.00 $0.80 19% $0.60 17.2% 18% $0.40 17% $0.20 $0.00 16% 29

(millions) 30(millions) 30
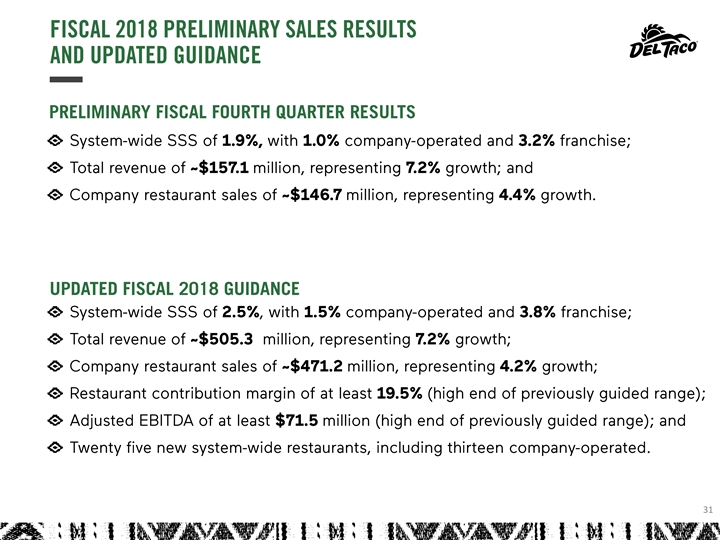
3131

3232

3333

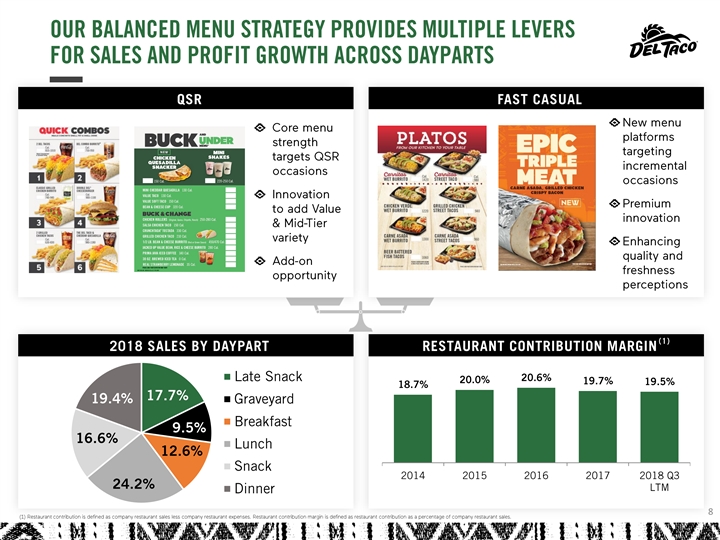
(1) FISCAL 2018 SALES BY DAY-PART BUCK & UNDER FISCAL 2018 TOP INGREDIENTS FISCAL 2018 SALES BY CHANNEL 34(1) FISCAL 2018 SALES BY DAY-PART BUCK & UNDER FISCAL 2018 TOP INGREDIENTS FISCAL 2018 SALES BY CHANNEL 34

Q3 YTD 2018 Q3 YTD 2017 2017 2016 2015 2014 2013 2012 Net income (loss) $13,313 $14,669 $49,871 $20,913 $4,757 $(9,255) $(6,539) $(8,222) : Provision (benefit) for income taxes 4,563 8,955 (15,824) 15,329 852 1,098 80 1,939 Interest expense 5,984 4,798 7,200 6,327 15,143 30,895 35,613 38,291 Depreciation and amortization 17,616 15,903 23,362 23,129 19,525 18,608 19,472 17,082 41,476 44,325 64,609 65,698 40,277 41,346 48,626 49,090 (a) Stock-based compensation expense 4,079 3,340 4,876 4,096 2,030 954 1,290 3,087 (b) Loss (gain) on disposal of assets 760 524 1,075 312 102 (151) 209 35 -- -- -- -- -- (c) 1,661 -- Impairment of long-lived assets 9,617 (d) Restaurant closure charges, net 635 (1) 191 435 2,109 82 298 716 Amortization of favorable and unfavorable (602) (521) (809) (607) (361) 144 378 617 (e) lease assets and liabilities, net -- -- -- -- (f) -- Debt modification costs 217 1,241 4,178 -- -- -- -- (g) Transaction-related costs 731 20,227 1,936 -- -- -- -- -- (h) Change in fair value of warrant liability (35) 1,417 33 (2,634) (i) Pre-opening costs 900 531 1,591 731 642 462 596 1,080 -- -- -- -- -- -- (j) Insurance reserves adjustment 1,800 -- -- -- -- -- (k) -- (523) (220) -- Other income $48,386 $48,198 $71,533 $71,396 $64,988 $58,848 $55,608 $51,991 -- -- -- -- -- -- (l) Pro-rata Adjustment to 52 Weeks (1,122) -- $48,386 $48,198 $71,533 $70,274 $64,988 $58,848 $55,608 $51,991 35Q3 YTD 2018 Q3 YTD 2017 2017 2016 2015 2014 2013 2012 Net income (loss) $13,313 $14,669 $49,871 $20,913 $4,757 $(9,255) $(6,539) $(8,222) : Provision (benefit) for income taxes 4,563 8,955 (15,824) 15,329 852 1,098 80 1,939 Interest expense 5,984 4,798 7,200 6,327 15,143 30,895 35,613 38,291 Depreciation and amortization 17,616 15,903 23,362 23,129 19,525 18,608 19,472 17,082 41,476 44,325 64,609 65,698 40,277 41,346 48,626 49,090 (a) Stock-based compensation expense 4,079 3,340 4,876 4,096 2,030 954 1,290 3,087 (b) Loss (gain) on disposal of assets 760 524 1,075 312 102 (151) 209 35 -- -- -- -- -- (c) 1,661 -- Impairment of long-lived assets 9,617 (d) Restaurant closure charges, net 635 (1) 191 435 2,109 82 298 716 Amortization of favorable and unfavorable (602) (521) (809) (607) (361) 144 378 617 (e) lease assets and liabilities, net -- -- -- -- (f) -- Debt modification costs 217 1,241 4,178 -- -- -- -- (g) Transaction-related costs 731 20,227 1,936 -- -- -- -- -- (h) Change in fair value of warrant liability (35) 1,417 33 (2,634) (i) Pre-opening costs 900 531 1,591 731 642 462 596 1,080 -- -- -- -- -- -- (j) Insurance reserves adjustment 1,800 -- -- -- -- -- (k) -- (523) (220) -- Other income $48,386 $48,198 $71,533 $71,396 $64,988 $58,848 $55,608 $51,991 -- -- -- -- -- -- (l) Pro-rata Adjustment to 52 Weeks (1,122) -- $48,386 $48,198 $71,533 $70,274 $64,988 $58,848 $55,608 $51,991 35
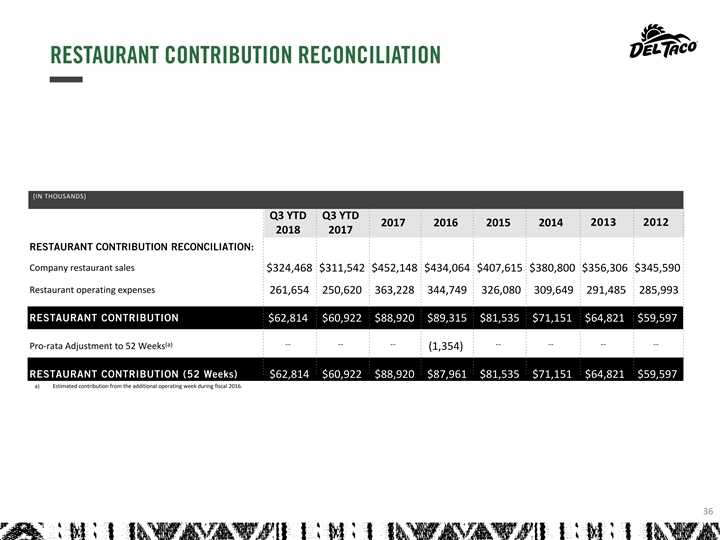
(IN THOUSANDS) Q3 YTD Q3 YTD 2017 2016 2015 2014 2013 2012 2018 2017 Company restaurant sales $324,468 $311,542 $452,148 $434,064 $407,615 $380,800 $356,306 $345,590 Restaurant operating expenses 261,654 250,620 363,228 344,749 326,080 309,649 291,485 285,993 $62,814 $60,922 $88,920 $89,315 $81,535 $71,151 $64,821 $59,597 (a) -- -- -- -- -- -- -- Pro-rata Adjustment to 52 Weeks (1,354) $62,814 $60,922 $88,920 $87,961 $81,535 $71,151 $64,821 $59,597 a) Estimated contribution from the additional operating week during fiscal 2016. 36(IN THOUSANDS) Q3 YTD Q3 YTD 2017 2016 2015 2014 2013 2012 2018 2017 Company restaurant sales $324,468 $311,542 $452,148 $434,064 $407,615 $380,800 $356,306 $345,590 Restaurant operating expenses 261,654 250,620 363,228 344,749 326,080 309,649 291,485 285,993 $62,814 $60,922 $88,920 $89,315 $81,535 $71,151 $64,821 $59,597 (a) -- -- -- -- -- -- -- Pro-rata Adjustment to 52 Weeks (1,354) $62,814 $60,922 $88,920 $87,961 $81,535 $71,151 $64,821 $59,597 a) Estimated contribution from the additional operating week during fiscal 2016. 36