Attached files
| file | filename |
|---|---|
| EX-99.1 - EX-99.1 - NABORS INDUSTRIES LTD | a19-2116_1ex99d1.htm |
| 8-K - 8-K - NABORS INDUSTRIES LTD | a19-2116_18k.htm |
Goldman Sachs Global Energy Conference January 8-9, 2019 Presented by: William Restrepo Chief Financial Officer

Forward-Looking Statements This presentation discusses certain forward-looking statements including new rig technology, rig margin improvement potential, job growth opportunities, cost savings, expectations regarding the performance of our industry, our current and future markets and demand for our products and services, and other statements related to our future performance. Such statements, including statements relating to matters that are not historical facts, are “forward-looking statements” within the meaning of the safe harbor provisions of Section 27A of the Securities Act, as amended, and Section 21E of the Securities Exchange Act of 1934, as amended. These “forward-looking statements” are based on an analysis of currently available competitive, financial and economic data and our operating plans and expectations. They are inherently uncertain and investors should recognize that events and actual results could turn out to be significantly different from our expectations. By way of illustration, when used in this document, words such as “anticipate,” “believe,” “expect,” “plan,” “intend,” “forecast”, “estimate,” “project,” “will,” “should,” “could,” “may,” “predict,” “illustrative,” “hypothetical,” “target” and similar expressions are intended to identify forward-looking statements. Factors to consider when evaluating these forward-looking statements include, but are not limited to: • • • • • • • • • fluctuations and volatility in worldwide prices of and demand for oil and natural gas; fluctuations in levels of oil and natural gas exploration and development activities; fluctuations in the demand for our services; competitive and technological changes and other developments in the oil and gas and oilfield services industries; our ability to renew customer contracts in order to maintain competitiveness; the existence of operating risks inherent in the oil and gas and oilfield services industries; the possibility of the loss of one or a number of our large customers; the impact of long term indebtedness and other financial commitments on our financial and operating flexibility; our access to and the cost of capital, including the impact of a downgrade in our credit rating, covenant restrictions, availability under our unsecured revolving credit facilities, and future issuances of debt or equity securities; our dependence on our operating subsidiaries and investments to meet our financial obligations; our ability to retain skilled employees; our ability to complete, and realize the expected benefits of strategic transactions, including our joint venture in Saudi Arabia and recent acquisition of Tesco Corporation; the recent changes in U.S. tax laws and the possibility of changes in other tax laws and other laws and regulations; the possibility of political or economic instability, civil disturbance, war or acts of terrorism in any of the countries in which we do business; general economic conditions, including the capital and credit markets; and our expectations regarding future trends of EBITDA, net debt and free cash flow. • • • • • • • Our businesses depend, to a large degree, on the level of spending by oil and gas companies for exploration and production activities. Therefore, sustained lower oil or natural gas prices that have a material impact on exploration, development, or production activities could also materially affect our financial position, results of operations, and cash flows. 2
Non-GAAP Financial Measures The above description of risks and uncertainties is by no means all-inclusive, but is designed to highlight what we believe are important factors to consider. For a discussion of these factors and other risks and uncertainties, please refer to our filings with the Securities and Exchange Commission ("SEC"), including those contained in our Annual Reports of Form 10-K and Quarterly Reports on Form 10-Q, which are available at the SEC's website at www.sec.gov. This presentation refers to Net Debt. Net Debt is calculated as Total Debt minus the sum of cash and cash equivalents and short term investments. Net Debt should not be used in isolation or as a substitute for the amounts reported in accordance with generally accepted accounting principles (“GAAP”). Management uses net debt as a measure of our overall liquidity. In addition, securities analysts use this and other measures as some of the metrics on which they analyze our performance. For a reconciliation of Net Debt to Total Debt, which is the most closely comparable GAAP measure, see the Appendix at the end of this presentation. 3
Current Market Environment • WTI crude price weakened to $43-$50 range at end of 2018 • Lower 48 • • • Commodity price drop creates uncertainty within the client base Oil price volatility could lead U.S. customers to scale back investment Leading edge dayrates have stabilized at current attractive levels • International • • • • Land rig market continues to add rigs Leading-edge rig dayrates remain below prior peak Uneven market recovery across major markets Focus on reactivating rigs that require limited capex 4
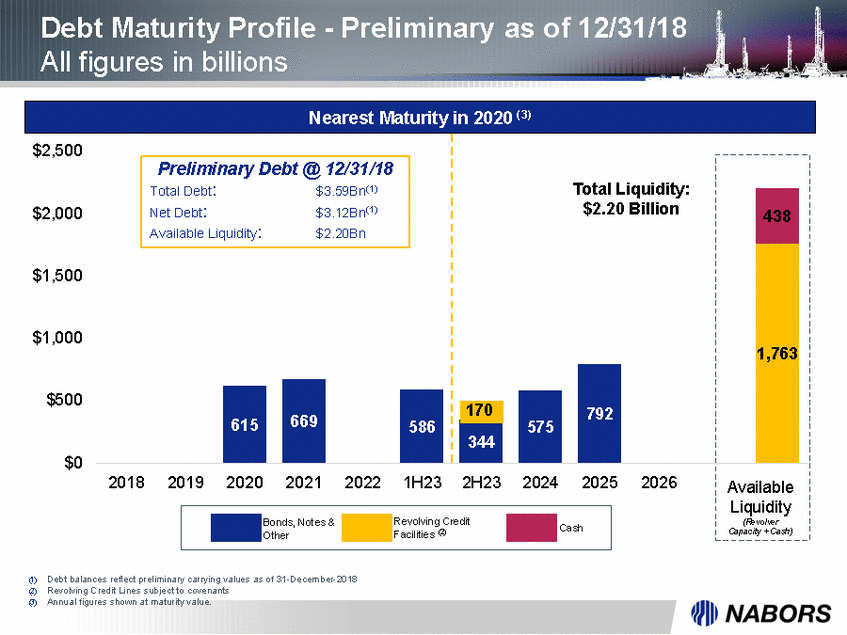
Recent Company Highlights • Lower 48 • • End-of-year rig count at 114 Estimate 4Q daily gross margin above $9,000 • International • • End-of-year rig count at 93 (after sale of Argentina workover rigs) 4Q daily gross margin below third-quarter actual • Net Debt reduction of approximately $230 million included net million from SANAD JV partner and $25 million payment for a acquisition payment of $157 small technology • Preliminary year-end 2018 Net Debt of approximately $3.12 billion, compared to $3.35 billion at 9/30/2018. Total Debt at year-end was approximately $3.59 billion, compared to $3.74 billion at 9/30/2018. • Since the end of 3Q we have redeemed $108 million of senior notes Note, Nabors fourth quarter financials are not yet finalized. The company does not intend for the above metrics to be taken as an indication of GAAP financial results for the fourth quarter. They are only intended to provide investors with advance information on Nabors’ financial position, given investors’ level of interest on that specific issue. Nabors will release its full financial and operational results for the fourth quarter and full year of 2018 in late February.

2019 Priorities Cautious Start to the New Year • Continued focus on cost reductions • Reduce annual combined G&A and R&E expenses by 10% • Target 2019 capital spending to $400 million • Management proposal to reduce quarterly dividend on common shares, beginning with payment in 2Q, to $0.01 per share • Estimate 2019 impact of approximately $54 million • Anticipate $200-$250 million reduction in Net Debt in 2019 6
Key Investment Highlights 1 One of the world’s largest global land drilling fleets 2 Capitalizing on global drilling rebound 3 Differentiated cyclical resilience through International 4 Modern super-spec L48 Fleet 5 Growth and margin expansion through NDS and automation 6 Committed to free cash flow generation and net debt reduction 7 Please refer to the disclaimers on slides 2 and 3 of the presentation deck.
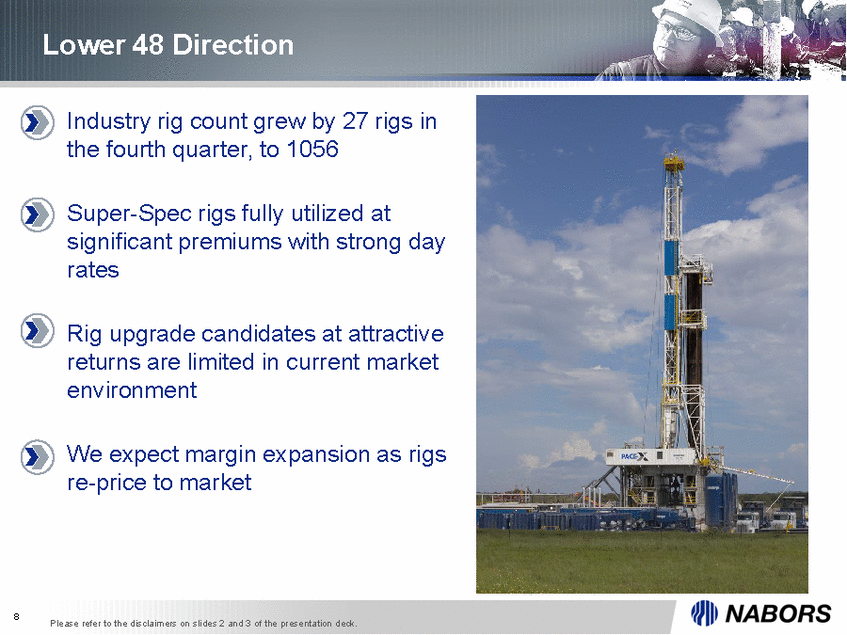
Lower 48 Direction Industry rig count grew by 27 rigs in the fourth quarter, to 1056 • Super-Spec rigs fully utilized at significant premiums with strong day rates • Rig upgrade candidates at attractive returns are limited in current market environment • We expect margin re-price to market expansion as rigs • 8 Please refer to the disclaimers on slides 2 and 3 of the presentation deck.
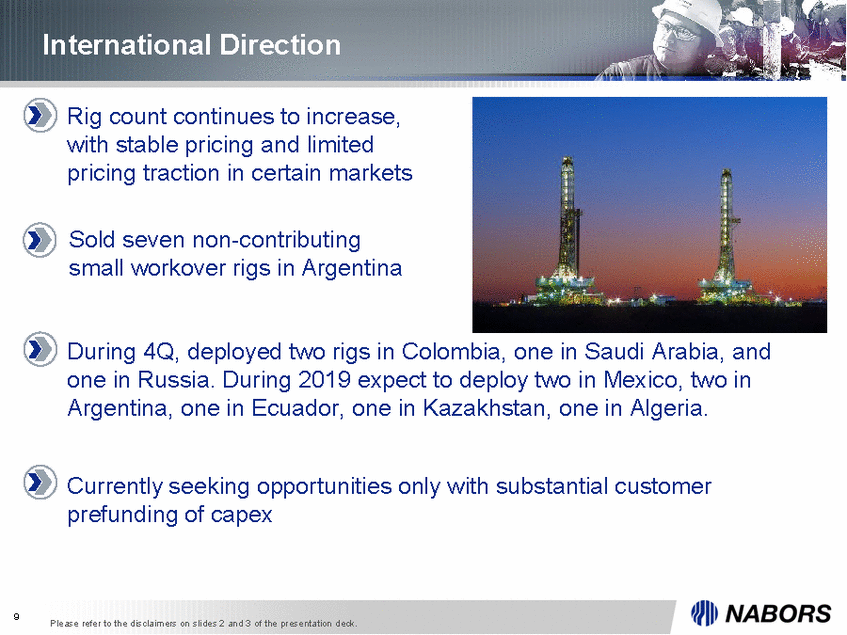
International Direction Rig count continues to increase, with stable pricing and limited pricing traction in certain markets • Sold seven non-contributing small workover rigs in Argentina During 4Q, deployed two rigs in Colombia, one in Saudi Arabia, and one in Russia. During 2019 expect to deploy two in Mexico, two in Argentina, one in Ecuador, one in Kazakhstan, one in Algeria. Currently seeking opportunities prefunding of capex only with substantial customer 9 Please refer to the disclaimers on slides 2 and 3 of the presentation deck.
Debt Maturity Profile - Preliminary as of 12/31/18 All figures in billions Capacity + Cash) (1) Debt balances reflect preliminary carrying values as of 31-December-2018 (2) Revolving Credit Lines subject to covenants (3) Annual figures shown at maturity value. Nearest Maturity in 2020 (3) $2,500 $2,000 $1,500 $1,000 $500 $0 Total Liquidity: $2.20 Billion 438 1,763 792 669 615 586 575 170 344 201820192020202120221H232H23202420252026 Bonds, Notes & Revolving Credit Other Facilities (2)Cash Available Liquidity (Revolver Preliminary Debt @ 12/31/18 Total Debt: $3.59Bn(1) Net Debt: $3.12Bn(1) Available Liquidity: $2.20Bn
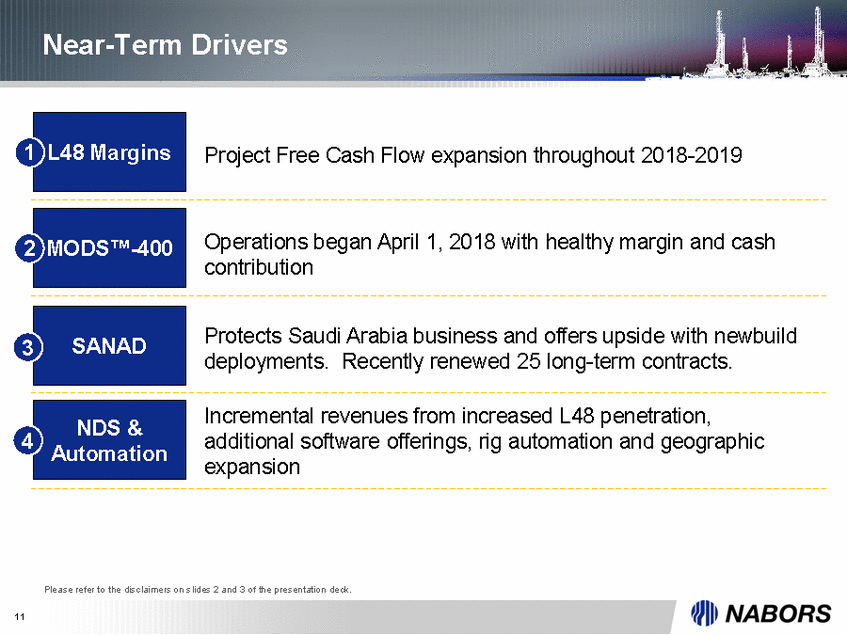
Near-Term Drivers L48 Margins 1 Project Free Cash Flow expansion throughout 2018-2019 Operations began April 1, 2018 with healthy margin and cash contribution 2 MODS™-400 Protects Saudi Arabia business and offers upside with newbuild deployments.Recently renewed 25 long-term contracts. SANAD 3 Incremental revenues from increased L48 penetration, additional software offerings, rig automation and geographic expansion 4 Automation Please refer to the disclaimers on slides 2 and 3 of the presentation deck. 11 NDS &
Appendix 1/JIIl NABORS 12
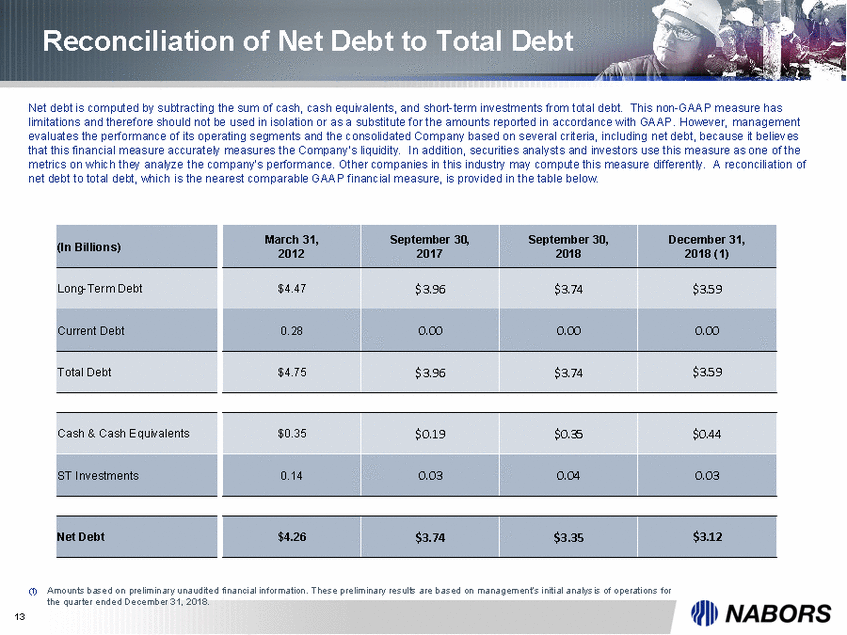
Reconciliation of Net Debt to Total Debt Net debt is computed by subtracting the sum of cash, cash equivalents, and short-term investments from total debt. This non-GAAP measure has limitations and therefore should not be used in isolation or as a substitute for the amounts reported in accordance with GAAP. However, management evaluates the performance of its operating segments and the consolidated Company based on several criteria, including net debt, because it believes that this financial measure accurately measures the Company’s liquidity. In addition, securities analysts and investors use this measure as one of the metrics on which they analyze the company’s performance. Other companies in this industry may compute this measure differently. A reconciliation of net debt to total debt, which is the nearest comparable GAAP financial measure, is provided in the table below. 2012 2017 2018 2018 (1) (1) Amounts based on preliminary unaudited financial information. These preliminary results are based on management’s initial analysis of operations for the quarter ended December 31, 2018. 13 $4.26$3.74$3.35$3.12 Net Debt $0.35$0.19$0.35$0.44 0.140.030.040.03 Cash & Cash Equivalents ST Investments March 31,September 30,September 30,December 31, $4.47$3.96$3.74$3.59 0.280.000.000.00 $4.75$3.96$3.74$3.59 (In Billions) Long-Term Debt Current Debt Total Debt