Attached files
| file | filename |
|---|---|
| 8-K - 8-K - Teladoc Health, Inc. | a19-1308_18k.htm |
Safe harbor This presentation contains, and our officers may make, “forward-looking” statements that are based on our management’s beliefs and assumptions and on information currently available to management. These forward-looking statements include, without limitation, information concerning possible or assumed future results of operations, including descriptions of our business plan and strategies. These statements often include words such as ‘‘anticipate,’’ ‘‘expect,’’ ‘‘suggest,’’ ‘‘plan,’’ ‘‘believe,’’ ‘‘intend,’’ ‘‘estimate,’’ ‘‘target,’’ ‘‘project,’’ ‘‘should,’’ ‘‘could,’’ ‘‘would,’’ ‘‘may,’’ ‘‘will,’’ ‘‘forecast,’’ and other similar expressions. Forward-looking statements involve known and unknown risks, uncertainties, and other factors that may cause our actual results, performance, or achievements to be materially different from any future results, performance, or achievements expressed or implied by the forward-looking statements. These statements are based on certain assumptions that we have made in light of our experience in the industry and our perception of historical trends, current conditions, expected future developments, and other factors we believe are appropriate under the circumstances as of the date hereof. These and other important factors may cause our actual results, performance, or achievements to differ materially from those expressed or implied by these forward-looking statements. Such risks and other factors that may impact management’s beliefs and assumptions are more particularly described in our filings with the U.S. Securities and Exchange Commission (the “SEC”), including under “Item 1A.—Risk Factors” in our Annual Report on Form 10-K for the year ended December 31, 2017, and under similar headings in our subsequently filed Quarterly Reports on Form 10-Q, and could cause our results to differ materially from those expressed in forward-looking statements. As a result, we cannot guarantee future results, outcomes, levels of activity, performance, developments, or achievements, and there can be no assurance that our expectations, intentions, anticipations, beliefs, or projections will result or be achieved or accomplished. The forward-looking statements in this presentation are made only as of the date hereof. Except as required by law, we assume no obligation to update these forward-looking statements, or to update the reasons actual results could differ materially from those anticipated in the forward-looking statements, even if new information becomes available in the future. This presentation also contains estimates and other statistical data made by independent parties and by us relating to market size and growth and other data about our industry. This data involves a number of assumptions and limitations, and you are cautioned not to give undue weight to such estimates. This presentation may include certain non-GAAP financial measured as defined by SEC rules. We believe that the presentation of such non-GAAP financial measures enhances an investor's understanding of our financial performance. We use certain non-GAAP financial measures for business planning purposes and in measuring our performance relative to that of our competitors. For additional information regarding these non-GAAP financial measures, including reconciliations to the most directly comparable financial measure calculated according to GAAP, refer to our Annual Report on Form 10-K for the year ended December 31, 2017 and any subsequently filed Quarterly Reports on Form 10-Q.
Teladoc Health investment highlights Global footprint with significant growth opportunities Industry leader with strong competitive positioning Accelerating utilization rates across populations Compelling financial model The only comprehensive virtual care delivery solution
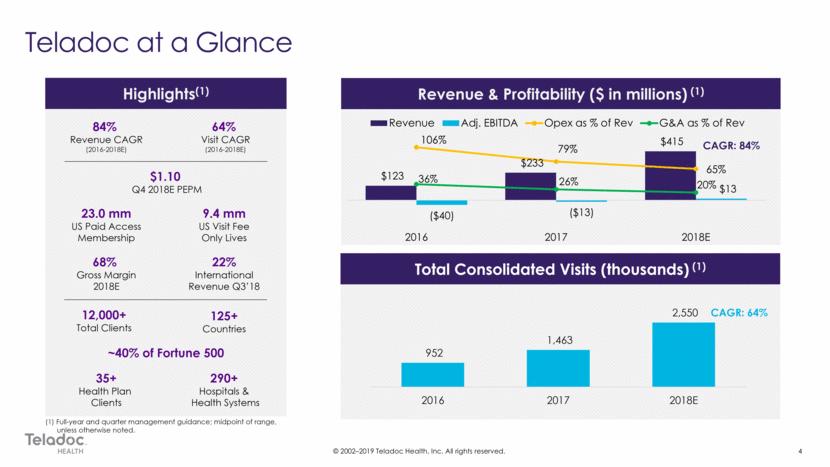
Revenue & Profitability ($ in millions) (1) Total Consolidated Visits (thousands) (1) Highlights(1) Teladoc at a Glance (1) Full-year and quarter management guidance; midpoint of range, unless otherwise noted. 84% Revenue CAGR (2016-2018E) 64% Visit CAGR (2016-2018E) 22% International Revenue Q3’18 35+ Health Plan Clients 290+ Hospitals & Health Systems $1.10 Q4 2018E PEPM ~40% of Fortune 500 12,000+ Total Clients 125+ Countries CAGR: 64% CAGR: 84% 68% Gross Margin 2018E 9.4 mm US Visit Fee Only Lives 23.0 mm US Paid Access Membership 952 1,463 2,550 2016 2017 2018E
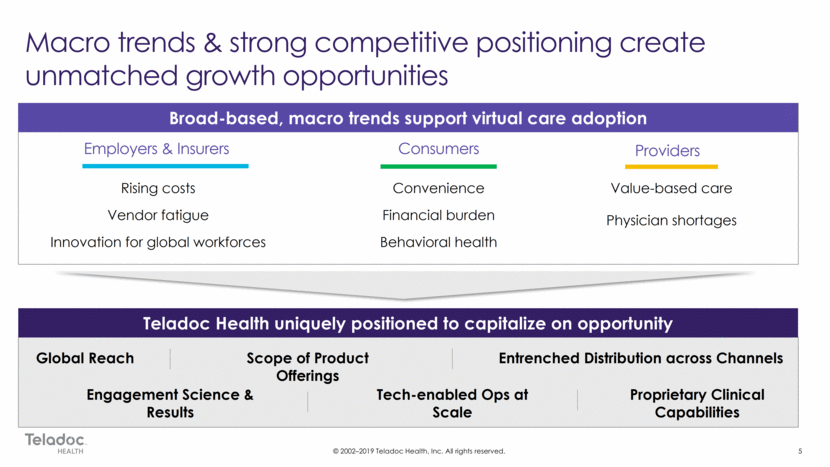
Macro trends & strong competitive positioning create unmatched growth opportunities Rising costs Vendor fatigue Innovation for global workforces Employers & Insurers Convenience Financial burden Behavioral health Consumers Value-based care Physician shortages Providers Broad-based, macro trends support virtual care adoption Teladoc Health uniquely positioned to capitalize on opportunity Global Reach Entrenched Distribution across Channels Scope of Product Offerings Engagement Science & Results Proprietary Clinical Capabilities Tech-enabled Ops at Scale
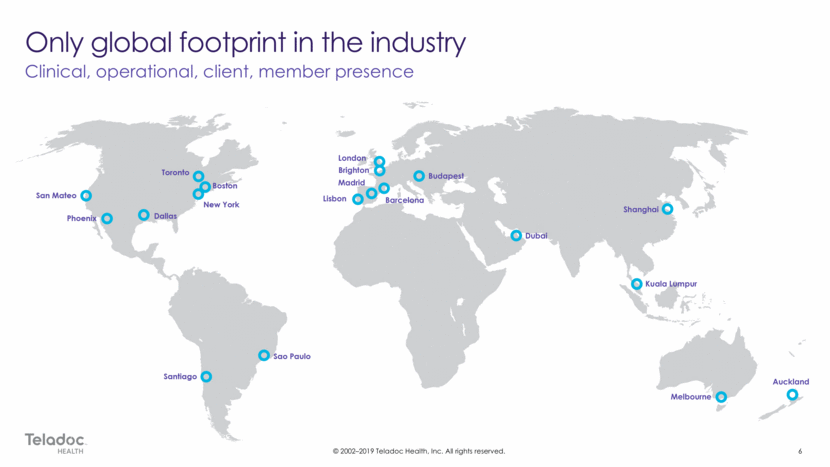
Only global footprint in the industry Clinical, operational, client, member presence San Mateo Phoenix Dallas Toronto Boston New York Sao Paulo Santiago London Brighton Madrid Lisbon Budapest Barcelona Dubai Kuala Lumpur Shanghai Melbourne Auckland
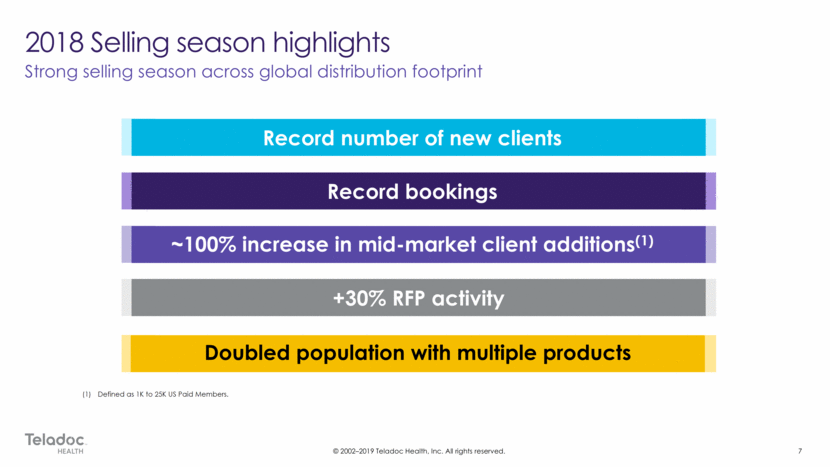
2018 Selling season highlights Strong selling season across global distribution footprint Record bookings Doubled population with multiple products ~100% increase in mid-market client additions(1) +30% RFP activity Defined as 1K to 25K US Paid Members. Record number of new clients
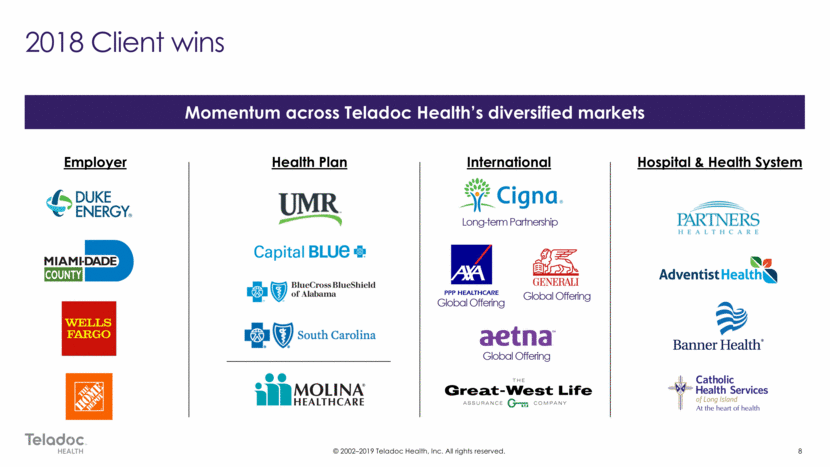
2018 Client wins Momentum across Teladoc Health’s diversified markets Employer Health Plan International Long-term Partnership Global Offering Global Offering Global Offering Hospital & Health System
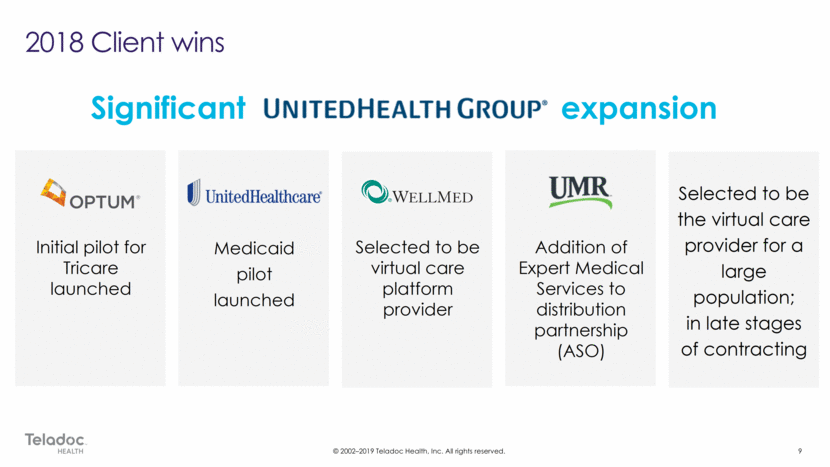
2018 Client wins Significant expansion Selected to be virtual care platform provider Initial pilot for Tricare launched Selected to be the virtual care provider for a large population; in late stages of contracting Addition of Expert Medical Services to distribution partnership (ASO) Medicaid pilot launched
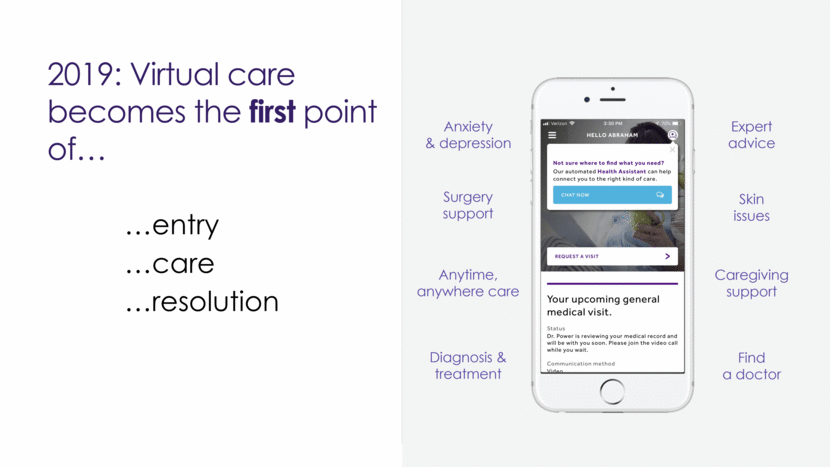
Expert advice Skin issues Caregiving support Find a doctor Anxiety & depression Surgery support Anytime, anywhere care Diagnosis & treatment 2019: Virtual care becomes the first point of entry care resolution
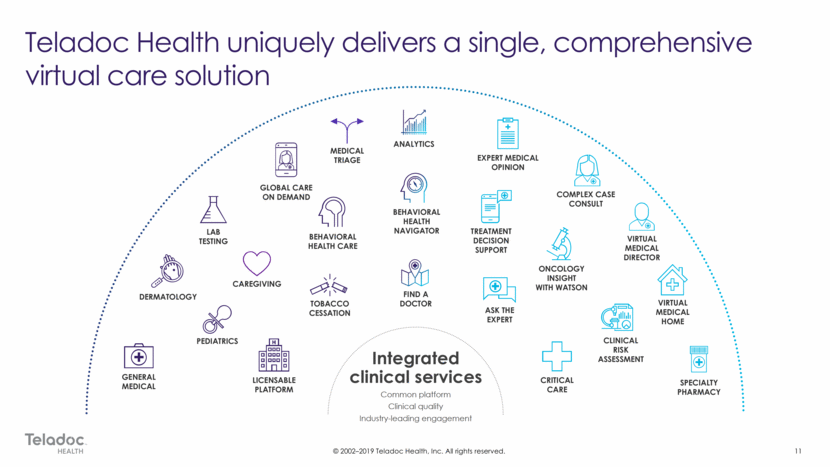
Teladoc Health uniquely delivers a single, comprehensive virtual care solution Integrated clinical services ANALYTICS BEHAVIORAL HEALTH CARE BEHAVIORAL HEALTH NAVIGATOR FIND A DOCTOR LAB TESTING CAREGIVING TOBACCO CESSATION DERMATOLOGY PEDIATRICS GENERAL MEDICAL LICENSABLE PLATFORM GLOBAL CARE ON DEMAND TREATMENT DECISION SUPPORT EXPERT MEDICAL OPINION COMPLEX CASE CONSULT VIRTUAL MEDICAL DIRECTOR VIRTUAL MEDICAL HOME ASK THE EXPERT CLINICAL RISK ASSESSMENT SPECIALTY PHARMACY ONCOLOGY INSIGHT WITH WATSON CRITICAL CARE MEDICAL TRIAGE Common platform Clinical quality Industry-leading engagement
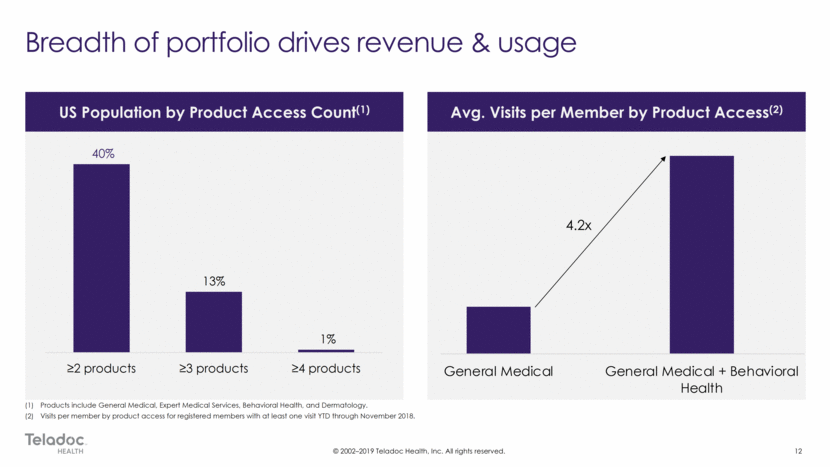
Avg. Visits per Member by Product Access(2) US Population by Product Access Count(1) Breadth of portfolio drives revenue & usage Products include General Medical, Expert Medical Services, Behavioral Health, and Dermatology. Visits per member by product access for registered members with at least one visit YTD through November 2018. 4.2x 40% 13% 1% ?2 products ?3 products ?4 products Ge n e r a l M e d i c a l Ge n e r a l M e d i c a l + B e h a v i o r a l He al t h Ge n e r a l M e d i c a l + B H + D e r m V i s i t s P er M em b er
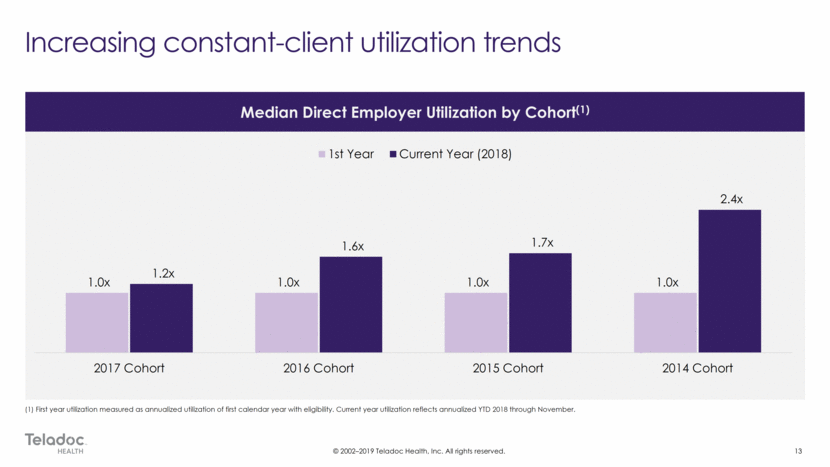
Increasing constant-client utilization trends (1) First year utilization measured as annualized utilization of first calendar year with eligibility. Current year utilization reflects annualized YTD 2018 through November. Median Direct Employer Utilization by Cohort(1) 1.0x 1.0x 1.0x 1.0x 1.2x 1.6x 1.7x 2.4x 2017 Cohort 2016 Cohort 2015 Cohort 2014 Cohort 1st Year Current Year (2018)
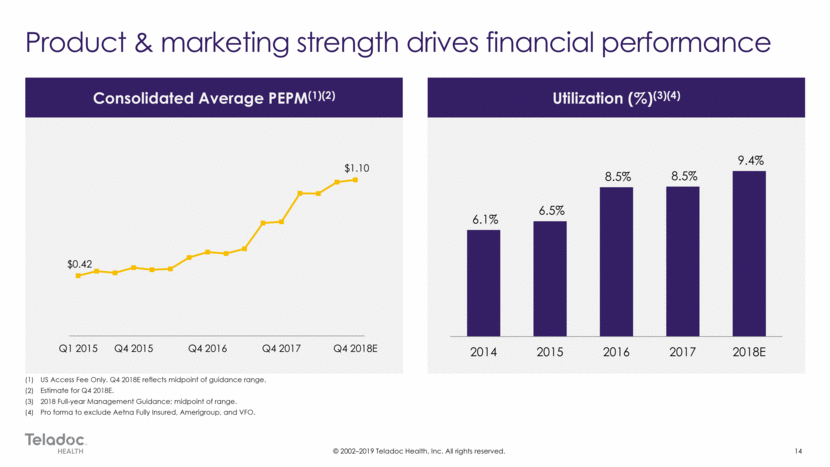
Product & marketing strength drives financial performance Utilization (%)(3)(4) Consolidated Average PEPM(1)(2) US Access Fee Only. Q4 2018E reflects midpoint of guidance range. Estimate for Q4 2018E. 2018 Full-year Management Guidance; midpoint of range. Pro forma to exclude Aetna Fully Insured, Amerigroup, and VFO. 6.1% 6.5% 8.5% 8.5% 9.4% 2014 2015 2016 2017 2018E
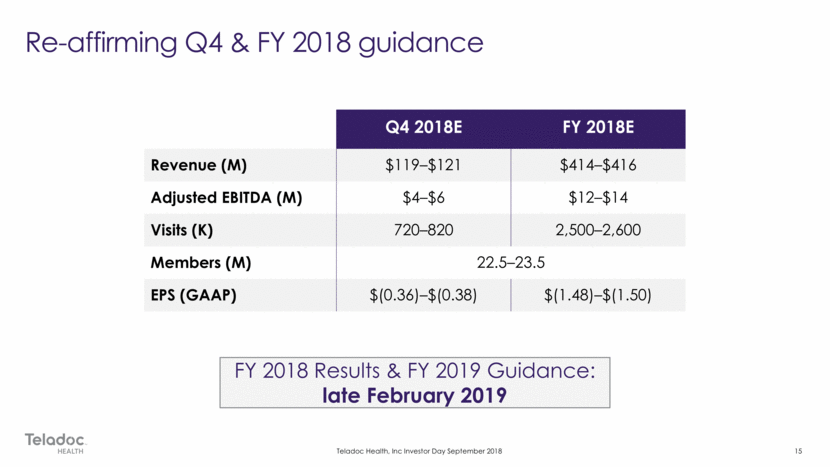
Re-affirming Q4 & FY 2018 guidance Q4 2018E FY 2018E Revenue (M) $119–$121 $414–$416 Adjusted EBITDA (M) $4–$6 $12–$14 Visits (K) 720–820 2,500–2,600 Members (M) 22.5–23.5 EPS (GAAP) $(0.36)–$(0.38) $(1.48)–$(1.50) FY 2018 Results & FY 2019 Guidance: late February 2019
Teladoc Health: Compelling financial model Multiple vectors driving sustainable top-line growth in a large addressable market High degree of visibility into future revenue streams Scalable model Strong & flexible balance sheet – $473 million of cash and marketable securities on balance sheet as of September 30, 2018
