Attached files
| file | filename |
|---|---|
| EX-32.2 - EX-32.2 - Teladoc Health, Inc. | tdoc-20161231ex3229aa087.htm |
| EX-32.1 - EX-32.1 - Teladoc Health, Inc. | tdoc-20161231ex321eb591d.htm |
| EX-31.2 - EX-31.2 - Teladoc Health, Inc. | tdoc-20161231ex312ce0394.htm |
| EX-31.1 - EX-31.1 - Teladoc Health, Inc. | tdoc-20161231ex311cf41a1.htm |
| EX-23.1 - EX-23.1 - Teladoc Health, Inc. | tdoc-20161231ex2317771ce.htm |
| EX-10.19 - EX-10.19 - Teladoc Health, Inc. | tdoc-20161231ex1019c1143.htm |
| EX-10.18 - EX-10.18 - Teladoc Health, Inc. | tdoc-20161231ex10189fbea.htm |
| EX-10.17 - EX-10.17 - Teladoc Health, Inc. | tdoc-20161231ex10179ef15.htm |
| EX-10.16 - EX-10.16 - Teladoc Health, Inc. | tdoc-20161231ex1016aecfc.htm |
UNITED STATES
SECURITIES AND EXCHANGE COMMISSION
Washington, D.C. 20549
Form 10-K
☒ANNUAL REPORT PURSUANT TO SECTION 13 OR 15(d) OF THE SECURITIES EXCHANGE ACT OF 1934
For the year ended December 31, 2016
or
☐TRANSITION REPORT PURSUANT TO SECTION 13 OR 15(d) OF THE SECURITIES EXCHANGE ACT OF 1934
For the transition period from to
Commission File Number: 001-37477
TELADOC, INC.
(Exact name of registrant as specified in its charter)
|
Delaware |
|
04-3705970 |
|
(State of incorporation) |
|
(I.R.S. Employer Identification No.) |
|
|
|
|
|
2 Manhattanville Road, Suite 203 |
|
|
|
Purchase, New York |
|
10577 |
|
(Address of principal executive office) |
|
(Zip code) |
(203) 635-2002
(Registrant’s telephone number including area code)
Securities registered pursuant to Section 12(b) of the Act:
Title of Each Class Name of Each Exchange on Which Registered
Common Stock, par value $0.01 per share The New York Stock Exchange
Securities registered pursuant to Section 12(g) of the Act: Not Applicable
Indicate by check mark if the registrant is a well-known seasoned issuer, as defined in Rule 405 of the Securities Act. Yes ☐ No ☒
Indicate by check mark if the registrant is not required to file reports pursuant to Section 13 or Section 15(d) of the Exchange Act. Yes ☐ No ☒
Indicate by check mark whether the registrant: (1) has filed all reports required,to be filed by Section 13 or 15(d) of the Securities Exchange Act of 1934 during the preceding 12 months (or for such shorter period that the registrant was required to file such reports), and (2) has been subject to such filing requirements for the past 90 days. Yes ☒ No ☐
Indicate by check mark whether the registrant has submitted electronically and posted on its corporate Web site, if any, every Interactive Data File required to be submitted and posted pursuant to Rule 405 of Regulation S-T during the preceding 12 months (or for such shorter period that the registrant was required to submit and post such files). Yes ☒ No ☐
Indicate by check mark if disclosure of delinquent filers pursuant to Item 405 of Regulation S-K is not contained herein, and will not be contained, to the best of registrant’s knowledge, in definitive proxy or information statements incorporated by reference into Part III of this Form 10-K or any amendment to this Form 10-K. ☐
Indicate by check mark whether the registrant is a large accelerated filer, an accelerated filer, a non-accelerated filer, or a smaller reporting company. See the definitions of “large accelerated filer,” “accelerated filer” and “smaller reporting company” in Rule 12b-2 of the Exchange Act. (Check one):
|
Large accelerated filer |
☐ |
Accelerated filer |
☒ |
Non-accelerated filer |
☐ |
Smaller reporting company |
☐ |
|
|
|
|
(Do not check if a smaller reporting company) |
|
|||
Indicate by check mark whether the registrant is a shell company (as defined in Rule 12b-2 of the Exchange Act.) Yes ☐ No ☒
The aggregate market value of the common stock held by non-affiliates as of the last business day of the registrant’s most recently completed second fiscal quarter was approximately $380,301,791. The registrant has no non-voting stock outstanding.
As of February 24, 2017, there were 54,240,193 shares of common stock outstanding.
DOCUMENTS INCORPORATED BY REFERENCE
Portions of the registrant’s definitive proxy statement to be delivered to stockholders in connection with the 2017 annual meeting of stockholders to be held on May 25, 2017 are incorporated by reference in response to Part III of this Report.

THE NATION’S FIRST & LARGEST
TELEHEALTH PLATFORM
24/7/365 ON-DEMAND HEALTHCARE ANYTIME, ANYWHERE
VIA MOBILE DEVICES, INTERNET, VIDEO AND PHONE
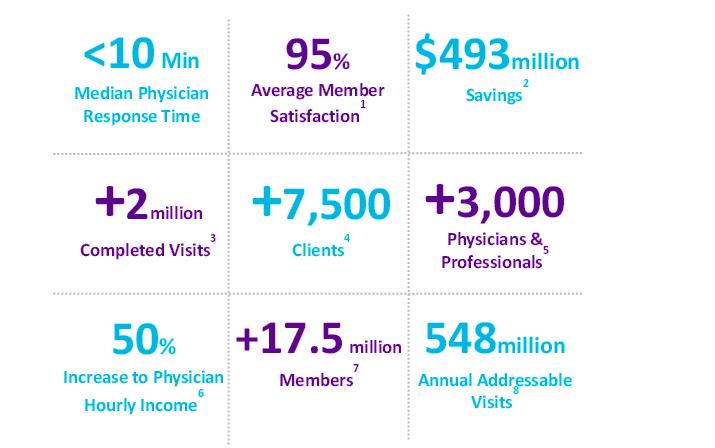
1 Represents average member satisfaction over the last six years
2 Represents average claims savings per visit ($472) based on an independent study completed by Veracity Analytics of several Teladoc Clients
3 Since the inception of the Company
4 As of February 1, 2017
5 Board-certified, state-licensed physicians and behavioral health professionals
6 Based on the ability of a Teladoc physician to earn ~$150/hour which represents a 50%+ increase to the average full-time physician hourly wage
7 As of December 31, 2016
8 Addressable ambulatory visits via Telehealth are 417 million based on a 2000 report from the Centers for Disease Control and Prevention (“CDC”); includes visits in the United States per
year, including those at primary care offices, hospital emergency rooms, outpatient clinics and other settings and methodology described in Oliver Wyman report. Additionally, there are
an estimated 131 million total addressable behavioral health visits via telehealth based on the US Department of Health & Human Services Agency for Healthcare Research and Quality
(“AHRQ”) 2012 report
1
Overview
Teladoc, Inc. is a Delaware corporation that was originally formed in Texas on June 13, 2002 and reincorporated in Delaware on October 16, 2008.
We are the nation’s first and largest telehealth platform, delivering on‑demand healthcare anytime, anywhere, via mobile devices, the Internet, video and phone. Our solution connects consumers, or our Members, with our over 3,000 board‑certified physicians and behavioral health professionals who treat a wide range of conditions and cases from acute diagnoses such as upper respiratory infection, urinary tract infection and sinusitis to dermatological conditions, anxiety and smoking cessation. Over 17.5 million unique Members now benefit from access to Teladoc 24 hours a day, seven days a week, 365 days a year. Our solution is delivered with a median response time of less than ten minutes from the time a Member requests a telehealth visit to the time they speak with a Teladoc physician. We completed approximately 952,000 telehealth visits in 2016. Membership increased by approximately 43% from December 31, 2015 through December 31, 2016.
The Teladoc solution is transforming the access, cost and quality dynamics of healthcare delivery for all of our market participants. Our Members rely on Teladoc to remotely access affordable, on‑demand healthcare whenever and wherever they choose. Employers, health plans and consumers, which we refer to as our Clients, purchase our solution to reduce their healthcare spending while at the same time offering convenient, affordable, high‑quality healthcare to their employees or beneficiaries. Our network of physicians and other healthcare professionals, which we refer to as our Providers, have the ability to generate meaningful income and deliver their services more efficiently with no administrative burden. We believe the value proposition of our solution is evidenced by our overall Member satisfaction rate, which is over 90% over the last eight years. We further believe any consumer, employer or health plan or practitioner interested in a better approach to healthcare is a potential Teladoc Member, Client or Provider.
According to the Centers for Disease Control and Prevention, or the CDC, there are approximately 1.25 billion ambulatory care visits in the United States per year, including those at primary care offices, hospital emergency rooms, outpatient clinics and other settings. We estimate that approximately 417 million, or 33%, of these visits could be treated through telehealth. We believe that the total addressable market for telehealth in the United States consists of the ambulatory care telehealth opportunity, a subset of visits currently delivered in urgent and retail care settings and care foregone by those currently not accessing the healthcare delivery system.
Additionally, according to the US Department of Health and Human Services Agency for Healthcare Research and Quality, or the AHRQ, there are approximately 168 million behavioral health market visits in the United States per year, including only outpatient provider offices. We estimate that approximately 131 million, or 78%, of these visits could be treated through telehealth.
The U.S. healthcare system is experiencing a growing crisis of access, cost and quality of care due to inefficiencies in today’s healthcare system and barriers between participants. According to the National Association of Community Health Centers, or the NACHC, approximately 62 million individuals in the United States currently have no or inadequate access to primary care as a result of physician shortages. Absent convenient access to a primary care physician, individuals will most likely either not seek care at all or visit emergency rooms or urgent care clinics, the most expensive and often inefficient settings for their primary care needs. These market dynamics impact not only the consumers seeking care, but also the health plans and employers that ultimately bear all or a portion of these costs. A 2013 study by Truven Health Analytics that examined insurance claims for emergency room visits found that over 70% of patients received care related to causes that did not require immediate attention, or were addressable or avoidable with proper outpatient care.
Innovators in other industries have solved access, cost and quality inefficiencies through the implementation of technology platforms and business models that deliver products and services on‑demand and create new economies by
2
connecting and empowering both consumers and businesses. We have taken the same approach to solving the pervasive access, cost and quality challenges facing the current healthcare system. Consumers’ ability to access high‑quality, affordable care has been limited by many factors such as physician availability, prohibitive costs, physician office hours and geographic locations. Likewise, burdensome administration, cancellations, reimbursement rates, unfilled appointment slots, geographic constraints and business hour limitations have historically impacted physician efficiency and, as a result, constrained physicians’ income. We believe we have created a platform that is uniquely positioned to bridge the supply and demand gap between physicians and consumers by fundamentally changing the way market participants access and deliver healthcare—eliminating traditional barriers and inefficiencies between participants and empowering them to engage in a healthcare marketplace anytime, anywhere. Our platform provides our Members with access to board‑certified physicians, comprehensive clinical programs and consumer engagement strategies in an economic model that delivers multiple benefits to all participants. The unique combination of these features enables us to dynamically and efficiently match consumer demand and physician availability in real‑time or through advanced scheduling, in various modalities including video, mobile app, web and telephonic connections requested through our member services center.
Our underlying technology platform is complex, deeply integrated and purpose‑built over the last ten years for the evolving healthcare marketplace. Our platform is highly scalable and can support substantial growth in our current membership base. Our platform provides for broad interconnectivity between healthcare constituents and, we believe, uniquely positions us as a focal point in the rapidly evolving healthcare industry to introduce innovative, technology‑based solutions, such as remote patient monitoring, post‑discharge treatment plan adherence and in‑home and chronic care.
We currently serve over 7,500 employers, health plans, health systems and other entities. These Clients collectively purchase access to our solution for more than 17.5 million Members. We believe our business to business to consumer, or B2B2C, distribution strategy is the most efficient method by which to reach consumers and deliver telehealth to our Members. We have over 30 health plans as Clients, including some of the largest in the United States such as Aetna, Blue Shield of California, Blue Cross and Blue Shield of Alabama, Premera Blue Shield and UnitedAd. Health plans serve as Clients as well as distribution channels to self‑insured employer Clients that contract with us through a health plan relationship. Our employer Clients include over 220 Fortune 1000 companies and industry leaders such as Accenture, Bank of America, Pepsi and T-Mobile. We also have a number of health system clients such as Einstein Healthcare Network, Silver Cross Hospital and Craig Hospital. The remainder of our Clients are from channel partners such as brokers, resellers and consultants who sell into a range of small, medium and large enterprises. Over the past two years, we have more than doubled our client and membership bases.
We generate revenue from our Clients on a contractually recurring, per‑Member‑per‑month, subscription access fee basis, which provides us with significant revenue visibility. In addition, under our large Client contracts, we generate additional revenue on a per‑telehealth visit basis, through a visit fee. Subscription access fees are paid by our Clients on behalf of their employees, dependents, beneficiaries or themselves, while visit fees are paid by either Clients or Members. We generated $123.2 million, $77.4 million and $43.5 million in revenue in 2016, 2015 and 2014, respectively, representing 59% and 78% year‑over‑year growth from 2015 to 2016 and from 2014 to 2015, respectively. For both of the years ended December 31, 2016 and 2015, 82% and 18% of our revenue were derived from subscription access fees and visit fees, respectively. For the year ended December 31, 2014, 85% and 15% of our revenue were derived from subscription access fees and visit fees, respectively. Our solution offers our Clients substantial savings opportunities and an attractive return on investment. We recently commissioned Veracity Analytics, an independent healthcare data analytics company, to perform an independent study of several Clients representing nearly 2 million of our Members as of the end of 2016. The study was prepared on behalf of Veracity Analytics and was led by a researcher and physician at a leading research hospital. The study found that these Clients saved $472 on average per visit when its Members received care through Teladoc instead of receiving care in other settings for the same diagnosis. Combined with average employee productivity savings of $46, estimated from data provided by the Bureau of Labor Statistics, we saved our Clients approximately $493 million in healthcare delivery costs in 2016. We believe these results are representative of the value proposition we can provide the broader U.S. healthcare system.
3
Industry Challenges and Our Opportunity
Barriers and inefficiencies in the current U.S. healthcare system present market participants with three major challenges: (i) consumers lack sufficient access to high‑quality, cost‑effective healthcare at appropriate sites of care, while bearing an increasing share of costs; (ii) employers and health plans lack an effective solution that reduces costs while enhancing healthcare access for beneficiaries; and (iii) providers lack flexibility to increase productivity by delivering care on their own terms. Market participants are therefore increasingly unable to effectively and efficiently receive, deliver or administer healthcare. At the same time, the emergence of technology platforms solving massive structural challenges in other industries has highlighted the need for a similar solution in healthcare. We believe there is a significant opportunity to solve these challenges through a trusted solution, such as ours, that matches consumer demand and physician supply in real‑time, while offering health plans and employers an attractive, cost‑effective healthcare alternative for their beneficiaries.
Growing Healthcare Access Crisis for Consumers
Consumers in the United States are experiencing challenges in obtaining access to affordable, high‑quality healthcare at appropriate sites of care. A 2016 study from IHS Markit prepared for the Association of American Medical Colleges found that physician demand continues to grow faster than supply, resulting in a projected total physician shortfall of up to 94,700 physicians by 2025, including a shortage of approximately 36,000 primary care physicians. We believe provider supply is projected to further contract, evidenced by the 2014 Survey of America’s Physicians, where 81% of physicians describe themselves as either over‑extended or at full capacity. According to a 2014 Merritt Hawkins study, the average lead time to see a primary care physician across various metro areas was 19 days. Given expected population growth and aging in the United States, the supply and demand gap for access to healthcare services is expected to further widen, placing additional pressure on an already overburdened healthcare system that lacks physician capacity and diagnoses‑appropriate access points.
This access crisis has resulted in U.S. consumers either seeking care at inappropriate, more costly settings such as hospital emergency rooms, or foregoing needed care entirely. A 2015 survey from the American College of Emergency Physicians found that almost 50% of physicians polled stated that demands for care coordination including emergency department visits are increasing due to increased difficulty in finding or arranging timely follow-up with primary care physicians and/or specialists. In the same survey, 70% of physicians polled also noted that they believe their emergency department is not adequately prepared for potentially substantial increases in patient volume.
Healthcare Cost Burden and Lack of Viable Options for Health Plans and Employers
The U.S. healthcare system is burdened by significant waste and extreme variations in access, cost and quality of care. A recent study published in The Journal of the American Medical Association estimates that approximately $734 billion, or 27%, of all healthcare spending in 2011 was wasted due to factors such as the provision of unnecessary services, inefficient delivery of care and inflated prices. When consumers are forced to seek care at inappropriate and more costly sites of care, those cost inefficiencies impact not only the consumer, but also the health plans and employers that ultimately bear all or a portion of these costs.
The costs and associated burdens on health plans, employers and consumers are only expected to increase. Centers for Medicare and Medicaid Services, or CMS, forecasted U.S. national health expenditures reached $3.1 trillion, or approximately 18% of the U.S. GDP in 2014, and will reach approximately 20% of GDP by 2022. A survey from Milliman in 2016 noted that healthcare costs for an average American family of four exceeded $25,000 in 2016, and have tripled since 2001. A 2013 survey by the National Business Group on Health and Towers Watson indicated that employers bear on average approximately two‑thirds of their employees’ healthcare costs and CMS forecasted U.S. employers spent approximately $660 billion on healthcare in 2015. Despite the significant amount of dollars spent, U.S. healthcare outcomes remain inferior relative to those of many other countries.
The unsustainable levels of spending on healthcare and extreme inefficiencies in the system have driven an increased focus by employers and health plans to control healthcare expenditures. Governments, private insurance companies and self‑insured employers, are implementing meaningful cost containment measures, including shifting
4
financial responsibility to patients through higher co‑pays and deductibles and delivering healthcare through alternative, more cost‑effective methods. The increasing shift of financial responsibility to patients coupled with increased pricing transparency has, in turn, heightened beneficiary focus on healthcare alternatives. According to a 2013 survey for Prudential Insurance by MRops, Inc. and Oxygen Research Inc., 49% of employers are extremely or very likely to eventually offer only high deductible health plans. As consumers take responsibility for a larger share of their healthcare costs and spend more on healthcare services, they are also demanding higher quality care, greater control in how and where they receive care, increased convenience and more service for every dollar spent.
Challenging Environment for Physicians is Constraining Supply
Physicians face declining compensation paired with diminishing productivity due to a combination of reimbursement cuts and an increasing administrative burden. These factors have contributed to physician dissatisfaction and negatively impacted their desire to practice medicine. Medscape’s 2014 Physician Compensation Report shows that 50% of all physicians do not feel fairly compensated and 42% would not choose medicine as their career today.
In response to this growing dissatisfaction, physicians are reducing access to healthcare in a number of different ways. The 2014 Survey of America’s Physicians indicated that 44% of physicians plan to take steps to limit access to their practices, including cutting back on the number of patients seen, working part‑time, closing their practices to new members, seeking non‑clinical jobs or retiring. Notably, 39% of surveyed physicians indicated they plan to accelerate retirement given changes in the healthcare environment. A study by Physicians for a National Health Program showed medical billing paperwork and insurance‑related red tape cost the United States economy approximately $471 billion in 2012, 80% of which was wasted due to inefficiency. These constraints have driven physicians to seek more control over the way they deliver care to new and existing patients, increase their income and reduce the amount of time they spend on administration.
Physicians have responded to these challenges by shifting payment models and patient mix. Medscape’s 2014 Physician Compensation Report showed a 100% increase from 2011 to 2013 in the percent of physicians transitioning to cash‑only models, no longer accepting insurance. A 2014 Merritt Hawkins study found that 54.3% of physicians in the United States’ 15 largest cities are not accepting new Medicaid patients. We believe there is a significant opportunity for a single source solution that addresses these physician needs.
Opportunity to Remove Barriers Through an Innovative Platform that Benefits All Participants
We believe we have a significant opportunity to solve access, cost and quality of care challenges through a platform that matches consumer demand and physician availability in real‑time and in various modalities such as video, web, mobile and telephone, while offering health plans and employers an attractive, cost‑effective alternative for their beneficiaries through our platform. As consumerism in healthcare increases and consumers and providers become accustomed to on‑demand services in other industries, they are similarly demanding technology‑powered solutions for their healthcare needs. The emergence and subsequent rapid adoption of technologies such as big data and analytics, cloud‑based solutions, online video and mobile applications represents an enormous opportunity for healthcare innovation. We believe the confluence of consumer empowerment, emergence of broad technology solutions and focus by all constituents on providing high‑quality, cost‑effective healthcare creates a unique opportunity for a disruptive platform that transforms the way consumers access, providers deliver and employers and health plans administer high‑quality, cost‑efficient healthcare.
Our Competitive Strengths
We believe the following are our key competitive strengths.
Leading Solution and First‑Mover Advantage
Our solution is composed of an integrated technology platform, high‑quality Provider network, sophisticated consumer engagement strategies and entrenched distribution channels. We have developed a strong brand, established strong relationships with Clients and have become a leading telehealth platform in the United States. Our history of
5
innovation and long‑standing operations provide us with a significant first‑mover advantage, including what we believe are the following telehealth industry firsts:
|
· |
Integrated Technology Platform. We were the first to build a scalable, integrated technology platform for telehealth with an API and multiple real‑time payor integrations. Our platform’s application program interface or API, powers external connectivity with a wide range of payors, third‑party applications and other interfaces and uniquely positions us to be a central partner in the rapidly emerging, technology‑powered healthcare industry. |
|
· |
High Quality Provider Network. We were the first to deliver nationwide access to board certified physicians 24 hours a day, seven days a week, 365 days a year and establish over 100 proprietary Evidence Based clinical guidelines specifically designed for telehealth. In addition, we are the first telehealth company that has received certification by the National Committee for Quality Assurance, or the NCQA, an independent, not for profit, healthcare oriented organization founded in 1990 dedicated to improving healthcare quality and verifying adherence to national standards of excellence in the provision of healthcare for our physician credentialing processes. We have implemented the highest credentialing requirements, ensuring quality interactions and reliable resolutions. The NCQA is funded by corporations and foundations who share its goals as well as its sponsors who, in turn, are eligible to receive NCQA progress reports and access to educational seminars. As a not for profit organization, the NCQA relies on these contributions to foster its accreditation and performance measurement initiatives. The NCQA states that it accepts funds from sponsors only for programs or activities that are consistent with NCQA’s mission and in a manner consistent with presenting the credibility and objectivity of its information, priorities, programs and decisions. |
|
· |
Consumer Engagement Strategies. We were the first to implement sophisticated behavioral analytics and predictive modeling to better understand our Members and to drive increased engagement with Teladoc. Our predictive models allow us to identify Members most likely to use our solution and to improve outcomes and serve as the basis of our messaging, which increases the frequency and richness of Member interactions. We were the first to use claims data, plan design and other metrics to influence behavior. For example, we identify Members who have been high utilizers of emergency rooms and urgent care and seek to re‑direct their non‑emergency visits to our lower cost solution. Our consumer engagement strategies are supported by our industry first self‑service communications portals that provide for robust Provider and Member interaction. |
6
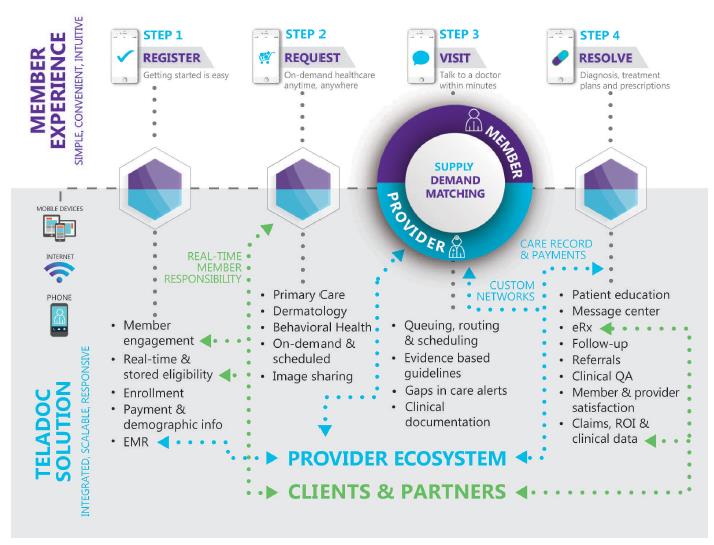
The following graphic outlines the simple, convenient and intuitive Teladoc Member experience supported by our integrated, scalable and responsive solution:
Innovative Technology Platform
Our integrated solution positions us at the center of the patient, provider and payor relationship and as a key participant in the rapidly emerging, technology‑powered healthcare industry. We continually incorporate new product features into our platform to meet the evolving needs of the highly complex healthcare industry. We believe our technology platform contains several differentiating features, including the following:
|
· |
Purpose‑Built. Our platform is built specifically to serve the needs of consumers, employers and health plans and providers. We believe that ours is the only platform that incorporates the core functionality required to offer telehealth in a single system. Our platform features predictive modeling, automated complex routing, queuing and scheduling and is currently capable of supporting 100 million Members. Our ability to scale is supported by our proprietary telehealth algorithms that dynamically and efficiently match our Members’ demand and our Providers’ capacity in real‑time. |
|
· |
Integration and Interoperability. Our fully functional application program interface, or API powers external connectivity, and we have deep integration with other premier healthcare solutions, including electronic prescribing, payment and administration, care coordination and cost transparency. In addition, |
7
we pride ourselves on what we believe is unmatched integration with the payor community that enables us to uniquely provide real‑time eligibility checking, real‑time Member financial liability calculations and clinical data exchange. |
|
· |
Customization for Members, Clients and Providers. Each of our constituents has their own purpose‑built interface. Our Members benefit from the ability to manage their own electronic medical record, or EMR, a secure message center, image upload and sharing capability with Providers, visit scheduling, single sign‑on and fully interoperable native iOs and Android apps. We offer our Clients low implementation effort, custom integrations, interfaces and custom co‑branded landing pages, self‑service portals and robust reporting data. Our Providers benefit from our easy‑to‑use EMR and visit queue, proprietary telehealth guidelines, e‑prescribing and a range of other features and functions such as auto‑complete symptoms, diagnoses and billing codes. |
Highly Scalable Platform
Our platform is highly scalable and can currently provide the same level of Member support and response time for upwards of 20,000 visits per day versus our current rate of approximately 4,000 visits per day on average. Similarly, our platform is currently equipped to serve over 100 million Members and can be scaled quickly to serve even higher volumes. Further, our platform has been built to accommodate the seamless and quick introduction of new services and products, such as behavioral health, dermatology and other services that are currently in the development stages. We have the ability to respond quickly to evolving market needs with innovative solutions, such as mobile applications, biometric devices and at‑home testing, to enhance our solution and support our leadership position. We believe our highly scalable platform provides us with significant growth opportunities within our existing membership and client bases and allows us to grow with low capital expenditure requirements.
Clinical Capabilities Tailored to Telehealth
We believe that by directly recruiting, credentialing, training and contracting with our Providers we have built our clinical capabilities in a manner that supports the operational complexity of and commitment to clinical quality required in telehealth. Our physician Providers are board‑certified with an average of 20 years of experience and are credentialed through an NCQA‑certified process. The NCQA’s accreditation process involves a comprehensive on‑site and off‑site review by a team of physicians and managed care experts that evaluates more than 60 quality‑related healthcare standards, including quality management and improvement and utilization management. The results of the evaluation are reviewed by the NCQA’s National Review Oversight Committee prior to their assigning an accreditation level. The NCQA’s requirements are developed with the input and support of health plans, providers, purchasers, unions and consumer groups. The NCQA’s accreditation process is not telehealth specific; rather, since its formation in 1990, the NCQA established, and consistently updates, its quality standards and performance measures for a broad range of healthcare entities by building consensus around important health care quality issues. In determining its quality standards and performance measures, the NCQA works with large employers, policymakers, doctors, patients and health plans to determine areas of focus and how to promote improvement within them. Health plans in every state, the District of Columbia and Puerto Rico are NCQA accredited. According to the NCQA, these certified plans cover 109 million Americans, or 70.5% of all Americans enrolled in health plans.
Our clinical capabilities are designed specifically for telehealth. For example, our Members have the option to share a record of every visit and their EMR with their existing primary care physicians. In circumstances where a Member reports that they do not have a primary care physician, the Teladoc Provider educates the Member on the importance of establishing this relationship. Prior to every visit, the Provider reviews the Member’s proprietary EMR and certifies to this review by completing a multi‑step checklist. During and following the visit, the Provider may reference our over 100 proprietary Evidence Based clinical guidelines and other telehealth‑specific content. In addition, Members and Providers remain connected following visits. Members receive personalized notes, patient education materials and are able to ask questions of our clinical team via the Teladoc Message Center. Approximately 10% of all physician visits are reviewed by our clinical quality assurance staff to ensure adherence to appropriate treatment and prescription patterns. We believe our track record of zero medical malpractice claims is a testament to our Providers’ clinical quality.
8
Well‑Established Distribution Channels and Strategic Alliances
We have spent over ten years developing sales channels and strategic alliances, which we believe provide an opportunity to sell our solution through trusted partners and are not easily replicated. Our solution is sold through a highly efficient and effective B2B2C distribution network wherein we reach consumers through our Clients and channel partners rather than marketing our solution directly to potential Members. We sell through a direct sales force to our Clients who in turn buy our solution on behalf of their beneficiaries. In addition, a range of third‑parties including brokers, agents, benefits consultants and resellers, whom we refer to as channel partners, sell our solution to various end markets. Notably, many of our health plan Clients also act as channel partners because they resell our solution to their administrative service only or ASO accounts and other customers. We believe the breadth of our distribution strategy allows us to reach employers of nearly every size and in nearly every market, which are capable of purchasing our solution for a large number of beneficiaries, rather than attempting to sell our solution one consumer at a time.
Our Growth Strategies
The following are our key growth strategies.
Expand Our Membership with New and Existing Clients
We intend to increase our membership by adding additional Members from both existing Clients and from new Clients. We plan to execute this strategy by further penetrating existing relationships and by pursuing new relationships through our distribution channels and an expanded sales team. Within existing accounts, we believe our current membership represents only a fraction of the potential Members available to us. Our existing health plan Clients and self‑insured Clients associated with these health plans currently purchase our solution for only a small percentage of their beneficiaries in the aggregate, and we estimate this provides us the opportunity to grow our membership base by more than 50 million individuals by expanding our penetration within our existing Clients alone. Similarly, we have 220 Fortune 1000 Clients, representing a significant opportunity for new Client growth with large employers. We are investing heavily in new marketing technologies and support staff to aid our sales force in penetrating existing accounts, lead generation, new Client generation and implementations. We further believe that as market leader in the telehealth industry, we have a strong, established brand and are uniquely positioned to capitalize on the B2C channel in the future.
Expand into New Clinical Specialties
We currently offer our Clients access to over 3,000 board‑certified physicians and behavioral health professionals who treat a wide range of conditions and cases from acute diagnoses such as upper respiratory infection, urinary tract infection and sinusitis to dermatological conditions. We also currently offer direct‑to‑Member access to behavioral health professionals who treat conditions such as anxiety and depression. We intend to leverage our highly scalable platform by expanding into new clinical specialties, such as second opinions and chronic conditions such as diabetes, and by focusing on expanding our existing services amongst current Clients such as by offering dermatology, tobacco cessation, sexual health testing and behavioral health as a commercial service to our Clients. As we expand our clinical offerings, we intend to further eliminate gaps in continuity of care in order to provide coordinated care along the healthcare delivery continuum. For example, we continue to expand our dermatology, tobacco cessation, sexual health testing and behavioral health product offerings. According to the 2012 white paper from the U.S. Department of Health and Human Services, approximately 46 million adults in the U.S. suffer from mental illness with more than 11 million adults reporting an unmet need for mental healthcare. Compounding this unmet need, the shortage of psychiatrists and behavioral health resources has become acute nationwide. According to a 2014 Merritt Hawkins report, psychiatrists are essentially aging out of the workforce, with over 70% of psychiatrists 50 years of age or older. Furthermore, industry surveys indicate that turnover amongst mental health professionals is significantly higher than that of primary care physicians and in the future, the growing demand for psychiatric services is expected to be addressed by primary care physicians.
9
Leverage Existing Sales Channels and Penetrate New Markets
We have developed a highly effective distribution network to target large employers and we are committing incremental sales and marketing resources to the small medium business or SMB sales channel to increase our penetration within this market. Additionally, we intend to further penetrate the provider market, notably hospitals and group physician practices, as we believe our solution offers these markets an attractive platform from which to generate substantial income by acquiring new patients and to better participate in emerging risk‑sharing and value‑based payment models, such as Accountable Care Organizations and Patient‑Centered Medical Homes.
Expand Across Care Settings and Use Cases
We intend to expand our solution across use cases and additional care settings. We also continually explore ancillary opportunities to broaden our business. We believe our services have wide applicability across new use cases, including home care, post discharge, wellness/screening and chronic care. We are also currently extending or have already offered to our members additional range and functionality of our benefits applications, and will continue to respond quickly to evolving market needs with innovative solutions, including mobile applications, biometric devices and at‑home testing.
Increase Engagement by Our Members
We believe there is significant opportunity within our existing membership base to increase engagement by continually increasing awareness of and loyalty to our solution. We believe our solution can become the single source for on‑demand healthcare for our Members by continuing to add new and complementary products and services, third‑party connections and other strategic alliances. We will continually refine and enhance our user experience, which is a critical driver of new and repeat engagement and we will continue validating our Member satisfaction with surveys and other proactive tools. We are in the process of redesigning aspects of our mobile application and website to further drive Member engagement. We are also building robust data repositories to strengthen our predictive models and multi‑channel marketing strategies to provide a more complete picture of our Members, enhancing our ability to lead targeted and purposeful campaigns and we will continue to invest heavily in marketing technologies that allow us to increase Member touch‑points. Lastly, we will continue to actively engage Clients in benefit design, worksite marketing and executive sponsorship strategies to drive awareness about our solution.
Expand Through Focused Acquisitions
We plan to continue to leverage our know‑how and the scale of our platform to selectively pursue acquisitions. To date, we have completed five acquisitions that have expanded our distribution capabilities and broadened our service offering, including into areas such as behavioral health. Our acquisition strategy is centered on acquiring technologies, products, capabilities, clinical specialties and distribution channels that are highly scalable and rapidly growing. We will continue to evaluate and pursue acquisition opportunities that are complementary to our business.
Technology and Operations
Our integrated platform supports rapid and efficient access to, and evaluation of, information from a variety of healthcare network participants. It has a user‑friendly interface designed to empower Members and dependents to remotely access healthcare whenever and wherever each individual chooses (via mobile devices, the Internet, video and phone).
Our enterprise scale platform is architected for real‑time sharing of clinical and non‑clinical data in real time among the Teladoc constituents, which include: Members, Providers, provider network operations centers staff, nurses, SureScripts for electronic medication prescription writing, routing and fulfillment and health plans for real‑time eligibility checking, real‑time Member financial responsibility calculations, claims processing, clinical summaries and clinical alerts.
10
The Teladoc Provider network leverages our technology platform for managing custom visit queues that automatically and instantly route available visits to appropriate Providers based upon proprietary algorithms. Providers use our Internet‑based application or iOs app for viewing their visit queue, scheduling visits and following the proprietary Teladoc workflow for reviewing Members’ medical history and symptoms, documenting the actual visits, e‑Prescribing, if appropriate, and sending applicable medical content with follow up instructions to the Member via a secure message center.
We use data and analytics to predict demand patterns by geography and we recruit and manage our Provider network to meet the demands of our patients. Our complex algorithms enable us to effectively manage/allocate supply and onboard Providers to meet demand while maintaining one‑hour guaranteed response times, with a median response time of less than ten minutes.
Additionally, our platform’s external connectivity and easy integration with EMR and outside systems extends its functionality and customer features, which include:
|
· |
Client real‑time eligibility and Member financial liability; |
|
· |
clinical alerts, including gaps in care integration; |
|
· |
partner integration and operability; |
|
· |
clinical data exchange (including, biometrics and visit information); and |
|
· |
a fully functional RESTful API. |
REST is a stateless, scalable web services architecture that utilizes open communication standards such as HTTP and HTTPS, and has been widely adopted for system‑to‑system communications. Having a documented set of RESTful API’s enables our Clients and Members to access our solution using a custom or pre‑existing website. For example, a Teladoc health plan Client can offer its Members the ability to access our solution through their existing Member portal. Members can also register for Teladoc, complete their medical history, select a pharmacy and request a consult without having to access the Teladoc Member site. All of these functions are provided via the Client’s website that makes system calls to the Teladoc API to process the requests.
11
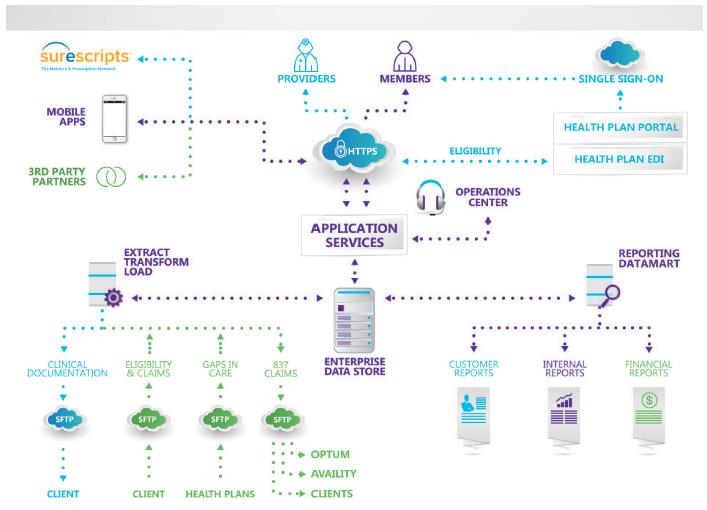
The following graphic displays our robust technology architecture that supports our platform:
We host our applications and serve all of our Members from two redundant data centers in geographically diverse locations. We rely on third‑party vendors to operate these data centers, which are designed to host computer systems that require high levels of availability and have redundant subsystems and compartmentalized security zones. We utilize commercially available hardware for our data center servers. Due to the sensitive nature of our Members and Clients’ data, we have a heightened focus on data security and protection. We have implemented telehealth industry‑standard processes, policies and tools through all levels of our software development and network administration, including regularly scheduled vulnerability scanning and third‑party penetration testing in order to reduce the risk of vulnerabilities in our system. On an annual basis, we also undergo independent, third‑party HIPAA and SSAE 16 audits.
We have achieved over 99% uptime over the last 12 months. Systems are continually monitored for any signs of problems and preemptive action is taken when necessary. Encrypted backup files are transmitted over secure connections to a redundant server storage device in a secondary data center. Our data center facilities employ advanced measures to ensure physical integrity, including redundant power and cooling systems and advanced fire and flood prevention.
We have also successfully grown our business to a level that supports the establishment of two Teladoc‑owned provider network operations centers that we opened in December 2016 and August 2015, respectively. Through these internal operations centers, our employees service Teladoc Members and Clients with expanded customer service and compliance monitoring operations.
12
Sales and Marketing
We sell our services through our direct sales organization. Our direct sales team is comprised of enterprise‑focused field sales professionals who are organized principally by geography and account size. Our field professionals are supported by a sales operations staff, including product technology experts, lead generation professionals and sales data experts. We maintain relationships with key industry participants including benefit consultants, brokers, group purchasing organizations and health plan and hospital partners.
We generate Client leads, accelerate sales opportunities and build brand awareness through our marketing programs. Our marketing programs target human resource, benefits and finance executives in addition to technology and health professionals, senior business leaders and healthcare channel partners. Our principal marketing programs include use of our website to provide information about our company and our solution, as well as learning opportunities for potential Members; demand generation; field marketing events; integrated marketing campaigns (including direct email and online advertising); and participation in industry events, trade shows and conferences.
Clients and Members
Our Clients consist of (i) employers, including 220 Fortune 1000 companies, (ii) health plans and (iii) health systems and other entities. As of December 31, 2016, we had approximately 7,500 Clients and our services reached over 17.5 million Members. The following is a selection of our Clients:
|
· |
employers, such as Accenture, Bank of America, General Mills, Pepsi, and T‑Mobile; |
|
· |
health plans, such as Aetna, Premera, Blue Shield of California, Blue Cross and Blue Shield of Alabama, UnitedAg and Universal American; and |
|
· |
health systems, such as Einstein Healthcare Network, Silver Cross Hospital and Craig Hospital. |
Within existing accounts, we believe our current membership represents only a fraction of the potential Members available to us. For example, our existing health plan Clients and self‑insured Clients associated with these health plans currently purchase our solution for only a small percentage of their beneficiaries in aggregate, reflecting a significant opportunity for membership growth. We believe there are in excess of 50 million potential Members within these existing Clients alone.
Research and Development
Our ability to compete depends, in large part, on our continuous commitment to rapidly introduce new services, technologies, features and functionality. Our product development team, which as of December 31, 2016, consisted of 110 employees, is responsible for the design, development, testing and certification of our solution. In addition, we utilize certain third‑party development services to perform application development and design services. We focus our efforts on developing new products and further enhancing the usability, functionality, reliability, performance and flexibility of our solution.
Competition
We view as our competitors those companies that currently (or in the future will) (i) develop and market telehealth technology (devices and systems) or (ii) provide telehealth, such as the delivery of on‑demand access to healthcare. In the provision of telehealth, competition focuses on, among other factors, experience in operation, customer service, quality of technology and know‑how and reputation. Competitors in the telehealth market include MDLive, Inc., and American Well Corporation, among other smaller industry participants.
13
Physicians and Healthcare Professionals
We contract for our Providers’ services through the Services Agreement with Teladoc Physician Association or Teladoc PA, and, therefore, our Providers are not our employees. Under the Services Agreement, we have agreed to serve, on an exclusive basis, as manager and administrator of Teladoc PA’s non‑medical functions and services related to the provision of the telehealth services by physicians employed by or under contract with Teladoc PA. Teladoc PA has agreed to provide our Members, through its physicians, access to telehealth services and recommended treatment 24 hours per day, 365 days per year. The Services Agreement also requires Teladoc PA to maintain the state licensure and other credentialing requirements of its physicians. The non‑medical functions and services we provide under the Services Agreement primarily include Member management services such as maintaining network operations center for our Members to request a visit with Teladoc PA’s physicians (our Providers), Member billing and collection administration and maintenance and storage of Member medical records. Under the Services Agreement, Teladoc PA currently pays us an access fee of $25,000 per month for network operations center and medical records maintenance, a fixed fee of $65,000 per month for our provision of management and administrative services and a license fee of $10,000 per month for the non‑exclusive use of the Teladoc trade name. Additionally, we are required to maintain, for our company and our employees, general insurance of at least $1.0 million per occurrence and $2.0 million in the aggregate. Similarly, Teladoc PA is required to maintain, for itself and its physicians, professional liability insurance of at least $1.0 million per occurrence and $3.0 million in the aggregate. The Services Agreement has a 20‑year term and expires in February 2025 unless earlier terminated upon mutual agreement of the parties or unilaterally by a party following the commencement of bankruptcy or liquidation proceeds by the non‑terminating party, a material breach of the Services Agreement by the non‑terminating party or a governmental or judicial termination order related to the Services Agreement.
Our Providers are paid promptly, every two weeks via direct deposit or check. Our Providers bear no out‑of‑pocket medical malpractice expenses when delivering care on our platform. Teladoc PA carries professional liability insurance covering $1.0 million per claim and $3.0 million in the aggregate for itself and each of its healthcare professionals (our Providers), and we separately carry a general insurance policy, which covers medical malpractice claims, covering $5.0 million per claim and $5.0 million in the aggregate. We have not had a medical malpractice claim in our over ten‑year operating history.
Government Regulation
The healthcare industry and the practice of medicine are extensively regulated at both the state and federal levels. Our ability to operate profitably will depend in part upon our ability, and that of our affiliated Providers, to maintain all necessary licenses and to operate in compliance with applicable laws and rules. Those laws and rules continue to evolve, and we therefore devote significant resources to monitoring developments in healthcare and medical practice regulation. As the applicable laws and rules change, we are likely to make conforming modifications in our business processes from time to time. In many jurisdictions where we operate, neither our current nor our anticipated business model has been the subject of judicial or administrative interpretation. We cannot be assured that a review of our business by courts or regulatory authorities will not result in determinations that could adversely affect our operations or that the healthcare regulatory environment will not change in a way that restricts our operations.
Provider Licensing, Medical Practice, Certification and Related Laws and Guidelines
The practice of medicine, including the provision of behavioral health services, is subject to various federal, state and local certification and licensing laws, regulations and approvals, relating to, among other things, the adequacy of medical care, the practice of medicine (including the provision of remote care and cross‑coverage practice), equipment, personnel, operating policies and procedures and the prerequisites for the prescription of medication. The application of some of these laws to telehealth is unclear and subject to differing interpretation.
Physicians and behavioral health professionals who provide professional medical or behavioral health services to a patient via telehealth must, in most instances, hold a valid license to practice medicine or to provide behavioral health treatment in the state in which the patient is located. In addition, certain states require a physician providing telehealth to be physically located in the same state as the patient. We have established systems for ensuring that our
14
affiliated physicians and behavioral health professionals are appropriately licensed under applicable state law and that their provision of telehealth to our Members occurs in each instance in compliance with applicable rules governing telehealth. Failure to comply with these laws and regulations could result in our services being found to be non‑reimbursable or prior payments being subject to recoupments and can give rise to civil or criminal penalties.
Corporate Practice of Medicine; Fee‑Splitting
We contract with physicians or physician‑owned professional associations and professional corporations to deliver our services to their patients. We frequently enter into management services contracts with these physicians and physician‑owned professional associations and professional corporations pursuant to which we provide them with billing, scheduling and a wide range of other services, and they pay us for those services out of the fees they collect from patients and third‑party payors. These contractual relationships are subject to various state laws, including those of New York, Texas and California, that prohibit fee‑splitting or the practice of medicine by lay entities or persons and are intended to prevent unlicensed persons from interfering with or influencing the physician’s professional judgment. In addition, various state laws also generally prohibit the sharing of professional services income with nonprofessional or business interests. Activities other than those directly related to the delivery of healthcare may be considered an element of the practice of medicine in many states. Under the corporate practice of medicine restrictions of certain states, decisions and activities such as scheduling, contracting, setting rates and the hiring and management of non‑clinical personnel may implicate the restrictions on the corporate practice of medicine.
State corporate practice of medicine and fee‑splitting laws vary from state to state and are not always consistent among states. In addition, these requirements are subject to broad powers of interpretation and enforcement by state regulators. Some of these requirements may apply to us even if we do not have a physical presence in the state, based solely on our engagement of a Provider licensed in the state or the provision of telehealth to a resident of the state. However, regulatory authorities or other parties, including our Providers, may assert that, despite these arrangements, we are engaged in the corporate practice of medicine or that our contractual arrangements with affiliated physician groups constitute unlawful fee‑splitting. In this event, failure to comply could lead to adverse judicial or administrative action against us and/or our Providers, civil or criminal penalties, receipt of cease‑and‑desist orders from state regulators, loss of Provider licenses, the need to make changes to the terms of engagement of our Providers that interfere with our business and other materially adverse consequences.
Federal and State Fraud and Abuse Laws
Federal Stark Law
We are subject to the federal self‑referral prohibitions, commonly known as the Stark Law. Where applicable, this law prohibits a physician from referring Medicare patients to an entity providing “designated health services” if the physician or a member of such physician’s immediate family has a “financial relationship” with the entity, unless an exception applies. The penalties for violating the Stark Law include the denial of payment for services ordered in violation of the statute, mandatory refunds of any sums paid for such services, civil penalties of up to $15,000 for each violation and twice the dollar value of each such service and possible exclusion from future participation in the federally‑funded healthcare programs. A person who engages in a scheme to circumvent the Stark Law’s prohibitions may be fined up to $100,000 for each applicable arrangement or scheme. The Stark Law is a strict liability statute, which means proof of specific intent to violate the law is not required. In addition, the government and some courts have taken the position that claims presented in violation of the various statutes, including the Stark Law can be considered a violation of the federal False Claims Act (described below) based on the contention that a provider impliedly certifies compliance with all applicable laws, regulations and other rules when submitting claims for reimbursement. A determination of liability under the Stark Law could have a material adverse effect on our business, financial condition and results of operations.
Federal Anti‑Kickback Statute
We are also subject to the federal Anti‑Kickback Statute. The Anti‑Kickback Statute is broadly worded and prohibits the knowing and willful offer, payment, solicitation or receipt of any form of remuneration in return for, or to
15
induce, (i) the referral of a person covered by Medicare, Medicaid or other governmental programs, (ii) the furnishing or arranging for the furnishing of items or services reimbursable under Medicare, Medicaid or other governmental programs or (iii) the purchasing, leasing or ordering or arranging or recommending purchasing, leasing or ordering of any item or service reimbursable under Medicare, Medicaid or other governmental programs. Certain federal courts have held that the Anti‑Kickback Statute can be violated if “one purpose” of a payment is to induce referrals. In addition, a person or entity does not need to have actual knowledge of this statute or specific intent to violate it to have committed a violation, making it easier for the government to prove that a defendant had the requisite state of mind or “scienter” required for a violation. Moreover, the government may assert that a claim including items or services resulting from a violation of the Anti‑Kickback Statute constitutes a false or fraudulent claim for purposes of the False Claims Act, as discussed below. Violations of the Anti‑Kickback Statute can result in exclusion from Medicare, Medicaid or other governmental programs as well as civil and criminal penalties, including fines of $50,000 per violation and three times the amount of the unlawful remuneration. Imposition of any of these remedies could have a material adverse effect on our business, financial condition and results of operations. In addition to a few statutory exceptions, the U.S. Department of Health and Human Services Office of Inspector General, or OIG, has published safe-harbor regulations that outline categories of activities that are deemed protected from prosecution under the Anti‑Kickback Statute provided all applicable criteria are met. The failure of a financial relationship to meet all of the applicable safe harbor criteria does not necessarily mean that the particular arrangement violates the Anti‑Kickback Statute. However, conduct and business arrangements that do not fully satisfy each applicable safe harbor may result in increased scrutiny by government enforcement authorities, such as the OIG.
False Claims Act
Both federal and state government agencies have continued civil and criminal enforcement efforts as part of numerous ongoing investigations of healthcare companies and their executives and managers. Although there are a number of civil and criminal statutes that can be applied to healthcare providers, a significant number of these investigations involve the federal False Claims Act. These investigations can be initiated not only by the government but also by a private party asserting direct knowledge of fraud. These “qui tam” whistleblower lawsuits may be initiated against any person or entity alleging such person or entity has knowingly or recklessly presented, or caused to be presented, a false or fraudulent request for payment from the federal government, or has made a false statement or used a false record to get a claim approved. In addition, the improper retention of an overpayment for 60 days or more is also a basis for a False Claim Act action, even if the claim was originally submitted appropriately. Penalties for False Claims Act violations include fines ranging from $5,500 to $11,000 for each false claim, plus up to three times the amount of damages sustained by the federal government. A False Claims Act violation may provide the basis for exclusion from the federally‑funded healthcare programs. In addition, some states have adopted similar fraud, whistleblower and false claims provisions.
State Fraud and Abuse Laws
Several states in which we operate have also adopted similar fraud and abuse laws as described above. The scope of these laws and the interpretations of them vary from state to state and are enforced by state courts and regulatory authorities, each with broad discretion. Some state fraud and abuse laws apply to items or services reimbursed by any third‑party payor, including commercial insurers, not just those reimbursed by a federally‑funded healthcare program. A determination of liability under such state fraud and abuse laws could result in fines and penalties and restrictions on our ability to operate in these jurisdictions.
Other Healthcare Laws
The federal Health Insurance Portability and Accountability Act of 1996, as amended by the Health Information Technology for Economic and Clinical Health Act, or HITECH, and their implementing regulations, which we collectively refer to as HIPAA, established several separate criminal penalties for making false or fraudulent claims to insurance companies and other non‑governmental payors of healthcare services. Under HIPAA, these two additional federal crimes are: “Healthcare Fraud” and “False Statements Relating to Healthcare Matters.” The Healthcare Fraud statute prohibits knowingly and recklessly executing a scheme or artifice to defraud any healthcare benefit program, including private payors. A violation of this statute is a felony and may result in fines, imprisonment or exclusion from
16
government‑sponsored programs. The False Statements Relating to Healthcare Matters statute prohibits knowingly and willfully falsifying, concealing or covering up a material fact by any trick, scheme or device or making any materially false, fictitious or fraudulent statement in connection with the delivery of or payment for healthcare benefits, items or services. A violation of this statute is a felony and may result in fines or imprisonment. This statute could be used by the government to assert criminal liability if a healthcare provider knowingly fails to refund an overpayment. These provisions are intended to punish some of the same conduct in the submission of claims to private payors as the federal False Claims Act covers in connection with governmental health programs.
In addition, the Civil Monetary Penalties Law imposes civil administrative sanctions for, among other violations, inappropriate billing of services to federally funded healthcare programs and employing or contracting with individuals or entities who are excluded from participation in federally funded healthcare programs. Moreover, a person who offers or transfers to a Medicare or Medicaid beneficiary any remuneration, including waivers of co‑payments and deductible amounts (or any part thereof), that the person knows or should know is likely to influence the beneficiary’s selection of a particular provider, practitioner or supplier of Medicare or Medicaid payable items or services may be liable for civil monetary penalties of up to $10,000 for each wrongful act. Moreover, in certain cases, providers who routinely waive copayments and deductibles for Medicare and Medicaid beneficiaries can also be held liable under the Anti‑Kickback Statute and civil False Claims Act, which can impose additional penalties associated with the wrongful act. One of the statutory exceptions to the prohibition is non‑routine, unadvertised waivers of copayments or deductible amounts based on individualized determinations of financial need or exhaustion of reasonable collection efforts. The OIG emphasizes, however, that this exception should only be used occasionally to address special financial needs of a particular patient. Although this prohibition applies only to federal healthcare program beneficiaries, the routine waivers of copayments and deductibles offered to patients covered by commercial payers may implicate applicable state laws related to, among other things, unlawful schemes to defraud, excessive fees for services, tortious interference with patient contracts and statutory or common law fraud.
State and Federal Health Information Privacy and Security Laws
There are numerous U.S. federal and state laws and regulations related to the privacy and security of personally identifiable information, or PII, including health information. In particular, HIPAA establishes privacy and security standards that limit the use and disclosure of protected health information, or PHI, and require the implementation of administrative, physical, and technical safeguards to ensure the confidentiality, integrity and availability of individually identifiable health information in electronic form. Teladoc, our Providers and our health plan Clients are all regulated as covered entities under HIPAA. Since the effective date of the HIPAA Omnibus Final Rule on September 23, 2013, HIPAA’s requirements are also directly applicable to the independent contractors, agents and other “business associates” of covered entities that create, receive, maintain or transmit PHI in connection with providing services to covered entities. Although we are a covered entity under HIPAA, we are also a business associate of other covered entities when we are working on behalf of our affiliated medical groups.
Violations of HIPAA may result in civil and criminal penalties. The civil penalties range from $100 to $50,000 per violation, with a cap of $1.5 million per year for violations of the same standard during the same calendar year. However, a single breach incident can result in violations of multiple standards. We must also comply with HIPAA’s breach notification rule. Under the breach notification rule, covered entities must notify affected individuals without unreasonable delay in the case of a breach of unsecured PHI, which may compromise the privacy, security or integrity of the PHI. In addition, notification must be provided to the HHS and the local media in cases where a breach affects more than 500 individuals. Breaches affecting fewer than 500 individuals must be reported to HHS on an annual basis. The regulations also require business associates of covered entities to notify the covered entity of breaches by the business associate.
State attorneys general also have the right to prosecute HIPAA violations committed against residents of their states. While HIPAA does not create a private right of action that would allow individuals to sue in civil court for a HIPAA violation, its standards have been used as the basis for the duty of care in state civil suits, such as those for negligence or recklessness in misusing personal information. In addition, HIPAA mandates that HHS conduct periodic compliance audits of HIPAA covered entities and their business associates for compliance. It also tasks HHS with establishing a methodology whereby harmed individuals who were the victims of breaches of unsecured PHI may
17
receive a percentage of the Civil Monetary Penalty fine paid by the violator. In light of the HIPAA Omnibus Final Rule, recent enforcement activity, and statements from HHS, we expect increased federal and state HIPAA privacy and security enforcement efforts.
HIPAA also required HHS to adopt national standards establishing electronic transaction standards that all healthcare providers must use when submitting or receiving certain healthcare transactions electronically. On January 16, 2009, HHS released the final rule mandating that everyone covered by HIPAA must implement ICD‑10 for medical coding on October 1, 2013, which was subsequently extended to October 1, 2015 and is now in effect.
Many states in which we operate and in which our patients reside also have laws that protect the privacy and security of sensitive and personal information, including health information. These laws may be similar to or even more protective than HIPAA and other federal privacy laws. For example, the laws of the State of California, in which we operate, are more restrictive than HIPAA. Where state laws are more protective than HIPAA, we must comply with the state laws we are subject to, in addition to HIPAA. In certain cases, it may be necessary to modify our planned operations and procedures to comply with these more stringent state laws. Not only may some of these state laws impose fines and penalties upon violators, but also some, unlike HIPAA, may afford private rights of action to individuals who believe their personal information has been misused. In addition, state laws are changing rapidly, and there is discussion of a new federal privacy law or federal breach notification law, to which we may be subject.
In addition to HIPAA, state health information privacy and state health information privacy laws, we may be subject to other state and federal privacy laws, including laws that prohibit unfair privacy and security practices and deceptive statements about privacy and security and laws that place specific requirements on certain types of activities, such as data security and texting.
In recent years, there have been a number of well‑publicized data breaches involving the improper use and disclosure of PII and PHI. Many states have responded to these incidents by enacting laws requiring holders of personal information to maintain safeguards and to take certain actions in response to a data breach, such as providing prompt notification of the breach to affected individuals and state officials. In addition, under HIPAA and pursuant to the related contracts that we enter into with our business associates, we must report breaches of unsecured PHI to our contractual partners following discovery of the breach. Notification must also be made in certain circumstances to affected individuals, federal authorities and others.
OTHER INFORMATION
Employees
As of December 31, 2016, we had 670 employees. We consider our relationship with our employees to be good. None of our employees are represented by a labor union or party to a collective bargaining agreement.
Intellectual Property
We own and use trademarks and service marks on or in connection with our services, including both unregistered common law marks and issued trademark registrations in the United States. We also have trademark applications pending to register marks in the United States. In addition, we rely on certain intellectual property rights that we license from third parties and on other forms of intellectual property rights and measures, including trade secrets, know‑how and other unpatented proprietary processes and nondisclosure agreements, to maintain and protect proprietary aspects of our products and technologies. Other than the trademark Teladoc (and design), we do not believe our business is dependent to a material degree on trademarks, patents, copyrights or trade secrets. We require our employees, consultants and certain of our contractors to execute confidentiality and proprietary rights agreements in connection with their employment or consulting relationships with us. We also require our employees and consultants to disclose and assign to us all inventions conceived during the term of their employment or engagement while using our property or which relate to our business.
18
Legal Proceedings
Teladoc is subject to legal proceedings, claims and litigation arising in the ordinary course of its business.
On April 29, 2015, the Company filed a lawsuit against the Texas Medical Board, or the TMB, in the United States District Court for the Western District of Texas, Austin Division, which we refer to as the District Court, alleging that the TMB’s adoption on April 10, 2015 of an amendment to 22 T.A.C. 190.8(1)(L) that would require a prior in-person examination for a doctor validly to prescribe any controlled substance to a patient in Texas constitutes a violation, inter alia, of the Sherman Antitrust Act. The District Court held a hearing on May 22, 2015 on Teladoc’s motion for preliminary injunction of the effectiveness of such amendments, which otherwise was scheduled to take effect on June 3, 2015. On May 29, 2015, the District Court issued the preliminary injunction requested by Teladoc and enjoined the effectiveness of such rule amendment pending trial. On July 30, 2015, the TMB filed a motion to dismiss the suit, and the District Court denied this motion on December 14, 2015. On January 8, 2016, the TMB provided notice of its intent to appeal the District Court’s denial of its motion to dismiss to the U.S. Court of Appeals for the Fifth Circuit, which was filed on June 17, 2016 and voluntarily withdrawn by the TMB on October 17, 2016. On November 2, 2016, the District Court granted the parties’ joint motion to stay the trial case through April 19, 2017. Accordingly, no trial date has been set.
Business in the State of Texas accounted for approximately $15.1 million (or 12%), $12.6 million (or 16%) and $10.0 million (or 23%) of Teladoc’s consolidated revenue during the year ended December 31, 2016, 2015 and 2014, respectively. If the TMB’s proposed rule amendments go into effect as written and Teladoc is unable to adapt its business model in compliance with the revised rules, its ability to operate its business in the State of Texas could be materially adversely affected, which would have a material adverse effect on its business, financial condition and results of operations.
Given the nature and status of the lawsuits described above, Teladoc cannot determine the amount or reasonable range of a potential loss, if any, though it does not believe a material loss is probable in connection with any of the suits. Teladoc routinely assesses all of its litigation and threatened litigation as to the probability of ultimately incurring a liability and records its best estimate of the ultimate loss in situations where it assesses the likelihood of loss as probable and estimable. In this regard, Teladoc establishes accrual estimates for various lawsuits, claims, investigations and proceedings when it is probable that an asset has been impaired or a liability incurred at the date of the financial statements and the loss can be reasonably estimated. At December 31, 2016, Teladoc has established accruals for certain of its lawsuits, claims, investigations and proceedings based upon estimates of the most likely outcome in a range of loss or the minimum amounts in a range of loss if no amount within a range is a more likely estimate. Teladoc does not believe that, at December 31, 2016, any reasonably possible losses in excess of the amounts accrued would be material to the consolidated financial statements.
Seasonality
We typically experience the strongest increases in consecutive quarterly revenue during the fourth and first quarters of each year, which coincides with traditional annual benefit enrollment seasons. In particular, as a result of many Clients’ introduction of new services at the very end of a calendar year, or the start of each calendar year, the majority of our new Client contracts have an effective date of January 1. Additionally, as a result of national seasonal cold and flu trends, we experience our highest level of visit fees during the first and fourth quarters of each year when compared to other quarters of the year. Conversely, the second quarter of the year has historically been the period of lowest utilization of our Provider network services relative to the other quarters of the year. See “Risk Factors—Risks Related to Our Business—Our quarterly results may fluctuate significantly, which could adversely impact the value of our common stock.” included below in this annual report on Form 10-K.
Other
To the extent required by Item 1 of Form 10-K, the information contained in Item 7 of this Annual Report is hereby incorporated by reference in this Item 1.
19
Our financial and operating results are subject to many significant risks and uncertainties, as described below. The following is a summary of the material risks known to us. There may be other material risks of which we are unaware.
Risks Related to Our Business
Our business could be adversely affected by ongoing legal challenges to our business model or by new state actions restricting our ability to provide the full range of our services in certain states.
Our ability to conduct business in each state is dependent upon the state’s treatment of telemedicine (and of remote healthcare delivery in general, such as the permissibility of, and requirements for, physician cross‑coverage practice) under such state’s laws, rules and policies governing the practice of medicine, which are subject to changing political, regulatory and other influences. Cross‑coverage regulation refers to the state rules under which one doctor is permitted to treat the regular patients of another doctor remotely. Some state medical boards have established new rules or interpreted existing rules in a manner that limits or restricts our ability to conduct our business as currently conducted in other states. Some of these actions have resulted in litigation and the suspension of our operations in certain states. See “Legal Proceedings” included above in this Annual Report on Form 10-K.
In addition, during 2014, we voluntarily suspended our business operations in the States of Arkansas and Idaho in response to formal and informal communications among us, our affiliated physicians, and the respective boards of medicine in each state. In each state, the board of medicine took the position that our business model did not meet the state’s applicable legal requirements in order for our affiliated physicians to prescribe medications for our Members. In March 2015, Idaho Governor Otter signed the Idaho Telehealth Access Act, which redefined telehealth services in Idaho in a manner that allowed us to resume operations in Idaho in July 2015. We remain in active discussions with the relevant authorities in Arkansas to demonstrate the safety and benefits inherent to our business. Despite these discussions, we cannot guarantee that we will be able to resume operations in Arkansas.
It is possible that the laws and rules governing the practice of medicine in one or more states may change in a manner analogous to what occurred in Arkansas. If this were to happen, and we were unable to adapt our business model accordingly, our operations in such states would be disrupted, which could have a material adverse effect on our business, financial condition and results of operations.
We are dependent on our relationships with affiliated professional entities, which we do not own, to provide physician services, and our business would be adversely affected if those relationships were disrupted.
There is a risk that state authorities in some jurisdictions may find that our contractual relationships with our physicians violate laws prohibiting the corporate practice of medicine. These laws generally prohibit the practice of medicine by lay persons or entities and are intended to prevent unlicensed persons or entities from interfering with or inappropriately influencing the physician’s professional judgment. The extent to which each state considers particular actions or contractual relationships to constitute improper influence of professional judgment varies across the states and is subject to change and to evolving interpretations by state boards of medicine and state attorneys general, among others. As such, we must monitor our compliance with laws in every jurisdiction in which we operate on an ongoing basis and we cannot guarantee that subsequent interpretation of the corporate practice of medicine laws will not further circumscribe our business operations. State corporate practice of medicine doctrines also often impose penalties on physicians themselves for aiding the corporate practice of medicine, which could discourage physicians from participating in our network of providers.
The corporate practice of medicine prohibition exists in some form, by statute, regulation, board of medicine or attorney general guidance, or case law, in at least 42 states, all of which we operate in, though the broad variation between state application and enforcement of the doctrine makes an exact count difficult. Due to the prevalence of the corporate practice of medicine doctrine, including in the states where we predominantly conduct our business, we contract for Provider services through a services agreement with Teladoc PA, which is a 100% physician‑owned
20
independent entity that has agreements with several professional corporations, to contract with physicians and professional corporations that contract with physicians for the clinical and professional services provided to our Members. See “Business—Physicians and Healthcare Professionals” for a more detailed discussion of the Services Agreement. We do not own Teladoc PA or the professional corporations with which it contracts. Teladoc PA is owned by Dr. Timothy Howard, one of our Providers, and the professional corporations are owned by physicians licensed in their respective states. While we expect that these relationships will continue, we cannot guarantee that they will. A material change in our relationship with Teladoc PA, or among Teladoc PA and the contracted professional corporations, whether resulting from a dispute among the entities, a change in government regulation, or the loss of these affiliations, could impair our ability to provide services to our Members and could have a material adverse effect on our business, financial condition and results of operations. In addition, the arrangement in which we have entered to comply with state corporate practice of medicine doctrines could subject us to additional scrutiny by federal and state regulatory bodies regarding federal and state fraud and abuse laws. Any scrutiny, investigation, or litigation with regard to our arrangement with Teladoc PA could have a material adverse effect on our business, financial condition and results of operations.
Evolving government regulations may require increased costs or adversely affect our results of operations.
In a regulatory climate that is uncertain, our operations may be subject to direct and indirect adoption, expansion or reinterpretation of various laws and regulations. Compliance with these future laws and regulations may require us to change our practices at an undeterminable and possibly significant initial monetary and annual expense. These additional monetary expenditures may increase future overhead, which could have a material adverse effect on our results of operations.
We have identified what we believe are the areas of government regulation that, if changed, would be costly to us. These include: rules governing the practice of medicine by physicians; licensure standards for doctors and behavioral health professionals; laws limiting the corporate practice of medicine; cybersecurity and privacy laws; laws and rules relating to the distinction between independent contractors and employees; and tax and other laws encouraging employer‑sponsored health insurance. There could be laws and regulations applicable to our business that we have not identified or that, if changed, may be costly to us, and we cannot predict all the ways in which implementation of such laws and regulations may affect us.
In the states in which we operate, we believe we are in compliance with all applicable regulations, but, due to the uncertain regulatory environment, certain states may determine that we are in violation of their laws and regulations. In the event that we must remedy such violations, we may be required to modify our services and products in such states in a manner that undermines our solution’s attractiveness to Clients, Members or Providers, we may become subject to fines or other penalties or, if we determine that the requirements to operate in compliance in such states are overly burdensome, we may elect to terminate our operations in such states. In each case, our revenue may decline and our business, financial condition and results of operations could be materially adversely affected.
Additionally, the introduction of new services may require us to comply with additional, yet undetermined, laws and regulations. Compliance may require obtaining appropriate state medical board licenses or certificates, increasing our security measures and expending additional resources to monitor developments in applicable rules and ensure compliance. The failure to adequately comply with these future laws and regulations may delay or possibly prevent some of our products or services from being offered to Clients and Members, which could have a material adverse effect on our business, financial condition and results of operations.
We conduct business in a heavily regulated industry and if we fail to comply with these laws and government regulations, we could incur penalties or be required to make significant changes to our operations or experience adverse publicity, which could have a material adverse effect on our business, financial condition, and results of operations.
The healthcare industry is heavily regulated and closely scrutinized by federal, state and local governments. Comprehensive statutes and regulations govern the manner in which we provide and bill for services and collect
21
reimbursement from governmental programs and private payors, our contractual relationships with our Providers, vendors and Clients, our marketing activities and other aspects of our operations. Of particular importance are:
|
· |
the federal physician self‑referral law, commonly referred to as the Stark Law, that, subject to limited exceptions, prohibits physicians from referring Medicare or Medicaid patients to an entity for the provision of certain “designated health services” if the physician or a member of such physician’s immediate family has a direct or indirect financial relationship (including an ownership interest or a compensation arrangement) with the entity, and prohibit the entity from billing Medicare or Medicaid for such designated health services; |
|
· |
the federal Anti‑Kickback Statute that prohibits the knowing and willful offer, payment, solicitation or receipt of any bribe, kickback, rebate or other remuneration for referring an individual, in return for ordering, leasing, purchasing or recommending or arranging for or to induce the referral of an individual or the ordering, purchasing or leasing of items or services covered, in whole or in part, by any federal healthcare program, such as Medicare and Medicaid. A person or entity does not need to have actual knowledge of the statute or specific intent to violate it to have committed a violation. In addition, the government may assert that a claim including items or services resulting from a violation of the federal Anti‑Kickback Statute constitutes a false or fraudulent claim for purposes of the False Claims Act; |
|
· |
the criminal healthcare fraud provisions of HIPAA and related rules that prohibit knowingly and willfully executing a scheme or artifice to defraud any healthcare benefit program or falsifying, concealing or covering up a material fact or making any material false, fictitious or fraudulent statement in connection with the delivery of or payment for healthcare benefits, items or services. Similar to the federal Anti‑Kickback Statute, a person or entity does not need to have actual knowledge of the statute or specific intent to violate it to have committed a violation; |
|
· |
the federal False Claims Act that imposes civil and criminal liability on individuals or entities that knowingly submit false or fraudulent claims for payment to the government or knowingly making, or causing to be made, a false statement in order to have a false claim paid, including qui tam or whistleblower suits; |
|
· |
reassignment of payment rules that prohibit certain types of billing and collection practices in connection with claims payable by the Medicare or Medicaid programs; |
|
· |
similar state law provisions pertaining to anti‑kickback, self‑referral and false claims issues, some of which may apply to items or services reimbursed by any third‑party payor, including commercial insurers; |
|
· |
state laws that prohibit general business corporations, such as us, from practicing medicine, controlling physicians’ medical decisions or engaging in some practices such as splitting fees with physicians; |
|
· |
laws that regulate debt collection practices as applied to our debt collection practices; |
|
· |
a provision of the Social Security Act that imposes criminal penalties on healthcare providers who fail to disclose or refund known overpayments; |
|
· |
federal and state laws that prohibit providers from billing and receiving payment from Medicare and Medicaid for services unless the services are medically necessary, adequately and accurately documented, and billed using codes that accurately reflect the type and level of services rendered; and |
|
· |
federal and state laws and policies that require healthcare providers to maintain licensure, certification or accreditation to enroll and participate in the Medicare and Medicaid programs, to report certain changes in their operations to the agencies that administer these programs. |
22
Because of the breadth of these laws and the narrowness of the statutory exceptions and safe harbors available, it is possible that some of our business activities could be subject to challenge under one or more of such laws. Achieving and sustaining compliance with these laws may prove costly. Failure to comply with these laws and other laws can result in civil and criminal penalties such as fines, damages, overpayment recoupment loss of enrollment status and exclusion from the Medicare and Medicaid programs. The risk of our being found in violation of these laws and regulations is increased by the fact that many of them have not been fully interpreted by the regulatory authorities or the courts, and their provisions are sometimes open to a variety of interpretations. Our failure to accurately anticipate the application of these laws and regulations to our business or any other failure to comply with regulatory requirements could create liability for us and negatively affect our business. Any action against us for violation of these laws or regulations, even if we successfully defend against it, could cause us to incur significant legal expenses, divert our management’s attention from the operation of our business and result in adverse publicity.
To enforce compliance with the federal laws, the U.S. Department of Justice and the OIG, have recently increased their scrutiny of healthcare providers, which has led to a number of investigations, prosecutions, convictions and settlements in the healthcare industry. Dealing with investigations can be time‑ and resource‑consuming and can divert management’s attention from the business. Any such investigation or settlement could increase our costs or otherwise have an adverse effect on our business. In addition, because of the potential for large monetary exposure under the federal False Claims Act, which provides for treble damages and mandatory minimum penalties of $5,500 to $11,000 per false claim or statement, healthcare providers often resolve allegations without admissions of liability for significant and material amounts to avoid the uncertainty of treble damages that may be awarded in litigation proceedings. Such settlements often contain additional compliance and reporting requirements as part of a consent decree, settlement agreement or corporate integrity agreement. Given the significant size of actual and potential settlements, it is expected that the government will continue to devote substantial resources to investigating healthcare providers’ compliance with the healthcare reimbursement rules and fraud and abuse laws.
The laws, regulations and standards governing the provision of healthcare services may change significantly in the future. We cannot assure you that any new or changed healthcare laws, regulations or standards will not materially adversely affect our business. We cannot assure you that a review of our business by judicial, law enforcement, regulatory or accreditation authorities will not result in a determination that could adversely affect our operations.
We have a history of cumulative losses, which we expect to continue, and we may never achieve or sustain profitability.
We have incurred significant losses in each period since our inception. We incurred net losses of $74.2 million, $58.0 million and $17.0 million for the years ended December 31, 2016, 2015 and 2014, respectively. As of December 31, 2016, we had an accumulated deficit of $204.7 million. These losses and accumulated deficit reflect the substantial investments we made to acquire new Clients, build our proprietary network of healthcare providers and develop our technology platform. We intend to continue scaling our business to increase our client, member and provider bases, broaden the scope of services we offer and expand our applications of technology through which Members can access our services. Accordingly, we anticipate that cost of revenue and operating expenses will increase substantially in the foreseeable future. These efforts may prove more expensive than we currently anticipate and we may not succeed in increasing our revenue sufficiently to offset these higher expenses. We cannot assure you that we will achieve profitability in the future or that, if we do become profitable, we will be able to sustain or increase profitability. Our prior losses, combined with our expected future losses, have had and will continue to have an adverse effect on our stockholders’ equity and working capital. As a result of these factors, we may need to raise additional capital through debt or equity financings in order to fund our operations, and such capital may not be available on reasonable terms, if at all.
The impact of recent healthcare reform legislation and other changes in the healthcare industry and in healthcare spending on us is currently unknown, but may adversely affect our business, financial condition and results of operations.
Our revenue is dependent on the healthcare industry and could be affected by changes in healthcare spending and policy. The healthcare industry is subject to changing political, regulatory and other influences. The Patient
23
Protection and Affordable Care Act or PPACA made major changes in how healthcare is delivered and reimbursed, and increased access to health insurance benefits to the uninsured and underinsured population of the United States.
The PPACA, among other things, increased the number of individuals with Medicaid and private insurance coverage, implemented reimbursement policies that tie payment to quality, facilitated the creation of accountable care organizations that may use capitation and other alternative payment methodologies, strengthened enforcement of fraud and abuse laws and encouraged the use of information technology. Several of these changes require implementing regulations which have not yet been drafted or have been released only as proposed rules.
Such changes in the regulatory environment may also result in changes to our payor mix that may affect our operations and revenue.
In addition, certain provisions of the PPACA authorize voluntary demonstration projects, which include the development of bundling payments for acute, inpatient hospital services, physician services and postacute services for episodes of hospital care. Further, the PPACA may adversely affect payors by increasing medical costs generally, which could have an effect on the industry and potentially impact our business and revenue as payors seek to offset these increases by reducing costs in other areas. The full impact of these changes on us cannot be determined at this time.
We expect that additional state and federal healthcare reform measures will be adopted in the future, any of which could limit the amounts that federal and state governments and other third‑party payors will pay for healthcare products and services, which could adversely affect our business, financial condition and results of operations.
A significant portion of our revenue comes from a limited number of Clients, the loss of which would have a material adverse effect on our business, financial condition and results of operations.
Historically, we have relied on a limited number of Clients for a substantial portion of our total revenue. For the year ended December 31, 2016, 2015 and 2014, no Client represented more than 10% of our total revenue. For the years ended December 31, 2016, 2015 and 2014, our top ten Clients by revenue accounted for 23.9%, 22.9% and 28.1% of our total revenue, respectively. We also rely on our reputation and recommendations from key Clients in order to promote our solution to potential new Clients. The loss of any of our key Clients, or a failure of some of them to renew or expand their subscriptions, could have a significant impact on the growth rate of our revenue, reputation and our ability to obtain new Clients. In addition, mergers and acquisitions involving our Clients could lead to cancellation or non‑renewal of our contracts with those Clients or by the acquiring or combining companies, thereby reducing the number of our existing and potential Clients and Members.
The telehealth market is immature and volatile, and if it does not develop, if it develops more slowly than we expect, if it encounters negative publicity or if our solution does not drive Member engagement, the growth of our business will be harmed.
The telehealth market is relatively new and unproven, and it is uncertain whether it will achieve and sustain high levels of demand, consumer acceptance and market adoption. Our success will depend to a substantial extent on the willingness of our Members to use, and to increase the frequency and extent of their utilization of, our solution, as well as on our ability to demonstrate the value of telehealth to employers, health plans, government agencies and other purchasers of healthcare for beneficiaries. Negative publicity concerning our solution or the telehealth market as a whole could limit market acceptence of our solution. If our Clients and Members do not perceive the benefits of our solution, or if our solution does not drive Member engagement, then our market may not develop at all, or it may develop more slowly than we expect. Similarly, individual and healthcare industry concerns or negative publicity regarding patient confidentiality and privacy in the context of telehealth could limit market acceptance of our healthcare services. If any of these events occurs, it could have a material adverse effect on our business, financial condition or results of operations.
24
If the number of individuals covered by our employer, health plan and other Clients decreases, or the number of applications or services to which they subscribe decreases, our revenue will likely decrease.
Under most of our Client contracts, we base our fees on the number of individuals to whom our Clients provide benefits and the number of applications or services subscribed to by our Clients. Many factors may lead to a decrease in the number of individuals covered by our Clients and the number of applications or services subscribed to by our Clients, including, but not limited to, the following:
|
· |
failure of our Clients to adopt or maintain effective business practices; |
|
· |
changes in the nature or operations of our Clients; |
|
· |
government regulations; and |
|
· |
increased competition or other changes in the benefits marketplace. |
If the number of individuals covered by our employer, health plan and other Clients decreases, or the number of applications or services to which they subscribe decreases, for any reason, our revenue will likely decrease.
Our growth depends in part on the success of our strategic relationships with third parties.
In order to grow our business, we anticipate that we will continue to depend on our relationships with third parties, including our partner organizations and technology and content providers. For example, we partner with a number of price transparency, health savings account, or HSA and other benefits platforms to deliver our solution to their consumers. Identifying partners, and negotiating and documenting relationships with them, requires significant time and resources. Our competitors may be effective in providing incentives to third parties to favor their products or services or to prevent or reduce subscriptions to, or utilization of, our products and services. In addition, acquisitions of our partners by our competitors could result in a decrease in the number of our current and potential Clients, as our partners may no longer facilitate the adoption of our applications by potential Clients. If we are unsuccessful in establishing or maintaining our relationships with third parties, our ability to compete in the marketplace or to grow our revenue could be impaired and our results of operations may suffer. Even if we are successful, we cannot assure you that these relationships will result in increased Client use of our applications or increased revenue.
Our business and growth strategy depend on our ability to maintain and expand a network of qualified Providers. If we are unable to do so, our future growth would be limited and our business, financial condition and results of operations would be harmed.
Our success is dependent upon our continued ability to maintain a network of qualified Providers. If we are unable to recruit and retain board‑certified physicians and other healthcare professionals, it would have a material adverse effect on our business and ability to grow and would adversely affect our results of operations. In any particular market, Providers could demand higher payments or take other actions that could result in higher medical costs, less attractive service for our Clients or difficulty meeting regulatory or accreditation requirements. Our ability to develop and maintain satisfactory relationships with Providers also may be negatively impacted by other factors not associated with us, such as changes in Medicare and/or Medicaid reimbursement levels and other pressures on healthcare providers and consolidation activity among hospitals, physician groups and healthcare providers. The failure to maintain or to secure new cost‑effective Provider contracts may result in a loss of or inability to grow our membership base, higher costs, healthcare provider network disruptions, less attractive service for our Clients and/or difficulty in meeting regulatory or accreditation requirements, any of which could have a material adverse effect on our business, financial condition and results of operations.
25
We may become subject to medical liability claims, which could cause us to incur significant expenses and may require us to pay significant damages if not covered by insurance.
Our business entails the risk of medical liability claims against both our Providers and us. Although we and Teladoc PA carry insurance covering medical malpractice claims in amounts that we believe are appropriate in light of the risks attendant to our business, successful medical liability claims could result in substantial damage awards that exceed the limits of our and Teladoc PA’s insurance coverage. Teladoc PA carries professional liability insurance covering $1.0 million per claim and $3.0 million in the aggregate for itself and each of its healthcare professionals (our Providers), and we separately carry a general insurance policy, which covers medical malpractice claims, covering $5.0 million per claim and $5.0 million in the aggregate. In addition, professional liability insurance is expensive and insurance premiums may increase significantly in the future, particularly as we expand our services. As a result, adequate professional liability insurance may not be available to our Providers or to us in the future at acceptable costs or at all.
Any claims made against us that are not fully covered by insurance could be costly to defend against, result in substantial damage awards against us and divert the attention of our management and our Providers from our operations, which could have a material adverse effect on our business, financial condition and results of operations. In addition, any claims may adversely affect our business or reputation.
Rapid technological change in our industry presents us with significant risks and challenges.
The telehealth market is characterized by rapid technological change, changing consumer requirements, short product lifecycles and evolving industry standards. Our success will depend on our ability to enhance our solution with next‑generation technologies and to develop or to acquire and market new services to access new consumer populations. There is no guarantee that we will possess the resources, either financial or personnel, for the research, design and development of new applications or services, or that we will be able to utilize these resources successfully and avoid technological or market obsolescence. Further, there can be no assurance that technological advances by one or more of our competitors or future competitors will not result in our present or future applications and services becoming uncompetitive or obsolete.
A decline in the prevalence of employer‑sponsored healthcare or the emergence of new technologies may render our solution obsolete or require us to expend significant resources in order to remain competitive.
The U.S. healthcare industry is massive, with a number of large market participants with conflicting agendas, is subject to significant government regulation and is currently undergoing significant change. Changes in our industry, for example, away from high‑deductible health plans, or the emergence of new technologies as more competitors enter our market, could result in our solution being less desirable or relevant.
For example, we currently derive the majority of our revenue from sales to Clients that purchase healthcare for their employees (either via insurance or self‑funded benefit plans). A large part of the demand for our solution depends on the need of these employers to manage the costs of healthcare services that they pay on behalf of their employees. Some experts have predicted that the PPACA will encourage employer‑sponsored health insurance to become significantly less prevalent as employees migrate to obtaining their own insurance over the state‑sponsored insurance marketplaces. Were this to occur, there is no guarantee that we would be able to compensate for the loss in revenue from employers by increasing sales of our solution to health insurance companies or to individuals or government agencies. In such a case, our results of operations would be adversely affected.
If healthcare benefits trends shift or entirely new technologies are developed that replace existing solutions, our existing or future solutions could be rendered obsolete and our business could be adversely affected. In addition, we may experience difficulties with software development, industry standards, design or marketing that could delay or prevent our development, introduction or implementation of new applications and enhancements.
26
If our new applications and services are not adopted by our Clients, or if we fail to innovate and develop new applications and services that are adopted by our Clients, our revenue and results of operations will be adversely affected.
To date, we have derived a substantial majority of our revenue from sales of our primary care telehealth solution, and our longer‑term results of operations and continued growth will depend on our ability successfully to develop and market new applications and services that our Clients want and are willing to purchase. In addition, we have invested, and will continue to invest, significant resources in research and development to enhance our existing solution and introduce new high‑quality applications and services. If existing Clients are not willing to make additional payments for such new applications, or if new Clients and Members do not value such new applications, it could have a material adverse effect on our business, financial condition and results of operations. If we are unable to predict user preferences or if our industry changes, or if we are unable to modify our solution and services on a timely basis, we may lose Clients. Our results of operations would also suffer if our innovations are not responsive to the needs of our Clients, appropriately timed with market opportunity or effectively brought to market.
We rely on data center providers, Internet infrastructure, bandwidth providers, third‑party computer hardware and software, other third parties and our own systems for providing services to our Clients and Members, and any failure or interruption in the services provided by these third parties or our own systems could expose us to litigation and negatively impact our relationships with Clients, adversely affecting our brand and our business.
We serve all of our Clients and Members from two data centers, one located in Lewisville, Texas and the other located in the Metro New York City area. While we control and have access to our servers, we do not control the operation of these facilities. The owners of our data center facilities have no obligation to renew their agreements with us on commercially reasonable terms, or at all. If we are unable to renew these agreements on commercially reasonable terms, or if one of our data center operators is acquired, we may be required to transfer our servers and other infrastructure to new data center facilities, and we may incur significant costs and possible service interruption in connection with doing so. Problems faced by our third‑party data center locations with the telecommunications network providers with whom we or they contract or with the systems by which our telecommunications providers allocate capacity among their clients, including us, could adversely affect the experience of our Clients and Members. Our third‑party data center operators could decide to close their facilities without adequate notice. In addition, any financial difficulties, such as bankruptcy faced by our third‑party data centers operators or any of the service providers with whom we or they contract may have negative effects on our business, the nature and extent of which are difficult to predict.
Additionally, if our data centers are unable to keep up with our growing needs for capacity, this could have an adverse effect on our business. For example, a rapid expansion of our business could affect the service levels at our data centers or cause such data centers and systems to fail. Any changes in third‑party service levels at our data centers or any disruptions or other performance problems with our solution could adversely affect our reputation and may damage our Clients and Members’ stored files or result in lengthy interruptions in our services. Interruptions in our services may reduce our revenue, cause us to issue refunds to Clients for prepaid and unused subscriptions, subject us to potential liability or adversely affect Client renewal rates.
In addition, our ability to deliver our Internet‑based services depends on the development and maintenance of the infrastructure of the Internet by third parties. This includes maintenance of a reliable network backbone with the necessary speed, data capacity, bandwidth capacity and security. Our services are designed to operate without interruption in accordance with our service level commitments. However, we have experienced and expect that we may experience future interruptions and delays in services and availability from time to time. In the event of a catastrophic event with respect to one or more of our systems, we may experience an extended period of system unavailability, which could negatively impact our relationship with Clients and Members. To operate without interruption, both we and our service providers must guard against:
|
· |
damage from fire, power loss, natural disasters and other force majeure events outside our control; |
|
· |
communications failures; |
27
|
· |
software and hardware errors, failures and crashes; |
|
· |
security breaches, computer viruses, hacking, denial‑of‑service attacks and similar disruptive problems; and |
|
· |
other potential interruptions. |
We also rely on computer hardware purchased or leased and software licensed from third parties in order to offer our services, including software from Dell Computer and Redhat Corporation, and routers and network equipment from Cisco and Hewlett‑Packard Company. These licenses are generally commercially available on varying terms. However, it is possible that this hardware and software may not continue to be available on commercially reasonable terms, or at all. Any loss of the right to use any of this hardware or software could result in delays in the provisioning of our services until equivalent technology is either developed by us, or, if available, is identified, obtained and integrated.
We exercise limited control over third‑party vendors, which increases our vulnerability to problems with technology and information services they provide. Interruptions in our network access and services may in connection with third‑party technology and information services reduce our revenue, cause us to issue refunds to Clients for prepaid and unused subscription services, subject us to potential liability or adversely affect Client renewal rates. Although we maintain a $5.0 million security and privacy damages policy, the coverage under our policies may not be adequate to compensate us for all losses that may occur related to the services provided by our third‑party vendors. In addition, we may not be able to continue to obtain adequate insurance coverage at an acceptable cost, if at all.
We could incur substantial costs as a result of any claim of infringement of another party’s intellectual property rights.
In recent years, there has been significant litigation in the United States involving patents and other intellectual property rights. Companies in the Internet and technology industries are increasingly bringing and becoming subject to suits alleging infringement of proprietary rights, particularly patent rights, and our competitors and other third parties may hold patents or have pending patent applications, which could be related to our business. These risks have been amplified by the increase in third parties, which we refer to as non‑practicing entities, whose sole primary business is to assert such claims. Regardless of the merits of any other intellectual property litigation, we may be required to expend significant management time and financial resources on the defense of such claims, and any adverse outcome of any such claim or the above referenced review could have a material adverse effect on our business, financial condition or results of operations. We expect that we may receive in the future notices that claim we or our Clients using our solution have misappropriated or misused other parties’ intellectual property rights, particularly as the number of competitors in our market grows and the functionality of applications amongst competitors overlaps. Our existing or any future litigation, whether or not successful, could be extremely costly to defend, divert our management’s time, attention and resources, damage our reputation and brand and substantially harm our business.
In addition, in most instances, we have agreed to indemnify our Clients against certain third‑party claims, which may include claims that our solution infringes the intellectual property rights of such third parties. Our business could be adversely affected by any significant disputes between us and our Clients as to the applicability or scope of our indemnification obligations to them. The results of any intellectual property litigation to which we may become a party, or for which we are required to provide indemnification, may require us to do one or more of the following:
|
· |
cease offering or using technologies that incorporate the challenged intellectual property; |
|
· |
make substantial payments for legal fees, settlement payments or other costs or damages; |
|
· |
obtain a license, which may not be available on reasonable terms, to sell or use the relevant technology; or |
|
· |
redesign technology to avoid infringement. |
28
If we are required to make substantial payments or undertake any of the other actions noted above as a result of any intellectual property infringement claims against us or any obligation to indemnify our Clients for such claims, such payments or costs could have a material adverse effect on our business, financial condition and results of operations.
If our arrangements with our Providers or our Clients are found to violate state laws prohibiting the corporate practice of medicine or fee splitting, our business, financial condition and our ability to operate in those states could be adversely impacted.
The laws of many states, including states in which our Clients are located, prohibit us from exercising control over the medical judgments or decisions of physicians and from engaging in certain financial arrangements, such as splitting professional fees with physicians. These laws and their interpretations vary from state to state and are enforced by state courts and regulatory authorities, each with broad discretion. We enter into agreements with a professional association, Teladoc PA, which enters into contracts with our Providers pursuant to which they render professional medical services. In addition, we enter into contracts with our Clients to deliver professional services in exchange for fees. These contracts include management services agreements with our affiliated physician organizations pursuant to which the physician organizations reserve exclusive control and responsibility for all aspects of the practice of medicine and the delivery of medical services. Although we seek to substantially comply with applicable state prohibitions on the corporate practice of medicine and fee splitting, state officials who administer these laws or other third parties may successfully challenge our existing organization and contractual arrangements. If such a claim were successful, we could be subject to civil and criminal penalties and could be required to restructure or terminate the applicable contractual arrangements. A determination that these arrangements violate state statutes, or our inability to successfully restructure our relationships with our Providers to comply with these statutes, could eliminate Clients located in certain states from the market for our services, which would have a materially adverse effect on our business, financial condition and results of operations.
If our Providers are characterized as employees, we would be subject to employment and withholding liabilities.
We structure our relationships with our Providers in a manner that we believe results in an independent contractor relationship, not an employee relationship. An independent contractor is generally distinguished from an employee by his or her degree of autonomy and independence in providing services. A high degree of autonomy and independence is generally indicative of a contractor relationship, while a high degree of control is generally indicative of an employment relationship. Although we believe that our Providers are properly characterized as independent contractors, tax or other regulatory authorities may in the future challenge our characterization of these relationships. If such regulatory authorities or state, federal or foreign courts were to determine that our Providers are employees, and not independent contractors, we would be required to withhold income taxes, to withhold and pay social security, Medicare and similar taxes and to pay unemployment and other related payroll taxes. We would also be liable for unpaid past taxes and subject to penalties. As a result, any determination that our Providers are our employees could have a material adverse effect on our business, financial condition and results of operations.
Any future litigation against us could be costly and time‑consuming to defend.
We may become subject, from time to time, to legal proceedings and claims that arise in the ordinary course of business such as claims brought by our Clients in connection with commercial disputes or employment claims made by our current or former associates. Litigation may result in substantial costs and may divert management’s attention and resources, which may substantially harm our business, financial condition and results of operations. Insurance may not cover such claims, may not provide sufficient payments to cover all of the costs to resolve one or more such claims and may not continue to be available on terms acceptable to us. A claim brought against us that is uninsured or underinsured could result in unanticipated costs, thereby reducing our revenue and leading analysts or potential investors to reduce their expectations of our performance, which could reduce the market price of our stock.
29
Certain state tax authorities may assert that we have a state nexus and seek to impose state and local income taxes which could adversely affect our results of operations.
We are currently licensed to operate in all fifty states and file state income tax returns in 25 states. There is a risk that certain state tax authorities where we do not currently file a state income tax return could assert that we are liable for state and local income taxes based upon income or gross receipts allocable to such states. States are becoming increasingly aggressive in asserting a nexus for state income tax purposes. We could be subject to state and local taxation, including penalties and interest attributable to prior periods, if a state tax authority successfully asserts that our activities give rise to a nexus. Such tax assessments, penalties and interest may adversely affect our results of operations.
Our ability to use our net operating losses to offset future taxable income may be subject to certain limitations.
In general, under Section 382 of the U.S. Internal Revenue Code of 1986, as amended, or the Code, a corporation that undergoes an “ownership change” is subject to limitations on its ability to utilize its pre‑change net operating losses, or NOLs, to offset future taxable income. A Section 382 “ownership change” generally occurs if one or more stockholders or groups of stockholders who own at least 5% of our stock increase their ownership by more than 50 percentage points over their lowest ownership percentage within a rolling three‑year period. Similar rules may apply under state tax laws. As of December 31, 2016, we have approximately $192.3 million of federal and state net operating loss carryforwards available to offset future taxable income which, if not utilized, will begin to expire in 2025. Our ability to utilize NOLs may be currently subject to limitations due to a prior ownership changes. In addition, future changes in our stock ownership, some of which are outside of our control, could result in an ownership change under Section 382 of the Code, further limiting our ability to utilize NOLs arising prior to such ownership change in the future. There is also a risk that due to regulatory changes, such as suspensions on the use of NOLs, or other unforeseen reasons, our existing NOLs could expire or otherwise be unavailable to offset future income tax liabilities. We have recorded a full valuation allowance against the deferred tax assets attributable to our NOLs.
Our proprietary software may not operate properly, which could damage our reputation, give rise to claims against us or divert application of our resources from other purposes, any of which could harm our business, financial condition and results of operations.
The Teladoc proprietary application platform provides our Members and Providers with the ability to, among other things, register for our services; complete, view and edit medical history; request a visit (either scheduled or on demand) and conduct a visit (via video or phone). Proprietary software development is time‑consuming, expensive and complex, and may involve unforeseen difficulties. We may encounter technical obstacles, and it is possible that we may discover additional problems that prevent our proprietary applications from operating properly. We are currently implementing software with respect to a number of new applications and services. If our solution does not function reliably or fails to achieve Client expectations in terms of performance, Clients could assert liability claims against us or attempt to cancel their contracts with us. This could damage our reputation and impair our ability to attract or maintain Clients.
Moreover, data services are complex and those we offer have in the past contained, and may in the future develop or contain, undetected defects or errors. Material performance problems, defects or errors in our existing or new software and applications and services may arise in the future and may result from interface of our solution with systems and data that we did not develop and the function of which is outside of our control or undetected in our testing. These defects and errors, and any failure by us to identify and address them, could result in loss of revenue or market share, diversion of development resources, harm to our reputation and increased service and maintenance costs. Defects or errors may discourage existing or potential Clients from purchasing our solution from us. Correction of defects or errors could prove to be impossible or impracticable. The costs incurred in correcting any defects or errors may be substantial and could have a material adverse effect on our business, financial condition and results of operations.
30
In order to support the growth of our business, we may need to incur additional indebtedness under our current credit facilities or seek capital through new equity or debt financings, which sources of additional capital may not be available to us on acceptable terms or at all.
Our operations have consumed substantial amounts of cash since inception and we intend to continue to make significant investments to support our business growth, respond to business challenges or opportunities, develop new applications and services, enhance our existing solution and services, enhance our operating infrastructure and potentially acquire complementary businesses and technologies. For the years ended December 31, 2016, 2015 and 2014, our net cash used in operating activities was $51.8 million, $47.2 million and $11.4 million respectively. As of December 31, 2016, we had $50.0 million of cash and cash equivalents and $15.8 million of short-term investments, which are held for working capital purposes. As of December 31, 2016, we had borrowings of $42.5 million under our credit facilities and the ability to borrow up to an additional $32.5 million. Borrowings under our credit facilities are secured by substantially all of our properties, rights and assets. Additionally, the credit agreements governing our credit facilities contain certain customary restrictive covenants that limit our ability to incur additional indebtedness and liens, merge with other companies or consummate certain changes of control, acquire other companies, engage in new lines of business, make certain investments, pay dividends and transfer or dispose of assets as well as a financial covenant that requires us to maintain a specified level of recurring revenue growth. These covenants could limit our ability to seek capital through the incurrence of new indebtedness or, if we are unable to meet our recurring revenue growth obligation, require us to repay any outstanding amounts with sources of capital we may otherwise use to fund our business, operations and strategy.
Our future capital requirements may be significantly different from our current estimates and will depend on many factors, including our growth rate, subscription renewal activity, the timing and extent of spending to support development efforts, the expansion of sales and marketing activities, the introduction of new or enhanced services and the continuing market acceptance of telehealth. Accordingly, we may need to engage in equity or debt financings or collaborative arrangements to secure additional funds. If we raise additional funds through further issuances of equity or convertible debt securities, our existing stockholders could suffer significant dilution, and any new equity securities we issue could have rights, preferences and privileges superior to those of holders of our common stock. Any debt financing secured by us in the future could involve additional restrictive covenants relating to our capital‑raising activities and other financial and operational matters, which may make it more difficult for us to obtain additional capital and to pursue business opportunities, including potential acquisitions. In addition, during times of economic instability, it has been difficult for many companies to obtain financing in the public markets or to obtain debt financing, and we may not be able to obtain additional financing on commercially reasonable terms, if at all. If we are unable to obtain adequate financing or financing on terms satisfactory to us, it could have a material adverse effect on our business, financial condition and results of operations.
Failure to adequately expand our direct sales force will impede our growth.
We believe that our future growth will depend on the continued development of our direct sales force and its ability to obtain new Clients and to manage our existing client base. Identifying and recruiting qualified personnel and training them requires significant time, expense and attention. It can take six months or longer before a new sales representative is fully trained and productive. Our business may be adversely affected if our efforts to expand and train our direct sales force do not generate a corresponding increase in revenue. In particular, if we are unable to hire and develop sufficient numbers of productive direct sales personnel or if new direct sales personnel are unable to achieve desired productivity levels in a reasonable period of time, sales of our services will suffer and our growth will be impeded.
We may be unable to successfully execute on our growth initiatives, business strategies or operating plans.
We are continually executing a number of growth initiatives, strategies and operating plans designed to enhance our business. For example, we recently entered into new specialist healthcare professional markets as well as into B2C markets. The anticipated benefits from these efforts are based on several assumptions that may prove to be inaccurate. Moreover, we may not be able to successfully complete these growth initiatives, strategies and operating plans and realize all of the benefits, including growth targets and cost savings, that we expect to achieve or it may be more costly to
31
do so than we anticipate. A variety of risks could cause us not to realize some or all of the expected benefits. These risks include, among others, delays in the anticipated timing of activities related to such growth initiatives, strategies and operating plans, increased difficulty and cost in implementing these efforts, including difficulties in complying with new regulatory requirements and the incurrence of other unexpected costs associated with operating the business. Moreover, our continued implementation of these programs may disrupt our operations and performance. As a result, we cannot assure you that we will realize these benefits. If, for any reason, the benefits we realize are less than our estimates or the implementation of these growth initiatives, strategies and operating plans adversely affect our operations or cost more or take longer to effectuate than we expect, or if our assumptions prove inaccurate, our business, financial condition and results of operations may be materially adversely affected.
Our use and disclosure of personally identifiable information, including health information, is subject to federal and state privacy and security regulations, and our failure to comply with those regulations or to adequately secure the information we hold could result in significant liability or reputational harm and, in turn, a material adverse effect on our client base, membership base and revenue.
Numerous state and federal laws and regulations govern the collection, dissemination, use, privacy, confidentiality, security, availability and integrity of PII, including protected health information. These laws and regulations include HIPAA . HIPAA establishes a set of basic national privacy and security standards for the protection of protected health information, or PHI, by health plans, healthcare clearinghouses and certain healthcare providers, referred to as covered entities, and the business associates with whom such covered entities contract for services, which includes us.
HIPAA requires healthcare providers like us to develop and maintain policies and procedures with respect to PHI that is used or disclosed, including the adoption of administrative, physical and technical safeguards to protect such information. HIPAA also implemented the use of standard transaction code sets and standard identifiers that covered entities must use when submitting or receiving certain electronic healthcare transactions, including activities associated with the billing and collection of healthcare claims.
HIPAA imposes mandatory penalties for certain violations. Penalties for violations of HIPAA and its implementing regulations start at $100 per violation and are not to exceed $50,000 per violation, subject to a cap of $1.5 million for violations of the same standard in a single calendar year. However, a single breach incident can result in violations of multiple standards. HIPAA also authorizes state attorneys general to file suit on behalf of their residents. Courts will be able to award damages, costs and attorneys’ fees related to violations of HIPAA in such cases. While HIPAA does not create a private right of action allowing individuals to sue us in civil court for violations of HIPAA, its standards have been used as the basis for duty of care in state civil suits such as those for negligence or recklessness in the misuse or breach of PHI.
In addition, HIPAA mandates that the Secretary of Health and Human Services, or HHS conduct periodic compliance audits of HIPAA covered entities or business associates for compliance with the HIPAA Privacy and Security Standards. It also tasks HHS with establishing a methodology whereby harmed individuals who were the victims of breaches of unsecured PHI may receive a percentage of the Civil Monetary Penalty fine paid by the violator.
HIPAA further requires that patients be notified of any unauthorized acquisition, access, use or disclosure of their unsecured PHI that compromises the privacy or security of such information, with certain exceptions related to unintentional or inadvertent use or disclosure by employees or authorized individuals. HIPAA specifies that such notifications must be made “without unreasonable delay and in no case later than 60 calendar days after discovery of the breach.” If a breach affects 500 patients or more, it must be reported to HHS without unreasonable delay, and HHS will post the name of the breaching entity on its public web site. Breaches affecting 500 patients or more in the same state or jurisdiction must also be reported to the local media. If a breach involves fewer than 500 people, the covered entity must record it in a log and notify HHS at least annually.
Numerous other federal and state laws protect the confidentiality, privacy, availability, integrity and security of personally identifiable information, or PII, including PHI. These laws in many cases are more restrictive than, and may not be preempted by, the HIPAA rules and may be subject to varying interpretations by courts and government agencies,
32
creating complex compliance issues for us and our Clients and potentially exposing us to additional expense, adverse publicity and liability.
New health information standards, whether implemented pursuant to HIPAA, congressional action or otherwise, could have a significant effect on the manner in which we must handle healthcare related data, and the cost of complying with standards could be significant. If we do not comply with existing or new laws and regulations related to PHI, we could be subject to criminal or civil sanctions.
Because of the extreme sensitivity of the PII we store and transmit, the security features of our technology platform are very important. If our security measures, some of which are managed by third parties, are breached or fail, unauthorized persons may be able to obtain access to sensitive Client and Member data, including HIPAA‑regulated PHI. As a result, our reputation could be severely damaged, adversely affecting Client and Member confidence. Members may curtail their use of or stop using our services or our client base could decrease, which would cause our business to suffer. In addition, we could face litigation, damages for contract breach, penalties and regulatory actions for violation of HIPAA and other applicable laws or regulations and significant costs for remediation, notification to individuals and for measures to prevent future occurrences. Any potential security breach could also result in increased costs associated with liability for stolen assets or information, repairing system damage that may have been caused by such breaches, incentives offered to Clients or other business partners in an effort to maintain our business relationships after a breach and implementing measures to prevent future occurrences, including organizational changes, deploying additional personnel and protection technologies, training employees and engaging third‑party experts and consultants. While we maintain insurance covering certain security and privacy damages and claim expenses in the amount of $5.0 million per claim, we may not carry insurance or maintain coverage sufficient to compensate for all liability and in any event, insurance coverage would not address the reputational damage that could result from a security incident.
We outsource important aspects of the storage and transmission of Client and Member information, and thus rely on third parties to manage functions that have material cyber‑security risks. We attempt to address these risks by requiring outsourcing subcontractors who handle Client and Member information to sign business associate agreements contractually requiring those subcontractors to adequately safeguard personal health data to the same extent that applies to us and in some cases by requiring such outsourcing subcontractors to undergo third‑party security examinations. In addition, we periodically hire third‑party security experts to assess and test our security posture. However, we cannot assure you that these contractual measures and other safeguards will adequately protect us from the risks associated with the storage and transmission of Client and Members’ proprietary and protected health information.
We also publish statements to our Members that describe how we handle and protect personal information. If federal or state regulatory authorities or private litigants consider any portion of these statements to be untrue, we may be subject to claims of deceptive practices, which could lead to significant liabilities and consequences, including, without limitation, costs of responding to investigations, defending against litigation, settling claims and complying with regulatory or court orders.
We also send short message service, or SMS text messages to potential end users who are eligible to use our service through certain customers and partners. While we obtain consent from or on behalf of these individuals to send text messages, federal or state regulatory authorities or private litigants may claim that the notices and disclosures we provide, form of consents we obtain or our SMS texting practices, are not adequate. These SMS texting campaigns are potential sources of risk for class action lawsuits and liability for our company. Numerous class‑action suits under federal and state laws have been filed in the past year against companies who conduct SMS texting programs, with many resulting in multi‑million dollar settlements to the plaintiffs. Any future such litigation against us could be costly and time‑consuming to defend.
Our quarterly results may fluctuate significantly, which could adversely impact the value of our common stock.
Our quarterly results of operations, including our revenue, gross profit, net loss and cash flows, has varied and may vary significantly in the future, and period‑to‑period comparisons of our results of operations may not be meaningful. Accordingly, our quarterly results should not be relied upon as an indication of future performance. Our
33
quarterly financial results may fluctuate as a result of a variety of factors, many of which are outside of our control, including, without limitation, the following:
|
· |
the addition or loss of large Clients, including through acquisitions or consolidations of such Clients; |
|
· |
seasonal and other variations in the timing of the sales of our services, as a significantly higher proportion of our Clients enter into new subscription contracts with us or renew their existing contracts in the third and fourth quarters of the year compared to the first and second quarters; |
|
· |
seasonal and other variations in the timing of the sales of our services, as a significantly higher proportion of our Members use our services during peak cold and flu season months; |
|
· |
the timing of recognition of revenue, including possible delays in the recognition of revenue due to sometimes unpredictable implementation timelines; |
|
· |
the amount and timing of operating expenses related to the maintenance and expansion of our business, operations and infrastructure; |
|
· |
our ability to effectively manage the size and composition of our proprietary network of healthcare professionals relative to the level of demand for services from our Members; |
|
· |
the timing and success of introductions of new applications and services by us or our competitors or any other change in the competitive dynamics of our industry, including consolidation among competitors, Clients or strategic partners; |
|
· |
Client renewal rates and the timing and terms of Client renewals; |
|
· |
the mix of applications and services sold during a period; and |
|
· |
the timing of expenses related to the development or acquisition of technologies or businesses and potential future charges for impairment of goodwill from acquired companies. |
We are particularly subject to fluctuations in our quarterly results of operations because the costs associated with entering into Client contracts are generally incurred up front, while we generally recognize revenue over the term of the contract. Further, most of our revenue in any given quarter is derived from contracts entered into with our Clients during previous quarters. Consequently, a decline in new or renewed contracts in any one quarter may not be fully reflected in our revenue for that quarter. Such declines, however, would negatively affect our revenue in future periods and the effect of significant downturns in sales of and market demand for our solution, and potential changes in our rate of renewals or renewal terms, may not be fully reflected in our results of operations until future periods. Our subscription model also makes it difficult for us to rapidly increase our total revenue through additional sales in any period, with the exception of the first quarter during peak benefits enrollment, as revenue from new Clients must be recognized over the applicable term of the contract. Accordingly, the effect of changes in the industry impacting our business or changes we experience in our new sales may not be reflected in our short‑term results of operations. Any fluctuation in our quarterly results may not accurately reflect the underlying performance of our business and could cause a decline in the trading price of our common stock.
If we fail to manage our growth effectively, our expenses could increase more than expected, our revenue may not increase and we may be unable to implement our business strategy.
We have experienced significant growth in recent periods, which puts strain on our business, operations and employees. For example, we grew from 595 full‑time employees at December 31, 2015 to 670 full‑time employees at December 31, 2016. We have also increased our client and membership bases significantly over the past two years. We anticipate that our operations will continue to rapidly expand. To manage our current and anticipated future growth effectively, we must continue to maintain and enhance our IT infrastructure, financial and accounting systems and
34
controls. We must also attract, train and retain a significant number of qualified sales and marketing personnel, customer support personnel, professional services personnel, software engineers, technical personnel and management personnel, and the availability of such personnel, in particular software engineers, may be constrained.
A key aspect to managing our growth is our ability to scale our capabilities to implement our solution satisfactorily with respect to both large and demanding Clients, who currently constitute the substantial majority of our client base, as well as smaller Clients who are becoming an increasingly larger portion of our client base. Large Clients often require specific features or functions unique to their membership base, which, at a time of significant growth or during periods of high demand, may strain our implementation capacity and hinder our ability to successfully implement our solution to our Clients in a timely manner. We may also need to make further investments in our technology and automate portions of our solution or services to decrease our costs. If we are unable to address the needs of our Clients or Members, or our Clients or Members are unsatisfied with the quality of our solution or services, they may not renew their contracts, seek to cancel or terminate their relationship with us or renew on less favorable terms, any of which could cause our annual net dollar retention rate to decrease.
Failure to effectively manage our growth could also lead us to over‑invest or under‑invest in development and operations, result in weaknesses in our infrastructure, systems or controls, give rise to operational mistakes, financial losses, loss of productivity or business opportunities and result in loss of employees and reduced productivity of remaining employees. Our growth is expected to require significant capital expenditures and may divert financial resources from other projects such as the development of new applications and services. If our management is unable to effectively manage our growth, our expenses may increase more than expected, our revenue may not increase or may grow more slowly than expected and we may be unable to implement our business strategy. The quality of our services may also suffer, which could negatively affect our reputation and harm our ability to attract and retain Clients.
We incur significant upfront costs in our Client relationships, and if we are unable to maintain and grow these Client relationships over time, we are likely to fail to recover these costs, which could have a material adverse effect on our business, financial condition and results of operations.
We derive most of our revenue from subscription access fees. Accordingly, our business model depends heavily on achieving economies of scale because our initial upfront investment is costly and the associated revenue is recognized on a ratable basis. We devote significant resources to establish relationships with our Clients and implement our solution and related services. This is particularly so in the case of large enterprises that, to date, have comprised a substantial majority of our client base and revenue and often request or require specific features or functions unique to their particular business processes. Accordingly, our results of operations will depend in substantial part on our ability to deliver a successful experience for both Clients and Members and persuade our Clients to maintain and grow their relationship with us over time. Additionally, as our business is growing significantly, our Client acquisition costs could outpace our build‑up of recurring revenue, and we may be unable to reduce our total operating costs through economies of scale such that we are unable to achieve profitability. If we fail to achieve appropriate economies of scale or if we fail to manage or anticipate the evolution and in future periods, demand, of the subscription access fee model, our business, financial condition and results of operations could be materially adversely affected.
If our existing Clients do not continue or renew their contracts with us, renew at lower fee levels or decline to purchase additional applications and services from us, it could have a material adverse effect on our business, financial condition and results of operations.
We expect to derive a significant portion of our revenue from renewal of existing Client contracts and sales of additional applications and services to existing Clients. As part of our growth strategy, for instance, we have recently focused on expanding our services amongst current Clients. As a result, selling additional applications and services are critical to our future business, revenue growth and results of operations.
Factors that may affect our ability to sell additional applications and services include, but are not limited to, the following:
|
· |
the price, performance and functionality of our solution; |
35
|
· |
the availability, price, performance and functionality of competing solutions; |
|
· |
our ability to develop and sell complementary applications and services; |
|
· |
the stability, performance and security of our hosting infrastructure and hosting services; |
|
· |
changes in healthcare laws, regulations or trends; and |
|
· |
the business environment of our Clients and, in particular, headcount reductions by our Clients. |
We enter into subscription access contracts with our Clients. These contracts generally have stated initial terms of one year. Most of our Clients have no obligation to renew their subscriptions for our solution after the initial term expires. In addition, our Clients may negotiate terms less advantageous to us upon renewal, which may reduce our revenue from these Clients. Our future results of operations also depend, in part, on our ability to expand into new clinical specialties and across care settings and use cases. If our Clients fail to renew their contracts, renew their contracts upon less favorable terms or at lower fee levels or fail to purchase new products and services from us, our revenue may decline or our future revenue growth may be constrained.
In addition, after the initial contract year, a significant number of our Client contracts allow Clients to terminate such agreements for convenience at certain times, typically with one to three months advance notice. We typically incur the expenses associated with integrating a Client’s data into our healthcare database and related training and support prior to recognizing meaningful revenue from such Client. Subscription access revenue is not recognized until our products are implemented for launch, which is generally from one to three months from contract signing. If a Client terminates its contract early and revenue and cash flows expected from a Client are not realized in the time period expected or not realized at all, our business, financial condition and results of operations could be adversely affected.
Our sales and implementation cycle can be long and unpredictable and requires considerable time and expense, which may cause our results of operations to fluctuate.
The sales cycle for our solution from initial contact with a potential lead to contract execution and implementation, varies widely by Client, ranging from a number of days to approximately 24 months. Some of our Clients undertake a significant and prolonged evaluation process, including to determine whether our services meet their unique healthcare needs, which frequently involves evaluation of not only our solution but also an evaluation of those of our competitors, which has in the past resulted in extended sales cycles. Our sales efforts involve educating our Clients about the use, technical capabilities and potential benefits of our solution. Moreover, our large enterprise Clients often begin to deploy our solution on a limited basis, but nevertheless demand extensive configuration, integration services and pricing concessions, which increase our upfront investment in the sales effort with no guarantee that these Clients will deploy our solution widely enough across their organization to justify our substantial upfront investment. It is possible that in the future we may experience even longer sales cycles, more complex Client needs, higher upfront sales costs and less predictability in completing some of our sales as we continue to expand our direct sales force, expand into new territories and market additional applications and services. If our sales cycle lengthens or our substantial upfront sales and implementation investments do not result in sufficient sales to justify our investments, it could have a material adverse effect on our business, financial condition and results of operations.
We operate in a competitive industry, and if we are not able to compete effectively, our business, financial condition and results of operations will be harmed.
While the telehealth market is in an early stage of development, it is competitive and we expect it to attract increased competition, which could make it difficult for us to succeed. We currently face competition in the telehealth industry for our solution from a range of companies, including specialized software and solution providers that offer similar solutions, often at substantially lower prices, and that are continuing to develop additional products and becoming more sophisticated and effective. These competitors include MDLive, Inc., and American Well Corporation, among other smaller industry participants. In addition, large, well‑financed health plans have in some cases developed
36
their own telehealth tools and may provide these solutions to their customers at discounted prices. Competition from specialized software and solution providers, health plans and other parties will result in continued pricing pressures, which is likely to lead to price declines in certain product segments, which could negatively impact our sales, profitability and market share.
Some of our competitors may have greater name recognition, longer operating histories and significantly greater resources than we do. Further, our current or potential competitors may be acquired by third parties with greater available resources. As a result, our competitors may be able to respond more quickly and effectively than we can to new or changing opportunities, technologies, standards or customer requirements and may have the ability to initiate or withstand substantial price competition. In addition, current and potential competitors have established, and may in the future establish, cooperative relationships with vendors of complementary products, technologies or services to increase the availability of their solutions in the marketplace. Accordingly, new competitors or alliances may emerge that have greater market share, a larger customer base, more widely adopted proprietary technologies, greater marketing expertise, greater financial resources and larger sales forces than we have, which could put us at a competitive disadvantage. Our competitors could also be better positioned to serve certain segments of the telehealth market, which could create additional price pressure. In light of these factors, even if our solution is more effective than those of our competitors, current or potential Clients may accept competitive solutions in lieu of purchasing our solution. If we are unable to successfully compete in the telehealth market, our business, financial condition and results of operations could be materially adversely affected.
If we cannot implement our solution for Clients or resolve any technical issues in a timely manner, we may lose Clients and our reputation may be harmed.
Our Clients utilize a variety of data formats, applications and infrastructure and our solution must support our Clients’ data formats and integrate with complex enterprise applications and infrastructures. If our platform does not currently support a Client’s required data format or appropriately integrate with a Client’s applications and infrastructure, then we must configure our platform to do so, which increases our expenses. Additionally, we do not control our Clients’ implementation schedules. As a result, if our Clients do not allocate the internal resources necessary to meet their implementation responsibilities or if we face unanticipated implementation difficulties, the implementation may be delayed. If the Client implementation process is not executed successfully or if execution is delayed, we could incur significant costs, Clients could become dissatisfied and decide not to increase utilization of our solution or not to implement our solution beyond an initial period prior to their term commitment or, in some cases, revenue recognition could be delayed. In addition, competitors with more efficient operating models with lower implementation costs could jeopardize our Client relationships.
Our Clients and Members depend on our support services to resolve any technical issues relating to our solution and services, and we may be unable to respond quickly enough to accommodate short‑term increases in Member demand for support services, particularly as we increase the size of our client and membership bases. We also may be unable to modify the format of our support services to compete with changes in support services provided by competitors. It is difficult to predict Member demand for technical support services, and if Member demand increases significantly, we may be unable to provide satisfactory support services to our Members. Further, if we are unable to address Members’ needs in a timely fashion or further develop and enhance our solution, or if a Client or Member is not satisfied with the quality of work performed by us or with the technical support services rendered, then we could incur additional costs to address the situation or be required to issue credits or refunds for amounts related to unused services, and our profitability may be impaired and Clients’ dissatisfaction with our solution could damage our ability to expand the number of applications and services purchased by such Clients. These Clients may not renew their contracts, seek to terminate their relationship with us or renew on less favorable terms. Moreover, negative publicity related to our Client relationships, regardless of its accuracy, may further damage our business by affecting our reputation or ability to compete for new business with current and prospective Clients. If any of these were to occur, our revenue may decline and our business, financial condition and results of operations could be adversely affected.
37
We depend on our senior management team, and the loss of one or more of our executive officers or key employees or an inability to attract and retain highly skilled employees could adversely affect our business.
Our success depends largely upon the continued services of our key executive officers. These executive officers are at‑will employees and therefore they may terminate employment with us at any time with no advance notice. We maintain “key person” insurance in the amount of $4.0 million for Jason Gorevic, our Chief Executive Officer, but not for any of our other executive officers or any of our other key employees. We also rely on our leadership team in the areas of research and development, marketing, services and general and administrative functions. From time to time, there may be changes in our executive management team resulting from the hiring or departure of executives, which could disrupt our business. The replacement of one or more of our executive officers or other key employees would likely involve significant time and costs and may significantly delay or prevent the achievement of our business objectives.
To continue to execute our growth strategy, we also must attract and retain highly skilled personnel. Competition is intense for qualified professionals. We may not be successful in continuing to attract and retain qualified personnel. We have from time to time in the past experienced, and we expect to continue to experience in the future, difficulty in hiring and retaining highly skilled personnel with appropriate qualifications. The pool of qualified personnel with experience working in the healthcare market is limited overall. In addition, many of the companies with which we compete for experienced personnel have greater resources than we have.
In addition, in making employment decisions, particularly in high‑technology industries, job candidates often consider the value of the stock options or other equity instruments they are to receive in connection with their employment. Volatility in the price of our stock may, therefore, adversely affect our ability to attract or retain highly skilled personnel. Further, the requirement to expense stock options and other equity instruments may discourage us from granting the size or type of stock option or equity awards that job candidates require to join our company. Failure to attract new personnel or failure to retain and motivate our current personnel, could have a material adverse effect on our business, financial condition and results of operations.
If we fail to develop widespread brand awareness cost‑effectively, our business may suffer.
We believe that developing and maintaining widespread awareness of our brand in a cost‑effective manner is critical to achieving widespread adoption of our solution and attracting new Clients. Our brand promotion activities may not generate Client awareness or increase revenue, and even if they do, any increase in revenue may not offset the expenses we incur in building our brand. If we fail to successfully promote and maintain our brand, or incur substantial expenses in doing so, we may fail to attract or retain Clients necessary to realize a sufficient return on our brand‑building efforts or to achieve the widespread brand awareness that is critical for broad Client adoption of our solution.
Our marketing efforts depend significantly on our ability to receive positive references from our existing Clients.
Our marketing efforts depend significantly on our ability to call upon our current Clients to provide positive references to new, potential Clients. Given our limited number of long‑term Clients, the loss or dissatisfaction of any Client could substantially harm our brand and reputation, inhibit widespread adoption of our solution and impair our ability to attract new Clients and maintain existing Clients. Any of these consequences could lower retention rate and have a material adverse effect on our business, financial condition and results of operations.
Any failure to protect our intellectual property rights could impair our ability to protect our technology and our brand.
Our success depends in part on our ability to enforce our intellectual property and other proprietary rights. We rely upon a combination of trademark and trade secret laws, as well as license and access agreements and other contractual provisions, to protect our intellectual property and other proprietary rights. In addition, we attempt to protect our intellectual property and proprietary information by requiring our employees, consultants and certain of our contractors to execute confidentiality and assignment of inventions agreements. These laws, procedures and restrictions provide only limited protection and any of our intellectual property rights may be challenged, invalidated, circumvented,
38
infringed or misappropriated. To the extent that our intellectual property and other proprietary rights are not adequately protected, third parties may gain access to our proprietary information, develop and market solutions similar to ours or use trademarks similar to ours, each of which could materially harm our business. Unauthorized parties may also attempt to copy or obtain and use our technology to develop applications with the same functionality as our solution, and policing unauthorized use of our technology and intellectual property rights is difficult and may not be effective. The failure to adequately protect our intellectual property and other proprietary rights could have a material adverse effect on our business, financial condition and results of operations.
We may acquire other companies or technologies, which could divert our management’s attention, result in dilution to our stockholders and otherwise disrupt our operations and we may have difficulty integrating any such acquisitions successfully or realizing the anticipated benefits therefrom, any of which could have a material adverse effect on our business, financial condition and results of operations.
We may in the future seek to acquire or invest in businesses, applications and services or technologies that we believe could complement or expand our solution, enhance our technical capabilities or otherwise offer growth opportunities. The pursuit of potential acquisitions may divert the attention of management and cause us to incur various expenses in identifying, investigating and pursuing suitable acquisitions, whether or not they are consummated.
In addition, we have limited experience in acquiring other businesses. If we acquire additional businesses, we may not be able to integrate the acquired personnel, operations and technologies successfully, or effectively manage the combined business following the acquisition. We also may not achieve the anticipated benefits from the acquired business due to a number of factors, including, but not limited to:
|
· |
inability to integrate or benefit from acquired technologies or services in a profitable manner; |
|
· |
unanticipated costs or liabilities associated with the acquisition; |
|
· |
difficulty integrating the accounting systems, operations and personnel of the acquired business; |
|
· |
difficulties and additional expenses associated with supporting legacy products and hosting infrastructure of the acquired business; |
|
· |
difficulty converting the clients of the acquired business onto our platform and contract terms, including disparities in the revenue, licensing, support or professional services model of the acquired company; |
|
· |
diversion of management’s attention from other business concerns; |
|
· |
adverse effects to our existing business relationships with business partners and Clients as a result of the acquisition; |
|
· |
the potential loss of key employees; |
|
· |
use of resources that are needed in other parts of our business; and |
|
· |
use of substantial portions of our available cash to consummate the acquisition. |
In addition, a significant portion of the purchase price of companies we acquire may be allocated to acquired goodwill and other intangible assets, which must be assessed for impairment at least annually. In the future, if our acquisitions do not yield expected returns, we may be required to take charges to our results of operations based on this impairment assessment process, which could adversely affect our results of operations.
Acquisitions could also result in dilutive issuances of equity securities or the incurrence of debt, which could adversely affect our results of operations. In addition, if an acquired business fails to meet our expectations, our business, financial condition and results of operations may suffer.
39
Taxing authorities may successfully assert that we should have collected or in the future should collect sales and use or similar taxes which could adversely affect our results of operations.
We do not collect sales and use and similar taxes in any states based on our belief that our services are not subject to such taxes in any state. Sales and use and similar tax laws and rates vary greatly from state to state. Certain states in which we do not collect such taxes may assert that such taxes are applicable, which could result in tax assessments, penalties and interest with respect to past services, and we may be required to collect such taxes for services in the future. Such tax assessments, penalties and interest or future requirements may adversely affect our results of operations.
Economic uncertainties or downturns in the general economy or the industries in which our Clients operate could disproportionately affect the demand for our solution and negatively impact our results of operations.
General worldwide economic conditions have experienced significant downturns during the last ten years, and market volatility and uncertainty remain widespread, making it potentially very difficult for our Clients and us to accurately forecast and plan future business activities. During challenging economic times, our Clients may have difficulty gaining timely access to sufficient credit or obtaining credit on reasonable terms, which could impair their ability to make timely payments to us and adversely affect our revenue. If that were to occur, our financial results could be harmed. Further, challenging economic conditions may impair the ability of our Clients to pay for the applications and services they already have purchased from us and, as a result, our write‑offs of accounts receivable could increase. We cannot predict the timing, strength or duration of any economic slowdown or recovery. If the condition of the general economy or markets in which we operate worsens, our business could be harmed.
The estimates of market opportunity and forecasts of market growth included in this Form 10-K may prove to be inaccurate, and even if the market in which we compete achieves the forecasted growth, our business could fail to grow at similar rates, if at all.
Market opportunity estimates and growth forecasts are subject to significant uncertainty and are based on assumptions and estimates that may not prove to be accurate. The estimates and forecasts in this Form 10-K relating to the size and expected growth of the telehealth market may prove to be inaccurate. Even if the market in which we compete meets our size estimates and forecasted growth, our business could fail to grow at similar rates, if at all.
Natural or man‑made disasters and other similar events may significantly disrupt our business and negatively impact our business, financial condition and results of operations.
Our offices may be harmed or rendered inoperable by natural or man‑made disasters, including earthquakes, power outages, fires, floods, nuclear disasters and acts of terrorism or other criminal activities, which may render it difficult or impossible for us to operate our business for some period of time. For example, our headquarters are located in the greater New York City area, a region with a history of terrorist attacks and hurricanes. Any disruptions in our operations related to the repair or replacement of our offices, could negatively impact our business and results of operations and harm our reputation. Although we maintain a $7.1 million insurance policy covering damage to property we rent, such insurance may not be sufficient to compensate for losses that may occur. Any such losses or damages could have a material adverse effect on our business, financial condition and results of operations. In addition, our Clients’ facilities may be harmed or rendered inoperable by such natural or man‑made disasters, which may cause disruptions, difficulties or material adverse effects on our business.
Future sales to Clients outside the United States or with international operations may expose us to risks inherent in international sales that, if realized, could adversely affect our business.
We may in the future expand internationally. Operating in international markets requires significant resources and management attention and will subject us to regulatory, economic and political risks that are different from those in the United States. Because of our limited experience with international operations, our international expansion efforts may not be successful in creating demand for our products and services outside of the United States or in effectively
40
selling our solutions in the international markets we enter. In addition, we will face risks in doing business internationally that could adversely affect our business, including, but not limited to, the following:
|
· |
the need to localize and adapt our solutions for specific countries, including translation into foreign languages and associated expenses; |
|
· |
data privacy laws that require that Client data be stored and processed in a designated territory; |
|
· |
difficulties in staffing and managing foreign operations; |
|
· |
different pricing environments, longer sales cycles and longer accounts receivable payment cycles and collections issues; |
|
· |
new and different sources of competition; |
|
· |
weaker protection for intellectual property and other legal rights than in the United States and practical difficulties in enforcing intellectual property and other rights outside of the United States; |
|
· |
laws and business practices favoring local competitors; |
|
· |
compliance challenges related to the complexity of multiple, conflicting and changing governmental laws and regulations, including employment, healthcare, tax, privacy and data protection laws and regulations; |
|
· |
increased financial accounting and reporting burdens and complexities; |
|
· |
restrictions on the transfer of funds; |
|
· |
adverse tax consequences; and |
|
· |
unstable regional economic and political conditions. |
If we denominate our international contracts in local currencies, fluctuations in the value of the U.S. dollar and foreign currencies may impact our results of operations when translated into U.S. dollars.
Our marketing efforts for the direct-to-consumer behavioral health portion of our business may not be successful or may become more expensive, either of which could increase our costs and adversely affect our business, financial condition, results of operations and cash flows.
Direct-to-consumer behavioral health represents a material portion of our overall business. We spend significant resources marketing this service. We rely on relationships for our direct-to-consumer behavioral health business with a wide variety of third parties, including Internet search providers such as Google, social networking platforms such as Facebook, Internet advertising networks, co-registration partners, retailers, distributors, television advertising agencies and direct marketers, to source new members and to promote or distribute our services and products. In addition, in connection with the launch of new services or products for our direct-to-consumer behavioral health business, we may spend a significant amount of resources on marketing. If our marketing activities are inefficient or unsuccessful, if important third-party relationships or marketing strategies, such as Internet search engine marketing and search engine optimization, become more expensive or unavailable, or are suspended, modified or terminated, for any reason, if there is an increase in the proportion of consumers visiting our websites or purchasing our services by way of marketing channels with higher marketing costs as compared to channels that have lower or no associated marketing costs or if our marketing efforts do not result in our services being prominently ranked in Internet search listings, our business, financial condition, results of operations and cash flows could be materially and adversely impacted.
41
We are an “emerging growth company,” and the reduced disclosure requirements applicable to emerging growth companies may make our common stock less attractive to investors.
We are an “emerging growth company”, as defined in the Jumpstart Our Business Startups Act of 2012, or JOBS Act, and may remain an emerging growth company for up to five years following our initial public offering. For so long as we remain an emerging growth company, we are permitted and intend to rely on exemptions from certain disclosure requirements that are applicable to other public companies that are not emerging growth companies. These exemptions include:
|
· |
not being required to comply with the auditor attestation requirements of Section 404 of the Sarbanes-Oxley Act of 2002 in the assessment of our internal control over financial reporting; |
|
· |
reduced disclosure obligations regarding executive compensation in our periodic reports, proxy statements and registration statements; and |
|
· |
exemption from the requirements of holding a nonbinding advisory vote on executive compensation and obtaining stockholder approval of any golden parachute payments not previously approved. |
We have, and currently intend to continue to, take advantage of reduced reporting. We cannot predict whether investors will find our common stock less attractive if we rely on these exemptions. If some investors find our common stock less attractive as a result, there may be a less active trading market for our common stock and our stock price may be reduced or more volatile. In addition, the JOBS Act provides that an emerging growth company can take advantage of an extended transition period for complying with new or revised accounting standards. This allows an emerging growth company to delay the adoption of these accounting standards until they would otherwise apply to private companies. We have irrevocably elected not to avail ourselves of this exemption and, therefore, we will be subject to the same new or revised accounting standards as other public companies that are not emerging growth companies.
Provisions in our amended and restated certificate of incorporation and amended and restated bylaws and under Delaware law could make an acquisition of our company, which may be beneficial to our stockholders, more difficult and may prevent attempts by our stockholders to replace or remove our current management.
Provisions in our amended and restated certificate of incorporation and our amended and restated bylaws may discourage, delay or prevent a merger, acquisition or other change in control of our company that stockholders may consider favorable, including transactions in which you might otherwise receive a premium for your shares. These provisions could also limit the price that investors might be willing to pay in the future for shares of our common stock, thereby depressing the market price of our common stock. In addition, because our board of directors is responsible for appointing the members of our management team, these provisions may frustrate or prevent any attempts by our stockholders to replace or remove our current management by making it more difficult for stockholders to replace members of our board of directors. Among other things, these provisions include those establishing:
|
· |
a classified board of directors with three-year staggered terms, which may delay the ability of stockholders to change the membership of a majority of our board of directors; |
|
· |
no cumulative voting in the election of directors, which limits the ability of minority stockholders to elect director candidates; |
|
· |
the exclusive right of our board of directors to elect a director to fill a vacancy created by the expansion of our board of directors or the resignation, death or removal of a director, which prevents stockholders from filling vacancies on our board of directors; |
|
· |
the ability of our board of directors to authorize the issuance of shares of preferred stock and to determine the terms of those shares, including preferences and voting rights, without stockholder approval, which could be used to significantly dilute the ownership of a hostile acquirer; |
|
· |
the ability of our board of directors to alter our amended and restated bylaws without obtaining stockholder approval; |
|
· |
the required approval of the holders of at least two-thirds of the shares entitled to vote at an election of directors to adopt, amend or repeal our amended and restated bylaws or repeal the provisions of our amended and restated certificate of incorporation regarding the election and removal of directors; |
42
|
· |
a prohibition on stockholder action by written consent, which forces stockholder action to be taken at an annual or special meeting of our stockholders; |
|
· |
the requirement that a special meeting of stockholders be called only by the chairman of our board of directors, the chief executive officer, the president or our board of directors, which may delay the ability of our stockholders to force consideration of a proposal or to take action, including the removal of directors; andadvance notice procedures that stockholders must comply with in order to nominate candidates to our board of directors or to propose matters to be acted upon at a stockholders’ meeting, which may discourage or deter a potential acquirer from conducting a solicitation of proxies to elect the acquirer’s own slate of directors or otherwise attempting to obtain control of us. |
Moreover, because we are incorporated in Delaware, we are governed by the provisions of Section 203 of the General Corporation Law of the State of Delaware, or the DGCL, which prohibits a person who owns in excess of 15% of our outstanding voting stock from merging or combining with us for a period of three years after the date of the transaction in which the person acquired in excess of 15% of our outstanding voting stock, unless the merger or combination is approved in a prescribed manner.
Our amended and restated certificate of incorporation provides that the Court of Chancery of the State of Delaware will be the exclusive forum for substantially all disputes between us and our stockholders, which could limit our stockholders’ ability to obtain a favorable judicial forum for disputes with us or our directors, officers or employees.
Our amended and restated certificate of incorporation provides that the Court of Chancery of the State of Delaware is the exclusive forum for (1) any derivative action or proceeding brought on our behalf, (2) any action asserting a claim of breach of a fiduciary duty or other wrongdoing by any of our directors, officers, employees or agents to us or our stockholders, (3) any action asserting a claim arising pursuant to any provision of the DGCL or our amended and restated certificate of incorporation or amended and restated bylaws, (4) any action to interpret, apply, enforce or determine the validity of our amended and restated certificate of incorporation or amended and restated bylaws or (5) any action asserting a claim governed by the internal affairs doctrine. This choice of forum provision may limit a stockholder’s ability to bring a claim in a judicial forum that it finds favorable for disputes with us or our directors, officers or other employees, which may discourage such lawsuits against us and our directors, officers and other employees. Alternatively, if a court were to find the choice of forum provision contained in our amended and restated certificate of incorporation to be inapplicable or unenforceable in an action, we may incur additional costs associated with resolving such action in other jurisdictions, which could have a material adverse effect our business, financial condition or results of operations.
Because we do not anticipate paying any cash dividends on our capital stock in the foreseeable future, capital appreciation will be your sole source of gain, if any.
We have never declared or paid cash dividends on our capital stock. We currently intend to retain all of our future earnings, if any, to finance the growth and development of our business. Any future debt agreements may preclude us from paying dividends. As a result, capital appreciation, if any, of our common stock will be your sole source of gain for the foreseeable future.
We could be subject to securities class action litigation.
In the past, securities class action litigation has often been brought against a company following a decline in the market price of its securities. If we face such litigation, it could result in substantial costs and a diversion of management’s attention and resources, which could have a material adverse effect on our business, financial condition or results of operations.
Item 1B.Unresolved Staff Comments
None.
43
We believe that our company’s offices and other facilities are, in general, in good operating condition and adequate for our current operations and that additional leased space in appropriate locations can be obtained on acceptable terms if needed.
We lease approximately 18,000 square feet of office space in Purchase, New York for our corporate headquarters and certain of our operations under a lease for which the term expires in August 2018. In 2016 we executed a lease for approximately 19,000 square feet of office space in Phoenix, Arizona for our backup provider network operations center. The lease has a seven-year initial term and provides for a five-year extension. In 2015 we executed a lease for approximately 73,000 square feet of office space in Lewisville, Texas for our provider network operations center and administrative purposes. The lease has a ten-year initial term and provides for two five-year extensions. We also lease additional operational facilities elsewhere in the United States. We believe that our facilities are adequate to meet our needs for the immediate future, and that, should it be needed, suitable additional space will be available to accommodate any such expansion of our operations.
We are subject to legal proceedings, claims and litigation arising in the ordinary course of our business. Descriptions of certain legal proceedings to which we are a party are contained in Note 17, “Legal Matters”, to our audited consolidated financial statements included in Part II, of this Annual Report on Form 10-K and are incorporated by reference herein.
Item 4.Mine Safety Disclosures
Not applicable.
44
Item 5.Market for Registrant’s Common Equity, Related Stockholder Matters and Issuer Purchases of Equity Securities
Market Information
We completed the initial public offering of our Common Stock in July 2015. Our Common Stock began trading on the New York Stock Exchange (“NYSE”) under the symbol “TDOC” on July 1, 2015. The high and low prices of our Common Stock for each quarterly period during the last two fiscal years are as follows:
|
|
|
High |
|
Low |
|
||
|
2015 |
|
|
|
|
|
|
|
|
Third quarter |
|
$ |
34.82 |
|
$ |
20.53 |
|
|
Fourth quarter |
|
$ |
22.81 |
|
$ |
15.61 |
|
|
2016 |
|
|
|
|
|
|
|
|
First quarter |
|
$ |
20.80 |
|
$ |
9.08 |
|
|
Second quarter |
|
$ |
16.30 |
|
$ |
9.28 |
|
|
Third quarter |
|
$ |
19.49 |
|
$ |
13.49 |
|
|
Fourth quarter |
|
$ |
19.10 |
|
$ |
14.00 |
|
The market price of our Common Stock has fluctuated in the past and is likely to fluctuate in the future. Changes in the market price of our Common Stock may result from, among other things:
|
· |
quarter-to-quarter variations in operating results; |
|
· |
operating results being different from our previously announced guidance or from analysts’ estimates or opinions; |
|
· |
changes in analysts’ or financial commentators’ earnings estimates, ratings or opinions; |
|
· |
changes in financial guidance or other forward-looking information; |
|
· |
new products, services or pricing policies introduced by us or our competitors; |
|
· |
acquisitions by us or our competitors; |
|
· |
developments in existing customer relationships; |
|
· |
actual or perceived changes in our business strategy; |
|
· |
developments in new or pending litigation and claims; |
|
· |
sales of large amounts of our Common Stock; |
|
· |
changes in general business or regulatory conditions affecting the healthcare, information technology or Internet industries; |
|
· |
changes in general economic conditions; and |
|
· |
fluctuations in the securities markets in general. |
45
In addition, the market prices of our Common Stock and of the stock of other healthcare technology companies have experienced large fluctuations, sometimes quite rapidly. These fluctuations often may be unrelated to or disproportionate to operating performance.
Holders
On February 27, 2017, there were 132 shareholders of record of our Common Stock.
Dividends
We have never declared or paid any cash dividends on our Common Stock, and we do not anticipate paying cash dividends in the foreseeable future.
Purchase of Equity Securities
We did not purchase any of our registered equity securities during the period covered by this report.
Performance Graph
The following graph compares the cumulative total stockholder return on Teladoc Common Stock with the comparable cumulative return of the Russell 2000 composite index over the period of time covered in the graph. The graph assumes that $100 was invested in Teladoc Common Stock and in each index on July 1, 2015. The stock price performance on the following graph is not necessarily indicative of future stock price performance.
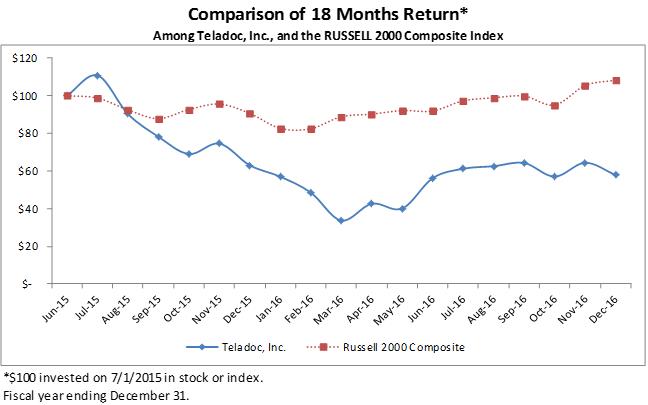
The comparisons in the graph above are provided in response to disclosure requirements of the SEC and are not intended to forecast or be indicative of future performance of the Company’s common stock.
46
Item 6.Selected Financial Data
The following selected consolidated financial data should be read in conjunction with “Management’s Discussion and Analysis of Financial Condition and Results of Operations” and with the Consolidated Financial Statements and notes thereto, which are included elsewhere in this Annual Report.
|
|
|
Year Ended December 31, |
|
|||||||
|
|
|
2016 |
|
2015 |
|
2014 |
|
|||
|
Consolidated Statements of Operations Data (in thousands): |
|
|
|
|
|
|
|
|
|
|
|
Revenue |
|
$ |
123,157 |
|
$ |
77,384 |
|
$ |
43,528 |
|
|
Cost of revenue |
|
|
31,971 |
|
|
21,041 |
|
|
9,929 |
|
|
Gross profit |
|
|
91,186 |
|
|
56,343 |
|
|
33,599 |
|
|
Operating expenses: |
|
|
|
|
|
|
|
|
|
|
|
Advertising and marketing |
|
|
34,720 |
|
|
20,236 |
|
|
7,662 |
|
|
Sales |
|
|
26,243 |
|
|
17,976 |
|
|
11,571 |
|
|
Technology and development |
|
|
21,815 |
|
|
14,210 |
|
|
7,573 |
|
|
Legal |
|
|
4,117 |
|
|
8,878 |
|
|
1,311 |
|
|
Regulatory |
|
|
3,158 |
|
|
2,433 |
|
|
429 |
|
|
Acquisition related costs |
|
|
6,959 |
|
|
551 |
|
|
196 |
|
|
General and administrative |
|
|
48,568 |
|
|
42,981 |
|
|
17,687 |
|
|
Depreciation and amortization |
|
|
8,270 |
|
|
4,863 |
|
|
2,320 |
|
|
Loss from operations |
|
|
(62,664) |
|
|
(55,785) |
|
|
(15,150) |
|
|
Amortization of warrants and loss on extinguishment of debt |
|
|
8,454 |
|
|
— |
|
|
|
|
|
Interest expense, net |
|
|
2,588 |
|
|
2,199 |
|
|
1,499 |
|
|
Net loss before taxes |
|
|
(73,706) |
|
|
(57,984) |
|
|
(16,649) |
|
|
Income tax provision |
|
|
510 |
|
|
36 |
|
|
388 |
|
|
|
|
|
|
|
|
|
|
|
|
|
|
Net loss |
|
$ |
(74,216) |
|
$ |
(58,020) |
|
$ |
(17,037) |
|
|
Net loss per share, basic and diluted |
|
$ |
(1.75) |
|
$ |
(2.91) |
|
$ |
(10.25) |
|
|
Weighted-average shares used to compute basic and diluted net loss per share |
|
|
42,330,908 |
|
|
19,917,348 |
|
|
1,962,845 |
|
|
|
As of December 31, |
|
||||
|
|
2016 |
|
2015 |
|
||
|
Consolidated Balance Sheet Data (in thousands): |
|
|
|
|
|
|
|
Cash, cash equivalents and investments |
$ |
50,015 |
|
$ |
55,066 |
|
|
Working capital |
|
61,645 |
|
|
133,592 |
|
|
Total assets |
|
303,670 |
|
|
229,737 |
|
|
Stockholders’ equity |
|
230,870 |
|
|
178,564 |
|
47
SPECIAL NOTE REGARDING FORWARD‑LOOKING STATEMENTS
Many statements made in this Form 10-K that are not statements of historical fact, including statements about our beliefs and expectations, are forward‑ looking statements and should be evaluated as such. Forward‑looking statements include information concerning possible or assumed future results of operations, including descriptions of our business plan and strategies. These statements often include words such as “anticipates”, “believes”,“suggests”, “targets”, “projects”, “plans”, “expects”, “future”, “intends”, “estimates”, “predicts”, “potential”, “may”, “will”, “should”, “could”, “would”, “likely”, “foresee”, “forecast”, “continue” and other similar words or phrases, as well as statements in the future tense to identify these forward-looking statements. These forward‑looking statements and projections are contained throughout this Form 10-K, including the sections entitled “Form 10-K Summary,” “Risk Factors,” “Management’s Discussion and Analysis of Financial Condition and Results of Operations” and “Business.” We base these forward‑looking statements or projections on our current expectations, plans and assumptions that we have made in light of our experience in the industry, as well as our perceptions of historical trends, current conditions, expected future developments and other factors we believe are appropriate under the circumstances and at such time. As you read and consider this Form 10-K, you should understand that these statements are not guarantees of performance or results. The forward‑looking statements and projections are subject to and involve risks, uncertainties and assumptions and you should not place undue reliance on these forward‑looking statements or projections. Although we believe that these forward‑looking statements and projections are based on reasonable assumptions at the time they are made, you should be aware that many factors could affect our actual financial results or results of operations and could cause actual results to differ materially from those expressed in the forward‑looking statements and projections. Factors that may materially affect such forward‑looking statements and projections include, but are not limited to the following:
|
· |
ongoing legal challenges to, or new state actions against, our business model; |
|
· |
our dependence on our relationships with affiliated professional entities; |
|
· |
evolving government regulations and our ability to stay abreast of new or modified laws and regulations that currently apply or become applicable to our business; |
|
· |
our ability to operate in the heavily regulated healthcare industry; |
|
· |
our history of net losses and accumulated deficit; |
|
· |
the impact of recent healthcare reform legislation and other changes in the healthcare industry; |
|
· |
risk of the loss of any of our significant Clients; |
|
· |
risks associated with a decrease in the number of individuals offered benefits by our Clients or the number of products and services to which they subscribe; |
|
· |
our ability to establish and maintain strategic relationships with third parties; |
|
· |
our ability to recruit and retain a network of qualified Providers; |
|
· |
risk that the insurance we maintain may not fully cover all potential exposures; |
|
· |
rapid technological change in the telehealth market; |
|
· |
any statements of belief and any statements of assumptions underlying any of the foregoing; |
|
· |
other factors disclosed in this Form 10-K; and |
|
· |
other factors beyond our control. |
48
These cautionary statements should not be construed by you to be exhaustive and are made only as of the date of this Form 10-K. We undertake no obligation to update or revise any forward‑looking statements, whether as a result of new information, future events or otherwise. You should evaluate all forward‑looking statements made in this Form 10-K in the context of these risks and uncertainties.
49
MANAGEMENT’S DISCUSSION AND ANALYSIS
OF FINANCIAL CONDITION AND RESULTS OF OPERATIONS
Item 7. Management’s Discussion and Analysis of Financial Condition and Results of Operations
Overview
We are the nation’s first and largest telehealth platform, delivering on-demand healthcare anytime, anywhere, via mobile devices, the Internet, video and phone. Our solution connects consumers, or our Members, with our over 3,000 board-certified physicians and behavioral health professionals who treat a wide range of conditions and cases from acute diagnoses such as upper respiratory infection, urinary tract infection and sinusitis to dermatological conditions, anxiety and smoking cessation. Over 17.5 million unique Members now benefit from access to Teladoc 24 hours a day, seven days a week, 365 days a year. Our solution is delivered with a median response time of less than ten minutes from the time a Member requests a telehealth visit to the time they speak with a Teladoc physician. We completed approximately 952,000 telehealth visits, 576,000 telehealth visits and 300,000 telehealth visits for the year in 2016, 2015 and 2014, respectively. Membership increased by approximately 5.3 million members and 4.1 million members from December 31, 2015 through December 31, 2016 and from December 31, 2014 through December 31, 2015, respectively.
The Teladoc solution is transforming the access, cost and quality dynamics of healthcare delivery for all of our market participants. Our Members rely on Teladoc to remotely access affordable, on-demand healthcare whenever and wherever they choose. Employers, health plans and consumers, or our Clients, purchase our solution to reduce their healthcare spending while at the same time offering convenient, affordable, high-quality healthcare to their employees or beneficiaries. Our network of physicians and other healthcare professionals, or our Providers, have the ability to generate meaningful income and deliver their services more efficiently with no administrative burden. We believe the value proposition of our solution is evidenced by our overall Member satisfaction rate, which has exceeded 90% over the last eight years. We further believe any consumer, employer or health plan or practitioner interested in a better approach to healthcare is a potential Teladoc Member, Client or Provider.
In January 2017, we successfully closed on our Follow-On Offering in which the Company issued and sold 7,885,500 shares of common stock, including the exercise of an underwriter option to purchase additional shares, at an issuance price of $16.75 per share. We received net proceeds of $124.0 million after deducting underwriting discounts and commissions of $7.6 million as well as other offering expenses of $0.5 million. In July 2015, we successfully closed on our initial public offering, or IPO, in which the Company issued and sold 9,487,500 shares of common stock, including the exercise of an underwriter option to purchase additional shares, at an issuance price of $19.00 per share. We received net proceeds of $163.1 million after deducting underwriting discounts and commissions of $12.6 million as well as other offering expenses of $4.5 million. On July 7, 2015, all of the Company’s then-outstanding convertible preferred stock converted into an aggregate of 25.5 million shares of common stock and all of the Company’s redeemable common stock converted into 113,294 shares of common stock.
We generate revenue from our Clients on a contractually recurring, per-Member-per-month, subscription access fee basis, which provides us with significant revenue visibility. In addition, under our large Client contracts, we generate additional revenue on a per-telehealth visit basis, through a visit fee. Subscription access fees are paid by our Clients on behalf of their employees, dependents, beneficiaries or themselves, while visit fees are paid by either Clients or Members. We generated $123.2 million, $77.4 million and $43.5 million in revenue for the years ended December 31, 2016, 2015 and 2014, respectively, representing 59% and 78% year-over-year growth from 2015 to 2016 and from 2014 to 2015. We had net losses of $74.2 million, $58.0 million and $17.0 million for the years ended December 31, 2016, 2015 and 2014, respectively. For both of the years ended December 31, 2016 and 2015, 82% and 18% of our revenue was derived from subscription access fees and visit fees, respectively. For the year ended December 31, 2014, 85% and 15% of our revenue was derived from subscription access fees and visit fees, respectively.
Acquisition History
We have scaled and intend to continue to scale our platform through the pursuit of selective acquisitions. We have completed multiple acquisitions since our inception, which we believe have expanded our distribution capabilities
50
and broadened our service offering.
On July1, 2016, we completed our acquisition of HY Holdings, Inc. d/b/a HealthiestYou Corporation, or HealthiestYou, for aggregate consideration of $151.5 million, comprised of $43.2 million of cash and $108.3 million of our common stock (or 6,955,796 shares), net of cash acquired. HealthiestYou is a leading telehealth consumer engagement technology platform for the small to mid-sized employer market. HealthiestYou provides end-users with access to telemedicine services including through a web-based portal and a mobile application. Solutions provided by HealthiestYou include 24/7 access to telephone, e-mail, and video conferencing with doctors as well as the convenience of procedure price comparisons, prescription medicine price comparisons, health plan information and benefits eligibility, and location information for wellness service providers.
On July 31, 2015, we acquired certain assets from Gateway to Provider Access, In., or Gateway, which is engaged in the marketing, selling and administering our services through other third parties.
On June 17, 2015, we completed our acquisition of Stat Health Services Inc., or StatDoc, for aggregate consideration of $30.1 million, comprised of $13.3 million of cash and $16.8 million of our common stock (or 1,051,033 shares), net of cash acquired. StatDoc is a telehealth provider, focused on managed care, health system and self-insured clients.
In January 2015, we completed the acquisition of Compile, Inc. d/b/a BetterHelp, or BetterHelp, a provider of direct-to-consumer, behavioral health services, for $3.3 million net of cash acquired, and a $1.0 million promissory note and we have agreed to make annual payments to the sellers equal to a percentage of the total net revenue generated by the BetterHelp business for each of the next four years. This acquisition helped us broaden our service into the direct-to-consumer and behavioral health sector.
In May 2014, we acquired AmeriDoc, LLC, or AmeriDoc, for $17.2 million, net of cash acquired. AmeriDoc specialized in providing telehealth solutions to small and medium-sized businesses through broker distribution channels. This acquisition added new distribution opportunities that we believe are an important element of our growth strategy.
Key Factors Affecting Our Performance
Number of Members. Our revenue growth rate and long-term profitability are affected by our ability to increase our number of Members because we derive a substantial portion of our revenue from subscription access fees via Client contracts that provide Members access to our professional Provider network in exchange for a contractual based monthly fee. Revenue is driven primarily by the number of Clients, the number of Members in a Client’s population, the number of services contracted for by a Client and the contractually negotiated prices of our services and the negotiated pricing that is specific to that particular Client. We believe that increasing our membership is an integral objective that will provide us with the ability to continually innovate our services and support initiatives that will enhance Member‘s experiences. Membership increased by approximately 5.3 million members from December 31, 2015 through December 31, 2016 and increased by approximately 4.1 million members from December 31, 2014 through December 31, 2015.
Number of Visits. We also realize revenue in connection with the completion of a visit for the majority of our contracts. Accordingly, our visit revenue, or visit fees, increase as the number of visits increase. Visit fee revenue is driven primarily by the number of Clients, the number of Members in a Client’s population, Member utilization of our Provider network services and the contractually negotiated prices of our services. We believe that increasing our current Member utilization rate is a key objective in order for our Clients to realize tangible healthcare savings with our service.
Seasonality. We typically experience the strongest increases in consecutive quarterly revenue during the fourth and first quarters of each year, which coincides with traditional annual benefit enrollment seasons. In particular, as a result of many Clients’ introduction of new services at the very end of the current year, or the start of each year, the majority of our new Client contracts have an effective date of January 1. Additionally, as a result of national seasonal cold and flu trends, we experience our highest level of visit fees during the first and fourth quarters of each year when compared to other quarters of the year. Conversely, the second quarter of the year has historically been the period of
51
lowest utilization of our Provider network services relative to the other quarters of the year. See “Risk Factors—Risks Related to Our Business—Our quarterly results may fluctuate significantly, which could adversely impact the value of our common stock.” included elsewhere in this Annual Report on Form 10-K.
Components of Results of Operations
Revenue
We generate in excess of 80% of our revenue from our Clients who purchase access to our professional Provider network for their employees, dependents and other beneficiaries. Our Client contracts include a per-Member-per-month subscription access fee and for the majority of our contracts, a visit fee for each completed visit, which is either paid to us by the Client, the Member or both parties. Accordingly, we generate subscription access revenue from our subscription access fees and visit revenue from our visit fees.
Subscription access revenue accounted for approximately 82%, 82% and 85% of our total revenue during the years ended December 31, 2016, 2015 and 2014, respectively. Subscription access revenue is driven primarily by the number of Clients, the number of Members in a Client’s population, the number of services contracted for by a Client and the contractually negotiated prices of our services. Visit fee revenue is driven primarily by the number of Clients, the number of Members in a Client’s population, Member utilization of our professional Provider network services and the contractually negotiated prices of our services.
We recognize subscription access fees monthly when the following criteria are met: (i) there is an executed subscription agreement, (ii) the Member has access to the service, (iii) collection of the fees is reasonably assured and (iv) the amount of fees to be paid by the Client and Member is fixed and determinable. Our agreements generally have a term of one year. The majority of Clients renew their contracts with us following their first year of services. We generally invoice our Members in advance on a monthly basis. Visit fees are recognized as incurred and billed in arrears.
Warranties and Indemnification
Our arrangements generally include certain provisions for indemnifying Clients against liabilities if there is a breach of a Client’s data or if our service infringes a third party’s intellectual property rights. To date, we have not incurred any material costs as a result of such indemnifications.
We have also agreed to indemnify our directors and executive officers for costs associated with any fees, expenses, judgments, fines and settlement amounts incurred by any of these persons in any action or proceeding to which any of those persons is, or is threatened to be, made a party by reason of the person’s service as a director or officer, including any action by us, arising out of that person’s services as our director or officer or that person’s services provided to any other company or enterprise at our request. We maintain director and officer liability insurance coverage that would generally enable us to recover a portion of any future amounts paid. We may also be subject to indemnification obligations by law with respect to the actions of our employees under certain circumstances and in certain jurisdictions.
Concentrations of Risk and Significant Clients
Our financial instruments that are exposed to concentrations of credit risk consist primarily of cash and cash equivalents, short-term investments and accounts receivable. Although we deposit our cash with multiple financial institutions, our deposits, at times, may exceed federally insured limits. Our short-term investments are comprised of a portfolio of diverse high credit rating instruments with maturity durations of one year or less.
During the year ended December 31, 2016 and 2015, substantially all of our revenue was generated by Clients located in the United States. During the year ended 2014, all of our revenue was generated by clients located in the United States. One Client represented 11% of accounts receivable at December 31, 2016. No Client represented over 10% of accounts receivable at December 31, 2015 or revenue for the years ended December 31, 2016 and 2015.
52
Cost of Revenue
Cost of revenue primarily consists of fees paid to our Providers, costs incurred in connection with our Provider network operations, which include employee-related expenses (including salaries and benefits), costs related to our call center activities and insurance, which includes coverage for medical malpractice claims. Cost of revenue is driven primarily by the number of visits completed in each period. Many of the elements of the cost of revenue are relatively variable and semi-variable, and can be reduced in the near-term to offset any decline in our revenue. Our business and operational models are designed to be highly scalable and leverage variable costs to support revenue-generating activities. While we currently expect to grow our headcount to continue to build our Provider network operations center and to enhance our sales and technology capabilities and support business growth, we believe our increased investment in automation and integration capabilities and economies of scale in our Provider network operations center operating model, will position us to grow our revenue at a greater rate than our cost of revenue.
Gross Profit
Our gross profit is our total revenue minus our total cost of revenue, and we also express our gross profit as a percentage of our total revenue. Our gross profit has been and will continue to be affected by a number of factors, including the fees we charge our Clients, the number of visits we complete and the costs of running our Provider network operations center. We expect our annual gross profit to remain relatively consistent over the near term, although our quarterly gross profit is expected to fluctuate from period to period depending on the interplay of these aforementioned factors.
Advertising and Marketing Expenses
Advertising and marketing expenses consist primarily of personnel and related expenses for our marketing staff, including costs of digital advertisements, communications materials that are produced to generate greater awareness and utilization among our Clients and Members. Marketing costs also include third-party independent research, trade shows and brand messages, public relations costs and stock-based compensation for our advertising and marketing employees. Our advertising and marketing expenses exclude certain allocations of occupancy expense as well as depreciation and amortization.
We expect our advertising and marketing expenses to increase for the foreseeable future as we continue to increase the size of our advertising and marketing operations and expand into new products and markets. Our advertising and marketing expenses will fluctuate as a percentage of our total revenue from period to period due to the seasonality of our total revenue and the timing and extent of our advertising campaigns and marketing expenses. We will continue to invest in advertising and marketing by hiring additional personnel and promoting our brand through a variety of marketing and public relations activities.
Sales Expenses
Sales expenses consist primarily of employee-related expenses, including salaries, benefits, commissions, employment taxes, travel and stock-based compensation costs for our employees engaged in sales, account management and sales support. Our sales expenses exclude certain allocations of occupancy expense as well as depreciation and amortization.
We expect our sales expenses to increase as we strategically invest to expand our business and to capture an increasing amount of our market opportunity. As we scale our sales and related account management and sales support personnel in the short- to medium-term, we expect these expenses to increase.
Technology and Development Expenses
Technology and development expenses include personnel and related expenses for software engineering, information technology infrastructure, security and compliance and product development. Technology and development expenses also include outsourced software engineering services, the costs of operating our on-demand technology infrastructure and stock-based compensation for our technology and development employees. Our technology and
53
development expenses exclude certain allocations of occupancy expense as well as depreciation and amortization.
We expect our technology and development expenses to increase for the foreseeable future as we continue to invest in the development of our technology platform. Our technology and development expenses may fluctuate as a percentage of our total revenue from period to period due to the seasonality of our total revenue and the timing and extent of our technology and development expenses. Historically, the majority of our technology and development expenses has been expensed.
Legal and Regulatory Expenses
Legal and regulatory expenses include professional fees incurred. Our legal and regulatory expenses exclude certain allocations of personnel and related expenses, occupancy expense as well as depreciation and amortization.
Acquisition Related Costs
Acquisition related costs include legal, accounting and certain non-cash, non-recurring transaction costs related to mergers and acquisitions.
General and Administrative Expenses
General and administrative expenses include personnel and related expenses of, and professional fees incurred by, our executive, finance, product development, business development, operations and human resources departments. They also include stock-based compensation and most of the facilities costs including utilities and facilities maintenance. Our general and administrative expenses exclude any allocation of depreciation and amortization.
We expect our general and administrative expenses to increase for the foreseeable future due to costs that we incur as a public enterprise, as well as other costs associated with continuing to grow our business. However, we expect our general and administrative expenses to decrease as a percentage of our total revenue over the next several years. Our general and administrative expenses may fluctuate as a percentage of our total revenue from period to period due to the seasonality of our total revenue and the timing and extent of our general and administrative expenses.
Depreciation and Amortization
Depreciation and amortization consists primarily of depreciation of fixed assets, amortization of capitalized software development costs and amortization of acquisition-related intangible assets.
Amortization of Warrants and Loss on Extinguishment of Debt
Amortization of warrants and loss on extinguishment of debt consists of the recognition of the amortization of the fair value of warrants in connection with Silicon Valley Bank, or SVB, indebtedness for the July 2016 Mezzanine Term Loan and the write-off of origination and termination financing fees and related deferred cost.
Interest Expense, Net
Interest expense, net consists of interest activity associated with our bank, other debt and short-term investments.
Income Tax Provision
We account for income taxes using the liability method, under which deferred tax assets and liabilities are determined based on the future tax consequences attributable to differences between the financial reporting carrying amounts of existing assets and liabilities and their respective tax bases and tax credit and NOLs. Deferred tax assets and liabilities are measured using the enacted tax rates that are expected to be in effect when the differences are expected to reverse. We assess the likelihood that deferred tax assets will be recovered from future taxable income, and a valuation allowance is established when necessary to reduce deferred tax assets to the amounts more likely than not expected to be
54
realized. We have also recorded deferred tax liabilities arising principally from the difference between treatment of the goodwill between tax and financial accounting book purposes. We have provided a full valuation allowance for our deferred tax assets at December 31, 2016 and 2015, due to the uncertainty surrounding the future realization of such assets.
Consolidated Results of Operations
The following table sets forth our consolidated statement of operations data for the years ended December 31, 2016, 2015 and 2014 and the dollar and percentage change between the respective periods (dollar in thousands):
|
|
|
|
Year Ended December 31, |
|
|||||||||||||||||||
|
|
|
|
2016 |
|
|
|
|
|
|
|
2015 |
|
|
|
|
|
|
|
2014 |
|
|||
|
|
|
|
$ |
|
Variance |
|
% |
|
|
$ |
|
Variance |
|
% |
|
|
$ |
|
|||||
|
Revenue |
|
|
$ |
123,157 |
|
$ |
45,773 |
|
59 |
% |
|
$ |
77,384 |
|
$ |
33,856 |
|
78 |
% |
|
$ |
43,528 |
|
|
Cost of revenue |
|
|
|
31,971 |
|
|
10,930 |
|
52 |
% |
|
|
21,041 |
|
|
11,112 |
|
112 |
% |
|
|
9,929 |
|
|
Gross profit |
|
|
|
91,186 |
|
|
34,843 |
|
62 |
% |
|
|
56,343 |
|
|
22,744 |
|
68 |
% |
|
|
33,599 |
|
|
Operating expenses: |
|
|
|
|
|
|
|
|
|
|
|
|
|
|
|
|
|
|
|
|
|
|
|
|
Advertising and marketing |
|
|
|
34,720 |
|
|
14,484 |
|
72 |
% |
|
|
20,236 |
|
|
12,574 |
|
164 |
% |
|
|
7,662 |
|
|
Sales |
|
|
|
26,243 |
|
|
8,267 |
|
46 |
% |
|
|
17,976 |
|
|
6,405 |
|
55 |
% |
|
|
11,571 |
|
|
Technology and development |
|
|
|
21,815 |
|
|
7,605 |
|
54 |
% |
|
|
14,210 |
|
|
6,637 |
|
88 |
% |
|
|
7,573 |
|
|
Legal |
|
|
|
4,117 |
|
|
(4,761) |
|
-54 |
% |
|
|
8,878 |
|
|
7,567 |
|
577 |
% |
|
|
1,311 |
|
|
Regulatory |
|
|
|
3,158 |
|
|
725 |
|
30 |
% |
|
|
2,433 |
|
|
2,004 |
|
467 |
% |
|
|
429 |
|
|
Acquisition related costs |
|
|
|
6,959 |
|
|
6,408 |
|
NM |
% |
|
|
551 |
|
|
354 |
|
181 |
% |
|
|
196 |
|
|
General and administrative |
|
|
|
48,568 |
|
|
5,587 |
|
13 |
% |
|
|
42,981 |
|
|
25,294 |
|
143 |
% |
|
|
17,687 |
|
|
Depreciation and amortization |
|
|
|
8,270 |
|
|
3,407 |
|
70 |
% |
|
|
4,863 |
|
|
2,543 |
|
110 |
% |
|
|
2,320 |
|
|
Loss from operations |
|
|
|
(62,664) |
|
|
(6,879) |
|
12 |
% |
|
|
(55,785) |
|
|
(40,635) |
|
268 |
% |
|
|
(15,150) |
|
|
Amortization of warrants and loss on extinguishment of debt |
|
|
|
8,454 |
|
|
8,454 |
|
NM |
% |
|
|
— |
|
|
— |
|
— |
% |
|
|
— |
|
|
Interest expense, net |
|
|
|
2,588 |
|
|
389 |
|
18 |
% |
|
|
2,199 |
|
|
700 |
|
47 |
% |
|
|
1,499 |
|
|
Net loss before taxes |
|
|
|
(73,706) |
|
|
(15,722) |
|
27 |
% |
|
|
(57,984) |
|
|
(41,335) |
|
248 |
% |
|
|
(16,649) |
|
|
Income tax provision |
|
|
|
510 |
|
|
474 |
|
NM |
% |
|
|
36 |
|
|
(352) |
|
-91 |
% |
|
|
388 |
|
|
Net loss |
|
|
$ |
(74,216) |
|
$ |
(16,196) |
|
28 |
% |
|
$ |
(58,020) |
|
$ |
(40,983) |
|
241 |
% |
|
$ |
(17,037) |
|
NM – not meaningful
Adjusted EBITDA
The following table reconciles net loss to EBITDA and Adjusted EBITDA for the years ended December 31, 2016, 2015 and 2014 (in thousands):
|
|
|
|
Year Ended |
|
|||||||
|
|
|
|
December 31, |
|
|||||||
|
|
|
|
2016 |
|
2015 |
|
2014 |
|
|||
|
Net loss |
|
|
$ |
(74,216) |
|
$ |
(58,020) |
|
$ |
(17,037) |
|
|
Add (deduct): |
|
|
|
|
|
|
|
|
|
|
|
|
Interest expense, net |
|
|
|
2,588 |
|
|
2,199 |
|
|
1,499 |
|
|
Income tax provision |
|
|
|
510 |
|
|
36 |
|
|
388 |
|
|
Depreciation expense |
|
|
|
2,176 |
|
|
1,133 |
|
|
335 |
|
|
Amortization expense |
|
|
|
6,094 |
|
|
3,730 |
|
|
1,985 |
|
|
EBITDA(1) |
|
|
|
(62,848) |
|
|
(50,922) |
|
|
(12,830) |
|
|
Stock-based compensation |
|
|
|
7,723 |
|
|
3,075 |
|
|
533 |
|
|
Amortization of warrants and loss on extinguishment of debt |
|
|
|
8,454 |
|
|
— |
|
|
— |
|
|
Acquisition related costs |
|
|
|
6,959 |
|
|
551 |
|
|
196 |
|
|
Adjusted EBITDA(2) |
|
|
$ |
(39,712) |
|
$ |
(47,296) |
|
$ |
(12,101) |
|
|
(1) |
EBITDA consists of net loss before interest, taxes, depreciation and amortization. |
55
|
(2) |
Adjusted EBITDA |
To supplement our financial information presented in accordance with generally accepted accounting principles in the United States, or U.S. GAAP, we use the following additional non-U.S. GAAP financial measures to clarify and enhance an understanding of past performance: Adjusted EBITDA. We believe that the presentation of this financial measure enhances an investor’s understanding of our financial performance. We further believe that this financial measure is a useful financial metric to assess our operating performance from period-to-period by excluding certain items that we believe are not representative of our core business. We use certain financial measures for business planning purposes and in measuring our performance relative to that of our competitors. We utilize Adjusted EBITDA as the primary measure of our performance.
Adjusted EBITDA consists of net loss before interest, taxes, depreciation, amortization and stock-based compensation, amortization of warrants and loss on extinguishment of debt and acquisition related costs related to mergers and acquisitions. We believe that making such adjustment provides investors meaningful information to understand our results of operations and ability to analyze financial and business trends on a period-to-period basis.
We believe these financial measures are commonly used by investors to evaluate our performance and that of our competitors. However, our use of the term Adjusted EBITDA may vary from that of others in our industry. Adjusted EBITDA should not be considered as an alternative to net loss before taxes, net loss, loss per share or any other performance measures derived in accordance with U.S. GAAP as measures of performance.
Adjusted EBITDA has an important limitation as an analytical tool and you should not consider it in isolation or as a substitute for analysis of our results as reported under U.S. GAAP. Some of these limitations are:
Adjusted EBITDA:
|
· |
does not reflect the significant interest expense on our debt; and |
|
· |
does not reflect the significant non cash stock compensation expense which should be viewed as a component of recurring operating costs; and |
|
· |
does not reflect the significant non-recurring charge associated with the amortization of warrants and loss on extinguishment of debt; and |
|
· |
does not reflect the significant acquisition related costs related to mergers and acquisitions; and |
|
· |
eliminates the impact of income taxes on our results of operations; and |
|
· |
although depreciation and amortization are non-cash charges, the assets being depreciated and amortized will often have to be replaced in the future, and Adjusted EBITDA does not reflect any expenditures for such replacements; and |
|
· |
other companies in our industry may calculate Adjusted EBITDA differently than we do, limiting the usefulness of adjusted EBITDA as comparative measures. |
We compensate for these limitations by using Adjusted EBITDA along with other comparative tools, together with U.S. GAAP measurements, to assist in the evaluation of operating performance. Such U.S. GAAP measurements include gross profit, net loss, net loss per share and other performance measures.
In evaluating these financial measures, you should be aware that in the future we may incur expenses similar to those eliminated in this presentation. Our presentation of Adjusted EBITDA should not be construed as an inference that our future results will be unaffected by unusual or nonrecurring items.
56
Consolidated Results of Operations Discussion
We completed our acquisitions of HealthiestYou on July 1, 2016, Gateway on July 31, 2015, StatDoc on June 17, 2015, BetterHelp on January 23, 2015 and AmeriDoc on May 1, 2014. The results of operations of all acquisitions have been included in our audited consolidated financial statements from their respective acquisition dates.
Revenue. Total revenue was $123.2 million for the year ended December 31, 2016, compared to $77.4 million during the year ended December 31, 2015, an increase of $45.8 million, or 59%. The increase in revenue was substantially driven by an increase in new Clients and the number of new Members generating additional subscription access fees and visit fees. The increase in subscription access fees was due to the addition of new Clients, both organically and through acquisitions, as the number of Members increased by 59% from December 31, 2015 to December 31, 2016. We experienced 952,000 visits, representing $22.7 million of visit fees for the year ended December 31, 2016, compared to 575,689 visits, representing $14.1 million of visit fees during the year ended December 31, 2015, an increase of $8.6 million, or 61%.
Total revenue was $77.4 million for the year ended December 31, 2015, compared to $43.5 million during the year ended December 31, 2014, an increase of $33.9 million, or 78%. The increase in revenue was substantially driven by an increase in new Clients and the number of new Members generating additional subscription access fees and visit fees. The increase in subscription access fees was due to the addition of new Clients, both organically and through acquisitions, as the number of Members increased by 51% from December 31, 2014 to December 31, 2015. We experienced 575,689 visits, representing $14.1 million of visit fees for the year ended December 31, 2015, compared to 298,833 visits, representing $6.5 million of visit fees during the year ended December 31, 2014, an increase of $7.6 million, or 116%.
Cost of Revenue. Cost of revenue was $32.0 million for the year ended December 31, 2016 compared to $21.0 million for the year ended December 31, 2015, an increase of $11.0 million, or 52%. The increase was primarily due to increased telehealth visits resulting in increased provider fees and call center costs, increased medical malpractice insurance costs, and hiring of additional personnel to manage our provider network operations centers.
Cost of revenue was $21.0 million for the year ended December 31, 2015 compared to $9.9 million for the year ended December 31, 2014, an increase of $11.1 million, or 112%. The increase was primarily due to increased telehealth visits resulting in increased provider fees and call center costs, increased medical malpractice insurance costs, and hiring of additional personnel to manage our provider network operations centers.
Gross Profit. Gross profit was $91.2 million, or 74% as a percentage of revenue, for the year ended December 31, 2016 compared to $56.3 million, or 73%, as a percentage of revenue, for the year ended December 31, 2015, an increase of $34.9 million, or 62%. The increase is the result of the aforementioned revenue and cost of revenue growth.
Gross profit was $56.3 million, or 73% as a percentage of revenue, for the year ended December 31, 2015 compared to $33.6 million, or 77%, as a percentage of revenue, for the year ended December 31, 2014, an increase of $22.7 million, or 68%. The increase is the result of the aforementioned revenue and cost of revenue growth. Additionally, increased visit volume, resulting in greater mix of visit revenue to total revenue and their associated costs negatively impacted gross profit as a percentage of revenue for the year ended December 31, 2015.
Advertising and Marketing Expenses. Advertising and marketing expenses were $34.7 million for the year ended December 31, 2016 compared to $20.2 million for the year ended December 31, 2015, an increase of $14.5 million, or 72%. This increase primarily consisted of increased member engagement initiatives, increased digital advertising, sponsorship of professional organizations and trade shows of $12.3 million, increased staffing and employee-related expenses of $1.6 million and other expenses of $0.6 million.
Advertising and marketing expenses were $20.2 million for the year ended December 31, 2015 compared to $7.7 million for the year ended December 31, 2014, an increase of $12.5 million, or 164%. This increase primarily consisted of increased member engagement initiatives, increased digital advertising, sponsorship of professional organizations and trade shows of $11.2 million, increased staffing and employee-related expenses of $1.1 million and
57
other expenses of $0.2 million.
Sales Expenses. Sales expenses were $26.2 million for the year ended December 31, 2016 compared to $18.0 million for the year ended December 31, 2015, an increase of $8.2 million, or 46%. This increase primarily consisted of increased staffing and employee-related expenses including sales commissions of $6.6 million, increased travel and entertainment expenses of $0.3 million and an increase to other sales expenses of $1.3 million.
Sales expenses were $18.0 million for the year ended December 31, 2015 compared to $11.6 million for the year ended December 31, 2014, an increase of $6.4 million, or 55%. This increase primarily consisted of increased staffing and employee-related expenses including sales commissions of $5.1 million, increased travel and entertainment expenses of $0.7 million and an increase to other sales expenses of $0.6 million.
Technology and Development Expenses. Technology and development expenses were $21.8 million for the year ended December 31, 2016 compared to $14.2 million for the year ended December 31, 2015, an increase of $7.6 million, or 54%. This increase resulted primarily from hiring additional personnel totaling $6.4 million, and ongoing projects to improve and optimize our technology platform and other expenses of $1.2 million.
Technology and development expenses were $14.2 million for the year ended December 31, 2015 compared to $7.6 million for the year ended December 31, 2014, an increase of $6.6 million, or 88%. This increase resulted primarily from hiring additional personnel totaling $6.5 million, increase in other expenses of $0.1 million.
Legal Expenses. Legal expenses were $4.1 million for the year ended December 31, 2016 compared to $8.9 million for the year ended December 31, 2015, a decrease of $4.8 million, or 54%. This decrease resulted primarily from lower legal fees incurred in connection with the Company’s legal actions in Texas.
Legal expenses were $8.9 million for the year ended December 31, 2015 compared to $1.3 million for the year ended December 31, 2014, an increase of $7.6 million, or 577%. This increase resulted primarily from the increased activities required in connection with the Company’s legal actions in Texas.
Regulatory Expenses. Regulatory expenses were $3.1 million for the year ended December 31, 2016 compared to $2.4 million for the year ended December 31, 2015, an increase of $0.7 million, or 30%. This increase resulted primarily from the increased activities required in connection with the Company’s legal efforts in Texas and certain other states.
Regulatory expenses were $2.4 million for the year ended December 31, 2015 compared to $0.4 million for the year ended December 31, 2014, an increase of $2.0 million, or 467%. This increase resulted primarily from the Company’s increased activities in Texas and certain other states.
Acquisition Related Costs. Acquisition related costs were $7.0 million for the year ended December 31, 2016 compared to $0.6 million for the year ended December 31, 2015, an increase of $6.4 million. This increase was primarily due to $5.7 million of contract termination costs related to HealthiestYou for certain third party providers. The contract termination costs of $5.7 million were previously accrued by HealthiestYou and reflected in HealthiestYou’s financial statements as of June 30, 2016, prior to the acquisition. These principally non-cash expenses are reflected in the Company’s 2016 results as the Company had determined that it will benefit from the termination of these contracts.
Acquisition related costs were $0.6 million for the year ended December 31, 2015 compared to $0.2 million for the year ended December 31, 2014, an increase of $0.4 million due to increased acquisition related activities.
General and Administrative Expenses. General and administrative expenses were $48.6 million for the year ended December 31, 2016 compared to $43.0 million for the year ended December 31, 2015, an increase of $5.6 million, or 13%. This increase was driven in part by an increase in employee-related expenses of approximately $7.7 million as a result of growth in overall full time employee headcount to 670 at December 31, 2016 as compared to 595 at December 31, 2015, and was primarily due to the establishment of our call center which migrated activities from a third-party provider during 2015. Additionally, costs incurred in our provider network operations centers in connection with
58
enhancing our Member services decreased by $1.5 million. Professional fees, decreased by $0.6 million for the year ended December 31, 2016 as compared to December 31, 2015. Other expenses, which include office-related charges and bank charges, severance costs, lease costs including costs associated with abandoned facilities and bad debt expenses, increased to $14.3 million for the year ended December 31, 2016 from $14.1 million for the year ended December 31, 2015, an increase of $0.2 million.
General and administrative expenses were $43.0 million for the year ended December 31, 2015 compared to $17.7 million for the year ended December 31, 2014, an increase of $25.3 million, or 143%. This increase was driven in part by an increase in employee-related expenses of approximately $13.9 million as a result of growth in overall full time employee headcount to 595 at December 31, 2015 as compared to 222 at December 31, 2014, and was primarily due to the aforementioned establishment of our call center during 2015. Professional fees, increased by $2.9 million for the year ended December 31, 2015 as compared to December 31, 2014. Severance costs, impairment of capitalized software development costs, new office lease costs, costs associated with abandoned facilities and bad debt expenses, increased to $14.1 million for the year ended December 31, 2015 from $5.6 million for the year ended December 31, 2014, an increase of $8.5 million.
Depreciation and Amortization. Depreciation and amortization was $8.3 million for the year ended December 31, 2016 compared to $4.9 million for the year ended December 31, 2015, an increase of $3.4 million, or 70%. This increase was due to additional amortization expense primarily related to acquisition-related intangible assets that increased from $20.9 million at December 31, 2015 to $36.6 million at December 31, 2016 and an increase in depreciation expense on an increased base of depreciable fixed assets that increased from $7.5 million at December 31, 2015 to $11.7 million at December 31, 2016.
Depreciation and amortization was $4.9 million for the year ended December 31, 2015 compared to $2.3 million for the year ended December 31, 2014, an increase of $2.6 million, or 110%. This increase was due to additional amortization expense primarily related to acquisition-related intangible assets that increased from $10.1 million at December 31, 2014 to $20.9 million at December 31, 2015 and an increase in depreciation expense on an increased base of depreciable fixed assets that increased from $2.3 million at December 31, 2014 to $7.5 million at December 31, 2015.
Amortization of Warrants and Loss on Extinguishment of Debt. Amortization of warrants and loss on extinguishment of debt was $8.5 million for the year ended December 31, 2016 and none for the year ended December 31, 2015. As a result of the July 2016 refinancing, the Company determined that the July 2016 Mezzanine Term Loan represented an extinguishment of the original SVB Mezzanine Term Loan and recorded a one-time charge associated with the amortization of warrants and loss on extinguishment of debt of $8.5 million. The amortization of warrants and loss on extinguishment of debt includes the write-off of loan origination fees paid to SVB, deferred debt costs associated with the original Mezzanine Term Loan and the $7.7 million non-cash fair value of the warrants issued to affiliates of SVB in connection with the July 2016 Mezzanine Term Loan.
Interest Expense, Net. Interest expense, net consists of interest costs associated with our bank and other debt and interest income from short-term investments in marketable securities. Interest expense, net was $2.6 million and $2.2 million for the years ended December 31, 2016 and 2015, respectively. The increase in interest expense reflects higher outstanding debt and costs associated with the refinancing.
Interest expense, net was $2.2 million and $1.5 million for the years ended December 31, 2015 and 2014, respectively. The increase in interest expense reflects higher outstanding debt offset by interest income from our IPO proceeds.
59
Liquidity and Capital Resources
The following table presents a summary of our cash flow activity for the periods set forth below (in thousands):
|
|
|
Year Ended |
|
|||||||
|
|
|
December 31, |
|
|||||||
|
|
|
2016 |
|
2015 |
|
2014 |
|
|||
|
Consolidated Statements of Cash Flows Data |
|
|
|
|
|
|
|
|
|
|
|
Net cash used in operating activities |
|
$ |
(51,795) |
|
$ |
(47,181) |
|
$ |
(11,359) |
|
|
Net cash provided by (used in) investing activities |
|
|
26,146 |
|
|
(108,203) |
|
|
(15,578) |
|
|
Net cash provided by financing activities |
|
|
20,598 |
|
|
164,014 |
|
|
70,161 |
|
|
Total |
|
$ |
(5,051) |
|
$ |
8,630 |
|
$ |
43,224 |
|
Since our inception, we have financed our operations primarily through private sales of equity securities and to a lesser extent, bank borrowings. In July 2015, we received $163.1 million of net cash proceeds associated with the issuance of 9,487,500 shares of common stock in conjunction with our IPO, after deducting underwriting discounts and commissions of $12.6 million as well as other offering expenses of $4.5 million.
Our principal sources of liquidity were cash and cash equivalents totaling $50.0 million as of December 31, 2016, which were held for working capital purposes. In addition, we have $15.8 million of short-term investments in marketable securities. Our cash and cash equivalents and short term investments are comprised of money market funds and marketable securities.
In January 2017, we successfully closed on a follow-on public offering, or our Follow-On Offering, in which the Company issued and sold 7,887,500 shares of common stock, including the exercise of an underwriter option to purchase additional shares, at an issuance price of $16.75 per share. We received net proceeds of $124.0 million after deducting underwriting discounts and commissions of $7.6 million as well as other offering expenses of $0.5 million.
Cash Used in Operating Activities
For the year ended December 31, 2016, cash used in operating activities was $51.8 million. The negative cash flows resulted primarily from our net loss of $74.2 million, partially offset by depreciation and amortization of $8.3 million, allowance for doubtful accounts of $2.4 million, stock-based compensation of $7.7 million, deferred income taxes of $0.5 million, accretion of interest of $0.2 million, and amortization of warrants of $7.7 million. These items are offset by the effect of changes in working capital and other balance sheet accounts resulting in cash inflows of approximately $4.4 million, all of which was the result of growth of the business.
For the year ended December 31, 2015, cash used in operating activities was $47.2 million. The negative cash flows resulted primarily from our net loss of $58.0 million, partially offset by depreciation and amortization of $4.9 million, allowance for doubtful accounts of $2.0 million, stock-based compensation of $3.1 million, accretion of interest of $0.5 million, and impairment in long lived assets of $0.8 million. These items are offset by the effect of changes in working capital and other balance sheet accounts resulting in cash inflows of approximately $0.4 million, all of which was the result of growth of the business.
For the year ended December 31, 2014, cash used in operating activities was $11.4 million. The cash used primarily related to our net loss of $17.0 million, partially offset by depreciation and amortization of $2.3 million, allowance for doubtful accounts of $1.3 million, deferred income taxes of $0.4 million, and stock-based compensation of $0.5 million, as well as the effect of changes in working capital and other balance sheet accounts resulting in cash inflows of approximately $1.0 million, all of which was due to year-over-year growth.
The increase in cash used in operating activities was primarily the result of additional headcount, increased advertising and marketing expenses, costs incurred to improve and optimize our technology platform, increases in our provider network operations centers, increased legal fees and office-related charges to support the growth of our business.
60
Cash Provided by (Used in) Investing Activities
Cash provided by investing activities was $26.1 million for the year ended December 31, 2016. Cash provided by investing activities consisted of net proceeds from short-term marketable securities of $66.6 million. Cash used in investing activities consisted of acquisition of HealthiestYou which required payments of $37.0 million, the purchase of property and equipment totaling $2.1 million and investments in internally developed capitalized software of $1.3 million.
Cash used in investing activities was $108.2 million for the year ended December 31, 2015. Cash used in investing activities consisted of purchases of short-term marketable securities of $82.6 million, net of sales, the acquisitions of BetterHelp, StatDoc and Gateway which included payments of $3.3 million, $12.9 million and $1.5 million net of cash acquired, respectively, the purchase of property and equipment totaling $6.3 million and investments in internally developed capitalized software of $1.5 million.
Cash used in investing activities was $15.6 million for the year ended December 31, 2014. Cash used in investing activities consisted of the acquisition of AmeriDoc, which included cash payments of $13.8 million, and of purchases of property and equipment totaling $1.1 million and investments in internally developed capitalized software of $0.7 million.
Cash Provided by Financing Activities
In January 2017, we generated cash proceeds from our Follow-On Offering. In July 2015, we generated cash proceeds from our IPO. Prior to our IPO, our primary financing activities have consisted of private sales of preferred stock and bank and other borrowings.
Cash provided by financing activities for the year ended December 31, 2016 was $20.6 million. Cash provided by financing activities consisted of $29.5 million borrowed under the Revolving Advance Facility and $2.5 million of proceeds from the exercise of employee stock options and $0.3 million from the issuance of common stock. Cash used in financing activities consisted of the repayment of $11.7 million under the Revolving Advance Facility and the Amended and Restated Subordinated Promissory Note.
Cash provided by financing activities for the year ended December 31, 2015 was $164.0 million. Cash provided by financing activities consisted of $163.1 million of net cash proceeds from our IPO, an additional $6.8 million borrowed under the SVB Revolving Advance Facility and $0.4 million of proceeds from the exercise of employee stock options. Cash used in financing activities consisted of the repayment of $6.3 million under the Revolving Advance Facility and the Amended and Restated Subordinated Promissory Note.
Cash provided by financing activities was $70.2 million for the year ended December 31, 2014. Cash provided by financing activities was primarily attributable to the issuance of preferred stock of $50.1 million, $19.7 million borrowed under the SVB Revolving Advance Facility, Term Loan Facility and Mezzanine Term Loans, $0.7 million of proceeds from the exercise of employee stock options offset by the Company purchases of $0.3 million of preferred and common stock.
Looking Forward
As a result of our recent Follow-On Offering and IPO, we received $124.0 million and $163.1 million of net cash proceeds in January 2017 and July 2015, respectively. Currently, we anticipate negative EBITDA results through the end of 2017.
We believe that our existing cash and cash equivalents will be sufficient to meet our working capital and capital expenditure needs for at least the next 12 months. Our future capital requirements will depend on many factors including our growth rate, contract renewal activity, number of visits, the timing and extent of spending to support product development efforts, our expansion of sales and marketing activities, the introduction of new and enhanced services offerings and the continuing market acceptance of telehealth. We may in the future enter into arrangements to acquire or
61
invest in complementary businesses, services and technologies and intellectual property rights. We may be required to seek additional equity or debt financing. In the event that additional financing is required from outside sources, we may not be able to raise it on terms acceptable to us or at all. If we are unable to raise additional capital when desired, our business, financial condition and results of operations would be adversely affected.
2016 Shelf Registration Statement
We filed a shelf registration statement on Form S-3 under the Securities Act on September 30, 2016, which was declared effective October 5, 2016 and which we refer to as the 2016 Shelf. Under the 2016 Shelf at the time of effectiveness, we had the ability to raise up to $300 million by selling common stock in addition to 2,000,000 shares of common stock eligible for resale by certain existing shareholders.
In January 2017, we successfully closed on our Follow-On Offering in which the Company issued and sold 7,885,500 shares of common stock, including the exercise of an underwriter option to purchase additional shares and 1,600,000 shares offered by certain stockholders of the Company, at an issuance price of $16.75 per share. We received net proceeds of $124.0 million after deducting underwriting discounts and commissions of $7.6 million as well as other offering expenses of $0.5 million.
Indebtedness
In July 2016, the Company entered into an Amended and Restated Loan and Security Agreement with Silicon Valley Bank, or SVB, that provided for a $25 million Mezzanine Term Loan and a $25 million Line of Credit Facility. The Mezzanine Term Loan carries interest at a rate of 6.25% above the WSJ Prime Rate with a WSJ Prime Rate floor of 3.75% and matures in July 2019. Interest payments are payable monthly in arrears. The Company incurred a $250,000 loan origination fee and will be liable for a final payment fee of $750,000 payable at maturity or upon prepayment of the Mezzanine Term Loan. In connection with entry into the Mezzanine Term Loan, the Company granted two affiliates of SVB warrants to purchase an aggregate of 798,694 shares of common stock of the Company at an exercise price of $13.50 per share. The warrants are immediately exercisable and have a 10-year term. The fair value of the common stock warrants on the date of issue was approximately $7.7 million. The Company also granted SVB a security interest in significantly all of the Company’s assets. The Mezzanine Term Loan has been used to fund the expansion of the Company’s business.
In December 2016, the Company issued an aggregate of 107,931 shares of common stock from the cashless exercise of 399,347 warrants at an exercise price of $13.50 per share for one of the affiliates. The Company did not receive any proceeds from this cashless exercise. Additionally, there are 399,347 of these warrants outstanding as of December 31, 2016.
The Company determined that the Mezzanine Term Loan represents an extinguishment of the original $13 million Mezzanine Term Loan and as a result recorded a one-time charge of $8.5 million. The amortization of warrants and loss on extinguishment of debt includes the write-off of loan origination fees paid to SVB, deferred debt costs associated with the original Mezzanine Term Loan and the $7.7 million non-cash fair value of the aforementioned warrants.
The Line of Credit Facility provides for borrowings up to $25 million based on 300% of the Company’s monthly recurring revenue, as defined. In addition, there is an additional $25 million Uncommitted Incremental Facility permitted under the Line of Credit Facility. The Line of Credit Facility carries interest at a rate of 0.50% above the WSJ Prime Rate and matures in July 2019. The Company incurred an initial $75,000 loan origination fee and is responsible for additional $75,000 in annual fees on the anniversary of the Line of Credit Facility. The Company will also be liable for a $50,000 loan arrangement fee if and when the Company utilizes the Uncommitted Incremental Facility.
The Company determined that the original Amended Term Loan Facility and Revolving Advance Facility were modified as part of the refinancing and as a result, less than $0.1 million of previous deferred loan costs will continue to be amortized to interest expense through July 2019.
The following information describes the Company’s debt agreements before the refinancing in July 2016.
62
In May 2014, the Company entered into an Amended and Restated Loan and Security Agreement with SVB that provided for a Revolving Advance Facility and a Term Loan Facility, or the Amended Term Loan Facility. The Revolving Advance Facility provided for borrowings up to $12.0 million based on 300% of the Company’s monthly recurring revenue, as defined therein. Borrowings under the Revolving Advance Facility were $6.5 million and $4.7 million at December 31, 2015 and 2014, respectively. The Revolving Advance Facility carried interest at a rate of 0.75% above the prime rate per annum and was to mature in April 2016. The Company entered into an amendment to the Revolving Advance Facility in March 2015 that extended its maturity to April 2017. Interest payments were payable monthly in arrears. In May 2015, the Company increased the borrowings to $11.5 million. On July 15, 2015, the Company reduced its indebtedness under the Revolving Advance Facility with a $5.0 million principal repayment.
The Amended Term Loan Facility provided for borrowings up to $5.0 million. As of December 31, 2015 and 2014, the Company had utilized the total $5.0 million available under this Amended Term Loan Facility. The Amended Term Loan Facility carried interest at a rate of 1.00% above the prime rate per annum. Interest payments were payable monthly in arrears. Payments on the Amended Term Loan Facility commenced in May 2015 and through June 2016.
In May 2014, the Company entered into a Subordinated Loan and Security Agreement with SVB that provided for a Mezzanine Term Loan totaling $13.0 million. The Mezzanine Term Loan carried interest at a rate of 10.00% per annum. Interest payments were payable monthly in arrears. In connection with entry into the Mezzanine Term Loan, the Company granted two affiliates of SVB warrants to purchase an aggregate of 131,239 shares of its common stock at an exercise price of $2.95 per share. The warrants were immediately exercisable, had a 10‑year term and were exercised in 2015. The Company also granted SVB a security interest in significantly all of the Company’s assets. The Mezzanine Term Loan was used to fund the expansion of the Company’s business.
Effective with the purchase of AmeriDoc, the Company executed a Subordinated Promissory Note in the amount of $3.5 million payable to the seller of AmeriDoc on April 30, 2015. The Subordinated Promissory Note carries interest at a rate of 10.00% annual interest and is subordinated to the SVB Facilities. In March 2015, the Company, the seller of AmeriDoc and SVB executed an Amended and Restated Subordinated Promissory Note that extended the maturity of the Amended and Restated Subordinated Promissory Note to April 30, 2017. In November 2015, the Company executed the Second Amended and Restated Subordinated Promissory Note with a revised annual interest rate at 7.00% commencing on January 1, 2016 and extended the maturity of the Second Amended and Restated Promissory Note to April 30, 2018 with a seller put option effective on April 30, 2017. The Company repaid $1.0 million and $0.5 million of principal on this Second Amended and Restated Subordinated Promissory Note during 2016 and 2015, respectively. As a result of the seller put option, the Company has classified the $2.0 million outstanding balance to current liability as of December 31, 2016.
The Company was in compliance with all debt covenants at December 31, 2016 and 2015.
Contractual Obligations and Commitments
The following summarizes our contractual obligations as of December 31, 2016 (in thousands):
|
|
|
Payment Due by Period |
|
|||||||||||||
|
|
|
|
|
|
Less than |
|
1 to 3 |
|
4 to 5 |
|
More than |
|
||||
|
|
|
Total |
|
1 Year |
|
Years |
|
Years |
|
5 Years |
|
|||||
|
Operating leases |
|
$ |
11,855 |
|
$ |
1,996 |
|
$ |
3,109 |
|
$ |
2,586 |
|
$ |
4,164 |
|
|
Obligations under SVB Facilities and AmeriDoc Promissory Note |
|
|
44,490 |
|
|
2,000 |
|
|
42,490 |
|
|
— |
|
|
— |
|
|
Interest associated with long-term debt |
|
|
8,217 |
|
|
3,267 |
|
|
4,949 |
|
|
— |
|
|
— |
|
|
Total |
|
$ |
64,562 |
|
$ |
7,263 |
|
$ |
50,548 |
|
$ |
2,586 |
|
$ |
4,164 |
|
Our existing office and hosting co-location facilities lease agreements provide us with the option to renew and generally provide for rental payments on a graduated basis. Our future operating lease obligations would change if we entered into additional operating lease agreements as we expand our operations and if we exercised the office and hosting co-location facilities lease options. The contractual commitment amounts in the table above are associated with agreements that are enforceable and legally binding and that specify all significant terms, including fixed or minimum
63
services to be used, fixed, minimum or variable price provisions and the approximate timing of the transaction. Obligations under contracts that we can cancel without a significant penalty are not included in the table above. For abandoned facilities, the above contractual obligation schedule does not reflect any realized or potential sublease revenue.
Off-Balance Sheet Arrangements
During the periods presented, we did not have, nor do we currently have, any relationships with unconsolidated entities or financial partnerships, such as entities often referred to as structured finance or special purpose entities, which would have been established for the purpose of facilitating off-balance sheet arrangements or other contractually narrow or limited purposes. We are therefore not exposed to the financing, liquidity, market or credit risk that could arise if we had engaged in those types of relationships.
Recently Issued and Adopted Accounting Pronouncements
In May 2014, the Financial Accounting Standards Board, or the FASB, issued Accounting Standards Update, or ASU, 2014-09, Revenue from Contracts with Customers (Topic 606), to achieve a consistent application of revenue recognition within the U.S., resulting in a single revenue model to be applied by reporting companies under GAAP. Under the new model, recognition of revenue occurs when a customer obtains control of promised goods or services in an amount that reflects the consideration to which the entity expects to be entitled in exchange for those goods or services. In addition, the revised guidance requires that reporting companies disclose the nature, amount, timing, and uncertainty of revenue and cash flows arising from contracts with customers. The revised guidance is effective for the Company beginning in the quarter ending March 31, 2018; early adoption is allowed. The revised guidance is required to be applied retrospectively to each prior reporting period presented or modified retrospectively applied with the cumulative effect of initially applying it recognized at the date of initial application. We currently anticipate adopting the standard using the modified retrospective method. We are currently evaluating the impact of the adoption of this guidance on our consolidated financial statements.
In August 2014, the FASB issued ASU 2014-15, Presentation of Financial Statements—Going Concern. This guidance addresses management’s responsibility to evaluate whether there is substantial doubt about an entity’s ability to continue as a going concern and to provide related footnote disclosures. Management’s evaluation should be based on relevant conditions and events that are known and reasonably knowable at the date that the financial statements are issued. ASU 2014-15 is effective for annual periods ending after December 15, 2016. Early adoption is permitted. We adopted this guidance in the fourth quarter of 2016 and based on the management assessment, there are no conditions and events that raise substantial doubt about our ability to continue as a going concern. As a result, the adoption of this standard had no impact on our consolidated financial statements or disclosures.
In February 2016, the FASB issued ASU 2016-02, Leases (Topic 842). ASU 2016-02 related to leases that outlines a comprehensive lease accounting model and supersedes the current lease guidance. The new guidance requires lessees to recognize lease liabilities and corresponding right-of-use assets for all leases with lease terms of greater than 12 months. It also changes the definition of a lease and expands the disclosure requirements of lease arrangements. The new guidance must be adopted using the modified retrospective approach and will be effective for the Company starting in the first quarter of fiscal 2019. Early adoption is permitted. We are currently in the process of evaluating the impact of the adoption of this standard on our consolidated financial statements.
In March 2016, the FASB issued ASU 2016-09, Compensation—Stock Compensation (Topic 718): Improvements to Employee Share-Based Payment Accounting. ASU 2016-09 revises the accounting treatment for excess tax benefits, minimum statutory withholding requirements and forfeitures related to share-based awards. The new guidance will be effective for the Company starting in the first quarter of fiscal 2017. Early adoption is permitted in any annual or interim period. We are currently in the process of evaluating the impact of the adoption of this standard on our consolidated financial statements.
64
Consolidated Quarterly Results of Operations
The following table sets forth our quarterly consolidated statement of operations data for the years ended December 31, 2016 and 2015:
|
(in thousands, per share data) |
|
1Q15 |
|
2Q15 |
|
3Q15 |
|
4Q15 |
|
1Q16 |
|
2Q16 |
|
3Q16 |
|
4Q16 |
|
||||||||
|
|
|
|
|
|
|
|
|
|
|
|
|
|
|
|
|
|
|
|
|
|
|
|
|
|
|
|
Revenue |
|
$ |
16,488 |
|
$ |
18,283 |
|
$ |
19,973 |
|
$ |
22,640 |
|
$ |
26,888 |
|
$ |
26,488 |
|
$ |
32,381 |
|
$ |
37,400 |
|
|
Cost of revenue |
|
|
5,281 |
|
|
4,793 |
|
|
4,488 |
|
|
6,479 |
|
|
7,943 |
|
|
6,891 |
|
|
7,112 |
|
|
10,025 |
|
|
Gross profit |
|
|
11,207 |
|
|
13,490 |
|
|
15,485 |
|
|
16,161 |
|
|
18,945 |
|
|
19,597 |
|
|
25,269 |
|
|
27,375 |
|
|
Operating expenses: |
|
|
|
|
|
|
|
|
|
|
|
|
|
|
|
|
|
|
|
|
|
|
|
|
|
|
Advertising and marketing |
|
|
4,341 |
|
|
4,730 |
|
|
5,284 |
|
|
5,881 |
|
|
8,050 |
|
|
7,804 |
|
|
9,046 |
|
|
9,820 |
|
|
Sales |
|
|
3,682 |
|
|
4,397 |
|
|
5,111 |
|
|
4,786 |
|
|
5,270 |
|
|
5,860 |
|
|
7,662 |
|
|
7,451 |
|
|
Technology and development |
|
|
2,906 |
|
|
3,203 |
|
|
3,941 |
|
|
4,160 |
|
|
5,225 |
|
|
4,829 |
|
|
5,867 |
|
|
5,894 |
|
|
Legal |
|
|
1,369 |
|
|
5,022 |
|
|
1,421 |
|
|
1,067 |
|
|
1,122 |
|
|
1,193 |
|
|
1,033 |
|
|
769 |
|
|
Regulatory |
|
|
277 |
|
|
733 |
|
|
740 |
|
|
683 |
|
|
848 |
|
|
772 |
|
|
817 |
|
|
721 |
|
|
Acquisition related costs |
|
|
173 |
|
|
362 |
|
|
15 |
|
|
— |
|
|
— |
|
|
763 |
|
|
6,196 |
|
|
— |
|
|
General and administrative |
|
|
10,149 |
|
|
10,371 |
|
|
10,077 |
|
|
12,384 |
|
|
11,637 |
|
|
11,280 |
|
|
12,298 |
|
|
13,353 |
|
|
Depreciation and amortization |
|
|
903 |
|
|
923 |
|
|
1,491 |
|
|
1,546 |
|
|
1,508 |
|
|
1,558 |
|
|
2,607 |
|
|
2,597 |
|
|
Loss from operations |
|
|
(12,593) |
|
|
(16,251) |
|
|
(12,595) |
|
|
(14,346) |
|
|
(14,715) |
|
|
(14,462) |
|
|
(20,257) |
|
|
(13,230) |
|
|
Amortization of warrants and loss on extinguishment of debt |
|
|
— |
|
|
— |
|
|
— |
|
|
— |
|
|
— |
|
|
— |
|
|
8,454 |
|
|
— |
|
|
Interest expense, net |
|
|
568 |
|
|
642 |
|
|
489 |
|
|
500 |
|
|
427 |
|
|
407 |
|
|
873 |
|
|
881 |
|
|
|
|
|
|
|
|
|
|
|
|
|
|
|
|
|
|
|
|
|
|
|
|
|
|
|
|
|
Net loss before taxes |
|
|
(13,161) |
|
|
(16,893) |
|
|
(13,084) |
|
|
(14,846) |
|
|
(15,142) |
|
|
(14,869) |
|
|
(29,584) |
|
|
(14,111) |
|
|
Income tax provision (benefit) |
|
|
(458) |
|
|
171 |
|
|
162 |
|
|
161 |
|
|
162 |
|
|
10 |
|
|
188 |
|
|
150 |
|
|
|
|
|
|
|
|
|
|
|
|
|
|
|
|
|
|
|
|
|
|
|
|
|
|
|
|
|
Net loss |
|
|
(12,703) |
|
|
(17,064) |
|
|
(13,246) |
|
|
(15,007) |
|
|
(15,304) |
|
|
(14,879) |
|
|
(29,772) |
|
|
(14,261) |
|
|
GAAP Net Loss per Share |
|
$ |
(5.87) |
|
$ |
(7.20) |
|
$ |
(0.37) |
|
$ |
(0.39) |
|
$ |
(0.40) |
|
$ |
(0.38) |
|
$ |
(0.65) |
|
$ |
(0.31) |
|
|
Weighted Average Common Shares Outstanding Used in Computing GAAP Net Loss per Share - Basic and Diluted |
|
|
2,162 |
|
|
2,370 |
|
|
36,100 |
|
|
38,460 |
|
|
38,584 |
|
|
38,717 |
|
|
45,860 |
|
|
46,082 |
|
Item 7A. Quantitative and Qualitative Disclosures About Market Risk
Interest Rate Risk
We have floating rate debt with our Mezzanine Term Loan and Line of Credit Facility, and cash equivalents that are subject to interest rate volatility, which is our principal market risk. A 25 basis point change in the weighted average interest rate relating to the Mezzanine Term Loan and Line of Credit Facility as of December 31, 2016, which are subject to variable interest rates based on the prime rate, would yield a change of approximately $117,000 in annual interest expense. We do not expect cash flows to be affected to any significant degree by a sudden change in market interest rates.
Item 8. Financial Statements and Supplementary Data
Our Consolidated Financial Statements are listed in the Index to Consolidated Financial Statements and Financial Statement Schedule filed as part of this Form 10-K.
Item 9. Changes in and Disagreements with Accountants on Accounting and Financial Disclosure
None.
Item 9A. Controls and Procedures
In designing and evaluating our disclosure controls and procedures, management recognizes that any controls and procedures, no matter how well designed and operated, can provide only reasonable assurance of achieving the desired control objectives and management necessarily applies its judgment in evaluating the cost-benefit relationship of possible controls and procedures.
65
Management’s Report on Internal Control over Financial Reporting
Our management is responsible for establishing and maintaining adequate internal control over financial reporting, as such term is defined in Rules 13a-15(f) and 15d-15(f) under the Exchange Act. Our internal control system is designed to provide reasonable assurance regarding the preparation and fair presentation of published financial statements.
Our management, including our Chief Executive Officer and our Chief Financial Officer, assessed the effectiveness of our internal control over financial reporting as of December 31, 2016, excluding the revenue from our July 2016 acquisition of HealthiestYou, which accounted for approximately 10% of our total revenue. In making this assessment, management used the criteria set forth by the Committee of Sponsoring Organizations of the Treadway Commission (COSO) in Internal Control-Integrated Framework (2013 framework). Based on this assessment, management, including our Chief Executive Officer and our Chief Financial Officer, concluded that we maintained effective internal control over financial reporting at the reasonable assurance level as of December 31, 2016.
No changes in our internal control over financial reporting (as defined in Rules 13a-15(f) and 15d-15(f) under the Exchange Act) occurred during the year ended December 31, 2016 that have materially affected, or are reasonably likely to materially affect, our internal control over financial reporting. The material weakness in our internal control over financial reporting previously identified in the 2015 Annual Report on Form 10-K had been remediated by June 30, 2016.
66
67
Information required by Items 10, 11, 12, 13 and 14 of Part III is omitted from this Annual Report and will be filed in a definitive proxy statement or by an amendment to this Annual Report not later than 120 days after the end of the fiscal year covered by this Annual Report.
Item 10. Directors, Executive Officers and Corporate Governance
We will provide information that is responsive to this Item 10 in our definitive proxy statement or in an amendment to this Annual Report not later than 120 days after the end of the fiscal year covered by this Annual Report, in either case under the captions “Directors and Executive Officers” and “Corporate Governance” and possibly elsewhere therein. That information is incorporated in this Item 10 by reference.
Item 11. Executive Compensation
We will provide information that is responsive to this Item 11 in our definitive proxy statement or in an amendment to this Annual Report not later than 120 days after the end of the fiscal year covered by this Annual Report, in either case under the caption “Executive Compensation,” and possibly elsewhere therein. That information is incorporated in this Item 11 by reference.
Item 12. Security Ownership of Certain Beneficial Owners and Management and Related Stockholder Matters
We will provide information that is responsive to this Item 12 in our definitive proxy statement or in an amendment to this Annual Report not later than 120 days after the end of the fiscal year covered by this Annual Report, in either case under the caption “Security Ownership of Certain Beneficial Owners and Management and Related Stockholder Matters,” and possibly elsewhere therein. That information is incorporated in this Item 12 by reference.
Item 13. Certain Relationships and Related Transactions, and Director Independence
We will provide information that is responsive to this Item 13 in our definitive proxy statement or in an amendment to this Annual Report not later than 120 days after the end of the fiscal year covered by this Annual Report, in either case under the caption “Certain Relationships and Related Transactions,” and possibly elsewhere therein. That information is incorporated in this Item 13 by reference.
Item 14. Principal Accounting Fees and Services
We will provide information that is responsive to this Item 14 in our definitive proxy statement or in an amendment to this Annual Report not later than 120 days after the end of the fiscal year covered by this Annual Report, in either case under the caption “Services and Fees of Ernst & Young,” and possibly elsewhere therein. That information is incorporated in this Item 14 by reference.
68
Item 15. Exhibits and Financial Statement Schedules
A list of exhibits is set forth on the Exhibit Index immediately following the signature page of this Form 10-K, and is incorporated herein by reference.
(a) (1) The Registrant’s financial statements together with a separate table of contents are annexed hereto
|
(3) |
Financial Statement Schedules are listed in the separate table of contents annexed hereto. |
Schedule II—Valuation and Qualifying Accounts
Allowance for Doubtful Accounts Receivable (in thousands):
|
|
|
Balance at |
|
|
|
|
|
|
|
|
|
|
|
|
|
Balance at |
|
||||
|
|
|
Beginning |
|
|
|
|
|
|
|
|
|
|
|
|
|
End |
|
||||
|
|
|
of Period |
|
Provision |
|
Write-offs |
|
Other |
|
of Period |
|
||||||||||
|
Fiscal Year Ended December 31, 2016 |
$ |
1,812 |
$ |
2,412 |
$ |
(1,802) |
$ |
— |
$ |
2,422 | |||||||||||
|
Fiscal Year Ended December 31, 2015 |
$ |
1,785 |
$ |
1,962 |
$ |
(1,935) |
$ |
— |
$ |
1,812 | |||||||||||
|
Fiscal Year Ended December 31, 2014 |
|
$ |
728 |
|
|
$ |
1,351 |
|
|
$ |
(294) |
|
|
$ |
— |
|
|
$ |
1,785 |
|
|
Income Taxes Valuation Allowance (in thousands):
|
|
|
Balance at |
|
|
|
|
|
|
|
|
|
|
|
|
|
Balance at |
|
|||
|
|
|
Beginning |
|
|
|
|
|
|
|
|
|
|
|
|
|
End |
|
|||
|
|
|
of Period |
|
Provision |
|
Write-offs |
|
Other |
|
of Period |
|
|||||||||
|
Fiscal Year Ended December 31, 2016 |
|
$ |
46,477 |
|
|
$ |
25,856 |
|
|
$ |
— |
|
|
$ |
(1,131) |
|
|
$ |
71,202 |
|
|
Fiscal Year Ended December 31, 2015 |
|
$ |
22,358 |
|
|
$ |
22,094 |
|
|
$ |
— |
|
|
$ |
2,025 |
|
|
$ |
46,477 |
|
|
Fiscal Year Ended December 31, 2014 |
|
$ |
15,742 |
|
|
$ |
6,668 |
|
|
$ |
— |
|
|
$ |
(52) |
|
|
$ |
22,358 |
|
All other schedules are omitted as the required information is inapplicable or the information is presented in the consolidated financial statements and notes thereto in Item 8 above.
(3) Exhibits
Unless otherwise indicated, each of the following exhibits has been previously filed with the Securities and Exchange Commission by the Company under File No. 001-37477.
Not applicable.
69
Pursuant to the requirements of the Securities Exchange Act of 1934, the registrant has duly caused this report to be signed on its behalf by the undersigned thereunto duly authorized.
|
|
TELADOC, INC. |
|
|
|
|
|
|
Date: March 1, 2017 |
By: |
/s/ JASON GOREVIC |
|
|
Name: |
Jason Gorevic |
|
|
Title: |
President and Chief Executive Officer |
|
|
|
|
|
Date: March 1, 2017 |
By: |
/s/ MARK HIRSCHHORN |
|
|
Name: |
Mark Hirschhorn |
|
|
Title: |
Executive Vice President, Chief Operating Officer and Chief Financial Officer |
|
|
|
|
|
Date: March 1, 2017 |
By: |
/s/ DAVID B. SNOW, JR. |
|
|
Name: |
David B. Snow, Jr. |
|
|
Title: |
Chairman |
|
|
|
|
|
Date: March 1, 2017 |
By: |
/s/ WILLIAM H. FRIST, M.D. |
|
|
Name: |
William H. Frist, M.D. |
|
|
Title: |
Director |
|
|
|
|
|
Date: March 1, 2017 |
By: |
/s/ MICHAEL GOLDSTEIN |
|
|
Name: |
Michael Goldstein |
|
|
Title: |
Director |
|
|
|
|
|
Date: March 1, 2017 |
By: |
/s/ THOMAS G. MCKINLEY |
|
|
Name: |
Thomas G. McKinley |
|
|
Title: |
Director |
|
|
|
|
|
Date: March 1, 2017 |
By: |
/s/ ARNEEK MULTANI |
|
|
Name: |
Arneek Multani |
|
|
Title: |
Director |
|
|
|
|
|
Date: March 1, 2017 |
By: |
/s/ JAMES OUTLAND |
|
|
Name: |
James Outland |
|
|
Title: |
Director |
|
|
|
|
|
Date: March 1, 2017 |
By: |
/s/ HELEN DARLING |
|
|
Name: |
Helen Darling |
|
|
Title: |
Director |
|
|
|
|
|
Date: March 1, 2017 |
By: |
/s/ DAVID SHEDLARZ |
|
|
Name: |
David Shedlarz |
|
|
Title: |
Director |
|
|
|
|
70
Index
|
|
|
|
|
Incorporated by Reference |
||||||||
|
Exhibit |
|
Exhibit Description |
|
Form |
|
File No. |
|
Exhibit |
|
Filing |
|
Filed |
|
|
|
|
|
|
|
|
|
|
|
|
|
|
|
3.1 |
|
Fifth Amended and Restated Certificate of Incorporation of Teladoc, Inc. |
|
8-K |
|
001-37477 |
|
3.1 |
|
7/07/15 |
|
|
|
|
|
|
|
|
|
|
|
|
|
|
|
|
|
3.2 |
|
Amended and Restated Bylaws of Teladoc, Inc. |
|
8-K |
|
001-37477 |
|
3.2 |
|
7/07/15 |
|
|
|
|
|
|
|
|
|
|
|
|
|
|
|
|
|
4.1 |
|
Specimen stock certificate evidencing shares of the common stock. |
|
S-1/A |
|
333-204577 |
|
4.5 |
|
6/24/15 |
|
|
|
|
|
|
|
|
|
|
|
|
|
|
|
|
|
4.2 |
|
Warrants to Purchase Common Stock dated July 11, 2016. |
|
8-K |
|
001-37477 |
|
4.1 |
|
7/15/16 |
|
|
|
|
|
|
|
|
|
|
|
|
|
|
|
|
|
4.3 |
|
Warrants to Purchase Common Stock dated July 11, 2016. |
|
8-K |
|
001-37477 |
|
4.2 |
|
7/15/16 |
|
|
|
|
|
|
|
|
|
|
|
|
|
|
|
|
|
10.1 |
|
Form of Indemnification Agreement. |
|
S-1/A |
|
333-204577 |
|
10.7 |
|
6/18/15 |
|
|
|
|
|
|
|
|
|
|
|
|
|
|
|
|
|
10.2 |
|
Teladoc, Inc. 2015 Incentive Award Plan. |
|
S-1/A |
|
333-204577 |
|
10.10 |
|
6/18/15 |
|
|
|
|
|
|
|
|
|
|
|
|
|
|
|
|
|
10.3 |
|
Form of Stock Option Agreement under the Teladoc, Inc. 2015 Incentive Award Plan. |
|
S-1/A |
|
333-204577 |
|
10.11 |
|
6/18/15 |
|
|
|
|
|
|
|
|
|
|
|
|
|
|
|
|
|
10.4 |
|
Form of Restricted Stock Agreement under the Teladoc, Inc. 2015 Incentive Award Plan. |
|
S-1/A |
|
333-204577 |
|
10.12 |
|
6/18/15 |
|
|
|
|
|
|
|
|
|
|
|
|
|
|
|
|
|
10.5 |
|
Form of Restricted Stock Unit Agreement under the Teladoc, Inc. 2015 Incentive Award Plan. |
|
S-1/A |
|
333-204577 |
|
10.13 |
|
6/18/15 |
|
|
|
|
|
|
|
|
|
|
|
|
|
|
|
|
|
10.6 |
|
Teladoc, Inc. 2015 Employee Stock Purchase Plan. |
|
S-1/A |
|
333-204577 |
|
10.14 |
|
6/18/15 |
|
|
|
|
|
|
|
|
|
|
|
|
|
|
|
|
|
10.7 |
|
Teladoc, Inc. Non-Employee Director Compensation Program, as amended. |
|
8-K |
|
001-37477 |
|
10.7 |
|
8/03/16 |
|
|
|
|
|
|
|
|
|
|
|
|
|
|
|
|
|
10.8 |
|
Amended and Restated Executive Employment Agreement, dated June 16, 2015, by and between Teladoc, Inc. and Jason Gorevic. |
|
S-1/A |
|
333-204577 |
|
10.19 |
|
6/18/15 |
|
|
|
|
|
|
|
|
|
|
|
|
|
|
|
|
|
10.9 |
|
Amended and Restated Executive Employment Agreement, dated June 16, 2015, by and between Teladoc, Inc. and Mark Hirschhorn. |
|
S-1/A |
|
333-204577 |
|
10.20 |
|
6/18/15 |
|
|
|
|
|
|
|
|
|
|
|
|
|
|
|
|
|
10.10 |
|
Amended and Restated Executive Employment Agreement, dated June 16, 2015, by and between Teladoc, Inc. and Michael King. |
|
S-1/A |
|
333-204577 |
|
10.21 |
|
6/18/15 |
|
|
|
|
|
|
|
|
|
|
|
|
|
|
|
|
|
10.11 |
|
Amended and Plan of Merger, dated as of June 29, 2016, by and among Teladoc, Inc., Copper Acquisition Sub One, Inc., Copper Acquisition Sub Two, Inc., HY Holdings, Inc. and Frontier Fund IV, L.P., as stockholder representative. |
|
8-K |
|
001-37477 |
|
2.1 |
|
7/06/16 |
|
|
71
|
10.12 |
|
Joinder and Third Loan Modification Agreement dated as of July 11, 2016 to Amended and Restated Loan and Security Agreement dated as of May 2, 2014, as amended, among the Company, its subsidiaries, Silicon Valley Bank (SVB) and the lenders party thereto. |
|
8-K |
|
001-37477 |
|
10.1 |
|
7/15/16 |
|
|
|
|
|
|
|
|
|
|
|
|
|
|
|
|
|
10.13 |
|
Amended and Restated Loan and Security Agreement among the Company, its subsidiaries, SVB and the lenders party thereto dated as of May 2, 2014. |
|
8-K |
|
001-37477 |
|
10.2 |
|
7/15/16 |
|
|
|
|
|
|
|
|
|
|
|
|
|
|
|
|
|
10.14 |
|
Credit Agreement dated as of July 11, 2016 among the Company, its subsidiaries, SVB and the lenders party thereto. |
|
8-K |
|
001-37477 |
|
10.3 |
|
7/15/16 |
|
|
|
|
|
|
|
|
|
|
|
|
|
|
|
|
|
10.15 |
|
Amendment to Amended and Restated Executive Employment Agreement, by and between Teladoc, Inc. and Mark Hirschhorn |
|
8-K |
|
001-37477 |
|
|
|
12/30/16 |
|
|
|
10.16
|
|
Teladoc, Inc. 2017 Inducement Award Plan |
|
|
|
|
|
|
|
|
|
* |
|
10.17
|
|
Form of Stock Option Agreement under the Teladoc, Inc. 2017 Inducement Award Plan |
|
|
|
|
|
|
|
|
|
* |
|
10.18
|
|
Form of Restricted Stock Agreement under the Teladoc, Inc. 2017 Inducement Award Plan |
|
|
|
|
|
|
|
|
|
* |
|
10.19
|
|
Form of Restricted Stock Unit Agreement under the Teladoc, Inc. 2017 Inducement Award Plan |
|
|
|
|
|
|
|
|
|
* |
|
21.1 |
|
Subsidiaries of the Registrant. |
|
S-1/A |
|
|
|
|
|
7/01/15 |
|
|
|
23.1
|
|
Consents of Ernst & Young, LLP, Independent Registered Public Accounting Firm
|
|
|
|
|
|
|
|
|
|
* |
|
31.1 |
|
Chief Executive Officer—Certification pursuant to Rule 13a-14(a) or Rule 15d-14(a) of the Securities Exchange Act of 1934, as adopted pursuant to Section 302 of the Sarbanes-Oxley Act of 2002. |
|
|
|
|
|
|
|
|
|
* |
|
31.2 |
|
Chief Financial Officer—Certification pursuant to Rule 13a-14(a) or Rule 15d-14(a) of the Securities Exchange Act of 1934, as adopted pursuant to Section 302 of the Sarbanes-Oxley Act of 2002. |
|
|
|
|
|
|
|
|
|
* |
|
|
|
|
|
|
|
|
|
|
|
|
|
|
|
32.1 |
|
Chief Executive Officer—Certification pursuant to Rule13a-14(b) or Rule 15d-14(b) of the Securities Exchange Act of 1934 and 18 U.S.C. Section 1350, as adopted pursuant to Section 906 of the Sarbanes-Oxley Act of 2002. |
|
|
|
|
|
|
|
|
|
** |
|
|
|
|
|
|
|
|
|
|
|
|
|
|
72
|
32.2 |
|
Chief Financial Officer—Certification pursuant to Rule 13a-14(b) or Rule 15d-14(b) of the Securities Exchange Act of 1934 and 18 U.S.C. Section 1350, as adopted pursuant to Section 906 of the Sarbanes-Oxley Act of 2002. |
|
|
|
|
|
|
|
|
|
** |
|
|
|
|
|
|
|
|
|
|
|
|
|
|
|
101.INS |
|
XBRL Instance Document. |
|
|
|
|
|
|
|
|
|
* |
|
|
|
|
|
|
|
|
|
|
|
|
|
|
|
101.SCH |
|
XBRL Taxonomy Extension Schema Document. |
|
|
|
|
|
|
|
|
|
* |
|
|
|
|
|
|
|
|
|
|
|
|
|
|
|
101.CAL |
|
XBRL Taxonomy Calculation Linkbase Document. |
|
|
|
|
|
|
|
|
|
* |
|
|
|
|
|
|
|
|
|
|
|
|
|
|
|
101.DEF |
|
XBRL Definition Linkbase Document. |
|
|
|
|
|
|
|
|
|
* |
|
|
|
|
|
|
|
|
|
|
|
|
|
|
|
101.LAB |
|
XBRL Taxonomy Label Linkbase Document. |
|
|
|
|
|
|
|
|
|
* |
|
|
|
|
|
|
|
|
|
|
|
|
|
|
|
101.PRE |
|
XBRL Taxonomy Presentation Linkbase Document. |
|
|
|
|
|
|
|
|
|
* |
*Filed herewith.
**Furnished herewith.
73
INDEX TO CONSOLIDATED FINANCIAL STATEMENTS AND SUPPLEMENTAL DATA
|
|
|
Page |
|
1. Audited Consolidated Financial Statements of Teladoc, Inc. |
|
|
|
|
F-2 |
|
|
|
F-3 |
|
|
|
F-4 |
|
|
|
F-5 |
|
|
Consolidated Statements of Convertible Preferred Stock and Stockholders’ Equity (Deficit) |
|
F-6 |
|
|
F-7 |
|
|
|
F-8 |
|
|
2. Supplemental Financial Data: The following supplemental financial data of the Registrant required to be included in Item 15(a)(2) on Form-10K are listed below: Schedule II – Valuation and Qualifying Accounts |
|
69 |
F-1
REPORT OF INDEPENDENT REGISTERED PUBLIC ACCOUNTING FIRM
The Board of Directors and Stockholders of
Teladoc, Inc.
We have audited the accompanying consolidated balance sheets of Teladoc, Inc. as of December 31, 2016 and 2015, and the related consolidated statements of operations, comprehensive loss, convertible preferred stock and stockholders’ equity (deficit), and cash flows for each of the three years in the period ended December 31, 2016. Our audits also included the financial statement schedule listed in the Index at Item 15(a). These financial statements and schedule are the responsibility of the Company’s management. Our responsibility is to express an opinion on these financial statements and schedule based on our audits.
We conducted our audits in accordance with the standards of the Public Company Accounting Oversight Board (United States). Those standards require that we plan and perform the audit to obtain reasonable assurance about whether the financial statements are free of material misstatement. We were not engaged to perform an audit of the Company’s internal control over financial reporting. Our audits included consideration of internal control over financial reporting as a basis for designing audit procedures that are appropriate in the circumstances, but not for the purpose of expressing an opinion on the effectiveness of the Company’s internal control over financial reporting. Accordingly, we express no such opinion. An audit also includes examining, on a test basis, evidence supporting the amounts and disclosures in the financial statements, assessing the accounting principles used and significant estimates made by management, and evaluating the overall financial statement presentation. We believe that our audits provide a reasonable basis for our opinion.
In our opinion, the financial statements referred to above present fairly, in all material respects, the consolidated financial position of Teladoc, Inc. at December 31, 2016 and 2015, and the consolidated results of their operations and their cash flows for each of the three years in the period ended December 31, 2016, in conformity with U.S. generally accepted accounting principles. Also, in our opinion, the related financial statement schedule, when considered in relation to the basic financial statements taken as a whole, present fairly in all material respects the information set forth therein.
|
|
/s/ Ernst & Young LLP |
New York, New York
March 1, 2017
F-2
TELADOC, INC.
(in thousands, except share and per share data)
|
|
|
As of December 31, |
||||
|
|
|
2016 |
|
2015 |
||
|
|
|
|
|
|
|
|
|
Assets |
|
|
|
|
|
|
|
Current assets: |
|
|
|
|
|
|
|
Cash and cash equivalents |
|
$ |
50,015 |
|
$ |
55,066 |
|
Short-term investments |
|
|
15,793 |
|
|
82,282 |
|
Accounts receivable, net of allowance of $2,422 and $1,812, respectively |
|
|
13,806 |
|
|
12,134 |
|
Prepaid expenses and other current assets |
|
|
3,103 |
|
|
2,096 |
|
Total current assets |
|
|
82,717 |
|
|
151,578 |
|
Property and equipment, net |
|
|
7,479 |
|
|
6,259 |
|
Goodwill |
|
|
188,184 |
|
|
56,342 |
|
Intangible assets, net |
|
|
24,875 |
|
|
15,265 |
|
Other assets |
|
|
415 |
|
|
293 |
|
Total assets |
|
$ |
303,670 |
|
$ |
229,737 |
|
Liabilities and stockholders’ equity |
|
|
|
|
|
|
|
Current liabilities: |
|
|
|
|
|
|
|
Accounts payable |
|
$ |
2,236 |
|
$ |
2,213 |
|
Accrued expenses and other current liabilities |
|
|
7,981 |
|
|
8,197 |
|
Accrued compensation |
|
|
8,856 |
|
|
6,326 |
|
Long-term bank and other debt-current portion |
|
|
2,000 |
|
|
1,250 |
|
Total current liabilities |
|
|
21,073 |
|
|
17,986 |
|
Other liabilities |
|
|
7,609 |
|
|
6,775 |
|
Deferred taxes |
|
|
1,694 |
|
|
1,185 |
|
Long term bank and other debt, net |
|
|
42,424 |
|
|
25,227 |
|
Commitments and contingencies |
|
|
|
|
|
|
|
Stockholders’ equity: |
|
|
|
|
|
|
|
Common stock, $0.001 par value; 75,000,000 shares authorized as of December 31, 2016 and 2015; 46,201,563 shares and 38,524,922 shares issued and outstanding as of December 31, 2016 and 2015, respectively |
|
|
46 |
|
|
38 |
|
Additional paid-in capital |
|
|
435,551 |
|
|
309,078 |
|
Accumulated deficit |
(204,726) | (130,510) | ||||
|
Accumulated other comprehensive loss |
|
|
(1) |
|
|
(42) |
|
Total stockholders’ equity |
|
|
230,870 |
|
|
178,564 |
|
Total liabilities and stockholders’ equity |
|
$ |
303,670 |
|
$ |
229,737 |
See accompanying notes to audited consolidated financial statements.
F-3
TELADOC, INC.
Consolidated Statements of Operations
(in thousands, except shares and per share data)
|
|
|
|
Year Ended December 31, |
|
|||||||
|
|
|
|
2016 |
|
2015 |
|
2014 |
|
|||
|
Revenue |
|
|
$ |
123,157 |
|
$ |
77,384 |
|
$ |
43,528 |
|
|
Cost of revenue |
|
|
|
31,971 |
|
|
21,041 |
|
|
9,929 |
|
|
Gross profit |
|
|
|
91,186 |
|
|
56,343 |
|
|
33,599 |
|
|
Operating expenses: |
|
|
|
|
|
|
|
|
|
|
|
|
Advertising and marketing |
|
|
|
34,720 |
|
|
20,236 |
|
|
7,662 |
|
|
Sales |
|
|
|
26,243 |
|
|
17,976 |
|
|
11,571 |
|
|
Technology and development |
|
|
|
21,815 |
|
|
14,210 |
|
|
7,573 |
|
|
Legal |
|
|
|
4,117 |
|
|
8,878 |
|
|
1,311 |
|
|
Regulatory |
|
|
|
3,158 |
|
|
2,433 |
|
|
429 |
|
|
Acquisition related costs |
|
|
|
6,959 |
|
|
551 |
|
|
196 |
|
|
General and administrative |
|
|
|
48,568 |
|
|
42,981 |
|
|
17,687 |
|
|
Depreciation and amortization |
|
|
|
8,270 |
|
|
4,863 |
|
|
2,320 |
|
|
Loss from operations |
|
|
|
(62,664) |
|
|
(55,785) |
|
|
(15,150) |
|
|
Amortization of warrants and loss on extinguishment of debt |
|
|
|
8,454 |
|
|
— |
|
|
— |
|
|
Interest expense, net |
|
|
|
2,588 |
|
|
2,199 |
|
|
1,499 |
|
|
Net loss before taxes |
|
|
|
(73,706) |
|
|
(57,984) |
|
|
(16,649) |
|
|
Income tax provision |
|
|
|
510 |
|
|
36 |
|
|
388 |
|
|
Net loss |
|
|
$ |
(74,216) |
|
$ |
(58,020) |
|
$ |
(17,037) |
|
|
Net loss per share, basic and diluted |
|
|
$ |
(1.75) |
|
$ |
(2.91) |
|
$ |
(10.25) |
|
|
|
|
|
|
|
|
|
|
|
|
|
|
|
Weighted-average shares used to compute basic and diluted net loss per share |
|
|
|
42,330,908 |
|
|
19,917,348 |
|
|
1,962,845 |
|
|
|
|
|
|
|
|
|
|
|
|
|
|
See accompanying notes to audited consolidated financial statements.
F-4
TELADOC, INC.
Consolidated Statements of Comprehensive Loss
(In thousands)
|
|
|
Year Ended December 31, |
|
|||||||
|
|
|
2016 |
|
2015 |
|
2014 |
|
|||
|
Net loss |
|
$ |
(74,216) |
|
$ |
(58,020) |
|
$ |
(17,037) |
|
|
Other comprehensive income, net of tax |
|
|
|
|
|
|
|
|
|
|
|
Net change in unrealized gains (losses) on available-for-sale securities |
|
|
41 |
|
|
(42) |
|
|
— |
|
|
Other comprehensive income (loss), net of tax |
|
|
41 |
|
|
(42) |
|
|
— |
|
|
Comprehensive loss |
|
$ |
(74,175) |
|
$ |
(58,062) |
|
$ |
(17,037) |
|
See accompanying notes to audited consolidated financial statements
F-5
TELADOC, INC.
Consolidated Statements of Convertible Preferred Stock and Stockholders’ Equity (Deficit)
(in thousands, except share data)
|
|
|
|
|
|
|
|
|
|
|
|
|
|
|
|
|
Accumulated |
|
|
|
||||||||||
|
|
|
Convertible |
|
Redeemable |
|
|
|
|
|
|
Additional |
|
|
|
|
Other |
|
Total |
|
||||||||||
|
|
|
Preferred Stock |
|
Common Stock |
|
|
Common Stock |
|
Paid-In |
|
Accumulated |
|
Comprehensive |
|
Stockholders’ |
|
|||||||||||||
|
|
|
Shares |
|
Amount |
|
Shares |
|
Amount |
|
|
Shares |
|
Amount |
|
Capital |
|
Deficit |
|
Income (Loss) |
|
Equity |
|
|||||||
|
Balance as of January 1, 2014 |
|
37,590,286 |
|
|
71,655 |
|
113,294 |
|
|
2,852 |
|
|
1,302,759 |
|
$ |
1 |
|
$ |
— |
|
$ |
(55,453) |
|
$ |
— |
|
$ |
(55,452) |
|
|
Issuance of Series F preferred stock, net of issuance costs |
|
11,329,068 |
|
|
50,082 |
|
— |
|
|
— |
|
|
— |
|
|
— |
|
|
— |
|
|
— |
|
|
— |
|
|
— |
|
|
Accretion of Seried F preferred stock to redemption amount |
|
— |
|
|
168 |
|
— |
|
|
— |
|
|
— |
|
|
— |
|
|
(168) |
|
|
— |
|
|
— |
|
|
(168) |
|
|
Preferred dividend |
|
— |
|
|
2,920 |
|
— |
|
|
— |
|
|
— |
|
|
— |
|
|
(2,920) |
|
|
— |
|
|
— |
|
|
(2,920) |
|
|
Preferred dividends retired and converted to Series F preferred stock |
|
1,553,917 |
|
|
(6,892) |
|
— |
|
|
— |
|
|
— |
|
|
— |
|
|
6,892 |
|
|
— |
|
|
— |
|
|
6,892 |
|
|
Warrants issued |
|
— |
|
|
— |
|
— |
|
|
— |
|
|
— |
|
|
— |
|
|
219 |
|
|
— |
|
|
— |
|
|
219 |
|
|
Repurchase of convertible preferred and common stock |
|
(20,332) |
|
|
(19) |
|
— |
|
|
— |
|
|
(50,834) |
|
|
— |
|
|
(349) |
|
|
— |
|
|
— |
|
|
(349) |
|
|
Exercise of stock options |
|
— |
|
|
— |
|
— |
|
|
— |
|
|
786,074 |
|
|
1 |
|
|
746 |
|
|
— |
|
|
— |
|
|
747 |
|
|
Stock-based compensation |
|
— |
|
|
— |
|
— |
|
|
— |
|
|
— |
|
|
— |
|
|
533 |
|
|
— |
|
|
— |
|
|
533 |
|
|
Net loss |
|
— |
|
|
— |
|
— |
|
|
— |
|
|
— |
|
|
— |
|
|
— |
|
|
(17,037) |
|
|
— |
|
|
(17,037) |
|
|
Balance as of December 31, 2014 |
|
50,452,939 |
|
|
117,914 |
|
113,294 |
|
|
2,852 |
|
|
2,037,999 |
|
|
2 |
|
|
4,953 |
|
|
(72,490) |
|
|
— |
|
|
(67,535) |
|
|
Exercise of stock options |
|
— |
|
|
— |
|
— |
|
|
— |
|
|
270,545 |
|
|
— |
|
|
428 |
|
|
— |
|
|
— |
|
|
428 |
|
|
Exercise of warrants |
|
— |
|
|
— |
|
— |
|
|
— |
|
|
114,111 |
|
|
— |
|
|
(1) |
|
|
— |
|
|
— |
|
|
(1) |
|
|
Issuance of stock in acquisition |
|
— |
|
|
— |
|
— |
|
|
— |
|
|
1,051,033 |
|
|
1 |
|
|
16,774 |
|
|
— |
|
|
— |
|
|
16,775 |
|
|
Issuance of stock in connection with IPO, net of $17,144 issuance costs |
|
— |
|
|
— |
|
— |
|
|
— |
|
|
9,487,500 |
|
|
9 |
|
|
163,109 |
|
|
— |
|
|
— |
|
|
163,118 |
|
|
Conversion of convertible preferred stock |
|
(50,452,939) |
|
|
(117,914) |
|
— |
|
|
— |
|
|
25,450,440 |
|
|
26 |
|
|
117,888 |
|
|
— |
|
|
— |
|
|
117,914 |
|
|
Conversion of redeemable common stock |
|
— |
|
|
— |
|
(113,294) |
|
|
(2,852) |
|
|
113,294 |
|
|
— |
|
|
2,852 |
|
|
— |
|
|
— |
|
|
2,852 |
|
|
Stock-based compensation |
|
— |
|
|
— |
|
— |
|
|
— |
|
|
— |
|
|
— |
|
|
3,075 |
|
|
— |
|
|
— |
|
|
3,075 |
|
|
Other comprehensive loss, net of tax |
|
— |
|
|
— |
|
— |
|
|
— |
|
|
— |
|
|
— |
|
|
— |
|
|
— |
|
|
(42) |
|
|
(42) |
|
|
Net loss |
|
— |
|
|
— |
|
— |
|
|
— |
|
|
— |
|
|
— |
|
|
— |
|
|
(58,020) |
|
|
— |
|
|
(58,020) |
|
|
Balance as of December 31, 2015 |
|
— |
|
$ |
— |
|
— |
|
$ |
— |
|
|
38,524,922 |
|
|
38 |
|
|
309,078 |
|
|
(130,510) |
|
|
(42) |
|
|
178,564 |
|
|
Exercise of stock options |
|
|
|
|
|
|
|
|
|
|
|
|
594,555 |
|
|
1 |
|
|
2,523 |
|
|
— |
|
|
— |
|
|
2,524 |
|
|
Exercise of warrants |
|
|
|
|
|
|
|
|
|
|
|
|
107,931 |
|
|
— |
|
|
— |
|
|
— |
|
|
— |
|
|
— |
|
|
Stock-based compensation |
|
|
|
|
|
|
|
|
|
|
|
|
— |
|
|
— |
|
|
7,723 |
|
|
— |
|
|
— |
|
|
7,723 |
|
|
Warrants issued |
|
|
|
|
|
|
|
|
|
|
|
|
— |
|
|
— |
|
|
7,717 |
|
|
— |
|
|
— |
|
|
7,717 |
|
|
Issuance of stock in acquisition |
|
|
|
|
|
|
|
|
|
|
|
|
6,955,796 |
|
|
7 |
|
|
108,260 |
|
|
— |
|
|
— |
|
|
108,267 |
|
|
Issuance of stock |
|
|
|
|
|
|
|
|
|
|
|
|
18,359 |
|
|
— |
|
|
250 |
|
|
— |
|
|
— |
|
|
250 |
|
|
Other comprehensive income, net of tax |
|
|
|
|
|
|
|
|
|
|
|
|
— |
|
|
— |
|
|
— |
|
|
— |
|
|
41 |
|
|
41 |
|
|
Net loss |
|
|
|
|
|
|
|
|
|
|
|
|
— |
|
|
— |
|
|
— |
|
|
(74,216) |
|
|
— |
|
|
(74,216) |
|
|
Balance as of December 31, 2016 |
|
— |
|
$ |
— |
|
— |
|
$ |
— |
|
|
46,201,563 |
|
$ |
46 |
|
$ |
435,551 |
|
$ |
(204,726) |
|
$ |
(1) |
|
$ |
230,870 |
|
See accompanying notes to audited consolidated financial statements.
F-6
TELADOC, INC.
Consolidated Statements of Cash Flows
(in thousands)
|
|
|
Year Ended December 31, |
|
|||||||
|
|
|
2016 |
|
2015 |
|
2014 |
|
|||
|
Cash flows used in operating activities: |
|
|
|
|
|
|
|
|
|
|
|
Net loss |
|
$ |
(74,216) |
|
$ |
(58,020) |
|
$ |
(17,037) |
|
|
Adjustments to reconcile net loss to net cash used in operating activities: |
|
|
|
|
|
|
|
|
|
|
|
Depreciation and amortization |
|
|
8,270 |
|
|
4,863 |
|
|
2,320 |
|
|
Allowance for doubtful accounts |
|
|
2,412 |
|
|
2,034 |
|
|
1,308 |
|
|
Stock-based compensation |
|
|
7,723 |
|
|
3,075 |
|
|
533 |
|
|
Deferred income taxes |
|
|
510 |
|
|
36 |
|
|
388 |
|
|
Accretion of interest |
|
|
262 |
|
|
460 |
|
|
106 |
|
|
Amortization of warrants |
|
|
7,717 |
|
|
798 |
|
|
— |
|
|
Changes in operating assets and liabilities: |
|
|
|
|
|
— |
|
|
— |
|
|
Accounts receivable |
|
|
(2,900) |
|
|
(6,795) |
|
|
(5,079) |
|
|
Prepaid expenses and other current assets |
|
|
(826) |
|
|
(957) |
|
|
(436) |
|
|
Other assets |
|
|
(42) |
|
|
5 |
|
|
(185) |
|
|
Accounts payable |
|
|
(813) |
|
|
(612) |
|
|
2,099 |
|
|
Accrued expenses and other current liabilities |
|
|
(2,221) |
|
|
3,457 |
|
|
(26) |
|
|
Accrued compensation |
|
|
1,688 |
|
|
2,887 |
|
|
1,971 |
|
|
Other liabilities |
|
|
641 |
|
|
1,588 |
|
|
2,679 |
|
|
Net cash used in operating activities |
|
|
(51,795) |
|
|
(47,181) |
|
|
(11,359) |
|
|
Cash flows provided by (used in) investing activities: |
|
|
|
|
|
|
|
|
|
|
|
Purchase of property and equipment |
|
|
(2,108) |
|
|
(6,275) |
|
|
(1,069) |
|
|
Purchase of internal software |
|
|
(1,304) |
|
|
(1,542) |
|
|
(665) |
|
|
Purchase of marketable securities |
|
|
(44,146) |
|
|
(103,030) |
|
|
— |
|
|
Proceeds from the liquidation/maturity of marketable securities |
|
|
110,717 |
|
|
20,411 |
|
|
— |
|
|
Acquisition of business, net of cash acquired |
|
|
(37,013) |
|
|
(17,767) |
|
|
(13,844) |
|
|
Net cash provided by (used in) investing activities |
|
|
26,146 |
|
|
(108,203) |
|
|
(15,578) |
|
|
Cash flows provided by financing activities: |
|
|
|
|
|
|
|
|
|
|
|
Net proceeds from the exercise of stock options |
|
|
2,524 |
|
|
428 |
|
|
747 |
|
|
Proceeds from issuance of convertible preferred stock |
|
|
— |
|
|
— |
|
|
50,082 |
|
|
Proceeds from borrowing under bank and other debt |
|
|
34,990 |
|
|
6,800 |
|
|
19,700 |
|
|
Repayment of bank loan and other debt |
|
|
(17,166) |
|
|
(6,332) |
|
|
— |
|
|
Proceeds from issuance of common stock under IPO |
|
|
— |
|
|
163,118 |
|
|
— |
|
|
Proceeds from issuance of common stock |
|
|
250 |
|
|
— |
|
|
— |
|
|
Repurchase of stock |
|
|
— |
|
|
— |
|
|
(368) |
|
|
Net cash provided by financing activities |
|
|
20,598 |
|
|
164,014 |
|
|
70,161 |
|
|
Net (decrease) increase in cash and cash equivalents |
|
|
(5,051) |
|
|
8,630 |
|
|
43,224 |
|
|
Cash and cash equivalents at beginning of the period |
|
|
55,066 |
|
|
46,436 |
|
|
3,212 |
|
|
Cash and cash equivalents at end of the period |
|
$ |
50,015 |
|
$ |
55,066 |
|
$ |
46,436 |
|
|
Interest paid |
|
$ |
2,387 |
|
$ |
1,995 |
|
$ |
1,191 |
|
See accompanying notes to audited consolidated financial statements.
F-7
TELADOC, INC.
Notes to Audited Consolidated Financial Statements
Note 1. Organization and Description of Business
Teladoc, Inc. (together with its consolidated subsidiaries, “Teladoc”, or the “Company”) was incorporated in the State of Texas in June 2002 and changed its state of incorporation to the State of Delaware in October 2008. The Company’s principal executive offices are located in Purchase, New York and Lewisville, Texas. Teladoc is the nation’s largest telehealth company.
On July 7, 2015, Teladoc closed on its initial public offering (the “IPO”) in which the Company issued and sold 9,487,500 shares of common stock, including the exercise of an underwriter option to purchase additional shares, at an issuance price of $19.00 per share. The Company received net proceeds of $163.1 million after deducting underwriting discounts and commissions of $12.6 million as well as other offering expenses of $4.5 million. On July 7, 2015, all of the Company’s then-outstanding convertible preferred stock converted into an aggregate of 25.5 million shares of common stock and all of the Company’s redeemable common stock converted into 113,294 shares of common stock. See Note 18, “Subsequent Events” for information regarding the Company’s follow-on public offering (“Follow-On Offering”).
The Company completed the acquisition of HY Holdings, Inc. in July 2016 (“HealthiestYou”), a leading telehealth consumer engagement technology platform for the small to mid-sized employer market and Compile, Inc. d/b/a BetterHelp (“BetterHelp”) and Stat Health Services Inc. (“StatDoc”) in 2015, and AmeriDoc, LLC (“AmeriDoc”) in 2014, four companies engaged in telehealth activities similar to those of Teladoc. Additionally in 2015, the Company acquired certain assets from Gateway to Provider Access, Inc. (“Gateway”) which engaged in the marketing, selling and administering the Company’s services through other third parties. Upon the effective date of each respective merger, each entity merged with and into Teladoc.
Note 2. Summary of Significant Accounting Policies
Basis of Presentation and Principles of Consolidation
These consolidated financial statements have been prepared in accordance with U.S. generally accepted accounting principles (“GAAP”). The consolidated financial statements include the results of Teladoc, two professional associations and twenty two professional corporations and a service corporation (collectively, the “Association”).
Teladoc Physicians, P.A. is party to several Services Agreements by and among it and the professional corporations pursuant to which each professional corporation provides services to Teladoc Physicians, P.A. Each professional corporation is established pursuant to the requirements of its respective domestic jurisdiction governing the corporate practice of medicine.
The Company holds a variable interest in the Association which contracts with physicians and other health professionals in order to provide services to Teladoc. The Association is considered a variable interest entity (“VIE”) since it does not have sufficient equity to finance its activities without additional subordinated financial support. An enterprise having a controlling financial interest in a VIE, must consolidate the VIE if it has both power and benefits—that is, it has (1) the power to direct the activities of a VIE that most significantly impact the VIE’s economic performance (power) and (2) the obligation to absorb losses of the VIE that potentially could be significant to the VIE or the right to receive benefits from the VIE that potentially could be significant to the VIE (benefits). The Company has the power and rights to control all activities of the Association and funds and absorbs all losses of the VIE.
Total revenue and net loss for the VIE were $22.5 million and $(8.6) million, $13.9 million and $(7.3) million and $6.5 million and $(3.9) million for the years ended December 31, 2016, 2015 and 2014, respectively. The VIE’s total assets were $2.9 million and $2.4 million at December 31, 2016 and 2015, respectively. Total liabilities for the VIE were
F-8
$27.8 million and $18.7 million at December 31, 2016 and 2015, respectively. The VIE total stockholders’ deficit was $25.0 million and $16.4 million at December 31, 2016 and 2015, respectively.
All significant intercompany transactions and balances have been eliminated.
Business Combinations
The Company accounts for its business combinations using the acquisition method of accounting. The cost of an acquisition is measured as the aggregate of the acquisition date fair values of the assets transferred and liabilities assumed by the Company to the sellers and equity instruments issued. Transaction costs directly attributable to the acquisition are expensed as incurred. Identifiable assets and liabilities acquired or assumed are measured separately at their fair values as of the acquisition date. The excess of (i) the total costs of acquisition over (ii) the fair value of the identifiable net assets of the acquiree is recorded as goodwill.
Use of Estimates
The preparation of financial statements in conformity with GAAP requires management to make estimates and assumptions that affect the amounts reported in the consolidated financial statements and accompanying notes. The Company bases its estimates on historical experience, current business factors, and various other assumptions that the Company believes are necessary to consider to form a basis for making judgments about the carrying values of assets and liabilities, the recorded amounts of revenue and expenses, and the disclosure of contingent assets and liabilities. The Company is subject to uncertainties such as the impact of future events, economic and political factors, and changes in the Company’s business environment; therefore, actual results could differ from these estimates. Accordingly, the accounting estimates used in the preparation of the Company’s consolidated financial statements will change as new events occur, as more experience is acquired, as additional information is obtained and as the Company’s operating environment evolves.
Changes in estimates are made when circumstances warrant. Such changes in estimates and refinements in estimation methodologies are reflected in reported results of operations; if material, the effects of changes in estimates are disclosed in the notes to the consolidated financial statements. Significant estimates and assumptions by management affect the allowance for doubtful accounts, the carrying value of long‑lived assets (including goodwill and intangible assets), the carrying value, capitalization and amortization of software development costs, client performance guarantees, the calculation of a contingent liability in connection with an earn‑out, the provision for income taxes and related deferred tax accounts, certain accrued liabilities, revenue recognition, contingencies, litigation and related legal accruals and the value attributed to employee stock options and other stock‑based awards.
Segment Information
The Company’s chief operating decision maker, its Chief Executive Officer (“CEO”), reviews the financial information presented on a consolidated basis for purposes of allocating resources and evaluating its financial performance. Accordingly, the Company has determined that it operates in a single reportable segment—health services.
Revenue Recognition
The Company offers two types of subscription access revenue contracts: (i) contracts that provide for a fixed monthly charge for access and unlimited visits per Member and (ii) contracts that provide for a fixed monthly charge for access and a contractually defined cost for each visit. Any visit fee revenue that is not included in the subscription access revenue is recognized when the service has been provided to the Member.
The Company recognizes a substantial portion of its revenue from contracts that provide employers and health plans (“Clients”) with subscription access to the Company’s network of physicians and other healthcare professionals (“Providers”) on a subscription basis for a fixed monthly fee which entitles the Client’s employees and their beneficiaries (“Members”) to unlimited consultations (“visits”). The contracts are generally for a one‑year term and have an automatic renewal feature for additional years.
F-9
The Company commences revenue recognition for the subscription access service on the date that the services are made available to the Client and its Members, which is considered the implementation date, provided all of the following criteria are met:
|
· |
there is an executed subscription agreement; |
|
· |
the Member has access to the service; |
|
· |
collection of the fees is reasonably assured; and |
|
· |
the amount of fees to be paid by the Client and Member is fixed and determinable. |
Subscription Access Revenue
Subscription access revenue recognition commences on the date that the Company’s services are made available to the Client, which is considered the implementation date, provided all of the other criteria described above are met. Revenue is recognized over the term of the Client contract and is based on the terms in the Client contracts, which can provide for a variable periodic fee based upon the actual number of Members.
Revenue From Visit Fees
Revenue from visits is comprised of all revenue that is earned in connection with the completion of a visit. The Company recognizes revenue as the visits are completed.
The Company’s contracts do not generally contain refund provisions for fees earned related to services performed. However, the Companys direct-to-consumer behavioral health product provides for refunds and the Company issued credits of approximately $0.8 million and $0.4 million for the years ended December 31, 2016 and 2015, respectively. Additionally, certain of the Company’s contracts include client performance guarantees that are based upon minimum Member utilization and guarantees by the Company for specific service level performance of the Company’s services. If client performance guarantees are not being realized, the Company deducts from revenue an estimate of the amount that will be due at the end of the respective client’s contractual period. The Company issued credits amounting to approximately $0.1 million for the year ended December 31, 2016 and $0.4 million for both of the years ended December 31, 2015 and 2014.
Cost of Revenue
Cost of revenue primarily consists of fees paid to the Providers, costs incurred in connection with the Company’s Provider network operations, which include employee‑related expenses (including salaries and benefits) as well as costs related to medical malpractice insurance.
Cash and Cash Equivalents
Cash and cash equivalents consist of highly liquid investments with original maturities of three months or less from the date of purchase. The Company’s cash and cash equivalents generally consist of investments in money market funds. Cash and cash equivalents are stated at fair value.
Short-Term Investments
The Company holds short-term investments in marketable securities primarily consisting of corporate bonds, commercial paper, U.S. treasuries and asset backed securities with maturities of less than one year. These short-term investments are classified as available-for-sale and are carried at fair value with unrealized gains or losses recorded as a separate component of stockholders’ equity in accumulated other comprehensive loss. Realized gains or losses are recognized in the consolidated statements of operations upon disposition of the securities.
F-10
As of December 31, 2016, there were no short-term investments that had been in a continuous loss position for more than 12 months.
Actual maturities may differ from contractual maturities because borrowers may have the right to call or prepay obligations with or without call or prepayment penalties. Realized losses for the year ended December 31, 2016 were less than $0.1 million and are included in general and administrative expenses in the Company’s consolidated statements of operations. There were no realized losses in 2015 and 2014.
Accounts Receivable and Allowance for Doubtful Accounts
Accounts receivable are recorded at the invoiced amount, net of allowances for doubtful accounts. The allowance for doubtful accounts is based on the Company’s assessment of the collectability of accounts. The Company regularly reviews the adequacy of the allowance for doubtful accounts by considering the age of each outstanding invoice and the collection history of each customer to determine whether a specific allowance is appropriate. Accounts receivable deemed uncollectable are charged against the allowance for doubtful accounts when identified.
Property and Equipment
Property and equipment are stated at cost less accumulated depreciation. Depreciation is recorded using the straight‑line method over the estimated useful lives of the respective asset as follows:
|
Computer equipment |
|
3 years |
|
Furniture and equipment |
|
5 years |
|
Leasehold improvements |
|
Shorter of the lease term or the estimated useful lives of the improvements |
Maintenance and repairs are charged to expense as incurred, and improvements are capitalized. When assets are retired or otherwise disposed of, the cost and accumulated depreciation are removed from the accounts, and any resulting gain or loss is reflected in the consolidated statement of operations in the period realized.
Internal‑Use Software
Internal‑use software is included in intangible assets and is amortized on a straight‑line basis over 3 to 5 years. For the Company’s development costs related to its software development tools that enable its Members and Providers to interact, the Company capitalizes costs incurred during the application development stage. Costs related to minor upgrades, minor enhancements and maintenance activities are expensed as incurred.
Goodwill and Intangible Assets
Goodwill represents the excess of the purchase price over the fair value of the net tangible and intangible assets acquired in a business combination. Goodwill is not amortized, but is tested for impairment annually on October 1 or more frequently if events or changes in circumstances indicate that the asset may be impaired. The Company’s impairment tests are based on a single operating segment and reporting unit structure. The goodwill impairment test involves a two‑ step process. The first step involves comparing the fair value of the Company’s reporting unit to its carrying value, including goodwill. The fair value of the reporting unit is estimated using quoted market prices in active markets of the Company’s stock. If the carrying value of the reporting unit exceeds its fair value, the second step of the test is performed by comparing the carrying value of the goodwill in the reporting unit to its implied fair value. An impairment charge is recognized for the excess of the carrying value of goodwill over its implied fair value.
The Company’s annual goodwill impairment test resulted in no impairment charges in any of the periods presented in the consolidated financial statements.
Other intangible assets resulted from business acquisitions and include Client relationships, non‑compete agreements, patents and trademarks. Client relationships are amortized over a period of 2 to 10 years in relation to
F-11
expected future cash flows, while non‑compete agreements are amortized over a period of 1.5 to 5 years using the straight‑line method. Patents and trademarks are amortized over 3 years using the straight-line method.
Long-lived assets (property and equipment, internally developed software, and intangible assets) used in operations are reviewed for impairment whenever events or changes in circumstances indicate that carrying amounts may not be recoverable. For long-lived assets to be held and used, the Company recognizes an impairment loss only if its carrying amount is not recoverable through its undiscounted cash flows and measures the impairment loss based on the difference between the carrying amount and fair value. In 2015 the Company recorded an impairment loss for certain internally developed software as it is no longer being utilized. The impairment loss of $0.8 million is included in general and administrative expense in the consolidated statements of operations. There were no impairment losses in 2016 or 2014.
Stock‑Based Compensation
Stock‑based compensation for stock options granted is measured based on the grant‑ date fair value of the awards and recognized on a straight‑line basis over the period during which the employee is required to perform services in exchange for the award (generally the vesting period of the award). The Company estimates the fair value of employee stock options using the Black‑Scholes option‑pricing model.
The Company’s Employee Stock Purchase Plan (“ESPP”) permits eligible employees to purchase common stock at a discount through payroll deductions during defined offering periods. Under the ESPP, the Company may specify offerings with durations of not more than 27 months, and may specify shorter purchase periods within each offering. Each offering will have one or more purchase dates on which shares of its common stock will be purchased for employees participating in the offering. An offering may be terminated under certain circumstances. The price at which the stock is purchased is equal to the lower of 85% of the fair market value of the common stock at the beginning of an offering period or on the date of purchase.
Income Taxes
The Company accounts for income taxes using the liability method, under which deferred tax assets and liabilities are determined based on the future tax consequences attributable to differences between the financial reporting carrying amounts of existing assets and liabilities and their respective tax bases and tax credit carry forwards and net operating loss carryforwards. Deferred tax assets and liabilities are measured using the enacted tax rates that are expected to be in effect when the differences are expected to reverse.
The Company assesses the likelihood that deferred tax assets will be recovered from future taxable income, and a valuation allowance is established when necessary to reduce deferred tax assets to the amounts more likely than not expected to be realized.
The Company recognizes and measures uncertain tax positions using a two‑ step approach. The first step is to evaluate the tax position taken or expected to be taken by determining if the weight of available evidence indicates that it is more likely than not that the tax position will be sustained in an audit, including resolution of any related appeals or litigation processes. The second step is to measure the tax benefit as the largest amount that is more than 50% likely to be realized upon ultimate settlement. Significant judgment is required to evaluate uncertain tax positions. The Company evaluates its uncertain tax positions on a regular basis. Its evaluations are based on a number of factors, including changes in facts and circumstances, changes in tax law, correspondence with tax authorities during the course of audit and effective settlement of audit issues. The Company’s policy is to include interest and penalties related to unrecognized tax benefits as a component of interest income (expense), net in the consolidated statements of operations.
Comprehensive Loss
Comprehensive loss consists of net loss and unrealized gains or losses on short-term investments. Unrealized gains or losses are net of any reclassification adjustments for realized gains and losses included in the consolidated statements of operations.
F-12
Net Loss Per Share
Basic net loss per share is computed by dividing the net loss by the weighted-average number of shares of common stock of the Company outstanding during the period. Diluted net loss per share is computed by giving effect to all potential shares of common stock, including the preferred stock (in 2015 and 2014) and outstanding stock options and warrants, to the extent dilutive. Basic and diluted net loss per share was the same for each period presented as the inclusion of all potential shares of common stock outstanding would have been anti-dilutive.
Warranties and Indemnification
The Company’s arrangements generally include certain provisions for indemnifying Clients against liabilities if there is a breach of a Client’s data or if the Company’s service infringes a third party’s intellectual property rights. To date, the Company has not incurred any material costs as a result of such indemnifications.
The Company has also agreed to indemnify its directors and executive officers for costs associated with any fees, expenses, judgments, fines and settlement amounts incurred by any of these persons in any action or proceeding to which any of those persons is, or is threatened to be, made a party by reason of the person’s service as a director or officer, including any action by the Company, arising out of that person’s services as a director or officer or that person’s services provided to any other company or enterprise at the Company’s request. The Company maintains director and officer liability insurance coverage that would generally enable it to recover a portion of any future amounts paid. The Company may also be subject to indemnification obligations by law with respect to the actions of its employees under certain circumstances and in certain jurisdictions.
Advertising and Marketing Expenses
Advertising and marketing include all communications and campaigns to the Company’s Clients and Members, digital advertising and related employees’ costs and are expensed as incurred. For the years ended December 31, 2016, 2015 and 2014, advertising expenses were $29.5 million, $17.3 million and $6.0 million, respectively.
Concentrations of Risk and Significant Clients
The Company’s financial instruments that are exposed to concentrations of credit risk consist primarily of cash and cash equivalents, and accounts receivable. Although the Company deposits its cash with multiple financial institutions, its deposits, at times, may exceed federally insured limits.
During the year ended December 31, 2016 and 2015, substantially all of the Company’s revenue was generated by Clients located in the United States. During the year ended 2014, all of the Company’s revenue was generated by clients located in the United States. One Client represented 11% of accounts receivable at December 31, 2016. No Client represented over 10% of accounts receivable at December 31, 2015 or revenue for the years ended December 31, 2016, 2015 and 2014.
Reclassifications
Certain prior year amounts have been reclassified to conform to the current year presentation.
Seasonality
The Company typically experiences the strongest increases in consecutive quarterly revenue during the fourth and first quarters of each year, which coincides with traditional annual benefit enrollment seasons. In particular, as a result of many Clients’ introduction of new services at the very end of a calendar year, or the start of each calendar year, the majority of the Company’s new Client contracts have an effective date of January 1. Additionally, as a result of national seasonal cold and flu trends, the Company experiences the highest level of visit fees during the first and fourth quarters of each year when compared to other quarters of the year. Conversely, the second quarter of the year has
F-13
historically been the period of lowest utilization of the Company’s Provider network services relative to the other quarters of the year.
Recently Issued and Adopted Accounting Pronouncements
In May 2014, the Financial Accounting Standards Board (“FASB”) issued Accounting Standards Update (“ASU”) 2014-09, Revenue from Contracts with Customers (Topic 606), to achieve a consistent application of revenue recognition within the U.S., resulting in a single revenue model to be applied by reporting companies under GAAP. Under the new model, recognition of revenue occurs when a customer obtains control of promised goods or services in an amount that reflects the consideration to which the entity expects to be entitled in exchange for those goods or services. In addition, the revised guidance requires that reporting companies disclose the nature, amount, timing, and uncertainty of revenue and cash flows arising from contracts with customers. The revised guidance is effective for the Company beginning in the quarter ending March 31, 2018; early adoption is allowed. The revised guidance is required to be applied retrospectively to each prior reporting period presented or modified retrospectively applied with the cumulative effect of initially applying it recognized at the date of initial application. The Company currently anticipates adopting the standard using the modified retrospective method. The Company is currently evaluating the impact of the adoption of this guidance on the consolidated financial statements.
In August 2014, the FASB issued ASU 2014-15, Presentation of Financial Statements—Going Concern. This guidance addresses management’s responsibility to evaluate whether there is substantial doubt about an entity’s ability to continue as a going concern and to provide related footnote disclosures. Management’s evaluation should be based on relevant conditions and events that are known and reasonably knowable at the date that the financial statements are issued. ASU 2014-15 is effective for annual periods ending after December 15, 2016. Early adoption is permitted. The Company adopted this guidance in the fourth quarter of 2016 and based on the management assessment, there are no conditions and events that raise substantial doubt about the Company’s ability to continue as a going concern. As a result, the adoption of this standard had no impact on the Company’s consolidated financial statements and disclosures.
In February 2016, the FASB issued ASU 2016-02, Leases (Topic 842). ASU 2016-02 related to leases that outlines a comprehensive lease accounting model and supersedes the current lease guidance. The new guidance requires lessees to recognize lease liabilities and corresponding right-of-use assets for all leases with lease terms of greater than 12 months. It also changes the definition of a lease and expands the disclosure requirements of lease arrangements. The new guidance must be adopted using the modified retrospective approach and will be effective for the Company starting in the first quarter of fiscal 2019. Early adoption is permitted. The Company is currently in the process of evaluating the impact of the adoption of this standard on the consolidated financial statements.
In March 2016, the FASB issued ASU 2016-09, Compensation—Stock Compensation (Topic 718): Improvements to Employee Share-Based Payment Accounting. ASU 2016-09 revises the accounting treatment for excess tax benefits, minimum statutory withholding requirements and forfeitures related to share-based awards. The new guidance will be effective for the Company starting in the first quarter of fiscal 2017. Early adoption is permitted in any annual or interim period. The Company is currently in the process of evaluating the impact of the adoption of this standard on the consolidated financial statements.
Note 3. Fair Value Measurements
The Company measures its financial assets and liabilities at fair value at each reporting period using a fair value hierarchy that requires it to maximize the use of observable inputs and minimize the use of unobservable inputs when measuring fair value. A financial instrument’s classification within the fair value hierarchy is based upon the lowest level of input that is significant to the fair value measurement. Three levels of inputs may be used to measure fair value:
Level 1—Observable inputs that reflect quoted prices (unadjusted) for identical assets or liabilities in active
markets.
Level 2—Include other inputs that are directly or indirectly observable in the marketplace.
F-14
Level 3—Unobservable inputs that are supported by little or no market activity.
The Company measures its cash equivalents at fair value on a recurring basis. The Company classifies its cash equivalents within Level 1 because they are valued using observable inputs that reflect quoted prices for identical assets in active markets and quoted prices directly in active markets.
The Company measures its short-term investments at fair value on a recurring basis and classifies such as Level 2. They are valued using observable inputs that reflect quoted prices directly or indirectly in active markets. The short-term investments amortized cost approximates fair value.
The Company measures its contingent consideration at fair value on a recurring basis and classifies such as Level 3. The Company estimates the fair value of contingent consideration as the present value of the expected contingent payments, determined using the weighted probability of the possible payments.
The following tables present information about the Company’s assets and liabilities that are measured at fair value on a recurring basis using the above input categories (in thousands):
|
|
|
December 31, 2016 |
||||||||||
|
|
|
Level 1 |
|
Level 2 |
|
Level 3 |
|
Total |
||||
|
Cash and cash equivalents |
|
$ |
50,015 |
|
$ |
— |
|
$ |
— |
|
$ |
50,015 |
|
Short-term investments |
|
$ |
— |
|
$ |
15,793 |
|
$ |
— |
|
$ |
15,793 |
|
Contingent liability (included in other liabilities) |
|
$ |
— |
|
$ |
— |
|
$ |
3,678 |
|
$ |
3,678 |
|
|
|
December 31, 2015 |
|
||||||||||
|
|
|
|
Level 1 |
|
|
Level 2 |
|
|
Level 3 |
|
|
Total |
|
|
Cash and cash equivalents |
|
$ |
55,066 |
|
$ |
— |
|
$ |
— |
|
$ |
55,066 |
|
|
Short-term investments |
|
$ |
— |
|
$ |
82,282 |
|
$ |
— |
|
$ |
82,282 |
|
|
Contingent liability (included in accrued expenses and other current liabilities and other liabilities) |
|
$ |
— |
|
$ |
— |
|
$ |
3,408 |
|
$ |
3,408 |
|
There were no transfers between fair value measurement levels during the years ended December 31, 2016 and 2015.
The change in fair value of the Company’s contingent liability is recorded in general and administrative expenses in the consolidated statements of operations. The following table reconciles the beginning and ending balance of the Company’s Level 3 contingent liability (in thousands):
|
|
|
|
|
|
Balance at December 31, 2015 |
|
$ |
3,408 |
|
Change in fair value |
|
|
270 |
|
Fair value at December 31, 2016 |
|
$ |
3,678 |
Note 4. Lease Abandonment Charge
In connection with the Company’s abandonment of facilities in Dallas, Texas and Greenwich, Connecticut, the Company incurred $0.8 million, in lease abandonment charges during the year ended December 31, 2015, which is included within general and administrative expenses in the consolidated statement of operations. There were no lease
F-15
abandonments in 2016 or 2014. The following table details the associated liability. The current portion of the liability of less than $0.1 million was recorded in accrued expenses and other current liabilities (in thousands):
|
|
|
Year Ended |
|
||||
|
|
|
December 31, |
|
||||
|
|
|
2016 |
|
2015 |
|
||
|
Balance January 1 |
|
$ |
474 |
|
$ |
— |
|
|
Charged to expense |
|
|
— |
|
|
740 |
|
|
Paid or settled |
|
|
(433) |
|
|
(266) |
|
|
Balance December 31 |
|
$ |
41 |
|
$ |
474 |
|
Note 5. Business Acquisitions
On July 1, 2016, the Company completed the acquisition of HealthiestYou through a merger in which HealthiestYou became a wholly-owned subsidiary of the Company. The aggregate merger consideration paid was $151.5 million, which was comprised of 6,955,796 shares of Teladoc’s common stock valued at $108.3 million on July 1,2016, and $43.2 million of cash, subject to post-closing working capital adjustments as defined in the merger agreement. The post-closing working capital adjustment was finalized in the amount of less than $0.1 million. HealthiestYou was a leading telehealth consumer engagement technology platform for the small to mid-sized employer market. HealthiestYou provided end-users with access to telemedicine services including through a web-based portal and a mobile application. Solutions provided by HealthiestYou included 24/7 access to telephone, e-mail, and video conferencing with doctors as well as the convenience of procedure price comparisons, prescription medicine price comparisons, health plan information and benefits eligibility, and location information for wellness service providers. The acquisition was considered a stock acquisition for tax purposes and as such, the goodwill resulting from this acquisition is not tax deductible. The total acquisition related costs of the acquisition were $6.9 million and included transaction costs for banker and other professional fees as well as $5.7 million of contract termination costs for certain HealthiestYou third party providers. The contract termination costs of $5.7 million were previously accrued by HealthiestYou and reflected in HealthiestYou’s financial statements as of June 30, 2016, prior to the acquisition. These expenses are also reflected in the Company’s financial results as the Company benefited from the termination of these contracts and they represent a non-cash charge.
On July 31, 2015, the Company acquired certain assets from Gateway for $1.5 million, subject to post-closing working capital adjustments as defined in the purchase agreement. Gateway engaged in the marketing, selling and administering the Company’s services through other third parties and as a result, the price in excess of the net assets acquired (less than $0.1 million) was allocated to client relationships. The acquisition transaction costs were less than $0.1 million and were recorded in general and administrative expense. The acquisition was considered an asset acquisition for tax purposes.
On June 17, 2015, the Company completed the acquisition of StatDoc through a merger in which StatDoc became a wholly-owned subsidiary of the Company. The aggregate merger consideration paid by the Company in connection with the acquisition was $30.1 million, which was comprised of $13.3 million of cash and $16.8 million of the Company’s common stock (or 1,051,033 shares), subject to post-closing working capital adjustments as defined in the Agreement and Plan of Merger governing the acquisition. During the quarter ended September 30, 2015, the post-closing working capital adjustment was finalized favorably to the Company in the amount of less than $0.1 million. Fair value of the common stock was determined based on market data from similar healthcare enterprises. StatDoc was a telemedicine provider, focused on managed care, health system and self-insured clients. The acquisition was considered a stock acquisition for tax purposes and as such, the goodwill resulting from this acquisition is not tax deductible. The total associated transaction costs of the acquisition were $0.3 million and were recorded in general and administrative expense.
On January 23, 2015, the Company completed the acquisition of BetterHelp, through a merger in which BetterHelp became a wholly‑owned subsidiary of the Company. The merger consideration paid by the Company in connection with this acquisition consisted of (i) $3.3 million net of cash acquired and (ii) earn‑out payments equal to a percentage of the annual net revenue of the BetterHelp business for four years following closing. The Company
F-16
computed the value of these future payments from internally produced revenue projections and recorded a contingent liability in the amount of $2.4 million which is considered as additional purchase consideration. The Company also issued an unsecured, subordinated promissory note in the amount of $1.0 million, with all principal and interest at a rate of 5% per annum being payable on the third anniversary of the closing to the selling shareholder and another executive of BetterHelp. If the employment of the promissory note holders is terminated, then they forfeit their right to receive the promissory note. As such, the Company has determined the promissory note to be compensatory and is accruing the expense over the service term. In December 2015, the Company agreed to pay the full amount plus interest in January 2016 and, as a result, accelerated the expense in 2015. BetterHelp was acquired to help the Company expand its operations in the direct‑to‑consumer behavioral health sector. The acquisition was considered a stock acquisition for tax purposes and as such, the goodwill resulting from this acquisition is not tax deductible. The total associated transaction costs of the acquisition were $0.1 million and were recorded in general and administrative expense.
The acquisitions described above were accounted for using the acquisition method of accounting, which requires, among other things, the assets acquired and the liabilities assumed be recognized at their fair values as of the acquisition date. The results of the acquisitions were integrated within the Company’s existing business on the respective aforementioned acquisition dates.
The following table summarizes the fair value estimates of the assets acquired and liabilities assumed at each acquisition date. The Company, with the assistance of a third-party valuation expert, estimated the fair value of the acquired tangible and intangible assets.
Identifiable assets acquired and liabilities assumed (in thousands):
|
|
|
HealthiestYou |
|
StatDoc |
|
BetterHelp |
|
|||
|
Purchase price |
|
$ |
151,484 |
|
$ |
29,991 |
|
$ |
5,749 |
|
|
Less: |
|
|
|
|
|
|
|
|
|
|
|
Cash |
|
|
6,204 |
|
|
360 |
|
|
89 |
|
|
Accounts receivable |
|
|
1,184 |
|
|
419 |
|
|
11 |
|
|
Other assets |
|
|
1,537 |
|
|
70 |
|
|
4 |
|
|
Client relationships |
|
|
10,930 |
|
|
3,220 |
|
|
141 |
|
|
Non-compete agreements |
|
|
70 |
|
|
1,070 |
|
|
910 |
|
|
Internal software |
|
|
2,220 |
|
|
2,960 |
|
|
780 |
|
|
Trademarks |
|
|
1,180 |
|
|
— |
|
|
140 |
|
|
Accounts payable |
|
|
(836) |
|
|
(609) |
|
|
(6) |
|
|
Deferred tax |
|
|
— |
|
|
— |
|
|
(666) |
|
|
Other liabilities |
|
|
(2,847) |
|
|
(701) |
|
|
(340) |
|
|
Goodwill |
|
$ |
131,842 |
|
$ |
23,202 |
|
$ |
4,686 |
|
The amount allocated to goodwill reflects the benefits Teladoc expects to realize from the growth of the respective acquisitions operations.
The Company’s unaudited pro forma revenue and net loss for the years ended December 31, 2016 and 2015 below have been prepared as if BetterHelp, StatDoc and HealthiestYou had been purchased on January 1, 2015. Unaudited pro forma financial statement results including the results of Gateway would not differ materially from the Company’s historically reported financial statement results.
|
|
|
|
Unaudited Pro Forma |
|
||||
|
(in thousands) |
|
|
2016 |
|
2015 |
|
||
|
Revenue |
|
|
$ |
131,945 |
|
$ |
86,011 |
|
|
Net loss |
|
|
$ |
(75,854) |
|
$ |
(65,536) |
|
The unaudited pro forma financial information above is not necessarily indicative of what the Company’s consolidated results actually would have been if the acquisitions had been completed at the beginning of the respective periods. In addition, the unaudited pro forma information above does not attempt to project the Company’s future results.
F-17
Note 6. Property and Equipment, Net
Property and equipment, net, consist of the following (in thousands):
|
|
|
As of December 31, |
|
||||
|
|
|
2016 |
|
2015 |
|
||
|
Computer equipment |
|
$ |
7,059 |
|
$ |
5,394 |
|
|
Furniture and equipment |
|
|
1,081 |
|
|
377 |
|
|
Leasehold improvement |
|
|
3,559 |
|
|
1,747 |
|
|
Construction in progress |
|
|
— |
|
|
785 |
|
|
Total |
|
|
11,699 |
|
|
8,303 |
|
|
Accumulated depreciation |
|
|
(4,220) |
|
|
(2,044) |
|
|
Property and equipment, net |
|
$ |
7,479 |
|
$ |
6,259 |
|
Depreciation expense for the years ended December 31, 2016, 2015 and 2014 was $2.2 million, $1.1 million and $0.3 million, respectively. As of December 31, 2015, construction in progress consisted primarily of costs incurred to establish a new hosting facility and purchased computer equipment, which was not placed into service until 2016.
Note 7. Intangible Assets, Net
Intangible assets consist of the following (in thousands):
|
|
|
|
|
|
|
|
|
|
|
|
|
|
Weighted |
|
|
|
|
|
|
|
|
|
|
|
|
|
|
|
Average |
|
|
|
|
Useful |
|
|
|
|
Accumulated |
|
Net Carrying |
|
Remaining |
|
||
|
|
|
Life |
|
Gross Value |
|
Amortization |
|
Value |
|
Useful Life |
|
|||
|
December 31, 2016 |
|
|
|
|
|
|
|
|
|
|
|
|
|
|
|
Client relationships |
|
2 to 10 years |
|
$ |
22,581 |
|
$ |
(6,226) |
|
$ |
16,355 |
|
8.5 |
|
|
Non-compete agreements |
|
1.5 to 5 years |
|
|
3,480 |
|
|
(2,344) |
|
|
1,136 |
|
1.6 |
|
|
Trademarks |
|
3 years |
|
|
1,320 |
|
|
(287) |
|
|
1,033 |
|
2.4 |
|
|
Patents |
|
3 years |
|
|
200 |
|
|
(6) |
|
|
194 |
|
2.9 |
|
|
Internal software |
|
3 to 5 years |
|
|
8,976 |
|
|
(2,819) |
|
|
6,157 |
|
3.0 |
|
|
Intangible assets, net |
|
|
|
$ |
36,557 |
|
$ |
(11,682) |
|
$ |
24,875 |
|
6.5 |
|
|
December 31, 2015 |
|
|
|
|
|
|
|
|
|
|
|
|
|
|
|
Client relationships |
|
2 to 10 years |
|
$ |
11,651 |
|
$ |
(3,219) |
|
$ |
8,432 |
|
7.9 |
|
|
Non-compete agreements |
|
3 to 5 years |
|
|
3,410 |
|
|
(1,360) |
|
|
2,050 |
|
2.3 |
|
|
Trademarks |
|
3 years |
|
|
140 |
|
|
(44) |
|
|
96 |
|
2.1 |
|
|
Internal software |
|
3 to 5 years |
|
|
5,662 |
|
|
(975) |
|
|
4,687 |
|
3.8 |
|
|
Intangible assets, net |
|
|
|
$ |
20,863 |
|
$ |
(5,598) |
|
$ |
15,265 |
|
5.9 |
|
Amortization expense for intangible assets was $6.1 million, $3.7 million and $2.0 million for the years ended December 31, 2016, 2015 and 2014, respectively.
F-18
Periodic amortization that will be charged to expense over the remaining life of the intangible assets as of December 31, 2016 is as follows (in thousands):
|
Years Ending December 31, |
|
|
|
|
|
2017 |
|
$ |
7,838 |
|
|
2018 |
|
|
6,224 |
|
|
2019 |
|
|
4,309 |
|
|
2020 |
|
|
2,389 |
|
|
2021 |
|
|
1,538 |
|
|
Thereafter |
|
|
2,577 |
|
|
|
|
$ |
24,875 |
|
Note 8. Goodwill
Goodwill consists of the following (in thousands):
|
|
|
As of December 31, |
|
||||
|
|
|
2016 |
|
2015 |
|
||
|
Beginning balance |
|
$ |
56,342 |
|
$ |
28,454 |
|
|
Additions associated with acquisitions |
|
|
131,842 |
|
|
27,888 |
|
|
Goodwill |
|
$ |
188,184 |
|
$ |
56,342 |
|
Note 9. Accrued Expenses and Other Current Liabilities
Accrued expenses and other current liabilities consist of the following (in thousands):
|
|
|
As of December 31, |
|
||||
|
|
|
2016 |
|
2015 |
|
||
|
Professional fees |
|
$ |
292 |
|
$ |
411 |
|
|
Consulting fees/customer service fees/provider fees |
|
|
1,687 |
|
|
869 |
|
|
Legal fees |
|
|
897 |
|
|
1,056 |
|
|
Interest payable |
|
|
389 |
|
|
287 |
|
|
Marketing |
|
|
142 |
|
|
53 |
|
|
Earnout and compensation |
|
|
1,045 |
|
|
2,449 |
|
|
Lease abandonment |
|
|
42 |
|
|
433 |
|
|
Deferred revenue |
|
|
1,002 |
|
|
831 |
|
|
Other |
|
|
2,485 |
|
|
1,808 |
|
|
Total |
|
$ |
7,981 |
|
$ |
8,197 |
|
F-19
Note 10. Long Term Bank and Other Debt
Long‑term bank and other debt consist of the following (in thousands):
|
|
|
As of December 31, |
|
||||
|
|
|
2016 |
|
2015 |
|
||
|
SVB Mezzanine Term Loan less debt discount of $0 and $190 |
|
$ |
25,000 |
|
$ |
12,810 |
|
|
SVB Term Loan Facility |
|
|
— |
|
|
4,167 |
|
|
SVB Revolving Advance Facility |
|
|
— |
|
|
6,500 |
|
|
SVB Line of Credit Facility less debt discount of $66 and $0 |
|
|
17,424 |
|
|
— |
|
|
Subordinated Promissory Note |
|
|
2,000 |
|
|
3,000 |
|
|
Total |
|
|
44,424 |
|
|
26,477 |
|
|
Less: current portion of Subordinated Promissory Note/SVB Term Loan Facility |
|
|
(2,000) |
|
|
(1,250) |
|
|
Long term bank and other debt |
|
$ |
42,424 |
|
$ |
25,227 |
|
Long term bank and other debt are stated at amortized cost, which approximates fair value.
In July 2016, the Company entered into an Amended and Restated Loan and Security Agreement with Silicon Valley Bank (“SVB”) that provided for a $25 million Mezzanine Term Loan and a $25 million Line of Credit Facility. The Mezzanine Term Loan carries interest at a rate of 6.25% above the Wall Street Journal or WSJ Prime Rate with a WSJ Prime Rate floor of 3.75% and matures in July 2019. Interest payments are payable monthly in arrears. The Company incurred a $250,000 loan origination fee and will be liable for a final payment fee of $750,000 payable at maturity or upon prepayment of the Mezzanine Term Loan. In connection with entry into the Mezzanine Term Loan, the Company granted two affiliates of SVB warrants to purchase an aggregate of 798,694 shares of common stock of the Company at an exercise price of $13.50 per share. The warrants are immediately exercisable and have a 10-year term. The fair value of the common stock warrants on the date of issue was approximately $7.7 million. The Company also granted SVB a security interest in significantly all of the Company’s assets. The Mezzanine Term Loan has been used to fund the expansion of the Company’s business.
The Company determined that the Mezzanine Term Loan represents an extinguishment of the original $13 million Mezzanine Term Loan and as a result recorded a one-time charge of $8.5 million. The amortization of warrants and loss on extinguishment of debt included in the statement of operations includes the write-off of loan origination fees paid to SVB, deferred debt costs associated with the original Mezzanine Term Loan and the amortization of $7.7 million non-cash fair value of the aforementioned warrants.
The Line of Credit Facility provides for borrowings up to $25 million based on 300% of the Company’s monthly recurring revenue, as defined. In addition, there is an additional $25 million Uncommitted Incremental Facility permitted under the Line of Credit Facility. The Line of Credit Facility carries interest at a rate of 0.50% above the WSJ Prime Rate and matures in July 2019. The Company incurred an initial $75,000 loan origination fee and is responsible for additional $75,000 in annual fees on the anniversary of the Line of Credit Facility. The Company will also be liable for a $50,000 loan arrangement fee if and when the Company utilizes the Uncommitted Incremental Facility.
The Company determined that the original Term Loan Facility and Revolving Advance Facility were modified as part of the refinancing and as a result, less than $0.1 million of previous deferred loan costs will continue to be amortized to interest expense through July 2019.
The following information describes the Company’s debt agreements before the refinancing in July 2016.
The Revolving Advance Facility provided for borrowings up to $12.0 million based on 300% of the Company’s monthly recurring revenue, as defined therein. Borrowings under the Revolving Advance Facility were $6.5 million at December 31, 2015. The Revolving Advance Facility carried interest at a rate of 0.75% above the prime rate per annum and was to mature in April 2016. The Company entered into an amendment to the Revolving Advance Facility in March 2015 that extended its maturity to April 2017. Interest payments were payable monthly in arrears. In 2015, the Company increased the borrowings to $11.5 million. On July 15, 2015, the Company reduced its indebtedness under the Revolving
F-20
Advance Facility with a $5.0 million principal repayment. The Revolving Advanced Facility was repaid in full in July 2016.
The Term Loan Facility provided for borrowings up to $5.0 million. As of December 31, 2015, the Company had utilized the total $5.0 million available. The Term Loan Facility carried interest at a rate of 1.00% above the prime rate per annum. Interest payments were payable monthly in arrears. Payments on the Term Loan Facility commenced in May 2015 through June 2016. The Term Loan Facility was repaid in full in July 2016.
In May 2014, the Company entered into a Subordinated Loan and Security Agreement with SVB that provided for a Mezzanine Term Loan totaling $13.0 million. The Mezzanine Term Loan carried interest at a rate of 10.00% per annum. Interest payments were payable monthly in arrears. In connection with entry into the Mezzanine Term Loan, the Company granted two affiliates of SVB warrants to purchase an aggregate of 131,239 shares of its common stock at an exercise price of $2.95 per share. The warrants were immediately exercisable, had a 10‑year term and were exercised in 2015. The Company also granted SVB a security interest in significantly all of the Company’s assets. The Mezzanine Term Loan was used to fund the expansion of the Company’s business. The Mezzanine Term Loan was repaid in full in July 2016.
Effective with the purchase of AmeriDoc, the Company executed a Subordinated Promissory Note in the amount of $3.5 million payable to the seller of AmeriDoc on April 30, 2015. The Subordinated Promissory Note carries interest at a rate of 10.00% annual interest and is subordinated to the SVB Facilities. In March 2015, the Company, the seller of AmeriDoc and SVB executed an Amended and Restated Subordinated Promissory Note that extended the maturity of the Amended and Restated Subordinated Promissory Note to April 30, 2017. In November 2015, the Company executed the Second Amended and Restated Subordinated Promissory Note with a revised annual interest rate of 7.00% commencing on January 1, 2016 and extended the maturity of the Second Amended and Restated Promissory Note to April 30, 2018 with a seller put option effective on April 30, 2017. The Company repaid $1.0 million and $0.5 million of principal on this Second Amended and Restated Subordinated Promissory Note during 2016 and 2015, respectively. As a result of the seller put option, the Company has classified the $2.0 million outstanding balance as a current liability as of December 31, 2016. See Note 18, “Subsequent Events” for more information.
Payments due are as follows (in thousands):
|
|
|
Total |
|
|
|
2017 |
|
$ |
2,000 |
|
|
2018 |
|
|
— |
|
|
2019 |
|
|
42,490 |
|
|
2020 |
|
|
— |
|
|
2021 and thereafter |
|
|
— |
|
|
Total |
|
$ |
44,490 |
|
The Company was in compliance with all debt covenants at December 31, 2016 and 2015.
F-21
Note 11. Leases and Contractual Obligations
Operating Leases
The Company leases office space under non‑cancelable operating leases in the United States. As of December 31, 2016, the future minimum lease payments under non‑cancelable operating leases are as follows (in thousands):
|
|
|
Operating |
|
|
|
|
|
Leases |
|
|
|
2017 |
|
$ |
1,996 |
|
|
2018 |
|
|
1,880 |
|
|
2019 |
|
|
1,228 |
|
|
2020 |
|
|
1,272 |
|
|
2021 |
|
|
1,315 |
|
|
2022 and thereafter |
|
|
4,164 |
|
|
|
|
$ |
11,855 |
|
All of the total future minimum lease payments relate to facilities space. The facility lease agreements generally provide for rental payments on a graduated basis and for options to renew, which could increase future minimum lease payments if exercised. The Company recognizes rent expense on a straight‑line basis over the lease period and has accrued for rent expense incurred but not paid. Deferred rent represents the difference between actual operating lease payments due and straight‑line rent expense. The excess is recorded as a deferred rent liability in the early periods of the lease, when cash payments are generally lower than straight‑line rent expense, and are reduced in the later periods of the lease when payments begin to exceed the straight‑line expense. The Company also accounts for leasehold improvement incentives within its deferred rent liability. For abandoned facilities, the above contractual obligation schedule does not reflect any realized or potential subleases. Rent expense for the years ended December 31, 2016, 2015 and 2014 was $1.8 million, $1.3 million and $0.8 million, respectively.
Letter of Credit
In November 2014, the Company arranged for SVB to issue a letter of credit on its behalf in the amount of $0.3 million in lieu of a cash deposit in connection with the Company’s Purchase, NY office lease. The letter of credit has been extended to November 2017.
In connection with the Company lease agreement for office space in Lewisville, Texas in February 2015, the Company arranged for SVB to issue a letter of credit on its behalf in the amount of $1.0 million in lieu of a cash deposit. The letter of credit has been extended to February 2018.
Note 12. Convertible Preferred Stock (the “Preferred Stock”)
On July 7, 2015, all of the Company's then-outstanding convertible preferred stock converted into an aggregate of 25.5 million shares of common stock.
F-22
The Preferred Stock consists of the following:
|
|
|
|
|
|
|
Common |
|
|
|
|
|
|
|
Shares |
|
Shares |
|
Shares Upon |
|
Liquidation |
|
|
|
December 31, 2014 |
|
Authorized |
|
Outstanding |
|
Conversion |
|
Preference |
|
|
|
Series A |
|
418,634 |
|
418,634 |
|
1,628,498 |
|
$ |
5,232,925 |
|
|
Series A-1 |
|
53,957 |
|
53,957 |
|
282,689 |
|
|
918,955 |
|
|
Series B |
|
263,839 |
|
263,839 |
|
1,790,050 |
|
|
5,768,378 |
|
|
Series C-1 |
|
18,287,483 |
|
18,267,759 |
|
7,991,496 |
|
|
15,253,579 |
|
|
Series D |
|
12,339,204 |
|
12,339,204 |
|
5,397,962 |
|
|
18,600,005 |
|
|
Series E |
|
6,227,169 |
|
6,227,169 |
|
2,724,165 |
|
|
15,000,005 |
|
|
Series F |
|
12,889,000 |
|
12,882,377 |
|
5,635,580 |
|
|
57,139,783 |
|
|
|
|
50,479,286 |
|
50,452,939 |
|
25,450,440 |
|
$ |
117,913,630 |
|
As of December 31, 2014, the significant terms applicable to the Series A through Series F Preferred Stock were as follows:
Dividend Rights
Prior to the issuance of the Series F Preferred Stock, the Series A—E Preferred Stock accrued cumulative dividends at the per annum rate of 7.5% of the respective original purchase price (as previously adjusted for a reverse stock split and, with respect to the Series A, A‑1 and B Preferred Stock, anti‑dilution protection) for each such series of Preferred Stock. Such dividends were payable when, as and if declared by the Company’s board of directors, but prior and in preference to any dividend on the common stock of the Company. In connection with the issuance of the Series F Preferred Stock, all such accrued and accumulated dividends (which totaled approximately $13.8 million at August 31, 2014) were converted into Series F Preferred Stock at a rate of $0.50 of Series F Preferred Stock per $1.00 in accrued dividends, resulting in the issuance of approximately 1,554,000 shares of Series F Preferred Stock on September 10, 2014. There are no longer any accrued or unpaid dividends, or any outstanding Preferred Stock, and no such dividends are required to accrue or be declared by the Company.
Conversion Rights
Each share of Preferred Stock was convertible, at any time and at the option of the holder of such share, into shares of the common stock of the Company, at the following ratios (subject to adjustment as described below):
|
|
|
|
|
|
|
|
|
Number of Shares of |
|
|
|
|
|
|
|
|
|
|
Common Stock Issued |
|
|
|
|
|
|
|
|
|
|
for each Preferred Share |
|
|
|
|
|
|
|
|
|
|
Upon Conversion |
|
|
|
|
Original |
|
Conversion |
|
(= Original Issue Price/ |
|
||
|
Series of Preferred Stock |
|
Issue Price |
|
Price |
|
Conversion Price) |
|
||
|
Series F |
|
$ |
4.4355 |
|
$ |
10.1391 |
|
0.4375 |
|
|
Series E |
|
$ |
2.4088 |
|
$ |
5.5063 |
|
0.4375 |
|
|
Series D |
|
$ |
1.5074 |
|
$ |
3.4458 |
|
0.4375 |
|
|
Series C-1 |
|
$ |
0.835 |
|
$ |
1.909 |
|
0.4375 |
|
|
Series B |
|
$ |
12.95 |
|
$ |
1.909 |
|
6.7846 |
|
|
Series A-1 |
|
$ |
10.00 |
|
$ |
1.909 |
|
5.2391 |
|
|
Series A |
|
$ |
7.425 |
|
$ |
1.909 |
|
3.8900 |
|
Liquidation, Redemption and Protective Rights
The Preferred Stock and certain common stockholders were entitled to certain liquidation, redemption and protective provisions. Upon consummation of the IPO on July 7, 2015 all of the then outstanding convertible Preferred Stock and redeemable common stock converted into common stock. As such these provisions ceased to exist on July 7, 2015.
F-23
Note 13. Common Stock and Stockholders’ Equity (Deficit)
Capitalization
On July 7, 2015, Teladoc completed its IPO in which the Company issued and sold 9,487,500 shares of common stock, including the exercise of an underwriter option to purchase additional shares, at an issuance price of $19.00 per share. The Company received net proceeds of $163.1 million after deducting underwriting discounts and commissions of $12.6 million as well as other offering expenses of $4.5 million.
On June 17, 2015, the Company filed a Certificate of Amendment to the Company’s Certificate of Incorporation to effect a one‑for‑2.2859 reverse stock split of all outstanding shares of common stock with the Secretary of State of the State of Delaware. The Certificate of Amendment provided that every 2.2859 shares of the Company’s issued and outstanding common stock automatically combine into one issued and outstanding share of the Company’s common stock. The Certificate of Amendment did not change the par value of the Company’s common stock and preferred stock. All shares and per share amounts in the consolidated financial statements and accompanying notes have been retroactively adjusted to give effect to the reverse stock split. In addition, the Certificate of Amendment increased the number of authorized shares of the Company’s common stock to 75,000,000 shares and the number of authorized shares of the Company’s preferred stock to 50,479,286 shares. Additionally, the holders of a majority of the outstanding shares of the Preferred Stock (voting as a single class on an as‑converted basis, including holders of at least a majority of the outstanding shares of Series F Preferred Stock) approved the automatic conversion of the Preferred Stock into common stock of the Company upon the closing of an IPO of the common stock of the Company at a per share price of at least $12.00 (prior to underwriting discounts and commissions) that results in aggregate proceeds to the Company of at least $75.0 million (net of underwriting discounts and commissions). On July 7, 2015, all of the Company’s then-outstanding convertible preferred stock converted into an aggregate of 25.5 million shares of common stock and all of the Company’s redeemable common stock converted into 113,294 shares of common stock.
See Note 18 “Subsequent Events” for information regarding the Company’s Follow-On Offering.
Warrants
On May 2, 2014, the Company issued 131,239 common stock warrants to purchase an aggregate of 131,239 shares of its common stock at an exercise price of $2.95 per share to two entities affiliated with SVB. The common stock warrants were immediately exercisable upon issuance and have a 10-year term. The fair value of the common stock warrants on the date of issue was approximately $0.2 million. On July 24, 2015, the Company issued 59,281 shares of common stock resulting from the cashless exercise of these 65,620 warrants at an exercise price of $2.95 per share for one of the SVB affiliates and on December 22, 2015, the Company issued 54,830 shares of common stock resulting from the cashless exercise of the remaining 65,619 warrants at an exercise price of $2.95 per share.
In July 2016, in conjunction with the debt refinancing of the Mezzanine Term Loan, the Company issued 798,694 common stock warrants to purchase an aggregate of 798,694 shares of its common stock at an exercise price of $13.50 per share to two entities affiliated with SVB. The common stock warrants were immediately exercisable upon issuance and have a 10-year term. The fair value of the common stock warrants on the date of issue was approximately $7.7 million. On December 9, 2016, the Company issued an aggregate of 107,931 shares of common stock resulting from an SVB affiliate cashless exercise of 399,347 of these warrants at an exercise price of $13.50 per share. At December 31, 2016, 399,347 warrants remain outstanding.
Stock Plan and Stock Options
The Company’s 2015 Incentive Award Plan (the “Plan”) provides for the issuance of incentive and nonstatutory options and other equity-based awards to its employees and non‑employees. Options issued under the Plan are exercisable for periods not to exceed ten years, and vest and contain such other terms and conditions as specified in the applicable award document. Prior to becoming a public company, pursuant to the Company’s Second Amended and Restated Stock Incentive Plan which is now retired, the Company historically issued incentive and non-statutory stock options with exercise prices equal to the fair value of the Company’s common stock on the date of grant, as determined
F-24
by the Company’s board of directors informed by third-party valuations. Subsequent to becoming a public company, only options to buy common stock have been issued under the Plan, with exercise prices equal to the closing price of shares of the Company’s common stock on the New York Stock Exchange.
Activity under the Plan is as follows (in thousands, except share and per share amounts and years):
|
|
|
|
|
|
|
|
|
|
Weighted- |
|
|
|
|
|
|
|
|
|
|
|
Weighted- |
|
Average |
|
|
|
|
|
|
|
|
Shares |
|
Number of |
|
Average |
|
Remaining |
|
Aggregate |
|
||
|
|
|
Available |
|
Shares |
|
Exercise |
|
Contractual |
|
Intrinsic |
|
||
|
|
|
for Grant |
|
Outstanding |
|
Price |
|
Life in Years |
|
Value |
|
||
|
Balance at January 1, 2014 |
|
694,280 |
|
2,115,069 |
|
$ |
1.14 |
|
8.28 |
|
$ |
4,058 |
|
|
Increase in Plan authorized shares |
|
1,621,795 |
|
— |
|
$ |
— |
|
— |
|
$ |
— |
|
|
Stock option grants |
|
(1,574,104) |
|
1,574,104 |
|
$ |
5.53 |
|
— |
|
$ |
— |
|
|
Stock options exercised |
|
— |
|
(786,074) |
|
$ |
0.96 |
|
— |
|
$ |
— |
|
|
Stock options cancelled |
|
— |
|
(27,993) |
|
$ |
1.60 |
|
— |
|
$ |
— |
|
|
Balance at December 31, 2014 |
|
741,971 |
|
2,875,106 |
|
$ |
3.73 |
|
8.38 |
|
$ |
6,758 |
|
|
Increase in Plan authorized shares |
|
2,493,337 |
|
— |
|
$ |
— |
|
— |
|
$ |
— |
|
|
Stock option grants |
|
(1,522,581) |
|
1,522,581 |
|
$ |
— |
|
— |
|
$ |
— |
|
|
Stock options exercised |
|
— |
|
(270,545) |
|
$ |
— |
|
— |
|
$ |
— |
|
|
Stock options cancelled |
|
240,064 |
|
(240,064) |
|
|
|
|
|
|
|
|
|
|
Stock options expired |
|
33,599 |
|
(33,599) |
|
$ |
— |
|
— |
|
$ |
— |
|
|
Balance at December 31, 2015 |
|
1,986,390 |
|
3,853,479 |
|
$ |
7.62 |
|
8.54 |
|
$ |
41,894 |
|
|
Increase in Plan authorized shares |
|
1,937,770 |
|
— |
|
$ |
— |
|
— |
|
$ |
— |
|
|
Stock option grants |
|
(3,910,431) |
|
3,910,431 |
|
$ |
14.58 |
|
— |
|
$ |
519 |
|
|
Stock options exercised |
|
— |
|
(594,555) |
|
$ |
4.29 |
|
— |
|
$ |
6,984 |
|
|
Stock options expired |
|
329,487 |
|
(329,487) |
|
$ |
11.62 |
|
— |
|
$ |
1,699 |
|
|
Balance at December 31, 2016 |
|
343,216 |
|
6,839,868 |
|
$ |
11.70 |
|
8.64 |
|
$ |
36,795 |
|
|
Vested or expected to vest December 31, 2016 |
|
|
|
6,199,485 |
|
$ |
11.38 |
|
8.55 |
|
$ |
35,426 |
|
|
Exercisable as of December 31, 2016 |
|
|
|
1,604,209 |
|
$ |
6.08 |
|
7.20 |
|
$ |
17,505 |
|
The total grant‑date fair value of stock options granted during the year ended December 31, 2016, 2015 and 2014 was $25.9 million, $10.8 million and $4.8 million, respectively.
Stock‑Based Compensation
All stock‑based awards to employees are measured based on the grant‑date fair value of the awards and are generally recognized in the Company’s consolidated statement of operations over the period during which the employee is required to perform services in exchange for the award (generally requiring a four‑year vesting period for each award). The Company estimates the fair value of stock options granted using the Black‑Scholes option‑pricing model. Compensation cost is generally recognized over the vesting period of the applicable award using the straight‑line method.
Given the absence of a public trading market prior to July 2015, the Company’s board of directors considered numerous objective and subjective factors to determine the fair value of its common stock at each grant date. These factors included, but were not limited to, (i) contemporaneous valuations of common stock performed by unrelated third‑party specialists; (ii) the prices for the Preferred Stock sold to outside investors; (iii) the rights, preferences and privileges of the Preferred Stock relative to the common stock; (iv) the lack of marketability of the common stock; (v) developments in the business; and (vi) the likelihood of achieving a liquidity event, such as an IPO or a merger or acquisition of the Company, given prevailing market conditions.
The assumptions used in the Black‑Scholes option‑pricing model were determined as follows:
Volatility. Since the Company does not have a trading history prior to July 2015 for its common stock, the expected volatility was derived from the historical stock volatilities of several unrelated public companies within its
F-25
industry that it considers to be comparable to its business combined with the Company’s over a period equivalent to the expected term of the stock option grants.
Risk‑Free Interest Rate. The risk‑free interest rate is based on U.S. Treasury zero‑coupon issues with remaining terms similar to the expected term on the options.
Expected Term. The expected term represents the period that the stock‑based awards are expected to be outstanding. When establishing the expected term assumption, the Company utilized the historical data.
Dividend Yield. The Company has never declared or paid any cash dividends and does not plan to pay cash dividends in the foreseeable future, and therefore, it used an expected dividend yield of zero.
Forfeiture rate. The Company uses historical data to estimate pre‑ vesting option forfeitures and record stock‑based compensation expense only for those awards that are expected to vest.
The fair value of each option grant was estimated on the date of grant using the Black‑Scholes option‑pricing model with the following assumptions and fair value per share:
|
|
|
Year Ended December 31, |
|
|||||||
|
|
|
2016 |
|
2015 |
|
2014 |
|
|||
|
Volatility |
|
|
44.7% – 47.8% |
|
|
45.4% – 51.0% |
|
|
53.3% – 53.7% |
|
|
Expected life (in years) |
|
|
6.0 |
|
|
6.9 |
|
|
7 |
|
|
Risk-free interest rate |
|
|
1.09% - 2.29% |
|
|
1.85% - 2.06% |
|
|
1.92% - 2.30% |
|
|
Dividend yield |
|
|
– |
|
|
– |
|
|
– |
|
|
Weighted-average fair value of underlying common stock |
|
$ |
6.63 |
|
$ |
7.09 |
|
$ |
5.53 |
|
Employee Stock Purchase Plan
In July 2015, the Company adopted the 2015 Employee Stock Purchase Plan, or ESPP, in connection with its initial public offering. A total of 458,024 shares of common stock were reserved for issuance under this plan. The Company’s ESPP permits eligible employees to purchase common stock at a discount through payroll deductions during defined offering periods. Under the ESPP, the Company may specify offerings with durations of not more than 27 months, and may specify shorter purchase periods within each offering. Each offering will have one or more purchase dates on which shares of its common stock will be purchased for employees participating in the offering. An offering may be terminated under certain circumstances. The price at which the stock is purchased is equal to the lower of 85% of the fair market value of the common stock at the beginning of an offering period or on the date of purchase.
As of December 31, 2016, the Company had not issued any shares under the ESPP and 458,024 remained available for issuance.
For the year ended December 31, 2016, the Company recorded stock-based compensation expense related to the ESPP of $0.4 million based on offerings made under the plan to-date, and there was none in 2015 and 2014.
F-26
Total compensation costs charged as an expense for stock‑based awards, including stock options and ESPP, recognized in the components of operating expenses are as follows (in thousands):
|
|
|
|
Year Ended |
|
|||||||
|
|
|
|
December 31, |
|
|||||||
|
|
|
|
2016 |
|
2015 |
|
2014 |
|
|||
|
Administrative and marketing |
|
|
$ |
514 |
|
$ |
83 |
|
$ |
23 |
|
|
Sales |
|
|
|
1,365 |
|
|
422 |
|
|
75 |
|
|
Technology and development |
|
|
|
1,322 |
|
|
337 |
|
|
39 |
|
|
General and administrative |
|
|
|
4,522 |
|
|
2,233 |
|
|
396 |
|
|
Total stock-based compensation expense |
|
|
$ |
7,723 |
|
$ |
3,075 |
|
$ |
533 |
|
As of December 31, 2016, the Company had $24.7 million in unrecognized compensation cost related to non‑vested stock options, which is expected to be recognized over a weighted‑average period of approximately 2.9 years.
Note 14. Income Taxes
The components of loss from continuing operations before income taxes were generated substantially in the United States. As a result of the Company’s history of net operating losses and full valuation allowance against its deferred tax assets, only the timing differences attributable to the treatment of the amortization of tax deductible goodwill is reflected in the income tax provision for the years ended December 31, 2016, 2015 and 2014. In addition for the year ended December 31, 2015 the income tax provision was partially offset by an income tax benefit that was realized as a result of acquisition activity.
Reconciliations of the statutory federal income tax rate and the Company’s effective tax rate consist of the following (in thousands):
|
|
|
Year Ended |
|
|||||||
|
|
|
December 31, |
|
|||||||
|
|
|
2016 |
|
2015 |
|
2014 |
|
|||
|
Tax at federal statutory rate |
|
$ |
(25,797) |
|
$ |
(19,715) |
|
$ |
(5,661) |
|
|
State and local tax |
|
|
(1,133) |
|
|
(3,189) |
|
|
(916) |
|
|
Non-deductible stock compensation |
|
|
1,291 |
|
|
688 |
|
|
210 |
|
|
Non-deductible expenses |
|
|
382 |
|
|
158 |
|
|
87 |
|
|
Benefit due to tax rate change |
|
|
(89) |
|
|
— |
|
|
— |
|
|
Change in valuation allowance |
|
|
25,856 |
|
|
22,094 |
|
|
6,668 |
|
|
Income tax provision |
|
$ |
510 |
|
$ |
36 |
|
$ |
388 |
|
Significant components of the Company’s deferred tax assets and liabilities were as follows (in thousands):
|
|
|
As of |
|
||||
|
|
|
December 31, |
|
||||
|
|
|
2016 |
|
2015 |
|
||
|
Deferred tax assets (liabilities): |
|
|
|
|
|
|
|
|
Net operating loss carryforwards |
|
$ |
70,247 |
|
$ |
47,053 |
|
|
Accrued expenses |
|
|
1,088 |
|
|
926 |
|
|
Stock-based compensation |
|
|
2,238 |
|
|
451 |
|
|
Amortization of debt restructure cost |
|
|
2,718 |
|
|
— |
|
|
Amortization of intangible assets |
|
|
(6,908) |
|
|
(3,072) |
|
|
Depreciation of property and equipment |
|
|
(28) |
|
|
(152) |
|
|
Valuation allowance |
|
|
(71,202) |
|
|
(46,477) |
|
|
Other |
|
|
153 |
|
|
86 |
|
|
Net deferred tax assets (liabilities) |
|
$ |
(1,694) |
|
$ |
(1,185) |
|
F-27
The Company has provided a full valuation allowance for its deferred tax assets at December 31, 2016 and 2015, due to the uncertainty surrounding the future realization of such assets. Therefore, no benefit has been recognized for the net operating loss carryforwards and other deferred tax assets.
The valuation allowance increased by $24.7 million, $24.1 million and $6.7 million during the years ended December 31, 2016, 2015 and 2014, respectively. For the year ended December 31, 2016, the valuation allowance included an increase of approximately $1.7 million associated with acquisition activity and a decrease of $3.3 million resulting from a tax rate change.
As of December 31, 2016, the Company had approximately $192.3 million of federal and state net operating loss carryforwards available to offset future taxable income. If not utilized, the federal net operating loss carryforwards begin to expire in 2025. The deferred tax asset related to its net operating losses include no excess tax benefit of stock option exercises, which, when realized, will be recorded as a credit to additional paid‑in capital.
The Company’s ability to utilize the net operating loss and tax credit carryforwards in the future may be subject to substantial restrictions in the event of past or future ownership changes as defined in Section 382 of the U.S. Internal Revenue Code of 1986, as amended (the “Internal Revenue Code”). In the event the Company should experience an ownership change, as defined in the Internal Revenue Code, utilization of its net operating loss carryforwards and tax credits could be limited.
The Company has previously recorded an uncertain tax position of $2.3 million during the year ended December 31, 2013. There were no uncertain tax positions recorded in 2016, 2015 and 2014. The Company has recognized $0.1 million of interest expense in both of the years ended December 31, 2016 and 2015 related to unrealized tax benefits. At December 31, 2016 and 2015, the Company had a liability for the payment of interest and penalties of approximately $0.7 million and $0.6 million, respectively, related to unrecognized tax benefits.
The Company does not anticipate that the total amounts of unrecognized tax benefits will significantly increase or decrease in the next 12 months.
The Company’s tax jurisdiction is the United States. The Company’s 2013 through 2016 tax years are open to examination by U.S. federal and state tax authorities.
Note 15. Net Loss per Share
Basic net loss per share is computed by dividing the net loss by the weighted‑average number of shares of common stock of the Company outstanding during the period. Diluted net loss per share is computed by giving effect to all potential shares of common stock of the Company, including the Preferred Stock and outstanding stock options and warrants, to the extent dilutive. Basic and diluted net loss per share was the same for each period presented as the inclusion of all potential shares of common stock of the Company outstanding would have been anti‑dilutive. The Company has 6.8 million outstanding stock options, 0.4 million outstanding warrants and 0.1 million issuable common stock associated with the ESPP that are future potential shares of common stock.
The following table presents the calculation of basic and diluted net loss per share for the Company’s common stock (in thousands, except per share data):
|
|
|
|
Year Ended |
|
|||||||
|
|
|
|
December 31, |
|
|||||||
|
|
|
|
2016 |
|
2015 |
|
2014 |
|
|||
|
Net loss |
|
|
$ |
(74,216) |
|
$ |
(58,020) |
|
$ |
(17,037) |
|
|
Preferred stock dividends |
|
|
|
— |
|
|
— |
|
|
(2,920) |
|
|
Accretion of preferred stock |
|
|
|
— |
|
|
— |
|
|
(168) |
|
|
Net loss |
|
|
$ |
(74,216) |
|
$ |
(58,020) |
|
$ |
(20,125) |
|
|
Weighted-average shares used to compute basic and diluted net loss per share |
|
|
|
42,331 |
|
|
19,917 |
|
|
1,963 |
|
|
Net loss per share, basic and diluted |
|
|
$ |
(1.75) |
|
$ |
(2.91) |
|
$ |
(10.25) |
|
F-28
Note 16. 401(k) Plan
The Company has established a 401(k) plan that qualifies as a deferred compensation arrangement under Section 401 of the Internal Revenue Code. All employees over the age of 21 are eligible to participate in the plan. The Company contributes 100% of an employee’s elective deferral up to 4% of $0.3 million of eligible earnings. The Company made matching contributions to participants’ accounts totaling $1.1 million, $0.7 million and $0.4 million during the years ended December 31, 2016, 2015 and 2014, respectively.
Note 17. Legal Matters
The Company may become subject to legal proceedings, claims and litigation arising in the ordinary course of its business. At December 31, 2016, the Company was party to the following legal proceedings:
On April 29, 2015, the Company filed a lawsuit against the Texas Medical Board (the ‘‘TMB’’) in the United States District Court for the Western District of Texas, Austin Division (the “District Court”) allenging that the TMB’s adoption on April 10, 2015 of an amendment to 22 T.A.C. 190.8(1)(L) that would require a prior in-person examination for a doctor validly to prescribe any controlled substance to a patient in Texas constitutes a violation, inter alia, of the Sherman Antitrust Act. The District Court held a hearing on May 22, 2015 on Teladoc’s motion for preliminary injunction of the effectiveness of such amendment, which otherwise was scheduled to take effect on June 3, 2015. On May 29, 2015, the District Court issued the preliminary injunction requested by Teladoc and enjoined the effectiveness of such rule amendment pending trial. On July 30, 2015, the TMB filed a motion to dismiss the suit, and the District Court denied this motion on December 14, 2015. On January 8, 2016, the TMB provided notice of its intent to appeal the District Court’s denial of its motion to dismiss to the U.S. Court of Appeals for the Fifth Circuit, which was filed on June 17, 2016 and voluntarily withdrawn by the TMB on October 17, 2016. On November 2, 2016, the Disctrict Court granted the parties’ joint motion to stay the trial case through April 19, 2017. Accordingly, no trial date has been set.
Business in the State of Texas accounted for approximately $15.1 million, or 12%, $12.6 million, or 16% and $10.0 million or 23% of Teladoc’s consolidated revenue during the years ended December 31, 2016, 2015 and 2014, respectively. If the TMB’s proposed rule amendments go into effect as written and Teladoc is unable to adapt its business model in compliance with the revised rules, its ability to operate its business in the State of Texas would be materially adversely affected, which would have a material adverse effect on its business, financial condition and results of operations.
Other than as stated the Company is not a party to any material legal proceeding, and it is not aware of any pending or threatened litigation that would have a material adverse effect on its business, results of operations, cash flows or financial condition should such litigation be resolved unfavorably.
Note 18. Subsequent Events
On January 24, 2017, Teladoc completed its Follow-On Offering in which the Company issued and sold 7,887,500 shares of common stock, including the exercise of an underwriter option to purchase additional shares, at an issuance price of $16.75 per share. The Company received net proceeds of $124.0 million after deducting underwriting discounts and commissions of $7.6 million as well as other offering expenses of $0.5 million.
In January 2017, the Company repaid the outstanding $2.0 million of principal plus interest on the Second Amended and Restated Subordinated Promissory Note.
F-29