Attached files
| file | filename |
|---|---|
| 8-K - CURRENT REPORT - ANGIODYNAMICS INC | an53165593-8k.htm |
Exhibit 99.1

AngioDynamics Second Quarter 2019 Earnings PresentationJanuary 4, 2019

Forward-Looking Statements Notice Regarding Forward-Looking StatementsThis presentation contains
forward-looking statements within the meaning of the Private Securities Litigation Reform Act of 1995. All statements regarding AngioDynamics’ expected future financial position, results of operations, cash flows, business strategy, budgets,
projected costs, capital expenditures, products, competitive positions, growth opportunities, plans and objectives of management for future operations, as well as statements that include the words such as “expects,” “reaffirms,” “intends,”
“anticipates,” “plans,” “believes,” “seeks,” “estimates,” “optimistic,” or variations of such words and similar expressions, are forward-looking statements. These forward-looking statements are not guarantees of future performance and are
subject to risks and uncertainties. Investors are cautioned that actual events or results may differ from AngioDynamics’ expectations. Factors that may affect the actual results achieved by AngioDynamics include, without limitation, the ability
of AngioDynamics to develop its existing and new products, technological advances and patents attained by competitors, infringement of AngioDynamics’ technology or assertions that AngioDynamics’ technology infringes the technology of third
parties, the ability of AngioDynamics to effectively compete against competitors that have substantially greater resources, future actions by the FDA or other regulatory agencies, domestic and foreign health care reforms and government
regulations, results of pending or future clinical trials, overall economic conditions, the results of on-going litigation, challenges with respect to third-party distributors or joint venture partners or collaborators, the results of sales
efforts, the effects of product recalls and product liability claims, changes in key personnel, the ability of AngioDynamics to execute on strategic initiatives, the effects of economic, credit and capital market conditions, general market
conditions, market acceptance, foreign currency exchange rate fluctuations, the effects on pricing from group purchasing organizations and competition, the ability of AngioDynamics to integrate acquired businesses, as well as the risk factors
listed from time to time in AngioDynamics’ SEC filings, including but not limited to its Annual Report on Form 10-K for the year ended May 31, 2018. AngioDynamics does not assume any obligation to publicly update or revise any forward-looking
statements for any reason.In the United States, the NanoKnife System has received a 510(k) clearance by the Food and Drug Administration for use in the surgical ablation of soft tissue, and is similarly approved for commercialization in Canada,
the European Union and Australia. The NanoKnife System has not been cleared for the treatment or therapy of a specific disease or condition.Notice Regarding Non-GAAP Financial MeasuresManagement uses non-GAAP measures to establish operational
goals, and believes that non-GAAP measures may assist investors in analyzing the underlying trends in AngioDynamics’ business over time. Investors should consider these non-GAAP measures in addition to, not as a substitute for or as superior
to, financial reporting measures prepared in accordance with GAAP. In this news release, AngioDynamics has reported adjusted EBITDAS (income before interest, taxes, depreciation and amortization and stock-based compensation); adjusted net
income; adjusted earnings per share and free cash flow. Management uses these measures in its internal analysis and review of operational performance. Management believes that these measures provide investors with useful information in
comparing AngioDynamics’ performance over different periods. By using these non-GAAP measures, management believes that investors get a better picture of the performance of AngioDynamics’ underlying business. Management encourages investors to
review AngioDynamics’ financial results prepared in accordance with GAAP to understand AngioDynamics’ performance taking into account all relevant factors, including those that may only occur from time to time but have a material impact on
AngioDynamics’ financial results. Please see the tables that follow for a reconciliation of non-GAAP measures to measures prepared in accordance with GAAP.
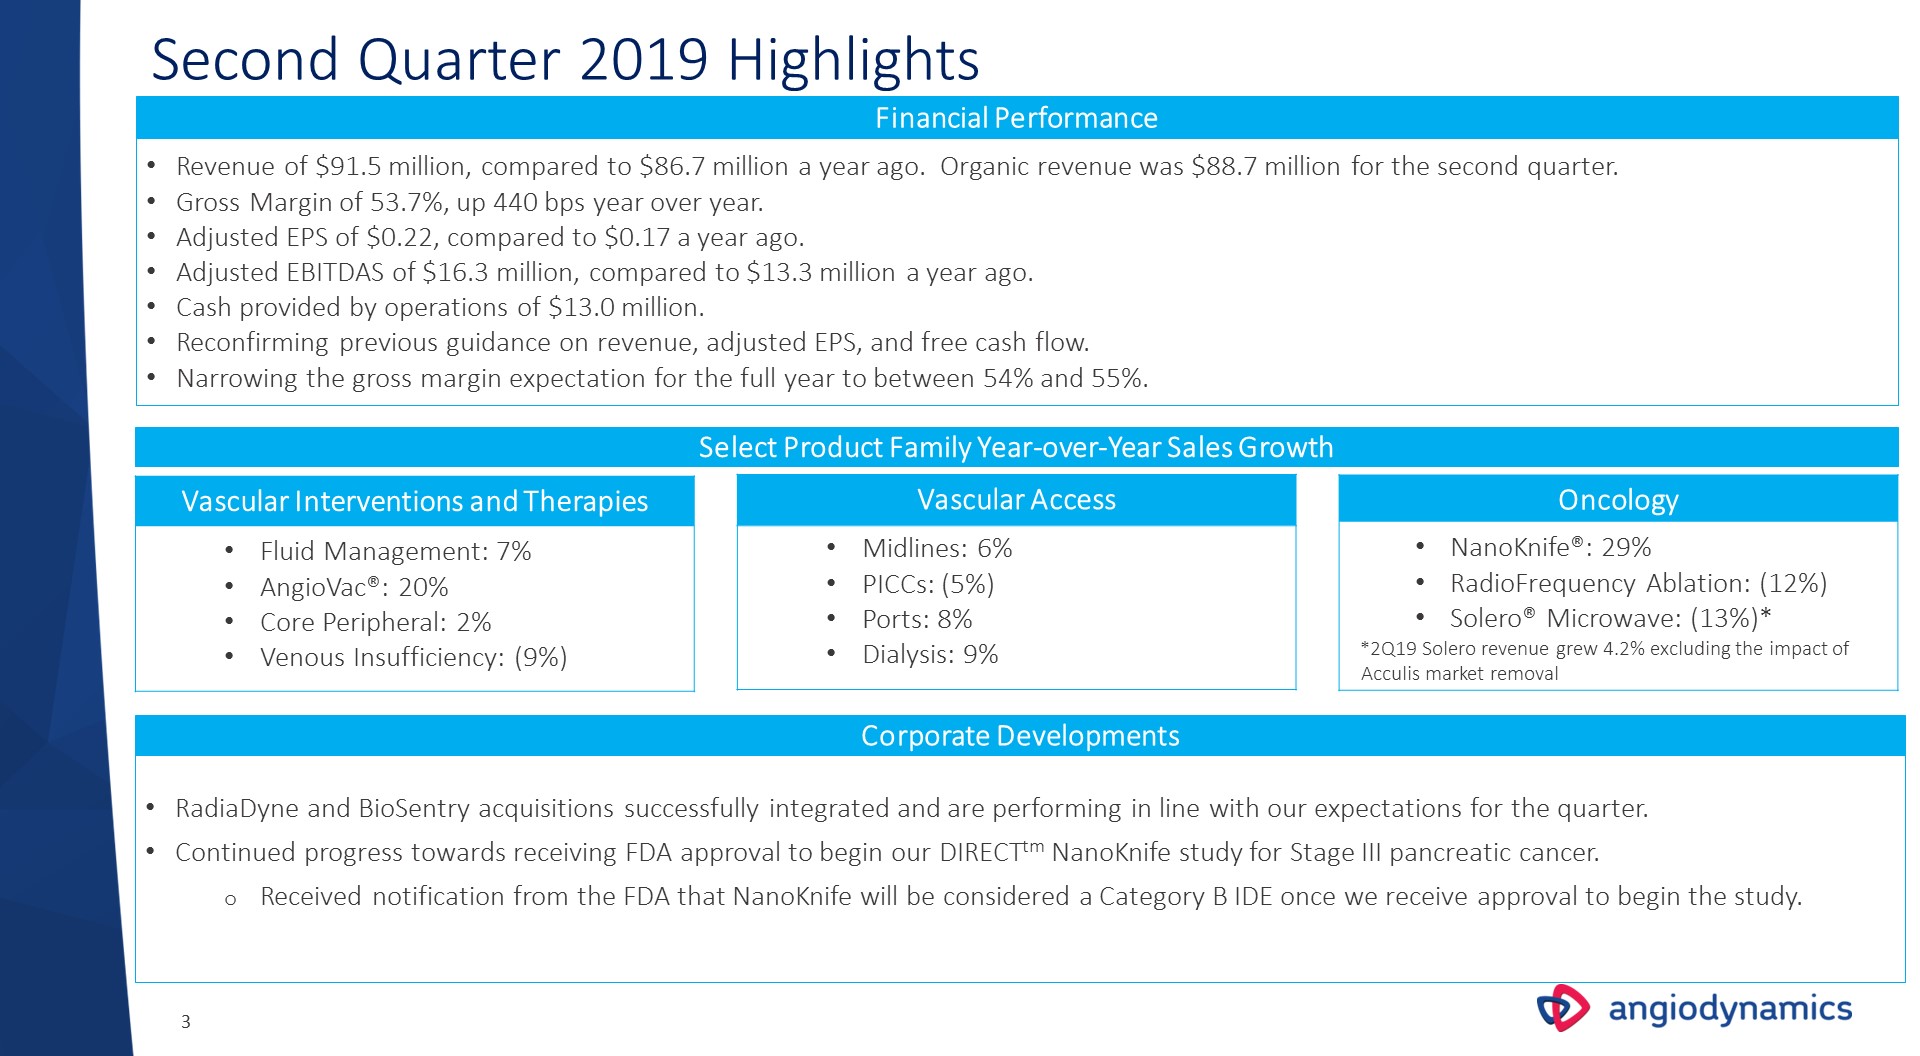
Second Quarter 2019 Highlights Financial Performance Revenue of $91.5 million, compared to $86.7
million a year ago. Organic revenue was $88.7 million for the second quarter.Gross Margin of 53.7%, up 440 bps year over year. Adjusted EPS of $0.22, compared to $0.17 a year ago.Adjusted EBITDAS of $16.3 million, compared to $13.3 million a
year ago.Cash provided by operations of $13.0 million.Reconfirming previous guidance on revenue, adjusted EPS, and free cash flow. Narrowing the gross margin expectation for the full year to between 54% and 55%. Corporate
Developments RadiaDyne and BioSentry acquisitions successfully integrated and are performing in line with our expectations for the quarter.Continued progress towards receiving FDA approval to begin our DIRECTtm NanoKnife study for Stage III
pancreatic cancer.Received notification from the FDA that NanoKnife will be considered a Category B IDE once we receive approval to begin the study. Vascular Interventions and Therapies Fluid Management: 7%AngioVac®: 20% Core Peripheral:
2%Venous Insufficiency: (9%) Vascular Access Midlines: 6%PICCs: (5%)Ports: 8%Dialysis: 9% Oncology NanoKnife®: 29%RadioFrequency Ablation: (12%)Solero® Microwave: (13%)**2Q19 Solero revenue grew 4.2% excluding the impact of Acculis market
removal Select Product Family Year-over-Year Sales Growth

Second Quarter and Year-to-Date FY 2019 Results $ in thousands (except per share data) FY2019 Q2
Results FY2018Q2 Results Change FY2019 YTD Results FY2018 YTD Results Change Revenue- Vascular Interventions and Therapies- Vascular Access- Oncology - United States-
International $91,50352,49423,72315,28671,88319,620 $86,70651,36822,57412,76468,30118,405 5.5%2.2%5.1%19.8%5.2%6.6% $176,843102,48847,51326,842139,56737,276 $172,117101,23445,81225,071137,23234,885 2.7%1.2%3.7%7.1%1.7%6.9% Net
IncomeAdjusted Net Income $2,140$8,386 $249$6,298 $1,671$14,602 $214$11,275 GAAP Earnings Per ShareNon-GAAP Adjusted EPS $0.06$0.22 $0.01$0.17 $0.04$0.38 $0.01$0.30 Gross Margin 53.7% 49.3% 52.9% 48.8% Adjusted
EBITDAS $16,316 $13,335 $28,939 $24,618 Free Cash Flow $12,225 $9,444 $2,670 $11,979 Cash $42,820 $74,096* $42,820 $74,096* Debt $145,000 $92,500* $145,000 $92,500* * Balances reflect amounts at 5/31/2018

GAAP to Non-GAAP Reconciliation
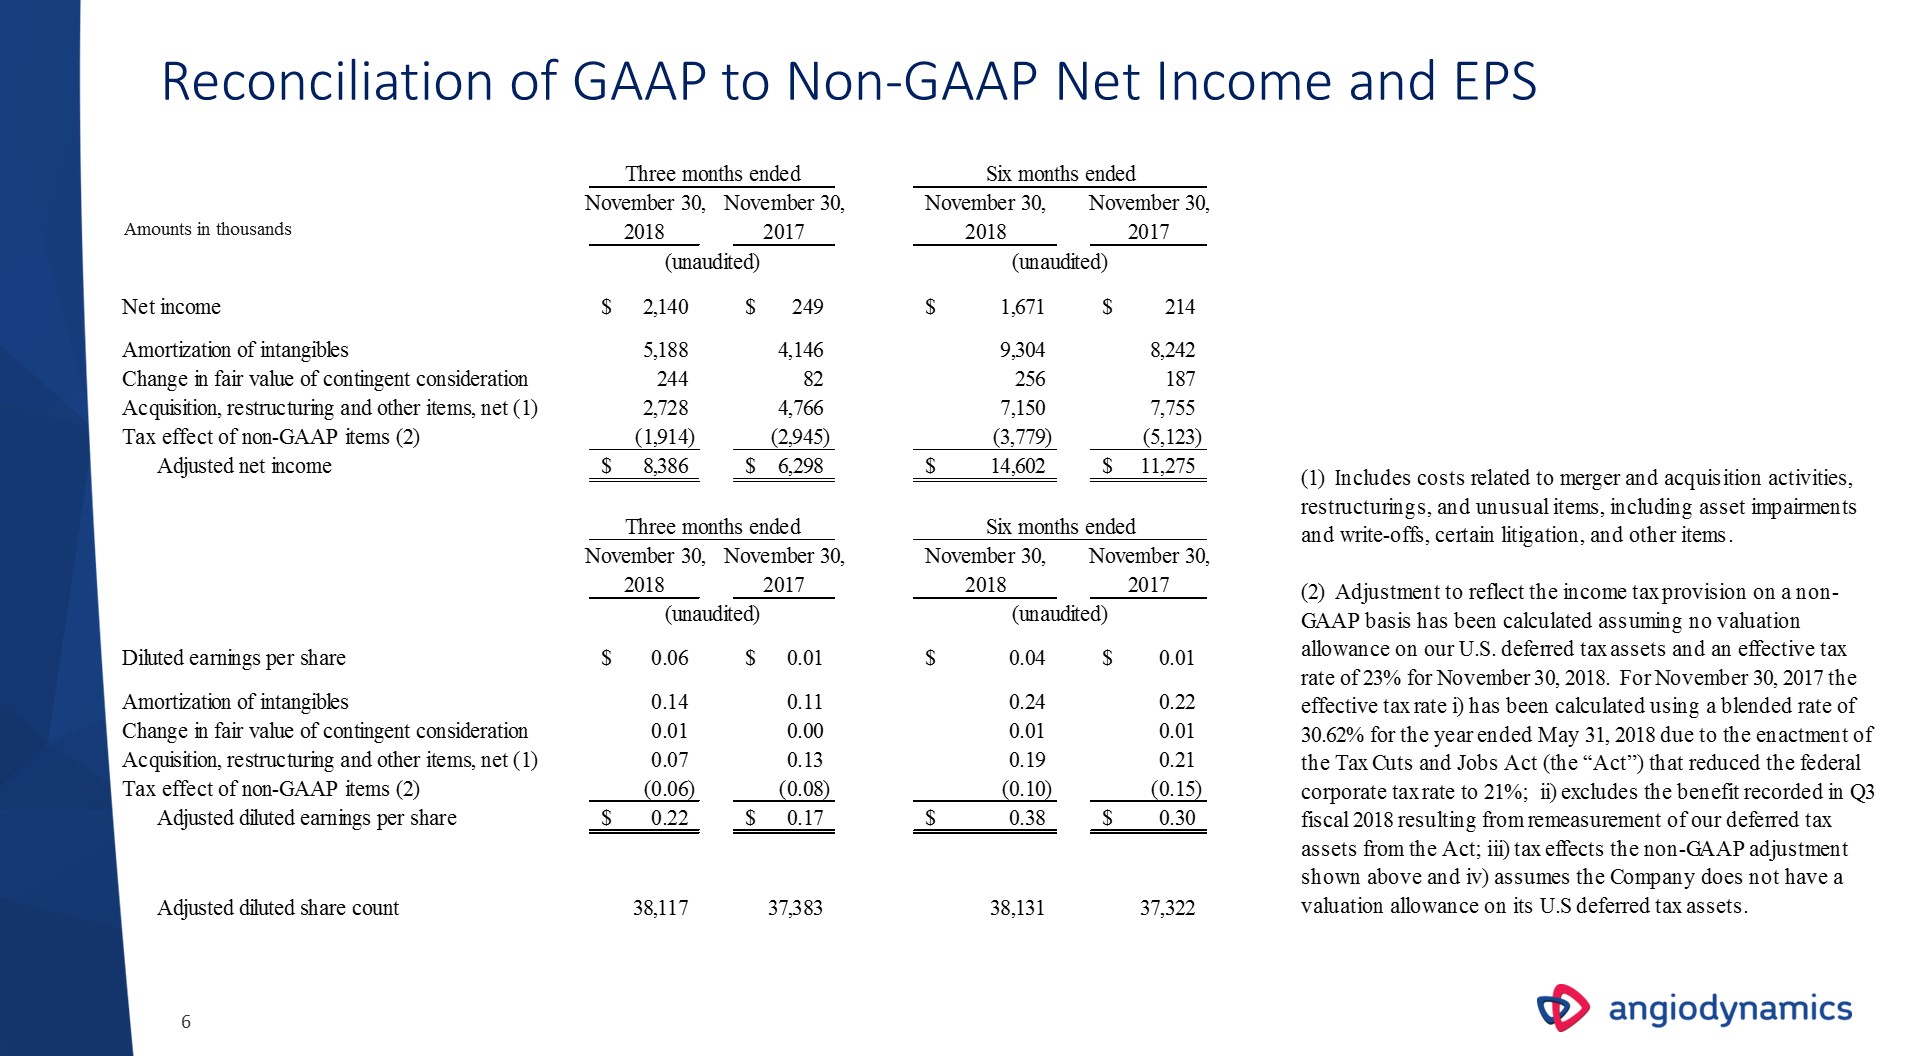
Reconciliation of GAAP to Non-GAAP Net Income and EPS Amounts in thousands

Reconciliation of Net Income to EBITDAS to Adjusted EBITDAS Amounts in thousands

Growth through Focus Execution Accountability