Attached files
| file | filename |
|---|---|
| EX-32 - EXHIBIT 32 - DAILY JOURNAL CORP | ex_131401.htm |
| EX-31 - EXHIBIT 31 - DAILY JOURNAL CORP | ex_131400.htm |
| EX-21 - EXHIBIT 21 - DAILY JOURNAL CORP | ex_131402.htm |
UNITED STATES
SECURITIES AND EXCHANGE COMMISSION
Washington, D.C. 20549
FORM 10-K
(MARK ONE)
|
☒ |
ANNUAL REPORT PURSUANT TO SECTION 13 OR 15(d) OF THE SECURITIES EXCHANGE ACT OF 1934 |
| for the fiscal year ended September 30, 2018 |
OR
|
☐ |
TRANSITION REPORT PURSUANT TO SECTION 13 OR 15(d) OF THE SECURITIES EXCHANGE ACT OF 1934 |
Commission File No. 0-14665
DAILY JOURNAL CORPORATION
(Exact name of registrant as specified in its charter)
|
South Carolina (State or other jurisdiction of incorporation or organization) |
95-4133299 (IRS Employer Identification No.) |
|
915 East First Street |
|
|
Los Angeles, California (Address of principal executive offices) |
90012 (Zip Code) |
Registrant's telephone number, including area code: (213) 229-5300
Securities registered pursuant to Section 12(b) of the Act: Common Stock, The NASDAQ Stock Market.
Securities registered pursuant to Section 12(g) of the Act: None.
Indicate by check mark if the registrant is a well-known seasoned issuer, as defined in Rule 405 of the Securities Act.
Yes ☐ No ☒
Indicate by check mark if the registrant is not required to file reports pursuant to Section 13 or Section 15(d) of the Act.
Yes ☐ No ☒
Indicate by check mark whether the registrant (1) has filed all reports required to be filed by Section 13 or 15(d) of the Securities Exchange Act of 1934 during the preceding 12 months (or for such shorter period that the registrant was required to file such reports), and (2) has been subject to such filing requirements for the past 90 days.
Yes ☐ No ☒
Indicate by check mark whether the registrant has submitted electronically and posted on its corporate Web site, if any, every Interactive Data File required to be submitted and posted pursuant to Rule 405 of Regulation S-T during the preceding 12 months (or for such shorter period that the registrant was required to submit and post such files).
Yes ☐ No ☒
Indicate by check mark whether the registrant is a large accelerated filer, an accelerated filer, a non-accelerated filer, a smaller reporting company, or an emerging growth company. See the definitions of “large accelerated filer,” “accelerated filer,” “smaller reporting company,” and “emerging growth company” in Rule 12b-2 of the Exchange Act.
(Check one):
|
Large accelerated filer ☐ |
Accelerated filer ☒ |
|
Non-accelerated filer ☐ (Do not check if a smaller reporting company) |
Smaller reporting company ☐ |
|
Emerging growth company ☐ |
If an emerging growth company, indicate by check mark if the registrant has elected not to use the extended transition period for complying with any new or revised financial accounting standards provided pursuant to Section 13(a) of the Exchange Act. ☐
Indicate by check mark whether the registrant is a shell company (as defined in Rule 12b-2 of the Exchange Act):
Yes ☐ No ☒
As of March 31, 2018, the aggregate market value of Daily Journal Corporation's voting stock held by non-affiliates was approximately $253,809,000.
As of November 30, 2018 there were outstanding 1,380,746 shares of Common Stock of Daily Journal Corporation.
Disclosure Regarding Forward-Looking Statements
This Annual Report on Form 10-K includes “forward-looking statements” within the meaning of Section 27A of the Securities Act of 1933, as amended, and Section 21E of the Securities Exchange Act of 1934, as amended. Certain statements contained in this document, including but not limited to those in “Management’s Discussion and Analysis of Financial Condition and Results of Operations,” are “forward-looking” statements that involve risks and uncertainties that may cause actual future events or results to differ materially from those described in the forward-looking statements. Words such as “expects,” “intends,” “anticipates,” “should,” “believes,” “will,” “plans,” “estimates,” “may,” variations of such words and similar expressions are intended to identify such forward-looking statements. We disclaim any intention or obligation to revise any forward-looking statements whether as a result of new information, future developments, or otherwise. There are many factors that could cause actual results to differ materially from those contained in the forward-looking statements. These factors include, among others: risks associated with software development and implementation efforts; Journal Technologies’ reliance on professional services engagements with justice agencies; material changes in the costs of postage and paper; possible changes in the law, particularly changes limiting or eliminating the requirements for public notice advertising; possible loss of the adjudicated status of the Company’s newspapers and their legal authority to publish public notice advertising; a further decline in public notice advertising revenues because of fewer foreclosures; a further decline in subscriber and commercial advertising revenues; possible security breaches of the Company’s software or websites; the Company’s reliance on its president and chief executive officer, who has recently reduced his work schedule due to a health issue; changes in accounting guidance; material weaknesses in the Company’s internal control over financial reporting; and declines in the market prices of the securities owned by the Company. In addition, such statements could be affected by general industry and market conditions, general economic conditions (particularly in California) and other factors. Although the Company believes that the expectations reflected in such forward-looking statements are reasonable, it can give no assurance that such expectations will prove to have been correct. Important factors that could cause actual results to differ materially from those in the forward-looking statements are discussed in this Form 10-K, including in conjunction with the forward-looking statements themselves. Additional information concerning factors that could cause actual results to differ materially from those in the forward-looking statements is contained from time to time in documents filed by the Company with the Securities and Exchange Commission.
PART I
Item 1. Business
The Company publishes newspapers and web sites in California and Arizona and produces several specialized information services. It also serves as a newspaper representative specializing in public notice advertising. We often refer to this as “The Traditional Business”.
Journal Technologies, Inc. (“Journal Technologies”), a wholly owned subsidiary of the Company, supplies case management software systems and related products to courts and other justice agencies, county governments and bar associations. These organizations use the Journal Technologies family of products to help manage cases and information electronically, to interface with other critical justice partners and to extend electronic services to bar members and the public, including efiling and a website to pay traffic citations online. These products are licensed to more than 500 organizations in 42 states and internationally. Journal Technologies is the result of the October 1, 2014 merger of the Company’s three technology-related subsidiaries, which were previously separate companies: Sustain Technologies, Inc. (“Sustain”), a wholly owned subsidiary since 2008; New Dawn Technologies, Inc. (“New Dawn”), acquired in December 2012; and ISD Technologies, Inc. (“ISD”), acquired in September 2013.
Essentially all of the Company’s operations are based in California, Arizona, Colorado and Utah. Financial information of the Company, including information about each of the Company’s reportable segments, is set forth in Item 8 (“Financial Statements and Supplementary Data”).
Products and Services
The Traditional Business
Newspapers and related online publications. The Company publishes 10 newspapers of general circulation. Each newspaper, in addition to news of interest to the general public, has a particular area of in-depth focus with regard to its news coverage, thereby attracting readers interested in obtaining information about that area through a newspaper format. Each of these smaller publications has a website.
The publications are based in the following cities:
|
Newspaper publications |
Base of publication |
|
Los Angeles Daily Journal |
Los Angeles, California |
|
San Francisco Daily Journal |
San Francisco, California |
|
Daily Commerce |
Los Angeles, California |
|
The Daily Recorder |
Sacramento, California |
|
The Inter-City Express |
Oakland, California |
|
San Jose Post-Record |
San Jose, California |
|
Orange County Reporter |
Santa Ana, California |
|
The Daily Transcript |
San Diego, California |
|
Business Journal |
Riverside, California |
|
The Record Reporter |
Phoenix, Arizona |
The Daily Journals. The Los Angeles Daily Journal and the San Francisco Daily Journal (together, “The Daily Journals”) are each published every weekday except certain holidays and were established in 1888 and 1893, respectively. In addition to covering state and local news of general interest, these newspapers focus particular coverage on law and its impact on society. Generally, The Daily Journals seek to be of special utility to lawyers and judges and to gain wide multiple readership of newspapers sent to law firm subscribers.
The Daily Journals contain much material and render many services in a common endeavor. The Los Angeles Daily Journal is the largest newspaper published by the Company, both in terms of revenues and circulation. At September 30, 2018, the Los Angeles Daily Journal had approximately 4,500 paid subscribers and the San Francisco Daily Journal had approximately 2,500 paid subscribers as compared with total paid subscriptions for both of The Daily Journals of 7,400 at September 30, 2017. The Daily Journals carry commercial advertising (display and classified) and public notice advertising required or permitted by law to be published in a newspaper of general circulation. The main source of commercial advertising revenue has been local advertisers, law firms and businesses in or wishing to reach the legal professional community. The gross revenues generated directly by The Daily Journals are attributable approximately 59% to subscriptions and 41% to the sale of advertising and other revenues. Revenues from The Daily Journals constituted approximately 19% of the Company's total fiscal 2018 revenues, 20% in 2017, 20% in 2016, 18% in 2015 and 19% in 2014.
It is the policy of The Daily Journals (1) to take no editorial position on the legal and political controversies of the day but instead to publish well-written editorial views of others on many sides of a controversy and (2) to try to report on factual events with technical competence and with objectivity and accuracy. It is believed that this policy suits a professional readership of exceptional intelligence and education, which is the target readership for the newspapers. Moreover, The Daily Journals believe that they bear a duty to their readership, particularly judges and justices, as a self-imposed public trust, regardless, within reason, of short-term income penalties. The Company believes that this policy of The Daily Journals is in the long-term interest of the Company’s shareholders.
The Daily Journals contain the Daily Appellate Report which provides the full text and case summaries of all opinions certified for publication by the California Supreme Court, the California Courts of Appeal, the U.S. Supreme Court, the U.S. Court of Appeals for the Ninth Circuit, the U.S. Bankruptcy Appellate Panel for the Ninth Circuit, the State Bar Court and selected opinions of the U.S. District Courts in California and the Federal Circuit Court of Appeals. The Daily Journals also include a monthly court directory in booklet form. This directory includes a comprehensive list of sitting judges in all California courts as well as courtroom assignments, phone numbers and courthouse addresses, plus ''Judicial Transitions'' which lists judicial appointments, elevations, confirmations, resignations, retirements and deaths.
The Daily Journals are distributed by mail and hand delivery, with subscribers in the Los Angeles and San Francisco areas usually receiving copies the same day. Certain subscribers in Los Angeles, San Francisco, Santa Clara, Alameda, Orange, San Diego, Riverside and San Bernardino counties receive copies by hand delivery. The regular yearly subscription rate for each of The Daily Journals is $836 plus tax.
Much of the information contained in The Daily Journals is available to subscribers online at www.dailyjournal.com.
Daily Commerce. Published since 1917, the Daily Commerce is based in Los Angeles and covers news of general interest, columns of interest to real estate investors and brokers, and information on distressed properties in Los Angeles County. The nature of the news coverage enhances the effectiveness of public notice advertising by distributing information about foreclosures to potential buyers. Features include default listings and probate sale notices. The Daily Commerce carries both public notice and commercial advertising. It is published each business day. A subscription includes online access to the Los Angeles County foreclosure listing and public record database.
The Daily Recorder. The Daily Recorder, based in Sacramento, began operations in 1911. It is published each business day. In addition to general news items, it includes legal news and columns of interest to the Sacramento legal and real estate communities. It includes the Daily Appellate Report and carries commercial and public notice advertising. A subscription includes online access to the Sacramento County foreclosure listing and public record database.
The Inter-City Express. The Inter-City Express (the “Express”) has been published since 1909. It covers general news of local interest and focuses its coverage on news about the real estate and legal communities in the Oakland/San Francisco area. The Express carries public notice advertising and is published each business day. A subscription includes online access to the Alameda County foreclosure listing and public record database.
San Jose Post-Record. The San Jose Post-Record (the “Post-Record”) has been published since 1910. In addition to general news of local interest, the Post-Record focuses on legal and real estate news. It is published every business day and carries public notice advertising. A subscription includes online access to the Santa Clara County foreclosure listing and public record database.
Orange County Reporter. The Orange County Reporter (“Reporter”) has been an adjudicated newspaper of general circulation since 1922. In addition to general news of local interest, the Reporter publishes local and state legal, business and real estate news, and carries public notice advertising. The Reporter is published three days a week. A subscription includes online access to the Orange County foreclosure listing and public record database.
The Daily Transcript. The Daily Transcript is based in San Diego and published each business day. It reports general news items and San Diego commercial real estate, business and construction news. It has been an adjudicated newspaper of general circulation since 1909. It carries commercial and public notice advertising. A subscription includes online access to the San Diego County foreclosure listing and public record database.
Business Journal. The Business Journal, established in 1991, publishes news of general interest and provides coverage of the business and professional communities in Riverside County. It also carries public notice advertising and is published each business day. The subscription includes online access to the Riverside/San Bernardino County foreclosure listing and public record database.
The Record Reporter (Arizona). The Record Reporter has been in existence since 1914. In addition to general news of local interest, The Record Reporter, which is published three days a week, focuses on legal news and public record information and carries primarily public notice advertising.
Information Services. The specialized information services offered by the Company have grown out of its newspaper operations or have evolved in response to a desire for such services primarily from its newspaper subscribers.
The Company has several court rules services, including a multi-volume, loose-leaf set for certain state and federal courts in California. The Northern California set consists of nine volumes. The Southern California set has eight volumes. The Company updates Court Rules on a monthly basis. In addition, the Company publishes single-volume rules for (1) Los Angeles County; (2) Orange County; (3) San Diego County; (4) San Bernardino County; (5) Riverside County; (6) Ventura, Santa Barbara and San Luis Obispo counties; and (7) the Ninth Circuit and the Central District of California. The Company published loose-leaf books for Santa Clara/San Mateo, Alameda/Contra Costa, and San Francisco counties and for statewide probate rules, all of which were discontinued in early fiscal 2019. The single volumes are normally updated or replaced whenever there are substantial rule changes.
The Judicial Profiles service contains information concerning nearly all active judges in California. The Judicial Profiles include an interview-based article previously published in The Daily Journals, biographical data and information supplied by each judge regarding the judge's policies and views on various trial and appellate procedures and the manner in which appearances are conducted in his or her courtroom. Subscribers may purchase either the ten-volume set for Southern California or the eight-volume set for Northern California.
The Company also provides online foreclosure information to about 30 customers. This service primarily provides distressed property information, some of which also appears in some of the Company's newspapers.
Advertising and Newspaper Representative. The Company's publications carry commercial advertising and public notice advertising. Commercial advertising consists of display and classified advertising and constituted about 7% of the Company’s total operating revenues in fiscal 2018, 7% in 2017, 7% in 2016, 8% in 2015 and 9% in 2014. Classified advertising has continued to decline primarily due to the continued downturn in the employment advertising marketplace and online competition.
Public notice advertising consists of many different types of legal notices required by law to be published in an adjudicated newspaper of general circulation, including notices of death, fictitious business names, trustee sale notices and notices of governmental hearings. The major types of public notice advertisers are real estate-related businesses and trustees, governmental agencies, attorneys and businesses or individuals filing fictitious business name statements. Many government agencies use the Company’s Internet-based advertising system to produce and send their notices to the Company. A fictitious business name web site enables individuals to send their statements to the Company for filing and publication and another web site enables attorneys and individuals to send probate, civil, corporate, public sale and other types of public notices to the Company. California Newspaper Service Bureau (“CNSB”), a division of the Company, is a statewide newspaper representative (commission-earning selling agent) specializing since 1934 in public notice advertising. CNSB places public notices and other forms of advertising with adjudicated newspapers of general circulation, most of which are not owned by the Company.
Public notice advertising revenues and related advertising and other service fees, including trustee sales legal advertising revenues, constituted about 21% of the Company's total operating revenues in fiscal 2018, 21% in 2017, 23% in 2016, 22% in 2015 and 24% in 2014. Most of these revenues were generated by (i) notices published in the Company’s newspapers, (ii) commissions and similar fees received from other publications in which the advertising was placed and (iii) service fees generated when filing notices with government agencies.
Trustee sales legal advertising revenues alone represented about 3% of the Company’s total operating revenues in fiscal 2018, 4% in 2017, 5% in 2016, 6% in 2015 and 7% in 2014. For several years, these revenues were driven by the large number of foreclosures in California and Arizona, for which public notice advertising is required by law, but the number of foreclosures has continued to decline since 2010. In addition, in many states, including California and Arizona, legislatures have considered various proposals which would result in the elimination or reduction of the amount of public notice advertising required by statute, and Arizona recently approved one such proposal for one particular notice type. There is a risk that such laws could change in a manner that would have a significant adverse impact on the Company's public notice advertising revenues.
Other revenues are attributable to service fees from users of an online foreclosure/fictitious business name database, fees from attorneys taking continuing legal education “courses” published in The Daily Journals and online and other miscellaneous fees.
Journal Technologies
Journal Technologies provides case management software and related services to courts and other justice agencies. Its operations constituted about 58% of the Company’s total operating revenues in fiscal 2018, 58% in 2017, 56% in 2016, 57% in 2015 and 53% in 2014. Journal Technologies earns revenue from license and maintenance fees paid by customers to use its software products; consulting fees paid by customers for installation, implementation and training services; and fees generated by the use of secure websites through which the general public can pay traffic citations and e-file cases. Journal Technologies has the following main products:
eCourt®, eProsecutor™, eDefender™ and eProbation™ — browser-based case processing systems that can be used by courts and other justice agencies for all case types because the screens, data elements, business rules, work queues, searches and alerts are highly configurable. Journal Technologies also supports its prior generation Justice Edition software, which is a Windows-based system that also provides for customizable configurability.
JustWare® — a family of case management software products for use by courts and other justice agencies. JustWare®, which was acquired as part of the New Dawn acquisition, provides a standardized case management system that includes business rules to automate tasks, document and report generation, digital signatures and shortcuts to speed data input. Journal Technologies also licenses its JusticeWeb® public access software, which allows the public to view certain case information, provides a means to create permission-based access for sensitive data, allows pro se litigants and attorneys to e-file documents and includes a way for case participants and others to make payments online.
ICMS™ — a court case management system, which was acquired as part of the acquisition of the ISD assets. Journal Technologies has also licensed CASE™ — an automated probation case management system, including juvenile hall detention management features.
eFile™ — a browser-based interface that allows attorneys and the general public to electronically file documents with the court using the Internet at any time.
ePayIt™ — a service primarily for the online payment of traffic citations. Users can pay traffic citations using the Internet at any time with a credit card, and can obtain traffic school and other information.
Almost all of Journal Technologies’ customers are government agencies, and most new software installation and licensing projects are subject to competitive bidding procedures. Accordingly, the ability of Journal Technologies to get new customers is highly unpredictable. In addition, budget constraints, especially during stressful economic times, could force governmental agencies to defer or forgo consulting services or even to stop paying their annual software maintenance fees. As a technology-based company, Journal Technologies’ success depends on the continued improvement of its products, which is why the costs to update and upgrade them consistently constitute such a significant portion of the Company’s expenses.
The Company’s revenues from Journal Technologies’ foreign customers were $336,000 in fiscal 2018, $276,000 in 2017, $221,000 in fiscal 2016 and $278,000 in fiscal 2015 and $332,000 in fiscal 2014. All of the Company’s other revenues in those years were attributable to the United States.
Materials and Postage
After personnel costs (included in “Salaries and employee benefits” and in “Outside services” in the accompanying consolidated statements of comprehensive income (loss)), postage and paper costs are typically the next two largest expenses for The Traditional Business. Paper and postage accounted for approximately 5% of our traditional publishing segment's operating costs in fiscal 2018, 5% in 2017, 6% in 2016, 6% in 2015 and 7% in 2014. Paper prices may fluctuate substantially in the future, and periodic postal rate increases could significantly impact income from operations. Further, we may not be able to pass on such increases to our customers.
An adequate supply of newsprint and other paper is important to the Company's operations. The Company currently does not have a contract with any paper supplier. The Company has always been able to obtain sufficient newsprint for its operations, although in the past shortages of newsprint have sometimes resulted in higher prices. The price of newsprint increased during fiscal 2018, and we anticipate future increases in 2019.
We use the U.S. Postal Service for distribution of a majority of our newspapers. During the past several years, the Company has instituted changes in an attempt to mitigate higher postage costs. These changes have included contracting for hand delivery in selected sections of the San Francisco Bay area and in Santa Clara, Alameda, San Diego, Riverside, San Bernardino, Orange and Los Angeles counties, delivering pre-sorted newspapers to the post office on pallets, which facilitates delivery and improves service, and implementing a method of bundling newspapers which reduces the per piece charges. In addition, the Company has an ink jet labeler which eliminates paper labels and enables the Company to receive bar code discounts from the postal service on some of its newspapers.
Postal rates are dependent on the operating efficiency of the U.S. Postal Service and on legislative mandates imposed upon the U.S. Postal Service. During the past several years, the U.S. Postal Service has increased postal rates. (There were decreases in the Company’s aggregate postage costs during fiscal 2018 primarily due to fewer subscribers.)
Marketing
The Company actively promotes its individual newspapers and its multiple newspaper network as well as its other publications. The Company's staff includes a number of employees whose primary responsibilities include attracting new subscribers and advertisers. The specialization of each publication creates both target subscribers and target advertisers. Subscribers are likely to be attracted because of the nature of the information carried by the particular publication, and likely advertisers are those interested in reaching such consumer groups. In marketing products, the Company also focuses on its ancillary products which can be of service to subscribers, such as its specialized information services.
The Company receives, on a non-exclusive basis, public notice advertising from a number of agencies. Such agencies ordinarily receive a commission of 15% to 25% on their sales of advertising in Company publications. Commercial advertising agencies also place advertising in Company publications and receive commissions for advertising sales.
Journal Technologies’ staff includes employees who provide marketing and consulting services which may also result in additional consulting projects and the licensing of products. Most of Journal Technologies’ new projects come from existing customers or from a competitive bidding process.
Competition
Competition for readers and advertisers is very intense, both by established publications and by new entries into the market. The Daily Journals face aggressive competition in Los Angeles and San Francisco. All of the Company's business publications and products face strong competition from other publications and service companies. Readers of specialized newspapers focus on the amount and quality of general and specialized news, amount and type of advertising, timely delivery and price. The Company designs its newspapers to fill niches in the news marketplace that are not covered as well by major metropolitan dailies. The in-depth news coverage which the Company's newspapers provide, along with general news coverage, attracts readers who, for personal or professional reasons, desire to keep abreast of topics to which a major newspaper cannot devote significant news space. Other newspapers do provide some of the same subject coverage as does the Company, but the Company believes its coverage, particularly that of The Daily Journals, is more complete and therefore attracts more readers. The Company believes that The Daily Journals are the most important newspapers serving California lawyers on a daily basis.
The Company's court rules publications face competition in both the Southern California and Northern California markets from case management systems and the courts themselves. Subscriptions to the multi-volume Court Rules and Local Rules volumes continued to decline during fiscal 2018. The Company's Judicial Profile services have indirect competition because some of the same information is available through other sources, including the courts.
The steady decline in recent years in the number of subscriptions to The Daily Journals and court rule publications is likely to continue and will certainly impact the Company’s future revenues. The pricing of the Company's products is reviewed every year.
In attracting commercial advertisers, the Company competes with other newspapers and magazines, television, radio and other media, including electronic and online systems for employment-related classified advertising. Factors which may affect competition for advertisers are the cost for such advertising compared with other media, and the size and characteristics of the readership of the Company's publications.
Internet sites devoted to recruitment have become significant competitors of our newspapers and web sites for classified advertising. In addition, there has been a steady consolidation of companies serving the legal marketplace, resulting in an ever-smaller group of companies placing display advertising. Consequently, retaining advertising revenues remains a challenge.
The Company competes with anywhere from one serious competitor to many competing newspapers for public notice advertising revenue in all of its markets. Large metropolitan general interest newspapers normally do not carry a significant amount of legal advertising, although recently they too have solicited certain types of public notice advertising. CNSB, the Company’s commission-earning selling agent, faces competition from a number of companies based in California, some of which specialize in placing certain types of notices.
There is significant competition among a limited number of companies to provide services and software to the courts and other justice agencies, and some of these companies are much larger and have greater access to capital and other resources than Journal Technologies. Others provide services for a limited number of customers. As part of the competitive bidding process, many customers will express a preference for, or even require, larger vendors.
Many customers desire Internet-based solutions to centralize operations, facilitate electronic filing and other interfaces with other justice partners and the public, and publish certain information from case management systems. Journal Technologies’ product lines provide versions of these services, but there are many uncertainties in the process of courts and other agencies migrating to newer Internet-based systems, including whether Journal Technologies’ versions of case management systems will find general acceptance and whether the update, upgrade and modification of such systems can be done in a cost effective manner. The Company competes on a variety of factors, including price, technological capabilities and services to accommodate the individual requirements of each customer.
Employees
The Company has approximately 350 full-time employees and contractors and about 25 part-time employees as of September 30, 2018. This includes about 220 full-time employees and contractors and 12 part-time staff of Journal Technologies. The Company is not a party to any collective bargaining agreements. Certain benefits, including medical insurance, are provided to all full-time employees. Management considers its employee relations to be good.
The Company relies heavily on Gerald Salzman, who serves as president, chief executive officer, chief financial officer, treasurer and assistant secretary. If Mr. Salzman’s services were no longer available to the Company, it is unlikely that the Company could find a single replacement to perform all of the duties now handled by him, and it could have a significant adverse effect on the Company’s business. The Company does not carry key man life insurance, nor has it entered into an employment agreement with Mr. Salzman. In April 2018, Mr. Salzman suffered a Transient Ischemic Attack (TIA) stroke. He was released from the hospital after one night and has since been working mostly from home, performing his executive roles with the Company while continuing to undergo physical therapy. He has reduced his work schedule to a more sustainable level and has delegated certain of his duties to other managers.
Working Capital
Traditionally, the Company had generated sufficient cash flow from operations to cover all its needs without significant borrowing. However, in fiscal 2018, the Company had negative cash flow primarily due to the expansion of Journal Technologies. The aggregate market value of the securities owned by the Company has increased significantly in recent years (although fiscal 2016 and 2017 were exceptions), providing the Company with working capital, subject, of course, to the normal risks associated with owning stocks. To a considerable extent, the Company also benefits from the fact that subscriptions and some licenses, maintenance and consulting fees are paid in advance. In 2012, the Company borrowed $14 million from its investment margin account to purchase all of the outstanding stock of New Dawn, and in 2013, it borrowed another $15.5 million to acquire substantially all of the operating assets and liabilities of ISD, in each case pledging its marketable securities to obtain favorable financing.
The Company believes it has sufficient cash and marketable securities for the foreseeable future. If the Company’s overall cash needs exceed cash flow from operations and its current working capital, the Company may still have the ability to borrow against its marketable securities on favorable terms as it did for the New Dawn and ISD acquisitions, or it may attempt to secure additional financing which may or may not be available on acceptable terms. The Company could also sell marketable securities to generate cash, if necessary.
The Company extends unsecured credit to most of its advertising customers. The Company maintains a reserve account for estimated losses resulting from the inability of these customers to make required payments, but if the financial conditions of these customers were to deteriorate or the Company’s judgments about their abilities to pay are incorrect, additional allowances might be required, and the Company’s cash flows and results of operations could be materially affected.
Inflation
The effects of inflation are not significantly any more or less adverse on the Company's businesses than they are on other publishing and software companies. The Company has experienced the effects of inflation primarily through increases in costs of personnel, newsprint, postage and services. These costs have generally been offset by periodic price increases for advertising and subscription rates, but with frequent exceptions during several years when the Company has experienced substantial increases in postage and newsprint expenses and additional costs related to acquisitions.
Access to Our Information
The Company files annual, quarterly and current reports, proxy statements and other information with the Securities and Exchange Commission (“SEC”). These filings are not available on our website, www.dailyjournal.com, which is generally dedicated to the content of our publications. We will, however, provide these filings in electronic or paper format free of charge upon request addressed to our Secretary at our principal executive offices. Our SEC filings are also available to the public over the Internet at the SEC’s website at www.sec.gov. The public may also read and copy any document we file at the SEC’s public reference room located at 100 F Street N.E., Washington, D.C. 20549. Please call the SEC at 1-800-SEC-0330 for further information on the operation of the public reference room.
Item 1A. Risk Factors
The foregoing business discussion and the other information included in this Form 10-K should be read in conjunction with the following risks, trends and uncertainties, any of which, either individually or in the aggregate, could materially and adversely affect our business, operating results or financial condition.
Risks Associated with The Traditional Business
A continuing reduction in the number of residential foreclosures in California and Arizona will result in fewer trustee sale notices being published in the Company’s newspapers.
For several years, the revenues of The Traditional Business were driven by the large number of foreclosures in California and Arizona, for which public notice advertising is required by law. With improvements in the economy, the number of foreclosures continued to decline in 2018. We expect this trend to continue, and it will significantly adversely impact the earnings of The Traditional Business because it will be impractical for the Company to offset the expected revenue loss with expense reductions.
Changes in the legal requirement to publish public notice advertising or in the legal ability of our newspapers to publish those notices would have a significant adverse impact on The Traditional Business.
From time to time, the legislatures in California and Arizona (and elsewhere) have considered various proposals that would result in the elimination or reduction of the amount of public notice advertising in printed newspapers required by statute, and Arizona recently approved one such proposal for a particular notice type. These proposals typically focus on the availability of alternative means of providing public notices, such as via the Internet. Some proposals also question the need for public notices at all. To the extent these proposals become law, particularly in California and Arizona, they could materially affect the revenues of The Traditional Business.
In addition, if the adjudication, which is what gives publishers the legal ability to publish public notice advertising, of one or more of the Company’s newspapers was challenged and revoked, those newspapers would no longer be eligible to publish public notice advertising, and it could materially affect the revenues of The Traditional Business.
The Traditional Business faces strong competition in each of its markets.
Competition for readers and advertisers is very intense, both from established publications and from new entrants into the market. The Daily Journals face aggressive competition. The Company’s court rules publications face competition in both Northern and Southern California from document management programs, online court rules services, and the courts themselves. The steady decline in recent years in the number of subscriptions to The Daily Journals and the court rule publications is likely to continue and adversely impact The Traditional Business’ future revenues.
The Traditional Business also competes with anywhere from one serious competitor to many competing newspapers for public notice advertising in all of its markets. As the amount of this advertising has decreased due to the reduction in the number of foreclosures discussed above, the competition to publish the remaining public notices has intensified and may result in a further decline in The Traditional Business’ public notice advertising revenues.
The Traditional Business continues to experience challenges in maintaining its commercial advertising and circulation revenues, particularly due to the growth of Internet sites.
Internet sites devoted to recruitment have become significant competitors of our newspapers and web sites for classified advertising. In addition, there has been a steady consolidation of companies serving the legal marketplace, resulting in an ever-smaller group of companies placing display advertising. Furthermore, newspapers like ours have been struggling to compete for display advertising generally, given the many other forums (including Internet sites) that compete for advertising dollars. These trends are expected to continue and would adversely affect The Traditional Business.
Circulation revenues have continued to decline as more and more information has become available from the Internet. Law firm mergers have also reduced the number of firms that purchase multiple subscriptions of our newspapers. It is not practical to assume that we will be able to offset the decline in subscriptions with increases in the subscription rate, and we expect that our circulation revenues will continue to decline.
The Traditional Business is exposed to risks associated with fluctuations in postage and paper costs.
After personnel costs, postage and paper costs are typically the Company’s next two largest expenses. An adequate supply of newsprint and other paper is important to the operations of The Traditional Business. The Company currently does not have a contract with any paper supplier, and in the past, shortages of newsprint have sometimes resulted in higher prices. The price of newsprint increased in fiscal year 2018 and we anticipate future increases.
The Traditional Business uses the U.S. Postal Service for distribution of a majority of its newspapers and magazine. Postal rates are dependent on the operating efficiency of the U.S. Postal Service and on legislative mandates imposed upon the U.S. Postal Service. During the past several years, postal rates have increased. Postal rates and fees may increase more in the future. Further, we may not be able to pass on increases in paper and postage costs to our customers.
Risks Associated with Journal Technologies
The success of Journal Technologies depends in large part on the technological update and upgrade of its software products.
Journal Technologies’ success depends on the continued improvement of its products, and the costs to update and upgrade those products consistently represent a large portion of Journal Technologies’ expenses. There are many uncertainties in the process of courts and other justice agencies migrating to newer case management systems, including whether Journal Technologies’ versions of these systems will find general acceptance and whether the modification of such systems can be done in a cost effective manner. The costs to update and upgrade Journal Technologies’ products are expensed as incurred and will impact earnings at least through the foreseeable future.
Journal Technologies faces significant competition from other case management software vendors.
There is significant competition among a limited number of companies to provide services and software to courts and other justice agencies, and some of these companies are much larger and have greater access to capital and other resources than Journal Technologies. Normally, the vendor is selected through a bidding process, and often the customers will express a preference for, or even require, larger vendors. An inability to successfully compete in this difficult market could materially affect the earnings of Journal Technologies.
The customers of Journal Technologies are public sector entities, which create special issues and risks.
All of the customers of Journal Technologies are courts, justice agencies, and other government entities. Accordingly, we face special risks associated with governmental budget constraints, especially during stressful economic times, which could force government entities to defer or forego consulting services or even stop paying their annual software license and maintenance fees. In addition, we encounter risks related to a longer and more complicated sales cycle than exists for commercial customers, political issues related to resource allocation, administration turnover and preferences for internal case management solutions or for a particular vendor, complicated bidding procedures, and fluctuations in the demand for information technology products and services.
Journal Technologies generally recognizes revenues for software installations only upon completion of the applicable services and customer acceptance of the software system.
In most cases, installation fees are not due until the customer has indicated its satisfaction with the installed system, and it has “gone live”. Accordingly, we do not recognize revenues for installation services or for most other consulting services until after the services have been performed and accepted. There are significant risks associated with our ability to complete our services to the satisfaction of our customers and to fulfill the requirements that entitle us to be paid. An inability to realize payment for services performed could materially affect the earnings of Journal Technologies.
Risks Associated with Our Holdings of Marketable Securities
A large portion of the Company’s assets is held in publicly traded securities, and the prices of those securities may decline.
As of September 30, 2018, the Company held marketable securities worth approximately $212,296,000, with an unrealized gain for financial statement purposes of $158,407,000. While this portfolio has enabled the Company to borrow on very favorable terms for the New Dawn and ISD acquisitions and to better compete for case management software opportunities that are usually limited to “large” firms, it is unusual for a public company to invest a significant amount of its available cash in the marketable securities of other public companies. The value of these securities could decline, which would adversely affect shareholders’ equity.
Also, as of September 30, 2018, the Company’s holdings of marketable securities were concentrated in just six companies and included two based in foreign currencies. Accordingly, a significant decline in the market value and unfavorable changes in the foreign exchange rates of one or more of the Company’s holdings may not be offset by hypothetically better performance of other holdings. This concentration of risk may result in a more pronounced effect on shareholders’ equity.
In certain circumstances, the Company may be required to recognize losses in a particular security for financial statement purposes even though the Company has not actually sold the security.
Even if the Company’s marketable securities as a whole perform extraordinarily well, for accounting reasons, an “other-than-temporary impairment” in a particular security may result in the need to recognize a loss with respect to that security in the Company’s statements of comprehensive income (loss) in a particular period. This has happened in several previous fiscal years and in fiscal 2018, and it may happen again in the future with respect to the same securities or other securities owned by the Company. This requirement to recognize a loss could have a material effect on the Company’s earnings in a particular period. Also, at times, the Company may hold marketable securities denominated in currencies other than the United States Dollar. When it does, the Company may be at risk for significant fluctuations in the applicable foreign currency exchange rates, which would affect the profitability of such marketable securities.
General Corporate Risks
The Company relies heavily on the services of Gerald Salzman.
Gerald Salzman, 79, serves as the Company’s president, chief executive officer, chief financial officer, treasurer and assistant secretary. He is also the president, chief executive officer, chief financial officer and secretary of Journal Technologies. If Mr. Salzman’s services were no longer available to the Company, it is unlikely that the Company could find a single replacement to perform all of the duties now handled by him, and it could have a significant adverse effect on the Company’s business. The Company does not carry key man life insurance, nor has it entered into an employment agreement with Mr. Salzman. In April 2018, Mr. Salzman suffered a Transient Ischemic Attack (TIA) stroke. He was released from the hospital after one night and has since been working mostly from home, performing his executive roles with the Company while continuing to undergo physical therapy. He has reduced his work schedule to a more sustainable level and has delegated certain of his duties to other managers.
Changes in accounting guidance could have a significant effect on the Company’s reported financial results.
Preparing consolidated financial statements requires the Company’s management to make estimates and assumptions that affect the reported amount of assets, liabilities, revenues and expenses. These estimates and assumptions are affected by management’s application of accounting policies and the prevailing accounting guidance. The Company considers fair value measurement and disclosures, revenue recognition, accounting for software costs, accounting for business combinations, testing for goodwill and intangible impairments and income taxes to be critical accounting policies and estimates. A change in the accounting guidance with respect to one or more of these areas could materially affect the Company’s reported financial results.
We cannot be sure that customer information and systems are fully protected against security breaches.
Journal Technologies’ software processes and stores customer information in the conduct of its business, including in some cases by utilizing cloud-based systems supplied by third-party vendors. Despite our efforts to maintain up-to-date security controls, it is possible that our system could be improperly used to access or misappropriate customer systems or information, including personally identifiable or other confidential information. A material security breach of this nature could harm our reputation, cause us to lose current and potential customers, require us to allocate more resources to information security, or subject us or our customers to liability, resulting in increased costs, loss of revenue, or both. The Traditional Business also operates certain websites that process and, in certain cases, store customer information. A minor security breach was discovered on a website operated by The Traditional Business in early fiscal 2015, and although it was remediated, there can be no assurance that there will not be more material breaches in the future. Also, our insurance may not cover all of the costs that we may incur as a result of a material security breach.
The Company has identified material weaknesses in its internal control over financial reporting.
The Company has identified material weaknesses in its internal control over financial reporting. The Company’s internal control over financial reporting has been designed to provide management and the Board of Directors with reasonable assurance regarding the preparation and fair presentation of the Company’s consolidated financial statements. As a small company, we are not able to segregate duties to the extent we could if we had more people, and we have not sufficiently designed controls that support an effective assessment of our internal controls relating to the prevention of fraud and possible management override of controls. Further, the Company does not have an internal audit department, and has not engaged an outside firm to complete the documentation of its internal control assessment to the level required by the applicable criteria.
We believe that our overall internal control environment is sufficient for a company of our size. However, the existence of material weaknesses means that there is a reasonable possibility that a material misstatement of our financial statements will not be prevented or detected on a timely basis. If we are not able to correct material weaknesses or deficiencies in internal controls in a timely way, our ability to record, process, summarize and report financial information accurately and within the time periods specified in the SEC’s rules and forms will be adversely affected. Such a result could negatively impact the market price and trading liquidity of our stock, weaken investor confidence in our reported financial information, subject us to civil and criminal investigations and penalties, and generally materially and adversely affect our business and financial condition. For more information regarding the material weaknesses, the mitigating controls we use, and certain remedial steps we have taken or considered, please see Part II. Item 9A Controls and Procedures.
Item 1B. Unresolved Staff Comments
None.
Item 2. Properties
The Company owns office and printing facilities in Los Angeles and an office building in Logan, Utah, and leases space for its other offices under operating leases which expire at various dates through 2020.
The main Los Angeles property is comprised of a two-story, 34,000 square foot building constructed in 1990, which is fully occupied by the Company. Approximately 75% of the building is devoted to office space and the remainder to printing and production equipment and facilities. In 2003, the Company finished building an adjacent 37,000 square foot building and parking facilities on properties it acquired in 1996 and 1998. This building provides additional office, production and storage space. The Company and Journal Technologies occupy this building’s first floor and will complete the build-out of the second floor as needed.
In November 2015, the Company purchased a 30,700 square foot office building constructed in 1998 on about 3.6 acres in Logan, Utah that had been previously leased for Journal Technologies.
The Company leases approximately 6,200 square feet of office space (expiring in October 2019) in San Francisco. Journal Technologies leases about 7,100 square feet of office space (expiring in May 2019) in Corona, California; 9,800 square feet of office space (expiring in August 2020) in Englewood, Colorado; and 1,800 square feet of office space (expiring in October 2019) in Englewood, Colorado which has been sublet. In addition, the Company rents facilities in each of the remaining cities where its staff is located on a month-to-month basis or pursuant to leases generally of no longer than three years’ duration. The Company believes that it has adequate office space.
See Note 4 of Notes to Consolidated Financial Statements for information concerning rents payable under leases.
Item 3. Legal Proceedings
From time to time, the Company is subject to litigation arising in the normal course of its business. While it is not possible to predict the results of such litigation, management does not believe the ultimate outcome of these types of matters will have a material adverse effect on the Company’s financial position or results of operations or cash flows.
Item 4. Mine Safety Disclosures
Not applicable.
Part II
Item 5. Market for Registrant’s Common Equity, Related Stockholder Matters and Issuer Purchases of Equity Securities
The following table sets forth the sales prices of the Company’s common stock for the periods indicated. Quotations are as reported by the NASDAQ Capital Market.
|
High |
Low |
|||||||
|
Fiscal 2018 |
||||||||
|
Quarter ended December 31, 2017 |
$ | 250.03 | $ | 217.67 | ||||
|
Quarter ended March 31, 2018 |
250.95 | 213.85 | ||||||
|
Quarter ended June 30, 2018 |
248.42 | 221.04 | ||||||
|
Quarter ended September 30, 2018 |
246.75 | 225.01 | ||||||
|
Fiscal 2017 |
||||||||
|
Quarter ended December 31, 2016 |
$ | 282.48 | $ | 200.01 | ||||
|
Quarter ended March 31, 2017 |
253.90 | 201.01 | ||||||
|
Quarter ended June 30, 2017 |
223.55 | 202.98 | ||||||
|
Quarter ended September 30, 2017 |
240.03 | 195.00 | ||||||
As of December 10, 2018, there were approximately 440 holders of record of the Company’s common stock, and the last trade was at $230.80 per share.
The Company did not declare or pay any dividends during fiscal 2018, 2017 or 2016. A determination by the Company whether or not to pay dividends in the future will depend on numerous factors, including the Company’s earnings, cash flow, financial condition, capital requirements, future prospects, acquisition opportunities, and other relevant factors. The Board of Directors does not expect that the Company will pay any dividends or other distributions to shareholders in the foreseeable future.
The Company does not have any equity compensation plans, and it did not sell any securities, whether or not registered under the Securities Act of 1933, during the past three fiscal years.
From time to time, the Company has repurchased shares of its common stock and may do so in the future. The Company maintains a common stock repurchase program that was implemented in 1987 in combination with the Company’s Management Incentive Plan. See Note 2 of Notes to Consolidated Financial Statements for more information. The Company’s stock repurchase program remains in effect, but the Company did not repurchase any shares during fiscal 2018 or 2017 or 2016.
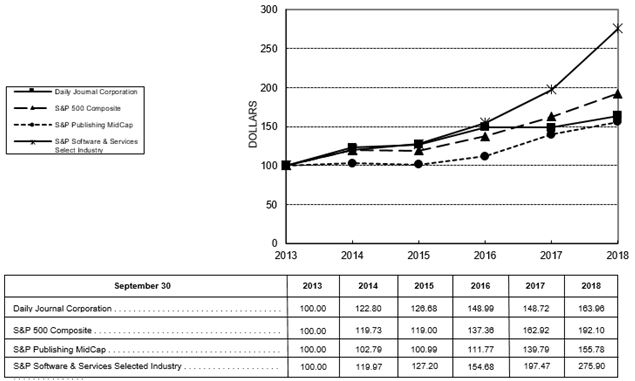
The following graph shows a five-year comparison of cumulative total return on the Company’s common stock, Standard & Poor’s 500 Composite Index, Standard & Poor’s Publishing MidCap Index and Standard & Poor’s Software & Services Select Industry Index, assuming $100 was invested on September 30, 2013, and all dividends were reinvested. The Company has not declared a dividend in any of the fiscal years shown.
Daily Journal Corporation
Total Cumulative Shareholder Return for Five Years Ended September 30, 2018
Item 6. Selected Financial Data
The following sets forth selected financial data for the Company as of, and for each of the five years ended September 30, 2018. Such data should be read in conjunction with, and is qualified in its entirety by reference to, the Company’s consolidated financial statements and the notes thereto and “Management’s Discussion and Analysis of Financial Condition and Results of Operations,” each included herein.
| Fiscal Year Ended September 30 | ||||||||||||||||||||
| 2018 | 2017 | 2016 | 2015 | 2014 | ||||||||||||||||
|
(Dollar amounts in thousands, except share and per share amounts) |
||||||||||||||||||||
|
Consolidated Statement of Comprehensive Income (Loss): |
||||||||||||||||||||
|
Revenues |
||||||||||||||||||||
| Advertising, net | $ | 9,112 | $ | 9,104 | $ | 9,854 | $ | 10,502 | $ | 11,435 | ||||||||||
|
Circulation |
5,401 | 5,654 | 5,912 | 5,915 | 6,038 | |||||||||||||||
|
Advertising service fees and other |
2,659 | 2,812 | 2,651 | 2,703 | 2,800 | |||||||||||||||
|
Licensing and maintenance fees |
17,225 | 16,037 | 14,758 | 13,984 | 12,987 | |||||||||||||||
|
Consulting fees |
2,832 | 4,476 | 4,085 | 4,704 | 4,002 | |||||||||||||||
|
Other public service fees |
3,474 | 3,301 | 4,352 | 6,170 | 6,161 | |||||||||||||||
| 40,703 | 41,384 | 41,612 | 43,978 | 43,423 | ||||||||||||||||
|
Costs and expenses |
||||||||||||||||||||
|
Salaries and employee benefits |
33,832 | 31,749 | 27,381 | 26,010 | 25,262 | |||||||||||||||
|
Outside services |
4,287 | 4,552 | 3,729 | 3,524 | 3,212 | |||||||||||||||
|
Postage and delivery costs |
857 | 1,112 | 1,141 | 1,318 | 1,281 | |||||||||||||||
|
Newsprint and printing expenses |
780 | 877 | 912 | 1,225 | 1,221 | |||||||||||||||
|
Depreciation and amortization |
3,678 | 5,586 | 5,709 | 5,531 | 5,516 | |||||||||||||||
|
Other general and administrative expenses |
11,329 | 10,675 | 9,380 | 9,882 | 9,121 | |||||||||||||||
| 54,763 | 54,551 | 48,252 | 47,490 | 45,613 | ||||||||||||||||
|
Loss from operations |
(14,060 | ) | (13,167 | ) | (6,640 | ) | (3,512 | ) | (2,190 | ) | ||||||||||
|
Other income and expenses |
||||||||||||||||||||
|
Dividends and interest income |
4,808 | 4,844 | 4,085 | 3,829 | 3,001 | |||||||||||||||
|
Other income |
37 | 34 | 61 | 65 | 97 | |||||||||||||||
|
Interest expenses on margin loans |
(651 | ) | (422 | ) | (284 | ) | (224 | ) | (230 | ) | ||||||||||
|
Interest expense on note payable collateralized by real estate |
(95 | ) | (100 | ) | (88 | ) | --- | --- | ||||||||||||
|
Interest and penalty (expense) expense reversal accrued for uncertain and unrecognized tax benefits |
3,182 | 743 | (112 | ) | (96 | ) | (537 | ) | ||||||||||||
|
Capital gains on sales of marketable securities and others |
--- | --- | --- | 4 | --- | |||||||||||||||
|
Other-than temporary impairment losses on Investments |
(4,560 | ) | --- | --- | (376 | ) | --- | |||||||||||||
|
(Loss) income before taxes |
(11,339 | ) | (8,068 | ) | (2,978 | ) | (310 | ) | 141 | |||||||||||
|
Benefit from income taxes |
19,540 | 7,150 | 1,935 | 1,120 | 490 | |||||||||||||||
|
Net income (loss) |
$ | 8,201 | $ | (918 | ) | $ | (1,043 | ) | $ | 810 | $ | 631 | ||||||||
|
Weighted average number of common shares outstanding – basic and diluted |
1,380,746 | 1,380,746 | 1,380,746 | 1,380,746 | 1,380,746 | |||||||||||||||
|
Basic and diluted net income (loss) per share |
$ | 5.94 | $ | (0.66 | ) | $ | (0.76 | ) | $ | 0.59 | $ | 0.46 | ||||||||
|
Comprehensive income (loss) |
||||||||||||||||||||
|
Net income (loss) |
$ | 8,201 | $ | (918 | ) | $ | (1,043 | ) | $ | 810 | $ | 631 | ||||||||
|
Net change in unrealized appreciation of investments (net of taxes) |
(5,823 | ) | 35,316 | (2,214 | ) | (8,811 | ) | 22,393 | ||||||||||||
|
Reclassification adjustment of other-than-temporary impairment losses recognized in net income |
3,350 | --- | --- | 230 | --- | |||||||||||||||
|
Net change in comprehensive income (loss) |
$ | 5,728 | $ | 34,398 | $ | (3,257 | ) | $ | (7,771 | ) | $ | 23,024 | ||||||||
|
September 30 |
||||||||||||||||||||
|
2018 |
2017 |
2016 |
2015 |
2014 |
||||||||||||||||
|
Consolidated Balance Sheet Data: |
||||||||||||||||||||
|
Total assets |
$ | 263,998 | $ | 280,708 | $ | 225,446 | $ | 228,196 | $ | 243,877 | ||||||||||
|
Shareholders’ equity |
162,916 | 159,741 | 125,343 | 128,600 | 136,371 | |||||||||||||||
Item 7. Management's Discussion and Analysis of Financial Condition and Results of Operations
Results of Operations
The Company continues to operate as two different businesses: (1) The Traditional Business, being the business of newspaper publishing and related services that the Company had before 1999 when it purchased a software company, and (2) Journal Technologies, Inc. (“Journal Technologies”), a wholly-owned subsidiary which supplies case management software systems and related products to courts, prosecutor and public defender offices, probation departments and other justice agencies, including administrative law organizations, city and county governments and bar associations. These organizations use the Journal Technologies family of products to help manage cases and information electronically, to interface with other critical justice partners and to extend electronic services to bar members and the public, including efiling and a website to pay traffic citations online. These products are licensed to more than 500 organizations in 42 states and internationally.
Comprehensive Income (Loss)
Comprehensive income (loss) includes net income (loss) and unrealized net (losses) gains on investments, net of taxes, as summarized below:
|
Comprehensive Income (Loss) |
||||||||||||
|
Fiscal Year Ended September 30 |
||||||||||||
|
2018 |
2017 |
2016 |
||||||||||
|
Net income (loss) |
$ | 8,201,000 | $ | (918,000 | ) | $ | (1,043,000 | ) | ||||
|
Net increase (decrease) in unrealized appreciation of investments (net of taxes) |
(5,823,000 | ) | 35,316,000 | (2,214,000 | ) | |||||||
|
Reclassification adjustment of other-than-temporary impairment losses recognized in net income (net of taxes) |
3,350,000 | --- | --- | |||||||||
| $ | 5,728,000 | $ | 34,398,000 | $ | (3,257,000 | ) | ||||||
Fiscal 2018 compared with fiscal 2017
Consolidated operating revenues were $40,703,000 and $41,384,000 for fiscal year ended September 30, 2018 and 2017, respectively. This decrease of $681,000 was primarily from (i) a $1,644,000 reduction in Journal Technologies’ consulting fees due to fewer go-lives in fiscal 2018 and (ii) a $168,000 reduction in The Traditional Business’s trustee sale notice and related service fee revenues and a $253,000 reduction in circulation revenues, partially offset by increased Journal Technologies’ license and maintenance fees of $1,188,000 and public service fees of $173,000. The Company’s revenues derived from Journal Technologies’ operations constituted about 58% of the Company’s total operating revenues for both fiscal 2018 and fiscal 2017.
Consolidated operating expenses increased by $212,000 to $54,763,000 from $54,551,000. Total personnel costs increased by $2,083,000 (7%) to $33,832,000 from $31,749,000 primarily resulting from additional personnel costs for Journal Technologies. Outside services decreased by $265,000 (6%) to $4,287,000 from $4,552,000 mainly because of decreased contractor’s costs for Daily Journal. Depreciation and amortization costs, which included primarily the amortization of Journal Technologies’ intangible assets of $3,058,000 and $4,895,000 for fiscal 2018 and 2017, respectively, decreased by $1,908,000 to $3,678,000 from $5,586,000 mainly because all intangible assets became fully amortized during fiscal 2018. Other general and administrative expenses increased by $654,000 (6%) to $11,329,000 from $10,675,000 mainly because of increased rent expenses of $254,000 as we expanded the Colorado office and other computer related expenses of $372,000 for Journal Technologies.
The Company’s non-operating income, net of expenses, decreased by $2,378,000 (47%) to $2,721,000 from $5,099,000 primarily resulting from (i) the non-cash other-than-temporary impairment losses on investments of $4,560,000, partially offset by the capital gains on sales of marketable securities and others of $3,182,000, (ii) increases in the interest rate on the two acquisition margin loans of $229,000 and (iii) the prior year’s interest and penalty expense reversal of $743,000 for uncertain and unrecognized tax benefits.
During fiscal 2018, consolidated pretax loss was $11,339,000 as compared with $8,068,000 in the prior year. There was consolidated net income (after tax benefits) of $8,201,000 ($5.94 per share) for fiscal 2018 primarily due to tax benefits resulting from the December 2017 Tax Cuts and Jobs Act (the “Tax Act”) as compared with a net loss of $918,000 (-$0.66 per share) in the prior year. (See Taxes.)
At September 30, 2018, the aggregate fair market value of the Company’s marketable securities was $212,296,000. These securities had approximately $158,407,000 of unrealized gains before taxes of $42,151,000 and generated approximately $4,808,000 in dividends and interest income in fiscal 2018 which lowers the Company’s effective income tax rate because of the dividends received deduction. Most of the unrealized gains were in the common stocks of three U.S. financial institutions and one foreign manufacturer.
Additional details about each of the Company’s reportable segments, and its corporate income and expenses, is set forth below:
|
Overall Financial Results (000) |
||||||||||||||||||||||||||||||||
|
For the twelve months ended September 30 |
||||||||||||||||||||||||||||||||
|
Reportable Segments |
||||||||||||||||||||||||||||||||
|
Traditional Business |
Journal Technologies |
Corporate |
Total |
|||||||||||||||||||||||||||||
|
2018 |
2017 |
2018 |
2017 |
2018 |
2017 |
2018 |
2017 |
|||||||||||||||||||||||||
|
Revenues |
||||||||||||||||||||||||||||||||
|
Advertising |
$ | 9,112 | $ | 9,104 | $ | --- | $ | --- | $ | --- | $ | --- | $ | 9,112 | $ | 9,104 | ||||||||||||||||
|
Circulation |
5,401 | 5,654 | --- | --- | --- | --- | 5,401 | 5,654 | ||||||||||||||||||||||||
|
Advertising service fees and other |
2,659 | 2,812 | --- | --- | --- | --- | 2,659 | 2,812 | ||||||||||||||||||||||||
|
Licensing and maintenance fees |
--- | --- | 17,225 | 16,037 | --- | --- | 17,225 | 16,037 | ||||||||||||||||||||||||
|
Consulting fees |
--- | --- | 2,832 | 4,476 | --- | --- | 2,832 | 4,476 | ||||||||||||||||||||||||
|
Other public service fees |
--- | --- | 3,474 | 3,301 | --- | --- | 3,474 | 3,301 | ||||||||||||||||||||||||
|
Total operating revenues |
17,172 | 17,570 | 23,531 | 23,814 | --- | --- | 40,703 | 41,384 | ||||||||||||||||||||||||
|
Operating expenses |
||||||||||||||||||||||||||||||||
|
Salaries and employee benefits |
10,381 | 10,548 | 23,451 | 21,201 | --- | --- | 33,832 | 31,749 | ||||||||||||||||||||||||
|
Amortization of intangible assets |
--- | --- | 3,058 | 4,895 | --- | --- | 3,058 | 4,895 | ||||||||||||||||||||||||
|
Others |
6,459 | 7,304 | 11,414 | 10,603 | --- | --- | 17,873 | 17,907 | ||||||||||||||||||||||||
|
Total operating expenses |
16,840 | 17,852 | 37,923 | 36,699 | --- | --- | 54,763 | 54,551 | ||||||||||||||||||||||||
|
Income (loss) from operations |
332 | (282 | ) | (14,392 | ) | (12,885 | ) | --- | --- | (14,060 | ) | (13,167 | ) | |||||||||||||||||||
|
Dividends and interest income |
--- | --- | --- | --- | 4,808 | 4,844 | 4,808 | 4,844 | ||||||||||||||||||||||||
|
Other income |
--- | 22 | --- | --- | 37 | 12 | 37 | 34 | ||||||||||||||||||||||||
|
Interest expenses on note payable collateralized by real estate |
(95 | ) | (100 | ) | --- | --- | --- | --- | (95 | ) | (100 | ) | ||||||||||||||||||||
|
Interest expense on margin loans |
--- | --- | --- | --- | (651 | ) | (422 | ) | (651 | ) | (422 | ) | ||||||||||||||||||||
|
Capital gains on sales of marketable securities and others |
--- | --- | --- | --- | 3,182 | --- | 3,182 | --- | ||||||||||||||||||||||||
|
Other-than-temporary impairment losses on investments |
--- | --- | --- | --- | (4,560 | ) | --- | (4,560 | ) | --- | ||||||||||||||||||||||
|
Interest expense reversal for uncertain and unrecognized tax benefits |
--- | --- | --- | 743 | --- | --- | --- | 743 | ||||||||||||||||||||||||
|
Pretax income (loss) |
$ | 237 | $ | (360 | ) | $ | (14,392 | ) | $ | (12,142 | ) | $ | 2,816 | $ | 4,434 | $ | (11,339 | ) | $ | (8,068 | ) | |||||||||||
The Traditional Business
The Traditional Business segment’s pretax income increased by $597,000 to pretax income of $237,000 from a pretax loss of $360,000.
Advertising revenues increased by $8,000 to $9,112,000 from $9,104,000, primarily resulting from increases in conference revenues of $92,000 and net government notice advertising revenues of $65,000, partially offset by declines in trustee sale notice advertising revenues of $149,000.
Trustee sale notices are very much dependent on the number of California and Arizona foreclosures for which public notice advertising is required by law. The number of foreclosure notices published by the Company decreased by 13% during the twelve months ended September 30, 2018 as compared to the prior year. Because this slowing is expected to continue, the Company expects there will be fewer foreclosure notice and other public notice advertisements and declining revenues in fiscal 2019, and the Company’s print-based earnings will also likely decline significantly because it will be impractical for the Company to offset all revenue losses by expense reduction. The Company’s smaller newspapers, those other than the Los Angeles and San Francisco Daily Journals (“The Daily Journals”), accounted for about 88% of the total public notice advertising revenues in fiscal 2018. Public notice advertising revenues and related advertising and other service fees constituted about 21% of the Company’s total operating revenues for both fiscal 2018 and 2017. Because of this concentration, the Company’s revenues would be significantly adversely affected if California and Arizona eliminated the legal requirement to publish public notices in adjudicated newspapers of general circulation, as had been recently implemented in Arizona for one notice type that has represented approximately $500,000 in annual revenues for the Company. Also, if the adjudication of one or more of the Company’s newspapers was challenged and revoked, those newspapers would no longer be eligible to publish public notice advertising, and it could have a material adverse effect on the Company’s revenues.
The Daily Journals accounted for about 89% of The Traditional Business’ total circulation revenues, which declined by $253,000 to $5,401,000 from $5,654,000. The court rule and judicial profile services generated about 8% of the total circulation revenues, with the other newspapers and services accounting for the balance. Advertising service fees and other are Traditional Business segment revenues, which include primarily (i) agency commissions received from outside newspapers in which the advertising is placed, and (ii) fees generated when filing notices with government agencies.
The Traditional Business segment operating expenses decreased by $1,012,000 (6%) to $16,840,000 from $17,852,000, primarily due to decreased personnel and contractor costs.
Journal Technologies
Journal Technologies’ business segment pretax loss increased by $2,250,000 (19%) to $14,392,000 from $12,142,000, after recording the interest and penalty expense reversal of $743,000 for uncertain and unrecognized tax benefits in the prior year and including the amortization costs of intangible assets of $3,058,000 for fiscal 2018 and $4,895,000 for fiscal 2017.
Revenues decreased by $283,000 (1%) to $23,531,000 from $23,814,000 in the prior year. Licensing and maintenance fees increased by $1,188,000 (7%) to $17,225,000 from $16,037,000. Consulting fees decreased by $1,644,000 (37%) to $2,832,000 from $4,476,000. Deferred revenues on installation contracts primarily represent the fair value of advances from customers of Journal Technologies for installation services and are recognized upon final project go-lives. Deferred revenues on license and maintenance contracts represent prepayments of annual license and maintenance fees and are recognized ratably over the maintenance period. Other public service fees increased by $173,000 (5%) to $3,474,000 from $3,301,000 primarily due to an increase in the number of traffic tickets processed through Journal Technologies’ products.
Operating expenses increased by $1,224,000 (3%) to $37,923,000 from $36,699,000, primarily due to increased personnel costs.
Intangible assets, including customer relationships and developed technology from the fiscal 2013 acquisitions, were fully amortized on a straight-line basis over five years for financial statement purposes due to the short life cycle of technology on which customer relationships depend, and are being amortized over 15 years for tax purposes. Goodwill, which is not amortized for financial statement purposes, is amortized over 15 years for tax purposes. Goodwill represents the expected synergies in expanding the Company’s software business. Goodwill is evaluated for impairment annually, or whenever events or changes in circumstances indicate that the value may not be recoverable. Considered factors for potential goodwill impairment evaluation include the current year’s operating financial results before intangible amortization, fluctuations of revenues, changes in the market place, the status of installation contracts and new business, among other things. Journal Technologies is continuing to update and upgrade its software products. These costs are expensed as incurred and will impact earnings at least through the foreseeable future.
Taxes
The Tax Act reduced the maximum corporate income tax rate from 35% to 21%, effective January 1, 2018. The Company has completed its review of the Tax Act. The impact to its financial statements is as follows: (i) current income tax expense or benefit is calculated using a blended rate of 24.28% pursuant to IRC Section 15, (ii) deferred tax expense includes a discrete net tax benefit of approximately $16 million resulting from a revaluation of deferred tax assets and liabilities to the expected tax rate that will be applied when temporary differences are expected to reverse, (iii) items that were expected to reverse during fiscal 2018 were valued at the blended rate of 24.28% while temporary differences that will reverse after fiscal 2018 were valued at the 21% rate, and (iv) approximately $20 million of the revaluation of deferred taxes relates to items that were initially recorded as accumulated other comprehensive income (“AOCI”). This revaluation of approximately $20 million was recorded as a component of income tax expense or benefit in continuing operations.
During fiscal 2018, the Company recorded an income tax benefit of $19,540,000 on a pretax loss of $11,339,000. The effective tax rate (before the discrete Tax Act item discussed above) was greater than the statutory rate primarily due to the dividends received deduction which increases the loss for tax purposes.
On a pretax loss of $8,068,000 for fiscal 2017, the Company recorded an income tax benefit of $7,150,000 which included a reversal of an accrued liability of approximately $2,665,000 for uncertain and unrecognized tax benefits relating to an acquisition in fiscal 2013. The Internal Revenue Service concluded its examination of the Company’s fiscal 2014 income tax return with no proposed changes to the tax position that gave rise to this liability. As a result, this liability was reversed along with the related accrued interest and penalty expense of $743,000. In addition, a deferred tax liability, in the amount of $352,000, relating to temporary differences that would only exist if the uncertain tax position was never recognized, was reversed. The effective tax rate (before the discrete IRS item) was greater than the statutory rate mainly resulting from the dividends received deduction. The Company’s effective tax rate was 172% and 89% for fiscal 2018 and 2017, respectively.
The Company files consolidated federal income tax returns in the United States and with various state jurisdictions and is no longer subject to examinations for fiscal years before fiscal 2015 with regard to federal income taxes and fiscal 2013 for state income taxes.
Fiscal 2017 compared with fiscal 2016
Consolidated revenues were $41,384,000 and $41,612,000 for fiscal year ended September 30, 2017 and 2016, respectively. This decrease of $228,000 was primarily from the reduction in (i) The Traditional Business’s trustee sale notice and its related service fee revenues of $724,000 and (ii) Journal Technologies’ public service fees of $1,051,000 primarily due to a reduction in the number of traffic tickets processed through Journal Technologies’ products, partially offset by increased Journal Technologies’ license and maintenance fees of $1,279,000 and consulting fees of $391,000. The Company’s revenues derived from Journal Technologies’ operations constituted about 58% and 56% of the Company’s total operating revenues for fiscal 2017 and 2016, respectively.
Consolidated operating expenses increased by $6,299,000 (13%) to $54,551,000 from $48,252,000, primarily resulting from additional personnel costs and services for Journal Technologies. Total personnel costs increased by $4,368,000 (16%) to $31,749,000 from $27,381,000. Outside services increased by $823,000 (22%) to $4,552,000 from $3,729,000 mainly because of increased contractors’ costs for Journal Technologies. Depreciation and amortization costs, which included primarily the amortization of Journal Technologies’ intangible assets of $4,895,000 for both fiscal 2017 and 2016, decreased by $123,000 to $5,586,000 from $5,709,000. Other general and administrative expenses increased by $1,295,000 (14%) to $10,675,000 from $9,380,000 mainly because of increased accounting and legal fees and other hosting service fees for Journal Technologies.
The Company’s non-operating income, net of expenses, increased by $1,437,000 (39%) to $5,099,000 from $3,662,000 primarily because of the interest and penalty expense reversal of $743,000 for uncertain and unrecognized tax benefits and more dividend income, partially offset by increases in the interest rate on the two acquisition margin loans and additional interest expense for the Company’s real estate loan.
During fiscal 2017, consolidated pretax loss was $8,068,000 as compared with $2,978,000 in the prior year. There was a consolidated net loss after tax benefits of $918,000 (-$0.66 per share) for fiscal 2017 as compared with $1,043,000 (-$0.76 per share) in the prior year.
At September 30, 2017, the aggregate fair market value of the Company’s marketable securities was $229,265,000. These securities had approximately $165,872,000 of unrealized gains before taxes of $64,550,000 and generated approximately $4,844,000 in dividends and interest income in fiscal 2017 which lowers the Company’s effective income tax rate because of the dividends received deduction. Most of the unrealized gains were in the common stocks of three U.S. financial institutions and one foreign manufacturer.
Additional details about each of the Company’s reportable segments, and its corporate income and expenses, is set forth below:
|
Overall Financial Results (000) |
||||||||||||||||||||||||||||||||
|
For the twelve months ended September 30 |
||||||||||||||||||||||||||||||||
|
Reportable Segments |
||||||||||||||||||||||||||||||||
|
Traditional Business |
Journal Technologies |
Corporate |
Total |
|||||||||||||||||||||||||||||
|
2017 |
2016 |
2017 |
2016 |
2017 |
2016 |
2017 |
2016 |
|||||||||||||||||||||||||
|
Revenues |
||||||||||||||||||||||||||||||||
|
Advertising |
$ | 9,104 | $ | 9,854 | $ | --- | $ | --- | $ | --- | $ | --- | $ | 9,104 | $ | 9,854 | ||||||||||||||||
|
Circulation |
5,654 | 5,912 | --- | --- | --- | --- | 5,654 | 5,912 | ||||||||||||||||||||||||
|
Advertising service fees and other |
2,812 | 2,651 | --- | --- | --- | --- | 2,812 | 2,651 | ||||||||||||||||||||||||
|
Licensing and maintenance fees |
--- | --- | 16,037 | 14,758 | --- | --- | 16,037 | 14,758 | ||||||||||||||||||||||||
|
Consulting fees |
--- | --- | 4,476 | 4,085 | --- | --- | 4,476 | 4,085 | ||||||||||||||||||||||||
|
Other public service fees |
--- | --- | 3,301 | 4,352 | --- | --- | 3,301 | 4,352 | ||||||||||||||||||||||||
|
Total operating revenues |
17,570 | 18,417 | 23,814 | 23,195 | --- | --- | 41,384 | 41,612 | ||||||||||||||||||||||||
|
Operating expenses |
||||||||||||||||||||||||||||||||
|
Salaries and employee benefits |
10,548 | 9,997 | 21,201 | 17,384 | --- | --- | 31,749 | 27,381 | ||||||||||||||||||||||||
|
Amortization of intangible assets |
--- | 142 | 4,895 | 4,895 | --- | --- | 4,895 | 5,037 | ||||||||||||||||||||||||
|
Others |
7,304 | 7,101 | 10,603 | 8,733 | --- | --- | 17,907 | 15,834 | ||||||||||||||||||||||||
|
Total operating expenses |
17,852 | 17,240 | 36,699 | 31,012 | --- | --- | 54,551 | 48,252 | ||||||||||||||||||||||||
|
(Loss) income from operations |
(282 | ) | 1,177 | (12,885 | ) | (7,817 | ) | --- | --- | (13,167 | ) | (6,640 | ) | |||||||||||||||||||
|
Dividends and interest income |
--- | --- | --- | --- | 4,844 | 4,085 | 4,844 | 4,085 | ||||||||||||||||||||||||
|
Other income |
22 | 52 | --- | --- | 12 | 9 | 34 | 61 | ||||||||||||||||||||||||
|
Interest expenses on note payable collateralized by real estate |
(100 | ) | (88 | ) | --- | --- | --- | --- | (100 | ) | (88 | ) | ||||||||||||||||||||
|
Interest expense on margin loans |
--- | --- | --- | --- | (422 | ) | (284 | ) | (422 | ) | (284 | ) | ||||||||||||||||||||
|
Interest expense reversal (accrual) for uncertain and unrecognized tax benefits |
--- | --- | 743 | (112 | ) | --- | --- | 743 | (112 | ) | ||||||||||||||||||||||
|
Pretax (loss) income |
$ | (360 | ) | $ | 1,141 | $ | (12,142 | ) | $ | (7,929 | ) | $ | 4,434 | $ | 3,810 | $ | (8,068 | ) | $ | (2,978 | ) | |||||||||||
The Traditional Business
The Traditional Business segment’s pretax income decreased by $1,501,000 to a pretax loss of $360,000 from pretax income of $1,141,000.
Advertising revenues decreased by $750,000 to $9,104,000 from $9,854,000, primarily resulting from the declines in trustee sale notice advertising and its related service fee revenues of $724,000.
Trustee sale notices are very much dependent on the number of California and Arizona foreclosures for which public notice advertising is required by law. The number of foreclosure notices published by the Company decreased by 25% during the twelve months ended September 30, 2017 as compared to the prior year. The Company’s smaller newspapers, those other than the Los Angeles and San Francisco Daily Journals (“The Daily Journals”), accounted for about 89% of the total public notice advertising revenues in fiscal 2017. Public notice advertising revenues and related advertising and other service fees constituted about 21% and 23% of the Company’s total operating revenues for fiscal 2017 and 2016, respectively.
The Daily Journals accounted for about 88% of The Traditional Business’ total circulation revenues, which declined by $258,000 to $5,654,000 from $5,912,000. The court rule and judicial profile services generated about 10% of the total circulation revenues, with the other newspapers and services accounting for the balance. Advertising service fees and other are Traditional Business segment revenues, which include primarily (i) agency commissions received from outside newspapers in which the advertising is placed, and (ii) fees generated when filing notices with government agencies.
The Traditional Business segment operating expenses increased by $612,000 (4%) to $17,852,000 from $17,240,000, primarily due to increased personnel costs.
Journal Technologies
Journal Technologies’ business segment pretax loss increased by $4,213,000 (53%) to $12,142,000 from $7,929,000, after recording the interest and penalty expense reversal of $743,000 for uncertain and unrecognized tax benefits in March 2017 and including the amortization costs of intangible assets of $4,895,000 for both fiscal 2017 and 2016.
Revenues increased by $619,000 (3%) to $23,814,000 from $23,195,000 in the prior year. Licensing and maintenance fees increased by $1,279,000 (9%) to $16,037,000 from $14,758,000. Consulting fees also increased by $391,000 (10%) to $4,476,000 from $4,085,000. Other public service fees decreased by $1,051,000 (24%) to $3,301,000 from $4,352,000 primarily due to a reduction in the number of traffic tickets processed online for the public to pay traffic citations.
Operating expenses increased by $5,687,000 (18%) to $36,699,000 from $31,012,000, primarily due to increased personnel costs.
Taxes
At the beginning of fiscal 2017, the Company had a liability for uncertain and unrecognized tax benefits in the amount of $2,723,000 relating to an acquisition in fiscal 2013. During the second quarter of fiscal 2017, the Internal Revenue Service concluded its examination of the Company’s fiscal 2014 income tax return and proposed no changes to the tax position that gave rise to this liability. Consequently, this liability was reversed in March 2017 along with the related accrued interest and penalty expenses of $743,000. In addition, a deferred tax liability, in the amount of $352,000, relating to temporary differences that would only exist if the uncertain tax position was never recognized, was reversed. At September 30, 2016, the liability was approximately $2,723,000, after a reduction of $521,000 resulting from the recognition of deferred revenues and from the amortization of goodwill for tax purposes. During 2016 and 2015, interest expense of approximately $112,000 and $96,000 respectively, was recorded as “interest and penalty expense accrued for uncertain and unrecognized tax benefits”.
During fiscal 2017, the Company recorded an income tax benefit of $7,150,000 on pretax loss of $8,068,000. The effective tax rate (before the discrete item discussed above) was greater than the statutory rate primarily due to the dividends received deduction which increases the loss for tax purposes. On pretax loss of $2,978,000 for fiscal 2016, the Company recorded an income tax benefit of $1,935,000. The effective tax rate was greater than the statutory rate mainly resulting from the dividends received deduction. The Company’s effective tax rate was 89% and 65% for fiscal 2017 and 2016, respectively.
Reportable Segments
The Company’s Traditional Business is one reportable segment and the other is Journal Technologies. Additional details about each of the reportable segments and its corporate income and expenses is set forth below:
|
Reportable Segments |
||||||||||||||||
|
Traditional Business |
Journal Technologies |
Corporate |
Total |
|||||||||||||
|
Fiscal 2018 |
||||||||||||||||
|
Revenues |
||||||||||||||||
|
Advertising, net |
$ | 9,112,000 | $ | --- | $ | --- | $ | 9,112,000 | ||||||||
|
Circulation |
5,401,000 | --- | --- | 5,401,000 | ||||||||||||
|
Advertising service fees and other |
2,659,000 | --- | --- | 2,659,000 | ||||||||||||
|
Licensing and maintenance fees |
--- | 17,225,000 | --- | 17,225,000 | ||||||||||||
|
Consulting fees |
--- | 2,832,000 | --- | 2,832,000 | ||||||||||||
|
Other public service fees |
--- | 3,474,000 | --- | 3,474,000 | ||||||||||||
|
Operating expenses |
16,840,000 | 37,923,000 | --- | 54,763,000 | ||||||||||||
|
Income (loss) from operations |
332,000 | (14,392,000 | ) | --- | (14,060,000 | ) | ||||||||||
|
Dividends and interest income |
--- | --- | 4,808,000 | 4,808,000 | ||||||||||||
|
Other income |
--- | --- | 37,000 | 37,000 | ||||||||||||
|
Interest expense on note payable collateralized by real estate |
(95,000 | ) | --- | --- | (95,000 | ) | ||||||||||
|
Interest expense on margin loans |
--- | --- | (651,000 | ) | (651,000 | ) | ||||||||||
|
Capital gains on sales of marketable Securities and others |
--- | --- | 3,182,000 | 3,182,000 | ||||||||||||
|
Other-than-temporary impairment losses on investments |
--- | --- | (4,560,000 | ) | (4,560,000 | ) | ||||||||||
|
Pretax (loss) income |
237,000 | (14,392,000 | ) | 2,816,000 | (11,339,000 | ) | ||||||||||
|
Income tax benefit |
490,000 | 695,000 | 18,355,000 | 19,540,000 | ||||||||||||
|
Net (loss) income |
727,000 | (13,697,000 | ) | 21,171,000 | 8,201,000 | |||||||||||
|
Total assets |
19,602,000 | 29,885,000 | 214,511,000 | 263,998,000 | ||||||||||||
|
Capital expenditures |
212,000 | --- | --- | 212,000 | ||||||||||||
|
Amortization of intangible assets |
--- | 3,058,000 | --- | 3,058,000 | ||||||||||||
|
Reportable Segments |
||||||||||||||||
|
Traditional Business |
Journal Technologies |
Corporate |
Total |
|||||||||||||
|
Fiscal 2017 |
||||||||||||||||
|
Revenues |
||||||||||||||||
|
Advertising, net |
$ | 9,104,000 | $ | --- | $ | --- | $ | 9,104,000 | ||||||||
|
Circulation |
5,654,000 | --- | --- | 5,654,000 | ||||||||||||
|
Advertising service fees and other |
2,812,000 | --- | --- | 2,812,000 | ||||||||||||
|
Licensing and maintenance fees |
--- | 16,037,000 | --- | 16,037,000 | ||||||||||||
|
Consulting fees |
--- | 4,476,000 | --- | 4,476,000 | ||||||||||||
|
Other public service fees |
--- | 3,301,000 | --- | 3,301,000 | ||||||||||||
|
Operating expenses |
17,852,000 | 36,699,000 | --- | 54,551,000 | ||||||||||||
|
Loss from operations |
(282,000 | ) | (12,885,000 | ) | --- | (13,167,000 | ) | |||||||||
|
Dividends and interest income |
--- | --- | 4,844,000 | 4,844,000 | ||||||||||||
|
Other income |
22,000 | --- | 12,000 | 34,000 | ||||||||||||
|
Interest expense on note payable collateralized by real estate |
(100,000 | ) | --- | --- | (100,000 | ) | ||||||||||
|
Interest expense on margin loans |
--- | --- | (422,000 | ) | (422,000 | ) | ||||||||||
|
Interest and penalty expense reversal for uncertain and unrecognized tax benefits |
--- | 743,000 | --- | 743,000 | ||||||||||||
|
Pretax (loss) income |
(360,000 | ) | (12,142,000 | ) | 4,434,000 | (8,068,000 | ) | |||||||||
|
Income tax benefit (expense) |
(2,000 | ) | 7,910,000 | (758,000 | ) | 7,150,000 | ||||||||||
|
Net (loss) income |
(362,000 | ) | (4,232,000 | ) | 3,676,000 | (918,000 | ) | |||||||||
|
Total assets |
16,606,000 | 33,461,000 | 230,641,000 | 280,708,000 | ||||||||||||
|
Capital expenditures |
160,000 | 93,000 | --- | 253,000 | ||||||||||||
|
Amortization of intangible assets |
--- | 4,895,000 | --- | 4,895,000 | ||||||||||||
|
Reportable Segments |
||||||||||||||||
|
Traditional Business |
Journal Technologies |
Corporate |
Total |
|||||||||||||
|
Fiscal 2016 |
||||||||||||||||
|
Revenues |
||||||||||||||||
|
Advertising, net |
$ | 9,854,000 | $ | --- | $ | --- | $ | 9,854,000 | ||||||||
|
Circulation |
5,912,000 | --- | --- | 5,912,000 | ||||||||||||
|
Advertising service fees and other |
2,651,000 | --- | --- | 2,651,000 | ||||||||||||
|
Licensing and maintenance fees |
--- | 14,758,000 | --- | 14,758,000 | ||||||||||||
|
Consulting fees |
--- | 4,085,000 | --- | 4,085,000 | ||||||||||||
|
Other public service fees |
--- | 4,352,000 | --- | 4,352,000 | ||||||||||||
|
Operating expenses |
17,240,000 | 31,012,000 | --- | 48,252,000 | ||||||||||||
|
Income (loss) from operations |
1,177,000 | (7,817,000 | ) | --- | (6,640,000 | ) | ||||||||||
|
Dividends and interest income |
--- | --- | 4,085,000 | 4,085,000 | ||||||||||||
|
Other income |
52,000 | --- | 9,000 | 61,000 | ||||||||||||
|
Interest expense on note payable collateralized by real estate |
(88,000 | ) | --- | --- | (88,000 | ) | ||||||||||
|
Interest expense on margin loans |
--- | --- | (284,000 | ) | (284,000 | ) | ||||||||||
|
Interest expense accrued for uncertain and unrecognized tax benefits |
--- | (112,000 | ) | --- | (112,000 | ) | ||||||||||
|
Pretax income (loss) |
1,141,000 | (7,929,000 | ) | 3,810,000 | (2,978,000 | ) | ||||||||||
|
Income tax benefit (expense) |
(530,000 | ) | 3,140,000 | (675,000 | ) | 1,935,000 | ||||||||||
|
Net income (loss) |
611,000 | (4,789,000 | ) | 3,135,000 | (1,043,000 | ) | ||||||||||
|
Total assets |
17,644,000 | 39,786,000 | 168,016,000 | 225,446,000 | ||||||||||||
|
Capital expenditures, including purchase of Logan building |
3,662,000 | 117,000 | --- | 3,779,000 | ||||||||||||
|
Amortization of intangible assets |
142,000 | 4,895,000 | --- | 5,037,000 | ||||||||||||
During fiscal 2018, 2017 and 2016, the Traditional Business had total operating revenues of $17,172,000, $17,570,000 and $18,417,000 of which $11,771,000, $11,916,000 and $12,505,000, respectively, were recognized after services were provided while $5,401,000, $5,654,000 and $5,912,000, respectively, were recognized ratably over the subscription terms. Total operating revenues for the Company’s software business were $23,531,000, $23,814,000 and $23,195,000, of which $7,437,000, $8,618,000 and $9,735,000, respectively, were recognized upon completion of services while $16,094,000, $15,196,000 and $13,460,000, respectively, were recognized ratably over the subscription periods.
Approximately 58% of the Company’s revenues during fiscal 2018 were derived from Journal Technologies, as compared with 58% and 56% in the prior two years. In addition, the Company’s revenues have been primarily from the United States, with approximately 1% from foreign countries. Journal Technologies’ revenues are all from governmental agencies.
The following table sets forth certain deferred obligations from October 1, 2017 through September 30, 2018:
|
Beginning Balance |
Addition |
Recognized |
Ending Balance |
|||||||||||||
|
Deferred subscriptions |
$ | 3,284,000 | $ | 5,291,000 | $ | (5,401,000 | ) | $ | 3,174,000 | |||||||
|
Deferred installation contracts |
5,072,000 | 1,445,000 | (3,963,000 | ) | 2,554,000 | |||||||||||
|
Deferred maintenance agreements and others |
10,201,000 | 20,255,000 | (16,094,000 | ) | 14,362,000 | |||||||||||
Disclosure of Contractual Obligations
The following table sets forth certain contractual obligations as of September 30, 2018:
Contractual Obligations (000)
|
Less than 1 year |
1-3 years |
3-5 years |
More than 5 years |
Total |
||||||||||||||||
|
Real estate loan |
$ | 121 | $ | 259 | $ | 285 | $ | 1,291 | $ | 1,956 | ||||||||||
|
Obligations under operating leases |
848 | 350 | --- | --- | 1,198 | |||||||||||||||
|
Long-term accrued liabilities * |
--- | 26 | 16 | 128 | 170 | |||||||||||||||
| $ | 969 | $ | 635 | $ | 301 | $ | 1,419 | $ | 3,324 | |||||||||||
* The long-term accrued liabilities for the Management Incentive Plan are discounted to the present value using a discount rate of 6%.
In addition, during fiscal 2013, the Company borrowed from its investment margin account the aggregate purchase price of $29.5 million for two acquisitions, in each case pledging its marketable securities as collateral. These investment margin account borrowings do not mature. The interest rate for these investment margin account borrowings fluctuates based on the Federal Funds Rate plus 50 basis points with interest only payable monthly. The interest rate as of September 30, 2018 was 2.50%, an increase of .75% in interest rate during fiscal 2018 as compared with 1.75% after the same interest rate increase of .75% during fiscal 2017. During fiscal 2016, there was an interest rate increase of .25%. Prior to fiscal 2016, there had been no change to the interest rate which was at .75% since December 2012.
During the second quarter of fiscal 2017, the prior years’ accrual of liability of approximately $2,723,000 for uncertain and unrecognized tax benefits relating to one of the acquisitions in fiscal 2013 was completely reversed as the Internal Revenue Service concluded its examination of the Company’s fiscal 2014 income tax return and proposed no changes to the tax position that gave rise to this liability.
Liquidity and Capital Resources
During fiscal 2018, the Company’s cash and cash equivalents and marketable security positions decreased by $11,052,000 to $221,597,000 after the sale of the bonds for $8,125,000 with a capital gain of $3,180,000. Cash and cash equivalents were used for the purchase of capital assets of $212,000 and for operating activities of $1,881,000, which included a net decrease of $555,000 in accounts receivable and a net increase of $1,533,000 in deferred subscriptions, deferred installation contracts and deferred maintenance agreements and others.
The investments in marketable securities, which had a market value of about $212,296,000 at September 30, 2018, had approximately $158,407,000 of unrealized gains before estimated taxes of $42,151,000 and generated approximately $4,808,000 in dividends and interest income.
Cash flows from operating activities increased by $770,000 during fiscal 2018 as compared to the prior year primarily resulting from decreases in accounts receivable of $1,206,000 because of more customer payments. The net cash used in operating activities of $1,881,000 included net increases of $1,533,000 in deferred subscriptions, deferred installation contracts and deferred maintenance agreements and others.
As of September 30, 2018, the Company had working capital of $199,971,000, including the liabilities for deferred subscriptions, deferred installation and maintenance agreements and others of $19,914,000, which are scheduled to be earned within one year.
The Company believes that it will be able to fund its operations for the foreseeable future through its cash flows from operations and its current working capital and expects that any such cash flows will be invested in its businesses. The Company may or may not have the ability to borrow against its marketable securities. The Company also may entertain additional business acquisition opportunities. Any excess cash flows could be used to reduce the investment margin account liability or note payable collateralized by real estate or invested as management and the Board of Directors deem appropriate at the time.
Such investments may include additional securities of the companies in which the Company has already invested, securities of other companies, government securities (including U.S. Treasury Notes and Bills) or other instruments. The decision as to particular investments will be driven by the Company’s belief about the risk/reward profile of the various investment choices at the time, and it may utilize government securities as a default if attractive opportunities for a better return are not available. The Company’s Chairman of the Board, Charles Munger, is also the vice chairman of Berkshire Hathaway Inc., which maintains a substantial investment portfolio. The Company’s Board of Directors has utilized his judgment and suggestions, as well as those of J.P. Guerin, the Company’s vice chairman, when selecting investments, and both of them will continue to play an important role in monitoring existing investments and selecting any future investments.
As of September 30, 2018, the investments were concentrated in just six companies. Accordingly, a significant decline in the market value of one or more of the Company’s investments may not be offset by the hypothetically better performance of other investments, and that could result in a large decrease in the Company’s shareholders’ equity and, under certain circumstances, in the recognition of impairment losses in the Company’s income statement (such as the other-than-temporary impairment losses of $4,560,000 recognized during this year).
Critical Accounting Policies and Estimates
The Company’s financial statements and accompanying notes are prepared in accordance with U.S. generally accepted accounting principles. Preparing financial statements requires management to make estimates and assumptions that affect the reported amounts of assets, liabilities, revenues and expenses. These estimates and assumptions are affected by management’s application of accounting policies. Management believes that revenue recognition, accounting for software costs, fair value measurement and disclosures (including for the long-term Incentive Plan liabilities), testing for goodwill impairment, income taxes and segment reporting are critical accounting policies and estimates.
The Company recognizes revenues in accordance with the provisions of ASU No. 2014-09, Revenue from Contracts with Customers (ASC Topic 606). For the Traditional Business, proceeds from the sale of subscriptions for newspapers, court rule books and other publications and other services are recorded as deferred revenue and are included in earned revenue only when the services are provided, generally over the subscription term. Advertising revenues are recognized when advertisements are published and are net of agency commissions.
Journal Technologies contracts may include several products and services, which are generally distinct and include separate transaction pricing and performance obligations. Most are one-transaction contracts. These current subscription-type contract revenues include (i) implementation consulting fees to configure the system to go-live, (ii) subscription software license, maintenance (including updates and upgrades) and support fees, and (iii) third-party hosting fees when used. Revenues for consulting are recognized at point of delivery (go-live) upon completion of services, and subscription and advertising revenues are recognized ratably (using the output method based on time-elapsed). These contracts include assurance warranty provisions for limited periods and do not include financing terms. For some contracts, the Company acts as a principal with respect to certain services, such as data conversion, interfaces and hosting that are provided by third-parties, and recognizes such revenues on a gross basis. For legacy contracts with perpetual license arrangements, licenses and consulting services are recognized at point of delivery (go-live), and maintenance revenues are recognized ratably after the go-live. Other public service fees are earned and recognized as revenues when the Company processes credit card payments on behalf of the courts via its websites through which the public can efile cases and pay traffic citations and other fees.
ASC 985-20, Accounting for the Costs of Computer Software to be Sold, Leased, or Otherwise Marketed, provides that costs related to the research and development of a new software product are to be expensed as incurred until the technological feasibility of the product is established. Accordingly, costs related to the development of new software products are expensed as incurred until technological feasibility has been established, at which time such costs are capitalized, subject to expected recoverability. In general, “technological feasibility” is achieved when the developer has established the necessary skills, hardware and technology to produce a product and a detailed program design has been (i) completed, (ii) traced to the product specifications and (iii) reviewed for high-risk development issues. The Company believes its process for developing software is essentially completed concurrent with the establishment of technological feasibility, and accordingly, no software development costs have been capitalized to date.
ASC 820, Fair Value Measurement and Disclosures, requires the Company to (i) disclose the amounts of transfers in and out of Level 1 and Level 2 fair value measurements and the reasons for the transfers and (ii) present separately information about purchases, sales, issuances and settlements in the reconciliation of Level 3 measurements. This guidance also provides clarification of existing disclosures requiring the Company to determine each class of its investments based on risk and to disclose the valuation techniques and inputs used to measure fair value for both Level 2 and Level 3 measurements. The Company made no transfers in and out of Level 1 and Level 2 measurements in fiscal years 2018, 2017 and 2016. During that time all of the Company’s investments have been quoted on public markets and, therefore, all fair value calculations have been based on Level 1 measurements. The estimated Incentive Plan’s future commitment is calculated based on an average of the prior year (fiscal 2017) and the current year’s pretax earnings before certain items, discounted to the present value at 6% since each granted Incentive Plan Unit will expire over its remaining life term of up to 10 years.
The Company analyzes goodwill for possible impairment under ASC 350, Intangibles – Goodwill and Other, annually or whenever events or changes in circumstances indicate that the value may not be recoverable. Considered factors for potential goodwill impairment evaluation for the reporting units include current year’s business profitability before intangible amortization, fluctuations of revenues, changes in the market place, the status of installation contracts and new business, among other things. In addition, ASC 2011-08, Testing Goodwill for Impairment, allows for the option of performing a qualitative assessment before calculating the fair value of a reporting unit. If it is determined based on qualitative factors that there is no impairment to goodwill, then the fair value of a reporting unit is not needed. If a quantitative analysis is required and the unit’s carrying amount exceeds its fair value, then the second step is performed to measure the amount of potential impairment. The Company’s annual goodwill impairment analysis in 2018 did not result in an impairment charge based on the qualitative assessment using the above-mentioned considered factors for potential goodwill impairment.
ASC 740, Income Taxes, establishes financial accounting and reporting standards for the effect of income taxes. The objectives of accounting for income taxes are to recognize the amount of taxes payable or refundable for the current year and the deferred tax liabilities and assets for the future tax consequences of events that have been recognized in the financial statements or tax returns. This accounting guidance also prescribes recognition thresholds and measurement attributes for the financial statements recognition and measurement of a tax position taken or expected to be taken in a tax return. Judgment is required in assessing the future tax consequences of events that have been recognized in the Company’s financial statements or tax returns. Fluctuations in the actual outcome of these future tax consequences could materially impact the Company’s financial position or its results of operations and its deferred tax liabilities related to the unrealized net gains on investments. See Note 3 of Notes to Consolidated Financial Statements for further discussion.
ASC 280-10, Segment Reporting, defines an operating segment as a component of a public entity that has discrete financial information that is evaluated regularly by the Company’s Chief Executive Officer to decide how to allocate resources and to assess performance. In accordance with ASC 280-10, the Company has two reportable business segments which are: (i) The Traditional Business and (ii) Journal Technologies.
The above discussion and analysis should be read in conjunction with the consolidated financial statements and the notes thereto included in this report.
Item 7A. Qualitative and Quantitative Disclosures about Market Risk
During fiscal 2013, the Company borrowed from its investment margin account the aggregate purchase price of $29.5 million for two acquisitions, in each case pledging its marketable securities as collateral. The interest rate for these investment margin account borrowings fluctuates based on the Federal Funds Rate plus 50 basis points with interest only payable monthly. The interest rate as of September 30, 2018 was 2.50%, an increase of .75% in interest rate during fiscal 2018 as compared with 1.75% after the same interest rate increase of .75% during fiscal 2017. During fiscal 2016, there was an interest rate increase of .25%. Prior to fiscal 2016, there had been no change to the interest rate which was at .75% since December 2012. The Company was not subject to any significant interest rate risk during such period.
Foreign Currency Risk
The Company holds foreign marketable securities based in the South Korean Won and Hong Kong Dollar that are subject to risk associated with changes in the exchange rates of these currencies against the United States Dollar. The fair value of the foreign marketable security held in South Korean Won was $10,249,000 with an adjusted cost of $10,249,000 (after the other-than-temporary impairment losses of $4,560,000) and $11,724,000 with an adjusted cost of $14,810,000 as of September 30, 2018 and 2017, respectively. The exchange rate of the South Korean Won against the United States Dollar was $0.00090 and $0.00087 at September 30, 2018 and 2017, respectively. The fair value of the foreign marketable security held in Hong Kong Dollars was $42,587,000 with an adjusted cost of $14,710,000 and $55,000,000 with an adjusted cost of $14,710,000 as of September 30, 2018 and 2017, respectively. The exchange rate of the Hong Kong Dollar against the United States Dollar was $0.12780 and $0.12803 at September 30, 2018 and 2017, respectively.
Equity Price Risk
The Company owns marketable securities and is subject to equity price risk. The following table summarizes our equity securities with significant equity price risk as of September 30, 2018 and 2017. The effects of a hypothetical 30% increase and a 30% decrease in market prices as of those dates are also shown. The selected 30% hypothetical changes do not reflect what could be considered the best or worst case scenarios. Indeed, results could be far better or worse due both to the nature of equity markets and the aforementioned concentration in our equity investment portfolio.
Equity Price Risk (000)
|
Fair Value |
Hypothetical Price Change |
Estimated Fair Value after Hypothetical Change in Prices |
Hypothetical Percentage Increase (Decrease) in Shareholders’ Equity |
|||||||||||
|
September 30, 2018 |
||||||||||||||
|
Equity securities |
$ | 212,296 | 30% increase | $ | 275,985 | 39% increase | ||||||||
| 30% decrease | 148,607 | 39% decrease | ||||||||||||
|
September 30, 2017 |
||||||||||||||
|
Equity securities |
$ | 220,973 | 30% increase | $ | 287,265 | 41% increase | ||||||||
| 30% decrease | 154,681 | 41% decrease | ||||||||||||
Item 8. Financial Statements and Supplementary Data
Report of Independent Registered Public Accounting Firm
To The Board of Directors and Shareholders of Daily Journal Corporation
Opinion on the Financial Statements
We have audited the accompanying consolidated balance sheets of Daily Journal Corporation (the Company) as of September 30, 2018 and 2017, the related consolidated statements of comprehensive income (loss), shareholders' equity and cash flows for each of the three years in the period ended September 30, 2018, and the related notes to the consolidated financial statements (collectively, the financial statements). In our opinion, the financial statements present fairly, in all material respects, the financial position of the Company as of September 30, 2018 and 2017, and the results of its operations and its cash flows for each of the three years in the period ended September 30, 2018, in conformity with accounting principles generally accepted in the United States of America.
We have also audited, in accordance with the standards of the Public Company Accounting Oversight Board (United States) (PCAOB), the Company's internal control over financial reporting as of September 30, 2018, based on criteria established in Internal Control — Integrated Framework issued by the Committee of Sponsoring Organizations of the Treadway Commission in 2013. Our report dated December 12, 2018 expressed an opinion that the Company had not maintained effective internal control over financial reporting as of September 30, 2018, based on criteria established in Internal Control — Integrated Framework issued by the Committee of Sponsoring Organizations of the Treadway Commission in 2013.
Basis for Opinion
These financial statements are the responsibility of the Company’s management. Our responsibility is to express an opinion on the Company’s financial statements based on our audits. We are a public accounting firm registered with the PCAOB and are required to be independent with respect to the Company in accordance with U.S. federal securities laws and the applicable rules and regulations of the Securities and Exchange Commission and the PCAOB.
We conducted our audits in accordance with the standards of the PCAOB. Those standards require that we plan and perform the audits to obtain reasonable assurance about whether the financial statements are free of material misstatement, whether due to error or fraud. Our audits included performing procedures to assess the risks of material misstatement of the financial statements, whether due to error or fraud, and performing procedures that respond to those risks. Such procedures included examining, on a test basis, evidence regarding the amounts and disclosures in the financial statements. Our audits also included evaluating the accounting principles used and significant estimates made by management, as well as evaluating the overall presentation of the financial statements. We believe that our audits provide a reasonable basis for our opinion.
\s\ Squar Milner LLP
We have served as the Company's auditor since 2016.
Los Angeles, California
December 12, 2018
DAILY JOURNAL CORPORATION
CONSOLIDATED BALANCE SHEETS
|
September 30 |
September 30 |
|||||||
|
2018 |
2017 |
|||||||
|
ASSETS |
||||||||
|
Current assets |
||||||||
|
Cash and cash equivalents |
$ | 9,301,000 | $ | 3,384,000 | ||||
|
Marketable securities at fair value, including common stocks of $212,296,000 and bonds of $0 at September 30, 2018 and common stocks of $220,973,000 and bonds of $8,292,000 at September 30, 2017 |
212,296,000 | 229,265,000 | ||||||
|
Accounts receivable, less allowance for doubtful accounts of $200,000 at September 30, 2018 and September 30, 2017 |
4,803,000 | 5,358,000 | ||||||
|
Inventories |
46,000 | 40,000 | ||||||
|
Prepaid expenses and other current assets |
512,000 | 798,000 | ||||||
|
Income tax receivable |
270,000 | 909,000 | ||||||
|
Total current assets |
227,228,000 | 239,754,000 | ||||||
|
Property, plant and equipment, at cost |
||||||||
|
Land, buildings and improvements |
16,422,000 | 16,396,000 | ||||||
|
Furniture, office equipment and computer software |
2,877,000 | 2,724,000 | ||||||
|
Machinery and equipment |
1,749,000 | 1,799,000 | ||||||
| 21,048,000 | 20,919,000 | |||||||
|
Less accumulated depreciation |
(9,828,000 | ) | (9,292,000 | ) | ||||
| 11,220,000 | 11,627,000 | |||||||
|
Intangibles, net |
--- | 3,058,000 | ||||||
|
Goodwill |
13,400,000 | 13,400,000 | ||||||
|
Deferred income taxes - Federal |
9,269,000 | 10,652,000 | ||||||
|
Deferred income taxes - State |
2,881,000 | 2,217,000 | ||||||
| $ | 263,998,000 | $ | 280,708,000 | |||||
|
LIABILITIES AND SHAREHOLDERS' EQUITY |
||||||||
|
Current liabilities |
||||||||
|
Accounts payable |
$ | 2,820,000 | $ | 3,049,000 | ||||
|
Accrued liabilities |
4,402,000 | 3,112,000 | ||||||
|
Note payable collateralized by real estate |
121,000 | 115,000 | ||||||
|
Deferred subscriptions |
3,174,000 | 3,284,000 | ||||||
|
Deferred installation contracts |
2,554,000 | 5,072,000 | ||||||
|
Deferred maintenance agreements and others |
14,186,000 | 9,442,000 | ||||||
|
Total current liabilities |
27,257,000 | 24,074,000 | ||||||
|
Long term liabilities |
||||||||
|
Investment margin account borrowings |
29,493,000 | 29,493,000 | ||||||
|
Note payable collateralized by real estate |
1,835,000 | 1,956,000 | ||||||
|
Deferred maintenance agreements |
176,000 | 759,000 | ||||||
|
Accrued liabilities |
170,000 | 135,000 | ||||||
|
Deferred income taxes |
42,151,000 | 64,550,000 | ||||||
|
Total long term liabilities |
73,825,000 | 96,893,000 | ||||||
|
Commitments and contingencies (Notes 4 and 5) |
--- | --- | ||||||
|
Shareholders' equity |
||||||||
|
Preferred stock, $.01 par value, 5,000,000 shares authorized and no shares issued |
--- | --- | ||||||
|
Common stock, $.01 par value, 5,000,000 shares authorized; 1,805,053 shares issued, including 424,307 treasury shares, at September 30, 2018 and September 30, 2017 |
14,000 | 14,000 | ||||||
|
Additional paid-in capital |
1,755,000 | 1,755,000 | ||||||
|
Retained earnings |
45,361,000 | 57,150,000 | ||||||
|
Accumulated other comprehensive income |
115,786,000 | 100,822,000 | ||||||
|
Total shareholders' equity |
162,916,000 | 159,741,000 | ||||||
| $ | 263,998,000 | $ | 280,708,000 | |||||
See accompanying Notes to Consolidated Financial Statements
DAILY JOURNAL CORPORATION
CONSOLIDATED STATEMENTS OF COMPREHENSIVE INCOME (LOSS)
|
2018 |
2017 |
2016 |
||||||||||
|
Revenues |
||||||||||||
|
Advertising, net |
$ | 9,112,000 | $ | 9,104,000 | $ | 9,854,000 | ||||||
|
Circulation |
5,401,000 | 5,654,000 | 5,912,000 | |||||||||
|
Advertising service fees and other |
2,659,000 | 2,812,000 | 2,651,000 | |||||||||
|
Licensing and maintenance fees |
17,225,000 | 16,037,000 | 14,758,000 | |||||||||
|
Consulting fees |
2,832,000 | 4,476,000 | 4,085,000 | |||||||||
|
Other public service fees |
3,474,000 | 3,301,000 | 4,352,000 | |||||||||
| 40,703,000 | 41,384,000 | 41,612,000 | ||||||||||
|
Costs and expenses |
||||||||||||
|
Salaries and employee benefits |
33,832,000 | 31,749,000 | 27,381,000 | |||||||||
|
Outside services |
4,287,000 | 4,552,000 | 3,729,000 | |||||||||
|
Postage and delivery expenses |
857,000 | 1,112,000 | 1,141,000 | |||||||||
|
Newsprint and printing expenses |
780,000 | 877,000 | 912,000 | |||||||||
|
Depreciation and amortization |
3,678,000 | 5,586,000 | 5,709,000 | |||||||||
|
Other general and administrative expenses |
11,329,000 | 10,675,000 | 9,380,000 | |||||||||
| 54,763,000 | 54,551,000 | 48,252,000 | ||||||||||
|
Loss from operations |
(14,060,000 | ) | (13,167,000 | ) | (6,640,000 | ) | ||||||
|
Other income (expenses) |
||||||||||||
|
Dividends and interest income |
4,808,000 | 4,844,000 | 4,085,000 | |||||||||
|
Other income |
37,000 | 34,000 | 61,000 | |||||||||
|
Interest expense on note payable collateralized by real estate |
(95,000 | ) | (100,000 | ) | (88,000 | ) | ||||||
|
Interest expense on margin loans |
(651,000 | ) | (422,000 | ) | (284,000 | ) | ||||||
|
Interest and penalty expense reversal (accrual) for uncertain and unrecognized tax benefits |
--- | 743,000 | (112,000 | ) | ||||||||
|
Capital gains on sales of marketable securities and others |
3,182,000 | --- | --- | |||||||||
|
Other-than-temporary impairment losses on investments |
(4,560,000 | ) | --- | --- | ||||||||
|
Loss before taxes |
(11,339,000 | ) | (8,068,000 | ) | (2,978,000 | ) | ||||||
|
Benefit from income taxes |
19,540,000 | 7,150,000 | 1,935,000 | |||||||||
|
Net income (loss) |
$ | 8,201,000 | $ | (918,000 | ) | $ | (1,043,000 | ) | ||||
|
Weighted average number of common shares outstanding – basic and diluted |
1,380,746 | 1,380,746 | 1,380,746 | |||||||||
|
Basic and diluted net (loss) income per share |
$ | 5.94 | $ | (0.66 | ) | $ | (0.76 | ) | ||||
|
Comprehensive income (loss) |
||||||||||||
|
Net income (loss) |
$ | 8,201,000 | $ | (918,000 | ) | $ | (1,043,000 | ) | ||||
|
Net change in unrealized appreciation of investments (net of tax benefits of $1,258,000 for fiscal 2018; net of taxes of $22,300,000 for fiscal 2017, and net of tax benefits of $1,028,000 for fiscal 2016) |
(5,823,000 | ) | 35,316,000 | (2,214,000 | ) | |||||||
|
Reclassification adjustment of other-than-temporary impairment losses recognized in net income (net of taxes of $1,210,000, $0 and $0 for fiscal 2018, 2017 and 2016, respectively) |
3,350,000 | --- | --- | |||||||||
| $ | 5,728,000 | $ | 34,398,000 | $ | (3,257,000 | ) | ||||||
See accompanying Notes to Consolidated Financial Statements
DAILY JOURNAL CORPORATION
CONSOLIDATED STATEMENTS OF SHAREHOLDERS’ EQUITY
|
Accumulated |
||||||||||||||||||||||||||||||||
|
Additional |
Other |
Total |
||||||||||||||||||||||||||||||
|
Common Stock |
Treasury Stock |
Paid-in |
Retained |
Comprehensive |
Shareholders' |
|||||||||||||||||||||||||||
|
Share |
Amount |
Share |
Amount |
Capital |
Earnings |
Income |
Equity |
|||||||||||||||||||||||||
|
Balance at September 30, 2015 |
1,805,053 | $ | 18,000 | (424,307 | ) | $ | (4,000 | ) | $ | 1,755,000 | $ | 59,111,000 | $ | 67,720,000 | $ | 128,600,000 | ||||||||||||||||
|
Net loss |
--- | --- | --- | --- | --- | (1,043,000 | ) | --- | (1,043,000 | ) | ||||||||||||||||||||||
|
Unrealized losses on investments, net |
--- | --- | --- | --- | --- | --- | (2,214,000 | ) | (2,214,000 | ) | ||||||||||||||||||||||
|
Balance at September 30, 2016 |
1,805,053 | 18,000 | (424,307 | ) | (4,000 | ) | 1,755,000 | 58,068,000 | 65,506,000 | 125,343,000 | ||||||||||||||||||||||
|
Net loss |
--- | --- | --- | --- | --- | (918,000 | ) | --- | (918,000 | ) | ||||||||||||||||||||||
|
Unrealized gains on investments, net |
--- | --- | --- | --- | --- | --- | 35,316,000 | 35,316,000 | ||||||||||||||||||||||||
|
Balance at September 30, 2017 |
1,805,053 | 18,000 | (424,307 | ) | (4,000 | ) | 1,755,000 | 57,150,000 | 100,822,000 | 159,741,000 | ||||||||||||||||||||||
|
Net income |
--- | --- | --- | --- | --- | 8,201,000 | --- | 8,201,000 | ||||||||||||||||||||||||
|
Unrealized losses on investments, net |
--- | --- | --- | --- | --- | --- | (5,823,000 | ) | (5,823,000 | ) | ||||||||||||||||||||||
|
Sale of bond investments (net of taxes) |
--- | --- | --- | --- | --- | --- | (2,553,000 | ) | (2,553,000 | ) | ||||||||||||||||||||||
|
Reclassification of stranded tax effects |
--- | --- | --- | --- | --- | (19,990,000 | ) | 19,990,000 | --- | |||||||||||||||||||||||
|
Reclassification adjustment of other-than-temporary impairment losses recognized in net income (net of taxes) |
--- | --- | --- | --- | --- | --- | 3,350,000 | 3,350,000 | ||||||||||||||||||||||||
|
Balance at September 30, 2018 |
1,805,053 | $ | 18,000 | (424,307 | ) | $ | (4,000 | ) | $ | 1,755,000 | $ | 45,361,000 | $ | 115,786,000 | $ | 162,916,000 | ||||||||||||||||
See accompanying Notes to Consolidated Financial Statements
DAILY JOURNAL CORPORATION
CONSOLIDATED STATEMENTS OF CASH FLOWS
|
2018 |
2017 |
2016 |
||||||||||
|
Cash flows from operating activities |
||||||||||||
|
Net (loss) income |
$ | 8,201,000 | $ | (918,000 | ) | $ | (1,043,000 | ) | ||||
|
Adjustments to reconcile net (loss) income to net cash (used in) provided by operating activities |
||||||||||||
|
Depreciation and amortization |
3,678,000 | 5,586,000 | 5,709,000 | |||||||||
|
Gains on sales of marketable securities |
(3,182,000 | ) | --- | --- | ||||||||
|
Deferred income taxes |
(19,241,000 | ) | (4,574,000 | ) | (1,637,000 | ) | ||||||
|
Discount earned on bonds |
--- | (3,000 | ) | (3,000 | ) | |||||||
|
Other-than-temporary impairment losses on investments |
4,560,000 | --- | --- | |||||||||
|
Changes in assets and liabilities |
||||||||||||
|
(Increase) decrease in current assets |
||||||||||||
|
Accounts receivable, net |
555,000 | (651,000 | ) | 966,000 | ||||||||
|
Inventories |
(6,000 | ) | 1,000 | 7,000 | ||||||||
|
Prepaid expenses and other assets |
286,000 | 2,000 | (116,000 | ) | ||||||||
|
Income tax receivable |
639,000 | (19,000 | ) | (125,000 | ) | |||||||
|
Increase (decrease) in liabilities |
||||||||||||
|
Accounts payable |
(229,000 | ) | 405,000 | (1,568,000 | ) | |||||||
|
Accrued liabilities |
1,325,000 | (143,000 | ) | (209,000 | ) | |||||||
|
Income taxes |
--- | (2,723,000 | ) | (268,000 | ) | |||||||
|
Deferred subscription |
(110,000 | ) | (118,000 | ) | (72,000 | ) | ||||||
|
Deferred installation contracts |
(2,518,000 | ) | (2,268,000 | ) | (1,284,000 | ) | ||||||
|
Deferred maintenance agreements and others |
4,161,000 | 2,772,000 | 867,000 | |||||||||
|
Net cash (used in) provided by operating activities |
(1,881,000 | ) | (2,651,000 | ) | 1,224,000 | |||||||
|
Cash flows from investing activities |
||||||||||||
|
Sales of marketable securities |
8,125,000 | --- | --- | |||||||||
|
Purchases of marketable securities |
--- | (5,013,000 | ) | (3,832,000 | ) | |||||||
|
Purchases of property, plant and equipment, including the Logan Utah office building in fiscal 2016 |
(212,000 | ) | (253,000 | ) | (3,779,000 | ) | ||||||
|
Net cash provided by (used in) investing activities |
7,913,000 | (5,266,000 | ) | (7,611,000 | ) | |||||||
|
Cash flows from financing activities |
||||||||||||
|
Note payable collateralized by real estate |
--- | --- | 2,260,000 | |||||||||
|
Payment of loan principal |
(115,000 | ) | (110,000 | ) | (79,000 | ) | ||||||
|
Net cash (used in) provided by financing activities |
(115,000 | ) | (110,000 | ) | 2,181,000 | |||||||
|
Increase (decrease) in cash and cash equivalents |
5,917,000 | (8,027,000 | ) | (4,206,000 | ) | |||||||
|
Cash and cash equivalents |
||||||||||||
|
Beginning of year |
3,384,000 | 11,411,000 | 15,617,000 | |||||||||
|
End of year |
$ | 9,301,000 | $ | 3,384,000 | $ | 11,411,000 | ||||||
|
Interest paid during year |
$ | 736,000 | $ | 516,000 | $ | 361,000 | ||||||
|
Income taxes refunded during year |
$ | (1,077,000 | ) | $ | (3,000 | ) | $ | (13,000 | ) | |||
See accompanying Notes to Consolidated Financial Statements
DAILY JOURNAL CORPORATION
NOTES TO CONSOLIDATED FINANCIAL STATEMENTS
1. THE COMPANY AND OPERATIONS
Daily Journal Corporation (“Daily Journal”) publishes newspapers and web sites covering California and Arizona and produces several specialized information services. It also serves as a newspaper representative specializing in public notice advertising.
Journal Technologies, Inc. (“Journal Technologies”), a wholly-owned subsidiary, includes as of October 1, 2014, the combined operations of Sustain Technologies, Inc. (“Sustain”), a wholly-owned subsidiary since 2008; New Dawn Technologies, Inc. (“New Dawn”), acquired in December 2012; and ISD Technologies, Inc. (“ISD”), acquired in September 2013. Journal Technologies supplies case management software systems and related products to courts, prosecutor and public defender offices, probation departments and other justice agencies, including administrative law organizations, city and county governments and bar associations. These organizations use the Journal Technologies family of products to help manage cases and information electronically, to interface with other critical justice partners and to extend electronic services to the public, including efiling and a website to pay traffic citations online, and bar members. These products are licensed to more than 500 organizations in 42 states and internationally.
Essentially all of the operations of Daily Journal and Journal Technologies are based in California, Arizona, Colorado and Utah.
2. SUMMARY OF SIGNIFICANT ACCOUNTING POLICIES
Basis of Presentation: The consolidated financial statements include the accounts of the Daily Journal and Journal Technologies (collectively the “Company”). All intercompany accounts and transactions have been eliminated in consolidation.
Certain reclassifications of previously reported amounts have been made to conform to the current year’s presentation.
Concentrations of Credit Risk: The Company extends unsecured credit to most of its advertising customers. The Company recognizes that extending credit and setting appropriate reserves for receivables is largely a subjective decision based on knowledge of the customer and the industry. Credit limits, setting and maintaining credit standards, and managing the overall quality of the credit portfolio is largely centralized. The level of credit is influenced by the customer’s credit and payment history which the Company monitors when establishing a reserve.
The Company maintains the reserve account for estimated losses resulting from the inability of its customers to make required payments. If the financial condition of its customers were to deteriorate or its judgments about their abilities to pay are incorrect, additional allowances might be required and its results of operations could be materially affected.
Cash Equivalents: The Company considers all highly liquid investments with original maturities of three months or less to be cash equivalents.
Fair Value of Financial Instruments: The carrying amounts of cash, accounts receivable and accounts payable approximate fair value because of their short maturities. In addition, the Company has investments in marketable securities, all categorized as “available-for-sale” and stated at fair market value, with the unrealized gains and losses, net of taxes, reported in “Accumulated other comprehensive income” (AOCI) in the accompanying consolidated balance sheets. The unrealized gains and losses included in AOCI represent changes in the fair value of the investments due to changes in both market prices and foreign currency exchange rates. The Company uses quoted prices in active markets for identical assets (consistent with the Level 1 definition in the fair value hierarchy) to measure the fair value of its investments on a recurring basis pursuant to Accounting Standards Codification (“ASC”) Topic 820, Fair Value Measurement and Disclosures. At September 30, 2018, the aggregate fair market value of the Company’s marketable securities was $212,296,000. These investments had approximately $158,407,000 of net unrealized gains before taxes of $42,151,000. Most of the unrealized net gains were in the common stocks of three U.S. financial institutions. At September 30, 2017, the Company had marketable securities at fair market value of approximately $229,265,000, including approximately $165,872,000 of unrealized net gains before taxes of $64,550,000.
All investments are classified as “Current assets” because they are available for sale at any time. In February 2018, the Company sold its bond investments for $8,125,000, realizing a gain of approximately $3,180,000, and simultaneously reclassified a previously lodged tax effect of $30,000 from accumulated other comprehensive income to retained earnings. This represented a decrease to retained earnings and an increase to accumulated other comprehensive income. (The Company uses an “individual security approach” to release stranded tax effects for its available-for-sale securities when sold or extinguished.)
Investment in Financial Instruments
|
September 30, 2018 |
September 30, 2017 |
|||||||||||||||||||||||
|
Aggregate fair value |
Amortized/ Adjusted cost basis |
Pretax unrealized gains |
Aggregate fair value |
Amortized/ Adjusted cost basis |
Pretax unrealized gains |
|||||||||||||||||||
|
Marketable securities |
||||||||||||||||||||||||
|
Common stocks |
$ | 212,296,000 | $ | 53,889,000 | $ | 158,407,000 | $ | 220,973,000 | $ | 58,449,000 | $ | 162,524,000 | ||||||||||||
|
Bonds |
--- | --- | --- | 8,292,000 | 4,944,000 | 3,348,000 | ||||||||||||||||||
| $ | 212,296,000 | $ | 53,889,000 | $ | 158,407,000 | $ | 229,265,000 | $ | 63,393,000 | $ | 165,872,000 | |||||||||||||
The Company performed separate evaluations for equity securities with a fair value at September 30, 2018 and 2017 below cost to determine if the unrealized losses were other-than-temporary. This evaluation considered a number of factors including, but not limited to, the financial condition and near term prospects of the issuer, the Company’s ability and intent to hold the securities until fair value recovers, and the length of time and extent to which the fair value had been less than cost. The assessment of the ability and intent to hold these securities to recovery focuses on liquidity needs, asset/liability management and portfolio objectives. As of September 30, 2018, the Company concluded that the unrealized losses related to the marketable securities of one issuer were other-than-temporary and thus recorded impairment losses of $4,560,000 ($3,350,000 net of taxes). U.S. GAAP requires that the Company recognize other-than-temporary impairment losses in earnings rather than in accumulated comprehensive income when the security prices remain below cost for a period of time that may be deemed excessive even in instances where the Company possesses the ability and intent to hold the security. In fiscal 2017, there were no other-than-temporary impairment losses related to the marketable securities.
Intangible Assets: At September 30, 2018 and 2017, intangible assets were composed of (i) customer relationships of $0 and $2,776,000 (net of the accumulated amortization expenses of $21,950,000 and $19,174,000), respectively, and (ii) developed technology of $0 and $282,000 (net of accumulated amortization expenses of $2,525,000 and $2,243,000), respectively. These intangible assets were being amortized over five years based on their estimated useful lives. All intangible assets became fully amortized as of September 30, 2018. Intangible amortization expense was $3,058,000, $4,895,000 and $5,037,000 for fiscal 2018, 2017 and 2016, respectively.
Intangible Assets
|
September 30, 2018 |
September 30, 2017 |
|||||||||||||||||||||||
|
Customer Relationships |
Developed Technology |
Total |
Customer Relationships |
Developed Technology |
Total |
|||||||||||||||||||
|
Gross intangible |
$ | 21,950,000 | $ | 2,525,000 | $ | 24,475,000 | $ | 21,950,000 | $ | 2,525,000 | $ | 24,475,000 | ||||||||||||
|
Accumulated amortization |
(21,950,000 | ) | (2,525,000 | ) | (24,475,000 | ) | (19,174,000 | ) | (2,243,000 | ) | (21,417,000 | ) | ||||||||||||
| $ | --- | $ | --- | $ | --- | $ | 2,776,000 | $ | 282,000 | $ | 3,058,000 | |||||||||||||
Goodwill: The Company accounts for goodwill in accordance with ASC 350, Intangibles — Goodwill and Other. Goodwill is not amortized for financial statement purposes but evaluated for impairment annually, or whenever events or changes in circumstances indicate that the value may not be recoverable. The goodwill amount reported in the consolidated balance sheets relates only to Journal Technologies. The Company performed qualitative assessments for Journal Technologies and determined there were no substantive changes during the current year and no indication of impairment. In making this assessment, the Company only considered Journal Technologies’ assets and their revenue generating abilities as required by ASC 350. Goodwill represents the expected synergies in expanding the Company’s software business. Considered factors for potential goodwill impairment evaluation include the current year’s operating financial results before intangible amortization, fluctuations of revenues, changes in the market place, the status of installation contracts and new business, among other things. As of September 30, 2018 and 2017, there was goodwill of $13,400,000.
Prepaid Expenses and Other Current Assets: Included in other assets were in-progress installation service costs of $0 and $350,000 as of September 30, 2018 and 2017, respectively, for the legacy projects from the fiscal 2013 acquisitions for which revenues had not been recognized and were deferred.
Inventories: Inventories, comprised of newsprint and paper, are stated at cost, on a first-in, first-out basis, which does not exceed current net realizable value.
Property, plant and equipment: Property, plant and equipment are carried on the basis of cost or fair value for assets acquired in business combinations. Depreciation of assets is provided in amounts sufficient to depreciate the cost of related assets over their estimated useful lives ranging from 3 – 39 years. At September 30, 2018, the estimated useful lives were (i) 5 – 39 years for building and improvements, (ii) 3 – 5 years for furniture, office equipment and software, and (iii) 3 – 10 years for machinery and equipment. Leasehold improvements are amortized over the term of the related leases or the useful life of the assets, whichever is shorter. Assets are depreciated using the straight-line method for financial statements and accelerated method for tax purposes. Depreciation and amortization expenses were $620,000, $691,000 and $672,000 for fiscal 2018, 2017 and 2016, respectively.
Significant expenditures which extend the useful lives of existing assets are capitalized. Maintenance and repair costs are expensed as incurred. Gains or losses on dispositions of assets are reflected in current earnings.
Impairment of Long-Lived Assets: The Company evaluates long-lived assets for impairment whenever events or changes in circumstances indicate that the carrying value of an asset may not be recoverable. There were no such impairments identified during fiscal 2018 and 2017.
Journal Technologies’ Software Development Costs: Development costs related to software products for sale or licensing are expensed as incurred until the technological feasibility of the product has been established. Thereafter, until the product is released for sale, software development costs are capitalized and reported at the lower of unamortized cost or net realizable value of the related product. The establishment of technological feasibility and the ongoing assessment of recoverability of costs require considerable judgment by the Company with respect to certain internal and external factors, including, but not limited to, anticipated future product revenue, estimated economic life and changes in hardware and software technology.
The Company believes its process for developing software is essentially completed concurrent with the establishment of technological feasibility, and accordingly, no software development costs have been capitalized to date.
Revenue Recognition:
The Company recognizes revenues in accordance with the provisions of ASU No. 2014-09, Revenue from Contracts with Customers (ASC Topic 606), which it adopted effective October 1, 2017, using the modified retrospective method. (See “Accounting Standards Adopted in Fiscal 2018 ”.)
For the Traditional Business, proceeds from the sale of subscriptions for newspapers, court rule books and other publications and other services are recorded as deferred revenue and are included in earned revenue only when the services are provided, generally over the subscription term. Advertising revenues are recognized when advertisements are published and are net of agency commissions.
Journal Technologies contracts may include several products and services, which are generally distinct and include separate transaction pricing and performance obligations. Most are one-transaction contracts. These current subscription-type contract revenues include (i) implementation consulting fees to configure the system to go-live, (ii) subscription software license, maintenance (including updates and upgrades) and support fees, and (iii) third-party hosting fees when used. Revenues for consulting are recognized at point of delivery (go-live) upon completion of services, and subscription and advertising revenues are recognized ratably (using the output method based on time-elapsed) after the go-live. These contracts include assurance warranty provisions for limited periods and do not include financing terms. For some contracts, the Company acts as a principal with respect to certain services, such as data conversion, interfaces and hosting that are provided by third-parties, and recognizes such revenues on a gross basis. For legacy contracts with perpetual license arrangements, licenses and consulting services are recognized at point of delivery (go-live), and maintenance revenues are recognized ratably after the go-live. Other public service fees are earned and recognized as revenues when the Company processes credit card payments on behalf of the courts via its websites through which the public can efile cases and pay traffic citations and other fees.
The adoption of ASC 606 also requires the capitalization of certain costs of obtaining contracts, specifically sales commissions which are to be amortized over the expected term of the contracts. For its software contracts, the Company incurs an immaterial amount of sales commission costs which have no significant impact on the Company’s financial condition and results of operations. In addition, the Company’s implementation and fulfillment costs do not meet all criteria required for capitalization.
Since the Company recognizes revenues when it can invoice the customer pursuant to the contract for the value of completed performance, as a practical expedient and because reliable estimates cannot be made, it has elected not to include the transaction price allocated to unsatisfied performance obligations. Also, as a practical expedient, the Company has elected not to include its evaluation of variable consideration of certain usage based fees (i.e. public service fees) that are included in some contracts. Furthermore, there are no fulfillment costs to be capitalized for the software contracts because these costs do not generate or enhance resources that will be used in satisfying future performance obligations.
Approximately 58%, 58% and 56% of the Company’s revenues in fiscal 2018, 2017 and 2016, respectively, were derived from sales of software licenses, annual software licenses, maintenance and support agreements and consulting services that typically include implementation and training.
The change in allowance for doubtful accounts is as follows:
Allowance for Doubtful Accounts
|
Description |
Balance at Beginning of Year |
Additions Charged to Costs and Expenses |
Accounts Charged off less Recoveries |
Balance at End of Year |
||||||||||||
| Fiscal 2018 | ||||||||||||||||
|
Allowance for doubtful accounts |
$ | 200,000 | $ | 6,000 | $ | (6,000 | ) | $ | 200,000 | |||||||
| Fiscal 2017 | ||||||||||||||||
|
Allowance for doubtful accounts |
$ | 200,000 | $ | 33,000 | $ | (33,000 | ) | $ | 200,000 | |||||||
| Fiscal 2016 | ||||||||||||||||
|
Allowance for doubtful accounts |
$ | 250,000 | $ | 5,000 | $ | (55,000 | ) | $ | 200,000 | |||||||
Management Incentive Plan: In fiscal 1987, the Company implemented a Management Incentive Plan (the “Incentive Plan”) that entitles a participant to participate in pretax earnings before adjustment for certain items of the Company. In 2003, the Company modified the Incentive Plan to provide participants with three different types of non-negotiable incentive certificates based on the nature of the particular participants’ responsibilities. Each certificate entitles the participant to a specified share of the applicable pretax earnings in the year of grant and to receive the same percentage of pretax earnings to be generated in each of the next nine years provided they remain with the Company or are in retirement after working for the Company to age 65. If a participant dies while any of his or her certificates remain outstanding, future payments under those certificates will be made to the deceased participant’s beneficiaries.
In fiscal 2015, after combining Sustain, New Dawn and ISD into one company, the Company converted each existing Sustain Non-negotiable Incentive Certificate along with its supplemental Addendum to a new “Journal Technologies Non-negotiable Incentive Certificate” coupled with a similar supplemental Addendum which defines how the value of the Journal Technologies Certificate will be paid upon a triggering event such as a sale of Journal Technologies or an initial public offering. Employees and consultants of Journal Technologies are eligible to participate in these “Journal Technologies Certificates”. Payouts under the Journal Technologies Certificates are calculated based on the pretax income of Journal Technologies before supplemental compensation expenses, workers’ compensation expenses, intangible amortizations and goodwill impairment. Also effective fiscal 2015, the calculation of payouts under the Daily Journal Non-Consolidated Certificates is based on the pretax earnings of the traditional publishing business before supplemental compensation expenses, workers’ compensation expenses, financing costs of the non-traditional business activities and any write-downs of unrealized losses on investments. The calculation of payouts under the Daily Journal Consolidated Certificate remains unchanged. For any certificate held by an employee who is expected to become retirement eligible during the 10 year period of the certificate, the Company recognizes the future commitments at each fiscal year-end over the period from the grant date through retirement eligibility.
Certificate interests entitled participants to receive 6.09%, 5.12% and 4.49% (amounting to $367,400, $268,250 and $271,350, respectively) of Daily Journal non-consolidated income before taxes, workers’ compensation, supplemental compensation and certain other items, 8.72%, 8.53% and 8.30% (amounting to $0, $0 and $0 for fiscal 2018, 2017 and 2016, respectively) for Journal Technologies and 8.2%, 8.2% and 8.2% (amounting to $0, $0 and $0, respectively) for Daily Journal consolidated in fiscal 2018, 2017 and 2016, respectively. The Company accrued $170,000 and $135,000 as of September 30, 2018 and 2017, respectively, for the Plan’s future commitment for those who will still have Certificates at the age of 65. This future commitment included an increase in the accrual in fiscal 2018 of $35,000 or $.03 per outstanding share on an adjusted pretax basis as compared with an increase in fiscal 2017 of $75,000 or $.06 per outstanding share, in each case due to increased estimated future pretax income. The estimated Incentive Plan’s future commitment is calculated based on an average of the past year and the current year pretax earnings before certain items, discounted to the present value at 6% since each granted Certificate will expire over its remaining life term of up to 10 years.
Income taxes: The Company accounts for income taxes using an asset and liability approach which requires the recognition of deferred tax liabilities and assets for the expected future consequences of temporary differences between the carrying amounts for financial reporting purposes and the tax basis of the assets and liabilities. The Company accounts for uncertainty in income taxes under ASC 740-10 which prescribes a recognition threshold and measurement methodology to recognize and measure an income tax position taken, or expected to be taken, in a tax return. The evaluation of a tax position is based on a two-step approach. The first step requires an entity to evaluate whether the tax position would “more likely than not” be sustained upon examination by the appropriate taxing authority. The second step requires the tax position be measured at the largest amount of tax benefit that is greater than 50% likely of being realized upon ultimate settlement. In addition, previously recognized benefits from tax positions that no longer meet the new criteria would be derecognized.
Net (loss) income per common share: The net (loss) income per common share is based on the weighted average number of shares outstanding during each year. The shares used in the calculation were 1,380,746 for fiscal 2018, 2017 and 2016. The Company does not have any common stock equivalents, and therefore basic and diluted net income per share is the same.
Use of Estimates: The presentation of the Company’s financial statements in conformity with accounting principles generally accepted in the United States requires management to make estimates and assumptions that affect the reported amounts of assets and liabilities and disclosure of contingent assets and liabilities at the date of the financial statements and the reported amounts of revenues and expenses during the reporting period. The long-term Incentive Plan accrual is calculated using Level 3 inputs, as defined in the fair value hierarchy, based on an average of the past year’s and the current year’s pretax earnings, discounted to the present value at 6% since each granted Unit will expire over its remaining life term of up to 10 years. Actual results could differ from these estimates.
Accounting Standards Adopted in Fiscal 2018
In November 2015, the Financial Accounting Standards Board (FASB) issued Accounting Standards Update (ASU) No. 2015-17, Income Taxes (Topic 740): Balance Sheet Classification of Deferred Taxes. This update requires deferred tax liabilities and assets to be classified as noncurrent in the consolidated balance sheet. The Company adopted this guidance effective October 1, 2017 and concluded that it has no significant impact on the Company’s financial condition, results of operations or disclosures because it is simply a reclassification of current deferred taxes to non-current deferred taxes with an itemization of federal and state deferred taxes.
In February 2018, the FASB issued an amendment to ASC Subtopic 220-10, Reclassification of Certain Tax Effects from Accumulated Other Comprehensive Income (“AOCI”). This amendment permits entities to reclassify stranded tax effects resulting from tax rate changes related to the Tax Cuts and Jobs Act (the “Tax Act”), from AOCI to retained earnings. The guidance is effective for fiscal years beginning after December 15, 2018, and interim periods within those fiscal years. Early adoption is permitted. The election can be applied as of the first day of the interim period in which it is adopted or retroactively to the first interim period in which the tax effects of the Tax Act were recognized. The Company elected to adopt this amendment as of January 1, 2018. Pursuant to this amendment, the Company can only reclassify the stranded tax effects resulting from the Tax Act and not those relative to the previous California/State apportionment. As such, the Company recorded a reclassification of stranded tax effects of $19,960,000 between AOCI and retained earnings. This represented a decrease to retained earnings and an increase to AOCI, both of which are listed under the “Shareholders’ equity” section of the Company’s Consolidated Balance Sheets.
In May 2014, the FASB issued ASU No. 2014-09, Revenue from Contracts with Customers (ASC Topic 606), which requires that revenues be recognized in an amount reflecting the consideration an entity expects to receive in exchange for those goods or services when a customer obtains control of promised goods or services. The Company elected to adopt ASC Topic 606 early effective October 1, 2017 using the modified retrospective method.
The Company has concluded that the adoption of the ASC Topic 606 in fiscal 2018 had no significant impact on the Company’s financial condition or results of operations. For the Company’s traditional publishing business (the “Traditional Business”), revenue recognition related to advertising, circulation, and advertising service fees remains unchanged. For the Journal Technologies’ software business, the Company previously utilized the completed performance method of accounting, pursuant to which the Company did not recognize revenues for implementation services or licenses, maintenance, support and hosting services until after the services were performed and accepted by the customer (final go-live), due to the fact that the customer’s acceptance was typically unpredictable and reliable estimates of the progress towards completion could not be made. In addition, maintenance services were recognized over the term of the maintenance period. Thus, the Company’s past revenue recognition policy was already in conformity with ASU Topic 606, which calls for revenue recognition at the point of delivery when a performance obligation is fulfilled. Consequently, the Company believes there are no required material retrospective or accumulated catch-up adjustments with respect to prior years’ financial figures, as revenues have been recognized consistently in the same manner throughout the comparative reporting periods.
New Accounting Pronouncements:
In January 2016, FASB issued “ASU” No. 2016-01, Financial Instruments – Overall (Subtopic 825-10): Recognition and Measurement of Financial Assets and Financial Liabilities. This ASU updates certain aspects of recognition, measurement, presentation and disclosure of financial instruments and applies to all entities that hold financial assets or owe financial liabilities. It requires an entity to: (i) measure equity investments at fair value through net income, with certain exceptions; (ii) present in Other Comprehensive Income changes in instrument-specific credit risk for financial liabilities measured using the fair value option; (iii) present financial assets and financial liabilities by measurement category and form of financial asset; (iv) calculate the fair value of financial instruments for disclosure purposes based on an exit price and; (v) assess a valuation allowance on deferred tax assets related to unrealized losses of available-for-sale debt securities in combination with other deferred tax assets. The Update also requires a qualitative impairment assessment of such equity investments and amends certain fair value disclosure requirements. This ASU is effective for public business with fiscal years beginning after December 15, 2017, including interim periods within that annual period, which is the Company’s fiscal 2019. The Company has adopted this guidance effective October 1, 2018 and concluded that it may have a significant impact on the Company’s financial condition, results of operations or disclosures, depending on the market price fluctuations of the invested marketable securities.
In February 2016, the FASB issued ASU 2016-02, Leases (Topic 842). This update requires that all leases be recognized by lessees on the balance sheet through a right-of-use asset and corresponding lease liability, including today’s operating leases. This standard is required to be adopted for annual periods beginning after December 15, 2018, including interim periods within that annual period, which is the Company’s fiscal year 2020. The Company plans to begin its assessment in fiscal 2019 to evaluate what impact, if any, the adoption of this ASU may have on its financial condition, results of operations or disclosures.
In January 2017, FASB issued ASU No. 2017-04, Intangibles – Goodwill and Other (Topic 350): Simplifying the Test for Goodwill Impairment. This ASU simplifies how an entity is required to test goodwill for impairment by eliminating Step 2 from the goodwill impairment test and requiring impairment charges to be based on Step 1, which is to compare the fair value of a reporting unit with its carrying amount. A goodwill impairment should be recognized in the amount by which the carrying amount exceeds the reporting unit’s fair value. This ASU is effective for public business with fiscal years beginning after December 15, 2019, which is the Company’s fiscal 2021. Early adoption is permitted for annual and interim goodwill impairment testing dates after January 1, 2017. The Company has not yet evaluated what impact, if any, the adoption of this ASU may have on its financial condition, results of operations or disclosures because it is not required to be adopted for several years.
No other new accounting pronouncement issued or effective has had, or is expected to have, a material impact on the Company’s consolidated financial statements.
3. INCOME TAXES
The benefit from income taxes consists of the following:
|
2018 |
2017 |
2016 |
||||||||||
|
Current: |
||||||||||||
|
Federal |
$ | (209,000 | ) | $ | (2,570,000 | ) | $ | (268,000 | ) | |||
|
State |
(90,000 | ) | (6,000 | ) | (30,000 | ) | ||||||
| (299,000 | ) | (2,576,000 | ) | (298,000 | ) | |||||||
|
Deferred: |
||||||||||||
|
Federal |
(18,577,000 | ) | (3,854,000 | ) | (1,369,000 | ) | ||||||
|
State |
(664,000 | ) | (720,000 | ) | (268,000 | ) | ||||||
| (19,241,000 | ) | (4,574,000 | ) | (1,637,000 | ) | |||||||
| $ | (19,540,000 | ) | $ | (7,150,000 | ) | $ | (1,935,000 | ) | ||||
The difference between the statutory federal income tax rate and the Company’s effective rate is summarized below:
|
2018 |
2017 |
2016 |
||||||||||
|
Statutory federal income tax rate |
24.3 | % | 34.0 | % | 34.0 | % | ||||||
|
State franchise taxes (net of federal tax benefit) |
5.7 | 6.2 | 5.2 | |||||||||
|
Revalue of deferred taxes due to federal rate change |
176.0 | --- | --- | |||||||||
|
Effect of federal rate change on beginning net deferred tax liabilities |
(34.0 | ) | --- | --- | ||||||||
|
Business meals/gifts/other permanent differences |
(0.4 | ) | (0.8 | ) | (2.3 | ) | ||||||
|
Domestic production activity deduction and deferred revenue |
(0.9 | ) | --- | --- | ||||||||
|
Dividends received deduction |
5.8 | 10.0 | 24.5 | |||||||||
|
Reversal of uncertain and unrecognized tax position |
--- | 37.6 | --- | |||||||||
|
Penalties for uncertain and unrecognized tax benefits |
--- | 2.0 | --- | |||||||||
|
Prior year true-up |
(1.8 | ) | 1.0 | (2.0 | ) | |||||||
|
Foreign tax credits |
--- | 2.0 | 4.0 | |||||||||
|
Effect of state rate change on beginning balance of deferred tax liabilities |
(0.7 | ) | (0.3 | ) | 1.4 | |||||||
|
Others |
(1.7 | ) | (3.0 | ) | 0.2 | |||||||
|
Effective tax rate |
172.3 | % | 88.7 | % | 65.0 | % | ||||||
The Company’s deferred income tax assets and liabilities were comprised of the following:
|
2018 |
2017 |
|||||||
|
Deferred tax assets attributable to: |
||||||||
|
Accrued liabilities, including supplemental compensation and vacation pay accrual |
$ | (106,000 | ) | $ | (69,000 | ) | ||
|
Impairment losses on investments |
2,215,000 | 1,376,000 | ||||||
|
Bad debt reserves not yet deductible |
42,000 | 62,000 | ||||||
|
Depreciation and amortization |
4,446,000 | 5,977,000 | ||||||
|
Deferred revenues |
745,000 | 1,431,000 | ||||||
|
Net operating losses |
4,643,000 | 3,100,000 | ||||||
|
Credits and other |
455,000 | 1,303,000 | ||||||
|
Total deferred tax assets |
12,440,000 | 13,180,000 | ||||||
|
Deferred tax liabilities attributable to: |
||||||||
|
Unrealized gains on investments |
(42,151,000 | ) | (64,550,000 | ) | ||||
|
Goodwill |
(290,000 | ) | (311,000 | ) | ||||
|
Total deferred tax liabilities |
(42,441,000 | ) | (64,861,000 | ) | ||||
|
Net deferred income taxes |
$ | (30,001,000 | ) | $ | (51,681,000 | ) | ||
The Tax Act reduced the maximum corporate income tax rate from 35% to 21%, effective January 1, 2018. The Company has completed its review of the Tax Act. The impact to its financial statements is as follows: (i) current income tax expense or benefit is calculated using a blended rate of 24.28% pursuant to IRC Section 15, (ii) deferred tax expense includes a discrete net tax benefit of approximately $16 million resulting from a revaluation of deferred tax assets and liabilities to the expected tax rate that will be applied when temporary differences are expected to reverse, (iii) items that were expected to reverse during fiscal 2018 were valued at the blended rate of 24.28% while temporary differences that will reverse after fiscal 2018 were valued at the 21% rate, and (iv) approximately $20 million of the revaluation of deferred taxes relates to items that were initially recorded as accumulated other comprehensive income (“AOCI”). This revaluation of approximately $20 million was recorded as a component of income tax expense or benefit in continuing operations.
During fiscal 2018, the Company recorded an income tax benefit of $19,540,000 on a pretax loss of $11,339,000. The effective tax rate (before the discrete Tax Act item discussed above) was greater than the statutory rate primarily due to the dividends received deduction which increases the loss for tax purposes.
On a pretax loss of $8,068,000 for fiscal 2017, the Company recorded an income tax benefit of $7,150,000 which included a reversal of an accrued liability of approximately $2,665,000 for uncertain and unrecognized tax benefits relating to an acquisition in fiscal 2013. The Internal Revenue Service (“IRS”) concluded its examination of the Company’s fiscal 2014 income tax return with no proposed changes to the tax position that gave rise to this liability. As a result, this liability was reversed along with the related accrued interest and penalty expense of $743,000. In addition, a deferred tax liability, in the amount of $352,000, relating to temporary differences that would only exist if the uncertain tax position was never recognized, was reversed. The effective tax rate (before the discrete IRS item) was greater than the statutory rate mainly resulting from the dividends received deduction.
On a pretax loss of $2,978,000 for fiscal 2016, the Company recorded an income tax benefit of $1,935,000. The effective tax rate was greater than the statutory rate mainly resulting from the dividends received deduction. The Company’s effective tax rate was 172%, 89% and 65% for fiscal 2018, 2017 and 2016, respectively.
The Company files consolidated federal income tax returns in the United States and with various state jurisdictions and is no longer subject to examinations for fiscal years before fiscal 2015 with regard to federal income taxes and fiscal 2013 for state income taxes.
The Company has federal and state income tax net operating losses (“NOLs”). A portion of the fiscal 2017 federal and state NOLs were carried back to previous years. As of September 30, 2018, the Company had federal, California and other state NOL carryforwards of $18.5 million, $6.2 million and 4.3 million, respectively. These NOLs will expire at various dates from fiscal 2036 through 2038, as follows:
|
Fiscal year ended |
Federal NOL |
California NOL |
Other State NOL |
|||||||||
|
(in millions) |
||||||||||||
|
September 30, 2036 |
$ | .8 | $ | --- | $ | --- | ||||||
|
September 30, 2037 |
6.5 | .7 | 1.5 | |||||||||
|
September 30, 2038 |
11.2 | 5.5 | 2.8 | |||||||||
The Company believes it is more likely than not that the benefit of these NOLs will be realized in the future. Consequently, the Company has not provided a valuation allowance.
4. DEBTS AND COMMITMENTS
During fiscal 2013, the Company borrowed from its investment margin account the aggregate purchase price of $29.5 million for two acquisitions, in each case pledging its marketable securities as collateral. The interest rate for these investment margin account borrowings fluctuates based on the Federal Funds Rate plus 50 basis points with interest only payable monthly. The interest rate as of September 30, 2018 was 2.50%. These investment margin account borrowings do not mature.
In November 2015, the Company purchased a 30,700 square foot office building constructed in 1998 on about 3.6 acres in Logan, Utah that had been previously leased by Journal Technologies. The Company paid $1.24 million and financed the balance with a real estate bank loan of $2.26 million which bears a fixed interest rate of 4.66% and is repayable in equal monthly installments of about $17,600 through 2030. This loan is secured by the Logan facility and can be paid off at any time without prepayment penalty. This real estate loan had a balance of approximately $1.96 million as of September 30, 2018.
The Company also owns its facilities in Los Angeles and leases space for its other offices under operating leases which expire at various dates through fiscal 2021. During fiscal 2014, the Company renewed its office lease for its San Francisco office for five years to end on October 31, 2019 with a current monthly rent of approximately $28,000 for about 6,200 square feet. Beginning in fiscal 2017, the Company leased approximately 9,800 square feet of office space (expiring in August 2020) in Englewood, Colorado, for a monthly rent of approximately $21,000.
The Company is responsible for a portion of maintenance, insurance and property tax expenses relating to the leased properties. Rental expenses for fiscal years 2018, 2017 and 2016 were $996,000, $742,000 and $745,000, respectively.
The following table represents the Company’s future obligations:
|
Payments due by Fiscal Year |
||||||||||||||||||||||||||||
|
2019 |
2020 |
2021 |
2022 |
2023 |
2024 and after |
Total |
||||||||||||||||||||||
|
Real estate loan |
$ | 121,000 | $ | 126,000 | $ | 133,000 | $ | 139,000 | $ | 146,000 | $ | 1,291,000 | $ | 1,956,000 | ||||||||||||||
|
Obligations under operating leases |
848,000 | 331,000 | 19,000 | --- | --- | --- | 1,198,000 | |||||||||||||||||||||
|
Long-term accrued liabilities* |
--- | 20,000 | 6,000 | 4,000 | 12,000 | 128,000 | 170,000 | |||||||||||||||||||||
| $ | 969,000 | $ | 477,000 | $ | 158,000 | $ | 143,000 | $ | 158,000 | $ | 1,419,000 | $ | 3,324,000 | |||||||||||||||
* The long-term accrued liabilities for the Management Incentive Plan are discounted to the present value using a discount rate of 6%.
5. CONTINGENCIES
From time to time, the Company is subject to litigation arising in the normal course of its business. While it is not possible to predict the results of such litigation, management does not believe the ultimate outcome of these matters will have a material adverse effect on the Company’s financial position, results of operations or cash flows.
6. REPORTABLE SEGMENTS
An operating segment is defined as a component of an enterprise which has discrete financial information that is evaluated regularly by the Company’s Chief Executive Officer to decide how to allocate resources and to access performance.
In accordance with ASC 280-10, Segment Reporting, the Company has two segments of business. The Company’s reportable segments are: (i) The Traditional Business and (ii) Journal Technologies. All inter-segment transactions were eliminated.
Summarized financial information concerning the Company’s reportable segments and Corporate income and expenses is shown in the following table:
|
Reportable Segments |
||||||||||||||||
|
Traditional Business |
Journal Technologies |
Corporate |
Total |
|||||||||||||
|
Fiscal 2018 |
||||||||||||||||
|
Revenues |
||||||||||||||||
|
Advertising, net |
$ | 9,112,000 | $ | --- | $ | --- | $ | 9,112,000 | ||||||||
|
Circulation |
5,401,000 | --- | --- | 5,401,000 | ||||||||||||
|
Advertising service fees and other |
2,659,000 | --- | --- | 2,659,000 | ||||||||||||
|
Licensing and maintenance fees |
--- | 17,225,000 | --- | 17,225,000 | ||||||||||||
|
Consulting fees |
--- | 2,832,000 | --- | 2,832,000 | ||||||||||||
|
Other public service fees |
--- | 3,474,000 | --- | 3,474,000 | ||||||||||||
|
Operating expenses |
16,840,000 | 37,923,000 | --- | 54,763,000 | ||||||||||||
|
Income (loss) from operations |
332,000 | (14,392,000 | ) | --- | (14,060,000 | ) | ||||||||||
|
Dividends and interest income |
--- | --- | 4,808,000 | 4,808,000 | ||||||||||||
|
Other income |
--- | --- | 37,000 | 37,000 | ||||||||||||
|
Interest expense on note payable collateralized by real estate |
(95,000 | ) | --- | --- | (95,000 | ) | ||||||||||
|
Interest expense on margin loans |
--- | --- | (651,000 | ) | (651,000 | ) | ||||||||||
|
Capital gains on sales of marketable securities and others |
--- | --- | 3,182,000 | 3,182,000 | ||||||||||||
|
Other-than-temporary impairment losses on investments |
--- | --- | (4,560,000 | ) | (4,560,000 | ) | ||||||||||
|
Pretax (loss) income |
237,000 | (14,392,000 | ) | 2,816,000 | (11,339,000 | ) | ||||||||||
|
Income tax benefit |
490,000 | 695,000 | 18,355,000 | 19,540,000 | ||||||||||||
|
Net (loss) income |
727,000 | (13,697,000 | ) | 21,171,000 | 8,201,000 | |||||||||||
|
Total assets |
19,602,000 | 29,885,000 | 214,511,000 | 263,998,000 | ||||||||||||
|
Capital expenditures |
212,000 | --- | --- | 212,000 | ||||||||||||
|
Amortization of intangible assets |
--- | 3,058,000 | --- | 3,058,000 | ||||||||||||
|
Reportable Segments |
||||||||||||||||
|
Traditional Business |
Journal Technologies |
Corporate |
Total |
|||||||||||||
|
Fiscal 2017 |
||||||||||||||||
|
Revenues |
||||||||||||||||
|
Advertising, net |
$ | 9,104,000 | $ | --- | $ | --- | $ | 9,104,000 | ||||||||
|
Circulation |
5,654,000 | --- | --- | 5,654,000 | ||||||||||||
|
Advertising service fees and other |
2,812,000 | --- | --- | 2,812,000 | ||||||||||||
|
Licensing and maintenance fees |
--- | 16,037,000 | --- | 16,037,000 | ||||||||||||
|
Consulting fees |
--- | 4,476,000 | --- | 4,476,000 | ||||||||||||
|
Other public service fees |
--- | 3,301,000 | --- | 3,301,000 | ||||||||||||
|
Operating expenses |
17,852,000 | 36,699,000 | --- | 54,551,000 | ||||||||||||
|
Loss from operations |
(282,000 | ) | (12,885,000 | ) | --- | (13,167,000 | ) | |||||||||
|
Dividends and interest income |
--- | --- | 4,844,000 | 4,844,000 | ||||||||||||
|
Other income |
22,000 | --- | 12,000 | 34,000 | ||||||||||||
|
Interest expense on note payable collateralized by real estate |
(100,000 | ) | --- | --- | (100,000 | ) | ||||||||||
|
Interest expense on margin loans |
--- | --- | (422,000 | ) | (422,000 | ) | ||||||||||
|
Interest and penalty expense reversal for uncertain and unrecognized tax benefits |
--- | 743,000 | --- | 743,000 | ||||||||||||
|
Pretax (loss) income |
(360,000 | ) | (12,142,000 | ) | 4,434,000 | (8,068,000 | ) | |||||||||
|
Income tax benefit (expense) |
(2,000 | ) | 7,910,000 | (758,000 | ) | 7,150,000 | ||||||||||
|
Net (loss) income |
(362,000 | ) | (4,232,000 | ) | 3,676,000 | (918,000 | ) | |||||||||
|
Total assets |
16,606,000 | 33,461,000 | 230,641,000 | 280,708,000 | ||||||||||||
|
Capital expenditures |
160,000 | 93,000 | --- | 253,000 | ||||||||||||
|
Amortization of intangible assets |
--- | 4,895,000 | --- | 4,895,000 | ||||||||||||
|
Reportable Segments |
||||||||||||||||
|
Traditional Business |
Journal Technologies |
Corporate |
Total |
|||||||||||||
|
Fiscal 2016 |
||||||||||||||||
|
Revenues |
||||||||||||||||
|
Advertising, net |
$ | 9,854,000 | $ | --- | $ | --- | $ | 9,854,000 | ||||||||
|
Circulation |
5,912,000 | --- | --- | 5,912,000 | ||||||||||||
|
Advertising service fees and other |
2,651,000 | --- | --- | 2,651,000 | ||||||||||||
|
Licensing and maintenance fees |
--- | 14,758,000 | --- | 14,758,000 | ||||||||||||
|
Consulting fees |
--- | 4,085,000 | --- | 4,085,000 | ||||||||||||
|
Other public service fees |
--- | 4,352,000 | --- | 4,352,000 | ||||||||||||
|
Operating expenses |
17,240,000 | 31,012,000 | --- | 48,252,000 | ||||||||||||
|
Income (loss) from operations |
1,177,000 | (7,817,000 | ) | --- | (6,640,000 | ) | ||||||||||
|
Dividends and interest income |
--- | --- | 4,085,000 | 4,085,000 | ||||||||||||
|
Other income |
52,000 | --- | 9,000 | 61,000 | ||||||||||||
|
Interest expense on note payable collateralized by real estate |
(88,000 | ) | --- | --- | (88,000 | ) | ||||||||||
|
Interest expense on margin loans |
--- | --- | (284,000 | ) | (284,000 | ) | ||||||||||
|
Interest expense accrued for uncertain and unrecognized tax benefits |
--- | (112,000 | ) | --- | (112,000 | ) | ||||||||||
|
Pretax income (loss) |
1,141,000 | (7,929,000 | ) | 3,810,000 | (2,978,000 | ) | ||||||||||
|
Income tax benefit (expense) |
(530,000 | ) | 3,140,000 | (675,000 | ) | 1,935,000 | ||||||||||
|
Net income (loss) |
611,000 | (4,789,000 | ) | 3,135,000 | (1,043,000 | ) | ||||||||||
|
Total assets |
17,644,000 | 39,786,000 | 168,016,000 | 225,446,000 | ||||||||||||
|
Capital expenditures, including purchase of Logan building |
3,662,000 | 117,000 | --- | 3,779,000 | ||||||||||||
|
Amortization of intangible assets |
142,000 | 4,895,000 | --- | 5,037,000 | ||||||||||||
During fiscal 2018, 2017 and 2016, the Traditional Business had total operating revenues of $17,172,000, $17,570,000 and $18,417,000 of which $11,771,000, $11,916,000 and $12,505,000, respectively, were recognized after services were provided while $5,401,000, $5,654,000 and $5,912,000, respectively, were recognized ratably over the subscription terms. Total operating revenues for the Company’s software business were $23,531,000, $23,814,000 and $23,195,000, of which $7,437,000, $8,618,000 and $9,735,000, respectively, were recognized upon completion of services while $16,094,000, $15,196,000 and $13,460,000, respectively, were recognized ratably over the subscription periods.
7. RESULTS OF OPERATIONS BY QUARTER (UNAUDITED)
|
Quarter ended |
||||||||||||||||
|
December 31 |
March 31 |
June 30 |
September 30 |
|||||||||||||
|
(in thousands except per share amounts) |
||||||||||||||||
|
2018 |
||||||||||||||||
|
Revenues |
$ | 10,252 | $ | 9,338 | $ | 11,007 | $ | 10,106 | ||||||||
|
Costs and expenses |
13,697 | 13,711 | 13,716 | 13,639 | ||||||||||||
|
Loss from operations |
(3,445 | ) | (4,373 | ) | (2,709 | ) | (3,533 | ) | ||||||||
|
Other income, net |
1,334 | 4,041 | 1,027 | 879 | ||||||||||||
|
Other-than-temporary impairment losses on investments |
--- | --- | --- | (4,560 | ) | |||||||||||
|
Loss before taxes |
(2,111 | ) | (332 | ) | (1,682 | ) | (7,214 | ) | ||||||||
|
Benefits from income taxes |
16,850 | 100 | 710 | 1,880 | ||||||||||||
|
Net income (loss) |
14,739 | (232 | ) | (972 | ) | (5,334 | ) | |||||||||
|
Basic and diluted net income (loss) per share |
10.67 | (.17 | ) | (.70 | ) | (3.86 | ) | |||||||||
|
2017 |
||||||||||||||||
|
Revenues |
$ | 9,990 | $ | 10,279 | $ | 10,201 | $ | 10,914 | ||||||||
|
Costs and expenses |
12,843 | 13,545 | 13,834 | 14,329 | ||||||||||||
|
Loss from operations |
(2,853 | ) | (3,266 | ) | (3,633 | ) | (3,415 | ) | ||||||||
|
Other income, net |
1,072 | 2,005 | 817 | 1,205 | ||||||||||||
|
Income (loss) before taxes |
(1,781 | ) | (1,261 | ) | (2,816 | ) | (2,210 | ) | ||||||||
|
Benefits from income taxes |
310 | 4,240 | 1,465 | 1,135 | ||||||||||||
|
Net (loss) income |
(1,471 | ) | 2,979 | (1,351 | ) | (1,075 | ) | |||||||||
|
Basic and diluted net income (loss) per share |
(1.07 | ) | 2.16 | (.98 | ) | (.77 | ) | |||||||||
8. SUBSEQUENT EVENTS
The Company has completed an evaluation of all subsequent events through the issuance date of these financial statements and concluded that no additional subsequent events occurred that required recognition in the financial statements or disclosures in the Notes to Consolidated Financial Statements.
Item 9. Changes in and Disagreements with Accountants on Accounting and Financial Disclosure
None.
Item 9A. Controls and Procedures
An evaluation was performed under the supervision and with the participation of the Company’s management, including Gerald L. Salzman, its Chief Executive Officer and Chief Financial Officer, of the effectiveness of the design and operation of the Company’s disclosure controls and procedures as of September 30, 2018. Based on that evaluation, management concluded that because of material weaknesses in its internal control over financial reporting, as further described below, the Company’s disclosure controls and procedures were not effective as of September 30, 2018.
Management’s Report on Internal Control over Financial Reporting
The Company’s management is responsible for establishing and maintaining adequate internal control over financial reporting, as such term is defined in Rule 13a-15(f) under the Securities Exchange Act of 1934. The Company’s internal control over financial reporting has been designed to provide reasonable assurance to the Company’s management and Board of Directors regarding the preparation and fair presentation of the Company’s consolidated financial statements. All internal controls, no matter how well designed, have inherent limitations, and sometimes they can have one or more material weaknesses. A material weakness is a deficiency, or combination of deficiencies, in internal control over financial reporting, such that there is a reasonable possibility that a material misstatement of the company's annual or interim consolidated financial statements will not be prevented or detected on a timely basis.
Each year, management is required by SEC rules to evaluate the effectiveness of the Company’s internal control over financial reporting. If management identifies any material weaknesses in the course of the evaluation, the rules do not allow us to conclude that our internal control over financial reporting is effective. That evaluation is conducted under the supervision and with the participation of Mr. Salzman, and is based on criteria established in Internal Control – Integrated Framework issued by the Committee of Sponsoring Organizations of the Treadway Commission (COSO) in 2013, which applies to all accelerated filers regardless of size. Based on the evaluation under that framework and applicable SEC rules, management has identified the following deficiencies that constitute material weaknesses in the Company’s internal control over financial reporting:
Segregation of duties: As a small company, we have three long-time knowledgeable managers in our advertising and subscription departments, seven experienced employees in the accounting department and three in the IT department. Accordingly, we are not able to segregate duties to the extent we could if we had more people, and we have not sufficiently designed controls that support an effective assessment of our internal controls relating to the prevention of fraud and possible management override of controls. Although the Company has remediated some of the issues associated with administrative access to specific systems, these steps have not fully remediated the control issue.
Ineffective management assessment of internal control over financial reporting: The Company does not have an internal audit department due to the small size of its accounting department. Hiring an outside firm would certainly help complete the documentation of the internal control assessment to the level required by COSO framework, but the Company questions whether that would be a wise use of shareholders’ money.
Recognizing our deficiencies, we use mitigating controls, including a variety of internal procedures to check and double-check the areas where one person is responsible for multiple duties. Among other things, the Company’s monitoring activities include monthly review and comparative analysis of financial, production and public information with prior periods by the Company’s department supervisors, the CEO/CFO and the Board of Directors. We will continue to review our compensating controls and procedures in our efforts to remediate the above mentioned material weaknesses.
In addition, we believe our most important internal control is our hiring and retention of honest and capable people, whom we trust to do their jobs well. Accordingly, we believe our overall internal control environment is sufficient for a company of our size.
In the context of the COSO 2013 Framework; however, we believe that the above-mentioned control deficiencies constitute material weaknesses, and therefore we must conclude that our internal control over financial reporting was not effective as of September 30, 2018.
Squar Milner LLP, the Company’s independent registered public accounting firm, expressed an unqualified opinion for the audit of our consolidated financial statements as of and for the year ended September 30, 2018. It has also issued its report on the effectiveness of our internal control over financial reporting as of September 30, 2018, which is presented below.
Report of Independent Registered Public Accounting Firm
The Board of Directors and Shareholders of Daily Journal Corporation
Opinion on the Internal Control Over Financial Reporting
We have audited Daily Journal Corporation's (the Company) internal control over financial reporting as of September 30, 2018, based on criteria established in Internal Control — Integrated Framework issued by the Committee of Sponsoring Organizations of the Treadway Commission (“COSO”) in 2013. In our opinion, because of the effect of the material weaknesses described below on the achievement of the objectives of the control criteria, the Company has not maintained effective internal control over financial reporting as of September 30, 2018, based on criteria established in Internal Control — Integrated Framework issued by the Committee of Sponsoring Organizations of the Treadway Commission in 2013 Framework issued by the Committee of Sponsoring Organizations of the Treadway Commission in 2013.
We have also audited, in accordance with the standards of the Public Company Accounting Oversight Board (United States) (PCAOB), the consolidated balance sheets of the Company as of September 30, 2018 and 2017 and the related consolidated statements of comprehensive income (loss), shareholders’ equity and cash flows for each of the years ended in the three year period ended September 30, 2018 and our report dated December 12, 2018 expressed an unqualified opinion.
A material weakness is a deficiency, or a combination of deficiencies, in internal control over financial reporting, such that there is a reasonable possibility that a material misstatement of the company's annual or interim financial statements will not be prevented or detected on a timely basis. The following deficiencies in internal control have been identified as material weaknesses over the Company’s control environment and monitoring pursuant to the COSO framework:
| Inadequate segregation of duties to mitigate the risk of fraud and management override of controls pertaining to access over significant accounting applications and ineffective management assessment of internal control over financial reporting, including insufficient experienced resources to complete the documentation of internal control assessment. |
These material weaknesses were considered in determining the nature, timing and extent of audit tests applied in our audit of the 2018 financial statements, and this report does not affect our report dated December 12, 2018.
Basis for Opinion
The Company’s management is responsible for maintaining effective internal control over financial reporting and for its assessment of the effectiveness of internal control over financial reporting in the accompanying Management’s Report on Internal Control over Financial Reporting. Our responsibility is to express an opinion on the Company’s internal control over financial reporting based on our audit. We are a public accounting firm registered with the PCAOB and are required to be independent with respect to the Company in accordance with U.S. federal securities laws and the applicable rules and regulations of the Securities and Exchange Commission and the PCAOB.
We conducted our audit in accordance with the standards of the PCAOB. Those standards require that we plan and perform the audit to obtain reasonable assurance about whether effective internal control over financial reporting was maintained in all material respects. Our audit included obtaining an understanding of internal control over financial reporting, assessing the risk that a material weakness exists, and testing and evaluating the design and operating effectiveness of internal control based on the assessed risk. Our audit also included performing such other procedures as we considered necessary in the circumstances. We believe that our audit provides a reasonable basis for our opinion.
Definition and Limitations of Internal Control Over Financial Reporting
A company's internal control over financial reporting is a process designed to provide reasonable assurance regarding the reliability of financial reporting and the preparation of financial statements for external purposes in accordance with generally accepted accounting principles. A company's internal control over financial reporting includes those policies and procedures that (1) pertain to the maintenance of records that, in reasonable detail, accurately and fairly reflect the transactions and dispositions of the assets of the company; (2) provide reasonable assurance that transactions are recorded as necessary to permit preparation of financial statements in accordance with generally accepted accounting principles, and that receipts and expenditures of the company are being made only in accordance with authorizations of management and directors of the company; and (3) provide reasonable assurance regarding prevention or timely detection of unauthorized acquisition, use or disposition of the company's assets that could have a material effect on the financial statements.
Because of its inherent limitations, internal control over financial reporting may not prevent or detect misstatements. Also, projections of any evaluation of effectiveness to future periods are subject to the risk that controls may become inadequate because of changes in conditions, or that the degree of compliance with the policies or procedures may deteriorate.
\s\ Squar Milner LLP
Los Angeles, California
December 12, 2018
Changes in Internal Control over Financial Reporting
In light of the material weaknesses in the Company’s internal control over financial reporting discussed above for the fiscal year ended September 30, 2018, management concluded that the Company’s disclosure controls and procedures were not effective as of September 30, 2018. Except as described above under Management’s Report on Internal Control over Financial Reporting, there were no other changes in our internal control over financial reporting that occurred during the quarter ended September 30, 2018 that have materially affected, or are reasonably likely to materially affect, our internal control over financial reporting.
Item 9B. Other Information
None.
PART III
Item 10. Directors, Executive Officers and Corporate Governance
The information set forth in the tables, the notes thereto, and the paragraphs under the captions “Election of Directors”, “Corporate Governance” and “Section 16(a) Beneficial Ownership Reporting Compliance” in the Company's definitive Proxy Statement for the Annual Meeting of Shareholders to be held on or about February 14, 2019 (the “Proxy Statement”), which Proxy Statement will be filed with the SEC within 120 days after September 30, 2018, is incorporated herein by reference.
The Company has adopted a Code of Ethics that applies to all directors, officers and employees of the Company, including the Chief Executive Officer, Chief Financial Officer and Controller. The Company’s Code of Ethics has been filed as Exhibit 14 hereto.
Item 11. Executive Compensation
The information set forth under the captions “Executive Compensation” and “Corporate Governance” in the Proxy Statement is incorporated herein by reference.
Item 12. Security Ownership of Certain Beneficial Owners and Management and Related Stockholder Matters
The information set forth under the caption “Security Ownership of Certain Beneficial Owners and Management” in the Proxy Statement is incorporated herein by reference.
Item 13. Certain Relationships and Related Transactions, and Director Independence
The information set forth under the caption “Corporate Governance” in the Proxy Statement is incorporated herein by reference.
Item 14. Principal Accounting Fees and Services
The information set forth under the caption “Other Matters Regarding Independent Registered Public Accounting Firm” in the Proxy Statement is incorporated herein by reference.
PART IV
Item 15. Exhibits, Financial Statement Schedules
The following documents are filed as part of this Report:
|
(1) |
Consolidated Financial Statements: |
|
Report of Independent Registered Public Accounting Firm |
|
|
Consolidated Balance Sheets at September 30, 2018 and 2017 |
|
|
Consolidated Statements of Comprehensive Income (Loss) for the years ended September 30, 2018, 2017 and 2016 |
|
|
Consolidated Statements of Shareholders’ Equity for the years ended September 30, 2018, 2017 and 2016 |
|
|
Consolidated Statements of Cash Flows for the years ended September 30, 2018, 2017 and 2016 |
|
|
Notes to Consolidated Financial Statements |
|
|
(2) |
Exhibits |
|
3.1 |
Articles of Incorporation of Daily Journal Corporation, as amended. (≈) |
|
3.2 |
Amended and Restated Bylaws of Daily Journal Corporation. (≈) |
|
10.1 |
|
|
14 |
|
|
21 |
|
|
31 |
|
|
32 |
|
(≈) |
Filed as an Exhibit to the Company’s 2014 Annual Report on Form 10-K, filed with the Securities and Exchange Commission on January 28, 2015. |
|
(‡) |
Management Compensatory Plan. |
Item 16. Form 10-K Summary
None.
SIGNATURES
Pursuant to the requirements of Section 13 or 15(d) of the Securities Exchange Act of 1934, the registrant has duly caused this report to be signed on its behalf by the undersigned, thereunto duly authorized.
|
DAILY JOURNAL CORPORATION
By /s/ Gerald L. Salzman Gerald L. Salzman President |
Date: December 12, 2018
Pursuant to the requirements of the Securities Exchange Act of 1934, this report has been signed below by the following persons on behalf of the registrant and in the capacities and on the dates indicated.
|
Signature |
Title |
Date |
|||
|
/s/ Charles T. Munger |
Chairman of the Board |
December 12, 2018 |
|||
|
Charles T. Munger |
|||||
|
/s/ Gerald L. Salzman |
President, Chief Executive Officer, Chief Financial Officer, Treasurer and Director (Principal Executive Officer, Principal Financial Officer and Principal Accounting Officer) |
December 12, 2018 |
|||
|
Gerald L. Salzman |
|||||
|
/s/ J. P. Guerin |
Vice-Chairman |
December 12, 2018 |
|||
|
J. P. Guerin |
|||||
|
|
Director |
|
|||
|
Peter Kaufman |
|||||
|
|
Director |
|
|||
|
Gary Wilcox |
65