Attached files
| file | filename |
|---|---|
| EX-32.2 - EXHIBIT 32.2 - Blue Bird Corp | a10-k2018exhibit322cfo906c.htm |
| EX-32.1 - EXHIBIT 32.1 - Blue Bird Corp | a10-k2018exhibit321ceo906c.htm |
| EX-31.2 - EXHIBIT 31.2 - Blue Bird Corp | a10-k2018exhibit312cfo302c.htm |
| EX-31.1 - EXHIBIT 31.1 - Blue Bird Corp | a10-k2018exhibit311ceo302c.htm |
| EX-23.1 - EXHIBIT 23.1 - Blue Bird Corp | a10-k2018exhibit231bdocons.htm |
| EX-21.1 - EXHIBIT 21.1 - Blue Bird Corp | a10-k2018exhibit211subsidi.htm |
UNITED STATES
SECURITIES AND EXCHANGE COMMISSION
Washington, D.C. 20549
FORM 10-K
[ X ] ANNUAL REPORT PURSUANT TO SECTION 13 OR 15(d) OF THE SECURITIES EXCHANGE ACT OF 1934
For the fiscal year ended September 29, 2018
OR
[ ] TRANSITION REPORT PURSUANT TO SECTION 13 OR 15(d) OF THE SECURITIES EXCHANGE ACT OF 1934
For the transition period from ________ to ________
Commission File Number: 001-36267
BLUE BIRD CORPORATION
(Exact name of registrant as specified in its charter)
Delaware | 46-3891989 |
(State or other jurisdiction of incorporation or organization) | (IRS Employer Identification No.) |
3920 Arkwright Road 2nd Floor Macon, Georgia | 31210 |
(Address of Principal Executive Offices) | (Zip Code) |
(478) 822-2801
(Registrant’s telephone number, including area code)
Securities registered pursuant to Section 12(b) of the Act:
Title of each class Name of each exchange on which registered
Common Stock, $0.0001 par value NASDAQ Global Market
Securities registered pursuant to Section 12(g) of the Act: None
Indicate by check mark whether the registrant is a well-known seasoned issuer, as defined in Rule 405 of the Securities Act.
Yes o No x
Indicate by check mark if the registrant is not required to file reports pursuant to Section 13 or Section 15(d) of the Act.
Yes o No x
Indicate by check mark whether the registrant (1) has filed all reports required to be filed by Section 13 or 15(d) of the Securities Exchange Act of 1934 during the preceding 12 months (or for such shorter period that the registrant was required to file such reports), and (2) has been subject to such filing requirements for the past 90 days.
Yes x No o
Indicate by check mark whether the registrant has submitted electronically every Interactive Data File required to be submitted pursuant to Rule 405 of Regulation S-T (§ 232.405 of this chapter) during the preceding 12 months (or for such shorter period that the registrant was required to submit such files). Yes x No o
Indicate by check mark if disclosure of delinquent filers pursuant to Item 405 of Regulation S-K (§ 229.405 of this chapter) is not contained herein, and will not be contained, to the best of registrant’s knowledge, in definitive proxy or information statements incorporated by reference in Part III of this Form 10-K or any amendment to this Form 10-K. o
Indicate by check mark whether the registrant is a large accelerated filer, an accelerated filer, a non-accelerated filer, a smaller reporting company, or an emerging growth company. See the definitions of “large accelerated filer,” “accelerated filer,” “smaller reporting company," and "emerging growth company" in Rule 12b-2 of the Exchange Act.
Large accelerated filer | o | Accelerated filer | x | |||
Non-accelerated filer | o | Smaller reporting company | o | |||
Emerging growth company | x | |||||
If an emerging growth company, indicate by check mark if the registrant has elected not to use the extended transition period for complying with any new or revised financial accounting standards provided pursuant to Section 13(a) of the Exchange Act. o
Indicate by check mark whether the registrant is a shell company (as defined in Rule 12b-2 of the Exchange Act). Yes o No x
At March 31, 2018, the aggregate market value of the registrant’s common stock held by non-affiliates of the registrant was approximately $270.3 million based on the closing sales price of $23.70 as reported on The NASDAQ Global Market on March 29, 2018. For the purpose of this response, executive officers, directors, and holders of 10% or more of the registrant’s common stock are considered to be affiliates of the registrant at that date.
At December 4, 2018, there were 26,331,075 outstanding shares of the registrant’s $0.0001 par value common stock.
DOCUMENTS INCORPORATED BY REFERENCE
Portions of the Registrant’s definitive proxy statement to be delivered to shareholders in connection with the Registrant’s 2019 Annual Meeting of Shareholders are incorporated by reference in response to Part III of this report.
BLUE BIRD CORPORATION
FORM 10-K
TABLE OF CONTENTS
PART I
SPECIAL NOTE REGARDING FORWARD-LOOKING STATEMENTS
This Annual Report on Form 10-K (this “Report”) of Blue Bird Corporation (“Blue Bird” or the “Company”) contains forward-looking statements. Except as otherwise indicated by the context, references in this Report to “we,” “us” and “our” are to the consolidated business of the Company. All statements in this Report, including those made by the management of the Company, other than statements of historical fact, are forward-looking statements. These forward-looking statements are based on management’s estimates, projections and assumptions as of the date hereof and include the assumptions that underlie such statements. Forward-looking statements may contain words such as “may,” “will,” “should,” “could,” “would,” “expect,” “plan,” “estimate,” “project,” “forecast,” “seek,” “target,” “anticipate,” “believe,” “estimate,” “predict,” “potential” and “continue,” the negative of these terms, or other comparable terminology. Examples of forward-looking statements include statements regarding the Company’s future financial results, research and trial results, regulatory approvals, operating results, business strategies, projected costs, products, competitive positions, management’s plans and objectives for future operations, and industry trends. These forward-looking statements relate to expectations for future financial performance, business strategies or expectations for our business. Specifically, forward-looking statements may include statements relating to:
• | the future financial performance of the Company; |
• | changes in the market for Blue Bird products; and |
• | expansion plans and opportunities. |
These forward-looking statements are based on information available as of the date of this Report (or, in the case of forward-looking statements incorporated herein by reference, as of the date of the applicable filed document), and current expectations, forecasts and assumptions, and involve a number of judgments, risks and uncertainties. Accordingly, forward-looking statements should not be relied upon as representing our views as of any subsequent date, and we do not undertake any obligation to update forward-looking statements to reflect events or circumstances after the date they were made, whether as a result of new information, future events or otherwise, except as may be required under applicable securities laws. As a result of a number of known and unknown risks and uncertainties, our actual results or performance may be materially different than those expressed or implied by these forward-looking statements.
Any expectations based on these forward-looking statements are subject to risks and uncertainties and other important factors, including those discussed in this Report, particularly the sections titled “Risk Factors” and “Management’s Discussion and Analysis of Financial Condition and Results of Operations.” Other risks and uncertainties are and will be disclosed in the Company’s prior and future SEC filings. The following information should be read in conjunction with the financial statements included in this Report.
Available Information
We are subject to the reporting and information requirements of the Securities Exchange Act of 1934, as amended, and as a result are obligated to file annual, quarterly, and current reports, proxy statements, and other information with the Securities and Exchange Commission ("SEC"). We make these filings available free of charge on our website (http://www.blue-bird.com) as soon as reasonably practicable after we electronically file them with, or furnish them to, the SEC. Information on our website does not constitute part of this Annual Report on Form 10-K. In addition, the SEC maintains a website (http://www.sec.gov) that contains our annual, quarterly, and current reports, proxy and information statements, and other information we electronically file with, or furnish to, the SEC. Any materials we file with, or furnish to, the SEC may also be read and/or copied at the SEC's Public Reference Room at 100 F Street, N.E., Washington, D.C. 20549. Information on the operation of the Public Reference Room may be obtained by calling the SEC at 1-800-SEC-0330.
1
Item 1. Business
The Company (formerly Hennessy Capital Acquisition Corp.) was incorporated in Delaware on September 24, 2013 as a special purpose acquisition company, or SPAC. On February 24, 2015, the Company consummated a business combination (the “Business Combination”), pursuant to which the Company acquired all of the outstanding capital stock of School Bus Holdings Inc. (“School Bus Holdings” or “SBH”) from The Traxis Group, B.V. (the “Seller”), in accordance with the purchase agreement, dated as of September 21, 2014, by and among the Company, the Seller and Hennessy Capital Partners I LLC, as amended on February 10, 2015 and February 18, 2015 (the “Purchase Agreement”). Pursuant to the Purchase Agreement, the total purchase price was paid in a combination of cash in the amount of $100.0 million and 12,000,000 shares of the Company’s common stock, $0.0001 par value (the “Common Stock”), valued at $120.0 million.
In connection with the closing of the Business Combination, the Company changed its name from Hennessy Capital Acquisition Corp. to Blue Bird Corporation. Unless expressly stated otherwise in this Report, Blue Bird Corporation shall be referred to as “Blue Bird” or the “Company,” and includes its consolidated subsidiaries.
The following description of our business describes the business historically operated by School Bus Holdings and its subsidiaries under the “Blue Bird” name as an independent enterprise prior to the Business Combination and as subsidiaries of Blue Bird Corporation (formerly Hennessy Capital Acquisition Corp.) after the Business Combination.
Pursuant to a Purchase and Sale Agreement, dated as of May 26, 2016 (the “Purchase and Sale Agreement”), by and among Seller, ASP BB Holdings LLC, a Delaware limited liability company (“ASP”), and the Company, Seller agreed to sell and ASP agreed to purchase all of the 12,000,000 shares of Common Stock of the Company owned by Seller (the “Transaction Shares”). Pursuant to the terms and conditions set forth in the Purchase and Sale Agreement, ASP acquired 7,000,000 Transaction Shares at an initial closing on June 3, 2016 for an amount in cash equal to $10.10 per share and 5,000,000 Transaction Shares at a second closing on June 8, 2016 for an amount in cash equal to $11.00 per share, for an aggregate purchase price of $125.7 million. There were no proceeds to the Company from this transaction.
The periodic reports filed by us with the Securities and Exchange Commission (“SEC”) pursuant to Section 13(a) or 15(d) of the Securities Exchange Act of 1934, as amended, are available free of charge at http://investors.blue-bird.com. This includes Annual Reports on Form 10-K, Quarterly Reports on Form 10-Q and Current Reports on Form 8-K, as well as any amendments to those reports. Section 16 filings made with the SEC by any of our executive officers or directors with respect to our Common Stock also are made available free of charge through our website. We post each of these documents on our website as soon as reasonably practicable after it is electronically filed with the SEC. Our reports filed with the SEC may also be found at the SEC’s website at www.sec.gov. The Company’s Common Stock is traded on The NASDAQ Global Market under the symbol “BLBD”.
The corporate governance information on our website includes our Corporate Governance Principles, Code of Conduct and Ethics and the Charters for each of the Committees of our Board of Directors. Any amendments to our Code of Ethics or waivers granted to our directors and executive officers will be posted on our corporate website.
In addition to the information contained in this Form 10-K for the fiscal year ended September 29, 2018 (“2018 Form 10-K Report” or “Report”), information about our Company can be found at http://investors.blue-bird.com, including extensive information about our management team, our products and our corporate governance.
The foregoing information regarding our website and its content is for convenience only and shall not be deemed to be incorporated by reference into this Report nor filed with the SEC.
Overview
We are the leading independent designer and manufacturer of school buses, with more than 550,000 buses sold since our formation in 1927 and approximately 180,000 buses in operation today.
We review and present our business in two operating segments, which are also our reportable segments: (i) the Bus segment, which involves the design, engineering, manufacture and sales of school buses and extended warranties; and (ii) the Parts segment, which includes the sales of replacement bus parts. Financial information is reported on the basis that it is used internally by the chief operating decision maker (“CODM”) in evaluating segment performance and deciding how to allocate resources to segments. The President and Chief Executive Officer of the Company has been identified as the CODM. Management evaluates the segments based primarily upon revenues and gross profit. Refer to Note 11, Segment Information, to the Company’s consolidated financial statements for additional financial information regarding our reportable segments including the primary geographic areas in which we earn revenues.
2
Our performance in recent years has been driven by the implementation of repeatable processes focused on product initiatives, continuous improvement of both competitiveness and manufacturing flexibility, and lowering our cost of capital, as described below:
1. | Alternative Fuel Initiatives — Blue Bird is the clear leader in alternative fuel school buses (defined as buses that do not operate on diesel fuel) and we continue to introduce new products to support growing consumer demand for these products. |
• | Propane — In 2012, we entered into our exclusive relationship with Ford Motor Company and Roush Clean Tech to offer propane-powered Type C school buses. We have continued to lead the industry with this offering. |
• | We launched the industry’s first .05g/bhp-hr NOx propane engine in 2017. This engine operates four times cleaner than the current emission standard and is significantly better for the environment than competitors published offerings. |
• | We launched the industry’s first .02g/bhp-hr NOx propane engine in August 2018. This engine complies with Ultra Low NOx classification and has an emissions level at 10% of the current standard and competitive offerings. |
• | CNG — Blue Bird was the first OEM to introduce a CNG powertrain for the Rear Engine Type D bus using Cummins Westport technology. In 2016, we launched a new CNG product using a Ford engine and transmission and a Roush Clean Tech fuel delivery system to provide CNG in a Type C bus. |
• | Electric — Blue Bird is the first major manufacturer to market, and presently the only manufacturer among major OEMs, to offer electric school buses, which we developed with our exclusive partners, EDI and Adomani. We are offering electric solutions in both our Type C and Type D buses and commenced delivery to customers in 2018. |
• | Gasoline — In 2016, we re-introduced gasoline engines in school buses, again using a Ford engine and transmission and a Roush Clean Tech fuel delivery. This product has been an immediate success and continues to grow the Blue Bird customer base. |
2. | Diesel — Blue Bird works closely with Cummins on diesel engines which continue to be the power source for the majority of school buses sold. We have provided diesel customers with more choice by offering an Eaton transmission as an option. |
3. | Product Initiatives — We continue to update and improve our products. |
• | Blue Bird introduced the first Electronic Stability Control system on school buses as an optional offering. |
• | In 2017, we announced that we were commencing work on a major product enhancement. We are continuing to develop this product for future launch. |
4. | Manufacturing and Process Initiatives — We have commenced a number of initiatives to continue to build customer loyalty, reduce cost, and enhance competitiveness. |
• | We will launch our all-new, state of the art paint facility in 2019. This facility will drive greater reliability and capacity at a lower cost. |
• | We contracted with industry leaders to revise our production techniques in our plant. |
• | We commenced an initiative with industry leaders to make structural reductions in cost on existing and future products to enhance our cost competitiveness. |
5. | Access to Capital — We refinanced our term debt on substantially better terms in December 2016, resulting in a decrease of $9.8 million in interest expense from the fiscal year ended 2016 compared to the fiscal year ended 2018. In September 2018, we entered into a first amendment of the December, 2016 credit agreement, which increased the revolving credit facility to $100.0 million, a $25.0 million increase, providing more liquidity at lower interest rates. |
Our management believes that Blue Bird is in a leading position in the industry due to our range of alternative fuel offerings and our strong diesel offering. We believe that alternative fuels will continue to capture market share in the industry as customers realize benefits on the total cost of ownership and the adoption of green technology gains traction. Furthermore, we believe that our new product, process, and manufacturing initiatives are fully aligned with our long term objectives.
3
As a result of the concentration of Blue Bird’s sales in the school bus industry in the United States and Canada, our operations are affected by national, state, and local economic and political factors that impact spending for public and, to a lesser extent, private education. Unlike the discretionary portion of school budgets, the offering of school bus services is typically viewed as a mandatory part of the public infrastructure across the United States and Canada, ensuring that funding for new school buses receives some level of priority in all economic climates. All 50 States, the District of Columbia, and the 13 Canadian Provinces have fleets of school buses in operation.
Bus Segment
Our buses are sold through an extensive network of 50 United States and Canadian dealers that, in their territories, are exclusive to our Company on Type C and Type D school buses. We also sell directly to major fleet operators, the United States Government, state governments and authorized dealers in a number of foreign countries.
In fiscal 2018, we sold 11,649 buses throughout the world. Refer to “Item 7. Management’s Discussion and Analysis of Financial Condition and Results of Operations” for discussion of our unit volumes.
Approximately 92% of our buses sold in fiscal 2018 were sold through distributors and dealers (“dealerships”). The Company holds no equity or control position in any of the dealerships or distributors.
We design, engineer, manufacture, and sell three types of buses: (i) Type C school buses, (ii) Type D school buses, and (iii) specialty buses. Each of our Type C and Type D buses is manufactured and assembled on its own dedicated purpose-built chassis in Fort Valley, Georgia. Regardless of specifications, all school bus bodies that we manufacture include our signature 14-gauge one piece steel bows roof system, complemented by a rugged and sturdy floor structure.
Specialty buses include school buses that are converted to suit applications required by the United States Government, state and local governments, and various customers for commercial and export markets.
The Blue Bird Micro Bird by Girardin Type A bus is produced through Micro Bird Holdings, Inc., an unconsolidated Canadian joint venture with Groupe Autobus Girardin LTEE (“Micro Bird”), and is sold through our dealer network. This is a smaller bus than the Type C or Type D bus and is produced on a chassis provided by either Ford or GM.
Parts Segment
Parts are key for routine maintenance, replacement of parts that are damaged in service, and replacement of parts that suffer from wear and tear through the useful life of the vehicle.
In fiscal 2018, parts sales represented 6.1% of Company net sales.
We maintain a parts distribution center in Delaware, Ohio that fills demand for our Company specific and all-makes parts. Additional demand for parts is fulfilled by drop ship and direct sales. To fulfill demand for parts that are not maintained at the distribution center, we are linked to approximately 41 suppliers that ship directly to dealers and independent service centers.
Our 50 dealers have approximately 250 parts and service locations across the United States and Canada, the majority of which are owned by independent operators, to complement their primary locations. Field service engineers provide technical support to our dealer network. At the end of fiscal 2018, service engineers had an average of 25 years of experience with our Company and are strategically placed throughout the United States and Canada to better serve both dealers and end-customers. The network leverages our parts inventory, technical training, and online warranty network to address customer service needs.
Our Industry
The school bus serves a critical role in the United States and Canadian education systems. According to School Transportation News, nearly 50 percent of the U.S. student population rides a school bus. The United States and Canadian fleet of approximately 598,000 Type C and Type D school buses transports approximately 26 million children daily. School buses are distinguished from other types of buses by design characteristics associated with increased safety as mandated by federal, state, and municipal regulations.
The United States and Canadian school bus industry for Type C and Type D buses has averaged approximately 30,300 unit sales annually between 1985 and 2018. Unit sales for fiscal 2018 are projected to be about 33,100, a decrease of 6.8% versus fiscal 2017.
4
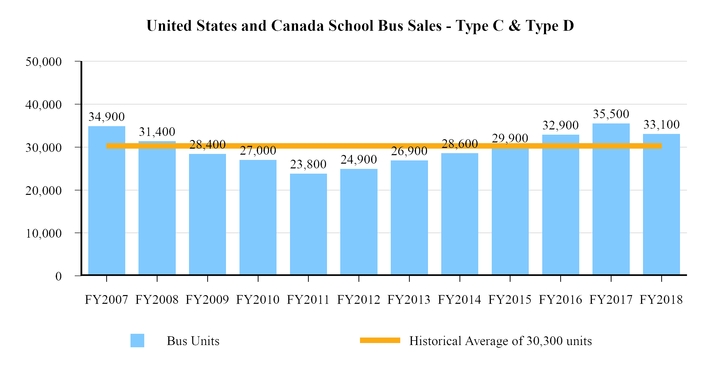
Source: Historical registration data are based on R.L. Polk vehicle registration data.
The low point in the industry occurred in 2011, at approximately 23,800 units, and was the result of the decline in the United States economy and, in particular, the collapse of the housing market in 2008 and 2009. Property tax receipts were impacted in the 2010-2011 period as a result of the substantial recession in the United States economy in general, and housing market in particular, preceding and during that period.
The school bus industry is currently in recovery, supported by positive demographic trends, pent-up demand from several years of below-trend bus sales, and a growing tax base for education-related spending. Our management believes, based on our industry forecast model developed using R.L. Polk school bus registration data and which considers population changes of school age children, that Type C and Type D school bus registrations are expected to grow by 1% to 2% annually between fiscal 2018 and fiscal 2020. Our management believes that there will be a continued recovery for the school bus industry. We believe that (i) the industry has been operating below its historical long-term average of approximately 30,300 unit sales per year since the recession - fiscal 2018 is only the third year since the recession in which unit sales exceeded this historical average, signaling the ability of the industry to now address the pent-up demand accumulated from fiscal 2009 to fiscal 2015, during which the industry made below-average annual purchases, (ii) there are approximately 177,000 buses in the United States and Canadian fleets that have been in service for 15 or more years, and (iii) the population of school age children is growing.
Local property and municipal tax receipts are key drivers of school district transportation budgets. Budgets for school bus purchases are directly related to property tax receipts, which are projected to continue a recovery that began in 2012. The forecast for continued appreciation in housing prices is expected to have a positive effect on property tax receipts going forward and school transportation budgets are expected to directly benefit from larger municipal spending budgets. We believe that incremental demand may be achieved as a result of (i) the average age of a school bus in service (approximately 11 years), and (ii) an increased student population during the period from 2013 to 2018 (based on information from the National Center of Education Studies, we expect total student enrollment in the United States to increase by over 2.0 million students from 2016 to 2023).
5
In addition to strong property tax collections, additional funding for school buses will become available in connection with the Volkswagen ("VW") settlement with the Federal Government in regard to emissions violations. Of the $14.7 billion in settlement funds, $2.9 billion was allocated to the VW Diesel Emissions Environmental Mitigation Trust for state government projects to reduce NOx output from ten categories; school buses are one of the ten categories. The mitigation trust funds are pro-rated for the population of affected VW engines in each state and must be spent within a ten-year period. Each state has the autonomy to develop a plan to mitigate NOx output utilizing their allocation within the ten specified categories. Including Washington DC and Puerto Rico, as of October 2018, 30 states had finalized plans, 17 states had draft plans, and five states were still in the development/public comment stage. Of the 30 finalized plans, we have identified approximately $167.0 million of potential funding opportunities, with $68.0 million being earmarked specifically for school buses.
Our management has developed a forecasting model using R.L. Polk vehicle registration data, population of school age children forecasts from the National Center for Education Statistics and bus ridership data collected and published by School Transportation News. Our management utilizes this internally developed model to assess historical experience and to predict demand for school buses in future periods. This model is also the source for all forward-looking market information provided with respect to the United States and Canadian school bus industry in this Report. The ability to purchase new buses to fulfill predicted demand, however, is based on the assumption that funds will be available through property taxes and other state sources. Should there be a significant downturn in property tax collections or in the availability of funds from other state sources, growth in the school bus industry could flatten or decline.
Our Competitive Strengths
We believe that our competitive strengths are derived from the following factors:
Reputation for safety, product quality/reliability/durability, and drivability. Our longevity and reputation in the school bus industry have made us an iconic American brand. We are the only principal manufacturer with chassis and body production specifically designed for school bus applications and the only school bus company to offer compliance with industry recognized safety tests-Altoona Testing, Colorado Rack Test and the Kentucky Pole Test-as a standard specification across our entire product line.
Alternative fuel leadership. We are the market leader in propane, gasoline, and CNG fuel powered-buses, having sold approximately eight times more alternative fuel school buses than all of our competitors combined from fiscal 2010 through fiscal 2018. In fiscal 2018 we sold 4,428 propane, gasoline, CNG, and electric powered buses, an increase of 13.9% versus the prior year.
Innovative product leadership. We have consistently led the school bus industry with innovative product leadership through several industry firsts, including the first Type D CNG school bus, the first unique school bus chassis, and the first OEM-manufactured propane bus. In fiscal 2016, we launched the industry's only gasoline powered Type C bus (utilizing an exclusive Ford and Roush CleanTech powertrain), and we were first-to-market with Electronic Stability Control and the new Eaton transmissions as available options. Also in 2016, we launched a new CNG product using a Ford engine and transmission and a Roush Clean Tech fuel delivery system to provide CNG in a Type C bus. In fiscal 2018, we sold our first Type D electric vehicles. Our research and development costs totaled $8.4 million, $7.0 million, and $5.4 million for the fiscal years ended 2018, 2017, and 2016, respectively.
Strong distribution model. We have built an extensive, experienced network of 50 dealers to distribute our buses across the United States and Canada, and during recent years have significantly enhanced our relationships with large fleet operators. Our dealers have an average tenure of more than 28 years with us and do not sell competing Type C or Type D school bus products in the areas assigned to them by us.
Highly-skilled and committed workforce. We benefit from a highly-skilled, committed hourly workforce of approximately 1,943 people (full-time and part-time hourly employees) that support our customized assembly operations at our 900,000 square foot integrated chassis manufacturing and body assembly facility and 340,000 square foot component fabrication facility. Our employees are trained to maximize production efficiency by following customized processes developed by us.
Strong management team. We are led by a highly experienced and committed management team with an established track record in the United States and Canadian school bus industry.
Sales Volume
In fiscal 2018, we sold 11,649 Type C and Type D buses, including 11,137 school buses, 172 commercial buses, 20 export buses and 320 GSA (Government Services Administration) buses. Our Type C school bus accounted for 79% of unit sales and our Type D school bus accounted for 17% of unit sales. Commercial, GSA and export buses, which can be ordered with either the Type C or Type D chassis, accounted for the remaining 4% of unit sales.
6
Our Dealer Network
In fiscal 2018, we sold approximately 92% of our vehicles through our United States and Canadian dealer network, currently consisting of 50 dealers that, in their territories, are exclusive to us with Type C and D school buses. School buses sold in the United States and Canada through our dealer network are purchased by school districts and private schools, as well as small and medium size contractors that provide services to school districts on a fee basis. Bus purchases and contractor fees are funded through local school district budgets. Purchases of school buses are typically made through a bid process at the district or state level, with dealers coordinating this process. Dealers develop collaborative relationships with school districts, district transportation directors, and key officials in their states.
Our dealers have access to financing through Blue Bird Capital Services (“BBCS”), a private-label financing product maintained by an independent third party, TCF Inventory Finance, Inc. We do not assume any balance sheet risk with respect to this type of financing and do not receive any direct economic benefit from BBCS.
Other Distribution Channels
Fleet Operators. We also sell school buses directly to large national fleets that span multiple states and such sales are managed internally by our National Account Sales Team.
Export Dealers. We regularly monitor opportunities to sell our Type C and Type D buses in either school bus or other configurations in international markets and typically sell these products through dealers assigned to those territories.
U.S. Government; Other Specialty Sales. We also sell buses through our United States General Services Administration (“GSA”) contract, an expedited procurement procedure designed to meet the needs of bus customers authorized to purchase through the GSA contracting offices, including the U.S. Air Force, U.S. Army, Homeland Security and the U.S. Department of Agriculture. This full line of bus models is configured for adult or school bus use. In addition to the base GSA specifications, we offer several additional configurations to provide a wide range of passenger capacities and optional features. We also offer a full line of activity bus and Multi-Function School Activity Bus (“MFSAB”) products. With varying vehicle sizes, capacities, fuel choices, and engine types, our bus options enable our customers to tailor their transportation solutions to their specific needs, be it transporting a church congregation or shuttling workers to job sites.
Government Contracts
As a U.S. government contractor, we are subject to specific regulations and requirements as mandated by our contracts. These regulations include Federal Acquisition Regulations, Defense Federal Acquisition Regulations, and the Code of Federal Regulations. We are also subject to routine audits and investigations by U.S. government agencies such as the Defense Contract Management Agency and Defense Contract Audit Agency. These agencies review and assess compliance with contractual requirements, cost structure, cost accounting, and applicable laws, regulations, and standards.
A portion of our existing U.S. government contracts extend over multiple years and are conditioned upon the continuing availability of congressional appropriations. In addition, our U.S. government contracts generally permit the contracting government agency to terminate the contract, in whole or in part, either for the convenience of the government or for default based on our failure to perform under the contract.
Suppliers
We purchase our engine and transmission components on a single-source basis from major OEM manufacturers with sophisticated engineering, production and logistics capabilities, as reflected in the table below:
Component | OEM Supplier | |
Diesel engines | Cummins Inc. | |
Diesel emissions kits | Cummins Inc. | |
Propane, gasoline, and CNG (Type C) engines and transmissions | Ford Motor Company | |
Diesel transmissions | Allison Transmission | |
Propane, gasoline, and CNG (Type C) fueling kits | Roush CleanTech | |
Our purchasing department continually works to improve our purchasing processes by rationalizing the supplier base (reducing the supplier base by approximately one-third in the last five years) and by implementing improved control processes. We regularly perform supplier audits and, when necessary, will meet with underperforming suppliers in order to enhance performance. At September 29, 2018, we had in place long-term supply contracts (addressing both component price and supply) covering over 84% of the value of our purchases from suppliers, including long-term agreements with our major single-source suppliers.
7
Based on our experience to date and our relationships with our suppliers, we do not expect to be subject to sustained shortages on any material components, whether or not single-sourced.
Competition
The school bus industry is highly competitive. Our two principal competitors are Thomas Built Bus and IC Bus. Thomas Built Bus is a subsidiary of Daimler Trucks North America and IC Bus is a subsidiary of Navistar International.
We compete primarily on the basis of price, product diversification, school bus innovation, safety, quality, durability and drivability of our products, and the scope and strength of our dealer network. As our principal competitors are parts of larger corporations, our competitors may have greater access to financial capital, human resources, and business opportunities. Such access, in turn, may be used by such companies to compete with us and others in the industry.
Facilities
Our corporate headquarters are located in Macon, Georgia. Our Bus segment operates a fabrication plant and an integrated chassis manufacturing and body assembly plant in Fort Valley, Georgia, where components for Type C, Type D, and specialty buses are manufactured and assembled. Our Parts segment operates a parts distribution center located in Delaware, Ohio. We own our facilities in Fort Valley, Georgia (approximately 1.5 million square feet). We lease our facilities in Macon, Georgia (approximately .05 million square feet) and Delaware, Ohio (approximately 0.1 million square feet). Our Micro Bird joint venture leases its facility (0.1 million square feet) in Drummondville, Quebec, Canada.
Intellectual Property and Technology
We seek trademark protection in the United States and outside of the United States where available and when appropriate. Among other trademarks, we have registered trademark rights in the principal names and designs used by us and Micro Bird in the United States, Canada and elsewhere. We use these registered marks in connection with all aspects of our branding. However, we also rely on a number of significant unregistered trademarks and other unregistered intellectual property in the day-to-day operation of our business. Without the protections afforded by registration, our ability to protect and use our trademarks and other unregistered intellectual property may be limited and could negatively affect our business.
In addition to trademarks, we rely heavily on trade secrets and know-how to develop and maintain our competitive position. For example, significant aspects of our product designs, manufacturing processes and cost containment steps are based on unpatented trade secrets and know-how. Trade secrets and know-how can be difficult to protect. We seek to protect our proprietary technology and processes, in part, by confidentiality agreements with our employees, suppliers and other commercial partners. These agreements are designed to protect our proprietary information. We also seek to preserve the integrity and confidentiality of our data, designs and trade secrets by maintaining physical security of our premises and physical and electronic security of our information technology systems. While we have confidence in these individuals, organizations and systems, agreements or security measures may be breached, and we may not have adequate remedies for any breach. In addition, our trade secrets may otherwise become known or be independently discovered by competitors. To the extent that our suppliers or contractors use intellectual property owned by others in their work for us, disputes may arise as to the rights in related or resulting know-how.
Government Regulation
Our products must satisfy various legal, environmental, health and safety requirements at federal, state and municipal levels. Compliance with such requirements adds to the costs that must be incurred in order to manufacture a school bus. Failure to comply with such requirements could lead to substantial additional regulatory costs.
At the federal level, “FMVSS,” or Federal Motor Vehicle Safety Standards, govern the safety of all motor vehicles sold for use in the United States. More than half of the FMVSS regulations apply to school buses. For example, federal regulations require school buses to be painted “school bus yellow” and to be equipped with specific warning and safety devices. School buses are also built with the body on top of chassis frame rails. This so-called “high floor” construction moves the passenger compartment above the typical automotive “crash zone” and therefore provides an added measure of safety should a collision occur. Steel rollover cages and heavy duty bumpers are designed to provide incremental protection, in contrast with standard transit buses with “low floor” construction that offer lower curb height access with limited or no steel reinforcement.
8
After a school bus is sold, regulation of the operation of the school bus becomes the responsibility of the state in which it operates. Today, each state has its own rules and regulations pertaining to the manufacture, design, operation and safety of the school buses operated in their jurisdictions. As a result, we cannot manufacture to a single set of specifications, but rather must assure that each manufactured bus conforms to the specifications of the particular jurisdiction in which it will be operated.
We must also consider the rules and regulations of foreign jurisdictions. In Canada, where our Micro Bird joint venture operates, school buses are governed by the Canadian Motor Vehicle Safety Regulations. These regulations are patterned after the FMVSS regulations, although differences do exist between the two regulatory systems.
Seasonality
Our business is highly seasonal. Most school districts seek to buy their new school buses so that they will be available for use on the first day of the school year, typically in August to early September. As a result, our two busiest quarters are our third and fourth fiscal quarters, the latter ending on the Saturday closest to September 30. Our quarterly results of operations, cash flows, and liquidity are likely to be impacted by these seasonal patterns. For example, our revenues are typically highest in our third and fourth fiscal quarters. Working capital, on the other hand, is typically a significant use of cash during the first fiscal quarter and a significant source of cash generation in the fourth fiscal quarter. We typically conduct planned shutdowns during our first fiscal quarter.
Environmental Matters
We are subject to various federal, state and local laws and regulations governing the protection of the environment and health and safety, including those regulating the following: soil, surface water and groundwater contamination; the generation, storage, handling, use, disposal and transportation of hazardous materials; the emission and discharge of materials, including greenhouse gases (“GHGs”) into the environment; and the health and safety of our employees. We are also required to obtain environmental permits from governmental authorities for certain operations. We have taken various steps to comply with these numerous and sometimes complex laws, regulations and permits. Compliance with environmental requirements historically has not had a material impact on our capital expenditures, earnings, or competitive position. We have made, and will continue to make, capital and other expenditures pursuant to such requirements. If we violate or fail to comply with these requirements, we could be subject to fines, penalties, enforcement actions or lawsuits.
For additional information regarding potential environmental issues at Blue Bird’s Fort Valley, Georgia facility, refer to Item 1A. “Risk Factors - Risk Factors Relating to Our Business and Industry - Environmental obligations and liabilities could have a negative impact on our financial condition, cash flows and profitability."
Environmental laws, regulations, and permits and the enforcement thereof, change frequently and have become more stringent over time. Among other things, more rigorous GHG emission requirements are in various stages of development. For example, the United States Environmental Protection Agency (“U.S. EPA”) has promulgated the GHG Reporting Rule, which requires reporting of GHG data and other relevant information from large sources and suppliers in the United States, and the GHG Tailoring Rule, which requires certain facilities with significant GHG emissions to obtain emissions permits under the authority of the Clean Air Act (typically limited to only the largest stationary sources of GHGs). The United States Congress has also considered imposing additional restrictions on GHG emissions. Any additional regulation of GHG emissions by either the United States Congress and/or the U.S. EPA could include a cap-and-trade system, technology mandate, emissions tax, reporting requirement, or other program and could subject us to significant costs, including those relating to emission credits, pollution control equipment, monitoring, and reporting, as well as increased energy and raw material prices.
Our facilities and operations could in the future be subject to regulation related to climate change and climate change itself may also have some impact on the Company’s operations. However, these impacts are currently uncertain and the Company cannot presently predict the nature and scope of those impacts.
Research and Development
Research and development costs were $8.4 million, $7.0 million, and $5.4 million for the fiscal years ended 2018, 2017, and 2016, respectively. Refer to Note 2, Summary of Significant Accounting Policies and Recently Issued Accounting Standards, to the accompanying consolidated financial statements for further information on research and development.
9
Warranty
We provide warranties on all of the buses and parts we sell. Warranties are offered for specific periods of time and mileage, and vary depending upon the type of product and the geographic location of its sale. Pursuant to these warranties, we will repair, replace, or adjust all parts on a bus that are defective in factory-supplied materials or workmanship during the specified warranty period. In addition to the costs associated with this warranty coverage provided on our vehicles, we also incur costs as a result of field service actions (i.e., safety recalls and service bulletins), and customer satisfaction actions.
Legal Proceedings
We are engaged in legal proceedings in the ordinary course of our business. Although no assurances can be given about the final outcome of pending legal proceedings, at the present time our management does not believe that the resolution or outcome of any of our pending legal proceedings will have a material adverse effect on our financial condition, liquidity or results of operations.
Backlog
We define order backlog ("backlog") as orders received but yet to be built and sold as of the end of the fiscal period. The backlog may be cancellable within a certain period and may not represent guarantees of purchases by customers or dealers.
The following table provides our worldwide backlog:
(dollars in millions) | Units | Value | ||||
2018 | 1,415 | $ | 125.2 | |||
2017 | 1,446 | $ | 128.7 | |||
Employees
At September 29, 2018, we employed 2,237 employees, consisting of 1,943 full-time and part-time hourly employees and 294 salaried employees. Our workforce is non-union.
10
Item 1A. Risk Factors
You should carefully consider the following risk factors in addition to the other information included in this Report, including matters addressed in the section entitled “Cautionary Note Regarding Forward-Looking Statements.” We may face additional risks and uncertainties that are not presently known to us, or that we currently deem immaterial, which may also impair our business. The following discussion should be read in conjunction with the financial statements and notes to the financial statements included in this Report.
Risk Factors Relating to Our Business and Industry
General economic conditions in the markets we serve have a significant impact on demand for our buses.
The school bus market is predominantly driven by long-term trends in the level of spending by municipalities. The principal factors underlying spending by municipalities are housing prices, property tax levels, municipal budgeting issues and voter initiatives. Demand for school buses is further influenced by overall acquisition priorities of municipalities, availability of school bus financing, student population changes, school district busing policies, price and other competitive factors, fuel prices and environmental regulations. Significant deterioration in the economic environment, housing prices, property tax levels or municipal budgets could result in fewer new orders for school buses or could cause customers to seek to postpone or reduce orders, which could result in lower revenues, profitability and cash flows.
Our products may not achieve or maintain market acceptance or competing products could gain market share, which could adversely affect our competitive position.
We operate in a highly competitive domestic market. Our principal competitors are Thomas Built Bus (owned by Daimler Trucks North America) and IC Bus (owned by Navistar International), which, at the consolidated level, have potential access to more technical, financial and marketing resources than our Company. Our competitors may develop or gain access to products that are superior to our products, develop methods of more efficiently and effectively providing products and services, or adapt more quickly than we do to new technologies or evolving customer requirements. IC Bus sells and Thomas Built Bus has sold propane-powered school buses. This brings IC Bus (and potentially Thomas Built Bus should they reenter the market) into direct competition with our propane-powered school buses. Our competitors may achieve cost savings or be able to withstand a substantial downturn in the market because their businesses are consolidated with other vehicle lines. In addition, our competitors could be, and have been in the past, vertically integrated by designing and manufacturing their own components (including engines) to reduce their costs. The school bus market does not have “Buy America” regulations, so competitors or new entrants to the market could manufacture school buses in more cost-effective jurisdictions and import them to the United States to compete with us. Any increase in competition may cause us to lose market share or compel us to reduce prices to remain competitive, which could result in reduced sales and earnings.
We continue to optimize our product offerings to meet customer needs and specifications. While we target product offerings to meet customer needs, there is no assurance that our product offerings will be embraced and that we will meet our sales projections.
Our business is cyclical, which has had, and could have future, adverse effects on our sales and results of operations and lead to significant shifts in our results of operations from quarter to quarter that make it difficult to project long-term performance.
The school bus market historically has been and is expected to continue to be cyclical. This cyclicality has an impact both on the school bus industry and also on the comparative analysis of quarterly results of our Company.
Customers historically have replaced school buses in lengthy cycles. Moreover, weak macroeconomic conditions can adversely affect demand for new school buses and lead to an overall aging of school bus fleets beyond a typical replacement cycle. While United States and Canadian demand for school buses has steadily increased since 2011, that increase may be partially attributable to the lower volume of purchases during the sustained downturn from 2007 to 2011 and historically low industry sales in 2011. To the extent the increase in school bus demand is attributable to pent-up demand rather than overall economic growth, future school bus sales may lag behind improvements in general economic conditions or property tax levels.
During downturns, we may find it necessary to reduce line rates and employee levels due to lower overall demand. An economic downturn may reduce, and in the past has reduced, demand for school buses, resulting in lower sales volumes, lower prices and decreased profits.
Primarily as a result of the seasonal nature of our business, we operate with negative working capital for significant portions of our fiscal year. During economic downturns, this tends to result in our utilizing a substantial portion of our cash reserves. On the other hand, when economic factors favor growth in the school bus industry, we can be positioned to generate significant sums of cash.
11
We may be unable to obtain critical components from suppliers, which could disrupt or delay our ability to deliver products to customers.
We rely on specialist suppliers for critical components (including engines, transmissions and axles) and replacement of any of these components with like parts from another supplier normally requires engineering and testing procedures, which entail costs and take time. The lack of ready-to-implement alternatives could give such suppliers, some of which have substantial market power, significant leverage over us if these suppliers elected to exert their market power over us, which leverage could adversely impact the terms and conditions, including pricing and delivery schedules, pursuant to which we purchase these products from these suppliers. We seek to mitigate the risk of losing supply from our key suppliers by entering into long-term agreements, by commencing contract negotiations with suppliers of critical components significantly before contract expiration dates and by diversifying our suppliers of key components when possible.
If any of our critical component suppliers limit or reduce the supply of components due to commercial reasons, financial difficulties or other problems that prevent them from supplying us with the necessary components, we could experience a loss of revenues due to our inability to fulfill orders. These single-source and other suppliers are each subject to quality and performance issues, materials shortages, excess demand, reduction in capacity and other factors that may disrupt the flow of goods to us or to our customers, which would adversely affect our business and customer relationships.
We have no assurance that our suppliers will continue to meet our requirements. If supply arrangements are interrupted, we may not be able to find another supplier on a timely or satisfactory basis. We may incur significant set-up costs, delays and lag time in manufacturing should it become necessary to replace any key suppliers due to work stoppages, shipping delays, financial difficulties, natural or man-made disasters, cyber-attacks or other factors. In addition, strikes, work stoppages or other types of conflicts with labor organizations or employees at a supplier’s facility could delay the production and/or development of the components that they supply to us, which could strain relationships with our customers and cause a loss of revenues which could materially adversely affect our operations. Our business interruption insurance coverage may not be adequate for any such factors that we could encounter and may not continue to be available in amounts and on terms acceptable to us. Production delays could, under certain circumstances, result in penalties or liquidated damages in certain of our General Services Administration (“GSA”) contracts. In addition to the general risks described above regarding interruption of supplies, which are exacerbated in the case of single-source suppliers, the exclusive supplier of a key component potentially could exert significant bargaining power over price, warranty claims or other terms relating to a component.
Our ability to sell our products may be affected by trade policies and tariffs.
We import some of our components from the People's Republic of China and other foreign countries. Our purchases may be subject to the effects of the United States trade policy, including the imposition of tariffs on these components. We cannot assure you that our ability to sell our products at reasonable margins will not be impaired by the imposition of tariffs or other changes in trade policy which may make it more difficult or more expensive to purchase our products.
We rely substantially on single-source suppliers which could materially and adversely impact us if they were to interrupt the supply of component parts to us.
We currently rely on a limited number of single-source suppliers for important bus parts such as diesel engines and emission components, propane and gasoline engines including powertrains, control modules, steering systems, seats, plastics and fiberglass, as well as other key components. Shortages and allocations by such manufacturers may result in inefficient operations and a build-up of inventory, which could negatively affect our working capital position.
New laws, regulations or policies of governmental organizations regarding environmental, health and safety standards, or changes in existing ones, may have a significant negative effect on how we do business.
Our products must satisfy various legal, environmental, health and safety requirements, including applicable emissions and fuel economy requirements. Meeting or exceeding government-mandated safety standards can be difficult and costly. Such regulations are extensive and may, in certain circumstances, operate at cross purposes. While we are managing our product development and production operations to reduce costs, unique local, state, federal and international standards can result in additional costs for product development, testing and manufacturing. We depend on third party sole-source suppliers to comply with applicable emissions and fuel economy standards in the manufacture of engines supplied to us for our buses. Increased environmental, safety, emissions, fuel economy or other regulations may result in additional costs and lag time to introduce new products to market.
12
Safety or durability incidents associated with a school bus malfunction may result in loss of school bus sales that could have material adverse effects on our business.
The school bus industry has few competitors due to the importance of brand and reputation for safety and durability, compliance with stringent safety and regulatory requirements, an understanding of the specialized product specifications in each region and specialized technological and manufacturing know-how. If incidents associated with school bus malfunction transpired that called into question our reputation for safety or durability, it could harm our brand and reputation and cause consumers to question the safety, reliability and durability of our products. Lost school bus sales resulting from safety or durability incidents associated with a school bus malfunction could materially adversely affect our business.
Disruption of our manufacturing and distribution operations would have an adverse effect on our financial condition and results of operations.
We manufacture school buses at two facilities in Fort Valley, Georgia and distribute parts from a distribution center located in Delaware, Ohio. If operations at our manufacturing or distribution facilities were to be disrupted for a significant length of time as a result of significant equipment failures, natural disasters, power outages, fires, explosions, terrorism, adverse weather conditions, labor disputes, cyber-attacks or other reasons, we may be unable to fill dealer or customer orders and otherwise meet demand for our products, which would have an adverse effect on our business, financial condition and results of operations. Any interruption in production or distribution capability could require us to make substantial capital expenditures to fill customer orders, which could negatively affect our profitability and financial condition. We maintain property damage insurance that we believe to be adequate to provide for reconstruction of facilities and equipment, as well as business interruption insurance to mitigate losses resulting from any production interruption or shutdown caused by an insured loss. However, any recovery under our insurance policies may not offset the lost sales or increased costs that may be experienced during the disruption of operations, which could adversely affect our financial performance. Also, our property damage and business interruption insurance coverage may not be applicable or adequate for any such disruption that we could encounter and may not continue to be available in amounts and on terms acceptable to us.
Rationalization or restructuring of manufacturing facilities, including plant expansions and system upgrades at our manufacturing facilities, may cause production capacity constraints and inventory fluctuations.
The rationalization of our manufacturing facilities has at times resulted in, and similar rationalizations or restructurings in the future may result in, temporary constraints upon our ability to produce the quantity of products necessary to fill orders and thereby complete sales in a timely manner. In addition, system upgrades at our manufacturing facilities that impact ordering, production scheduling and other related manufacturing processes are complex, and could impact or delay production targets. A prolonged delay in our ability to fill orders on a timely basis could affect customer demand for our products and increase the size of our raw material inventories, causing future reductions in our manufacturing schedules and adversely affecting our results of operations. Moreover, our continuous development and production of new products will often involve the retooling of existing manufacturing equipment. This retooling may limit our production capacity at certain times in the future, which could materially adversely affect our results of operations and financial condition. In addition, the expansion, reconfiguration, maintenance and modernization of existing manufacturing facilities and the start-up of new manufacturing operations, could increase the risk of production delays and require significant investments of capital.
We may incur material losses and costs related to product warranty claims.
We are subject to product warranty claims in the ordinary course of our business. Our standard warranty covers the bus for one year and certain components for up to five years. We attempt to adequately price ongoing warranty costs into our bus purchase contracts; however, our warranty reserves are estimates and if we produce poor quality products, develop new products with deficiencies or receive defective materials or components, we may incur material unforeseen costs in excess of what we have provided for in our contracts or reserved in our financial statements.
In addition, we may not be able to enforce warranties and extended warranties received or purchased from our suppliers if such suppliers refuse to honor such warranties or go out of business. Also, a customer may choose to pursue remedies directly under its contract with us over enforcing such supplier warranties. In such a case, we may not be able to recover our losses from the supplier.
13
We may incur material losses and costs as a result of product liability claims and recalls.
We face an inherent risk of exposure to product liability claims if the use of our products results, or is alleged to result, in personal injury and/or property damage. If we manufacture a defective product or if component failures result in damages that are not covered by warranty provisions, we may experience material product liability losses in the future. In addition, we may incur significant costs to defend product liability claims. We could also incur damages and significant costs in correcting any defects, lose sales and suffer damage to our reputation. Our product liability insurance coverage may not be adequate for all liabilities we could incur and may not continue to be available in amounts and on terms acceptable to us. Significant product liability claims could have a material adverse effect on our financial condition, results of operations and cash flows. Moreover, the adverse publicity that may result from a product liability claim or perceived or actual defect with our products could have a material adverse effect on our ability to market our products successfully.
We are subject to potential recalls of our products from customers to cure manufacturing defects or in the event of a failure to comply with customers’ order specifications or applicable regulatory standards, as well as potential recalls of components or parts manufactured by suppliers which we purchase and incorporate into our school buses. We may also be required to remedy or retrofit buses in the event that an order is not built to a customer’s specifications or where a design error has been made. Significant retrofit and remediation costs or product recalls could have a material adverse effect on our financial condition, results of operations and cash flows.
A failure to renew dealer agreements or cancellation of, or significant delay in, new bus orders may result in unexpected declines in revenue and profitability.
We rely to a significant extent on our dealers to sell our products to the end consumer. A loss of one or more significant dealers or a reduction in the market share of existing dealers would lead to a loss of revenues that could materially adversely affect our business and results of operations.
Our dealer agreements are typically for a five-year term; however, the dealer can usually cancel the agreement for convenience without penalty upon 90 days’ notice. While most of our dealers have been purchasing from us for more than two decades, we can provide no assurance that we will be able to renew our dealer agreements on favorable terms, or at all, at their scheduled expiration dates. If we are unable to renew a contract with one or more of our significant dealers, our revenues and results of operations could be adversely affected until an alternative solution is implemented (e.g., a new dealer or combining the territory with another, existing Blue Bird dealer). If dealer agreements are terminated with one or more of our top 10 dealers, significant orders are canceled or delayed or we incur a significant decrease in the level of purchases from any of our top 10 dealers, our sales and operating results would be adversely impacted. In addition, our new bus orders are subject to potential reduction, cancellation and/or significant delay. Although dealers generally only order buses from us after they have a firm order from a school district, orders for buses are also generally cancelable until 14 weeks prior to delivery.
The inability to attract and retain key personnel could adversely affect our business and results of operations.
Our ability to operate our business and implement our strategies depends, in part, on the efforts of our executive officers and other key employees. Our future success depends, in large part, on our ability to attract and retain qualified personnel, including manufacturing personnel, sales professionals and engineers. The unexpected loss of services of any of our key personnel or the failure to attract or retain other qualified personnel could have a material adverse effect on the operation of our business.
While we have enjoyed good relations and a collaborative approach with our work force, employment relationships can deteriorate over time. Given the extent to which we rely on our employees, any significant deterioration in our relationships with our key employees or overall workforce could materially harm us. We cannot predict how stable our relationships with our employees will be in the future and we may experience work stoppages or labor organizing activity in the future, which could adversely affect our business. Work stoppages or instability in our relationships with our employees could delay the production and/or development of our products, which could strain relationships with customers and cause a loss of revenues which would adversely affect our operations. In addition, local economic conditions in the Central Georgia area (where both of our principal manufacturing facilities are located) may impact our ability to attract and retain qualified personnel.
Changes in laws or regulations, or a failure to comply with any laws and regulations, may adversely affect our business and results of operations.
We are subject to laws and regulations enacted by national, regional and local governments, including non-U.S. governments. In particular, we are required to comply with certain SEC and other legal requirements, as well as laws and regulations regarding the manufacture of school buses. Compliance with, and monitoring of, applicable laws and regulations may be difficult, time consuming and costly. Those laws and regulations and their interpretation and application may also change from time to time and those changes could have a material adverse effect on our business and results of operations. In addition, a failure to comply with applicable laws or regulations, as interpreted and applied, could have a material adverse effect on our business and results of operations.
14
Our products must satisfy a complex compliance scheme due to variability in and potentially conflicting local, state, federal and international laws and regulations. The cost of compliance may be substantial in a period due to the potential for modification or customization of our school buses in any of the 50 plus jurisdictions. In addition, if we expand into more international jurisdictions, we could potentially incur additional costs in order to tailor our products to the applicable local law requirements of such jurisdictions. Further, we must comply with additional regulatory requirements applicable to us as a federal contractor for our GSA contracts, which increases our costs. GSA contracts are also subject to audit and increased inspections and costs of compliance. Any potential penalties for non-compliance with laws and regulations may not be covered by insurance that we carry.
Environmental obligations and liabilities could have a negative impact on our financial condition, cash flows and profitability.
Potential environmental issues have been identified at our facility in Fort Valley, Georgia, including the solid waste management units at the facility’s old landfill. Potential remediation costs and obligations could require the expenditure of capital and, if greater than expected, or in excess of applicable insurance coverage, could have a material adverse effect on our results of operations, liquidity or financial condition. We are cooperating with the Georgia Environmental Protection Division and have conducted a site-wide investigation under the current hazardous waste management law. All investigations of suspect areas have been completed. Implementation of a corrective action plan is forthcoming, which will consist of re-surfacing the landfill cap, possible monitoring, and ground water use restrictions for the old landfill. There are currently no proposed remediation actions to be included in the corrective action plan. Based on the data generated from the latest site investigation, we believe our environmental risks have been reduced.
Our worker’s compensation insurance may not provide adequate coverage against potential liabilities.
Although we maintain a workers’ compensation insurance stop loss policy to cover us for costs and expenses we may incur due to injuries to our employees resulting from work-related injuries over our self-insured limit, this insurance may not provide adequate coverage against potential liabilities as we incur the costs and expenses up to our self-insured limit. In addition, we may incur substantial costs in order to comply with current or future health and safety laws and regulations. These current or future laws and regulations may negatively impact our manufacturing operations. Failure to comply with these laws and regulations also may result in substantial fines, penalties or other sanctions.
Our future competitiveness and ability to achieve long-term profitability depend on our ability to control costs, which requires us to improve our organization continuously and to increase operating efficiencies and reduce costs.
In order to operate profitably in our market, we are continually transforming our organization and rationalizing our operating processes. Our future competitiveness depends upon our continued success in implementing these initiatives throughout our operations. While some of the elements of cost reduction are within our control, others, such as commodity costs, regulatory costs and labor costs, depend more on external factors, and there can be no assurance that such external factors will not materially adversely affect our ability to reduce our costs.
Our operating results may vary widely from period to period due to the sales cycle, seasonal fluctuations and other factors.
Our orders with our dealers and customers generally require time-consuming customization and specification. We incur significant operating expenses when we are building a bus prior to sale or designing and testing a new bus. If there are delays in the sale of buses to dealers or customers, such delays may lead to significant fluctuations in results of operations from quarter to quarter, making it difficult to predict our financial performance on a quarterly basis. Further, if we were to experience a significant amount of cancellations of or reductions in purchase orders, it would reduce our future sales and results of operations.
Our business is subject to seasonal and other fluctuations. In particular, we have historically experienced higher revenues during the third quarter and fourth quarter versus the first quarter and second quarter during each fiscal year. This seasonality is caused primarily by school districts ordering more school buses prior to the beginning of a school year. Our ability to meet customer delivery schedules is dependent on a number of factors including, but not limited to, access to components and raw materials, an adequate and capable workforce, assembling/engineering expertise for certain projects and sufficient manufacturing capacity. The availability of these factors may in some cases be subject to conditions outside of our control. A failure to deliver in accordance with our performance obligations may result in financial penalties under certain of our GSA contracts and damage to existing customer relationships, damage to our reputation and a loss of future bidding opportunities, which could cause the loss of future business and could negatively impact our financial performance.
15
Our defined benefit pension plans are currently underfunded and pension funding requirements could increase significantly due to a reduction in funded status as a result of a variety of factors, including weak performance of financial markets, declining interest rates and investments that do not achieve adequate returns.
Our employee benefit plans currently hold a significant amount of equity and fixed income securities. Our future funding requirement for our frozen defined benefit pension plan (“Pension Plan”) qualified with the Internal Revenue Service depends upon the future performance of assets placed in trusts for this plan, the level of interest rates used to determine funding levels, the level of benefits provided for by the Pension Plan and any changes in government laws and regulations. Future funding requirements generally increase if the discount rate decreases or if actual asset returns are lower than expected asset returns, as other factors are held constant. If future funding requirements increase, we would be required to contribute more funds, which would negatively affect our cash flows.
We enter into firm fixed-price school bus sales contracts without price escalation clauses which could subject us to losses if we have cost overruns or if our costs increase.
We often bid on contracts weeks or months before school buses are delivered and enter into school bus sales contracts with fixed prices per bus. The sales contracts generally do not have an indexed price escalation formula to account for economic fluctuations between the contract date and the delivery date. As a result, we typically are unable to pass along increased costs due to economic fluctuations to our customers. We generally purchase steel one quarter in advance, but because we generally do not hedge our other primary raw materials (rubber, aluminum and copper), changes in prices of raw materials can significantly impact operating margins. Our actual costs and any gross profit realized on these fixed-price contracts could vary from the estimated costs on which these contracts were originally based.
Our current or future indebtedness could impair our financial condition and reduce the funds available to us for growth or other purposes. Our debt agreements impose certain operating and financial restrictions, with which failure to comply could result in an event of default that could adversely affect our results of operations.
We have substantial indebtedness. If our cash flows and capital resources are insufficient to fund the interest payments on our outstanding borrowings under our credit facility and other debt service obligations and keep us in compliance with the covenants under our debt agreements or to fund our other liquidity needs, we may be forced to reduce or delay capital expenditures, sell assets or operations, seek additional capital or restructure or refinance our indebtedness. We cannot assure investors that we would be able to take any of these actions, that these actions would permit us to meet our scheduled debt service obligations or that these actions would be permitted under the terms of our existing or future debt agreements, which may impose significant operating and financial restrictions on us and could adversely affect our ability to finance our future operations or capital needs; obtain standby letters of credit, bank guarantees or performance bonds required to bid on or secure certain customer contracts; make strategic acquisitions or investments or enter into alliances; withstand a future downturn in our business or the economy in general; engage in business activities, including future opportunities for growth, that may be in our interest; and plan for or react to market conditions or otherwise execute our business strategies.
If we cannot make scheduled payments on our debt, or if we breach any of the covenants in our debt agreements, we will be in default and, as a result, our lenders could declare all outstanding principal and interest to be due and payable, could terminate their commitments to lend us money and foreclose against the assets securing our borrowings, and we could be forced into bankruptcy or liquidation.
In addition, we and certain of our subsidiaries may incur significant additional indebtedness, including additional secured indebtedness. Although the terms of our debt agreements contain restrictions on the incurrence of additional indebtedness, these restrictions are subject to a number of qualifications and exceptions, and additional indebtedness incurred in compliance with these restrictions could be significant. Incurring additional indebtedness could increase the risks associated with our substantial indebtedness, including our ability to service our indebtedness.
Our profitability depends on achieving certain minimum school bus sales volumes and margins. If school bus sales deteriorate, our results of operations and financial condition will suffer.
Our continued profitability requires us to maintain certain minimum school bus sales volumes and margins. As is typical for a vehicle manufacturer, we have significant fixed costs and, therefore, changes in our school bus sales volume can have a disproportionately large effect on profitability. If our school bus sales were to decline to levels significantly below our assumptions, due to a financial downturn, renewed recessionary conditions, changes in consumer confidence, geopolitical events, inability to produce sufficient quantities of school buses, limited access to financing or other factors, our financial condition and results of operations would be materially adversely affected.
16
We may need additional financing to execute our business plan and fund operations, which additional financing may not be available on reasonable terms or at all.
Our future growth, including the potential for future market expansion and opportunities for future international growth, may require substantial additional capital. We will consider raising additional funds through various financing sources, including the sale of our equity securities or the procurement of additional commercial debt financing. However, there can be no assurance that such funds will be available on commercially reasonable terms, if at all. If such financing is not available on satisfactory terms, we may be unable to execute our growth strategy, and operating results may be adversely affected. Any additional debt financing will increase expenses and must be repaid regardless of operating results and may involve restrictions limiting our operating flexibility. If we issue equity securities to raise additional funds, the percentage ownership of our existing stockholders will be reduced, and our stockholders may experience additional dilution in net book value per share.
Our ability to obtain financing may be impaired by such factors as the capital markets, both generally and specifically in our industry, which could impact the availability or cost of future financings. If the amount of capital we are able to raise from financing activities, together with our revenues from operations, are not sufficient to satisfy our capital needs, we may be required to decrease the pace of, or eliminate, our future product offerings and market expansion opportunities and potentially curtail operations.
Interest rates could change substantially, materially impacting our profitability.
Our borrowings under our credit facility are at variable rates of interest and expose us to interest rate risk. We monitor and manage this exposure as part of our overall risk management program, which recognizes the unpredictability of interest rates and seeks to reduce potentially adverse effects on our business. The majority of our debt interest payments are protected against increasing short-term rates; however, changes in interest rates cannot always be predicted, hedged, or offset with price increases to eliminate earnings volatility.
If we do not maintain an effective system of internal control over financial reporting, we may not be able to accurately report our financial results.
A material weakness is a deficiency or a combination of deficiencies in internal control over financial reporting such that there is a reasonable possibility that a material misstatement of the annual or interim financial statements will not be prevented or detected on a timely basis.
Deficiencies in internal control over financial reporting are matters that may require an extended period to remediate. We will continue to evaluate, design and implement policies and procedures to address deficiencies to maintain adequate internal control over financial reporting as a public company.
Internal control over financial reporting, no matter how well designed and operated, can provide only reasonable, not absolute, assurance that the control objectives will be met. These inherent limitations include system errors, the potential for human error and unauthorized actions of employees or contractors, inadequacy of controls, temporary lapses in controls due to shortfalls in transition planning and oversight or resources, and other factors. Consequently, such controls may not prevent or detect misstatements in our reported financial results as required under SEC and NASDAQ rules, which could increase our operating costs or impair our ability to operate our business. Controls may also become inadequate due to changes in circumstances, and it is necessary to replace, upgrade or modify our internal information systems from time to time.
If management is not successful in maintaining a strong internal control environment, material weaknesses could occur, causing investors to lose confidence in our reported financial information. This could lead to a decline in our stock price, limit our ability to access the capital markets in the future, and require us to incur additional costs to improve our internal control systems and procedures.
An impairment in the carrying value of goodwill and other long-lived intangible assets could negatively affect our operating results.
We have a substantial amount of goodwill and purchased intangible assets on our balance sheet, concentrated in our bus segment and specifically related to the dealer network and our trade name. The carrying value of goodwill represents the fair value of an acquired business in excess of identifiable assets and liabilities as of the acquisition date. The carrying value of other long-lived intangible assets represents the fair value of trademarks and trade names, customer relationships and technology as of the acquisition date. Under generally accepted accounting principles, long-lived assets are required to be reviewed for impairment at least annually, or more frequently if potential interim indicators exist that could result in impairment. If any business conditions or other factors cause profitability or cash flows to significantly decline, we may be required to record a non-cash impairment charge, which could adversely affect our operating results. Events and conditions that could result in impairment include a prolonged period of global economic weakness, a further decline in economic conditions or a slow, weak economic recovery, sustained declines in the price of our Common Stock, adverse changes in
17
the regulatory environment, adverse changes in the market share of our products, adverse changes in interest rates or other factors leading to reductions in the long-term sales or profitability that we expect.
If Blue Bird Capital Services cannot provide financial services to our dealers and customers to acquire our products, our sales and results of operations could deteriorate.
Our dealers and customers benefit from Blue Bird Capital Services (“BBCS”), a private label financing product. BBCS finances floorplan financing for certain of our network dealers and provides a modest amount of vehicle lease financing to school districts. Although we neither assume any balance sheet risk nor receive any direct economic benefit from BBCS, which is financed by TCF Inventory Finance, Inc. we could be materially adversely affected if BBCS were unable to provide this financing and our dealers were unable to obtain alternate financing, at least until we were able to put in place a replacement for BBCS. BBCS faces a number of business, economic and financial risks that could impair its access to capital and negatively affect its business and operations and its ability to provide financing and leasing to our dealers and customers. Because BBCS serves as an additional source of leasing and financing options for dealers and customers, an impairment of BBCS’ ability to provide such financial services could negatively affect our efforts to expand our market penetration among customers who rely on these financial services to acquire new school buses and dealers who seek financing.
We rely heavily on trade secrets to gain a competitive advantage in the market and the unenforceability of our nondisclosure agreements may adversely affect our operations.
Historically, we have not relied upon patents to protect our design or manufacturing processes or products. Instead, we rely significantly on maintaining the confidentiality of our trade secrets and other information related to our operations. Accordingly, we require all executives, engineering employees and suppliers to sign a nondisclosure agreement to protect our trade secrets, business strategy and other proprietary information. If the provisions of these agreements are found unenforceable in any jurisdiction in which we operate, the disclosure of our proprietary information may place us at a competitive disadvantage. Even where the provisions are enforceable, the confidentiality clauses may not provide adequate protection of our trade secrets and proprietary information in every such jurisdiction.
We require training sessions for our employees regarding the protection of our trade secrets, business strategy and other proprietary information. Our employee training may not provide adequate protection of our trade secrets and proprietary information.
We may be unable to prevent third parties from using our intellectual property rights, including trade secrets and know-how, without our authorization or from independently developing intellectual property that is the same as or similar to our intellectual property, particularly in those countries where the laws do not protect our intellectual property rights as fully as in the United States. The unauthorized use of our trade secrets or know-how by third parties could reduce or eliminate any competitive advantage we have developed, cause us to lose sales or otherwise harm our business or increase our expenses as we attempt to enforce our rights.
Our intellectual property rights may not be successfully asserted in the future or may be invalidated, circumvented or challenged.
We rely on a number of significant unregistered trademarks and other unregistered intellectual property in the day-to-day operation of our business. Without the protections afforded by registration, our ability to protect and use our trademarks and other unregistered intellectual property may be limited, which could negatively affect our business in the future.
In addition, while we have not faced intellectual property infringement claims from others in recent years, in the event successful infringement claims are brought against us, particularly claims (under patents or otherwise) against our product design or manufacturing processes, such claims could have a material adverse effect on our business, financial condition or results of operation.
Security breaches and other disruptions to our information technology networks and systems could interfere with our operations and could compromise the confidentiality of our proprietary information, notwithstanding the fact that no such breaches or disruptions have materially impacted us to date.
We rely upon information technology systems and networks, some of which are managed by third-parties, to process, transmit and store electronic information, and to manage or support a variety of business processes and activities, including supply chain management, manufacturing, invoicing and collection of payments from our dealer network and customers. Additionally, we collect and store sensitive data, including intellectual property, proprietary business information, the proprietary business information of our dealers and suppliers, as well as personally identifiable information of our employees, in data centers and on information technology systems. The secure operation of these information technology systems, and the processing and maintenance of this information, is critical to our business operations and strategy. Despite security measures and business continuity plans, our information technology systems and networks may be vulnerable to damage, disruptions or shutdowns due to attacks by hackers or breaches due to errors or malfeasance by employees, contractors and others who have access to our networks and systems, or other disruptions during the process of upgrading or replacing computer software or hardware, hardware failures, software errors, third-party service provider outages, power outages, computer viruses, telecommunication or utility failures or natural disasters or other catastrophic events. The occurrence of any of these events could
18
compromise our systems and the information stored there could be accessed, publicly disclosed, lost or stolen. Any such access, disclosure or other loss of information could result in legal claims or proceedings, liability or regulatory penalties under laws protecting the privacy of personal information, disrupt operations and reduce the competitive advantage we hope to derive from our investment in technology. Our insurance coverage may not be available or adequate to cover all the costs related to significant security attacks or disruptions resulting from such attacks.
Our business could be materially adversely affected by changes in foreign currency exchange rates.
We sell the majority of our buses and parts in United States Dollars. Our foreign customers have exposures to risks related to changes in foreign currency exchange rates on our sales in that region. Foreign currency exchange rates can have material adverse effects on our foreign customers' ability to purchase our products. Further, we have certain sales contracts that are transacted in Canadian Dollars. While we aim to hedge any such transactions, that may not always be the case. As a result, foreign currency fluctuations and the associated translations could have a material adverse effect on our results of operations and financial condition.
Taxing authorities could challenge our historical and future tax positions as well as our allocation of taxable income among our subsidiaries and affiliates.
The amount of income tax we pay is subject to our interpretation of applicable tax laws in the jurisdictions in which we file. We have taken, and will continue to take, appropriate tax positions based on our interpretation of such tax laws. While we believe that we have complied with all applicable tax laws, there can be no assurance that a taxing authority will not have a different interpretation of the law and assess additional taxes. Should additional taxes be assessed, this may have a material adverse effect on our results of operations and financial condition.
The manufacture of our Type A buses is conducted by the Micro Bird joint venture that we do not control and cannot operate solely for our benefit.
The manufacture of Type A buses is carried out by a 50/50 Canadian joint venture, Micro Bird Holdings, Inc., an unconsolidated Canadian joint venture with Groupe Autobus Girardin LTEE (“Micro Bird”). In the future, we may be required to enter into more joint ventures, particularly in emerging economies, in order to enter certain markets. In joint ventures, we share ownership and management of a company with one or more parties who may not have the same goals, strategies, priorities or resources as we do and may compete with us outside the joint venture. Joint ventures are intended to be operated for the equal benefit of all co-owners, rather than for our exclusive benefit. Operating a business as a joint venture often requires additional organizational formalities as well as time-consuming procedures for sharing information and making decisions. In joint ventures, we are required to foster our relationships with co-owners as well as promote the overall success of the joint venture, and if a co-owner changes or relationships deteriorate, our success in the joint venture may be materially adversely affected. The benefits from a successful joint venture are shared among the co-owners, so that we do not receive all the benefits from our joint venture.
Other Risk Factors Relating to an Investment in Our Common Stock
Our only significant asset is ownership of 100% of the capital stock of School Bus Holdings and we do not currently intend to pay cash dividends on our Common Stock. Consequently, stockholders' ability to achieve a return on their investment will depend on appreciation in the price of our Common Stock.
We have no direct operations and no significant assets other than the ownership of 100% of the capital stock of School Bus Holdings. We depend on School Bus Holdings and its subsidiaries for distributions, loans and other payments to generate the funds necessary to meet our financial obligations, including our expenses as a publicly traded company, and to pay any dividends with respect to our Common Stock, if any. Legal and contractual restrictions in agreements governing our current indebtedness, as well as our financial condition and operating requirements, may limit our ability to obtain cash from School Bus Holdings and its subsidiaries. While we are permitted to pay dividends in certain circumstances under our credit facility, as long as we are in compliance with our obligations under the credit facility, we do not expect to pay cash dividends on our Common Stock. Any future dividend payments are within the absolute discretion of our board of directors and will depend on, among other things, our results of operations, working capital requirements, capital expenditure requirements, financial condition, level of indebtedness, contractual restrictions with respect to payment of dividends, business opportunities, anticipated cash needs, provisions of applicable law and other factors that our board of directors may deem relevant.
Concentration of ownership of our Common Stock may have the effect of delaying or preventing a change in control.
Approximately 43% of our Common Stock is owned by ASP Holdings LLC, an entity owned by American Securities LLC ("American Securities"). As a result, American Securities has the ability to significantly influence the outcome of corporate actions of our Company requiring stockholder approval. This concentration of ownership may have the effect of delaying or preventing a change in control and might adversely affect the market price of our Common Stock.
19
We are dependent upon our executive officers and directors and their departure could adversely affect our business.
Our operations are dependent upon a relatively small group of individuals and, in particular, our executive officers and directors. We believe that our success depends on the continued service of our executive officers and directors. We do not have key-man insurance on the life of any of our directors or executive officers. The unexpected loss of the services of one or more of our directors or executive officers could adversely impact us and the market price of our Common Stock.
Pursuant to the Jumpstart Our Business Startups Act of 2012 (the “JOBS Act”), our independent registered public accounting firm will not be required to attest to the effectiveness of our internal control over financial reporting pursuant to Section 404 of the Sarbanes-Oxley Act for so long as we are an “emerging growth company.”
Section 404 of the Sarbanes-Oxley Act requires annual management assessments of the effectiveness of internal control over financial reporting, and generally requires in the same report a report by the independent registered public accounting firm on the effectiveness of internal control over financial reporting. Under the JOBS Act, our independent registered public accounting firm will not be required to attest to the effectiveness of our internal control over financial reporting pursuant to Section 404 of the Sarbanes-Oxley Act until we are no longer an “emerging growth company.” We will be an “emerging growth company” until the earliest of (1) the last day of the fiscal year (a) following January 23, 2019, the fifth anniversary of Hennessy Capital’s initial public offering, or (b) in which we have total annual gross revenues of at least $1.07 billion, or (2) in which we are deemed to be a large accelerated filer, which means the market value of our Common Stock that is held by non-affiliates exceeds $700 million as of the last business day of our prior second fiscal quarter, or (3) the date on which we have issued more than $1.0 billion in non-convertible debt during the prior three-year period.
In addition, Section 107 of the JOBS Act also provides that an “emerging growth company” can take advantage of the extended transition period provided in Section 7(a)(2)(B) of the Securities Act for complying with new or revised accounting standards. An “emerging growth company” can therefore delay the adoption of certain accounting standards until those standards would otherwise apply to private companies. We have chosen not to “opt out” of such extended transition period, which means that when a standard is issued or revised and it has different application dates for public or private companies, we, as an emerging growth company, can adopt the new or revised standard at the time private companies adopt the new or revised standard. This may make comparison of our financial statements with another public company which is neither an emerging growth company nor an emerging growth company which has opted out of using the extended transition period difficult or impossible because of the potential differences in accounting standards used.
We will cease to be an emerging growth company at the end of our fiscal year 2019.
If we do not meet the expectations of investors, stockholders or financial analysts, the market price of our securities may decline.
Fluctuations in the price of our securities could contribute to the loss of all or part of your investment. If an active market for our securities develops and continues, the trading price of our securities could be volatile and subject to wide fluctuations in response to various factors, some of which are beyond our control. Any of the factors listed below could have a material adverse effect on your investment in our securities and our securities may trade at prices significantly below the price you paid for them. In such circumstances, the trading price of our securities may not recover and may experience a further decline.
Factors affecting the trading price of our securities may include:
• | actual or anticipated fluctuations in our quarterly financial results or the quarterly financial results of companies perceived to be similar to us; |
• | changes in the market’s expectations about our operating results; |
• | success of competitors; |
• | our operating results failing to meet the expectation of securities analysts or investors in a particular period; |
• | changes in financial estimates and recommendations by securities analysts concerning us or the school bus market in general; |
• | operating and stock price performance of other companies that investors deem comparable to us; |
• | our ability to market new and enhanced products on a timely basis; |
• | changes in laws and regulations affecting our business; |
• | commencement of, or involvement in, litigation involving us; |
• | our ability to access the capital markets as needed; |
• | changes in our capital structure, such as future issuances of securities or the incurrence of additional debt; |
• | the volume of shares of our Common Stock available for public sale; |
• | any major change in our board or management; |
• | sales of substantial amounts of Common Stock by our directors, executive officers or significant stockholders or the perception that such sales could occur; and |
• | general economic and political conditions such as recessions, interest rates, fuel prices, international currency fluctuations and acts of war or terrorism. |
20
Broad market and industry factors may materially harm the market price of our securities irrespective of our operating performance. The stock market in general, and NASDAQ in particular, have experienced price and volume fluctuations that have often been unrelated or disproportionate to the operating performance of the particular companies affected. The trading prices and valuations of these stocks, and of our securities, may not be predictable. A loss of investor confidence in the market for manufacturing stocks or the stocks of other companies which investors perceive to be similar to us could depress our stock price regardless of our business, prospects, financial condition or results of operations. A decline in the market price of our securities also could adversely affect our ability to issue additional securities and our ability to obtain additional financing in the future.
Shares of our Common Stock are reserved for issuance which would have the effect of diluting the existing shareholders.
On May 28, 2015, we registered 3,700,000 Common Stock shares which represents the common stock issuable under the Blue Bird Corporation 2015 Omnibus Equity Incentive Plan (the “Incentive Plan”) and, pursuant to Rule 416(c) under the Securities Act of 1933, as amended, an indeterminable number of additional shares of common stock issuable under the Incentive Plan, as such amount may be adjusted as a result of stock splits, stock dividends, recapitalizations, anti-dilution provisions and similar transactions. At September 29, 2018, there were 826,857 Common Stock shares remaining to be issued under the Incentive Plan.
Warrants are exercisable for our Common Stock, which, if exercised, would increase the number of shares eligible for future resale in the public market and result in dilution to our stockholders.
At September 29, 2018, there were 1,081,384 warrants outstanding to purchase an aggregate of 540,692 shares of our Common Stock, each of which is exercisable. Each warrant entitles the holder thereof to purchase one-half of one share of our Common Stock at a price of $5.75 per half share ($11.50 per whole share), subject to adjustment. To the extent such warrants are exercised, additional shares of our Common Stock will be issued, which will result in dilution to the then existing holders of our Common Stock and increase the number of shares eligible for resale in the public market. Sales of substantial numbers of such shares in the public market could adversely affect the market price of our Common Stock.
Anti-takeover provisions contained in our certificate of incorporation and bylaws, as well as provisions of Delaware law, could impair a takeover attempt.
Our certificate of incorporation and bylaws contain provisions that could have the effect of delaying or preventing changes in control or changes in our management without the consent of our board of directors. These provisions include:
• | no cumulative voting in the election of directors, which limits the ability of minority stockholders to elect director candidates; |
• | the exclusive right of our board of directors to elect a director to fill a vacancy created by the expansion of the board of directors or the resignation, death, or removal of a director with or without cause by stockholders, which prevents stockholders from being able to fill vacancies on our board of directors; |
• | subject to any rights of holders of existing preferred shares, the ability of our board of directors to determine whether to issue shares of our preferred stock and to determine the price and other terms of those shares, including preferences and voting rights, without stockholder approval, which could be used to significantly dilute the ownership of a hostile acquirer; |
• | a prohibition on stockholder action by written consent, which forces stockholder action to be taken at an annual or special meeting of our stockholders; |
• | the requirement that a special meeting of stockholders may be called only by the chairman of the board of directors, the chief executive officer, or the board of directors, which may delay the ability of our stockholders to force consideration of a proposal or to take action, including the removal of directors; |
• | limiting the liability of, and providing indemnification to, our directors and officers; |
• | controlling the procedures for the conduct and scheduling of stockholder meetings; |
• | providing for a staggered board, in which the members of the board of directors are divided into three classes to serve for a period of three years from the date of their respective appointment or election; |
• | permitting the removal of directors with or without cause by stockholders voting a majority of the votes cast if, at any time and for so long as, American Securities beneficially owns, in the aggregate, capital stock representing at least 40% of the outstanding shares of our Common Stock; |
21
• | advance notice procedures that stockholders must comply with in order to nominate candidates to our board of directors or to propose matters to be acted upon at a stockholders’ meeting, which may discourage or deter a potential acquirer from conducting a solicitation of proxies to elect the acquirer’s own slate of directors or otherwise attempting to obtain control of our Company; |
• | requiring an affirmative vote of at least two-thirds (2/3) of our entire board of directors and by the holders of at least 66.67% of the voting power of our outstanding voting stock in order to adopt an amendment to our certificate of incorporation if, at any time and for so long as, American Securities beneficially owns, in the aggregate, capital stock representing at least 50% of the outstanding shares of our Common Stock; and |
• | requiring an affirmative vote of at least two-thirds (2/3) of our entire board of directors or by the holders of at least 66.67% of the voting power of our outstanding voting stock to amend our bylaws if, at any time and for so long as, American Securities beneficially owns, in the aggregate, capital stock representing at least 50% of the outstanding shares of our Common Stock. |
These provisions, alone or together, could delay hostile takeovers and changes in control of our Company or changes in our board of directors and management.
As a Delaware corporation, we are also subject to provisions of Delaware law, including Section 203 of the Delaware General Corporation Law (the “DGCL”), which prevents some stockholders holding more than 15% of our outstanding Common Stock from engaging in certain business combinations without approval of the holders of substantially all of our outstanding Common Stock. Any provision of our certificate of incorporation or bylaws or Delaware law that has the effect of delaying or deterring a change in control could limit the opportunity for our stockholders to receive a premium for their shares of our Common Stock and could also affect the price that some investors are willing to pay for our Common Stock.
22
Item 1B. Unresolved Staff Comments
None.
Item 2. Properties
Our corporate headquarters are located in Macon, Georgia. Our Bus segment operates a fabrication plant and an integrated chassis manufacturing and body assembly plant in Fort Valley, Georgia, where components for Type C, Type D, and specialty buses are manufactured and assembled. Our Parts segment operates a parts distribution center located in Delaware, Ohio. We own our facilities in Fort Valley, Georgia (approximately 1.5 million square feet). We lease our facilities in Macon, Georgia (approximately .05 million square feet) and Delaware, Ohio (approximately 0.1 million square feet). Our Micro Bird joint venture leases its facility (0.1 million square feet) in Drummondville, Quebec, Canada.
Item 3. Legal Proceedings
In the ordinary course of business, we may be a party to various legal proceedings from time to time. We do not believe that there is any pending or threatened proceeding against us, which, if determined adversely, would have a material effect on our business, results of operations, or financial condition.
Item 4. Mine Safety Disclosures
Not Applicable.
23
PART II
Item 5. Market for Registrant’s Common Equity, Related Stockholder Matters and Issuer Purchases of Equity Securities
Our Common Stock is currently quoted on the NASDAQ Global Market under the symbol “BLBD”. Our Warrants are traded on the over-the-counter market under the symbol “BLBDW”. There has been no established trading market for our Series A Convertible Preferred Stock. On November 13, 2018, all outstanding shares of Series A Convertible Preferred Stock were converted to our Common Stock.
The following table sets forth the high and low sales prices of our Common Stock and Warrants for the fiscal periods indicated as reported by the NASDAQ Global Market and over-the-counter market, as applicable.
Common Stock | Warrants | ||||||||||||||
High | Low | High | Low | ||||||||||||
2018 | |||||||||||||||
Fourth Quarter | $ | 25.65 | $ | 21.15 | $ | 7.09 | $ | 4.63 | |||||||
Third Quarter | 24.60 | 18.75 | 6.66 | 3.67 | |||||||||||
Second Quarter | 24.00 | 18.35 | 6.22 | 3.45 | |||||||||||
First Quarter | 21.65 | 17.95 | 5.09 | 3.34 | |||||||||||
2017 | |||||||||||||||
Fourth Quarter | $ | 20.60 | $ | 16.95 | $ | 4.50 | $ | 2.75 | |||||||
Third Quarter | 19.35 | 16.70 | 3.95 | 2.65 | |||||||||||
Second Quarter | 17.15 | 15.50 | 3.00 | 2.15 | |||||||||||
First Quarter | 17.35 | 14.10 | 3.00 | 1.57 | |||||||||||
At December 4, 2018, there were 90 holders of record of the Company’s Common Stock. Management of the Company believes that there are in excess of 3,000 beneficial holders of our Common Stock.
Performance Graph
The following graph compares the performance of the Company’s Common Stock with the performance of a peer group and the Russell 3000 Index for March 20, 2014 (the date on which the Company’s Common Stock became registered under Section 12(b) of the Exchange Act) through September 29, 2018 (the end of our latest fiscal year). The following graph and related information shall not be deemed to be "filed" for purposes of Section 18 of the Exchange Act, nor will such information be incorporated by reference into any filing under the Exchange Act or the Securities Act of 1933.
24
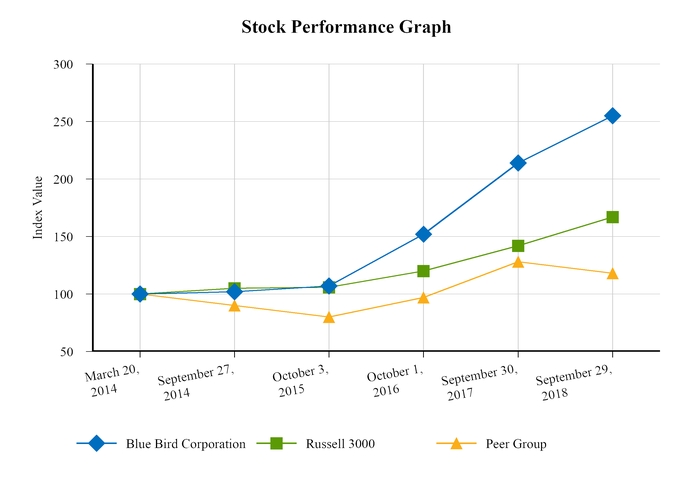
Cumulative Total Return | |||||||||||||||||
March 20, 2014 | September 27, 2014 | October 3, 2015 | October 1, 2016 | September 30, 2017 | September 29, 2018 | ||||||||||||
Blue Bird Corporation | 100 | 102 | 107 | 152 | 214 | 255 | |||||||||||
Russell 3000 | 100 | 105 | 106 | 120 | 142 | 167 | |||||||||||
Peer Group | 100 | 90 | 80 | 97 | 128 | 118 | |||||||||||
Our peer group for purposes of our performance graph consists of:
Allison Transmission Holdings Inc. | Federal Signal Corp. | Nfi Group Inc. | Spartan Motors Inc. | |||
Astec Industries Inc. | Harley-Davidson Inc. | Oshkosh Corp. | Thor Industries Inc. | |||
Briggs & Stratton Corp. | Manitex International Inc. | Paccar Inc. | Wabash National Corp | |||
Commercial Vehicle Group Inc. | Meritor Inc. | Power Solutions International Inc. | Wabco Holdings Inc. | |||
Cummins Inc. | Navistar International Corp | Rev Group Inc. | Winnebago Industries Inc. | |||
Blue Bird is the only publicly traded school bus company. As such, our peer group is not constructed on a line-of-business basis. Given our business model and brand recognition, we believe that the specialty vehicle original equipment manufacturers (OEMs) and branded industrial companies that we have selected represent the most comparable publicly traded companies to Blue Bird.
Dividends
We have not paid any dividends on our Common Stock to date. It is our present intention to retain any earnings for use in our business operations and, accordingly we do not anticipate the board of directors declaring any dividends in the foreseeable future on our Common Stock. In addition, certain of our loan agreements restrict the payment of dividends and the terms of our Series A Convertible Preferred Stock placed certain limitations on paying cash dividends on our Common Stock. On November 13, 2018, all outstanding shares of Series A Convertible Preferred Stock were converted to Common Stock.
25
Holders of the Series A Convertible Preferred Stock were entitled to receive, when, as and if declared by our board of directors, cumulative dividends at the rate of 7.625% per annum (the dividend rate) on the $100 liquidation preference per share of the Series A Convertible Preferred Stock, payable quarterly in arrears on each dividend payment date. Dividends were payable in cash or, at our option, in additional shares of Series A Convertible Preferred Stock, Common Stock or a combination thereof. On November 13, 2018, all outstanding shares of Series A Convertible Preferred Stock were converted to Common Stock.
Securities Authorized for Issuance Under Equity Compensation Plans
The following table provides information for all equity compensation plans at September 29, 2018, under which the equity securities of the Company were authorized for issuance:
Plan Category (1) | (a) Number of Securities to be Issued Upon Exercise of Outstanding Options, Warrants, and Rights | (b) Weighted Average Exercise Price of Outstanding Options, Warrants and Rights | (c) Number of Securities Remaining Available for Future Issuance Under Equity Compensation Plans (excluding securities reflected in column (a)) | |||||||
Equity compensation plans approved by security holders | 286,369 | $ | 10.98 | 826,857 | ||||||
(1) There are no equity compensation plans not approved by stockholders.
Purchases of Common Stock
During the three months ended September 29, 2018, the Company executed purchases for 325,506 shares of its common stock at an average purchase price per share of $22.63, under the share repurchase program which was authorized in June 2018 by our Board of Directors. The repurchase program allowed the Company to spend up to $25.0 million to repurchase, in open market or private transactions, outstanding common stock and/or Series A Convertible Preferred Stock over a 24 month period ending June 2019. The program was suspended on August 8, 2018 with the announcement of a planned $50.0 million Tender Offer.
The following table provides information regarding the Company's purchases of common stock during the three fiscal months ended September 29, 2018:
Period by fiscal month | Total number of shares purchased | Average price paid per share | Total number of shares purchased as part of publicly announced plans or programs | Approximate dollar value of shares that may yet be purchased under the plans or programs (in thousands) | ||||||||||
Repurchases from July 1, 2018 - July 28, 2018 | 250,182 | $ | 22.88 | 250,182 | $ | 16,023 | ||||||||
Repurchases from July 29, 2018 - August 25, 2018 | 75,324 | 22.12 | 75,324 | 14,356 | ||||||||||
Repurchases from August 26, 2018 - September 29, 2018 | — | — | — | — | ||||||||||
Total | 325,506 | 325,506 | ||||||||||||
26
Item 6. Selected Financial Data
The Company reports its operations on a 52-53 week fiscal year ending on the Saturday closest to September 30. The following table sets forth selected consolidated financial data of the Company taking into account completion of the Business Combination and the subsequent change of the Company’s fiscal year to the historic fiscal year of School Bus Holdings for each of its five most recent fiscal years, which have been derived from the consolidated financial statements of the Company. See Notes 1 and 2 to the consolidated financial statements for further explanation regarding Basis of Presentation and impact of Recently Adopted Accounting Standards.
The historical results presented below are not necessarily indicative of the results to be expected for any future period. This selected consolidated financial data should be read in conjunction with Item 1A. “Risk Factors”, Item 7. “Management’s Discussion and Analysis of Financial Condition and Results of Operations”, and the consolidated financial statements and the notes thereto included in Item 8. "Financial Statements".
in thousands, except per share data | Fiscal Year | |||||||||||||||||||
2018 | 2017 | 2016 | 2015 | 2014 | ||||||||||||||||
RESULTS OF OPERATIONS DATA | ||||||||||||||||||||
Net sales | $ | 1,024,976 | $ | 990,602 | $ | 932,010 | $ | 919,128 | $ | 855,735 | ||||||||||
Cost of goods sold | 902,988 | 863,234 | 802,654 | 798,733 | 746,362 | |||||||||||||||
Gross profit | 121,988 | 127,368 | 129,356 | 120,395 | 109,373 | |||||||||||||||
Operating expenses | ||||||||||||||||||||
Selling, general and administrative expenses | 88,755 | 72,831 | 102,711 | 84,561 | 91,445 | |||||||||||||||
Operating profit | 33,233 | 54,537 | 26,645 | 35,834 | 17,928 | |||||||||||||||
Interest expense | (6,661 | ) | (7,251 | ) | (16,412 | ) | (19,078 | ) | (6,156 | ) | ||||||||||
Interest income | 70 | 140 | 133 | 113 | 102 | |||||||||||||||
Other income (expense), net | 231 | 66 | (539 | ) | (201 | ) | 138 | |||||||||||||
Loss on debt extinguishment | — | (10,142 | ) | — | — | — | ||||||||||||||
Income before income taxes | 26,873 | 37,350 | 9,827 | 16,668 | 12,012 | |||||||||||||||
Income tax benefit (expense) | 2,620 | (11,856 | ) | (5,804 | ) | (4,370 | ) | (10,465 | ) | |||||||||||
Equity in net income of non-consolidated affiliate | 1,327 | 3,307 | 2,877 | 2,634 | 1,210 | |||||||||||||||
Net income | 30,820 | 28,801 | 6,900 | 14,932 | 2,757 | |||||||||||||||
Less: preferred stock dividends | 1,896 | 4,261 | 3,878 | 2,438 | — | |||||||||||||||
Less: preferred stock repurchase | — | 6,091 | — | — | — | |||||||||||||||
Net income available to common stockholders | $ | 28,924 | $ | 18,449 | $ | 3,022 | $ | 12,494 | $ | 2,757 | ||||||||||
EARNINGS PER SHARE DATA | ||||||||||||||||||||
Basic earnings per share | $ | 1.15 | $ | 0.79 | $ | 0.14 | $ | 0.59 | $ | 0.13 | ||||||||||
Diluted earnings per share | 1.08 | 0.74 | 0.14 | 0.59 | 0.13 | |||||||||||||||
BALANCE SHEET DATA | ||||||||||||||||||||
Total assets | $ | 307,430 | $ | 295,816 | $ | 277,866 | $ | 266,725 | $ | 290,455 | ||||||||||
Long-term debt | 132,239 | 143,224 | 140,366 | 175,418 | 209,640 | |||||||||||||||
Total liabilities | 335,766 | 354,326 | 364,840 | 387,955 | 439,250 | |||||||||||||||
Total stockholders' deficit | (28,336 | ) | (58,510 | ) | (86,974 | ) | (121,230 | ) | (148,795 | ) | ||||||||||
27
Item 7. Management’s Discussion and Analysis of Financial Condition and Results of Operations
The following discussion and analysis of financial condition and results of operations of the Company should be read in conjunction with the Company’s audited financial statements for the fiscal years ended September 29, 2018, September 30, 2017 and October 1, 2016 and related notes appearing elsewhere in this Report. Our actual results may not be indicative of future performance. This discussion and analysis contains forward-looking statements and involves numerous risks and uncertainties, including, but not limited to, those discussed or incorporated by reference in the sections of this Report titled “Special Note Regarding Forward-Looking Statements” and “Risk Factors”. Actual results may differ materially from those contained in any forward-looking statements. Certain monetary amounts, percentages and other figures included in this Report have been subjected to rounding adjustments. Accordingly, figures shown as totals in certain tables may not be the arithmetic aggregation of the figures that precede them, and figures expressed as percentages in the text may not total 100% or, as applicable, when aggregated, may not be the arithmetic aggregation of the percentages that precede them.
We refer to the fiscal year ended September 29, 2018 as “fiscal 2018”. We refer to the fiscal year ended September 30, 2017 as “fiscal 2017” and we refer to the fiscal year ended October 1, 2016 as “fiscal 2016”. In fiscal years 2018, 2017, and 2016, there were a total of 52 weeks.
Executive Overview
Blue Bird is the leading independent designer and manufacturer of school buses. Our longevity and reputation in the school bus industry have made Blue Bird an iconic American brand. We distinguish ourselves from our principal competitors by dedicating our focus to the design, engineering, manufacture and sale of school buses and related parts. As the only principal manufacturer of chassis and body production specifically designed for school bus applications, Blue Bird is recognized as an industry leader for school bus innovation, safety, product quality/reliability/durability, efficiency, and lower operating costs. In addition, Blue Bird is the market leader in alternative fuel applications with its propane-powered, gasoline-powered, and compressed natural gas (“CNG”)-powered school buses. In 2018, we delivered our first all-electric school buses.
Blue Bird sells its buses and parts through an extensive network of United States and Canadian dealers that, in their territories, are exclusive to Blue Bird on Type C and Type D school buses. Blue Bird also sells directly to major fleet operators, the United States Government, state governments and authorized dealers in a number of foreign countries.
Factors Affecting Our Revenues
Our revenues are driven primarily by the following factors:
• | Property tax revenues. Property tax revenues are one of the major sources of funding for school districts, and therefore new school buses. Property tax revenues are a function of land and building prices, relying on assessments of property value by state or county assessors and millage rates voted by the local electorate. |
• | Student enrollment. Increases or decreases in the number of school bus riders has a direct impact on school district demand. |
• | Revenue mix. We are able to charge more for certain of our products (e.g., Type C propane-powered school buses, Type D buses, and buses with higher option content) than other products. The mix of products sold in any fiscal period can directly impact our revenues for the period. |
• | Strength of the dealer network. We rely on our dealers, as well as a small number of major fleet operators, to be the direct point of contact with school districts and their purchasing agents. An effective dealer is capable of expanding revenues within a given school district by matching that district’s needs to our capabilities, offering options that would not otherwise be provided to the district. |
• | Pricing. Our products are sold to school districts throughout the United States and Canada. Each state and each Canadian province has its own set of regulations that govern the purchase of products, including school buses, by their school districts. We and our dealers must navigate these regulations, purchasing procedures, and the districts’ specifications in order to reach mutually acceptable price terms. Pricing may or may not be favorable to us, depending upon a number of factors impacting purchasing decisions. |
• | Buying patterns of major fleets. Major fleets regularly compete against one another for existing accounts. Fleets are also continuously trying to win the business of school districts that operate their own transportation services. These activities can have either a positive or negative impact on our sales, depending on the brand preference of the fleet that wins the business. Major fleets also periodically review their fleet sizes and replacement patterns due to funding availability as well as the profitability of existing routes. These actions can impact total purchases by fleets in a given year. |
28
• | Seasonality. Our sales are subject to seasonal variation based on the school calendar. The peak season has historically been during our third and fourth fiscal quarters. Sales during the third and fourth fiscal quarters are typically greater than the first and second fiscal quarters due to the desire of municipalities to have any new buses that they order available to them at the beginning of the new school year. There are, however, variations in the seasonal demands from year to year depending in large part upon municipal budgets, distinct replacement cycles, and student enrollment. The seasonality and annual variations of seasonality could impact the ability to compare results between fiscal periods. |
Factors Affecting Our Expenses and Other Items
Our expenses and other line items in our Consolidated Statements of Operations are principally driven by the following factors:
• | Cost of goods sold. The components of our cost of goods sold consist of material costs (principally powertrain components, steel and rubber, as well as aluminum and copper), labor expense and overhead. Our cost of goods sold may vary from period to period due to changes in sales volume, efforts by certain suppliers to pass through the economics associated with key commodities, design changes with respect to specific components, design changes with respect to specific bus models, wage increases for plant labor, productivity of plant labor, delays in receiving materials and other logistical challenges, and the impact of overhead items such as utilities. |
• | Selling, general and administrative expenses. Our selling, general and administrative expenses include costs associated with our selling and marketing efforts, engineering, centralized finance, human resources, purchasing and information technology services, as well as other administrative matters and functions. In most instances, other than direct costs associated with sales and marketing programs, the principal component of these costs is salary expense. Changes from period to period are typically driven by the number of our employees, as well as by merit increases provided to experienced personnel. |
• | Interest expense. Our interest expense relates to costs associated with our debt instruments and reflects both the amount of indebtedness and the interest rate that we are required to pay on our debt. |
• | Income taxes. We make estimates of the amounts to recognize for income taxes in each tax jurisdiction in which we operate. In addition, provisions are established for withholding taxes related to the transfer of cash between jurisdictions and for uncertain tax positions taken. |
• | Equity in net income of non-consolidated affiliate. We include in this line item our share of income or loss from our investment in Micro Bird, our unconsolidated 50/50 Canadian joint venture. |
Key Non-GAAP Measures We Use to Evaluate Our Performance
This filing includes the following non-GAAP financial measures “Adjusted EBITDA”, “Adjusted EBITDA Margin”, and “Free Cash Flow” because management views these metrics as a useful way to look at the performance of our operations between periods and to exclude decisions on capital investment and financing that might otherwise impact the review of profitability of the business based on present market conditions.
Adjusted EBITDA is defined as net income prior to interest income, interest expense, income taxes, depreciation and amortization, and disposals, as adjusted to add back certain charges that we may record each year, such as stock-compensation expense, as well as non-recurring charges such as (i) significant product design changes; (ii) transaction related costs; or (iii) discrete expenses related to major cost cutting initiatives. We believe these expenses and non-recurring charges are not considered an indicator of ongoing company performance. We define Adjusted EBITDA margin as Adjusted EBITDA as a percentage of net sales. Adjusted EBITDA and Adjusted EBITDA margin are not measures of performance defined in accordance with GAAP. The measures are used as a supplement to GAAP results in evaluating certain aspects of our business, as described below.
We believe that Adjusted EBITDA and Adjusted EBITDA margin are useful to investors in evaluating our performance because the measures consider the performance of our operations, excluding decisions made with respect to capital investment, financing, and other non-recurring charges as outlined in the preceding paragraph. We believe the non-GAAP metrics offer additional financial metrics that, when coupled with the GAAP results and the reconciliation to GAAP results, provide a more complete understanding of our results of operations and the factors and trends affecting our business.
Adjusted EBITDA and Adjusted EBITDA margin should not be considered as alternatives to net income as an indicator of our performance or as alternatives to any other measure prescribed by GAAP as there are limitations to using such non-GAAP measures. Although we believe that Adjusted EBITDA and Adjusted EBITDA margin may enhance an evaluation of our operating performance based on recent revenue generation and product/overhead cost control because they exclude the impact of prior decisions made about capital investment, financing, and other expenses, (i) other companies in Blue Bird’s industry may define Adjusted EBITDA and Adjusted EBITDA margin differently than we do and, as a result, they may not be comparable to similarly titled measures used by other companies in Blue Bird’s
29
industry, and (ii) Adjusted EBITDA and Adjusted EBITDA margin exclude certain financial information that some may consider important in evaluating our performance.
We compensate for these limitations by providing disclosure of the differences between Adjusted EBITDA and GAAP results, including providing a reconciliation to GAAP results, to enable investors to perform their own analysis of our operating results.
Our measure of “Free Cash Flow” is used in addition to and in conjunction with results presented in accordance with GAAP and free cash flow should not be relied upon to the exclusion of GAAP financial measures. Free cash flow reflects an additional way of viewing our liquidity that, when viewed with our GAAP results, provides a more complete understanding of factors and trends affecting our cash flows. We strongly encourage investors to review our financial statements and publicly-filed reports in their entirety and not to rely on any single financial measure.
We define free cash flow as net cash provided by/used in continuing operations minus cash paid for fixed assets. We use free cash flow, and ratios based on the free cash flow, to conduct and evaluate our business because, although it is similar to cash flow from operations, we believe it is a more conservative measure of cash flow since purchases of fixed assets and intangible assets are a necessary component of ongoing operations. In limited circumstances in which proceeds from sales of fixed or intangible assets exceed purchases, free cash flow would exceed cash flow from operations. However, since we do not anticipate being a net seller of fixed or intangible assets, we expect free cash flow to be less than operating cash flows.
Our Segments
We manage our business in two operating segments, which are also our reportable segments: (i) the Bus segment, which involves the design, engineering, manufacture and sales of school buses and extended warranties; and (ii) the Parts segment, which includes the sales of replacement bus parts. Financial information is reported on the basis that it is used internally by the chief operating decision maker (“CODM”) in evaluating segment performance and deciding how to allocate resources to segments. The President and Chief Executive Officer of the Company has been identified as the CODM. Management evaluates the segments based primarily upon revenues and gross profit.
Consolidated Results of Operations for the fiscal years ended September 29, 2018 and September 30, 2017:
(in thousands of dollars) | 2018 | 2017 | |||||
Net sales | $ | 1,024,976 | $ | 990,602 | |||
Cost of goods sold | 902,988 | 863,234 | |||||
Gross profit | $ | 121,988 | $ | 127,368 | |||
Operating expenses | |||||||
Selling, general and administrative expenses | 88,755 | 72,831 | |||||
Operating profit | $ | 33,233 | $ | 54,537 | |||
Interest expense | (6,661 | ) | (7,251 | ) | |||
Interest income | 70 | 140 | |||||
Other income, net | 231 | 66 | |||||
Loss on debt extinguishment | — | (10,142 | ) | ||||
Income before income taxes | $ | 26,873 | $ | 37,350 | |||
Income tax benefit (expense) | 2,620 | (11,856 | ) | ||||
Equity in net income of non-consolidated affiliate | 1,327 | 3,307 | |||||
Net income | $ | 30,820 | $ | 28,801 | |||
Other financial data: | |||||||
Adjusted EBITDA | $ | 70,379 | $ | 68,904 | |||
Adjusted EBITDA margin | 6.9 | % | 7.0 | % | |||
30
The following provides the results of operations of Blue Bird's two reportable segments:
(in thousands of dollars) | 2018 | 2017 | |||||
Net Sales by Segment | |||||||
Bus | $ | 962,769 | $ | 930,738 | |||
Parts | 62,207 | 59,864 | |||||
Total | $ | 1,024,976 | $ | 990,602 | |||
Gross Profit by Segment | |||||||
Bus | $ | 100,002 | $ | 106,462 | |||
Parts | 21,986 | 20,906 | |||||
Total | $ | 121,988 | $ | 127,368 | |||
Net sales. Net sales were $1.02 billion for the fiscal year ended 2018, an increase of $34.4 million, or 3.5%, compared to $990.6 million for the fiscal year ended 2017.
Bus sales increased $32.0 million, or 3.4%, reflecting an increase in units booked and slightly higher sales prices. In the fiscal year ended 2018, 11,649 units were booked compared to 11,317 units booked for the fiscal year ended 2017. The average net sales price per unit for the fiscal year ended 2018 was 0.5% higher than the price per unit for the fiscal year ended 2017. The increase in unit price mainly reflects product and customer mix changes.
Parts sales increased $2.3 million, or 3.9%, for the fiscal year ended 2018 compared to fiscal year ended 2017, resulting from higher volumes primarily due to incentive and shipping programs launched in the previous fiscal year.
Cost of goods sold. Total cost of goods sold was $903.0 million for the fiscal year ended 2018, an increase of $39.8 million, or 4.6%, compared to $863.2 million for the fiscal year ended 2017. As a percentage of net sales, total cost of goods sold increased from 87.1% to 88.1%.
Bus segment cost of goods sold increased $38.5 million, or 4.7%, for the fiscal year ended 2018 compared to the fiscal year ended 2017. The average cost of goods sold per unit for the fiscal year ended 2018 was 1.7% higher compared to the average cost of goods sold per unit for the fiscal year ended 2017 due to raw material price increases related to rising commodity costs, which were partially offset by favorable changes in product and customer mix as well as cost savings resulting from our operational improvement initiatives.
The $1.3 million, or 3.2%, increase in parts segment cost of goods sold for the fiscal year ended 2018 compared to the fiscal year ended 2017 was primarily attributed to increased parts sales volume.
Operating profit. Operating profit was $33.2 million for the fiscal year ended 2018, a decrease of $21.3 million, or 39.1%, compared to $54.5 million for the fiscal year ended 2017. Profitability was negatively impacted by a decrease of $5.4 million in gross profit and an increase of $15.9 million in selling, general and administrative expenses due in large part to several non-recurring operational and product development initiatives.
Interest expense. Interest expense was $6.7 million for the fiscal year ended 2018, a decrease of $0.6 million, or 8.1%, compared to $7.3 million for the fiscal year ended 2017. The decrease was primarily attributed to lower average borrowing levels as well as a lower weighted-average annual effective interest rate.
Income taxes. We recorded an income tax benefit of $2.6 million for the fiscal year ended 2018, compared to an income tax expense of $11.9 million for the fiscal year ended 2017.
The effective tax rate for the fiscal year ended 2018 was (9.7)%, which significantly differed from the statutory federal income tax rate of 24.5%. The difference is explained below.
We recorded several one-time tax items in the fiscal year ended 2018, including:
• | Release of a $7.6 million reserve for uncertain tax positions; |
• | A total of $1.7 million of tax benefits from accelerated deductions reported on our prior year return; and |
• | Tax expense adjustments of $2.1 million related to the Tax Cuts and Jobs Act, which was enacted during our first fiscal quarter of 2018 (enacted on December 22, 2017). |
31
Along with re-measuring our deferred tax balances to the new tax rate, the $2.1 million net tax reform adjustment amount cited above includes $1.1 million in expense related to our tax liability for uncertain tax positions with the associated accrued interest and $0.1 million associated with the deemed repatriation tax. We also recorded normal tax rate benefit items, such as the domestic production activities deduction, federal and state tax credits, and share-based award related deductions in excess of recorded expense.
The Tax Cuts and Jobs Act reduced the U.S. federal corporate tax rate from 35% to 21%. Since we are a fiscal year taxpayer, our tax rate reduction is pro-rated and our statutory federal tax rate for fiscal 2018 is approximately 24.5%. We will fully apply the new 21% statutory rate in fiscal 2019. The new legislation will also require companies to pay a one-time transition tax on earnings of certain foreign subsidiaries, such as our unconsolidated joint venture investment in Micro Bird.
Although additional guidance is expected from the IRS for the new law, we do not expect any changes would have a material impact on us and thus have finalized our estimates under SAB 118.
The effective tax rate for the fiscal year ended 2017 was 31.7%, which differed from the statutory federal income tax rate of 35%, reflecting the benefits of income tax credits, the domestic production activities deduction, and recording a tax windfall from share-based compensation awards exercised, which were offset by the application of tax credits claimed as offsets against our payroll tax liabilities, and interest and penalties on uncertain tax positions.
Adjusted EBITDA. Adjusted EBITDA was $70.4 million, or 6.9% of net sales, for the fiscal year ended 2018, an increase of $1.5 million, or 2.1%, compared to $68.9 million, or 7.0% of net sales, for the fiscal year ended 2017. The increase in adjusted EBITDA was primarily the result of a decrease in selling, general and administrative expenses when adjusted for specific non-recurring operational and product development initiatives, which was partially offset by decreased gross profit.
The following table sets forth a reconciliation of net income to adjusted EBITDA for the fiscal years presented:
(in thousands of dollars) | 2018 | 2017 | |||||
Net income | $ | 30,820 | $ | 28,801 | |||
Adjustments: | |||||||
Discontinued operations income | (81 | ) | (65 | ) | |||
Interest expense, net | 6,591 | 7,111 | |||||
Income tax (benefit) expense | (2,620 | ) | 11,856 | ||||
Depreciation, amortization, and disposals | 9,214 | 8,205 | |||||
Loss on debt extinguishment | — | 10,142 | |||||
Operational transformation initiatives | 17,708 | — | |||||
Unrealized gains on foreign currency hedges | (109 | ) | — | ||||
Share-based compensation | 2,628 | 1,270 | |||||
Product redesign initiatives | 6,253 | 1,758 | |||||
Other | (25 | ) | (174 | ) | |||
Adjusted EBITDA | $ | 70,379 | $ | 68,904 | |||
Adjusted EBITDA margin (percentage of net sales) | 6.9 | % | 7.0 | % | |||
32
Consolidated Results of Operations for the fiscal years ended September 30, 2017 and October 1, 2016:
(in thousands of dollars) | 2017 | 2016 | |||||
Net sales | $ | 990,602 | $ | 932,010 | |||
Cost of goods sold | 863,234 | 802,654 | |||||
Gross profit | $ | 127,368 | $ | 129,356 | |||
Operating expenses | |||||||
Selling, general and administrative expenses | 72,831 | 102,711 | |||||
Operating profit | $ | 54,537 | $ | 26,645 | |||
Interest expense | (7,251 | ) | (16,412 | ) | |||
Interest income | 140 | 133 | |||||
Other income (expense), net | 66 | (539 | ) | ||||
Loss on debt extinguishment | (10,142 | ) | — | ||||
Income before income taxes | $ | 37,350 | $ | 9,827 | |||
Income tax expense | (11,856 | ) | (5,804 | ) | |||
Equity in net income of non-consolidated affiliate | 3,307 | 2,877 | |||||
Net income | $ | 28,801 | $ | 6,900 | |||
Other financial data: | |||||||
Adjusted EBITDA | $ | 68,904 | $ | 72,210 | |||
Adjusted EBITDA margin | 7.0 | % | 7.7 | % | |||
The following provides the results of operations of Blue Bird's two reportable segments:
(in thousands of dollars) | 2017 | 2016 | |||||
Net Sales by Segment | |||||||
Bus | $ | 930,738 | $ | 876,087 | |||
Parts | 59,864 | 55,923 | |||||
Total | $ | 990,602 | $ | 932,010 | |||
Gross Profit by Segment | |||||||
Bus | $ | 106,462 | $ | 108,232 | |||
Parts | 20,906 | 21,124 | |||||
Total | $ | 127,368 | $ | 129,356 | |||
Net sales. Net sales were $990.6 million for the fiscal year ended 2017, an increase of $58.6 million, or 6.3%, compared to $932.0 million for the fiscal year ended 2016.
Bus sales increased $54.7 million, or 6.2%, reflecting an increase in units booked, which were 11,317 units for the fiscal year ended 2017, compared to 10,616 units for the fiscal year ended 2016. The average net sales price per unit for the fiscal year ended 2017 was 0.3% lower than the price per unit for the fiscal year ended 2016. The decrease in unit price mainly reflects product and customer mix changes.
Parts sales increased $3.9 million, or 7.0%, for the fiscal year ended 2017 compared to the fiscal year ended 2016, resulting from the expansion of product offerings as well as new incentive and shipping programs launched in fiscal 2017.
Cost of goods sold. Total cost of goods sold was $863.2 million for the fiscal year ended 2017, an increase of $60.6 million, or 7.5%, compared to $802.7 million for the fiscal year ended 2016. As a percentage of net sales, total cost of goods sold increased from 86.1% to 87.1%.
Bus segment cost of goods sold increased $56.4 million, or 7.3%, for the fiscal year ended 2017 compared to the fiscal year ended 2016. The average cost of goods sold per unit for the fiscal year ended 2017 was 0.7% higher compared to the average cost of goods sold per unit for the fiscal year ended 2016 as higher commodity costs increased material costs.
33
The $4.2 million, or 12.0%, increase in parts segment cost of goods sold for the fiscal year ended 2017 compared to the fiscal year ended 2016 was primarily attributed to increased parts sales volume.
Operating profit. Operating profit was $54.5 million for the fiscal year ended 2017, an increase of $27.9 million, or 104.7%, compared to $26.6 million for the fiscal year ended 2016. Profitability was positively impacted by a decrease of $29.9 million in selling, general and administrative expenses, which was partially offset by a a decrease of $2.0 million in gross profit. Selling, general and administrative expenses for fiscal year ended 2016 included expenses incurred from the change in control transaction, of which $17.1 million was a non-recurring special compensation expense and $9.8 million more share-based compensation expense, primarily due to an accelerated vesting of equity awards as a result of the change in control.
Interest expense. Interest expense was $7.3 million for the fiscal year ended 2017, a decrease of $9.2 million, or 55.8%, compared to $16.4 million for the fiscal year ended 2016. The decrease was primarily attributed to the decrease in our effective interest rate resulting from the new credit facility we entered into in December 2016, as well as lower average borrowing levels.
Income tax expense. Income tax expense was $11.9 million for the fiscal year ended 2017, compared to income tax expense of $5.8 million for the fiscal year ended 2016. The increase was primarily due to an increase in pre-tax income.
The effective tax rate for the fiscal year ended 2017 was 31.7%, which differed from the federal statutory tax rate of 35%, reflecting the benefits of income tax credits, the domestic production activities deduction, and recording a tax windfall from share-based compensation awards exercised, which were offset by the application of tax credits claimed as offsets against our payroll tax liabilities, and interest and penalties on uncertain tax positions. The effective tax rate for the fiscal year ended 2016 was 59.1%, which differed from the federal statutory tax rate of 35.0%, primarily from discrete items in the period, including interest and penalties on uncertain tax positions, investor tax on our Micro Bird joint venture, limitation on the deductibility of certain share-based compensation, and a net tax shortfall, recorded as expense, associated with the vesting of share-based compensation awards.
Adjusted EBITDA. Adjusted EBITDA was $68.9 million, or 7.0% of net sales, for the fiscal year ended 2017, a decrease of $3.3 million, or 4.6%, compared to $72.2 million, or 7.7% of net sales, for the fiscal year ended 2016. The decrease in adjusted EBITDA is primarily the result of decreased gross profit.
The following table sets forth a reconciliation of net income to adjusted EBITDA for the fiscal years presented:
(in thousands of dollars) | 2017 | 2016 | |||||
Net income | $ | 28,801 | $ | 6,900 | |||
Adjustments: | |||||||
Discontinued operations (income) loss | (65 | ) | 512 | ||||
Interest expense, net | 7,111 | 16,279 | |||||
Income tax (benefit) expense | 11,856 | 5,804 | |||||
Depreciation, amortization, and disposals | 8,205 | 8,176 | |||||
Loss on debt extinguishment | 10,142 | — | |||||
Special compensation payment | — | 17,128 | |||||
Operational transformation initiatives | — | — | |||||
Business combination expenses | — | 3,798 | |||||
One-time post-retirement benefit adjustment | — | 896 | |||||
Share-based compensation | 1,270 | 12,717 | |||||
Product redesign initiatives | 1,758 | — | |||||
Other | (174 | ) | — | ||||
Adjusted EBITDA | $ | 68,904 | $ | 72,210 | |||
Adjusted EBITDA margin (percentage of net sales) | 7.0 | % | 7.7 | % | |||
34
Liquidity and Capital Resources
The Company's primary sources of liquidity are cash generated from operations, available cash, and borrowings under the credit facility. At September 29, 2018, the Company had $60.3 million of available cash and cash equivalents (net of outstanding checks) and $93.1 million of additional borrowings available under the revolving line of credit portion of its senior secured credit facilities. The Company’s revolving line of credit is available for working capital requirements, capital expenditures and other general corporate purposes.
Credit Agreement
On December 12, 2016 (the “Closing Date”), Blue Bird Body Company as the borrower (the "Borrower"), a wholly-owned subsidiary of the Company, executed a $235.0 million five-year credit agreement with Bank of Montreal, which acts as the administrative agent and an issuing bank, Fifth Third Bank, as co-syndication agent and an issuing bank, and Regions Bank, as Co-Syndication Agent, together with other lenders (the "Credit Agreement").
The credit facility provided for under the Credit Agreement consists of a term loan facility in an aggregate initial principal amount of $160.0 million (the “Term Loan Facility”) and a revolving credit facility with aggregate commitments of $75.0 million. The revolving credit facility includes a $15.0 million letter of credit sub-facility and $5.0 million swingline sub-facility (the “Revolving Credit Facility,” and together with the Term Loan Facility, each a “Credit Facility” and collectively, the “Credit Facilities”). The borrowings under the Term Loan Facility, which were made at the Closing Date, may not be re-borrowed once they are repaid. The borrowings under the Revolving Credit Facility may be repaid and reborrowed from time to time at our election. The proceeds of the loans under the Credit Facilities that were borrowed on the Closing Date were used to finance in part, together with available cash on hand, (i) the repayment of certain existing indebtedness of the Company and its subsidiaries, and (ii) transaction costs associated with the consummation of the Credit Facilities.
The obligations under the Credit Agreement and the related loan documents (including without limitation, the borrowings under the Facilities (including the Incremental Term Loan) and obligations in respect of certain cash management and hedging obligations owing to the agents, the lenders or their affiliates), are, in each case, secured by a lien on and security interest in substantially all of the assets of the Company and its subsidiaries (including the Borrower), with certain exclusions as set forth in a collateral agreement entered into on December 12, 2016.
Up to $75.0 million of additional term loans and/or revolving credit commitments may be incurred under the Credit Agreement, subject to certain limitations as set forth in the Credit Agreement, and which additional loans and/or commitments would require further commitments from the existing lenders or from new lenders.
The Credit Agreement contains negative and affirmative covenants affecting the Company and its subsidiaries including the Borrower, with certain exceptions set forth in the Credit Agreement. The negative covenants and restrictions include, among others: limitations on liens, dispositions of assets, consolidations and mergers, loans and investments, indebtedness, transactions with affiliates (including management fees and compensation), dividends, distributions and other restricted payments, change in fiscal year, fundamental changes, amendments to and subordinated indebtedness, restrictive agreements, sale and leaseback transactions and certain permitted acquisitions. Dividends, distributions, and other restricted payments are permitted in certain circumstances under the Credit Agreement, including, among other exceptions, (i) in an amount up to the cumulative available amount of excess free cash flow that is not required to be used to prepay the outstanding loans under the Credit Agreement, subject to certain adjustments, provided that there is not a continuing default, the Company maintains a Total Net Leverage Ratio on such date that is 0.25x less than the ratio required by the Credit Agreement at such date and the Company and its subsidiaries have not less than $5.0 million in the aggregate of Unrestricted Cash (as defined in the Credit Agreement) plus remaining availability under the revolving commitments, (ii) in an amount that would not cause the Total Net Leverage Ratio to exceed 2.75 to 1.00, provided that there is not a continuing default and the Company and its subsidiaries have at least $5.0 million in the aggregate of Unrestricted Cash plus remaining availability under the revolving commitments, (iii) to make payments under the Certificate of Designations of the Company's outstanding preferred stock in an amount up to the cumulative available amount of excess free cash flow that is not required to be used to prepay the outstanding loans under the Credit Agreement, subject to certain adjustments, provided that there is not a continuing default, the Company maintains a Total Net Leverage Ratio that does not exceed 3.25 to 1.00 and the Company and its subsidiaries have at least $5.0 million in the aggregate of Unrestricted Cash plus remaining availability under the revolving commitments, and (iv) in an amount not to exceed $15.0 million provided that there is not a continuing default.
Amended Credit Agreement
On September 13, 2018, the Company executed an amendment to the Credit Agreement (the "Amended Credit Agreement"), by and among the Company, the Borrower, and Bank of Montreal, acting as administrative agent together with other lenders. The Amended Credit Agreement, provides for an aggregate lender commitment of $50.0 million in additional term loan borrowings (the “Incremental Term Loan”). The Incremental Term Loan was intended to finance a portion of a tender offer up to $50.0 million. Funding of the Incremental Term Loan was subject to the satisfaction of customary closing conditions, including the accuracy in all material respects of the
35
representations and warranties under the Amended Credit Agreement and the absence of a default or event of default under the Amended Credit Agreement. In October 2018, the Incremental Term Loan funded for $50.0 million and the tender offer referenced above was finalized (refer to Note 18, Subsequent Events, to the accompanying consolidated financial statements).
After giving effect to the Amended Credit Agreement, the initial $160.0 million Term Loan Facility, with a balance of $146.2 million at September 29, 2018, increased $50.0 million, and the initial $75.0 million Revolving Credit Facility increased $25.0 million. The amended Credit Facilities each mature on September 13, 2023, the fifth anniversary of the effective date of the Amended Credit Agreement.
After giving effect to the Amended Credit Agreement, the interest payable with respect to the Term Loan Facility is (i) from the first amendment effective date until the first quarter ended on or about September 30, 2018, LIBOR plus 2.25% and (ii) commencing with the fiscal quarter ended on or about September 30, 2018 and thereafter, dependent on the Total Net Leverage Ratio of the Company, an election of either base rate or LIBOR pursuant to the table below. The Company's Total Net Leverage Ratio is defined as the ratio of (a) consolidated net debt to (b) consolidated EBITDA, which includes certain add-backs that are not reflected in the definition of Adjusted EBITDA appearing in the Company’s Annual Report on Form 10-K, at the end of each fiscal quarter for the consecutive four fiscal quarter period most recently then ending.
Level | Total Net Leverage Ratio | ABR Loans | Eurodollar Loans | |||
I | Less than 2.00x | 0.75% | 1.75% | |||
II | Greater than or equal to 2.00x and less than 2.50x | 1.00% | 2.00% | |||
III | Greater than or equal to 2.50x and less than 3.00x | 1.25% | 2.25% | |||
IV | Greater than or equal to 3.00x and less than 3.25x | 1.50% | 2.50% | |||
V | Greater than or equal to 3.25x and less than 3.50x | 1.75% | 2.75% | |||
VI | Greater than 3.50x | 2.00% | 3.00% | |||
Under the Amended Credit Agreement, the principal of the Term Facility must be paid in quarterly installments on the last day of each fiscal quarter, in an amount equal to:
• | $2,475,000 per quarter beginning on the last day of the Company’s first fiscal quarter of 2019 through the last day of the Company’s third fiscal quarter in 2021; |
• | $3,712,500 per quarter beginning on the last day of the Company’s fourth fiscal quarter in 2021 through the last day of the Company’s third fiscal quarter in 2022; |
• | $4,950,000 per quarter beginning on the last day of the Company’s fourth fiscal quarter in 2022 through the last day of the Company’s second fiscal quarter in 2023, with the remaining principal amount due at maturity. |
There are customary events of default under the Amended Credit Agreement, including, among other things, events of default resulting from (i) failure to pay obligations when due under the Amended Credit Agreement, (ii) insolvency of the Company or its material subsidiaries, (iii) defaults under other material debt, (iv) judgments against the Company or its subsidiaries, (v) failure to comply with certain financial maintenance covenants (as set forth in the Amended Credit Agreement), or (vi) a change of control of the Company, in each case subject to limitations and exceptions as set forth in the Amended Credit Agreement.
The Amended Credit Agreement contains customary covenants and warranties including, among other things, an amended Total Net Leverage Ratio financial maintenance covenant which requires compliance as follows:
Period | Maximum Total Net Leverage Ratio | |
September 13, 2018 through the second quarter of the 2019 fiscal year | 4.00:1.00 | |
Second quarter of the 2019 fiscal year through the fourth quarter of the 2021 fiscal year | 3.75:1.00 | |
Fourth quarter of the 2021 fiscal year and thereafter | 3.50:1.00 | |
At September 29, 2018, the Borrower and the guarantors were in compliance with all covenants in the Amended Credit Agreement.
Short-Term and Long-Term Liquidity Requirements
Our ability to make principal and interest payments on borrowings under the Amended Credit Agreement and our ability to fund planned capital expenditures will depend on our ability to generate cash in the future, which, to a certain extent, is subject to general economic, financial, competitive, regulatory and other conditions. Based on the current level of operations, we believe that our existing cash balances and expected cash flows from operations will be sufficient to meet operating requirements for at least the next 12 months.
36
Seasonality
Our business is highly seasonal. Most school districts seek to buy their new school buses so that they will be available for use on the first day of the school year, typically in mid-August to early September. As a result, our two busiest quarters are our third and fourth fiscal quarters, the latter ending on the Saturday closest to September 30. Our quarterly results of operations, cash flows, and liquidity are likely to be impacted by these seasonal patterns. For example, our revenues are typically highest in our third and fourth fiscal quarters. There are, however, variations in the seasonal demands from year to year depending, in part, on large direct sales to major fleet customers for which short-term trade credit is generally offered. Working capital, on the other hand, is typically a significant use of cash during the first fiscal quarter and a significant source of cash generation in the fourth fiscal quarter. We typically conduct planned shutdowns during our first fiscal quarter.
Cash Flows
The following table sets forth general information derived from our statement of cash flows for the fiscal years presented:
(in thousands of dollars) | 2018 | 2017 | 2016 | ||||||||
Cash and cash equivalents, beginning of year | $ | 62,616 | $ | 52,309 | $ | 52,861 | |||||
Total cash provided by operating activities | 48,353 | 47,641 | 25,105 | ||||||||
Total cash used in investing activities | (32,104 | ) | (9,204 | ) | (9,583 | ) | |||||
Total cash used in financing activities | (18,605 | ) | (28,130 | ) | (16,074 | ) | |||||
Change in cash and cash equivalents | (2,356 | ) | 10,307 | (552 | ) | ||||||
Cash and cash equivalents, end of year | $ | 60,260 | $ | 62,616 | $ | 52,309 | |||||
Depreciation and amortization expense | 9,042 | 8,180 | 8,046 | ||||||||
Cash paid for fixed assets and acquired intangible assets | $ | 32,118 | $ | 9,252 | $ | 9,583 | |||||
Total cash provided by operating activities
Cash flows provided by operating activities totaled $48.4 million for the fiscal year ended 2018, as compared with $47.6 million of cash flows provided by operating activities for the fiscal year ended 2017. The $0.7 million increase was primarily attributed to a $2.0 million increase in net income, an improvement in the cash flow impacts of changes to working capital and other assets of $19.0 million, and $2.2 million in additional non-cash components to net income in the year. The sources of operating cash were largely offset by a $15.3 million negative difference in the cash flow impacts of accrued expenses between the years which includes the release of our uncertain tax position, as well as a decrease of $2.8 million in dividends received from our Micro Bird joint venture.
Cash flows provided by operating activities totaled $47.6 million for the fiscal year ended 2017, as compared with $25.1 million of cash flows provided by operating activities for the fiscal year ended 2016. The $22.5 million increase was primarily attributed to a $21.9 million increase in net income that was partially offset by $12.3 million more of total non-cash components in net income, improved working capital cash flow impact of $7.7 million, and an increase of $2.3 million in dividends received from our Micro Bird joint venture.
Total cash used in investing activities
Cash flows used in investing activities totaled $32.1 million for the fiscal year ended 2018, as compared with $9.2 million of cash flows used in investing activities for the fiscal year ended 2017. The $22.9 million increase in cash used was primarily due to increased spending on manufacturing assets.
Cash flows used in investing activities totaled $9.2 million for the fiscal year ended 2017, as compared with $9.6 million of cash flows used in investing activities for the fiscal year ended 2016. The $0.4 million decrease in cash used was mainly attributed to cash paid for fixed assets.
37
Total cash used in financing activities
Cash used in financing activities totaled $18.6 million for the fiscal year ended 2018, as compared with $28.1 million in cash used in financing activities for the fiscal year ended 2017. The $9.5 million decrease in cash used was mainly attributed to a decrease of $7.7 million in cash spent on share repurchases under share repurchase programs, a $2.4 million decrease in cash dividends paid on preferred stock, and a $2.8 million decrease in debt principal payments. The decreases in cash used were partially offset by an increase of $1.7 million paid for debt issuance costs and a $1.2 million increase in cash taxes paid for employee taxes on vested restricted shares and stock option exercises.
Cash used in financing activities totaled $28.1 million for the fiscal year ended 2017, as compared with $16.1 million in cash used in financing activities for the fiscal year ended 2016. The $12.1 million increase in cash used was mainly attributed to $34.3 million in cash spent on share repurchases under the share repurchase program and a $17.0 million decrease in contributions from our former majority stockholder. The increase in cash used was partially offset by a decrease of $26.1 million in cash paid for principal payments on debt and an increase of $11.2 million in cash received for warrant exercises.
Free cash flow
Management believes the non-GAAP measurement of free cash flow, defined as net cash provided by continuing operations less cash paid for fixed assets, fairly represents the Company’s ability to generate surplus cash that could fund activities not in the ordinary course of business. See “Key Measures We Use to Evaluate Our Performance”. The following table sets forth the calculation of free cash flow for the fiscal years presented:
(in thousands of dollars) | 2018 | 2017 | 2016 | ||||||||
Total cash provided by operating activities | $ | 48,353 | $ | 47,641 | $ | 25,105 | |||||
Cash paid for fixed assets and acquired intangible assets | (32,118 | ) | (9,252 | ) | (9,583 | ) | |||||
Free cash flow | $ | 16,235 | $ | 38,389 | $ | 15,522 | |||||
Free cash flow for the fiscal year ended 2018 was $22.2 million lower than free cash flow for the fiscal year ended 2017, primarily due to an increase of $22.9 million in cash paid for manufacturing assets, which was partially offset by a $0.7 million increase from cash provided by operating activities as discussed above.
Free cash flow for the fiscal year ended 2017 was $22.9 million higher than free cash flow for the fiscal year ended 2016, which was primarily driven by an increase in net income of $21.9 million.
Commitments and Contractual Obligations
In the normal course of business, we enter into various contractual obligations that impact, or could impact, our liquidity. The table below outlines our projected cash payments for material obligations at September 29, 2018. Also refer to Note 10, Guarantees, Commitments and Contingencies, to the accompanying consolidated financial statements for further information on our commitments and contractual obligations.
Payments Due by Period | |||||||||||||||||||
(in thousands of dollars) | Total | Less than 1 year | 1 to 3 years | 3 to 5 years | More than 5 years | ||||||||||||||
Debt obligations (1) | $ | 146,150 | $ | 9,900 | $ | 19,800 | $ | 116,450 | $ | — | |||||||||
Interest expense on long-term debt obligations (2) | 27,812 | 6,545 | 11,845 | 9,422 | — | ||||||||||||||
Accrued warranty costs (3) | 22,646 | 9,142 | 9,048 | 4,456 | — | ||||||||||||||
Operating lease obligations (4) | 11,632 | 1,305 | 2,837 | 2,866 | 4,624 | ||||||||||||||
Future pension plan contributions (5) | 17,735 | — | 6,797 | 4,943 | 5,995 | ||||||||||||||
Capital lease obligations (6) | 235 | 175 | 36 | 24 | — | ||||||||||||||
Purchase commitments (7) | 88,806 | 84,850 | 3,956 | — | — | ||||||||||||||
Total commitments and contractual obligations | $ | 315,016 | $ | 111,917 | $ | 54,319 | $ | 138,161 | $ | 10,619 | |||||||||
(1) Reflects principal payments under the amended credit agreement. Refer to Note 8, Debt, for further information.
(2) Reflects estimated interest expense using the stated interest rate per the amended credit agreement at fiscal year end 2018.
(3) Reflects accrued anticipated warranty costs based on the historical average per unit warranty cost of the relevant bus model type.
38
(4) Represents the future minimum lease payments under non-cancelable operating leases with original terms exceeding one year.
(5) Represents expected future minimum IRS contributions required to fund Blue Bird's pension plan, based on current actuarial assumptions.
(6) Represents the future minimum lease payments under non-cancelable capital leases, including interest.
(7) Reflects non-cancelable purchase commitments for manufacturing inventory and capital assets.
Off-Balance Sheet arrangements
We lease office buildings and fork lifts for use in our operations on an operating lease basis.
We had outstanding letters of credit totaling $6.9 million at September 29, 2018, the majority of which secure our self-insured workers compensation program, the collateral for which is regulated by the State of Georgia.
At September 29, 2018, there were 0.5 million shares of common stock issuable upon exercise of outstanding warrants.
Critical Accounting Policies and Estimates
The preparation of financial statements in conformity with U.S. GAAP requires management to make estimates and assumptions that affect the reported amounts of assets and liabilities at the date of the financial statements and the reported amounts of revenues and expenses during the reporting period. Blue Bird evaluates its estimates on an ongoing basis, based on historical experience and on various other assumptions that are believed to be reasonable under the circumstances. Application of these accounting policies involves the exercise of judgment and use of assumptions as to future uncertainties and, as a result, actual results could differ from these estimates.
Use of Estimates and Assumptions
The preparation of financial statements in accordance with accounting principles generally accepted in the United States of America (“U.S. GAAP”) requires management to make estimates and assumptions. At the date of the financial statements, these estimates and assumptions affect the reported amounts of assets and liabilities and disclosures of contingent assets and liabilities, and during the reporting period, these estimates and assumptions affect the reported amounts of revenues and expenses. For example, significant management judgments are required in determining excess, obsolete, or unsalable inventory, allowance for doubtful accounts, potential impairment of long-lived assets, goodwill and intangibles, the accounting for self-insurance reserves, warranty reserves, pension obligations, income taxes, environmental liabilities and contingencies. Future events and their effects cannot be predicted with certainty, and, accordingly, the Company’s accounting estimates require the exercise of judgment. The accounting estimates used in the preparation of the Company’s consolidated financial statements may change as new events occur, as more experience is acquired, as additional information is obtained and as the Company’s operating environment changes. The Company evaluates and updates its assumptions and estimates on an ongoing basis and may employ outside experts to assist in the Company’s evaluations. Actual results could differ from the estimates that the Company has used.
Revenue Recognition
The Company recognizes revenue when persuasive evidence of an arrangement exists, ownership has transferred to the customer, the selling price is fixed or determinable, and collectability is reasonably assured. Generally, the Company recognizes revenue, net of sales concessions, when the product is delivered or when the product has been completed, is ready for delivery, has been paid for, its title has transferred and is awaiting pickup by the customer, which generally occurs within 30 days of completion. Provisions for discounts are recorded in the same period as the related revenues.
The Company sells extended warranties related to its products. Revenue related to these contracts is recognized on a straight-line basis over the contract period and costs thereunder are expensed as incurred.
The Company classifies shipping and handling revenues and costs billed to a customer as net sales on the Consolidated Statements of Operations and the related costs incurred by the Company are included in cost of goods sold on the Consolidated Statements of Operations. Inbound shipping and handling costs and outbound shipping costs which are paid for by the Company and not charged to a customer are recorded in cost of goods sold on the Consolidated Statements of Operations.
39
Self-Insurance
The Company is self-insured for the majority of its workers’ compensation and medical claims. The expected ultimate cost for claims incurred as of the balance sheet date is not discounted and is recognized as a liability. Self-insurance losses for claims filed and claims incurred but not reported are accrued based upon estimates of the aggregate liability for uninsured claims using loss development factors and actuarial assumptions followed in the insurance industry and historical loss development experience. At September 29, 2018 and September 30, 2017, reserves totaled approximately $5.2 million and $5.4 million, respectively.
Inventories
The Company values inventories at the lower of cost or net realizable value. The Company uses a standard costing methodology, which approximates cost on a first-in, first-out (“FIFO”) basis. The Company reviews the standard costs of raw materials, work-in-process and finished goods inventory on a periodic basis to ensure that its inventories approximate current actual costs. Manufacturing cost includes raw materials, direct labor and manufacturing overhead. Obsolete inventory amounts are based on historical usage and assumptions about future demand.
Goodwill and Intangible Assets
Goodwill represents the excess of the purchase price of acquired businesses over the fair value of the assets acquired less liabilities assumed in connection with such acquisition. In accordance with the provisions of ASC 350, Intangibles—Goodwill and Other (“ASC 350”), goodwill and intangible assets with indefinite useful lives acquired in an acquisition are not amortized, but instead are tested for impairment at least annually or more frequently should an event occur or circumstances indicate that the carrying amount may be impaired. Such events or circumstances may be a significant change in business climate, economic and industry trends, legal factors, negative operating performance indicators, significant competition, changes in strategy or disposition of a reporting unit or a portion thereof. Although management believes the assumptions used in the determination of the value of the enterprise are reasonable, no assurance can be given that these assumptions will be achieved. As a result, impairment charges may occur when goodwill is tested for impairment in the future.
We have two reporting units for which we test goodwill for impairment: Bus and Parts. In the evaluation of goodwill for impairment, we have the option to perform a qualitative assessment to determine whether further impairment testing is necessary or to perform a quantitative assessment by comparing the fair value of a reporting unit to its carrying amount, including goodwill. Under the qualitative assessment, an entity is not required to calculate the fair value of a reporting unit unless the entity determines that it is more likely than not that its fair value is less than its carrying amount. If under the quantitative assessment the fair value of a reporting unit is less than its carrying amount, then the amount of the impairment loss, if any, must be measured under step two of the impairment analysis. In step two of the analysis, we would record an impairment loss equal to the excess of the carrying value of the reporting unit’s goodwill over its implied fair value should such a circumstance arise.
Fair value of the reporting units is estimated primarily using the income approach, which incorporates the use of discounted cash flow (DCF) analysis. A number of significant assumptions and estimates are involved in the application of the DCF model to forecast operating cash flows, including markets and market shares, sales volumes and prices, costs to produce, tax rates, capital spending, discount rate and working capital changes. The cash flow forecasts are based on approved strategic operating plans.
During the fourth quarter of each fiscal year presented, we performed our annual impairment assessment of goodwill which did not indicate that an impairment existed.
In the evaluation of indefinite lived assets for impairment, we have the option to perform a qualitative assessment to determine whether further impairment testing is necessary, or to perform a quantitative assessment by comparing the fair value of an asset to its carrying amount. The Company’s intangible asset with an indefinite useful life is the Blue Bird trade-name. Under the qualitative assessment, an entity is not required to calculate the fair value of the asset unless the entity determines that it is more likely than not that its fair value is less than its carrying amount. If a qualitative assessment is not performed or if a quantitative assessment is otherwise required, then the entity compares the fair value of an asset to its carrying amount and the amount of the impairment loss, if any, is the difference between fair value and carrying value. The fair value of our trade name is derived by using the relief from royalty method, which discounts the estimated cash savings we realized by owning the name instead of otherwise having to license or lease it.
During the fourth quarter of each fiscal year presented, we performed our annual impairment assessment of our trade name which did not indicate that an impairment existed.
40
Our intangible assets with definite useful lives include customer relationships and engineering designs, which are amortized over their estimated useful lives of 20 and 7 years, respectively, using the straight-line method. These assets are tested for impairment whenever events or changes in circumstances indicate the carrying amount of the assets may not be recoverable. No impairments have been recorded.
Pensions
We have pension benefit costs and obligations, which are developed from actuarial valuations. Actuarial assumptions attempt to anticipate future events and are used in calculating the expense and liability relating to our plan. These factors include assumptions we make about interest rates and expected investment return on plan assets. In addition, our actuarial consultants also use subjective factors such as mortality rates to develop our valuations. We review and update these assumptions on an annual basis at the beginning of each fiscal year. We are required to consider current market conditions, including changes in interest rates, in making these assumptions. Effective January 1, 2006, the benefit plan was frozen to all participants. No accrual of future benefits is earned or calculated beyond this date. Accordingly, our obligation estimate is based on benefits earned at that time discounted using an estimate of the single equivalent discount rate determined by matching the plan’s future expected cash flows to spot rates from a yield curve comprised of high quality corporate bond rates of various durations. The expected long-term rate of return on plan assets reflects the average rate of earnings expected on the funds invested, or to be invested, to provide for the pension benefit obligation. In estimating that rate, appropriate consideration is given to the returns being earned by the plan assets in the fund and rates of return expected to be available for reinvestment and a building block method and we consider asset allocations, input from an external pension investment adviser, and risks and other factors adjusted for our specific investment strategy. The focus is on long-term trends and provides for the consideration of recent plan performance.
The actuarial assumptions that we use may differ materially from actual results due to changing market and economic conditions as well as longer or shorter life spans of participants. These differences may result in a significant impact to the measurement of our pension benefit obligations, and to the amount of pension benefits expense we may record. For example, as of September 29, 2018, a one-half percent increase in the discount rate would reduce the projected benefit obligation of our pension plans by approximately $8.3 million, while a one-half percent decrease in the discount rate would increase the projected benefit obligation of our pension plans by approximately $9.1 million.
Product Warranty Costs
The Company’s products are generally warranted against defects in material and workmanship for a period of one to five years. A provision for estimated warranty costs is recorded at the time a unit is sold. The methodology to determine the warranty reserve calculates the average expected warranty claims using warranty claims by body type, by month, over the life of the bus, which is then multiplied by remaining months under warranty, by warranty type. Management believes the methodology provides an accurate reserve estimate. Actual claims incurred could differ from the original estimates, requiring future adjustments.
The Company also sells extended warranties related to its products. Revenue related to these contracts is recognized on a straight-line basis over the contract period and costs thereunder are expensed as incurred. All warranty expenses are recorded in cost of goods sold on the Consolidated Statements of Operations. The current methodology to determine short-term extended warranty income reserve is based on twelve months of the remaining warranty value for each effective extended warranty at the balance sheet date.
Income Taxes
The Company accounts for income taxes in accordance with ASC 740, Income Taxes (“ASC 740”), which requires an asset and liability approach to financial accounting and reporting for income taxes. Under this approach, deferred income taxes represent the expected future tax consequences of temporary differences between the financial statement and tax basis of assets and liabilities. The Company evaluates its ability, based on the weight of evidence available, to realize future tax benefits from deferred tax assets and establishes a valuation allowance to reduce a deferred tax asset to a level which, more likely than not, will be realized in future years.
The Company recognizes uncertain tax positions based on a cumulative probability assessment if it is more likely than not that the tax position will be sustained upon examination by an appropriate tax authority with full knowledge of all information. Recognized income tax positions are measured at the largest amount that is greater than 50% likely of being realized. Amounts recorded for uncertain tax positions are periodically assessed, including the evaluation of new facts and circumstances, to ensure sustainability of the positions. The Company records interest and penalties related to unrecognized tax benefits in income tax expense.
Recent Accounting Pronouncements
A discussion of recently issued accounting standards applicable to the Company is described in Note 2, Summary of Significant Accounting Policies and Recently Issued Accounting Standards, in the Notes to Consolidated Financial Statements contained elsewhere in this Report, and we incorporate such discussion by reference herein.
41
Item 7A. Quantitative and Qualitative Disclosures About Market Risk
The Company is exposed to market risk from changes in interest rates, currency exchange rates, and commodity prices.
Interest Rate Risk
At September 29, 2018, the Company carried $146.2 million of term loan debt with a rate of LIBOR plus 225 basis points. At September 29, 2018, a 100 basis point increase or decrease in Blue Bird’s effective interest rate under its Credit Facilities would result in additional expense, or reduced expense, of $1.2 million per annum.
Commodity Risk
The Company and its suppliers incorporate raw and finished commodities such as steel, copper, aluminum, and other automotive type commodities into its products. We often bid on contracts weeks or months before school buses are delivered and enter into school bus sales contracts with fixed prices per bus. The sales contracts generally do not have an indexed price escalation formula to account for economic fluctuations between the contract date and the delivery date. As a result, we are typically unable to pass along increased economic fluctuation costs to our customers. We generally purchase steel one quarter in advance, but because we generally do not otherwise hedge steel or the other primary commodities we purchase (rubber, aluminum and copper), changes in prices of raw materials can significantly impact future operating margins.
Currency Risk
The Company transacts substantially all of its sales in United States Dollars. Our foreign customers have exposure to risks related to changes in foreign currency exchange rates on our sales in that region, due in part to the time elapsed between a fixed price order date and delivery/payment for the order. Foreign currency exchange rates can have material adverse effects on our foreign customers' ability to purchase our products. Therefore, at times, we may allow them to pay in their local currency and we may utilize derivative instruments to hedge changes in foreign currency exchange rates for those transactions.
42
Item 8. Financial Statements and Supplementary Data
Selected Quarterly Financial Data (Unaudited)
(in thousands except per share data) | ||||||||||||||||
First Quarter | Second Quarter | Third Quarter | Fourth Quarter | |||||||||||||
2018 | ||||||||||||||||
Net sales | $ | 162,549 | $ | 216,628 | $ | 314,186 | $ | 331,613 | ||||||||
Gross profit | 20,648 | 21,668 | 36,973 | 42,699 | ||||||||||||
Operating (loss) profit | (5,270 | ) | 2,927 | 16,023 | 19,553 | |||||||||||
Net (loss) income | (7,839 | ) | 1,836 | 21,891 | 14,932 | |||||||||||
Earnings per share: | ||||||||||||||||
Net (loss) income (from above) | $ | (7,839 | ) | $ | 1,836 | $ | 21,891 | $ | 14,932 | |||||||
Less: preferred stock dividends | 770 | 763 | 182 | 181 | ||||||||||||
Net (loss) income available to common stockholders | $ | (8,609 | ) | $ | 1,073 | $ | 21,709 | $ | 14,751 | |||||||
Basic (loss) earnings per share | (0.36 | ) | 0.04 | 0.83 | 0.55 | |||||||||||
Diluted (loss) earnings per share | (0.36 | ) | 0.04 | 0.77 | 0.52 | |||||||||||
2017 | ||||||||||||||||
Net sales | $ | 136,660 | $ | 208,651 | $ | 332,604 | $ | 312,687 | ||||||||
Gross profit | 18,198 | 24,649 | 45,010 | 39,511 | ||||||||||||
Operating profit | 6 | 5,390 | 28,679 | 20,462 | ||||||||||||
Net (loss) income | $ | (8,523 | ) | $ | 2,748 | $ | 20,032 | $ | 14,544 | |||||||
Earnings per share: | ||||||||||||||||
Net (loss) income (from above) | $ | (8,523 | ) | $ | 2,748 | $ | 20,032 | $ | 14,544 | |||||||
Less: preferred stock dividends | 953 | 1,017 | 974 | 1,317 | ||||||||||||
Less: preferred stock repurchase | — | — | — | 6,091 | ||||||||||||
Net (loss) income available to common stockholders | $ | (9,476 | ) | $ | 1,731 | $ | 19,058 | $ | 7,136 | |||||||
Basic (loss) earnings per share | $ | (0.42 | ) | $ | 0.08 | $ | 0.81 | $ | 0.30 | |||||||
Diluted (loss) earnings per share | (0.42 | ) | 0.07 | 0.68 | 0.28 | |||||||||||
43
Report of Independent Registered Public Accounting Firm
Stockholders and Board of Directors
Blue Bird Corporation
Macon, Georgia
Opinion on the Consolidated Financial Statements
We have audited the accompanying consolidated balance sheets of Blue Bird Corporation (the “Company”) and subsidiaries as of September 29, 2018 and September 30, 2017, the related consolidated statements of operations and comprehensive income (loss), stockholders’ deficit, and cash flows for each of the three years in the period ended September 29, 2018, and the related notes and schedules (collectively referred to as the “consolidated financial statements”). In our opinion, the consolidated financial statements present fairly, in all material respects, the financial position of the Company and subsidiaries at September 29, 2018 and September 30, 2017, and the results of their operations and their cash flows for each of the three years in the period ended September 29, 2018, in conformity with accounting principles generally accepted in the United States of America.
Basis for Opinion
These consolidated financial statements are the responsibility of the Company’s management. Our responsibility is to express an opinion on the Company’s consolidated financial statements based on our audits. We are a public accounting firm registered with the Public Company Accounting Oversight Board (United States) (“PCAOB”) and are required to be independent with respect to the Company in accordance with the U.S. federal securities laws and the applicable rules and regulations of the Securities and Exchange Commission and the PCAOB.
We conducted our audits in accordance with the standards of the PCAOB. Those standards require that we plan and perform the audit to obtain reasonable assurance about whether the consolidated financial statements are free of material misstatement, whether due to error or fraud. The Company is not required to have, nor were we engaged to perform, an audit of its internal control over financial reporting. As part of our audits we are required to obtain an understanding of internal control over financial reporting but not for the purpose of expressing an opinion on the effectiveness of the Company’s internal control over financial reporting. Accordingly, we express no such opinion.
Our audits included performing procedures to assess the risks of material misstatement of the consolidated financial statements, whether due to error or fraud, and performing procedures that respond to those risks. Such procedures included examining, on a test basis, evidence regarding the amounts and disclosures in the consolidated financial statements. Our audits also included evaluating the accounting principles used and significant estimates made by management, as well as evaluating the overall presentation of the consolidated financial statements. We believe that our audits provide a reasonable basis for our opinion.
/s/ BDO USA, LLP
We have served as the Company's auditor since 2016.
Atlanta, Georgia
December 12, 2018
44
BLUE BIRD CORPORATION AND SUBSIDIARIES
CONSOLIDATED BALANCE SHEETS
(in thousands except for share data) | September 29, 2018 | September 30, 2017 | |||||
Assets | |||||||
Current assets | |||||||
Cash and cash equivalents | $ | 60,260 | $ | 62,616 | |||
Accounts receivable, net | 24,067 | 10,148 | |||||
Inventories | 57,333 | 76,155 | |||||
Other current assets | 8,183 | 11,528 | |||||
Total current assets | $ | 149,843 | $ | 160,447 | |||
Property, plant and equipment, net | 66,054 | 34,708 | |||||
Goodwill | 18,825 | 18,825 | |||||
Intangible assets, net | 55,472 | 57,481 | |||||
Equity investment in affiliate | 11,123 | 11,625 | |||||
Deferred tax asset | 4,437 | 11,755 | |||||
Other assets | 1,676 | 975 | |||||
Total assets | $ | 307,430 | $ | 295,816 | |||
Liabilities and Stockholders' Deficit | |||||||
Current liabilities | |||||||
Accounts payable | $ | 95,780 | $ | 87,331 | |||
Warranty | 9,142 | 8,573 | |||||
Accrued expenses | 21,935 | 18,229 | |||||
Deferred warranty income | 8,159 | 6,776 | |||||
Other current liabilities | 3,941 | 9,847 | |||||
Current portion of senior term debt | 9,900 | 8,000 | |||||
Total current liabilities | $ | 148,857 | $ | 138,756 | |||
Long-term liabilities | |||||||
Long-term debt | $ | 132,239 | $ | 143,224 | |||
Warranty | 13,504 | 12,337 | |||||
Deferred warranty income | 15,032 | 12,519 | |||||
Deferred tax liabilities | 197 | — | |||||
Other liabilities | 4,924 | 15,064 | |||||
Pension | 21,013 | 32,426 | |||||
Total long-term liabilities | $ | 186,909 | $ | 215,570 | |||
Guarantees, commitments and contingencies (Note 10) | |||||||
Stockholders' deficit | |||||||
Preferred stock, $0.0001 par value, 10,000,000 shares authorized, 93,000 issued with liquidation preference of $9,300 at September 29, 2018 and 400,000 issued with liquidation preference of $40,000 at September 30, 2017 | $ | 9,300 | $ | 40,000 | |||
Common stock, $0.0001 par value, 100,000,000 shares authorized, 27,259,262 and 23,739,344 issued and outstanding at September 29, 2018 and September 30, 2017, respectively. | 3 | 2 | |||||
Additional paid-in capital | 70,023 | 45,418 | |||||
Accumulated deficit | (69,235 | ) | (100,055 | ) | |||
Accumulated other comprehensive loss | (38,427 | ) | (43,875 | ) | |||
Total stockholders' deficit | $ | (28,336 | ) | $ | (58,510 | ) | |
Total liabilities and stockholders' deficit | $ | 307,430 | $ | 295,816 | |||
The accompanying notes are an integral part of these consolidated financial statements.
45
BLUE BIRD CORPORATION AND SUBSIDIARIES
CONSOLIDATED STATEMENTS OF OPERATIONS
Fiscal Years Ended | |||||||||||
(in thousands except for share data) | 2018 | 2017 | 2016 | ||||||||
Net sales | $ | 1,024,976 | $ | 990,602 | $ | 932,010 | |||||
Cost of goods sold | 902,988 | 863,234 | 802,654 | ||||||||
Gross profit | $ | 121,988 | $ | 127,368 | $ | 129,356 | |||||
Operating expenses | |||||||||||
Selling, general and administrative expenses | 88,755 | 72,831 | 102,711 | ||||||||
Operating profit | $ | 33,233 | $ | 54,537 | $ | 26,645 | |||||
Interest expense | (6,661 | ) | (7,251 | ) | (16,412 | ) | |||||
Interest income | 70 | 140 | 133 | ||||||||
Other income (expense), net | 231 | 66 | (539 | ) | |||||||
Loss on debt extinguishment | — | (10,142 | ) | — | |||||||
Income before income taxes | $ | 26,873 | $ | 37,350 | $ | 9,827 | |||||
Income tax benefit (expense) | 2,620 | (11,856 | ) | (5,804 | ) | ||||||
Equity in net income of non-consolidated affiliate | 1,327 | 3,307 | 2,877 | ||||||||
Net income | $ | 30,820 | $ | 28,801 | $ | 6,900 | |||||
Earnings per share: | |||||||||||
Net income (from above) | $ | 30,820 | $ | 28,801 | $ | 6,900 | |||||
Less: preferred stock dividends | 1,896 | 4,261 | 3,878 | ||||||||
Less: preferred stock repurchase | — | 6,091 | — | ||||||||
Net income available to common stockholders | $ | 28,924 | $ | 18,449 | $ | 3,022 | |||||
Basic weighted average shares outstanding | 25,259,595 | 23,343,772 | 21,252,616 | ||||||||
Diluted weighted average shares outstanding | 28,616,862 | 24,877,729 | 21,315,619 | ||||||||
Basic earnings per share | $ | 1.15 | $ | 0.79 | $ | 0.14 | |||||
Diluted earnings per share | $ | 1.08 | $ | 0.74 | $ | 0.14 | |||||
The accompanying notes are an integral part of these consolidated financial statements.
46
BLUE BIRD CORPORATION AND SUBSIDIARIES
CONSOLIDATED STATEMENTS OF COMPREHENSIVE INCOME (LOSS)
Fiscal Years Ended | |||||||||||
(in thousands) | 2018 | 2017 | 2016 | ||||||||
Net income | $ | 30,820 | $ | 28,801 | $ | 6,900 | |||||
Other comprehensive income (loss), net of tax | |||||||||||
Net change in defined benefit pension plan | 5,448 | 15,003 | (7,104 | ) | |||||||
Net unrealized gain (loss) on cash flow hedges | — | 13 | (13 | ) | |||||||
Total other comprehensive income (loss), net of tax | $ | 5,448 | $ | 15,016 | $ | (7,117 | ) | ||||
Comprehensive income (loss) | $ | 36,268 | $ | 43,817 | $ | (217 | ) | ||||
The accompanying notes are an integral part of these consolidated financial statements.
47
BLUE BIRD CORPORATION AND SUBSIDIARIES
CONSOLIDATED STATEMENTS OF CASH FLOWS
Fiscal Years Ended | |||||||||||
(in thousands) | 2018 | 2017 | 2016 | ||||||||
Cash flows from operating activities | |||||||||||
Net income | $ | 30,820 | $ | 28,801 | $ | 6,900 | |||||
Adjustments to reconcile net income to net cash provided by operating activities: | |||||||||||
Depreciation and amortization | 9,042 | 8,180 | 8,046 | ||||||||
Amortization of debt costs | 771 | 1,107 | 3,007 | ||||||||
Share-based compensation | 2,628 | 1,270 | 12,717 | ||||||||
Equity in net income of affiliate | (1,327 | ) | (3,307 | ) | (2,877 | ) | |||||
Loss (gain) on disposal of fixed assets | 114 | (33 | ) | 72 | |||||||
Deferred taxes | 5,655 | (1,202 | ) | 8,957 | |||||||
Provision for bad debt | — | — | (5 | ) | |||||||
Amortization of deferred actuarial pension losses | 3,521 | 6,291 | 4,787 | ||||||||
Loss on debt extinguishment | — | 10,142 | — | ||||||||
Unrealized gains on foreign currency hedges | (109 | ) | — | — | |||||||
Changes in operating assets and liabilities: | |||||||||||
Accounts receivable | (13,920 | ) | 10,167 | (6,564 | ) | ||||||
Inventories | 17,786 | (22,349 | ) | (4,626 | ) | ||||||
Other assets | 2,755 | (5,469 | ) | (2,457 | ) | ||||||
Accounts payable | 3,096 | 8,404 | (330 | ) | |||||||
Accrued expenses, pension and other liabilities | (14,307 | ) | 1,013 | (4,838 | ) | ||||||
Dividend from equity investment in affiliate | 1,828 | 4,626 | 2,316 | ||||||||
Total adjustments | $ | 17,533 | $ | 18,840 | $ | 18,205 | |||||
Total cash provided by operating activities | $ | 48,353 | $ | 47,641 | $ | 25,105 | |||||
Cash flows from investing activities | |||||||||||
Cash paid for fixed assets and acquired intangible assets | $ | (32,118 | ) | $ | (9,252 | ) | $ | (9,583 | ) | ||
Proceeds from sale of fixed assets | 14 | 48 | — | ||||||||
Total cash used in investing activities | $ | (32,104 | ) | $ | (9,204 | ) | $ | (9,583 | ) | ||
Cash flows from financing activities | |||||||||||
Repayments under the former senior term loan | — | (161,500 | ) | (36,750 | ) | ||||||
Borrowings under the new term loan | — | 156,887 | — | ||||||||
Repayments under the new term loan | (7,850 | ) | (6,000 | ) | — | ||||||
Cash paid for capital leases | (158 | ) | (155 | ) | (221 | ) | |||||
Cash paid for debt issuance costs | (2,006 | ) | (299 | ) | (1,117 | ) | |||||
Cash paid to extinguish debt | — | (507 | ) | — | |||||||
Contributions from former majority stockholder | — | — | 16,971 | ||||||||
Payment of dividends on preferred stock | (1,896 | ) | (4,261 | ) | (2,881 | ) | |||||
Cash paid for employee taxes on vested restricted shares and stock option exercises | (2,211 | ) | (1,013 | ) | (3,892 | ) | |||||
Proceeds from exercises of warrants | 22,102 | 23,045 | 11,816 | ||||||||
Common stock, preferred stock, and warrant repurchases under the share repurchase program | (26,586 | ) | (34,327 | ) | — | ||||||
Total cash used in financing activities | $ | (18,605 | ) | $ | (28,130 | ) | $ | (16,074 | ) | ||
Change in cash and cash equivalents | (2,356 | ) | 10,307 | (552 | ) | ||||||
Cash and cash equivalents, beginning of year | 62,616 | 52,309 | 52,861 | ||||||||
Cash and cash equivalents, end of year | $ | 60,260 | $ | 62,616 | $ | 52,309 | |||||
48
Fiscal Years Ended | |||||||||||
(in thousands) | 2018 | 2017 | 2016 | ||||||||
Supplemental disclosures of cash flow information | |||||||||||
Cash paid during the period for: | |||||||||||
Interest paid, net of interest received | $ | 5,782 | $ | 6,081 | $ | 13,315 | |||||
Income tax paid, net of tax refunds | 3,673 | 8,420 | 159 | ||||||||
Non-cash Investing and Financing Activities: | |||||||||||
Capital expenditures funded by capital lease borrowings | $ | — | $ | — | $ | 100 | |||||
Capital additions to property, plant and equipment and intangible assets from change in accounts payable and transfers from other assets and inventory | 6,389 | (1,719 | ) | 2,081 | |||||||
Common stock dividend on Series A preferred stock (market value of common shares) | — | — | 998 | ||||||||
Cashless exercise of stock options | 3,570 | 4,216 | 2,312 | ||||||||
The accompanying notes are an integral part of these consolidated financial statements.
49
BLUE BIRD CORPORATION AND SUBSIDIARIES
CONSOLIDATED STATEMENTS OF STOCKHOLDERS' DEFICIT
Common Stock | Convertible Preferred Stock | ||||||||||||||||||||||||||||
(in thousands except for share data) | Shares | Par Value | Additional Paid-In-Capital | Shares | Amount | Accumulated Other Comprehensive Loss | Accumulated Deficit | Total Stockholders' Deficit | |||||||||||||||||||||
Balance, October 3, 2015 | 20,874,882 | $ | 2 | $ | 15,887 | 500,000 | $ | 50,000 | $ | (51,774 | ) | $ | (135,345 | ) | $ | (121,230 | ) | ||||||||||||
Business combination tax adjustment | — | — | — | — | — | — | (411 | ) | (411 | ) | |||||||||||||||||||
Exercise of stock warrants | 1,027,493 | — | 11,816 | — | — | — | — | 11,816 | |||||||||||||||||||||
Restricted stock activity | 455,465 | — | (3,511 | ) | — | — | — | — | (3,511 | ) | |||||||||||||||||||
Exercise of stock options, cashless | 40,611 | — | (381 | ) | — | — | — | — | (381 | ) | |||||||||||||||||||
Employee stock purchase plan activity | 23,673 | — | 247 | — | — | — | — | 247 | |||||||||||||||||||||
Series A preferred stock dividends | 95,934 | — | (2,881 | ) | — | — | — | — | (2,881 | ) | |||||||||||||||||||
Contribution from former majority stockholder | — | — | 16,971 | — | — | — | — | 16,971 | |||||||||||||||||||||
Share-based compensation expense | — | — | 12,623 | — | — | — | — | 12,623 | |||||||||||||||||||||
Net income | — | — | — | — | — | — | 6,900 | 6,900 | |||||||||||||||||||||
Other comprehensive loss, net of tax | — | — | — | — | — | (7,117 | ) | — | (7,117 | ) | |||||||||||||||||||
Balance, October 1, 2016 | 22,518,058 | $ | 2 | $ | 50,771 | 500,000 | $ | 50,000 | $ | (58,891 | ) | $ | (128,856 | ) | $ | (86,974 | ) | ||||||||||||
Exercise of stock warrants | 2,003,914 | — | 23,045 | — | — | — | — | 23,045 | |||||||||||||||||||||
Exercise of stock options, cashless | 82,124 | — | (1,013 | ) | — | — | — | — | (1,013 | ) | |||||||||||||||||||
Series A preferred stock dividends | — | — | (4,261 | ) | — | — | — | — | (4,261 | ) | |||||||||||||||||||
Share repurchase program | (864,752 | ) | — | (24,282 | ) | (100,000 | ) | (10,000 | ) | — | — | (34,282 | ) | ||||||||||||||||
Share-based compensation expense | — | — | 1,158 | — | — | — | — | 1,158 | |||||||||||||||||||||
Net income | — | — | — | — | — | — | 28,801 | 28,801 | |||||||||||||||||||||
Other comprehensive income, net of tax | — | — | — | — | — | 15,016 | — | 15,016 | |||||||||||||||||||||
Balance, September 30, 2017 | 23,739,344 | $ | 2 | $ | 45,418 | 400,000 | $ | 40,000 | $ | (43,875 | ) | $ | (100,055 | ) | $ | (58,510 | ) | ||||||||||||
Exercise of stock warrants | 1,921,901 | 1 | 22,102 | — | — | — | — | 22,103 | |||||||||||||||||||||
Restricted stock activity | 33,963 | — | (370 | ) | — | — | — | — | (370 | ) | |||||||||||||||||||
Exercise of stock options, cashless | 97,504 | — | (1,841 | ) | — | — | — | — | (1,841 | ) | |||||||||||||||||||
Series A preferred stock dividends | — | — | (1,896 | ) | — | — | — | — | (1,896 | ) | |||||||||||||||||||
Share repurchase program | (1,183,412 | ) | — | (26,586 | ) | — | — | — | — | (26,586 | ) | ||||||||||||||||||
Preferred stock conversion | 2,649,962 | — | 30,700 | (307,000 | ) | (30,700 | ) | — | — | — | |||||||||||||||||||
Share-based compensation expense | — | — | 2,496 | — | — | — | — | 2,496 | |||||||||||||||||||||
Net income | — | — | — | — | — | — | 30,820 | 30,820 | |||||||||||||||||||||
Other comprehensive income, net of tax | — | — | — | — | — | 5,448 | — | 5,448 | |||||||||||||||||||||
Balance, September 29, 2018 | 27,259,262 | $ | 3 | $ | 70,023 | 93,000 | $ | 9,300 | $ | (38,427 | ) | $ | (69,235 | ) | $ | (28,336 | ) | ||||||||||||
The accompanying notes are an integral part of these consolidated financial statements.
50
BLUE BIRD CORPORATION
NOTES TO CONSOLIDATED FINANCIAL STATEMENTS
1. Nature of Business and Basis of Presentation
Nature of Business
On February 24, 2015, Hennessy Capital Acquisition Corp. ("HCAC"), a special purpose acquisition company (SPAC), consummated its business combination (the “Business Combination”), pursuant to which HCAC acquired all of the outstanding capital stock of School Bus Holdings, Inc. (“SBH”) from The Traxis Group B.V. (the “Seller”). SBH operates its business of designing and manufacturing school buses through subsidiaries and under the Blue Bird Corporation (“Blue Bird”) name. In the Business Combination, the total purchase price was paid in a combination of cash ($100.0 million) and in shares of HCAC’s Common Stock (12,000,000 shares valued at a total of $120.0 million). In connection with the closing of the Business Combination, we changed our name from Hennessy Capital Acquisition Corp. to Blue Bird Corporation.
Blue Bird Body Company, a wholly-owned subsidiary of Blue Bird, was incorporated in 1958 and has manufactured, assembled and sold school buses to a variety of municipal, federal and commercial customers since 1927. The majority of Blue Bird’s sales are made to an independent distributor network, which in turn sells buses to ultimate end users. We are headquartered in Macon, Georgia. References in these notes to financial statements to “Blue Bird”, the “Company,” “we,” “our,” or “us” refer to Blue Bird Corporation and its wholly-owned subsidiaries, unless the context specifically indicates otherwise.
Basis of Presentation
The accompanying consolidated financial statements include the accounts of the Company and its wholly-owned subsidiaries. All significant inter-company transactions and accounts have been eliminated in consolidation.
The Company’s fiscal year ends on the Saturday closest to September 30 with its quarters consisting of thirteen weeks in most years. In fiscal years 2018, 2017, and 2016, there were a total of 52 weeks.
The Business Combination was accounted for as a reverse acquisition since immediately following completion of the transaction the sole stockholder of SBH immediately prior to the Business Combination maintained effective control of Blue Bird Corporation, the post-combination company. For accounting purposes, SBH is deemed the accounting acquirer in the transaction and, consequently, the transaction is treated as a recapitalization of SBH (i.e., a capital transaction involving the issuance of stock and payment of cash by HCAC for the stock of SBH). Accordingly, the consolidated assets, liabilities and results of operations of SBH are the historical financial statements of Blue Bird Corporation, and HCAC assets, liabilities and results of operations are consolidated with SBH beginning on the acquisition date. No step-up in basis of intangible assets or goodwill was recorded in this transaction. We have effected this treatment through opening stockholders' deficit by adjusting the number of our common shares outstanding. Other than transaction costs paid and a contribution from our majority stockholder for payment of management incentive compensation related to the transaction, the transaction was primarily non-cash and involved exchanges of consideration and equity between our majority stockholder and HCAC and its related entities.
2. Summary of Significant Accounting Policies and Recently Issued Accounting Standards
Use of Estimates and Assumptions
The preparation of financial statements in accordance with accounting principles generally accepted in the United States of America (“U.S. GAAP”) requires management to make estimates and assumptions. At the date of the financial statements, these estimates and assumptions affect the reported amounts of assets and liabilities and disclosures of contingent assets and liabilities, and during the reporting period, these estimates and assumptions affect the reported amounts of revenues and expenses. For example, significant management judgments are required in determining excess, obsolete, or unsalable inventory, allowance for doubtful accounts, potential impairment of long-lived assets, goodwill and intangibles, the accounting for self-insurance reserves, warranty reserves, pension obligations, income taxes, environmental liabilities and contingencies. Future events and their effects cannot be predicted with certainty, and, accordingly, the Company’s accounting estimates require the exercise of judgment. The accounting estimates used in the preparation of the Company’s consolidated financial statements may change as new events occur, as more experience is acquired, as additional information is obtained and as the Company’s operating environment changes. The Company evaluates and updates its assumptions and estimates on an ongoing basis and may employ outside experts to assist in the Company’s evaluations. Actual results could differ from the estimates that the Company has used.
51
Cash and Cash Equivalents
The Company considers all highly liquid investments purchased with an original maturity of three months or less to be cash equivalents.
Allowance for Doubtful Accounts
Accounts receivable consist of amounts owed to the Company by customers. The Company monitors collections and payments from customers, and generally does not require collateral. Accounts receivable are generally due within 30 to 90 days. The Company provides for the possible inability to collect accounts receivable by recording an allowance for doubtful accounts. The Company reserves for an account when it is considered potentially uncollectible. The Company estimates its allowance for doubtful accounts based on historical experience, aging of accounts receivable and information regarding the creditworthiness of its customers. To date, losses have been within the range of management’s expectations. The Company writes off accounts receivable if it determines that the account is uncollectible.
Revenue Recognition
The Company recognizes revenue when persuasive evidence of an arrangement exists, ownership has transferred to the customer, the selling price is fixed or determinable, and collectability is reasonably assured. Generally, the Company recognizes revenue, net of sales concessions, when the product is delivered or when the product has been completed, is ready for delivery, has been paid for, its title has transferred and is awaiting pickup by the customer, which generally occurs within 30 days of completion.
The Company sells extended warranties related to its products. Revenue related to these contracts is recognized on a straight-line basis over the contract period and costs thereunder are expensed as incurred.
The Company classifies shipping and handling revenues and costs billed to a customer as net sales on the Consolidated Statements of Operations and the related costs incurred by the Company are included in cost of goods sold on the Consolidated Statements of Operations.
See Note 3, Supplemental Financial Information, for further information on warranties and shipping and handling costs.
Self-Insurance
The Company is self-insured for the majority of its workers’ compensation and medical claims. The expected ultimate cost for claims incurred as of the balance sheet date is not discounted and is recognized as a liability. Self-insurance losses for claims filed and claims incurred but not reported are accrued based upon estimates of the aggregate liability for uninsured claims, using loss development factors and actuarial assumptions followed in the insurance industry and historical loss development experience. See Note 3, Supplemental Financial Information, and Note 15, Benefit Plans, for further information.
Financial Instruments
The Company’s financial instruments consist primarily of cash and cash equivalents, trade receivables, accounts payable, revolving credit facilities and long-term debt. The carrying amounts of cash and cash equivalents, trade receivables and accounts payable approximate their fair values because of the short-term maturity and highly liquid nature of these instruments. The carrying value of the Company’s senior term loan approximates fair value due to the variable interest rate. See Note 8, Debt, for further discussion.
Inventories
The Company values inventories at the lower of cost or net realizable value. The Company uses a standard costing methodology, which approximates cost on a first-in, first-out (“FIFO”) basis. The Company reviews the standard costs of raw materials, work-in-process and finished goods inventory on a periodic basis to ensure that its inventories approximate current actual costs. Manufacturing cost includes raw materials, direct labor and manufacturing overhead. Obsolete inventory amounts are based on historical usage and assumptions about future demand.
52
Property, Plant and Equipment
Property, plant and equipment are stated at cost, less accumulated depreciation and amortization. Depreciation and amortization are calculated on a straight-line basis using the following periods, which represent the estimated useful lives of the assets:
Years | ||
Buildings | 15 - 33 | |
Machinery and equipment | 5 - 10 | |
Office furniture, equipment and other | 3 - 10 | |
Computer equipment and software | 3 - 7 | |
Costs, including capitalized interest and certain design, construction and installation costs related to assets that are under construction and are in the process of being readied for their intended use, are recorded as construction in progress and are not depreciated until such time as the subject asset is placed in service. Repairs and maintenance that do not extend the useful life of the asset are expensed as incurred. Upon sale, retirement, or other disposition of these assets, the costs and related accumulated depreciation are removed from the respective accounts and any gain or loss on the disposition is included on our Consolidated Statements of Operations.
Impairment of Long-Lived Assets
The Company reviews its long-lived assets, including property, plant and equipment, for impairment whenever events or changes in circumstances indicate the carrying amount of an asset may not be recoverable. If we are required to analyze recoverability based on a triggering event, undiscounted future cash flows over the estimated remaining life of the asset, or asset group, are projected. If these projected cash flows are less than the carrying amount, an impairment loss is recognized to the extent the fair value of the asset less any costs of disposition is less than the carrying amount of the asset. Judgments regarding the existence of impairment indicators are based on market and operational performance. Evaluating potential impairment also requires estimates of future operating results and cash flows. No impairment charge was recognized in any of the periods presented.
Goodwill and Intangible Assets
Goodwill represents the excess of the purchase price of acquired businesses over the fair value of the assets acquired less liabilities assumed in connection with such acquisition. In accordance with the provisions of ASC 350, Intangibles—Goodwill and Other, goodwill and intangible assets with indefinite useful lives acquired in an acquisition are not amortized, but instead are tested for impairment at least annually or more frequently should an event occur or circumstances indicate that the carrying amount may be impaired. Such events or circumstances may be a significant change in business climate, economic and industry trends, legal factors, negative operating performance indicators, significant competition, changes in strategy or disposition of a reporting unit or a portion thereof.
We have two reporting units for which we test goodwill for impairment: Bus and Parts. In the evaluation of goodwill for impairment, we have the option to perform a qualitative assessment to determine whether further impairment testing is necessary or to perform a quantitative assessment by comparing the fair value of a reporting unit to its carrying amount, including goodwill. Under the qualitative assessment, an entity is not required to calculate the fair value of a reporting unit unless the entity determines that it is more likely than not that its fair value is less than its carrying amount. If, under the quantitative assessment, the fair value of a reporting unit is less than its carrying amount, then the amount of the impairment loss, if any, must be measured under step two of the impairment analysis. In step two of the analysis, we would record an impairment loss equal to the excess of the carrying value of the reporting unit’s goodwill over its implied fair value, should such a circumstance arise.
Fair value of the reporting units is estimated primarily using the income approach, which incorporates the use of discounted cash flow (DCF) analysis. A number of significant assumptions and estimates are involved in the application of the DCF model to forecast operating cash flows, including markets and market shares, sales volumes and prices, costs to produce, tax rates, capital spending, discount rate and working capital changes. The cash flow forecasts are based on approved strategic operating plans and long-term forecasts.
In the evaluation of indefinite lived assets for impairment, we have the option to perform a qualitative assessment to determine whether further impairment testing is necessary, or to perform a quantitative assessment by comparing the fair value of an asset to its carrying amount. The Company’s intangible asset with an indefinite useful life is the "Blue Bird" trade name. Under the qualitative assessment, an entity is not required to calculate the fair value of the asset unless the entity determines that it is more likely than not that its fair value is less than its carrying amount. If a qualitative assessment is not performed or if a quantitative assessment is otherwise required, then the entity compares the fair value of an asset to its carrying amount and the amount of the impairment loss, if any, is the difference between fair value and carrying value. The fair value of our trade name is derived by using the relief from royalty method, which discounts the estimated cash savings we realized by owning the name instead of otherwise having to license or lease it.
53
Our intangible assets with a definite useful life are amortized over their estimated useful lives, 7 or 20 years, using the straight-line method. The useful lives of our intangible assets are reassessed annually and they are tested for impairment whenever events or changes in circumstances indicate the carrying amount of the asset may not be recoverable.
Debt Issue Costs
Amounts paid directly to lenders or as an original issue discount and amounts classified as issuance costs are recorded as a reduction in the carrying value of the debt, for which the Company had deferred financing costs totaling $4.0 million and $2.8 million at September 29, 2018 and September 30, 2017, respectively, incurred in connection with its debt facilities and related amendments.
All deferred financing costs are amortized to interest expense. The effective interest method is used for debt discounts related to the term loan. The Company’s amortization of these costs was $0.8 million, $1.1 million and $3.0 million for the fiscal years ended 2018, 2017 and 2016, respectively, and are reflected in the Consolidated Statements of Operations as a component of interest expense. See Note 8, Debt, for a discussion of the Company’s indebtedness.
Pensions
The Company accounts for its pension benefit obligations using actuarial models. The measurement of plan obligations and assets was made at September 29, 2018. Effective January 1, 2006, the benefit plan was frozen to all participants. No accrual of future benefits is earned or calculated beyond this date. Accordingly, our obligation estimate is based on benefits earned at that time discounted using an estimate of the single equivalent discount rate determined by matching the plan’s future expected cash flows to spot rates from a yield curve comprised of high quality corporate bond rates of various durations. The Company recognizes the funded status of its pension plan obligations in its Consolidated Balance Sheet and records in other comprehensive income (loss) certain gains and losses that arise during the period, but are deferred under pension accounting rules.
Product Warranty Costs
The Company’s products are generally warranted against defects in material and workmanship for a period of one to five years. A provision for estimated warranty costs is recorded at the time a unit is sold. The methodology to determine the warranty reserve calculates the average expected warranty claims using warranty claims by body type, by month, over the life of the bus, which is then multiplied by remaining months under warranty, by warranty type. Management believes the methodology provides an accurate reserve estimate. Actual claims incurred could differ from the original estimates, requiring future adjustments.
The Company also sells extended warranties related to its products. Revenue related to these contracts is recognized on a straight-line basis over the contract period and costs thereunder are expensed as incurred. All warranty expenses are recorded in the cost of goods sold line in the Consolidated Statements of Operations. The current methodology to determine short-term extended warranty income reserve is based on twelve months of the remaining warranty value for each effective extended warranty at the balance sheet date. See Note 3, Supplemental Financial Information, for further information.
Research and Development
Research and development costs are expensed as incurred and included in selling, general and administrative expenses in our Consolidated Statements of Operations. For the fiscal years ended 2018, 2017 and 2016, the Company expensed $8.4 million, $7.0 million and $5.4 million, respectively, in the Consolidated Statements of Operations, related to research and development.
Income Taxes
The Company accounts for income taxes in accordance with ASC 740, Income Taxes (“ASC 740”), which requires an asset and liability approach to financial accounting and reporting for income taxes. Under this approach, deferred income taxes represent the expected future tax consequences of temporary differences between the financial statement and tax basis of assets and liabilities. The Company evaluates its ability, based on the weight of evidence available, to realize future tax benefits from deferred tax assets and establishes a valuation allowance to reduce a deferred tax asset to a level which, more likely than not, will be realized in future years.
The Company recognizes uncertain tax positions based on a cumulative probability assessment if it is more likely than not that the tax position will be sustained upon examination by an appropriate tax authority with full knowledge of all information. Recognized income tax positions are measured at the largest amount that is greater than 50% likely of being realized. Amounts recorded for uncertain tax positions are periodically assessed, including the evaluation of new facts and circumstances, to ensure sustainability of the positions. The Company records interest and penalties related to unrecognized tax benefits in income tax expense.
54
Environmental Liabilities
The Company records reserves for environmental liabilities on a discounted basis when environmental investigation and remediation obligations are probable and related costs are reasonably estimable. See Note 10, Guarantees, Commitments and Contingencies, for further information.
Segment Reporting
Operating segments are components of an entity that engage in business activities with discrete financial information available that is regularly reviewed by the chief operating decision maker (“CODM”) in order to assess performance and allocate resources. The Company’s CODM is the Company’s President and Chief Executive Officer. As discussed further in Note 11, Segment Information, the Company determined its operating and reportable segments to be Bus and Parts. The Bus segment includes the manufacturing and assembly of school buses to be sold to a variety of customers across the United States, Canada and in international markets. The Parts segment consists primarily of the purchase of parts from third parties to be sold to dealers within the Company’s network.
Recently Adopted Accounting Standards
ASU 2015-11 — In the first quarter of fiscal 2018, the Company adopted Accounting Standards Update ("ASU") No. 2015-11, Simplifying the Measurement of Inventory, which requires inventory to be measured at the lower of cost or net realizable value. The adoption of this pronouncement did not have any impact on any component of our financial statements.
Recently Issued Accounting Standards
ASU 2018-15 — In August 2018, the Financial Accounting Standards Board ("FASB") issued ASU No. 2018-15, Intangibles—Goodwill and Other—Internal-Use Software (Subtopic 350-40): Customer’s Accounting for Implementation Costs Incurred in a Cloud Computing Arrangement That Is a Service Contract, which aligns the requirements for capitalizing implementation costs incurred in a hosting arrangement that is a service contract with the requirements for capitalizing implementation costs incurred to develop or obtain internal-use software. The new guidance will be effective for annual reporting periods beginning after December 15, 2019, including interim periods. Early adoption is permitted for annual or interim periods. We plan to early adopt this standard in the first quarter of fiscal 2019 and do not anticipate a significant impact on the consolidated financial statements.
ASU 2018-14 — In August, 2018, the FASB issued ASU No. 2018-14, Compensation—Retirement Benefits—Defined Benefit Plans—General (Subtopic 715-20): Disclosure Framework—Changes to the Disclosure Requirements for Defined Benefit Plans, which modifies the disclosure requirements for employers that sponsor defined benefit pension or other post-retirement benefit plans. The guidance removes disclosures that are no longer considered cost beneficial, and adds new and clarifies other disclosure requirements. The guidance will be effective for annual and interim periods beginning after December 15, 2020, which is effective for the Company in the first quarter of fiscal 2022. Early adoption is permitted and adoption is required on a retrospective basis. We are currently evaluating the impact the standard will have on our disclosures.
ASU 2018-13 — In August, 2018, the FASB issued ASU No. 2018-13, Fair Value Measurement (Topic 820): Disclosure Framework—Changes to the Disclosure Requirements for Fair Value Measurement, which eliminates disclosures such as the amount of and reasons for transfers between Level 1 and Level 2 of the fair value hierarchy and adds new disclosure requirements for Level 3 measurements. The ASU is effective for fiscal years beginning after December 15, 2019, which is effective for the Company in the first quarter of fiscal 2020. Early adoption is permitted. The impact of this guidance will dependent on any future hierarchy changes or any future addition of Level 3 assets or liabilities.
ASU 2018-07 — In June 2018, the FASB issued ASU No. 2018-07, Compensation - Stock Compensation (Topic 718): Improvements to Non-employee Share-Based Payment Accounting, which provides guidance on accounting for non-employee share-based awards for goods or services received by a company. We have not granted any share-based awards to non-employees. The impact of this guidance will be dependent on future grants, if any, of these forms of share-based awards.
ASU 2018-05 — In March 2018, the FASB issued ASU No. 2018-05, Income Taxes (Topic 740): Amendments to SEC Paragraphs Pursuant to SEC Staff Accounting Bulletin No. 118, which updates income tax accounting to reflect the SEC's interpretive guidance released on December 22, 2017, when the Tax Cuts and Jobs Act (the "Tax Act") was signed into law. For more information regarding the impact of the Tax Act, see Note 9. Income Taxes.
55
ASU 2018-02 — In February 2018, the FASB issued ASU No. 2018-02, Income Statement - Reporting Comprehensive Income (Topic 220). This ASU provides guidance on a reclassification from accumulated other comprehensive income ("AOCI") to retained earnings for the effect of the tax rate change resulting from the Tax Cuts and Jobs Act (H.R.1) (the "Tax Act"). The amendments eliminate the stranded tax effects resulting from the Tax Act and will improve the usefulness of information reported to financial statement users. This ASU is effective for fiscal years, and interim periods within those fiscal years, beginning after December 15, 2018, with early adoption permitted. Should we elect to apply this optional ASU, it will be effective for us in the first quarter of fiscal 2020. We are currently evaluating the impact this ASU may have on our consolidated financial statements.
ASU 2017-12 — In August 2017, the FASB issued ASU No. 2017-12, Derivatives and Hedging (Topic 815): Targeted Improvements to Accounting for Hedging Activities, which intends to simplify the application of hedge accounting guidance and better align an entity's risk management activities and financial reporting for hedging relationships through changes to both the designation and measurement guidance for qualifying hedging relationships and the presentation of hedge results. The amendments expand and refine hedge accounting for both non-financial and financial risk components and align the recognition and presentation of the effects of the hedging instrument and the hedged item in the financial statements. The Company will adopt this amended guidance during the first quarter of fiscal 2019 and apply it to applicable transactions. We do not expect the impact on the Company's consolidated financial statements to be material.
ASU 2016-15 — In August 2016, the FASB issued ASU No. 2016-15, Statement of Cash Flows (Topic 230): Classification of Certain Cash Receipts and Cash Payments, which will make eight targeted changes to how cash receipts and cash payments are presented and classified in the statement of cash flows. ASU 2016-15 is effective for fiscal years, and interim periods within those years, beginning after December 15, 2017, and early adoption is permitted. We will adopt this standard in the first quarter of fiscal 2019 and make a policy election to classify distributions received from our equity method investment using the nature of distribution approach. Adoption of the standard will not have an impact on the Company's consolidated financial statements, as this is the manner in which we've recorded previous distributions from our equity method investee.
ASU 2016-12 and 2016-10 — In May 2016, the FASB issued ASU No. 2016-12, Revenue from Contracts with Customers (Topic 606): Narrow-Scope Improvements and Practical Expedients, and in April 2016 issued ASU No. 2016-10, Revenue from Contracts with Customers (Topic 606): Identifying Performance Obligations and Licensing, both of which provide further clarification to be considered when implementing ASU 2014-09, Revenue from Contracts with Customers (Topic 606). The ASUs are effective concurrently with ASU 2014-09, which is effective for the Company in fiscal 2019. We will adopt this standard on September 30, 2018 using the modified retrospective transition approach. We are finalizing our evaluation of the impact this guidance will have on our financial statements, but currently estimate we will adjust retained earnings and increase accrued liabilities by approximately $0.9 million to account for specific sales incentives offered to our customers.
ASU 2016-02 — In February 2016, the FASB issued ASU No. 2016-02, Leases (Topic 842), which requires lessees to recognize assets on the balance sheet for the rights and obligations created by all leases with terms greater than 12 months. The standard will also require certain qualitative and quantitative disclosures designed to give financial statement users information on the amount, timing, and uncertainty of cash flows arising from leases. ASU 2016-02 is effective for fiscal years, and interim periods within those years, beginning after December 15, 2018, and early adoption is permitted. This standard will not be effective for us until fiscal 2020. We anticipate early adoption of this standard in the first quarter of fiscal 2019 using the modified retrospective adoption approach with a cumulative-effect adjustment recognized to the opening balance on the adoption date with prior periods not recast, and electing the practical expedients allowed under the standard. We are still analyzing the impact the standard will have on our consolidated financial statements, but expect an increase in total assets and total liabilities of approximately $9.3 million. The impact on our results of operations and cash flows is not expected to be material.
56
3. Supplemental Financial Information
Accounts Receivable
Accounts receivable, net, consisted of the following at the dates indicated:
(in thousands of dollars) | September 29, 2018 | September 30, 2017 | |||||
Accounts receivable | $ | 24,167 | $ | 10,248 | |||
Allowance for doubtful accounts | (100 | ) | (100 | ) | |||
Accounts receivable, net | $ | 24,067 | $ | 10,148 | |||
Product Warranties
The following table reflects activity in accrued warranty cost (current and long-term portion combined) for the fiscal years presented:
(in thousands of dollars) | 2018 | 2017 | 2016 | ||||||||
Balance at beginning of period | $ | 20,910 | $ | 19,444 | $ | 17,661 | |||||
Add: current period accruals | 11,454 | 11,075 | 10,452 | ||||||||
Less: current period reductions of accrual | (9,718 | ) | (9,609 | ) | (8,669 | ) | |||||
Balance at end of period | $ | 22,646 | $ | 20,910 | $ | 19,444 | |||||
Extended Warranties
The following table reflects activity in deferred warranty income (current and long-term portions combined), for the sale of extended warranties of two to five years, for the fiscal years presented:
(in thousands of dollars) | 2018 | 2017 | 2016 | ||||||||
Balance at beginning of period | $ | 19,295 | $ | 16,187 | $ | 14,145 | |||||
Add: current period deferred income | 10,854 | 9,146 | 7,186 | ||||||||
Less: current period recognition of income | (6,958 | ) | (6,038 | ) | (5,144 | ) | |||||
Balance at end of period | $ | 23,191 | $ | 19,295 | $ | 16,187 | |||||
Self-Insurance
The following table reflects the total accrued self-insurance liability, comprised of workers' compensation and health insurance related claims, at the dates indicated:
(in thousands of dollars) | September 29, 2018 | September 30, 2017 | |||||
Current portion | $ | 3,332 | $ | 3,194 | |||
Long-term portion | 1,901 | 2,251 | |||||
Total accrued self-insurance | $ | 5,233 | $ | 5,445 | |||
The current and long-term portions of the accrued self-insurance liability are included in accrued expenses and other liabilities, respectively, on the accompanying Consolidated Balance Sheets.
Shipping and Handling
Shipping and handling revenues represent costs billed to customers and are presented as part of net sales on the accompanying Consolidated Statements of Operations. Shipping and handling costs incurred are included in cost of goods sold. Shipping and handling revenues recognized were $20.7 million, $19.1 million and $17.6 million for the fiscal years ended 2018, 2017 and 2016, respectively. The related cost of goods sold were $17.8 million, $17.0 million and $15.4 million for the fiscal years ended 2018, 2017 and 2016, respectively.
57
4. Inventories
The following table presents components of inventories at the dates indicated:
(in thousands of dollars) | September 29, 2018 | September 30, 2017 | |||||
Raw materials | $ | 42,439 | $ | 54,379 | |||
Work in process | 13,141 | 14,660 | |||||
Finished goods | 1,753 | 7,116 | |||||
Total inventories | $ | 57,333 | $ | 76,155 | |||
5. Property, Plant and Equipment
Property, plant and equipment consisted of the following at the dates indicated:
(in thousands of dollars) | September 29, 2018 | September 30, 2017 | |||||
Land | $ | 2,159 | $ | 1,187 | |||
Buildings | 22,514 | 18,420 | |||||
Machinery and equipment | 68,782 | 63,988 | |||||
Office furniture, equipment and other | 2,059 | 1,389 | |||||
Computer equipment and software | 17,250 | 16,765 | |||||
Construction in process | 27,983 | 2,544 | |||||
Property, plant and equipment, gross | 140,747 | 104,293 | |||||
Accumulated depreciation and amortization | (74,693 | ) | (69,585 | ) | |||
Property, plant and equipment, net | $ | 66,054 | $ | 34,708 | |||
Depreciation and amortization expense for property, plant and equipment was $7.0 million, $6.2 million, and $6.1 million for the fiscal years ended 2018, 2017, and 2016, respectively.
6. Goodwill
The carrying amounts of goodwill by reporting unit are as follows at the dates indicated:
(in thousands of dollars) | Gross Goodwill | Accumulated Impairments | Net Goodwill | ||||||||
September 29, 2018 | |||||||||||
Bus | $ | 15,139 | $ | — | $ | 15,139 | |||||
Parts | 3,686 | — | 3,686 | ||||||||
Total | $ | 18,825 | $ | — | $ | 18,825 | |||||
September 30, 2017 | |||||||||||
Bus | $ | 15,139 | $ | — | $ | 15,139 | |||||
Parts | 3,686 | — | 3,686 | ||||||||
Total | $ | 18,825 | $ | — | $ | 18,825 | |||||
In the fourth quarters of the fiscal years ended 2018 and 2017, we performed our annual impairment assessment of goodwill which did not indicate that an impairment existed; therefore, no impairments of goodwill have been recorded.
58
7. Intangible Assets
The gross carrying amounts and accumulated amortization of intangible assets are as follows at the dates indicated:
September 29, 2018 | September 30, 2017 | ||||||||||||||||||||||
(in thousands of dollars) | Gross Carrying Amount | Accumulated Amortization | Total | Gross Carrying Amount | Accumulated Amortization | Total | |||||||||||||||||
Finite lived: Engineering designs | $ | 982 | $ | 280 | $ | 702 | $ | 982 | $ | 141 | $ | 841 | |||||||||||
Finite lived: Customer relationships | 37,425 | 22,471 | 14,954 | 37,425 | 20,601 | 16,824 | |||||||||||||||||
Total amortized intangible assets | 38,407 | 22,751 | 15,656 | 38,407 | 20,742 | 17,665 | |||||||||||||||||
Indefinite lived: Trade name | 39,816 | — | 39,816 | 39,816 | — | 39,816 | |||||||||||||||||
Total intangible assets | $ | 78,223 | $ | 22,751 | $ | 55,472 | $ | 78,223 | $ | 20,742 | $ | 57,481 | |||||||||||
Management considers the "Blue Bird" trade name to have an indefinite useful life and, accordingly, it is not subject to amortization. Management reached this conclusion principally due to the longevity of the Blue Bird name and because management considers renewal upon reaching the legal limit of the trademarks related to the trade name as perfunctory. The Company expects to maintain usage of the trade name on existing products and introduce new products in the future that will also display the trade name. During the fourth quarters of the fiscal years ended 2018 and 2017, we performed our annual impairment assessment of our trade name, which did not indicate that an impairment existed; therefore, no impairments of our indefinite lived intangibles have been recorded.
Customer relationships are amortized on a straight-line basis over an estimated life of 20 years. Engineering designs are amortized on a straight-line basis over an estimated life of 7 years. Total amortization expense for intangible assets was $2.0 million, $2.0 million, and $1.9 million for the fiscal years ended 2018, 2017, and 2016, respectively.
Amortization expense for finite lived intangible assets for the next five years is expected to be as follows:
Fiscal Years Ending | Amortization Expense | |||
2019 | $ | 2,009 | ||
2020 | 2,009 | |||
2021 | 2,009 | |||
2022 | 2,009 | |||
2023 | 2,009 | |||
Thereafter | 5,611 | |||
Total amortization expense | $ | 15,656 | ||
8. Debt
Original Credit Agreement
On December 12, 2016, Blue Bird Body Company, a wholly-owned subsidiary of the Company, executed a $235.0 million five-year credit agreement with Bank of Montreal, which acts as the administrative agent and an issuing bank, Fifth Third Bank, as co-syndication agent and an issuing bank, and Regions Bank, as Co-Syndication Agent, together with other lenders (the "Credit Agreement").
The credit facility provided for under the Credit Agreement consisted of a term loan facility in an aggregate initial principal amount of $160.0 million (the “Term Loan Facility”) and a revolving credit facility with aggregate commitments of $75.0 million. The revolving credit facility includes a $15.0 million letter of credit sub-facility and a $5.0 million swingline sub-facility (the “Revolving Credit Facility,” and together with the Term Loan Facility, each a “Credit Facility” and collectively, the “Credit Facilities”). The obligations under the Credit Agreement and the related loan documents (including without limitation, the borrowings under the Credit Facilities and obligations in respect of certain cash management and hedging obligations owing to the agents, the lenders or their affiliates), are, in each case, secured by a lien on and security interest in substantially all of the assets of the Company and its subsidiaries including the Borrower, with certain exclusions as set forth in a Collateral Agreement entered into on the Closing Date.
59
As a result of the Credit Agreement, we incurred $3.3 million of debt discount and issuance costs, which have been recorded as contra-debt and will be amortized over the life of the Credit Agreement using the effective interest method. Proceeds from the Term Loan Facility were used to fully extinguish our previous credit agreement with Societe Generale. In connection with the extinguishment, we recorded a $10.1 million loss, which was the difference in the reacquisition price of the extinguished debt and the net carrying value at extinguishment. The loss includes the write-off of unamortized deferred financing costs recorded as a reduction of the prior debt, unamortized issuance costs associated with the previous revolving credit facility recorded in other assets, as well as interest and legal fees incurred to extinguish the prior debt.
Amended Credit Agreement
On September 13, 2018, the Company entered into a first amendment of the December 12, 2016 credit agreement. The amendment provided for additional funding of $50.0 million with intended use as funds for the announced tender offer and remained unfunded at September 29, 2018. The amendment also increased the revolving credit facility to $100.0 million, a $25.0 million increase. The amendment extended the maturity date to September 13, 2023, five years from the effective date of the first amendment. The first amendment also amended the interest rate pricing matrix (as follows) as well as the principal payment schedule (as disclosed at the end of this footnote). In connection with the first amendment, we incurred $2.0 million of debt discount and issuance costs, which have been recorded as contra-debt and will be amortized over the life of the amended credit agreement using the effective interest method.
The interest rate on the Term Loan Facility is (i) from the first amendment effective date until the first quarter ended on or about September 30, 2018, LIBOR plus 2.25% and (ii) commencing with the fiscal quarter ended on or about September 30, 2018 and thereafter, dependent on the Total Net Leverage Ratio of the Company, an election of either base rate or LIBOR pursuant to the table below:
Level | Total Net Leverage Ratio | ABR Loans | Eurodollar Loans | |||
I | Less than 2.00x | 0.75% | 1.75% | |||
II | Greater than or equal to 2.00x and less than 2.50x | 1.00% | 2.00% | |||
III | Greater than or equal to 2.50x and less than 3.00x | 1.25% | 2.25% | |||
IV | Greater than or equal to 3.00x and less than 3.25x | 1.50% | 2.50% | |||
V | Greater than or equal to 3.25x and less than 3.50x | 1.75% | 2.75% | |||
VI | Greater than 3.50x | 2.00% | 3.00% | |||
Additional Disclosures
Debt consisted of the following at the dates indicated:
(in thousands of dollars) | September 29, 2018 | September 30, 2017 | |||||
2023 and 2021 term loans, net of deferred financing costs of $4,011 and $2,776, respectively | $ | 142,139 | $ | 151,224 | |||
Less: Current portion of long-term debt | 9,900 | 8,000 | |||||
Long-term debt, net of current portion | $ | 132,239 | $ | 143,224 | |||
Term loans are recognized on the Consolidated Balance Sheets at the unpaid principal balance, and are not subject to fair value measurement. Given the variable rates on the loans, the Company estimates that the unpaid principal balance approximates fair value. If measured at fair value in the financial statements, the term loans would be classified as Level 2 in the fair value hierarchy. At September 29, 2018 and September 30, 2017, $146.2 million and $154.0 million, respectively, were outstanding on the term loans.
At September 29, 2018 and September 30, 2017, the stated interest rates on the term loans were 4.5% and 2.8%, respectively. At September 29, 2018 and September 30, 2017, the weighted-average annual effective interest rates for the term loans were 4.1% and 4.5%, respectively, which included amortization of the deferred financing costs.
No borrowings were outstanding on the Revolving Credit Facility at September 29, 2018; however, since there were $6.9 million of Letters of Credit outstanding on September 29, 2018, the Company would have been able to borrow $93.1 million on the revolving line of credit.
Interest expense on all indebtedness for the fiscal years ended 2018, 2017 and 2016 was $6.7 million, $7.3 million and $16.4 million, respectively.
60
The schedules of remaining principal maturities for the term loan for the next five fiscal years are as follows:
(in thousands of dollars) | ||||
Year | Principal Payments | |||
2019 | $ | 9,900 | ||
2020 | 9,900 | |||
2021 | 9,900 | |||
2022 | 14,850 | |||
2023 | 101,600 | |||
Total remaining principal payments | $ | 146,150 | ||
9. Income Taxes
The components of income tax expense were as follows for the fiscal years presented:
(in thousands of dollars) | 2018 | 2017 | 2016 | ||||||||
Current tax provision: | |||||||||||
Federal | $ | (8,925 | ) | $ | 11,705 | $ | (3,377 | ) | |||
State | 559 | 1,353 | 224 | ||||||||
Foreign | 91 | — | — | ||||||||
Total current tax (benefit) provision | $ | (8,275 | ) | $ | 13,058 | $ | (3,153 | ) | |||
Deferred tax provision: | |||||||||||
Federal | $ | 6,816 | $ | (767 | ) | $ | 9,052 | ||||
State | (1,161 | ) | (435 | ) | (95 | ) | |||||
Total deferred tax provision (benefit) | 5,655 | (1,202 | ) | 8,957 | |||||||
Income tax (benefit) expense | $ | (2,620 | ) | $ | 11,856 | $ | 5,804 | ||||
During the fiscal year ended 2016, the Company had a Change in Control of its majority stockholder and does not expect any Section 382 limitations to impair the Company's ability to realize all tax attributes.
At September 29, 2018, the Company had no federal tax credit carryforwards.
The effective tax rates for the fiscal years ended 2018, 2017 and 2016 were (9.7)%, 31.7% and 59.1%, respectively.
On December 22, 2017, the U.S. enacted the Tax Cuts and Jobs Act (“Tax Act”), which significantly changed U.S. tax law. The Tax Act lowered the Company’s U.S. statutory federal income tax rate from 35% to 21% effective January 1, 2018, while also imposing a deemed repatriation tax on previously deferred foreign income. By operation of law, the Company applied a transitional or blended U.S. statutory federal income tax rate of 24.5% for 2018.
The impact of the Tax Act increased our provision for income taxes by $2.1 million in 2018. This increase was composed of $2.0 million related to the re-measurement of net deferred tax assets and liabilities and $0.1 million associated with the deemed repatriation tax. Although additional guidance is expected from the IRS for the new law, we do not expect any changes would have a material impact on our results and thus have finalized our estimates under SAB 118.
The effective tax rate for the fiscal year ended 2018 significantly differed from the statutory federal income tax rate of 24.5%, mainly due to one-time events like the decrease in our uncertain tax positions and a re-measurement of our deferred tax assets and liabilities as a result of the Tax Act. The rate was also favorably impacted by normal tax rate benefit items, such as the domestic production activities deduction, federal and state tax credits, and share based award related deductions in excess of recorded book expense.
The effective tax rate for the fiscal year ended 2017 differed from the statutory federal income tax rate of 35%, reflecting the benefits of income tax credits, the domestic production activities deduction, and recording a tax windfall from share-based compensation awards exercised, which were offset by the application of tax credits claimed as offsets against our payroll tax liabilities, and interest and penalties on uncertain tax positions.
61
The effective tax rate for the fiscal year ended 2016 differed from the statutory federal income tax rate of 35%, primarily as a result of discrete items increasing tax expense in the period, including a change in investor tax on our non-consolidated affiliate income, the application of tax credits claimed as offsets against our payroll tax liabilities, interest and penalties on uncertain tax positions, limitations of the deductibility of certain share-based compensation, a net tax shortfall associated with the vesting of share-based compensation awards pursuant to adoption of ASU 2016-09, which were partially offset by recording the impact of new tax legislation.
A reconciliation between the reported income tax expense for continuing operations and the amount computed by applying the statutory federal income tax rate as follows:
(in thousands of dollars) | 2018 | 2017 | 2016 | ||||||||
Federal taxes at statutory rate | $ | 6,584 | $ | 13,073 | $ | 3,439 | |||||
Increase (reduction) in income taxes resulting from: | |||||||||||
State taxes, net | (1,501 | ) | 307 | (20 | ) | ||||||
Change in uncertain tax positions | (7,606 | ) | 651 | 821 | |||||||
Share-based compensation | (735 | ) | (210 | ) | 1,001 | ||||||
Permanent items | (366 | ) | (701 | ) | (84 | ) | |||||
Valuation allowance | 783 | 90 | 27 | ||||||||
Tax credits | (470 | ) | (530 | ) | (470 | ) | |||||
Return to accrual true-ups | (1,699 | ) | (646 | ) | (78 | ) | |||||
Investor tax on non-consolidated affiliate income | (1,734 | ) | (271 | ) | 582 | ||||||
Tax rate adjustments | 3,756 | 144 | 535 | ||||||||
Other | 368 | (51 | ) | 51 | |||||||
Income tax expense | $ | (2,620 | ) | $ | 11,856 | $ | 5,804 | ||||
The Company’s liability arising from uncertain tax positions was recorded in other non-current liabilities on the Consolidated Balance Sheets. A reconciliation of the beginning and ending amount of unrecognized tax benefits is as follows:
(in thousands of dollars) | 2018 | 2017 | 2016 | ||||||||
Balance, beginning of year | $ | 6,389 | $ | 6,389 | $ | 6,389 | |||||
Lapses of applicable statute of limitations | (6,389 | ) | — | — | |||||||
Balance, end of year | $ | — | $ | 6,389 | $ | 6,389 | |||||
The Company recognizes accrued interest and penalties related to unrecognized tax benefits as income tax expense. The accrued interest and penalties were $0.0 million and $2.9 million at September 29, 2018 and September 30, 2017, respectively.
The Company is subject to taxation mostly in the United States and various state jurisdictions. At September 29, 2018, tax years prior to 2015 are generally no longer subject to examination by federal and most state tax authorities.
62
The following table sets forth the sources of and differences between the financial accounting and tax bases of the Company’s assets and liabilities which give rise to the net deferred tax assets at the dates indicated:
(in thousands of dollars) | September 29, 2018 | September 30, 2017 | |||||
Deferred tax liabilities | |||||||
Property, plant and equipment | $ | (4,012 | ) | $ | (2,282 | ) | |
Other intangible assets | (11,584 | ) | (18,030 | ) | |||
Investor tax on non-consolidated affiliate income | (496 | ) | (2,230 | ) | |||
Other assets | (534 | ) | (527 | ) | |||
Total deferred tax liabilities | $ | (16,626 | ) | $ | (23,069 | ) | |
Deferred tax assets | |||||||
NOL carryforward | $ | 577 | $ | 550 | |||
Accrued expenses | 6,280 | 9,575 | |||||
Indirect effect of uncertain tax position | — | 2,869 | |||||
Compensation | 6,540 | 14,095 | |||||
Inventories | 1,194 | 1,576 | |||||
Unearned income | 3,069 | 4,000 | |||||
Tax credits | 4,638 | 2,809 | |||||
Total deferred tax assets | $ | 22,298 | $ | 35,474 | |||
Less: valuation allowance | (1,432 | ) | (650 | ) | |||
Deferred tax assets less valuation allowance | $ | 20,866 | $ | 34,824 | |||
Net deferred tax assets | $ | 4,240 | $ | 11,755 | |||
10. Guarantees, Commitments and Contingencies
Litigation
At September 29, 2018, the Company had a number of product liability and other cases pending. Management believes that, considering the Company’s insurance coverage and its intention to vigorously defend its positions, the ultimate resolution of these matters will not have a material adverse impact on the Company’s financial statements.
Environmental
The Company is subject to a variety of environmental regulations relating to the use, storage, discharge and disposal of hazardous materials used in its manufacturing processes. Failure by the Company to comply with present and future regulations could subject it to future liabilities. In addition, such regulations could require the Company to acquire costly equipment or to incur other significant expenses to comply with environmental regulations. The Company is currently not involved in any material environmental proceedings and therefore management believes that the resolution of environmental matters will not have a material adverse effect on the Company’s financial statements.
Our environmental liability using a discount rate of 11.5%, included in current accrued expenses and other long-term liabilities on the Consolidated Balance Sheets, was $0.4 million and $0.5 million at September 29, 2018 and September 30, 2017, respectively. The estimated aggregate undiscounted amount that will be incurred over the next 9 years is $0.9 million. The estimated payments for each of the next five years are $0.1 million per year and the aggregate amount thereafter is $0.4 million. Future expenditures may exceed the amounts accrued and estimated.
Lease Commitments
The Company leases certain buildings, machinery and equipment under operating leases expiring at various dates through 2027. Total rent expense was $2.0 million, $1.3 million and $1.2 million for the fiscal years ended 2018, 2017 and 2016, respectively.
63
Operating Leases
The following table sets forth future minimum lease payments under non-cancelable operating leases with original terms exceeding one year at September 29, 2018:
(in thousands of dollars) | |||
Years Ended | Amount | ||
2019 | $ | 1,305 | |
2020 | 1,428 | ||
2021 | 1,409 | ||
2022 | 1,424 | ||
2023 | 1,442 | ||
Thereafter | 4,624 | ||
Total operating lease commitments | $ | 11,632 | |
Capital Leases
The Company leases from third party vendors various office and plant equipment which qualify for capital lease treatment under the provisions of ASC 840. On the Consolidated Balance Sheets, amounts due under capital lease obligations are included in other liabilities, current and long-term, with the related assets recorded in property, plant and equipment, net. Depreciation of assets recorded under capital lease obligations is included in cost of goods sold or selling, general and administrative expenses, depending upon use of leased property, on the Consolidated Statements of Operations. These leases have remaining lease terms ranging from 1.0 to 4.3 years.
Leased property under capital leases at the dates indicated is presented in the following table:
(in thousands of dollars) | September 29, 2018 | September 30, 2017 | |||||
Leased property under capital leases | $ | 1,071 | $ | 1,071 | |||
Accumulated amortization | (870 | ) | (715 | ) | |||
Leased property under capital leases, net | $ | 201 | $ | 356 | |||
The following table summarizes the Company’s future minimum lease payments under capital leases at September 29, 2018:
(in thousands of dollars) | ||||
Years Ended | Amount | |||
2019 | $ | 175 | ||
2020 | 18 | |||
2021 | 18 | |||
2022 | 18 | |||
2023 | 6 | |||
Thereafter | — | |||
Total minimum lease payments | 235 | |||
Amount of lease payments representing interest | (15 | ) | ||
Present value of future minimum capital lease payments | $ | 220 | ||
Current obligations under capital leases | $ | 169 | ||
Long-term obligations under capital leases | 51 | |||
64
Purchase Commitments
In the ordinary course of business, the Company enters into short-term contractual purchase orders for inventory and other assets. The amount of these commitments for the next five fiscal years is expected to be as follows:
(in thousands of dollars) | ||||
Years Ended | Amount | |||
2019 | $ | 84,850 | ||
2020 | 3,956 | |||
Total purchase commitments | $ | 88,806 | ||
11. Segment Information
We manage our business in two operating segments, which are also our reportable segments. The Bus segment includes the manufacturing and assembly of buses to be sold to a variety of customers across the United States, Canada and in international markets. The Parts segment consists primarily of the purchase of parts from third parties to be sold to dealers within the Company’s network. Financial information is reported on the basis that it is used internally by the chief operating decision maker (the “CODM”) in evaluating segment performance and deciding how to allocate resources. The President and Chief Executive Officer of the Company has been identified as the CODM. Management evaluates the segments based primarily upon revenues and gross profit. A measure of assets is not applicable, as segment assets are not regularly reviewed by the CODM for evaluating performance or allocating resources. The tables below present segment net sales and gross profit for the fiscal years presented:
Net sales
(in thousands of dollars) | 2018 | 2017 | 2016 | ||||||||
Bus | $ | 962,769 | $ | 930,738 | $ | 876,087 | |||||
Parts | 62,207 | 59,864 | 55,923 | ||||||||
Segment net sales | $ | 1,024,976 | $ | 990,602 | $ | 932,010 | |||||
Gross profit
(in thousands of dollars) | 2018 | 2017 | 2016 | ||||||||
Bus | $ | 100,002 | $ | 106,462 | $ | 108,232 | |||||
Parts | 21,986 | 20,906 | 21,124 | ||||||||
Segment gross profit | $ | 121,988 | $ | 127,368 | $ | 129,356 | |||||
The following table is a reconciliation of segment gross profit to consolidated income before income taxes for the fiscal years presented:
(in thousands of dollars) | 2018 | 2017 | 2016 | ||||||||
Segment gross profit | $ | 121,988 | $ | 127,368 | $ | 129,356 | |||||
Adjustments: | |||||||||||
Selling, general and administrative expenses | (88,755 | ) | (72,831 | ) | (102,711 | ) | |||||
Interest expense | (6,661 | ) | (7,251 | ) | (16,412 | ) | |||||
Interest income | 70 | 140 | 133 | ||||||||
Other income (expense), net | 231 | 66 | (539 | ) | |||||||
Loss on debt extinguishment | — | (10,142 | ) | — | |||||||
Income before income taxes | $ | 26,873 | $ | 37,350 | $ | 9,827 | |||||
65
Sales are attributable to geographic areas based on customer location and were as follows for the fiscal years presented:
(in thousands of dollars) | 2018 | 2017 | 2016 | |||||||
United States | $ | 911,558 | $ | 878,631 | 838,418 | |||||
Canada | 106,762 | 104,016 | 83,669 | |||||||
Rest of world | 6,656 | 7,955 | 9,923 | |||||||
Total net sales | $ | 1,024,976 | $ | 990,602 | 932,010 | |||||
12. Stockholders’ Deficit
Convertible Preferred Stock
Dividends
Holders of the Company's 7.625% Series A Convertible Cumulative Preferred Stock, par value $0.0001 ("Preferred Stock") are entitled to receive when, as and if declared by the Board, dividends which are payable at a rate of 7.625% per annum. The dividends are payable in cash, common shares, preferred shares, or any combination thereof. The form of dividend payment is at the sole discretion of the Company. In fiscal 2018, we paid four cash dividends totaling $1.9 million. As we are in an accumulated deficit position, we reduce additional paid-in capital for the dividend payments made in shares of common stock at the same amount we record additional paid-in-capital for the issuance of the common stock, which results in no net change to our Stockholders' Deficit. The fair value of all dividends are reflected as a deductions from net income to calculate net income available to common stockholders in our Consolidated Statements of Operations.
Repurchase of Preferred Stock
On September 23, 2017, the Company entered into a Securities Purchase Agreement with one holder of preferred stock, pursuant to which the preferred stock holder agreed to sell and the Company agreed to purchase all of (i) the shares of common stock, par value $0.0001 (the “Common Stock”) of the Company, (ii) the shares of the Preferred Stock, and (iii) the warrants to acquire Common Stock, in each case, owned by the preferred stock holder (the “Transaction Securities”). The Company purchased the Transaction Securities for an aggregate purchase price of $32.1 million, reflecting a price per share of Common Stock of $18.65.
As disclosed in Note 18, Subsequent Events, all Preferred Stock was converted to Common Stock.
Warrants
At September 29, 2018, there were a total of 1,081,384 warrants outstanding to purchase 540,692 shares of our Common Stock.
Change in Control
Pursuant to, and subject to the terms of, a Purchase and Sale Agreement, dated as of May 26, 2016 (the “Purchase and Sale Agreement”), by and among The Traxis Group B.V. ("Traxis"), ASP BB Holdings LLC, a Delaware limited liability company (“ASP”), and the Company, Traxis agreed to sell and ASP agreed to purchase all of the 12,000,000 shares of Common Stock of the Company owned by Traxis (the “Transaction Shares”). Subject to the terms and conditions set forth in the Purchase and Sale Agreement, ASP acquired 7,000,000 Transaction Shares at an initial closing on June 3, 2016 for an amount in cash equal to $10.10 per share, and 5,000,000 Transaction Shares at a second closing on June 8, 2016 for an amount in cash equal to $11.00 per share, for an aggregate purchase price of $125.7 million. Rights held by Traxis under the Registration Rights Agreement were transferred to ASP in conjunction with the Purchase and Sale Agreement. The Company was not a part of the transaction and there were no proceeds to the Company, resulting in no required accounting treatment; however, the sale of Transaction Shares did trigger a phantom equity compensation payment. The payment was primarily funded by Traxis and not by the Company.
66
13. Earnings Per Share
The following table presents the basic and diluted earnings per share computation for the fiscal years presented:
(in thousands except share data) | 2018 | 2017 | 2016 | ||||||||
Numerator: | |||||||||||
Net income | $ | 30,820 | $ | 28,801 | $ | 6,900 | |||||
Less: preferred stock dividends | 1,896 | 4,261 | 3,878 | ||||||||
Less: preferred stock repurchase | — | 6,091 | — | ||||||||
Net income available to common stockholders | $ | 28,924 | $ | 18,449 | $ | 3,022 | |||||
Basic earnings per share (1): | |||||||||||
Weighted average common shares outstanding | 25,259,595 | 23,343,772 | 21,252,616 | ||||||||
Basic earnings per share | $ | 1.15 | $ | 0.79 | $ | 0.14 | |||||
Diluted earnings per share (2): | |||||||||||
Weighted average common shares outstanding | 25,259,595 | 23,343,772 | 21,252,616 | ||||||||
Weighted average dilutive securities, convertible preferred stock | 2,294,205 | — | — | ||||||||
Weighted average dilutive securities, restricted stock | 50,891 | 19,073 | 60,401 | ||||||||
Weighted average dilutive securities, warrants | 737,183 | 1,280,265 | — | ||||||||
Weighted average dilutive securities, stock options | 274,988 | 234,619 | 2,602 | ||||||||
Weighted average shares and dilutive potential common shares | 28,616,862 | 24,877,729 | 21,315,619 | ||||||||
Diluted earnings per share | $ | 1.08 | $ | 0.74 | $ | 0.14 | |||||
(1) Basic earnings per share is calculated by dividing income available to common stockholders by the weighted average common shares outstanding during the period.
(2) Diluted earnings per share is calculated by adjusting the weighted average shares outstanding for the dilutive effect of common stock equivalents outstanding during the period, determined by using the treasury-stock method, and adjusting for the dilutive effect of our convertible preferred stock, determined by using the if-converted method. For the fiscal year ended 2017, 4,302,212 shares of potentially dilutive convertible preferred stock were excluded from the calculation since the if-converted impact would be anti-dilutive and, as a result, the numerator used in the calculation included the impact on income of preferred stock dividends and the excess of fair value over carrying value for preferred stock repurchase. Potentially dilutive common stock equivalents totaling 12,295 and 173,009 shares were excluded from the fiscal years ended 2017 and 2016, respectively, calculations since their impact would be anti-dilutive.
14. Share-Based Compensation
In fiscal 2015, we adopted the Omnibus Equity Incentive Plan (the "Plan"). The Plan is administered by the Compensation Committee of our Board of Directors. Under the Plan, the Committee may grant awards for the issuance up to an aggregate of 3,700,000 shares of common stock in the form of non-qualified stock options, incentive stock options, stock appreciation rights (collectively, “SARs” and each individually a “SAR”), restricted stock, restricted stock units, performance shares, performance units, incentive bonus awards, other cash-based awards and other stock-based awards. The exercise price of a share subject to a stock option may not be less than 100% of the fair market value of a share of the Company's common stock with respect to the grant date of such stock option. In fiscal years prior to 2015, we had not granted any stock options or other stock-settled awards. No portion of the options shall vest and become exercisable after the date on which the Optionee’s service with the Company and its subsidiaries terminates. The vesting of all unvested shares of common stock subject to an option will automatically be accelerated in connection with a “Change in Control,” as defined in the Plan. New shares of the Company's common stock are issued upon stock option exercises, or at the time of vesting for restricted stock.
Stock-based payments to employees, including grants of stock options, restricted stock awards ("RSAs") and restricted stock units ("RSUs"), are recognized in the financial statements based on their fair value. The fair value of each stock option award on the grant date is estimated using the Black-Scholes option-pricing model with the following assumptions: expected dividend yield, expected stock price volatility, weighted-average risk-free interest rate and weighted average expected term of the options. The volatility assumption used in the Black-Scholes option-pricing model is based on peer group volatility because we do not have a sufficient trading history as a stand-alone public company. Because we do not have sufficient history with respect to stock option activity and post-vesting cancellations, the expected term assumption is based on the simplified method under GAAP, which is based on the vesting period and contractual term for each vesting tranche of awards. The mid-point between the vesting date and the expiration date is used as the expected term under this method. The risk-free interest rate used in the Black-Scholes model is based on the implied yield curve available on U.S. Treasury zero-
67
coupon issues at the date of grant with a remaining term equal to the Company’s expected term assumption. The Company has never declared or paid a cash dividend on common shares. Restricted stock units and restricted stock awards are valued based on the intrinsic value of the difference between the exercise price, if any, of the award and the fair market value of our common stock on the grant date. We expense any award with graded-vesting features using a straight-line attribution method.
All outstanding share-based compensation awards vested upon the change in control which took place on June 8, 2016. Concurrent with the change in control, certain awards not considered as granted under GAAP due to fiscal 2017 and 2018 performance criteria which had not been established, were granted for accounting purposes and immediately vested and expensed with the change in control.
Restricted Stock Awards
The following table summarizes the Company's RSA and RSU award activity for the fiscal year presented:
2018 | |||||||
Restricted Stock Activity | Number of Shares | Weighted-Average Grant Date Fair Value | |||||
Balance, beginning of year | 75,590 | $ | 15.83 | ||||
Granted | 118,450 | 18.59 | |||||
Vested | (67,890 | ) | 15.86 | ||||
Forfeited | (8,076 | ) | 15.62 | ||||
Balance, end of year | 118,074 | 18.59 | |||||
The weighted-average grant date fair value of restricted stock awards granted in the fiscal years ended 2017 and 2016 was $15.82 and $10.82, respectively.
Compensation expense for restricted stock awards, recognized in selling, general and administrative expenses on the Consolidated Statements of Operations, was $1.6 million, $0.8 million, and $8.7 million for the fiscal years ended 2018, 2017, and 2016, respectively, with associated tax benefits of $0.4 million, $0.3 million, and $3.0 million, respectively. At September 29, 2018, unrecognized compensation cost related to restricted stock awards totaled $0.4 million and is expected to be recognized over a weighted-average period of four months.
Stock Option Awards
The following table summarizes the Company's stock option activity for the fiscal year presented:
2018 | |||||||
Number of Options | Weighted Average Exercise Price per Share ($) | ||||||
Outstanding options, beginning of year | 623,962 | $ | 11.15 | ||||
Granted | 215,530 | 16.61 | |||||
Exercised (1) | (322,035 | ) | 11.09 | ||||
Forfeited | (19,030 | ) | 15.50 | ||||
Outstanding options, end of year (2) | 498,427 | $ | 13.38 | ||||
Fully vested and exercisable options, end of year (3) | 286,369 | $ | 10.98 | ||||
(1) Stock options exercised during the fiscal year had an aggregate intrinsic value totaling $4.2 million.
(2) Stock options outstanding at the end of the fiscal year had an aggregate intrinsic value totaling $5.5 million.
(3) Fully vested and exercisable options at fiscal year end had an aggregate intrinsic value totaling $3.9 million with a weighted average contractual term of 6.9 years.
The total aggregate intrinsic value of stock options exercised during the fiscal years ended 2017 and 2016 were $2.3 million and $1.0 million, respectively.
68
Compensation expense for stock option awards, recognized in selling, general and administrative expenses on the Consolidated Statements of Operations, was $0.9 million, $0.4 million, and $4 million for the fiscal years ended 2018, 2017, and 2016, respectively, with associated tax benefits of $0.2 million, $0.1 million, and $1.4 million, respectively. At September 29, 2018, unrecognized compensation cost related to stock option awards totaled $0.2 million and is expected to be recognized over a weighted-average period of three months.
The fair value of each option award at grant date was estimated using the Black-Scholes option-pricing model with the following assumptions made and resulting grant-date fair values during the fiscal years presented:
2018 | 2017 | 2016 | ||||||||||
Expected volatility | 29.2 | % | 33.7 | % | 33.7 | % | ||||||
Expected dividend yield | 0 | % | 0 | % | 0 | % | ||||||
Risk-free interest rate | 2.16 | % | 1.9 | % | 1.7 | % | ||||||
Expected term (in years) | 5.0 - 5.5 | 5.5 | 4.7 | |||||||||
Weighted-average grant-date fair value | $ | 6.15 | $ | 5.35 | $ | 3.72 | ||||||
Phantom Award
A phantom stock award plan was adopted by the Company in February 2007 (as amended and restated from time to time, the “Phantom Award Plan”). Upon vesting of a phantom award, the participants (including employees, directors, officers and consultants of the Company) were eligible to receive a cash payment subject to the initial investors in the Company receiving an agreed upon return of capital. There have been three events that met the required return on capital to our investors to trigger a Phantom Award Plan payment: (a) in June 2016, in conjunction with the change in control of the Company's major stockholder, the board of directors approved for all Phantom Award Plan participants a payment of $17.1 million, which was primarily funded by a $17.0 million contribution from our former major stockholder, (b) in February 2015, in conjunction with the Business Combination, the board of directors approved for all Phantom Award Plan participants a payment of $13.8 million, which was primarily funded by a $13.6 million contribution from our former major stockholder.
With the 2016 payment and change in control, the incentive program was terminated.
15. Benefit Plans
Defined Benefit Pension Plans
The Company has a defined benefit pension plan (the “Defined Benefit Plan”) covering U.S. hourly and salaried personnel. On May 13, 2002, the Defined Benefit Plan was amended to freeze new participation as of May 15, 2002, and therefore, any new employees who started on or after May 15, 2002 were not permitted to participate in the Defined Benefit Plan. Effective January 1, 2006, the benefit plan was frozen to all participants. No accrual of future benefits will be calculated beyond this date.
The Company contributed $5.9 million and $5.4 million to the Defined Benefit Plan during the fiscal years ended September 29, 2018 and September 30, 2017, respectively. For the fiscal years ended September 29, 2018 and September 30, 2017, benefits paid were $7.1 million and $6.9 million, respectively. The projected benefit obligation (“PBO”) for the Defined Benefit Plan was $144.5 million and $144.7 million at September 29, 2018 and September 30, 2017, respectively.
The reconciliation of the beginning and ending balances of the PBO for the Defined Benefit Plan for the fiscal years indicated is presented in the following table:
Benefit Obligation | |||||||
(in thousands of dollars) | 2018 | 2017 | |||||
Projected benefit obligation balance, beginning of year | $ | 144,737 | $ | 157,030 | |||
Interest cost | 5,428 | 5,063 | |||||
Assumption changes (1) | 770 | (9,621 | ) | ||||
Actuarial gain | 686 | (798 | ) | ||||
Benefits paid | (7,137 | ) | (6,937 | ) | |||
Projected benefit obligations balance, end of year | $ | 144,484 | $ | 144,737 | |||
(1) The assumption changes referenced in the table above result from (i) changes in the utilized discount rate to value Blue Bird’s future obligations and (ii) updates to the mortality table projections used in the calculation of the benefit obligations.
69
Plan Assets: The summary and reconciliation of the beginning and ending balances of the fair value of the plan assets are as follows:
Plan Assets | |||||||
(in thousands of dollars) | 2018 | 2017 | |||||
Fair value of plan assets, beginning of year | $ | 112,311 | $ | 100,662 | |||
Actual return on plan assets | 13,457 | 14,702 | |||||
Employer contribution | 5,949 | 5,414 | |||||
Expenses | (1,109 | ) | (1,530 | ) | |||
Benefits paid | (7,137 | ) | (6,937 | ) | |||
Fair value of plan assets, end of year | $ | 123,471 | $ | 112,311 | |||
Funded Status: The following table reconciles the benefit obligations, plan assets, funded status and net liability information of the Defined Benefit Plan at the dates indicated. The net pension liability is reflected in long-term liabilities on the Consolidated Balance Sheets.
Funded Status | ||||||||
(in thousands of dollars) | September 29, 2018 | September 30, 2017 | ||||||
Benefit obligation | $ | 144,484 | $ | 144,737 | ||||
Fair value of plan assets | 123,471 | 112,311 | ||||||
Funded status | (21,013 | ) | (32,426 | ) | ||||
Net pension liability recognized | $ | (21,013 | ) | $ | (32,426 | ) | ||
Fair Value of Plan Assets: The Company determines the fair value of its financial instruments in accordance with the Fair Value Measurements and Disclosures Topic of the ASC. Fair value is the price to hypothetically sell an asset or transfer a liability in an orderly manner in the principal market for that asset or liability. This topic provides a hierarchy that gives highest priority to unadjusted quoted market prices in active markets for identical assets or liabilities. This topic requires that financial assets and liabilities are classified into one of the following three categories:
Level 1 | Unadjusted quoted prices in active markets for identical assets or liabilities | |
Level 2 | Unadjusted quoted prices in active markets for similar assets or liabilities, or unadjusted quoted prices for identical or similar assets or liabilities in markets that are not active, or inputs other than quoted prices that are observable for the asset or liability | |
Level 3 | Unobservable inputs for the asset or liability | |
The Company evaluates fair value measurement inputs on an ongoing basis in order to determine if there is a change of sufficient significance to warrant a transfer between levels. Transfers between levels of the fair value hierarchy are recognized on the actual date of the event or circumstances that caused the transfer, which generally coincides with the Company's valuation process.
The Defined Benefit Plan assets are comprised of various investment funds, which are valued based upon their quoted market prices. The invested pension plan assets of the Defined Benefit Plan are all Level 2 assets under ASC 820, Fair Value Measurements (“ASC 820”). During the fiscal years ended 2018 and 2017, there were no transfers between levels. There are no sources of significant concentration risk in the invested assets at September 29, 2018, the measurement date.
70
The following table sets forth, by level within the fair value hierarchy, a summary of the Defined Benefit Plan’s investments measured at fair value:
(in thousands of dollars) | Level 1 | Level 2 | Level 3 | Total | ||||||||||||
September 29, 2018 | ||||||||||||||||
Assets: | ||||||||||||||||
Equity securities | $ | — | $ | 86,410 | $ | — | $ | 86,410 | ||||||||
Debt securities | — | 37,061 | — | 37,061 | ||||||||||||
Total assets at fair value | $ | — | $ | 123,471 | $ | — | $ | 123,471 | ||||||||
September 30, 2017 | ||||||||||||||||
Assets: | ||||||||||||||||
Equity securities | $ | — | $ | 80,795 | $ | — | $ | 80,795 | ||||||||
Debt securities | — | 31,516 | — | 31,516 | ||||||||||||
Total assets at fair value | $ | — | $ | 112,311 | $ | — | $ | 112,311 | ||||||||
The following table represents net periodic benefit cost and changes in plan assets and benefit obligations recognized in other comprehensive income, before tax effect, for the fiscal years presented:
(in thousands of dollars) | 2018 | 2017 | 2016 | ||||||||
Interest cost | $ | 5,428 | $ | 5,063 | $ | 5,063 | |||||
Expected return on plan assets | (7,105 | ) | (6,358 | ) | (6,112 | ) | |||||
Amortization of net loss | 3,521 | 6,291 | 4,787 | ||||||||
Net periodic benefit cost | $ | 1,844 | $ | 4,996 | $ | 3,738 | |||||
Net (gain) loss | $ | (3,787 | ) | $ | (17,232 | ) | $ | 15,716 | |||
Amortization of net loss | (3,521 | ) | (6,291 | ) | (4,787 | ) | |||||
Total (gain) loss recognized in other comprehensive income | $ | (7,308 | ) | $ | (23,523 | ) | $ | 10,929 | |||
Total (gain) loss recognized in net periodic pension benefit cost and other comprehensive income | $ | (5,464 | ) | $ | (18,527 | ) | $ | 14,667 | |||
The estimated net loss for the Defined Benefit Plan that will be amortized from accumulated other comprehensive loss into net periodic benefit cost over the next fiscal year is $2.8 million. The unrecognized gain or loss is amortized as follows: the total unrecognized gain or loss, less the larger of 10% of the liability or 10% of the assets, is divided by the average future working lifetime of active plan participants.
The following actuarial assumptions were used to determine the benefit obligations at the dates indicated:
Weighted-average assumptions used to determine benefit obligations: | September 29, 2018 | September 30, 2017 | ||||
Discount rate | 4.30 | % | 3.85 | % | ||
Rate of compensation increase | N/A | N/A | ||||
Weighted-average assumptions used to determine net periodic benefit cost: | September 29, 2018 | September 30, 2017 | ||||
Discount rate | 3.85 | % | 3.30 | % | ||
Expected long-term return on plan assets | 6.37 | % | 6.37 | % | ||
Rate of compensation increase | N/A | N/A | ||||
The benchmark for the discount rates is an estimate of the single equivalent discount rate determined by matching the Defined Benefit Plan’s future expected cash flows to spot rates from a yield curve comprised of high quality corporate bond rates of various durations.
The Defined Benefit Plan asset allocations at the dates indicated, the measurement date, are as follows:
September 29, 2018 | September 30, 2017 | |||||
Equity securities | 70 | % | 72 | % | ||
Debt securities | 30 | % | 28 | % | ||
100 | % | 100 | % | |||
71
There was no Company common stock included in equity securities. Assets of the Defined Benefit Plan are invested primarily in common stock funds. Assets are valued using quoted prices in active markets.
The expected long-term rate of return on plan assets reflects the average rate of earnings expected on the funds invested, or to be invested, to provide for the benefits included in the PBO. In estimating that rate, appropriate consideration is given to the returns being earned by the plan assets in the fund and rates of return expected to be available for reinvestment and a building block method. The expected rate of return on each asset class is broken down into three components: (1) inflation, (2) the real risk-free rate of return (i.e., the long term estimate of future returns on default free U.S. government securities) and (3) the risk premium for each asset class (i.e., the expected return in excess of the risk-free rate).
The investment strategy for pension plan assets is to limit risk through asset allocation, diversification, selection and timing. Assets are managed on a total return basis, with dividends and interest reinvested in the account.
The Company expects to contribute no funds to its Defined Benefit Plan in fiscal year 2019. The following benefit payments are expected to be paid to the Company’s pension plan participants in the fiscal years indicated:
(in thousands of dollars) | Expected Payments | ||
2019 | $ | 7,738 | |
2020 | 7,833 | ||
2021 | 8,016 | ||
2022 | 8,227 | ||
2023 | 8,430 | ||
2024 - 2028 | 43,423 | ||
Total expected future benefit payments | $ | 83,667 | |
Defined Contribution Plans
The Company offers a defined contribution 401(k) plan covering substantially all U.S. employees and a defined contribution plan for Canadian employees. During the fiscal years ended 2018, 2017 and 2016, the Company offered a 50% match on the first 6% of the employee’s contributions. The plans also provide for an additional discretionary match depending on Company performance. Compensation expense related to defined contribution plans totaled $1.9 million, $1.9 million and $1.7 million for the fiscal years ended 2018, 2017 and 2016, respectively.
Health Benefits
The Company provides and is predominantly self-insured for medical, dental, and accident and sickness benefits. A liability related to this obligation is recorded on the Company’s Consolidated Balance Sheets as accrued expenses. Total expense related to this plan recorded for the fiscal years ended 2018, 2017, and 2016, was $14.3 million, $13.6 million, and $12.3 million, respectively.
Employee Compensation Plans
The Management Incentive Plan (the “MIP”) compensates certain key salaried management employees and is based on earnings before interest, taxes, depreciation and amortization (“EBITDA”) performance as well as a net debt metric. MIP bonus liabilities of $2.4 million and $3.5 million are included in accrued expenses on the Consolidated Balance Sheets at September 29, 2018 and September 30, 2017, respectively.
16. Equity Investment in Affiliate
On October 14, 2009, Blue Bird and Girardin Minibus entered into a venture, Micro Bird Holdings, Inc. (“Micro Bird”), to combine the complementary expertise of the two separate manufacturers. Blue Bird Micro Bird by Girardin Type A buses are produced in Drummondville, Quebec by Micro Bird.
72
The Company holds a 50% equity interest in Micro Bird Holdings, Inc. ("Micro Bird"), and accounts for Micro Bird under the equity method of accounting as the Company does not have control to direct the activities that most significantly impact Micro Bird’s financial performance based on the shared powers of the venture partners. The carrying amount of the equity method investment is adjusted for the Company’s proportionate share of net earnings or losses and reduced by any dividends received. At September 29, 2018 and September 30, 2017, the Company had an investment of $11.1 million and $11.6 million, respectively. During fiscal years ended 2018, 2017 and 2016, Micro Bird paid dividends to all common stockholders, and the Company received $1.8 million, $4.6 million, and $2.3 million, respectively, net of required withholding taxes. The dividends reduced the carrying value of our investment and are presented as cash inflows in the operating section of our Consolidated Statements of Cash Flows.
In recognizing the Company’s 50% portion of Micro Bird net income, the Company recorded $1.3 million, $3.3 million and $2.9 million in equity in net income of non-consolidated affiliate for the fiscal years ended 2018, 2017 and 2016, respectively.
17. Accumulated Other Comprehensive Income
The following table provides information on changes in accumulated other comprehensive income (“AOCI”) for the periods presented:
(in thousands) | Defined Benefit Pension Plan | Cash Flow Hedges (Effective Portion) | Total AOCI | ||||||||
Balance, October 3, 2015 | $ | (51,774 | ) | $ | — | $ | (51,774 | ) | |||
Other comprehensive loss, gross | (15,716 | ) | (236 | ) | (15,952 | ) | |||||
Amounts reclassified from other comprehensive income and included in earnings | 4,787 | 216 | 5,003 | ||||||||
Total other comprehensive loss, before taxes | (10,929 | ) | (20 | ) | (10,949 | ) | |||||
Income tax benefit | 3,825 | 7 | 3,832 | ||||||||
Balance, October 1, 2016 | $ | (58,878 | ) | $ | (13 | ) | $ | (58,891 | ) | ||
Other comprehensive income, gross | 17,232 | 344 | 17,576 | ||||||||
Amounts reclassified from other comprehensive income and included in earnings | 6,291 | (324 | ) | 5,967 | |||||||
Total other comprehensive income, before taxes | 23,523 | 20 | 23,543 | ||||||||
Income tax expense | (8,520 | ) | (7 | ) | (8,527 | ) | |||||
Balance, September 30, 2017 | $ | (43,875 | ) | $ | — | $ | (43,875 | ) | |||
Other comprehensive income, gross | 3,787 | — | 3,787 | ||||||||
Amounts reclassified from other comprehensive income and included in earnings | 3,521 | — | 3,521 | ||||||||
Total other comprehensive income, before taxes | 7,308 | — | 7,308 | ||||||||
Income tax expense | (1,860 | ) | — | (1,860 | ) | ||||||
Balance, September 29, 2018 | $ | (38,427 | ) | $ | — | $ | (38,427 | ) | |||
18. Subsequent Events
Credit Facility Amendment and Tender Offer
On October 15, 2018, the Company received $50.0 million in funding from the amended credit facility. Refer to Note 8, Debt, for more information on the credit facility amendment. In conjunction with the debt funding, we conducted a Tender Offer and accepted for purchase (i) 1,782,568 shares of our Common Stock, $0.0001 par value per share at a price of $28.00 per share, and (ii) 364 shares of our 7.625% Series A Convertible Cumulative Preferred Stock, par value $0.0001 per share, at a price of $241.69 per share, for an aggregate cost of approximately $50.0 million, excluding fees and expenses relating to the tender offer. These shares represented approximately 6.54% of the shares of Common Stock outstanding and 0.39% of the shares of Preferred Stock outstanding as of October 15, 2018, the date the Tender Offer commenced.
73
Preferred Stock Conversion
On November 13, 2018, the Company converted all remaining outstanding shares of Preferred Stock, and issued 799,615 shares of Common Stock. There were no dividends paid with the conversion.
74
Item 9. Changes in and Disagreements with Accountants on Accounting and Financial Disclosure
None.
Item 9A. Controls and Procedures
Evaluation of Disclosure Controls and Procedures
The Company maintains disclosure controls and procedures that are designed to ensure that information required to be disclosed in the reports the Company files or submits under the Securities Exchange Act of 1934, as amended (the "Exchange Act"), is recorded, processed, summarized and reported within the time periods specified in the SEC’s rules and forms and that such information is accumulated and communicated to the Company’s management, including its Chief Executive Officer and Chief Financial Officer, as appropriate, to allow timely decisions regarding required disclosure. In designing and evaluating the disclosure controls and procedures, management recognizes that any controls and procedures, no matter how well designed and operated, can provide only reasonable assurance of achieving the desired control objectives.
In connection with the preparation of this Annual Report on Form 10-K, the Company carried out an evaluation under the supervision of and with the participation of the Company’s management, including the Chief Executive Officer and Chief Financial Officer, as of September 29, 2018 on the effectiveness of the design and operation of the Company’s disclosure controls and procedures, as such term is defined in Rules 13a-15(e) and 15d-15(e) under the Exchange Act. Based on their evaluation, our Chief Executive Officer and Chief Financial Officer concluded that our disclosure controls and procedures were effective.
Management’s Report on Internal Control Over financial Reporting
Our management is responsible for establishing and maintaining adequate internal control over financial reporting as such term is defined in Rule 13a-15(f) under the Exchange Act. Our internal control over financial reporting is designed to provide reasonable assurance regarding the reliability of financial reporting and the preparation of financial statements for external purposes in accordance with generally accepted accounting principles. A company’s internal control over financial reporting includes those policies and procedures that (i) pertain to the maintenance of records that, in reasonable detail, accurately and fairly reflect the transactions and dispositions of the assets of the company; (ii) provide reasonable assurance that transactions are recorded as necessary to permit preparation of financial statements in accordance with generally accepted accounting principles, and that receipts and expenditures of the company are being made only in accordance with authorizations of management and directors of the company; and (iii) provide reasonable assurance regarding prevention or timely detection of unauthorized acquisition, use, or disposition of the company’s assets that could have a material effect on the financial statements.
Because of its inherent limitations, internal control over financial reporting may not prevent or detect misstatements. Also, projections of any evaluation of effectiveness to future periods are subject to the risk that controls may become inadequate because of changes in conditions, or that the degree of compliance with the policies or procedures may deteriorate.
Management assessed the effectiveness of our internal control over financial reporting as of the end of the period covered by this Report. In making this assessment, management used the criteria set forth by the Committee of Sponsoring Organizations of the Treadway Commission (“COSO”) in Internal Control – Integrated Framework (2013). Based on management's assessment and those criteria, management concluded that our internal control over financial reporting was effective as of September 29, 2018.
Changes in Internal Control over Financial Reporting
There have been no changes in our internal control over financial reporting that occurred during the fourth fiscal quarter ended September 29, 2018 that have materially affected, or are reasonably likely to materially affect, our internal control over financial reporting.
Item 9B. Other Information
None.
75
PART III
Certain information required by Part III of this Annual Report on Form 10-K is incorporated by reference from the Company’s definitive proxy statement (the “Proxy Statement”) to be filed pursuant to Regulation 14A for the Company’s Annual Meeting of Stockholders to be held in March 2019. The Company will, within 120 days of the end of its fiscal year, file the Proxy Statement with the SEC or supply the information required by this Part III by amendment to this Annual Report on Form 10-K.
Item 10. Directors, Executive Officers and Corporate Governance
The information responsive to this item is incorporated by reference from the sections entitled “Corporate Governance and Board Matters”, “Election of Directors” and “Information Concerning Management” contained in the Proxy Statement.
Item 11. Executive Compensation
The information responsive to this item is incorporated by reference from the section entitled “Director and Executive Compensation” contained in the Proxy Statement.
Item 12. Security Ownership of Certain Beneficial Owners and Management and Related Stockholder Matters
The information responsive to this item is incorporated by reference from the section entitled “Security Ownership of Certain Beneficial Owners and Management” contained in the Proxy Statement. See also the section entitled “Securities Authorized for Issuance under Equity Compensation Plans” in Item 5 of this Report.
Item 13. Certain Relationships and Related Transactions, and Director Independence
The information responsive to this item is incorporated by reference from the sections entitled “Corporate Governance and Board Matters” and “Certain Relationships and Related Transactions” contained in the Proxy Statement.
Item 14. Principal Accountant Fees and Services
The information responsive to this item is incorporated by reference from the section entitled “Certain Accounting and Audit Matters” contained in the Proxy Statement.
76
PART IV
Item 15. Exhibits and Financial Statement Schedules
(a) Index
(1) Financial Statements.
The following financial statements are located in Item 8 of this Annual Report on Form 10-K:
Consolidated Balance Sheets at September 29, 2018 and September 30, 2017
Consolidated Statements of Operations for the fiscal years ended September 29, 2018, September 30, 2017 and October 1, 2016
Consolidated Statements of Comprehensive Income (Loss) for the fiscal years ended September 29, 2018, September 30, 2017 and October 1, 2016
Consolidated Statements of Stockholders' Deficit for the fiscal years ended September 29, 2018, September 30, 2017 and October 1, 2016
Consolidated Statements of Cash Flows for the fiscal years ended September 29, 2018, September 30, 2017 and October 1, 2016
(2) Financial Statement Schedules.
All other schedules are not required under the related instructions or are not applicable.
(b) Exhibits
Exhibit No. Description
2.1† |
2.2 |
2.3 |
3.1 |
3.2 |
3.3 |
77
4.1 |
4.2 |
4.3 |
4.4 |
4.5 |
4.6 |
4.7 |
10.1 |
10.2†† |
10.3 |
10.4†† |
10.5†† |
10.6†† |
10.7†† |
10.8†† |
78
10.9†† |
10.10 |
10.11†† |
10.12†† |
10.13†† |
10.14†† |
10.15†† |
10.16 |
10.17 |
10.18 |
10.19†† |
10.20†† |
10.21 |
10.22 |
79
21.1* |
23.1* |
31.1* |
31.2* |
32.1* |
32.2* |
101* | The following materials from the Company's Annual Report on Form 10-K for the fiscal year ended September 29, 2018 formatted in XBRL (eXtensible Business Reporting Language) and furnished electronically herewith: (i) Consolidated Balance Sheets; (ii) Consolidated Statements of Operations; (iii) Consolidated Statements of Comprehensive Income (Loss); (iv) Consolidated Statements of Changes in Stockholders' Equity; (iv) Consolidated Statements of Cash Flows; and (v) Notes to the Consolidated Financial Statements. |
_________________________
*Filed herewith.
†The exhibits and schedules to this Exhibit have been omitted in accordance with Regulation S-K Item 601(b)(2). The Registrant agrees to furnish supplementally a copy of all omitted exhibits and schedules to the Securities and Exchange Commission upon its request.
††Management contract or compensatory plan or arrangement.
Item 16. Form 10-K Summary
Omitted at registrant's option.
SCHEDULE II- VALUATION AND QUALIFYING ACCOUNTS
(in thousands of dollars) | Allowance for Doubtful Accounts | |||||||||||||||
Fiscal Year Ended | Beginning Balance | Charges to Expense/(Income) | Doubtful Accounts Written Off, Net | Ending Balance | ||||||||||||
October 1, 2016 | $ | 105 | $ | (5 | ) | $ | — | $ | 100 | |||||||
September 30, 2017 | 100 | — | — | 100 | ||||||||||||
September 29, 2018 | 100 | — | — | 100 | ||||||||||||
(in thousands of dollars) | Deferred Tax Valuation Allowance | |||||||||||||||
Fiscal Year Ended | Beginning Balance | Charges to Expense/(Income) | Charges utilized/Write offs | Ending Balance | ||||||||||||
October 1, 2016 | $ | 671 | $ | (86 | ) | $ | (27 | ) | $ | 558 | ||||||
September 30, 2017 | 558 | 92 | — | 650 | ||||||||||||
September 29, 2018 | 650 | 847 | (65 | ) | 1,432 | |||||||||||
80
SIGNATURES
In accordance with the requirements of Section 13 or 15(d) of the Securities Exchange Act of 1934, the Registrant has duly caused this Report to be signed on its behalf by the undersigned, thereunto duly authorized.
Date: December 12, 2018 By: /s/ Philip Horlock
Philip Horlock
President and Chief Executive Officer
Pursuant to the requirements of the Securities Exchange Act of 1934, this Report has been signed below by the following persons on behalf of the Registrant and in the capacities and on the dates indicated.
Person | Capacity | Date | ||
/s/ Phil Horlock | President, Chief Executive Officer and Director | |||
Phil Horlock | (Principal Executive Officer) | December 12, 2018 | ||
/s/ Phil Tighe | Chief Financial Officer | |||
Phil Tighe | (Principal Financial and Accounting Officer) | December 12, 2018 | ||
/s/ Gurminder S. Bedi | ||||
Gurminder S. Bedi | Director | December 12, 2018 | ||
/s/ Chan Galbato | ||||
Chan Galbato | Director | December 12, 2018 | ||
/s/ Douglas Grimm | ||||
Douglas Grimm | Director | December 12, 2018 | ||
/s/ Daniel J. Hennessy | ||||
Daniel J. Hennessy | Director | December 12, 2018 | ||
/s/ Kevin Penn | ||||
Kevin Penn | Director | December 12, 2018 | ||
/s/ Connor Wentzell | ||||
Connor Wentzell | Director | December 12, 2018 | ||
/s/ Alan H. Schumacher | ||||
Alan H. Schumacher | Director | December 12, 2018 | ||
81