Attached files
| file | filename |
|---|---|
| 8-K - 8-K - Cactus, Inc. | f8-k.htm |
Exhibit 99.1
| Investor Presentation Cactus, Inc. (NYSE: WHD) December 2018 |

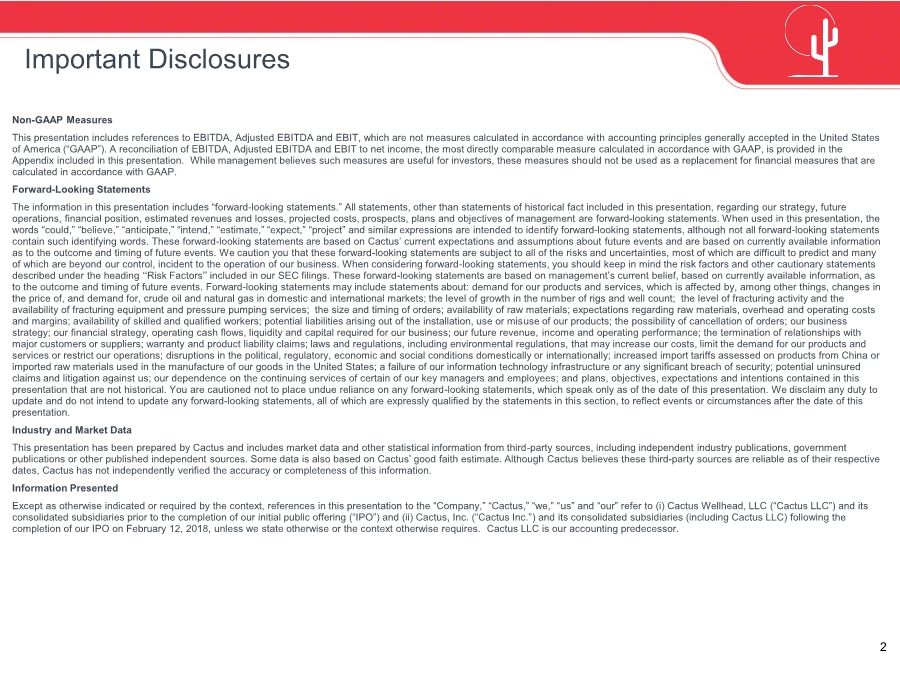
| 2 Non-GAAP Measures This presentation includes references to EBITDA, Adjusted EBITDA and EBIT, which are not measures calculated in accordance with accounting principles generally accepted in the United States of America (“GAAP”). A reconciliation of EBITDA, Adjusted EBITDA and EBIT to net income, the most directly comparable measure calculated in accordance with GAAP, is provided in the Appendix included in this presentation. While management believes such measures are useful for investors, these measures should not be used as a replacement for financial measures that are calculated in accordance with GAAP. Forward-Looking Statements The information in this presentation includes “forward-looking statements.” All statements, other than statements of historical fact included in this presentation, regarding our strategy, future operations, financial position, estimated revenues and losses, projected costs, prospects, plans and objectives of management are forward-looking statements. When used in this presentation, the words “could,” “believe,” “anticipate,” “intend,” “estimate,” “expect,” “project” and similar expressions are intended to identify forward-looking statements, although not all forward-looking statements contain such identifying words. These forward-looking statements are based on Cactus’ current expectations and assumptions about future events and are based on currently available information as to the outcome and timing of future events. We caution you that these forward-looking statements are subject to all of the risks and uncertainties, most of which are difficult to predict and many of which are beyond our control, incident to the operation of our business. When considering forward-looking statements, you should keep in mind the risk factors and other cautionary statements described under the heading ‘‘Risk Factors’’ included in our SEC filings. These forward-looking statements are based on management’s current belief, based on currently available information, as to the outcome and timing of future events. Forward-looking statements may include statements about: demand for our products and services, which is affected by, among other things, changes in the price of, and demand for, crude oil and natural gas in domestic and international markets; the level of growth in the number of rigs and well count; the level of fracturing activity and the availability of fracturing equipment and pressure pumping services; the size and timing of orders; availability of raw materials; expectations regarding raw materials, overhead and operating costs and margins; availability of skilled and qualified workers; potential liabilities arising out of the installation, use or misuse of our products; the possibility of cancellation of orders; our business strategy; our financial strategy, operating cash flows, liquidity and capital required for our business; our future revenue, income and operating performance; the termination of relationships with major customers or suppliers; warranty and product liability claims; laws and regulations, including environmental regulations, that may increase our costs, limit the demand for our products and services or restrict our operations; disruptions in the political, regulatory, economic and social conditions domestically or internationally; increased import tariffs assessed on products from China or imported raw materials used in the manufacture of our goods in the United States; a failure of our information technology infrastructure or any significant breach of security; potential uninsured claims and litigation against us; our dependence on the continuing services of certain of our key managers and employees; and plans, objectives, expectations and intentions contained in this presentation that are not historical. You are cautioned not to place undue reliance on any forward-looking statements, which speak only as of the date of this presentation. We disclaim any duty to update and do not intend to update any forward-looking statements, all of which are expressly qualified by the statements in this section, to reflect events or circumstances after the date of this presentation. Industry and Market Data This presentation has been prepared by Cactus and includes market data and other statistical information from third-party sources, including independent industry publications, government publications or other published independent sources. Some data is also based on Cactus’ good faith estimate. Although Cactus believes these third-party sources are reliable as of their respective dates, Cactus has not independently verified the accuracy or completeness of this information. Information Presented Except as otherwise indicated or required by the context, references in this presentation to the “Company,” “Cactus,” “we,” “us” and “our” refer to (i) Cactus Wellhead, LLC (“Cactus LLC”) and its consolidated subsidiaries prior to the completion of our initial public offering (“IPO”) and (ii) Cactus, Inc. (“Cactus Inc.”) and its consolidated subsidiaries (including Cactus LLC) following the completion of our IPO on February 12, 2018, unless we state otherwise or the context otherwise requires. Cactus LLC is our accounting predecessor. Important Disclosures |
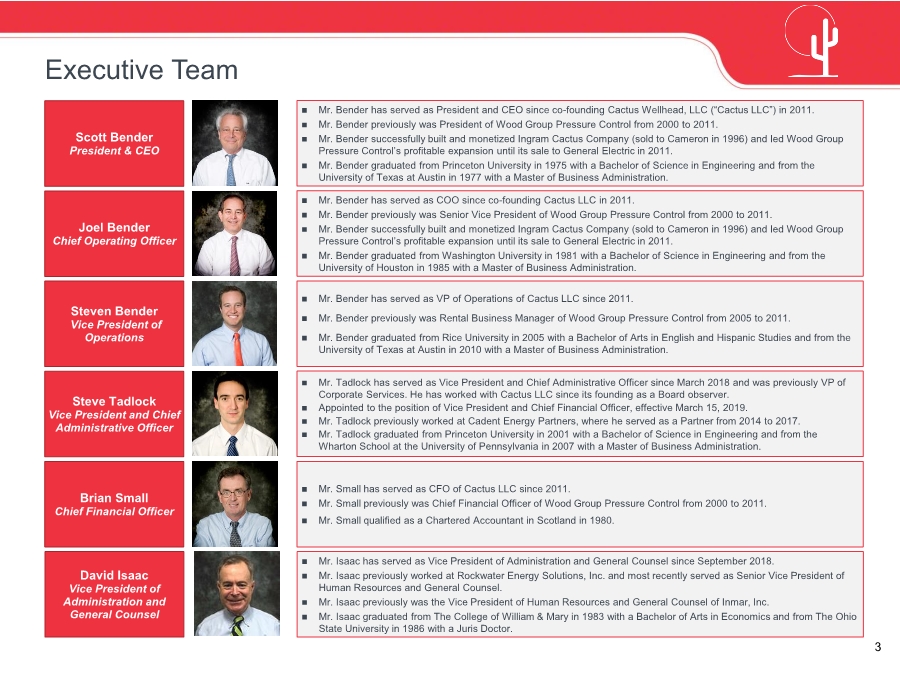
| 3 Executive Team Mr. Bender has served as President and CEO since co-founding Cactus Wellhead, LLC (“Cactus LLC”) in 2011. Mr. Bender previously was President of Wood Group Pressure Control from 2000 to 2011. Mr. Bender successfully built and monetized Ingram Cactus Company (sold to Cameron in 1996) and led Wood Group Pressure Control’s profitable expansion until its sale to General Electric in 2011. Mr. Bender graduated from Princeton University in 1975 with a Bachelor of Science in Engineering and from the University of Texas at Austin in 1977 with a Master of Business Administration. Scott Bender President & CEO Joel Bender Chief Operating Officer Mr. Bender has served as COO since co-founding Cactus LLC in 2011. Mr. Bender previously was Senior Vice President of Wood Group Pressure Control from 2000 to 2011. Mr. Bender successfully built and monetized Ingram Cactus Company (sold to Cameron in 1996) and led Wood Group Pressure Control’s profitable expansion until its sale to General Electric in 2011. Mr. Bender graduated from Washington University in 1981 with a Bachelor of Science in Engineering and from the University of Houston in 1985 with a Master of Business Administration. Brian Small Chief Financial Officer Mr. Small has served as CFO of Cactus LLC since 2011. Mr. Small previously was Chief Financial Officer of Wood Group Pressure Control from 2000 to 2011. Mr. Small qualified as a Chartered Accountant in Scotland in 1980. Steven Bender Vice President of Operations Mr. Bender has served as VP of Operations of Cactus LLC since 2011. Mr. Bender previously was Rental Business Manager of Wood Group Pressure Control from 2005 to 2011. Mr. Bender graduated from Rice University in 2005 with a Bachelor of Arts in English and Hispanic Studies and from the University of Texas at Austin in 2010 with a Master of Business Administration. Steve Tadlock Vice President and Chief Administrative Officer Mr. Tadlock has served as Vice President and Chief Administrative Officer since March 2018 and was previously VP of Corporate Services. He has worked with Cactus LLC since its founding as a Board observer. Appointed to the position of Vice President and Chief Financial Officer, effective March 15, 2019. Mr. Tadlock previously worked at Cadent Energy Partners, where he served as a Partner from 2014 to 2017. Mr. Tadlock graduated from Princeton University in 2001 with a Bachelor of Science in Engineering and from the Wharton School at the University of Pennsylvania in 2007 with a Master of Business Administration. David Isaac Vice President of Administration and General Counsel Mr. Isaac has served as Vice President of Administration and General Counsel since September 2018. Mr. Isaac previously worked at Rockwater Energy Solutions, Inc. and most recently served as Senior Vice President of Human Resources and General Counsel. Mr. Isaac previously was the Vice President of Human Resources and General Counsel of Inmar, Inc. Mr. Isaac graduated from The College of William & Mary in 1983 with a Bachelor of Arts in Economics and from The Ohio State University in 1986 with a Juris Doctor. |
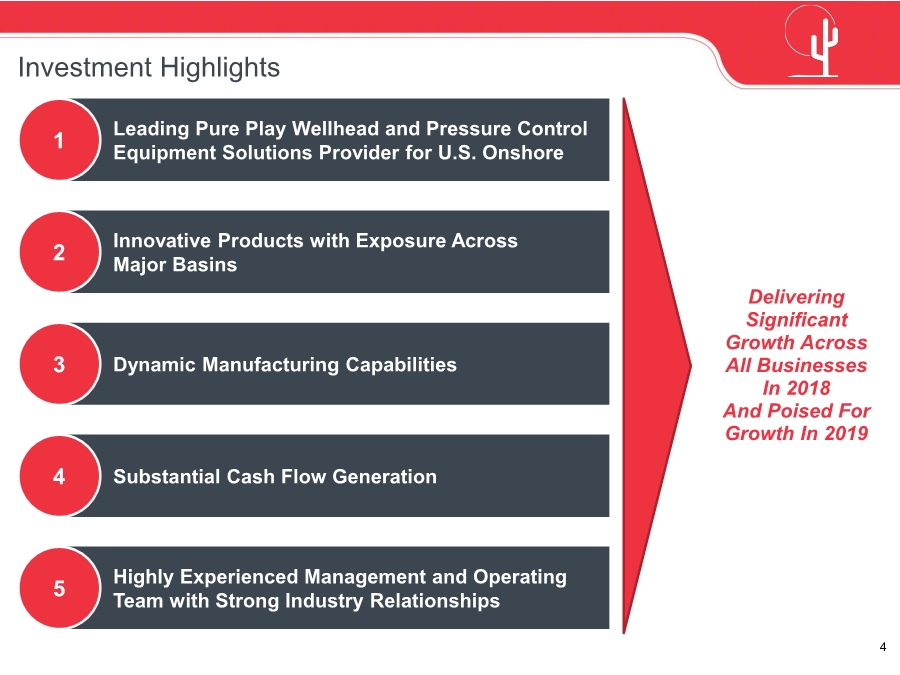
| 4 Investment Highlights Highly Experienced Management and Operating Team with Strong Industry Relationships Innovative Products with Exposure Across Major Basins Leading Pure Play Wellhead and Pressure Control Equipment Solutions Provider for U.S. Onshore Substantial Cash Flow Generation Dynamic Manufacturing Capabilities 5 4 3 2 1 Delivering Significant Growth Across All Businesses In 2018 And Poised For Growth In 2019 |
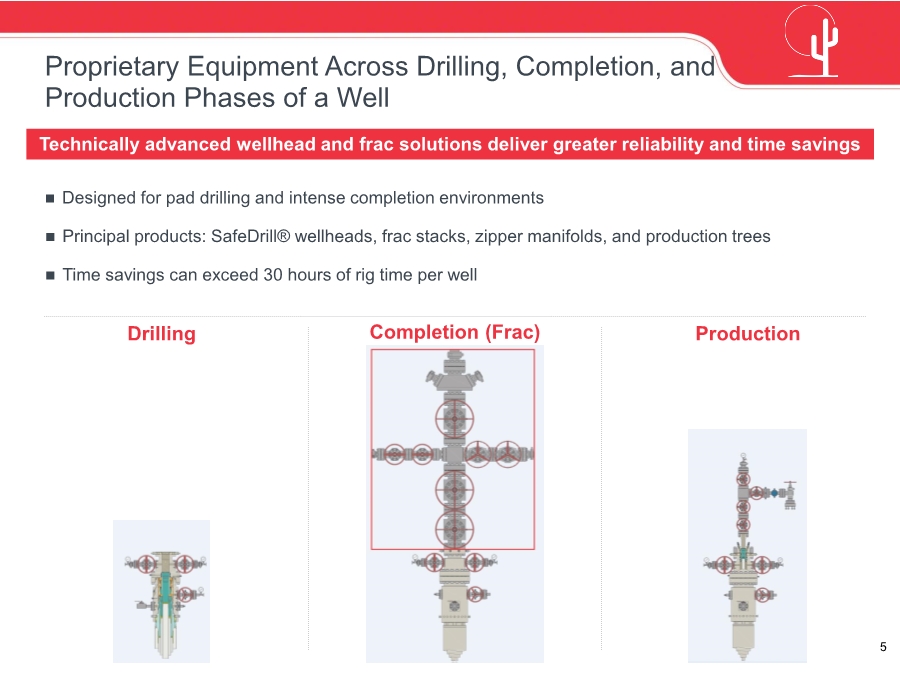
| 5 Proprietary Equipment Across Drilling, Completion, and Production Phases of a Well Designed for pad drilling and intense completion environments Principal products: SafeDrill® wellheads, frac stacks, zipper manifolds, and production trees Time savings can exceed 30 hours of rig time per well Drilling ProductionCompletion (Frac) Technically advanced wellhead and frac solutions deliver greater reliability and time savings |
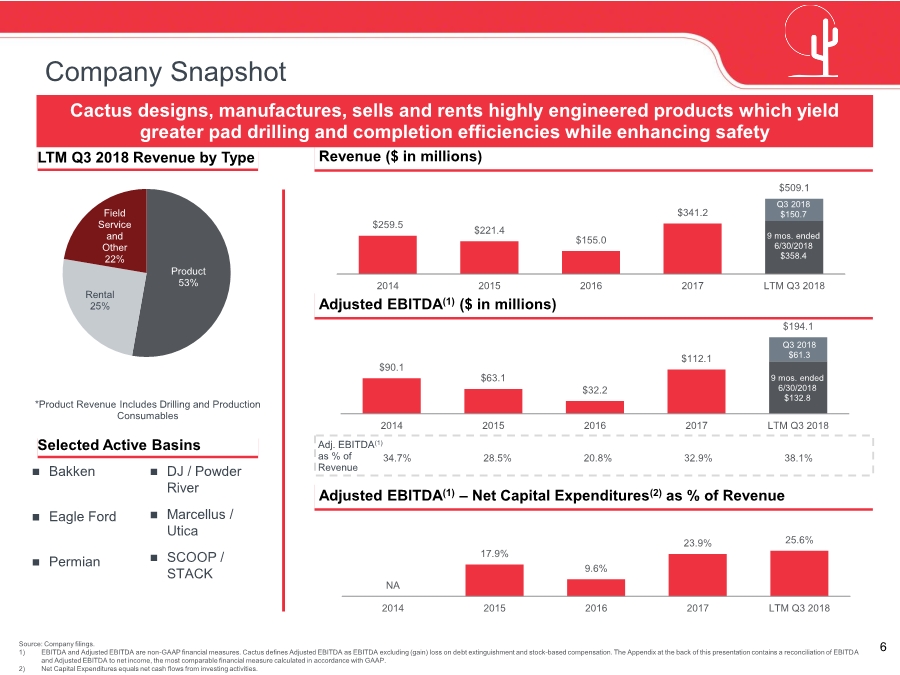
| 6 $259.5 $221.4 $155.0 $341.2 $509.1 2014 2015 2016 2017 LTM Q3 2018 NA 17.9% 9.6% 23.9% 25.6% 2014 2015 2016 2017 LTM Q3 2018 $90.1 $63.1 $32.2 $112.1 $194.1 2014 2015 2016 2017 LTM Q3 2018 LTM Q3 2018 Revenue by Type Revenue ($ in millions) Q3 2018 $61.3 Bakken Eagle Ford Permian DJ / Powder River Marcellus / Utica SCOOP / STACK Company Snapshot *Product Revenue Includes Drilling and Production Consumables Cactus designs, manufactures, sells and rents highly engineered products which yield greater pad drilling and completion efficiencies while enhancing safety Selected Active Basins Source: Company filings. 1) EBITDA and Adjusted EBITDA are non-GAAP financial measures. Cactus defines Adjusted EBITDA as EBITDA excluding (gain) loss on debt extinguishment and stock-based compensation. The Appendix at the back of this presentation contains a reconciliation of EBITDA and Adjusted EBITDA to net income, the most comparable financial measure calculated in accordance with GAAP. 2) Net Capital Expenditures equals net cash flows from investing activities. Adjusted EBITDA(1) – Net Capital Expenditures(2) as % of Revenue 33.4% Margin 37.1% MarginAdjusted EBITDA(1) ($ in millions) Adj. EBITDA(1) as % of Revenue 9 mos. ended 6/30/2018 $132.8 Q3 2018 $150.7 9 mos. ended 6/30/2018 $358.4 Product 53% Rental 25% Field Service and Other 22% 34.7% 28.5% 20.8% 32.9% 38.1% |
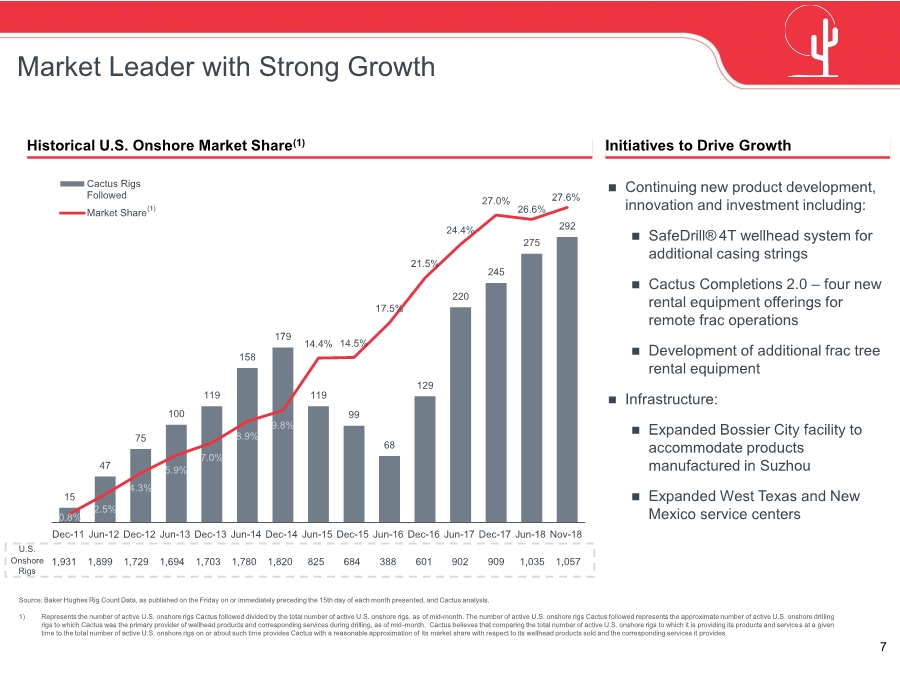
| 7 15 47 75 100 119 158 179 119 99 68 129 220 245 275 292 0.8% 2.5% 4.3% 5.9% 7.0% 8.9% 9.8% 14.4% 14.5% 17.5% 21.5% 24.4% 27.0% 26.6% 27.6% Dec-11 Jun-12 Dec-12 Jun-13 Dec-13 Jun-14 Dec-14 Jun-15 Dec-15 Jun-16 Dec-16 Jun-17 Dec-17 Jun-18 Nov-18 Cactus Rigs Followed Market Share 1,931 1,899 1,729 1,694 1,703 1,780 1,820 825 684 388 601 902 909 1,035 1,057 Market Leader with Strong Growth Historical U.S. Onshore Market Share(1) Source: Baker Hughes Rig Count Data, as published on the Friday on or immediately preceding the 15th day of each month presented, and Cactus analysis. 1) Represents the number of active U.S. onshore rigs Cactus followed divided by the total number of active U.S. onshore rigs, as of mid-month. The number of active U.S. onshore rigs Cactus followed represents the approximate number of active U.S. onshore drilling rigs to which Cactus was the primary provider of wellhead products and corresponding services during drilling, as of mid-month. Cactus believes that comparing the total number of active U.S. onshore rigs to which it is providing its products and services at a given time to the total number of active U.S. onshore rigs on or about such time provides Cactus with a reasonable approximation of its market share with respect to its wellhead products sold and the corresponding services it provides. Initiatives to Drive Growth Continuing new product development, innovation and investment including: SafeDrill® 4T wellhead system for additional casing strings Cactus Completions 2.0 – four new rental equipment offerings for remote frac operations Development of additional frac tree rental equipment Infrastructure: Expanded Bossier City facility to accommodate products manufactured in Suzhou Expanded West Texas and New Mexico service centers (1) U.S. Onshore Rigs |
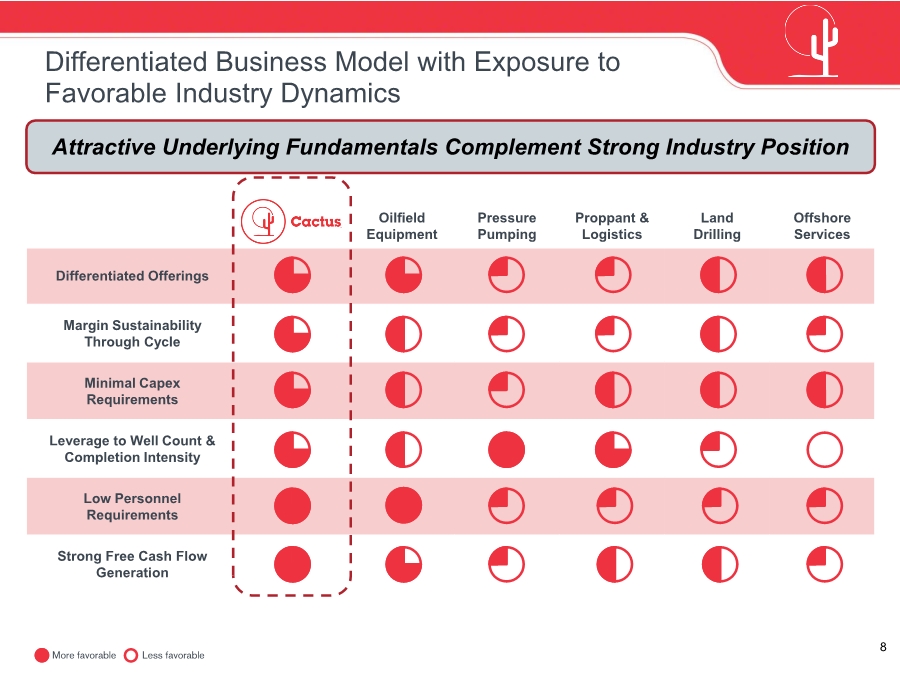
| 8More favorable Less favorable Cactus Oilfield Equipment Pressure Pumping Proppant & Logistics Land Drilling Offshore Services Differentiated Offerings Margin Sustainability Through Cycle Minimal Capex Requirements Leverage to Well Count & Completion Intensity Low Personnel Requirements Strong Free Cash Flow Generation Differentiated Business Model with Exposure to Favorable Industry Dynamics Attractive Underlying Fundamentals Complement Strong Industry Position |
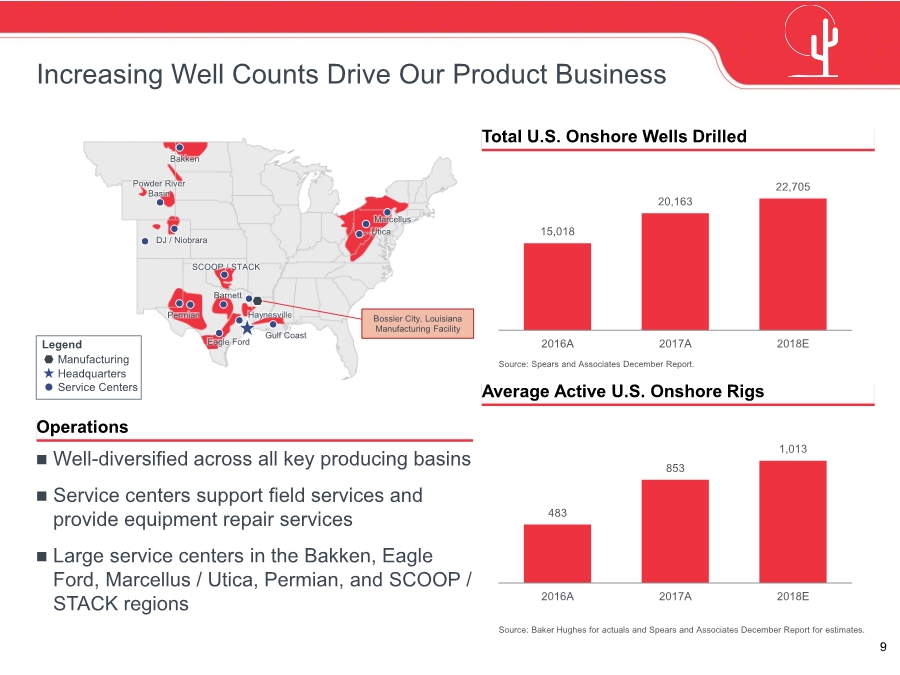
| 9 15,018 20,163 22,705 2016A 2017A 2018E 483 853 1,013 2016A 2017A 2018E DJ / Niobrara Powder River Basin Bakken SCOOP / STACK HaynesvillePermian Eagle Ford Utica Marcellus Gulf Coast Bossier City, Louisiana Manufacturing Facility Increasing Well Counts Drive Our Product Business Total U.S. Onshore Wells Drilled Average Active U.S. Onshore Rigs Well-diversified across all key producing basins Service centers support field services and provide equipment repair services Large service centers in the Bakken, Eagle Ford, Marcellus / Utica, Permian, and SCOOP / STACK regions Legend Service Centers Headquarters Manufacturing Source: Baker Hughes for actuals and Spears and Associates December Report for estimates. Source: Spears and Associates December Report. Barnett Operations |
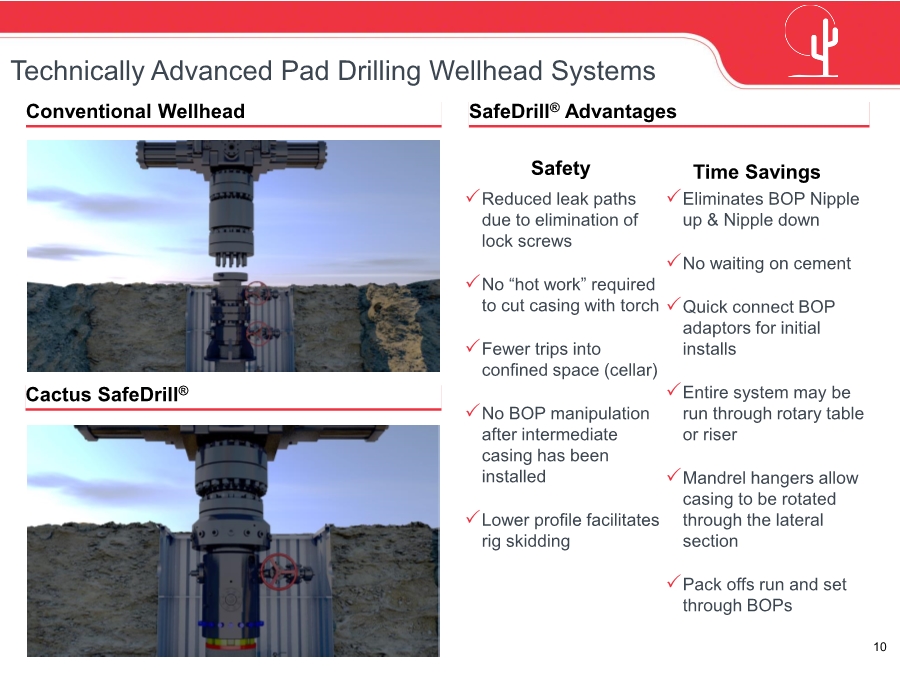
| 10 Technically Advanced Pad Drilling Wellhead Systems SafeDrill® Advantages Eliminates BOP Nipple up & Nipple down No waiting on cement Quick connect BOP adaptors for initial installs Entire system may be run through rotary table or riser Mandrel hangers allow casing to be rotated through the lateral section Pack offs run and set through BOPs Reduced leak paths due to elimination of lock screws No “hot work” required to cut casing with torch Fewer trips into confined space (cellar) No BOP manipulation after intermediate casing has been installed Lower profile facilitates rig skidding Safety Time Savings Conventional Wellhead Cactus SafeDrill® |
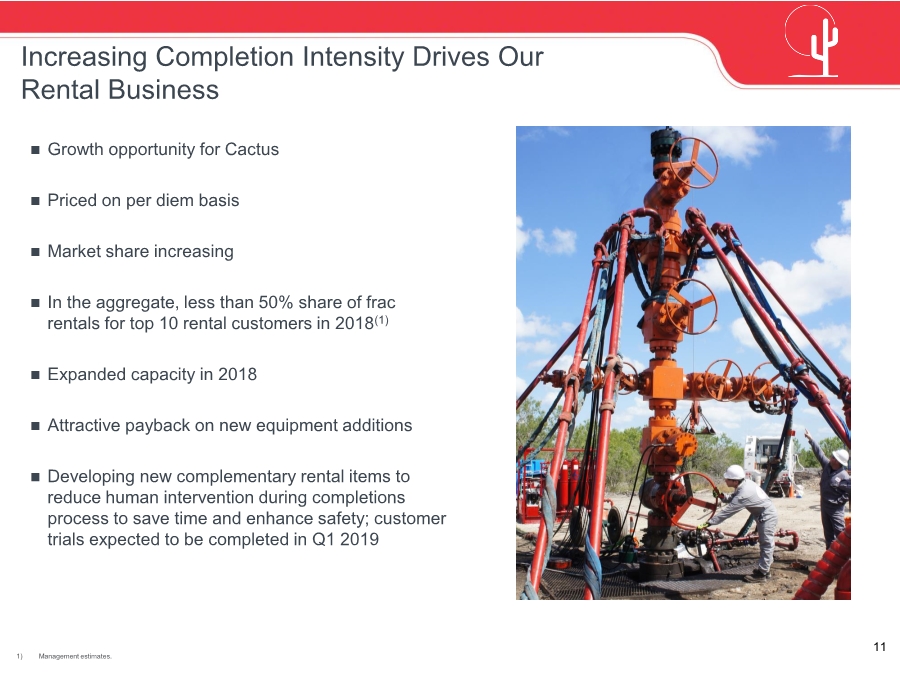
| 11 Increasing Completion Intensity Drives Our Rental Business Growth opportunity for Cactus Priced on per diem basis Market share increasing In the aggregate, less than 50% share of frac rentals for top 10 rental customers in 2018(1) Expanded capacity in 2018 Attractive payback on new equipment additions Developing new complementary rental items to reduce human intervention during completions process to save time and enhance safety; customer trials expected to be completed in Q1 2019 1) Management estimates. |
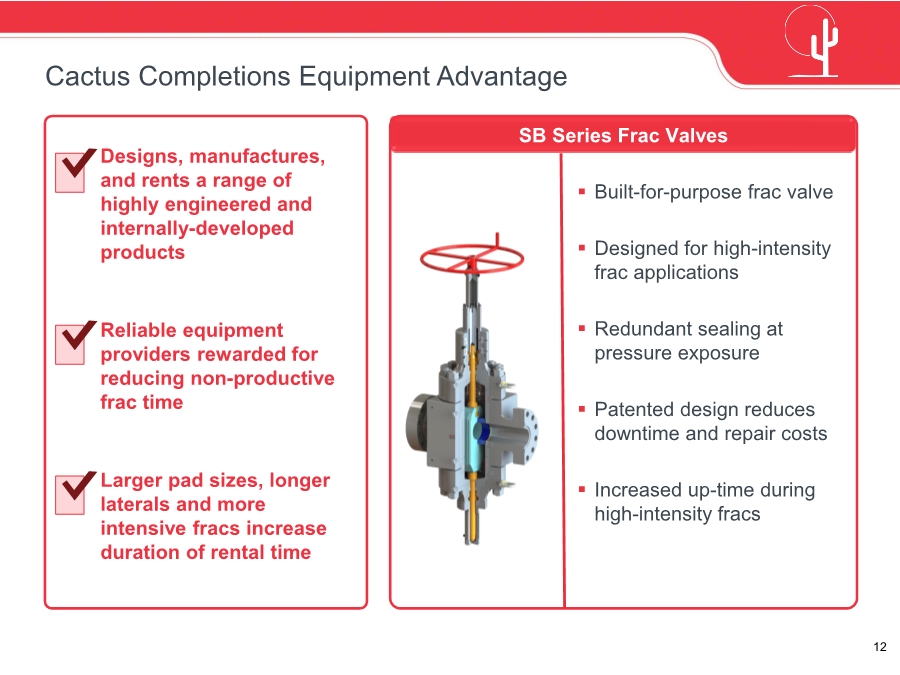
| 12 Cactus Completions Equipment Advantage Designs, manufactures, and rents a range of highly engineered and internally-developed products Reliable equipment providers rewarded for reducing non-productive frac time Larger pad sizes, longer laterals and more intensive fracs increase duration of rental time SB Series Frac Valves ▪ Built-for-purpose frac valve ▪ Designed for high-intensity frac applications ▪ Redundant sealing at pressure exposure ▪ Patented design reduces downtime and repair costs ▪ Increased up-time during high-intensity fracs |
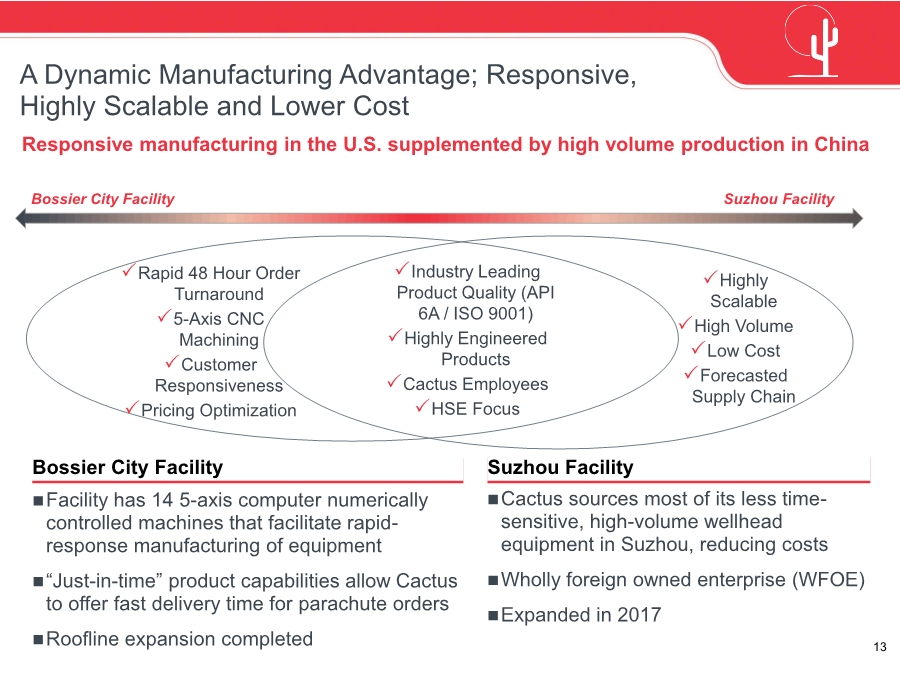
| 13 A Dynamic Manufacturing Advantage; Responsive, Highly Scalable and Lower Cost Bossier City Facility Suzhou Facility Industry Leading Product Quality (API 6A / ISO 9001) Highly Engineered Products Cactus Employees HSE Focus Rapid 48 Hour Order Turnaround 5-Axis CNC Machining Customer Responsiveness Pricing Optimization Highly Scalable High Volume Low Cost Forecasted Supply Chain Responsive manufacturing in the U.S. supplemented by high volume production in China Bossier City Facility Suzhou Facility Facility has 14 5-axis computer numerically controlled machines that facilitate rapid- response manufacturing of equipment “Just-in-time” product capabilities allow Cactus to offer fast delivery time for parachute orders Roofline expansion completed Cactus sources most of its less time- sensitive, high-volume wellhead equipment in Suzhou, reducing costs Wholly foreign owned enterprise (WFOE) Expanded in 2017 |
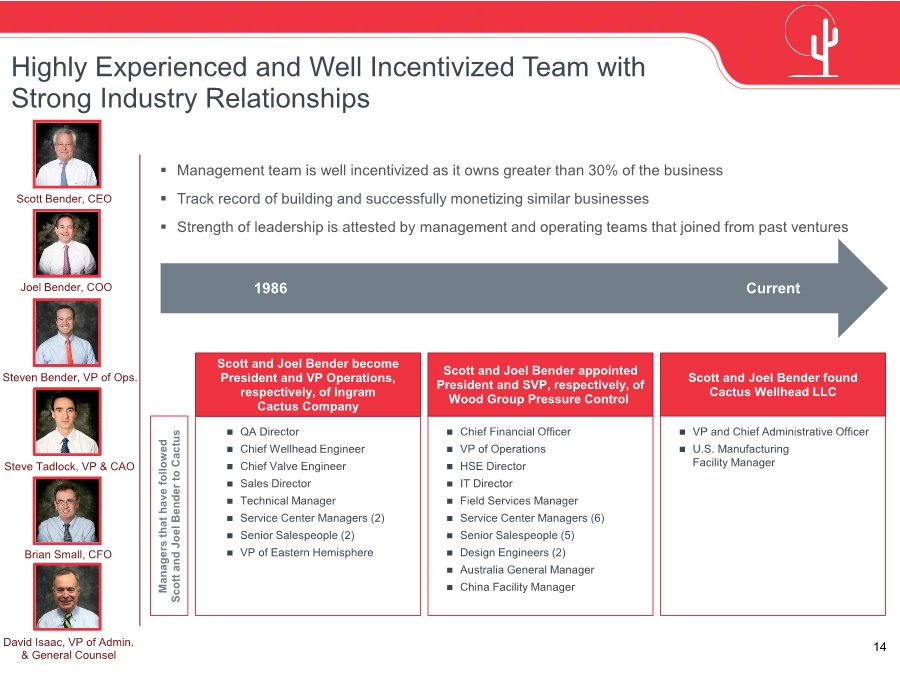
| 14 1986 Current Scott and Joel Bender found Cactus Wellhead LLC Scott and Joel Bender appointed President and SVP, respectively, of Wood Group Pressure Control Scott and Joel Bender become President and VP Operations, respectively, of Ingram Cactus Company QA Director Chief Wellhead Engineer Chief Valve Engineer Sales Director Technical Manager Service Center Managers (2) Senior Salespeople (2) VP of Eastern Hemisphere VP and Chief Administrative Officer U.S. Manufacturing Facility Manager 1986 Current Managers that have followed Scott and Joel Bender to Cactus ▪ Management team is well incentivized as it owns greater than 30% of the business ▪ Track record of building and successfully monetizing similar businesses ▪ Strength of leadership is attested by management and operating teams that joined from past ventures Scott Bender, CEO Steven Bender, VP of Ops. Brian Small, CFO Joel Bender, COO Highly Experienced and Well Incentivized Team with Strong Industry Relationships Steve Tadlock, VP & CAO Chief Financial Officer VP of Operations HSE Director IT Director Field Services Manager Service Center Managers (6) Senior Salespeople (5) Design Engineers (2) Australia General Manager China Facility Manager David Isaac, VP of Admin. & General Counsel |
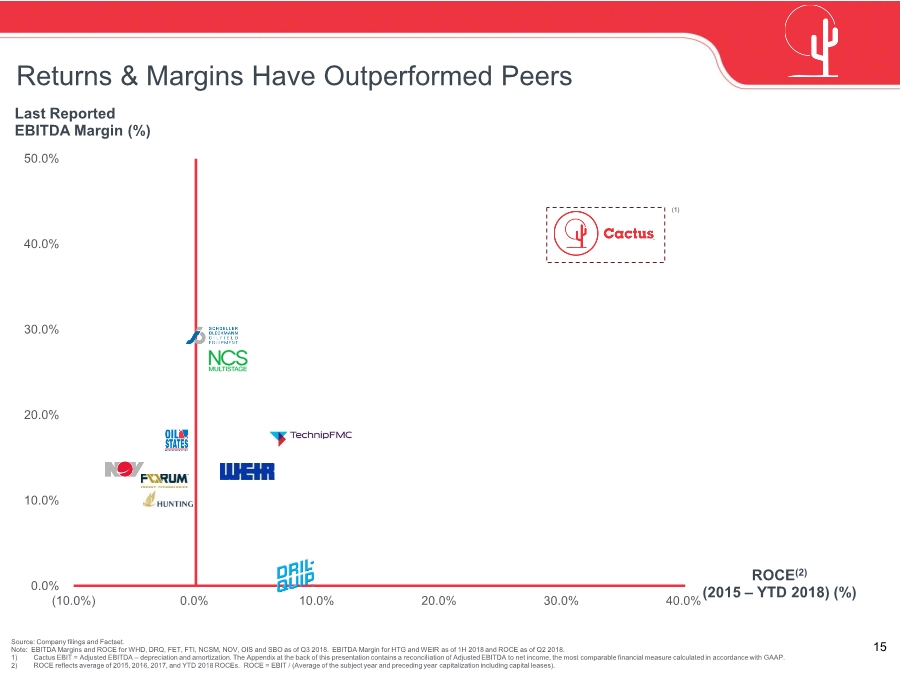
| 15 Cactus FTI DRQ WEIR NCSM SBO OIS HTG FETNOV 0.0% 10.0% 20.0% 30.0% 40.0% 50.0% (10.0%) 0.0% 10.0% 20.0% 30.0% 40.0% Returns & Margins Have Outperformed Peers Source: Company filings and Factset. Note: EBITDA Margins and ROCE for WHD, DRQ, FET, FTI, NCSM, NOV, OIS and SBO as of Q3 2018. EBITDA Margin for HTG and WEIR as of 1H 2018 and ROCE as of Q2 2018. 1) Cactus EBIT = Adjusted EBITDA – depreciation and amortization. The Appendix at the back of this presentation contains a reconciliation of Adjusted EBITDA to net income, the most comparable financial measure calculated in accordance with GAAP. 2) ROCE reflects average of 2015, 2016, 2017, and YTD 2018 ROCEs. ROCE = EBIT / (Average of the subject year and preceding year capitalization including capital leases). Last Reported EBITDA Margin (%) ROCE(2) (2015 – YTD 2018) (%) (1) |
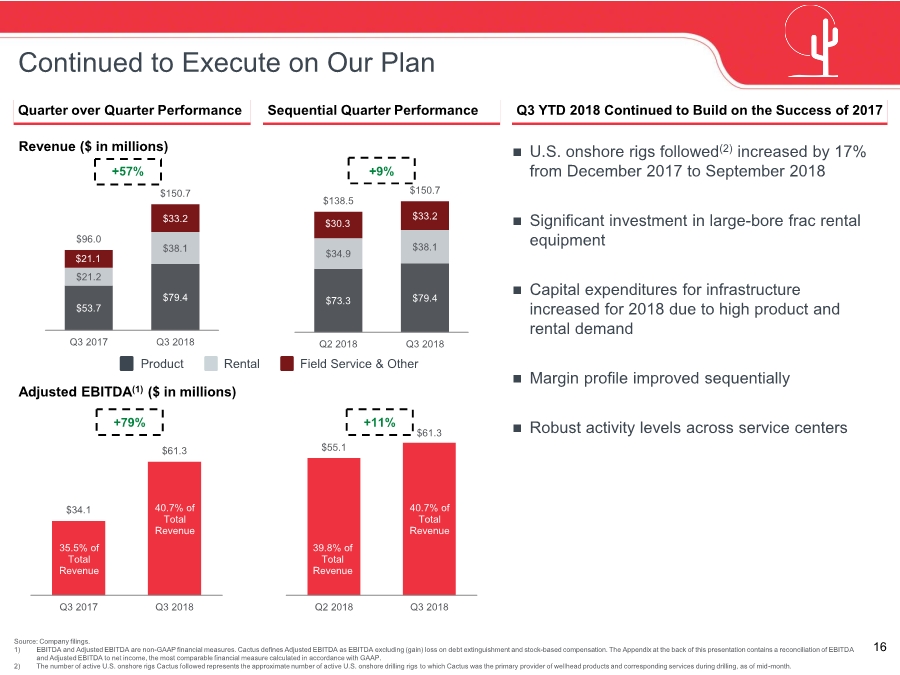
| 16 $55.1 $61.3 Q2 2018 Q3 2018 $34.1 $61.3 Q3 2017 Q3 2018 $53.7 $79.4 $21.2 $38.1 $21.1 $33.2 $96.0 $150.7 Q3 2017 Q3 2018 $73.3 $79.4 $34.9 $38.1 $30.3 $33.2 $138.5 $150.7 Q2 2018 Q3 2018 U.S. onshore rigs followed(2) increased by 17% from December 2017 to September 2018 Significant investment in large-bore frac rental equipment Capital expenditures for infrastructure increased for 2018 due to high product and rental demand Margin profile improved sequentially Robust activity levels across service centers Q3 YTD 2018 Continued to Build on the Success of 2017 Continued to Execute on Our Plan Source: Company filings. 1) EBITDA and Adjusted EBITDA are non-GAAP financial measures. Cactus defines Adjusted EBITDA as EBITDA excluding (gain) loss on debt extinguishment and stock-based compensation. The Appendix at the back of this presentation contains a reconciliation of EBITDA and Adjusted EBITDA to net income, the most comparable financial measure calculated in accordance with GAAP. 2) The number of active U.S. onshore rigs Cactus followed represents the approximate number of active U.S. onshore drilling rigs to which Cactus was the primary provider of wellhead products and corresponding services during drilling, as of mid-month. * Quarter over Quarter Performance +9% Revenue ($ in millions) Sequential Quarter Performance Adjusted EBITDA(1) ($ in millions) +79% +11% +57% Product Field Service & OtherRental 35.5% of Total Revenue 40.7% of Total Revenue 39.8% of Total Revenue 40.7% of Total Revenue |
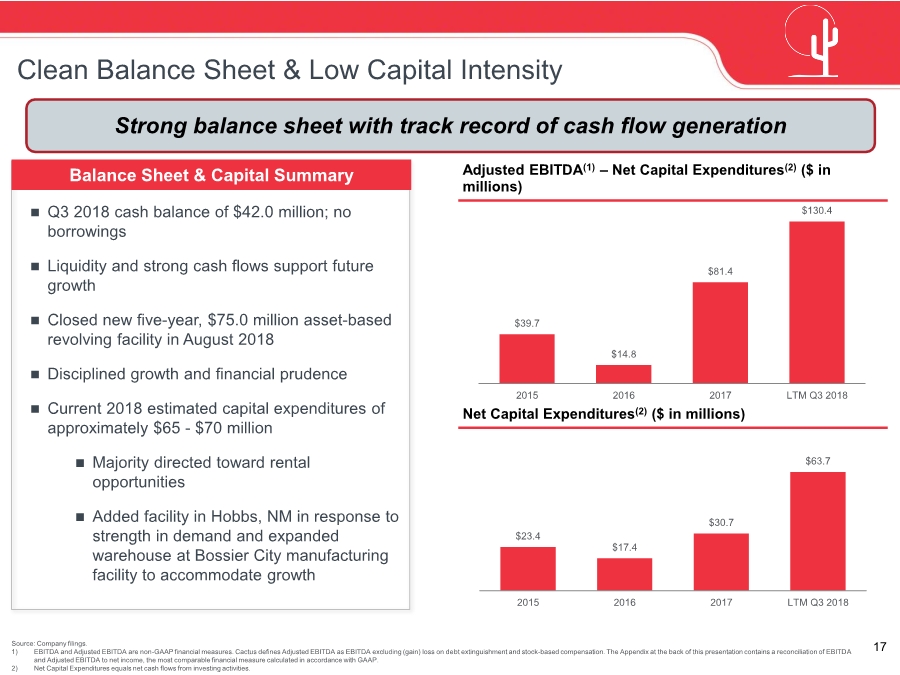
| 17 $23.4 $17.4 $30.7 $63.7 2015 2016 2017 LTM Q3 2018 $39.7 $14.8 $81.4 $130.4 2015 2016 2017 LTM Q3 2018 Q3 2018 cash balance of $42.0 million; no borrowings Liquidity and strong cash flows support future growth Closed new five-year, $75.0 million asset-based revolving facility in August 2018 Disciplined growth and financial prudence Current 2018 estimated capital expenditures of approximately $65 - $70 million Majority directed toward rental opportunities Added facility in Hobbs, NM in response to strength in demand and expanded warehouse at Bossier City manufacturing facility to accommodate growth Adjusted EBITDA(1) – Net Capital Expenditures(2) ($ in millions) Strong balance sheet with track record of cash flow generation Net Capital Expenditures(2) ($ in millions) Clean Balance Sheet & Low Capital Intensity Balance Sheet & Capital Summary Source: Company filings. 1) EBITDA and Adjusted EBITDA are non-GAAP financial measures. Cactus defines Adjusted EBITDA as EBITDA excluding (gain) loss on debt extinguishment and stock-based compensation. The Appendix at the back of this presentation contains a reconciliation of EBITDA and Adjusted EBITDA to net income, the most comparable financial measure calculated in accordance with GAAP. 2) Net Capital Expenditures equals net cash flows from investing activities. |
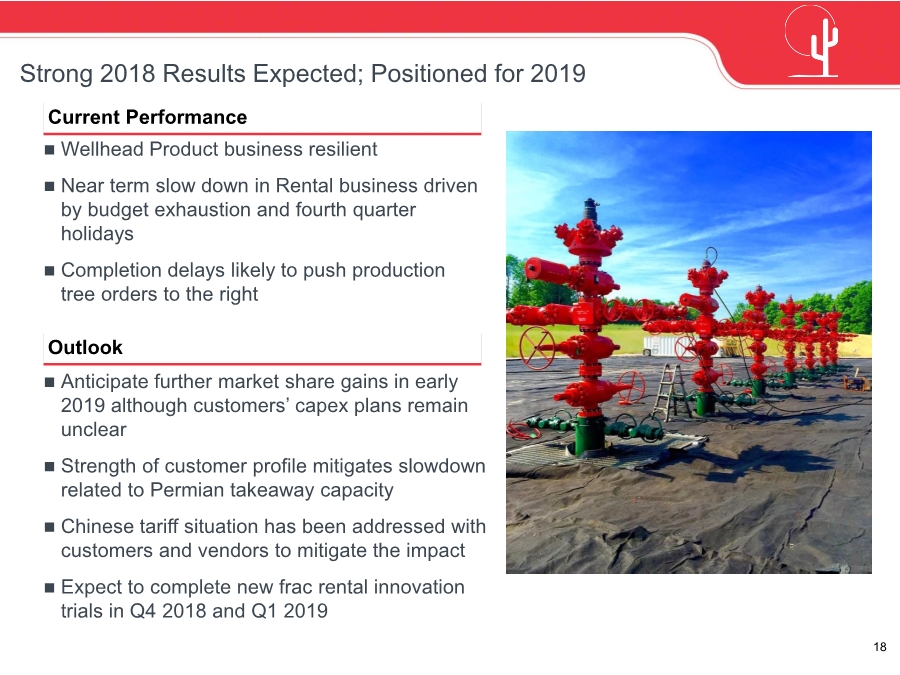
| 18 Strong 2018 Results Expected; Positioned for 2019 Wellhead Product business resilient Near term slow down in Rental business driven by budget exhaustion and fourth quarter holidays Completion delays likely to push production tree orders to the right Current Performance Outlook Anticipate further market share gains in early 2019 although customers’ capex plans remain unclear Strength of customer profile mitigates slowdown related to Permian takeaway capacity Chinese tariff situation has been addressed with customers and vendors to mitigate the impact Expect to complete new frac rental innovation trials in Q4 2018 and Q1 2019 |
| Appendix |
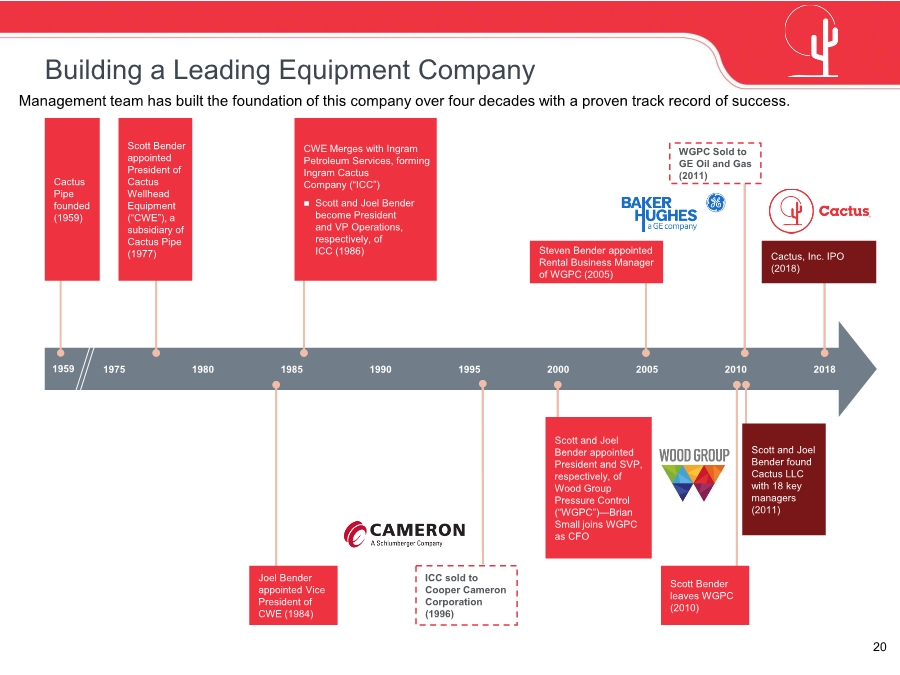
| 20 1959 19801975 1985 1990 1995 2000 2005 2010 ICC sold to Cooper Cameron Corporation (1996) 2018 Scott Bender appointed President of Cactus Wellhead Equipment (“CWE”), a subsidiary of Cactus Pipe (1977) Cactus Pipe founded (1959) CWE Merges with Ingram Petroleum Services, forming Ingram Cactus Company (“ICC”) Scott and Joel Bender become President and VP Operations, respectively, of ICC (1986) Joel Bender appointed Vice President of CWE (1984) Scott and Joel Bender appointed President and SVP, respectively, of Wood Group Pressure Control (“WGPC”)—Brian Small joins WGPC as CFO Scott Bender leaves WGPC (2010) Scott and Joel Bender found Cactus LLC with 18 key managers (2011) WGPC Sold to GE Oil and Gas (2011) Management team has built the foundation of this company over four decades with a proven track record of success. Building a Leading Equipment Company Steven Bender appointed Rental Business Manager of WGPC (2005) Cactus, Inc. IPO (2018) |
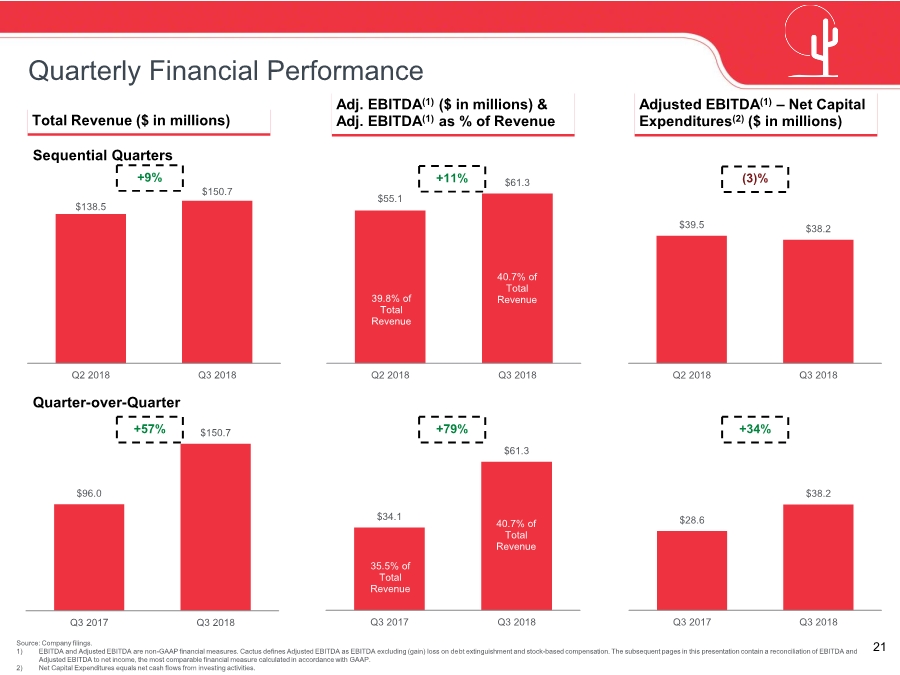
| 21 $39.5 $38.2 Q2 2018 Q3 2018 $28.6 $38.2 Q3 2017 Q3 2018 $34.1 $61.3 Q3 2017 Q3 2018 $55.1 $61.3 Q2 2018 Q3 2018 $96.0 $150.7 Q3 2017 Q3 2018 $138.5 $150.7 Q2 2018 Q3 2018 Quarterly Financial Performance Total Revenue ($ in millions) Adj. EBITDA(1) ($ in millions) & Adj. EBITDA(1) as % of Revenue +57% +79% +34% 35.5% of Total Revenue Source: Company filings. 1) EBITDA and Adjusted EBITDA are non-GAAP financial measures. Cactus defines Adjusted EBITDA as EBITDA excluding (gain) loss on debt extinguishment and stock-based compensation. The subsequent pages in this presentation contain a reconciliation of EBITDA and Adjusted EBITDA to net income, the most comparable financial measure calculated in accordance with GAAP. 2) Net Capital Expenditures equals net cash flows from investing activities. +9% +11% (3)% 39.8% of Total Revenue 40.7% of Total Revenue Sequential Quarters Quarter-over-Quarter Adjusted EBITDA(1) – Net Capital Expenditures(2) ($ in millions) 40.7% of Total Revenue |
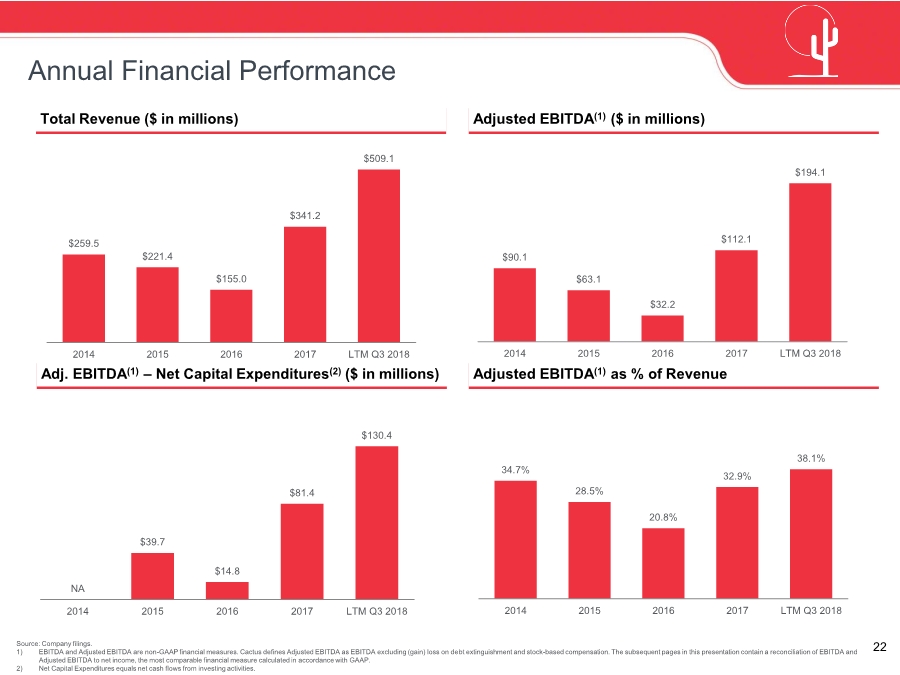
| 22 34.7% 28.5% 20.8% 32.9% 38.1% 2014 2015 2016 2017 LTM Q3 2018 NA $39.7 $14.8 $81.4 $130.4 2014 2015 2016 2017 LTM Q3 2018 $90.1 $63.1 $32.2 $112.1 $194.1 2014 2015 2016 2017 LTM Q3 2018 $259.5 $221.4 $155.0 $341.2 $509.1 2014 2015 2016 2017 LTM Q3 2018 Annual Financial Performance Total Revenue ($ in millions) Adj. EBITDA(1) – Net Capital Expenditures(2) ($ in millions) Adjusted EBITDA(1) as % of Revenue Source: Company filings. 1) EBITDA and Adjusted EBITDA are non-GAAP financial measures. Cactus defines Adjusted EBITDA as EBITDA excluding (gain) loss on debt extinguishment and stock-based compensation. The subsequent pages in this presentation contain a reconciliation of EBITDA and Adjusted EBITDA to net income, the most comparable financial measure calculated in accordance with GAAP. 2) Net Capital Expenditures equals net cash flows from investing activities. Adjusted EBITDA(1) ($ in millions) |
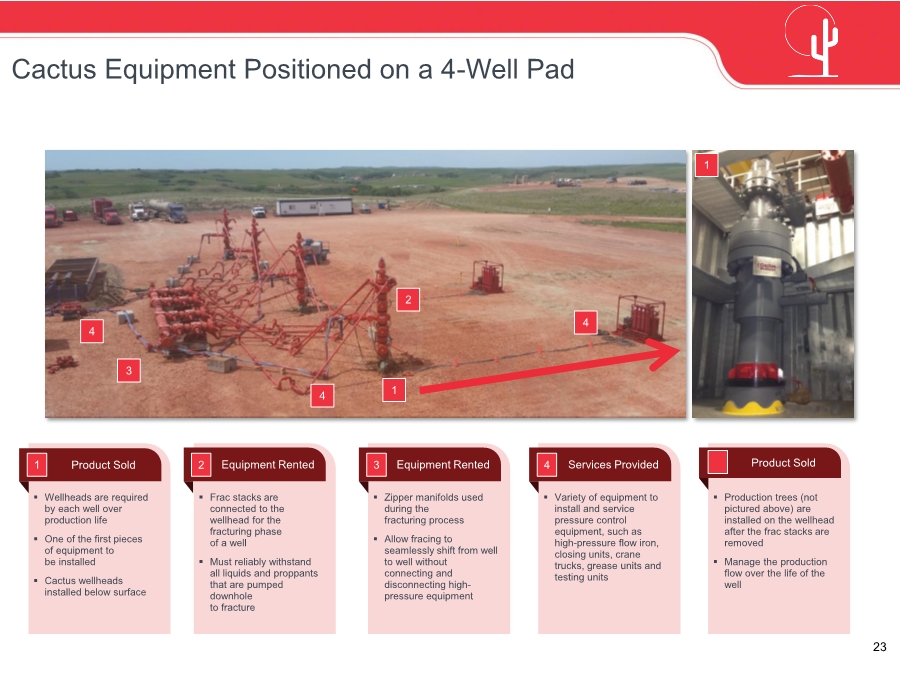
| 23 Cactus Equipment Positioned on a 4-Well Pad 2 4 3 4 1 1 4 ▪ Wellheads are required by each well over production life ▪ One of the first pieces of equipment to be installed ▪ Cactus wellheads installed below surface Product Sold1 ▪ Frac stacks are connected to the wellhead for the fracturing phase of a well ▪ Must reliably withstand all liquids and proppants that are pumped downhole to fracture Equipment Rented 2 ▪ Zipper manifolds used during the fracturing process ▪ Allow fracing to seamlessly shift from well to well without connecting and disconnecting high- pressure equipment Equipment Rented 3 ▪ Variety of equipment to install and service pressure control equipment, such as high-pressure flow iron, closing units, crane trucks, grease units and testing units Services Provided4 ▪ Production trees (not pictured above) are installed on the wellhead after the frac stacks are removed ▪ Manage the production flow over the life of the well Product Sold |
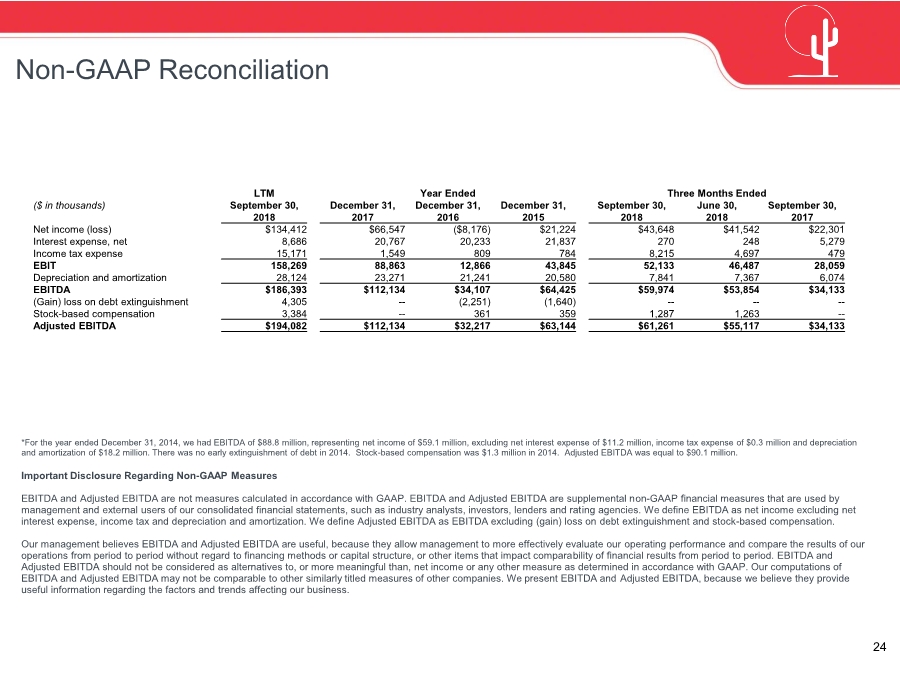
| 24 Non-GAAP Reconciliation Important Disclosure Regarding Non-GAAP Measures EBITDA and Adjusted EBITDA are not measures calculated in accordance with GAAP. EBITDA and Adjusted EBITDA are supplemental non-GAAP financial measures that are used by management and external users of our consolidated financial statements, such as industry analysts, investors, lenders and rating agencies. We define EBITDA as net income excluding net interest expense, income tax and depreciation and amortization. We define Adjusted EBITDA as EBITDA excluding (gain) loss on debt extinguishment and stock-based compensation. Our management believes EBITDA and Adjusted EBITDA are useful, because they allow management to more effectively evaluate our operating performance and compare the results of our operations from period to period without regard to financing methods or capital structure, or other items that impact comparability of financial results from period to period. EBITDA and Adjusted EBITDA should not be considered as alternatives to, or more meaningful than, net income or any other measure as determined in accordance with GAAP. Our computations of EBITDA and Adjusted EBITDA may not be comparable to other similarly titled measures of other companies. We present EBITDA and Adjusted EBITDA, because we believe they provide useful information regarding the factors and trends affecting our business. *For the year ended December 31, 2014, we had EBITDA of $88.8 million, representing net income of $59.1 million, excluding net interest expense of $11.2 million, income tax expense of $0.3 million and depreciation and amortization of $18.2 million. There was no early extinguishment of debt in 2014. Stock-based compensation was $1.3 million in 2014. Adjusted EBITDA was equal to $90.1 million. LTM Year Ended Three Months Ended ($ in thousands) September 30, December 31, December 31, December 31, September 30, June 30, September 30, 2018 2017 2016 2015 2018 2018 2017 Net income (loss) $134,412 $66,547 ($8,176) $21,224 $43,648 $41,542 $22,301 Interest expense, net 8,686 20,767 20,233 21,837 270 248 5,279 Income tax expense 15,171 1,549 809 784 8,215 4,697 479 EBIT 158,269 88,863 12,866 43,845 52,133 46,487 28,059 Depreciation and amortization 28,124 23,271 21,241 20,580 7,841 7,367 6,074 EBITDA $186,393 $112,134 $34,107 $64,425 $59,974 $53,854 $34,133 (Gain) loss on debt extinguishment 4,305 -- (2,251) (1,640) -- -- -- Stock-based compensation 3,384 -- 361 359 1,287 1,263 -- Adjusted EBITDA $194,082 $112,134 $32,217 $63,144 $61,261 $55,117 $34,133 |
| 25 Investor Relations Contact John Fitzgerald Director of Corporate Development & Investor Relations 713-904-4655 IR@CactusWHD.com |