Attached files
| file | filename |
|---|---|
| EX-32.2 - EX-32.2 - Cactus, Inc. | whd-20171231ex32204bc81.htm |
| EX-32.1 - EX-32.1 - Cactus, Inc. | whd-20171231ex3215dd730.htm |
| EX-31.2 - EX-31.2 - Cactus, Inc. | whd-20171231ex3124d7e8f.htm |
| EX-31.1 - EX-31.1 - Cactus, Inc. | whd-20171231ex31143747d.htm |
| EX-21.1 - EX-21.1 - Cactus, Inc. | whd-20171231ex2115c4eb1.htm |
| EX-3.2 - EX-3.2 - Cactus, Inc. | whd-20171231ex32b2defed.htm |
UNITED STATES
SECURITIES AND EXCHANGE COMMISSION
Washington, D.C. 20549
FORM 10‑K
(Mark One)
☑ANNUAL REPORT PURSUANT TO SECTION 13 OR 15(d) OF THE SECURITIES EXCHANGE ACT OF 1934
For the fiscal year ended December 31, 2017
or
☐TRANSITION REPORT PURSUANT TO SECTION 13 OR 15(d) OF THE SECURITIES EXCHANGE ACT OF 1934
For the transition period from to
Commission File Number: 001‑38390
Cactus, Inc.
(Exact name of registrant as specified in its charter)
|
Delaware |
35‑2586106 |
|
(State or other jurisdiction |
(I.R.S. Employer |
|
|
|
|
Cobalt Center 920 Memorial City Way, Suite 300 Houston, Texas |
77024 |
|
(Address of principal executive offices) |
(Zip code) |
(713) 626‑8800
(Registrant’s telephone number, including area code)
Securities registered pursuant to Section 12(b) of the Act:
|
Common Stock, par value $0.01 per share |
New York Stock Exchange |
|
(Title of each class) |
(Name of each exchange on which registered) |
Securities registered pursuant to Section 12(g) of the Act: None
Indicate by check mark if the Registrant is a well‑known seasoned issuer, as defined in Rule 405 of the Securities Act. Yes ☐ No ☑
Indicate by check mark if the Registrant is not required to file reports pursuant to Section 13 or Section 15(d) of the Act. Yes ☐ No ☑
Indicate by check mark whether the registrant (1) has filed all reports required to be filed by Section 13 or 15(d) of the Securities Exchange Act of 1934 during the preceding 12 months (or for such shorter period that the registrant was required to file such reports), and (2) has been subject to such filing requirements for the past 90 days. Yes ☐ No ☑
Indicate by check mark whether the registrant has submitted electronically and posted on its corporate Web site, if any, every Interactive Data File required to be submitted and posted pursuant to Rule 405 of Regulation S-T during the preceding 12 months (or for such shorter period that the registrant was required to submit and post such files). Yes ☑No ☐
Indicate by check mark if disclosure of delinquent filers pursuant to Item 405 of Regulation S-K is not contained herein, and will not be contained, to the best of registrant’s knowledge, in definitive proxy or information statements incorporated by reference in Part III of this Form 10‑K or any amendment to this Form 10‑K. ☑
Indicate by check mark whether the registrant is a large accelerated filer, an accelerated filer, a non-accelerated filer, smaller reporting company, or an emerging growth company. See the definitions of “large accelerated filer,” “accelerated filer,” “smaller reporting company” and “emerging growth company” in Rule 12b‑2 of the Exchange Act.
|
Large accelerated filer |
☐ |
Accelerated filer |
☐ |
|
Non-accelerated filer |
☑ |
Smaller reporting company |
☐ |
|
(Do not check if a smaller reporting company) |
Emerging growth company |
☑ |
|
If an emerging growth company indicate by check mark if the registrant has elected not to use the extended transition period for complying with any new or revised financial accounting standards provided pursuant to Section 13(a) of the Exchange Act. ☑
Indicate by check mark whether the registrant is a shell company (as defined in Rule 12b‑2 of the Exchange Act). Yes ☐ No ☑
As of June 30, 2017, the last business day of the registrant’s most recently completed second quarter, there was no public market for the registrant’s common stock. The registrant’s common stock began trading on the New York Stock Exchange on February 8, 2018.
As of March 13, 2018, the registrant had 26,450,000 shares of Class A Common Stock, $0.01 par value per share, and 48,439,772 shares of Class B Common Stock, $0.01 par value per share, outstanding.
DOCUMENTS INCORPORATED BY REFERENCE
The Company’s definitive proxy statement relating to the annual meeting of shareholders (to be held June 20, 2018) will be filed with the Securities and Exchange Commission within 120 days after the close of the Company’s fiscal year ended December 31, 2017 and is incorporated by reference in Part III to the extent described herein.
|
ii |
||
|
iv |
||
|
|
|
|
|
|
1 | |
|
|
|
|
| 1 | ||
| 12 | ||
| 32 | ||
| 33 | ||
| 33 | ||
| 34 | ||
|
|
|
|
|
|
34 | |
|
|
|
|
| 34 | ||
| 35 | ||
|
Management’s Discussion and Analysis of Financial Condition and Results of Operations |
36 | |
| 52 | ||
| 54 | ||
|
Changes in and Disagreements with Accountants on Accounting and Financial Disclosure |
83 | |
| 83 | ||
| 84 | ||
|
|
|
|
|
|
85 | |
|
|
|
|
| 85 | ||
| 85 | ||
|
Security Ownership of Certain Beneficial Owners and Management and Related Stockholder Matters |
85 | |
|
Certain Relationships and Related Transactions, and Director Independence |
85 | |
| 85 | ||
|
|
|
|
|
|
86 | |
|
|
|
|
| 86 | ||
| 88 | ||
|
|
89 | |
i
CAUTIONARY STATEMENT REGARDING FORWARD-LOOKING STATEMENTS
This Annual Report on Form 10‑K (this “Annual Report”) contains “forward-looking statements” within the meaning of Section 21E of the Securities Exchange Act of 1934, as amended (the “Exchange Act”). When used in this Annual Report, the words “could,” “believe,” “anticipate,” “intend,” “estimate,” “expect,” “project” and similar expressions are intended to identify forward‑looking statements, although not all forward‑looking statements contain such identifying words. These forward‑looking statements are based on our current expectations and assumptions about future events and are based on currently available information as to the outcome and timing of future events. When considering forward‑looking statements, you should keep in mind the risk factors and other cautionary statements described under the heading “Item 1A. Risk Factors” included in this Annual Report. These forward‑looking statements are based on management’s current belief, based on currently available information, as to the outcome and timing of future events.
Forward‑looking statements may include statements about:
|
· |
demand for our products and services, which is affected by, among other things, changes in the price of, and demand for, crude oil and natural gas in domestic and international markets; |
|
· |
the level of growth in number of rigs and well count; |
|
· |
the level of fracturing activity and the availability of fracturing equipment and pressure pumping services; |
|
· |
the size and timing of orders; |
|
· |
availability of raw materials; |
|
· |
expectations regarding raw materials, overhead and operating costs and margins; |
|
· |
availability of skilled and qualified workers; |
|
· |
potential liabilities arising out of the installation, use or misuse of our products; |
|
· |
the possibility of cancellation of orders; |
|
· |
our business strategy; |
|
· |
our financial strategy, operating cash flows, liquidity and capital required for our business; |
|
· |
our future revenue, income and operating performance; |
|
· |
the termination of relationships with major customers or suppliers; |
|
· |
warranty and product liability claims; |
|
· |
laws and regulations, including environmental regulations, that may increase our costs, limit the demand for our products and services or restrict our operations; |
|
· |
disruptions in the political, regulatory, economic and social conditions domestically or internationally; |
ii
|
· |
increased import tariffs assessed on products from China or imported raw materials used in the manufacture of our goods in the United States; |
|
· |
a failure of our information technology infrastructure or any significant breach of security; |
|
· |
potential uninsured claims and litigation against us; |
|
· |
our dependence on the continuing services of certain of our key managers and employees; |
|
· |
the lack of a public market for our securities; and |
|
· |
plans, objectives, expectations and intentions contained in this Annual Report that are not historical. |
We caution you that these forward‑looking statements are subject to all of the risks and uncertainties, most of which are difficult to predict and many of which are beyond our control, incident to the operation of our business. These risks include, but are not limited to the risks described in this Annual Report under “Item 1A. Risk Factors.”
Should one or more of the risks or uncertainties described in this Annual Report occur, or should underlying assumptions prove incorrect, our actual results and plans could differ materially from those expressed in any forward‑looking statements.
All forward‑looking statements, expressed or implied, included in this Annual Report are expressly qualified in their entirety by this cautionary statement. This cautionary statement should also be considered in connection with any subsequent written or oral forward‑looking statements that we or persons acting on our behalf may issue.
Except as otherwise required by applicable law, we disclaim any duty to update any forward‑looking statements, all of which are expressly qualified by the statements in this section, to reflect events or circumstances after the date of this Annual Report.
iii
EMERGING GROWTH COMPANY STATUS
We are an “emerging growth company” as defined in the Jumpstart Our Business Startups Act (the “JOBS Act”). For as long as we are an emerging growth company, unlike public companies that are not emerging growth companies under the JOBS Act, we will not be required to:
|
· |
provide an auditor’s attestation report on management’s assessment of the effectiveness of our system of internal control over financial reporting pursuant to Section 404(b) of the Sarbanes‑Oxley Act of 2002; |
|
· |
comply with any new requirements adopted by the Public Company Accounting Oversight Board (the “PCAOB”) requiring mandatory audit firm rotation or a supplement to the auditor’s report in which the auditor would be required to provide additional information about the audit and the financial statements of the issuer; |
|
· |
provide certain disclosure regarding executive compensation required of larger public companies or hold shareholder advisory votes on the executive compensation required by the Dodd‑Frank Wall Street Reform and Consumer Protection Act (the “Dodd‑Frank Act”); or |
|
· |
obtain shareholder approval of any golden parachute payments not previously approved. |
We will cease to be an emerging growth company upon the earliest of the:
|
· |
last day of the fiscal year in which we have $1.07 billion or more in annual revenues; |
|
· |
date (after being subject to Section 13(a) or Section 15(d) of the Exchange Act for a period of at least twelve calendar months) on which we become a “large accelerated filer” (the fiscal year‑end on which the total market value of our common equity securities held by non‑affiliates is $700 million or more as of June 30); |
|
· |
date on which we issue more than $1.0 billion of non‑convertible debt over a three‑year period; or |
|
· |
last day of the fiscal year following the fifth anniversary of our initial public offering. |
In addition, Section 107 of the JOBS Act provides that an emerging growth company can take advantage of the extended transition period provided in Section 7(a)(2)(B) of the Securities Act of 1933, as amended (the “Securities Act”), for complying with new or revised accounting standards, but we have irrevocably opted out of the extended transition period and, as a result, we will adopt new or revised accounting standards on the relevant dates in which adoption of such standards is required for other public companies.
For a description of the qualifications and other requirements applicable to emerging growth companies and certain elections that we have made due to our status as an emerging growth company, see “Risk Factors—Risks Related to Our Class A Common Stock—For as long as we are an emerging growth company, we will not be required to comply with certain reporting requirements, including those relating to disclosure about our executive compensation, that apply to other public companies.”
iv
You should read this entire report carefully, including the risks described under Part 1, Item 1A. Risk Factors and our consolidated financial statements and the notes to those consolidated financial statements included elsewhere in this Annual Report on Form 10‑K. Except as otherwise indicated or required by the context, all references in this Annual Report to the “Company,” “Cactus,” “we,” “us” and “our” refer to (i) Cactus Wellhead, LLC (“Cactus LLC”) and its consolidated subsidiaries prior to the completion of our initial public offering and (ii) Cactus, Inc. (“Cactus Inc.”) and its consolidated subsidiaries (including Cactus LLC) following the completion of our initial public offering on February 12, 2018, unless we state otherwise or the context otherwise requires. References in this Annual Report to “Cadent” are to Cadent Energy Partners II, L.P., an affiliate of Cadent Energy Partners. References in this Annual Report to “Cactus WH Enterprises” are to Cactus WH Enterprises, LLC. Cadent, Cactus WH Enterprises and Mr. Lee Boquet are collectively referred to herein as the “Pre-IPO Owners.”
Overview
Cactus Inc. was incorporated as a Delaware corporation on February 17, 2017 for the purpose of completing an initial public offering of equity (our “IPO”) and related transactions. On February 12, 2018, in connection with our IPO, Cactus Inc. became a holding company whose sole material assets are units in Cactus LLC (“CW Units”). Cactus Inc. became the managing member of Cactus LLC and is responsible for all operational, management and administrative decisions relating to Cactus LLC’s business.
On February 12, 2018, we completed our initial public offering of 23,000,000 shares of Class A common stock, par value $0.01 per share (“Class A Common Stock”), at a price to the public of $19.00 per share. We received net proceeds of $405.8 million after deducting underwriting discounts and commissions and estimated offering expenses of our IPO. On February 14, 2018 we completed the sale of an additional 3,450,000 shares of Class A Common Stock pursuant to the exercise in full by the underwriters of their option to purchase additional shares of Class A Common Stock (the “Option”), resulting in $61.6 million of additional net proceeds. We contributed all of the net proceeds of the IPO to Cactus LLC in exchange for CW Units. Cactus LLC used (i) $251.0 million of the net proceeds to repay all of the borrowings outstanding under its term loan facility, including accrued interest and (ii) $216.4 million to redeem CW Units from certain direct and indirect owners of Cactus LLC.
We design, manufacture, sell and rent a range of highly‑engineered wellheads and pressure control equipment. Our products are sold and rented principally for onshore unconventional oil and gas wells and are utilized during the drilling, completion (including fracturing) and production phases of our customers’ wells. In addition, we provide field services for all of our products and rental items to assist with the installation, maintenance and handling of the wellhead and pressure control equipment.
Organizational Structure
In connection with the completion of the IPO, Cactus Inc. became the sole managing member of Cactus LLC and is responsible for all operational, management and administrative decisions relating to Cactus LLC’s business and consolidates the financial results of Cactus LLC and its subsidiaries. The Limited Liability Company Operating Agreement of Cactus LLC was amended and restated as the First Amended and Restated Limited Liability Company Operating Agreement of Cactus LLC (the “Cactus Wellhead LLC Agreement”) to, among other things, admit Cactus Inc. as the sole managing member of Cactus LLC.
1
In connection with our IPO, we completed a series of reorganization transactions, including the following:
|
(a) |
all of the membership interests in Cactus LLC were converted into a single class of CW Units; |
|
(b) |
Cactus Inc. contributed the net proceeds of the IPO to Cactus LLC in exchange for 23,000,000 CW Units; |
|
(c) |
Cactus LLC used the net proceeds of the IPO that it received from Cactus Inc. to repay the borrowings outstanding, plus accrued interest, under its term loan facility and to redeem 8,667,841 CW Units from the owners thereof; |
|
(d) |
Cactus Inc. issued and contributed 51,747,768 shares of its Class B common stock, par value $0.01 per share (“Class B Common Stock”) equal to the number of outstanding CW Units held by the Pre-IPO Owners following the redemption described in (c) above to Cactus LLC; |
|
(e) |
Cactus LLC distributed to each of the Pre-IPO Owners that continued to own CW Units following the IPO one share of Class B Common Stock for each CW Unit such Pre-IPO Owner held following the redemption described in (c) above; |
|
(f) |
Cactus Inc. contributed the net proceeds from the exercise of the Option to Cactus LLC in return for 3,450,000 additional CW Units; and |
|
(g) |
Cactus LLC used the net proceeds from the Option to redeem 3,450,000 CW Units from the owners thereof, and Cactus Inc. canceled a corresponding number of shares of Class B Common Stock. |
In connection with the IPO, Cactus Inc. granted 0.7 million restricted stock unit awards, which will vest over one to three years, to certain directors, officers and employees of Cactus.
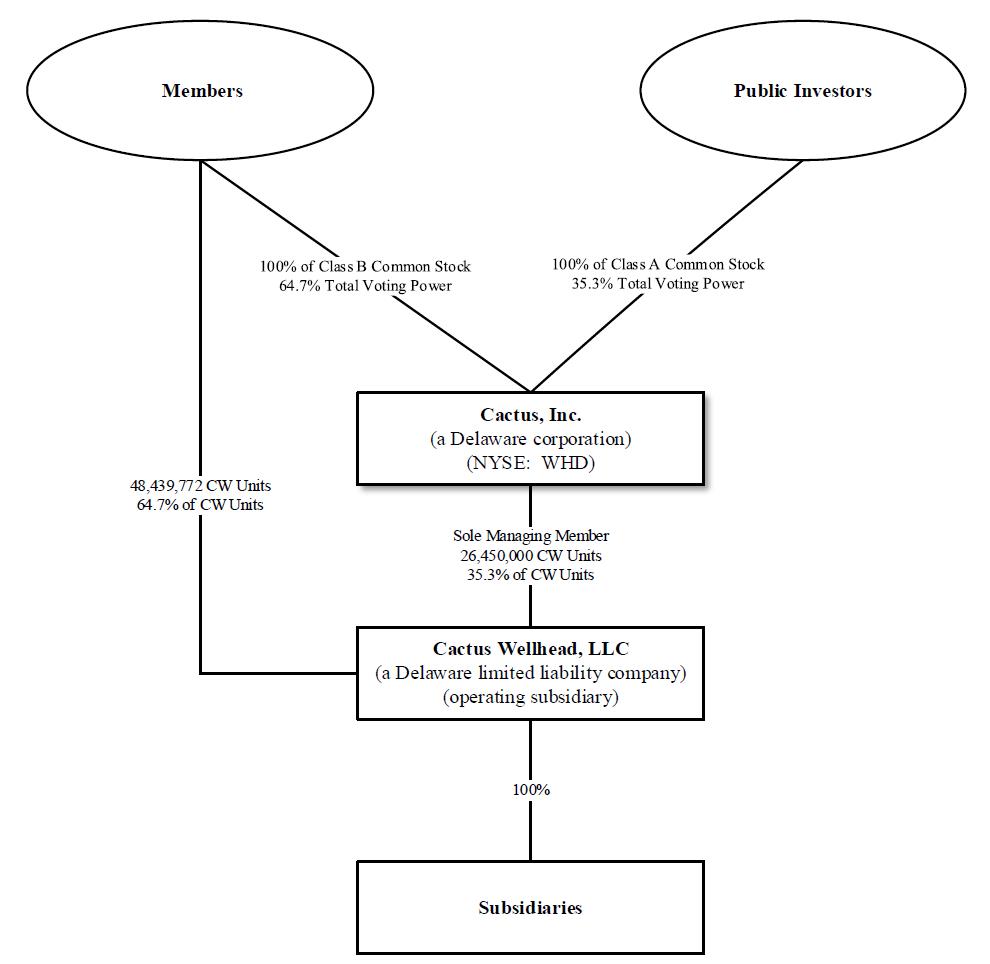
In this Annual Report, we refer to the owners of CW Units (along with their permitted transferees) as “CW Unit Holders.” CW Unit Holders also own one share of our Class B Common Stock for each CW Unit such CW Unit Holders own. After giving effect to our IPO and the related transactions, Cactus Inc. owns an approximate 35.3% interest in Cactus LLC, and the CW Unit Holders own an approximate 64.7% interest in Cactus LLC. These ownership percentages are based on 26,450,000 shares of Class A Common Stock and 48,439,772 shares of Class B Common Stock issued and outstanding as of March 13, 2018.
2
The following diagram indicates our simplified ownership structure.
Our Company
We design, manufacture, sell and rent a range of highly‑engineered wellheads and pressure control equipment. Our products are sold and rented principally for onshore unconventional oil and gas wells and are utilized during the drilling, completions (including fracturing) and production phases of our customers’ wells. In addition, we provide field services for all of our products and rental items to assist with the installation, maintenance and handling of the wellhead and pressure control equipment.
3
Our principal products include our Cactus SafeDrill™ wellhead systems, frac stacks, zipper manifolds and production trees that we design and manufacture. Every oil and gas well requires a wellhead, which is installed at the onset of the drilling process and which remains with the well through its entire productive life. The Cactus SafeDrill™ wellhead systems employ technology which allows technicians to land and secure casing strings more safely from the rig floor reducing the need to descend into the cellar. We believe we are a market leader in the application of such technology, with thousands of our products sold and installed across the United States since 2011. During the completion phase of a well, we rent frac stacks, zipper manifolds and other high‑pressure equipment that are used for well control and for managing the transmission of frac fluids and proppants during the hydraulic fracturing process. These severe service applications require robust and reliable equipment. For the subsequent production phase of a well, we sell production trees that regulate hydrocarbon production, which are installed on the wellhead after the frac tree has been removed. In addition, we provide mission‑critical field services for all of our products and rental items, including 24‑hour service crews to assist with the installation, maintenance and safe handling of the wellhead and pressure control equipment. Finally, we provide repair services for all of the equipment that we sell or rent.
Our innovative wellhead products and pressure control equipment are developed internally. We believe our close relationship with our customers provides us with insight into the specific issues encountered in the drilling and completions processes, allowing us to provide them with highly tailored product and service solutions. We have achieved significant market share, as measured by the percentage of total active U.S. onshore rigs that we follow (which we define as the number of active U.S. onshore drilling rigs to which we are the primary provider of wellhead products and corresponding services during drilling), and brand name recognition with respect to our engineered products, which we believe is due to our focus on safety, reliability, cost effectiveness and time saving features. We optimize our products for pad drilling (i.e., the process of drilling multiple wellbores from a single surface location) to reduce rig time and provide operators with significant efficiencies that translate to cost savings at the wellsite.
Our manufacturing and production facilities are located in Bossier City, Louisiana and Suzhou, China. While both facilities can produce our full range of products, our Bossier City facility has advanced capabilities and is designed to support time‑sensitive and rapid turnaround orders, while our facility in China is optimized for longer lead time orders and outsources its machining requirements. Both our United States and China facilities are licensed to the latest API 6A specification for both wellheads and valves and API Q1 and ISO9001:2015 quality management systems.
We operate 14 service centers in the United States, which are strategically located in the key oil and gas producing regions, including the Permian, SCOOP/STACK, Marcellus, Utica, Eagle Ford, Bakken and other active oil and gas regions in the United States. We also have one service center in Eastern Australia. These service centers support our field services and provide equipment assembly and repair services.
Our History
We began operating in August 2011, following the formation of Cactus LLC by Scott Bender and Joel Bender, who have owned or operated wellhead manufacturing businesses since the late 1970s, and by Cadent, as its equity sponsor. We acquired our primary manufacturing facility in Bossier City, Louisiana from one of our Pre-IPO Owners in September 2011 and established our other production facility, located in Suzhou, China, in December 2013. Since we began operating, we have grown to 14 U.S. service centers located in Texas, Louisiana, Colorado, Wyoming, New Mexico, Oklahoma, Pennsylvania and North Dakota. In July 2014, we formed Cactus Wellhead Australia Pty, Ltd and established a service center to develop the market for our products in Eastern Australia.
Suppliers and Raw Materials
Forgings, castings and bar stock represent the principal raw materials used in the manufacture of our products and rental equipment. In addition, we require accessory items (such as elastomers, ring gaskets, studs and nuts) and machining services. We purchase these items and services from over 250 vendors, both in the United States and China.
4
For the years ended December 31, 2017, 2016 and 2015, approximately $33.4 million, $10.8 million and $18.1 million, respectively, of machined component purchases were made from a vendor located in China, representing approximately 22%, 20% and 27%, respectively, of our total third party vendor purchases of raw materials, finished products, equipment, machining and other services. Although we have historically made purchases from this vendor pursuant to a long term contract, such contract expired at the end of 2016. We are currently purchasing from this vendor on terms substantially similar to those contained in the expired agreement. We expect to negotiate a new agreement with such vendor on terms similar to those in the expired agreement. Although our relationships with our existing vendors, including the Chinese vendor referred to above, are important to us, we do not believe that we are substantially dependent on any individual vendor to supply our required materials or services. The materials and services essential to our business are normally readily available and, where we use one or a few vendors as a source of any particular materials or services, we believe that we can, within a reasonable period of time, make satisfactory alternative arrangements in the event of an interruption of supply from any vendor.
We believe that our materials and services vendors have the capacity to meet additional demand should we require it.
Impact of Section 232 of the Trade Expansion Act of 1962 (“Section 232”)
On March 8, 2018, the President of the United States issued two proclamations imposing tariffs on imports of certain steel and aluminum products, effective March 23, 2018. The decision was made in response to the Department of Commerce’s findings and recommendations in its reports of its investigations into the impact of imported steel and aluminum on the national security of the United States pursuant to Section 232. Specifically, the President has imposed a 25% global tariff on certain imported steel mill products and a 10% global tariff on certain imported aluminum products from all countries except Canada and Mexico. The tariffs could cause the cost of raw materials to increase, although the impact to us of Section 232 remains uncertain.
Customers
We serve over 200 customers representing major independent and other oil and gas companies with operations in the key U.S. oil and gas producing basins including the Permian, Marcellus Shale/Utica, the SCOOP/STACK, the Eagle Ford, the Bakken and other active oil and gas basins, as well as in Australia. For the year ended December 31, 2017, Pioneer Natural Resources represented 11% of our total revenue and no other customer represented 10% or more of our total revenue. For each of the years ended December 31, 2016 and 2015, Devon Energy Corporation represented 12% of our total revenue, and no other customer represented 10% or more of our total revenue.
Manufacturing
Our manufacturing and production facilities are located in Bossier City, Louisiana and Suzhou, China. While both facilities can produce our full range of products, our Bossier City facility has advanced capabilities and is designed to support time‑sensitive and rapid turnaround orders, while China is optimized for longer lead time orders and outsources its machining requirements. Both our U.S. and China facilities are API certified to the API 6A specification for both wellheads and valves and API Q1 and ISO9001:2015 quality management systems.
Our Bossier City facility is configured to provide rapid‑response production of made‑to‑order equipment. Where typical manufacturing facilities are designed to run in batches with different machining processes occurring in stages, this facility uses highly‑capable computer numeric control (“CNC”) machines to perform substantially all machining of the product in a single step. We believe eliminating the setup and queue times between machining processes allows us to offer significantly shorter order‑to‑delivery time for equipment than our competitors, albeit at higher costs than China. Responsiveness to urgent needs strengthens our relationship with key customers.
5
Our Bossier City manufacturing facility also functions as a repair and testing facility with its API 6A PSL3 certification and full QA/QC department. The facility also has the ability to perform hydrostatic testing, phosphate and oiling, copper coating and frac valve remanufacturing.
Our production facility in China is configured to efficiently produce our range of pressure control products and components for less time‑sensitive, higher‑volume orders. All employees in our Suzhou facility are Cactus employees, which we believe is a key factor in ensuring high quality. Our Suzhou facility currently assembles and tests some machined components before shipment to the United States or Australia.
Trademarks and Other Intellectual Property
Trademarks are important to the marketing of our products. We consider the Cactus Wellhead trademark to be important to our business as a whole. Additionally, the SafeDrillTM trademark is complementary to our marketing efforts and brand recognition. These trademarks are registered in the United States.
We also rely on trade secret protection for our confidential and proprietary information. To protect our information, we customarily enter into confidentiality agreements with our employees and suppliers. There can be no assurance, however, that others will not independently obtain similar information or otherwise gain access to our trade secrets.
Cyclicality
We are substantially dependent on conditions in the oil and gas industry, including the level of exploration, development and production activity of, and the corresponding capital spending by, oil and natural gas companies. The level of exploration, development and production activity is directly affected by trends in oil and natural gas prices, which has historically been volatile, and by capital spending discipline imposed by customers.
Declines, as well as anticipated declines, in oil and gas prices could negatively affect the level of these activities and capital spending, which could adversely affect demand for our products and services and, in certain instances, result in the cancellation, modification or rescheduling of existing and expected orders and the ability of our customers to pay us for our products and services. These factors could have an adverse effect on our revenue and profitability.
Seasonality
Our business is not significantly impacted by seasonality, although our fourth quarter has historically been impacted by holidays and our clients’ budget cycles.
Environmental, Health and Safety Regulation
Our operations are subject to domestic (including U.S. federal, state and local) and international regulations with regard to air, land and water quality and other environmental matters. We believe we are in substantial compliance with these regulations. Laws and regulations to minimize and mitigate risks to the environment and to workplace safety continue to be enacted. Changes in standards of enforcement of existing regulations, as well as the enactment and enforcement of new legislation, may require us and our customers to modify, supplement or replace equipment or facilities or to change or discontinue present methods of operation. Our environmental compliance expenditures, our capital costs for environmental control equipment, and the market for our products may change accordingly.
Hazardous Substances and Waste. The Resource Conservation and Recovery Act (“RCRA”) and comparable state statutes, regulate the generation, transportation, treatment, storage, disposal and cleanup of hazardous and non‑hazardous wastes. Under the auspices of the Environmental Protection Agency (“EPA”), the individual states
6
administer some or all of the provisions of RCRA, sometimes in conjunction with their own, more stringent requirements. We are required to manage the transportation, storage and disposal of hazardous and non‑hazardous wastes generated by our operations in compliance with applicable laws, including RCRA.
The Comprehensive Environmental Response, Compensation, and Liability Act (“CERCLA”), also known as the Superfund law, imposes joint and several liability, without regard to fault or legality of conduct, on classes of persons who are considered to be responsible for the release of a hazardous substance into the environment. These persons include the current and former owner or operator of the site where the release occurred, and anyone who disposed of or arranged for the disposal of a hazardous substance released at the site. We currently own, lease, or operate numerous properties used for manufacturing and other operations. We also contract with waste removal services and landfills. In the event of a release from these properties, under CERCLA, RCRA and analogous state laws, we could be required to remove substances and wastes, remediate contaminated property, or perform remedial operations to prevent future contamination even if the releases are not from our operations. In addition, neighboring landowners and other third parties may also file claims for personal injury and property damage allegedly caused by releases into the environment. Any obligations to undertake remedial operations in the future may increase our cost of doing business and may have a material adverse effect on our results of operations and financial condition.
Water Discharges. The Federal Water Pollution Control Act (the “Clean Water Act”) and analogous state laws restrict and control the discharge of pollutants into waters of the United States. Discharges to water associated with our operations require appropriate permits from state agencies and may add material costs to our operations. The adoption of more stringent criteria in the future may also increase our costs of operation. The Clean Water Act and analogous state laws provide for administrative, civil and criminal penalties for unauthorized discharges and, together with the Oil Pollution Act of 1990, impose rigorous requirements for spill prevention and response planning, as well as substantial potential liability for the costs of removal, remediation, and damages in connection with any unauthorized discharges. In addition, in 2015 the EPA and U.S. Army Corps of Engineers (“Corps”) finalized a rule that expanded the scope of waters subject to Clean Water Act jurisdiction. If implemented, this rule may have a material adverse effect on the operation costs of customers, thereby potentially reducing demand for our products. The rule was stayed nationwide in late 2015, however, and the EPA and the Corps have proposed to repeal the rule and reinstate the pre‑2015 rule. In a separate rulemaking, the EPA and the Corps have also proposed to delay the implementation of the 2015 rule until 2019. Neither of these proposals has been finalized and the rule remains stayed by the Sixth Circuit.
Employee Health and Safety. We are subject to a number of federal and state laws and regulations, including OSHA and comparable state statutes, establishing requirements to protect the health and safety of workers. In addition, the OSHA hazard communication standard, the EPA community right‑to‑know regulations under Title III of the federal Superfund Amendment and Reauthorization Act and comparable state statutes require that information be maintained concerning hazardous materials used or produced in our operations and that this information be provided to employees, state and local government authorities and the public. Substantial fines and penalties can be imposed and orders or injunctions limiting or prohibiting certain operations may be issued in connection with any failure to comply with laws and regulations relating to worker health and safety.
API Certifications. Our manufacturing facility and our production facility are currently certified by the API as being in compliance with API 6A specification for both wellheads and valves and API Q1 and ISO9001:2015 quality management systems. These standards have also been incorporated into regulations adopted by the Bureau of Safety and Environmental Enforcement (“BSEE”) that apply to the oil and gas industries that operate on the outer continental shelf. API’s standards are subject to revision, however, and there is no guarantee that future amendments or substantive changes to the standards would not require us to modify our operations or manufacturing processes to meet the new standards. Doing so may materially affect our operation costs. We also cannot guarantee that changes to the standards would not lead to the rescission of our licenses should we be unable to make the changes necessary to meet the new standards. Furthermore, these facilities are subjected to annual audits by the API. Loss of our API licenses could materially affect demand for these products.
7
Climate Change. International, national and state governments and agencies are currently evaluating and/or promulgating legislation and regulations that are focused on restricting emissions commonly referred to as greenhouse gas (“GHG”) emissions. These regulatory measures include, among others, adoption of cap and trade regimes, carbon taxes, increased efficiency standards and incentives or mandates for renewable energy. Consideration of further legislation or regulation may be impacted by the Paris Agreement, which was announced by the Parties to the United Nations Framework Convention on Climate Change in December 2015 and which calls on signatories to set progressive GHG emission reduction goals. Although the United States became a party to the Paris Agreement in April 2016, the Trump administration announced in June 2017 its intention to either withdraw from the Agreement or renegotiate more favorable terms. However, the Paris Agreement stipulates that participating countries must wait four years before withdrawing from the agreement. Despite the planned withdrawal, certain U.S. city and state governments have announced their intention to satisfy their proportionate obligations under the Paris Agreement. These commitments could further reduce demand and prices for fossil fuels produced by our customers. In the United States, the EPA has made findings under the Clean Air Act that GHG emissions endanger public health and the environment, resulting in the EPA’s adoption of regulations requiring construction and operating permit reviews of both existing and new stationary sources with major emissions of GHGs, which reviews require the installation of new GHG emission control technologies. However, in October 2017, the EPA announced a proposal to repeal its regulation of GHG emissions from existing stationary sources. The EPA has also promulgated rules requiring the monitoring and annual reporting of GHG emissions from certain sources, including onshore and offshore oil and natural gas production facilities and onshore oil and natural gas processing, transmission, storage and distribution facilities. In addition, in May 2016, the EPA finalized a rule that set additional emissions limits for volatile organic compounds and established new methane emission standards for certain new, modified or reconstructed equipment and processes in the oil and natural gas source category, including production, processing, transmission and storage activities. In June 2017, the EPA issued an administrative stay of key provisions of the rule, but was promptly ordered by the D.C. Circuit to implement the rule. The EPA also published proposed 60‑day and two‑year stays of certain provisions in June 2017 and published a Notice of Data Availability in November 2017 seeking comment and providing clarification regarding the agency’s legal authority to stay the rule.
It is too early to determine whether, or in what form, further regulatory action regarding greenhouse gas emissions will be adopted or what specific impact a new regulatory action might have on us or our customers. Generally, the anticipated regulatory actions do not appear to affect us in any material respect that is different, or to any materially greater or lesser extent, than other companies that are our competitors. However, to the extent our customers are subject to these or other similar proposed or newly enacted laws and regulations, the additional costs incurred by our customers to comply with such laws and regulations could impact their ability or desire to continue to operate at current or anticipated levels, which would negatively impact their demand for our products and services. In addition, any new laws or regulations establishing cap‑and‑trade or that favor the increased use of non‑fossil fuels may dampen demand for oil and gas production and lead to lower spending by our customers for our products and services. Similarly, to the extent we are or become subject to any of these or other similar proposed or newly enacted laws and regulations, we expect that our efforts to monitor, report and comply with such laws and regulations, and any related taxes imposed on companies by such programs, will increase our cost of doing business and may have a material adverse effect on our financial condition and results of operations. Moreover, any such regulations could ultimately restrict the exploration and production of fossil fuels, which could adversely affect demand for our products.
Hydraulic Fracturing. Many of our customers utilize hydraulic fracturing in their operations. Environmental concerns have been raised regarding the potential impact of hydraulic fracturing on underground water supplies. These concerns have led to several regulatory and governmental initiatives in the United States to restrict the hydraulic fracturing process, which could have an adverse impact on our customers’ completions or production activities. For example, in December 2016, the EPA released its final report on the potential impacts of hydraulic fracturing on drinking water resources, concluding that “water cycle” activities associated with hydraulic fracturing may impact drinking water resources “under some circumstances,” including water withdrawals for fracturing in times or areas of low water availability; surface spills during the management of fracturing fluids, chemicals or produced water; injection of fracturing fluids into wells with inadequate mechanical integrity; injection of fracturing fluids directly into
8
groundwater resources; discharge of inadequately treated fracturing wastewater to surface waters; and disposal or storage of fracturing wastewater in unlined pits. In other examples, the EPA has issued final regulations under the U.S. Clean Air Act governing performance standards, including standards for the capture of air emissions released during hydraulic fracturing, though the EPA is currently reconsidering these standards, and published in June 2016 a final rule prohibiting the discharge of wastewater from hydraulic fracturing operations to publicly owned wastewater treatment plants. Also, the U.S. Bureau of Land Management finalized rules in March 2015 that imposed new or more stringent standards for performing hydraulic fracturing on federal and American Indian lands. While the agency subsequently published a final rule rescinding the 2015 rule in December 2017, this decision could be subject to legal challenge. In addition, in some instances, states and local governments have enacted more stringent hydraulic fracturing restrictions or bans on hydraulic fracturing activities. These and other similar state and foreign regulatory initiatives, if adopted, would establish additional levels of regulation for our customers that could make it more difficult for our customers to complete natural gas and oil wells and could adversely affect the demand for our equipment and services, which, in turn, could adversely affect our results of operations, financial condition and cash flows.
State and federal regulatory agencies have also recently focused on a possible connection between the operation of injection wells used for oil and gas waste disposal and seismic activity. Similar concerns have been raised that hydraulic fracturing may also contribute to seismic activity. When caused by human activity, such events are called induced seismicity. Developing research suggests that the link between seismic activity and wastewater disposal may vary by region, and that only a very small fraction of the tens of thousands of injection wells have been suspected to be, or have been, the likely cause of induced seismicity. In March 2016, the United States Geological Survey identified six states with the most significant hazards from induced seismicity, including Oklahoma, Kansas, Texas, Colorado, New Mexico, and Arkansas. In light of these concerns, some state regulatory agencies have modified their regulations or issued orders to address induced seismicity. Increased regulation and attention given to induced seismicity could lead to greater opposition to, and litigation concerning, oil and gas activities utilizing hydraulic fracturing or injection wells for waste disposal, which could indirectly impact our business, financial condition and results of operations. In addition, these concerns may give rise to private tort suits from individuals who claim they are adversely impacted by seismic activity they allege was induced. Such claims or actions could result in liability for property damage, exposure to waste and other hazardous materials, nuisance or personal injuries, and require our customers to expend additional resources or incur substantial costs or losses. This could in turn adversely affect the demand for our products.
Although we do not conduct hydraulic fracturing, increased regulation and attention given to the hydraulic fracturing process could lead to greater opposition to oil and gas production activities using hydraulic fracturing techniques. In addition, the adoption of new laws or regulations at the federal, state, local or foreign level imposing reporting obligations on, or otherwise limiting, delaying or banning, the hydraulic fracturing process or other processes on which hydraulic fracturing relies, such as water disposal, could make it more difficult to complete oil and natural gas wells, increase our customers’ costs of compliance and doing business, and otherwise adversely affect the hydraulic fracturing services they perform, which could negatively impact demand for our products.
Offshore Drilling. Various new regulations intended to improve offshore safety systems and environmental protection have been issued since 2010 that have increased the complexity of the drilling permit process and may limit the opportunity for some operators to continue deepwater drilling in the U.S. Gulf of Mexico, which could have an adverse impact on our customers’ activities. For example, in April 2016, BSEE published a final blowout preventer systems and well control rule that focuses on blowout preventer requirements and includes reforms in well design, well control, casing, cementing, real‑time well monitoring and subsea containment. Additionally, in July 2016, the Bureau of Ocean Energy Management issued a notice to lessees (“NTL”), effective September 30, 2016, setting out new financial assurance requirements for offshore leases intended to ensure that leaseholders will be able to cover the costs of decommissioning. In January 2017, the Bureau extended the NTL implementation timeline for certain leases by an additional six months. In May 2017, the Bureau began a review of the NTL to determine whether it should be implemented. If these new financial assurance requirements remain in place, they may increase our customers’ operating costs and impact our customers’ ability to obtain leases, thereby reducing demand for our products. Additional regulation includes a third‑party certification requirement promulgated by the Bureau of Safety and Environmental
9
Enforcement (“BSEE”) in September 2016 under which offshore operators must certify through an independent third party that their critical safety and pollution prevention equipment is operational and will function as designed in the most extreme conditions. However, the BSEE published a proposed rule in December 2017 to rescind this requirement, allowing equipment to demonstrate its adequacy through various industry standards, such as those established by the API. Third‑party challenges to industry operations in the U.S. Gulf of Mexico may also serve to further delay or restrict activities. Although our operations are predominately onshore, if the new regulations, policies, operating procedures and possibility of increased legal liability are viewed by our current or future customers as a significant impairment to expected profitability on projects or an unjustifiable increase in risk, they could discontinue or curtail their offshore operations, thereby adversely affecting the demand for our equipment and services, which, in turn could adversely affect our results of operations, financial condition and cash flows.
Chinese Environmental Law. As we have manufacturing operations in the People’s Republic of China (“PRC”), we are regulated by various PRC national and local environmental protection laws, regulations and policies. Chinese PRC environmental laws and regulations include national and local standards governing activities that may impact human health and the environment. These laws and regulations set standards for emissions control, discharges to surface and subsurface water, and the generation, handling, storage, transportation, treatment and disposal of waste materials. Although we believe that our operations are in substantial compliance with current environmental laws and regulations, we may not be able to comply with these regulations at all times as the PRC environmental legal regime is evolving and becoming more stringent. Therefore, if the PRC government imposes more stringent regulations in the future, we will have to incur additional and potentially substantial costs and expenses to comply with new regulations, which may negatively affect our results of operations. If we fail to comply with any of the present or future environmental regulations in any material aspects, we may suffer from negative publicity and may be required to pay substantial fines, suspend or even cease operations.
Companies must register or file an environmental impact report with the appropriate environmental bureau before starting construction or any major expansion or renovation of a new production facility. Before commencing operations, the agency must inspect the new or renovated facility and determine that all necessary equipment has been installed as required by applicable environmental protection requirements.
Chinese PRC authorities have the power to issue fines and penalties for non‑compliance and can also require violators to cease operations until compliance has been restored. We cannot currently predict the extent of future capital expenditures, if any, required for compliance with environmental laws and regulations, which may include expenditures for environmental control facilities.
Insurance and Risk Management
We provide products and systems to customers involved in oil and gas exploration, development and production. We also provide parts, repair services and field services associated with installation at all of our facilities and service centers in the United States and at our facility in Australia, as well as at customer sites. Our operations are subject to hazards inherent in the oil and natural gas industry, including accidents, blowouts, explosions, cratering, fires, oil spills and hazardous materials spills. These conditions can cause personal injury or loss of life, damage to or destruction of property, equipment, the environment and wildlife, and interruption or suspension of operations, among other adverse effects. In addition, claims for loss of oil and natural gas production and damage to formations can occur. If a serious accident were to occur at a location where our equipment and services are being used, it could result in our being named as a defendant to lawsuits asserting significant claims.
We have suffered accidents in the past, and we anticipate that we could experience accidents in the future. In addition to the property and personal losses from these accidents, the frequency and severity of these incidents affect our operating costs and insurability, as well as our relationships with customers, employees and regulatory agencies. Any significant increase in the frequency or severity of these incidents, or the general level of compensation awards, could
10
adversely affect the cost of, or our ability to obtain, workers’ compensation and other forms of insurance and could have other adverse effects on our results of operations and financial condition.
We rely on customer indemnifications and third‑party insurance as part of our risk mitigation strategy. However, our customers may be unable to satisfy indemnification claims against them. In addition, we indemnify our customers against certain claims and liabilities resulting or arising from our provision of goods or services to them. Our insurance may not be sufficient to cover any particular loss or may not cover all losses. We carry a variety of insurance coverages for our operations, and we are partially self‑insured for certain claims, in amounts that we believe to be customary and reasonable. Historically, insurance rates have been subject to various market fluctuations that may result in less coverage, increased premium costs, or higher deductibles or self‑insured retentions.
Our insurance includes coverage for commercial general liability, damage to our real and personal property, damage to our mobile equipment, sudden and accidental pollution liability, workers’ compensation and employer’s liability, auto liability, foreign package policy, excess liability, and directors and officers insurance. Our insurance includes various limits and deductibles or self‑insured retentions, which must be met prior to, or in conjunction with, recovery. To cover potential pollution risks, our commercial general liability policy is endorsed with sudden and accidental coverage and our excess liability policies provide additional limits of liability for covered sudden and accidental pollution losses.
Employees
As of December 31, 2017, we employed over 880 people. Our future success will depend partially on our ability to attract, retain and motivate qualified personnel. We are not a party to any collective bargaining agreements and have not experienced any strikes or work stoppages. We consider our relations with our employees to be satisfactory.
Facilities
Our corporate headquarters is located in Houston, Texas. Please see “Item 2. Properties” for information with respect to our other facilities. We believe that our facilities are adequate for our current operations.
Competition
The markets in which we operate are highly competitive. We believe that we are one of the largest suppliers of wellheads in the United States. We compete with divisions of Schlumberger, Baker Hughes a GE company, Weir and TechnipFMC as well as with a number of smaller companies. We believe that the wellhead market is relatively concentrated, with Cactus, Schlumberger and Baker Hughes representing over 50% of the market. Similar to Cactus, each of Schlumberger, Baker Hughes and TechnipFMC manufacture their own engineered products.
We believe that the rental market for frac stacks and related flow control equipment is more fragmented than the wellhead product market. Cactus does not believe that any individual company represents more than 10% of the market. As is the case in the wellhead market, Cactus, Schlumberger, Baker Hughes and TechnipFMC rent internally engineered and manufactured products. Other competitors generally rent foreign designed and manufactured generic products.
We believe that the principal competitive factors in the markets we serve are technical features, equipment availability, work force competency, efficiency, safety record, reputation, experience and price. Additionally, projects are often awarded on a bid basis, which tends to create a highly competitive environment. While we seek to be competitive in our pricing, we believe many of our customers elect to work with us based on product features, safety, performance and quality of our crews, equipment and services. We seek to differentiate ourselves from our competitors
11
by delivering the highest‑quality services and equipment possible, coupled with superior execution and operating efficiency in a safe working environment.
Available Information
We are required to file annual, quarterly and current reports, proxy statements and certain other information with the SEC. Any documents filed by us with the SEC may be inspected without charge at the SEC’s Public Reference Room at 100 F Street, N.E., Washington, D.C. 20549. Copies of these materials may be obtained from such office upon payment of a duplicating fee. Please call the SEC at 1‑800‑SEC‑0330 for further information on the operation of the Public Reference Room.
The SEC maintains a website at www.sec.gov that contains reports, proxy and information statements and other information regarding registrants that file electronically with the SEC. Any documents filed by us with the SEC, including this Annual Report, can be downloaded from the SEC’s website.
Our principal executive offices are located at Cobalt Center, 920 Memorial City Way, Suite 300, Houston, TX 77024, and our telephone number at that address is (713) 626‑8800. Our website address is www.CactusWHD.com. Our periodic reports and other information filed with or furnished to the SEC are available, free of charge, through our website, as soon as reasonably practicable after those reports and other information are electronically filed with or furnished to the SEC. Information on our website or any other website is not incorporated by reference into this Annual Report and does not constitute a part of this Annual Report.
Investing in our Class A Common Stock involves risks. You should carefully consider the information in this Annual Report, including the matters addressed under “Cautionary Note Regarding Forward‑Looking Statements,” and the following risks before making an investment decision. Our business, financial condition, prospects and results of operations could be materially and adversely affected by any of these risks. Additional risks or uncertainties not currently known to us, or that we deem immaterial, may also have an effect on our business, financial condition, prospects or results of operations. The trading price of our Class A Common Stock could decline due to any of these risks, and you may lose all or part of your investment.
Risks Related to the Oilfield Services Industry and Our Business
Demand for our products and services depends on oil and gas industry activity and expenditure levels, which are directly affected by trends in the demand for and price of crude oil and natural gas.
Demand for our products and services depends primarily upon the general level of activity in the oil and gas industry, including the number of drilling rigs in operation, the number of oil and gas wells being drilled, the depth and drilling conditions of these wells, the volume of production, the number of well completions and the level of well remediation activity, and the corresponding capital spending by oil and natural gas companies. Oil and gas activity is in turn heavily influenced by, among other factors, oil and gas prices worldwide, which have historically been volatile.
Declines, as well as anticipated declines, in oil and gas prices could negatively affect the level of these activities and capital spending, which could adversely affect demand for our products and services and, in certain instances, result in the cancellation, modification or rescheduling of existing and expected orders and the ability of our customers to pay us for our products and services. These factors could have an adverse effect on our revenue and profitability.
12
Factors affecting the prices of oil and natural gas include, but are not limited to, the following:
|
· |
demand for hydrocarbons, which is affected by worldwide population growth, economic growth rates and general economic and business conditions; |
|
· |
changes in sentiment on environmental matters; |
|
· |
costs of exploring for, producing and delivering oil and natural gas; |
|
· |
political and economic uncertainty and sociopolitical unrest; |
|
· |
available excess production capacity within the Organization of Petroleum Exporting Countries (“OPEC”) and the level of oil and gas production by non‑OPEC countries; |
|
· |
oil refining capacity and shifts in end‑customer preferences toward fuel efficiency and the use of natural gas; |
|
· |
technological advances affecting energy consumption; |
|
· |
potential acceleration of the development of alternative fuels; |
|
· |
access to capital and credit markets, which may affect our customers’ activity levels and spending for our products and services; |
|
· |
the relative strength of the U.S. dollar; |
|
· |
changes in laws and regulations related to hydraulic fracturing activities; |
|
· |
changes in environmental laws and regulations (including relating to the use of coal in power plants); and |
|
· |
natural disasters. |
The oil and gas industry has historically experienced periodic downturns, which have been characterized by diminished demand for oilfield services and downward pressure on the prices we charge. The last downturn in the oil and gas industry that began in mid‑2014 resulted in a reduction in demand for oilfield services and adversely affected our financial condition, results of operations and cash flows. Any future downturn or expected downturn could again adversely affect our results of operations, financial condition and cash flows.
The cyclicality of the oil and natural gas industry may cause our operating results to fluctuate.
We derive our revenues from companies in the oil and natural gas exploration and production industry, a historically cyclical industry with levels of activity that are significantly affected by the levels and volatility of oil and natural gas prices. We have experienced and may in the future experience significant fluctuations in operating results as a result of the reactions of our customers to changes in oil and natural gas prices. For example, prolonged low commodity prices during 2015 and 2016, combined with adverse changes in the capital and credit markets, caused many exploration and production companies to reduce their capital budgets and drilling activity. This resulted in a significant decline in demand for oilfield services and adversely impacted the prices we could charge, particularly for rentals of frac equipment.
13
If oil prices or natural gas prices decline, the demand for our products and services could be adversely affected.
The demand for our products and services is primarily determined by current and anticipated oil and natural gas prices and the level of drilling activity and related general production spending in the areas in which we have operations. Volatility or weakness in oil prices or natural gas prices (or the perception that oil prices or natural gas prices will decrease) affects the spending patterns of our customers and may result in the drilling of fewer new wells or lower production spending on existing wells. When this occurs, exploration and production (“E&P”) companies move to significantly cut costs, both by decreasing drilling and completions activity and by demanding price concessions from their service providers. This results in lower demand for our products and services and may cause lower rates and lower utilization of our equipment. If oil prices decline or natural gas prices continue to remain low or decline further, or if there is a reduction in drilling activities, the demand for our products and services and our results of operations could be materially and adversely affected.
Additionally, the commercial development of economically viable alternative energy sources (such as wind, solar, geothermal, tidal, fuel cells and biofuels) could reduce demand for our products and services and create downward pressure on the revenue we are able to derive from such products and services, as they are dependent on oil and natural gas prices.
Anticipated growth in U.S. drilling and completions activity, and our ability to benefit from such anticipated growth, could be adversely affected by any significant constraints in pressure pumping capacity in the industry.
Growth in U.S. drilling and completions activity may be impacted by, among other things, pressure pumping capacity and pricing, which, in turn, is impacted by, among other things, the availability of fracturing equipment, demand for fracturing equipment and fracturing intensity per active rig. Also, longer laterals and higher intensity fracturing result in greater wear and tear to the industry’s fracturing equipment, which has caused and will continue to cause attrition in the supply of fracturing equipment and shortages in the availability of pressure pumping services. In addition, rising fracturing intensity per rig and an overall increase in completions activity has increased the demand for fracturing equipment. During the completion phase of a well, we rent frac stacks, zipper manifolds and other high‑pressure equipment used during the hydraulic fracturing process. For the subsequent production phase of a well, we sell production trees, which are installed on the wellhead after the frac tree has been removed. Any significant additional constraints in the availability of pressure pumping services, fracturing equipment or the ability of fracturing service providers to deliver fracturing services would have an adverse impact on the demand for the products we sell and rent, which could have a material adverse effect on our business, results of operations, financial condition and cash flows.
We design, manufacture, sell, rent and install equipment that is used in oil and gas exploration and production activities, which may subject us to liability, including claims for personal injury, property damage and environmental contamination should such equipment fail to perform to specifications.
We provide products and systems to customers involved in oil and gas exploration, development and production. Some of our equipment is designed to operate in high‑temperature and/or high‑pressure environments, and some equipment is designed for use in hydraulic fracturing operations. We also provide parts, repair services and field services associated with installation at all of our facilities and service centers in the United States and at our facility in Australia, as well as at customer sites. Because of applications to which our products and services are exposed, particularly those involving high pressure environments, a failure of such equipment, or a failure of our customer to maintain or operate the equipment properly, could cause damage to the equipment, damage to the property of customers and others, personal injury and environmental contamination and could lead to a variety of claims against us that could have an adverse effect on our business and results of operations.
We indemnify our customers against certain claims and liabilities resulting or arising from our provision of goods or services to them. In addition, we rely on customer indemnifications, generally, and third‑party insurance as part
14
of our risk mitigation strategy. However, our insurance may not be adequate to cover our liabilities. In addition, our customers may be unable to satisfy indemnification claims against them. Further, insurance companies may refuse to honor their policies, or insurance may not generally be available in the future, or if available, premiums may not be commercially justifiable. We could incur substantial liabilities and damages that are either not covered by insurance or that are in excess of policy limits, or incur liability at a time when we are not able to obtain liability insurance. Such potential liabilities could have a material adverse effect on our business, results of operations, financial condition and cash flows.
We may be unable to employ a sufficient number of skilled and qualified workers to sustain or expand our current operations.
The delivery of our products and services requires personnel with specialized skills and experience. Our ability to be productive and profitable will depend upon our ability to attract and retain skilled workers. In addition, our ability to expand our operations depends in part on our ability to increase the size of our skilled labor force. The demand for skilled workers is high, the supply is limited, and the cost to attract and retain qualified personnel has increased. During industry downturns, skilled workers may leave the industry, reducing the availability of qualified workers when conditions improve. In addition, a significant increase in the wages paid by competing employers could result in increases in the wage rates that we must pay. If we are not able to employ and retain skilled workers, our ability to respond quickly to customer demands or strong market conditions may inhibit our growth, which could have a material adverse effect on our business, results of operations and financial condition.
Political, regulatory, economic and social disruptions in the countries in which we conduct business could adversely affect our business or results of operations.
In addition to our facilities in the United States, we operate one production facility in China and have a facility in Australia that sells and rents equipment as well as provides parts, repair services and field services associated with installation. Instability and unforeseen changes in any of the markets in which we conduct business could have an adverse effect on the demand for, or supply of, our products and services, our results of operations and our financial condition. These factors include, but are not limited to, the following:
|
· |
nationalization and expropriation; |
|
· |
potentially burdensome taxation; |
|
· |
inflationary and recessionary markets, including capital and equity markets; |
|
· |
civil unrest, labor issues, political instability, terrorist attacks, cyber‑terrorism, military activity and wars; |
|
· |
supply disruptions in key oil producing countries; |
|
· |
tariffs, trade restrictions, trade protection measures associated with Section 232 or price controls; |
|
· |
foreign ownership restrictions; |
|
· |
import or export licensing requirements; |
|
· |
restrictions on operations, trade practices, trade partners and investment decisions resulting from domestic and foreign laws and regulations; |
15
|
· |
changes in, and the administration of, laws and regulations; |
|
· |
inability to repatriate income or capital; |
|
· |
reductions in the availability of qualified personnel; |
|
· |
foreign currency fluctuations or currency restrictions; and |
|
· |
fluctuations in the interest rate component of forward foreign currency rates. |
We are dependent on a relatively small number of customers in a single industry. The loss of an important customer could adversely affect our results of operations and financial condition.
Our customers are engaged in the oil and natural gas E&P business primarily in the United States and Australia. Historically, we have been dependent on a relatively small number of customers for our revenues. For the year ended December 31, 2017, Pioneer Natural Resources represented 11% of our total revenue, and no other customer represented more than 10% of our total revenue. For each of the years ended December 31, 2016 and 2015, Devon Energy Corporation represented 12% of our total revenue, and no other customer represented more than 10% of our total revenue.
Our business, financial condition, prospects and results of operations could be materially adversely affected if an important customer ceases to engage us for our services on favorable terms or at all or fails to pay or delays in paying us significant amounts of our outstanding receivables.
Additionally, the E&P industry is characterized by frequent consolidation activity. Changes in ownership of our customers may result in the loss of, or reduction in, business from those customers, which could materially and adversely affect our business, results of operations and financial condition.
Customer credit risks could result in losses.
The concentration of our customers in the energy industry may impact our overall exposure to credit risk as customers may be similarly affected by changes in economic and industry conditions. In addition, laws in some jurisdictions outside of the U.S. in which we operate could make collection difficult or time consuming. We perform ongoing credit evaluations of our customers and do not generally require collateral in support of our trade receivables. While we maintain reserves for potential credit losses, we cannot assure such reserves will be sufficient to meet write‑offs of uncollectible receivables or that our losses from such receivables will be consistent with our expectations.
To the extent one or more of our key customers commences bankruptcy proceedings, our contracts with these customers may be subject to rejection under applicable provisions of the United States Bankruptcy Code, or may be renegotiated. Further, during any such bankruptcy proceeding, prior to assumption, rejection or renegotiation of such contracts, the bankruptcy court may temporarily authorize the payment of value for our services less than contractually required, which could also have a material adverse effect on our business, results of operations, financial condition and cash flows.
Delays in obtaining, or inability to obtain or renew, permits or authorizations by our customers for their operations could impair our business.
In most states, our customers are required to obtain permits or authorizations from one or more governmental agencies or other third parties to perform drilling and completions activities, including hydraulic fracturing. Such permits or approvals are typically required by state agencies but can also be required by federal and local governmental agencies
16
or other third parties. The requirements for such permits or authorizations vary depending on the location where such drilling and completions activities will be conducted. As with most permitting and authorization processes, there is a degree of uncertainty as to whether a permit will be granted, the time it will take for a permit or approval to be issued and the conditions which may be imposed in connection with the granting of the permit. In some jurisdictions, such as New York State and within the jurisdiction of the Delaware River Basin Commission, certain regulatory authorities have delayed or suspended the issuance of permits or authorizations while the potential environmental impacts associated with issuing such permits can be studied and appropriate mitigation measures evaluated. In Texas, rural water districts have begun to impose restrictions on water use and may require permits for water used in drilling and completions activities. Permitting, authorization or renewal delays, the inability to obtain new permits or the revocation of current permits could cause a loss of revenue and potentially have a materially adverse effect on our business, results of operations and financial condition.
We may lose money on fixed‑price contracts.
From time to time, we agree to provide products and services under relatively short term fixed‑price contracts. Under these contracts, we are typically responsible for cost overruns. Our actual costs and any gross profit realized on these fixed‑price contracts may vary from the estimated amounts on which these contracts were originally based. There is inherent risk in the estimation process, including significant unforeseen technical and logistical challenges or longer than expected deployment times in the case of rentals. Depending on the size of a project, variations from estimated contract performance could have an adverse impact on our results of operations, financial condition and cash flows.
Increased costs, or lack of availability, of raw materials and other components may result in increased operating expenses and adversely affect our results of operations and cash flows.
Our ability to source low cost raw materials and components, such as steel castings and forgings, is critical to our ability to manufacture and sell our products and provide our services competitively. Our results of operations may be adversely affected by our inability to manage the rising costs and availability of raw materials and components used in our wide variety of products and systems. We cannot assure that we will be able to continue to purchase these raw materials on a timely basis or at commercially viable prices, nor can we be certain of the impact of Section 232. Further, unexpected changes in the size of regional and/or product markets, particularly for short lead‑time products, could affect our results of operations and cash flows. Should our current suppliers be unable to provide the necessary raw materials or components or otherwise fail to deliver such materials and components timely and in the quantities required, resulting delays in the provision of products or services to our customers could have a material adverse effect on our business.
In accordance with Section 1502 of the Dodd‑Frank Act, the SEC’s rules regarding mandatory disclosure and reporting requirements by public companies of their use of “conflict minerals” (tantalum, tin, tungsten and gold) originating in the Democratic Republic of Congo and adjoining countries became effective in 2014. While the conflict minerals rule continues in effect as adopted, there remains uncertainty regarding how the conflict minerals rule, and our compliance obligations, will be affected in the future. Additional requirements under the rule could affect sourcing at competitive prices and availability in sufficient quantities of certain of the conflict minerals used in the manufacture of our products or in the provision of our services, which could have a material adverse effect on our ability to purchase these products in the future. The costs of compliance, including those related to supply chain research, the limited number of suppliers and possible changes in the sourcing of these minerals, could have a material adverse effect on our results of operations and cash flows.
Competition within the oilfield services industry may adversely affect our ability to market our services.
The oilfield services industry is highly competitive and fragmented and includes numerous small companies capable of competing effectively in our markets on a local basis, as well as several large companies that possess substantially greater financial and other resources than we do. The amount of equipment available may exceed demand,
17
which could result in active price competition. Many contracts are awarded on a bid basis, which may further increase competition based primarily on price. In addition, adverse market conditions lower demand for well servicing equipment, which results in excess equipment and lower utilization rates. If market conditions in our oil‑oriented operating areas were to deteriorate or if adverse market conditions in our natural gas‑oriented operating areas persist, utilization rates may decline. The competitive environment has intensified since late 2014 as a result of the industry downturn and oversupply of oilfield equipment and services. Any significant future increase in overall market capacity for the products, rental equipment or services that we offer could adversely affect our business and results of operations.
Our relationship with one of our vendors is important to us.
We obtain certain important materials and machining services from one of our vendors located in China. For the years ended December 31, 2017, 2016 and 2015, approximately $33.4 million, $10.8 million and $18.1 million of purchases of machined components were made from this vendor, representing approximately 22%, 20% and 27%, respectively, of our total third party vendor purchases of raw materials, finished products, equipment, machining and other services. If we are not able to maintain our relationship with such vendor, our results of operations could be adversely impacted until we are able to find an alternative vendor.
Conservation measures and technological advances could reduce demand for oil and natural gas and our services.
Fuel conservation measures, alternative fuel requirements, increasing consumer demand for alternatives to oil and natural gas, technological advances in fuel economy and energy generation devices could reduce demand for oil and natural gas, resulting in reduced demand for oilfield services. The impact of the changing demand for oil and natural gas services and products may have a material adverse effect on our business, results of operations, financial condition and cash flows.
Indebtedness and liquidity needs could restrict our operations and make us more vulnerable to adverse economic conditions.
Indebtedness we may incur in the future, whether incurred in connection with acquisitions, operations or otherwise, may adversely affect our operations and limit our growth, and we may have difficulty making debt service payments on such indebtedness as payments become due. Our level of indebtedness may affect our operations in several ways, including the following:
|
· |
increasing our vulnerability to general adverse economic and industry conditions should our business fail to generate sufficient cash flow to meet our debt obligations; |
|
· |
limiting our ability to borrow funds, dispose of assets, pay dividends and make certain investments due to the covenants that are contained in the agreements governing our indebtedness; |
|
· |
affecting our flexibility in planning for, and reacting to, changes in the economy and in our industry; |
|
· |
causing an event of default resulting from any failure to comply with the financial or other covenants of our debt, including covenants that impose requirements to maintain certain financial ratios; and |
|
· |
impairing our ability to obtain additional financing in the future for working capital, capital expenditures, acquisitions or other general corporate purposes. |
18
We are subject to foreign currency fluctuation risk.
We outsource certain of our wellhead equipment to suppliers in China, and our production facility in China assembles and tests these outsourced components, as we do not engage in machining operations in this facility. In addition, we have a service center in Australia that sells products, rents frac equipment and provides field services. To the extent either facility has net U.S. dollar denominated assets, our profitability is eroded when the U.S. dollar weakens against the Chinese Yuan and the Australian dollar. Our production facility in China generally has net U.S. dollar denominated assets, while our service center in Australia generally has net U.S. dollar denominated liabilities. The U.S. dollar translated profits and net assets of our facilities in China and Australia are eroded if the respective local currency value weakens against the U.S. dollar. We have not entered into any derivative arrangements to protect against fluctuations in currency exchange rates.
New technology may cause us to become less competitive.
The oilfield services industry is subject to the introduction of new drilling and completions techniques and services using new technologies, some of which may be subject to patent or other intellectual property protections. Although we believe our equipment and processes currently give us a competitive advantage, as competitors and others use or develop new or comparable technologies in the future, we may lose market share or be placed at a competitive disadvantage. Further, we may face competitive pressure to develop, implement or acquire certain new technologies at a substantial cost. Some of our competitors have greater financial, technical and personnel resources that may allow them to enjoy various competitive advantages in the development and implementation of new technologies. We cannot be certain that we will be able to continue to develop and implement new technologies or products. Limits on our ability to develop, effectively use and implement new and emerging technologies may have a material adverse effect on our business, results of operations and financial condition, including the reduction in the value of assets replaced by new technologies.
A failure of our information technology infrastructure could adversely impact us.
We depend on our information technology (“IT”) systems for the efficient operation of our business. Accordingly, we rely upon the capacity, reliability and security of our IT hardware and software infrastructure and our ability to expand and update this infrastructure in response to our changing needs. Despite our implementation of security measures, our systems are vulnerable to damages from computer viruses, natural disasters, incursions by intruders or hackers, failures in hardware or software, power fluctuations, cyber terrorists and other similar disruptions. Additionally, we rely on third parties to support the operation of our IT hardware and software infrastructure, and in certain instances, utilize web‑based applications. Although no such material incidents have occurred to date, the failure of our IT systems or those of our vendors to perform as anticipated for any reason or any significant breach of security could disrupt our business and result in numerous adverse consequences, including reduced effectiveness and efficiency of operations, inappropriate disclosure of confidential and proprietary information, reputational harm, increased overhead costs and loss of important information, which could have a material adverse effect on our business and results of operations. In addition, we may be required to incur significant costs to protect against damage caused by these disruptions or security breaches in the future.
Our business is dependent on the continuing services of certain of our key managers and employees.
We depend on key personnel. The loss of key personnel could adversely impact our business if we are unable to implement certain strategies or transactions in their absence. The loss of qualified employees or an inability to retain and motivate additional highly‑skilled employees required for the operation and expansion of our business could hinder our ability to successfully maintain and expand our market share.
19
Equity interests in us are a substantial portion of the net worth of our executive officers and several of our other senior managers. Following the completion of the IPO, those executive officers and other senior managers have increased liquidity with respect to their equity interests in us. As a result, those executive officers and senior managers may have less incentive to remain employed by us. After terminating their employment with us, some of them may become employed by our competitors.
Adverse weather conditions could impact demand for our services or materially impact our costs.
Our business could be materially adversely affected by adverse weather conditions. For example, unusually warm winters could adversely affect the demand for our products and services by decreasing the demand for natural gas or unusually cold winters could adversely affect our ability to perform our services due to delays in the delivery of products that we need to provide our services. Our operations in arid regions can be affected by droughts and limited access to water used in hydraulic fracturing operations. Adverse weather can also directly impede our own operations. Repercussions of adverse weather conditions may include:
|
· |
curtailment of services; |
|
· |
weather‑related damage to infrastructure, transportation, facilities and equipment, resulting in delays in operations; |
|
· |
inability to deliver equipment, personnel and products to job sites in accordance with contract schedules; and |
|
· |
loss of productivity. |
Competition among oilfield service and equipment providers is affected by each provider’s reputation for safety and quality.
Our activities are subject to a wide range of national, state and local occupational health and safety laws and regulations. In addition, customers maintain their own compliance and reporting requirements. Failure to comply with these health and safety laws and regulations, or failure to comply with our customers’ compliance or reporting requirements, could tarnish our reputation for safety and quality and have a material adverse effect on our competitive position.
Our operations require us to comply with various domestic and international regulations, violations of which could have a material adverse effect on our results of operations, financial condition and cash flows.
We are exposed to a variety of federal, state, local and international laws and regulations relating to matters such as environmental, workplace, health and safety, labor and employment, customs and tariffs, export and reexport controls, economic sanctions, currency exchange, bribery and corruption and taxation. These laws and regulations are complex, frequently change and have tended to become more stringent over time. They may be adopted, enacted, amended, enforced or interpreted in such a manner that the incremental cost of compliance could adversely impact our results of operations, financial condition and cash flows.
Our operations outside of the United States require us to comply with numerous anti‑bribery and anti‑corruption regulations. The U.S. Foreign Corrupt Practices Act (“FCPA”), among others, applies to us and our operations. Our policies, procedures and programs may not always protect us from reckless or criminal acts committed by our employees or agents, and severe criminal or civil sanctions may be imposed as a result of violations of these laws. We are also subject to the risks that our employees and agents outside of the United States may fail to comply with applicable laws.
20
In addition, we import raw materials, semi‑finished goods, and finished products into the United States, China and Australia for use in such countries or for manufacturing and/or finishing for re‑export and import into another country for use or further integration into equipment or systems. Most movement of raw materials, semi‑finished or finished products involves imports and exports. As a result, compliance with multiple trade sanctions, embargoes and import/export laws and regulations pose a constant challenge and risk to us since a portion of our business is conducted outside of the United States through our subsidiaries. Our failure to comply with these laws and regulations could materially affect our reputation, results of operations and financial condition.
Compliance with environmental laws and regulations may adversely affect our business and results of operations.
Environmental laws and regulations in the United States and foreign countries affect the equipment, systems and services we design, market and sell, as well as the facilities where we manufacture and produce our equipment and systems in the United States and China, and opportunities our customers pursue that create demand for our products. For example, we may be affected by such laws as the Resource Conservation and Recovery Act (“RCRA”), the Comprehensive Environmental Response, Compensation, and Liability Act (“CERCLA”), the Clean Water Act, and the Occupational Safety and Health Act (“OSHA”) of 1970. Further, our customers may be subject to a range of laws and regulations governing hydraulic fracturing, offshore drilling, and greenhouse gas emissions.
We are required to invest financial and managerial resources to comply with environmental laws and regulations and believe that we will continue to be required to do so in the future. Failure to comply with these laws and regulations may result in the assessment of administrative, civil and criminal penalties, the imposition of remedial obligations, or the issuance of orders enjoining operations. These laws and regulations, as well as the adoption of other new laws and regulations affecting exploration and production of crude oil and natural gas by our customers, could adversely affect our business and operating results by increasing our costs, limiting the demand for our products and services or restricting our operations. Increased regulation or a move away from the use of fossil fuels caused by additional regulation could also reduce demand for our products and services. For additional information, please see “Item 1. Business—Environmental, Health and Safety Regulation.” The operations of the energy industry, including those undertaking hydraulic fracturing, are also subject to wildlife‑protection laws and regulations, such as the Migratory Bird Treaty Act (“MBTA”) or the Endangered Species Act, which may impact exploration, development, and production activities through regulations intended to protect certain species. For example, regulations under the MBTA sometimes require companies to cover reserve pits that are open for more than 90 days to prevent the taking of birds.
Concerns over general economic, business or industry conditions may have a material adverse effect on our results of operations, financial condition and liquidity.
Concerns over global economic conditions, energy costs, geopolitical issues, inflation, the availability and cost of credit and the European, Asian and the United States financial markets have contributed to increased economic uncertainty and diminished expectations for the global economy. These factors, combined with volatility in commodity prices, business and consumer confidence and unemployment rates, have precipitated an economic slowdown. Concerns about global economic growth have had a significant adverse impact on global financial markets and commodity prices. If the economic climate in the United States or abroad deteriorates, worldwide demand for petroleum products could diminish further, which could impact the price at which oil, natural gas and natural gas liquids can be sold, which could affect the ability of our customers to continue operations and ultimately adversely impact our results of operations, financial condition and liquidity.
21
Our operations are subject to hazards inherent in the oil and natural gas industry, which could expose us to substantial liability and cause us to lose customers and substantial revenue.
Risks inherent in our industry include the risks of equipment defects, vehicle accidents, fires, explosions, blowouts, surface cratering, uncontrollable flows of gas or well fluids, pipe or pipeline failures, abnormally pressured formations and various environmental hazards such as oil spills and releases of, and exposure to, hazardous substances. For example, our operations are subject to risks associated with hydraulic fracturing, including any mishandling, surface spillage or potential underground migration of fracturing fluids, including chemical additives. The occurrence of any of these events could result in substantial losses to us due to injury or loss of life, severe damage to or destruction of property, natural resources and equipment, pollution or other environmental damage, clean‑up responsibilities, regulatory investigations and penalties, suspension of operations and repairs required to resume operations. The cost of managing such risks may be significant. The frequency and severity of such incidents will affect operating costs, insurability and relationships with customers, employees and regulators. In particular, our customers may elect not to purchase our products or services if they view our environmental or safety record as unacceptable, which could cause us to lose customers and substantial revenues.
Our insurance may not be adequate to cover all losses or liabilities we may suffer. Also, insurance may no longer be available to us or its availability may be at premium levels that do not justify its purchase. The occurrence of a significant uninsured claim, a claim in excess of the insurance coverage limits maintained by us or a claim at a time when we are not able to obtain liability insurance could have a material adverse effect on our ability to conduct normal business operations and on our results of operations, financial condition and cash flows. In addition, we may not be able to secure additional insurance or bonding that might be required by new governmental regulations. This may cause us to restrict our operations, which might severely impact our financial condition.
A terrorist attack or armed conflict could harm our business.
The occurrence or threat of terrorist attacks in the United States or other countries, anti‑terrorist efforts and other armed conflicts involving the United States or other countries, including continued hostilities in the Middle East, may adversely affect the United States and global economies and could prevent us from meeting our financial and other obligations. If any of these events occur, the resulting political instability and societal disruption could reduce overall demand for oil and natural gas, potentially putting downward pressure on demand for our services and causing a reduction in our revenues. Oil and natural gas related facilities could be direct targets of terrorist attacks, and our operations could be adversely impacted if infrastructure integral to our customers’ operations is destroyed or damaged. Costs for insurance and other security may increase as a result of these threats, and some insurance coverage may become more difficult to obtain, if available at all.
If we are unable to fully protect our intellectual property rights or trade secrets, we may suffer a loss in our competitive advantage or market share.
We do not have patents relating to many of our key processes and technology. If we are not able to maintain the confidentiality of our trade secrets, or if our customers or competitors are able to replicate our technology or services, our competitive advantage would be diminished. We also cannot assure you that any patents we may obtain in the future would provide us with any significant commercial benefit or would allow us to prevent our competitors from employing comparable technologies or processes.
22
Risks Related to Our Class A Common Stock
We are a holding company. Our only material asset is our equity interest in Cactus LLC, and accordingly, we are dependent upon distributions from Cactus LLC to pay taxes, make payments under the Tax Receivable Agreement and cover our corporate and other overhead expenses.
We are a holding company and have no material assets other than our equity interest in Cactus LLC. We have no independent means of generating revenue. To the extent Cactus LLC has available cash and subject to the terms of any current or future credit agreements or debt instruments, we intend to cause Cactus LLC to make (i) generally pro rata distributions to its unitholders, including us, in an amount at least sufficient to allow us to pay our taxes and to make payments under the Tax Receivable Agreement and (ii) non‑pro rata payments to us to reimburse us for our corporate and other overhead expenses. To the extent that we need funds and Cactus LLC or its subsidiaries are restricted from making such distributions or payments under applicable law or regulation or under the terms of any future financing arrangements, or are otherwise unable to provide such funds, our financial condition and liquidity could be materially adversely affected.
Moreover, because we have no independent means of generating revenue, our ability to make payments under the Tax Receivable Agreement is dependent on the ability of Cactus LLC to make distributions to us in an amount sufficient to cover our obligations under the Tax Receivable Agreement. This ability, in turn, may depend on the ability of Cactus LLC’s subsidiaries to make distributions to it. The ability of Cactus LLC, its subsidiaries and other entities in which it directly or indirectly holds an equity interest to make such distributions will be subject to, among other things, (i) the applicable provisions of Delaware law (or other applicable U.S. and foreign jurisdictions) that may limit the amount of funds available for distribution and (ii) restrictions in relevant debt instruments issued by Cactus LLC or its subsidiaries and other entities in which it directly or indirectly holds an equity interest. To the extent that we are unable to make payments under the Tax Receivable Agreement for any reason, such payments will be deferred and will accrue interest until paid.
The requirements of being a public company, including compliance with the reporting requirements of the Exchange Act, and the requirements of the Sarbanes‑Oxley Act, may strain our resources, increase our costs and distract management, and we may be unable to comply with these requirements in a timely or cost‑effective manner.
As a public company, we need to comply with new laws, regulations and requirements, certain corporate governance provisions of the Sarbanes‑Oxley Act of 2002, related regulations of the SEC, including filing quarterly and annual financial statements, and the requirements of the NYSE, with which we were not required to comply as a private company. Complying with these statutes, regulations and requirements will occupy a significant amount of time of our board of directors and management and will significantly increase our costs and expenses. We need to:
|
· |
institute a more comprehensive compliance function, including for financial reporting and disclosures; |
|
· |
comply with rules promulgated by the NYSE; |
|
· |
continue to prepare and distribute periodic public reports in compliance with our obligations under the federal securities laws; |
|
· |
enhance our investor relations function; |
|
· |
establish new internal policies, such as those relating to insider trading; and |
|
· |
involve and retain to a greater degree outside counsel and accountants in the above activities. |
23
The changes necessitated by becoming a public company require a significant commitment of resources and management oversight that has increased, and may continue to increase, our costs and might place a strain on our systems and resources. Such costs could have a material adverse effect on our business, results of operations and financial condition.
Furthermore, while we generally must comply with Section 404 of the Sarbanes‑Oxley Act of 2002 for our fiscal year ending December 31, 2018, we are not required to have our independent registered public accounting firm attest to the effectiveness of our internal controls until our first annual report subsequent to our ceasing to be an “emerging growth company” within the meaning of Section 2(a)(19) of the Securities Act. Accordingly, we may not be required to have our independent registered public accounting firm attest to the effectiveness of our internal controls until as late as our annual report for the fiscal year ending December 31, 2023, although this could be required earlier. Once it is required to do so, our independent registered public accounting firm may issue a report that is adverse in the event it is not satisfied with the level at which our controls are documented, designed, operated or reviewed. Compliance with these requirements may strain our resources, increase our costs and distract management, and we may be unable to comply with these requirements in a timely or cost‑effective manner.
In addition, we expect that being a public company subject to these rules and regulations may make it more difficult and more expensive for us to obtain director and officer liability insurance, and we may be required to accept reduced policy limits and coverage or incur substantially higher costs to obtain the same or similar coverage. As a result, it may be more difficult for us to attract and retain qualified individuals to serve on our board of directors or as executive officers. We are currently evaluating these rules, and we cannot predict or estimate the amount of additional costs we may incur or the timing of such costs.
In the past, we identified a material weakness in our internal control over financial reporting and may identify additional material weaknesses in the future. Material weaknesses could affect the reliability of our financial statements and may cause to us to fail to meet our reporting obligations or fail to prevent fraud, which would harm our business and could negatively impact the price of our Class A Common Stock.
Effective internal control over financial reporting is necessary for us to provide reliable financial reports and prevent or detect fraud. If we cannot provide reliable financial reports or prevent fraud, our reputation and operating results would be harmed. A material weakness is a deficiency, or a combination of deficiencies, in internal control over financial reporting, such that there is a reasonable possibility that a material misstatement of our annual or interim financial statements will not be prevented or detected on a timely basis.
In connection with the audit of the consolidated financial statements of Cactus LLC, our predecessor for accounting purposes, for the year ended December 31, 2016, we identified a material weakness in our internal control over financial reporting. We did not effectively operate controls in place over the review of the consolidated financial statements and related disclosures. This resulted in the identification of certain errors in the consolidated statement of cash flows that have been corrected as a revision of that statement. Please read “Item 9A. Remediation of Material Weakness in Internal Control Over Financial Reporting.” The material weakness described above or any newly identified material weakness could result in a material misstatement of our annual or interim consolidated financial statements that would not be prevented or detected.
In addition, neither our management nor an independent registered public accounting firm has performed an evaluation of our internal control over financial reporting in accordance with the provisions of the Sarbanes‑Oxley Act because no such evaluation has been required. Had we or our independent registered public accounting firm performed an evaluation of our internal control over financial reporting in accordance with the provisions of the Sarbanes‑Oxley Act, additional material weaknesses may have been identified.
24
Material weaknesses could affect the reliability of our financial statements and may cause to us to fail to meet our reporting obligations or fail to prevent fraud, which would harm our business, and could negatively impact investor perceptions. This could negatively impact the price of our Class A Common Stock.
Additionally, our reporting obligations as a public company will place a significant strain on our management, operational and financial resources and systems for the foreseeable future and may cause us to fail to timely achieve and maintain the adequacy of our internal control over financial reporting. Please see “—The requirements of being a public company, including compliance with the reporting requirements of the Exchange Act and the requirements of the Sarbanes‑Oxley Act, may strain our resources, increase our costs and distract management, and we may be unable to comply with these requirements in a timely or cost‑effective manner.”
Our stock price may be volatile.
The market price of our Class A Common Stock could fluctuate significantly as a result of a number of factors, some of which are beyond our control. In the event of a drop in the market price of our Class A Common Stock, you could lose a substantial part or all of your investment in our Class A Common Stock. The following factors could affect our stock price:
|
· |
our operating and financial performance; |
|
· |
quarterly variations in the rate of growth of our financial indicators, such as net income per share, net income and revenues; |
|
· |
the public reaction to our press releases, our other public announcements and our filings with the SEC; |
|
· |
strategic actions by our competitors; |
|
· |
changes in revenue or earnings estimates, or changes in recommendations or withdrawal of research coverage, by equity research analysts; |
|
· |
speculation in the press or investment community; |
|
· |
the failure of research analysts to cover our Class A Common Stock; |
|
· |
sales of our Class A Common Stock by us or the perception that such sales may occur; |
|
· |
changes in accounting principles, policies, guidance, interpretations or standards; |
|
· |
additions or departures of key management personnel; |
|
· |
actions by our shareholders; |
|
· |
general market conditions, including fluctuations in commodity prices; |
|
· |
domestic and international economic, legal and regulatory factors unrelated to our performance; and |
|
· |
the realization of any risks described under this “Risk Factors” section. |
25
The stock markets in general have experienced extreme volatility that has often been unrelated to the operating performance of particular companies. These broad market fluctuations may adversely affect the trading price of our Class A Common Stock. Securities class action litigation has often been instituted against companies following periods of volatility in the overall market and in the market price of a company’s securities. Such litigation, if instituted against us, could result in very substantial costs, divert our management’s attention and resources and harm our business, results of operations and financial condition.
Cadent and Cactus WH Enterprises will have the ability to direct the voting of a majority of the voting power of our common stock, and their interests may conflict with those of our other shareholders.
Holders of Class A Common Stock and Class B Common Stock vote together as a single class on all matters presented to our shareholders for their vote or approval, except as otherwise required by applicable law or our certificate of incorporation. Cadent owns approximately 49.2% of our Class B common stock (representing 31.8% of our voting power) and Cactus WH Enterprises owns approximately 46.6% of our Class B common stock (representing 30.2% of our voting power).
As a result, Cadent and Cactus WH Enterprises will be able to control matters requiring shareholder approval, including the election of directors, changes to our organizational documents and significant corporate transactions. This concentration of ownership makes it unlikely that any holder or group of holders of our Class A Common Stock will be able to affect the way we are managed or the direction of our business. The interests of Cadent and Cactus WH Enterprises with respect to matters potentially or actually involving or affecting us, such as future acquisitions, financings and other corporate opportunities and attempts to acquire us, may conflict with the interests of our other shareholders. Cadent and Cactus WH Enterprises would have to approve any potential acquisition of us. In addition, one of our directors is currently a partner of Cadent Energy Partners. This director’s duties as a partner of Cadent Energy Partners may conflict with his duties as our director, and the resolution of these conflicts may not always be in our or your best interest. Furthermore, in connection with our IPO, we entered into a stockholders’ agreement with Cadent and Cactus WH Enterprises. Among other things, the stockholders’ agreement provides each of Cadent and Cactus WH Enterprises with the right to designate a certain number of nominees to our board of directors so long as they and their respective affiliates collectively beneficially own at least 5% of the outstanding shares of our common stock. The existence of significant shareholders and the stockholders’ agreement may have the effect of deterring hostile takeovers, delaying or preventing changes in control or changes in management or limiting the ability of our other shareholders to approve transactions that they may deem to be in our best interests. Cadent and Cactus WH Enterprises’ concentration of stock ownership may also adversely affect the trading price of our Class A Common Stock to the extent investors perceive a disadvantage in owning stock of a company with significant shareholders.
Certain of our directors have significant duties with, and spend significant time serving, entities that may compete with us in seeking acquisitions and business opportunities and, accordingly, may have conflicts of interest in allocating time or pursuing business opportunities.
Certain of our directors, who are responsible for managing the direction of our operations and acquisition activities, hold positions of responsibility with other entities (including Cadent and its affiliated entities) whose businesses are similar to our business. The existing positions held by these directors may give rise to fiduciary or other duties that are in conflict with the duties they owe to us. These directors may become aware of business opportunities that may be appropriate for presentation to us as well as to the other entities with which they are or may become affiliated. Due to these existing and potential future affiliations, they may present potential business opportunities to other entities prior to presenting them to us, which could cause additional conflicts of interest. They may also decide that certain opportunities are more appropriate for other entities with which they are affiliated, and as a result, they may elect not to present those opportunities to us. These conflicts may not be resolved in our favor.
26
Cadent and its affiliates are not limited in their ability to compete with us, and the corporate opportunity provisions in our amended and restated certificate of incorporation could enable Cadent to benefit from corporate opportunities that might otherwise be available to us.
Our governing documents provide that Cadent and its affiliates (including portfolio investments of Cadent and its affiliates) are not restricted from owning assets or engaging in businesses that compete directly or indirectly with us. In particular, subject to the limitations of applicable law, our amended and restated certificate of incorporation, among other things:
|
· |
permits Cadent and its affiliates, including any of our directors affiliated with Cadent, to conduct business that competes with us and to make investments in any kind of business, asset or property in which we may make investments; and |
|
· |
provides that if Cadent or its affiliates, including any of our directors affiliated with Cadent, becomes aware of a potential business opportunity, transaction or other matter, they will have no duty to communicate or offer that opportunity to us (unless such opportunity is expressly offered to such director in his capacity as one of our directors). |
Cadent and its affiliates, or our non‑employee directors, may become aware, from time to time, of certain business opportunities (such as, among other things, acquisition opportunities) and may direct such opportunities to other businesses in which they have invested, in which case we may not become aware of or otherwise have the ability to pursue such opportunity. Further, such businesses may choose to compete with us for these opportunities, possibly causing these opportunities to not be available to us or causing them to be more expensive for us to pursue. In addition, Cadent and its affiliates, or our non‑employee directors, may dispose of assets owned by them in the future, without any obligation to offer us the opportunity to purchase any of those assets. As a result, our renouncing our interest and expectancy in any business opportunity that may be from time to time presented to Cadent and its affiliates, or our non‑employee directors, could adversely impact our business or prospects if attractive business opportunities are procured by such parties for their own benefit rather than for ours.
Cadent and its affiliates potentially have access to resources greater than ours, which may make it more difficult for us to compete with Cadent and its affiliates with respect to commercial activities as well as for potential acquisitions. We cannot assure you that any conflicts that may arise between us and our shareholders, on the one hand, and Cadent, on the other hand, will be resolved in our favor. As a result, competition from Cadent and its affiliates could adversely impact our results of operations.
Our amended and restated certificate of incorporation and amended and restated bylaws, as well as Delaware law, contain provisions that could discourage acquisition bids or merger proposals, which may adversely affect the market price of our Class A Common Stock.
Our amended and restated certificate of incorporation authorizes our board of directors to issue preferred stock without shareholder approval. If our board of directors elects to issue preferred stock, it could be more difficult for a third party to acquire us. In addition, some provisions of our amended and restated certificate of incorporation and amended and restated bylaws could make it more difficult for a third party to acquire control of us, even if the change of control would be beneficial to our shareholders, including:
|
· |
limitations on the removal of directors; |
|
· |
limitations on the ability of our shareholders to call special meetings; |
27
|
· |
establishing advance notice provisions for shareholder proposals and nominations for elections to the board of directors to be acted upon at meetings of shareholders; |
|
· |
providing that the board of directors is expressly authorized to adopt, or to alter or repeal our bylaws; and |
|
· |
establishing advance notice and certain information requirements for nominations for election to our board of directors or for proposing matters that can be acted upon by shareholders at shareholder meetings. |
In addition, certain change of control events have the effect of accelerating the payment due under the Tax Receivable Agreement, which could be substantial and accordingly serve as a disincentive to a potential acquirer of our company. Please see “—In certain cases, payments under the Tax Receivable Agreement may be accelerated and/or significantly exceed the actual benefits, if any, we realize in respect of the tax attributes subject to the Tax Receivable Agreement.”
Our amended and restated certificate of incorporation designates the Court of Chancery of the State of Delaware as the sole and exclusive forum for certain types of actions and proceedings that may be initiated by our shareholders, which could limit our shareholders’ ability to obtain a favorable judicial forum for disputes with us or our directors, officers, employees or agents.
Our amended and restated certificate of incorporation provides that, unless we consent in writing to the selection of an alternative forum, the Court of Chancery of the State of Delaware will, to the fullest extent permitted by applicable law, be the sole and exclusive forum for (i) any derivative action or proceeding brought on our behalf, (ii) any action asserting a claim of breach of a fiduciary duty owed by any of our directors, officers, employees or agents to us or our shareholders, (iii) any action asserting a claim arising pursuant to any provision of the Delaware General Corporation Law (the “DGCL”), our amended and restated certificate of incorporation or our bylaws, or (iv) any action asserting a claim against us that is governed by the internal affairs doctrine, in each such case subject to such Court of Chancery having personal jurisdiction over the indispensable parties named as defendants therein. Any person or entity purchasing or otherwise acquiring any interest in shares of our capital stock will be deemed to have notice of, and consented to, the provisions of our amended and restated certificate of incorporation described in the preceding sentence. This choice of forum provision may limit a shareholder’s ability to bring a claim in a judicial forum that it finds favorable for disputes with us or our directors, officers, employees or agents, which may discourage such lawsuits against us and such persons. Alternatively, if a court were to find these provisions of our amended and restated certificate of incorporation inapplicable to, or unenforceable in respect of, one or more of the specified types of actions or proceedings, we may incur additional costs associated with resolving such matters in other jurisdictions, which could adversely affect our business, results of operations and financial condition.
Future sales of our Class A Common Stock in the public market, or the perception that such sales may occur, could reduce our stock price, and any additional capital raised by us through the sale of equity or convertible securities may dilute your ownership in us.
Subject to certain limitations and exceptions, the CW Unit Holders may cause Cactus LLC to redeem their CW Units for shares of Class A Common Stock (on a one‑for‑one basis, subject to conversion rate adjustments for stock splits, stock dividends and reclassification and other similar transactions) and then sell those shares of Class A Common Stock. Additionally, we may issue additional shares of Class A Common Stock or convertible securities in subsequent public offerings. We have 26,450,000 outstanding shares of Class A Common Stock and 48,439,772 outstanding shares of Class B Common Stock. The CW Unit Holders own 48,439,772 shares of Class B Common Stock, representing approximately 64.7% of our total outstanding common stock. All such shares of Class B Common Stock are restricted from immediate resale under the federal securities laws and are subject to the lock‑up agreements between such parties and the underwriters but may be sold into the market in the future. Cadent and Cactus WH Enterprises are party to a registration rights agreement between us and the Pre-IPO Owners, which will require us to effect the registration of their
28
shares in certain circumstances no earlier than the expiration of the lock‑up period contained in the underwriting agreement entered into in connection with our IPO.
We cannot predict the size of future issuances of our Class A Common Stock or securities convertible into Class A Common Stock or the effect, if any, that future issuances and sales of shares of our Class A Common Stock will have on the market price of our Class A Common Stock. Sales of substantial amounts of our Class A Common Stock (including shares issued in connection with an acquisition), or the perception that such sales could occur, may adversely affect prevailing market prices of our Class A Common Stock.
Under certain circumstances, redemptions of CW Units by CW Unit Holders will result in dilution to the holders of our Class A Common Stock.
Redemptions of CW Units by CW Unit Holders in accordance with the terms of the Cactus Wellhead LLC Agreement will result in a corresponding increase in our membership interest in Cactus LLC, increase in the number of shares of Class A Common Stock outstanding and decrease in the number of shares of Class B Common Stock outstanding. In the event that CW Units are exchanged at a time when Cactus LLC has made cash distributions to CW Unit Holders, including Cactus Inc., and Cactus Inc. has accumulated such distributions and neither reinvests them in Cactus LLC in exchange for additional CW Units nor distributes them as dividends to the holders of Cactus Inc.’s Class A Common Stock, the holders of our Class A Common Stock would experience dilution with respect to such accumulated distributions.
Cactus Inc. will be required to make payments under the Tax Receivable Agreement for certain tax benefits that we may claim, and the amounts of such payments could be significant.
In connection with our IPO, we entered into a Tax Receivable Agreement with the TRA Holders. This agreement will generally provide for the payment by Cactus Inc. to the TRA Holders of 85% of the net cash savings, if any, in U.S. federal, state and local income tax and franchise tax that Cactus Inc. actually realizes or is deemed to realize in certain circumstances as a result of certain increases in tax basis and certain benefits attributable to imputed interest. Cactus Inc. will retain the benefit of the remaining 15% of these net cash savings.
The term of the Tax Receivable Agreement will continue until all tax benefits that are subject to the Tax Receivable Agreement have been utilized or expired, unless we exercise our right to terminate the Tax Receivable Agreement (or the Tax Receivable Agreement is terminated due to other circumstances, including our breach of a material obligation thereunder or certain mergers or other changes of control), and we make the termination payment specified in the Tax Receivable Agreement. In addition, payments we make under the Tax Receivable Agreement will be increased by any interest accrued from the due date (without extensions) of the corresponding tax return. In the event that the Tax Receivable Agreement is not terminated, the payments under the Tax Receivable Agreement are anticipated to commence in 2019 and to continue for 16 years after the date of the last redemption of CW Units.
The payment obligations under the Tax Receivable Agreement are our obligations and not obligations of Cactus LLC, and we expect that the payments we will be required to make under the Tax Receivable Agreement will be substantial. Estimating the amount and timing of payments that may become due under the Tax Receivable Agreement is by its nature imprecise. For purposes of the Tax Receivable Agreement, cash savings in tax generally are calculated by comparing our actual tax liability (determined by using the actual applicable U.S. federal income tax rate and an assumed combined state and local income tax rate) to the amount we would have been required to pay had we not been able to utilize any of the tax benefits subject to the Tax Receivable Agreement. The amounts payable, as well as the timing of any payments under the Tax Receivable Agreement, are dependent upon significant future events and assumptions, including the timing of the redemption of CW Units, the price of our Class A Common Stock at the time of each redemption, the extent to which such redemptions are taxable transactions, the amount of the redeeming unit holder’s tax basis in its CW Units at the time of the relevant redemption, the depreciation and amortization periods that
29
apply to the increase in tax basis, the amount and timing of taxable income we generate in the future and the U.S. federal income tax rates then applicable, and the portion of our payments under the Tax Receivable Agreement that constitute imputed interest or give rise to depreciable or amortizable tax basis. The payments under the Tax Receivable Agreement will not be conditioned upon a holder of rights under the Tax Receivable Agreement having a continued ownership interest in us.
In certain cases, payments under the Tax Receivable Agreement may be accelerated and/or significantly exceed the actual benefits, if any, we realize in respect of the tax attributes subject to the Tax Receivable Agreement.
If we elect to terminate the Tax Receivable Agreement early or it is terminated early due to Cactus Inc.’s failure to honor a material obligation thereunder or due to certain mergers or other changes of control, our obligations under the Tax Receivable Agreement would accelerate and we would be required to make an immediate payment equal to the present value of the anticipated future payments to be made by us under the Tax Receivable Agreement (determined by applying a discount rate of one‑year LIBOR plus 150 basis points) and such payment is expected to be substantial. The calculation of anticipated future payments will be based upon certain assumptions and deemed events set forth in the Tax Receivable Agreement, including (i) the assumption that we have sufficient taxable income to fully utilize the tax benefits covered by the Tax Receivable Agreement and (ii) the assumption that any CW Units (other than those held by Cactus Inc.) outstanding on the termination date are deemed to be redeemed on the termination date. Any early termination payment may be made significantly in advance of the actual realization, if any, of the future tax benefits to which the termination payment relates.
As a result of either an early termination or a change of control, we could be required to make payments under the Tax Receivable Agreement that exceed our actual cash tax savings under the Tax Receivable Agreement. In these situations, our obligations under the Tax Receivable Agreement could have a substantial negative impact on our liquidity and could have the effect of delaying, deferring or preventing certain mergers, asset sales, or other forms of business combinations or changes of control. There can be no assurance that we will be able to finance our obligations under the Tax Receivable Agreement.
Payments under the Tax Receivable Agreement will be based on the tax reporting positions that we will determine. The TRA Holders will not reimburse us for any payments previously made under the Tax Receivable Agreement if any tax benefits that have given rise to payments under the Tax Receivable Agreement are subsequently disallowed, except that excess payments made to any TRA Holder will be netted against payments that would otherwise be made to such TRA Holder, if any, after our determination of such excess. As a result, in some circumstances, we could make payments that are greater than our actual cash tax savings, if any, and may not be able to recoup those payments, which could adversely affect our liquidity.
If Cactus LLC were to become a publicly traded partnership taxable as a corporation for U.S. federal income tax purposes, we and Cactus LLC might be subject to potentially significant tax inefficiencies, and we would not be able to recover payments previously made by us under the Tax Receivable Agreement even if the corresponding tax benefits were subsequently determined to have been unavailable due to such status.
We intend to operate such that Cactus LLC does not become a publicly traded partnership taxable as a corporation for U.S. federal income tax purposes. A “publicly traded partnership” is a partnership the interests of which are traded on an established securities market or are readily tradable on a secondary market or the substantial equivalent thereof. Under certain circumstances, redemptions of CW Units pursuant to the Redemption Right (or our Call Right) or other transfers of CW Units could cause Cactus LLC to be treated as a publicly traded partnership. Applicable U.S. Treasury regulations provide for certain safe harbors from treatment as a publicly traded partnership, and we intend to operate such that one or more such safe harbors shall apply. For example, we intend to limit the number of unitholders of Cactus LLC, and the Cactus Wellhead LLC Agreement, which was entered into in connection with the closing of our IPO, provides for limitations on the ability of CW Unit Holders to transfer their CW Units and provides us, as managing
30
member of Cactus LLC, with the right to impose restrictions (in addition to those already in place) on the ability of unitholders of Cactus LLC to redeem their CW Units pursuant to the Redemption Right to the extent we believe it is necessary to ensure that Cactus LLC will continue to be treated as a partnership for U.S. federal income tax purposes.
If Cactus LLC were to become a publicly traded partnership, significant tax inefficiencies might result for us and for Cactus LLC, including as a result of our inability to file a consolidated U.S. federal income tax return with Cactus LLC. In addition, we would no longer have the benefit of certain increases in tax basis covered under the Tax Receivable Agreement, and we would not be able to recover any payments previously made by us under the Tax Receivable Agreement, even if the corresponding tax benefits (including any claimed increase in the tax basis of Cactus LLC’s assets) were subsequently determined to have been unavailable.
If Cactus Inc. were deemed to be an investment company under the Investment Company Act of 1940, as amended (the “1940 Act”), as a result of its ownership of Cactus LLC, applicable restrictions could make it impractical for Cactus Inc. to continue its business as contemplated and could have a material adverse effect on its business.
Under Sections 3(a)(1)(A) and (C) of the 1940 Act, a company generally will be deemed to be an “investment company” for purposes of the 1940 Act if (i) it is, or holds itself out as being, engaged primarily, or proposes to engage primarily, in the business of investing, reinvesting or trading in securities or (ii) it engages, or proposes to engage, in the business of investing, reinvesting, owning, holding or trading in securities and it owns or proposes to acquire investment securities having a value exceeding 40% of the value of its total assets (exclusive of U.S. government securities and cash items) on an unconsolidated basis. We do not believe that Cactus Inc. is an “investment company,” as such term is defined in either of those sections of the 1940 Act. As the sole managing member of Cactus LLC, Cactus Inc. will control and operate Cactus LLC. On that basis, we believe that Cactus Inc.’s interest in Cactus LLC is not an “investment security” as that term is used in the 1940 Act. However, if Cactus Inc. were to cease participation in the management of Cactus LLC, its interest in Cactus LLC could be deemed an “investment security” for purposes of the 1940 Act. Cactus Inc. and Cactus LLC intend to conduct their operations so that Cactus Inc. will not be deemed an investment company. However, if Cactus Inc. were to be deemed an investment company, restrictions imposed by the 1940 Act, including limitations on Cactus Inc.’s capital structure and its ability to transact with affiliates, could make it impractical for Cactus Inc. to continue its business as contemplated and could have a material adverse effect on its business.
We may issue preferred stock whose terms could adversely affect the voting power or value of our Class A Common Stock.
Our amended and restated certificate of incorporation authorizes us to issue, without the approval of our shareholders, one or more classes or series of preferred stock having such designations, preferences, limitations and relative rights, including preferences over our Class A Common Stock respecting dividends and distributions, as our board of directors may determine. The terms of one or more classes or series of preferred stock could adversely impact the voting power or value of our Class A Common Stock. For example, we might grant holders of preferred stock the right to elect some number of our directors in all events or on the happening of specified events or the right to veto specified transactions. Similarly, the repurchase or redemption rights or liquidation preferences we might assign to holders of preferred stock could affect the residual value of the Class A Common Stock.
We are a “controlled company” within the meaning of the NYSE rules and, as a result, will qualify for and intend to rely on exemptions from certain corporate governance requirements.
Cadent and Cactus WH Enterprises beneficially own a majority of our outstanding voting interests. As a result, we are a “controlled company” within the meaning of the NYSE corporate governance standards. Under the NYSE rules, a company of which more than 50% of the voting power is held by another person or group of persons acting together is
31
a “controlled company” and may elect not to comply with certain NYSE corporate governance requirements, including the requirements that:
|
· |
a majority of the board of directors consist of independent directors; |
|
· |
we have a nominating and governance committee that is composed entirely of independent directors with a written charter addressing the committee’s purpose and responsibilities; |
|
· |
we have a compensation committee that is composed entirely of independent directors with a written charter addressing the committee’s purpose and responsibilities; and |
|
· |
there be an annual performance evaluation of the nominating and governance and compensation committees. |
These requirements will not apply to us as long as we remain a controlled company. For at least some period, we intend to utilize these exemptions. Accordingly, you may not have the same protections afforded to shareholders of companies that are subject to all of the corporate governance requirements of the NYSE.
For as long as we are an emerging growth company, we will not be required to comply with certain reporting requirements, including those relating to accounting standards and disclosure about our executive compensation, that apply to other public companies.
We are classified as an “emerging growth company” under the JOBS Act. For as long as we are an emerging growth company, which may be up to five full fiscal years, unlike other public companies, we will not be required to, among other things: (i) provide an auditor’s attestation report on management’s assessment of the effectiveness of our system of internal control over financial reporting pursuant to Section 404(b) of the Sarbanes‑Oxley Act; (ii) comply with any new requirements adopted by the PCAOB requiring mandatory audit firm rotation or a supplement to the auditor’s report in which the auditor would be required to provide additional information about the audit and the financial statements of the issuer; (iii) provide certain disclosure regarding executive compensation required of larger public companies; or (iv) hold nonbinding advisory votes on executive compensation. We will remain an emerging growth company for up to five years, although we will lose that status sooner if we have more than $1.07 billion of revenues in a fiscal year, have more than $700.0 million in market value of our Class A Common Stock held by non‑affiliates, or issue more than $1.0 billion of non‑convertible debt over a three‑year period.
To the extent that we rely on any of the exemptions available to emerging growth companies, you will receive less information about our executive compensation and internal control over financial reporting than issuers that are not emerging growth companies. If some investors find our Class A Common Stock to be less attractive as a result, there may be a less active trading market for our Class A common stock and our stock price may be more volatile.
Item 1B. Unresolved Staff Comments
None.
32
The following tables set forth information with respect to our facilities.
|
|
|
|
|
Own/ |
|
Approximate |
|
|
|
Location |
|
Type |
|
Lease |
|
Size |
|
Status |
|
United States: |
|
|
|
|
|
|
|
|
|
Athens, PA |
|
Service Center |
|
Lease |
|
6,500 sq. ft. |
|
Active |
|
Bossier City, LA(1) |
|
Manufacturing Facility and Service Center |
|
Lease |
|
38,000 sq. ft. |
|
Active |
|
Bossier City, LA(1) |
|
Manufacturing Facility and Service Center |
|
Own |
|
74,000 sq. ft./5.7 acres |
|
Active |
|
Bossier City, LA(2) |
|
Land Adjacent to Manufacturing Facility |
|
Own |
|
10.0 acres |
|
Undeveloped |
|
Broussard, LA |
|
Service Center |
|
Lease |
|
17,500 sq. ft. |
|
Active |
|
Carlsbad, NM |
|
Service Center |
|
Lease |
|
5,000 sq. ft. |
|
Active |
|
Casper, WY |
|
Service Center |
|
Lease |
|
5,000 sq. ft. |
|
Active |
|
Center, TX(3) |
|
— |
|
Lease |
|
18,125 sq. ft. |
|
Idle / Storage |
|
Decatur, TX |
|
Service Center |
|
Lease |
|
9,000 sq. ft. |
|
Active |
|
Donora, PA |
|
Service Center |
|
Lease |
|
37,000 sq. ft. |
|
Active |
|
DuBois, PA |
|
Service Center |
|
Lease |
|
20,580 sq. ft. |
|
Active |
|
DuBois, PA |
|
Land Adjacent to Service Center |
|
Own |
|
5.1 acres |
|
Undeveloped |
|
Grand Junction, CO |
|
Service Center |
|
Lease |
|
7,200 sq. ft. |
|
Active |
|
Houston, TX(4) |
|
— |
|
Lease |
|
20,000 sq. ft. |
|
Idle / Sub-leased to third party |
|
Houston, TX |
|
Administrative Headquarters |
|
Lease |
|
23,125 sq. ft. |
|
Active |
|
Kilgore, TX(4) |
|
— |
|
Lease |
|
24,000 sq. ft. |
|
Portions sub-leased to third party / Storage |
|
LaSalle, CO |
|
Service Center |
|
Lease |
|
6,800 sq. ft. |
|
Active |
|
Midland, TX(3) |
|
— |
|
Lease |
|
11,500 sq. ft. |
|
Sub-leased to third party |
|
New Waverly, TX |
|
Service Center / Land |
|
Own |
|
21,000 sq. ft./8.7 acres |
|
Active |
|
Odessa, TX |
|
Service Center |
|
Lease |
|
63,750 sq. ft. |
|
Active |
|
Odessa, TX |
|
Land |
|
Own |
|
9.1 acres |
|
Undeveloped |
|
Oklahoma City, OK |
|
Service Center |
|
Lease |
|
51,547 sq. ft. |
|
Active |
|
Oklahoma City, OK |
|
Service Center |
|
Lease |
|
20,200 sq. ft. |
|
Idle / Vacant |
|
Pleasanton, TX |
|
Service Center |
|
Lease |
|
18,125 sq. ft. |
|
Active |
|
Pleasanton, TX |
|
Land Adjacent to Service Center |
|
Own |
|
5.4 acres |
|
Storage |
|
Williston, ND |
|
Service Center |
|
Lease |
|
22,825 sq. ft. |
|
Active |
|
Williston, ND |
|
Land Adjacent to Service Center |
|
Own |
|
3.1 acres |
|
Undeveloped |
|
China and Australia: |
|
|
|
|
|
|
|
|
|
Queensland, Australia |
|
Service Center / Land |
|
Lease |
|
15,000 sq. ft. |
|
Active |
|
Suzhou, China |
|
Production Facility |
|
Lease |
|
89,535 sq. ft. |
|
Active |
|
(1) |
Consists of various facilities adjacent to each other constituting our manufacturing facility and service center. |
|
(2) |
Consists of various parcels of contiguous land adjacent to our manufacturing facility. |
|
(3) |
Previously operated as a service center. |
|
(4) |
Previously operated as a manufacturing facility. |
Additional information about our properties is set forth in “Item 1. Business.”
We are party to lawsuits arising in the ordinary course of our business. We cannot predict the outcome of any such lawsuits with certainty, but management believes it is remote that pending or threatened legal matters will have a material adverse impact on our financial condition.
Due to the nature of our business, we are, from time to time, involved in other routine litigation or subject to disputes or claims related to our business activities, including workers’ compensation claims and employment related disputes. In the opinion of our management, none of these other pending litigation, disputes or claims against us, if decided adversely, will have a material adverse effect on our financial condition, cash flows or results of operations.
33
Item 4. Mine Safety Disclosures
Not applicable.
Item 5. Market for Registrant’s Common Equity, Related Stockholder Matters and Issuer Purchases of Equity Securities
Common Stock
Our Class A Common Stock began trading on the NYSE under the symbol “WHD” on February 8, 2018. Prior to that, there was no public market for our Class A Common Stock. As a result, we have not set forth quarterly information with respect to the high and low prices for our common stock for the two most recent fiscal years or provided a performance graph.
On March 13, 2018, the closing price of our Class A Common Stock as reported by the NYSE was $26.68 per share, and we had approximately one holder of record. This number excludes owners for whom Class A Common Stock may be held in “street” name.
Dividend Policy
We do not anticipate declaring or paying any cash dividends to holders of our Class A Common Stock in the foreseeable future. We currently intend to retain future earnings, if any, to finance the growth of our business. Our future dividend policy is within the discretion of our board of directors and will depend upon then-existing conditions, including our results of operations, financial condition, capital requirements, investment opportunities, statutory restrictions on our ability to pay dividends and other factors our board of directors may deem relevant. In addition, our Credit Agreement restricts our ability to pay cash dividends to holders of our Class A Common Stock.
Securities Authorized for Issuance under Equity Compensation Plans
The information relating to our equity compensation plans required by Item 5 is incorporated by reference to such information as set forth in Item 12. “Security Ownership of Certain Beneficial Owners and Management and Related Stockholder Matters” contained herein.
Issuer Purchases of Equity Securities
We did not purchase any of our equity securities during the quarter ended December 31, 2017.
Sales of Unregistered Equity Securities
We did not have any sales of unregistered equity securities during the fiscal year ended December 31, 2017.
34
Item 6. Selected Financial Data
The following tables show selected historical consolidated financial data, for the periods and as of the dates indicated, of Cactus LLC, our accounting predecessor. Our historical results are not necessarily indicative of future results. The following selected financial and operating data should be read in conjunction with “Item 7. Management’s Discussion and Analysis of Financial Condition and Results of Operations” and the consolidated financial statements and related notes, each of which is included in this report.
|
|
|
Year Ended December 31, |
|
|||||||
|
|
|
2017 |
|
2016 |
|
2015 |
|
|||
|
|
|
(in thousands, except per unit data) |
|
|||||||
|
Consolidated Statements of Income Data: |
|
|
|
|
|
|
|
|
|
|
|
Total revenues |
|
$ |
341,191 |
|
$ |
155,048 |
|
$ |
221,395 |
|
|
Total costs and expenses |
|
|
252,328 |
|
|
144,433 |
|
|
179,190 |
|
|
Income from operations |
|
|
88,863 |
|
|
10,615 |
|
|
42,205 |
|
|
Interest expense, net |
|
|
(20,767) |
|
|
(20,233) |
|
|
(21,837) |
|
|
Other income (expense), net |
|
|
— |
|
|
2,251 |
|
|
1,640 |
|
|
Income (loss) before income taxes |
|
|
68,096 |
|
|
(7,367) |
|
|
22,008 |
|
|
Income tax expense(1) |
|
|
1,549 |
|
|
809 |
|
|
784 |
|
|
Net income (loss) |
|
$ |
66,547 |
|
$ |
(8,176) |
|
$ |
21,224 |
|
|
Earnings (loss) per Class A unit: |
|
|
|
|
|
|
|
|
|
|
|
Basic and diluted |
|
$ |
1,258.36 |
|
$ |
(224.00) |
|
$ |
306.88 |
|
|
Weighted average Class A units outstanding: |
|
|
|
|
|
|
|
|
|
|
|
Basic and diluted |
|
|
36.5 |
|
|
36.5 |
|
|
36.5 |
|
|
|
|
|
|
|
|
|
|
|
|
|
|
Consolidated Balance Sheets Data (at period end): |
|
|
|
|
|
|
|
|
|
|
|
Cash and cash equivalents |
|
$ |
7,574 |
|
$ |
8,688 |
|
$ |
12,526 |
|
|
Total assets |
|
|
266,456 |
|
|
165,328 |
|
|
177,559 |
|
|
Long-term debt, net |
|
|
241,437 |
|
|
242,254 |
|
|
250,555 |
|
|
Members’ equity (deficit)(2) |
|
|
(36,217) |
|
|
(103,321) |
|
|
(93,167) |
|
|
|
|
|
|
|
|
|
|
|
|
|
|
Consolidated Statements of Cash Flows Data: |
|
|
|
|
|
|
|
|
|
|
|
Net cash provided by (used in): |
|
|
|
|
|
|
|
|
|
|
|
Operating activities |
|
$ |
34,707 |
|
$ |
23,975 |
|
$ |
45,927 |
|
|
Investing activities |
|
|
(30,678) |
|
|
(17,358) |
|
|
(23,422) |
|
|
Financing activities |
|
|
(5,313) |
|
|
(10,171) |
|
|
(22,776) |
|
|
(1) |
Cactus Inc. is a corporation and is subject to U.S. federal as well as state income tax for its share of ownership in Cactus LLC. Our predecessor, Cactus LLC, is not subject to U.S. federal income tax at an entity level. As a result, the consolidated net income (loss) in our historical financial statements does not reflect the tax expense we would have incurred if we were subject to U.S. federal income tax at an entity level during such periods. Cactus LLC is subject to entity‑level taxes for certain states within the United States. Additionally, our operations in both Australia and China are subject to local country income taxes. |
|
(2) |
In March 2014 and July 2014, Cactus LLC entered into an amendment and restatement of its then existing credit facility and a discount loan agreement, respectively, a portion of the proceeds from which were used to make a cash distribution to the Pre-IPO Owners. These transactions had the effect of creating a deficit in our total members’ equity. |
35
Item 7. Management’s Discussion and Analysis of Financial Condition and Results of Operations
Except as otherwise indicated or required by the context, all references in this Annual Report to the “Company,” “Cactus,” “we,” “us” and “our” refer to (i) Cactus Wellhead, LLC (“Cactus LLC”) and its consolidated subsidiaries prior to the completion of our initial public offering on February 12, 2018 and (ii) Cactus, Inc. (“Cactus Inc.”) and its consolidated subsidiaries (including Cactus LLC) following the completion of our initial public offering, unless we state otherwise or the context otherwise requires. The following discussion and analysis of our financial condition and results of operations should be read in conjunction with the accompanying consolidated financial statements and related notes. The following discussion contains “forward-looking statements” that reflect our plans, estimates, beliefs and expected performance. Our actual results may differ materially from those anticipated as discussed in these forward-looking statements as a result of a variety of risks and uncertainties, including those described above in “Cautionary Statement Regarding Forward-Looking Statements” and “Item 1A. Risk Factors” included elsewhere in this Annual Report, all of which are difficult to predict. In light of these risks, uncertainties and assumptions, the forward-looking events discussed may not occur. We assume no obligation to update any of these forward-looking statements except as otherwise required by law.
Executive Summary
We design, manufacture, sell and rent a range of highly‑engineered wellheads and pressure control equipment. Our products are sold and rented principally for onshore unconventional oil and gas wells and are utilized during the drilling, completions (including fracturing) and production phases of our customers’ wells. In addition, we provide field services for all of our products and rental items to assist with the installation, maintenance and handling of the wellhead and pressure control equipment.
Our principal products include our Cactus SafeDrill™ wellhead systems, as well as frac stacks, zipper manifolds and production trees that we design and manufacture. Every oil and gas well requires a wellhead, which is installed at the onset of the drilling process and which remains with the well through its entire productive life. The Cactus SafeDrill™ wellhead systems employ technology which allows technicians to land and secure casing strings safely from the rig floor without the need to descend into the cellar. We believe we are a market leader in the application of such technology, with thousands of our products sold and installed across the United States since 2011. During the completion phase of a well, we rent frac stacks, zipper manifolds and other high‑pressure equipment that are used for well control and for managing the transmission of frac fluids and proppants during the hydraulic fracturing process. These severe service applications require robust and reliable equipment. For the subsequent production phase of a well, we sell production trees that regulate hydrocarbon production, which are installed on the wellhead after the frac tree has been removed. In addition, we provide mission‑critical field services for all of our products and rental items, including 24‑hour service crews to assist with the installation, maintenance and safe handling of the wellhead and pressure control equipment. Finally, we provide repair services for all of the equipment that we sell or rent.
Our primary wellhead products and pressure control equipment are developed internally. We believe our close relationship with our customers provides us with insight into the specific issues encountered in the drilling and completions processes, allowing us to provide them with highly tailored product and service solutions. We have achieved significant market share, as measured by the percentage of total active U.S. onshore rigs that we follow (which we define as the number of active U.S. onshore drilling rigs to which we are the primary provider of wellhead products and corresponding services during drilling), and brand name recognition with respect to our engineered products, which we believe is due to our focus on safety, reliability, cost effectiveness and time saving features. We optimize our products for pad drilling (i.e., the process of drilling multiple wellbores from a single surface location) to reduce rig time and provide operators with significant efficiencies that translate to cost savings at the wellsite.
Our manufacturing and production facilities are located in Bossier City, Louisiana and Suzhou, China. While both facilities can produce our full range of products, our Bossier City facility has advanced capabilities and is designed
36
to support time‑sensitive and rapid turnaround orders, while our facility in China is optimized for longer lead time orders and outsources its machining requirements. Both our United States and China facilities are licensed to the latest API 6A specification for both wellheads and valves and API Q1 and ISO9001:2015 quality management systems.
We operate 14 service centers in the United States, which are strategically located in the key oil and gas producing regions, including the Permian, SCOOP/STACK, Marcellus, Utica, Eagle Ford, Bakken and other active oil and gas regions in the United States. We also have one service center in Eastern Australia. These service centers support our field services and provide equipment assembly and repair services.
Market Factors and Trends
Demand for our products and services depends primarily upon the general level of activity in the oil and gas industry, including the number of drilling rigs in operation, the number of oil and gas wells being drilled, the depth and drilling conditions of these wells, the volume of production, the number of well completions and the level of well remediation activity, and the corresponding capital spending by oil and natural gas companies. Oil and gas activity is in turn heavily influenced by, among other factors, oil and gas prices worldwide, which have historically been volatile.
The total U.S. onshore rig count for 2017 as reported by Baker Hughes based on a monthly average was 852 rigs, a material increase relative to the 2016 monthly average of 485 rigs. The December 2017, January 2018 and February 2018 monthly average was 909, 920 and 959 rigs, respectively.
Oil and natural gas prices have historically been volatile. Ongoing compliance among OPEC producers on production cuts implemented in early 2017 and the extension of these production cuts through the end of 2018, combined with current geopolitical tension, have supported upward momentum for energy prices. We believe that recent increases in oil and natural gas prices, as well as moderate relief from the global oversupply of oil and domestic oversupply of natural gas, should increase demand for our products and services.
The key market factor of our product sales is the number of wells drilled, as each well requires an individual wellhead assembly, and after completion, the installation of an associated production tree. We measure our product sales activity levels versus our competitors’ by the number of rigs that we are supporting on a monthly basis as a proxy for wells drilled. Each active drilling rig produces different levels of revenue based on the customer’s drilling plan, which includes factors such as the number of wells drilled per pad, the time taken to drill each well, the number and size of casing strings, the working pressure, material selection and the complexity of the wellhead system chosen by the customer. All of these factors are influenced by the oil and gas region in which our customer is operating. While these factors may lead to differing revenues per rig, they allow us to forecast our product needs and anticipated revenue levels based on general trends in a given region and with a specific customer.
Our rental revenues are primarily dependent on the number of wells completed (i.e., hydraulically fractured) and the number of fracture stages per well. Rental revenues and prices are more dependent on overall industry activity levels in the short‑term than product sales. This is due to the more competitive and price‑sensitive nature of the rental market with more participants having access to completions‑focused rental equipment. Pricing had also been impacted with the move from dayrate pricing to stage‑based pricing in the hydraulic fracturing market. This had a follow‑on effect to the rental pricing of completions‑focused pressure control equipment, as problems experienced with rental equipment do not have as significant a cost impact as they did previously to the E&P operator under dayrate pricing. We believe that as the market increases in activity levels and as capacity becomes more constrained due to cannibalization of both rental and hydraulic fracturing service equipment, the pricing of completions‑focused pressure control rental equipment will improve due to a renewed focus on reliability and quality. Furthermore, we believe that the current number of Drilled But Uncompleted wells (“DUCs”) and any increases thereto could ultimately provide additional opportunities.
37
Service and other revenues are closely correlated to revenues from product sales and rentals, as items sold or rented often have an associated service component. Almost all service sales are offered in connection with a product sale or rental. Therefore, the market factors and trends of product sales and rental revenues similarly impact the associated levels of service and other revenues generated.
How We Generate Our Revenues
Our revenues are derived from three sources: products, rentals, and field service and other. Product revenues are primarily derived from the sale of wellhead systems and production trees. Rental revenues are primarily derived from the rental of equipment used for well control during the completions process as well as the rental of drilling tools. Field service and other revenues are primarily earned when we provide installation and other field services for both product sales and equipment rental. Additionally, other revenues are derived from providing repair and reconditioning services to customers that have previously installed our products on their wellsite. Items sold or rented generally have an associated service component. Therefore, field service and other revenues closely correlate to revenues from product sales and rentals.
In 2017, we derived 55% of our total revenues from the sale of our products, 23% of our total revenues from rental and 22% of our total revenues from field service and other. In 2016, we derived 50% of our total revenues from the sale of our products, 29% of our total revenues from rental and 21% of our total revenues from field service and other. In 2015, we derived 50% of our total revenues from the sale of our products, 30% of our total revenues from rental and 20% of our total revenues from field service and other. We have predominantly domestic operations, with 99% of our total sales in 2017, 98% of our total sales in 2016 and 99% of our total sales in 2015 earned from U.S. operations.
Substantially all of our sales are made on a call‑out basis, wherein our clients issue requests for goods and/or services as their operations require. Such goods and/or services are most often priced in accordance with a preapproved price list.
Generally, we attempt to raise prices as our costs increase or additional features are provided. However, the actual pricing of our products and services is impacted by a number of factors, including competitive pricing pressure, the level of utilized capacity in the oil service sector, maintenance of market share, and general market conditions.
Costs of Conducting Our Business
The principal elements of cost of sales for products are the direct and indirect costs to manufacture and supply the product, including labor, materials, machine time, lease expense related to our facilities and freight. The principal elements of cost of sales for rentals are the direct and indirect costs of supplying rental equipment, including depreciation, repairs specifically performed on such rental equipment, lease expense and freight. The principal elements of cost of sales for field service and other are labor, equipment depreciation and repair, equipment lease expense, fuel and supplies.
Selling, general and administrative expense is comprised of costs such as sales and marketing, engineering expenses, general corporate overhead, business development expenses, compensation expense, IT expenses, safety and environmental expenses, legal and professional expenses and other related administrative functions.
Interest expense, net is comprised primarily of interest expense associated with our term loan facility. A portion of the net proceeds of the IPO was used to repay the borrowings outstanding under our term loan facility.
38
Factors Affecting the Comparability of Our Financial Condition and Results of Operations
Our historical financial condition and results of operations for the periods presented may not be comparable, either from period to period or going forward, for the following reasons:
|
· |
Selling, General and Administrative Expenses. We expect to incur additional selling, general and administrative expenses as a result of becoming a publicly traded company. These costs include expenses associated with our annual and quarterly reporting, tax return preparation expenses, Sarbanes‑Oxley compliance expenses, audit fees, legal fees, directors and officers insurance, investor relations expenses, Tax Receivable Agreement administration expenses and registrar and transfer agent fees. These increases in selling, general and administrative expenses are not reflected in our historical financial statements, other than a portion of these costs incurred in 2017 in preparation of becoming a public company. |
|
· |
Corporate Reorganization. The historical consolidated financial statements are based on the financial statements of our accounting predecessor, Cactus LLC and its subsidiaries, prior to our reorganization in connection with our IPO. As a result, the historical consolidated financial data may not provide an accurate indication of what our actual results would have been if such transactions had been completed at the beginning of the periods presented or of what our future results of operations are likely to be. In addition, we entered into a Tax Receivable Agreement with the TRA Holders. This agreement generally provides for the payment by us to the TRA Holders of 85% of the net cash savings, if any, in U.S. federal, state and local income tax or franchise tax that we actually realize or are deemed to realize in certain circumstances as a result of certain increases in tax basis and imputed interest, as described below. We will retain the benefit of the remaining 15% of such net cash savings. For additional information regarding the Tax Receivable Agreement, see “Item 1A. Risk Factors—Risks Related to our Class A Common Stock.” |
We intend to account for any amounts payable under the Tax Receivable Agreement in accordance with Accounting Standard Codification (“ASC”) Topic 450, Contingencies (“ASC 450”). We believe accounting for the Tax Receivable Agreement under the provisions of ASC 450 is appropriate, given the significant uncertainties regarding the amount and timing of payments, if any, to be made under the Tax Receivable Agreement.
The tax benefits covered by the Tax Receivable Agreement include tax benefits expected to arise in connection with the reorganization and the IPO, including (i) certain increases in tax basis that occur as a result of Cactus Inc.’s acquisition (or deemed acquisition for U.S. federal income tax purposes) of CW Units from the Pre-IPO Owners in connection with the IPO, (ii) certain increases in tax basis resulting from the repayment, in connection with the IPO, of borrowings outstanding under Cactus LLC’s term loan facility and (iii) imputed interest deemed to be paid by Cactus Inc. as a result of, and additional tax basis arising from, any payments Cactus Inc. makes under the Tax Receivable Agreement. Payments will generally be made under the Tax Receivable Agreement as we realize actual cash tax savings from such tax benefits (provided that if we experience a change of control or the Tax Receivable Agreement terminates early at our election or as a result of a breach, we could be required to make an immediate lump‑sum payment in advance of any actual cash tax savings).
We will evaluate whether it is more likely than not that actual cash tax savings will be realized by Cactus Inc. from the tax benefits expected to arise in connection with the reorganization and the IPO. If it is determined that it is more likely than not that the tax benefits will be realized through actual cash tax savings, then the Tax Receivable Agreement would be expected to be probable of resulting in future payments and a liability would be recorded. On the other hand, if it is determined that it is more likely than not that the tax benefits will not be realized through actual cash tax savings, then no Tax Receivable
39
Agreement liability would be recorded, as future payments under the Tax Receivable Agreement would not be probable of occurring.
The accounting for any exchanges of CW Units subsequent to the reorganization transaction will follow the same accounting described above.
We will recognize subsequent changes to the measurement of the Tax Receivable Agreement liability in the income statement. In the case of any changes resulting from changes to any valuation allowance associated with the underlying tax asset, given the inextricable link between the tax savings generated and the recognition of the Tax Receivable Agreement liability (i.e., one is recorded based on 85% of the other), and the explicit guidance in ASC 740‑20‑45‑11(g) which requires that subsequent changes in a valuation allowance established against deferred tax assets that arose due to change in tax basis as a result of a transaction among or with shareholders to be recorded in the income statement as opposed to equity, we believe recording of the corollary adjustment to the Tax Receivable Agreement liability in the income statement would also be appropriate.
To the extent Cactus LLC has available cash and subject to the terms of any current or future credit agreements or debt instruments, we intend to cause Cactus LLC to generally make pro rata distributions to its unitholders, including us, in an amount at least sufficient to allow us to pay our taxes and to make payments under the Tax Receivable Agreement. Except in cases where we elect to terminate the Tax Receivable Agreement early or it is otherwise terminated, we may generally elect to defer payments due under the Tax Receivable Agreement if we do not have available cash to satisfy our payment obligations under the Tax Receivable Agreement. Any such deferred payments under the Tax Receivable Agreement generally will accrue interest from the due date for such payment until the payment date.
|
· |
Income Taxes. Our accounting predecessor is a limited liability company that constitutes a partnership for U.S. federal income tax purposes, and therefore is not subject to U.S. federal income taxes. Accordingly, no provision for U.S. federal income taxes has been provided for in our historical results of operations because taxable income was passed through to Cactus LLC’s members. We do not expect to report any income tax benefit or expense attributable to U.S. federal income taxes until after the IPO. After the IPO, we will be taxed as a corporation under the Code and subject to U.S. federal income taxes (currently at a statutory rate of 21% of pretax earnings, as adjusted by the Code), as well as state income taxes, for Cactus Inc.’s share of ownership in Cactus LLC. |
|
· |
Long‑Term Incentive Plan. To incentivize individuals providing services to us or our affiliates, our board adopted a long‑term incentive plan prior to the completion of our IPO. The LTIP provides for the grant, from time to time, at the discretion of our board of directors or a committee thereof, of stock options, stock appreciation rights, restricted stock, restricted stock units, stock awards, dividend equivalents, other stock‑based awards, cash awards, substitute awards and performance awards. Any individual who is our officer or employee or an officer or employee of any of our affiliates, and any other person who provides services to us or our affiliates, including members of our board of directors, will be eligible to receive awards under the LTIP at the discretion of our board of directors. In connection with the IPO, we issued 737,493 restricted stock unit awards, which will vest over one to three years, to certain of our officers and directors. We will recognize equity compensation expenses aggregating up to $5.0 million per year, starting in 2018, over the one to three year vesting term related to this issuance. |
40
Predecessor Consolidated Results of Operations
Year Ended December 31, 2017 Compared to Year Ended December 31, 2016
The following table presents summary consolidated operating results for the periods indicated:
|
|
|
Year Ended |
|
|
|
|
|
|
||||
|
|
|
December 31, |
|
|
|
|
|
|
||||
|
|
|
2017 |
|
2016 |
|
$ Change |
|
% Change |
|
|||
|
|
|
(in thousands) |
|
|||||||||
|
Revenues |
|
|
|
|
|
|
|
|
|
|
|
|
|
Product revenue |
|
$ |
189,091 |
|
$ |
77,739 |
|
$ |
111,352 |
|
143.2 |
% |
|
Rental revenue |
|
|
77,469 |
|
|
44,372 |
|
|
33,097 |
|
74.6 |
|
|
Field service and other revenue |
|
|
74,631 |
|
|
32,937 |
|
|
41,694 |
|
126.6 |
|
|
Total revenues |
|
|
341,191 |
|
|
155,048 |
|
|
186,143 |
|
120.1 |
|
|
Costs and expenses |
|
|
|
|
|
|
|
|
|
|
|
|
|
Cost of product revenue |
|
|
124,030 |
|
|
62,766 |
|
|
61,264 |
|
97.6 |
|
|
Cost of rental revenue |
|
|
40,519 |
|
|
33,990 |
|
|
6,529 |
|
19.2 |
|
|
Cost of field service and other revenue |
|
|
60,602 |
|
|
28,470 |
|
|
32,132 |
|
112.9 |
|
|
Selling, general and administrative expenses |
|
|
27,177 |
|
|
19,207 |
|
|
7,970 |
|
41.5 |
|
|
Total costs and expenses |
|
|
252,328 |
|
|
144,433 |
|
|
107,895 |
|
74.7 |
|
|
Income from operations |
|
|
88,863 |
|
|
10,615 |
|
|
78,248 |
|
737.1 |
|
|
|
|
|
|
|
|
|
|
|
|
|
|
|
|
Interest expense, net |
|
|
(20,767) |
|
|
(20,233) |
|
|
534 |
|
2.6 |
|
|
Other income (expense), net |
|
|
— |
|
|
2,251 |
|
|
(2,251) |
|
(100.0) |
|
|
Income (loss) before income taxes |
|
|
68,096 |
|
|
(7,367) |
|
|
75,463 |
|
nm |
|
|
Income tax expense(1) |
|
|
1,549 |
|
|
809 |
|
|
740 |
|
91.5 |
|
|
Net income (loss) |
|
$ |
66,547 |
|
$ |
(8,176) |
|
$ |
74,723 |
|
nm |
|
nm = not meaningful
|
(1) |
Cactus Inc. is a corporation and is subject to U.S. federal as well as state income tax related to its ownership percentage in Cactus LLC. Our predecessor, Cactus LLC, is not subject to U.S. federal income tax at an entity level. As a result, the consolidated net (loss) income in our historical financial statements does not reflect the tax expense we would have incurred if we were subject to U.S. federal income tax at an entity level during such periods. Cactus LLC is subject to entity‑level taxes for certain states within the United States. Additionally, our operations in both Australia and China are subject to local country income taxes. |
Revenues
Product revenue for the year ended December 31, 2017 was $189.1 million, an increase of $111.4 million, or 143%, from $77.7 million for the year ended December 31, 2016. The increase was primarily attributable to accelerated U.S. land activity in 2017 associated with increased E&P drilling, completions and production, which led to a higher onshore rig count in the United States, resulting in increased demand for our products and greater volume of product sales. Additionally, a change in mix toward higher value advanced wellheads has also contributed to the increase in revenues.
Rental revenue for the year ended December 31, 2017 was $77.5 million, an increase of $33.1 million, or 75%, from $44.4 million for the year ended December 31, 2016. The increase was primarily attributable to increased drilling and completions activities, which led to increased demand for the rental of our equipment in 2017, as well as pricing improvement in our rental fleet compared to 2016.
41
Field service and other revenue for the year ended December 31, 2017 was $74.6 million, an increase of $41.7 million, or 127%, from $32.9 million for the year ended December 31, 2016. The increase was primarily attributable to higher demand for these services following the increase in our product and rental revenue, as field service is closely correlated with these activities.
Costs and expenses
Cost of product revenue for the year ended December 31, 2017 was $124.0 million, an increase of $61.3 million, or 98%, from $62.8 million for the year ended December 31, 2016. The increase was largely attributable to increased product sales volume as a result of higher demand for our products. Product margins benefited from price increases together with a change in mix toward higher value advanced wellheads.
Cost of rental revenue for the year ended December 31, 2017 was $40.5 million, an increase of $6.5 million, or 19%, from $34.0 million for the year ended December 31, 2016. The increase was primarily due to higher depreciation expense from capital additions and higher operating costs due to an increase in activity. Increased utilization and better pricing contributed to higher margins.
Cost of field service and other revenue for the year ended December 31, 2017 was $60.6 million, an increase of $32.1 million, or 113%, from $28.5 million for the year ended December 31, 2016. The increase was primarily due to higher payroll costs attributable to additional field personnel and higher operating costs due to activity increases.
Selling, general and administrative expense for the year ended December 31, 2017 was $27.2 million, an increase of $8.0 million, or 42%, from $19.2 million for the year ended December 31, 2016. The increase was primarily due to higher payroll and incentive compensation costs associated with the overall growth of Cactus. Also, we expensed $1.0 million of costs during 2017 related to preparing for being a public company.
Interest expense, net. Interest expense, net for the year ended December 31, 2017 was $20.8 million, an increase of $0.5 million, or 3%, from $20.2 million for the year ended December 31, 2016. The increase was primarily due to higher average interest rates on borrowings under our credit facility and increased interest related to amounts on capital lease obligations.
Other income (expense), net. Other income, net for 2016 relates to a gain on debt extinguishment of $2.3 million associated with our redemption of $7.5 million of debt outstanding under our term loan during the second quarter of 2016.
Income tax expense. Although our operations have not been subject to U.S. federal income tax at an entity level, our operations are subject to state taxes within the United States. In addition, Cactus LLC’s operations located in China and Australia are subject to local country income taxes. Income tax expense for the years ended December 31, 2017 and 2016 were $1.5 million and $0.8 million, respectively.
42
Year Ended December 31, 2016 Compared to Year Ended December 31, 2015
The following table presents summary consolidated operating results for the periods presented:
|
|
|
Year Ended |
|
|
|
|
|
|
||||
|
|
|
December 31, |
|
|
|
|
|
|
||||
|
|
|
2016 |
|
2015 |
|
$ Change |
|
% Change |
|
|||
|
|
|
(in thousands) |
|
|||||||||
|
Revenues |
|
|
|
|
|
|
|
|
|
|
|
|
|
Product revenue |
|
$ |
77,739 |
|
$ |
110,917 |
|
$ |
(33,178) |
|
(29.9) |
% |
|
Rental revenue |
|
|
44,372 |
|
|
65,431 |
|
|
(21,059) |
|
(32.2) |
|
|
Field service and other revenue |
|
|
32,937 |
|
|
45,047 |
|
|
(12,110) |
|
(26.9) |
|
|
Total revenues |
|
|
155,048 |
|
|
221,395 |
|
|
(66,347) |
|
(30.0) |
|
|
Costs and expenses |
|
|
|
|
|
|
|
|
|
|
|
|
|
Cost of product revenue |
|
|
62,766 |
|
|
84,604 |
|
|
(21,838) |
|
(25.8) |
|
|
Cost of rental revenue |
|
|
33,990 |
|
|
39,251 |
|
|
(5,261) |
|
(13.4) |
|
|
Cost of field service and other revenue |
|
|
28,470 |
|
|
33,200 |
|
|
(4,730) |
|
(14.2) |
|
|
Selling, general and administrative expenses |
|
|
19,207 |
|
|
22,135 |
|
|
(2,928) |
|
(13.2) |
|
|
Total costs and expenses |
|
|
144,433 |
|
|
179,190 |
|
|
(34,757) |
|
(19.4) |
|
|
Income from operations |
|
|
10,615 |
|
|
42,205 |
|
|
(31,590) |
|
(74.8) |
|
|
|
|
|
|
|
|
|
|
|
|
|
|
|
|
Interest expense, net |
|
|
(20,233) |
|
|
(21,837) |
|
|
(1,604) |
|
(7.3) |
|
|
Other income (expense), net |
|
|
2,251 |
|
|
1,640 |
|
|
611 |
|
37.3 |
|
|
Income (loss) before income taxes |
|
|
(7,367) |
|
|
22,008 |
|
|
(29,375) |
|
nm |
|
|
Income tax expense(1) |
|
|
809 |
|
|
784 |
|
|
25 |
|
3.2 |
|
|
Net income (loss) |
|
$ |
(8,176) |
|
$ |
21,224 |
|
$ |
(29,400) |
|
nm |
|
nm = not meaningful
|
(1) |
Cactus Inc. is a corporation and is subject to U.S. federal as well as state income tax related to its ownership percentage in Cactus LLC. Our predecessor, Cactus LLC, is not subject to U.S. federal income tax at an entity level. As a result, the consolidated net (loss) income in our historical financial statements does not reflect the tax expense we would have incurred if we were subject to U.S. federal income tax at an entity level during such periods. Cactus LLC is subject to entity‑level taxes for certain states within the United States. Additionally, our operations in both Australia and China are subject to local country income taxes. |
Revenues
Product revenue for the year ended December 31, 2016 was $77.7 million, a decrease of $33.2 million, or 30%, from $110.9 million for the year ended December 31, 2015. The decrease was primarily attributable to the decline in crude oil prices, which led to a lower onshore rig count in the United States, resulting in a lower demand for our products.
Rental revenue for the year ended December 31, 2016 was $44.4 million, a decrease of $21.1 million, or 32%, from $65.4 million for the year ended December 31, 2015. The decrease was primarily attributable to the decline in oil prices, which reduced drilling and completions activities. These factors reduced demand for the rental of our equipment and put downward pressure on rental pricing.
Field service and other revenue for the year ended December 31, 2016 was $32.9 million, a decrease of $12.1 million, or 27%, from $45.0 million for the year ended December 31, 2015. The decrease was primarily attributable to a reduction in demand for our services following the decline in crude oil prices, resulting in lower rig count.
43
Costs and expenses
Cost of product revenue for the year ended December 31, 2016 was $62.8 million, a decrease of $21.8 million, or 26%, from $84.6 million for the year ended December 31, 2015. The decrease was primarily attributable to reduced product sales volume as a result of lower demand for our products.
Cost of rental revenue for the year ended December 31, 2016 was $34.0 million, a decrease of $5.3 million, or 13%, from $39.3 million for the year ended December 31, 2015. The decrease was primarily due to lower repair costs.
Cost of field service and other revenue for the year ended December 31, 2016 was $28.5 million, a decrease of $4.7 million, or 14%, from $33.2 million for the year ended December 31, 2015. The decrease was primarily due to reduction in payroll costs and branch overhead costs.
Selling, general and administrative expense for the year ended December 31, 2016 was $19.2 million, a decrease of $2.9 million, or 13%, from $22.1 million for the year ended December 31, 2015. The decrease was largely due to lower headcount costs and a reduction in the provision for doubtful accounts.
Interest expense, net. Interest expense, net for the year ended December 31, 2016 was $20.2 million, a decrease of $1.6 million, or 7%, from $21.8 million for the year ended December 31, 2015. The decrease was primarily related to reduced interest expense due to less average debt outstanding under our credit agreement during 2016 from the early redemptions of this debt in 2016 and 2015.
Other income (expense), net. The increase was due to a higher gain arising from the redemption of $7.5 million of the debt outstanding under our credit agreement during 2016 compared to the gain recognized during 2015 from the redemption of $10.0 million of the debt outstanding under our credit agreement.
Income tax expense. Although our operations have not been subject to U.S. federal income tax at an entity level, our operations are subject to state taxes within the United States. In addition, Cactus LLC’s operations located in China and Australia are subject to local country income taxes. Income tax expense for the year ended December 31, 2016 and 2015 remained consistent at $0.8 million.
Liquidity and Capital Resources
In February 2018, we completed our IPO. We received net proceeds of $467.4 million from the sale of 26,450,000 shares of Class A Common Stock in the IPO. We contributed all of the net proceeds of the IPO to Cactus LLC in exchange for CW Units. Cactus LLC used (i) $251.0 million of the net proceeds to repay all of the borrowings outstanding, plus accrued interest, under its term loan facility and (ii) $216.4 million to redeem CW Units from certain direct and indirect owners of Cactus LLC.
We expect that our primary sources of liquidity and capital resources will be cash flows generated by operating activities and borrowings under our revolving credit facility. Depending upon market conditions and other factors, we may also have the ability to issue additional equity and debt if needed.
Historically, our predecessor’s primary sources of liquidity were cash flows from operations, borrowings under Cactus LLC’s credit agreement and equity provided by the Pre-IPO Owners. Our predecessor’s primary use of capital has been for working capital purposes, to make cash distributions to the Pre-IPO Owners and repay indebtedness. Prior to the repayment of the term loan facility in conjunction with the IPO, our predecessor’s borrowings outstanding under Cactus LLC’s credit agreement were $248.5 million and $251.1 million at December 31, 2017 and 2016, respectively. Borrowings were used primarily for working capital purposes, to make cash distributions to the Pre-IPO Owners and repay indebtedness.
44
Our ability to satisfy our liquidity requirements, including cash distributions to the CW Unit Holders to fund their share of taxes of the partnership, depends on our future operating performance, which is affected by prevailing economic conditions, market conditions in the E&P industry, availability and cost of raw materials, and financial, business and other factors, many of which are beyond our control.
We currently estimate that our capital expenditures for the year ending December 31, 2018 will range from $40 million to $50 million, excluding acquisitions. We have begun expanding our investments in frac equipment in response to increasing opportunities and client demands, and we expect to expand our facilities. We continuously evaluate our capital expenditures, and the amount we ultimately spend will depend on a number of factors, including, among other things, demand for rental assets, prevailing economic conditions, market conditions in the E&P industry, customers’ forecasts, demand volatility and company initiatives. We believe that our existing cash on hand, cash generated from operations and available borrowings under our revolving credit facility will be sufficient to meet working capital requirements, anticipated capital expenditures, expected cash distributions to the CW Unit Holders and anticipated tax liabilities for at least the next 12 months.
At December 31, 2017 and December 31, 2016, we had approximately $7.6 million and $8.7 million, respectively, of cash and cash equivalents and approximately $50 million and $15 million, respectively, of available borrowing capacity under our revolving credit facility. As of December 31, 2017, there were no borrowings outstanding under the revolving credit facility and $50 million in available borrowing capacity thereunder. On January 21, 2018, the board of directors of Cactus LLC declared a cash distribution of $26.0 million, which was paid to the Pre-IPO Owners on January 25, 2018. Such distribution was funded by borrowing under the revolving credit facility. The purpose of the distribution was to provide funds to the Pre-IPO Owners to pay their federal and state tax liabilities associated with taxable income recognized by them as a result of their ownership interests in Cactus LLC prior to the completion of our IPO. As of March 13, 2018, we had $8.0 million outstanding under the revolving credit facility and approximately $11.0 million of cash and cash equivalents.
Cash Flows
Year Ended December 31, 2017 Compared to Year Ended December 31, 2016
The following table summarizes our cash flows for the periods indicated:
|
|
|
Year Ended December 31, |
||||
|
|
|
2017 |
|
2016 |
||
|
|
|
(in thousands) |
||||
|
Net cash provided by operating activities |
|
$ |
34,707 |
|
$ |
23,975 |
|
Net cash used in investing activities |
|
|
(30,678) |
|
|
(17,358) |
|
Net cash used in financing activities |
|
|
(5,313) |
|
|
(10,171) |
Net cash provided by operating activities was $34.7 million and $24.0 million for the years ended December 31, 2017 and 2016, respectively. The primary reason for the change was the $74.7 million increase in net income and $3.2 million increase in non-cash items, offset by a $67.2 million increase in net working capital items due to the significant increase in business activity during the second half of 2017.
Net cash used in investing activities was $30.7 million and $17.4 million for the years ended December 31, 2017 and 2016, respectively. The primary reason for the change was higher capital expenditures during 2017 related to the additional investments in our rental fleet as market activity improved significantly during 2017.
Net cash used in financing activities was $5.3 million and $10.2 million for the years ended December 31, 2017 and 2016, respectively. The primary reason for the change was due to less debt service in 2017 as 2016 included a partial
45
redemption of principal under our term loan. Also, there were no distributions to members in 2017 compared to $2.1 million in 2016.
Year Ended December 31, 2016 Compared to Year Ended December 31, 2015
The following table summarizes our cash flows for the periods indicated:
|
|
|
Year Ended December 31, |
||||
|
|
|
2016 |
|
2015 |
||
|
|
|
(in thousands) |
||||
|
Net cash provided by operating activities |
|
$ |
23,975 |
|
$ |
45,927 |
|
Net cash used in investing activities |
|
|
(17,358) |
|
|
(23,422) |
|
Net cash used in financing activities |
|
|
(10,171) |
|
|
(22,776) |
Net cash provided by operating activities was $24.0 million and $45.9 million for the years ended December 31, 2016 and 2015, respectively. The primary cause of the reduction was the $29.4 million reduction in net income, partially offset by an $8.9 million reduction in net working capital items.
Net cash used in investing activities was $17.4 million and $23.4 million for the years ended December 31, 2016 and 2015, respectively. The primary reason for the change was a $3.6 million reduction in capital expenditures from 2015 to 2016 following a facility expansion and additional purchases of property and equipment in 2015.
Net cash used in financing activities was $10.2 million and $22.8 million for the years ended December 31, 2016 and 2015, respectively. The primary reason for the change was lower distributions to members of $10.2 million in 2016 compared to 2015.
Credit Agreement
On July 31, 2014, we entered into a credit agreement with Credit Suisse AG as administrative agent, collateral agent and issuing bank, and the other lenders party thereto (the “Credit Agreement”). The Credit Agreement provides for a term loan tranche in an aggregate principal amount of $275.0 million, the outstanding balance of which was repaid in full with the net proceeds of the IPO, and a revolving credit facility of up to $50.0 million with a $10.0 million sublimit for letters of credit. The revolving credit facility matures on July 31, 2019.
As of December 31, 2017 and 2016, we had $248.5 million and $251.1 million, respectively, of borrowings outstanding under the term loan, no borrowings outstanding under the revolving credit facility and no outstanding letters of credit. In conjunction with our IPO, we repaid the $248.5 million outstanding under the term loan, plus accrued interest.
On January 21, 2018, the board of directors of Cactus LLC declared a cash distribution of $26.0 million, which was paid to the Pre-IPO Owners on January 25, 2018. Such distribution was funded by a $26.0 million borrowing under the revolving credit facility. As of March 13, 2018, we had $8.0 million outstanding on the revolving credit facility.
The Credit Agreement is secured by liens on substantially all of our properties and guarantees from Cactus LLC and any future subsidiaries of Cactus LLC that may become guarantors under the Credit Agreement. The Credit Agreement contains restrictive covenants that may limit our ability to, among other things:
|
· |
incur additional indebtedness; |
|
· |
incur liens; |
46
|
· |
enter into sale and lease‑back transactions; |
|
· |
make investments or dispositions; |
|
· |
make loans to others; |
|
· |
enter into mergers or consolidations; |
|
· |
enter into transactions with affiliates; |
|
· |
issue additional equity interests at the subsidiary level or issue disqualified equity interests; and |
|
· |
make or declare dividends. |
The Credit Agreement also requires us to maintain a total leverage ratio, as defined in the Credit Agreement, of not more than 5:00 to 1:00 as of the last day of any fiscal quarter, if the total aggregate principal amount of borrowings and letters of credit outstanding under the revolving credit facility (but excluding (x) undrawn letters of credit which have been cash collateralized by at least 103% of the undrawn amount of such letters of credit and (y) any other undrawn letters of credit up to $2.5 million in the aggregate as of the last day of such fiscal quarter) exceeds an amount equal to 30% of the aggregate revolving credit commitments as of such day.
If an event of default occurs under the Credit Agreement, subject to certain cure rights with respect to certain of the events of default, the lenders will be able to accelerate the maturity of the Credit Agreement and all outstanding amounts thereunder, foreclose on the collateral and/or terminate their revolving loan commitments. The Credit Agreement contains customary events of default, such as, among other things:
|
· |
inaccuracy of any representation and warranty; |
|
· |
failure to repay principal and interest when due and payable; |
|
· |
failure to comply with the financial covenant or other covenants; |
|
· |
cross‑default to certain other material indebtedness; |
|
· |
bankruptcy and other insolvency events; |
|
· |
the occurrence of certain litigation judgments; or |
|
· |
a change of control. |
As of December 31, 2017 and 2016, we were in compliance with all covenants under the Credit Agreement.
Interest is payable quarterly for alternate base rate loans and at the end of the applicable interest period for Eurodollar loans (or quarterly if the applicable interest period is longer than three months). We have a choice of borrowing at an adjusted Eurodollar rate (subject to a 1.0% floor) plus an applicable margin or at the alternate base rate plus an applicable margin. The alternate base rate per annum is equal to the greatest of (i) the agent bank’s reference prime rate, (ii) the federal funds effective rate plus 0.5% and (iii) the adjusted LIBO rate for a one month interest period plus 1.0%. The applicable margin with respect to any Eurodollar revolving loan ranges from 2.75% to 3.75% and alternate base rate revolving loan ranges from 1.75% to 2.75% based on our total leverage ratio. During the continuance
47
of an event of default due to failure to pay interest or other amounts under the Credit Agreement, all overdue amounts under the Credit Agreement will bear interest at 2.0% plus the otherwise applicable interest rate.
As of December 31, 2017 and 2016, borrowings under the Credit Agreement had a weighted average interest rate of 7.3% and 7.0%, respectively.
Tax Receivable Agreement
The Tax Receivable Agreement that Cactus Inc. entered into with the TRA Holders in connection with our IPO generally provides for the payment by Cactus Inc. to the TRA Holders of 85% of the net cash savings, if any, in U.S. federal, state and local income tax or franchise tax that Cactus Inc. actually realizes or is deemed to realize in certain circumstances. Cactus Inc. will retain the benefit of the remaining 15% of these net cash savings. To the extent Cactus LLC has available cash, we intend to cause Cactus LLC to make generally pro rata distributions to its unitholders, including us, in an amount at least sufficient to allow us to pay our taxes and to make payments under the Tax Receivable Agreement.
Except in cases where we elect to terminate the Tax Receivable Agreement early, the Tax Receivable Agreement is terminated early due to certain mergers, asset sales, or other forms of business combinations or changes of control or we have available cash but fail to make payments when due under circumstances where we do not have the right to elect to defer the payment, we may generally elect to defer payments due under the Tax Receivable Agreement if we do not have available cash to satisfy our payment obligations under the Tax Receivable Agreement. Any such deferred payments under the Tax Receivable Agreement generally will accrue interest. In certain cases, payments under the Tax Receivable Agreement may be accelerated and/or significantly exceed the actual benefits, if any, we realize in respect of the tax attributes subject to the Tax Receivable Agreement. In these situations, our obligations under the Tax Receivable Agreement could have a substantial negative impact on our liquidity. For further discussion regarding the potential acceleration of payments under the Tax Receivable Agreement and its potential impact, please read “Item 1A. Risk Factors—Risks Related to Our Class A Common Stock.”
Contractual Obligations
A summary of our predecessor’s contractual obligations as of December 31, 2017 is provided in the following table.
|
|
|
Predecessor |
|||||||||||||||||||
|
|
|
Payments Due by Period For the Year Ending December 31, |
|||||||||||||||||||
|
|
|
2018 |
|
2019 |
|
2020 |
|
2021 |
|
2022 |
|
Thereafter |
|
Total |
|||||||
|
|
|
(in thousands) |
|||||||||||||||||||
|
Long-term debt, including current portion(1) |
|
$ |
2,568 |
|
$ |
2,568 |
|
$ |
243,393 |
|
$ |
— |
|
$ |
— |
|
$ |
— |
|
$ |
248,529 |
|
Interest on long-term debt(2) |
|
|
18,322 |
|
|
18,135 |
|
|
10,474 |
|
|
— |
|
|
— |
|
|
— |
|
|
46,931 |
|
Operating lease obligations(3) |
|
|
5,506 |
|
|
4,083 |
|
|
3,752 |
|
|
3,077 |
|
|
2,031 |
|
|
4,713 |
|
|
23,162 |
|
Capital lease obligations(4) |
|
|
5,296 |
|
|
5,394 |
|
|
3,475 |
|
|
— |
|
|
— |
|
|
— |
|
|
14,165 |
|
Total |
|
$ |
31,692 |
|
$ |
30,180 |
|
$ |
261,094 |
|
$ |
3,077 |
|
$ |
2,031 |
|
$ |
4,713 |
|
$ |
332,787 |
|
(1) |
Long‑term debt excludes interest payments on each obligation. The term loan was repaid in full in February 2018 in connection with our IPO. |
|
(2) |
Relates to our term loan. Interest on long‑term debt assumes no excess cash flow payments. Interest rate used for the calculation was 7.3%. The term loan, plus accrued interest, was repaid in full in February 2018 using the net proceeds from our IPO. As such, the entire interest expense reflected in the table will not be incurred. |
|
(3) |
Operating lease obligations relate to real estate, vehicles and equipment. |
|
(4) |
Capital lease obligations relate to vehicles used in our business. |
48
The contractual obligations table does not include any Tax Receivable Agreement liability associated with the redemptions of CW Units made in connection with our reorganization and IPO in February 2018.
Critical Accounting Policies and Estimates
The discussion and analysis of our financial condition and results of operations are based upon our consolidated financial statements, which have been prepared in accordance with GAAP. The preparation of our financial statements requires us to make estimates and assumptions that affect the reported amounts of assets, liabilities, revenues and expenses and related disclosure of contingent assets and liabilities. Certain accounting policies involve judgments and uncertainties to such an extent that there is reasonable likelihood that materially different amounts could have been reported under different conditions, or if different assumptions had been used. We evaluate our estimates and assumptions on a regular basis. We base our estimates on historical experience and various other assumptions that are believed to be reasonable under the circumstances, the results of which form the basis for making judgments about the carrying values of assets and liabilities that are not readily apparent from other sources. Actual results may differ from these estimates and assumptions used in preparation of our consolidated financial statements. See Note 2 in the notes to the audited consolidated financial statements of Cactus LLC for an expanded discussion of our significant accounting policies and estimates made by management.
Accounts Receivable
We extend credit to customers in the normal course of business. In our determination of the allowance for doubtful accounts, we assess those amounts where there are concerns over collection and record an allowance for that amount. Estimating this amount requires us to analyze the financial condition of our customers, our historical experience and any specific concerns. By its nature, such an estimate is highly subjective and it is possible that the amount of accounts receivable that we are unable to collect may be different from the amount initially estimated.
The allowance for doubtful accounts as of December 31, 2017 was $0.7 million, compared to $0.9 million as of December 31, 2016, representing approximately 1.0% and 2.6%, respectively, of our consolidated gross accounts receivable. A 10% increase in our allowance for doubtful accounts at December 31, 2017 would result in a change in reserves of approximately $0.1 million and a change in income before income taxes by the same amount. Currently, management does not believe that there is a reasonable likelihood that there will be a material change in the future estimates or assumptions that were used to calculate our allowance for doubtful accounts.
Inventories
Inventories are stated at the lower of cost or net realizable value. Cost is determined using standard cost (which approximates average cost) and weighted average methods. Costs include an application of related direct labor and overhead cost. Net realizable value is the estimated selling price in the ordinary course of business, less reasonably predictable costs of completion, disposal and transportation. Reserves are made for obsolete and slow‑moving items based on a range of factors, including age, usage and technological or market changes that may impact demand for those products. The amount of allowance recorded is subjective and it may be that the level of provision required may be different from that initially recorded.
The inventory obsolescence reserve as of December 31, 2017 was $5.9 million, compared to $4.8 million as of December 31, 2016, representing approximately 8.4% and 11.2%, respectively, of our consolidated gross inventories. A 10% increase in our inventory obsolescence reserve at December 31, 2017 would result in a change in reserves of approximately $0.6 million and a change in income before income taxes by the same amount. Currently, management does not believe that there is a reasonable likelihood that there will be a material change in the future estimates or assumptions that were used to calculate our inventory obsolescence reserve.
49
Long‑Lived Assets
Key estimates related to long‑lived assets include useful lives and recoverability of carrying values. Such estimates could be modified, as impairment could arise as a result of changes in supply and demand fundamentals, technological developments, new competitors with cost advantages and the cyclical nature of the oil and gas industry. We evaluate long‑lived assets for potential impairment indicators whenever events or changes in circumstances indicate that the carrying amount of an asset may not be recoverable. Long‑lived assets assessed for impairment are grouped at the lowest level for which identifiable cash flows are available, and a provision made where the cash flow is less than the carrying value of the asset. Actual impairment losses could vary from amounts estimated.
Goodwill
Goodwill represents the excess of acquisition consideration paid over the fair value of identifiable net tangible and identifiable intangible assets acquired. Goodwill is not amortized, but is reviewed for impairment on an annual basis (or more frequently if impairment indicators exist). We have established December 31st as the date of our annual test for impairment of goodwill. We perform a qualitative assessment of the fair value of our reporting unit before calculating the fair value of the reporting unit in step one of the two‑step goodwill impairment model. If, through the qualitative assessment, we determine that it is more likely than not that the reporting unit’s fair value is greater than its carrying value, the remaining impairment steps would be unnecessary.
If there are indicators that goodwill has been impaired and thus the two‑step goodwill impairment model is necessary, step one is to determine the fair value of the reporting unit and compare it to the reporting unit’s carrying value. Fair value is determined based on the present value of estimated cash flows using available information regarding expected cash flows of each reporting unit, discount rates and the expected long‑term cash flow growth rates. If the fair value of the reporting unit exceeds the carrying value, goodwill is not impaired and no further testing is performed. The second step is performed if the carrying value exceeds the fair value. The implied fair value of the reporting unit’s goodwill must be determined and compared to the carrying value of the goodwill. If the carrying value of a reporting unit’s goodwill exceeds its implied fair value, an impairment loss equal to the difference will be recorded.
Goodwill as of December 31, 2017 was $7.8 million, which is the same value as the year ended December 31, 2016. We performed our annual impairment analysis and concluded there was no impairment. A 10% decrease in the fair value of our reporting unit at December 31, 2017 would not result in an impairment. Currently, management does not believe that there is a reasonable likelihood that there will be a material change in the carrying value of goodwill.
Product Warranties
We generally warrant our manufactured products 12 months from the date placed in service, although where product failures arise, they typically manifest themselves at the time of installation at the well site. Most failures are the result of installation errors rather than product defects and are addressed by not charging service time required to remedy such errors. In rare instances, our customers request compensation for non‑productive time at the well site. Any compensation provided is voluntarily granted to promote strong customer relationships, as our master service agreements include waivers of consequential damages.
The accruals for product warranties as of December 31, 2017 were $0.3 million, compared to $0.1 million as of December 31, 2016, representing approximately 0.2% and 0.1% of our annualized product revenues for the respective periods. A 10% increase in our accruals for product warranties at December 31, 2017 would result in a change in accruals of less than $0.1 million and a change in income before income taxes by the same amount. Currently, management does not believe that there is a reasonable likelihood that there will be a material change in the future estimates or assumptions that were used to calculate our accruals for product warranties.
50
Income Taxes
Cactus LLC is a limited liability company and files a U.S. Return of Partnership Income, which includes both U.S. and foreign operations. As a limited liability company, Cactus LLC is treated as a partnership, and the members of Cactus LLC are taxed individually on their share of our earnings for U.S. federal income tax purposes. Accordingly, no provision for U.S. federal income taxes has been made in the accompanying consolidated financial statements.
We are subject to state taxes within the United States. However, the income generated by Cactus LLC flows through to the members’ individual state tax returns. Additionally, our operations in both Australia and China are subject to local country income taxes.
We follow guidance issued by the Financial Accounting Standards Board (“FASB”), which clarifies accounting for uncertainty in income taxes by prescribing the minimum recognition threshold an income tax position is required to meet before being recognized in the consolidated financial statements and applies to all income tax positions. Each income tax position is assessed using a two‑step process. A determination is first made as to whether it is more likely than not that the income tax position will be sustained, based upon technical merits, upon examination by the taxing authorities. If the income tax position is expected to meet the more likely than not criteria, the benefit recorded in the consolidated financial statements equals the largest amount that is greater than 50% likely to be realized upon its ultimate settlement.
Deferred taxes are recorded using the liability method, whereby tax assets and liabilities are determined based on the differences between the financial statement and tax basis of assets and liabilities using enacted tax rates in effect for the year in which the differences are expected to reverse. The realizability of deferred tax assets are evaluated annually and a valuation allowance is provided if it is more likely than not that the deferred tax assets will not give rise to future benefits in our tax returns.
We intend to account for any amounts payable under the Tax Receivable Agreement in accordance with ASC 450. We believe accounting for the Tax Receivable Agreement under the provisions of ASC 450 is appropriate, given the significant uncertainties regarding the amount and timing of payments, if any, to be made under the Tax Receivable Agreement.
U.S. Federal Income Tax Reform
On December 22, 2017, the President of the United States signed into law legislation informally known as the Tax Cuts and Jobs Act (the “Act”). The Act represents major tax reform legislation that, among other provisions, reduces the U.S. corporate tax rate. As of December 31, 2017, since Cactus LLC is a pass-through entity, management considers that the abovementioned Act will have an immaterial impact. However, going forward, the Company will analyze the impact based on revised circumstances.
Fair Value Measures
Fair value measurements—We record our financial assets and financial liabilities at fair value. Fair value is defined as the price that would be received to sell an asset or paid to transfer a liability (an exit price) in an orderly transaction between market participants at the reporting date. The fair value framework requires the categorization of assets and liabilities into three levels based upon the assumptions (inputs) used to price the assets or liabilities, with the exception of certain assets and liabilities measured using the net asset value practical expedient, which are not required to be leveled. Level 1 provides the most reliable measure of fair value, whereas Level 3 generally requires significant management judgment. The three levels are defined as follows:
|
· |
Level 1: Unadjusted quoted prices in active markets for identical assets and liabilities. |
51
|
· |
Level 2: Observable inputs other than quoted prices included in Level 1. For example, quoted prices for similar assets or liabilities in active markets or quoted prices for identical assets or liabilities in inactive markets. |
|
· |
Level 3: Unobservable inputs reflecting management’s own assumptions about the assumptions market participants would use in pricing the asset or liability. |
Fair value of long‑lived, non‑financial assets—Long‑lived, non‑financial assets are measured at fair value on a non‑recurring basis for the purposes of calculating potential impairment. The fair value measurements of our long‑lived, non‑financial assets measured on a non‑recurring basis are determined by estimating the amount and timing of net future cash flows, which are Level 3 unobservable inputs, and discounting them using a risk‑adjusted rate of interest. Significant increases or decreases in actual cash flows may result in valuation changes.
Other fair value disclosures—The carrying amounts of cash and cash equivalents, receivables, accounts payable, short‑term debt, commercial paper, debt associated with our Credit Agreement as well as amounts included in other current assets and other current liabilities that meet the definition of financial instruments, approximate fair value.
Stock‑based Compensation
We recognize stock-based compensation expense using a fair value method. Fair value methods use a valuation model to theoretically value stock option grants even though they are not available for trading and are of longer duration. The Black‑Scholes‑Merton option‑pricing model that we use includes the input of certain variables that are dependent on future expectations, including the expected lives of the options from grant date to maturity date, the level of volatility of peer companies in our industry, risk‑free interest rate and an assumption that there will be no forfeitures or future distributions. Our estimates of these variables are made for the purpose of using the valuation model to determine an expense for each reporting period and are not subsequently adjusted. These estimates are not considered highly complex or subjective. These estimates will not be necessary to determine the fair value of new stock awards once the underlying shares begin trading.
Recent Accounting Pronouncements
See Note 2 in the notes to the audited consolidated financial statements of Cactus LLC for discussion of recent accounting pronouncements.
Inflation
Inflation in the United States has been relatively low in recent years and did not have a material impact on our results of operations for the years ended December 31, 2017, 2016 and 2015. Although the impact of inflation has been insignificant in recent years, it is still a factor in the United States economy, and we tend to experience inflationary pressure on wages and raw materials.
Off‑Balance Sheet Arrangements
Currently, neither we nor our predecessor have off‑balance sheet arrangements.
Item 7A. Quantitative and Qualitative Disclosures about Market Risk
We are exposed to market risk from changes in foreign currency rates and changes in interest rates.
52
We outsource certain of our wellhead equipment to suppliers in China, and our production facility in China assembles and tests these outsourced components, as we do not engage in machining operations in this facility. In addition, we have a service center in Australia that sells products, rents frac equipment and provides field services. To the extent either facility has net U.S. dollar denominated assets, our profitability is eroded when the U.S. dollar weakens against the Chinese Yuan and the Australian dollar. Our production facility in China generally has net U.S. dollar denominated assets, while our service center in Australia generally has net U.S. dollar denominated liabilities. The U.S. dollar translated profits and net assets of our facilities in China and Australia are eroded if the respective local currency value weakens against the U.S. dollar. We have not entered into any derivative arrangements to protect against fluctuations in foreign currency exchange rates.
During 2015, we entered into an interest rate hedge with a duration of five years, expiring in July 2020, to manage our exposure under the term loan tranche of our Credit Agreement. Pursuant to the terms of the hedge contract, we are not liable for any interest arising from LIBOR exceeding 6% with respect to up to $200 million of our borrowings outstanding under our term loan. As of December 31, 2017, 2016 and 2015, the fair value of the hedge was $1,000, $68,000 and $88,000, respectively. In conjunction with the completion of our IPO and the repayment in full of our outstanding term loan using the net proceeds from our IPO, we terminated the hedge contract for no value.
53
Item 8. Financial Statements and Supplementary Data
The following Consolidated Financial Statements are filed as part of this Annual Report:
Cactus, Inc.
| 55 | |
|
|
|
| 56 | |
|
|
|
| 57 |
Cactus Wellhead, LLC (Predecessor)
54
Report of Independent Registered Public Accounting Firm
To the Board of Directors of Cactus, Inc.
Opinion on the Financial Statements
We have audited the accompanying balance sheets of Cactus, Inc. (the “Company”) as of December 31, 2017 and February 17, 2017, including the related notes (collectively referred to as the “financial statements”). In our opinion, the financial statements present fairly, in all material respects, the financial position of the Company as of December 31, 2017 and February 17, 2017 in conformity with accounting principles generally accepted in the United States of America.
Basis for Opinion
The financial statements are the responsibility of the Company’s management. Our responsibility is to express an opinion on the Company’s financial statements based on our audits. We are a public accounting firm registered with the Public Company Accounting Oversight Board (United States) (“PCAOB”) and are required to be independent with respect to the Company in accordance with the U.S. federal securities laws and the applicable rules and regulations of the Securities and Exchange Commission and the PCAOB.
We conducted our audits of these financial statements in accordance with the standards of the PCAOB. Those standards require that we plan and perform the audit to obtain reasonable assurance about whether the financial statements are free of material misstatement, whether due to error or fraud.
Our audits included performing procedures to assess the risks of material misstatement of the financial statements, whether due to error or fraud, and performing procedures that respond to those risks. Such procedures included examining, on a test basis, evidence regarding the amounts and disclosures in the financial statements. Our audits also included evaluating the accounting principles used and significant estimates made by management, as well as evaluating the overall presentation of the financial statements. We believe that our audits provide a reasonable basis for our opinion.
/s/ PricewaterhouseCoopers LLP
Houston, Texas
March 19, 2018
We have served as the Company’s auditor since 2015.
55
CACTUS, INC.
|
|
|
December 31, |
|
February 17, |
||
|
|
|
2017 |
|
2017 |
||
|
|
|
(in thousands, except share data) |
||||
|
Assets |
|
|
|
|
|
|
|
Cash and cash equivalents |
|
$ |
— |
|
$ |
— |
|
Total assets |
|
$ |
— |
|
$ |
— |
|
|
|
|
|
|
|
|
|
Liabilities and Stockholder's Equity |
|
|
|
|
|
|
|
Total liabilities |
|
$ |
— |
|
$ |
— |
|
|
|
|
|
|
|
|
|
Commitments and contingencies |
|
|
|
|
|
|
|
Stockholder's Equity |
|
|
|
|
|
|
|
Common stock, par value $0.01 per share, 1,000,000 shares authorized, none issued and outstanding |
|
|
— |
|
|
— |
|
Total stockholder's equity |
|
|
— |
|
|
— |
|
Total liabilities and stockholder's equity |
|
$ |
— |
|
$ |
— |
The accompanying notes are an integral part of this balance sheet.
56
CACTUS, INC.
(in thousands, unless otherwise indicated)
1. Organization and Operations
Cactus, Inc. (the “Company”) is a Delaware corporation, incorporated on February 17, 2017. Pursuant to a reorganization and completion of the Company’s initial public offering on February 12, 2018 (the “IPO”), the Company became a holding corporation for Cactus Wellhead, LLC (“Cactus LLC”) and its subsidiaries. Following completion of the IPO, the Company’s sole material assets are units in Cactus LLC (“CW Units”). See note 4.
2. Summary of Significant Accounting Policies
Basis of Presentation
The Company’s balance sheet has been prepared in accordance with U.S. generally accepted accounting principles. Separate statements of income and comprehensive income, cash flows and changes in stockholder’s equity have not been presented because the Company has had no operations to date.
3. Stockholder’s Equity
As of December 31, 2017, the Company was authorized to issue 1 million shares of common stock with a par value of $0.01 per share. The Board of Directors has the authority to issue one or more series of preferred stock without stockholder approval. In conjunction with the IPO, the Company amended its articles of incorporation to increase the number of authorized shares.
4. Subsequent Events
On February 12, 2018, in connection with the completion of the Company’s IPO, Cactus Inc. became the managing member of Cactus LLC and is responsible for all operational, management and administrative decisions relating to Cactus LLC’s business.
Pursuant to the IPO, the Company issued 23,000,000 shares of Class A common stock, par value $0.01 per share (“Class A Common Stock”), at a price to the public of $19.00 per share. The Company received net proceeds of $405.8 million after deducting underwriting discounts and commissions and estimated offering expenses of the IPO. On February 14, 2018 the Company sold an additional 3,450,000 shares of Class A Common Stock pursuant to the exercise by the underwriters in full of their option to purchase additional shares of Class A Common Stock (the “Option”), resulting in $61.6 million of additional net proceeds after deducting underwriting discounts and commissions. The Company contributed all of the net proceeds of the IPO to Cactus LLC in exchange for CW Units. Cactus LLC used (i) $251.0 million of the net proceeds to repay all of the borrowings outstanding under its term loan facility, including accrued interest and (ii) $216.4 million to redeem CW Units from certain direct and indirect owners of Cactus LLC.
57
Report of Independent Registered Public Accounting Firm
To the Board of Directors and Unitholders of Cactus Wellhead, LLC
Opinion on the Financial Statements
We have audited the accompanying consolidated balance sheets of Cactus Wellhead, LLC and its subsidiaries (the “Company”) as of December 31, 2017 and 2016, and the related consolidated statements of income, comprehensive income, members’ equity (deficit) and cash flows for each of the three years in the period ended December 31, 2017, including the related notes (collectively referred to as the “consolidated financial statements”). In our opinion, the consolidated financial statements present fairly, in all material respects, the financial position of the Company as of December 31, 2017 and 2016, and the results of their operations and their cash flows for each of the three years in the period ended December 31, 2017 in conformity with accounting principles generally accepted in the United States of America.
Basis for Opinion
These consolidated financial statements are the responsibility of the Company’s management. Our responsibility is to express an opinion on the Company’s consolidated financial statements based on our audits. We are a public accounting firm registered with the Public Company Accounting Oversight Board (United States) (“PCAOB”) and are required to be independent with respect to the Company in accordance with the U.S. federal securities laws and the applicable rules and regulations of the Securities and Exchange Commission and the PCAOB.
We conducted our audits of these consolidated financial statements in accordance with the standards of the PCAOB. Those standards require that we plan and perform the audit to obtain reasonable assurance about whether the consolidated financial statements are free of material misstatement, whether due to error or fraud.
Our audits included performing procedures to assess the risks of material misstatement of the consolidated financial statements, whether due to error or fraud, and performing procedures that respond to those risks. Such procedures included examining, on a test basis, evidence regarding the amounts and disclosures in the consolidated financial statements. Our audits also included evaluating the accounting principles used and significant estimates made by management, as well as evaluating the overall presentation of the consolidated financial statements. We believe that our audits provide a reasonable basis for our opinion.
/s/ PricewaterhouseCoopers LLP
Houston, Texas
March 19, 2018
We have served as the Company’s auditor since 2015.
58
CACTUS WELLHEAD, LLC AND SUBSIDIARIES
|
|
|
December 31, |
|
December 31, |
||
|
|
|
2017 |
|
2016 |
||
|
|
|
(in thousands, except unit data) |
||||
|
Assets |
|
|
|
|
|
|
|
Current assets |
|
|
|
|
|
|
|
Cash and cash equivalents |
|
$ |
7,574 |
|
$ |
8,688 |
|
Accounts receivable-trade, net |
|
|
84,173 |
|
|
32,289 |
|
Inventories |
|
|
64,450 |
|
|
37,900 |
|
Prepaid expenses and other current assets |
|
|
7,732 |
|
|
3,713 |
|
Total current assets |
|
|
163,929 |
|
|
82,590 |
|
Property and equipment, net |
|
|
94,654 |
|
|
74,870 |
|
Goodwill |
|
|
7,824 |
|
|
7,824 |
|
Other noncurrent assets |
|
|
49 |
|
|
44 |
|
Total assets |
|
$ |
266,456 |
|
$ |
165,328 |
|
Liabilities and Members' Equity |
|
|
|
|
|
|
|
Current liabilities |
|
|
|
|
|
|
|
Accounts payable-trade |
|
$ |
35,080 |
|
$ |
14,002 |
|
Accrued expenses and other |
|
|
10,559 |
|
|
6,430 |
|
Capital lease obligations, current portion |
|
|
4,667 |
|
|
1,134 |
|
Current maturities of long-term debt |
|
|
2,568 |
|
|
2,568 |
|
Total current liabilities |
|
|
52,874 |
|
|
24,134 |
|
Capital lease obligations, net of current portion |
|
|
7,946 |
|
|
2,065 |
|
Deferred tax liability, net |
|
|
416 |
|
|
196 |
|
Long-term debt, net |
|
|
241,437 |
|
|
242,254 |
|
Total liabilities |
|
|
302,673 |
|
|
268,649 |
|
Commitments and contingencies |
|
|
|
|
|
|
|
Members' equity (deficit) |
|
|
|
|
|
|
|
Class A, 36,500 units and 36,500 units issued and outstanding |
|
|
(35,055) |
|
|
(80,985) |
|
Class A-1, 520 units and 520 units issued and outstanding |
|
|
802 |
|
|
148 |
|
Class B, 8,608 units and 8,608 units issued and outstanding |
|
|
(2,046) |
|
|
(22,009) |
|
Accumulated other comprehensive income (loss) |
|
|
82 |
|
|
(475) |
|
Total members' equity (deficit) |
|
|
(36,217) |
|
|
(103,321) |
|
Total liabilities and members’ equity (deficit) |
|
$ |
266,456 |
|
$ |
165,328 |
The accompanying notes are an integral part of these consolidated financial statements.
59
CACTUS WELLHEAD, LLC AND SUBSIDIARIES
CONSOLIDATED STATEMENTS OF INCOME
|
|
|
Year Ended December 31, |
|||||||
|
|
|
2017 |
|
2016 |
|
2015 |
|||
|
|
|
(in thousands, except unit and per unit data) |
|||||||
|
Revenues |
|
|
|
|
|
|
|
|
|
|
Product revenue |
|
$ |
189,091 |
|
$ |
77,739 |
|
$ |
110,917 |
|
Rental revenue |
|
|
77,469 |
|
|
44,372 |
|
|
65,431 |
|
Field service and other revenue |
|
|
74,631 |
|
|
32,937 |
|
|
45,047 |
|
Total revenues |
|
|
341,191 |
|
|
155,048 |
|
|
221,395 |
|
|
|
|
|
|
|
|
|
|
|
|
Costs and expenses |
|
|
|
|
|
|
|
|
|
|
Cost of product revenue |
|
|
124,030 |
|
|
62,766 |
|
|
84,604 |
|
Cost of rental revenue |
|
|
40,519 |
|
|
33,990 |
|
|
39,251 |
|
Cost of field service and other revenue |
|
|
60,602 |
|
|
28,470 |
|
|
33,200 |
|
Selling, general and administrative expenses |
|
|
27,177 |
|
|
19,207 |
|
|
22,135 |
|
Total costs and expenses |
|
|
252,328 |
|
|
144,433 |
|
|
179,190 |
|
Income from operations |
|
|
88,863 |
|
|
10,615 |
|
|
42,205 |
|
|
|
|
|
|
|
|
|
|
|
|
Interest expense, net |
|
|
(20,767) |
|
|
(20,233) |
|
|
(21,837) |
|
Other income (expense), net |
|
|
— |
|
|
2,251 |
|
|
1,640 |
|
Income (loss) before income taxes |
|
|
68,096 |
|
|
(7,367) |
|
|
22,008 |
|
Income tax expense |
|
|
1,549 |
|
|
809 |
|
|
784 |
|
Net income (loss) |
|
$ |
66,547 |
|
$ |
(8,176) |
|
$ |
21,224 |
|
Earnings (loss) per Class A Unit—basic and diluted |
|
$ |
1,258.36 |
|
$ |
(224.00) |
|
$ |
306.88 |
|
Weighted average Class A Units outstanding—basic and diluted |
|
|
36,500 |
|
|
36,500 |
|
|
36,500 |
The accompanying notes are an integral part of these consolidated financial statements.
60
CACTUS WELLHEAD, LLC AND SUBSIDIARIES
CONSOLIDATED STATEMENTS OF COMPREHENSIVE INCOME
|
|
|
Year Ended December 31, |
|||||||
|
|
|
2017 |
|
2016 |
|
2015 |
|||
|
|
|
(in thousands) |
|||||||
|
Net income (loss) |
|
$ |
66,547 |
|
$ |
(8,176) |
|
$ |
21,224 |
|
Foreign currency translation |
|
|
557 |
|
|
(284) |
|
|
(215) |
|
Total comprehensive income (loss) |
|
$ |
67,104 |
|
$ |
(8,460) |
|
$ |
21,009 |
The accompanying notes are an integral part of these consolidated financial statements.
61
CACTUS WELLHEAD, LLC AND SUBSIDIARIES
CONSOLIDATED STATEMENTS OF MEMBERS’ EQUITY (DEFICIT)
|
|
|
|
|
|
Accumulated |
|
Total |
||
|
|
|
Members' |
|
Other |
|
Members' |
|||
|
|
|
Equity |
|
Comprehensive |
|
Equity |
|||
|
|
|
(Deficit) |
|
Income (Loss) |
|
(Deficit) |
|||
|
|
|
|
(in thousands) |
||||||
|
Balances at December 31, 2014 |
|
$ |
(102,327) |
|
$ |
24 |
|
$ |
(102,303) |
|
Member distributions |
|
|
(12,232) |
|
|
— |
|
|
(12,232) |
|
Other comprehensive income (loss) |
|
|
— |
|
|
(215) |
|
|
(215) |
|
Equity based compensation |
|
|
359 |
|
|
— |
|
|
359 |
|
Net income |
|
|
21,224 |
|
|
— |
|
|
21,224 |
|
Balances at December 31, 2015 |
|
|
(92,976) |
|
|
(191) |
|
|
(93,167) |
|
Member distributions |
|
|
(2,055) |
|
|
— |
|
|
(2,055) |
|
Other comprehensive income (loss) |
|
|
— |
|
|
(284) |
|
|
(284) |
|
Equity based compensation |
|
|
361 |
|
|
— |
|
|
361 |
|
Net loss |
|
|
(8,176) |
|
|
— |
|
|
(8,176) |
|
Balances at December 31, 2016 |
|
|
(102,846) |
|
|
(475) |
|
|
(103,321) |
|
Other comprehensive income (loss) |
|
|
— |
|
|
557 |
|
|
557 |
|
Net income |
|
|
66,547 |
|
|
— |
|
|
66,547 |
|
Balances at December 31, 2017 |
|
$ |
(36,299) |
|
$ |
82 |
|
$ |
(36,217) |
The accompanying notes are an integral part of these consolidated financial statements.
62
CACTUS WELLHEAD, LLC AND SUBSIDIARIES
CONSOLIDATED STATEMENTS OF CASH FLOWS
|
|
|
Year Ended December 31, |
|||||||
|
|
|
2017 |
|
2016 |
|
2015 |
|||
|
|
|
(in thousands) |
|||||||
|
Cash flows from operating activities |
|
|
|
|
|
|
|
|
|
|
Net income (loss) |
|
$ |
66,547 |
|
$ |
(8,176) |
|
$ |
21,224 |
|
Reconciliation of net income (loss) to net cash provided by operating activities |
|
|
|
|
|
|
|
|
|
|
Depreciation and amortization |
|
|
23,271 |
|
|
21,241 |
|
|
20,580 |
|
Debt discount and deferred loan cost amortization |
|
|
1,752 |
|
|
1,777 |
|
|
1,913 |
|
Stock-based compensation |
|
|
— |
|
|
361 |
|
|
359 |
|
Provision for (recovery of) bad debts |
|
|
(100) |
|
|
(357) |
|
|
250 |
|
Inventory obsolescence |
|
|
1,259 |
|
|
1,851 |
|
|
2,343 |
|
Loss on disposal of assets |
|
|
534 |
|
|
950 |
|
|
402 |
|
Deferred income taxes |
|
|
220 |
|
|
132 |
|
|
64 |
|
Gain on debt extinguishment |
|
|
— |
|
|
(2,251) |
|
|
(1,640) |
|
Changes in operating assets and liabilities |
|
|
|
|
|
|
|
|
|
|
Accounts receivable-trade |
|
|
(50,094) |
|
|
509 |
|
|
12,829 |
|
Inventories |
|
|
(28,279) |
|
|
4,126 |
|
|
10,563 |
|
Prepaid expenses and other assets |
|
|
(4,012) |
|
|
1,080 |
|
|
127 |
|
Accounts payable-trade |
|
|
19,505 |
|
|
5,014 |
|
|
(18,703) |
|
Accrued expenses and other liabilities |
|
|
4,104 |
|
|
(2,282) |
|
|
(4,384) |
|
Net cash provided by operating activities |
|
|
34,707 |
|
|
23,975 |
|
|
45,927 |
|
|
|
|
|
|
|
|
|
|
|
|
Cash flows from investing activities |
|
|
|
|
|
|
|
|
|
|
Capital expenditures |
|
|
(32,074) |
|
|
(21,677) |
|
|
(25,281) |
|
Patent expenditures |
|
|
(8) |
|
|
(44) |
|
|
— |
|
Proceeds from sale of assets |
|
|
1,404 |
|
|
4,363 |
|
|
1,859 |
|
Net cash used in investing activities |
|
|
(30,678) |
|
|
(17,358) |
|
|
(23,422) |
|
|
|
|
|
|
|
|
|
|
|
|
Cash flows from financing activities |
|
|
|
|
|
|
|
|
|
|
Principal payments on long-term debt |
|
|
(2,569) |
|
|
(7,908) |
|
|
(10,525) |
|
Payments on capital leases |
|
|
(2,744) |
|
|
(208) |
|
|
— |
|
Payments for deferred loan costs |
|
|
— |
|
|
— |
|
|
(19) |
|
Distributions to members |
|
|
— |
|
|
(2,055) |
|
|
(12,232) |
|
Net cash used in financing activities |
|
|
(5,313) |
|
|
(10,171) |
|
|
(22,776) |
|
|
|
|
|
|
|
|
|
|
|
|
Effect of exchange rate changes on cash and cash equivalents |
|
|
170 |
|
|
(284) |
|
|
(128) |
|
|
|
|
|
|
|
|
|
|
|
|
Net increase (decrease) in cash and cash equivalents |
|
|
(1,114) |
|
|
(3,838) |
|
|
(399) |
|
|
|
|
|
|
|
|
|
|
|
|
Cash and cash equivalents |
|
|
|
|
|
|
|
|
|
|
Beginning of period |
|
|
8,688 |
|
|
12,526 |
|
|
12,925 |
|
End of period |
|
$ |
7,574 |
|
$ |
8,688 |
|
$ |
12,526 |
The accompanying notes are an integral part of these consolidated financial statements.
63
CACTUS WELLHEAD, LLC AND SUBSIDIARIES
NOTES TO CONSOLIDATED FINANCIAL STATEMENTS
(in thousands, except unit and per unit data, or as otherwise indicated)
1. Organization and Nature of Operations
Cactus Wellhead, LLC (“Cactus LLC”) is a Delaware limited liability company and was formed on July 11, 2011. Cactus LLC has a U.S. manufacturing facility in Bossier City, Louisiana, that it acquired in September 2011. Effective August 14, 2013, Cactus LLC formed Cactus Wellhead (Suzhou) Pressure Control Co., Ltd. (“Suzhou”), a Chinese limited company, as a production facility that provides products to Cactus LLC and affiliates in the United States and Australia. Effective July 1, 2014, Cactus LLC formed Cactus Wellhead Australia Pty, Ltd (“CWA”), an Australian limited company, to service the Australian market.
Cactus LLC, Suzhou and CWA (collectively, “Cactus”, “we”, “us” and “our”) are primarily engaged in the design, manufacture and sale of wellheads and pressure control equipment. In addition, we maintain a fleet of frac trees and ancillary equipment for short‑term rental, we offer repair and refurbishment services and we provide service crews to assist in the installation and operations of pressure control systems at the wellhead. We operate through 14 U.S. service centers principally located in Texas, Oklahoma, New Mexico, Louisiana, Pennsylvania, North Dakota, Wyoming, Colorado, and one service center in Australia, with our corporate headquarters located in Houston, Texas.
On February 12, 2018, Cactus, Inc. (“Cactus Inc.”) completed the initial public offering of Class A common stock (the “IPO”). Pursuant to a reorganization and the IPO, Cactus Inc. became a holding corporation for Cactus LLC. See note 13.
2. Summary of Significant Accounting Policies and Other Items
Basis of Presentation
The consolidated financial statements have been prepared in accordance with accounting principles generally accepted in the United States of America (“GAAP”). These consolidated financial statements include the accounts of Cactus LLC and its wholly owned subsidiaries, Suzhou and CWA. All significant intercompany transactions and balances have been eliminated upon consolidation.
Reclassifications
Certain prior period amounts have been reclassified to conform to the current period presentation.
Limitation of Members’ Liability
Under the terms of the Amended and Restated Limited Liability Company Operating Agreement, dated as of May 31, 2016, of Cactus LLC (the “Agreement”), the members are not obligated for debt, liabilities, contracts or other obligations of Cactus LLC. Profits and losses are allocated to members as defined in the Agreement.
Segment and Related Information
We operate as a single operating segment, which reflects how we manage our business and the fact that all of our products and services are dependent upon the oil and natural gas industry. Substantially all of our products and services are sold in the U.S., which consists largely of oil and natural gas exploration and production companies. We operate in the United States, Australia and China. Our operations in Australia and China represented less than 10% of our consolidated operations for all periods presented in these consolidated financial statements.
64
Significant Customers and Concentration of Credit Risk
We had one customer representing 11% of total revenues in 2017 and one customer representing 12% of total revenues in both 2016 and 2015. There were no other customers representing 10% or more of total revenues in 2017, 2016 or 2015. Our assets that are potentially subject to concentrations of credit risk are cash and accounts receivable. Our receivables are spread over a number of customers, a majority of which are operators and suppliers to the oil and natural gas industry. We manage the credit risk on financial instruments by transacting only with what management believes are financially secure counterparties, requiring credit approvals and credit limits, and monitoring counterparties’ financial condition. Our maximum exposure to credit loss in the event of non‑performance by the counterparty is limited to the receivable balance. We perform ongoing credit evaluations as to the financial condition of our customers with respect to trade receivables. Generally, no collateral is required as a condition of sale.
Significant Vendors
We purchase a significant portion of supplies, equipment and machined components from a single vendor. During 2017, 2016 and 2015, purchases from this vendor totaled $33.4 million, $10.8 million and $18.1 million, respectively. These figures represent approximately 22%, 20% and 27% for the respective periods, of total third party vendor purchases of raw materials, finished products, equipment, machining and other services. Amounts due to the vendor included in accounts payable, in the consolidated balance sheets, as of December 31, 2017 and 2016 totaled $7.4 million and $1.3 million, respectively.
Use of Estimates
The preparation of consolidated financial statements in conformity with GAAP requires management to make estimates and assumptions that affect the reported amounts of assets and liabilities and disclosure of contingent assets and liabilities at the date of the consolidated financial statements and the reported amounts of revenues and expenses during the reporting period. Such estimates include but are not limited to estimated losses on accounts receivables, estimated realizable value on excess and obsolete inventory, useful lives of equipment and estimates related to fair value of reporting units for purposes of assessing goodwill for impairment. Actual results could differ from those estimates.
Revenue Recognition
Revenue is recognized when all of the following criteria have been met: (i) evidence of an arrangement exists; (ii) delivery and acceptance by the customer has occurred; (iii) the price to the customer is fixed or determinable; and (iv) collectability is reasonably assured, as follows:
Product revenue. Revenue is recognized from the sale of wellhead systems and production trees and is recognized when the products have shipped and significant risk of ownership has passed under our contract terms. The arrangements typically do not include the right of return.
Rental revenue. We design and manufacture a suite of highly technical equipment, tools and products used for well control during the drilling and completion phases that are rented to customers on a short-term basis. Our rental agreements are directly with customers and provide for a rate based on the period of time the equipment is used or made available to the customer. Revenue is recognized as earned over the rental period.
Field service and other revenue. We provide field services to our customers based on contractually agreed rates. Other revenue is derived from providing repair and reconditioning services to customers, generally to customers who have installed our products on their wellsite. Revenues are recognized as the services are performed or rendered.
65
From time to time certain of our contracts include multiple deliverables. The pricing of each of our products and services is individually negotiated and agreed with our customers. The hierarchy for determining the selling price of a deliverable includes (a) vendor‑specific objective evidence, if available, (b) third‑party evidence, if vendor‑specific evidence is not available, and (c) our best estimate of selling price, if neither vendor‑specific nor third‑party evidence is available. Our revenues for multi‑element arrangements are based on vendor‑specific evidence as most of our products, rentals and field services are sold on an individual basis.
Foreign Currency Translation
The financial position and results of operations of our foreign subsidiaries are measured using the local currency as the functional currency. Revenues and expenses of the subsidiaries have been translated into U.S. Dollars at average exchange rates prevailing during the period. Assets and liabilities have been translated at the rates of exchange on the balance sheet dates. The resulting translation gain and loss adjustments have been recorded directly as a separate component of other comprehensive income (loss) in the consolidated statements of income and comprehensive income, and members’ equity.
Transaction gains and losses that arise from exchange rate fluctuations on transactions denominated in a currency other than the functional currency are included in the consolidated results of operations as incurred.
Stock‑based Compensation
We measure the cost of equity‑based awards based on the grant‑date fair value and we allocate the compensation expense over the corresponding service period, which is usually the vesting period, using the straight‑line method. All grant date fair value is expensed immediately for awards that are fully vested as of the grant date.
Income Taxes
Cactus LLC is a limited liability company and files a U.S. Return of Partnership Income, which includes both our U.S. and foreign operations. As a limited liability company, Cactus LLC is treated as a partnership, and the members of Cactus LLC are taxed individually on their share of our earnings for U.S. federal income tax purposes. Accordingly, no provision for U.S. federal income taxes has been made in the consolidated financial statements.
Cactus LLC is subject to state taxes within the United States. However, the income generated by Cactus LLC flows through to the members’ individual state tax returns. Additionally, our operations in both Australia and China are subject to local country income taxes.
Deferred taxes are recorded using the liability method, whereby tax assets and liabilities are determined based on the differences between the financial statement and tax basis of assets and liabilities using enacted tax rates in effect for the year in which the differences are expected to reverse. The realizability of deferred tax assets are evaluated annually and a valuation allowance is provided if it is more likely than not that the deferred tax assets will not give rise to future benefits in our tax returns.
We account for uncertainty in income taxes by prescribing the minimum recognition threshold an income tax position is required to meet before being recognized in the consolidated financial statements. Each income tax position is assessed using a two‑step process. A determination is first made as to whether it is more likely than not that the income tax position will be sustained, based upon technical merits, upon examination by the taxing authorities. If the income tax position is expected to meet the more likely than not criteria, the benefit recorded in the consolidated financial statements equals the largest amount that is greater than 50% likely to be realized upon its ultimate settlement.
66
We record income tax related interest and penalties, if any, as a component in the provision for income tax expense.
U.S. Federal Income Tax Reform
On December 22, 2017, the President of the United States signed into law legislation informally known as the Tax Cuts and Jobs Act (the “Act”). The Act represents major tax reform legislation that, among other provisions, reduces the U.S. corporate tax rate. As of December 31, 2017, since Cactus LLC is a pass-through entity, management considers that the abovementioned Act will have an immaterial impact. However, going forward, the Company will analyze the impact based on revised circumstances.
Cash and Cash Equivalents
We consider all highly liquid instruments purchased with a maturity of three months or less to be cash equivalents. Throughout the year, we maintained cash balances that were not covered by federal deposit insurance. We have not experienced any losses in such accounts.
Accounts Receivable
We extend credit to customers in the normal course of business. We do not accrue interest on delinquent accounts receivable. Accounts receivable as of December 31, 2017 and 2016 includes unbilled revenue of $24.9 million and $8.8 million, respectively, for products delivered and for services performed for which billings had not yet been submitted to the customers. Earnings are charged with a provision for doubtful accounts based on a current review of the collectability of accounts. Accounts deemed uncollectible are applied against the allowance for doubtful accounts. Accounts receivable is net of allowance for doubtful accounts of $0.7 million and $0.9 million as of December 31, 2017 and 2016, respectively.
The following is a rollforward of our allowance for doubtful accounts:
|
|
|
Balance at |
|
|
|
|
|
|
|
|
|
|
Balance at |
||
|
|
|
Beginning of |
|
Expense |
|
|
|
|
|
|
|
End of |
|||
|
|
|
Period |
|
(recovery) |
|
Write off |
|
Other |
|
Period |
|||||
|
Year Ended December 31, 2017 |
|
$ |
851 |
|
$ |
(100) |
|
$ |
(3) |
|
$ |
(8) |
|
$ |
740 |
|
Year Ended December 31, 2016 |
|
|
1,208 |
|
|
(357) |
|
|
— |
|
|
— |
|
|
851 |
|
Year Ended December 31, 2015 |
|
|
1,024 |
|
|
250 |
|
|
(66) |
|
|
— |
|
|
1,208 |
Inventories
Inventories are stated at the lower of cost or net realizable value. Cost is determined using standard cost (which approximates average cost) and weighted average methods. Costs include an application of related direct labor and overhead cost. Net realizable value is the estimated selling price in the ordinary course of business, less reasonably predictable costs of completion, disposal and transportation. Reserves are made for obsolete and slow‑moving items based on a range of factors, including age, usage and technological or market changes that may impact demand for those products. The inventory obsolescence reserve was $5.9 million and $4.8 million as of December 31, 2017 and 2016, respectively.
67
The following is a rollforward of our inventory obsolescence reserve:
|
|
|
Balance at |
|
|
|
|
|
|
|
|
|
|
Balance at |
||
|
|
|
Beginning of |
|
Expense |
|
|
|
|
|
|
|
End of |
|||
|
|
|
Period |
|
(recovery) |
|
Write off |
|
Other |
|
Period |
|||||
|
Year Ended December 31, 2017 |
|
$ |
4,770 |
|
$ |
1,259 |
|
$ |
(103) |
|
$ |
(41) |
|
$ |
5,885 |
|
Year Ended December 31, 2016 |
|
|
3,184 |
|
|
1,851 |
|
|
(265) |
|
|
— |
|
|
4,770 |
|
Year Ended December 31, 2015 |
|
|
841 |
|
|
2,343 |
|
|
— |
|
|
— |
|
|
3,184 |
Property and Equipment
Property and equipment are stated at cost. We manufacture some of our own rental assets and during the manufacture of these assets, they are reflected as construction in progress until complete. We depreciate the cost of property and equipment using the straight‑line method over the estimated useful lives and depreciate our rental assets to their salvage value. Leasehold improvements are amortized over the shorter of the remaining lease term or economic life of the related assets. When assets are retired or otherwise disposed of, the cost and related accumulated depreciation are removed from the accounts and any resulting gain or loss are reflected in income for the period. The cost of maintenance and repairs is charged to income as incurred; significant renewals and improvements are capitalized. Estimated useful lives are as follows:
|
Land |
|
N/A |
|
|
Buildings and improvement |
|
5-39 |
years |
|
Machinery and equipment |
|
7 |
years |
|
Vehicles under capital lease |
|
3 |
years |
|
Rental equipment |
|
2-5 |
years |
|
Furniture and fixtures |
|
5 |
years |
|
Computers and software |
|
3-5 |
years |
Property and equipment as of December 31, 2017 and 2016 consists of the following:
|
|
|
December 31, |
||||
|
|
|
2017 |
|
2016 |
||
|
Land |
|
$ |
2,241 |
|
$ |
2,241 |
|
Buildings and improvements |
|
|
11,657 |
|
|
11,169 |
|
Machinery and equipment |
|
|
43,528 |
|
|
38,429 |
|
Vehicles under capital lease |
|
|
15,557 |
|
|
2,616 |
|
Rental equipment |
|
|
85,292 |
|
|
75,437 |
|
Furniture and fixtures |
|
|
1,110 |
|
|
984 |
|
Computers and software |
|
|
2,636 |
|
|
2,429 |
|
|
|
|
162,021 |
|
|
133,305 |
|
Less: Accumulated depreciation and amortization |
|
|
72,917 |
|
|
62,381 |
|
|
|
|
89,104 |
|
|
70,924 |
|
Construction in progress |
|
|
5,550 |
|
|
3,946 |
|
Total property and equipment, net |
|
|
94,654 |
|
|
74,870 |
Depreciation of property and equipment was $23.3 million, $21.2 million and $20.6 million for 2017, 2016 and 2015, respectively. Depreciation expense is included in “total costs and expenses” in the consolidated statements of income.
68
Impairment of Long‑Lived Assets
We review the recoverability of long‑lived assets, such as property and equipment, when events or changes in circumstances occur that indicate the carrying value of the asset or asset group may not be recoverable. The assessment of possible impairment is based on our ability to recover the carrying value of the asset or asset group from the expected future pre‑tax cash flows (undiscounted) of the related operations. If these cash flows are less than the carrying value of such asset, an impairment loss is recognized for the difference between estimated fair value and carrying value. We concluded there were no indicators evident or other circumstances present that these assets were not recoverable and accordingly, no impairment charges of long‑lived assets were recognized for 2017, 2016 and 2015.
Goodwill
Goodwill represents the excess of acquisition consideration paid over the fair value of identifiable net tangible and identifiable intangible assets acquired. All of the goodwill resulted from the acquisition of a manufacturing facility in Bossier City, Louisiana in 2011. The facility supports our full range of products, rentals and services. Goodwill is attributable to the reduced reliance on vendors and synergies associated with the ability of the Bossier City plant to manufacture our full range of products as well as to deliver time sensitive and rapid turnaround orders. Goodwill is not amortized, but is reviewed for impairment on an annual basis (or more frequently if impairment indicators exist). We have established December 31 as the date of our annual test for impairment of goodwill. We perform a qualitative assessment of the fair value of our reporting unit before calculating the fair value of the reporting unit in step one of the two‑step goodwill impairment model. If, through the qualitative assessment, we determine that it is more likely than not that the reporting unit’s fair value is greater than its carrying value, the remaining impairment steps would be unnecessary.
If there are indicators that goodwill has been impaired and thus the two‑step goodwill impairment model is necessary, step one is to determine the fair value of the reporting unit and compare it to the reporting unit’s carrying value. Fair value is determined based on the present value of estimated cash flows using available information regarding expected cash flows of each reporting unit, discount rates and the expected long‑term cash flow growth rates. If the fair value of the reporting unit exceeds the carrying value, goodwill is not impaired and no further testing is performed. The second step is performed if the carrying value exceeds the fair value. The implied fair value of the reporting unit’s goodwill must be determined and compared to the carrying value of the goodwill. If the carrying value of a reporting unit’s goodwill exceeds its implied fair value, an impairment loss equal to the difference will be recorded. We concluded that there was no impairment of goodwill in 2017, 2016 or 2015, based on our annual impairment analysis.
Debt Discount and Deferred Loan Costs
Long‑term debt is presented in the consolidated balance sheets net of an original issue discount as well as deferred loan costs, which are both amortized to interest expense over the life of the debt. The original issue discount was $5.5 million. The amortization of the discount totaled $0.8 million, $0.8 million and $0.9 million for 2017, 2016 and 2015, respectively, and is included in interest expense in the consolidated statements of income.
Deferred loan costs are amortized to interest expense over the term of the related debt agreement using methods which approximate the effective interest method. We capitalized $6.0 million in connection with our long-term debt. The amortization of the deferred loan costs for 2017, 2016 and 2015 totaled $0.9 million, $0.9 million and $1.0 million, respectively.
When the related debt instrument is retired, any remaining unamortized costs of the original issue discount and deferred loan costs are included in the determination of the gain or loss on the extinguishment of the debt.
69
As of December 31, 2017 and 2016, the unamortized balance of debt discount and deferred loan costs was $4.5 million and $6.3 million, respectively. In conjunction with the IPO and repayment in full of our term loan, the unamortized balance of debt discount and deferred loan costs will be written off to loss on debt extinguishment.
Accrued Expenses and Other
Accrued expenses and other as of December 31, 2017 and 2016 are as follows:
|
|
|
December 31, |
||||
|
|
|
2017 |
|
2016 |
||
|
Payroll, payroll taxes and benefits |
|
$ |
4,033 |
|
$ |
2,722 |
|
Income based tax payable |
|
|
526 |
|
|
641 |
|
Taxes other than income |
|
|
1,375 |
|
|
1,271 |
|
Deferred revenue |
|
|
765 |
|
|
565 |
|
Product warranties |
|
|
343 |
|
|
95 |
|
Accrued insurance |
|
|
1,059 |
|
|
— |
|
Accrued interest |
|
|
161 |
|
|
50 |
|
Other |
|
|
2,297 |
|
|
1,086 |
|
Total |
|
$ |
10,559 |
|
$ |
6,430 |
Deferred Revenue
Deferred revenue represents cash received from customers for rental equipment services not yet rendered and products not yet delivered.
Product Warranties
We generally warrant our manufactured products 12 months from the date placed in service.
Fair Value Measures
Fair value measurements—We record financial assets and financial liabilities at fair value. Fair value is defined as the price that would be received to sell an asset or paid to transfer a liability (an exit price) in an orderly transaction between market participants at the reporting date. The fair value framework requires the categorization of assets and liabilities into three levels based upon the assumptions (inputs) used to price the assets or liabilities, with the exception of certain assets and liabilities measured using the net asset value practical expedient, which are not required to be leveled. Level 1 provides the most reliable measure of fair value, whereas Level 3 generally requires significant management judgment. The three levels are defined as follows:
|
· |
Level 1: Unadjusted quoted prices in active markets for identical assets and liabilities. |
|
· |
Level 2: Observable inputs other than quoted prices included in Level 1. For example, quoted prices for similar assets or liabilities in active markets or quoted prices for identical assets or liabilities in inactive markets. |
|
· |
Level 3: Unobservable inputs reflecting management’s own assumptions about the assumptions market participants would use in pricing the asset or liability. |
Fair value of long‑lived, non‑financial assets—Long‑lived, non‑financial assets are measured at fair value on a non‑recurring basis for the purposes of calculating impairment. The fair value measurements of our long‑lived,
70
non‑financial assets measured on a non‑recurring basis are determined by estimating the amount and timing of net future cash flows, which are Level 3 unobservable inputs, and discounting them using a risk‑adjusted rate of interest. Significant increases or decreases in actual cash flows may result in valuation changes.
Fair value of debt—The fair value, based on Level 2, of our term loan facility due 2020 approximated the face value of the debt of $248.5 million as of December 31, 2017. The fair value was approximately $231 million as of December 31, 2016 compared to the $251.1 million face value of the debt as of December 31, 2016.
Other fair value disclosures—The carrying amounts of cash and cash equivalents, receivables, accounts payable, as well as amounts included in other current assets and other current liabilities that meet the definition of financial instruments, approximate fair value.
Recent Accounting Pronouncements
Standards Adopted
In July 2015, the Financial Accounting Standards Board (“FASB”) issued Accounting Standards Update (“ASU”) No. 2015‑11, Simplifying the Measurement of Inventory, which requires companies to measure inventory at the lower of cost or net realizable value rather than at the lower of cost or market. Net realizable value is the estimated selling price in the ordinary course of business, less reasonably predictable costs of completion, disposal and transportation. We adopted this ASU on January 1, 2017. The adoption of this pronouncement did not have any material impact on the consolidated financial statements.
In March 2016, the FASB issued ASU No. 2016‑09, Improvements to Employee Share‑Based Payment Accounting. This new guidance includes provisions intended to simplify how share based payments are accounted for and presented in the financial statements, including: a) all excess tax benefits and tax deficiencies should be recognized as income tax expense or benefit in the income statement; b) excess tax benefits should be classified along with other income tax cash flows as an operating activity; c) an entity can make an entity wide accounting policy election to either estimate the number of awards that are expected to vest or account for forfeitures when they occur; d) the threshold to qualify for equity classification permits withholding up to the maximum statutory tax rates in the applicable jurisdictions; e) cash paid by an employer should be classified as a financing activity when shares are directly withheld for tax withholding purposes. We adopted this ASU on January 1, 2017. The adoption of this pronouncement did not have any material impact on the consolidated financial statements.
Standards Not Yet Adopted
In May 2014, the FASB issued ASU No. 2014‑09, Revenue from Contracts with Customers, which supersedes the current revenue recognition guidance. The ASU is based on the principle that revenue is recognized to depict the transfer of goods and services to customers in the amount that reflects the consideration to which the entity expects to be entitled in exchange for those goods or services. The ASU also requires additional disclosure about the nature, amount, timing, and uncertainty of revenue and cash flows arising from customer contracts, including significant judgments and changes in judgments and assets recognized from costs incurred to obtain or fulfill a contract. The new standard will be effective for public companies for the fiscal years beginning after December 31, 2017 using one of two retrospective application methods. We adopted this pronouncement on January 1, 2018 using the modified retrospective method. Based on the assessment performed, the adoption of this pronouncement will not have a material impact on the consolidated financial statements. We are continuing our assessment of potential changes to our disclosures under the new standard. We will provide additional disclosures, if any, regarding material differences in reported financial statement line items in 2018 when compared to the amounts that would have been reported under legacy accounting guidance.
71
In February 2016, the FASB issued ASU No. 2016‑02, Leases (Topic 842), to increase transparency and comparability among organizations by recognizing lease assets and lease liabilities on the balance sheet and disclosing key information about leasing arrangements. Upon adoption of the new guidance, lessees are required to recognize and measure leases at the beginning of the earliest period presented using a modified retrospective approach. The new guidance will be effective for fiscal years beginning after December 15, 2018. We are currently evaluating the impact this pronouncement will have on the consolidated financial statements.
In January 2017, the FASB issued ASU No. 2017‑01, Business Combinations (Topic 805): Clarifying the Definition of a Business, in an effort to clarify the definition of a business with the objective of adding guidance to assist entities with evaluating whether transactions should be accounted for as acquisitions (or disposals) of assets or businesses. The amendments in this standard provide a screen to determine when an integrated set of assets and activities is not a business. The screen requires that when substantially all of the fair value of the gross assets acquired (or disposed of) is concentrated in a single identifiable asset or a group of similar identifiable assets, the integrated set of assets and activities is not a business. The new guidance is effective for fiscal years beginning after December 15, 2017, and interim periods within those fiscal years. Early adoption is allowed for transactions for which the acquisition date occurs before the issuance date or effective date of the amendments, only when the transaction has not been reported in financial statements that have been issued or made available for issuance and for transactions in which a subsidiary is deconsolidated or a group of assets is derecognized before the issuance date or effective date of the amendments, only when the transaction has not been reported in financial statements that have been issued or made available for issuance. Entities will be required to apply the guidance prospectively when adopted. We do not expect the adoption of this pronouncement to have a material impact on the consolidated financial statements.
In January 2017, the FASB issued ASU 2017‑04, Intangibles‑Goodwill and Other, which simplifies the accounting for goodwill impairment by eliminating Step 2 of the current goodwill impairment test. In computing the implied fair value of goodwill under Step 2, an entity had to perform procedures to determine the fair value at the impairment testing date of its assets and liabilities (including unrecognized assets and liabilities) following the procedure that would be required in determining the fair value of assets acquired and liabilities assumed in a business combination. Instead, under the new standard, an entity should perform its annual, or interim, goodwill impairment test by comparing the fair value of a reporting unit with its carrying amount. An entity should recognize an impairment charge for the amount by which the carrying amount exceeds the reporting unit’s fair value; however, the loss recognized should not exceed the total amount of goodwill allocated to that reporting unit. An entity still has the option to perform the qualitative assessment for a reporting unit to determine if the quantitative impairment test is necessary. The new guidance should be adopted for annual or any interim goodwill impairment tests in fiscal years beginning after December 15, 2019. Early adoption is permitted for interim or annual goodwill impairment tests performed on testing dates after January 1, 2017. We do not expect the adoption of this pronouncement to have a material impact on the consolidated financial statements.
In August 2016, the FASB issued ASU No. 2016‑15, Cash Flow Statement (Topic 250). This new guidance addresses eight specific cash flow issues with the objective of reducing the existing diversity in practice, including: debt prepayment or debt extinguishment costs, settlement of zero coupon debt instruments or other debt instruments, contingent consideration payments made after a business combination, proceeds from the settlement of insurance claims, proceeds from the settlement of corporate owned life insurance policies, distributions received from equity method investees, beneficial interests in securitization transactions, and separately identifiable cash flows and application of the predominance principle. ASU 2016‑15 is effective for public business entities for fiscal years beginning after December 15, 2017, and interim periods within those fiscal years. Early adoption is permitted, including adoption in an interim period. We do not expect that the adoption of this pronouncement will have a material impact on the consolidated financial statements.
72
3. Inventories
Inventories consist of the following:
|
|
|
December 31, |
||||
|
|
|
2017 |
|
2016 |
||
|
Raw materials |
|
$ |
1,532 |
|
$ |
1,543 |
|
Work-in-progress |
|
|
3,590 |
|
|
4,585 |
|
Finished goods |
|
|
59,328 |
|
|
31,772 |
|
|
|
$ |
64,450 |
|
$ |
37,900 |
4. Long‑Term Debt
Long‑term debt consists of the following:
|
|
|
December 31, |
||||
|
|
|
2017 |
|
2016 |
||
|
Term Loan |
|
$ |
248,529 |
|
$ |
251,098 |
|
Less: |
|
|
|
|
|
|
|
Current portion |
|
|
(2,568) |
|
|
(2,568) |
|
Unamortized debt discount and deferred loan costs |
|
|
(4,524) |
|
|
(6,276) |
|
Long-term debt, net |
|
$ |
241,437 |
|
$ |
242,254 |
On July 31, 2014, we entered into a credit agreement collateralized by substantially all of our assets (the “Credit Agreement”), consisting of a $275.0 million Tranche B term loan (the “Term Loan”) and a $50.0 million revolving credit facility with a $10.0 million sublimit for letters of credit (the “Revolving Loans”). We make quarterly principal payments on the Term Loan and may make loan prepayments as outlined in the Credit Agreement. We may borrow and repay the Revolving Loans in accordance with the terms of the Credit Agreement. A commitment fee is payable quarterly on the unused portion of the revolving credit facility. There was $248.5 million and $251.1 million outstanding on the Term Loan as of December 31, 2017 and 2016, respectively. As of December 31, 2017 and 2016, no amounts were outstanding on the Revolving Loans and no letters of credit were outstanding. Interest on outstanding amounts under the Credit Agreement are payable in arrears for each draw fixed at an adjusted based rate plus an applicable margin, as defined in the Credit Agreement. At December 31, 2017 and 2016, there was $0.2 million and $0.1 million accrued interest included within accrued expenses, respectively, in the consolidated balance sheets. The Term Loan portion of the Credit Agreement matures on July 31, 2020. The Revolving Loans portion of the Credit Agreement matures on July 31, 2019. Amounts outstanding under the Credit Agreement may be voluntarily prepaid, in whole or in part, without premium or penalty, in accordance with the terms of the Credit Agreement and subject to breakage and similar costs.
In conjunction with the IPO, we repaid the Term Loan in full. As of December 31, 2017, prior to the repayment resulting from the IPO, the future maturities of long‑term debt were as follows:
|
Years Ending December 31, |
|
|
|
|
2018 |
|
$ |
2,568 |
|
2019 |
|
|
2,568 |
|
2020 |
|
|
243,393 |
|
|
|
$ |
248,529 |
The Credit Agreement contains various restrictive covenants that may limit our ability to incur additional indebtedness and liens, make or declare dividends, or enter into certain transactions, and contains a total leverage
73
financial covenant related only to the Revolving Loans once a total of $15.0 million or more has been drawn on the Revolving Loans. Based on this total leverage financial covenant, availability under the revolving credit facility can be limited to $15.0 million. At December 31, 2017, we had access to the full $50.0 million revolving credit facility capacity. At December 31, 2017 and 2016, we were in compliance with the covenants in the Credit Agreement.
At December 31, 2017 and 2016, the weighted average interest rate for borrowings under the Credit Agreement was 7.3% and 7.0%, respectively.
Gain on debt extinguishment
In accordance with the provisions of the Credit Agreement, we redeemed $7.5 million and $10.0 million of the Term Loan at a price of 65% and 79% of the principal amount in 2016 and 2015, respectively. We paid $4.9 million and $7.9 million for such redemptions, including fees, in 2016 and 2015, respectively. We recorded a gain on debt extinguishment of $2.3 million and $1.6 million in 2016 and 2015, respectively, on the redemptions. The gain consists of the tender discount on the Term Loan amount redeemed, partially offset by transaction fees and the write‑off of $0.3 million and $0.2 million of the unamortized debt discount and deferred loan costs in 2016 and 2015, respectively. The gain on debt extinguishment is included under other income, net, in the consolidated statements of income.
Interest Expense, net
Interest expense, net, including debt discount and deferred loan costs amortization, is comprised of the following:
|
|
|
Year Ended December 31, |
|||||||
|
|
|
2017 |
|
2016 |
|
2015 |
|||
|
Interest under Credit Agreement |
|
$ |
18,627 |
|
$ |
18,414 |
|
$ |
19,682 |
|
Debt discount and deferred loan costs amortization |
|
|
1,752 |
|
|
1,777 |
|
|
1,913 |
|
Capital lease interest |
|
|
311 |
|
|
24 |
|
|
— |
|
Other |
|
|
82 |
|
|
20 |
|
|
253 |
|
Interest (income) |
|
|
(5) |
|
|
(2) |
|
|
(11) |
|
Interest expense, net |
|
$ |
20,767 |
|
$ |
20,233 |
|
$ |
21,837 |
5. Income Taxes
Components of income (loss) before income taxes—Domestic and foreign components of income (loss) before income taxes were as follows:
|
|
|
Year Ended December 31, |
|||||||
|
|
|
2017 |
|
2016 |
|
2015 |
|||
|
Domestic |
|
$ |
65,023 |
|
$ |
(8,558) |
|
$ |
21,791 |
|
Foreign |
|
|
3,073 |
|
|
1,191 |
|
|
217 |
|
Income (loss) before income taxes |
|
$ |
68,096 |
|
$ |
(7,367) |
|
$ |
22,008 |
74
Provision for income tax—The provision for income taxes consisted of:
|
|
|
Year Ended December 31, |
|||||||
|
|
|
2017 |
|
2016 |
|
2015 |
|||
|
Current: |
|
|
|
|
|
|
|
|
|
|
Federal |
|
$ |
— |
|
$ |
— |
|
$ |
— |
|
State |
|
|
594 |
|
|
229 |
|
|
474 |
|
Foreign |
|
|
735 |
|
|
448 |
|
|
246 |
|
Total current income taxes |
|
|
1,329 |
|
|
677 |
|
|
720 |
|
Deferred—foreign |
|
|
220 |
|
|
132 |
|
|
64 |
|
Total provision for income taxes |
|
$ |
1,549 |
|
$ |
809 |
|
$ |
784 |
Effective income tax rate reconciliation—The effective income tax rate was different from the statutory U.S. federal income tax rate due to the following:
|
|
|
Year Ended December 31, |
|||||||
|
|
|
2017 |
|
2016 |
|
2015 |
|||
|
Income taxes at 35% statutory tax rate |
|
$ |
23,834 |
|
$ |
(2,578) |
|
$ |
7,703 |
|
Net difference resulting from: |
|
|
|
|
|
|
|
|
|
|
Profit and loss of Cactus LLC not subject to U.S. federal tax |
|
|
(22,758) |
|
|
2,990 |
|
|
(7,627) |
|
Foreign earnings subject to different tax rates |
|
|
(302) |
|
|
(122) |
|
|
(50) |
|
State income taxes |
|
|
594 |
|
|
229 |
|
|
474 |
|
Foreign withholding taxes |
|
|
220 |
|
|
132 |
|
|
64 |
|
Change in valuation allowance |
|
|
(39) |
|
|
158 |
|
|
220 |
|
Total provision for income taxes |
|
$ |
1,549 |
|
$ |
809 |
|
$ |
784 |
Deferred tax components—The components of deferred tax assets and liabilities are as follows:
|
|
|
December 31, |
||||
|
|
|
2017 |
|
2016 |
||
|
Foreign withholding taxes |
|
$ |
416 |
|
$ |
196 |
|
Foreign loss carryforwards |
|
|
(489) |
|
|
(528) |
|
Valuation allowance |
|
|
489 |
|
|
528 |
|
Total deferred tax liability, net |
|
$ |
416 |
|
$ |
196 |
We have foreign net operating losses of $1.8 million, $1.9 million and $1.3 million for 2017, 2016 and 2015, respectively. The foreign net operating losses have an indefinite carryforward period. We have recorded a full valuation allowance against the deferred tax assets associated with the foreign net operating loss carryforwards due to the uncertainty of realization.
Taxing Authority Examinations—The Texas Franchise state tax returns for the years ended December 31, 2014 and 2015 are currently under examination by the taxing authorities. Management believes that the result of the examination will not have a material impact on the financial statements. None of our other state income tax returns are currently under examination by state taxing authorities.
75
6. Members’ Equity
Member units outstanding were as follows:
|
|
|
December 31, |
||
|
|
|
2017 |
|
2016 |
|
Units |
|
|
|
|
|
Class A |
|
36,500 |
|
36,500 |
|
Class A-1 |
|
520 |
|
520 |
|
Class B |
|
8,608 |
|
8,608 |
There were no distributions for 2017. Distributions by Unit class are as follows for 2016 and 2015:
|
|
|
Year Ended December 31, |
||||||||||
|
|
|
2016 |
|
2015 |
||||||||
|
|
|
Amount |
|
Per Unit |
|
Amount |
|
Per Unit |
||||
|
Distributions |
|
|
|
|
|
|
|
|
|
|
|
|
|
Class A |
|
$ |
2,055 |
|
$ |
56 |
|
$ |
8,928 |
|
$ |
245 |
|
Class A-1 |
|
|
— |
|
|
— |
|
|
3 |
|
|
7 |
|
Class B |
|
|
— |
|
|
— |
|
|
3,301 |
|
|
528 |
|
Total distributions |
|
$ |
2,055 |
|
|
|
|
$ |
12,232 |
|
|
|
Distributions and income are defined in accordance with a waterfall calculation which allocates distributions and income to the Class A‑1 and Class B Unit holders based upon the Class A Unit holders’ return on investment thresholds. Under the terms of its operating agreement, Cactus LLC is obligated to make distributions to its members to enable them to settle tax liabilities that arise from their investment in Cactus LLC. These distributions are recorded in the period during which payment is made. Cactus LLC was not required to make any distributions related to member tax liabilities that arose in 2017 from their investment in Cactus LLC until 2018. In January 2018, Cactus LLC made a distribution of $26.0 million to its members related to tax liabilities incurred prior to the IPO. Voting rights are limited to Class A Unit holders.
There were no Class A or Class B Units issued during 2017, 2016 or 2015. From time to time, Cactus LLC issues Class A‑1 Units to Directors and key employees. There were no new Class A‑1 Units issued during 2017. During 2016 and 2015, Cactus LLC issued 120 and 125 Class A‑1 Units, respectively, and recorded compensation expense of $0.4 million and $0.4 million, respectively. The Class A‑1 Units were fully vested as of grant date and as such all equity compensation was expensed immediately. The equity compensation is included in selling, general and administrative expenses in the consolidated statements of income. Class A‑1 Unit holders are allocated pari passu with all Class A and Class A‑1 Unit holders provided Cactus LLC’s Enterprise Value exceeds the amount detailed in their individual Subscription and Investment Agreement.
The following is a rollforward of Class A‑1 Units:
|
Units at December 31, 2014 |
|
275 |
|
Units issued in 2015 |
|
125 |
|
Units at December 31, 2015 |
|
400 |
|
Units issued in 2016 |
|
120 |
|
Units at December 31, 2016 |
|
520 |
|
Units issued in 2017 |
|
— |
|
Units at December 31, 2017 |
|
520 |
76
The Class A‑1 Units were valued using the Black Scholes valuation model. Volatility was estimated based on the average of the volatility of peer group companies in Cactus LLC’s industry. No forfeitures or expected future distributions were assumed. No Class A‑1 Units were issued in 2017. The key assumptions for 2016 and 2015 are as follows:
|
|
|
December 31, |
|
||
|
|
|
2016 |
|
2015 |
|
|
Expected term in years |
|
3.5 |
years |
3.5 |
years |
|
Expected volatility |
|
33 |
% |
33 |
% |
|
Risk‑free interest rate |
|
0.98 |
% |
0.98 |
% |
The key assumptions were unchanged between 2016 and 2015 as the Class A‑1 Units were issued within a two month period of time (January 1, 2016 and November 1, 2015) and management believes that there were no factors during the two months to change the assumptions.
7. Related Party Transactions
We entered into a management services agreement with two of our members, whereby we must pay an annual management fee totaling approximately $0.3 million, payable in four installments, each to be paid quarterly in advance, prorated for any partial year. The agreement shall terminate upon the consummation of a change of control sale, as defined in our operating agreement. Management fee expense totaled $0.3 million for each of 2017, 2016 and 2015. There were no outstanding balances due as of December 31, 2017 and 2016 under the management services agreement. In conjunction with our IPO, the management services agreements terminated.
During 2016 and 2015, we rented certain equipment from a company owned by a member of Cactus LLC. These transactions were under short‑term rental arrangements. During 2017, 2016 and 2015, expense recognized in connection with these rentals totaled $0.3 million, $0.2 million and $0.3 million, respectively. As of December 31, 2017 and 2016, we owed less than $0.1 million, respectively, to this related party which are included in accounts payable in the consolidated balance sheets.
8. Commitments and Contingencies
Operating Leases and Capital Leases
We lease certain facilities, vehicles, equipment, office and manufacturing space under noncancelable operating leases which expire at various dates through 2029. We are also party to a significant number of month‑to‑month leases that can be canceled at any time. Total rent expense related to operating leases for 2017, 2016 and 2015 amounted to $7.1 million, $7.3 million and $7.9 million, respectively.
We also lease vehicles under capital leases. These leases are typically three years in duration and have no guaranteed residual values. Amounts included within property and equipment under capital leases are as follows:
|
|
|
December 31, |
||||
|
|
|
2017 |
|
2016 |
||
|
Cost |
|
$ |
15,557 |
|
$ |
2,616 |
|
Accumulated depreciation |
|
|
(2,672) |
|
|
(171) |
|
Net |
|
$ |
12,885 |
|
$ |
2,445 |
77
Future minimum annual lease payments, including executory costs and interest, for years subsequent to December 31, 2017 are approximately as follows:
|
|
|
Operating Leases |
|
Capital Leases |
|
Total |
|||
|
2018 |
|
$ |
5,506 |
|
$ |
5,296 |
|
$ |
10,802 |
|
2019 |
|
|
4,083 |
|
|
5,394 |
|
|
9,477 |
|
2020 |
|
|
3,752 |
|
|
3,475 |
|
|
7,227 |
|
2021 |
|
|
3,077 |
|
|
— |
|
|
3,077 |
|
2022 |
|
|
2,031 |
|
|
— |
|
|
2,031 |
|
Thereafter |
|
|
4,713 |
|
|
— |
|
|
4,713 |
|
|
|
$ |
23,162 |
|
$ |
14,165 |
|
$ |
37,327 |
Legal Contingencies
We are involved in various disputes arising in the ordinary course of business. Management does not believe the outcome of these disputes will have a material adverse effect on our consolidated financial position or consolidated results of operations.
9. Employee Benefit Plans
401K Plan
Our employees within the United States are eligible to participate in a 401(k) plan sponsored by us. These employees are eligible to participate upon employment hire date and obtaining the age of eighteen. All eligible employees may contribute a percentage of their compensation subject to a maximum imposed by the Internal Revenue Code. During 2017, we matched 100% of the first 3% of gross pay contributed by each employee and 50% of the next 4% of gross pay contributed by each employee. We may also make additional non‑elective employer contributions at its discretion under the plan. Similar benefit plans exist for employees of our foreign subsidiaries. During 2017, 2016 and 2015, employer matching contributions totaled $2.2 million, $1.2 million and $1.5 million, respectively. We have not made non‑elective employer contributions under the plan.
10. Earnings (loss) Per Unit
Class A‑1 Units and Class B Units are entitled to allocations of distributions and income based upon the Class A Unit holder’s return on investment thresholds. The Class A‑1 Units and the Class B Units are considered participating securities and are required to be included in the calculation of basic earnings (loss) per Unit using the two‑class method. The two‑class method of computing earnings per Unit is an earnings allocation formula that determines earnings per Unit for each class of Unit according to dividends declared and participation rights in
78
undistributed earnings. Basic earnings (loss) per Unit is calculated based on the weighted‑average number of the Class A Units outstanding during the periods presented. The following is a summary of earnings per Unit:
|
|
|
Year Ended December 31, |
|||||||
|
|
|
2017 |
|
2016 |
|
2015 |
|||
|
Numerator: |
|
|
|
|
|
|
|
|
|
|
Net income (loss) |
|
$ |
66,547 |
|
$ |
(8,176) |
|
$ |
21,224 |
|
Participating securities: |
|
|
|
|
|
|
|
|
|
|
Dividends |
|
|
— |
|
|
— |
|
|
(3,303) |
|
Income allocation |
|
|
(20,617) |
|
|
— |
|
|
(6,720) |
|
Net income (loss) available to Class A Units |
|
$ |
45,930 |
|
$ |
(8,176) |
|
$ |
11,201 |
|
Denominator: |
|
|
|
|
|
|
|
|
|
|
Weighted average Class A Units—basic and diluted |
|
|
36,500 |
|
|
36,500 |
|
|
36,500 |
|
Earnings (loss) per Class A Unit—basic and diluted |
|
$ |
1,258.36 |
|
$ |
(224.00) |
|
$ |
306.88 |
Losses were not allocated to the participating Units in 2016 as the participating securities are not contractually obligated to fund losses.
11. Supplemental Information
Non-cash investing and financing activities were as follows:
|
|
|
Year Ended December 31, |
|||||||
|
|
|
2017 |
|
2016 |
|
2015 |
|||
|
Property and equipment acquired under capital lease |
|
$ |
12,941 |
|
$ |
2,616 |
|
$ |
— |
|
Property and equipment in payables |
|
|
1,553 |
|
|
243 |
|
|
276 |
Cash paid for interest and income taxes was as follows:
|
|
|
Year Ended December 31, |
|||||||
|
|
|
2017 |
|
2016 |
|
2015 |
|||
|
Cash paid for interest |
|
$ |
18,826 |
|
$ |
19,946 |
|
$ |
21,391 |
|
Cash paid for income taxes, net |
|
|
1,535 |
|
|
583 |
|
|
370 |
12. Quarterly Financial Information (Unaudited)
Summarized quarterly financial data for the years ended December 31, 2017 and 2016 are presented in the following tables. In the following tables, the sum of basic and diluted earnings per unit for the four quarters may differ from the annual amounts due to the required method of computing weighted average number of shares in the respective
79
periods. Additionally, due to the effect of rounding, the sum of the individual quarterly earnings per share amounts may not equal the calculated year earnings per share amount.
|
|
|
2017 Quarters |
|||||||||||||
|
|
|
Total |
|
Fourth |
|
Third |
|
Second |
|
First |
|||||
|
|
|
|
|
|
|
|
|
|
|
|
|
|
|
|
|
|
Total revenues |
|
$ |
341,191 |
|
$ |
104,784 |
|
$ |
96,027 |
|
$ |
81,877 |
|
$ |
58,503 |
|
|
|
|
|
|
|
|
|
|
|
|
|
|
|
|
|
|
Income from operations |
|
|
88,863 |
|
|
28,737 |
|
|
28,059 |
|
|
22,073 |
|
|
9,994 |
|
|
|
|
|
|
|
|
|
|
|
|
|
|
|
|
|
|
Net income |
|
|
66,547 |
|
|
22,814 |
|
|
22,301 |
|
|
16,578 |
|
|
4,854 |
|
|
|
|
|
|
|
|
|
|
|
|
|
|
|
|
|
|
Earnings per Class A Unit—basic and diluted |
|
|
1,258.36 |
|
|
431.40 |
|
|
421.70 |
|
|
312.79 |
|
|
92.47 |
|
|
|
|
2016 Quarters |
||||||||||||
|
|
|
Total |
|
Fourth |
|
Third |
|
Second |
|
First |
|||||
|
|
|
|
|
|
|
|
|
|
|
|
|
|
|
|
|
|
Total revenues |
|
$ |
155,048 |
|
$ |
49,547 |
|
$ |
36,755 |
|
$ |
32,863 |
|
$ |
35,883 |
|
|
|
|
|
|
|
|
|
|
|
|
|
|
|
|
|
|
Income from operations |
|
|
10,615 |
|
|
6,162 |
|
|
2,112 |
|
|
1,218 |
|
|
1,123 |
|
|
|
|
|
|
|
|
|
|
|
|
|
|
|
|
|
|
Net income (loss) |
|
|
(8,176) |
|
|
1,346 |
|
|
(3,167) |
|
|
(1,833) |
|
|
(4,522) |
|
|
|
|
|
|
|
|
|
|
|
|
|
|
|
|
|
|
Earnings (loss) per Class A Unit—basic and diluted |
|
|
(224.00) |
|
|
36.88 |
|
|
(86.77) |
|
|
(50.22) |
|
|
(123.89) |
13. Subsequent Events
On February 12, 2018, Cactus Inc. completed its IPO. Pursuant to the IPO, Cactus Inc. issued 23,000,000 shares of Class A common stock, par value $0.01 per share (“Class A Common Stock”), at a price to the public of $19.00 per share. Cactus Inc. received net proceeds of $405.8 million after deducting underwriting discounts and commissions and estimated offering expenses of the IPO. On February 14, 2018 Cactus Inc. completed the sale of an additional 3,450,000 shares of Class A Common Stock pursuant to the exercise in full by the underwriters of their option (the “Option”) to purchase additional shares of Class A Common Stock, resulting in $61.6 million of additional net proceeds. Cactus Inc. contributed all of the net proceeds of the IPO to Cactus LLC in exchange for CW Units. Cactus LLC used (i) $251.0 million of the net proceeds to repay all of the borrowings outstanding under its term loan facility, including accrued interest and (ii) $216.4 million to redeem CW Units from certain direct and indirect owners of Cactus LLC. After the IPO, the amount of debt outstanding for Cactus LLC significantly decreased. With the closing of the IPO, we will write off $2.2 million of deferred IPO costs as a charge to additional paid in capital that are included in prepaid expenses in the consolidated balance sheet as of December 31, 2017.
In connection with the completion of the IPO, Cactus Inc. became the sole managing member of Cactus LLC and is responsible for all operational, management and administrative decisions relating to Cactus LLC’s business and will consolidate the financial results of Cactus LLC and its subsidiaries. The Limited Liability Company Operating Agreement of Cactus LLC was amended and restated as the First Amended and Restated Limited Liability Company Operating Agreement of Cactus LLC (the “Cactus Wellhead LLC Agreement”) to, among other things, admit Cactus Inc. as the sole managing member of Cactus LLC.
80
In connection with the IPO, Cactus completed a series of reorganization transactions, including the following:
|
(a) |
all of the membership interests in Cactus LLC were converted into a single class of CW Units; |
|
(b) |
Cactus Inc. contributed the net proceeds of the IPO to Cactus LLC in exchange for 23,000,000 CW Units; |
|
(c) |
Cactus LLC used the net proceeds of the IPO that it received from Cactus Inc. to repay the borrowings outstanding, plus accrued interest, under its term loan facility and to redeem 8,667,841 CW Units from the owners thereof; |
|
(d) |
Cactus Inc. issued and contributed 51,747,768 shares of its Class B common stock, par value $0.01 per share (“Class B Common Stock”) equal to the number of outstanding CW Units held by the Pre-IPO Owners following the redemption described in (c) above to Cactus LLC; |
|
(e) |
Cactus LLC distributed to each of the Pre-IPO Owners that continued to own CW Units following the IPO one share of Class B Common Stock for each CW Unit such Pre-IPO Owner held following the redemption described in (c) above; |
|
(f) |
Cactus Inc. contributed the net proceeds from the exercise of the Option to Cactus LLC in return for 3,450,000 additional CW Units; and |
|
(g) |
Cactus LLC used the net proceeds from the Option to redeem 3,450,000 CW Units from the owners thereof, and Cactus Inc. canceled a corresponding number of shares of Class B Common Stock. |
Additionally, in connection with the IPO, Cactus Inc. granted 0.7 million restricted stock unit awards, which will vest over one to three years, to certain directors, officers and employees of Cactus. Stock-based compensation expense associated with these awards will be recognized over the vesting term.
The owners of CW Units (along with their permitted transferees) are referred to as “CW Unit Holders.” CW Unit Holders also own one share of our Class B Common Stock for each CW Unit such CW Unit Holders own. After giving effect to the IPO and the related transactions, Cactus Inc. owns an approximate 35.3% interest in Cactus LLC, and the CW Unit Holders own an approximate 64.7% interest in Cactus LLC. These ownership percentages are based on 26,450,000 shares of Class A Common Stock and 48,439,772 shares of Class B Common Stock issued and outstanding as of March 13, 2018.
The shares of Class B common stock are not considered participating securities because they do not participate in the earnings of Cactus Inc. The noncontrolling interest owners own shares of Class B common stock. The noncontrolling interest owners have redemption rights which enable the noncontrolling interest owners to redeem CW Units (and corresponding shares of Class B common stock) for shares of Class A common stock on a one for one basis or, at Cactus Inc.’s or Cactus LLC’s election, an equivalent amount of cash.
Cactus Inc.’s sole material assets are CW Units in Cactus LLC. On February 12, 2018, in connection with the IPO, Cactus Inc. became the managing member of Cactus LLC and is responsible for all operational, management and administrative decisions relating to Cactus LLC’s business.
Cactus Inc. will be subject to federal income taxes related to its share of income in Cactus LLC. In connection with the IPO, Cactus Inc. entered into the Tax Receivable Agreement (“TRA”) with certain direct and indirect owners of Cactus LLC (each such person, a “TRA Holder”) pursuant to which Cactus Inc. will pay to the TRA Holders 85% of the amount of net cash savings, if any, in U.S. federal, state and local income tax or franchise tax that Cactus Inc. actually realizes (or is deemed to realize in certain circumstances) in periods after the IPO as a result of (i) certain increases in tax
81
basis that occur as a result of Cactus Inc.’s acquisition (or deemed acquisition for U.S. federal income tax purposes) of all or a portion of such TRA Holders’ CW Units in connection with the IPO or pursuant to the exercise of the redemption right or the call right set forth in the TRA, (ii) certain increases in tax basis resulting from the repayment, in connection with the IPO, of borrowings outstanding under Cactus LLC’s term loan facility, and (iii) imputed interest deemed to be paid by Cactus Inc. as a result of, and additional tax basis arising from, any payments Cactus Inc. makes under the TRA. Cactus Inc. will retain the benefit of the remaining 15% of these net cash savings.
On January 21, 2018, the board of directors of Cactus LLC declared a cash distribution of $26.0 million, which was paid to the Pre-IPO Owners on January 25, 2018. Such distribution was funded by borrowing under the revolving credit facility. The purpose of the distribution was to provide funds to the Pre-IPO Owners to pay their federal and state tax liabilities associated with taxable income recognized by them as a result of their ownership interests in Cactus LLC prior to the completion of our IPO.
82
Item 9. Changes in and Disagreements with Accountants on Accounting and Financial Disclosure
None.
Item 9A. Controls and Procedures
Evaluation of Disclosure Controls and Procedures
In accordance with Exchange Act Rules 13a‑15 and 15d‑15, we have evaluated, under the supervision and with the participation of our management, including our principal executive officer and principal financial officer, the effectiveness of the design and operation of our disclosure controls and procedures (as defined in Rules 13a‑15(e) and 15d‑15(e) under the Exchange Act) as of December 31, 2017. Our disclosure controls and procedures are designed to provide reasonable assurance that the information required to be disclosed by us in reports that we file or submit under the Exchange Act is accumulated and communicated to our management, including our principal executive officer and principal financial officer, as appropriate, to allow timely decisions regarding required disclosure and is recorded, processed, summarized and reported within the time periods specified in the rules and forms of the SEC. Based upon that evaluation, our principal executive officer and principal financial officer concluded that our disclosure controls and procedures were effective as of December 31, 2017 at the reasonable assurance level.
Management’s Annual Report on Internal Control over Financial Reporting and Attestation Report of the Registered Public Accounting Firm
This annual report does not include a report of management’s assessment regarding internal control over financial reporting or an attestation report of our registered public accounting firm due to a transition period established by the rules of the SEC for newly public companies. However, a report of management’s assessment regarding internal control over financial reporting will be required for the 2018 annual report.
Remediation of Material Weakness in Internal Control Over Financial Reporting
In connection with the audit of the consolidated financial statements of Cactus Wellhead, LLC, our predecessor for accounting purposes, for the year ended December 31, 2016, we identified a material weakness in our internal control over financial reporting. A material weakness is a deficiency, or a combination of deficiencies, in internal control over financial reporting, such that there is a reasonable possibility that a material misstatement of our annual or interim financial statements will not be prevented or detected on a timely basis.
We did not effectively operate controls in place over the review of the consolidated financial statements and related disclosures for 2016. This resulted in the identification of certain errors in the 2016 consolidated statement of cash flows that have been corrected as a revision of that statement.
Changes were made to our controls and procedures during the quarter ended June 30, 2017, in an effort to remediate these deficiencies. Activities to remediate the previously identified material weakness include hiring additional experienced resources to manage the preparation of the consolidated financial statements and disclosures to allow more timely review of these consolidated financial statements and disclosures by management. With this change, we also added new controls and procedures related to the preparation of the consolidated financial statements and disclosures. In connection with these efforts, we documented the internal controls with respect to the preparation of the consolidated financial statements and disclosures and performed those controls in the preparation of the consolidated financial statements and disclosures.
Neither our management nor an independent registered public accounting firm has performed an evaluation of our internal control over financial reporting in accordance with the provisions of the Sarbanes‑Oxley Act because no
83
such evaluation has been required. However, based on the actions described above, we have concluded that the previously identified and disclosed material weakness no longer exists as of December 31, 2017.
Changes in Internal Control over Financial Reporting
There has been no change in our internal control over financial reporting during the quarter ended December 31, 2017 that has materially affected, or is reasonably likely to materially affect, our internal control over financial reporting.
Not applicable.
84
Item 10. Directors, Executive Officers and Corporate Governance
Information as to Item 10 will be set forth in the Proxy Statement for the Annual Meeting of Shareholders to be held on June 20, 2018 (the “Annual Meeting”) and is incorporated herein by reference.
Our board of directors has adopted a Code of Business Conduct and Ethics applicable to all of our officers, directors and employees, including our principal executive officer, principal financial officer, principal accounting officer and controller, or persons performing similar functions and is available on our website at www.CactusWHD.com under “Corporate Governance” within the “Investors” section. We will provide a copy of this document to any person, without charge, upon request, by writing to us at Cactus, Inc., Investor Relations, Cobalt Center, 920 Memorial City Way, Suite 300, Houston, Texas 77024. We intend to satisfy the disclosure requirement under Item 406(b) of Regulation S-K regarding amendments to, or waivers from, provisions of our Code of Business Conduct and Ethics by posting such information on our website at the address and the location specified above.
Item 11. Executive Compensation
Information as to Item 11 will be set forth in the Proxy Statement for the Annual Meeting and is incorporated herein by reference.
Item 12. Security Ownership of Certain Beneficial Owners and Management and Related Stockholder Matters
Information as to Item 12 will be set forth in the Proxy Statement for the Annual Meeting and is incorporated herein by reference.
Item 13. Certain Relationships and Related Transactions, and Director Independence
Information as to Item 13 will be set forth in the Proxy Statement for the Annual Meeting and is incorporated herein by reference.
Item 14. Principal Accounting Fees and Services
Information as to Item 14 will be set forth in the Proxy Statement for the Annual Meeting and is incorporated herein by reference.
85
Item 15. Exhibits, Financial Statement Schedules
(1) Financial Statements
The consolidated financial statements of Cactus, Inc. and Cactus Wellhead, LLC and Subsidiaries and the Reports of Independent Registered Public Accounting Firm are included in Part II, Item 8 of this report. Reference is made to the accompanying Index to Consolidated Financial Statements.
(2) Financial Statement Schedules
All financial statement schedules have been omitted because they are not applicable or the required information is presented in the financial statements or the notes thereto.
(3) Index to Exhibits
The exhibits required to be filed or furnished pursuant to Item 601 of Regulation S-K are set forth below.
|
Exhibit No. |
Description |
|
|
3.1 |
||
|
3.2* |
||
|
10.1 |
||
|
10.2† |
||
|
10.3† |
||
|
10.4† |
||
|
10.5† |
||
|
10.6† |
||
86
|
Exhibit No. |
Description |
|
|
10.7† |
||
|
10.8† |
||
|
10.9† |
||
|
10.10† |
||
|
10.11† |
||
|
10.12† |
||
|
10.13† |
||
|
10.14† |
||
|
10.15† |
||
|
10.16† |
||
|
10.17 |
||
|
10.18 |
||
|
10.19 |
||
|
10.20 |
||
|
10.21 |
||
87
|
Exhibit No. |
Description |
|
|
10.22† |
||
|
10.23† |
||
|
21.1* |
||
|
31.1* |
Certification of Chief Executive Officer pursuant to Section 302 of the Sarbanes-Oxley Act of 2002. |
|
|
31.2* |
Certification of Chief Financial Officer pursuant to Section 302 of the Sarbanes-Oxley Act of 2002. |
|
|
32.1** |
||
|
32.2** |
* Filed herewith
** Furnished herewith. Pursuant to SEC Release No. 33‑8212, this certification will be treated as “accompanying” this Annual Report and not “filed” as part of such report for purposes of Section 18 of the Exchange Act or otherwise subject to the liability of Section 18 of the Exchange Act, and this certification will not be deemed to be incorporated by reference into any filing under the Securities Act, except to the extent that the registrant specifically incorporates it by reference.
† Management contract or compensatory plan or arrangement.
None.
88
Pursuant to the requirements of the Securities Exchange Act of 1934, the registrant has duly caused this report to be signed on its behalf by the undersigned thereunto duly authorized.
|
|
Cactus, Inc. |
|
|
|
|
|
|
|
By: |
/s/ Scott Bender |
|
|
|
Scott Bender |
|
|
|
President, Chief Executive Officer and Director |
|
|
Date: March 19, 2018 |
|
Pursuant to the requirements of the Securities Exchange Act of 1934, this report has been signed below by the following persons on behalf of the registrant and in the capacities indicated on March 19, 2018.
|
Signature |
|
Title |
|
|
|
|
|
/s/ Scott Bender |
|
President, Chief Executive Officer and Director (Principal Executive |
|
Scott Bender |
|
Officer) |
|
|
|
|
|
/s/ Brian Small |
|
Chief Financial Officer (Principal Financial Officer) |
|
Brian Small |
|
|
|
|
|
|
|
/s/ Ike Smith |
|
Chief Accounting Officer (Principal Accounting Officer) |
|
Ike Smith |
|
|
|
|
|
|
|
/s/ Bruce Rothstein |
|
Chairman |
|
Bruce Rothstein |
|
|
|
|
|
|
|
/s/ Joel Bender |
|
Director |
|
Joel Bender |
|
|
|
|
|
|
|
/s/ John (Andy) O’Donnell |
|
Director |
|
John (Andy) O’Donnell |
|
|
|
|
|
|
|
/s/ Michael McGovern |
|
Director |
|
Michael McGovern |
|
|
|
|
|
|
|
/s/ Alan Semple |
|
Director |
|
Alan Semple |
|
|
|
|
|
|
|
/s/ Gary Rosenthal |
|
Director |
|
Gary Rosenthal |
|
|
89