Attached files
| file | filename |
|---|---|
| EX-99.2 - EXHIBIT 99.2 - THOR INDUSTRIES INC | a51910007ex99_2.htm |
| EX-99.1 - EXHIBIT 99.1 - THOR INDUSTRIES INC | a51910007ex99_1.htm |
| 8-K - THOR INDUSTRIES, INC. 8-K - THOR INDUSTRIES INC | a51910007.htm |
Exhibit 99.3
601 East Beardsley Avenue, Elkhart, Indiana 46514-3305
First Quarter 2019 Investor Questions & Answers
Published December 6, 2018
Forward Looking Statements
This document includes certain statements that are “forward looking” statements within the meaning of the U.S. Private Securities
Litigation Reform Act of 1995, Section 27A of the Securities Act of 1933, as amended, and Section 21E of the Securities Exchange Act of 1934, as amended. These forward looking statements are made based on management’s current expectations and
beliefs regarding future and anticipated developments and their effects upon Thor, and inherently involve uncertainties and risks. These forward looking statements are not a guarantee of future performance. We cannot assure you that actual
results will not differ materially from our expectations. Factors which could cause materially different results include, among others, raw material and commodity price fluctuations; raw material, commodity or chassis supply restrictions; the
impact of tariffs on material or other input costs; the level and magnitude of warranty claims incurred; legislative, regulatory and tax law and/or policy developments including their potential impact on our dealers and their retail customers
or on our suppliers; the costs of compliance with governmental regulation; legal and compliance issues including those that may arise in conjunction with recently completed or announced transactions; lower consumer confidence and the level of
discretionary consumer spending; interest rate fluctuations; the potential impact of interest rate fluctuations on the general economy and specifically on our dealers and consumers; restrictive lending practices; management changes; the
success of new and existing products and services; consumer preferences; the ability to efficiently utilize production facilities; the pace of acquisitions and the successful closing, integration and financial impact thereof; the potential
loss of existing customers of acquisitions; our ability to retain key management personnel of acquired companies; a shortage of necessary personnel for production; the loss or reduction of sales to key dealers; disruption of the delivery of
units to dealers; increasing costs for freight and transportation; asset impairment charges; cost structure changes; competition; the impact of potential losses under repurchase agreements; the potential impact of the strength of the U.S.
dollar on international demand; general economic, market and political conditions; and changes to investment and capital allocation strategies or other facets of our strategic plan. Additional risks and uncertainties surrounding the
acquisition of Erwin Hymer Group SE (the "Erwin Hymer Group") include risks regarding the anticipated timing of the closing of the acquisition, the potential benefits of the proposed acquisition and the anticipated operating synergies, the
satisfaction of the conditions to closing the acquisition in the anticipated timeframe or at all, the integration of the business, changes in Euro-U.S. dollar exchange rates that could impact the mark-to-market value of outstanding derivative
instruments, the impact of exchange rate fluctuations and unknown or understated liabilities related to the acquisition and Erwin Hymer Group's business. These and other risks and uncertainties are discussed more fully in Item 1A of our
Annual Report on Form 10-K for the year ended July 31, 2018 and Part II, Item 1A of our quarterly report on Form 10-Q for the period ended October 31, 2018.
We disclaim any obligation or undertaking to disseminate any updates or revisions to any forward looking statements contained in this
document or to reflect any change in our expectations after the date hereof or any change in events, conditions or circumstances on which any statement is based, except as required by law.
1
Executive Overview
|
•
|
Optimistic about long-term growth as consumer sentiment and spending remain strong
|
|
•
|
Acquisition of Erwin Hymer Group (EHG) is proceeding as planned, with expected closing near the end of the calendar year
|
|
•
|
Quarterly results impacted by acquisition-related costs totaling $57.1 million, or $1.02 per share
|
For the first quarter fiscal 2019:
|
•
|
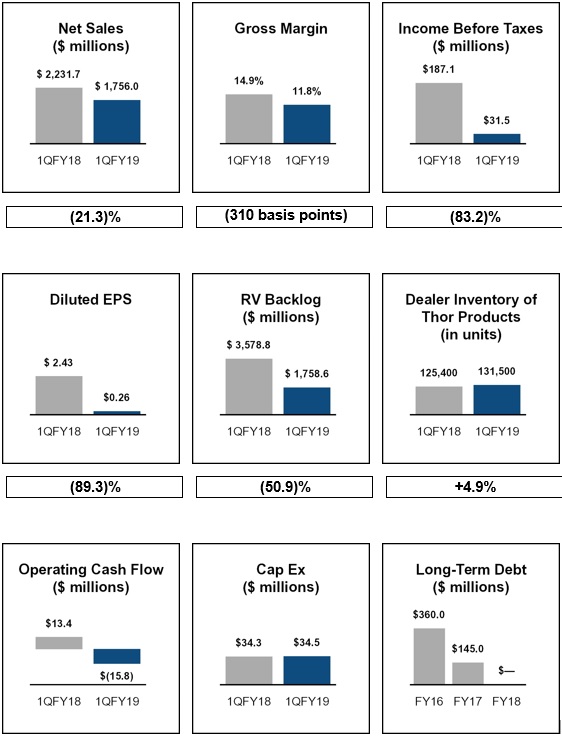
Net sales decreased 21.3% to $1.76 billion
|
|
•
|
Gross profit decreased 37.8% to $207.3 million
|
|
•
|
Income before taxes down 83.2% to $31.5 million
|
|
•
|
Diluted EPS decreased 89.3% to $0.26
|
|
•
|
Incurred acquisition-related costs of $57.1 million with an EPS impact of $1.02 per share
|
Outlook: Stable retail market is anticipated in fiscal 2019, setting a foundation for wholesale demand.
Planning assumptions reflect:
|
•
|
Positive long-term RV
industry fundamentals. This assumption is supported by high consumer confidence rates, favorable employment trends, adequate availability of credit at historically low rates and a healthy housing market.
|
|
•
|
High dealer optimism.
Demand continues to be driven by favorable demographic and lifestyle growth trends, including the ongoing strength of baby boomer customers, as well as first-time and younger buyers
|
|
•
|
Challenging wholesale
conditions in the North American market. Due to dealer order strength experienced in the first half of fiscal 2018, we are planning for tougher year-over-year comparisons in the first half of fiscal 2019, with more
favorable top-line comparisons in the second half of the year. Similar to the quarterly progression of our top line, we anticipate gross margin pressure to be greater in the first half of the year.
|
|
•
|
Impact of transaction costs
on our diluted EPS in FY 2019. Thor incurred $14.5 million in costs related to the pending acquisition of EHG, comprised primarily of legal, professional and advisory fees related to financial due diligence and
preliminary implementation costs, rating agency fees and regulatory review costs.
|
|
•
|
Effective tax rate.
Our effective tax rate (55.7% compared to a tax rate of 31.4% in the prior year) is higher than usual because the $42.6 million non-cash, mark-to-market loss on the foreign currency forward contract recorded in the first fiscal
quarter is not deductible for income tax purposes. The Company expects to return to a more normalized effective tax rate of 23-25%, before consideration of any discrete tax items, in the second half of fiscal 2019.
|
2
Quick Reference to Contents
|
A.
|
Consolidated Financial Highlights
|
4 |
|
B.
|
Summary of Key Quarterly Segment Data – Towables
|
5 |
|
C.
|
Summary of Key Quarterly Segment Data – Motorized
|
6 |
|
D.
|
First Quarter Operating Results
|
7 |
|
E.
|
Current Hot Topics
|
10 |
|
a. Acquisition of EHG
|
10 |
|
|
b. Dealer Inventory Levels
|
12 |
|
|
c. Material Costs, Including Discussion of Trade Tariffs
|
12 |
|
|
d. TH2 Joint Venture
|
12 |
|
|
F.
|
Drivers of Demand
|
13 |
|
a. Key Consumer Trends
|
13 |
|
|
b. Younger Buyers Entering the Marketplace
|
15 |
|
|
c. Used RV Market
|
15 |
|
|
G.
|
Current Market Conditions
|
15 |
|
a. North American Market
|
15 |
|
|
b. Labor Conditions
|
17 |
|
|
c. Competitive Environment
|
17 |
|
|
d. Credit Conditions – Wholesale & Retail
|
18 |
|
|
e. Consolidation of Dealer Base
|
18 |
|
|
H.
|
Balance Sheet and Cash Flow
|
19 |
|
I.
|
Key Economic Indicators
|
21 |
|
J.
|
Outlook
|
22 |
3
Consolidated Financial Highlights
1Q data is as of October 31, 2018 and 2017; FY data is as of or for the year ended July 31, 2018
4
Summary of Key Quarterly Segment Data – Towables
| |
Three Months
Ended
|
Three Months
Ended
|
|
%
|
||||||||
| October 31, 2018 |
October 31, 2017 | Change | ||||||||||
|
NET SALES:
|
||||||||||||
|
Towables
|
||||||||||||
|
Travel Trailers and Other
|
$ |
761,484 |
$
|
993,604 |
(23.4
|
)%
|
||||||
|
Fifth Wheels
|
517,614
|
624,897 |
(17.2
|
)%
|
||||||||
|
Total Towables
|
$ |
1,279,098 |
$
|
1,618,501 |
(21.0
|
)%
|
||||||
|
Three Months
Ended
|
Three Months
Ended
|
|
%
|
|||||||||
| October 31, 2018 | October 31, 2017 | Change | ||||||||||
|
# OF UNITS:
|
||||||||||||
|
Towables
|
||||||||||||
|
Travel Trailers and Other
|
37,497
|
51,668 |
(27.4
|
)%
|
||||||||
|
Fifth Wheels
|
11,571
|
14,427 |
(19.8
|
)%
|
||||||||
|
Total Towables
|
49,068
|
66,095 |
(25.8
|
)%
|
||||||||
|
As of
|
As of |
%
|
||||||||||
|
ORDER BACKLOG:
|
October 31, 2018
|
October 31, 2017 |
Change
|
|||||||||
|
Towables
|
$ |
1,018,384 |
$
|
2,455,056 |
(58.5
|
)%
|
||||||
|
MARKET SHARE SUMMARY (a)
|
Nine Months Ended September 30,
|
|||||||||||
|
2018
|
2017 |
|||||||||||
|
U.S. Market
|
48.5
|
% |
48.7
|
% | ||||||||
|
Canadian Market
|
53.2
|
% |
55.4
|
% | ||||||||
|
Combined North American Market
|
49.0
|
% |
49.5
|
% | ||||||||
(a) Source: Statistical Surveys, Inc. YTD September 30, 2018 vs. YTD September 30, 2017
Note: Data reported by Stat Surveys is based on official state and provincial records. This information is subject to adjustment and is continuously updated, and is often impacted by delays in reporting by various states or
provinces.
Thor Unit Shipments versus
Industry
Our Towable unit shipments for the quarter decreased by 25.8%. According to statistics published by RVIA, for the three months
ended October 31, 2018, combined industry travel trailer and fifth wheel wholesale unit shipments decreased 16.7% compared to the same period last year.
5
Summary of Key Quarterly Segment Data – Motorized
|
|
Three Months
Ended
|
Three Months
Ended
|
%
|
|||||||||
|
October 31, 2018
|
October 31, 2017 |
Change
|
||||||||||
|
NET SALES:
|
||||||||||||
|
Motorized
|
||||||||||||
|
Class A
|
$ | 227,274 |
$
|
252,423 |
(10.0
|
)%
|
||||||
|
Class C
|
184,384
|
286,666 |
(35.7
|
)%
|
||||||||
|
Class B
|
19,540
|
27,522 |
(29.0
|
)%
|
||||||||
|
Total Motorized
|
$ |
431,198 |
$
|
566,611 |
(23.9
|
)%
|
||||||
|
Three Months
Ended
|
Three Months
Ended
|
%
|
||||||||||
|
October 31, 2018
|
October 31, 2017 |
Change
|
||||||||||
|
# OF UNITS:
|
||||||||||||
|
Motorized
|
||||||||||||
|
Class A
|
1,672
|
2,267 |
(26.2
|
)%
|
||||||||
|
Class C
|
2,557
|
4,364 |
(41.4
|
)%
|
||||||||
|
Class B
|
137
|
212 |
(35.4
|
)%
|
||||||||
|
Total Motorized
|
4,366
|
6,843 |
(36.2
|
)%
|
||||||||
|
As of
|
As of |
%
|
||||||||||
|
ORDER BACKLOG:
|
October 31, 2018
|
October 31, 2017 |
Change
|
|||||||||
|
Motorized
|
$ |
740,228 |
$
|
1,123,745 |
(34.1
|
)%
|
||||||
|
MARKET SHARE SUMMARY (a)
|
Nine Months Ended September 30,
|
|||||||||||
|
2018
|
2017 |
|||||||||||
|
U.S. Market
|
40.2
|
% |
39.8
|
% | ||||||||
|
Canadian Market
|
38.5
|
% |
35.7
|
% | ||||||||
|
Combined North American Market
|
40.0
|
% |
39.5
|
% | ||||||||
(a) Source: Statistical
Surveys, Inc. YTD September 30, 2018 vs. YTD September 30, 2017
Note: Data reported by Stat
Surveys is based on official state and provincial records. This information is subject to adjustment and is continuously updated, and is often impacted by delays in reporting by various states or provinces.
Thor Unit Shipments versus
Industry
Our Motorized unit shipments decreased by 36.2% for the quarter, compared to an industry decrease of 16.9% for the three months
ended October 31, 2018. Class C industry shipments were down by 24.1% for the quarter, contributing to the quarterly motorized decrease given our larger market share in Class C.
6
First Quarter Operating Results
|
1.
|
Thor reported a decline in consolidated sales of 21.3% for the first quarter of fiscal 2019 versus
the prior year. What factors drove the lower sales levels?
|
|
A.
|
The decline in first quarter sales reflects several factors:
|
|
▪
|
Historical
Unit Sales: Unit sales are in line with a more normal historical seasonal sales trajectory whereby fiscal first quarter sales are typically lower than the fourth quarter, and historically our first half of the fiscal
year has lower sales than the second fiscal half, however, this trend was reversed in fiscal 2018.
|
|
▪
|
Historical
Growth Rates: We also faced more challenging comparisons to the prior fiscal year given the unusually strong level of sales in the first quarter of fiscal 2018. In fiscal 2018, dealers sought to ensure adequate
supply and inventory levels following supply constraints in fiscal 2017, and as a result, our consolidated sales in the first quarter of fiscal 2018 grew 30.6%. The decrease in sales in the first quarter of fiscal 2019
represents a correction to growth rates more closely aligned with retail demand.
|
|
▪
|
Inventory:
Our reduced production levels combined with modest retail demand growth have significantly improved the position of our dealers' inventories as they enter the new model year and prepare for the upcoming retail selling season.
|
|
▪
|
Discounts:
We experienced a sizable decrease in total unit shipments amounting to a 25.8% decrease in towables and a 36.2% decrease in motorized, which is reflective of our continuing efforts to balance inventory levels in the channel.
In addition to the reduction in unit shipments, dealers were disciplined in managing their own inventory levels ahead of new model year product introductions at the dealer Open House held in September, leading to elevated
levels of discounting and promotions compared to the unusually low level in the prior year.
|
We plan to continue managing our production and shipments to provide our dealers with the appropriate levels
of inventory to meet current and expected retail demand in a timely manner. Looking ahead, our objective is to align our sales (wholesale) with those of our dealers (retail) over time, which may result in quarterly variations in our
top-line growth metrics.
7
|
2.
|
Thor's first quarter gross margin decreased by 310 basis points on a year-over-year basis. What were
the main factors causing this result?
|
|
A.
|
The reduction in gross margin in the first quarter was the result of a number of factors. Corresponding with our
efforts to balance channel inventory, we saw a year-over-year increase in the overall level of discounts, particularly on towable products. Increased discounts reduce net sales, but with no corresponding reduction in cost of
goods sold, discounts directly reduced gross margins. During the first quarter, we also experienced an increase in year-over-year warranty costs and continued to experience inflationary price increases in certain raw material
and commodity-based components. This was due in part to the headwinds created by the announcement and implementation of the steel and aluminum tariffs. Labor costs have stabilized as industry production levels have come down
in recent months and did not significantly impact first quarter gross margins on a year over year basis. Overhead costs as a percentage of sale also increased due to the sales reduction coupled with cost increases due to
expanding facilities.
|
|
3.
|
Thor’s gross margin for the first quarter was 11.8% compared to 13.0% for the fourth quarter. What
caused this sequential decrease in margin?
|
|
A.
|
In general, our business does not lend itself to meaningful sequential analysis because of varying seasonal demand and
production. However, this quarter's gross margin was impacted by a year-over-year increase in the overall level of discounts, and an increase in year-over-year warranty costs. Historically, our first quarter has been
characterized by lower sales and resulting margins when compared to the fourth quarter. This normal sequential pattern did not occur in the first quarter of fiscal 2018, which makes the reversion to the normal seasonal
patterns in the first quarter of fiscal 2019 seem more pronounced.
|
|
4.
|
On a percentage of sales basis, Thor’s Selling, General and Administrative (SG&A) expenses were
down modestly compared to the prior year, at approximately 5.8% compared to 6.0% last year. What were some of the key factors that affected expenses during the quarter?
|
|
A.
|
Our recent historical trend of SG&A expenses reflects a general range of 5.5% to 6.0% of net sales. The costs
included in SG&A are primarily variable in nature and fluctuate with the level of sales and income before income taxes.
|
SG&A expenses at the segment, Corporate and consolidated levels were generally consistent as a percent of
sales compared to the first quarter of fiscal 2018, in spite of the decrease in sales, primarily due to a reduction in our management incentive compensation costs. These costs are based on pre-tax profitability and provides us with cost
savings in times when profitability is lower, as was the case in the first quarter of this year.
8
|
5.
|
Thor reported a decline in income before income taxes of 83.2% on a decline in sales of 21.3% for
the first quarter of fiscal 2019. What caused this result?
|
|
A.
|
Thor’s earnings performance was driven by lower sales and lower gross margin percent, as well as increased expenses
associated with the announced acquisition of the Erwin Hymer Group. Included in these transaction-related costs was a $42.6 million non-cash, mark-to-market loss on a foreign currency forward contract for the U.S. dollar-euro
exchange rate covering the cash portion of the purchase price, as well as $14.5 million in transaction related costs for legal, professional and advisory fees related to financial due diligence and preliminary implementation
costs, regulatory review costs and rating agency fees. Excluding the impact of these acquisition costs, our income before income taxes would have declined 52.6%.
|
|
6.
|
Thor reported a significant increase in its effective tax rate for the quarter, what caused this
increase?
|
|
A.
|
Although the Tax Act in 2017 favorably impacted Thor's effective tax rate, the primary reason for the increase in the
first quarter effective tax rate was the $42.6 million non-cash, mark-to-market foreign currency forward contract loss recorded in the fiscal first quarter which is not deductible for tax purposes. As a result, the entire
amount of the mark-to-market loss reduced Thor's pre-tax and net income by the same amount.
|
|
7.
|
What are the key factors affecting current backlog levels? Are you seeing any material cancellations
to orders placed earlier in the year?
|
|
A.
|
Following inventory constraints in 2017, industry demand softened. As a result, we took steps to balance production
levels with current demand. We continue to review backlog for each product line in each production facility and adjust production levels accordingly. Our backlog of $1.8 billion resulted from our ongoing efforts to deliver
dealer orders in a timely manner, combined with recent capacity additions we have made over the past several quarters and an elevated level of dealer inventory compared to prior years. We have not experienced any material
cancellations to orders placed earlier in the fiscal year by our dealers.
|
While these expansions in capacity have impacted results, we remain confident that they will provide for more
efficient and more disciplined growth in the long term. We continue to focus on our efforts to balance channel inventory levels with current demand and will remain flexible when managing production levels. In certain product
categories, we intend to take extended holiday plant shutdowns to further adjust to current demand levels.
9
|
8.
|
What was Thor's adjusted EBITDA for the first quarter?
|
|
A.
|
Although we do not disclose non-GAAP numbers, there are some items within our financial statements that might be
helpful in considering this question:
|
|
▪
|
Income before income taxes of $31.5 million from our income statement
|
|
▪
|
Net interest income of $0.3 million calculated from our income statement
|
|
▪
|
Depreciation of $10.5 million from our statement of cash flows
|
|
▪
|
Amortization of intangibles of $12.6 million from our statement of cash flows
|
|
▪
|
Increase in our LIFO reserve of $1.7 million from the Inventories footnote of our first quarter 10-Q report
|
|
▪
|
Expenses related to the acquisition of EHG of $57.1 million as shown on our income statement
|
Current Hot Topics
|
1.
|
What was your strategic rationale for acquiring the Erwin Hymer Group? Do you believe this
acquisition will be accretive to earnings?
|
|
A.
|
The EHG acquisition will provide Thor with an entry into the 6 billion-plus Euro growing European RV market with a
leadership position. Further, it enables us to go to market with a company that has a 60+ year track record of excellence within the RV industry, represented by outstanding brands that are synonymous with innovation and
quality. The Erwin Hymer Group has a complementary product lineup that spans across multiple price points and categories and is supported by a strong dealer network.
|
We believe the combined companies will be able to derive significant benefits from design,
R&D, technology, engineering and manufacturing excellence and create a global platform that will generate significant free cash flow and provide extensive synergy opportunities.
The transaction, which is expected to close near the end of calendar 2018, is expected to be accretive to
earnings in the first year, before taking into account anticipated synergies, purchase accounting adjustments and transaction-related costs.
10
|
2.
|
How does the European RV market compare to the North American RV market in terms of growth rates?
Has the European RV market fully recovered from the 2008-09 recession?
|
|
A.
|
Relative to the North American market, the European RV market has been growing at a somewhat slower rate over the past
few years and is approximately a third the size of the North American Market. The European RV market has not yet fully recovered from the recession of 2008-09, in part due to the negative effects of the European debt crisis
which slowed the economy's growth considerably in 2012-14. As a result of these conditions, we view the prospects for continued growth in the European market positively, as their recovery appears 2-3 years behind the North
American recovery, offering a compelling path to growth.
|
|
3.
|
What is Thor's strategy for EHG's involvement in the Chinese RV market?
|
|
A.
|
As the Chinese RV market is still emerging, Thor’s strategy is to maximize EHG’s entry into the Chinese RV market
through its joint venture with a Chinese manufacturer. This allows Thor and EHG to maximize its entry into the market while leveraging the knowledge and insights of their Chinese joint venture partner.
|
|
4.
|
Can you provide any more insights into the sources and amounts of synergies you are targeting with
EHG?
|
|
A.
|
As we have previously disclosed, we expect the transaction to be accretive to earnings in the first year, before taking
into account anticipated synergies, purchase accounting adjustments and transaction-related expenses.
|
Following the successful close of this transaction, we expect to review every aspect of our combined
operations with the respective teams, in an effort to refine and implement specific initiatives for the combined entity. Similar to our previous acquisitions, we expect to gain synergies from the sharing of best practices, leveraging
our common supplier base for better terms, and identifying more advanced product features from the European market that may resonate with our consumers in North America, and vice-versa. We do not anticipate any changes in production
facilities or employee levels as a direct result of this transaction.
|
5.
|
How do you expect to achieve significant synergies given how far apart the operations are
geographically?
|
|
A.
|
As has been the case in many of our past acquisitions, many of the synergies we expect to achieve rely on the sharing
of best practices which are less dependent by geography. In addition, these synergies flow in both directions, as we expect EHG will learn from our subsidiaries and our subsidiaries will learn from EHG. Importantly, we also
share a number of key suppliers, which have operations in North America and Europe, and we expect that our combined purchasing volumes will result in improved terms from those suppliers.
|
11
|
6.
|
Dealer inventories of Thor products are up 4.9% from last year’s first quarter. At the end of the
prior quarter, dealer inventories of Thor products were up 26.3% from the prior-year period. What is driving the decreased year-over-year growth rate in dealer inventories?
|
|
A.
|
Over the past few quarters, we have been extremely focused on balancing production, backlogs and channel inventory to
better reflect current levels of retail demand. As dealer inventory growth rates come down to more historically normalized levels, we are finally seeing the results of those efforts. At this point, we believe the inventory at
our independent dealers are approaching appropriate levels for seasonal consumer demand.
|
|
7.
|
Have you experienced recent increases in commodity or raw material prices as a result of steel and
aluminum tariffs, China-related tariffs or other causes?
|
|
A.
|
Due to various headwinds created by the announcement of and implementation of the steel and aluminum tariffs and other
regulatory actions, we continue to experience inflationary price increases in certain raw material and commodity-based components. Recently, we have seen some domestic suppliers raise prices in response to the announcement of
the tariffs, resulting in overall raw material pricing higher than prior-year levels. We continue to work closely with our supply partners to minimize the resulting price increases. We have also taken steps to address
incremental costs through a combination of product de-contenting, material sourcing strategies and strategic product price increases, in addition to implementing efficiency improvements throughout our production processes.
|
Historically, we have generally been able to offset net cost increases over time, but short-term input cost
volatility may impact our interim results, particularly when dealer inventory levels are adequate to meet current retail demand.
|
8.
|
Can you describe the TH2 business model for us?
|
|
A.
|
We continue to make excellent progress in ramping up TH2. Under the tradename Togo®, TH2 released a suite of consumer
apps at the Dealer Open House in September. Designed to offer transformational improvements to the RV user experience, Togo consists of products and services that inspire confidence and peace-of-mind in RV users.
|
In addition to the recent Togo app launch, the TH2 global joint venture is a comprehensive digital platform
including Roadtrippers (www.roadtrippers.com) and Roadtrippers Australasia - leaders in digital trip planning services; Cosmos, a digital
platform for RV fleet management, product pricing, and booking and rental management; Mighway (www.mighway.com) a leader in peer-to-peer RV
rentals; and Campermate, Australia and New Zealand’s top camping app.
TH2 offers a variety of products and services focused on enhancing the enjoyment, safety, connectivity and
convenience of RV ownership and use. In addition to making our products more attractive to technologically savvy consumers and attracting more consumers to the RV market, we believe that TH2's functionality will provide numerous
revenue streams, including subscriptions, advertisements and commissions.
12
|
9.
|
What impact did the joint venture have on Thor’s earnings in 1Q19? What is the anticipated earnings
impact of the joint venture in FY 2019?
|
|
A.
|
For the first quarter, Thor recorded a loss of $1.5 million which represents its 50% share of the financial results for
the quarter. The joint venture is expected to experience losses in fiscal 2019 as it continues its ramp-up phase, but such losses are not expected to have a material impact on Thor’s earnings for fiscal year 2019.
|
|
10.
|
What are TH2's competitive advantages in this space?
|
|
A.
|
TH2 has a number of competitive advantages as a pioneer in utilizing technology to enhance the RV user experience. A
key advantage to our offering surrounds the Cosmos technology that powers what we do. Cosmos offers fleet management, scheduling, dynamic pricing, telematics, customer management, and a host of other functions specific to the
apps that it supports. In addition, the solid relationships we have built with a broad, and growing base of service providers is a powerful advantage as we fully launch Togo, as well as access to 50% of new RV owners in the
US.
|
|
11.
|
What are Thor's financial commitments to TH2?
|
|
A.
|
On February 15, 2018, Thor announced the formation of a joint venture with Tourism Holdings Limited (thl) called TH2connect, LLC (TH2), with each partner owning 50% of the joint venture. At the formation of
TH2, Thor contributed $46.9 million in cash, which was followed by a subsequent cash investment by each partner of $3.5 million, bringing Thor's total cash contribution to $50.4 million. The Company's investment in TH2 is
accounted for under the equity method of accounting and Thor's share of the financial results of TH2 are included in "Other income (expense), net in the Consolidated Statements of Income and Comprehensive Income. Thor is
obligated to fund its share of the combined cash operating needs of TH2 up to $10 million, through February 14, 2020.
|
Drivers of Demand
|
1.
|
What trends are you seeing with regard to new consumers entering the RV and camping markets and do
you believe that new consumers will continue to support growth in the sector?
|
|
A.
|
There are many positive consumer trends that bode well for the long-term future of the RV industry. Some specific
findings of the 2018 North American Camping Report from Kampgrounds of America (KOA) include:
|
|
•
|
More than 6 million new households have started camping since 2014, with an increase of 2.6 million new camper
households in 2017.
|
|
•
|
As campers age, they generally begin to camp more using RVs. Approximately 7-in-10 current RVers are Millennials or
Gen Xers.
|
|
•
|
New campers are now more diverse than the overall U.S. population.
|
|
•
|
In 2017, 61% of campers stayed in a tent – marking a prime target market for Thor to convert tent campers to RVers.
|
|
•
|
The percentage of Millennial RV campers has increased from 29% in 2014 to 37% in 2017, marking a significant increase
in market penetration for this important age demographic which tends to value experiences over possessions. This preference fits well with RVs providing the ideal vehicle to enhance those experiences.
|
Looking ahead, we believe we are uniquely positioned to capitalize on these more favorable trends and we are
optimistic about our future growth in key areas with new consumers.
13
|
2.
|
What other trends are influencing growth in the RV lifestyle?
|
|
A.
|
We believe the trends mentioned above will continue to drive long-term growth in the RV marketplace. RV camping
continues to be viewed as an attractive way to spend time with family and friends. Other trends driving RV growth include:
|
|
•
|
The strong correlation with the growth in recreational sports – reflecting a trend toward becoming more active and
leading a healthy lifestyle, as well as a growing use of RVs with youth sports leagues and tournaments.
|
|
•
|
The wide variety of RV uses, including tailgating at spectator sports, from college and professional football to auto
racing and youth sports.
|
|
•
|
The ability an RV provides to escape stress and relax on short notice for long weekends or other quick getaways.
|
|
•
|
Key shifts in consumer travel preferences, including: the lower cost of RV vacations compared to other forms of travel,
the increasing inconvenience of domestic air travel and increasing interest in more experiential vacations which often include an outdoor element.
|
|
3.
|
What impact might RV sharing have on your business?
|
|
A.
|
We believe that trends in RV sharing are a positive for Thor and the industry for a variety of reasons.
|
|
▪
|
First peer-to-peer sharing allows more consumers to learn about RVs and experience how they can enhance their outdoor
experiences.
|
|
▪
|
Second, RV sharing can help overcome one of the major concerns of potential RV owners that might prevent them from
buying, which is how to maximize the use of their RV. If they can share the use and ultimately share the cost of their RV, that opens up RV ownership to a broader population.
|
|
▪
|
Finally, RV sharing has the potential to create a broader sense of community among RV owners and users which can
further enhance the ownership experience for younger consumers or consumer new to the RV lifestyle. Thor also supports RV sharing through its investment in TH2, Togo and the Mighway app.
|
14
|
4.
|
Do you have statistical data supporting the widely-stated claim that younger buyers are entering the
RV market?
|
|
A.
|
Yes – there are a number of sources that are supportive of this fact, including RVIA’s 2016 Industry Profile which
references a Nielsen research study performed for Go RVing™, which found that the typical RV owner is 45 years old compared to a similar study from 2015 that indicated the typical owner was 48 years old. This study did not
distinguish between owners of new versus used units, but is indicative of the reduction in the age of RV consumers. In addition, using data from Statistical Surveys, Inc., we have analyzed annual retail registrations of new
RV units from 2013 through 2017 and noted that the average age of the buyer has decreased from 56 years of age in 2013 to 54 years of age in 2017. Given that over 1 million new VINs were registered during this time frame, a 2
year reduction in the average age is a meaningful age reduction over a relatively short period of time.
|
|
5.
|
How do used RVs impact the demand and pricing for new products?
|
|
A.
|
In general, used RV inventory continues to be somewhat limited, and prices remain stable. Recent Black Book data from
October 2018 has indicated that auction pricing for motorized units has decreased 11.1% from a year ago, while towable auction pricing has increased 3.7% from year ago levels. Much of the change in October follows an
unusually strong performance in September, and likely represents a return to more normal seasonal patterns. However, at the same time, new products at the entry level are priced competitively and contain the features and
floorplans consumers are looking for as well as a factory warranty. This combination of price and value is leading many consumers to buy new rather than used products.
|
Robust demand for used RV inventory also enhances trade-in values. Historically, trade-in value has been one
factor that supports consumers who choose to purchase new units every 3-5 years. As a result, a healthy used RV market generally has a positive impact on the overall demand for new RVs.
Current Market Conditions
|
1.
|
How would you describe the current health of the North American retail RV market?
|
|
A.
|
Current retail data suggests that the market remains healthy, with modest levels of retail growth. Through September
2018, North American RV industry retail registrations, as reported by Statistical Surveys, Inc., increased by 4.6% versus the prior year, with towable registrations climbing 5.1% and motorized registrations also up by 1.3%.
This follows two years of strong growth, as North American retail registrations saw increases of 11.8% and 10.8% in calendar years 2017 and 2016, respectively.
|
As the current year retail registrations continue to be adjusted by more complete submissions from the
government agencies, combined with the reports of sales activity we are hearing from our dealers in October and November, we believe the calendar 2018 growth rate will be up in the low single-digits overall, with variations by product
type.
15
|
2.
|
Through September of 2018, how have industry wholesale shipments to dealers performed versus the
prior year? What is the current industry outlook by RVIA for industry wholesale shipments for calendar year 2018 and 2019?
|
|
A.
|
During the 9 months ended September 30, 2018, industry wholesale shipments to dealers, as reported by the RVIA, reflect
a 0.2% growth rate, with towable RVs up by 0.8% and motorized RVs down 3.9% compared to the prior year.
|
The November RVIA forecast estimates total industry wholesale shipments decreasing by 5.1% in 2018 and
decreasing by 5.4% in 2019, as manufacturers continue to match their shipments with units being sold by their dealers. As a reminder, industry wholesale shipments in 2017 increased by 17.2%, on top of 15.1% growth in 2016.
|
3.
|
Where do you believe dealers are in their current inventory positions? How long do you think it
will take for dealers to right size their inventory?
|
|
A.
|
We estimate that dealer inventory is approaching appropriate levels for current demand, but we anticipate some
difficult comparisons in the coming quarters due to the unusually strong results a year ago. Dealers have been disciplined in their ordering and inventory management over the past few quarters as shown by the recent growth
rates in dealer inventory levels which have stepped down from being up more than 25% year over year, to being up less than 5% as of October 31, 2018.
|
|
4.
|
Can you comment on dealer sentiment?
|
|
A.
|
Dealers continue to express strong long-term optimism and are demonstrating their optimism by investing in their
businesses, by expanding their existing facilities, adding additional service facilities and building new dealer locations or by buying other dealers to expand their market footprint.
|
|
5.
|
How are increasing interest rates affecting retail demand for RVs, and how are increasing interest
rates affecting dealer stocking patterns?
|
|
A.
|
At this point, we have not seen any significant impact of the recent increases in interest rates affecting consumer
purchasing patterns, as rates are still very low by historical standards and the rate changes to date have had a modest impact on the average monthly financed payment.
|
The impact of higher interest rates on dealer floorplan financing costs have increased over the past year. As
dealers seek to manage their interest expense, they appear more disciplined in the level of inventory they are willing to hold, particularly heading into the winter season.
16
|
6.
|
How does your variable cost structure and flexible production model help you in challenging times
like you are experiencing now?
|
|
A.
|
With our variable cost structure, we are able to review specific market segments and product categories and evaluate
immediate production needs in light of current demand, which may change seasonally. If necessary, we can reduce production on a specific line through a variety of methods, from reducing daily production rates and reducing the
number of production days per week, to taking extended holiday shutdowns and temporarily closing plants. Historically, we employed all of these tactics to remain profitable, and as we have seen demand reduced from dealers
reducing inventory levels, we have reduced daily production rates on some product lines, while on other product lines we will be taking extended holiday shutdowns near the end of the calendar year. Unlike many highly
automated, vertically integrated manufacturers, our variable cost structure enables us to idle plants without significant ongoing cost of maintenance or high levels of non-cash costs such as depreciation.
|
We have also effectively managed headcount in production and non-production staff while being mindful of our
need to maintain production capacity as seasonal demand increases. These actions allow us to better match levels of non-production workforce and overhead expenses with current production.
|
7.
|
How does your flexible production model help you as growth in the market resumes?
|
|
A.
|
When we think about our flexible production model we view it both from the perspective of maintaining profitability in
soft markets but also being able to more quickly respond to shifts in markets as they move higher, making us more responsive to market demand.
|
|
8.
|
What is the state of the labor market where you operate – in terms of the availability of employees
as well as wage inflation?
|
|
A.
|
The labor market remains tight in Northern Indiana, however, with the recent slowdown in RV production industry wide,
we have seen a stabilization in labor availability and cost. We have also implemented various initiatives to attract and retain the best workers and minimize the labor force pressures.
|
|
9.
|
Can you describe the current competitive environment?
|
|
A.
|
The RV industry remains highly competitive, as our subsidiaries and our outside competitors continue to drive the
industry forward with new and better products for dealers and consumers.
|
During the first quarter of FY 2019, some competitors were being aggressive with promotions,
and in order to protect our space on dealer lots, we experienced an increase in promotional costs and discounting compared to recent periods.
17
|
10.
|
What is the nature of the current dealer and consumer credit environment? Have there been
any negative effects from the recent decision of Ally Financial to exit the RV lending business?
|
|
A.
|
Both dealer and consumer credit environments are healthy. The wholesale lending environment remains healthy, with
normal seasonal credit line availability and utilization, as well as continued discipline among lenders concerning credit lines and curtailments.
|
Retail lending standards are also healthy, and credit is broadly available to creditworthy consumers with
reasonable down payments and normal length of term options available. The retail RV delinquency rate remains low and is significantly below the average delinquency rate of closed-end consumer loans.
To date, we have not seen, and do not anticipate any disruption of wholesale financing to any of our dealers
as a result of Ally's decision. Ally Financial was one of many RV wholesale lenders, some of which are much larger players within the RV wholesale space. Since Ally's exit, other lenders in the space are eager and able to take on
former Ally dealers.
|
11.
|
How is Thor affected by rising interest rates?
|
|
A.
|
Once the EHG acquisition is completed, we will be impacted by rising interest rates based on the effective rates for
our term loan and ABL line. These rates are variable and we would expect them to rise or fall with the overall level of rates in the market.
|
Traditionally, we have experienced little adverse effect on retail demand from gradual, modest increases in
interest rates. We remain in a historically lower interest rate environment, with adequate credit availability for qualified consumers, and we expect these conditions will continue to be the case for the foreseeable future.
|
12.
|
How does consolidation within the dealer base impact demand for Thor products? Do you
anticipate increased pressure on margins as a result of dealer consolidation?
|
|
A.
|
Competition for dealers is inherent in our industry. Recent dealer consolidation has not impacted this reality, nor do
we expect this to significantly change in the foreseeable future. Thor’s ability to develop long-standing relationships with the most productive dealers in the market has been, and will always be, crucial to our success, with
or without further consolidation.
|
To date, our margins have not been considerably impacted by dealer consolidation. We do not anticipate
significant pressure from further consolidation because our dealers appreciate the value that Thor offers, with our breadth of products and brands, people and day-to-day support. Larger dealers, in particular, value partnering with a
company that has the ability to provide a large volume of units within a reasonable time period throughout the year.
18
Balance Sheet and Cash Flow
|
1.
|
What was working capital at October 31, 2018 and October 31, 2017? What drove the change in working
capital year over year?
|
|
A.
|
Working capital at October 31, 2018, was $525.2 million compared to $440.2 million at October 31, 2017. The increase
of $85.0 million is primarily a result of an increase in inventory of $48.0 million, primarily due to additional production facilities and production lines added over the past year, an increase of $73.5 million in cash and
cash equivalents, reductions in accounts payable of $104.4 million and decreases in compensation payable related to lower incentive compensation. These items were partially offset by decreases in accounts receivable of $134.6
million, increases in warranty liability and the $42.6 million liability relating to the foreign currency forward contract.
|
|
2.
|
What is Thor’s current capital expenditure estimate for fiscal 2019, and what were capital
expenditures in the first quarter of fiscal 2019?
|
|
A.
|
In fiscal 2019, we expect to complete the previously announced expansion projects, including:
|
|
•
|
Jayco's
expansion in Twin Falls, ID, to improve service to dealers in the Western US and Canada. This facility is expected to be completed in the fall of 2019.
|
|
•
|
Airstream's
700,000 square foot facility, in Jackson Center, OH, that will include new production space for its iconic travel trailers as well as a state of the art training center and visitor center. The new facility is expected to be
completed in the fall of 2019.
|
As a result of these and other capital projects, we anticipate capital expenditures to total approximately
$135 million in fiscal 2019. During the first quarter of fiscal 2019, capital expenditures totaled $34.5 million.
As we look ahead, we see continued long-term demand in both our industry and for Thor’s products specifically.
Our recent capital investments in additional capacity provide us the ability to respond timely to dealer orders and will benefit us for the long-term as the industry continues to grow.
Management remains committed to balancing financial prudence with the goals of our strategic plan, as we
endeavor to best position Thor to seize the opportunities presented by the demand for our products and our growing market.
19
|
3.
|
As a result of your recent current capacity additions, do you expect the startup of production to
have an adverse impact on margins?
|
|
A.
|
Generally, the startup of new or expanded towable facilities happens more quickly than the startup of motorized
facilities, with lower initial costs. The startup of new facilities can temporarily pressure margins due to the increase various costs, including warranty costs, as a result of training and assimilating in an expanded
workforce. Over the past year, we have expanded a number of plants, started up a number of new plants and introduced a number of new products, and the start-up impact has resulted in some increases in warranty expense as we
ramped up production. We will take the lessons learned from these recent expansion experiences and apply them to future expansions to help alleviate such pressures.
|
|
4.
|
Will Thor utilize its share buyback program in light of its commitment to paying down the
acquisition debt?
|
|
A.
|
We will continue to evaluate repurchases strategically and opportunistically, but our first priority will be to pay
down debt. Over time, we plan to repurchase stock to offset the issuance of 2.3 million shares to the Hymer family for the purchase of EHG.
|
20
Key Economic Indicators

Sources: (1) Statistical Surveys, Inc.; (2) The Conference Board, Consumer Confidence Survey®; (3) Recreation Vehicle Industry Association;
(4) U.S. Bureau of Economic Analysis
21
Outlook
|
1.
|
What are the key factors that have been supporting the growth in the North American RV industry
and do you anticipate this growth to continue?
|
|
A.
|
Several factors have been supporting long-term growth in the RV industry, including (1) the health of the U.S. and
Canadian economies, (2) demographic trends and lifestyle changes that are favorably contributing to RV usage and ownership and (3) the continued focus on product innovation and affordability – providing the benefits of the
RV experience to a growing base of potential consumers.
|
The health of the overall North American economy is evidenced by certain key indicators
that our management team closely monitors, including:
|
•
|
A growing economy (GDP), healthy consumer confidence levels and increased discretionary consumer spending, which
should continue to benefit from lower tax rates stemming from the recent enactment of the Tax Act as well as increases in wages.
|
|
•
|
Strong job growth and low unemployment which forms a foundation for consumer spending. A healthy job market and
improving wages provide consumers with the confidence they need to make large discretionary purchases like RVs.
|
|
•
|
Historically lower interest rates with adequate credit availability, relatively stable fuel prices and a healthy
housing market.
|
|
•
|
See prior page for historical correlation between RV growth and certain key economic metrics.
|
Favorable demographic trends and lifestyle changes are influencing a greater level of
RV participation and continue to drive retail sales, including:
|
•
|
Increasing North American camping trends, as described earlier in this document, and further described in KOA’s
2018 annual survey report. Findings in this report reflect the growth in the number of overall campers and the frequency in which they camp, as well as a younger and more diverse group of new participants.
|
|
•
|
Specifically, Millennials comprised 31% of the total population in the most recent census, yet accounted for 40% of
the total campers in 2017, which increased from 38% of the total campers in 2016, and 34% in 2015. Of note, the percentage of Millennials camping in RVs has increased from 29% of total RV campers in 2014 to 37% of total RV
campers in 2017, indicating that this important demographic group is increasingly embracing RVs for their outdoor experiences.
|
|
•
|
New consumers continue to adopt the RV lifestyle. Per the Recreational Vehicle Industry Association: 34% of RVs
sold in 2016 were to first-time buyers, with 80% of those new buyers under age 65.
|
|
•
|
An expanding array of uses for RVs are driving incremental demand – such as outdoor recreation (an increasing
contributor to overall U.S. GDP), tailgating at spectator sports and other lifestyle events.
|
22
Finally, the continued focus on innovation and affordability is providing compelling
products, as well as enhancing the overall RV experiences by offering:
|
•
|
Award-winning products across the entire price spectrum, reflecting innovative and contemporary floor plans and
designs, as well as improved control systems and technologies. We also anticipate that the pending acquisition of EHG will provide even more opportunities to commercialize technology innovations that will resonate with
our evolving consumer base.
|
We anticipate the factors mentioned above will continue to support industry growth for the foreseeable
future, specifically solid macroeconomic fundamentals and the strong secular trends influencing new consumer growth and market expansion. Unlike many of the expansions we have experienced over the past two decades, the current
expansion has been driven largely by new consumers adopting the RV lifestyle. We view such an expansion to be more sustainable over the long term.
|
2.
|
What is your outlook for Thor for fiscal year 2019?
|
|
A.
|
We anticipate a stable retail market to provide the foundation for dealers to maintain appropriate inventory levels
in the near term. Our dealers remain optimistic about current and near-term economic conditions and new consumers entering the RV market, prompting many to expand their dealership and invest in long-term growth. We are
encouraged by recent order trends related to our higher-end products, including larger diesel Class A motorhomes, fifth wheels and Airstream products. Demand for Airstream products in particular remains very robust and
supports our plans to expand this facility.
|
We will likely continue to face near-term challenges for both top line and gross margin as we have
difficult comparisons to the unusually strong results posted in the first half of fiscal 2018. It is important to note how unusual the strength in our results was during the prior year, as historically our first and second quarters
are the seasonally weakest during the year, but in fiscal 2018 they were among the strongest. As our dealers balance their inventory levels, we expect to see a return to more normal seasonal patterns in our business.
As dealer orders and our resulting production schedules return to a more normalized pattern beginning in
the second half of fiscal 2019, we will continue to match production to our dealer needs, and protect and seek to grow our space on dealer lots. We will ensure we provide high-quality, innovative products in all key price points
with the features consumers are seeking. We will also work to reduce costs and increase operating efficiency where we have opportunities and act aggressively to offset items pressuring our margins, whether from tariffs, commodity
increases or other sources.
23
|
3.
|
What are your strategic plans for fiscal 2019 and beyond?
|
|
A.
|
We will remain focused on driving organic growth in our current businesses through prudent investments in capital
projects, technology and product innovation. In addition, we will be focused on completing the previously announced acquisition of the Erwin Hymer Group, which marks our first acquisition outside of North America. As we
apply the lessons of EHG we expect to continue evaluating strategic options in Europe and other global markets to enhance our business. Through all of these strategic plans, we remain focused on quickly paying down
debt, increasing returns to shareholders through dividends and share repurchases. We believe these combined actions will enhance shareholder value.
|
24