Attached files
| file | filename |
|---|---|
| EX-99.3 - EXHIBIT 99.3 - THOR INDUSTRIES INC | a51910007ex99_3.htm |
| EX-99.1 - EXHIBIT 99.1 - THOR INDUSTRIES INC | a51910007ex99_1.htm |
| 8-K - THOR INDUSTRIES, INC. 8-K - THOR INDUSTRIES INC | a51910007.htm |
Exhibit 99.2

INVESTOR PRESENTATIONDECEMBER 6, 2018
Forward Looking Statements This presentation includes certain statements that are “forward looking”
statements within the meaning of the U.S. Private Securities Litigation Reform Act of 1995, Section 27A of the Securities Act of 1933, as amended, and Section 21E of the Securities Exchange Act of 1934, as amended. These forward looking
statements are made based on management’s current expectations and beliefs regarding future and anticipated developments and their effects upon Thor, and inherently involve uncertainties and risks. These forward looking statements are not a
guarantee of future performance. We cannot assure you that actual results will not differ materially from our expectations. Factors which could cause materially different results include, among others, raw material and commodity price
fluctuations; raw material, commodity or chassis supply restrictions; the impact of tariffs on material or other input costs; the level and magnitude of warranty claims incurred; legislative, regulatory and tax law and/or policy developments
including their potential impact on our dealers and their retail customers or on our suppliers; the costs of compliance with governmental regulation; legal and compliance issues including those that may arise in conjunction with recently
completed or announced transactions; lower consumer confidence and the level of discretionary consumer spending; interest rate fluctuations; the potential impact of interest rate fluctuations on the general economy and specifically on our
dealers and consumers; restrictive lending practices; management changes; the success of new and existing products and services; consumer preferences; the ability to efficiently utilize production facilities; the pace of acquisitions and the
successful closing, integration and financial impact thereof; the potential loss of existing customers of acquisitions; our ability to retain key management personnel of acquired companies; a shortage of necessary personnel for production; the
loss or reduction of sales to key dealers; disruption of the delivery of units to dealers; increasing costs for freight and transportation; asset impairment charges; cost structure changes; competition; the impact of potential losses under
repurchase agreements; the potential impact of the strength of the U.S. dollar on international demand; general economic, market and political conditions; and changes to investment and capital allocation strategies or other facets of our
strategic plan. Additional risks and uncertainties surrounding the acquisition of Erwin Hymer Group SE (the "Erwin Hymer Group") include risks regarding the anticipated timing of the closing of the acquisition, the potential benefits of the
proposed acquisition and the anticipated operating synergies, the satisfaction of the conditions to closing the acquisition in the anticipated timeframe or at all, the integration of the business, changes in Euro-U.S. dollar exchange rates that
could impact the mark-to-market value of outstanding derivative instruments, the impact of exchange rate fluctuations and unknown or understated liabilities related to the acquisition and Erwin Hymer Group's business. These and other risks and
uncertainties are discussed more fully in Item 1A of our Annual Report on Form 10-K for the year ended July 31, 2018 and Part II, Item 1A of our quarterly report on Form 10-Q for the period ended October 31, 2018. We disclaim any obligation or
undertaking to disseminate any updates or revisions to any forward looking statements contained in this presentation or to reflect any change in our expectations after the date hereof or any change in events, conditions or circumstances on
which any statement is based, except as required by law.

Overview & Current Industry Conditions 4First Quarter 2019 Update 11Appendix: Financial & Market
Data 17 Table of Contents

Overview & Current Industry Conditions

Driving Operational Excellence 38-year record of profitability – 23.3% compounded annual five-year EPS
growth (1) Balance of organic growth and accretive acquisitions Global leader in a growing industry – Recreational Vehicle (RV) shipments grew 17.2% in calendar 2017 to 504,599 units, representing a five-year CAGR of 12.0% (2) Experienced
leadership – Current Thor management team has an average of almost 20 years in the RV industry, leading through various market conditionsDemonstrated commitment to returning cash to shareholders via dividends and stock buybacks while paying
down debt – more than $1 billion returned to shareholders over Thor’s historyCurrent authorization for $250 million share repurchase 5-year CAGR: +11.1% Based on Diluted EPS from continuing operations Source: RVIA, RV Shipments, YTD
December 2017 The declaration of future dividends and the establishment of the per share amounts, record dates and payment dates for any such future dividends are subject to compliance with the credit facility and determination of the Board,
and are dependent upon future earnings, cash flows and other factors. 5-year CAGR: +23.3% 5-year CAGR: +20.8% (21.3)% (89.3)%
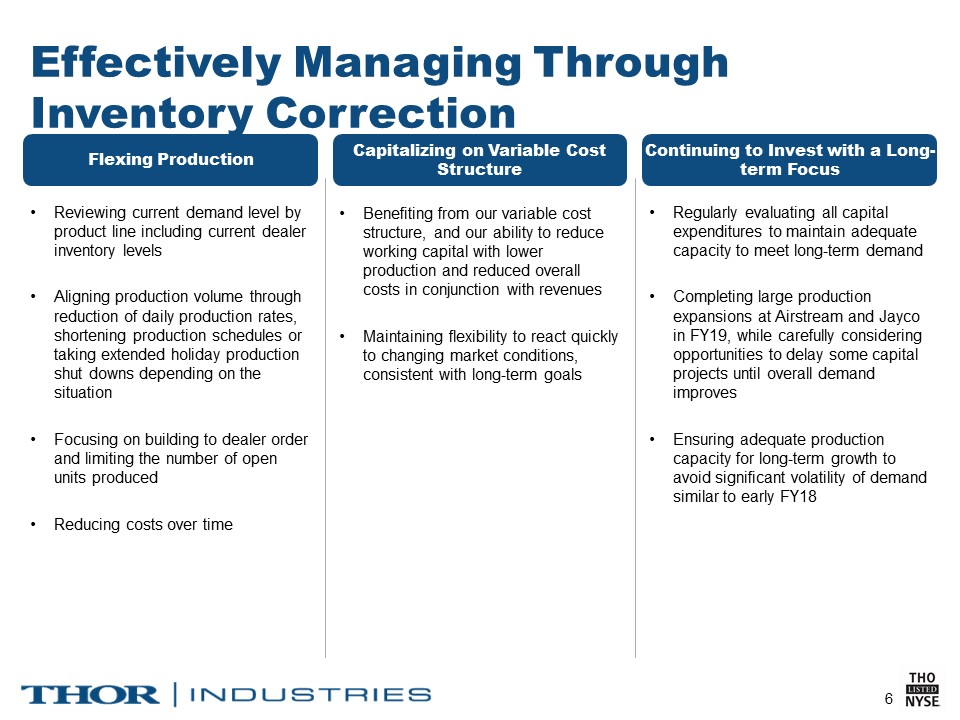
Effectively Managing Through Inventory Correction Flexing Production Capitalizing on Variable Cost
Structure Continuing to Invest with a Long-term Focus Benefiting from our variable cost structure, and our ability to reduce working capital with lower production and reduced overall costs in conjunction with revenuesMaintaining flexibility
to react quickly to changing market conditions, consistent with long-term goals Regularly evaluating all capital expenditures to maintain adequate capacity to meet long-term demandCompleting large production expansions at Airstream and Jayco
in FY19, while carefully considering opportunities to delay some capital projects until overall demand improves Ensuring adequate production capacity for long-term growth to avoid significant volatility of demand similar to early FY18
Reviewing current demand level by product line including current dealer inventory levelsAligning production volume through reduction of daily production rates, shortening production schedules or taking extended holiday production shut
downs depending on the situation Focusing on building to dealer order and limiting the number of open units producedReducing costs over time

Healthy RV Channel Dealer Inventory Approaching Normalized Levels:Following inventory shortages in FY17,
dealers ordered aggressively in early FY18 Although retail demand grew modestly, that growth was not sufficient to bring dealer inventory levels down Thor responded by reducing production levels to meet current demandAverage age of RV inventory
on dealer lots remains healthyUsed inventory levels remain low, supporting trade-in values and demand for new RVs Wholesale Financing Impacting Sales:Credit broadly availableNormal seasonal credit line utilizationLenders remain disciplined
with curtailments, motivating dealers to focus on turning inventoryRetail Financing Provides Positive Catalyst:Credit broadly availableLenders remain disciplined on down payments and termsMinimal sub-prime exposure; loan delinquency rates among
the lowest of consumer loans tracked by the American Bankers Association

Driving Global GrowthErwin Hymer Acquisition Creates the #1 global RV manufacturer with a leading
portfolio of brands, dealer network and global reachEstablishes a leading position in growing European RV market with a complementary and geographically diverse product portfolioSignificant mutual benefits derived from sharing design, R&D,
technology, engineering and manufacturing excellence Aligned with Thor’s strategic plan to enhance shareholder value – transaction to be accretive to earnings in first year (1) Before anticipated synergies, purchase accounting adjustments and
transaction related expenses

Snapshot of Combined CompanyBased on 2018 Actual Results Adds Scale Balances Product Mix Broadens
Global Footprint + + + = = = Revenue ($mm) Revenue % Revenue % / / / Note: Converted at USD/EUR FX rate of 1.16; Thor financials as of 7/31/18; EHG financials as of 8/31/18

Formed TH2 joint venture in 3Q18, with Thor investment to date of $50.4 million, to introduce new
products and services focused on enhancing the enjoyment, safety, connectivity and convenience of RV ownership, while reinforcing loyalty to Thor brandsProviding innovation solutions to an ever-widening consumer base to capture interest and
retain life-long customers Launched Togo app, including functions such as:RV service and maintenance records, checklists, registration data and remindersRoadtrippers (www.roadtrippers.com) — trip planning app to help RV owners see the
worldMighway (www.mighway.com) — connects RV owners and renters in the U.S. and New ZealandTH2's platform targets numerous additional revenue streams, including subscriptions, advertisements and commissions through partnerships with trusted
third-party service providers Capitalizing on Opportunities to Drive Continued GrowthTH2: Enhancing the RV Experience

First Quarter 2019 Update

First Quarter Overview Making Progress on Strategic Execution Maintaining Optimistic Outlook Helping
dealers right size their inventory through increased promotional efforts to support dealersExecuting on our strategic planAcquisition of Erwin Hymer Group (EHG) to provide platform for long-term growth in EuropeAcquisition-related costs in the
quarter total $57.1 million, or $1.02 per shareOn track to close near the end of the calendar year Stable retail market is anticipated in fiscal 2019, setting a foundation for future wholesale demand. Consumer sentiment and spending remain
strong Ongoing work to balance retail channel inventory during challenging wholesale conditions in the North American market for first half of calendar 2019 EHG transaction costs will impact diluted EPS in FY 2019 Acquisition of EHG and
continuing to execute on Thor's strategic plan to align business model with long-term positive consumer and economic trends supportive of long-term global growth
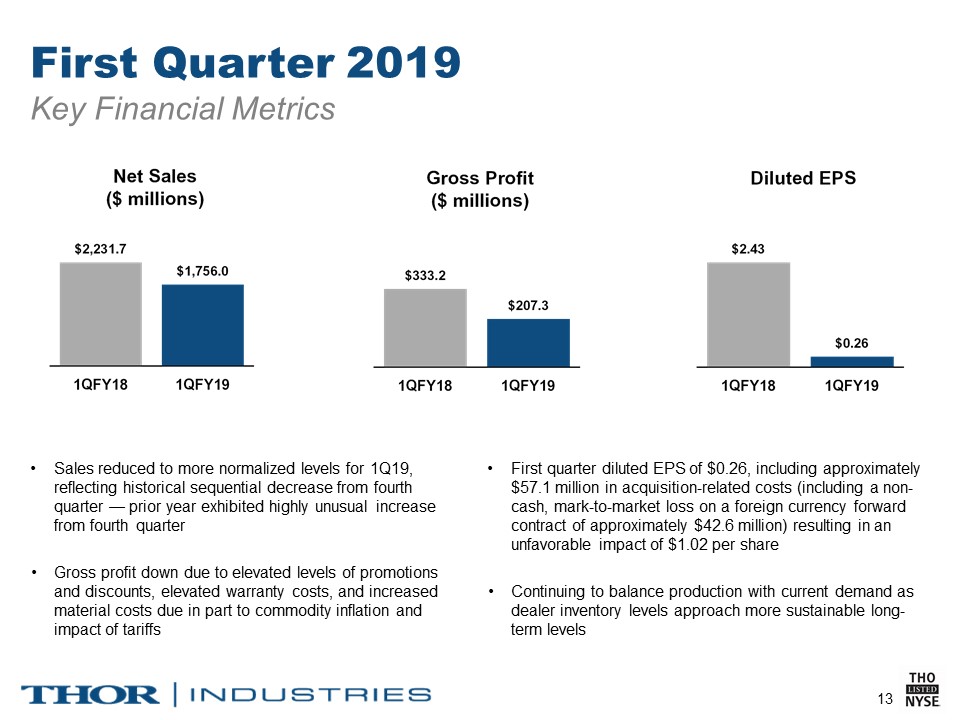
First Quarter 2019 Key Financial Metrics Sales reduced to more normalized levels for 1Q19, reflecting
historical sequential decrease from fourth quarter — prior year exhibited highly unusual increase from fourth quarter Gross profit down due to elevated levels of promotions and discounts, elevated warranty costs, and increased material costs
due in part to commodity inflation and impact of tariffs First quarter diluted EPS of $0.26, including approximately $57.1 million in acquisition-related costs (including a non-cash, mark-to-market loss on a foreign currency forward contract
of approximately $42.6 million) resulting in an unfavorable impact of $1.02 per share Continuing to balance production with current demand as dealer inventory levels approach more sustainable long-term levels

First Quarter 2019Towable Segment Sales of travel trailers and fifth wheels decreased by 23.4% and
17.2%, respectively Market share down slightly through September 2018, with U.S. Towable share decreasing from 48.7% to 48.5%, and Canadian Towable share down from 55.4% to 53.2%*Backlog decrease due in part to continuing dealer inventory
correction as well as increased capacity reducing lead times * Source: Statistical Surveys, Inc. YTD September 30, 2018 vs. YTD September 30, 2017 Note: Data reported by Stat Surveys is based on official state and provincial records. This
information is subject to adjustment and is continuously updated, and is often impacted by delays in reporting by various states or provinces.

Sales of Class A and Class C decreased by 10.0% and 35.7%, respectively U.S. Class A and C market share
through September 2018 increased from 41.7% to 43.2%*Canadian Class A and C market share increased from 41.3% to 44.8% through September 2018*Backlog decreased in part due to ongoing dealer inventory correction as well as shorter lead times *
Source: Statistical Surveys, Inc. YTD September 30, 2018 vs. YTD September 30, 2017 Note: Data reported by Stat Surveys is based on official state and provincial records. This information is subject to adjustment and is continuously updated,
and is often impacted by delays in reporting by various states or provinces. First Quarter 2019 Motorized Segment

First Quarter Key StatsAs of or for the Fiscal Quarters Ended October 31 Income Statement Balance Sheet
& Cash Flow * Includes $57.1M in acquisition-related costs. ** Includes $1.02 in unfavorable EPS impact from acquisition-related costs.

Appendix: Financial & Market Data

Thor Operating Entities Joint Venture Pending Acquisition* *
Acquisition of EHG expected to close near the end of the calendar year.

Thor's RV Product Range Towable Segment Motorized Segment Note: Retail prices noted
above are general ranges. Class Afully enclosed, bus-style motorhome; retail price $80,000 - $700,000 Class Cliving area built on van or pickup chassis;retail price $80,000 - $250,000 Class Bvan motorhomes;retail price $150,000 -
$250,000 Specialty Trailersincludes camping trailers, truck campers and horse trailers with living quarters;retail price $12,000 - $110,000 Travel Trailershitch to the bumper of the tow vehicle;retail price $12,000 - $150,000 Fifth
Wheelshitch to a specially mounted hitch in the bed of a pickup truck;retail price $20,000 - $185,000

Consumer TrendsPotential RV Buyers 77 Million Households Camping Each Year Consumers Interested in
RVs Target KOA study shows that 77 million households are camping in 2017, an increase of 6 million from 2014 and they are camping more often.(1)One fourth of campers use an RV, but 44% of those camping in an RV do not own the RV they are
using.(1) Campers who borrow or rent an RV are the next logical target for the industry. Refining those interested in experiencing the outdoors in an RV are the core target audience for Thor. Source: KOA 2018 North American Camping
ReportSource: RVIA, Winter RV Roadsigns, November 2018 THE OPPORTUNITY: With the RV market totaling approximately 500,000 units annually, even a small number of the millions of outdoor enthusiasts deciding to purchase an RV could have a
significant impact on the total market.(2)

Industry retail demand has seen a resurgence in some higher-end Class A motorhomes and fifth wheels while
entry level consumers continue to seek lighter-weight, more affordably-priced towables and gas Class A and Class C motorhomes Wholesale units typically outpace retail in the early part of the calendar year; historically, sales become more
balanced as we reach the peak retail selling season. These trends were reversed in 2018, as dealers responded to inventory shortages the prior year with aggressive ordering and resulting inventory build. Now dealers are working to reduce
overall inventory levels to return to more normal seasonal patterns RV Industry Overview Seasonal Shipment Patterns RV Industry Demand Calendar Year YTD September 2016 2017 2017 2018 Industry Retail Registrations (1) 416,054
units 465,272 units 390,070 units 408,143 units +10.8% +11.8% +12.8% +4.6% Industry Wholesale Shipments (2) 430,691 units 504,599 units 377,995 units 378,718 units +15.1% +17.2% +16.6% +0.2% Consumer Confidence vs. RV
Retail Registrations Source: Statistical Surveys, Inc., U.S. and CanadaSource: Recreation Vehicle Industry AssociationSource: The Conference Board, Consumer Confidence Survey ®

RV Industry Overview RV Wholesale Market Trends (Units 000's) Towable RV Wholesale Market Trends (Units
000's) YTD Shipments (Units) Sept 2018 Sept 2017 Unit Change % Change 378,718 377,995 723 +0.2% 5-year CAGR: 12.0% YTD Shipments (Units) Sept 2018 Sept 2017 Unit Change %
Change 333,253 330,662 2,591 +0.8% 5-year CAGR: 11.4% Motorized RV Wholesale Market Trends (Units 000's) YTD Shipments (Units) Sept 2018 Sept 2017 Unit Change % Change 45,465 47,333 (1,868) (3.9)% 5-year CAGR: 17.3%
Historical Data: Recreation Vehicle Industry Association (RVIA) (e) Calendar years 2018 & 2019 represents most recent RVIA estimate as of Winter RV Roadsigns, published in November 2018

RV Industry Overview Thor RV Retail Market Share Trend (1) Dealer Inventory of Thor Products RV
Industry Retail Market Share (1) Source: Statistical Surveys Inc., U.S. and Canada, calendar years 2014-17, 2018 YTD through September; Thor historical results adjusted to include results of Jayco, Livin' Lite, Bison Coach, K-Z Inc., Cruiser
RV and DRV Luxury Suites for all periods presented. Note: Towable market share includes Travel Trailers, Fifth Wheels, Camping Trailers and Park Models.Forest River includes Palomino, Coachmen, Prime Time, Shasta and Dynamax Inventory is
approaching more appropriate levels given current retail demand trends, but will likely take a few more quarters to adjust At the end of 1Q FY19, levels were elevated compared to the prior year, however the year-over-year increases in dealer
inventory levels have come down considerably from the prior quarter, from 26.3% at July 31, 2018, to 4.9% at October 31, 2018Dealers remain disciplined in ordering to ensure they have adequate supply for the spring show season and summer
selling seasonCurrent age of dealer inventories of Thor products on dealers' lots remains low on a historical standard. Wholesale floorplan lenders remain comfortable with current inventory aging and turns Dealer Inventory (Units) Oct
31, 2018 Oct 31, 2017 Unit Change % Change 131,500 125,400 6,100 4.9% YTD 9/30/18 YTD 9/30/17 Y/E 12/31/17 Y/E 12/31/16 Total Share % Total Share % Total Share % Total Share
% THOR 195,959 48.0 % 188,454 48.3 % 223,214 48.0 % 196,947 47.3 % Forest River (2) 136,703 33.5 % 134,688 34.5 % 158,626 34.1 % 145,482 35.0 % Grand
Design 20,671 5.1 % 14,531 3.7 % 18,280 3.9 % 11,818 2.8 % Winnebago 12,842 3.1 % 12,264 3.1 % 14,907 3.2 % 13,127 3.2 % Gulfstream 4,735 1.2 % 4,678 1.2 % 5,585 1.2 % 5,148 1.2 % REV
Group 2,991 0.7 % 3,139 0.8 % 3,998 0.9 % 3,540 0.9 % Subtotal 373,901 91.6 % 357,754 91.7 % 424,610 91.3 % 376,062 90.4 % All
Others 34,242 8.4 % 32,316 8.3 % 40,662 8.7 % 39,992 9.6 % Grand Total 408,143 100.0 % 390,070 100.0 % 465,272 100.0 % 416,054 100.0 %
