Attached files
| file | filename |
|---|---|
| EX-32.2 - EXHIBIT 32.2 - Sonos Inc | a10-kfy18322cfo906.htm |
| EX-32.1 - EXHIBIT 32.1 - Sonos Inc | a10kfy18321ceo906.htm |
| EX-31.2 - EXHIBIT 31.2 - Sonos Inc | a10-kfy18312cfo302.htm |
| EX-31.1 - EXHIBIT 31.1 - Sonos Inc | a10-kfy18311ceo302.htm |
| EX-24.1 - EXHIBIT 24.1 - Sonos Inc | sonos-10xkxsignaturepagesx.htm |
| EX-23.1 - EXHIBIT 23.1 - Sonos Inc | sonosconsentfy2018_secserv.htm |
| EX-10.10 - EXHIBIT 10.10 - Sonos Inc | offerletter-matthewsiegel.htm |
| EX-10.9 - EXHIBIT 10.9 - Sonos Inc | offerletternickmillington.htm |
UNITED STATES
SECURITIES AND EXCHANGE COMMISSION
Washington, D.C. 20549
_________________________________________________________________
Form 10-K
_________________________________________________________________
x | ANNUAL REPORT PURSUANT TO SECTION 13 OR 15(d) OF THE SECURITIES EXCHANGE ACT OF 1934 |
For the fiscal year ended September 29, 2018
or
☐ | TRANSITION REPORT PURSUANT TO SECTION 13 OR 15(d) OF THE SECURITIES EXCHANGE ACT OF 1934 |
Commission File Number: 001-38603
_________________________________________________________________
SONOS, INC.
(Exact name of Registrant as specified in its charter)
_________________________________________________________________
Delaware | 03-0479476 | |
(State or other jurisdiction of incorporation or organization) | (I.R.S. Employer Identification No.) | |
614 Chapala Street Santa Barbara, CA | 93101 | |
(Address of principal executive offices) | (Zip code) | |
Registrant’s telephone number, including area code: (805) 965-3001 | ||
Securities registered pursuant to Section 12(b) of the Act:
Title of each class | Name of each exchange on which registered |
Common Stock, $0.0001 par value | The Nasdaq Global Select Market |
Securities registered pursuant to Section 12(g) of the Act: None
_________________________________________________________________
Indicate by check mark if the registrant is a well-known seasoned issuer, as defined in Rule 405 of the Securities Act. Yes ☐ No x
Indicate by check mark if the registrant is not required to file reports pursuant to Section 13 or Section 15(d) of the Act. Yes ☐ No x
Indicate by check mark whether the registrant: (1) has filed all reports required to be filed by Section 13 or 15(d) of the Securities Exchange Act of 1934 during the preceding 12 months (or for such shorter period that the registrant was required to file such reports), and (2) has been subject to such filing requirements for the past 90 days. Yes x No ☐
Indicate by check mark whether the registrant has submitted electronically every Interactive Data File required to be submitted pursuant to Rule 405 of Regulation S-T (§ 232.405 of this chapter) during the preceding 12 months (or for such shorter period that the registrant was required to submit such files).
Yes x No ☐
Indicate by check mark if disclosure of delinquent filers pursuant to Item 405 of Regulation S-K (§ 229.405 of this chapter) is not contained herein, and will not be contained, to the best of registrant’s knowledge, in definitive proxy or information statements incorporated by reference in Part III of this Form 10-K or any amendment to this Form 10-K. ☐
Indicate by check mark whether the registrant is a large accelerated filer, an accelerated filer, a non-accelerated filer, a smaller reporting company or an emerging growth company. See the definitions of "large accelerated filer," "accelerated filer," "smaller reporting company" and "emerging growth company" in Rule 12b-2 of the Exchange Act (Check one):
Large accelerated filer | ☐ | Accelerated Filer | ☐ |
Non-accelerated filer | x | Smaller reporting company | ☐ |
Emerging Growth Company | ☐ | ||
If an emerging growth company, indicate by check mark if the registrant has elected not to use the extended transition period for complying with any new or revised financial accounting standards provided pursuant to Section 13(a) of the Exchange Act. ☐
Indicate by check mark whether the registrant is a shell company (as defined in Rule 12b-2 of the Act). Yes ☐ No x
The registrant was not a public company as of the last business day of its most recently completed second fiscal quarter and therefore, cannot calculate the aggregate market value of its voting and non-voting common equity held by non-affiliates as of such date.
As of November 16, 2018, the registrant had 100,947,974 shares of common stock outstanding, $0.0001 par value per share.
DOCUMENTS INCORPORATED BY REFERENCE
Part III incorporates by reference certain information from the registrant’s definitive proxy statement (the "2018 Proxy Statement") relating to its 2018 Annual Meeting of Stockholders. The 2018 Proxy Statement will be filed with the United States Securities and Exchange Commission within 120 days after the end of the fiscal year to which this report relates.
TABLE OF CONTENTS
Page | ||
2
Forward-Looking Statements
This Annual Report on Form 10-K contains forward-looking statements. All statements other than statements of historical facts contained in this Annual Report on Form 10-K, including statements regarding future operations, are forward-looking statements. In some cases, forward-looking statements may be identified by words such as "believe," "may," "will," "estimate," "continue," "anticipate," "intend," "could," "would," "expect," "objective," "plan," "potential," "seek," "grow," "target," "if," and similar expressions intended to identify forward-looking statements. We have based these forward-looking statements largely on our current expectations and projections about future events and trends that we believe may affect our financial condition, results of operations, business strategy, short-term and long-term business operations and objectives and financial needs. These forward-looking statements are subject to a number of risks, uncertainties and assumptions, including those described in the section titled "Risk Factors" set forth in Part I, Item 1A of this Annual Report on Form 10-K and in our other filings with the Securities and Exchange Commission (the "SEC"). Moreover, we operate in a very competitive and rapidly changing environment. New risks emerge from time to time. It is not possible for our management to predict all risks, nor can we assess the impact of all factors on our business or the extent to which any factor, or combination of factors, may cause actual results to differ materially from those contained in any forward-looking statements we may make. In light of these risks, uncertainties and assumptions, the future events and trends discussed in this Annual Report on Form 10-K may not occur and actual results may differ materially and adversely from those anticipated or implied in the forward-looking statements. Forward-looking statements contained in this Annual Report on Form 10-K include, but are not limited to, statements about:
• | our expectations regarding our results of operations, including gross margin, financial condition and cash flows; |
• | our expectations regarding the development and expansion of our business; |
• | anticipated trends, challenges and opportunities in our business and in the markets in which we operate; |
• | our ability to successfully develop and introduce new products at an increased pace; |
• | our ability to manage our international expansion; |
• | the effects of tariffs, trade barriers and retaliatory trade measures; |
• | our ability to expand our customer base and expand sales to existing customers; |
• | our expectations regarding development of our direct-to-consumer sales channels; |
• | expansion of our partner network; |
• | our ability to retain and hire necessary employees and staff our operations appropriately; |
• | the timing and amount of certain expenses and our ability to achieve operating leverage over time; and |
• | our ability to maintain, protect and enhance our intellectual property. |
We caution you that the foregoing list may not contain all of the forward-looking statements made in this Annual Report on Form 10-K.
You should not rely upon forward-looking statements as predictions of future events. The events and circumstances reflected in the forward-looking statements may not be achieved or occur. Although we believe that the expectations reflected in the forward-looking statements are reasonable, we cannot guarantee future results, levels of activity, performance or achievements. Except as required by law, we do not intend to update any of these forward-looking statements after the date of this Annual Report on Form 10-K or to conform these statements to actual results or revised expectations.
You should read this Annual Report on Form 10-K with the understanding that our actual future results, levels of activity, performance and events and circumstances may be materially different from what we expect.
3
PART I
Item 1: Business
Overview
Sonos was founded with a clear mission—to fill every home with music. This mission led us to invent wireless multi-room home audio. Sonos transforms the way people live and interact by restoring the shared experience of music throughout the home. Our sound system provides an immersive listening experience created by our thoughtfully designed speakers and components, our proprietary software platform and the ability to wirelessly stream the content our customers love from the services they prefer.
Sonos sits at the intersection of emerging trends driving the future of home entertainment. The proliferation of streaming services and the rapid adoption of voice assistants are significantly changing audio consumption habits and how consumers interact with the internet. As the leading sound system for consumers, content partners and developers, Sonos is poised to capitalize on the large market opportunity created by these dynamics.
We debuted the world’s first wireless multi-room sound system in 2005, and have since been a leading innovator in wireless home audio. Today, our products include wireless speakers, home theater speakers and components to address consumers’ evolving home audio needs. We launched our first voice-enabled wireless speaker, Sonos One, in October 2017, and our first voice-enabled home theater speaker, Sonos Beam, in July 2018. In addition to new product launches, we frequently introduce new features through software upgrades, providing our customers with enhanced functionality and improved sound in the home. We are committed to continuous technological innovation, as evidenced by our growing global patent portfolio of over 775 issued patents and 595 applications. We believe our patents comprise the foundational intellectual property for wireless multi-room audio technology.
Our network of partners provides our customers with access to voice control, streaming music, internet radio, podcasts and audiobook content, enabling them to control and listen to an expansive range of home entertainment. Our platform has attracted a broad range of approximately 100 streaming content providers, such as Apple Music, Pandora, Spotify and TuneIn. These partners find value in our independent platform and access to our millions of desirable and engaged customers.
As of September 29, 2018, our customers had registered nearly 21 million products in approximately 7.4 million households globally. We also estimate that our customers listened to 5.9 billion hours of audio content using our products in fiscal 2018, which represents 34% growth from fiscal 2017.
Our innovative products, seamless customer experience and expanding global footprint have driven 13 consecutive years of sustained revenue growth since our first product launch. We generate revenue from the sale of our wireless speakers, home theater speakers and component products, as new customers buy our products and existing customers continue to add products to their Sonos sound systems. In fiscal 2018, existing customers accounted for approximately 37% of new product registrations. We sell our products primarily through over 10,000 third-party physical retail stores, including custom installers of home audio systems. We also sell through select e-commerce retailers and our website sonos.com. Our products are distributed in over 50 countries, with 51% of our revenue in fiscal 2018 generated outside the United States.
Since our founding, we have focused on creating and enhancing a reliable, wireless multi-room sound system that simply works. The Sonos sound system integrates our speakers, proprietary software platform and a robust partner ecosystem to enable an immersive sound experience throughout the home. We manage the complexity of delivering a seamless customer experience in a multi-user and open-platform environment. The Sonos sound system is easy to set up, use and expand to bring the Sonic Internet to any room in the home. Through our software platform, we frequently upgrade features and services on our products, improving functionality and customer experience.
4
Our products
Our portfolio of products encourages customers to uniquely tailor their Sonos sound systems to best meet their sound and design preferences.
• | Wireless speakers. Our wireless speakers include Play:1, Play:3 and Play:5, as well as Sonos One, which includes native voice control. |
• | Home theater speakers. Our home theater products include speakers and a subwoofer designed to play audio content from TV/video. Our home theater products include Playbar, Playbase and Sub, as well as the recently released Sonos Beam, which includes native voice control. |
• | Components. Our Connect, Connect:Amp and Sonos Amp allow customers to convert third-party wired speakers, stereo systems or home theater setups into our easy-to-use, wirelessly controlled streaming music system. |
Our software
Our proprietary software is the foundation of the Sonos sound system and further differentiates our products from those of our competitors. Our software provides the following key benefits:
• | Multi-room experience. Our system enables our speakers to work individually or together in synchronized playback groups, powered by wireless mesh network capabilities to route and play audio optimally. |
• | Enhanced functionality through software upgrades. Our platform enables us to understand and enhance our customers’ listening and control experience, delivering feature updates and intelligent customization through remote software upgrades and cloud-based services. |
• | Intuitive and flexible control. Our customers can control their experiences through the Sonos app, voice control or an expanding number of third-party apps and smart devices. As our customers navigate across different controllers, our technology synchronizes the control experience across the Sonos platform to deliver the music and entertainment experience they desire. |
• | Advanced acoustics. We have made significant investments in our engineering team and audio technology, which have enabled us to create speakers that produce high-fidelity sound. For example, we invented technology to allow two of our speakers to pair wirelessly and create multi-channel sound, thereby enabling a much broader sound field. In addition, our Trueplay technology utilizes the microphones on an iOS device to analyze room attributes, speaker placement and other acoustic factors in order to improve sound quality. |
Our partner ecosystem
We have built a platform that attracts partners to enable our customers to play the content they love from the services they prefer. Our partners span across content, control and third-party applications:
• | Content. We partner with a broad range of content providers, such as streaming music services, internet radio stations and podcast services, allowing our customers to enjoy their audio content from whichever source they desire. |
• | Control. We provide our customers with multiple options to control their home audio experiences, including voice control and direct control from within selected streaming music service apps. |
• | Third-party applications. We partner with third-party developers, including home automation integrators such as Crestron. These partners are building new applications and services on top of the Sonos platform, increasing customer engagement and creating new experiences for our customers. |
5
Our competitive strengths
We believe the following combination of capabilities and features of our business model distinguish us from our competitors and position us well to capitalize on the opportunities created by the Sonic Internet:
• | Leading sound system. We have developed and refined our sound system with a singular focus for over 15 years. Our effort has resulted in significant consumer awareness and market share among home audio professionals. For example, a 2018 product study by a leading home audio publication of the top 100 custom integrator professionals ranked Sonos as the leading brand in the wireless audio, soundbar and subwoofer categories. Our 84% share in the wireless audio category among these industry professionals significantly outpaces our competitors. |
• | Platform enables freedom of choice for consumers. Our broad and growing network of partners provides our customers with access to voice control, streaming music, internet radio, podcasts and audiobook content, enabling them to listen to the content they love from the services they prefer. Our platform attracts a broad set of content providers, including leading streaming music services, and third-party developers. |
• | Differentiated consumer experience creates engaged households. We deliver a differentiated customer experience to millions of households every day, cultivating a passionate and engaged customer base. Long-term engagement with our products and our ability to continuously improve the functionality of our existing products through software updates leads to attractive economics as customers add products to their Sonos sound systems. |
• | Commitment to innovation drives continuous improvement. We have made significant investments in research and development for over 15 years and believe that we own the foundational intellectual property of wireless multi-room audio. We have significantly expanded the size of our patent portfolio in recent years. In 2017, the strength of our patent portfolio placed us 2nd in Electronics and 19th overall in IEEE’s Patent Power Report. |
• | Sound system expansion drives attractive financial model. We generate significant revenue from customers purchasing additional products to expand their Sonos sound systems, which has contributed to 13 consecutive years of sustained revenue growth. Existing households represented approximately 37% of new product registrations in fiscal 2018. We believe this aspect of our financial model will continue to be critical in sustaining our revenue growth over the long term. |
Our growth strategies
Key elements of our growth strategy include:
• | Consistently introduce innovative products. To address our market opportunity, we have developed a long-term roadmap to deliver innovative products and software enhancements, and intend to increase the pace of product introductions across multiple categories, including products designed for enjoyment in all the places and spaces that our customers listen to audio content, including outside of the home. Executing on our roadmap will position us to acquire new customers, increase sales to existing customers and improve the customer experience. |
• | Invest in geographic expansion. Geographic expansion represents a significant growth opportunity in currently unserved countries. We intend to expand into new countries by employing country-specific marketing campaigns and distribution channels. |
• | Build direct relationships with existing and prospective customers. We intend to continue to build direct relationships with current and prospective customers through sonos.com and the Sonos app to drive direct sales. |
• | Expand partner ecosystem to enhance platform. We intend to deepen our relationships with our current partners and expand our partner ecosystem to provide our customers access to streaming music services, voice assistants, internet radio, podcasts and audiobook content. For example, we introduced voice control with Amazon’s Alexa technology in 2017 and Apple’s Siri via Airplay 2 in 2018, and plan to introduce Google Assistant in 2019. |
• | Increase brand awareness in existing geographic markets. We intend to increase our household penetration rates in our existing geographic markets by investing in brand awareness, expanding our product offerings and growing our partner ecosystem. |
6
Sonos app
We offer our customers a single mobile app that controls the Sonos sound system and the entire listening experience. Customers can stream different audio content to speakers in different rooms or the same audio content synchronized throughout the entire home. Additionally, the Sonos app enables universal search, the ability to search for audio content across their streaming services and owned content to easily find, play or curate their favorite music.
Sales and marketing
We sell our products primarily through over 10,000 third-party physical retail stores, including custom installers of home audio systems, and our products are distributed in over 50 countries. The majority of our sales are transacted through traditional physical retailers, including on their websites. We also sell through online retailers such as Amazon, to custom installers who bundle our products with services that they sell to their customers and directly through our website sonos.com. We sell products internationally through distributors and to retailers. These retailers also sell products offered by our competitors. In fiscal 2018, Best Buy accounted for 17% of our revenue and the ALSO Group, our distributor in Germany, Sweden, Denmark and Norway, accounted for 10% of our revenue.
Our marketing investments are focused on driving profitable growth through advertising, public relations and brand promotion activities, including digital, out-of-home, print, sponsorships, brand activations and channel marketing. We invest in customer experience and customer relationship management to drive loyalty, word-of-mouth marketing and growth of our direct channels. We intend to continue to invest significant resources in our marketing and brand development efforts, including investing in capital expenditures on product displays to support our retail channel partners.
Research and development
Our research and development team develops new products and improves and enhances our existing products. We leverage the data that we gather from our products in the development of new features and enhancements to the Sonos sound system.
We intend to continue to significantly invest in research and development to bring new products to market and expand our platform and capabilities.
Manufacturing, logistics and fulfillment
We outsource the manufacturing of our speakers and components to contract manufacturers, using our design specifications. Our products are manufactured by Inventec Appliances Corporation ("Inventec") in China and other contract manufacturers.
Our contracts with Inventec and our other contract manufacturers do not obligate them to supply products to us in any specific quantity, except as specified in our purchase orders that are aligned with forecasts based on terms and conditions of the contract. Our contract manufacturers assemble our products to demand forecasts we establish based upon historical trends and analysis from our sales and product management functions. The vast majority of our products are shipped to our third-party warehouses and we then ship to our distributors, retailers and directly to our customers. Our third party warehouses are located in the United States in California and Pennsylvania, as well as internationally in Australia, Canada and the Netherlands.
We use a small number of logistics providers for substantially all of our product delivery to both distributors and retailers. This approach allows us to reduce order fulfillment time, reduce shipping costs and improve inventory flexibility.
Competition
We compete against established, well-known sellers of speakers and sound systems such as Bang & Olufsen, Bose, Samsung (and its subsidiaries Harman International and JBL), Sony and Sound United (and its subsidiaries Denon and Polk), and against developers of voice-enabled speakers and other voice-enabled products such as Amazon, Apple and Google. In some cases, our competitors are also our partners in our product development and resale and distribution channels. Many of our competitors have significant market share, diversified product lines, well-established supply and distribution systems, strong worldwide brand recognition, loyal customer bases and significant financial, marketing, research, development and other resources.
7
The principal competitive factors in our market include:
•brand awareness and reputation;
•breadth of product offering;
•price;
•sound quality;
•multi-room and wireless capabilities;
•customer support;
•product quality and design;
•ease of setup and use; and
•network of technology and content partners.
We believe we compete favorably with our competitors on the basis of the factors described above.
Government regulation
Our business and products are subject to numerous U.S. federal and state and foreign laws and regulations covering a wide variety of subject matters. These laws and regulations include general business regulations and laws, as well as regulations and laws specific to providers of internet-delivered streaming services and devices.
In particular, our business is subject to foreign and U.S. federal and state laws and regulations applicable to companies conducting business using the internet. Both domestic and international jurisdictions vary widely as to how or whether existing laws governing areas such as personal privacy and data security, consumer protection, payment processing or sales and other taxes and intellectual property apply to the internet and e-commerce. These laws, as well as those governing electronics contracts, and internet content and access restrictions, are continually evolving.
Additionally, we are subject to both general and e-commerce-specific privacy laws and regulations that may require us to provide users with our policies on sharing information with third parties and advance notice of any changes to these policies. Related laws may govern the manner in which we store or transfer sensitive information or impose obligations on us in the event of a security breach or inadvertent disclosure of such information. International jurisdictions impose different, and sometimes more stringent, consumer and privacy protections.
Tax regulations in domestic and international jurisdictions where we do not currently collect state or local taxes may subject us to the obligation to collect and remit such taxes, to additional taxes or to requirements intended to assist jurisdictions with their tax collection efforts. New legislation or regulation, the application of laws from jurisdictions whose laws do not currently apply to our business or the application of existing laws and regulations to the internet and e-commerce generally could result in significant additional taxes on our business.
In addition, the internet is a vital component of our business and also is subject to a variety of laws and regulations in jurisdictions throughout the world. We expect to rely on the historical openness and accessibility of the internet and the current balanced approach of network operators to conduct our business, and government regulations that impede or fail to preserve the open internet could harm our business.
The laws in each of these areas are continually changing and evolving in unpredictable ways. New laws and regulations in any of these areas, as well as compliance with these laws (and their derivatives) may have an adverse effect on our business. If we fail to comply with these laws we may be subject to significant liabilities and other penalties
Our content partners also are subject to a wide range of government regulations that may vary by jurisdiction. Because our business depends in part on the availability of third-party content delivered over the internet, increased regulation of our content
8
partners or changes in laws or regulations governing internet retransmission of third-party content could increase our expenses and adversely affect our business and the attractiveness of our platform.
Intellectual property
Intellectual property is an important aspect of our business, and we seek protection for our intellectual property as appropriate. To establish and protect our proprietary rights, we rely upon a combination of patent, copyright, trade secret and trademark laws and contractual restrictions such as confidentiality agreements, licenses and intellectual property assignment agreements. We maintain a policy requiring our employees, contractors, consultants and other third parties to enter into confidentiality and proprietary rights agreements to control access to our proprietary information. These laws, procedures and restrictions provide only limited protection, and any of our intellectual property rights may be challenged, invalidated, circumvented, infringed or misappropriated. Furthermore, the laws of certain countries do not protect proprietary rights to the same extent as the laws of the United States, and we therefore may be unable to protect our proprietary technology in certain jurisdictions.
As of September 29, 2018, we had been granted more than 775 patents and had over 595 patent applications pending. Our patents expire between 2024 and 2037. Our patents and patent applications focus on technology for the ability to stream content wirelessly to multiple rooms in the home. We continually review our development efforts to assess the existence and patentability of new intellectual property. We pursue the registration of our domain names, trademarks and service marks in the United States and in certain locations outside the United States. To protect our brand, we file trademark registrations in some jurisdictions.
We also enter into licensing agreements with our third-party content partners to provide access to a broad range of content for our customers.
Employees
As of September 29, 2018, we had 1,352 full-time employees. Of our full-time employees, 928 were in the United States and 424 were in our international locations. Other than our employees in France and the Netherlands, none of our employees are represented by a labor union or covered by a collective bargaining agreement. We have not experienced any work stoppages. We consider our relationship with our employees to be good.
Corporate information
We incorporated in Delaware in August 2002 as Rincon Audio, Inc. and we changed our name to Sonos, Inc. in May 2004. We completed the initial public offering ("IPO") of our common stock in August 2018 and our common stock is listed on The Nasdaq Global Select Market under the symbol of "SONO." Our principal executive offices are located at 614 Chapala Street, Santa Barbara, California 93101, and our telephone number is (805) 965-3001.
Our website address is www.sonos.com. The information on, or that can be accessed through, our website is not incorporated by reference into this Annual Report on Form 10-K. Investors should not rely on any such information in deciding whether to purchase our common stock.
Sonos, the Sonos logo, Sonos One, Sonos Beam, Play:1, Play:3, Play:5, Playbase, Playbar, Connect, Connect:Amp, Sonos Amp, Sub and our other registered or common law trademarks, tradenames or service marks appearing in this Annual Report on Form 10-K are our property. Solely for convenience, our trademarks, tradenames and service marks referred to in this Annual Report on Form 10-K appear without the ®, ™ and SM symbols, but those references are not intended to indicate, in any way, that we will not assert, to the fullest extent under applicable law, our rights to these trademarks, tradenames and service marks. This Annual Report on Form 10-K contains additional trademarks, tradenames and service marks of other companies that are the property of their respective owners.
Available information
We make available, free of charge through our website, our annual reports on Form 10-K, quarterly reports on Form 10-Q and current reports on Form 8-K, and amendments to those reports, filed or furnished pursuant to Sections 13(a) or Section 15(d) of the Securities Exchange Act of 1934, as amended, as soon as reasonably practicable after they have been electronically filed with, or furnished to, the SEC.
9
The SEC maintains an internet site (http://www.sec.gov) that contains reports, proxy and information statements, and other information regarding issuers that file electronically with the SEC.
Item 1A. Risk factors
Investing in our common stock involves a high degree of risk. You should carefully consider the risks and uncertainties described below, as well as the other information in this Annual Report on Form 10-K, including our consolidated financial statements and the related notes, and the section titled "Management’s discussion and analysis of financial condition and results of operations," before making an investment decision. The occurrence of any of the events or developments described below could materially and adversely affect our business, financial condition, results of operations and growth prospects. In such an event, the market price of our common stock could decline, and you may lose all or part of your investment. Additional risks and uncertainties not currently known to us or that we currently believe are not material may also impair our business, financial condition, results of operations and growth prospects.
Risks related to our business
We have a recent history of losses and expect to incur increased operating costs in the future, and we may not achieve or sustain profitability.
We have experienced net losses in our recent annual periods. In the fiscal years ended September 29, 2018, September 30, 2017 and October 1, 2016, we had net losses of $15.6 million, $14.2 million and $38.2 million, respectively. We had an accumulated deficit of $203.6 million as of September 29, 2018. We expect our operating expenses to increase in the future as we expand our operations and execute on our product roadmap. We plan to make significant future expenditures related to the expansion of our business and our product offerings, including investments in:
• | research and development to continue to introduce innovative new products, enhance existing products and improve our customers’ listening experience; |
• | sales and marketing to expand our global brand awareness, promote new products, increase our customer base and expand sales within our existing customer base; and |
• | legal, accounting, information technology and other administrative expenses to sustain our operations as a public company. |
We need to increase our revenue to achieve and maintain profitability in the future. We cannot assure you that our revenue will continue to grow or that it will not decline. In addition, we anticipate that new product introductions will adversely impact our gross margin in the near to intermediate term due to the increasing frequency of these product introductions and their anticipated increased share of our overall product volume. In the past, we have taken cost savings initiatives, including our reorganization effort in the third quarter of fiscal 2018. However, our cost savings initiatives do not assure our profitability. Additional reorganizations may be implemented in the future and cost savings may be offset by future hiring or other costs to pursue strategic objectives. Our revenue may decline or we may incur significant losses for a number of reasons, including the other risks and uncertainties described in these Risk Factors.
The pace of our revenue growth has been volatile, and we cannot assure you that we will continue to achieve consistent revenue growth.
We have experienced volatile revenue growth and demand for our products since launching our first product in 2005. Our revenue grew 14.6% in fiscal 2018 over fiscal 2017, 10.1% in fiscal 2017 over fiscal 2016, 6.8% in fiscal 2016 over fiscal 2015 and 8.9% in fiscal 2015 over fiscal 2014. Our historical revenue growth rates therefore should not be considered indicative of our future performance. Additionally, because our ability to achieve continued growth will depend on our ability to execute on our product roadmap, we cannot guarantee that our revenue will continue to grow. In order for our revenue growth to continue, and for the volatility of our growth to stabilize, we will need to be successful in determining the market opportunity for new products and developing and delivering products that appeal to consumers and stimulate demand. If we are unable to do so, our revenue may not grow as anticipated or at all, and the trading price of our common stock may decline.
The volatility of our revenue growth could cause our operating expenses to exceed our revenue in some periods. The unpredictable nature of the growth and expansion of our business and product offerings also places a continuous and significant
10
strain on our management, operational and financial resources. In future periods, we could experience a decline in revenue, or revenue could grow more slowly than we expect, which could have a material negative effect on our operating results and our stock price could be harmed.
Our operating results depend on a number of factors and are likely to fluctuate from quarter to quarter, which makes them difficult to predict and which could cause the trading price of our common stock to decline.
Our operating results and other key metrics have fluctuated in the past and may continue to fluctuate from quarter to quarter. We expect that this trend will continue as a result of a number of factors, many of which are outside of our control and may be difficult to predict, including:
• | fluctuations in demand for our products, including seasonal variations; |
• | the timing and success of new product introductions, which products initially tend to have a lower gross margin; |
• | the timing and success of new product introductions by our competitors; |
• | pricing pressure as a result of competition or otherwise; |
• | shifts in product, geographic or channel mix; |
• | the imposition of tariffs and other trade barriers, and the effects of retaliatory trade measures; |
• | delays or disruptions in our supply, manufacturing or distribution chain; |
• | fluctuations in costs and availability of raw materials and components, and in other manufacturing costs; |
• | fluctuations in levels of channel inventory; |
• | amount and timing of sales and marketing and other operating expenses related to maintenance and expansion of our business; |
• | negative publicity about our products; |
• | adverse litigation judgments, settlements or other litigation-related costs, especially from litigation involving alleged patent infringement or defense of our patents; |
• | fluctuations in foreign exchange rates; |
• | changes in tax rates or adverse changes in tax laws that expose us to additional income tax liabilities; |
• | natural disasters, geopolitical unrest, war, terrorism and other catastrophes outside of our control; and |
• | general economic conditions in domestic or international markets. |
Any one of the factors above or the cumulative effect of some of the factors above may result in significant fluctuations in our operating results. As a result, period-to-period comparisons of our operating results may not be meaningful, and you should not rely on them as an indication of our future performance. The variability and unpredictability of our quarterly operating results or other operating metrics could result in our failure to meet our expectations or those of investors or any analysts that cover us with respect to revenue or other operating results for a particular period. If we fail to meet or exceed such expectations for these or any other reasons, the market price of our common stock could fall substantially.
The success of our business depends on the continued growth of the voice-enabled speaker market, and our ability to establish and maintain market share.
We have increasingly focused our product roadmap on voice-enabled speakers, and we recently introduced our first voice-enabled speaker, Sonos One, in October 2017, and our first voice-enabled home theater speaker, Sonos Beam, in July 2018. The voice-enabled speaker market and the voice-enabled smart home systems market are still in the early stages of development. If
11
these markets do not continue to grow, or grow in unpredictable ways, our revenue may fall short of expectations and our operating results may be harmed, particularly since we incur substantial costs to introduce new products in advance of anticipated sales. Additionally, even if the market for voice-enabled speakers does expand, we may not be successful in developing and selling speakers that appeal to consumers or gain sufficient market acceptance. To succeed in this market, we will need to design, produce and sell innovative and compelling products and partner with other businesses that enable us to capitalize on new technologies. We also face intense competition in our markets, and we are dependent on a number of technology partners for the development of our products, some of which have developed or may develop and sell voice-enabled speaker products of their own. For example, Sonos One and Sonos Beam feature voice-control enablement powered by Amazon’s Alexa technology while Amazon currently competes by offering speaker products of their own. As we continue to execute on our product roadmap, our success in introducing voice-enabled speakers enabled with third-party technology, especially voice control, will increasingly depend on the willingness of our technology partners, many of which sell or may develop products that compete with ours, to continue to promote and enhance our products. These technology partners may cease doing business with us or disable the technology they provide our products for a variety of reasons, including to promote their products over our own. If these partners disable the integration of their technology into our products, demand for our products may decrease and our sales may be harmed. We cannot assure you that the resources we invest in research and development, existing or alternative technology partnerships, marketing and sales will be adequate for us to be successful in establishing and maintaining a large share of the voice-enabled speaker market. If we are not able to capture and sustain market share, our future revenue growth will be negatively impacted.
To remain competitive and stimulate consumer demand, we must successfully manage frequent new product introductions and transitions.
Due to the highly volatile and competitive nature of the home audio and broader consumer electronics industry, we must frequently introduce new products, enhance existing products and effectively stimulate customer demand for new and upgraded products in both mature and developing markets. The successful introduction of our new products depends on a number of factors, such as the timely completion of development efforts to correspond with limited windows for market introduction. In recent years, we have experienced delays in bringing new products to market, along with higher-than-expected costs in doing so. We face significant challenges in managing the risks associated with new product introductions and production ramp-up issues, including accurately forecasting initial consumer demand, as well as the risk that new products may have quality or other defects in the early stages of introduction. In addition, new and upgraded products can affect the sales and profitability of existing products. Accordingly, if we cannot properly manage the introduction of our new products, our operating results and financial condition may be adversely impacted, particularly if the cadence of new product introductions increases as we expect.
We are highly dependent on a key contract manufacturer to manufacture our products, and while we recently began using additional manufacturers, we may be unable to operate our business if our manufacturer is unable to manufacture our products or ends its relationship with us.
We have historically depended on a single manufacturer, Inventec, to manufacture our products. Recently, we began using additional manufacturers to manufacture certain of our products, though Inventec remains our key manufacturer for the vast majority of our production. Our reliance on Inventec increases the risk that, in the event of an interruption in Inventec’s operations, whether due to a natural catastrophe, labor dispute or otherwise, we would not be able to maintain our production capacity without incurring material additional costs and substantial delays. Additionally, Inventec can terminate its agreement with us for any reason with 180 days’ advance notice. If Inventec breaches or terminates its agreement with us or otherwise fails to perform its obligations in a timely manner, we may be severely delayed or fully prevented from selling our products. If Inventec were unable to perform its obligations or were to end its relationship with us, it would take up a significant amount of time to increase our production with other manufacturers or to identify and onboard a new manufacturer that has the capability and resources to build our products to our specifications in sufficient volume. A violation of labor, environmental, intellectual property or other laws by our manufacturers, or a failure of our manufacturers to follow generally accepted ethical business practices, could create negative publicity, harm our reputation and require us to contract with a new manufacturer. Identifying additional manufacturers would require us to evaluate and approve their quality control systems, technical capabilities, responsiveness, service, financial stability, regulatory compliance and labor and other ethical practices. Any material disruption in our relationship with our manufacturers would harm our ability to compete effectively and satisfy demand for our products, and could adversely impact our revenue, gross margin and operating results.
We depend on a limited number of third-party components suppliers and logistics providers. Our business may be harmed if these parties do not perform their obligations or if they suffer interruptions to their own operations, or if alternative component sources are unavailable or if there is an increase in the costs of these components.
We are dependent on a limited number of suppliers for various key components used in our products, and the cost, quality and availability of these components are essential to the successful production and sale of our products. We have sole-source
12
suppliers, particularly for product-specific mechanical enclosures, and single- source suppliers, particularly for processor components. We are subject to the risk of shortages and long lead times in the supply of these components and other materials, and the risk that our suppliers discontinue or modify, or increase the price of, the components used in our products. If the supply of these components were to be delayed or constrained, or if one or more of our main suppliers were to go out of business, alternative sources or suppliers may not be available on acceptable terms or at all. Further, if there were a shortage of supply, the cost of these components may increase and harm our ability to sell our products on a cost-effective basis. For example, similar to other companies in the electronics industries, we have from time to time experienced shortages of random-access memory that is integral to manufacturing our products. More recently, the global supply of multilayer ceramic capacitors, which are components used across the consumer electronics industry as well as in all of our products, is experiencing shortages due to an imbalance of global demand and supply capacity, resulting in related price increases that we expect will negatively impact our gross margin through calendar year 2019. In connection with any supply shortages in the future, reliable and cost-effective replacement sources may not be available on short notice or at all, and this may result in decreased sales or force us to increase prices and face a corresponding decrease in demand for our products. In the event that any of our suppliers were to discontinue production of our key product components, developing alternate sources of supply for these components would be time consuming, difficult and costly. This would harm our ability to sell our products in order to meet market demand and could materially and adversely affect our brand, image, business prospects and operating results.
We use a small number of logistics providers for substantially all of our product delivery to both distributors and retailers. If one of these providers were to experience financial difficulties or disruptions in its business, our own operations could be adversely affected. Because substantially all of our products are distributed from a small number of locations and by a small number of companies, we are susceptible to both isolated and system-wide interruptions caused by events out of our control. Our distribution facilities employ computer-controlled and automated equipment, and thus may be vulnerable to computer viruses or other security risks, as well as to electronic or power interruptions or other system failures. Any disruption to the operations of our distributions facilities could delay product delivery, harm our reputation among our customers and adversely affect our operating results and financial condition.
We have limited control over these parties on which our business depends. If any of these parties fails to perform its obligations on schedule, or breaches or ends its relationship with us, we may be unable to satisfy demand for our products. Delays, product shortages and other problems could impair our retail distribution and brand image and make it difficult for us to attract new customers. If we experience significantly increased demand, or if we need to replace an existing supplier or logistics provider, we may be unable to supplement or replace such supply or logistics capacity on terms that are acceptable to us, which may undermine our ability to deliver our products to customers in a timely manner. Further, we do not have long-term contracts with all of these parties, and there can be no assurance that we will be able to renew our contracts with them on favorable terms or at all. Accordingly, a loss or interruption in the service of any key party could adversely impact our revenue, gross margin and operating results.
Our investments in marketing may not yield the results we expect.
We have made significant investments in marketing our products. Such efforts include direct marketing to consumers to promote awareness of our products, and of our brand in general. These efforts may not yield the results we anticipate and may prove more expensive than we currently anticipate, and revenue may not increase sufficiently to offset these higher expenses. Failures in our marketing efforts could adversely impact our business, financial condition and results of operations.
The home audio and consumer electronics industries are highly competitive. Competition presents an ongoing threat to the success of our business.
The markets in which we operate are extremely competitive and rapidly evolving, and we expect that competition will intensify in the future. Our competition includes established, well-known sellers of speakers and sound systems such as Bang & Olufsen, Bose, Samsung (and its subsidiaries Harman International and JBL), Sony and Sound United (and its subsidiaries Denon and Polk), and developers of voice-enabled speakers and systems such as Amazon, Apple and Google. We could also face competition from new market entrants, some of whom might be current partners of ours. In order to deliver products that appeal to changing and increasingly diverse consumer preferences, and to overcome the fact that a relatively high percentage of consumers may already own or use products that they perceive to be similar to those that we offer, we must develop superior technology, anticipate increasingly diverse consumer tastes and rapidly develop attractive products with competitive selling prices. Even if we are able to efficiently develop and offer innovative products at competitive selling prices, our operating results and financial condition may be adversely impacted if we are unable to effectively anticipate and counter the ongoing price erosion that frequently affects consumer products or if the average selling prices of our products decrease faster than we are able to reduce our manufacturing costs.
13
Most of our competitors have greater financial, technical and marketing resources available to them than those available to us, and, as a result, they may develop competing products that cause the demand for our products to decline. Our current and potential competitors have established, or may establish, cooperative relationships among themselves or with third parties in order to increase the abilities of their products to address the needs of our prospective customers, and other companies may enter our markets by acquiring or entering into strategic relationships with our competitors. To remain competitive, we may also need to increase our selling and marketing expenses. We may not have the financial resources, technical expertise or marketing and sales capabilities to continue to compete successfully. A failure to efficiently anticipate and respond to these established and new competitors may adversely impact our business and operating results.
Further, our current and prospective competitors may consolidate with each other or acquire companies that will allow them to develop products that better compete with our products. Such consolidation would intensify the competition that we face and may also disrupt or lead to termination of our distribution, technology and content partnerships. For example, if one of our content partners were to acquire a home audio hardware company, that partner may decide to disable the streaming functionality of its service with our products. If we are unable to compete with these consolidated companies or if consolidation in the market disrupts our partnerships or reduces the number of companies we partner with, our business would be adversely affected.
Conflicts with our distribution and technology partners could harm our business and operating results.
Several of our existing products compete, and products that we may offer in the future could compete, with the product offerings of some of our significant channel and distribution partners, which partners have greater financial resources than we do. Amazon and Apple, for example, already offer products that compete with ours. To the extent products offered by our partners compete with our products, they may choose to promote their own products over ours, or could end our partnerships and cease selling or promoting our products entirely. If our distribution partners, such as Amazon and Apple, continue to compete with us more directly in the future, they would be able to market and promote their products more prominently than they market and promote our products, and could refuse to promote or offer our products for sale alongside their own, or at all, in distribution channels. Any reduction in our ability to place and promote our products, or increased competition for available shelf or website placement, especially during peak retail periods, such as the holiday shopping season, would require us to increase our marketing expenditures and to seek other distribution channels in order to promote our products. If we are unable to effectively sell our products due to conflicts with our distribution partners, our business would be harmed.
We are currently manufacturing and developing voice-enabled speaker systems that are enhanced with the technology of our partners, including those who sell competing products. We introduced Sonos One in October 2017 and Sonos Beam in July 2018, which are both voice- enabled speakers that feature voice-control enablement powered by Amazon’s Alexa technology. Our current agreement with Amazon allows Amazon to disable the Alexa integration in our Sonos One or Sonos Beam products with limited notice. As such, it is possible that Amazon, which sells products that compete with ours, may on limited notice disable the integration, which would cause our Sonos One or Sonos Beam products to lose their voice-enabled functionality. Amazon could also begin charging us for this integration which would harm our operating results. We are working to establish partnerships with other companies that have developed voice-control enablement technology, but we cannot assure you that we will be successful in doing so. If Amazon does not maintain the Alexa integration, if Amazon seeks to charge us for this integration, if we have not developed alternative partnerships for similar voice-enabled products or if we have not developed such products on our own, our sales may decline, our reputation may be harmed and our business and operating results may suffer.
Competition from our partners who are able to sell speaker products at lower prices could force us to lower our prices, which would harm our operating results.
Many of our current and potential partners have business objectives that may drive them to sell their speaker products at a significant discount to ours. Amazon and Google, for example, both currently offer their speaker products at significantly lower prices than Sonos One and Sonos Beam. Many of these partners may subsidize these prices and seek to monetize their customers through the sale of additional services rather than the speakers themselves. Our business model, by contrast, is dependent on the sale of our speakers. Should we be forced to lower the price of our products in order to compete on a price basis, our operating results could be harmed.
Competition with our content partners could cause these partners to cease to allow their content to be streamed on our products, which could lower product demand.
Demand for our products depends in large part on the availability of streaming third-party content that appeals to our existing and prospective customers. Compatibility with streaming music services, podcast platforms and other content provided by our content partners is a key feature of our products. To date, all of our arrangements have been entered into on a royalty-free basis. Some of these content partners compete with us already, and others may in the future produce and sell speakers along with their streaming services. Additionally, other content partners may form stronger alliances with our competitors in the home audio
14
market. Any of our content partners may cease to allow their content to be streamed on our products for a variety of reasons, including to promote other partnerships or their products over our own, or seek to charge us for this streaming. If this were to happen, demand for our products could decrease and our operating results could be harmed.
If we are unable to accurately anticipate market demand for our products, we may have difficulty managing our production and inventory and our operating results could be harmed.
We must forecast production and inventory needs in advance with our suppliers and manufacturer, and our ability to do so accurately could be affected by many factors, including an increase or decrease in customer demand for our products or those of our competitors, the success of new products in the market, sales promotions by us or our competitors, channel inventory levels and unanticipated shifts in general economic conditions or consumer confidence levels. Such a rapid increase in production could also cause a decline in manufacturing quality and customer satisfaction. If demand does not meet our forecast, excess product inventory could force us to write-down or write-off inventory, or to sell the excess inventory at discounted prices, which could cause our gross margin to suffer and could impair the strength of our brand. In addition, if we were to have excess inventory, we may have reduced working capital, which could adversely affect our ability to invest in other important areas of our business such as marketing and product development. If our channel partners have excess inventory of our products, they may decrease purchase of our products in subsequent periods. If demand exceeds our forecast and we do not have sufficient inventory to meet this demand, we would have to rapidly increase production and suffer higher supply and manufacturing costs that would lower our gross margin. Any of these scenarios could adversely impact our operating results and financial condition.
We experience seasonal demand for our products, and if our sales in high-demand periods are below our forecasts, our overall financial condition and operating results could be adversely affected.
Given the seasonal nature of our sales, accurate forecasting is critical to our business. Our fiscal year ends on the Saturday closest to September 30, the holiday shopping season occurs in the first quarter of our fiscal year and the typically slower summer months occur in our fourth fiscal quarter. Historically, our revenue has been significantly higher in our first fiscal quarter due to increased consumer spending patterns during the holiday season. We attempt to time our new product releases to coincide with relatively higher consumer spending in the first fiscal quarter, which contributes to this seasonal variation. Any shortfalls in expected first quarter revenue, due to macroeconomic conditions, product release patterns, a decline in the effectiveness of our promotional activities, supply chain disruptions or for any other reason, could cause our annual operating results to suffer significantly. In addition, if we fail to accurately forecast customer demand for the holiday season, we may experience excess inventory levels or a shortage of products available for sale, which could further harm our financial condition and operating results.
If market demand for streaming music does not grow as anticipated or the availability and quality of streaming services does not continue to increase, our business could be adversely affected.
A large proportion of our customer base uses our products to listen to content via subscription-based streaming music services. Accordingly, we believe our future revenue growth will depend in significant part on the continued expansion of the market for streaming music. We cannot assure you that this market will continue to grow. The success of the streaming music market depends on the quality, reliability and adoption of streaming technology, and on the continued success of streaming music services such as Apple Music, Pandora, Spotify and TuneIn. In order to attract and retain customers, these services must continue to attract record labels, artists, other content providers and advertisers and all parties must be able to successfully monetize their streaming-based businesses over the long term. If the development of the streaming music market fails to keep pace with consumer demand expectations, the market for streaming music could decline and our business may be harmed. Additionally, we cannot assure you that the streaming music business model or the streaming music services we partner with will be successful over the long term. If the streaming music market in general declines or if the streaming services we partner with are not successful, demand for our products may suffer and our operating results may be adversely affected.
If we are not successful in expanding our direct-to-consumer sales channel by driving consumer traffic and consumer purchases through our website, our business and results of operations could be harmed.
We are currently investing in our direct-to-consumer sales channel, primarily through our website, and our future growth relies in part on our ability to attract consumers to this channel. We plan to invest in driving sales through this channel. The level of consumer traffic and volume of consumer purchases through our website depends in large part on our ability to provide a user-friendly and visually appealing interface, a seamless consumer experience, sufficient inventory and reliable, timely delivery of our products. Building this channel and improving our website and product delivery services will continue to require significant expenditures in marketing, software development and infrastructure. If we are unable to drive traffic to, and increase sales through, our website, our business and results of operations could be harmed. The success of direct-to-consumer sales through our website is subject to risks associated with e-commerce, including implementing and maintaining appropriate
15
technology and systems, reliance on third-party service providers, data breaches and disruption of internet service. Our inability to adequately respond to these risks and uncertainties or to successfully maintain and expand our direct-to-consumer business via our website may have an adverse impact on our results of operations.
Additionally, the expansion of our direct-to-consumer channel may alienate some of our channel partners and could cause a reduction in product sales from these partners. Channel partners may perceive themselves to be at a disadvantage based on the direct-to-consumer sales offered through our website. Due to these and other factors, conflicts in our sales channels could arise and cause channel partners to divert resources away from the promotion and sale of our products or to offer competitive products. Further, to the extent we use our mobile app to increase traffic to our website and increase direct-to-consumer sales, we will rely on application marketplaces such as the Apple App Store and Google Play to drive downloads of our mobile app. Apple and Google, both of which sell products that compete with ours, may choose to use their marketplaces to promote their competing products over ours or may make access to our app more difficult. Any of these situations could adversely impact our business and results of operations.
We sell our products through a limited number of key channel partners, and the loss of any such channel partner would adversely impact our business.
We are dependent on our channel partners for a vast majority of our product sales. Some of our key channel partners include Best Buy, which accounted for 17% of our revenue in fiscal 2018, and the ALSO Group, our distributor in Germany, Sweden, Denmark and Norway, which accounted for 10% of our revenue in fiscal 2018. We do not enter into long-term volume commitments with our major channel partners. If one or several of our channel partners were to discontinue selling our products, increase their promotion of competing products or choose to promote competing products over ours, the volume of our products sold to customers could decrease, which could in turn harm our business. In addition, the loss of a key channel partner for distribution would require us to identify and contract with alternative channel partners, or to rely more heavily on direct-to-consumer sales, which we may be unable to do successfully or which could prove time-consuming and expensive. In addition, revenue from our channel partners depends on a number of factors outside our control and may vary from period to period. If one or more of our channel partners were to experience serious financial difficulty as a result of weak economic conditions or otherwise, and were to reduce its inventory of our products or limit or cease operations, our business and results of operations would be significantly harmed. Consolidation of our channel partners in the future or additional concentration of market share among our channel partners may also exacerbate this risk.
Because we compete with many other providers of consumer products for placement and promotion of products in the stores of our channel partners, our success depends on our channel partners and their willingness to promote our products successfully. In general, our contracts with these third parties allow them to exercise significant discretion over the placement and promotion of our products in their stores, and they could give higher priority to other products. Our channel partners may also give their own products or those of our competitors better placement over our products in stores or online. If our channel partners do not effectively market and sell our products, or if they choose to use greater efforts to market and sell their own or our competitors’ products, our business, operating results and prospects may be adversely affected.
A significant disruption in our websites, servers or information technology systems, or those of our third-party partners, or flaws or other vulnerabilities in our products, could impair our customers’ listening experience or otherwise adversely affect our customers, damage our reputation or harm our business.
As a consumer electronics company, our website and mobile app are important presentations of our business, identity and brand, and an important means of interacting with, and providing information to, consumers of our products. We depend on our servers and centralized information technology systems, and those of third parties, for product functionality and to store intellectual property, forecast our business, maintain financial records, manage operations and inventory and operate other critical functions. Accordingly, we rely heavily on the accuracy, capacity and security of both our information technology systems and those of third parties. We allocate significant resources to maintaining our information technology systems and deploying network security, data encryption, training and other measures to protect against unauthorized access or misuse. Nevertheless, our websites and information technology systems, and those of the third parties we rely on, are susceptible to damage, disruptions or shutdowns due to power outages, hardware failures, structural or operational failures, computer viruses, hacking attacks, telecommunication failures, user error, malfeasance, system upgrades, integration or migration, and other foreseeable and unforeseeable events. All of our products are connected to the internet and receive periodic software updates from our servers and it is possible that such servers could be compromised, resulting in the delivery of malicious code, severely hampering product functionality. System failures and disruptions could impede the manufacturing and shipping of products, delivery of online services, functionality of our products, transactions processing and financial reporting, and could result in the loss of intellectual property or data, require substantial repair costs and damage our reputation and business relationships. Such failures and disruptions could therefore adversely affect our reputation, competitive position, financial condition and results of operations.
16
For example, we use Amazon Web Services ("AWS") to maintain the interconnectivity of our mobile app to our servers and those of the streaming services that our customers access to enjoy our products. Our brand, reputation and ability to retain and attract new customers depend on the reliable performance of our technology and cloud-based content delivery. Because AWS runs its own platform that we access, we are vulnerable to both system-wide and Sonos-specific service outages at AWS. Our access to AWS’ infrastructure could be limited by a number of potential causes, including technical failures, natural disasters, fraud or security attacks that we cannot predict or prevent. If we were to experience an AWS service interruption, or if the security of the AWS infrastructure were compromised or believed to have been compromised, our ability to serve our customers and our reputation with current and potential customers would be negatively impacted.
Additionally, our products may contain flaws that make them susceptible to unauthorized access or use. For example, we previously discovered a vulnerability in our products that could be exploited when a customer visited a website with malicious content, allowing the customer’s local network to be accessed by third parties who could then gain unauthorized access to the customer’s playlists and other data and limited control of the customer’s devices. While we devote significant resources to address and eliminate flaws and other vulnerabilities in our products, there can be no assurance that our products will not be compromised in the future. Any such flaws or vulnerabilities, whether actual or merely potential, could harm our reputation, competitive position, financial condition and results of operations.
Changes in how network operators manage data that travel across their networks or in net neutrality rules could harm our business.
Our business relies in part upon the ability of consumers to access high-quality streaming content through the internet. As a result, the growth of our business depends partially on our customers’ ability to obtain low-cost, high-speed internet access, which relies in part on network operators’ continued willingness to upgrade and maintain their equipment as needed to sustain a robust internet infrastructure, as well as their continued willingness to preserve the open and interconnected nature of the internet. We exercise no control over network operators, which makes us vulnerable to any errors, interruptions or delays in their operations. Any material disruption in internet services could harm our business.
To the extent that the number of internet users continues to increase, network congestion could adversely affect the reliability of our platform. We may also face increased costs of doing business if network operators engage in discriminatory practices with respect to streamed audio content in an effort to monetize access to their networks by content providers. In the past, internet service providers ("ISPs") have attempted to implement usage-based pricing, bandwidth caps and traffic shaping or throttling. To the extent network operators create tiers of internet access service and charge our customers in direct relation to their consumption of audio content, our ability to attract and retain customers could be impaired, which would harm our business. Net neutrality rules, which were designed to ensure that all online content is treated the same by ISPs and other companies that provide broadband services, were repealed by the Federal Communications Commission effective June 2018. The repeal of the net neutrality rules could force us to incur greater operating expenses, cause our streaming partners to seek to shift costs to us or result in a decrease in the streaming-based usage of our platform by our customers, any of which would harm our results of operations.
Our investments in research and development may not yield the results expected.
Our business operates in intensely competitive markets characterized by changing consumer preferences and rapid technological innovation. Due to advanced technological innovation and the relative ease of technology imitation, new products tend to become standardized more rapidly, leading to more intense competition and ongoing price erosion. In order to strengthen the competitiveness of our products in this environment, we continue to invest heavily in research and development. However, these investments may not yield the innovation or the results expected on a timely basis, or our competitors may surpass us in technological innovation, hindering our ability to timely commercialize new and competitive products that meet the needs and demands of the market, which consequently may adversely impact our operating results as well as our reputation.
If we are not able to maintain and enhance the value and reputation of our brand, or if our reputation is otherwise harmed, our business and operating results could be adversely affected.
Our continued success depends on our reputation for providing high-quality products and consumer experiences, and the "Sonos" name is critical to preserving and expanding our business. Maintaining, promoting and positioning our brand depends largely on the success of our marketing efforts, the consistency of the quality of our products and our ability to successfully secure, maintain and defend the trademarks that are key to our brand. Each of these objectives requires significant expenditures, and there is no guarantee that we will be able to achieve these objectives successfully. If we fail to successfully maintain, promote and position our brand and protect our reputation, or if we incur significant expenses in this effort, our business, financial condition and operating results may be adversely affected. The value of our brand could also be severely damaged by isolated incidents, particularly if these incidents receive considerable negative publicity or result in litigation, and by events outside of
17
our control. Additionally, in the United States, we rely on custom installers of home audio systems for a significant portion of our sales but maintain no control over the quality of their work and thus could suffer damage to our brand or business to the extent such installations are unsatisfactory or defective. The market demand for our products, the value of our brand and our reputation generally could be harmed if any such incidents or other matters erode consumer confidence in us or our products. Any negative effect on our brand, regardless of whether it is within our control, could adversely affect our reputation, business and results of operations.
Our efforts to expand beyond our core product offerings and offer products with applications outside the home may not succeed and could adversely impact our business.
We may seek to expand beyond our core sound systems and develop products that have wider applications outside the home, such as commercial or office. Developing these products would require us to devote substantial additional resources, and our ability to succeed in developing such products to address such markets is unproven. It is likely that we would need to hire additional personnel, partner with new third parties and incur considerable research and development expenses in order to pursue such an expansion successfully. We have less familiarity with consumer preferences for these products and less product or category knowledge, and we could encounter difficulties in attracting new customers due to lower levels of consumer familiarity with our brand. As a result, we may not be successful in future efforts to achieve profitability from new markets or new types of products, and our ability to generate revenue from our existing products may suffer. If any such expansion does not enhance our ability to maintain or grow our revenue or recover any associated development costs, our operating results could be adversely affected.
We may choose to discontinue support for older versions of our products, resulting in customer dissatisfaction that could negatively affect our business and operating results.
We have historically maintained, and we believe our customers have grown to expect, extensive backward compatibility for our older products and the software that supports them, allowing older products to continue to benefit from new software updates. We expect that in the near to intermediate term, this backward compatibility will no longer be practical or cost-effective, and we may decrease or discontinue service for our older products. Therefore, if we no longer provide extensive backward capability for our products, we may damage our relationship with our customers, and the value proposition of our products with existing and prospective customers may decline. We may lose existing customers if their older products cannot integrate with newer versions of our software, and this may also result in negative publicity that could adversely affect our reputation and brand loyalty and impact our ability to attract new customers or sell new products to existing customers. For these reasons, any decision to decrease or discontinue backward capability may decrease sales and adversely affect our business, operating results and financial condition.
Product quality issues and a higher-than-expected number of warranty claims or returns could harm our business and operating results.
The products that we sell could contain defects in design or manufacture. Defects could also occur in the products or components that are supplied to us. There can be no assurance we will be able to detect and remedy all defects in the hardware and software we sell, which could result in product recalls, product redesign efforts, loss of revenue, reputational damage and significant warranty and other remediation expenses. Similar to other consumer electronics, our products have a risk of overheating and fire in the course of usage or upon malfunction. Any such defect could result in harm to property or in personal injury. If we determine that a product does not meet product quality standards or may contain a defect, the launch of such product could be delayed until we remedy the quality issue or defect. The costs associated with any protracted delay necessary to remedy a quality issue or defect in a new product could be substantial.
We generally provide a one-year warranty on all of our products, except in the European Union (the "EU") and select other countries where we provide a two-year warranty on all of our products. The occurrence of any material defects in our products could expose us to liability for damages and warranty claims in excess of our current reserves, and we could incur significant costs to correct any defects, warranty claims or other problems. In addition, if any of our product designs are defective or are alleged to be defective, we may be required to participate in a recall campaign. In part due to the terms of our warranty policy, any failure rate of our products that exceeds our expectations may result in unanticipated losses. Any negative publicity related to the perceived quality of our products could affect our brand image and decrease retailer, distributor and consumer confidence and demand, which could adversely affect our operating results and financial condition. Further, accidental damage coverage and extended warranties are regulated in the United States at the state level and are treated differently within each state. Additionally, outside the United States, regulations for extended warranties and accidental damage vary from country to country. Changes in interpretation of the regulations concerning extended warranties and accidental damage coverage on a federal, state, local or international level may cause us to incur costs or have additional regulatory requirements to meet in the future in order
18
to continue to offer our support services. Our failure to comply with past, present and future similar laws could result in reduced sales of our products, reputational damage, penalties and other sanctions, which could harm our business and financial condition.
The loss of one or more of our key personnel, or our failure to attract, assimilate and retain other highly qualified personnel in the future, could harm our business.
We depend on the continued services and performance of our key personnel. The loss of key personnel, including key members of management as well as our product development, marketing, sales and technology personnel, could disrupt our operations and have an adverse effect on our ability to grow our business. In addition, the loss of key personnel in our finance and accounting departments could harm our internal controls, financial reporting capability and capacity to forecast and plan for future growth.
As we become a more mature company, we may find our recruiting efforts more challenging. In particular, we have experienced difficulties in recruiting qualified software engineers. The equity incentives we currently use to attract, retain and motivate employees may not be as effective as in the past. In particular, we rely heavily on equity incentives to attract and retain employees, and if the value of the underlying common stock does not grow commensurate with expectations, we may not be able to effectively recruit new employees and we may risk losing existing employees. If we do not succeed in attracting, hiring and integrating high-quality personnel, or in retaining and motivating existing personnel, we may be unable to grow effectively and our financial condition may be harmed.
We may be subject to intellectual property rights claims and other litigation which are expensive to support, and if resolved adversely, could have a significant impact on us and our stockholders.
Companies in the consumer electronics industries own large numbers of patents, copyrights, trademarks, domain names and trade secrets, and frequently enter into litigation based on allegations of infringement, misappropriation or other violations of intellectual property or other rights. As we gain an increasingly high profile and face more intense competition in our markets, the possibility of intellectual property rights claims against us grows, including the threat of lawsuits from non-practicing entities. Our technologies may not be able to withstand any third-party claims or rights against their use, and we may be subject to litigation and disputes. The costs of supporting such litigation and disputes is considerable, and there can be no assurance that a favorable outcome would be obtained. We may be required to settle such litigations and disputes on terms that are unfavorable to us. Similarly, if any litigation to which we may be party fails to settle and we go to trial, we may be subject to an unfavorable judgment that may not be reversible upon appeal. The terms of such a settlement or judgment may require us to cease some or all of our operations, limit our ability to use certain technologies, pay substantial amounts to the other party or issue additional shares of our capital stock to the other party, which would dilute our existing stockholders.
With respect to intellectual property rights claims, we may have to negotiate a license in order to continue practices found to be in violation of a third party’s rights. Any such license may not be available on reasonable terms and may significantly increase our operating expenses, or may not be available to us at all. As a result, we may also be required to develop alternative, non-infringing technology or practices or to discontinue the practices altogether. The development of alternative non-infringing technology or practices could require significant effort and expense and ultimately may not be successful, and our business and results of operations could be materially and adversely affected.
If we are unable to protect our intellectual property, the value of our brand and other intangible assets may be diminished, and our business may be adversely affected.
We rely and expect to continue to rely on a combination of confidentiality and license agreements with our employees, consultants and third parties with whom we have relationships, as well as patent, trademark, copyright and trade secret protection laws, to protect our proprietary rights. In the United States and certain other countries, we have filed various applications for certain aspects of our intellectual property, most notably patents. However, third parties may knowingly or unknowingly infringe our proprietary rights, third parties may challenge our proprietary rights, pending and future patent and trademark applications may not be approved and we may not be able to prevent infringement without incurring substantial expense. Such infringement could have a material adverse effect on our brand, business, financial condition and results of operations. We have initiated legal proceedings to protect our intellectual property rights, and we may file additional actions in the future. For example, in December 2017, a jury found that D&M Holdings Inc. d/b/a The D+M Group, D&M Holdings U.S. Inc. and Denon Electronics (USA), LLC (collectively, "Denon") had infringed and was infringing certain of our patents, and in May 2018, we settled the remaining claims in exchange for royalty payments from Denon. The cost of defending our intellectual property has been and may be substantial, and there is no assurance we will be successful. Additionally, our business could be adversely affected as a result of any such actions, or a finding that any patents-in-suit are invalid or unenforceable. These actions have led and may also lead to additional counterclaims against us, which are expensive to defend against and for which there can be no assurance of a
19
favorable outcome. Further, parties we bring legal action against could retaliate through non-litigious means, which could harm our ability to compete against such parties or to enter new markets.
The regulations of certain foreign countries do not protect our intellectual property rights to the same extent as the laws of the United States. As our brand grows, we will likely discover unauthorized products in the marketplace that are counterfeit reproductions of our products. Although we may expend efforts to pursue counterfeiters, it is not practical to pursue all counterfeiters. If we are unsuccessful in pursuing producers or sellers of counterfeit products, continued sales of these products could adversely impact our brand, business, financial condition and results of operations.
Our use of open source software could negatively affect our ability to sell our products and could subject us to possible litigation.
We incorporate open source software into our products, and we may continue to incorporate open source software into our products in the future. Open source software is generally licensed by its authors or other third parties under open source licenses. Some of these licenses contain requirements that we make available source code for modifications or derivative works we create based upon the open source software, and that we license such modifications or derivative works under the terms of a particular open source license or other license granting third parties certain rights of further use. Additionally, if a third-party software provider has incorporated open source software into software that we license from such provider, we could be required to disclose any of our source code that incorporates or is a modification of our licensed software. If an author or other third party that distributes open source software that we use or license were to allege that we had not complied with the conditions of the applicable license, we could be required to incur significant legal expenses defending against those allegations and could be subject to significant damages, enjoined from offering or selling our products that contained the open source software and required to comply with the foregoing conditions. Any of the foregoing could disrupt and harm our business and financial condition.
We collect, store, process and use our customers’ personally identifiable information and other data, which subjects us to governmental regulation and other legal obligations related to privacy, information security and data protection. Any cybersecurity breaches or our actual or perceived failure to comply with such legal obligations by us, or by our third-party service providers or partners, could harm our business.
We collect, store, process and use our customers’ personally identifiable information and other data, and we rely on third parties that are not directly under our control to do so as well. While we take measures intended to protect the security, integrity and confidentiality of the personal information and other sensitive information we collect, store or transmit, we cannot guarantee that inadvertent or unauthorized use or disclosure will not occur, or that third parties will not gain unauthorized access to this information. There have been a number of recent reported incidents where third parties have used software to access the personal data of their partners’ customers for marketing and other purposes. While our privacy policies currently prohibit such activities, our third-party service providers or partners may engage in such activity without our knowledge or consent. If we or our third- party service providers were to experience a breach, disruption or failure of systems compromising our customers’ data, or if one of our third-party service providers or partners were to access our customers’ personal data without our authorization, our brand and reputation could be adversely affected, use of our products could decrease and we could be exposed to a risk of loss, litigation and regulatory proceedings. Depending on the nature of the information compromised in a data breach, disruption or other unauthorized access to our customers’ data, we may also have obligations to notify customers about the incident and we may need to provide some form of remedy for the individuals affected. Such breach notification laws continue to develop and may be inconsistent across jurisdictions. Complying with these obligations could cause us to incur substantial costs and negative publicity. While we maintain insurance coverage that is designed to address certain aspects of cyber risks, such insurance coverage may be insufficient to cover all losses or all types of claims that may arise in the event we experience a security breach.
Data protection laws may be interpreted and applied inconsistently from country to country, and often impose requirements that are inconsistent with one another. In addition, because various jurisdictions have different laws and regulations concerning the use, storage and transmission of such information, we may face complex and varied compliance requirements in existing markets as well as in new international markets that we seek to enter. Such laws and regulations, and the variation between jurisdictions, could subject us to elevated costs of security measures, liabilities or negative publicity that could adversely affect our business.
Regulatory scrutiny of privacy, data collection, use of data and data protection is intensifying globally, and the personal information and other data we collect, store, process and use is increasingly subject to legislation and regulations in numerous jurisdictions around the world, especially in Europe. These laws often develop in ways we cannot predict and may materially increase our cost of doing business, particularly as we expand the nature and types of products we offer. For example, the General Data Protection Regulation (the "GDPR"), which came into effect in the EU in May 2018 and superseded prior EU data protection legislation, imposes more stringent data protection requirements and provides for greater penalties for noncompliance. Further,
20
the United Kingdom has initiated the formal process to leave the EU, creating uncertainty with regard to the regulation of data protection in the United Kingdom. In particular, it is unclear whether the United Kingdom will enact data protection laws or regulations designed to be consistent with the GDPR and how data transfers to and from the United Kingdom will be regulated. Additionally, although we are making use of the EU Standard Contractual Clauses with regard to the transfer of certain personal data to countries outside the European Economic Area (the "EEA"), some regulatory uncertainty remains surrounding the future of data transfers from the EEA to the United States. Although we are closely monitoring regulatory developments in this area, any actual or perceived failure by us to comply with any regulatory requirements or orders or other domestic or international privacy or consumer protection-related laws and regulations could result in proceedings or actions against us by governmental entities or others (e.g., class action litigation), subject us to significant penalties and negative publicity, require us to change our business practices, increase our costs and adversely affect our business.
Data protection legislation is also becoming increasingly common in the United States at both the federal and state level. For example, in June 2018, the State of California enacted the California Consumer Privacy Act of 2018 (the "CCPA"), which will come into effect on January 1, 2020. The CCPA requires companies that process information on California residents to make new disclosures to consumers about their data collection, use and sharing practices, allows consumers to opt out of certain data sharing with third parties and provides a new cause of action for data breaches. However, legislators have stated that they intend to propose amendments to the CCPA, and it remains unclear what, if any, modifications will be made to the CCPA or how it will be interpreted. Additionally, the Federal Trade Commission and many state attorneys general are interpreting federal and state consumer protection laws to impose standards for the online collection, use, dissemination and security of data. The burdens imposed by the CCPA and other similar laws that may be enacted at the federal and state level may require us to modify our data processing practices and policies and to incur substantial expenditure in order to comply.
Further, we may be or become subject to data localization laws mandating that data collected in a foreign country be processed and stored only within that country. Russia adopted such a law in 2014, and it is expected that China will do so as well. If China or another country in which we have customers were to adopt a data localization law, we could be required to expand our data storage facilities there or build new ones in order to comply. The expenditure this would require, as well as costs of compliance generally, could harm our financial condition.
Our international operations are subject to increased business and economic risks that could impact our financial results.
We have operations outside the United States, and we expect to continue to expand our international presence, especially in Asia. In fiscal 2018, 51% of our revenue was generated outside the United States. This subjects us to a variety of risks inherent in doing business internationally, including:
• | fluctuations in currency exchange rates; |
• | political, social and/or economic instability; |
• | risks related to governmental regulations in foreign jurisdictions and unexpected changes in regulatory requirements and enforcement; |
• | higher levels of credit risk and payment fraud; |
• | burdens of complying with a variety of foreign laws; |
• | the cost of developing connected products for countries where Wi-Fi technology has been passed over in favor of more advanced cellular data networks; |
• | tariffs, trade barriers and duties; |
• | reduced protection for intellectual property rights in some countries; |
• | difficulties in staffing and managing global operations and the increased travel, infrastructure and legal compliance costs associated due to having multiple international locations; |
• | compliance with statutory equity requirements; |
• | management of tax consequences; |
21
• | protectionist laws and business practices that favor local businesses in some countries; |
• | imposition of currency exchange controls; |
• | greater fluctuations in sales to customers in developing countries, including longer payment cycles and greater difficulty collecting accounts receivable; and |
• | delays from customs brokers or government agencies. |
If we are unable to manage the complexity of our global operations successfully, or if the risks above become substantial for us, our financial performance and operating results could suffer. These factors may harm our results of operations. Also, any measures that we may implement to reduce risks of our international operations may not be effective, may increase our expenses and may require significant management time and effort. Entry into new international markets requires considerable management time and financial resources related to market, personnel and facilities development before any significant revenue is generated. As a result, initial operations in a new market may operate at low margins or may be unprofitable.
In particular, we have significant operations in China, where many of the risks listed above are particularly acute. Our business, financial condition and results of operations may be materially adversely affected by economic, political, legal, regulatory, competitive and other factors in China. The Chinese economy differs from the economies of most developed countries in many respects, including the level of government involvement and control over economic growth. In addition, our operations in China are governed by Chinese laws, rules and regulations, some of which are relatively new. The Chinese legal system continues to rapidly evolve, which may result in uncertainties with respect to the interpretation and enforcement of Chinese laws, rules and regulations that could have a material adverse effect on our business. China also experiences high turnover of direct labor due to the intensely competitive and fluid market for labor, and the retention of adequate labor may be a challenge for our operations in China. If our labor turnover rates are higher than we expect, or we otherwise fail to adequately manage our labor needs, then our business and results of operations could be adversely affected.
If significant tariffs or other restrictions are placed on Chinese imports or any related counter-measures are taken by China, our revenue and results of operations may be materially harmed.
If significant tariffs or other restrictions are placed on Chinese imports or any related counter-measures are taken by China, our revenue and results of operations may be materially harmed. In July 2018, the Trump Administration announced a list of thousands of categories of goods that currently face tariffs of 10% and will face tariffs of 25% beginning in January 2019. These tariffs currently affect our accessories products and we may be required to raise our prices on those products due to the tariffs, which may result in a loss of customers and harm our operating performance. If the existing tariffs are expanded or interpreted by a court or governmental agency to apply to any of our other products, we may be required to raise our prices on those products, which may further result in a loss of customers and harm our operating performance. Additionally, the Trump Administration continues to signal that it may further alter trade agreements and terms between China and the United States, including limiting trade with China, and may impose additional tariffs on imports from China. It is possible further tariffs will be imposed on imports of our products, or that our business will be impacted by retaliatory trade measures taken by China or other countries in response to existing or future tariffs, causing us to raise prices or make changes to our operations, any of which could materially harm our revenue or operating results. We may seek to shift production outside of China, resulting in significant costs and disruption to our operations as we would need to pursue the time-consuming processes of recreating a new supply chain, identifying substitute components and establishing new manufacturing locations.
We are susceptible to fluctuations in foreign currency exchange rates, which could result in declines in our reported revenue and operating results.
Our exposure to the effects of fluctuations in foreign currency exchange rates has grown with the continued expansion of our overseas operations, and primarily relates to non-U.S. dollar denominated sales and operating expenses worldwide. Unfavorable movement in currency exchange rates will adversely affect our results of operations and financial condition. While a significant percentage of our revenue is denominated in foreign currencies, the majority of our costs are denominated in U.S. dollars. This means that a strengthening of the U.S. dollar would adversely impact our reported financial results. The strengthening of foreign currencies may also increase our cost of product components denominated in those currencies, thus adversely affecting gross margin. Fluctuations in currency exchange rates may also make it more difficult to detect underlying trends in our business and results of operations. We may in the future engage in some hedging activities, such as the use of foreign currency forward and option contracts, to limit the risk of fluctuations in currency exchange rates. However, the use of such hedging activities may not offset any, or more than a portion, of the adverse financial effects of unfavorable movements in foreign exchange rates over the limited time the hedges are in place. Moreover, the use of hedging instruments may introduce additional risks if we are
22
unable to structure effective hedges with such instruments. In addition, a strengthening of the U.S. dollar may increase the cost of our products to our customers outside of the United States, which may also adversely affect our financial condition and results of operations.
Natural disasters, geopolitical unrest, war, terrorism, public health issues or other catastrophic events could disrupt the supply, delivery or demand of products, which could negatively affect our operations and performance.
We are subject to the risk of disruption by earthquakes, floods and other natural disasters, fire, power shortages, geopolitical unrest, war, terrorist attacks and other hostile acts, public health issues, epidemics or pandemics and other events beyond our control and the control of the third parties on which we depend. Any of these catastrophic events, whether in the United States or abroad, may have a strong negative impact on the global economy, us, our contract manufacturers or our suppliers or customers, and could decrease demand for our products, create delays and inefficiencies in our supply chain and make it difficult or impossible for us to deliver products to our customers. Further, our headquarters are located in Santa Barbara, California, in a seismically active region that is also prone to forest fires. Any catastrophic event that occurred near our headquarters, or near our manufacturing facilities in China, could impose significant damage to our ability to conduct our business and could require substantial recovery time, which could have an adverse effect on our business, operating results and financial condition.
We must comply with extensive regulatory requirements, and the cost of such compliance, and any failure to comply, may adversely affect our business, financial condition and results of operations.
In our current business and as we expand into new markets and product categories, we must comply with a wide variety of laws, regulations, standards and other requirements governing, among other things, electrical safety, wireless emissions, health and safety, e-commerce, consumer protection, export and import requirements, hazardous materials usage, product-related energy consumption, packaging, recycling and environmental matters. Compliance with these laws, regulations, standards and other requirements may be onerous and expensive, and they may be inconsistent from jurisdiction to jurisdiction, further increasing the cost of compliance and doing business. Our products may require regulatory approvals or satisfaction of other regulatory concerns in the various jurisdictions in which they are manufactured, sold or both. These requirements create procurement and design challenges that require us to incur additional costs identifying suppliers and manufacturers who can obtain and produce compliant materials, parts and products. Failure to comply with such requirements can subject us to liability, additional costs and reputational harm and, in extreme cases, force us to recall products or prevent us from selling our products in certain jurisdictions. If there is a new regulation, or change to an existing regulation, that significantly increases our costs of manufacturing or causes us to significantly alter the way that we manufacture our products, this would have a material adverse effect on our business, financial condition and results of operations. Additionally, while we have implemented policies and procedures designed to ensure compliance with applicable laws and regulations, there can be no assurance that our employees, contractors and agents will not violate such laws and regulations or our policies and procedures.
We are subject to the Foreign Corrupt Practices Act (the "FCPA"), and our failure to comply with the laws and regulations there under could result in penalties which could harm our reputation, business and financial condition.
Due to our international operations, we are subject to the FCPA, which generally prohibits companies and their intermediaries from making improper payments to foreign officials for the purpose of obtaining or keeping business. The FCPA also requires companies to maintain adequate recordkeeping and internal accounting practices to accurately reflect our transactions. Under the FCPA, U.S. companies may be held liable for actions taken by their strategic or local partners or representatives. The FCPA and similar laws in other countries can impose civil and criminal penalties for violations. If we do not properly implement practices and controls with respect to compliance with the FCPA and similar laws, or if we fail to enforce those practices and controls properly, we may be subject to regulatory sanctions, including administrative costs related to governmental and internal investigations, civil and criminal penalties, injunctions and restrictions on our business activities, all of which could harm our reputation, business and financial condition.
Our corporate tax rate may increase, we may incur additional income tax liabilities and we may incur costs in complying with changing tax laws in the United States and abroad, which could adversely impact our cash flow, financial condition and results of operations.
We are a U.S.-based company subject to taxes in multiple U.S. and foreign tax jurisdictions. Our profits, cash flow and effective tax rate could be adversely affected by changes in the tax rules and regulations in the jurisdictions in which we do business, unanticipated changes in statutory tax rates and changes to our global mix of earnings. As we expand our operations, any changes in the U.S. or foreign taxation of such operations may increase our worldwide effective tax rate. In 2017, the Tax Cuts and Jobs Act (the "Tax Act") implemented a wide variety of changes to the U.S. tax system, including a number of changes at the corporate level discussed in this Annual Report on Form 10-K. Several of the new provisions of the Tax Act require
23
clarification and guidance from the Internal Revenue Service (the "IRS") and the Treasury Department. These or other changes in U.S. tax law could impact our profits, cash flow and effective tax rate.
We are also subject to examination by the IRS and other tax authorities, including state revenue agencies and foreign governments. If any tax authority disagrees with any position we have taken, our tax liabilities and operating results may be adversely affected. While we regularly assess the likelihood of favorable or unfavorable outcomes resulting from examinations by the IRS and other tax authorities to determine the adequacy of our provision for income taxes, there can be no assurance that the actual outcome resulting from these examinations will not materially adversely affect our financial condition and results of operations. In addition, the distribution of our products subjects us to numerous complex and often-changing customs regulations. Failure to comply with these systems and regulations could result in the assessment of additional taxes, duties, interest and penalties. While we believe we are in compliance with local laws, there is no assurance that tax and customs authorities agree with our reporting positions and upon audit may assess us additional taxes, duties, interest and penalties. If this occurs and we cannot successfully defend our position, our profitability will be reduced.
Our ability to use our net operating loss carryforwards and certain other tax attributes may be limited.
As of September 29, 2018, we had gross U.S. federal net operating loss carryforwards of $74.7 million, which expire beginning in 2033, and gross state net operating loss carryforwards of $45.9 million, which expire beginning in 2020, as well as $21.9 million in foreign net operating loss carryforwards, of which $2.7 million have an indefinite life and $19.2 million that will expire in 2027. Also, as of September 29, 2018, we had U.S. federal and state research and development tax credit carryforwards of $25.4 million and $19.1 million. The federal research credits will begin to expire in the year 2025 and the state research credits will begin to expire in 2024. It is possible that we will not generate taxable income in time to use our net operating loss carryforwards before their expiration or at all. Under Sections 382 and 383 of the Internal Revenue Code of 1986, as amended (the "Code"), if a corporation undergoes an "ownership change," the corporation’s ability to use its pre-change net operating loss carryforwards and other pre-change attributes, such as research tax credits, to offset its post-change income may be limited. In general, an "ownership change" will occur if there is a cumulative change in our ownership by "5-percent shareholders" that exceeds 50 percentage points over a rolling three-year period. Similar rules may apply under state tax laws. As a result, our net operating losses generated through July 18, 2012 may be subject to limitation under Section 382 of the Code. The amount of pre-change loss carryforward which may be subject to this limitation is $46.8 million. Our ability to use net operating loss carry forwards and other tax attributes to reduce future taxable income and liabilities may be subject to limitations based on the ownership change of 2012. We have substantially completed an updated Section 382 study through August 31, 2018, and the preliminary results of this study show no ownership change within the meaning of Section 382 of the Code had occurred from the previously identified ownership change on July 18, 2012 through August 31, 2018.
We may need additional capital, and we cannot be certain that additional financing will be available.
Our operations have been financed primarily through cash flow from operating activities, borrowings under our credit facilities and net proceeds from the sale of our equity securities. We may require additional equity or debt financing to fund our operations and capital expenditures. Our ability to obtain financing will depend, among other things, on our development efforts, business plans, operating performance and condition of the capital markets at the time we seek financing. We cannot assure you that additional financing will be available to us on favorable terms if and when required, or at all.
We may acquire other businesses or receive offers to be acquired, which could require significant management attention, disrupt our business, dilute stockholder value and adversely affect our operating results.
As part of our business strategy, we may make investments in complementary businesses, products, services or technologies. We have not made any material acquisitions to date and, as a result, our ability as an organization to successfully acquire and integrate other companies, products, services or technologies is unproven. We may not be able to find suitable acquisition candidates and we may not be able to complete acquisitions on favorable terms, if at all. If we do complete acquisitions, we may not ultimately strengthen our competitive position or achieve our goals, and any acquisitions we complete could be viewed negatively by customers or investors. In addition, if we fail to integrate successfully such acquisitions, or the technologies associated with such acquisitions, into our company, the revenue and operating results of the combined company could be adversely affected. Any integration process will require significant time and resources, and we may not be able to manage the process successfully. We may not successfully evaluate or utilize the acquired technology and accurately forecast the financial impact of an acquisition transaction, including accounting charges. We may have to pay cash, incur debt or issue equity securities to pay for any such acquisition, each of which could affect our financial condition or the value of our capital stock. The sale of equity or issuance of debt to finance any such acquisitions could result in dilution to our stockholders. The incurrence of indebtedness would result in increased fixed obligations and could also include covenants or other restrictions that would impede our ability to manage our operations. Additionally, we may receive indications of interest from other parties interested in acquiring
24
some or all of our business. The time required to evaluate such indications of interest could require significant attention from management, disrupt the ordinary functioning of our business and adversely affect our operating results.
We will need to improve our financial and operational systems in order to manage our growth effectively and support our increasingly complex business arrangements, and an inability to do so could harm our business and results of operations.
To manage our growth and our increasingly complex business operations, especially as we move into new markets internationally, we will need to upgrade our operational and financial systems and procedures, improve the coordination between our various corporate functions and expand, train and manage our workforce adequately. Our efforts to manage the expansion of our operations may place a significant strain on our management personnel, systems and resources, particularly given the limited amount of financial resources and skilled employees that may be available at the time. When implementing new or changing existing processes, we may encounter transitional issues and incur substantial additional expenses. We cannot be certain that we will institute, in a timely manner or at all, the improvements to our managerial, operational and financial systems and procedures necessary to support our anticipated increased levels of operations. Delays or problems associated with any improvement or expansion of our operational and financial systems could adversely affect our relationships with our suppliers, manufacturers, resellers and customers, harm to our reputation and result in errors in our financial and other reporting, any of which could harm our business and operating results. We may not be able to manage our growth effectively, and as a result may not be able to take advantage of market opportunities, execute on expansion strategies or meet the demands of our customers. In particular, we anticipate that our legacy enterprise resource management system will need to be replaced in the near to intermediate term in order to accommodate our expanding operations. Such transitions can prove difficult and time consuming which can adversely impact our business and ability to timely prepare our external financial reports.
We have identified material weaknesses in our internal control over financial reporting and, if our remediation of these material weaknesses is not effective, or if we fail to maintain an effective system of internal control over financial reporting in the future, we may not be able to accurately or timely report our financial condition or results of operations, which may adversely affect investor confidence and the price of our common stock.
As a public company, we will be required to maintain internal control over financial reporting and to evaluate and determine the effectiveness of our internal control over financial reporting. Beginning with our second annual report on Form 10-K following our IPO, we will be required to provide a management report on internal control over financial reporting, as well as an attestation on our internal control over financial reporting from our independent registered public accounting firm.
During 2017, we identified material weaknesses in our internal control over financial reporting. A material weakness is a deficiency, or combination of deficiencies, in internal control over financial reporting such that there is a reasonable possibility that a material misstatement of our annual or interim financial statements will not be prevented or detected on a timely basis. We identified a material weakness related to an insufficient complement of experienced personnel with the requisite technical knowledge of financial statement disclosures and accounting for non-routine, unusual or complex events and transactions. This material weakness in our control environment contributed to an additional material weakness in that we did not maintain effective internal controls to address the accounting of non-routine, unusual or complex events and transactions and the related financial statement presentation of such transactions.
We are taking steps to address these control issues, including the following:
• | hiring of experienced additional accounting and financial reporting personnel; and |
• | creation of additional controls including those designed to strengthen our review processes around financial statement disclosures and accounting for non-routine, unusual or complex transactions. |
While we believe that these efforts will improve our internal control over financial reporting, the implementation of these measures is ongoing and will require validation and testing of the design and operating effectiveness of internal controls over a sustained period of financial reporting cycles.
We cannot assure you that the measures we have taken to date, and that we are continuing to implement, will be sufficient to remediate the material weaknesses we have identified or avoid the identification of additional material weaknesses in the future. If the steps we take do not remediate the material weaknesses in a timely manner, there could continue to be a reasonable possibility that these control deficiencies or others could result in a material misstatement of our annual or interim consolidated financial statements that would not be prevented or detected on a timely basis.
The process of designing and implementing internal control over financial reporting required to comply with the disclosure and attestation requirements of Section 404 of the Sarbanes-Oxley Act of 2002 ("Section 404") will be time consuming and
25
costly. If during the evaluation and testing process, we identify additional material weaknesses in our internal control over financial reporting or determine that existing material weaknesses have not been remediated, our management will be unable to assert that our internal control over financial reporting is effective. Even if our management concludes that our internal control over financial reporting is effective, our independent registered public accounting firm may conclude that there are material weaknesses with respect to our internal control over financial reporting. If we are unable to assert that our internal control over financial reporting is effective, or when required in the future, if our independent registered public accounting firm is unable to express an unqualified opinion as to the effectiveness of our internal control over financial reporting, investors may lose confidence in the accuracy and completeness of our financial reports, the market price of our common stock could be adversely affected and we could become subject to litigation or investigations by the stock exchange on which our securities are listed, the Securities and Exchange Commission (the "SEC") or other regulatory authorities, which could require additional financial and management resources.
Our reported financial results may be adversely affected by changes in accounting principles generally accepted in the United States.
Generally accepted accounting principles in the United States are subject to interpretation by the Financial Accounting Standards Board, the American Institute of Certified Public Accountants, the SEC and various bodies formed to promulgate and interpret appropriate accounting principles. A change in these principles or interpretations could have a significant effect on our reported financial results, and could affect the reporting of transactions completed before the announcement of a change.
Risks related to ownership of our common stock
The stock price of our common stock has been and may continue to be volatile or may decline regardless of our operating performance.
The market price of our common stock has been and may continue to be volatile. Since shares of our common stock were sold in our IPO in August 2018 at a price of $15.00 per share, the closing price of our common stock has ranged from $11.61 to $21.69 through November 26, 2018. In addition to factors discussed in this Annual Report on Form 10-K, the market price of our common stock may fluctuate significantly in response to numerous factors in addition to the ones described in the preceding Risk Factors, many of which are beyond our control, including:
• | overall performance of the equity markets and the economy as a whole; |
• | changes in the financial projections we may provide to the public or our failure to meet these projections; |
• | actual or anticipated changes in our growth rate relative to that of our competitors; |
• | announcements of new products, or of acquisitions, strategic partnerships, joint ventures or capital- raising activities or commitments, by us or by our competitors; |
• | additions or departures of key personnel; |
• | failure of securities analysts to initiate or maintain coverage of us, changes in financial estimates by any securities analysts who follow our company or our failure to meet these estimates or the expectations of investors; |
• | rumors and market speculation involving us or other companies in our industry; |
• | the expiration of contractual lock-up or market standoff agreements; and |
• | sales of shares of our common stock by us or our stockholders. |
In addition, the stock market with respect to newly public companies, particularly companies in the technology industry, have experienced significant price and volume fluctuations that have affected and continue to affect the market prices of stock prices of these companies. In the past, stockholders have instituted securities class action litigation following periods of market volatility. If we were to become involved in securities litigation, it could subject us to substantial costs, divert resources and the attention of management from our business and adversely affect our business.
26
Our business and financial performance may differ from any projections that we disclose or any information that may be attributed to us by third parties.
From time to time, we may provide guidance via public disclosures regarding our projected business or financial performance. However, any such projections involve risks, assumptions and uncertainties and our actual results could differ materially from such projections. Factors that could cause or contribute to such differences include, but are not limited to, those identified in these Risk Factors, some or all of which are not predictable or within our control. Other unknown or unpredictable factors also could adversely impact our performance, and we undertake no obligation to update or revise any projections, whether as a result of new information, future events or otherwise. In addition, various news sources, bloggers and other publishers often make statements regarding our historical or projected business or financial performance, and you should not rely on any such information even if it is attributed directly or indirectly to us.
Our stock price and trading volume could decline if securities or industry analysts do not publish about our business, or if they publish unfavorable research.
Equity research analysts do not currently provide coverage of our common stock, and we cannot assure that any equity research analysts will adequately provide research coverage of our common stock. A lack of adequate research coverage may harm the liquidity and market price of our common stock. To the extent equity research analysts do provide research coverage of our common stock, we will not have any control over the content and opinions included in their reports. The price of our common stock could decline if one or more equity research analysts downgrade our stock or publish other unfavorable commentary or research. If one or more equity research analysts cease coverage of our company, or fail to regularly publish reports on us, the demand for our common stock could decrease, which in turn could cause our stock price or trading volume to decline.
Sales of a substantial amount of our common stock in the public market, particularly sales by our directors, executive officers and significant stockholders, or the perception that these sales could occur, could cause the market price of our common stock to decline.
Sales of a substantial number of shares of our common stock in the public market, particularly sales by our directors, executive officers and principal stockholders, or the perception that these sales might occur, could cause the market price of our common stock to decline. The 15,972,221 shares of our common stock sold in our IPO are freely tradable in the public market without restrictions or further registration except for any shares held by our affiliates, as defined in Rule 144 under the Securities Act of 1933, as amended (the “Securities Act”). With respect to the remaining shares, our directors, executive officers and the holders of substantially all of our common stock outstanding prior to our IPO have entered into lock-up agreements or market standoff provisions in agreements with us that, for a period of at least 180 days from the date of our IPO and subject to certain exceptions, prohibit them from offering for sale, selling, contracting to sell, granting any option for the sale of, transferring or otherwise disposing of any shares of our common stock and of any securities convertible into or exercisable for our common stock, without the prior written consent of the underwriters in our IPO or us, as the case may be. Shares held by directors, executive officers, and other affiliates will also be subject to volume limitations under Rule 144 under the Securities Act and various vesting agreements. In addition, pursuant to the terms of the lock-up agreements, a total of 182,000 shares of our common stock, including shares held by one of our executive officers, became available for sale in the public market beginning on October 31, 2018 upon the exercise of stock options that would have otherwise expired pursuant to their terms prior to 181 days after the date of our IPO.
When the applicable lock-up and market standoff periods described above expire, we and our securityholders subject to a lock-up agreement or market standoff agreement will be able to sell shares of our common stock in the public market. In addition, the underwriters may, in their discretion, permit our securityholders to sell shares prior to the expiration of the restrictive provisions contained in the lock-up agreements. Sales of a substantial number of such shares upon expiration of the lock-up and market standoff agreements, the perception that such sales may occur or early release of these agreements could cause our market price to fall or make it more difficult for you to sell your common stock at a time and price that you deem appropriate.
In addition, we have filed a registration statement to register shares reserved for future issuance under our equity compensation plans. Subject to the satisfaction of applicable vesting requirements and expiration of the market standoff agreements and lock-up agreements referred to above, the shares issued upon exercise of outstanding stock options will be available for immediate resale in the United States in the open market.
Moreover, certain holders of our common stock have rights, subject to some conditions, to require us to file registration statements for the public resale of such shares or to include such shares in registration statements that we may file for us or other stockholders.
27
We may also issue our shares of common stock or securities convertible into shares of our common stock from time to time in connection with a financing, acquisition, investments or otherwise. We also grant equity awards to employees, directors and consultants under our 2018 Equity Incentive Plan and rights to purchase our common stock under our 2018 Employee Stock Purchase Plan, the latter of which will become effective at a future date upon determination by the compensation committee of our board of directors (the "Board"). Any such issuances could result in substantial dilution to our existing stockholders and cause the market price of our common stock to decline.
We do not intend to pay dividends for the foreseeable future.
We have never declared or paid any cash dividends on our common stock, and we do not intend to pay any cash dividends in the foreseeable future. We anticipate that we will retain all of our future earnings for use in the development of our business and for general corporate purposes. Any determination to pay dividends in the future will be at the discretion of the Board. Accordingly, investors must rely on sales of their common stock after price appreciation, which may never occur, as the only way to realize any future gains on their investments. In addition, the terms of our credit facilities contain restrictions on our ability to declare and pay cash dividends on our capital stock.
Additional stock issuances could result in significant dilution to our stockholders.
Additional issuances of our capital stock will result in dilution to our existing stockholders. Also, to the extent outstanding options to purchase our capital stock are exercised, there will be further dilution. The amount of dilution could be substantial depending upon the size of the issuance or exercise.
Certain provisions in our corporate charter documents and under Delaware law may prevent or hinder attempts by our stockholders to change our management or to acquire a controlling interest in us, and the market price of our common stock may be lower as a result.
There are provisions in our restated certificate of incorporation and restated bylaws that may make it difficult for a third party to acquire, or attempt to acquire, control of our company, even if a change in control were considered favorable by our stockholders. These anti-takeover provisions include:
• | a classified Board so that not all members of the Board are elected at one time; |
• | the ability of the Board to determine the number of directors and to fill any vacancies and newly created directorships; |
• | a requirement that our directors may only be removed for cause; |
• | a prohibition on cumulative voting for directors; |
• | the requirement of a super-majority to amend some provisions in our restated certificate of incorporation and restated bylaws; |
• | authorization of the issuance of "blank check" preferred stock that the Board could use to implement a stockholder rights plan; |
• | an inability of our stockholders to call special meetings of stockholders; and |
• | a prohibition on stockholder actions by written consent, thereby requiring that all stockholder actions be taken at a meeting of our stockholders. |
Moreover, because we are incorporated in Delaware, we are governed by the provisions of Section 203 of the Delaware General Corporation Law, which prohibit a person who owns 15% or more of our outstanding voting stock from merging or combining with us for a three-year period beginning on the date of the transaction in which the person acquired in excess of 15% of our outstanding voting stock, unless the merger or combination is approved in a prescribed manner. Any provision in our restated certificate of incorporation, our restated bylaws or Delaware law that has the effect of delaying or deterring a change in control could limit the opportunity for our stockholders to receive a premium for their shares of our common stock, and could also affect the price that some investors are willing to pay for our common stock.
Item 1B. Unresolved staff comments
28
None.
Item 2. Properties
We currently lease 33,280 square feet of office space for our current corporate headquarters in Santa Barbara, California under a lease agreement that expires in 2019, and we have the option to renew this lease for an additional five years. We have 98,555 square feet of additional office space in Santa Barbara under leases that expire at varying times through 2025. We also lease 169,465 square feet of office space in Boston, Massachusetts. We lease additional U.S. offices and facilities in New York City and Seattle. We also have international offices and facilities in Australia, China, Denmark, France, Germany, the Netherlands, Sweden and the United Kingdom under leases that expire at varying times through 2025.
We believe that our facilities are sufficient for our current needs. We intend to add new facilities or expand existing facilities in certain locations as we add staff or expand our geographic markets, and we believe that suitable additional space will be available as needed to accommodate any such expansion of our organization.
Item 3. Legal proceedings
From time to time, we may become involved in legal proceedings or be subject to claims arising in the ordinary course of our business. We are not presently a party to any legal proceedings that in the opinion of our management, if determined adversely to us, would individually or taken together have a material adverse effect on our business, operating results, financial condition or cash flows.
Further information with respect to this item may be found in Note 11 to the Consolidated Financial Statements in Item 8, which is incorporated herein by reference.
Item 4. Mine safety disclosures
None.
29
PART II
Item 5. Market for registrant’s common equity, related stockholder matters and issuer purchases of equity securities
Holders of record
As of November 16, 2018, there were 521 holders of record of our common stock. This figure does not include a substantially greater number of beneficial holders of our common stock whose shares are held of record by banks, brokers and other financial institutions.
Dividend policy
We have never declared or paid any cash dividends on our capital stock, and we do not currently intend to pay any cash dividends for the foreseeable future. We expect to retain future earnings, if any, to fund the development and growth of our business. Any future determination to pay dividends on our common stock will be made at the discretion of the Board and will depend upon, among other factors, our financial condition, operating results, current and anticipated cash needs, plans for expansion and other factors that the Board may deem relevant. In addition, the terms of our credit facilities contain restrictions on our ability to declare and pay cash dividends on our capital stock.
Sale of unregistered securities and use of proceeds
Recent sales of unregistered securities
None.
Use of proceeds from registered securities
In August 2018, we closed our IPO, in which we sold 6,388,888 shares of our common stock at our IPO price of $15.00 per share, including 833,333 shares pursuant to the underwriters' over-allotment option, and selling stockholders sold 9,583,333 shares of our common stock, including 1,250,000 shares pursuant to the underwriters' over-allotment option. The offer and sale of all of the shares in our IPO were registered under the Securities Act pursuant to a registration statement on Form S-1 (File No. 333-226076), which was declared effective by the SEC on August 1, 2018. We raised aggregate net proceeds of $90.6 million from our IPO, after deducting underwriting discounts and commissions of $5.3 million. Additionally, offering costs incurred by us totaled $4.6 million. There has been no material change in the planned use of proceeds from our IPO as described in the prospectus filed pursuant to Rule 424(b) under the Securities Act with the SEC on August 2, 2018. The managing underwriters of our IPO were Morgan Stanley & Co. LLC and Goldman Sachs & Co. LLC. No payments were made by us to directors, officers or persons owning 10% or more of our common stock or to their associates, or to our affiliates, other than payments in the ordinary course of business to officers for salaries and to non-employee directors pursuant to our director compensation policy.
30
Stock performance graph
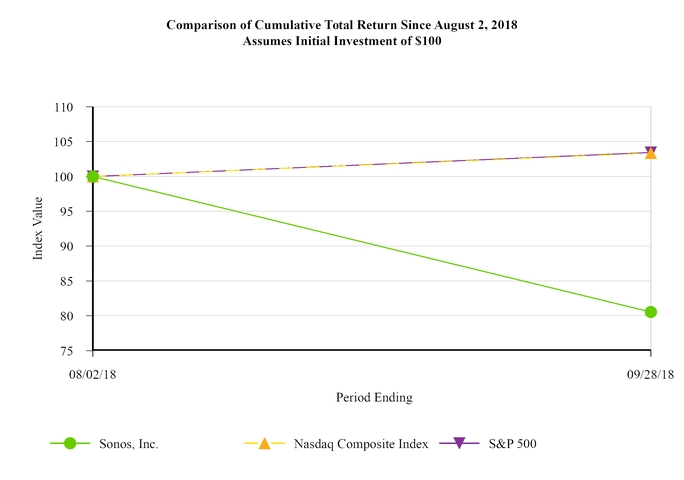
August 2, 2018 | September 28, 2018 | ||||||
Sonos, Inc. | $ | 100.00 | $ | 80.56 | |||
Nasdaq composite index | $ | 100.00 | $ | 103.34 | |||
S&P 500 | $ | 100.00 | $ | 103.43 | |||
31
Item 6. Selected consolidated financial and other data
The selected consolidated financial data below should be read in conjunction with the Item 7, "Management’s Discussion and Analysis of Financial Condition and Results of Operations," and our consolidated financial statements and related notes included in Item 8, "Financial Statements and Supplementary Data," of this Annual Report on Form 10-K.
The consolidated statements of operations data for the years ended September 29, 2018, September 30, 2017 and October 1, 2016, and the consolidated balance sheet data as of September 29, 2018 and September 30, 2017 are derived from our audited consolidated financial statements appearing in Item 8, "Financial Statements and Supplementary Data," of this Annual Report on Form 10-K. The consolidated statement of operations data for the year ended October 3, 2015 and the consolidated balance sheet data as of October 1, 2016 are derived from audited consolidated financial statements not included in this Annual Report on Form 10-K. The consolidated statement of operations data for the year ended September 27, 2014 and the consolidated balance sheet data as of September 27, 2014 and October 3, 2015 are derived from unaudited consolidated financial statements not included in this Annual Report on Form 10-K. Our unaudited consolidated annual financial statements were prepared in accordance with U.S. GAAP on the same basis as our audited consolidated financial statements and include, in the opinion of management, all adjustments, consisting of normal recurring adjustments, that are necessary for the fair statement of the financial information set forth in those financial statements. Our historical results are not necessarily indicative of the results that may be expected in any future period.
Fiscal Year Ended | |||||||||||||||||||
September 29, 2018 | September 30, 2017 | October 1, 2016 | October 3, 2015 | September 27, 2014 | |||||||||||||||
(In thousands, except share and per share amounts and percentages) | |||||||||||||||||||
Revenue | $ | 1,137,008 | $ | 992,526 | $ | 901,284 | $ | 843,524 | $ | 774,512 | |||||||||
Cost of revenue (1) | 647,700 | 536,461 | 497,885 | 461,387 | 425,191 | ||||||||||||||
Gross profit | 489,308 | 456,065 | 403,399 | 382,137 | 349,321 | ||||||||||||||
Operating expenses | |||||||||||||||||||
Research and development (1) | 142,109 | 124,394 | 107,729 | 100,653 | 70,623 | ||||||||||||||
Sales and marketing (1) | 270,869 | 270,162 | 258,012 | 272,427 | 204,847 | ||||||||||||||
General and administrative (1) | 85,205 | 77,118 | 68,531 | 64,805 | 46,911 | ||||||||||||||
Total operating expenses | 498,183 | 471,674 | 434,272 | 437,885 | 322,381 | ||||||||||||||
Operating income (loss) | (8,875 | ) | (15,609 | ) | (30,873 | ) | (55,748 | ) | 26,940 | ||||||||||
Other income (expense), net | |||||||||||||||||||
Interest expense, net | (4,511 | ) | (4,260 | ) | (2,489 | ) | (156 | ) | (75 | ) | |||||||||
Other income (expense), net | (1,162 | ) | 3,361 | (2,208 | ) | (9,631 | ) | (3,556 | ) | ||||||||||
Total other expense, net | (5,673 | ) | (899 | ) | (4,697 | ) | (9,787 | ) | (3,631 | ) | |||||||||
Income (loss) before provision for (benefit from) income taxes | (14,548 | ) | (16,508 | ) | (35,570 | ) | (65,535 | ) | 23,309 | ||||||||||
Provision for (benefit from) income taxes | 1,056 | (2,291 | ) | 2,644 | 3,242 | 1,448 | |||||||||||||
Net income (loss) | $ | (15,604 | ) | $ | (14,217 | ) | $ | (38,214 | ) | $ | (68,777 | ) | $ | 21,861 | |||||
Net income (loss) attributable to common stockholders (2) | |||||||||||||||||||
Basic | $ | (0.24 | ) | $ | (0.25 | ) | $ | (0.71 | ) | $ | (1.34 | ) | $ | 0.19 | |||||
Diluted | $ | (0.24 | ) | $ | (0.25 | ) | $ | (0.71 | ) | $ | (1.34 | ) | $ | 0.15 | |||||
Weighted-average shares used in computing net income (loss) per share attributable to common stockholders, basic (2) | 65,706,215 | 56,314,546 | 53,873,051 | 51,253,161 | 44,456,427 | ||||||||||||||
Weighted-average shares used in computing net income (loss) per share attributable to common stockholders, diluted (2) | 65,706,215 | 56,314,546 | 53,873,051 | 51,253,161 | 62,996,130 | ||||||||||||||
Other Data: | |||||||||||||||||||
Products sold | 5,078 | 3,935 | 3,514 | 3,401 | 2,938 | ||||||||||||||
Adjusted EBITDA (3) | $ | 69,128 | $ | 55,955 | $ | 29,413 | $ | (4,613 | ) | $ | 56,818 | ||||||||
Adjusted EBITDA margin (3) | 6.1 | % | 5.6 | % | 3.3 | % | (0.5 | )% | 7.3 | % | |||||||||
32
(1) | Stock-based compensation was allocated as follows: |
Fiscal Year Ended | |||||||||||||||||||
September 29, 2018 | September 30, 2017 | October 1, 2016 | October 3, 2015 | September 27, 2014 | |||||||||||||||
(In thousands) | |||||||||||||||||||
Cost of revenue | $ | 198 | $ | 240 | $ | 211 | $ | 236 | $ | 143 | |||||||||
Research and development | 13,960 | 13,605 | 8,260 | 8,186 | 5,984 | ||||||||||||||
Sales and marketing | 15,885 | 15,086 | 11,742 | 9,791 | 5,180 | ||||||||||||||
General and administrative | 8,602 | 7,619 | 5,750 | 5,064 | 3,471 | ||||||||||||||
Total stock-based compensation expense | $ | 38,645 | $ | 36,550 | $ | 25,963 | $ | 23,277 | $ | 14,778 | |||||||||
(2) | See Note 10 of the notes to our consolidated financial statements included elsewhere in this Annual Report on Form 10-K for an explanation of the calculations of our net income (loss) per share attributable to common stockholders, basic and diluted. |
(3) | Adjusted EBITDA and adjusted EBITDA margin are financial measures that are not calculated in accordance with U.S. generally accepted accounting principles ("U.S. GAAP"). See the section titled "—Non-GAAP Financial Measures" below for information regarding our use of these non-GAAP financial measures and a reconciliation of net income (loss) to adjusted EBITDA. |
As of | |||||||||||||||||||
September 29, 2018 | September 30, 2017 | October 1, 2016 | October 3, 2015 | September 27, 2014 | |||||||||||||||
(In thousands) | |||||||||||||||||||
Consolidated balance sheet data: | |||||||||||||||||||
Cash and cash equivalents | $ | 220,930 | $ | 130,595 | $ | 74,913 | $ | 76,352 | $ | 70,613 | |||||||||
Working capital | 201,243 | 78,203 | 31,866 | 27,057 | 69,839 | ||||||||||||||
Total assets | 587,498 | 400,020 | 278,879 | 278,970 | 210,967 | ||||||||||||||
Total long-term debt | 33,097 | 39,600 | 24,501 | 20,000 | — | ||||||||||||||
Total liabilities | 379,140 | 309,652 | 217,326 | 210,192 | 114,475 | ||||||||||||||
Redeemable convertible preferred stock | — | 90,341 | 90,341 | 88,637 | 88,682 | ||||||||||||||
Accumulated deficit | (203,611 | ) | (188,007 | ) | (173,790 | ) | (135,576 | ) | (66,799 | ) | |||||||||
Total stockholders’ equity (deficit) | 208,358 | 27 | (28,788 | ) | (19,859 | ) | 7,810 | ||||||||||||
Non-GAAP financial measures
To supplement our consolidated financial statements presented in accordance with U.S. GAAP, we monitor and consider adjusted EBITDA and adjusted EBITDA margin, which are non-GAAP financial measures. These non-GAAP financial measures are not based on any standardized methodology prescribed by U.S. GAAP and are not necessarily comparable to similarly titled measures presented by other companies.
We define adjusted EBITDA as net income (loss) adjusted to exclude the impact of depreciation, stock-based compensation expense, interest expense, net, other income (expense), net and provision for (benefit from) income taxes. We define adjusted EBITDA margin as adjusted EBITDA divided by revenue.
We use these non-GAAP financial measures to evaluate our operating performance and trends and make planning decisions. We believe that these non-GAAP financial measures help identify underlying trends in our business that could otherwise be masked by the effect of the expenses and other items that we exclude in these non-GAAP financial measures. Accordingly, we believe that these non-GAAP financial measures provide useful information to investors and others in understanding and
33
evaluating our operating results, enhancing the overall understanding of our past performance and future prospects, and allowing for greater transparency with respect to a key financial metric used by our management in its financial and operational decision-making.
Adjusted EBITDA and adjusted EBITDA margin are non-GAAP financial measures, and should not be considered in isolation of, or as an alternative to, measures prepared in accordance with U.S. GAAP. There are a number of limitations related to the use of adjusted EBITDA rather than net income (loss), which is the nearest U.S. GAAP equivalent of adjusted EBITDA, and the use of adjusted EBITDA margin rather than operating margin, which is the nearest U.S. GAAP equivalent of adjusted EBITDA margin. Some of these limitations are:
• | these non-GAAP financial measures exclude depreciation and, although these are non-cash expenses, the assets being depreciated may be replaced in the future; |
• | these non-GAAP financial measures exclude stock-based compensation expense, which has been, and will continue to be, a significant recurring expense for our business and an important part of our compensation strategy; |
• | these non-GAAP financial measures do not reflect interest expense, or the cash requirements necessary to service interest or principal payments on our debt, which reduces cash available to us; |
• | these non-GAAP financial measures do not reflect the effect of foreign currency exchange gains or losses, which is included in other income (expense), net; |
• | these non-GAAP financial measures do not reflect income tax payments that reduce cash available to us; and |
• | the expenses and other items that we exclude in our calculation of these non-GAAP financial measures may differ from the expenses and other items, if any, that other companies may exclude from these non-GAAP financial measures when they report their operating results. |
Because of these limitations, these non-GAAP financial measures should be considered along with other operating and financial performance measures presented in accordance with U.S. GAAP.
The following table presents a reconciliation of net income (loss) to adjusted EBITDA:
Fiscal Year Ended | |||||||||||||||||||
September 29, 2018 | September 30, 2017 | October 1, 2016 | October 3, 2015 | September 27, 2014 | |||||||||||||||
(In thousands, except percentages) | |||||||||||||||||||
Net income (loss) | $ | (15,604 | ) | $ | (14,217 | ) | $ | (38,214 | ) | $ | (68,777 | ) | $ | 21,861 | |||||
Depreciation | 39,358 | 35,014 | 34,323 | 27,858 | 15,100 | ||||||||||||||
Stock-based compensation expense | 38,645 | 36,550 | 25,963 | 23,277 | 14,778 | ||||||||||||||
Interest expense, net | 4,511 | 4,260 | 2,489 | 156 | 75 | ||||||||||||||
Other (income) expense, net | 1,162 | (3,361 | ) | 2,208 | 9,631 | 3,556 | |||||||||||||
Provision for (benefit from) income taxes | 1,056 | (2,291 | ) | 2,644 | 3,242 | 1,448 | |||||||||||||
Adjusted EBITDA | $ | 69,128 | $ | 55,955 | $ | 29,413 | $ | (4,613 | ) | $ | 56,818 | ||||||||
Revenue | $ | 1,137,008 | $ | 992,526 | $ | 901,284 | $ | 843,524 | $ | 774,512 | |||||||||
Adjusted EBITDA margin | 6.1 | % | 5.6 | % | 3.3 | % | (0.5 | )% | 7.3 | % | |||||||||
34
Item 7. Management’s discussion and analysis of financial condition and results of operations
You should read the following discussion of our financial condition and results of operations in conjunction with the financial statements and the notes thereto included elsewhere in this Annual Report on Form 10-K. The following discussion contains forward-looking statements that reflect our plans, estimates and beliefs. Our actual results could differ materially from those discussed in the forward-looking statements. Factors that could cause or contribute to these differences include those discussed below and elsewhere in this Annual Report on Form 10-K, particularly in the section titled "Risk Factors." We have a 4-4-5 fiscal year ending on the Saturday nearest September 30 each year. Our fiscal year is divided into four quarters, each beginning on a Sunday and containing two 4-week months followed by a 5-week "month." References to fiscal 2018 are to our fiscal year ended September 29, 2018, references to fiscal 2017 are to our fiscal year ended September 30, 2017 and references to fiscal 2016 are to our fiscal year ended October 1, 2016.
Overview
Sonos was founded with a clear mission—to fill every home with music. This mission led us to invent wireless multi-room home audio. Sonos transforms the way people live and interact by restoring the shared experience of music throughout the home. Our sound system provides an immersive listening experience created by our thoughtfully designed speakers and components, our proprietary software platform and the ability to wirelessly stream the content our customers love from the services they prefer.
Our innovative products, seamless customer experience and expanding global footprint have driven 13 consecutive years of sustained revenue growth since our first product launch. We generate revenue from the sale of our wireless speakers, home theater speakers and component products, as new customers buy our products and existing customers continue to add products to their Sonos sound systems.
We have developed a robust product and software roadmap that we believe will help us capture the expanding addressable market for our products. We believe executing on our roadmap will position us to acquire new customers, offer a continuously improving experience to our existing customers and grow follow-on purchases.
Our most recent steps in this direction occurred in October 2017, with the introduction of our first voice-enabled wireless speaker, Sonos One, and in July 2018, with the introduction of our first voice-enabled home theater speaker, Sonos Beam.
As of September 29, 2018, our customers had registered nearly 21 million products in over 7.4 million households worldwide. Acquiring new households is an important driver of our revenue, both in terms of initial purchases as well as creating the foundation for follow-on purchases. As our customers add Sonos to their homes and listen to more music, they typically increase the number of our products in their homes. In fiscal 2018, follow-on registrations represented approximately 37% of new product registrations. As we execute on our product roadmap to address evolving consumer preferences, we believe we can expand the number of products in our customers’ homes.
35
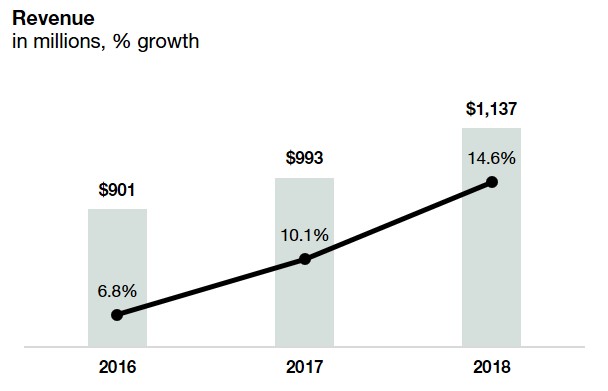
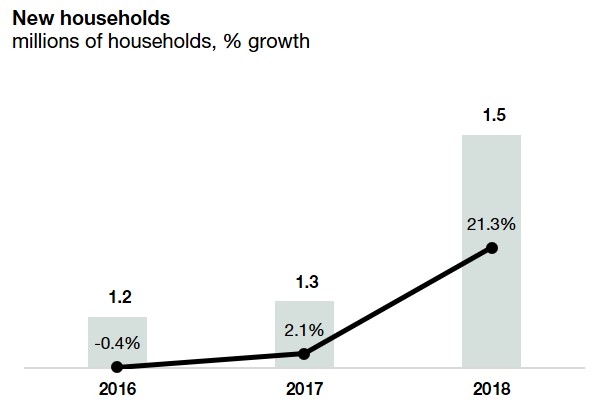
As of September 29, 2018, 62% of our 7.4 million households had registered more than one Sonos product, and our customers have typically purchased additional Sonos products over time.
Our annual gross margin declined to 43% in fiscal 2018, compared to a relatively consistent annual gross margin of approximately 45% over the previous two fiscal years. As we increase the pace of our product introductions, we expect our gross margin to decline in the near to intermediate term as new products gain a larger share of our overall product mix. In fiscal 2018, we saw this dynamic as we launched our Sonos One product in October 2017 and Sonos Beam in July 2018, both of which drove revenue and gross profit growth, but negatively impacted gross margins. We have historically seen that the gross margin for our newly released products is lowest at launch and has tended to increase over time as we realize cost efficiencies.
Accordingly, our future financial performance will be affected by our ability to drive additional savings as we scale production over time. In addition, we believe our operating expenses as a percentage of revenue will decline as we grow, enabling us to expand our adjusted EBITDA margin over time.
We sell our products primarily through over 10,000 third-party physical retail stores, including custom installers of home audio systems. We also sell through select e-commerce retailers and our website sonos.com. Our products are distributed in over 50 countries, with 51% of our revenue in fiscal 2018 generated outside the United States. We operate offices and development labs worldwide, with a significant presence in the United States, the Netherlands and China.
36
Key metrics
In addition to the measures presented in our consolidated financial statements, we use the following additional key metrics to evaluate our business, measure our performance, identify trends affecting our business and assist us in making strategic decisions. Our key metrics are products sold, adjusted EBITDA and adjusted EBITDA margin.
Net income (loss) is the most directly comparable financial measure calculated under U.S. GAAP for adjusted EBITDA. In the fiscal years ended September 29, 2018, September 30, 2017 and October 1, 2016, we had net losses of $15.6 million, $14.2 million and $38.2 million, respectively.
Fiscal Year Ended | |||||||||||
September 29, 2018 | September 30, 2017 | October 1, 2016 | |||||||||
(In thousands, except percentages) | |||||||||||
Products sold | 5,078 | 3,935 | 3,514 | ||||||||
Adjusted EBITDA | $ | 69,128 | $ | 55,955 | $ | 29,413 | |||||
Adjusted EBITDA margin | 6.1 | % | 5.6 | % | 3.3 | % | |||||
Products sold
Products sold represents the number of products that are sold during a period, net of returns. Products sold includes the sale of wireless speakers, home theater speakers and components. Products sold excludes the sale of other products, such as Sonos and third-party accessories. Historically, the sale of these accessories has not materially contributed to our revenue and we expect this trend to continue. Growth rates between products sold and revenue are not perfectly correlated because our revenue is affected by other variables, such as the mix of products sold during the period, promotional discount activity and the introduction of new products that may have higher or lower than average selling prices.
Adjusted EBITDA and adjusted EBITDA margin
We define adjusted EBITDA as net income (loss) adjusted to exclude the impact of stock-based compensation expense, depreciation, interest expense, net, other income (expense), net and provision for (benefit from) income taxes. We define adjusted EBITDA margin as adjusted EBITDA divided by revenue.
See the section titled "Selected Consolidated Financial and Other Data—Non-GAAP Financial Measures" for information regarding our use of adjusted EBITDA and adjusted EBITDA margin, and a reconciliation of net income (loss) to adjusted EBITDA.
Factors affecting our performance
New product introductions. Since 2005, we have released a number of products in multiple home audio categories including Play:1, Play:3, Play:5 and Sonos One in the wireless speaker category, Playbase, Playbar, Sub and Sonos Beam in the home theater speaker category and Connect:Amp, Connect and Sonos Amp in the components category. We intend to introduce new products that appeal to a broad set of consumers, as well as to bring our differentiated listening platform and experience to all the places and spaces our customers listen to the breadth of audio content available on demand today, including outside of the home. We also intend to increase the cadence of new product launches. As we increase the pace of our product introductions, we expect our gross margin to decline in the near to intermediate term as new products gain a larger share of our overall product mix. Accordingly, our future financial performance will be affected by our ability to drive cost of revenue savings as we scale production over time.
Voice control. We believe voice control technology is disrupting the home audio market and changing what consumers expect from a home speaker. Therefore, our product roadmap is focused on delivering products with native voice control. For example, we released Sonos One in the first quarter of fiscal 2018, our entry into the voice-enabled speaker category. Our ability to develop, manufacture and sell voice-enabled speakers that deliver differentiated consumer experiences will be a critical driver of our future performance, particularly as we compete in a larger market with an expanding number of competitors. We currently compete with, and will continue to compete with, companies that have greater resources than we do, some of which have already brought voice-enabled speakers to market. We are also partnering with certain of these companies in the development of our own voice-enabled products. Our competitiveness in the voice-enabled speaker market will depend on successful investment
37
in research and development, market acceptance of our products and our ability to maintain and benefit from these technology partnerships.
Seasonality. Historically, we have experienced the highest levels of revenue in the first fiscal quarter of the year, coinciding with the holiday shopping season. For example, revenue in the first quarter of fiscal 2018 accounted for 41% of our revenue for fiscal 2018. Our promotional discounting activity is higher in the first fiscal quarter as well, which negatively impacts gross margin during this period. For example, gross margin in the first quarter of fiscal 2018 was 42%, compared to gross margin of 43% for all of fiscal 2018. However, our higher sales volume in the holiday shopping season has historically resulted in a higher operating margin in the first fiscal quarter due to positive operating leverage. Given this significant seasonality, accurate forecasting for the first fiscal quarter is critical to our inventory management, as well as to our full-year financial planning and performance.
Ability to sell additional products to existing customers. As our customers add Sonos to their homes and listen to more music, they typically increase the number of our products in their homes. In fiscal 2018, follow-on purchases represented approximately 37% of new product registrations. As we execute on our product roadmap to address evolving consumer preferences, we believe we can expand the number of products in our customers’ homes. Our ability to sell additional products to existing customers is a key part of our business model, as follow-on purchases indicate high customer engagement and satisfaction, decrease the likelihood of competitive substitution and result in higher customer lifetime value. We will continue to innovate and invest in product development in order to enhance customer experience and drive sales of additional products to existing customers.
Expansion of partner ecosystem. Expanding and maintaining strong relationships with our partners will remain important to our success. We believe our partner ecosystem improves our customer experience, attracting more customers to Sonos, which in turn attracts more partners to the platform further enhancing our customer experience. We believe partners choose to be part of the Sonos platform because it provides access to a large, engaged customer base on a global scale. We look to partner with a wide variety of streaming music services, voice assistants, connected home integrators, content creators and podcast providers. To date, our agreements with these partners have all been on a royalty-free basis. As competition increases, we believe our ability to give users the freedom to choose across the broadest set of streaming services and voice control partners will be a key differentiating factor.
Channel strategy. We are focused on reaching and converting prospective customers through third-party retail stores, e-commerce retailers, custom installers of home audio systems and our website sonos.com. We are investing in our e-commerce capabilities and in-app experience to drive direct sales. Although sales through sonos.com represented 11.5% of our revenue in fiscal 2018 and 10% in fiscal 2017, we believe the growth of our own e-commerce channel will be important to supporting our overall growth and profitability as consumers continue the shift from physical to online sales channels. Our physical retail distribution relies on third-party retailers, as our company-owned stores do not materially contribute to our revenue. While we seek to increase sales through our direct-to-consumer sales channel, we expect that our future sales will continue to be substantially dependent on our third-party retailers. We will continue to seek retail partners that can deliver differentiated in-store experiences to support customer demand for product demonstrations. We anticipate that the total number of our third-party retail stores will decrease in the near term as we increase our focus on a smaller set of retailers that can deliver a superior experience for prospective customers.
International expansion. Our products are sold in over 50 countries and we have experienced growth in our international brand awareness and revenue in recent periods. In fiscal 2018, 51% of our revenue was generated outside the United States. Our international growth will depend on our ability to generate sales from the global population of consumers, to develop international distribution channels and diversify our partner ecosystem to appeal to a more global audience. We are committed to strengthening our brand in global markets and our future success will depend in significant part on our growth in international markets. In fiscal 2018, we launched in Japan, the world's second largest music market, presenting a significant opportunity to bring the Sonos experience to consumers who value design and fidelity of sound.
Investing in product development. Our investments in product development consist primarily of expenses in personnel who support our research and development efforts and capital expenditures for new tooling and production line equipment to manufacture and test our products. We believe that our financial performance will significantly depend on the effectiveness of our investments to design and introduce innovative new products and enhance existing products. If we fail to innovate and expand our product offerings, or fail to maintain high standards of quality in our products, our brand, market position and revenue will be adversely affected. Further, if our product development efforts are not successful, we will not recover the investments made.
38
Investing in sales and marketing. We intend to invest resources in our marketing and brand development efforts. Our marketing investments are focused on increasing brand awareness through advertising, public relations and brand promotion activities. While we maintain a base level of investment throughout the year, significant increases in spending are highly correlated with the holiday shopping season, new product launches and software introductions. We also invest in capital expenditures on product displays to support our retail channel partners. Sales and marketing investments are typically incurred in advance of any revenue benefits from these activities.
Components of results of operations
Revenue
We generate substantially all of our revenue from the sale of wireless speakers, home theater speakers and components. We also generate a small portion of our revenue from the sale of Sonos and third-party accessories, such as speaker stands and wall mounts, as well as licensing revenue. Our revenue is recognized net of allowances for returns, discounts, sales incentives and any taxes collected from customers. We also defer a portion of our revenue that is allocated to unspecified software upgrades and cloud-based services. Our revenue is subject to fluctuation based on the foreign currency in which our products are sold, principally for sales denominated in the euro and the British pound.
For a description of our revenue recognition policies, see the section titled "—Critical accounting policies and estimates."
Cost of revenue
Cost of revenue consists of product costs, including costs of our contract manufacturers for production, component costs, shipping and handling costs, warranty replacement costs, packaging, fulfillment costs, manufacturing and tooling equipment depreciation, warehousing costs, hosting costs and excess and obsolete inventory write-downs. In addition, we allocate certain costs related to management and facilities, personnel-related expenses and other expenses associated with supply chain logistics. Personnel-related expenses consist of salaries, bonuses, benefits and stock-based compensation expense.
Gross profit and gross margin
Our gross margin may in the future fluctuate from period to period based on a number of factors, including the mix of products we sell, the channel through which we sell our products and the foreign currency in which our products are sold. As we increase the pace of our product introductions, we expect our gross margin to decline in the near to intermediate term as new products gain a larger share of our overall product mix. We have historically seen that the gross margin for our newly released products are lowest at launch and have tended to increase over time as we realize cost efficiencies. In addition, our ability to reduce the cost of our products is critical to increasing our gross margin over the long term.
Operating expenses
Operating expenses consist of research and development, sales and marketing and general and administrative expenses.
Research and development. Research and development expenses consist primarily of personnel-related expenses, consulting and contractor expenses, tooling, test equipment and prototype materials and overhead costs. To date, software development costs have been expensed as incurred, because the period between achieving technological feasibility and the release of the software has been short and development costs qualifying for capitalization have been insignificant. We expect our research and development expenses to increase in absolute dollars as we continue to make significant investments in developing new products and enhancing existing products. We also anticipate that these expenses will decline as a percentage of our revenue over the long term, but that they may fluctuate with our investments in product development in a given quarter.
Sales and marketing. Sales and marketing expenses consist primarily of advertising and marketing promotions of our products and personnel-related expenses, as well as trade show and event costs, sponsorship costs, consulting and contractor expenses, travel, product display expenses and related depreciation, customer care costs and overhead costs. We anticipate that these expenses will decrease overall as a percentage of our revenue as we work to increase our operating leverage in Sales & Marketing, but expenses may fluctuate as we introduce new products.
General and administrative. General and administrative expenses consist of personnel-related expenses for our finance, legal, human resources and administrative personnel, as well as the costs of professional services, any overhead, information technology, litigation expenses, patent costs and other administrative expenses. We expect our general and administrative
39
expenses to increase in absolute dollars due to the growth of our business and related infrastructure as well as legal, accounting, insurance, investor relations and other costs associated with becoming a public company. However, we expect our general and administrative expenses to decrease as a percentage of our revenue as we scale our business.
Other income (expense), net
Interest expense, net. Interest expense consists primarily of interest expense associated with our debt financing arrangements and amortization of debt issuance costs. Interest income consists primarily of interest income earned on our cash and cash equivalents balances.
Other income (expense), net. Other income (expense), net consists primarily of our foreign currency exchange gains and losses relating to transactions and remeasurement of asset and liability balances denominated in currencies other than the U.S. dollar. We expect our foreign currency gains and losses to continue to fluctuate in the future due to changes in foreign currency exchange rates.
Provision for (benefit from) income taxes
We are subject to income taxes in the United States and foreign jurisdictions in which we operate. Our provision for (benefit from) income taxes results principally from our foreign operations. Foreign jurisdictions have statutory tax rates different from those in the United States. Accordingly, our effective tax rates will vary depending on the relative proportion of foreign to U.S. income, the utilization of foreign tax credits and changes in tax laws.
Deferred income taxes reflect the net tax effects of temporary differences between the carrying amounts of assets and liabilities for financial reporting purposes and the amounts used for income tax purposes. A valuation allowance is provided when it is more likely than not that the deferred tax assets will not be realized. We have established a full valuation allowance to offset our U.S. and certain foreign net deferred tax assets due to the uncertainty of realizing future tax benefits from our net operating loss carryforwards and other deferred tax assets.
As of September 29, 2018, we had gross U.S. federal net operating loss carryforwards of $74.7 million, which expire beginning in 2033, and gross state net operating loss carryforwards of $45.9 million, which expire beginning in 2020, as well as $21.9 million in foreign net operating loss carryforwards, of which $2.7 million have an indefinite life and $19.2 million that will expire in 2027. As of September 29, 2018, we had U.S. federal and state research and development tax credit carryforwards of $25.4 million and $19.1 million. The federal research credits will begin to expire in the year 2025, and the state research credits will begin to expire in 2024. In 2015 we completed a Section 382 study to determine whether an ownership change had occurred under Section 382 or 383 of the Code, and we determined at that time that an ownership change may have occurred in 2012. As a result, our net operating losses generated through July 18, 2012 may be subject to limitation under Section 382 of the Code. The amount of pre-change loss carryforward which may be subject to this limitation is $46.8million. Our ability to use net operating loss carry forwards and other tax attributes to reduce future taxable income and liabilities may be subject to limitations based on the ownership change of 2012. We have substantially completed an updated Section 382 study through August 31, 2018, and the preliminary results of this study showed that no ownership change within the meaning of Section 382 of the Code had occurred from the previously identified ownership change on July 18, 2012 through August 31, 2018.
On December 22, 2017, President Trump signed the Tax Act into law, implementing a wide variety of changes to the U.S. tax system. Among other changes at the corporate level, the Tax Act includes (i) a reduction in the U.S. federal corporate income tax rate from 35% to 21%, (ii) further limitations on the deductibility of interest expense and certain executive compensation, (iii) the repeal of the corporate alternative minimum tax, (iv) the imposition of a territorial tax system with a one-time repatriation tax on deemed repatriated earnings of foreign subsidiaries and (v) a subjecting of certain foreign earnings to U.S. taxation through a base erosion anti-abuse tax ("BEAT")and a new tax related to global intangible low taxed income ("GILTI"). Additionally, certain foreign derived intangible income ("FDII") may prospectively be subject to a reduced rate of income tax from the statutorily enacted rate of 21%. Some of these changes, including the BEAT, FDII and GILTI provisions, will not come into effect until our 2019 fiscal year, but because the decrease in the corporate income tax rate was effective January 1, 2018, we have reduced the future tax benefits of our existing U.S. deferred tax assets. However, since we maintain a full valuation allowance against these assets, for the fiscal year ended September 29, 2018 this did not have a material impact on our results of operations or financial condition. We have not recorded a provision related to the one-time transition tax under Section 965 of the Code as we have estimated that our foreign subsidiaries have a consolidated deficit in accumulated and current earnings and profits.
40
Our accounting for the elements of the Tax Act is incomplete. We have made reasonable estimates of the effects to the consolidated statements of income and consolidated balance sheets and have preliminarily determined that a provision is not required. The ultimate impact of the Tax Act may differ from the above estimates due to potential future legislative action to address questions that have arisen because of the Tax Act, issuance of additional guidance by the IRS to provide clarity on certain provisions of the Tax Act and any changes in accounting standards for income taxes or related interpretations in response to the Tax Act. The SEC has issued rules that would allow for a measurement period of up to one year after the enactment date of the Tax Act to finalize the recording of the related tax impacts. We currently anticipate finalizing and recording any resulting adjustments by the end of our fiscal quarter ending December 29, 2018.
Results of operations
The following table sets forth our consolidated results of operations for the periods indicated. The period-to-period comparison of financial results is not necessarily indicative of financial results to be achieved in future periods.
Fiscal Year Ended | |||||||||||
September 29, 2018 | September 30, 2017 | October 1, 2016 | |||||||||
(In thousands) | |||||||||||
Revenue | $ | 1,137,008 | $ | 992,526 | $ | 901,284 | |||||
Cost of revenue (1) | 647,700 | 536,461 | 497,885 | ||||||||
Gross profit | 489,308 | 456,065 | 403,399 | ||||||||
Operating expenses | |||||||||||
Research and development (1) | 142,109 | 124,394 | 107,729 | ||||||||
Sales and marketing (1) | 270,869 | 270,162 | 258,012 | ||||||||
General and administrative (1) | 85,205 | 77,118 | 68,531 | ||||||||
Total operating expenses | 498,183 | 471,674 | 434,272 | ||||||||
Operating loss | (8,875 | ) | (15,609 | ) | (30,873 | ) | |||||
Other income (expense), net | |||||||||||
Interest expense, net | (4,511 | ) | (4,260 | ) | (2,489 | ) | |||||
Other income (expense), net | (1,162 | ) | 3,361 | (2,208 | ) | ||||||
Total other expense, net | (5,673 | ) | (899 | ) | (4,697 | ) | |||||
Loss before provision for (benefit from) income taxes | (14,548 | ) | (16,508 | ) | (35,570 | ) | |||||
Provision for (benefit from) income taxes | 1,056 | (2,291 | ) | 2,644 | |||||||
Net loss | $ | (15,604 | ) | $ | (14,217 | ) | $ | (38,214 | ) | ||
Adjusted EBITDA (2) | $ | 69,128 | $ | 55,955 | $ | 29,413 | |||||
(1) | Amounts include stock-based compensation expense as follows: |
Fiscal Year Ended | |||||||||||
September 29, 2018 | September 30, 2017 | October 1, 2016 | |||||||||
(In thousands) | |||||||||||
Cost of revenue | $ | 198 | $ | 240 | $ | 211 | |||||
Research and development | 13,960 | 13,605 | 8,260 | ||||||||
Sales and marketing | 15,885 | 15,086 | 11,742 | ||||||||
General and administrative | 8,602 | 7,619 | 5,750 | ||||||||
Total stock-based compensation expense | $ | 38,645 | $ | 36,550 | $ | 25,963 | |||||
(2) | Adjusted EBITDA is a financial measure that is not calculated in accordance with U.S. GAAP. See the section titled "Selected Consolidated Financial and Other Data—Non-GAAP Financial Measures." |
41
The following table sets forth selected historical consolidated financial data for the periods indicated, expressed as a percentage of revenue (the table may not foot due to rounding):
Fiscal Year Ended | ||||||||
September 29, 2018 | September 30, 2017 | October 1, 2016 | ||||||
Revenue | 100 | % | 100 | % | 100 | % | ||
Cost of revenue (1) | 57.0 | 54.1 | 55.2 | |||||
Gross profit | 43.0 | 45.9 | 44.8 | |||||
Operating expenses | ||||||||
Research and development (1) | 12.5 | 12.5 | 12.0 | |||||
Sales and marketing (1) | 23.8 | 27.2 | 28.6 | |||||
General and administrative (1) | 7.5 | 7.8 | 7.6 | |||||
Total operating expenses | 43.8 | 47.5 | 48.2 | |||||
Operating loss | (0.8 | ) | (1.6 | ) | (3.4 | ) | ||
Other income (expense), net | ||||||||
Interest expense, net | (0.4 | ) | (0.4 | ) | (0.3 | ) | ||
Other income (expense), net | (0.1 | ) | 0.3 | (0.2 | ) | |||
Total other expense, net | (0.5 | ) | (0.1 | ) | (0.5 | ) | ||
Loss before provision for (benefit from) income taxes | (1.3 | ) | (1.7 | ) | (3.9 | ) | ||
Provision for (benefit from) income taxes | 0.1 | (0.2 | ) | 0.3 | ||||
Net loss | (1.4 | )% | (1.4 | )% | (4.2 | )% | ||
Adjusted EBITDA (2) | 6.1 | % | 5.6 | % | 3.3 | % | ||
(1) Amounts include stock-based compensation expense as a percentage of revenue as follows:
Fiscal Year Ended | ||||||||
September 29, 2018 | September 30, 2017 | October 1, 2016 | ||||||
Cost of revenue | — | % | — | % | — | % | ||
Research and development | 1.2 | 1.4 | 0.9 | |||||
Sales and marketing | 1.4 | 1.5 | 1.3 | |||||
General and administrative | 0.8 | 0.8 | 0.6 | |||||
Total stock-based compensation expense | 3.4 | % | 3.7 | % | 2.9 | % | ||
(2) Adjusted EBITDA margin is a financial measure that is not calculated in accordance with U.S. GAAP. See the section titled "Selected Consolidated Financial and Other Data—Non-GAAP Financial Measures."
42
Comparison of fiscal years 2018, 2017 and 2016
Revenue
Fiscal Year Ended | Change from Prior Fiscal Year | Fiscal Year Ended | Change from Prior Fiscal Year | ||||||||||||||||||||||
September 29, 2018 | September 30, 2017 | $ | % | October 1, 2016 | $ | % | |||||||||||||||||||
(Dollars in thousands) | |||||||||||||||||||||||||
Revenue by geographical region: | |||||||||||||||||||||||||
Americas | $ | 603,450 | $ | 496,668 | $ | 106,782 | 21.5 | % | $ | 443,314 | $ | 53,354 | 12.0 | % | |||||||||||
Europe, Middle East and Africa ("EMEA") | 478,518 | 442,081 | 36,437 | 8.2 | 415,689 | 26,392 | 6.3 | ||||||||||||||||||
Asia Pacific ("APAC") | 55,040 | 53,777 | 1,263 | 2.3 | 42,281 | 11,496 | 27.2 | ||||||||||||||||||
Total revenue | $ | 1,137,008 | $ | 992,526 | $ | 144,482 | 14.6 | % | $ | 901,284 | $ | 91,242 | 10.1 | % | |||||||||||
Other data: | |||||||||||||||||||||||||
Total products sold | 5,078 | 3,935 | 1,143 | 29.0 | % | 3,514 | 421 | 12.0 | % | ||||||||||||||||
Fiscal 2018 Compared to Fiscal 2017
Revenue increased by $144.5 million, or 14.6%, from $992.5 million for fiscal 2017 to $1,137.0 million for fiscal 2018, primarily due to the launch of Sonos One and Sonos Beam.
Products sold increased by 1.1 million, or 29.0%, from 3.9 million for fiscal 2017 to 5.1 million for fiscal 2018. The volume growth was primarily driven by sales of our newest wireless speaker product, Sonos One, which launched in October 2017, as well as by sales of our newest home theater product, Sonos Beam, which launched in July 2018. Volume growth was partially offset by a decrease in wireless speakers from sales of Play:1, Play:3 and Play:5 as well as by a decrease in home theater from sales of our Playbar. Revenue growth from the sale of our wireless speakers was primarily driven by sales of our new Sonos One product launched in October 2017, while growth from the sale of our home theater speakers was driven by sales of our new Sonos Beam product launched in July 2018.
Revenue from the Americas increased $106.8 million, or 21.5%, from $496.7 million for fiscal 2017 to $603.5 million for fiscal 2018. The increase in Americas revenue was driven by strong growth in wireless speakers and home theater speakers. Revenue from EMEA and from APAC increased $37.7 million, or 7.6%, from $495.9 million for fiscal 2017 to $533.6 million for fiscal 2018. The increase in EMEA and APAC revenue was driven by growth in wireless speakers and home theater speakers and partially offset by a decline in components. In constant U.S. dollars, total revenue increased by 10.9% for fiscal 2018 compared to fiscal 2017, which excludes the impact of foreign currency fluctuations against the U.S. dollar. We calculate constant currency growth percentages by translating our prior-period financial results using the current period average currency exchange rates and comparing these amounts to our current period reported results.
Fiscal 2017 Compared to Fiscal 2016
Revenue increased by $91.2 million, or 10.1%, from $901.3 million for fiscal 2016 to $992.5 million for fiscal 2017 due to an increase in the number of products sold from 3.5 million in fiscal 2016 to 3.9 million in fiscal 2017. The growth was primarily driven by increased sales of our home theater speaker products. Revenue growth from the sale of our home theater speakers was primarily driven by sales of our new Playbase product launched in April 2017, as well as by sales of a new white version of our Sub product.
Revenue from the Americas increased $53.4 million, or 12.0%, from $443.3 million for fiscal 2016 to $496.7 million for fiscal 2017. Revenue from EMEA and from APAC increased $37.9 million, or 8.3%, from $458.0 million for fiscal 2016 to $495.9 million for fiscal 2017. In constant U.S. dollars, consolidated revenue grew by 12% for the full fiscal year, which excludes the negative impact of foreign currency as the U.S. dollar strengthened against the euro and the British pound. We calculate constant currency growth percentages by translating our prior-period financial results using the current period average currency exchange rates and comparing these amounts to our current period reported results.
43
Cost of revenue and gross profit
Fiscal Year Ended | Change from Prior Fiscal Year | Fiscal Year Ended | Change from Prior Fiscal Year | ||||||||||||||||||||||
September 29, 2018 | September 30, 2017 | $ | % | October 1, 2016 | $ | % | |||||||||||||||||||
(Dollars in thousands) | |||||||||||||||||||||||||
Cost of revenue | $ | 647,700 | $ | 536,461 | $ | 111,239 | 20.7 | % | $ | 497,885 | $ | 38,576 | 7.7 | % | |||||||||||
Gross profit | $ | 489,308 | $ | 456,065 | $ | 33,243 | 7.3 | % | $ | 403,399 | $ | 52,666 | 13.1 | % | |||||||||||
Gross margin | 43.0 | % | 45.9 | % | 44.8 | % | |||||||||||||||||||
Fiscal 2018 Compared to Fiscal 2017
Cost of revenue increased $111.2 million, or 20.7%, from $536.5 million for fiscal 2017 to $647.7 million for fiscal 2018. The increase was primarily due to the increase in number of products sold, which increased 29.0%.
Gross margin decreased to 43.0% for fiscal 2018 from 45.9% for fiscal 2017. The decrease was primarily due to the impact of lower margins in connection with the launch of our new Sonos One product in October 2017 and our launch of Sonos Beam in July 2018, as well as due to lower retail prices on our older wireless speakers. These gross margin decreases were partially offset by cost reductions of our Play:5, Connect and Play:1 products.
Fiscal 2017 Compared to Fiscal 2016
Cost of revenue increased $38.6 million, or 7.7%, from $497.9 million for fiscal 2016 to $536.5 million for fiscal 2017. The increase was primarily due to the increase in number of products sold, partially offset by a decrease of per unit production costs resulting from supply chain improvement initiatives.
Gross margin increased to 45.9% for fiscal 2017 from 44.8% for fiscal 2016. The increase was primarily due to the reduction of per unit production costs, and was partially offset by the negative impact of foreign currency as the U.S. dollar strengthened against the euro and the British pound.
Research and development
Fiscal Year Ended | Change from Prior Fiscal Year | Fiscal Year Ended | Change from Prior Fiscal Year | ||||||||||||||||||||||
September 29, 2018 | September 30, 2017 | $ | % | October 1, 2016 | $ | % | |||||||||||||||||||
(Dollars in thousands) | |||||||||||||||||||||||||
Research and development | $ | 142,109 | $ | 124,394 | $ | 17,715 | 14.2 | % | $ | 107,729 | $ | 16,665 | 15.5 | % | |||||||||||
Percentage of revenue | 12.5 | % | 12.5 | % | 12.0 | % | |||||||||||||||||||
Fiscal 2018 Compared to Fiscal 2017
Research and development expenses increased $17.7 million, or 14.2%, from $124.4 million for fiscal 2017 to $142.1 million for fiscal 2018. The increase was primarily due to higher personnel-related expenses of $13.9 million as our headcount, particularly in software personnel, increased during the period, $2.4 million higher overhead costs and $1.5 million higher information technology costs.
Fiscal 2017 Compared to Fiscal 2016
Research and development expenses increased $16.7 million, or 15.5%, from $107.7 million for fiscal 2016 to $124.4 million for fiscal 2017. The increase was primarily due to higher personnel-related expenses of $8.6 million as our headcount
44
increased during the period, an increase in new product development expenses of $4.1 million related to prototypes, pre-production tooling and consulting and an increase of $4.2 million in overhead costs.
Sales and marketing
Fiscal Year Ended | Change from Prior Fiscal Year | Fiscal Year Ended | Change from Prior Fiscal Year | ||||||||||||||||||||||
September 29, 2018 | September 30, 2017 | $ | % | October 1, 2016 | $ | % | |||||||||||||||||||
(Dollars in thousands) | |||||||||||||||||||||||||
Sales and marketing | $ | 270,869 | $ | 270,162 | $ | 707 | 0.3 | % | $ | 258,012 | $ | 12,150 | 4.7 | % | |||||||||||
Percentage of revenue | 23.8 | % | 27.2 | % | 28.6 | % | |||||||||||||||||||
Fiscal 2018 Compared to Fiscal 2017
Sales and marketing expenses increased by $0.7 million, or 0.3%, from $270.2 million for fiscal 2017 to $270.9 million in fiscal 2018 as we demonstrated improved operating leverage. The increase was primarily due to increases in personnel-related costs, which were partially offset by decreases in marketing and advertising costs as we transitioned away from traditional paid media and we adopted more efficient direct-to-consumer and digital marketing tools.
Fiscal 2017 Compared to Fiscal 2016
Sales and marketing expenses increased $12.2 million, or 4.7%, from $258.0 million for fiscal 2016 to $270.2 million in fiscal 2017. The increase was primarily due to increases of $18.4 million in advertising and other marketing costs focused on brand awareness and the launch of our new Playbase product in April 2017 and an increase of $3.9 million in personnel-related costs. These increases were offset by a decrease of $6.1 million in overhead costs and a decrease of $4.1 million of product display depreciation.
General and administrative
Fiscal Year Ended | Change from Prior Fiscal Year | Fiscal Year Ended | Change from Prior Fiscal Year | ||||||||||||||||||||||
September 29, 2018 | September 30, 2017 | $ | % | October 1, 2016 | $ | % | |||||||||||||||||||
(Dollars in thousands) | |||||||||||||||||||||||||
General and administrative | $ | 85,205 | $ | 77,118 | $ | 8,087 | 10.5 | % | $ | 68,531 | $ | 8,587 | 12.5 | % | |||||||||||
Percentage of revenue | 7.5 | % | 7.8 | % | 7.6 | % | |||||||||||||||||||
Fiscal 2018 Compared to Fiscal 2017
General and administrative expenses increased $8.1 million, or 10.5% from $77.1 million for fiscal 2017 to $85.2 million for fiscal 2018. The increase was primarily due to an increase in personnel-related costs of $6.0 million, predominantly driven by growth in average headcount as we invested in personnel and programs to create the infrastructure necessary to support our operations as a public company. This increase was partially offset by a decrease in depreciation expense and other administrative costs.
Fiscal 2017 Compared to Fiscal 2016
General and administrative expenses increased $8.6 million, or 12.5%, from $68.5 million for fiscal 2016 to $77.1 million for fiscal 2017. The increase was primarily due to increases in personnel-related costs of $7.2 million, predominantly driven by growth in headcount. In addition, external legal fees increased by $2.4 million, primarily related to our patent infringement case against Denon. These increases were partially offset by a reduction in other facilities-related expenses.
45
Interest expense, net and other income (expense), net
Fiscal Year Ended | Change from Prior Fiscal Year | Fiscal Year Ended | Change from Prior Fiscal Year | ||||||||||||||||||||||
September 29, 2018 | September 30, 2017 | $ | % | October 1, 2016 | $ | % | |||||||||||||||||||
(Dollars in thousands) | |||||||||||||||||||||||||
Interest expense, net | $ | (4,511 | ) | $ | (4,260 | ) | $ | (251 | ) | 5.9 | % | $ | (2,489 | ) | $ | (1,771 | ) | 71.2 | % | ||||||
Other income (expense), net | $ | (1,162 | ) | $ | 3,361 | $ | (4,523 | ) | (134.6 | )% | $ | (2,208 | ) | $ | 5,569 | * | |||||||||
* not meaningful
Fiscal 2018 Compared to Fiscal 2017
Interest expense, net increased by $0.3 million, or 5.9%, from $4.3 million for fiscal 2017 to $4.5 million for fiscal 2018. Other income (expense), net decreased $4.5 million, from $3.4 million in income in fiscal 2017 to $1.2 million in expense in fiscal 2018, due to foreign currency exchange losses.
Fiscal 2017 Compared to Fiscal 2016
Interest expense, net increased $1.8 million, from $2.5 million for fiscal 2016 to $4.3 million for fiscal 2017. The increase in interest expense was driven by a $15.0 million increase in the principal balance of our term loan. Other expense, net decreased $5.6 million, from expense of $2.2 million in fiscal 2016 to income of $3.4 million in fiscal 2017. The decrease in net expense was due to foreign currency exchange gains.
Provision for (benefit from) income taxes
Fiscal Year Ended | Change from Prior Fiscal Year | Fiscal Year Ended | Change from Prior Fiscal Year | |||||||||||||||||||||
September 29, 2018 | September 30, 2017 | $ | % | October 1, 2016 | $ | % | ||||||||||||||||||
(Dollars in thousands) | ||||||||||||||||||||||||
Provision for (benefit from) income taxes | $ | 1,056 | $ | (2,291 | ) | $ | 3,347 | (146.1 | )% | $ | 2,644 | $ | (4,935 | ) | * | |||||||||
* not meaningful
Fiscal 2018 Compared to Fiscal 2017
Provision for income taxes increased $3.3 million, from a $2.3 million benefit for fiscal 2017 to a provision from income taxes of $1.1 million for fiscal 2018.
Provision for income taxes increased $3.3 million, from a $2.3 million benefit from income taxes for fiscal 2017 to a provision from income taxes of $1.1 million for fiscal 2018. In fiscal 2017, we amended our settlement agreement with the Dutch Tax Administration, which resulted in a net tax benefit of $4.9 million in fiscal 2017.
Fiscal 2017 Compared to Fiscal 2016
Provision for income taxes decreased $4.9 million, from $2.6 million provision for fiscal 2016 to $2.3 million benefit for fiscal 2017.
46
Liquidity and capital resources
Prior to our IPO, our operations were financed primarily through cash flow from operating activities, borrowings under our credit facilities and net proceeds from the sale of our equity securities.
Upon the closing of our IPO, we received net proceeds of $90.6 million, after deducting underwriting discounts and commissions of $5.3 million. Additionally, offering costs incurred by us totaled approximately $4.6 million.
As of September 29, 2018, our principal sources of liquidity consisted of cash flow from operating activities, cash and cash equivalents of $220.9 million, including $22.3 million held by our foreign subsidiaries, and borrowing capacity under our credit facility. In accordance with our policy, the undistributed earnings of our non-U.S. subsidiaries remain indefinitely reinvested outside of the United States as of September 29, 2018, as they are required to fund needs outside the United States. In the event funds from foreign operations are needed to fund operations in the United States and if U.S. tax has not already been previously provided, we may be required to accrue and pay additional U.S. taxes in order to repatriate these funds.
We believe our existing cash and cash equivalent balances, cash flow from operations and committed credit lines will be sufficient to meet our working capital and capital expenditure needs for at least the next 12 months. Our future capital requirements may vary materially from those currently planned and will depend on many factors, including our rate of revenue growth, the timing and extent of spending on research and development efforts and other business initiatives, the expansion of sales and marketing activities, the timing of new product introductions, market acceptance of our products and overall economic conditions. To the extent that current and anticipated future sources of liquidity are insufficient to fund our future business activities and requirements, we may be required to seek additional equity or debt financing. The sale of additional equity would result in additional dilution to our stockholders. The incurrence of debt financing would result in debt service obligations and the instruments governing such debt could provide for operating and financing covenants that would restrict our operations.
Credit facilities
Our credit facilities are as follows:
As of | |||||||||||||
September 29, 2018 | September 30, 2017 | ||||||||||||
Rate | Balance | Rate | Balance | ||||||||||
(In thousands) | |||||||||||||
J.P. Morgan Chase Bank, N.A Secured Term Loan (the "New Term Loan") (1) | 4.8 | % | $ | 40,000 | — | % | $ | — | |||||
J.P. Morgan Chase Bank, N.A Secured Credit Facility (the "Credit Facility") (2) | — | % | — | — | % | — | |||||||
Gordon Brothers Finance Company Secured Term Loan (the "Prior Term Loan") (3) | — | % | — | 10.7 | % | 40,000 | |||||||
Unamortized debt issuance costs (4) | (236 | ) | (400 | ) | |||||||||
Total indebtedness | $ | 39,764 | $ | 39,600 | |||||||||
Less short term portion | (6,667 | ) | — | ||||||||||
Long term debt | $ | 33,097 | $ | 39,600 | |||||||||
(1) | Bears interest at a variable rate equal to an adjusted LIBOR plus 2.25% and is payable quarterly. Due in October 2021, with quarterly principal payments beginning in July 2019. |
(2) | Allows us to borrow up to $80.0 million restricted to the value of the borrowing base which is based on the value of inventory and accounts receivable and is subject to monthly redeterminations. Also includes up to $10.0 million for the issuance of letters of credit and up to $8.0 million for swing line loans. The Credit Facility matures in October 2021 and may be drawn as Commercial Bank Floating Rate Loans (at the higher of prime rate or adjusted LIBOR plus 2.50%) or Eurocurrency Loans (at LIBOR plus an applicable margin). The unused portion is subject to an annual commitment fee of 0.2%. |
(3) | In July 2018, all outstanding principal, accrued interest and fees were paid in full and the Prior Term Loan was terminated. While outstanding, it bore interest at LIBOR plus 9.5%. |
(4) | Debt issuance costs are recorded as a debt discount and charged to interest expense over the term of the agreement. |
47
The Credit Facility and New Term Loan require us to maintain a consolidated fixed charge ratio of at least 1.0, restrict distribution of dividends unless certain conditions are met, such as having a fixed charge ratio of at least 1.15, and require financial statement reporting and delivery of borrowing base certificates. As of September 29, 2018 and September 30, 2017, we were in compliance with all covenants.
Obligations under the credit facilities are collateralized by our eligible inventory and accounts receivable as well as our intellectual property including patents and trademarks. As of September 29, 2018 and September 30, 2017, we did not have any outstanding borrowings and $4.5 million and $4.4 million, respectively, in undrawn letters of credit that reduce the availability under the Credit Facility. As of September 29, 2018, we had $39.8 million outstanding under the New Term Loan.
Cash flows
The following table summarizes our cash flows for the periods indicated:
Fiscal Year Ended | ||||||||||||
Sep 29, 2018 | Sep 30, 2017 | Oct 1, 2016 | ||||||||||
(In thousands) | ||||||||||||
Net cash provided by (used in): | ||||||||||||
Operating activities | $ | 30,570 | $ | 63,960 | $ | 43,294 | ||||||
Investing activities | (35,747 | ) | (33,553 | ) | (52,520 | ) | ||||||
Financing activities | 94,374 | 23,955 | 7,969 | |||||||||
Effect of exchange rate changes | 1,138 | 1,320 | (182 | ) | ||||||||
Net change in cash and cash equivalents | $ | 90,335 | $ | 55,682 | $ | (1,439 | ) | |||||
Cash flows from operating activities
Fiscal 2018 compared to fiscal 2017
Net cash provided by operating activities of $30.6 million for fiscal 2018 was primarily due to non-cash adjustments of $80.8 million, offset by a decrease in net change in operating assets and liabilities of $34.6 million and a net loss of $15.6 million. Non-cash adjustments primarily consisted of stock-based compensation expense of $38.6 million and depreciation of $39.4 million. The decrease in the net change in operating assets and liabilities was primarily due to an $80.1 million increase in inventory as we prepared for the holiday shopping season, which will occur in our first quarter of fiscal 2019, and a $28.6 million increase in accounts receivable driven by our fourth quarter fiscal 2018 revenue growth and other assets. The decrease in net change in operating assets and liabilities was offset by a $68.1 million increase in accounts payable and accrued expenses related to amounts owed to one of our contract manufacturers and various other vendors, and a $5.6 million increase in deferred revenue.
Fiscal 2017 compared to fiscal 2016
Net cash provided by operating activities of $64.0 million for fiscal 2017 was primarily due to net loss of $14.2 million, non-cash adjustments of $70.2 million and an increase in net change in operating assets and liabilities of $8.0 million. Non-cash adjustments primarily consisted of stock-based compensation expense of $36.6 million and depreciation of $35.0 million. The increase in net change in operating assets and liabilities was primarily due to a $60.0 million increase in accounts payable and accrued expenses related to amounts owed to one of our contract manufacturers and various other vendors, and a $9.4 million increase in deferred revenue. The increase in net change in operating assets and liabilities was offset by a $60.3 million increase in inventory as we prepared for the holiday shopping season, which occurred in our first quarter of fiscal 2018. This inventory also includes the initial production of our new wireless speaker, Sonos One, as we prepared for product launch in October 2017. An increase of $2.7 million in accounts receivable also offsets the increase in net change in operating assets and liabilities.
48
Fiscal 2016 compared to fiscal 2015
Net cash provided by operating activities of $43.3 million for fiscal 2016 was primarily due to net loss of $38.2 million, non-cash adjustments of $64.3 million and an increase in net change in operating assets and liabilities of $17.2 million. Non-cash adjustments primarily consisted of depreciation of $34.3 million and stock-based compensation expense of $26.0 million. The increase in net change in operating assets and liabilities was primarily due to an increase in deferred revenue of $8.6 million, an increase in other liabilities of $8.1 million primarily related to tenant improvement allowances received for our office and lab facilities, a $5.9 million decrease in inventory and a decrease of other assets of $2.9 million. The increase in net change in operating assets and liabilities was offset by increases in accounts receivable of $4.6 million, as well as a decrease in accounts payable and accrued expenses of $3.6 million.
Cash flows from investing activities
Fiscal 2018 compared to fiscal 2017
Cash used in investing activities for fiscal 2018 of $35.7 million was due to payments for property and equipment, which primarily comprised of marketing-related product displays, manufacturing-related tooling and test equipment used at our contract manufacturers to support the launch of new products as well as investments in office and lab facilities, lab equipment and related information technology tools.
Fiscal 2017 compared to fiscal 2016
Cash used in investing activities for fiscal 2017 of $33.6 million was due to payments for property and equipment, which primarily comprised of marketing-related product displays, manufacturing-related tooling and test equipment used at our contract manufacturers to support the launch of new products as well as investments in office and lab facilities, lab equipment and related information technology tools.
Fiscal 2016 compared to fiscal 2015
Cash used in investing activities for fiscal 2016 of $52.5 million was due to payments for property and equipment which primarily comprised of marketing-related product displays and our concept store in New York City, and manufacturing-related tooling and test equipment used at our contract manufacturers to support the launch of new products. In addition, we invested in upgrading and expanding our office and lab facilities, lab equipment and related information technology tools.
Cash flows from financing activities
Cash provided by financing activities for fiscal 2018 of $94.4 million primarily consisted of a $90.6 million from the net proceeds from our IPO, net proceeds of $30.0 million from our revolving credit facility, net proceeds of $39.7 million from the New Term Loan and $9.3 million in proceeds from the exercise of stock options. These increases were offset by payment of outstanding borrowings under the Amended Term Loan of $40.0 million, paydown of our revolving credit facilities of $30.0 million, $4.0 million in payments for offering costs, $0.9 million to repurchase common stock to provide liquidity for existing stockholders and $0.4 million in debt extinguishment costs.
Cash provided by financing activities for fiscal 2017 of $24.0 million primarily consisted of a $15.0 million increase in the principal amount of our existing term loan, $10.1 million in proceeds from issuance of common stock, net of issuance costs, and proceeds from the exercise of common stock options of $8.9 million. These increases were offset by $10.0 million to repurchase common stock to provide liquidity for existing stockholders.
Cash provided by financing activities for fiscal 2016 of $8.0 million primarily related to the net proceeds from the issuance of a new term loan debt of $24.4 million and proceeds from the exercise of common stock options of $3.7 million. This increase was offset by a net paydown of our revolving credit facilities of $20.0 million.
49
Commitments and contingencies
The following table summarizes our contractual commitments as of September 29, 2018:
Payments due by fiscal year | ||||||||||||||||||||||||||||
Total | 2019 | 2020 | 2021 | 2022 | 2023 | Beyond | ||||||||||||||||||||||
(In thousands) | ||||||||||||||||||||||||||||
Debt principal and interest (1) (2) | $ | 45,482 | $ | 8,863 | $ | 8,433 | $ | 8,080 | $ | 20,106 | $ | — | $ | — | ||||||||||||||
Operating leases (3) | 85,546 | 16,830 | 14,120 | 12,391 | 11,654 | 11,870 | 18,681 | |||||||||||||||||||||
Inventory (4) | 70,900 | 70,900 | — | — | — | — | — | |||||||||||||||||||||
Other noncancelable agreements | 8,696 | 3,279 | 3,574 | 1,843 | — | — | — | |||||||||||||||||||||
Total contractual commitments | $ | 210,624 | $ | 99,872 | $ | 26,127 | $ | 22,314 | $ | 31,760 | $ | 11,870 | $ | 18,681 | ||||||||||||||
(1) | Interest payments were calculated using the applicable interest rate as of September 29, 2018. |
(2) | In July 2018, we amended the 2015 Credit Facility with J.P. Morgan Chase Bank, N.A. In connection with the amendment, we borrowed $40.0 million under the New Term Loan, which we used to pay off all outstanding borrowings, accrued interest and fees under our then-outstanding term loan, as described below. The New Term Loan has a maturity date of October 2021 and bears interest at a variable rate equal to an adjusted LIBOR plus 2.25%. We will make our first principal payment under the New Term Loan in July 2019 and will make quarterly principal payments thereafter. We pay interest on the New Term Loan quarterly. |
(3) | We lease our facilities under long-term operating leases, which expire at various dates through 2025. The lease agreements frequently include provisions which require us to pay taxes, insurance or maintenance costs. |
(4) | We enter into various inventory-related purchase agreements with suppliers. Under these agreements, 100% of orders are cancelable by giving sufficient notice prior to the expected shipment date. |
Off-balance sheet arrangements
We have not entered into any off-balance sheet arrangements and do not have any holdings in variable interest entities.
Critical accounting policies and estimates
Our financial statements are prepared in accordance with U.S. GAAP. The preparation of these financial statements requires us to make estimates and assumptions that affect the reported amounts of assets, liabilities, revenue, expenses and related disclosures. We evaluate our estimates and assumptions on an ongoing basis. Our estimates are based on historical experience and various other assumptions that we believe to be reasonable under the circumstances. Actual results could differ materially from those estimates.
Our critical accounting policies requiring estimates, assumptions and judgments that we believe have the most significant impact on our consolidated financial statements are described below.
Revenue recognition
Adoption of ASC 606
Effective October 1, 2017, we elected to early adopt Accounting Standards Codification 606, Revenue from Contracts with Customers ("ASC"), using the full retrospective transition method, which required us to adjust each prior reporting period presented as if ASC 606 had been effective for those periods. The revenue recognition accounting policies and estimates described below reflect the adoption of ASC 606. For further information on our adoption of ASC 606, see Note 2 of the notes to our consolidated financial statements.
Revenue is recognized upon transfer of control of promised products or services to customers in an amount that reflects the consideration we expect to receive in exchange for those products or services. We generally enter into contracts that include
50
a combination of products and services. Revenue is allocated to distinct performance obligations and is recognized net of allowances for returns, discounts, sales incentives and any taxes collected from customers, which are subsequently remitted to governmental authorities. Shipping and handling costs associated with outbound freight after control over a product has transferred to a customer are accounted for as a fulfillment cost and are included in cost of revenue. We do not have material assets related to incremental costs to obtain or fulfill customer contracts.
Nature of products and services
Our product revenue includes sales of wireless speakers, home theater speakers and components, which include software that enables our products to operate over a customer’s wireless network, as well as connect to various third-party services, including music and voice. Our software primarily consists of firmware embedded in the products and the Sonos app, which is software that can be downloaded to consumer devices at no charge, with or without the purchase of one of our products. Products and related software are accounted for as a single performance obligation and all intended functionality is available to the customer upon purchase. The revenue allocated to the products and related software is the substantial portion of the total sale price. Revenue is recognized at the point in time when control is transferred, which is either upon shipment or upon delivery to the customer, depending on delivery terms.
Our service revenue includes revenue allocated to (i) unspecified software upgrades and (ii) cloud services that enable products to access third-party music and voice assistant platforms, which are each distinct performance obligations and are provided to customers at no additional charge. Unspecified software upgrades are provided on a when-and-if-available basis and have historically included updates and enhancements such as bug fixes, feature enhancements and updates to the ability to connect to third-party music or voice assistant platforms. Service revenue is recognized ratably over the estimated service period.
Significant judgments
Our contracts with customers generally contain promises to transfer products and services as described above. Determining whether products and services are considered distinct performance obligations that should be accounted for separately may require significant judgment.
Judgment is required to determine the standalone selling price ("SSP") for each distinct performance obligation. We estimate SSP for items that are not sold separately, which include the products and related software, unspecified software upgrades and cloud services, using information that may include competitive pricing information, where available, as well as analyses of the cost of providing the products or services plus a reasonable margin. In developing SSP estimates, we also consider the nature of the products and services and the expected level of future services.
Determining the revenue recognition period for unspecified software upgrades and cloud services also requires judgment. We recognize revenue attributable to these performance obligations ratably over the best estimate of the period that the customer is expected to receive the services. In developing the estimated period of providing future services, we consider our past history, our plans to continue to provide services, including plans to continue to support updates and enhancements to prior versions of our products, expected technological developments, obsolescence, competition and other factors. The estimated service period may change in the future in response to competition, technology developments and our business strategy.
We offer sales incentives through various programs, consisting primarily of discounts, cooperative advertising and market development fund programs. We record cooperative advertising and market development fund programs with customers as a reduction to revenue unless it receives a distinct benefit in exchange for credits claimed by the customer and can reasonably estimate the fair value of the benefit received, in which case we record it as an expense. We recognize a liability, or a reduction to accounts receivable, and reduce revenue for sales incentives based on the estimated amount of sales incentives that will be claimed by customers. Estimates for sales incentives are developed using the most likely amount and are included in the transaction price to the extent that a significant reversal of revenue would not result once the uncertainty is resolved. In developing its estimate, we also consider the susceptibility of the incentive to outside influences, the length of time until the uncertainty is resolved, our experience with similar contracts and the range of possible outcomes. Reductions in revenue related to discounts are allocated to products and services on a relative basis based on their respective SSP. Judgment is required to determine the timing and amount of recognition of marketing funds which we estimate based on past practice of providing similar funds.
We accept returns from direct customers and from certain resellers. To establish an estimate for returns, we use the expected value method by considering a portfolio of contracts with similar characteristics to calculate the historical returns rate. When determining the expected value of returns, we consider future business initiatives and relevant anticipated future events.
51
Inventories
Inventories consist of finished goods and component parts, which are purchased from contract manufacturers and component suppliers. Inventories are stated at the lower of cost or market and net realizable value on a first-in, first-out basis. We assess the valuation of inventory balances including an assessment to determine potential excess and/or obsolete inventory. We may be required to write down the value of inventory if estimates of future demand and market conditions indicate estimated excess and/or obsolete inventory.
Product warranties
Our products are covered by warranty to be free from defects in material and workmanship for a period of one year, except for products sold in the EU and select other countries where we provide a two-year warranty. At the time of sale, an estimate of future warranty costs is recorded as a component of the cost of revenue. Our estimate of costs to fulfill our warranty obligations is based on historical experience and expectations of future costs to repair or replace.
Income taxes
Our income tax expense, deferred tax assets and liabilities and liabilities for unrecognized tax benefits reflect our best estimate of current and future taxes to be paid. Significant judgments and estimates are required in the determination of the consolidated income tax expense.
We prepare and file income tax returns based on our interpretation of each jurisdiction’s tax laws and regulations. In preparing our consolidated financial statements, we estimate our income tax liability in each of the jurisdictions in which we operate by estimating our actual current tax expense together with assessing temporary differences resulting from differing treatment of items for tax and financial reporting purposes. These differences result in deferred tax assets and liabilities, which are included in our consolidated balance sheets. Significant management judgment is required in assessing the realizability of our deferred tax assets. In performing this assessment, we consider whether it is more likely than not that some portion or all of the deferred tax assets will not be realized. The ultimate realization of deferred tax assets is dependent upon the generation of future taxable income during the periods in which those temporary differences become deductible. In making this determination, we consider the scheduled reversal of deferred tax liabilities, projected future taxable income and the effects of tax planning strategies. We recorded a valuation allowance against all of our U.S. deferred tax assets and certain of our foreign deferred tax assets as of September 29, 2018. We intend to continue maintaining a full valuation allowance on our U.S. and certain foreign deferred tax assets until there is sufficient evidence to support the reversal of all or some portion of these allowances.
We account for uncertain tax positions using a "more-likely-than-not" threshold for recognizing and resolving uncertain tax positions. We evaluate uncertain tax positions on a quarterly basis and consider various factors, that include, but are not limited to, changes in tax law, the measurement of tax positions taken or expected to be taken in tax returns, the effective settlement of matters subject to audit, information obtained during in process audit activities and changes in facts or circumstances related to a tax position. We accrue for potential interest and penalties related to unrecognized tax benefits in income tax expense.
Our policy with respect to the undistributed earnings of our non-U.S. subsidiaries is to maintain an indefinite reinvestment assertion as they are required to fund needs outside of the United States and cannot be repatriated in a manner that is substantially tax-free. This assertion is made on a jurisdiction by jurisdiction basis and takes into account the liquidity requirements in both the United States and of our foreign subsidiaries. If we decide to repatriate funds to the United States in the future to execute our growth initiatives or to fund any other liquidity needs, the resulting tax consequences could negatively impact our results of operations through a higher effective tax rate and dilution of our earnings.
Stock-based compensation
We measure stock-based compensation cost at fair value on the date of grant. We estimate the fair value of stock option awards using the Black-Scholes option-pricing model. Compensation cost for stock options is recognized, on a straight-line basis, as expense over the period of vesting as the employee performs the related services, net of estimated forfeitures.
Determining the fair value of stock-based awards at the grant date requires judgment. Our use of the Black-Scholes model requires the input of assumptions, including the fair value of the underlying common stock, the expected common stock price volatility over the expected life of the options, the expected term of the stock option, risk-free interest rates and expected dividends.
Prior to our IPO, the fair value of the common stock underlying our stock options was determined by the Board. The valuations of our common stock were determined in accordance with the guidelines outlined in the American Institute of Certified
52
Public Accountants Practice Aid, Valuation of Privately-Held-Company Equity Securities Issued as Compensation. The Board, with input from management, exercised significant judgment and considered numerous objective and subjective factors to determine the fair value of our common stock at each grant date, including but not limited to the prices, rights, preferences and privileges of our preferred stock relative to the common stock, our operating and financial performance, current business conditions and projections, our stage of development, likelihood of achieving a liquidity event for the shares of common stock underlying these stock options, such as an IPO or sale of our company, given prevailing market conditions, any adjustment necessary to recognize a lack of marketability of the common stock underlying the granted options, the market performance of comparable publicly traded companies and U.S. and global capital market conditions.
Subsequent to our IPO, we use the market closing price for our common stock as reported on The Nasdaq Global Select Market on the date of grant.
We estimate the expected volatility of the common stock underlying our stock options at the grant date by taking the average historical volatility of a group of comparable publicly traded companies over a period equal to the expected life of the options.
We do not have sufficient historical exercise data to provide a reasonable basis upon which to estimate expected term. As a result, we use the simplified method, which is the average of the options’ vesting and contractual terms.
The risk-free interest rate is the estimated average interest rate based on U.S. Treasury zero-coupon notes with terms consistent with the expected term of the awards.
The expected dividend yield is zero as we do not presently plan to pay cash dividends in the foreseeable future.
The assumptions used in calculating the fair value of stock-based awards represent our best estimates, but these estimates involve inherent uncertainties and the application of judgment. As a result, if factors change or we use different assumptions, stock-based compensation expense could be materially different in the future.
The following table summarizes the weighted-average assumptions used in estimating the grant date fair value of our stock options:
Fiscal Year Ended | |||||||||
September 29, 2018 | September 30, 2017 | October 1, 2016 | |||||||
Expected term (years) | 6.25 | 6.25 | 6.25 | ||||||
Risk-free interest rate | 2.73 | % | 1.95 | % | 1.29 | % | |||
Expected volatility | 30.19 | % | 32.40 | % | 36.64 | % | |||
Expected dividend yield | — | % | — | % | — | % | |||
In addition, we estimate at the time of grant the expected forfeiture rate and only recognize expense for those stock-based awards expected to vest. We estimate the forfeiture rate of our stock-based awards based on an analysis of our actual and historical forfeitures and other factors such as employee turnover. The impact from a forfeiture rate adjustment would be recognized in the period in which the forfeiture rate changes and, if the actual number of future forfeitures differs from our prior estimates, we may be required to record adjustments to stock-based compensation.
53
Item 7A. Quantitative and qualitative disclosures about market risk
We are exposed to market risks in the ordinary course of our business. These risks primarily include interest rate and foreign currency risks as follows:
Interest rate risk
As of September 29, 2018, we had cash and cash equivalents of $220.9 million, which consisted primarily of cash on hand and bank deposits. Such interest-earning instruments carry a degree of interest rate risk due to floating interest rates. However, historical fluctuations of interest income have not been significant.
As of September 29, 2018, we had indebtedness of $39.8 million. The borrowings bore interest at a rate of 4.8% as of September 29, 2018.
To date, we have not been exposed, nor do we anticipate being exposed, to material risks due to changes in interest rates. A hypothetical 10% change in interest rates during any of the periods presented would not have had a material impact on our consolidated financial statements.
Foreign currency risk
To date, all of our inventory purchases have been denominated in U.S. dollars. Our international sales are primarily denominated in foreign currencies and any unfavorable movement in the exchange rate between the U.S. dollar and the currencies in which we conduct sales in foreign countries could have an adverse impact on our revenue, principally for sales denominated in the euro and the British pound. A portion of our operating expenses are incurred outside the United States and are denominated in foreign currencies, which are also subject to fluctuations due to changes in foreign currency exchange rates. In addition, our suppliers incur many costs, including labor costs, in other currencies. To the extent that exchange rates move unfavorably for our suppliers, they may seek to pass these additional costs on to us, which could have a material impact on our gross margin. In addition, a strengthening of the U.S. dollar may increase the cost of our products to our customers outside of the United States. Our operating results and cash flows are, therefore, subject to fluctuations due to changes in foreign currency exchange rates. However, we believe that the exposure to foreign currency fluctuation from operating expenses is relatively small at this time as the related costs do not constitute a significant portion of our total expenses.
We recognized a net loss from foreign currency of $1.2 million in fiscal 2018, a net gain from foreign currency of $3.2 million in fiscal 2017 and a net loss from foreign currency of $2.2 million in fiscal 2016. Based on transactions denominated in currencies other than respective functional currencies as of September 29, 2018, a hypothetical adverse change of 10% would have resulted in an adverse impact on income before income taxes of approximately $10.8 million for the fiscal year ended September 29, 2018.
At this time we do not, but we may in the future, enter into derivatives or other financial instruments in an attempt to hedge our foreign currency exchange risk. It is difficult to predict the impact hedging activities could have on our results of operations.
Recent accounting pronouncements
See Note 2 of the notes to our consolidated financial statements included elsewhere in this Annual Report on Form 10-K for a discussion of recent accounting pronouncements.
54
Item 8. Financial statements and supplementary data
INDEX TO CONSOLIDATED FINANCIAL STATEMENTS
Page | |
55
Report of Independent Registered Public Accounting Firm
To the Board of Directors and Stockholders of Sonos, Inc.
Opinion on the Financial Statements
We have audited the accompanying consolidated balance sheets of Sonos, Inc. and its subsidiaries (the “Company”) as of September 29, 2018 and September 30, 2017, and the related consolidated statements of operations and comprehensive loss, of redeemable convertible preferred stock and stockholders’ equity (deficit) and of cash flows for each of the three years in the period ended September 29, 2018, including the related notes (collectively referred to as the “consolidated financial statements”). In our opinion, the consolidated financial statements present fairly, in all material respects, the financial position of the Company as of September 29, 2018 and September 30, 2017, and the results of its operations and its cash flows for each of the three years in the period ended September 29, 2018 in conformity with accounting principles generally accepted in the United States of America.
Change in Accounting Principle
As discussed in Note 2 to the consolidated financial statements, the Company changed the manner in which it accounts for revenues from contracts with customers in fiscal year 2018.
Basis for Opinion
These consolidated financial statements are the responsibility of the Company’s management. Our responsibility is to express an opinion on the Company’s consolidated financial statements based on our audits. We are a public accounting firm registered with the Public Company Accounting Oversight Board (United States) (PCAOB) and are required to be independent with respect to the Company in accordance with the U.S. federal securities laws and the applicable rules and regulations of the Securities and Exchange Commission and the PCAOB.
We conducted our audits of these consolidated financial statements in accordance with the standards of the PCAOB. Those standards require that we plan and perform the audit to obtain reasonable assurance about whether the consolidated financial statements are free of material misstatement, whether due to error or fraud.
Our audits included performing procedures to assess the risks of material misstatement of the consolidated financial statements, whether due to error or fraud, and performing procedures that respond to those risks. Such procedures included examining, on a test basis, evidence regarding the amounts and disclosures in the consolidated financial statements. Our audits also included evaluating the accounting principles used and significant estimates made by management, as well as evaluating the overall presentation of the consolidated financial statements. We believe that our audits provide a reasonable basis for our opinion.
/s/ PricewaterhouseCoopers LLP
Los Angeles, California
November 28, 2018
We have served as the Company's auditor since 2011, which includes periods before the Company became subject to SEC reporting requirements.
56
SONOS, INC.
CONSOLIDATED BALANCE SHEETS
(in thousands, except share and par values)
As of | |||||||
September 29, 2018 | September 30, 2017 | ||||||
Assets | |||||||
Current assets: | |||||||
Cash and cash equivalents | $ | 220,930 | $ | 130,595 | |||
Restricted cash | 190 | 193 | |||||
Accounts receivable, net | 73,214 | 47,363 | |||||
Inventories | 193,193 | 113,856 | |||||
Prepaid and other current assets | 10,073 | 9,462 | |||||
Total current assets | 497,600 | 301,469 | |||||
Property and equipment, net | 85,371 | 95,130 | |||||
Deferred tax assets | 941 | 1,107 | |||||
Other noncurrent assets | 3,586 | 2,314 | |||||
Total assets | $ | 587,498 | $ | 400,020 | |||
Liabilities, redeemable convertible preferred stock and stockholders’ equity | |||||||
Current liabilities: | |||||||
Accounts payable | $ | 195,159 | $ | 114,494 | |||
Accrued expenses | 38,687 | 57,348 | |||||
Accrued compensation | 33,371 | 32,007 | |||||
Short-term debt | 6,667 | — | |||||
Deferred revenue | 11,615 | 10,920 | |||||
Other current liabilities | 10,858 | 8,497 | |||||
Total current liabilities | 296,357 | 223,266 | |||||
Long-term debt | 33,097 | 39,600 | |||||
Deferred revenue | 39,352 | 34,647 | |||||
Other noncurrent liabilities | 10,334 | 12,139 | |||||
Total liabilities | 379,140 | 309,652 | |||||
Commitments and contingencies (Note 11) | |||||||
Redeemable convertible preferred stock, $0.001 par value; liquidation preference of $90,976 as of September 30, 2017; 0 and 32,675,074 shares authorized; 0 and 32,482,590 shares issued and outstanding as of September 29, 2018 and September 30, 2017, respectively | — | 90,341 | |||||
Stockholders’ equity: | |||||||
Common stock, $0.001 par value; 500,000,000 and 151,458,824 shares authorized 100,868,250 and 59,339,336 shares issued; 100,061,210 and 58,592,874 shares outstanding, as of September 29, 2018 and September 30, 2017, respectively | 101 | 59 | |||||
Treasury stock, 807,040 and 746,462 shares at cost as of September 29, 2018 and September 30, 2017, respectively | (11,072 | ) | (10,161 | ) | |||
Additional paid-in capital | 424,617 | 200,301 | |||||
Accumulated deficit | (203,611 | ) | (188,007 | ) | |||
Accumulated other comprehensive loss | (1,677 | ) | (2,165 | ) | |||
Total stockholders’ equity | 208,358 | 27 | |||||
Total liabilities, redeemable convertible preferred stock and stockholders’ equity | $ | 587,498 | $ | 400,020 | |||
The accompanying notes are an integral part of these consolidated financial statements.
57
SONOS, INC.
CONSOLIDATED STATEMENTS OF OPERATIONS AND COMPREHENSIVE LOSS
(in thousands, except share and per share data)
Year Ended | |||||||||||
September 29, 2018 | September 30, 2017 | October 1, 2016 | |||||||||
Revenue | $ | 1,137,008 | $ | 992,526 | $ | 901,284 | |||||
Cost of revenue | 647,700 | 536,461 | 497,885 | ||||||||
Gross profit | 489,308 | 456,065 | 403,399 | ||||||||
Operating expenses | |||||||||||
Research and development | 142,109 | 124,394 | 107,729 | ||||||||
Sales and marketing | 270,869 | 270,162 | 258,012 | ||||||||
General and administrative | 85,205 | 77,118 | 68,531 | ||||||||
Total operating expenses | 498,183 | 471,674 | 434,272 | ||||||||
Operating loss | (8,875 | ) | (15,609 | ) | (30,873 | ) | |||||
Other income (expense), net | |||||||||||
Interest expense, net | (4,511 | ) | (4,260 | ) | (2,489 | ) | |||||
Other income (expense), net | (1,162 | ) | 3,361 | (2,208 | ) | ||||||
Total other expense, net | (5,673 | ) | (899 | ) | (4,697 | ) | |||||
Loss before provision for (benefit from) income taxes | (14,548 | ) | (16,508 | ) | (35,570 | ) | |||||
Provision for (benefit from) income taxes | 1,056 | (2,291 | ) | 2,644 | |||||||
Net loss | $ | (15,604 | ) | $ | (14,217 | ) | $ | (38,214 | ) | ||
Net loss per share attributable to common stockholders - basic and diluted | $ | (0.24 | ) | $ | (0.25 | ) | $ | (0.71 | ) | ||
Weighted-average shares used in computing net loss per share attributable to common stockholders - basic and diluted | 65,706,215 | 56,314,546 | 53,873,051 | ||||||||
Total comprehensive loss | |||||||||||
Net loss | $ | (15,604 | ) | $ | (14,217 | ) | $ | (38,214 | ) | ||
Change in foreign currency translation adjustment, net of tax | 488 | (2,486 | ) | (203 | ) | ||||||
Comprehensive loss | $ | (15,116 | ) | $ | (16,703 | ) | $ | (38,417 | ) | ||
The accompanying notes are an integral part of these consolidated financial statements.
58
SONOS, INC.
CONSOLIDATED STATEMENTS OF REDEEMABLE CONVERTIBLE PREFERRED STOCK AND STOCKHOLDERS’ EQUITY (DEFICIT)
(in thousands, except share amounts)
Redeemable Convertible Preferred Stock | Common Stock | Additional Paid-In Capital | Treasury Stock | Accumulated Deficit | Accumulated Other Comprehensive Loss | Total Stockholders’ Equity (Deficit) | |||||||||||||||||||||||||||||||
Shares | Amount | Shares | Amount | Shares | Amount | ||||||||||||||||||||||||||||||||
Balance at October 3, 2015 | 32,395,828 | $ | 88,637 | 78,546,014 | $ | 79 | $ | 333,459 | (24,982,950 | ) | $ | (218,345 | ) | $ | (135,576 | ) | $ | 524 | $ | (19,859 | ) | ||||||||||||||||
Net exercise of Series C preferred stock warrants | 86,762 | 1,704 | — | — | — | — | — | — | — | — | |||||||||||||||||||||||||||
Exercise of stock options | — | — | 1,278,150 | 1 | 3,669 | — | — | — | — | 3,670 | |||||||||||||||||||||||||||
Retirement of treasury stock | — | — | (24,982,950 | ) | (25 | ) | (218,320 | ) | 24,982,950 | 218,345 | — | — | — | ||||||||||||||||||||||||
Purchase of treasury stock | — | — | — | — | — | (7,780 | ) | (145 | ) | — | — | (145 | ) | ||||||||||||||||||||||||
Stock-based compensation expense | — | — | — | — | 25,963 | — | — | — | — | 25,963 | |||||||||||||||||||||||||||
Net loss | — | — | — | — | — | — | — | (38,214 | ) | — | (38,214 | ) | |||||||||||||||||||||||||
Change in foreign currency translation adjustment | — | — | — | — | — | — | — | — | (203 | ) | (203 | ) | |||||||||||||||||||||||||
Balance at October 1, 2016 | 32,482,590 | 90,341 | 54,841,214 | 55 | 144,771 | (7,780 | ) | (145 | ) | (173,790 | ) | 321 | (28,788 | ) | |||||||||||||||||||||||
Common stock issued, net of issuance costs | — | — | 742,034 | 1 | 10,077 | — | — | — | — | 10,078 | |||||||||||||||||||||||||||
Exercise of stock options | — | — | 3,756,088 | 3 | 8,903 | — | — | — | — | 8,906 | |||||||||||||||||||||||||||
Purchase of treasury stock | — | — | — | — | — | (738,682 | ) | (10,016 | ) | — | — | (10,016 | ) | ||||||||||||||||||||||||
Stock-based compensation expense | — | — | — | — | 36,550 | — | — | — | — | 36,550 | |||||||||||||||||||||||||||
Net loss | — | — | — | — | — | — | — | (14,217 | ) | — | (14,217 | ) | |||||||||||||||||||||||||
Change in foreign currency translation adjustment | — | — | — | — | — | — | — | — | (2,486 | ) | (2,486 | ) | |||||||||||||||||||||||||
Balance at September 30, 2017 | 32,482,590 | 90,341 | 59,339,336 | 59 | 200,301 | (746,462 | ) | (10,161 | ) | (188,007 | ) | (2,165 | ) | 27 | |||||||||||||||||||||||
Issuance of common stock upon initial public offering, net of offering costs | — | — | 6,388,888 | 6 | 86,021 | — | — | — | — | 86,027 | |||||||||||||||||||||||||||
Conversion of redeemable convertible preferred stock to common stock upon initial public offering | (32,482,590 | ) | (90,341 | ) | 32,482,590 | 33 | 90,308 | — | — | — | — | 90,341 | |||||||||||||||||||||||||
Exercise of stock options | — | — | 2,657,436 | 3 | 9,342 | — | — | — | — | 9,345 | |||||||||||||||||||||||||||
Purchase of treasury stock | — | — | — | — | — | (60,578 | ) | (911 | ) | — | — | (911 | ) | ||||||||||||||||||||||||
Stock-based compensation expense | — | — | — | — | 38,645 | — | — | — | — | 38,645 | |||||||||||||||||||||||||||
Net loss | — | — | — | — | — | — | — | (15,604 | ) | — | (15,604 | ) | |||||||||||||||||||||||||
Change in foreign currency translation adjustment | — | — | — | — | — | — | — | — | 488 | 488 | |||||||||||||||||||||||||||
Balance at September 29, 2018 | — | $ | — | 100,868,250 | $ | 101 | $ | 424,617 | (807,040 | ) | $ | (11,072 | ) | $ | (203,611 | ) | $ | (1,677 | ) | $ | 208,358 | ||||||||||||||||
The accompanying notes are an integral part of these consolidated financial statements.
59
SONOS, INC.
CONSOLIDATED STATEMENTS OF CASH FLOWS
(in thousands)
Year Ended | |||||||||||
September 29, 2018 | September 30, 2017 | October 1, 2016 | |||||||||
Cash flows from operating activities | |||||||||||
Net loss | $ | (15,604 | ) | $ | (14,217 | ) | $ | (38,214 | ) | ||
Adjustments to reconcile net loss to net cash provided by operating activities: | |||||||||||
Depreciation | 39,358 | 35,014 | 34,323 | ||||||||
Stock-based compensation expense | 38,645 | 36,550 | 25,963 | ||||||||
Other | 1,676 | 713 | 4,098 | ||||||||
Deferred income taxes | 152 | 1,443 | (857 | ) | |||||||
Foreign currency transaction (gain) loss | 941 | (3,568 | ) | 782 | |||||||
Changes in operating assets and liabilities: | |||||||||||
Accounts receivable, net | (26,505 | ) | (2,727 | ) | (4,590 | ) | |||||
Inventories, net | (80,107 | ) | (60,270 | ) | 5,878 | ||||||
Other assets | (2,140 | ) | 36 | 2,908 | |||||||
Accounts payable and accrued expenses | 66,473 | 54,895 | (5,715 | ) | |||||||
Accrued compensation | 1,625 | 5,123 | 2,094 | ||||||||
Deferred revenue | 5,566 | 9,411 | 8,556 | ||||||||
Other liabilities | 490 | 1,557 | 8,068 | ||||||||
Net cash provided by operating activities | 30,570 | 63,960 | 43,294 | ||||||||
Cash flows from investing activities | |||||||||||
Purchases of property and equipment | (35,747 | ) | (33,553 | ) | (52,520 | ) | |||||
Net cash used in investing activities | (35,747 | ) | (33,553 | ) | (52,520 | ) | |||||
Cash flows from financing activities | |||||||||||
Proceeds from initial public offering, net of underwriting discounts and commissions | 90,562 | — | — | ||||||||
Payments of offering costs | (3,950 | ) | — | — | |||||||
Proceeds from issuance of common stock, net of issuance costs | — | 10,078 | — | ||||||||
Proceeds from exercise of stock options | 9,345 | 8,906 | 3,670 | ||||||||
Payments for purchase of treasury stock | (911 | ) | (10,016 | ) | (145 | ) | |||||
Proceeds from borrowings, net of borrowing costs | 69,748 | 14,987 | 89,844 | ||||||||
Repayments of borrowings | (70,000 | ) | — | (85,400 | ) | ||||||
Payments for debt extinguishment costs | (420 | ) | — | — | |||||||
Net cash provided by financing activities | 94,374 | 23,955 | 7,969 | ||||||||
Effect of exchange rate changes on cash and cash equivalents | 1,138 | 1,320 | (182 | ) | |||||||
Net increase (decrease) in cash and cash equivalents | 90,335 | 55,682 | (1,439 | ) | |||||||
Cash and cash equivalents | |||||||||||
Beginning of period | 130,595 | 74,913 | 76,352 | ||||||||
End of period | $ | 220,930 | $ | 130,595 | $ | 74,913 | |||||
Supplemental disclosure | |||||||||||
Cash paid for interest | $ | 3,750 | $ | 4,114 | $ | 2,326 | |||||
Cash paid for taxes, net of refunds | $ | 1,430 | $ | 461 | $ | 233 | |||||
Supplemental disclosure of non-cash investing and financing activities | |||||||||||
Conversion of redeemable convertible preferred stock to common stock | $ | 90,341 | $ | — | $ | — | |||||
Purchases of property and equipment, accrued but not paid | $ | 4,075 | $ | 9,665 | $ | 3,939 | |||||
Net exercise of Series C preferred stock warrants | $ | — | $ | — | $ | 1,704 | |||||
Deferred offering costs in accounts payable and accrued expenses | $ | 585 | $ | — | $ | — | |||||
The accompanying notes are an integral part of these consolidated financial statements.
60
SONOS, INC.
NOTES TO CONSOLIDATED FINANCIAL STATEMENTS
1. Business overview
Description of business
Sonos, Inc. and its wholly owned subsidiaries (collectively, "Sonos" or the "Company") designs, develops, manufactures and sells multi-room audio products . The Sonos sound system provides customers with an immersive listening experience created by the design of its speakers and components, a proprietary software platform and the ability to stream content from a variety of sources throughout the home over the customer’s wireless network.
The Company’s products are sold through third-party retail stores, including custom installers of home audio systems. The Company also sells through select e-commerce retailers and its website sonos.com. The Company’s products are distributed in over 50 countries through its wholly owned subsidiaries: Sonos Europe B.V., Beijing Sonos Technology Co., Ltd. and Sonos Australia Pty Ltd., located in the Netherlands, China and Australia, respectively.
Initial public offering
On August 6, 2018, the Company completed its initial public offering ("IPO") of its common stock, in which it sold 6,388,888 shares of its common stock, including 833,333 shares of its common stock pursuant to the underwriters’ over-allotment option, and selling stockholders sold 9,583,333 shares of the Company's common stock, including 1,250,000 shares pursuant to the underwriters' over-allotment option. The shares were sold at the IPO price of $15.00 per share for net proceeds of $90.6 million, after deducting underwriting discounts and commissions of $5.3 million. Additionally, offering costs incurred by the Company totaled approximately $4.6 million. Upon the closing of the IPO, all outstanding shares of the Company's redeemable convertible preferred stock automatically converted into 32,482,590 shares of common stock on a one-for-one basis.
2. Summary of significant accounting policies
Basis of presentation and preparation
The consolidated financial statements, which include the accounts of Sonos, Inc. and its wholly owned subsidiaries, have been prepared in conformity with accounting principles generally accepted in the United States ("U.S. GAAP"). All intercompany accounts and transactions have been eliminated in consolidation.
The Company has a 4-4-5 fiscal year ending on the Saturday nearest September 30 each year. The Company’s fiscal year is divided into four quarters of 13 weeks, each beginning on a Sunday and containing two 4-week months followed by a 5-week "month." An additional week is included in the fourth fiscal quarter approximately every five years to realign fiscal quarters with calendar quarters. This occurred last in the fourth quarter of the Company’s fiscal year ended October 3, 2015. References to fiscal 2018 are to the Company’s fiscal year ended September 29, 2018, references to fiscal 2017 are to the Company’s fiscal year ended September 30, 2017 and references to fiscal 2016 are to the Company’s fiscal year ended October 1, 2016.
61
SONOS, INC.
NOTES TO CONSOLIDATED FINANCIAL STATEMENTS (CONTINUED)
Stock split
On July 19, 2018, the Company effected a two-for-one stock split of all outstanding shares of the Company’s capital stock, including its common stock and its redeemable convertible preferred stock. All share and per share information presented in the consolidated financial statements have been retroactively adjusted for all periods presented for the effects of the stock split.
Use of estimates and judgments
The preparation of financial statements in conformity with U.S. GAAP requires management to make estimates and judgments that affect the amounts reported and disclosed in the consolidated financial statements and accompanying notes. Actual results could differ materially from those estimates. For revenue recognition, examples of estimates and judgments include: determining the nature and timing of satisfaction of performance obligations, determining the standalone selling price ("SSP") of performance obligations, estimating variable consideration such as sales incentives, and product returns. Additionally, estimates and judgments are made by management for allowances for doubtful accounts, the market value of and demand for inventory, useful lives associated with property and equipment, valuation allowances with respect to deferred tax assets and uncertain tax positions, impairment of long-lived assets, goodwill impairment, warranty, contingencies and valuation and assumptions underlying stock-based compensation and other equity instruments. On an ongoing basis, the Company evaluates its estimates and judgments compared to historical experience and trends that form the basis for making estimates and judgments about the carrying value of assets and liabilities.
Comprehensive income (loss)
Comprehensive income (loss) consists of two components: net income (loss) and other comprehensive income (loss), net of tax. Other comprehensive income (loss), net of tax refers to net gains and losses that are recorded as an element of stockholders’ equity (deficit), but are excluded from net income (loss). The Company’s other comprehensive income (loss), net of tax consists of net unrealized gains and losses on foreign currency translation adjustments from those subsidiaries not using the U.S. dollar as their functional currency.
Cash and cash equivalents
Cash equivalents consist of short-term, highly liquid financial instruments with insignificant interest rate risk that are readily convertible to cash and have maturities of three months or less from the date of purchase. As of September 29, 2018 and September 30, 2017, cash equivalents consisted of money market funds, which are recorded at fair value.
Restricted cash
The Company held $0.2 million in restricted cash as of September 29, 2018 and September 30, 2017, representing security deposits on real estate leases.
Accounts receivable
Accounts receivable are recorded at the invoiced amount less allowances for doubtful accounts and sales incentives, do not require collateral and do not bear interest.
The allowance for doubtful accounts is established through a provision for net bad debt expense which is recorded in general and administrative expense in the consolidated statements of operations and comprehensive loss. The Company determines the adequacy of the allowance for doubtful accounts by evaluating customer accounts receivable balances as well as the customer’s financial condition, credit history and current economic conditions. This estimate is periodically adjusted as a result of the aforementioned process, or when the Company becomes aware of a specific customer’s inability to meet its financial obligations.
62
SONOS, INC.
NOTES TO CONSOLIDATED FINANCIAL STATEMENTS (CONTINUED)
Accounts receivable allowances
The following table summarizes changes in the allowance for doubtful accounts for fiscal 2018, 2017 and 2016:
2018 | 2017 | 2016 | ||||||||||
(In thousands) | ||||||||||||
Beginning balance | $ | 804 | $ | 726 | $ | 679 | ||||||
Increases | 635 | 449 | 962 | |||||||||
Write-offs | (567 | ) | (371 | ) | (915 | ) | ||||||
Ending balance | $ | 872 | $ | 804 | $ | 726 | ||||||
The following table summarizes the changes in the allowance for sales incentives for fiscal 2018, 2017 and 2016:
2018 | 2017 | 2016 | ||||||||||
(In thousands) | ||||||||||||
Beginning balance | $ | 11,195 | $ | 8,913 | $ | 6,235 | ||||||
Charged to revenue | 90,246 | 65,879 | 34,627 | |||||||||
Utilization of sales incentive allowance | (89,687 | ) | (63,597 | ) | (31,949 | ) | ||||||
Ending balance | $ | 11,754 | $ | 11,195 | $ | 8,913 | ||||||
Concentration of credit risk
Financial instruments that potentially subject the Company to significant concentrations of credit risk consist principally of cash and cash equivalents and accounts receivable. The Company maintains cash and cash equivalents in several high-quality financial institutions. Cash and cash equivalents held at these banks, including those held in foreign branches of global banks, may exceed the amount of insurance provided on such deposits. These deposits may be redeemed upon demand and management believes that the financial institutions that hold the Company’s cash and cash equivalents are financially sound and, accordingly, minimal credit risk exists with respect to cash. The Company has not experienced any losses in such accounts.
As of September 29, 2018 and September 30, 2017, the Company’s customers that accounted for 10% or more of total accounts receivable, net, were as follows:
Accounts receivable, net | ||||||
2018 | 2017 | |||||
Customer A | 31 | % | 26 | % | ||
Customer B | 13 | % | 16 | % | ||
Customer C | 11 | % | * | |||
* Accounts receivable was less than 10%.
The Company’s customers that accounted for 10% or more of total revenue were as follows:
Revenue | |||||||||
Year Ended | |||||||||
2018 | 2017 | 2016 | |||||||
Customer A | 17 | % | 16 | % | 17 | % | |||
Customer C | 10 | % | 12 | % | 11 | % | |||
Inventories
Inventories primarily consist of finished goods and to a lesser extent component parts, which are purchased from contract manufacturers and component suppliers. Inventories are stated at lower of cost and net realizable value on a first-in, first-out basis. The Company assesses the valuation of inventory balances including an assessment to determine potential excess and/or obsolete inventory. The Company may be required to write down the value of inventory if estimates of future demand and
63
SONOS, INC.
NOTES TO CONSOLIDATED FINANCIAL STATEMENTS (CONTINUED)
market conditions indicate estimated excess and/ or obsolete inventory. For the periods presented, the Company has not experienced significant write-downs.
Property and equipment, net
Property and equipment are stated at historical cost less accumulated depreciation. Depreciation is calculated using the straight-line method over the estimated useful lives of the related assets as follows:
Computer hardware and software | 2-3 years |
Furniture and fixtures | 3-5 years |
Tooling and production line test equipment | 2-4 years |
Leasehold improvements | 2-10 years |
Product displays | 1-3 years |
Costs incurred to improve leased office space are capitalized. Leasehold improvements are amortized on a straight-line basis over the shorter of the term of the lease or the estimated useful life of the improvement. Expenditures for major renewals and improvements that extend the useful lives of property and equipment are capitalized. Maintenance, repair costs and gains or losses associated with disposals are charged to expense as incurred.
Product displays are deployed at retail locations. Because the product displays facilitate marketing of the Company’s products within the retail stores, depreciation for product displays is recorded in sales and marketing expenses in the consolidated statements of operations and comprehensive loss.
Impairment of long-lived assets
The Company evaluates the recoverability of its long-lived assets, primarily comprised of property and equipment, for impairment whenever events or changes in circumstances indicate that the carrying amounts may not be recoverable. The Company performs impairment testing at the level that represents the lowest level for which identifiable cash flows are largely independent of the cash flows of other assets and liabilities. Recoverability is measured by comparing the carrying amounts to the expected future undiscounted cash flows attributable to the assets. If it is determined that an asset may not be recoverable, an impairment loss equal to the excess of the asset’s carrying value over its fair value is recorded. Fair value is determined based upon estimated discounted future cash flows. There were no impairment charges identified on the Company’s long-lived assets for each period presented.
Product warranties
The Company’s products are covered by warranty to be free from defects in material and workmanship for a period of one year, except for products sold in the European Union where the Company provides a two-year warranty. At the time of sale, an estimate of future warranty costs is recorded as a component of cost of revenue and a warranty liability is recorded for estimated costs to satisfy the warranty obligation. The Company’s estimate of costs to fulfill its warranty obligations is based on historical experience and expectations of future costs to repair or replace.
Legal contingencies
If a potential loss from any claim or legal proceeding is considered probable, and the amount can be reasonably estimated, the Company accrues a liability for an estimated loss. Legal fees are expensed as incurred and included in general and administrative expenses in the consolidated statements of operations and comprehensive loss. See Note 11 for additional information regarding legal contingencies.
Treasury stock
The Company accounts for treasury stock acquisitions using the cost method. The Company accounts for the retirement of treasury stock by deducting its par value from common stock and reflecting any excess of cost over par value as a deduction from additional paid-in capital on the consolidated balance sheets.
64
SONOS, INC.
NOTES TO CONSOLIDATED FINANCIAL STATEMENTS (CONTINUED)
Fair value accounting
Assets and liabilities recorded at fair value on the consolidated balance sheets are categorized based upon the level of judgment associated with the inputs used to measure their fair value.
Fair value is estimated by applying the following hierarchy, which prioritizes the inputs used to measure fair value into three levels and bases the categorization within the hierarchy upon the lowest level of input that is available and significant to the fair value measurement:
Level Input | Input Definition | |
Level 1 | Quoted prices for identical assets or liabilities in active markets at the measurement date. | |
Level 2 | Inputs, other than quoted prices included in Level 1, such as quoted prices for similar assets or liabilities, in active markets or other inputs that are observable or can be corroborated with market data at the measurement date. | |
Level 3 | Unobservable inputs that reflect management's best estimate of what market participants would use in pricing the asset or liability at the measurement date. | |
Foreign currency
Certain of the Company’s wholly owned subsidiaries have non-U.S. dollar functional currencies. The Company translates assets and liabilities of non-U.S. dollar functional currency subsidiaries into U.S. dollars using exchange rates in effect at the end of each period and stockholders’ equity (deficit) at historical rates. Revenue and expenses for these subsidiaries are translated using rates that approximate those in effect during the period. Gains and losses from translation are recognized in foreign currency translation included in accumulated other comprehensive income (loss).
The Company remeasures monetary assets or liabilities denominated in currencies other than the functional currency using exchange rates prevailing on the balance sheet date, and non-monetary assets and liabilities at historical rates. Foreign currency remeasurement and transaction gains and losses are included in other income (expense), net.
Foreign currency remeasurement and transaction gains (losses) are recorded in other income (expense), net and were $(1.2) million, $3.2 million and $(2.2) million for fiscal 2018, 2017 and 2016, respectively.
Revenue recognition
Revenue is recognized upon transfer of control of promised products or services to customers in an amount that reflects the consideration the Company expects to receive in exchange for those products or services. The Company generally enters into contracts that include a combination of products and services. Revenue is allocated to distinct performance obligations and is recognized net of allowances for returns, discounts, sales incentives and any taxes collected from customers, which are subsequently remitted to governmental authorities. Shipping and handling costs associated with outbound freight after control over a product has transferred to a customer are accounted for as a fulfillment cost and are included in cost of revenue. As of September 29, 2018 and September 30, 2017, the Company did not have any material assets related to incremental costs to obtain or fulfill customer contracts.
Nature of products and services
Product revenue includes sales of wireless speakers, home theater speakers and audio components, which include software that enables the Company’s products to operate over a customer’s wireless network, as well as connect to various third-party services, including music and voice. Software primarily consists of firmware embedded in the products and the Sonos app, which is software that can be downloaded to consumer devices at no charge, with or without the purchase of one of the Company’s products. Products and related software are accounted for as a single performance obligation and all intended functionality is available to the customer upon purchase. The revenue allocated to the products and related software is the substantial portion of the total sale price. Product revenue is recognized at the point in time when control is transferred, which is either upon shipment or upon delivery to the customer, depending on delivery terms.
Service revenue includes revenue allocated to (i) unspecified software upgrades and (ii) cloud-based services that enable products to access third-party music and voice assistant platforms, which are each distinct performance obligations and are provided to customers at no additional charge. Unspecified software upgrades are provided on a when-and-if-available basis
65
SONOS, INC.
NOTES TO CONSOLIDATED FINANCIAL STATEMENTS (CONTINUED)
and have historically included updates and enhancements such as bug fixes, feature enhancements and updates to the ability to connect to third-party music or voice assistant platforms. Service revenue is recognized ratably over the estimated service period.
Significant judgments
The Company’s contracts with customers generally contain promises to transfer products and services as described above. Determining whether products and services are considered distinct performance obligations that should be accounted for separately requires significant judgment.
Judgment is required to determine the SSP for each distinct performance obligation. The Company estimates SSP for items that are not sold separately, which include the products and related software, unspecified software upgrades and cloud-based services, using information that may include competitive pricing information, where available, as well as analyses of the cost of providing the products or services plus a reasonable margin. In developing SSP estimates, the Company also considers the nature of the products and services and the expected level of future services.
Determining the revenue recognition period for unspecified software upgrades and cloud-based services also requires judgment. The Company recognizes revenue attributable to these performance obligations ratably over the best estimate of the period that the customer is expected to receive the services. In developing the estimated period of providing future services, the Company considers past history, plans to continue to provide services, including plans to continue to support updates and enhancements to prior versions of the Company’s products, expected technological developments, obsolescence, competition and other factors. The estimated service period may change in the future in response to competition, technology developments and the Company’s business strategy.
The Company offers sales incentives through various programs consisting primarily of discounts, cooperative advertising and market development fund programs. The Company records cooperative advertising and market development fund programs with customers as a reduction to revenue unless it receives a distinct benefit in exchange for credits claimed by the customer and can reasonably estimate the fair value of the benefit received, in which case the Company records it as an expense. The Company recognizes a liability or a reduction to accounts receivable, and reduces revenue based on the estimated amount of sales incentives that will be claimed by customers. Estimates for sales incentives are developed using the most likely amount and are included in the transaction price to the extent that a significant reversal of revenue would not result once the uncertainty is resolved. In developing its estimate, the Company also considers the susceptibility of the incentive to outside influences, the length of time until the uncertainty is resolved and the Company’s experience with similar contracts. Reductions in revenue related to discounts are allocated to products and services on a relative basis based on their respective SSP. Judgment is required to determine the timing and amount of recognition of marketing funds which the Company estimates based on past practice of providing similar funds.
The Company accepts returns from direct customers and from certain resellers. To establish an estimate for returns, the Company uses the expected value method by considering a portfolio of contracts with similar characteristics to calculate the historical returns rate. When determining the expected value of returns, the Company considers future business initiatives and relevant anticipated future events.
Supplier concentration
The Company relies on third parties for the supply and manufacture of its products, as well as third-party logistics providers. In instances where these parties fail to perform their obligations, the Company may be unable to find alternative suppliers or satisfactorily deliver its products to customers on time, if at all. During fiscal 2018, 2017 and 2016, approximately 98%, 99% and 99%, respectively, of the Company’s finished goods purchased during each year were from one vendor.
Deferred revenue and payment terms
The Company invoices each order upon hardware shipment or delivery and recognizes revenue for each distinct performance obligation when transfer of control has occurred, which in the case of services, may extend over several reporting periods. Amounts invoiced in advance of revenue recognition are recorded as deferred revenue on the consolidated balance sheets. Deferred revenue primarily relates to revenue allocated to unspecified software upgrades and platform services. The Company classifies deferred revenue as noncurrent if amounts are expected to be recognized as revenue after more than one year from the balance sheet date.
66
SONOS, INC.
NOTES TO CONSOLIDATED FINANCIAL STATEMENTS (CONTINUED)
The following table summarizes the changes in the deferred revenue balances:
2018 | 2017 | 2016 | ||||||||||
(In thousands) | ||||||||||||
Deferred revenue, beginning of period | $ | 45,567 | $ | 36,160 | $ | 27,373 | ||||||
Recognition of revenue included in beginning of period deferred revenue | (10,627 | ) | (6,878 | ) | (4,553 | ) | ||||||
Revenue deferred, net of revenue recognized on contracts in the respective period | 16,027 | 16,285 | 13,340 | |||||||||
Deferred revenue, end of period | $ | 50,967 | $ | 45,567 | $ | 36,160 | ||||||
The Company expected the following recognition of deferred revenue as of September 29, 2018:
For the fiscal years ending | ||||||||||||||||||||||||
(In thousands) | 2019 | 2020 | 2021 | 2022 | 2023 and Beyond | Total | ||||||||||||||||||
Revenue expected to be recognized | $ | 11,615 | $ | 10,905 | $ | 9,602 | $ | 7,756 | $ | 11,089 | $ | 50,967 | ||||||||||||
See Note 4 for further information with respect to revenue, including revenue by product category and geography.
Payment terms
Payment terms and conditions vary among the Company’s distribution channels although terms generally include a requirement of payment within 30 days of product shipment. Sales directly to customers from the Company’s website are paid in advance of product shipment. Prior to providing payment terms to customers, an evaluation of the customer’s credit risk is performed. Contractual allowances are an offset to accounts receivable, net.
Research and development
Research and development expenses consist primarily of personnel-related expenses, consulting and outside professional service costs, tooling and prototype materials and overhead costs. Substantially all of the Company’s research and development expenses are related to developing new products and services and improving existing products and services. To date, software development costs have been expensed as incurred because the period between achieving technological feasibility and the release of the software has been short and development costs qualifying for capitalization have been insignificant.
Advertising costs
Advertising costs are expensed as incurred and included in sales and marketing expenses. Advertising expenses were $50.2 million, $72.2 million and $50.6 million for fiscal 2018, 2017 and 2016, respectively.
Stock-based compensation
The Company measures stock-based compensation cost at fair value on the date of grant. The Company estimates the fair value of stock option awards using the Black-Scholes option-pricing model. The fair value of restricted stock units ("RSUs") is the fair value of the Company’s common stock on the grant date. Compensation costs for RSUs and for stock options with graded vesting are recognized, on a straight-line basis, as expense over the period of vesting as the employee performs the related services, net of estimated forfeitures. The Company estimates forfeitures based on expected future terminations and will revise rates, as necessary, in subsequent periods if actual forfeitures differ from initial estimates.
401(k) Plan
The Company has a defined contribution 401(k) plan (the "401(k) Plan") for the Company’s U.S-based employees. The 401(k) Plan is for all full-time employees who meet certain eligibility requirements. Eligible employees may contribute up to 100% of their annual compensation, but are limited to the maximum annual dollar amount allowable under the Internal Revenue Code of 1986, as amended (the "Code"). Although the 401(k) Plan provides for discretionary employer matching
67
SONOS, INC.
NOTES TO CONSOLIDATED FINANCIAL STATEMENTS (CONTINUED)
contribution, the Company has not made any such contributions on behalf of participating employees as of September 29, 2018.
Income taxes
The Company accounts for income taxes under the asset and liability method, which requires the recognition of deferred tax assets and liabilities for the expected future tax consequences of events that have been included in the financial statements. Under this method, deferred tax assets and liabilities are determined based on the differences between the financial statements and tax basis of assets and liabilities using enacted tax rates in effect for the year in which the differences are expected to reverse. The effect of a change in tax rates on deferred tax assets and liabilities is recognized in income in the period that includes the enactment date.
The Company records a valuation allowance to the extent that its deferred tax assets are not more likely than not to be realized. In making such a determination, all available positive and negative evidence is considered, including future reversals of existing taxable temporary differences, projected future taxable income, tax-planning strategies and results of recent operations. If the Company determines that it would be able to realize its deferred tax assets in the future in excess of their net recorded amount, the Company would make an adjustment to the deferred tax asset valuation allowance, which would reduce the provision for income taxes.
The Company records uncertain tax positions in accordance with a two-step process whereby (i) the Company determines whether it is more likely than not that the tax positions will be sustained on the basis of the technical merits of the position and (ii) for those tax positions that meet the more likely than not recognition threshold, the Company recognizes the largest amount of tax benefit that is more than 50% likely to be realized upon ultimate settlement with the related tax authority.
The Company includes interest and penalties related to unrecognized tax benefits within the provision for income taxes in the consolidated statements of operations and comprehensive loss. The Company has not incurred any interest or penalties related to unrecognized tax benefits in any of the periods presented.
The Company’s provision for (benefit from) income taxes, deferred tax assets and liabilities and liabilities for unrecognized tax benefits involves the use of estimates, assumptions and judgments. Although the Company believes its estimates, assumptions and judgments to be reasonable, any changes in tax law or its interpretation of tax laws and the resolutions of potential tax audits could significantly impact the amounts provided for income taxes in the Company’s consolidated financial statements. Actual future operating results and the underlying amount and type of income could differ materially from the Company’s estimates, assumptions and judgments thereby impacting the Company’s financial position and results of operations.
Segment information
The Company operates as one operating segment as it only reports aggregate financial information on a consolidated basis, accompanied by disaggregated information about revenue by geographic region and product category to its Chief Executive Officer, who is the Company’s chief operating decision maker.
Leases
The substantial majority of the Company’s leases are for its office spaces and facilities, which are accounted for as operating leases. For leases that contain rent escalation or rent concession provisions, the Company recognizes rent on a straight-line basis over the term of the lease. The Company does not assume renewals in its determination of the lease term unless the renewals are deemed to be reasonably assured at inception. Tenant improvement allowances received from landlords are recorded as a credit to deferred rent, reported as a liability on the consolidated balance sheets and amortized on a straight-line basis over the lease term as a reduction to rent expense in the consolidated statements of operations and comprehensive loss.
Recently adopted accounting pronouncements
Revenue from contracts with customers
In May 2014, the Financial Accounting Standards Board (the "FASB") issued a new standard related to revenue recognition, Accounting Standards Codification ("ASC") No. 606, Revenue from Contracts with Customers ("ASC 606"). Under ASC
68
SONOS, INC.
NOTES TO CONSOLIDATED FINANCIAL STATEMENTS (CONTINUED)
606, revenue is recognized when a customer obtains control of promised goods or services in an amount that reflects the consideration the entity expects to receive in exchange for those goods or services. In addition, the standard requires disclosure of the nature, amount, timing and uncertainty of revenue and cash flows arising from contracts with customers.
ASC 606 is required to be adopted for annual reporting periods beginning after December 15, 2017, including interim periods therein, and may be earlier adopted, though no earlier than for annual reporting periods beginning after December 15, 2016. The Company elected to early adopt ASC 606 effective October 1, 2017, using the full retrospective transition method, which required the Company to adjust each prior reporting period presented.
The most significant impact of the adoption of this standard related to the Company’s accounting for arrangements with certain distributors and retail partners with implicit or explicit return rights that were recognized based on a sell-through method under ASC 605, Revenue Recognition. Under ASC 606, revenue with these parties is recognized upon transfer of control to the customer which occurs when the product is either shipped to or delivered to the customer depending on the contractual terms of the arrangement. This change resulted in an acceleration of revenue and related costs of revenue and most significantly, a reduction in deferred costs of revenue and deferred revenue at each balance sheet date. This acceleration of revenue can have a net increase or decrease in the adjusted revenue for the respective fiscal year depending on the year over year impact of the amounts accelerated across reporting periods. The impact of the adjusted balances on previously reported results presented below were also affected by changes in both product mix as well as by the timing of transactions within fiscal years.
Impact to previously reported results
The adoption of ASC 606 impacted the Company’s previously reported amounts on the consolidated balance sheets as of October 1, 2016 as follows:
2016 | |||||||||||
(In thousands) | As previously reported | Impact of adoption | As adjusted | ||||||||
Accounts receivable, net | $ | 48,569 | $ | (3,262 | ) | $ | 45,307 | ||||
Inventories, net | 53,553 | 9 | 53,562 | ||||||||
Deferred costs of revenue | 27,478 | (27,478 | ) | — | |||||||
Other current assets | 8,850 | 587 | 9,437 | ||||||||
Deferred tax assets | 6,207 | (3,663 | ) | 2,544 | |||||||
Deferred revenue | 96,696 | (60,536 | ) | 36,160 | |||||||
Other current liabilities | 4,599 | 1,936 | 6,535 | ||||||||
Stockholders’ equity (deficit) | (53,581 | ) | 24,793 | (28,788 | ) | ||||||
The adoption of ASC 606 impacted the Company’s previously reported amounts on the consolidated statements of operations and comprehensive loss for the years ended October 3, 2015 and October 1, 2016 as follows:
2016 | 2015 | ||||||||||||||||||||||
(In thousands) | As previously reported | Impact of adoption | As adjusted | As previously reported | Impact of adoption | As adjusted | |||||||||||||||||
Net revenue | $ | 904,049 | $ | (2,765 | ) | $ | 901,284 | $ | 860,652 | $ | (17,128 | ) | $ | 843,524 | |||||||||
Cost of revenue | 494,673 | 3,212 | 497,885 | 468,229 | (6,842 | ) | 461,387 | ||||||||||||||||
Provision for income taxes | 2,930 | (286 | ) | 2,644 | 2,734 | 508 | 3,242 | ||||||||||||||||
Net loss | (32,523 | ) | (5,691 | ) | (38,214 | ) | (57,983 | ) | (10,794 | ) | (68,777 | ) | |||||||||||
The Company has not previously reported its financial statements for fiscal 2017 under ASC 605. The adoption of ASC 606 had no impact to cash flows provided by or used in operating, financing or investing activities on the Company’s consolidated statements of cash flows. The cumulative impact of adoption resulted in a reduction to the Company’s accumulated deficit by $43.4 million from the previously reported accumulated deficit of $110.2 million, as of September 28, 2014, the beginning of the Company’s fiscal 2015.
69
SONOS, INC.
NOTES TO CONSOLIDATED FINANCIAL STATEMENTS (CONTINUED)
Recent accounting pronouncements pending adoption
In February 2016, the FASB issued Accounting Standards Update ("ASU") No. 2016-02, Leases (Topic 842) ("ASU 2016-02"), which amends a number of aspects of lease accounting, including requiring lessees to recognize operating leases with a term greater than one year on their balance sheet as a right-of-use asset and corresponding liability, measured at the present value of the lease payments. ASU 2016-02 is effective for fiscal years beginning after December 15, 2018, and interim periods within those years, with early adoption permitted. In January 2018, the FASB issued ASU No. 2018-01, Land Easement Practical Expedient for Transition to Topic 842 (“ASU 2018-01”), which establishes an optional transition practical expedient when applying the guidance in ASU 2016-02. In July 2018, the FASB issued ASU No. 2018-10, Codification Improvements to Topic 842, Leases (“ASU 2018-10”), and ASU No. 2018-11, Targeted Improvements (“ASU 2018-11”). ASU 2018-10 affects narrow aspects of the guidance issued in ASU 2016-02. ASU 2018-11 provides an additional transition method. The Company is currently evaluating the impact of adopting ASU 2016-02, ASU 2018-01, ASU 2018-10 and ASU 2018-11 on its consolidated financial statements.
In June 2016, the FASB issued ASU No. 2016-13, Financial Instruments—Credit Losses (Topic 326): Measurement of Credit Losses on Financial Instruments ("ASU 2016-13"). ASU 2016-13 provides for a new impairment model that requires measurement and recognition of expected credit losses for most financial assets and certain other instruments, including but not limited to accounts receivable and available for sale debt securities. ASU 2016-13 is effective for the Company for fiscal years beginning after December 15, 2019, and interim periods within those years, with early adoption permitted. The Company is currently evaluating the impact of ASU 2016-13 on its consolidated financial statements.
In August 2016, the FASB issued ASU No. 2016-15, Statement of Cash Flows (Topic 230): Classification of Certain Cash Receipts and Cash Payments ("ASU 2016-15"), which provides guidance intended to reduce diversity in practice in how certain transactions are classified in the statement of cash flows. ASU 2016-15 is effective for fiscal years beginning after December 15, 2017, and interim periods within those years, with early adoption permitted. The Company is currently evaluating the impact of ASU 2016-15 on its consolidated financial statements.
In November 2016, the FASB issued ASU No. 2016-18, Statement of Cash Flows (Topic 230): Restricted Cash ("ASU 2016-18"), which enhances and clarifies the guidance on the classification and presentation of restricted cash in the statement of cash flows. ASU 2016-18 is effective for fiscal years beginning after December 15, 2017, and interim periods within those years, with early adoption permitted. The Company held $0.2 million in restricted cash as of September 29, 2018 and September 30, 2017 and therefore does not expect the adoption of this guidance to have a material impact on its consolidated financial statements.
In October 2016, the FASB issued ASU No. 2016-16, Income Taxes (Topic 740): Intra-Entity Transfers of Assets Other Than Inventory ("ASU 2016-16"). ASU 2016-16 removes the prohibition in ASC Topic 740, Income Taxes, against the immediate recognition of the current and deferred income tax effects of intra-entity transfers of assets other than inventory. ASU 2016-16is intended to reduce the complexity of U.S. GAAP and diversity in practice related to the tax consequences of certain types of intra-entity asset transfers, particularly those involving intellectual property. ASU 2016-16 is effective for annual reporting periods beginning after December 15, 2017, including interim reporting periods within those annual reporting periods. The Company is currently evaluating the potential impact of ASU 2016-16 on its consolidated financial statements.
In January 2017, the FASB issued ASU No. 2017-04, Intangibles—Goodwill and Other (Topic 350): Simplifying the Test for Goodwill ("ASU 2017-04"), which simplifies the subsequent measurement of goodwill by eliminating the second step of the goodwill impairment test. The second step measures a goodwill impairment loss by comparing the implied fair value of a reporting unit’s goodwill with the carrying amount of that goodwill. Under ASU 2017-04, a company will record an impairment charge based on the excess of a reporting unit’s carrying amount over its fair value. ASU 2017-04 will be applied prospectively and is effective for annual or interim goodwill impairment tests in fiscal years beginning after December 15, 2019. Early adoption is permitted for interim or annual goodwill impairment tests performed on testing dates after January 1, 2017. The Company is currently evaluating the impact of ASU 2017-04 on its consolidated financial statements. The Company expects the impact of ASU 2017-04 to be immaterial as goodwill was $1.0 million as of September 29, 2018.
In August 2018, the FASB issued ASU No. 2018-13, Fair Value Measurement (Topic 820): Disclosure Framework—Changes to the Disclosure Requirements for Fair Value Measurement (“ASU 2018-13”). ASU 2018-13 eliminates disclosures such as the amount of and reasons for transfers between Level 1 and Level 2 of the fair value hierarchy and adds new disclosure requirements for Level 3 measurements. ASU 2018-13 is effective for fiscal years beginning after December 15, 2019, and
70
SONOS, INC.
NOTES TO CONSOLIDATED FINANCIAL STATEMENTS (CONTINUED)
interim periods within those fiscal years, with early adoption permitted for any eliminated or modified disclosures. The Company does not expect adoption will have a material impact on the Company's disclosures.
In August 2018, the FASB issued ASU No. 2018-15, Intangibles—Goodwill and Other—Internal-Use Software (Subtopic 350-40): Customer’s Accounting for Implementation Costs Incurred in a Cloud Computing Arrangement That Is a Service Contract (“ASU 2018-15”). The new guidance requires a customer in a cloud computing arrangement that is a service contract to follow the existing internal-use software guidance to determine which implementation costs to capitalize as assets or expense as incurred. The guidance is effective for fiscal years beginning after December 15, 2019, and interim periods within those fiscal years, with early adoption permitted, including adoption in any interim period. The Company is currently evaluating the impact of adopting ASU 2018-15.
3. Fair value measurements
The carrying values of the Company’s financial instruments, including accounts receivable and accounts payable, approximate their fair values due to the short period of time to maturity or repayment. The carrying values of the Company’s long-term debt approximate their fair values as of September 29, 2018 and September 30, 2017 as the debt carries a variable rate or market rates that approximate those currently available to the Company.
The following table summarizes fair value measurements by level for the assets measured at fair value on a recurring basis as of September 29, 2018 and September 30, 2017:
2018 | |||||||||||||||
(In thousands) | Level 1 | Level 2 | Level 3 | Total | |||||||||||
Assets: | |||||||||||||||
Money market funds (cash equivalents) | $ | 140,588 | $ | — | $ | — | $ | 140,588 | |||||||
2017 | |||||||||||||||
(In thousands) | Level 1 | Level 2 | Level 3 | Total | |||||||||||
Assets: | |||||||||||||||
Money market funds (cash equivalents) | $ | 40,072 | $ | — | $ | — | $ | 40,072 | |||||||
4. Revenue and geographic information
Disaggregation of revenue
Revenue by geographical region, based on ship-to address, is as follows:
2018 | 2017 | 2016 | |||||||||
(In thousands) | |||||||||||
Americas | $ | 603,450 | $ | 496,668 | $ | 443,314 | |||||
Europe, Middle East and Africa | 478,518 | 442,081 | 415,689 | ||||||||
Asia Pacific | 55,040 | 53,777 | 42,281 | ||||||||
Total revenue | $ | 1,137,008 | $ | 992,526 | $ | 901,284 | |||||
71
SONOS, INC.
NOTES TO CONSOLIDATED FINANCIAL STATEMENTS (CONTINUED)
Revenue from external customers is attributed to individual countries based on ship-to address. Revenue by significant countries is as follows:
2018 | 2017 | 2016 | |||||||||
(In thousands) | |||||||||||
United States | $ | 554,896 | $ | 449,261 | $ | 399,531 | |||||
Germany | 121,546 | 111,065 | 93,824 | ||||||||
United Kingdom | 114,790 | 110,695 | 120,732 | ||||||||
Other countries | 345,776 | 321,505 | 287,197 | ||||||||
Total revenue | $ | 1,137,008 | $ | 992,526 | $ | 901,284 | |||||
Revenue by major product category is as follows:
2018 | 2017 | 2016 | |||||||||
(In thousands) | |||||||||||
Wireless speakers | $ | 546,649 | $ | 480,977 | $ | 462,967 | |||||
Home theater speakers | 418,416 | 348,899 | 274,268 | ||||||||
Components | 150,436 | 151,965 | 151,658 | ||||||||
Other | 21,507 | 10,685 | 12,391 | ||||||||
Total revenue | $ | 1,137,008 | $ | 992,526 | $ | 901,284 | |||||
Revenue by product categories includes the applicable service revenue attributable to each product category.
Property and equipment, net by country as of September 29, 2018 and September 30, 2017 were as follows:
2018 | 2017 | ||||||
(In thousands) | |||||||
United States | $ | 48,441 | $ | 59,738 | |||
China | 18,729 | 22,672 | |||||
Other countries | 18,201 | 12,720 | |||||
Property and equipment, net | $ | 85,371 | $ | 95,130 | |||
5. Balance sheet components
The following tables show the Company’s balance sheet component details as of September 29, 2018 and September 30, 2017.
Inventories
Inventories, net, consist of the following:
2018 | 2017 | ||||||
(In thousands) | |||||||
Finished goods | $ | 176,181 | $ | 104,014 | |||
Components | 17,012 | 9,842 | |||||
Inventories | $ | 193,193 | $ | 113,856 | |||
72
SONOS, INC.
NOTES TO CONSOLIDATED FINANCIAL STATEMENTS (CONTINUED)
Property and equipment, net
Property and equipment, net consist of the following:
2018 | 2017 | ||||||
(In thousands) | |||||||
Computer hardware and software | $ | 46,385 | $ | 42,928 | |||
Furniture and fixtures | 9,696 | 9,840 | |||||
Tooling and production line test equipment | 47,297 | 42,368 | |||||
Leasehold improvements | 53,962 | 53,479 | |||||
Product displays | 40,265 | 55,855 | |||||
Total property and equipment | 197,605 | 204,470 | |||||
Accumulated depreciation and amortization | (112,234 | ) | (109,340 | ) | |||
Property and equipment, net | $ | 85,371 | $ | 95,130 | |||
Depreciation expense was $39.4 million, $35.0 million and $34.3 million for fiscal 2018, 2017 and 2016, respectively. During fiscal 2018, 2017 and 2016, the Company disposed of gross fixed assets of $35.8 million, $11.5 million and $6.2 million, with accumulated depreciation of $35.6 million, $11.2 million and $3.4 million, respectively. Disposals of fixed assets were recorded in operating expenses in the consolidated statements of operations and comprehensive loss and resulted in losses of $0.2 million, $0.2 million and $3.1 million for fiscal 2018, 2017 and 2016, respectively.
Accrued expenses
Accrued expenses consisted of the following:
2018 | 2017 | ||||||
(In thousands) | |||||||
Accrued advertising and marketing | $ | 11,613 | $ | 10,880 | |||
Accrued taxes | 4,175 | 4,800 | |||||
Accrued inventory | 4,179 | 22,563 | |||||
Accrued manufacturing, logistics and product development | 8,290 | 4,921 | |||||
Other accrued payables | 10,430 | 14,184 | |||||
Total accrued expenses | $ | 38,687 | $ | 57,348 | |||
73
SONOS, INC.
NOTES TO CONSOLIDATED FINANCIAL STATEMENTS (CONTINUED)
6. Debt
Our short and long term debt as of September 29, 2018 and September 30, 2017 is as follows:
2018 | 2017 | ||||||||||||
Rate | Balance | Rate | Balance | ||||||||||
(In thousands) | |||||||||||||
J.P. Morgan Chase Bank, N.A Secured Term Loan (the "New Term Loan") (1) | 4.8 | % | $ | 40,000 | — | % | $ | — | |||||
J.P. Morgan Chase Bank, N.A Secured Credit Facility (the "Credit Facility") (2) | — | % | — | — | % | — | |||||||
Gordon Brothers Finance Company Secured Term Loan (the "Prior Term Loan") (3) | — | % | — | 10.7 | % | 40,000 | |||||||
Unamortized debt issuance costs (4) | (236 | ) | (400 | ) | |||||||||
Total indebtedness | 39,764 | 39,600 | |||||||||||
Less short term portion | (6,667 | ) | — | ||||||||||
Long term debt | $ | 33,097 | $ | 39,600 | |||||||||
(1) | Bears interest at a variable rate equal to an adjusted LIBOR plus 2.25% and is payable quarterly. Due in October 2021, with quarterly principal payments beginning in July 2019. |
(2) | Allows the Company to borrow up to $80.0 million restricted to the value of the borrowing base which is based on the value of inventory and accounts receivable and is subject to monthly redetermination. Also includes up to $10.0 million for the issuance of letters of credit and up to $8.0 million for swing line loans. The Credit Facility matures in October 2021 and may be drawn as Commercial Bank Floating Rate Loans (at the higher of prime rate or adjusted LIBOR plus 2.50%) or Eurocurrency Loans (at LIBOR plus an applicable margin). The unused portion is subject to an annual commitment fee of 0.2%. |
(3) | In July 2018, all outstanding principal, accrued interest and fees were paid in full and the Prior Term Loan was terminated. While outstanding, it bore interest at LIBOR plus 9.5%. |
(4) | Debt issuance costs are recorded as debt discount and recorded as interest expense over the term of the agreement. |
The Credit Facility and the New Term Loan require the Company to maintain a consolidated fixed charge ratio of at least 1.0, restrict distribution of dividends unless certain conditions are met, such as having a fixed charge ratio of at least 1.15, and require financial statement reporting and delivery of borrowing base certificates. As of September 29, 2018 and September 30, 2017, the Company was in compliance with all financial covenants.
Obligations under the New Term Loan and the Credit Facility are collateralized by eligible inventory and accounts receivable of the Company as well as the Company's intellectual property including patents and trademarks. As of September 29, 2018 and September 30, 2017, the Company did not have any outstanding borrowings and $4.5 million and $4.4 million, respectively, in undrawn letters of credit that reduce the availability under the Credit Facility. As of September 29, 2018, the Company had $39.8 million outstanding on the New Term Loan.
74
SONOS, INC.
NOTES TO CONSOLIDATED FINANCIAL STATEMENTS (CONTINUED)
7. Stockholders' equity
Redeemable convertible preferred stock
Upon the closing of the IPO, all outstanding shares of the Company's redeemable convertible preferred stock automatically converted into 32,482,590 shares of common stock on a one-for-one basis. Additionally, upon completion of the IPO, the Company's authorized capital stock consisted of 500,000,000 shares of common stock, $0.001 par value per share and 10,000,000 shares of "blank check" preferred stock, $0.001 par value per share.
The following table summarizes the redeemable convertible preferred stock information (together, the "Preferred Stock") as of September 30, 2017:
(In thousands, except share amounts) | ||||||||||||||
Authorized Shares | Issued and Outstanding Shares | Carrying Value | Liquidation Preference | |||||||||||
Series A preferred stock | 10,035,000 | 10,005,000 | $ | 15,060 | $ | 15,008 | ||||||||
Series B preferred stock | 3,881,250 | 3,730,000 | 5,926 | 5,968 | ||||||||||
Series C preferred stock | 11,700,000 | 11,688,766 | 26,556 | 25,000 | ||||||||||
Series D preferred stock | 7,058,824 | 7,058,824 | 42,799 | 45,000 | ||||||||||
Total | 32,675,074 | 32,482,590 | $ | 90,341 | $ | 90,976 | ||||||||
Common and treasury stock
During fiscal 2017, in an effort to facilitate the sale of common stock to new investors and provide liquidity for existing stockholders, the Company purchased 738,682 shares of common stock at the fair value of common stock at the date of exchange for an aggregate purchase price of $10.0 million and concurrent therewith, the Company issued 742,034 shares of common stock to two outside investors. The sale price to the outside investors was $13.56 per share, the fair value of common stock at the date of exchange, for total gross proceeds to the Company of $10.1 million.
8. Stock-based compensation
During 2003, the Board established the 2003 Stock Plan, as amended (the "2003 Plan"). The 2003 Plan includes incentive stock options that are subject to the rules and regulations of the Code and nonqualified stock options. The option price, number of shares and grant date of stock options granted under the 2003 Plan were determined at the discretion of the Board. Under the 2003 Plan, as long as the optionholder performs services for the Company, the options generally vest over 48 months, with cliff vesting after one year and monthly vesting thereafter and are exercisable for a period not to exceed ten years from the date of grant.
In July 2018, the Board adopted the 2018 Equity Incentive Plan (the "2018 Plan") and ceased granting awards under the 2003 Plan. The 2018 Plan became effective in connection with the IPO. The Company reserved 21,200,000 shares of its common stock for issuance under the 2018 Plan. Any remaining shares available for issuance under the 2003 Plan on the effective date of the 2018 Plan were added to the shares of common stock reserved for issuance under the 2018 Plan. The number of shares reserved for issuance under the 2018 Plan will also be increased by (i) the number of shares that are subject to outstanding awards under the 2003 Plan which cease to be subject to such awards and (ii) the number of shares issued under the 2003 Plan which are forfeited or repurchased at their original issue price; however, shares subject to awards under the 2003 Plan that are used to pay the exercise price of an option or withheld to satisfy the tax withholding obligations related to any award will not become available for future grant or sale under the 2018 Plan. Further, the number of shares reserved for issuance under the 2018 Plan will increase automatically on January 1 of each year beginning in 2019 and continuing through 2028 by a number of shares of common stock equal to the lesser of (x) 5% of the total outstanding shares of the Company’s common stock and common stock equivalents as of the immediately preceding December 31 (rounded to the nearest whole share) and (y) a number of shares determined by the Board. As of September 29, 2018, there were 21,939,408 shares reserved for future issuance, including 21,200,000 shares authorized under the 2018 Plan, plus shares under the 2003 Plan that were available for issuance, or forfeited, that were added to shares reserved for issuance under the 2018 Plan.
75
SONOS, INC.
NOTES TO CONSOLIDATED FINANCIAL STATEMENTS (CONTINUED)
As of September 29, 2018, the Company had not granted any RSUs. Stock option activity was as follows:
Number of Options | Weighted Average Exercise Price | Weighted Average Remaining Contractual Term | Weighted Average Intrinsic Value | |||||||||
(in years) | (in thousands) | |||||||||||
Outstanding at September 30, 2017 | 45,817,252 | $ | 9.20 | 6.9 | $ | 199,663 | ||||||
Granted | 9,316,926 | 15.12 | ||||||||||
Exercised | (2,657,436 | ) | 3.52 | |||||||||
Forfeited | (3,971,280 | ) | 13.14 | |||||||||
Expired | (1,280 | ) | 15.11 | |||||||||
Outstanding at September 29, 2018 | 48,504,182 | $ | 10.33 | 6.6 | $ | 276,959 | ||||||
At September 29, 2018 | ||||||||||||
Options exercisable | 31,194,219 | $ | 8.13 | 5.4 | $ | 246,847 | ||||||
Options vested and expected to vest | 45,662,090 | $ | 10.07 | 6.5 | $ | 272,699 | ||||||
During fiscal 2018, 2017 and 2016, the Company granted options with a fair value of $50.2 million, $39.4 million and $83.5 million, respectively, with a weighted-average grant date fair value of $5.39, $4.84 and $5.32 per share, respectively.
The total intrinsic value of stock options exercised was $31.3 million, $42.0 million and $17.4 million for fiscal 2018, 2017 and 2016, respectively.
As of September 29, 2018 and September 30, 2017, the Company had $71.5 million and $74.9 million, respectively, of unrecognized stock-based compensation cost, which is expected to be recognized over a weighted-average period of 2.6 years and 2.8 years, respectively.
The Company’s policy for issuing stock upon stock option exercise is to issue new common stock.
Stock-based compensation cost is measured at the grant date based on the fair value of the award and is expensed, net of estimated forfeitures, over the remaining requisite service period. The Company uses the Black- Scholes option pricing model to estimate the fair value of stock options. This model requires the input of highly subjective assumptions including the expected term of the option, expected stock price volatility and expected dividends. If any of the assumptions used in the Black-Scholes model changes significantly, stock-based compensation expense may differ materially in the future from that recorded in the current period.
The fair value of options at the date of grant was estimated using the Black-Scholes option pricing model with the following weighted-average assumptions:
2018 | 2017 | 2016 | ||||||
Expected term (years) | 6.25 | 6.25 | 6.25 | |||||
Risk-free interest rate | 2.73 | % | 1.95 | % | 1.29 | % | ||
Expected volatility | 30.19 | % | 32.40 | % | 36.64 | % | ||
Expected dividend yield | — | % | — | % | — | % | ||
Expected term
The expected term represents the period over which the Company anticipates stock-based awards to be outstanding. The Company does not have sufficient historical exercise data to provide a reasonable basis upon which to estimate expected term. As a result, the Company elected the simplified method, which is the average of the options’ vesting and contractual terms.
76
SONOS, INC.
NOTES TO CONSOLIDATED FINANCIAL STATEMENTS (CONTINUED)
Risk-free interest rate
The risk-free interest rate is based on the U.S. Treasury yield curve in effect at the time of grant for the expected term of the option.
Expected share price volatility
The Company’s computation of expected volatility is based on the historical volatility of selected comparable publicly traded companies over a period equal to the expected term of the option.
Expected dividend yield
The Company used a zero-dividend yield, as the Company has never paid dividends and does not plan to pay dividends in the near future.
Fair value of common stock
Prior to the IPO, in accordance with the American Institute of Certified Public Accountants Accounting and Valuation Guide, Valuation of Privately-Held Company Equity Securities Issued as Compensation, the Board exercised reasonable judgment and considered numerous objective and subjective factors to determine the best estimate of fair value of the Company’s common stock, including but not limited to the prices at which the Company sold shares of its common stock to outside investors in arm’s-length transactions; independent third-party valuations of the Company’s common stock; the rights, preferences and privileges of redeemable convertible preferred stock relative to those of common stock; the Company’s operating results, financial position and capital resources; and additional relevant economic information.
Subsequent to the Company's IPO, the Company began using the market closing price for its common stock as reported on The Nasdaq Global Select Market.
Total stock-based compensation expense by function category was as follows:
2018 | 2017 | 2016 | |||||||||
(In thousands) | |||||||||||
Cost of revenue | $ | 198 | $ | 240 | $ | 211 | |||||
Research and development | 13,960 | 13,605 | 8,260 | ||||||||
Sales and marketing | 15,885 | 15,086 | 11,742 | ||||||||
General and administrative | 8,602 | 7,619 | 5,750 | ||||||||
Total stock-based compensation expense | $ | 38,645 | $ | 36,550 | $ | 25,963 | |||||
9. Income taxes
The Company’s income (loss) before provision for (benefit from) income taxes for fiscal 2018, 2017 and 2016 were as follows:
2018 | 2017 | 2016 | |||||||||
(In thousands) | |||||||||||
Domestic | $ | 2,803 | $ | (25,005 | ) | $ | (47,285 | ) | |||
Foreign | (17,351 | ) | 8,497 | 11,715 | |||||||
Income (loss) before provision for (benefit from) income taxes | $ | (14,548 | ) | $ | (16,508 | ) | $ | (35,570 | ) | ||
77
SONOS, INC.
NOTES TO CONSOLIDATED FINANCIAL STATEMENTS (CONTINUED)
Components of the provision for (benefit from) income taxes consisted of the following:
2018 | 2017 | 2016 | |||||||||
(In thousands) | |||||||||||
Current: | |||||||||||
U.S. Federal | $ | — | $ | — | $ | 129 | |||||
U.S. State | 177 | 62 | 59 | ||||||||
Foreign | 816 | (3,791 | ) | 3,344 | |||||||
Total current | 993 | (3,729 | ) | 3,532 | |||||||
Deferred: | |||||||||||
U.S. Federal | (168 | ) | — | — | |||||||
U.S. State | — | — | — | ||||||||
Foreign | 231 | 1,438 | (888 | ) | |||||||
Total deferred | 63 | 1,438 | (888 | ) | |||||||
Provision for (benefit from) income taxes | $ | 1,056 | $ | (2,291 | ) | $ | 2,644 | ||||
Components of the Company’s net deferred income tax assets (liabilities) are as follows:
2018 | 2017 | ||||||
(In thousands) | |||||||
Deferred tax assets | |||||||
Accrued expenses and reserves | $ | 5,639 | $ | 8,828 | |||
Deferred revenue | 10,317 | 218 | |||||
Inventory deferral | — | 3,259 | |||||
U.S. net operating loss carryforwards | 18,385 | 53,589 | |||||
Foreign net operating loss carryforwards | 5,625 | 1,147 | |||||
Tax credit carryforwards | 22,969 | 17,553 | |||||
Stock-based compensation | 7,237 | 7,976 | |||||
Amortization | 3,237 | 3,859 | |||||
Other | 427 | 324 | |||||
Total deferred tax assets | 73,836 | 96,753 | |||||
Valuation allowance | (72,380 | ) | (94,956 | ) | |||
Deferred tax assets, net of valuation allowance | 1,456 | 1,797 | |||||
Deferred tax liabilities | |||||||
Depreciation | (515 | ) | (690 | ) | |||
Total deferred tax liabilities | (515 | ) | (690 | ) | |||
Net deferred tax assets | $ | 941 | $ | 1,107 | |||
After considering all available positive and negative evidence, the Company has determined it is more likely than not that deferred tax assets will not be realized and that a full valuation allowance is required in the United States and the Netherlands. Both jurisdictions have generated cumulative losses in recent years. The Company has deferred tax assets in other foreign jurisdictions which it determined are more likely than not to be fully realized.
As of September 29, 2018, the Company had gross federal and post-apportionment state net operating loss carryforwards of $74.7 million and $45.9 million, respectively, available to reduce future taxable income. The earliest federal and state net operating loss carryforwards expire in varying amounts beginning in 2033 and 2020, respectively. As of September 29, 2018, the Company had gross foreign net operating loss carryforwards of $21.9 million, of which $2.7 million have an indefinite life and $19.2 million that will expire in 2027. The Company also has gross federal and state research and development tax credits carryforwards of $25.4 million and $19.1 million, respectively. The federal research credits will begin to expire in the year 2025, and the state research credits will begin to expire in the year 2024.
78
SONOS, INC.
NOTES TO CONSOLIDATED FINANCIAL STATEMENTS (CONTINUED)
Because of the change of ownership provisions of Sections 382 and 383 of the Code, use of a portion of the Company’s domestic net operating losses and tax credit carryforwards may be limited in future periods depending upon future changes in ownership. Specifically, the Company’s net operating losses generated through July 18, 2012 may be subject to limitation under Section 382 of the Code. The amount of pre-change loss carryforward which may be subject to this limitation is $46.8 million. Further, a portion of the carryforwards may expire before being applied to reduce future income tax liabilities if sufficient taxable income is not generated in future periods.
The following table summarizes changes in the valuation allowance for fiscal 2018, 2017 and 2016:
(In thousands) | 2018 | 2017 | 2016 | ||||||||
Beginning balance | $ | 94,956 | $ | 95,882 | $ | 33,264 | |||||
Increase (decrease) during the period | (22,576 | ) | (926 | ) | 19,535 | ||||||
Increase due to adoption of ASU 2016-09 | — | — | 43,083 | ||||||||
Ending balance | $ | 72,380 | $ | 94,956 | $ | 95,882 | |||||
During the year ended October 1, 2016, the Company elected early adoption of ASU 2016-09. Gross excess windfall tax benefits resulting from stock option exercises in the amount of $113.8 million and $59.8 million for federal and post-apportionment state net operating loss carryforwards, respectively, were not reported as components of gross deferred tax assets with an offsetting valuation allowance as of October 3, 2015. The Company applied a modified retrospective transition method to report the tax effected amount of $39.8 million and $3.2 million of U.S. federal and state net operating loss carryforwards, respectively, for the year ended October 1, 2016. The Company determined that these deferred tax assets are not more likely than not to be realized and recorded a corresponding increase to its valuation allowances. As a result, no tax benefit or effect on accumulated deficit was recognized in association with the adoption of ASU 2016-09.
Reconciliation of U.S. statutory federal income taxes to the Company’s provision for (benefit from) income taxes is as follows:
(In thousands) | 2018 | 2017 | 2016 | ||||||||
U.S. federal income taxes at statutory rate | $ | (3,570 | ) | $ | (5,778 | ) | $ | (12,450 | ) | ||
U.S. state and local income taxes | (1,441 | ) | (2,454 | ) | (1,813 | ) | |||||
Foreign income tax rate differential | (53 | ) | (1,101 | ) | (4,680 | ) | |||||
Dutch tax settlement | — | 7,361 | — | ||||||||
Stock-based compensation | 4,025 | 1,503 | 6,521 | ||||||||
Research tax credits | (2,343 | ) | (1,787 | ) | (4,036 | ) | |||||
Change in tax rate | 25,725 | — | (624 | ) | |||||||
Other | 259 | 1,197 | 191 | ||||||||
Change in valuation allowance | (21,546 | ) | (1,232 | ) | 19,535 | ||||||
Provision for (benefit from) income taxes | $ | 1,056 | $ | (2,291 | ) | $ | 2,644 | ||||
In December 2013, the Company entered into a written Settlement Agreement with the Dutch Tax Administration related to taxable profits of Sonos Europe B.V. The Settlement Agreement, which expired on October 1, 2016, provided for a 3% profit based on the statutory revenue of Sonos Europe B.V. which is then allowed to be reduced to 1% for taxable income purposes by utilizing prior year’s net operating losses. As of October 3, 2015, these net operating losses had been fully utilized.
In December 2016, the Company reached an agreement with the Dutch Tax Administration to amend the terms of the aforementioned Settlement Agreement (the "Amendment"). Based on a review of the functions, risks and assets of the Company, it was agreed that Sonos Europe B.V.’s arm’s length remuneration should be adjusted for fiscal years 2015 and 2016. The Company’s application of the terms of this Amendment generated a pre-tax loss in fiscal 2015 and 2016 in Sonos Europe B.V., a portion of which is treated as non-deductible for tax purposes and also resulted in an adjustment to the allocation of income and loss to Sonos, Inc., which led to the reduction of pre-existing net operating losses for U.S. tax purposes. As of September 30, 2017, the Company has utilized all of its Dutch tax loss carryforwards. Additionally, as a result of concluding the terms of the Amendment, the Company was released from previously accrued for Dutch income tax liabilities related to fiscal 2015 and fiscal 2016, resulting in a one-time tax benefit of $4.9 million for the year ended September 30, 2017.
79
SONOS, INC.
NOTES TO CONSOLIDATED FINANCIAL STATEMENTS (CONTINUED)
In January 2017, the Company entered into a unilateral Advance Pricing Agreement (the "APA") with the Dutch Tax Administration. The APA establishes an intercompany licensing arrangement whereby the operating profit or loss, as determined under U.S. GAAP, of Sonos Europe B.V. and Sonos, Inc. will be allocated between the two companies based on relative contribution to the development of marketing and technology intangibles. The APA has a five-year term that commenced on October 2, 2016 and ends on September 30, 2021.
Change in unrecognized tax benefits as a result of uncertain tax positions are as follows:
2018 | 2017 | ||||||
(In thousands) | |||||||
Beginning balance | $ | 13,780 | $ | 11,496 | |||
Increase (decrease) - tax positions in prior periods | 636 | (23 | ) | ||||
Increase (decrease) - tax positions in current periods | 3,378 | 2,307 | |||||
Ending balance | $ | 17,794 | $ | 13,780 | |||
The unrecognized tax benefits, if recognized, would increase a deferred tax asset which is expected to require a full valuation allowance based on the current circumstances and would not affect the Company’s effective tax rate for each period presented. The Company does not anticipate changes to unrecognized benefits within the next 12 months that would result in a material change to the Company’s financial position.
The Company conducts business in a number of tax jurisdictions and, as such, is required to file income tax returns in multiple jurisdictions globally. U.S. federal income tax returns for the 2014 tax year and earlier are no longer subject to examination by the U.S. Internal Revenue Service (the "IRS"). All net operating losses and tax credits generated to date are subject to adjustment for U.S. federal and state purposes.
The Company recognizes interest and penalties, if any, related to uncertain tax positions in income tax expense. There was no accrued interest or penalties as of September 29, 2018 and September 30, 2017. As of September 29, 2018, no tax provision has been made for $5.7 million of undistributed earnings of certain of the Company’s subsidiaries as these earnings are considered indefinitely reinvested. If, in the future, the Company decides to repatriate the undistributed earnings from these subsidiaries in the form of dividends or otherwise, the Company could be subject to withholding taxes payable at that time. The amount of withholding tax liability is dependent on circumstances existing if and when a remittance occurs, but could be reasonably estimated to be $0.3 million.
Tax Act
On December 22, 2017, President Trump signed the Tax Cuts and Jobs Act (the "Tax Act") into law, implementing a wide variety of changes to the U.S. tax system. Among other changes at the corporate level, the Tax Act includes (i) a reduction in the U.S. federal corporate income tax rate from 35% to 21%, (ii) further limitations on the deductibility of interest expense and certain executive compensation, (iii) the repeal of the corporate alternative minimum tax, (iv) the imposition of a territorial tax system with a one-time repatriation tax on deemed repatriated earnings of foreign subsidiaries and (v) subjecting certain foreign earnings to U.S. taxation through a base erosion anti-abuse tax ("BEAT") and a new tax related to global intangible low taxed income ("GILTI"). Additionally, certain foreign derived intangible income ("FDII") may prospectively be subject to a reduced rate of income tax from the statutorily enacted rate of 21%. Some of these changes, including the BEAT, FDII and GILTI provisions, will not come into effect until the Company’s 2019 fiscal year, but because the decrease in the corporate income tax rate was effective January 1, 2018, the Company has reduced the future tax benefits of the Company’s existing U.S. deferred tax assets. However, since the Company maintains a full valuation allowance against these assets, it did not have a material impact on the Company’s results of operations or financial condition. The Company has not recorded a provision related to the one-time transition tax under Section 965 as the Company has estimated that its foreign subsidiaries have a consolidated deficit in accumulated and current earnings and profits.
The Company’s accounting for the elements of the Tax Act is incomplete. The Company has made reasonable estimates of the effects to the consolidated statements of operations and comprehensive income (loss) and consolidated balance sheets and have preliminarily determined that a provision is not required. The ultimate impact of the Tax Act may differ from the above estimates due to potential future legislative action to address questions that have arisen because of the Tax Act, issuance of additional guidance by the IRS to provide clarity on certain provisions of the Tax Act and any changes in accounting standards for income taxes or related interpretations in response to the Tax Act. The SEC has issued rules that allow for a measurement period of up to one year after the enactment date of the Tax Act to finalize the recording of the related tax impacts. The Company currently anticipates finalizing and recording any resulting adjustments during its fiscal quarter ending December 29, 2018.
80
SONOS, INC.
NOTES TO CONSOLIDATED FINANCIAL STATEMENTS (CONTINUED)
10. Net loss per share
Basic and diluted net loss per share attributable to common stockholders is presented in conformity with the two-class method required for participating securities. Upon the closing of the IPO, all outstanding shares of the Company's redeemable convertible preferred stock automatically converted into 32,482,590 shares of common stock on a one-for-one basis. Basic net loss attributable to common stockholders per share is calculated by dividing net loss attributable to common stockholders by the weighted-average number of shares of common stock outstanding less shares subject to repurchase.
The following table sets forth the computation of the Company’s basic and diluted net loss per share:
2018 | 2017 | 2016 | |||||||||
(In thousands, except share and per share data) | |||||||||||
Numerator: | |||||||||||
Net loss attributable to common stockholders—basic and diluted | $ | (15,604 | ) | $ | (14,217 | ) | $ | (38,214 | ) | ||
Denominator: | |||||||||||
Weighted-average shares of common stock—basic and diluted | 65,706,215 | 56,314,546 | 53,873,051 | ||||||||
Net loss per share attributable to common stockholders: | |||||||||||
Net loss per share attributable to common stockholders—basic and diluted | $ | (0.24 | ) | $ | (0.25 | ) | $ | (0.71 | ) | ||
The following potentially dilutive shares as of the end of each period presented were excluded from the computation of diluted net loss per share for the periods presented because including them would have been antidilutive:
2018 | 2017 | 2016 | ||||||
Stock options to purchase common stock | 48,504,182 | 45,817,252 | 45,940,594 | |||||
Convertible preferred stock | — | 32,482,590 | 32,482,590 | |||||
Shares subject to repurchase | — | 53,892 | 53,892 | |||||
Total | 48,504,182 | 78,353,734 | 78,477,076 | |||||
81
SONOS, INC.
NOTES TO CONSOLIDATED FINANCIAL STATEMENTS (CONTINUED)
11. Commitments and contingencies
The following table presents noncancelable payments due by the Company as of September 29, 2018, and
excludes amounts already recorded on the consolidated balance sheet:
Fiscal years ended | ||||||||||||||||||||||||||||
(In thousands) | Total | 2019 | 2020 | 2021 | 2022 | 2023 | Beyond | |||||||||||||||||||||
Operating leases | $ | 85,546 | $ | 16,830 | $ | 14,120 | $ | 12,391 | $ | 11,654 | $ | 11,870 | $ | 18,681 | ||||||||||||||
Inventory | 70,900 | 70,900 | — | — | — | — | — | |||||||||||||||||||||
Other noncancelable agreements | 8,696 | 3,279 | 3,574 | 1,843 | — | — | — | |||||||||||||||||||||
Total contractual obligations | $ | 165,142 | $ | 91,009 | $ | 17,694 | $ | 14,234 | $ | 11,654 | $ | 11,870 | $ | 18,681 | ||||||||||||||
Operating leases
The Company entered into various non-cancelable operating lease agreements substantially for offices and facilities as well for auto leases. Company’s main offices are leased in California, Massachusetts and the Netherlands with additional sales and operations offices around the world. These facilities operate under leases with initial terms ranging from one to ten years and expire at various dates through 2025.
Rent expense during the years ended September 29, 2018, September 30, 2017 and October 1, 2016 was $14.5 million, and $13.5 million and $14.5 million, respectively.
Inventory
The Company enters into various inventory-related purchase agreements with suppliers. Under these agreements, 100% of orders are cancelable by giving sufficient notice prior to the expected shipment date.
Legal proceedings
From time to time, the Company is involved in legal proceedings in the ordinary course of business, including claims relating to employee relations, business practices and patent infringement. Litigation can be expensive and disruptive to normal business operations. Moreover, the results of complex legal proceedings are difficult to predict and the Company’s view of these matters may change in the future as the litigation and events related thereto unfold. The Company expenses legal fees as incurred. The Company records a provision for contingent losses when it is both probable that a liability has been incurred and the amount of the loss can be reasonably estimated. An unfavorable outcome to any legal matter, if material, could have an adverse effect on the Company’s operations or its financial position, liquidity or results of operations.
On October 21, 2014, the Company commenced a patent infringement action in the United States District Court, District of Delaware against D&M Holdings Inc. d/b/a The D+M Group, D&M Holdings U.S. Inc. and Denon Electronics (USA), LLC (collectively, "Denon"). On May 18, 2018, the Company entered into a patent covenant agreement with Denon, effective May 17, 2018, with a term lasting through May 22, 2022. Under the agreement, Denon will make royalty payments covering both historical sales and sales throughout the term, at an effective royalty rate materially consistent with the December 14, 2017 jury verdict. Pursuant to the agreement, all claims asserted in the Company’s patent infringement claim against Denon and in Denon’s countersuit against the Company were dismissed with prejudice and the parties released claims of any past infringement of the patents asserted in the litigation between the Company and Denon and any patents related thereto.
On March 10, 2017, Implicit, LLC ("Implicit") filed a patent infringement action in the United States District Court, District of Delaware against the Company. Implicit is asserting that the Company infringed on two patents in this case. The Company denies the allegations. There is no assurance of a favorable outcome and the Company’s business could be adversely affected as a result of a finding that the Company patents-in-suit are invalid and/or unenforceable. A range of loss, if any, associated with this matter is not probable or reasonably estimable as of September 29, 2018 and September 30, 2017.
The Company is involved in certain other litigation matters not listed above but does not consider the matters to be material either individually or in the aggregate at this time. The Company’s view of the matters not listed may change in the future as the litigation and events related thereto unfold.
82
SONOS, INC.
NOTES TO CONSOLIDATED FINANCIAL STATEMENTS (CONTINUED)
Product warranties
As of September 29, 2018, the Company recorded $2.4 million of warranty liability in other current liabilities on the consolidated balance sheets. Changes in the Company’s warranty liability were as follows:
(In thousands) | 2018 | 2017 | 2016 | ||||||||
Warranty liability at beginning of year | $ | 2,437 | $ | 2,491 | $ | 2,722 | |||||
Provision for warranties issued during the year | 10,678 | 5,867 | 5,412 | ||||||||
Settlements of warranty claims during the year | (10,665 | ) | (5,921 | ) | (5,643 | ) | |||||
Warranty liability at end of year | $ | 2,450 | $ | 2,437 | $ | 2,491 | |||||
Guarantees and indemnifications
In the normal course of business, the Company enters into agreements that contain a variety of representations and warranties and provide for general indemnification. The Company’s exposure under these agreements is unknown because it involves claims that may be made against the Company in the future, but have not yet been made. It is not possible to make a reasonable estimate of the maximum potential amount of future payments under these or similar agreements due to the conditional nature of the Company’s obligations and the unique facts and circumstances involved in each particular agreement. To date, the Company has not incurred material costs to defend lawsuits or settle claims related to these indemnification provisions. The Company has also entered into indemnification agreements with its directors and officers that may require the Company to indemnify its directors and officers against liabilities that may arise by reason of their status or service as directors or officers to the fullest extent permitted by the Delaware General Corporation Law. The Company also currently has directors’ and officers’ insurance. No amount has been accrued in the financial statements with respect to these indemnification guarantees.
12. Quarterly financial data (unaudited)
The following table shows a summary of the Company’s unaudited quarterly financial information for each of the four quarters of 2018 and 2017 (the sum of quarterly periods may not equal full-year amounts due to rounding):
Three Months Ended | |||||||||||||||
September 29, 2018 | June 30, 2018 | March 31, 2018 | December 30, 2017 | ||||||||||||
(In thousands, except per share amounts) | |||||||||||||||
Revenue | $ | 272,940 | $ | 208,398 | $ | 186,720 | $ | 468,950 | |||||||
Gross profit | 116,277 | 95,489 | 81,341 | 196,201 | |||||||||||
Net income (loss) | (1,720 | ) | (26,988 | ) | (32,592 | ) | 45,697 | ||||||||
Net income (loss) per share - basic | $ | (0.02 | ) | $ | (0.45 | ) | $ | (0.55 | ) | $ | 0.42 | ||||
Net income (loss) per share - diluted | $ | (0.02 | ) | $ | (0.45 | ) | $ | (0.55 | ) | $ | 0.36 | ||||
Three Months Ended | |||||||||||||||
September 30, 2017 | July 1, 2017 | April 1, 2017 | December 31, 2016 | ||||||||||||
(In thousands, except per share amounts) | |||||||||||||||
Revenue | $ | 214,095 | $ | 223,078 | $ | 182,546 | $ | 372,807 | |||||||
Gross profit | 102,891 | 107,288 | 86,105 | 159,782 | |||||||||||
Net income (loss) | (14,906 | ) | (14,539 | ) | (19,790 | ) | 35,017 | ||||||||
Net income (loss) per share - basic | $ | (0.26 | ) | $ | (0.26 | ) | $ | (0.35 | ) | $ | 0.32 | ||||
Net income (loss) per share - diluted | $ | (0.26 | ) | $ | (0.26 | ) | $ | (0.35 | ) | $ | 0.26 | ||||
83
Item 9. Changes in and disagreements with accountants on accounting and financial disclosure
None.
Item 9A. Controls and procedures
Evaluation of disclosure controls and procedures
Our management, with the participation of our Chief Executive Officer and Chief Financial Officer, has evaluated the effectiveness of our disclosure controls and procedures (as defined in Rules 13a-15(e) and 15d-15(e) under the Securities Exchange Act of 1934, as amended), as of the end of the period covered by this Annual Report on Form 10-K.
Based on the evaluation of our disclosure controls and procedures as of September 29, 2018, our Chief Executive Officer and Chief Financial Officer concluded that, as a result of material weaknesses in our internal control over financial reporting as described below, our disclosure controls and procedures were not effective as of September 29, 2018.
Material weaknesses in internal control over financial reporting
During 2017, we identified material weaknesses in our internal control over financial reporting, as defined in the standards established by the Sarbanes-Oxley Act of 2002 (the "Sarbanes-Oxley Act"). A material weakness is a deficiency, or a combination of deficiencies, in internal control over financial reporting such that there is a reasonable possibility that a material misstatement of our annual or interim financial statements will not be prevented or detected on a timely basis.
We identified a material weakness related to an insufficient complement of experienced personnel with the requisite technical knowledge of financial statement disclosures and accounting for non-routine, unusual or complex events and transactions. This material weakness in our control environment contributed to an additional material weakness in that we did not maintain effective internal controls to address the accounting of non-routine, unusual or complex events and transactions and the related financial statement presentation of such transactions.
Management’s plan to remediate the material weaknesses
As a result of these material weaknesses, we have initiated and will continue to implement remediation measures including, but not limited to, hiring experienced additional accounting and financial reporting personnel as well as the creation of additional controls including those designed to strengthen our review processes around financial statement disclosures and accounting for non-routine, unusual or complex transactions.
The initiatives we are implementing to remediate the material weaknesses are subject to continued management review supported by confirmation and testing, as well as audit committee oversight. We will continue to implement measures to remedy our internal control deficiencies through the end of our fiscal 2019, which coincides with the first year in which we will be required to provide management's report on internal control over financial reporting under Section 404 of the Sarbanes-Oxley Act.
Notwithstanding the material weaknesses, our management has concluded that the consolidated financial statements included elsewhere in this Annual Report on Form 10-K present fairly, in all material respects, our financial position, results of operations and cash flows in conformity with U.S. GAAP.
Changes in internal control
Other than the changes intended to remediate the material weaknesses noted above, there were no changes in our internal control over financial reporting during the three months ended September 29, 2018 that have materially affected, or are reasonably likely to materially affect, our internal control over financial reporting.
84
Attestation report of the registered public accounting firm
This Annual Report on Form 10-K does not include a report of management's assessment regarding internal control over financial reporting or an attestation report of our independent registered public accounting firm as permitted in this transition period under the rules of the SEC for newly public companies. A report of management’s assessment regarding internal control over financial reporting will be required to be included in our Annual Report on Form 10-K for the fiscal year ended September 28, 2019.
Item 9B. Other information
None.
PART III
Item 10. Directors, executive officers and corporate governance
The information required by this item is incorporated by reference to our definitive Proxy Statement for the 2019 Annual Meeting of Stockholders to be filed with the SEC within 120 days after the end of our year ended September 29, 2018.
Item 11. Executive compensation
The information required by this item is incorporated by reference to our definitive Proxy Statement for the 2019 Annual Meeting of Stockholders to be filed with the SEC within 120 days after the end of our year ended September 29, 2018.
Item 12. Security ownership of certain beneficial owners and management and related stockholder matters
The information required by this item is incorporated by reference to our definitive Proxy Statement for the 2019 Annual Meeting of Stockholders to be filed with the SEC within 120 days after the end of our year ended September 29, 2018.
Item 13. Certain relationships and related transactions, and director independence
The information required by this item is incorporated by reference to our definitive Proxy Statement for the 2019 Annual Meeting of Stockholders to be filed with the SEC within 120 days after the end of our year ended September 29, 2018.
Item 14. Principal accounting fees and services
The information required by this item is incorporated by reference to our definitive Proxy Statement for the 2019 Annual Meeting of Stockholders to be filed with the SEC within 120 days after the end of our year ended September 29, 2018.
PART IV
Item 15. Exhibits, financial statement schedules
(a)(1) Financial statements
The information concerning Sonos’ financial statements and the Report of Independent Registered Public Accounting Firm required by this Item 15(a)(1) is incorporated by reference herein to the section of this Annual Report on Form 10-K in Part II, Item 8, titled "Financial Statements and Supplementary Data."
(a)(2) Financial statement schedule
All financial statement schedules have been omitted as the information is not required under the related instructions or is not applicable or because the information required is already included in the financial statements or the notes to those financial statements.
85
(a)(3) Exhibits
We have filed, or incorporated into this Annual Report on Form 10-K by reference, the exhibits listed on the accompanying Exhibit Index immediately preceding the signature page of this Annual Report on Form 10-K.
EXHIBIT INDEX
Exhibit Number | Incorporated By Reference | Filed or Furnished Herewith | ||||||||||
Exhibit Title | Form | File No. | Exhibit | Filing Date | ||||||||
10-Q | 001-38603 | 3.1 | 9/11/2018 | |||||||||
10-Q | 001-38603 | 3.2 | 9/11/2018 | |||||||||
S-1 | 333-226076 | 4.01 | 7/6/2018 | |||||||||
S-1 | 333-226076 | 4.02 | 7/6/2018 | |||||||||
S-1 | 333-226076 | 10.01 | 7/6/2018 | |||||||||
S-1 | 333-226076 | 10.02 | 7/6/2018 | |||||||||
S-1/A | 333-226076 | 10.03 | 7/23/2018 | |||||||||
S-1 | 333-226076 | 10.04 | 7/6/2018 | |||||||||
S-1 | 333-226076 | 10.05 | 7/6/2018 | |||||||||
S-1 | 333-226076 | 10.06 | 7/6/2018 | |||||||||
S-1 | 333-226076 | 10.07 | 7/6/2018 | |||||||||
S-1 | 333-226076 | 10.08 | 7/6/2018 | |||||||||
X | ||||||||||||
X | ||||||||||||
S-1 | 333-226076 | 21.1 | 7/6/2018 | |||||||||
X | ||||||||||||
X | ||||||||||||
X | ||||||||||||
X | ||||||||||||
86
X | ||||||||||||
X | ||||||||||||
101.INS | XBRL Instance Document | X | ||||||||||
101.SCH | XBRL Taxonomy Extension Schema Document | X | ||||||||||
101.CAL | XBRL Taxonomy Extension Calculation Linkbase Document | X | ||||||||||
101.DEF | XBRL Taxonomy Extension Definition Linkbase Document | X | ||||||||||
101.LAB | XBRL Taxonomy Extension Label Linkbase Document | X | ||||||||||
101.PRE | XBRL Taxonomy Extension Presentation Linkbase Document | X | ||||||||||
* These exhibits are furnished with this Annual Report on Form 10-K and are not deemed filed with the Securities and Exchange Commission and are not incorporated by reference in any filing of Sonos, Inc. under the Securities Act of 1933, as amended, or the Securities Exchange Act of 1934, as amended, whether made before or after the date hereof and irrespective of any general incorporation language contained in such filings.
+ Indicates a management contract or compensatory plan or arrangement.
† Confidential treatment has been granted with respect to portions of this exhibit.
87
SIGNATURES
Pursuant to the requirements of the Securities Exchange Act of 1934, the Registrant has duly caused this Annual Report on Form 10-K to be signed on its behalf by the undersigned thereunto duly authorized.
Sonos, Inc.
Date: November 28, 2018 | By: | /s/ Patrick Spence |
Patrick Spence | ||
Chief Executive Officer and Director | ||
(Principal Executive Officer) | ||
Date: November 28, 2018 | By: | /s/ Michael Giannetto |
Michael Giannetto | ||
Chief Financial Officer | ||
(Principal Financial Officer and Principal Accounting Officer) | ||
88
POWER OF ATTORNEY
KNOW ALL PERSONS BY THESE PRESENTS, that each individual whose signature appears below constitutes and appoints Patrick Spence and Michael Giannetto, and each of them, such individual’s true and lawful attorneys-in-fact and agents with full power of substitution, for such individual and in such individual’s name, place and stead, in any and all capacities, to sign any amendments to this Annual Report on Form 10-K, and to file the same, with all exhibits thereto and all documents in connection therewith, with the Securities and Exchange Commission, granting unto said attorneys-in-fact and agents, and each of them, full power and authority to do and perform each and every act and thing requisite and necessary to be done in and about the premises, as fully to all intents and purposes as such individual might or could do in person, hereby ratifying and confirming all that said attorneys-in-fact and agents, or any of them or their substitute or substitutes, may lawfully do or cause to be done or by virtue hereof.
Pursuant to the requirements of the Securities Exchange Act of 1934, this Annual Report on Form 10-K has been signed by the following persons in the capacities and on the dates indicated:
Signature | Title | Date | ||
/s/ Patrick Spence | Chief Executive Officer | November 28, 2018 | ||
Patrick Spence | (Principal Executive Officer) | |||
/s/ Michael Giannetto | Chief Financial Officer | November 28, 2018 | ||
Michael Giannetto | (Principal Financial Officer and Principal Accounting Officer) | |||
/s/ Robert Bach | Director | November 28, 2018 | ||
Robert Bach | ||||
/s/ Brittany Bagley | Director | November 28, 2018 | ||
Brittany Bagley | ||||
/s/ Karen Boone | Director | November 28, 2018 | ||
Karen Boone | ||||
/s/ Thomas Conrad | Director | November 28, 2018 | ||
Thomas Conrad | ||||
/s/ Julius Genachowski | Director | November 28, 2018 | ||
Julius Genachowski | ||||
/s/ John Maeda | Director | November 28, 2018 | ||
John Maeda | ||||
/s/ Michelangelo Volpi | Director and Chairperson of the Board of Directors | November 28, 2018 | ||
Michelangelo Volpi | ||||
89