Attached files
| file | filename |
|---|---|
| EX-10.1 - EXHIBIT 10.1 - Atlantic Capital Bancshares, Inc. | projectbluepurchaseassumpt.htm |
| EX-99.2 - EXHIBIT 99.2 - Atlantic Capital Bancshares, Inc. | projectblue-xpressreleasei.htm |
| 8-K - 8-K - Atlantic Capital Bancshares, Inc. | acb-form8xkpurchaseandassu.htm |
NASDAQ TICKER: ACBI Divestiture of the Tennessee / North Georgia Franchise
Forward-Looking Statements This presentation contains forward-looking statements within the meaning of section 27A of the Securities Act of 1933, as amended, and section 21E of the Securities Exchange Act of 1934, as amended. These forward-looking statements reflect our current views with respect to, among other things, future events and our financial performance. These statements are often, but not always, made through the use of words or phrases such as “may,” “should,” “could,” “predict,” “potential,” “believe,” “will likely result,” “expect,” “continue,” “will,” “anticipate,” “seek,” “estimate,” “intend,” “plan,” “projection,” “would” and “outlook,” or the negative version of those words or other comparable of a future or forward-looking nature. These forward- looking statements are not historical facts, and are based on current expectations, estimates and projections about our industry, management’s beliefs and certain assumptions made by management, many of which, by their nature, are inherently uncertain and beyond our control. Accordingly, we caution you that any such forward-looking statements are not guarantees of future performance and are subject to risks, assumptions and uncertainties that are difficult to predict. Although we believe that the expectations reflected in these forward-looking statements are reasonable as of the date made, actual results may prove to be materially different from the results expressed or implied by the forward-looking statements. The following risks, among others, could cause actual results to differ materially from the anticipated results or other expectations expressed in the forward-looking statements: the actual impact of the divestiture may be different than anticipated; costs associated with, and fluctuations in income resulting from, strategic decisions with respect to particular markets, locations or lines of business; loss of income from the divested markets, and potential loss of customers, following our exit of these markets and the retail mortgage business; changes in asset quality and credit risk; the cost and availability of capital; customer acceptance of our products and services; customer borrowing, repayment, investment and deposit practices; the introduction, withdrawal, success and timing of business initiatives; the impact, extent, and timing of technological changes; severe catastrophic events in our geographic area; a weakening of the economies in which we conduct operations may adversely affect our operating results; the U.S. legal and regulatory framework, including those associated with the Dodd-Frank Wall Street Reform and Consumer Protection Act (the “Dodd-Frank Act”), could adversely affect the operating results of the company; an increasing interest rate environment may compress margins and adversely affect net interest income; changes in trade, monetary and fiscal policies of various governmental bodies and central banks could affect the economic environment in which we operate; our ability to determine accurate values of certain assets and liabilities; adverse developments in securities, public debt, and capital markets, including changes in market liquidity and volatility; our ability to anticipate or respond to interest rate changes correctly and manage interest rate risk presented through unanticipated changes in our interest rate risk position and/or short- and long-term interest rates; unanticipated changes in our liquidity position, including but not limited to our ability to enter the financial markets to manage and respond to any changes to our liquidity position; adequacy of our risk management program; increased costs associated with operating as a public company; increased competitive pressure due to consolidation in the financial services industry, particularly the entry of larger financial institutions in our geographic markets; risks related to security breaches, cybersecurity attacks and other significant disruptions in our information technology systems, including attacks focused on the financial industry, may result in costs and liabilities related to compromised personal information of our customers; the effect of changes in tax law, such as the effect of the Tax Cuts and Jobs Act that was enacted on December 22, 2017; or other risks and factors identified in our Annual Report on Form 10-K as filed with the Securities and Exchange Commission on March 15, 2018 in Part I, Item 1A under the heading “Risk Factors” and in Part II, item 7 under the heading “Management’s Discussion and Analysis of Financial Condition and Results of Operations.” 2
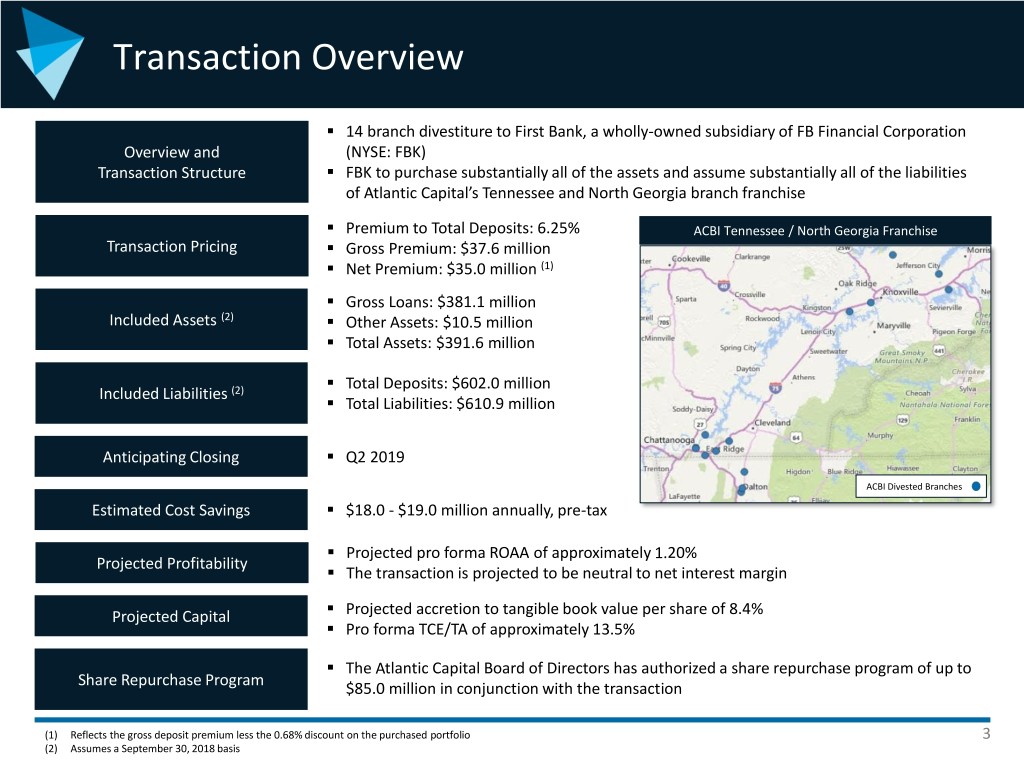
Transaction Overview . 14 branch divestiture to First Bank, a wholly-owned subsidiary of FB Financial Corporation Overview and (NYSE: FBK) Transaction Structure . FBK to purchase substantially all of the assets and assume substantially all of the liabilities of Atlantic Capital’s Tennessee and North Georgia branch franchise . Premium to Total Deposits: 6.25% ACBI Tennessee / North Georgia Franchise Transaction Pricing . Gross Premium: $37.6 million . Net Premium: $35.0 million (1) . Gross Loans: $381.1 million Included Assets (2) . Other Assets: $10.5 million . Total Assets: $391.6 million . Total Deposits: $602.0 million Included Liabilities (2) . Total Liabilities: $610.9 million Anticipating Closing . Q2 2019 ACBI Divested Branches Estimated Cost Savings . $18.0 - $19.0 million annually, pre-tax . Projected pro forma ROAA of approximately 1.20% Projected Profitability . The transaction is projected to be neutral to net interest margin . Projected Capital Projected accretion to tangible book value per share of 8.4% . Pro forma TCE/TA of approximately 13.5% . The Atlantic Capital Board of Directors has authorized a share repurchase program of up to Share Repurchase Program $85.0 million in conjunction with the transaction (1) Reflects the gross deposit premium less the 0.68% discount on the purchased portfolio 3 (2) Assumes a September 30, 2018 basis

Strategic Rationale Results in a stronger company, with strategic clarity and an opportunity for meaningful value creation . Clarifies strategic focus on Atlantic Capital’s high performing commercial Clarifies Strategy businesses in Atlanta and nationally . Redirects investment of capital and other resources to these businesses . Results in immediate improvement in Atlantic Capital’s financial Financially performance with significant cost savings Compelling . Enhances shareholder returns and EPS accretion through significant share repurchase program . Produces immediate tangible book value accretion Accretive to Capital . Generates significant excess capital 4
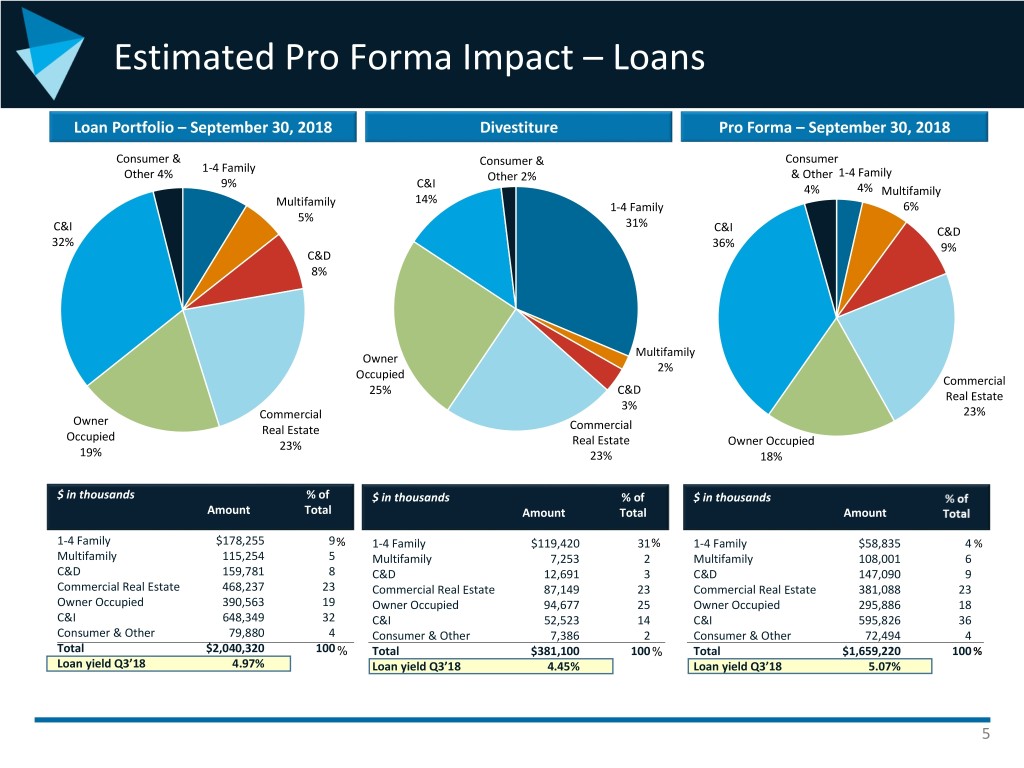
Estimated Pro Forma Impact – Loans Loan Portfolio – September 30, 2018 Divestiture Pro Forma – September 30, 2018 Consumer & Consumer & Consumer 1-4 Family Other 4% Other 2% & Other 1-4 Family 9% C&I 4% 4% Multifamily 14% Multifamily 1-4 Family 6% 5% 31% C&I C&I C&D 32% 36% 9% C&D 8% Multifamily Owner 2% Occupied Commercial C&D 25% Real Estate 3% Commercial 23% Owner Real Estate Commercial Occupied 23% Real Estate Owner Occupied 19% 23% 18% $ in thousands % of $ in thousands % of $ in thousands % of Amount Total Amount Total Amount Total 1-4 Family $178,255 9% 1-4 Family $119,420 31% 1-4 Family $58,835 4 % Multifamily 115,254 5 Multifamily 7,253 2 Multifamily 108,001 6 C&D 159,781 8 C&D 12,691 3 C&D 147,090 9 Commercial Real Estate 468,237 23 Commercial Real Estate 87,149 23 Commercial Real Estate 381,088 23 Owner Occupied 390,563 19 Owner Occupied 94,677 25 Owner Occupied 295,886 18 C&I 648,349 32 C&I 52,523 14 C&I 595,826 36 Consumer & Other 79,880 4 Consumer & Other 7,386 2 Consumer & Other 72,494 4 Total $2,040,320 100 % Total $381,100 100% Total $1,659,220 100 % Loan yield Q3’18 4.97% Loan yield Q3’18 4.45% Loan yield Q3’18 5.07% 5
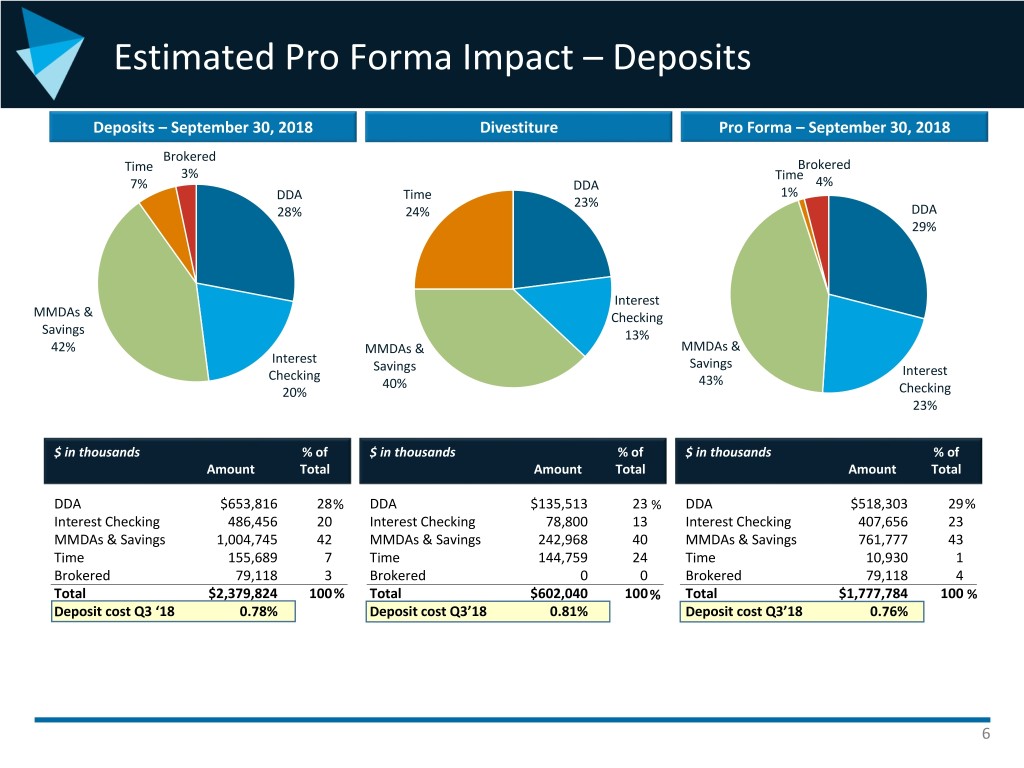
Estimated Pro Forma Impact – Deposits Deposits – September 30, 2018 Divestiture Pro Forma – September 30, 2018 Brokered Time Brokered 3% Time 7% DDA 4% DDA Time 1% 23% 28% 24% DDA 29% Interest MMDAs & Checking Savings 13% 42% MMDAs & MMDAs & Interest Savings Savings Checking Interest 40% 43% 20% Checking 23% $ in thousands % of $ in thousands % of $ in thousands % of Amount Total Amount Total Amount Total DDA $653,816 28% DDA $135,513 23 % DDA $518,303 29% Interest Checking 486,456 20 Interest Checking 78,800 13 Interest Checking 407,656 23 MMDAs & Savings 1,004,745 42 MMDAs & Savings 242,968 40 MMDAs & Savings 761,777 43 Time 155,689 7 Time 144,759 24 Time 10,930 1 Brokered 79,118 3 Brokered 0 0 Brokered 79,118 4 Total $2,379,824 100% Total $602,040 100% Total $1,777,784 100 % Deposit cost Q3 ‘18 0.78% Deposit cost Q3’18 0.81% Deposit cost Q3’18 0.76% 6

Estimated Pro Forma Impact – TBVPS and Capital Significant accretion to TBVPS, with excess capital to be deployed to optimize shareholder value P&A / Divestiture Transaction Secondary Transaction Adjustments Pro Forma ACBI ACBI TN & N. GA Pro Forma Fed DTA Post Secondary Dollars in thousands, As Reported Divestiture ACBI Post Transaction Write-down TN DTA Amortization LLR Accretion Transaction except per share amounts 9/30/2018 Adjustments Divestiture Expenses of Intangibles Write-down Acceleration Reversal Acceleration Adjustments Assets: Cash & Equivalents $189,587 ($3,055) $186,532 ($6,500) $180,032 Investment Securities 498,777 (84,313) 414,464 414,464 Gross Loans 2,040,320 (381,100) 1,659,220 3,050 1,662,270 Loan Loss Reserve (20,443) (20,443) (3,100) (17,343) Net Loans 2,019,877 1,638,777 1,644,927 Premises and Equipment, Net 17,371 (7,440) 9,931 9,931 Other Real Estate Owned 968 968 968 Goodwill 21,691 21,691 (21,691) 0 CDI 1,676 1,676 (1,676) 0 Other Assets 132,774 132,774 1,625 (419) (4,900) 4,100 (775) (763) 131,643 Total Assets $2,882,721 ($475,908) $2,406,813 ($4,875) ($23,786) ($4,900) $4,100 $2,325 $2,288 $2,381,965 Liabilities: Noninterest Bearing 653,816 ($135,513) $518,303 $518,303 Interest Bearing 1,726,008 (466,527) 1,259,481 1,259,481 Total Deposits 2,379,824 (602,040) 1,777,784 1,777,784 Borrowings 91,904 91,096 183,000 183,000 Subordinated Debt 49,662 49,662 49,662 Other Liabilities 41,094 8,759 49,853 49,853 Total Liabilities 2,562,484 (502,185) 2,060,299 0 0 0 0 0 0 2,060,299 Shareholders' Equity 320,237 $26,277 346,514 (4,875) (23,786) (4,900) 4,100 2,325 2,288 321,666 Total Liabilities & Equity $2,882,721 ($475,908) $2,406,813 ($4,875) ($23,786) ($4,900) $4,100 $2,325 $2,288 $2,381,965 Tang. Common Equity / Tang. Assets 10.38% 13.56% 13.50% Tang. Book Value / Share $11.37 $12.38 $12.32 Accretion / (Dilution) vs. 9/30/18 ($) $1.01 $0.95 Accretion / (Dilution) vs. 9/30/18 (%) 8.9% 8.4% Note: Assumes a September 30, 2018 basis for purposes of the illustration; transaction projected to close in Q2 2019 7 Note: Assumes a 25% tax rate for all deferred tax adjustments
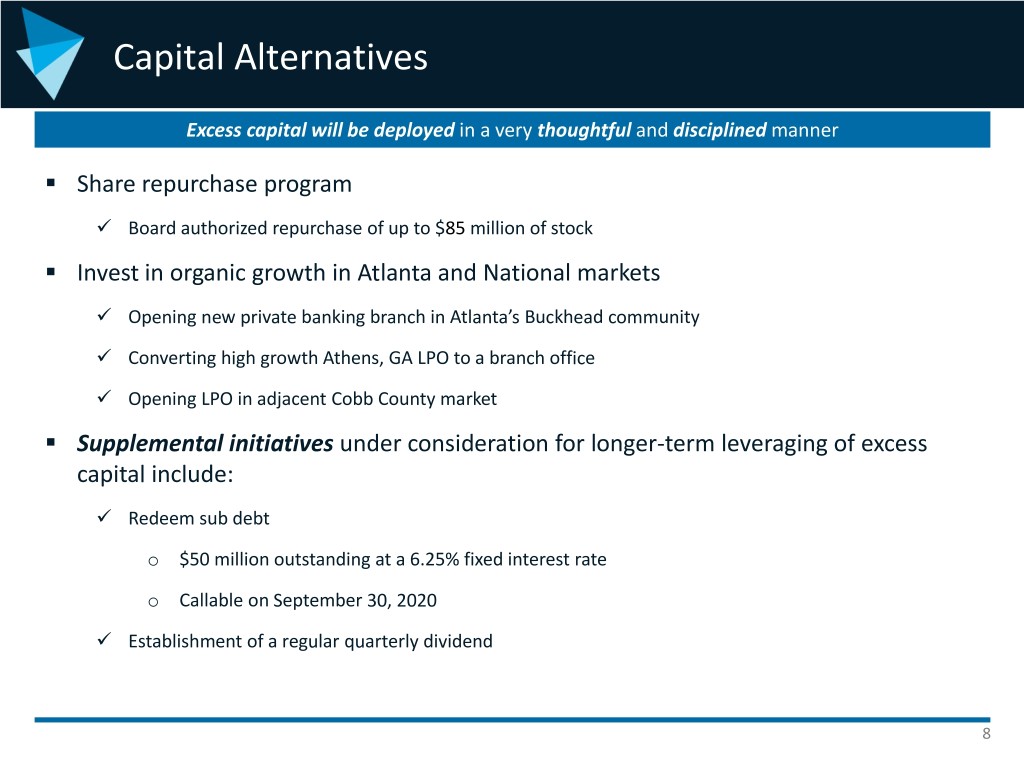
Capital Alternatives Excess capital will be deployed in a very thoughtful and disciplined manner . Share repurchase program Board authorized repurchase of up to $85 million of stock . Invest in organic growth in Atlanta and National markets Opening new private banking branch in Atlanta’s Buckhead community Converting high growth Athens, GA LPO to a branch office Opening LPO in adjacent Cobb County market . Supplemental initiatives under consideration for longer-term leveraging of excess capital include: Redeem sub debt o $50 million outstanding at a 6.25% fixed interest rate o Callable on September 30, 2020 Establishment of a regular quarterly dividend 8
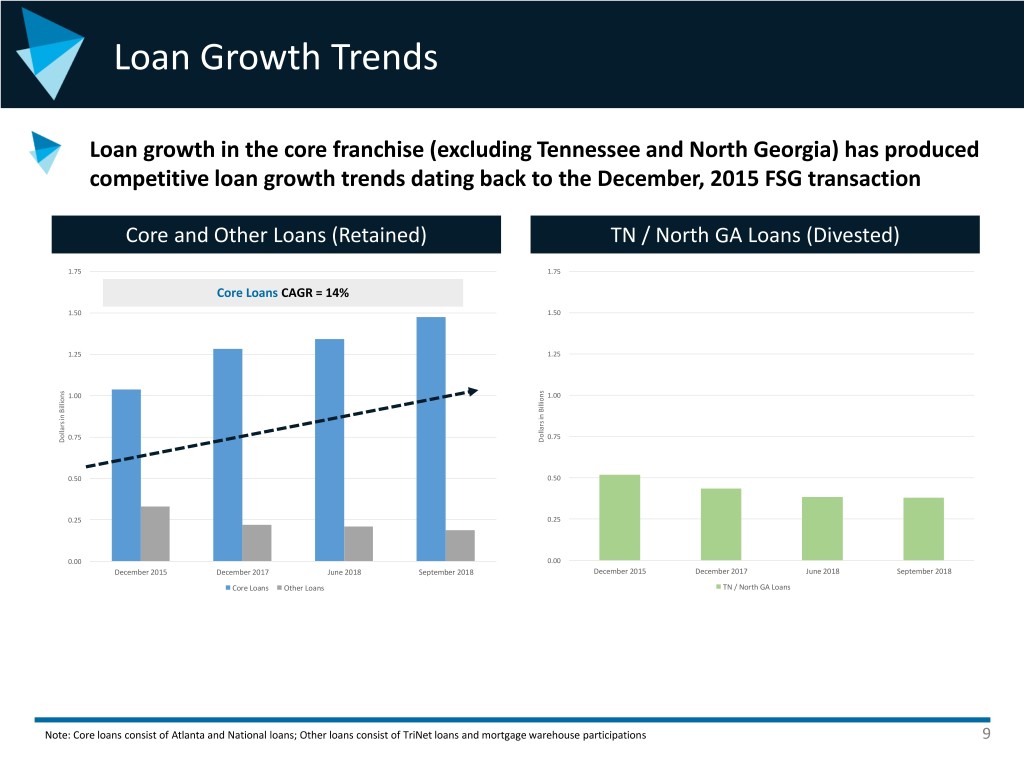
Loan Growth Trends Loan growth in the core franchise (excluding Tennessee and North Georgia) has produced competitive loan growth trends dating back to the December, 2015 FSG transaction Core and Other Loans (Retained) TN / North GA Loans (Divested) 1.75 1.75 Core Loans CAGR = 14% 1.50 1.50 1.25 1.25 1.00 1.00 0.75 0.75 Dollars inDollarsBillions Dollars inDollarsBillions 0.50 0.50 0.25 0.25 0.00 0.00 December 2015 December 2017 June 2018 September 2018 December 2015 December 2017 June 2018 September 2018 Core Loans Other Loans TN / North GA Loans Note: Core loans consist of Atlanta and National loans; Other loans consist of TriNet loans and mortgage warehouse participations 9
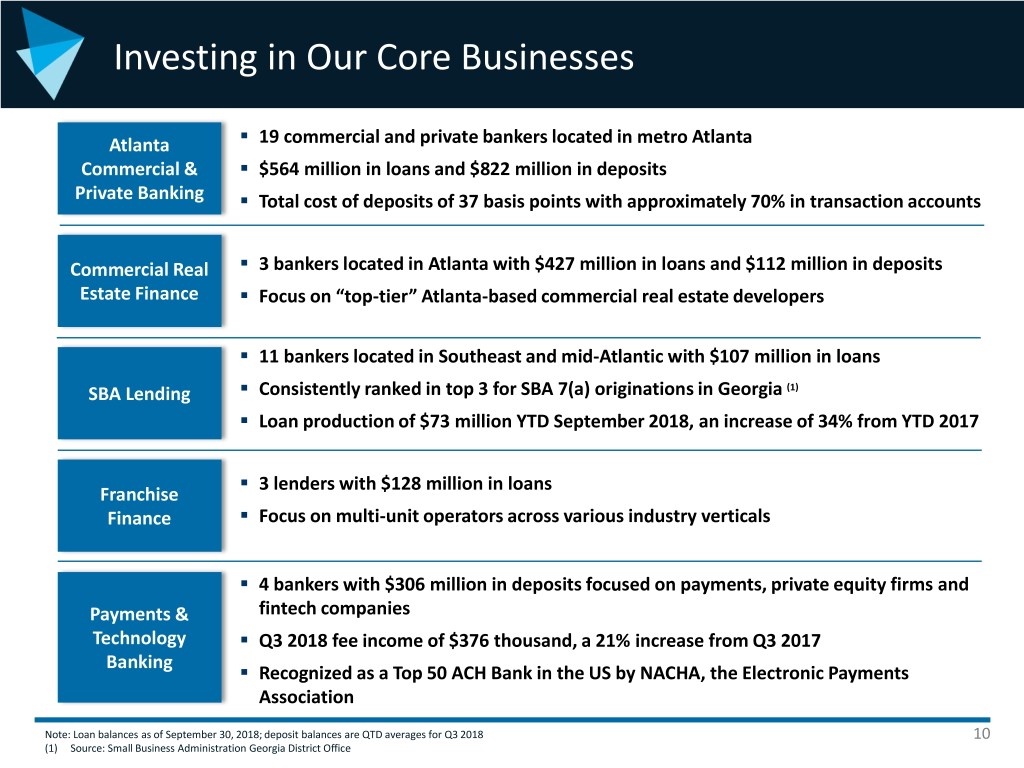
Investing in Our Core Businesses . Atlanta 19 commercial and private bankers located in metro Atlanta Commercial & . $564 million in loans and $822 million in deposits Private Banking . Total cost of deposits of 37 basis points with approximately 70% in transaction accounts . Commercial Real 3 bankers located in Atlanta with $427 million in loans and $112 million in deposits Estate Finance . Focus on “top-tier” Atlanta-based commercial real estate developers . 11 bankers located in Southeast and mid-Atlantic with $107 million in loans . SBA Lending Consistently ranked in top 3 for SBA 7(a) originations in Georgia (1) . Loan production of $73 million YTD September 2018, an increase of 34% from YTD 2017 . 3 lenders with $128 million in loans Franchise . Finance Focus on multi-unit operators across various industry verticals . 4 bankers with $306 million in deposits focused on payments, private equity firms and Payments & fintech companies Technology . Q3 2018 fee income of $376 thousand, a 21% increase from Q3 2017 Banking . Recognized as a Top 50 ACH Bank in the US by NACHA, the Electronic Payments Association Note: Loan balances as of September 30, 2018; deposit balances are QTD averages for Q3 2018 10 (1) Source: Small Business Administration Georgia District Office

Summary The new narrative of Atlantic Capital begins today…and we remain committed to our core strategy: Attract top tier talent and retain high quality TEAMMATES Build profitable RELATIONSHIPS Provide exceptional SERVICE Drive value for SHAREHOLDERS 11

Non-GAAP Financial Information Management believes that non-GAAP financial measures provide a greater understanding of ongoing performance and operations, and enhance comparability with prior periods. Non-GAAP financial measures should not be considered as an alternative to any measure of performance or financial condition as determined in accordance with GAAP, and investors should consider Atlantic Capital’s performance and financial condition as reported under GAAP and all other relevant information when assessing the performance or financial condition of the Company. Non-GAAP financial measures have limitations as analytical tools, and investors should not consider them in isolation or as a substitute for analysis of the results or financial condition as reported under GAAP. Non-GAAP financial measures may not be comparable to non-GAAP financial measures presented by other companies. Pro Forma ACBI Post Secondary ACBI As Reported Pro Forma ACBI Transaction 09/30/2018 Post Divestiture Adjustments Tangible book value per common share reconciliation Total shareholders’ equity $ 320,237 $ 346,514 $ 321,666 Intangible assets (23,367) (23,367) - Total tangible common equity $ 296,870 $ 323,147 $ 321,666 Common shares outstanding 26,103,666 26,103,666 26,103,666 Tangible book value $ 11.37 $ 12.38 $ 12.32 Tangible common equity to tangible assets reconciliation Total shareholders’ equity $ 320,237 $ 346,514 $ 321,666 Intangible assets (23,367) (23,367) - Total tangible common equity $ 296,870 $ 323,147 $ 321,666 Total assets $ 2,882,721 $ 2,406,813 $ 2,381,965 Intangible assets (23,367) (23,367) - Total tangible assets $ 2,859,354 $ 2,383,446 $ 2,381,965 Tangible common equity to tangible assets 10.38% 13.56% 13.50% 12
