Attached files
UNITED STATES
SECURITIES AND EXCHANGE COMMISSION
Washington, D.C. 20549

_______________________________________________
FORM 10-K
________________________________________________
ANNUAL REPORT PURSUANT TO SECTION 13 OR 15(d) OF THE SECURITIES AND EXCHANGE ACT OF 1934 |
For the fiscal year ended December 31, 2015
COMMISSION FILE NO. 001-37615
ATLANTIC CAPITAL BANCSHARES, INC.
(Exact Name of Registrant as Specified in its Charter)
Georgia | 20-5728270 |
(State of Incorporation) | (I.R.S. Employer Identification No.) |
3280 Peachtree Road NE, Suite 1600 Atlanta, Georgia | 30305 |
(Address of principal executive offices) | (Zip Code) |
Registrant’s telephone number, including area code: (404) 995-6050 | |
Securities registered pursuant to Section 12(b) of the Act: | Name of each exchange on which registered |
Title of each class | The NASDAQ Stock Market LLC |
Common Stock, no par value | (NASDAQ Global Select Market) |
Securities Registered Pursuant to Section 12(g) of the Act: None | |
Indicate by check mark if the registrant is a well-known seasoned issuer, as defined in Rule 405 of the Securities Act. Yes [ ] No [x]
Indicate by check mark if the registrant is not required to file reports pursuant to Section 13 or Section 15(d) of the Act. Yes [ ] No [x]
Indicate by check mark whether the Registrant (1) has filed all reports required to be filed by Section 13 or 15(d) of the Securities and Exchange Act of 1934 during the preceding 12 months (or for such shorter period that the Registrant was required to file such reports), and (2) has been subject to such filing requirements for the past 90 days. Yes [x] No [ ]
Indicate by check mark whether the registrant has submitted electronically and posted on its corporate Web site, if any, every Interactive Data File required to be submitted and posted pursuant to Rule 405 of Regulation S-T (Section 232.405 of this chapter) during the preceding 12 months (or for such shorter period that the registrant was required to submit and post such files). Yes [x] No [ ]
Indicate by check mark if disclosure of delinquent filers pursuant to Item 405 of Regulation S-K (§ 229.405 of this chapter) is not contained herein, and will not be contained, to the best of registrant’s knowledge, in definitive proxy or information statements incorporated by reference in Part III of this Form 10-K or any amendment to this Form 10-K. [ ]
Indicate by check mark whether the Registrant is a large accelerated filer, an accelerated filer, a non-accelerated filer, or a smaller reporting company. See definition of “large accelerated filer,” “accelerated filer,” and “smaller reporting company” in Rule 12b-2 of the Exchange Act.
Large accelerated filer | [ ] | Accelerated filer | [ ] | |
Non-accelerated filer | [x] | Smaller reporting company | [ ] | |
Indicate by check mark whether the Registrant is a shell company (as defined in Rule 12b-2 of the Exchange Act). Yes [ ] No [x]
The registrant was not a reporting company as of the end of its last completed second fiscal quarter. The aggregate market value of the common stock held by non-affiliates of the registrant, computed by reference to the closing price of the common stock on November 2, 2015 (the first day the shares of common stock were publicly traded) was $258.0 million.
Indicate the number of shares outstanding of each of the issuer’s classes of common stock, as of the latest practicable date.
Class | Outstanding at March 23, 2016 | |
Common Stock, no par value per share | 24,551,073 shares | |
DOCUMENTS INCORPORATED BY REFERENCE
The registrant has incorporated by reference into Part III of this report certain portions of its Proxy Statement for its 2016 Annual Meeting of Shareholders, which is expected to be filed pursuant to Regulation 14A within 120 days after the end of the registrant’s fiscal year ended December 31, 2015.
Atlantic Capital Bancshares, Inc.
Form 10-K
TABLE OF CONTENTS
Page No. | ||
PART I. | ||
Item 1. | ||
Item 1A. | ||
Item 1B. | ||
Item 2. | ||
Item 3. | ||
Item 4. | ||
PART II. | ||
Item 5. | ||
Item 6. | ||
Item 7. | ||
Item 7A. | ||
Item 8. | ||
Item 9. | ||
Item 9A. | ||
Item 9B. | ||
PART III | ||
Item 10. | ||
Item 11. | ||
Item 12. | ||
Item 13. | ||
Item 14. | ||
PART IV | ||
Item 15. | ||
PART I
ITEM 1. | BUSINESS |
CAUTIONARY NOTE REGARDING FORWARD-LOOKING STATEMENTS
This Annual Report on Form 10-K contains forward-looking statements within the meaning of section 27A of the Securities Act and 21E of the Securities Exchange Act of 1934, as amended (the “Exchange Act”). These forward-looking statements reflect our current views with respect to, among other things, future events and our financial performance. These statements are often, but not always, made through the use of words or phrases such as “may,” “should,” “could,” “predict,” “potential,” “believe,” “will likely result,” “expect,” “continue,” “will,” “anticipate,” “seek,” “estimate,” “intend,” “plan,” “projection,” “would” and “outlook,” or the negative version of those words or other comparable of a future or forward-looking nature. These forward-looking statements are not historical facts, and are based on current expectations, estimates and projections about our industry, management’s beliefs and certain assumptions made by management, many of which, by their nature, are inherently uncertain and beyond our control. Accordingly, we caution you that any such forward-looking statements are not guarantees of future performance and are subject to risks, assumptions and uncertainties that are difficult to predict. Although we believe that the expectations reflected in these forward-looking statements are reasonable as of the date made, actual results may prove to be materially different from the results expressed or implied by the forward-looking statements.
The following risks, among others, could cause actual results to differ materially from the anticipated results or other expectations expressed in the forward-looking statements:
• | our Company’s business may not integrate successfully with the former First Security Group, Inc. (“First Security”) business, or the integration may be more difficult, time-consuming or costly than expected; |
• | the expected growth opportunities and cost savings from the transaction with First Security may not be fully realized or may take longer to realize than expected; |
• | revenues may be lower than expected as a result of losses of customers or other reasons, including issues arising in connection with integration of First Security’s operations and the pending sale of certain branches; |
• | deposit attrition, operating costs, customer loss and business disruption following the transaction with First Security, including difficulties in maintaining relationships with employees, may be greater than expected; |
• | reputational risks and the reaction of the companies’ customers to the acquisition of First Security; |
• | diversion of management time on merger related issues; |
• | changes in asset quality and credit risk; |
• | the cost and availability of capital; |
• | customer acceptance of the combined company’s products and services; |
• | customer borrowing, repayment, investment and deposit practices; |
• | the introduction, withdrawal, success and timing of business initiatives; |
• | the impact, extent, and timing of technological changes; |
• | severe catastrophic events in our geographic area; |
• | a weakening of the economies in which the combined company will conduct operations may adversely affect its operating results; |
• | the U.S. legal and regulatory framework, including those associated with the Dodd-Frank Wall Street Reform and Consumer Protection Act (the “Dodd-Frank Act”), could adversely affect the operating results of the combined company; |
• | the interest rate environment may compress margins and adversely affect net interest income; |
• | changes in trade, monetary and fiscal policies of various governmental bodies and central banks could affect the economic environment in which we operate; |
• | our ability to determine accurate values of certain assets and liabilities; |
• | adverse behaviors in securities, public debt, and capital markets, including changes in market liquidity and volatility; |
• | our ability to anticipate or respond to interest rate changes correctly and manage interest rate risk presented through unanticipated changes in our interest rate risk position and/or short- and long-term interest rates; |
• | unanticipated changes in our liquidity position, including but not limited to our ability to enter the financial markets to manage and respond to any changes to our liquidity position; |
• | adequacy of our risk management program; |
• | increased costs associated with operating as a public company; |
• | competition from other financial services companies in the companies’ markets could adversely affect operations; and |
• | other risks and factors identified in this Form 10-K under the heading “Risk Factors.” |
1
Background
Atlantic Capital Bancshares, Inc. (“we,” “us,” “Atlantic Capital,” or the “Company”), a Georgia corporation organized in 2006 and headquartered in Atlanta, Georgia, is the parent of Atlantic Capital Bank, N.A. (the “Bank”). The Bank operates as a full service, locally-managed commercial bank with 25 offices located primarily in the metropolitan areas of Atlanta, Georgia and Chattanooga and Knoxville, Tennessee.
We provide a competitive array of credit, treasury management, and deposit products and services to emerging growth businesses, middle market corporations, commercial real estate developers and investors, and private clients. Our wealth management division offers financial planning, trust administration, investment management and estate planning services. We also provide selected capital markets, mortgage banking, and electronic banking services to our corporate, business, and individual clients.
On October 31, 2015, Atlantic Capital completed its acquisition of First Security and its subsidiary FSGBank, N.A. (“FSGBank”). In connection with the acquisition, Atlantic Capital’s subsidiary Atlantic Capital Bank, a Georgia chartered commercial bank merged with and into FSGBank, N.A, which subsequently changed its name to Atlantic Capital Bank, N.A. (the “Bank”). In connection with the acquisition, Atlantic Capital issued approximately 8,790,193 shares of common stock as partial consideration to former shareholders of First Security, with the remaining consideration consisting of approximately $47.1 million in cash.
In conjunction with the merger, Atlantic Capital also completed a $25.0 million private placement of Atlantic Capital common stock, at $12.60 per share. Atlantic Capital used a portion of the proceeds from this private placement and a $50.0 million private placement of subordinated notes completed on September 28, 2015, to fund the cash portion of the merger consideration. Atlantic Capital acquired approximately $970 million of loans and loans held for sale, and assumed approximately $801 million of deposits with the merger.
On December 17, 2015, Atlantic Capital announced the sale of seven legacy First Security branches in Eastern Tennessee. This office divestiture includes the sale of approximately $213 million in deposits, $35 million in loans and $7.0 million in other assets. Subject to customary closing conditions, including the receipt of all necessary regulatory approvals, the branch sales are expected to be completed during the second quarter of 2016.
Our Products and Services
We provide credit, treasury management, and depository services to emerging growth businesses, middle market corporations, commercial real estate developers and investors, and private clients through corporate and business banking, commercial real estate finance, specialty corporate financial services, and private banking teams.
Corporate and Business Banking
We focus our corporate and business banking activities on the complex needs of emerging growth businesses and middle market companies. We address the needs of our corporate and business banking clients with experienced bankers and advanced treasury management services technology. We offer a full suite of corporate and business banking credit products to fund a client’s strategic growth, capital expenditures, working capital requirements and strategic corporate finance activities. Our solutions include working capital and equipment loans, loans supported by owner-occupied real estate and strategic corporate financing funded through revolving lines of credit, term loans and letters of credit.
The terms of our corporate and business banking loans vary by purpose and by the underlying collateral, if any. The vast majority of these loans are secured by assets of the borrower; however, we periodically make unsecured loans to our most credit worthy clients when circumstances support such activity. Loans to support working capital typically have terms not exceeding one year and are usually fully-secured by accounts receivable and inventory, as well as by personal guarantees of the principals or owners of the business. For loans secured by accounts receivable or inventory, the principal balance is repaid as the assets securing the loan are converted into cash. For loans secured with other types of collateral, the principal balance generally amortizes over the term of the loan. The quality of the corporate borrower’s management and its ability to both properly evaluate and respond to changes affecting its business operations and operating environment are significant factors we evaluate with respect to a commercial borrower’s creditworthiness.
Private Banking
Our private banking business team focuses on serving the banking needs of professional firms throughout our regional markets, the principals of our corporate and commercial real estate clients, and other private clients. We offer personal credit products, an array of checking and savings products and online and mobile banking services.
Our private banking credit products include loans to individuals for personal and investment purposes, such as secured installment and term loans and home equity lines of credit. Repayment of these loans is often primarily dependent upon the borrower’s financial profile and is more likely to be adversely affected by personal hardships as compared to other types of loans. Our loan officers review a borrower’s credit and debt history, past income levels and cash flow and determine the impact of all these factors on the ability of the borrower to make future payments. Home equity lines of credit are underwritten based upon the borrower’s credit profile and perceived ability to repay the entirety of the obligation.
2
Commercial Real Estate Finance
Our commercial real estate team is highly focused on a select group of clients characterized by superior financial resources and long industry experience. We believe our focus on “top-tier” clients provides us with larger loan opportunities which enables us to achieve desired commercial real estate loan production with a relatively smaller team of experienced bankers.
Our primary commercial real estate loan types include secured construction loans, secured mini-permanent loans and, less frequently, secured or unsecured lines of credit. A large majority of our commercial real estate loan portfolio is secured by a first mortgage security interest in the property financed. We occasionally extend unsecured credit to public real estate investment trusts and to certain other commercial real estate clients, which we believe to have exceptional credit quality. We focus almost exclusively on providing loans for our core commercial real estate property types: multifamily (primarily for-rent) housing, office, industrial and retail properties.
In keeping with our “top-tier” client strategy, virtually all of our commercial real estate customers are based in our primary market areas. Accordingly, the largest proportion of our commercial real estate collateral is located in these markets. We have occasionally extended credit to select clients in markets outside our primary markets and expect to continue to do this in certain circumstances.
The majority of our total commercial real estate loans have been used to finance stabilized income producing assets of our borrowers. We have also extended a smaller percentage of loans for construction and development purposes and lines of credit. We seek to actively manage and balance our commercial real estate loan portfolio across various property types to assure appropriate diversification and to manage our exposure to market conditions. We have arranged and participated in syndicated commercial real estate loans to diversify and mitigate our loan concentration risk and to support our loan growth goals, and we may continue both in the future. Overall, our goal is to maintain frequent contact with our borrowers and, through that contact, build a deep understanding of each client’s business strategy, property status and overall financial strength and flexibility.
Specialty Corporate Financial Services
Our specialty corporate financial services team provides treasury management services, payments industry banking, financial institutions banking, capital markets services, and specialty commercial lending to emerging growth businesses, middle market corporations, payroll companies, and other banks on a selected basis in the southeastern United States and nationally.
Corporate treasury management services are designed to facilitate domestic and international collection and disbursement of client funds with real time online execution and reporting capabilities. We believe our services are competitive with those offered by large regional and national competitors. Our corporate treasury management professionals are highly experienced and provide expert advice to our clients.
We offer electronic payments services to payroll companies and other high transaction volume clients through the FedWire and Automated Clearing House (ACH) systems. These services generate substantial fee income and demand deposit balances for us. We use sophisticated systems capabilities and the expertise of our people to process high transaction volumes and manage and monitor risks associated with this activity.
Other financial institutions throughout the southeastern United States maintain money market deposit accounts with us to earn a higher return than that available on other short term investment or on balances at the Federal Reserve Bank. Our strong capitalization levels and superior credit quality have helped us attract large deposit amounts from other banks.
We provide targeted capital markets services, principally interest rate protection and foreign exchange, to our business and corporate clients, and loan sales and syndications to our bank clients. Spot and forward foreign exchange transactions are provided through third parties on a private label basis. Interest rate swaps are offered to our clients to hedge interest rate exposure on loans and are fully hedged on our books with mirror transactions with other financial institutions.
Specialty commercial loans consist of Small Business Administration (“SBA”) loans, franchise finance programs, and commercial mortgage loans on single credit tenant properties (the “TriNet division”). We offer these loans to small businesses, franchisees, and real estate investors across a wide range of industries in the southeast and nationally with a dedicated team of bankers with expertise in these specialized forms of lending.
Residential Mortgage
Our residential mortgage loan department primarily originates loans for sale into the secondary market. We generally do not retain long-term, fixed rate residential real estate loans in our portfolio due to interest rate and collateral risks and low levels of profitability. The limited amount of residential loans to individuals that are retained in our loan portfolio primarily consist of first liens on 1-4 family residential mortgages, home equity loans and lines of credit.
Trust & Wealth Management
We offer wealth management services including private client services, financial planning, trust administration, investment management, brokerage and estate planning services. Our trust and wealth management business is branded as Southeastern Trust Company and serves clients throughout the southeastern United States.
3
Competition and Market Area
We face substantial competition in all areas of our operations from a variety of different competitors, many of which are larger and may have more financial resources than we do. Such competitors primarily include national, regional, and Internet banks within the various markets in which we operate. We also face competition from many other types of financial institutions, including, without limitation, savings and loan associations, credit unions, finance companies, brokerage firms, insurance companies, and other financial intermediaries.
The financial services industry could become even more competitive as a result of legislative, regulatory, and technological changes and continued consolidation. Banks, securities firms, and insurance companies can merge under the umbrella of a financial holding company, which can offer virtually any type of financial service, including banking, securities underwriting, insurance (both agency and underwriting), and merchant banking. Also, technology has lowered barriers to entry and made it possible for non-banks to offer products and services traditionally provided by banks, such as automatic transfer and automatic payment systems. Many of our non-bank competitors have fewer regulatory constraints and may have lower cost structures. Additionally, due to their size, many competitors may be able to achieve economies of scale and, as a result, may offer a broader range of products and services as well as better pricing for those products and services than we can.
As of June 30, 2015, there were approximately 81 banks and thrifts operating in metropolitan Atlanta, 27 in the Chattanooga market and 50 in the Knoxville market. We believe the large national, super-regional and regional banks are our primary competitors. However, we believe that large banks often lack the consistency of decision-making authority and local focus necessary to provide superior service to our target markets. Conversely, smaller community banks typically lack the sophisticated products, capital and management experience to provide full service to our target markets. Through our local ownership, experienced management team and broad line of products and services, we believe we efficiently provide clients with loan, deposit and other financial products tailored to fit their specific needs.
We do not believe we are dependent on any one or any several customers or types of business whose loss would have a material adverse effect on us.
Our corporate and business banking clients represent a variety of industry sectors, including industrial and manufacturing, financial services, business services, not-for-profit, consumer service and retail. We intend to continue diversifying our client base across industries as a way to diversify our loan portfolio risk, gain market presence and leverage the industry experience of our corporate and business banking team. We also intend to further expand our corporate and business banking client base by cross-selling our services to clients of our deposit and treasury services and by soliciting relationships with new clients and capitalizing on prospective clients eager to explore new banking relationships. Moreover, we seek to become the primary banking relationship for our clients by remaining intensely focused on serving their needs. To achieve this position, we focus on providing significant expertise and capability to execute transactions, a deep understanding of our client’s business and banking needs and attentive care from senior and experienced bankers that a client might not obtain from larger banking institutions.
Our Business Strategy
Our objective is to build a premier regional corporate, business, and private bank operating in key metropolitan markets across the southeastern United States through a combination of strong growth in our existing businesses and markets and strategic expansion to new markets. In particular, we focus on client segments where we believe the expertise and experience of our bankers, competitive and sophisticated service capabilities, and high touch service delivery can differentiate us from our competitors. The essence of our business strategy is to build enduring and growing relationships with carefully selected corporate, business, and individual clients by providing tailored financial solutions and services to them from a broad range of credit, treasury management and depository, and trust and wealth management capabilities. We believe a growing number of client relationships with income streams from multiple services provided will result, over time, in reliable and consistent earnings and returns on our shareholders’ capital.
Our Competitive Strengths
We enjoy a number of important competitive strengths that we believe will drive our success and differentiate us from our competitors.
Market Focus
We believe that emerging growth businesses, middle market companies, commercial real estate developers, their principals, investors and other private clients are often unable to have all of their banking needs met by large financial institutions or small community banks. We are designed to provide the consistency of attention, local leadership and necessary decision-making authority that large financial institutions often lack. We also offer the sophisticated products, capital and expertise required by these clients that are typically absent from small community banks. Every aspect of Atlantic Capital is focused on serving our target clients’ unique and complex needs.
4
Experienced Bankers
Our bankers focus on serving corporate, business, and private clients in our primary market areas. We have attracted seasoned senior bankers who have enjoyed successful careers at one or more of our large national competitors and who understand and believe in our strategy and target market focus. Our bankers offer sophisticated advice, a deep knowledge of the client’s business and of local markets as well as personalized client service. We believe that our banking team’s highly-tailored focus and significant personal network, along with their substantial decision-making authority and our streamlined credit process, enable us to offer services and products to our target market more effectively and efficiently than our competitors.
Flexible, Client-Focused Technology
Our operating platform and service capabilities were developed from a broad array of market-leading third-party technologies built specifically to serve the banking needs of our target markets. Our technology solutions, in particular, our treasury services, are designed to improve a client’s “backroom” efficiency by allowing the client to process a variety of banking transactions utilizing our comprehensive online options. We use technology to enable high touch human and electronic delivery of banking solutions and services to our clients.
Credit Culture Designed to Yield Superior Asset Quality
We believe that maintaining superior asset quality allows us to remain focused on acquiring new clients and providing attentive service to current clients and helps ensure consistent earnings performance. Since our inception in 2006, we have maintained sound credit quality despite a global financial crisis, a severe recession, and a modest economic expansion.
Employees
As of December 31, 2015, we employed 361individuals (359 of whom were full-time equivalent employees). Each of our employees is also an employee of the Bank. We are not a party to a collective bargaining agreement, and we consider our relations with employees to be good.
Segment Reporting
We consider our operations to be a single business segment as defined in ASC 280, Segment Reporting. We have determined that our lending divisions meet the aggregation criteria of ASC 280 as the products and services, nature of the production processes, types of customers, methods used to distribute products and services and the regulatory environment are sufficiently similar to aggregate their results.
Supervision and Regulation
Bank holding companies and national banks are extensively regulated under both federal and state law. The following is a brief summary of certain statutes and rules and regulations that affect or will affect the Company and the Bank. This summary is not intended to be an exhaustive description of the statutes or regulations applicable to their respective businesses. Supervision, regulation and examination of the Company and the Bank by regulatory agencies are intended primarily for the protection of depositors rather than shareholders of the Company. The Company cannot predict whether or in what form any proposed statute or regulation will be adopted or the extent to which the business of the Company and the Bank may be affected by a statute or regulation. The discussion is qualified in its entirety by reference to applicable laws and regulations. Changes in such laws and regulations may have a material effect on the Company’s and the Bank’s business and prospects.
Bank Holding Company Regulation and Structure
As a bank holding company, the Company is subject to regulation under the Bank Holding Company Act of 1956, as amended (the “BHCA”) and to the supervision, examination and reporting requirements of the Federal Reserve. The Bank is chartered by the Office of the Comptroller of the Currency (“OCC”) and thus is subject to regulation, supervision and examination by the OCC.
The BHCA requires every bank holding company to obtain the prior approval of the Federal Reserve before:
• | it may acquire substantially all of the assets of any other bank holding company, or direct or indirect ownership or control of voting shares of any other bank holding company if, after the acquisition, the bank holding company will directly or indirectly own or control more than 5% of the voting shares of the other bank holding company; |
• | it may acquire substantially all of the assets of any other bank, or direct or indirect ownership or control of voting shares of any bank if, after the acquisition, the bank holding company will directly or indirectly own or control more than 5% of the voting shares of the bank; |
• | it or any of its subsidiaries, other than a bank, may acquire all or substantially all of the assets of any bank; or |
• | it may merge or consolidate with any other bank holding company. |
The BHCA further provides that the Federal Reserve may not approve any transaction that would result in a monopoly or that would substantially lessen competition in the banking business, unless the public interest in meeting the needs of the communities to be served outweighs the anti-competitive effects. The Federal Reserve is also required to consider the financial and managerial
5
resources and future prospects of the bank holding companies and banks involved and the convenience and needs of the communities to be served. Consideration of financial resources generally focuses on capital adequacy and consideration of convenience and needs issues, which focuses, in part, on the performance under the Community Reinvestment Act of 1977 (the “CRA”).
Subject to various exceptions, the BHCA and the Change in Bank Control Act, together with related regulations, require Federal Reserve approval prior to any person or company acquiring “control” of a bank holding company. Control is conclusively presumed to exist if an individual or company acquires 25% or more of any class of voting securities of a bank holding company. Control is also presumed to exist, although rebuttable, if a person or company acquires 10% or more, but less than 25%, of any class of voting securities and either:
• | the bank holding company has registered securities under Section 12 of the Exchange Act; or |
• | no other person owns a greater percentage of that class of voting securities immediately after the transaction. |
Our common stock is registered under Section 12 of the Exchange Act. The regulations provide a procedure for challenging rebuttable presumptions of control.
The BHCA generally prohibits a bank holding company from engaging in, or acquiring 5% or more of the voting stock of a company engaged in, activities other than banking; managing or controlling banks or other permissible subsidiaries and performing servicing activities for subsidiaries; and engaging in any activities other than activities that the Federal Reserve has determined by order or regulation are so closely related to banking as to be a proper incident included thereto under the BHCA. In determining whether a particular activity is permissible, the Federal Reserve considers whether performing the activity can be expected to produce benefits to the public that outweigh possible adverse effects, such as undue concentration of resources, decreased or unfair competition, conflicts of interest or unsound banking practices. The Federal Reserve has the power to order a bank holding company or its subsidiaries to terminate any activity or control of any subsidiary when the continuation of the activity or control constitutes a serious risk to the financial safety, soundness or stability of any bank subsidiary of that bank holding company.
Under the Gramm-Leach-Bliley Act, bank holding companies may elect to become “financial holding companies” that may affiliate with securities firms and insurance companies and engage in other activities that are financial in nature or incidental to a financial activity. The Gramm-Leach-Bliley Act permits a single financial services organization to offer a more complete array of financial products and services than historically was permitted. Under the BHCA, a bank holding company may file an election with the Federal Reserve to be treated as a financial holding company and engage in an expanded list of financial activities. The election must be accompanied by a certification that the Company’s insured depository institution subsidiary is “well capitalized” and “well managed.” Additionally, the CRA rating of each subsidiary bank must be satisfactory or better. The Company has not elected to be treated as a financial holding company.
We are required to act as a source of financial strength for the Bank and to commit resources to support the Bank. This support may be required at times when the Company might not be inclined to provide it. In addition, any capital loans made by the Company to the Bank will be repaid only after the Bank’s deposits and various other obligations are repaid in full.
Bank Merger Act
Section 18(c) of the Federal Deposit Insurance Act, commonly known as the “Bank Merger Act,” requires the prior written approval of the OCC before any bank may (i) merge or consolidate with, (ii) purchase or otherwise acquire the assets of, or (iii) assume the deposit liabilities of, another bank if the resulting institution is to be a national bank.
The Bank Merger Act prohibits the OCC from approving any proposed merger transaction that would result in a monopoly or would further a combination or conspiracy to monopolize or to attempt to monopolize the business of banking in any part of the United States. Similarly, the Bank Merger Act prohibits the OCC from approving a proposed merger transaction whose effect in any section of the country may be to lessen competition substantially, or to tend to create a monopoly, or which in any other manner would be in restraint of trade. An exception may be made in the case of a merger transaction whose effect would be to substantially lessen competition, tend to create a monopoly, or otherwise restrain trade, if the OCC finds that the anticompetitive effects of the proposed transaction are clearly outweighed by the probable effect of the transaction in meeting the convenience and needs of the community to be served.
In every proposed merger transaction, the OCC must also consider the financial and managerial resources and future prospects of the existing and proposed institutions, the convenience and needs of the communities to be served, and the effectiveness of each insured depository institution involved in the proposed merger transaction in combating money-laundering activities, including in overseas branches.
6
Capital Adequacy
In July 2013, the Federal Reserve Board and the FDIC approved a final rule (“final rule”) that changes the regulatory capital framework for all banking organizations and revises the prompt corrective action categories to incorporate the revised regulatory capital standards. The final rule implements for U.S. banks the Basel III regulatory capital reforms of the Basel Committee and certain changes required by the Dodd-Frank Wall Street Reform and Consumer Protection Act. The final rule strengthens areas of weakness identified in the Basel I capital rules by: (1) enhancing the quantity and quality of regulatory capital in the banking system; (2) better reflecting the risk of certain on and off-balance sheet exposures in the measurement of risk-weighted assets; and (3) building additional capital capacity into the banking system to absorb losses in times of future market and economic stress. Subject to certain transition provisions, banking organizations with $250 billion or less in total assets were required to comply with the new requirements beginning January 1, 2015.
The final rule establishes new prompt corrective action requirements for all banks and includes a new common equity Tier 1 risk-based capital measure. The risk-based capital and leverage capital requirements under the final rule are set forth in the table that follows.
Requirement | Total Risk Based Capital Ratio | Tier 1 Risk Based Capital Ratio | CET1 Risk Based Capital Ratio | Leverage Ratio |
Well Capitalized | ≥ 10% | ≥ 8% | ≥ 6.5% | ≥ 5% |
Adequately Capitalized | ≥ 8% | ≥ 6% | ≥ 4.5% | ≥ 4% |
Undercapitalized | ≥ 8% | ≥ 6% | ≥ 4.5% | ≥ 4% |
Significantly Undercapitalized | ≥ 6% | ≥ 4% | ≥ 3% | ≥ 3% |
Critically Undercapitalized | Tangible equity to total assets ≤ 2 | |||
The final rule also sets forth a capital ratio phase-in schedule. The phase-in provisions for banks with $250 billion or less in total assets are set forth in the following table.
Effective as of January 1, | 2015 | 2016 | 2017 | 2018 | 2019 |
Minimum Leverage Ratio | 4.0% | 4.0% | 4.0% | 4.0% | 4.0% |
Minimum Common Equity Tier 1 Risk Based Capital Ratio | 4.5% | 4.5% | 4.5% | 4.5% | 4.5% |
Capital Conservation Buffer (1) | N/A | 0.625% | 1.25% | 1.875% | 2.5% |
Minimum Common Equity Tier 1 Risk Based Capital Ratio with Capital Conservation Buffer | 4.5% | 5.125% | 5.75% | 6.375% | 7.0% |
Minimum Tier 1 Risk Based Capital Ratio | 6.0% | 6.0% | 6.0% | 6.0% | 6.0% |
Minimum Tier 1 Risk Based Capital Ratio with Capital Conservation Buffer | 6.0% | 6.625% | 7.25% | 7.875% | 8.5% |
Minimum Total Risk Based Capital Ratio | 8.0% | 8.0% | 8.0% | 8.0% | 8.0% |
Minimum Total Risk Based Capital Ratio with Capital Conservation Buffer | 8.0% | 8.625% | 9.25% | 9.875% | 10.5% |
(1) | The capital conservation buffer must be maintained in order for a banking organization to avoid being subject to limitations on capital distributions, including dividend payments, and discretionary bonus payments to executive officers. |
The final rule includes comprehensive guidance with respect to the measurement of risk-weighted assets. For residential mortgages, Basel III retains the risk-weights contained in the current capital rules which assign a risk-weight of 50% to most first-lien exposures and 100% to other residential mortgage exposures. The final rule would increase the risk-weights associated with certain on-balance sheet assets, such as high volatility commercial real estate loans, as defined, and loans that are more than 90 days past due or in nonaccrual status. Capital requirements would also increase for certain off-balance sheet exposures including, for example, loan commitments with an original maturity of one year or less.
Under the final rule, certain banking organizations, including the Company and the Bank, are permitted to make a one-time election to continue the current treatment of excluding from regulatory capital most accumulated other comprehensive income (“AOCI”) components, including amounts relating to unrealized gains and losses on available-for-sale debt securities and amounts attributable to defined benefit post-retirement plans. Institutions that elect to exclude most AOCI components from regulatory capital under Basel III will be able to avoid volatility that would otherwise be caused by things such as the impact of fluctuations in interest
7
rates on the fair value of available-for-sale debt securities. The Company and the Bank elected to exclude AOCI components from regulatory capital under Basel III.
Liquidity
In December 2010, the Basel Committee published “Basel III: International Framework for Liquidity Risk Measurement, Standards and Monitoring” and in January 2013 published a revised liquidity coverage ratio (collectively referred to as the “Liquidity Standard”). The Liquidity Standard includes: (1) a liquidity coverage ratio to ensure that sufficient high quality liquid resources are available in case of a liquidity crisis; (2) a net stable funding ratio to promote liquidity resiliency over longer time horizons by creating incentives for banks to fund their activities with stable sources of funding on an ongoing basis; and (3) additional liquidity monitoring metrics focused on maturity mismatch, concentration of funding and available unencumbered assets. The Liquidity Standard would be phased-in through 2019. On September 3, 2014, the U.S. banking agencies issued a final liquidity rule that establishes for the first time a standardized minimum liquidity requirement. The final rule applies to large and internationally active banking organizations and is not applicable to the Bank. The U.S. banking agencies have not adopted or proposed rules to implement a quantitative liquidity requirement for banks such as the Bank with less than $50 billion in total assets, and it is uncertain whether such a requirement will be established.
Failure to meet capital guidelines could subject a bank to a variety of enforcement remedies, including issuance of a capital directive, the termination of deposit insurance by the FDIC, a prohibition on taking brokered deposits and certain other restrictions on its business. As described below, the FDIC can impose substantial additional restrictions upon FDIC-insured depository institutions that fail to meet applicable capital requirements as set forth above.
The Federal Deposit Insurance Act (the “FDI Act”) requires the federal regulatory agencies to take “prompt corrective action” if a depository institution does not meet minimum capital requirements as set forth above. Generally, a receiver or conservator for a bank that is “critically undercapitalized” must be appointed within specific time frames. The regulations also provide that a capital restoration plan must be filed within 45 days of the date a bank is deemed to have received notice that it is “undercapitalized,” “significantly undercapitalized” or “critically undercapitalized.” Any holding company for a bank required to submit a capital restoration plan must guarantee the lesser of (i) an amount equal to 5% of the bank’s assets at the time it was notified or deemed to be undercapitalized by regulator, or (ii) the amount necessary to restore the bank to adequately capitalized status. This guarantee remains in place until the bank is notified that it has maintained adequately capitalized status for specified time periods. Additional measures with respect to undercapitalized institutions include a prohibition on capital distributions, growth limits and restrictions on activities.
The federal bank regulatory agencies have adopted regulations establishing relevant capital measures and relevant capital levels applicable to FDIC-insured banks. The relevant capital measures are the Total Risk-Based Capital ratio, Tier 1 Risk-Based Capital ratio, Common Equity Tier 1 Risk-Based Capital ratio and the leverage ratio. Under the regulations, a FDIC-insured bank will be:
• | “well capitalized” if it has a Total Risk-Based Capital ratio of 10% or greater, a Tier 1 Risk-Based Capital ratio of 8% or greater, a Common Equity Tier 1 Risk-Based Capital ratio of 6.5% or greater and a leverage ratio of 5% or greater and is not subject to any order or written directive by the appropriate regulatory authority to meet and maintain a specific capital level for any capital measure; |
• | “adequately capitalized” if it has a Total Risk-Based Capital ratio of 8% or greater, a Tier 1 Risk-Based Capital ratio of 6% or greater, a Common Equity Tier 1 Risk-Based Capital ratio of 4.5% or greater and a leverage ratio of 4% or greater and is not “well capitalized;” |
• | “undercapitalized” if it has a Total Risk-Based Capital ratio of less than 8%, a Tier 1 Risk-Based Capital ratio of less than 6%, a Common Equity Tier 1 Risk-Based Capital ratio of less than 4.5% or a leverage ratio of less than 4% and is not “significantly undercapitalized” or “critically undercapitalized”; |
• | “significantly undercapitalized” if it has a Total Risk-Based Capital ratio of less than 6%, a Tier 1 Risk-Based Capital ratio of less than 4%, a Common Equity Tier 1 Risk-Based Capital ratio of less than 3% or a leverage ratio of less than 3% and is not “critically undercapitalized”; and |
• | “critically undercapitalized” if its tangible equity is equal to or less than 2% of average quarterly tangible assets. |
An institution may be downgraded to, or deemed to be in, a capital category that is lower than is indicated by its capital ratios if it is determined to be in an unsafe or unsound condition or if it receives an unsatisfactory examination rating with respect to certain matters. As of December 31, 2015, the Bank had capital levels that qualify as “well capitalized” under such regulations.
8
The FDI Act generally prohibits an FDIC-insured bank from making a capital distribution (including payment of a dividend) or paying any management fee to its holding company if the bank would thereafter be “undercapitalized.” “Undercapitalized” banks are subject to growth limitations and are required to submit a capital restoration plan. The federal regulators may not accept a capital plan without determining, among other things, that the plan is based on realistic assumptions and is likely to succeed in restoring the bank’s capital. In addition, for a capital restoration plan to be acceptable to regulators, the bank’s parent holding company must guarantee that the institution will comply with such capital restoration plan. The aggregate liability of the parent holding company is limited to the lesser of: (i) an amount equal to 5% of the bank’s total assets at the time it became “undercapitalized”; and (ii) the amount which is necessary (or would have been necessary) to bring the institution into compliance with all capital standards applicable with respect to such institution as of the time it fails to comply with the plan. If a bank fails to submit an acceptable plan, it is treated as if it is “significantly undercapitalized.”
“Significantly undercapitalized” insured banks may be subject to a number of requirements and restrictions, including orders to sell sufficient voting stock to become “adequately capitalized,” requirements to reduce total assets and the cessation of receipt of deposits from correspondent banks. “Critically undercapitalized” institutions are subject to the appointment of a receiver or conservator. A bank that is not “well capitalized” is also subject to certain limitations relating to brokered deposits.
For further detail on capital and capital ratios see discussion under “Management’s Discussion and Analysis of Financial Condition and Results of Operations,” section, “Liquidity and Capital Resources,” contained in Item 7.
FDIC Insurance Assessments
The FDIC, through the Deposit Insurance Fund (“DIF”), insures the deposits of the Bank up to prescribed limits for each depositor, (currently, $250,000 per depositor). The assessment paid by each DIF member institution is based on its relative risk of default as measured by regulatory capital ratios and other factors. Specifically, the assessment rate is based on the institution’s capitalization risk category and supervisory subgroup category. An institution’s capitalization risk category is based on the FDIC’s determination of whether the institution is well capitalized, adequately capitalized or less than adequately capitalized. The Bank’s insurance assessments during 2015 and 2014 were $789,000 and $643,000, respectively.
Insurance of deposits may be terminated by the FDIC upon a finding that an institution has engaged in unsafe or unsound practices, is in an unsafe or unsound condition to continue operations or has violated any applicable law, regulation, rule, order or condition imposed by the FDIC.
As required by the Dodd-Frank Act, the FDIC also revised the deposit insurance assessment system, effective April 1, 2011, to base assessments on the average total consolidated assets of insured depository institutions during the assessment period, less the average tangible equity of the institution during the assessment period as opposed to solely bank deposits at an institution. This base assessment change necessitated that the FDIC adjust the assessment rates to ensure that the revenue collected under the new assessment system will approximately equal that under the existing assessment system.
Each of these changes may increase the rate of FDIC insurance assessments to maintain or replenish the FDIC’s DIF. This could, in turn, raise the Bank’s future deposit insurance assessment costs. On the other hand, the law changes the deposit insurance assessment base so that it will generally be equal to consolidated assets less tangible equity. This change of the assessment base from an emphasis on deposits to an emphasis on assets is generally considered likely to cause larger banking organizations to pay a disproportionately higher portion of future deposit insurance assessments, which may, correspondingly, lower the level of deposit insurance assessments that smaller community banks such as the Bank may otherwise have to pay in the future. While it is likely that the new law will increase the Bank’s future deposit insurance assessment costs, the specific amount by which the new law’s combined changes will affect the Bank’s deposit insurance assessment costs is hard to predict, particularly because the new law gives the FDIC enhanced discretion to set assessment rate levels.
The FDIC also collects a deposit-based assessment from insured financial institutions on behalf of the Financing Corporation (the “FICO”). The funds from these assessments are used to service debt issued by FICO in its capacity as a financial vehicle for the Federal Savings & Loan Insurance Corporation. These assessments will continue until the debt matures in 2017 through 2019.
Payment of Dividends and Other Restrictions
The Company is a legal entity that is separate and distinct from the Bank. While there are various legal and regulatory limitations under federal and state law governing the extent to which banks can pay dividends or otherwise supply funds to holding companies, the principal source of cash revenues for the Company are dividends from the Bank. The relevant federal and state regulatory agencies also have authority to prohibit a national bank or bank holding company from engaging in conduct that, in the opinion
9
of such regulatory body, constitutes an unsafe or unsound practice in conducting its business. The payment of dividends could, depending upon the financial condition of a bank, be deemed to constitute an unsafe or unsound practice in conducting its business.
Insured depository institutions, such as the Bank, are prohibited from making capital distributions, including the payment of dividends, if, after making such distribution, the institution would become “undercapitalized” (as such term is defined in the applicable law and regulations). In addition, recently adopted capital rules limit capital distributions, including dividends, if the depository institution does not have a “capital conservation buffer.” See further details above under “Capital Adequacy.”
National banks are required by federal law to obtain the prior approval of the OCC in order to declare and pay dividends if the total of all dividends declared in any calendar year would exceed the total of (1) such bank’s net profits (as defined and interpreted by regulation) for that year plus (2) its retained net profits (as defined and interpreted by regulation) for the preceding two calendar years, less any required transfers to surplus. In addition, these banks may only pay dividends to the extent that retained net profits (including the portion transferred to surplus) exceed bad debts (as defined by regulation).
The Federal Reserve has expressed the view that a bank holding company should pay cash dividends only to the extent that the holding company’s net income for the past year is sufficient to cover both the cash dividends and a rate of earning retention that is consistent with the holding company’s capital needs, asset quality and overall financial condition. The Federal Reserve also indicated that it would be inappropriate for a holding company experiencing serious financial problems to borrow funds to pay dividends. Furthermore, under the prompt corrective action regulations adopted by the Federal Reserve, the Federal Reserve may prohibit a bank holding company from paying any dividends if one or more of the holding company’s bank subsidiaries are classified as undercapitalized.
A bank holding company is required to give the Federal Reserve prior written notice of any purchase or redemption of its outstanding equity securities if the gross consideration for the purchase or redemption, when combined with the net consideration paid for all such purchases or redemptions during the preceding 12 months, is equal to 10% or more of its consolidated net worth. The Federal Reserve may disapprove such a purchase or redemption if it determines that the proposal would constitute an unsafe or unsound practice or would violate any law, regulation, Federal Reserve order or any condition imposed by, or written agreement with, the Federal Reserve. In addition, the Federal Reserve has indicated that bank holding companies should review their dividend policies, and has discouraged dividend payment ratios that are at maximum allowable levels unless both asset quality and capital levels are strong.
Transactions with Affiliates
Federal laws strictly limit the ability of banks to engage in transactions with their affiliates, including their bank holding companies. Regulations promulgated by the Federal Reserve Board limit the types and amounts of these transactions (including loans due and extensions of credit from their U.S. bank subsidiaries) that may take place and generally require those transactions to be on an arm’s-length basis. In general, these regulations require that any “covered transactions” between a subsidiary bank and its parent company or the nonbank subsidiaries of the bank holding company be limited to 10% of the bank subsidiary’s capital and surplus and, with respect to such parent company and all such nonbank subsidiaries, to an aggregate of 20% of the bank subsidiary’s capital and surplus. Further, loans and extensions of credit to affiliates generally are required to be secured by eligible collateral in specified amounts.
Interstate Banking and Branching
Effective June 1, 1997, the Riegle-Neal Interstate Banking and Branching Efficiency Act of 1994 amended the Federal Deposit Insurance Act and certain other statutes to permit state and national banks with different home states to merge across state lines, with approval of the appropriate federal banking agency, unless the home state of a participating bank had passed legislation prior to May 31, 1997 expressly prohibiting interstate mergers. Under the Riegle-Neal Act amendments, once a state or national bank has established branches in a state, that bank may establish and acquire additional branches at any location in the state at which any bank involved in the interstate merger transaction could have established or acquired branches under applicable federal or state law. If a state opts out of interstate branching within the specified time period, no bank in any other state may establish a branch in the state which has opted out, whether through an acquisition or de novo.
However, under the Dodd-Frank Act, the national branching requirements have been relaxed and national banks and state banks are able to establish branches in any state if that state would permit the establishment of the branch by a state bank chartered in that state. The Federal Deposit Insurance Act (the “FDIA”), requires that the OCC review (1) any merger or consolidation by or with an insured bank, or (2) any establishment of branches by an insured bank.
10
Loans to Directors, Executive Officers and Principal Shareholders
The authority of the Bank to extend credit to its directors, executive officers and principal shareholders, including their immediate family members, corporations and other entities that they control, is subject to substantial restrictions and requirements under Sections 22(g) and 22(h) of the Federal Reserve Act and Regulation O promulgated thereunder, as well as the Sarbanes-Oxley Act. These statutes and regulations impose specific limits on the amount of loans that the Bank may make to directors and other insiders, and specified approval procedures must be followed in making loans that exceed certain amounts. In addition, all loans the Bank makes to directors and other insiders must satisfy the following requirements:
• | the loans must be made on substantially the same terms, including interest rates and collateral, as those prevailing at the time for comparable transactions with persons not affiliated with the Bank; |
• | the Bank must follow credit underwriting procedures at least as stringent as those applicable to comparable transactions with persons who are not affiliated with the Bank; and |
• | the loans must not involve a greater than normal risk of non-payment or include other features not favorable to the Bank. |
Furthermore, the Bank must periodically report all loans made to directors and other insiders to the bank regulators, and these loans are closely scrutinized by the regulators for compliance with Sections 22(g) and 22(h) of the Federal Reserve Act and Regulation O. Each loan to directors or other insiders must be pre-approved by the Bank’s board of directors with the interested director abstaining from voting.
Community Reinvestment Act
The CRA requires federal bank regulatory agencies to encourage financial institutions to meet the credit needs of low and moderate-income borrowers in their local communities. An institution’s size and business strategy determines the type of examination that it will receive. Large, retail-oriented institutions are examined using a performance-based lending, investment and service test. Small institutions are examined using a streamlined approach. All institutions may opt to be evaluated under a strategic plan formulated with community input and pre-approved by the bank regulatory agency.
The CRA regulations provide for certain disclosure obligations. Each institution must post a notice advising the public of its right to comment to the institution and its regulator on the institution’s CRA performance and to review the institution’s CRA public file. Each lending institution must maintain for public inspection a file that includes a listing of branch locations and services, a summary of lending activity, a map of its communities and any written comments from the public on its performance in meeting community credit needs. The CRA requires public disclosure of a financial institution’s written CRA evaluations. This requirement promotes enforcement of CRA principles by providing the public with the status of a particular institution’s community reinvestment record.
The Gramm-Leach-Bliley Act made various changes to the CRA. Among other changes, CRA agreements with private parties must be disclosed, and annual CRA reports must be made available to a bank’s primary federal regulator. A bank holding company will not be permitted to become a financial holding company and no new activities authorized under the Gramm-Leach-Bliley Act may be commenced by a holding company or by a bank financial subsidiary if any of its bank subsidiaries received less than a satisfactory CRA rating in its latest examination. The Bank received a “Satisfactory” rating in its last CRA examination which was conducted on February 23, 2015.
Consumer Laws and Regulations
The Bank is also subject to certain consumer laws and regulations that are designed to protect consumers in transactions with banks. While the following list is not exhaustive, these laws and regulations include the Truth in Lending Act, the Truth in Savings Act, the Electronic Funds Transfer Act, the Expedited Funds Availability Act, the Equal Credit Opportunity Act, The Fair and Accurate Credit Transactions Act, The Real Estate Settlement Procedures Act and the Fair Housing Act, among others. These laws and regulations, among other things, prohibit discrimination on the basis of race, gender or other designated characteristics and mandate various disclosure requirements and regulate the manner in which financial institutions must deal with customers when taking deposits or making loans to such customers. These and other laws also limit finance charges or other fees or charges earned in the Bank’s activities.
11
Consumer Financial Protection Bureau
The Dodd-Frank Act created a new, independent federal agency called the Consumer Financial Protection Bureau (“CFPB”), which is granted broad rulemaking, supervisory and enforcement powers under various federal consumer financial protection laws, including the Equal Credit Opportunity Act, Truth in Lending Act, Real Estate Settlement Procedures Act, Fair Credit Reporting Act, Fair Debt Collection Act, the Consumer Financial Privacy provisions of the Gramm-Leach-Bliley Act and certain other statutes. The CFPB has examination and primary enforcement authority with respect to depository institutions with $10 billion or more in assets. Smaller institutions are subject to rules promulgated by the CFPB but continue to be examined and supervised by federal banking regulators for consumer compliance purposes. The CFPB has authority to prevent unfair, deceptive or abusive practices in connection with the offering of consumer financial products. The Dodd-Frank Act permits states to adopt consumer protection laws and standards that are more stringent than those adopted at the federal level and, in certain circumstances, permits the state attorney general to enforce compliance with both the state and federal laws and regulations.
The CFPB has finalized rules relating to, among other things, remittance transfers under the Electronic Fund Transfer Act, which requires companies to provide consumers with certain disclosures before the consumer pays for a remittance transfer. These rules became effective in October 2013. The CFPB has also amended certain rules under Regulation C relating to home mortgage disclosure to reflect a change in the asset-size exemption threshold for depository institutions based on the annual percentage change in the Consumer Price Index for Urban Wage Earners and Clerical Workers. In addition, on January 10, 2013, the CFPB released its final “Ability-to-Repay/Qualified Mortgage” rules, which amended the Truth in Lending Act (Regulation Z). Regulation Z currently prohibits a creditor from making a higher-priced mortgage loan without regard to the consumer’s ability to repay the loan. The final rule implements sections 1411 and 1412 of the Dodd-Frank Act, which generally require creditors to make a reasonable, good faith determination of a consumer’s ability to repay any consumer credit transaction secured by a dwelling (excluding an open-end credit plan, timeshare plan, reverse mortgage, or temporary loan) and establishes certain protections from liability under this requirement for “qualified mortgages.” The final rule also implements section 1414 of the Dodd-Frank Act, which limits prepayment penalties. Finally, the final rule requires creditors to retain evidence of compliance with the rule for three years after a covered loan is consummated. This rule became effective January 10, 2014.
Technology Risk Management and Consumer Privacy
Banks are generally expected to prudently manage technology-related risks as part of their comprehensive risk management policies by identifying, measuring, monitoring and controlling risks associated with the use of technology. Under Section 501 of the Gramm-Leach-Bliley Act, the federal banking agencies have established appropriate standards for financial institutions regarding the implementation of safeguards to ensure the security and confidentiality of customer records and information, protection against any anticipated threats or hazards to the security or integrity of such records and protection against unauthorized access to or use of such records or information in a way that could result in substantial harm or inconvenience to a customer. Among other matters, the rules require each bank to implement a comprehensive written information security program that includes administrative, technical and physical safeguards relating to customer information.
Under the Gramm-Leach-Bliley Act, a financial institution must also provide its customers with a notice of privacy policies and practices. Section 502 prohibits a financial institution from disclosing nonpublic personal information about a customer to nonaffiliated third parties unless the institution satisfies various notice and opt-out requirements and the customer has not elected to opt out of the disclosure. All banks are also required to develop initial and annual privacy notices which describe in general terms the bank’s information sharing practices. Banks that share nonpublic personal information about customers with nonaffiliated third parties must also provide customers with an opt-out notice and a reasonable period of time for the customer to opt out of any such disclosure (with certain exceptions). Limitations are placed on the extent to which a bank can disclose an account number or access code for credit card, deposit or transaction accounts to any nonaffiliated third party for use in marketing.
UDAP and UDAAP
Recently, banking regulatory agencies have increasingly used a general consumer protection statute to address “unethical” or otherwise “bad” business practices that may not necessarily fall directly under the purview of a specific banking or consumer finance law. The law of choice for enforcement against such business practices has been Section 5 of the Federal Trade Commission Act, referred to as the FTC Act, which is the primary federal law that prohibits unfair or deceptive acts or practices, referred to as UDAP, and unfair methods of competition in or affecting commerce. “Unjustified consumer injury” is the principal focus of the FTC Act. Prior to the Dodd-Frank Act, there was little formal guidance to provide insight to the parameters for compliance with UDAP laws and regulations. However, UDAP laws and regulations have been expanded under the Dodd-Frank Act to apply to “unfair, deceptive or abusive acts or practices,” referred to as UDAAP, which have been delegated to the CFPB for supervision.
12
Monitoring and Reporting Suspicious Activity
Under the Bank Secrecy Act (the “BSA”), financial institutions are required to monitor and report unusual or suspicious account activity that might signify money laundering, tax evasion or other criminal activities, as well as transactions involving the transfer or withdrawal of amounts in excess of prescribed limits. The BSA is sometimes referred to as an “anti-money laundering” law (“AML”). Several AML statutes, including provisions in Title III of the USA PATRIOT Act of 2001, have been enacted up to the present to amend the BSA. Under the USA PATRIOT Act, financial institutions are subject to prohibitions against specified financial transactions and account relationships as well as enhanced due diligence and “know your customer” standards in their dealings with financial institutions and foreign customers. Under the USA PATRIOT Act, financial institutions are also required to establish anti-money laundering programs. The USA PATRIOT Act sets forth minimum standards for these programs, including:
• | the development of internal policies, procedures, and controls; |
• | the designation of a compliance officer; |
• | an ongoing employee training program; and |
• | an independent audit function to test the programs. |
In addition, under the USA PATRIOT Act, the Secretary of the U.S. Department of the Treasury (the “Treasury”), has adopted rules addressing a number of related issues, including increasing the cooperation and information sharing between financial institutions, regulators, and law enforcement authorities regarding individuals, entities and organizations engaged in, or reasonably suspected based on credible evidence of engaging in, terrorist acts or money laundering activities. Any financial institution complying with these rules will not be deemed to violate the privacy provisions of the Gramm-Leach-Bliley Act that are discussed below. Finally, under the regulations of the Office of Foreign Asset Control (the “OFAC”), we are required to monitor and block transactions with certain “specially designated nationals” who OFAC has determined pose a risk to U.S. national security.
The Sarbanes-Oxley Act
The Sarbanes-Oxley Act mandates for public companies, such as the Company following the merger, a variety of reforms intended to address corporate and accounting fraud and provides for the establishment of the Public Company Accounting Oversight Board (the “PCAOB”), which enforces auditing, quality control and independence standards for firms that audit SEC-reporting companies. The Sarbanes-Oxley Act imposes higher standards for auditor independence and restricts the provision of consulting services by auditing firms to companies they audit and requires that certain audit partners be rotated periodically. The law also requires chief executive officers and chief financial officers, or their equivalents, to certify the accuracy of periodic reports filed with the SEC, subject to civil and criminal penalties if they knowingly or willfully violate this certification requirement, and increases the oversight and authority of audit committees of publicly traded companies.
Annual Disclosure Statement
This Annual Report on Form 10-K also serves as the annual disclosure statement of Atlantic Capital pursuant to Part 350 of the FDIC’s rules and regulations. This statement has not been reviewed or confirmed for accuracy or relevance by the FDIC.
ITEM 1A. | RISK FACTORS |
Risks Related to the Company and its Banking Operations
Failure to successfully integrate the combined institution could adversely affect our results of operations. We will continue to incur significant expenses in connection with integration of First Security’s and our operations.
The success of the completed merger with First Security will depend, in part, on our ability to realize the anticipated benefits and cost savings from combining the two businesses. In order to realize these anticipated benefits and cost savings, we must successfully combine our business with First Security. If we are not able to achieve these objectives, the anticipated benefits and cost savings of the merger may not be realized fully or at all or may take longer to realize than expected or we could incur higher expenses.
It is possible that the integration process could result in the loss of key employees, the disruption of ongoing business or inconsistencies in standards, controls, procedures and policies that adversely affect the ability of the Company to maintain relationships with customers, depositors and employees or to achieve the anticipated benefits of the merger. Integration efforts will also divert management attention and resources. These integration matters could have an adverse effect on our financial condition and results of operations.
13
An economic downturn in the housing market, the homebuilding industry, and/or in our markets generally could adversely affect our financial condition, results of operations or cash flows.
Our long-term success depends upon the growth in population, income levels, deposits and housing starts in our primary market areas-Metropolitan Atlanta and, following the merger, the Interstate 75 corridor between Dalton, Georgia (approximately one hour north of Atlanta) and Jefferson City, Tennessee (approximately 30 minutes north of Knoxville, Tennessee) and the Interstate 40 corridor between Knoxville and Nashville, Tennessee. If the communities in which the Bank operates do not grow, or if prevailing economic conditions locally or nationally are unfavorable, our business may not succeed. An economic recession over a prolonged period or other economic problems in our market areas could have a material adverse impact on the quality of the loan portfolio and the demand for our products and services. Future adverse changes in the economies in our market areas may have a material adverse effect on our financial condition, results of operations or cash flows. Further, the banking industry in Tennessee and Georgia is affected by general economic conditions such as inflation, recession, unemployment and other factors beyond our control.
In recent years, the homebuilding and residential mortgage industry experienced a significant and sustained decline in demand for new homes and a decrease in the absorption of new and existing homes available for sale in various markets. Consequently, our customers who are builders and developers faced greater difficulty in selling their homes in markets where these trends are more pronounced. A recurrence of these trends could cause us to face increased delinquencies and non-performing assets as these builders and developers are forced to default on their loans with us. If market conditions deteriorate, our non-performing assets may increase and we may need to take valuation adjustments on our loan portfolios and real estate owned.
We may experience increased delinquencies and credit losses, which could have a material adverse effect on our capital, financial condition and results of operations.
Like other lenders, we face the risk that our customers will not repay their loans. A customer’s failure to repay us is usually preceded by missed monthly payments. In some instances, however, a customer may declare bankruptcy prior to missing payments, and, following a borrower filing bankruptcy, a lender’s recovery of the credit extended is often limited. Since our loans are secured by collateral, we may attempt to seize the collateral when and if customers default on their loans. However, the value of the collateral may not equal the amount of the unpaid loan, and we may be unsuccessful in recovering the remaining balance from our customers. Elevated levels of delinquencies and bankruptcies in our market area generally and among our customers specifically can be precursors of future charge-offs and may require us to increase our allowance for loan losses. Higher charge-off rates and an increase in our allowance for loan losses may hurt our overall financial performance if we are unable to increase revenue to compensate for these losses and may also increase our cost of funds.
Our allowance for loan losses may not be adequate to cover actual losses, and we may be required to materially increase our allowance, which may adversely affect our capital, financial condition and results of operations.
We maintain an allowance for loan losses, which is a reserve established through a provision for loan losses charged to expenses that represents management’s best estimate of probable credit losses that have been incurred within the existing portfolio of loans. The allowance for loan losses and our methodology for calculating the allowance are fully described in Note 1 to our consolidated financial statements for the year ended December 31, 2015 under “Allowance for Loan Losses,” and in the “Management’s Discussion and Analysis of Financial Condition and Results of Operations-Critical Accounting Policies-Allowance for Loan Losses” section. In general, an increase in the allowance for loan losses results in a decrease in net income, and possibly risk-based capital, and may have a material adverse effect on our capital, financial condition and results of operations.
The allowance, in the judgment of management, is established to reserve for estimated loan losses and risks inherent in the loan portfolio. The determination of the appropriate level of the allowance for loan losses involves a high degree of subjectivity and requires us to make significant estimates of current credit risks using existing qualitative and quantitative information, all of which may undergo material changes. Changes in economic conditions affecting borrowers, new information regarding existing loans, identification of additional problem loans, and other factors, both within and outside of our control, may require an increase in the allowance for loan losses. In addition, bank regulatory agencies periodically review our allowance for loan losses and may require an increase in the provision for loan losses or the recognition of additional loan charge offs, based on judgments that are different than those of management. As we are consistently adjusting our loan portfolio and underwriting standards to reflect current market conditions, we can provide no assurance that our methodology will not change, which could result in a charge to earnings.
We continually reassess the creditworthiness of our borrowers and the sufficiency of our allowance for loan losses as part of the Bank’s credit functions. Any significant amount of additional non-performing assets, loan charge-offs, increases in the provision for loan losses or the continuation of aggressive charge-off policies or any inability by us to realize the full value of underlying collateral in the event of a loan default, will negatively affect our business, financial condition, and results of operations and the price of our securities. Our allowance for loan losses may not be sufficient to cover future credit losses.
14
We may not realize the anticipated benefits from our previously announced branch sales, and our costs and availability of funding may be materially adversely affected by the branch sales.
On December 17, 2015, we announced that the Bank entered into two definitive agreements for the sale of seven branches in the Bank’s Tennessee market. While we believe that the branch sales will be beneficial to the Bank and better position us to continue to focus on our strategic objectives, we may not realize the projected cost savings from the branch sales at anticipated levels, during the expected time period, or at all. In connection with the branch sales, we expect to experience a decrease of approximately $213 million of customer deposits. Customer deposits are a relatively inexpensive source of capital for the Bank, which we may not be able to replace at a comparable cost. Our inability to replace the lower-cost deposits with capital from other sources could in turn have a material adverse effect on our results of operations. In addition, the consolidation of branches and reduction in staff levels could result in higher-than-expected losses of customers and consolidation expenses. If we are unable to maintain customer relationships or limit consolidation expenses, our results of operations may be adversely affected.
We make and hold in our portfolio a number of land acquisition and development and construction loans, which pose more credit risk than other types of loans typically made by financial institutions.
We offer land acquisition and development, and construction loans for builders and developers, and as of December 31, 2015, we had $166 million in such loans outstanding, representing 9% of the Bank’s total risk-based capital. These land acquisition and development and construction loans are more risky than other types of loans. The primary credit risks associated with land acquisition and development and construction lending are underwriting and project risks. Project risks include cost overruns, borrower credit risk, project completion risk, general contractor credit risk, and environmental and other hazard risks. Market risks are risks associated with the sale of the completed residential units. They include affordability risk, which means the risk that borrowers cannot obtain affordable financing, product design risk, and risks posed by competing projects. Losses in our land acquisition and development and construction loan portfolio could exceed our reserves, which would adversely impact our earnings. Non-performing loans in our land acquisition and development and construction portfolio could increase during 2016, and these non-performing loans could result in a material level of charge-offs, which would negatively impact our capital and earnings.
If the value of real estate in our core markets declines, a significant portion of our loan portfolio could become under-collateralized, which could have a material adverse effect on us.
In addition to considering the financial strength and cash flow characteristics of borrowers, we often secure loans with real estate collateral. At December 31, 2015, approximately 73% of the Bank’s loans had real estate as a primary or secondary component of collateral. The real estate collateral in each case provides an alternate source of repayment in the event of default by the borrower but may deteriorate in value during the time the credit is extended. If the value of real estate in our core markets were to decline further, a significant portion of our loan portfolio could become under-collateralized. As a result, if we are required to liquidate the collateral securing a loan to satisfy the debt during a period of reduced real estate values, our earnings and capital could be adversely affected.
Our use of appraisals in deciding whether to make a loan on or secured by real property or how to value such loan in the future may not accurately describe the net value of the real property collateral that we can realize.
In considering whether to make a loan secured by real property, we generally require an appraisal of the property. However, an appraisal is only an estimate of the value of the property at the time the appraisal is made, and, as real estate values in our market area have experienced changes in value in relatively short periods of time, this estimate might not accurately describe the net value of the real property collateral after the loan has been closed. If the appraisal does not reflect the amount that may be obtained upon any sale or foreclosure of the property, we may not realize an amount equal to the indebtedness secured by the property. The valuation of the property may negatively impact the continuing value of such loan and could adversely affect our operating results and financial condition.
We depend on the accuracy and completeness of information about customers and counterparties.
In deciding whether to extend credit or enter into other transactions with customers and counterparties, we rely on information furnished to us by or on behalf of customers and counterparties, including financial statements and other financial information. We also rely on representations of customers and counterparties as to the accuracy and completeness of that information and, with respect to financial statements, on reports of independent auditors. For example, in deciding whether to extend credit to customers, we may assume that a customer’s audited financial statements conform to accounting principles generally accepted in the United States (“GAAP”), and present fairly, in all material respects, the financial condition, results of operations and cash flows of the customer. Our earnings and our financial condition could be negatively impacted to the extent the information furnished to us by and on behalf of borrowers is not correct or complete or is noncompliant with GAAP.
15
We will realize additional future losses if the proceeds we receive upon liquidation of non-performing assets are less than the fair value of such assets.
We have a strategy to manage our non-performing assets aggressively, a portion of which may not be currently identified. Non-performing assets are recorded on our financial statements at fair value, as required under GAAP, unless these assets have been specifically identified for liquidation, in which case they are recorded at the lower of cost or estimated net realizable value. In current market conditions, we are likely to realize additional future losses if the proceeds we receive upon dispositions of non-performing assets are less than the recorded fair value of such assets.
Changes in the policies of monetary authorities and other government action could materially adversely affect our profitability.
The Bank’s results of operations are affected by credit policies of monetary authorities, particularly the Federal Reserve. The instruments of monetary policy employed by the Federal Reserve include open market operations in U.S. government securities, changes in the discount rate or the federal funds rate on bank borrowings and changes in reserve requirements against bank deposits. In view of changing conditions in the national economy and in the money markets, particularly in light of the continuing threat of terrorist attacks and the current military operations and other instances of unrest in the Middle East, and the economic and political situations in the Middle East, Greece, the Ukraine and elsewhere, we cannot predict with certainty possible future changes in interest rates, deposit levels, loan demand or our business and earnings. Furthermore, the actions of the U.S. government and other governments in responding to such terrorist attacks or events in these or other regions may result in currency fluctuations, exchange controls, market disruption and other adverse effects.
We are subject to risks in the event of certain borrower defaults, which could have an adverse impact on our liquidity position and results of operations.
We may be required to repurchase mortgage loans or indemnify mortgage loan purchasers as a result of certain borrower defaults, which could adversely affect our liquidity position, results of operations, and financial condition. When we sell mortgage loans, we are required to make customary representations and warranties to the purchaser about the mortgage loans and the manner in which the loans were originated. In the event of a breach of any of the representations and warranties related to a loan sold, we could be liable for damages to the investor up to and including a “make whole” demand that involves, at the investor’s option, either reimbursing the investor for actual losses incurred on the loan or repurchasing the loan in full. Our maximum exposure to credit loss in the event of a make whole loan repurchase claim would be the unpaid principal balance of the loan to be repurchased along with any premium paid by the investor when the loan was purchased and other minor collection cost reimbursements. If repurchase demands increase, our liquidity position, results of operations, and financial condition could be adversely affected.
The requirements of being a public company may strain our resources, divert management’s attention and affect our ability to attract and retain executive management and qualified board members.
As a public company, we are subject to the reporting requirements of the Exchange Act, the Sarbanes-Oxley Act of 2002 (the “Sarbanes-Oxley Act”), the Dodd-Frank Act, and other applicable securities rules and regulations. Compliance with these rules and regulations increases our legal and financial compliance costs, makes some activities more difficult, time-consuming or costly and increases demand on our systems and resources. The Exchange Act requires, among other things, that we file annual, quarterly and current reports with respect to our business and operating results. The Sarbanes-Oxley Act requires, among other things, that we maintain effective disclosure controls and procedures and internal control over financial reporting. In order to maintain and, if required, improve our disclosure controls and procedures and internal control over financial reporting to meet this standard, significant resources and management oversight may be required. As a result, management’s attention may be diverted from other business concerns, which could adversely affect our business and operating results. We may need to hire more employees in the future or engage outside consultants, which will increase our costs and expenses.
In addition, changing laws, regulations and standards relating to corporate governance and public disclosure are creating uncertainty for public companies, increasing legal and financial compliance costs and making some activities more time consuming. These laws, regulations and standards are subject to varying interpretations, in many cases due to their lack of specificity, and, as a result, their application in practice may evolve over time as new guidance is provided by regulatory and governing bodies. This could result in continuing uncertainty regarding compliance matters and higher costs necessitated by ongoing revisions to disclosure and governance practices. We intend to invest resources to comply with evolving laws, regulations and standards, and this investment may result in increased general and administrative expenses and a diversion of management’s time and attention from revenue-generating activities to compliance activities. If our efforts to comply with new laws, regulations and standards differ from the activities intended by regulatory or governing bodies due to ambiguities related to their application and practice, regulatory authorities may initiate legal proceedings against us and our business may be adversely affected.
16
These new rules and regulations and the fact that we are a newly public company have increased the costs of our director and officer liability insurance, and we may be required to accept reduced coverage or incur substantially higher costs to obtain coverage in the future. These factors could also make it more difficult for us to attract and retain qualified members of our board of directors, particularly to serve on our audit and compensation committees, and qualified executive officers.
As a result of disclosure of information in our registration statement, this annual report and in other filings required of a public company, our business and financial condition will become more visible, which may result in threatened or actual litigation, including by competitors and other third parties. If such claims are successful, our business and operating results could be adversely affected, and even if the claims do not result in litigation or are resolved in our favor, these claims, and the time and resources necessary to resolve them, could divert the resources of our management and adversely affect our business and operating results.
Negative publicity about financial institutions, generally, or about our Company or the Bank, specifically, could damage our reputation and adversely impact our liquidity, business operations or financial results.
Reputation risk, or the risk to our business from negative publicity, is inherent in our business. Negative publicity can result from the actual or alleged conduct of financial institutions, generally, or our Company or the Bank, specifically, in any number of activities, including leasing and lending practices, corporate governance, and actions taken by government regulators in response to those activities. Negative publicity can adversely affect our ability to keep and attract customers and can expose us to litigation and regulatory action, any of which could negatively affect our liquidity, business operations or financial results.
Increases in our expenses and other costs could adversely affect our financial results.
Our expenses and other costs, such as operating expenses and hiring new employees, directly affect our earnings results. In light of the extremely competitive environment in which we operate, and because the size and scale of many of our competitors provides them with increased operational efficiencies, it is important that we are able to successfully manage such expenses. We are aggressively managing our expenses in the current economic environment, but as our business develops, changes or expands, and as we hire additional personnel, additional expenses can arise. Other factors that can affect the amount of our expenses include legal and administrative cases and proceedings, which can be expensive to pursue or defend. In addition, changes in accounting policies can significantly affect how we calculate expenses and earnings.
Fluctuations in interest rates could reduce our profitability.
Our earnings are significantly dependent on our net interest income, as we realize income primarily from the difference between interest earned on loans and investments and the interest paid on deposits and borrowings. We may be unable to predict future fluctuations in market interest rates, which are affected by many factors, including inflation, economic growth, employment rates, fiscal and monetary policy and disorder and instability in domestic and foreign financial markets. Our net interest income is affected not only by the level and direction of interest rates, but also by the shape of the yield curve and relationships between interest sensitive instruments and key interest driver rates, as well as balance sheet growth, customer loan and deposit preferences and the timing of changes in these variables. Our net interest income also may decline based on our exposure to a difference in short-term and long-term interest rates. A relatively high cost for securing deposits, combined with lower interest rates that can be charged on customer loans, will place downward pressure on our net interest income. Our asset-liability management strategy may not be effective in preventing changes in interest rates from having a material adverse effect on our business, financial condition and results of operations.
There is a risk that any of our strategic efforts may not be successful.
As part of our strategy, we continuously evaluate opportunities to expand into new markets or lines of business, offer new products or services, improve our existing lines of business and manage our geographic footprint to maximize the efficiency of our operations. Implementation of this strategy, which may involve organic growth initiatives, hiring groups of bankers, acquiring other financial institutions, branch offices or selected assets or deposits of financial institutions, reducing investment in or partially or completely exiting a line of business, or consolidating or selling branch offices, could be expensive and put a strain on our management, financial, operational and technical resources. In addition, acquisitions and other strategic efforts involve a number of risks, which could have a material adverse effect on our business, financial condition and results of operations, including:
• | there may be a substantial lag time between the time we incur the expenses associated with evaluating new markets for expansion, identifying and evaluating potential expansion partners or acquisition opportunities, and hiring experienced local management and opening new banking facilities, and the time when we generate sufficient assets, deposits and earnings to support the costs of such expansion; the use of inaccurate estimates |
17
and judgments in evaluating credit, operations, management and market risks with respect to any target institution or assets;
•diluting our existing shareholders in an acquisition;
• | the time associated with negotiating a transaction or working on strategic plans, resulting in management’s attention being diverted from our existing business; |
• | the time and expense of obtaining required regulatory approvals and complying with the terms and conditions of regulatory approvals, which may require us to dispose of acquired branches, sell certain segments of acquired loan portfolios, or impose other restrictions on our operations; |
•the time and expense of integrating new operations and personnel; and
• | the possible loss of key employees and customers as a result of expansion into a new market, elimination of redundant branches, or an acquisition that is poorly conceived and executed. |
There is no assurance that we will successfully implement our strategic plan or meet our goals. For example, if we expand into a new geographic market, we face additional risks as a result of not having the market expertise in the new geographic location that we possess in Metropolitan Atlanta and Chattanooga/Knoxville. The diligence we conduct with respect to any expansion opportunity may not be sufficient to properly evaluate the prospects of any such opportunity. Moreover, our failure to correctly identify, acquire and integrate any target or to successfully manage our growth in new markets may have a material adverse effect on our business, financial condition and results of operations. In addition, if we choose to eliminate branches or exit a market, that action could result in broader customer loss than anticipated.
Our use of brokered deposits may be limited or discouraged by bank regulators, which could adversely affect our liquidity.
We use brokered deposits to fund a portion of our operations. Our liquidity and our funding costs may be negatively affected if this funding source experiences reduced availability due to regulatory restrictions, loss of investor confidence or a move to other investments or as a result of increased Federal Deposit Insurance Corporation (“FDIC”) insurance costs for these deposits. As of December 31, 2015, 9% of the Bank’s total deposits were composed of brokered deposits. These deposits are a mix between short-term brokered certificates of deposit and brokered money market accounts. Depositors that invest in brokered deposits are generally interest rate sensitive and well-informed about alternative markets and investments. Consequently, these types of deposits may not provide the same stability to our deposit base or provide the same enterprise value as traditional local retail deposit relationships. Brokered deposits are also considered wholesale funding by bank regulators and a dependence on wholesale funding may warrant increased regulatory review and higher FDIC insurance costs. Banks that are no longer “well capitalized” for bank regulatory purposes are limited in accepting or renewing brokered deposits. In addition, our costs of funds and profitability are likely to be adversely affected to the extent we have to rely upon higher cost borrowings from other institutional investors or brokers to fund loan demand and origination needs.
We face strong competition from larger, more established competitors that may inhibit our ability to compete and expose us to greater lending risks.
The banking business is highly competitive, and we experience strong competition from many other financial institutions. We compete with commercial banks, credit unions, savings and loan associations, mortgage banking firms, consumer finance companies, securities brokerage firms, insurance companies, money market funds and other financial institutions, which operate in our primary market areas and elsewhere.
We compete with these institutions in attracting deposits, making loans and providing private banking services. In addition, we have to attract our customer base from other existing financial institutions and from new residents. Many of our competitors are well-established and much larger financial institutions. We may face a competitive disadvantage as a result of our smaller size and relative lack of geographic diversification.
Our relatively small geographic footprint limits our ability to diversify macro-economic risk. We lend primarily to privately held small and mid-sized businesses, not for profit institutions, institutional caliber commercial real estate developers and investors, and affluent families in the Metropolitan Atlanta and Eastern Tennessee areas which may expose us to greater lending risks than those of banks lending to larger, better capitalized businesses with longer operating histories. As a community bank, we are less able to spread the risk of unfavorable local economic conditions than larger or more regional banks. Moreover, we cannot give any assurance that we will benefit from any market growth or favorable economic conditions in our primary market areas-Metropolitan Atlanta, the Interstate 75 corridor between Dalton, Georgia (approximately one hour north of Atlanta) and Jefferson City, Tennessee (approximately 30 minutes north of Knoxville, Tennessee) and the Interstate 40 corridor between Knoxville and Nashville, Tennessee-if they do occur.
18
The soundness of our financial condition may also affect our competitiveness. Many of our competitors have fewer regulatory constraints and may have lower cost structures.
The costs and effects of litigation, investigations or similar matters, or adverse facts and developments related thereto, could materially affect our business, operating results and financial condition.
We may be involved from time to time in a variety of litigation, investigations or similar matters arising out of our business. Our insurance may not cover all claims that may be asserted against it and indemnification rights to which we are entitled may not be honored, and any claims asserted against us, regardless of merit or eventual outcome, may harm our reputation. Should the ultimate judgments or settlements in any litigation or investigation significantly exceed our insurance coverage, they could have a material adverse effect on our business, financial condition and results of operations. In addition, premiums for insurance covering the financial and banking sectors are rising. We may not be able to obtain appropriate types or levels of insurance in the future, nor may we be able to obtain adequate replacement policies with acceptable terms or at historic rates, if at all.
Changes in tax rates, interpretations of tax laws, the status of examinations by tax authorities and newly enacted statutory, judicial and regulatory guidance could materially affect our business, operating results and financial condition.
We are subject to various taxing jurisdictions where we conduct business. We assess the appropriate tax treatment of transactions and filing positions after considering statutes, regulations, judicial precedent and other pertinent information and maintain tax accruals consistent with our evaluation. This evaluation incorporates assumptions and estimates that involve a high degree of judgment and subjectivity. Changes in the results of these evaluations could have a material impact on our operating results.
Environmental liability associated with lending activities could result in losses.
In the course of our business, we may foreclose on and take title to properties securing our loans. If hazardous substances are discovered on any of these properties, we may be liable to governmental entities or third parties for the costs of remediation of the hazard, as well as for personal injury and property damage. Many environmental laws impose liability regardless of whether we knew of, or were responsible for, the contamination. In addition, if we arrange for the disposal of hazardous or toxic substances at another site, we may be liable for the costs of cleaning up and removing those substances from the site, even if we neither own nor operate the disposal site. Environmental laws may require us to incur substantial expenses and may materially limit the use of properties that we acquire through foreclosure, reduce their value or limit our ability to sell them in the event of a default on the loans they secure. In addition, future laws or more stringent interpretations or enforcement policies with respect to existing laws may increase our exposure to environmental liability. Our loan policies requiring certain due diligence of high risk industries and properties may not be effective in reducing the risks of environmental liability resulting from non-performing loan and/or foreclosed property.
We may not be able to retain, attract and motivate qualified individuals.
Our success depends on our ability to retain, attract and motivate qualified individuals in key positions throughout the organization. Competition for qualified individuals in most activities in which we are engaged can be intense, and we may not be able to hire or retain the people we want and/or need. Although we have entered into employment agreements with certain key employees, and have incentive compensation plans aimed, in part, at long-term employee retention, the unexpected loss of services of one or more of our key personnel could still occur, and such events may have a material adverse impact on our business because of the loss of the employee’s skills, knowledge of our market, and years of industry experience and the difficulty of promptly finding qualified replacement personnel. If we are unable to retain, attract and motivate qualified individuals in key positions, our business and results of operations could be adversely affected.
A failure in or breach of our operational or security systems, or those of our third party service providers, including as a result of cyber-attacks, could disrupt our business, result in unintentional disclosure or misuse of confidential or proprietary information, damage our reputation, increase our costs and/or adversely impact our earnings.
As a financial institution, our operations rely heavily on the secure processing, storage and transmission of confidential and other information on our computer systems and networks. Any failure, interruption or breach in security or operational integrity of these systems could result in failures or disruptions in our Internet banking system, treasury management products, check and document imaging, remote deposit capture systems, general ledger, and other systems. The security and integrity of our systems could be threatened by a variety of interruptions or information security breaches, including those caused by computer hacking, cyber-attacks, human error, electronic fraudulent activity or attempted theft of financial assets. We cannot assure you that any such failures, interruption or security breaches will not occur, or if they do occur, that they will be adequately addressed. The protective policies and procedures we currently have in place or which we implement in the future may not be sufficient as the nature and
19
sophistication of such threats continue to evolve. We may be required to expend significant additional resources in the future to modify and enhance our protective measures.
Additionally, we face the risk of operational disruption, failure, termination or capacity constraints of any of the third parties that facilitate our business activities, including exchanges, clearing agents, clearing houses or other financial intermediaries. Such parties could also be the source of an attack on, or breach of, our operational systems. Any failures, interruptions or security breaches in our information systems could damage our reputation, result in a loss of customer business, result in a violation of privacy or other laws, or expose us to civil litigation, regulatory fines or losses not covered by insurance.
We rely on other companies to provide key components of our business infrastructure.
Our business operations rely on third party vendors to provide services such as data processing, recording and monitoring transactions, online banking interfaces and services, Internet connections and network access. While we have selected these third party vendors carefully, we do not control their actions. Any problems caused or experienced by these third parties, including but not limited to those resulting from disruptions in communication services provided by a vendor, failure of a vendor to handle current or higher volumes, cyber-attacks and security breaches at a vendor, failure of a vendor to provide services for any reason or poor performance of services, could adversely affect our ability to deliver products and services to our customers and otherwise conduct our business. Financial or operational difficulties of a third party vendor could also hurt our operations if those difficulties interfere with the vendor’s ability to serve us. Furthermore, our vendors could also be sources of operational and information security risk to us, including from breakdowns or failures of their own systems or capacity constraints. Replacing these third party vendors could also create significant delay and expense. Accordingly, use of such third parties creates an unavoidable inherent risk to our business operations.
Our business is dependent on technology, and an inability to invest in technological improvements or obtain reliable technology and technological support may adversely affect our business, financial condition and results of operations.
The financial services industry is undergoing rapid technological changes with frequent introductions of new technology-driven products and services. In addition to better serving customers, the effective use of institutions to reduce costs. We depend in part upon our ability to address the needs of our customers by using technology to provide products and services that satisfy their operational needs. Many of our competitors have substantially greater resources to invest in technological improvements and third-party support. There can be no assurance that we will effectively implement new technology-driven products and services or successfully market these products and services to our customers. We also rely on our computer systems. For example, we rely on our computer systems to accurately track and record our assets and liabilities. If our computer systems become unreliable, fail or experience a breach of security, our ability to maintain accurate financial records may be impaired, which could materially affect our business, financial condition and results of operations.
Risks Related to Legislative and Regulatory Events
The Dodd-Frank Act and related regulations may adversely affect our business, financial condition, liquidity or results of operations.
The Dodd-Frank Act created a new agency, the CFPB, with power to promulgate and enforce consumer protection laws. Smaller depository institutions, including those with $10 billion or less in assets, will be subject to the CFPB’s rule-writing authority, and existing depository institution regulatory agencies will retain examination and enforcement authority for such institutions. The Dodd-Frank Act also established a Financial Stability Oversight Council chaired by the Secretary of the Treasury with authority to identify institutions and practices that might pose a systemic risk and, among other things, includes provisions affecting:
• | corporate governance and executive compensation of all companies whose securities are registered with the SEC; |
• | FDIC insurance assessments; |
• | interchange fees for debit cards, which would be set by the Federal Reserve under a restrictive “reasonable and proportional cost” per transaction standard, and; |
• | minimum capital levels for bank holding companies, subject to a grandfather clause for financial institutions with less than $15 billion in assets. |
The CFPB has broad powers to supervise and enforce consumer protection laws. The CFPB has broad rule-making authority for a wide range of consumer protection laws that apply to all banks, including the authority to prohibit unfair, deceptive or abusive acts and practices. In addition, the Dodd-Frank Act enhanced the regulation of mortgage banking and gave to the CFPB oversight
20
of many of the core laws which regulate the mortgage industry and the authority to implement mortgage regulations. New regulations adopted and anticipated to be adopted by the CFPB will significantly impact consumer mortgage lending and servicing.
The Dodd-Frank Act and the resulting regulations will likely affect our business and operations in other ways which are difficult to predict at this time. However, compliance with these laws and regulations will result in additional costs, which may adversely impact our results of operations, financial condition or liquidity, any of which may impact the market price of our common stock.
The CFPB’s “ability-to-repay” and “qualified mortgage” rules could have a negative impact on our loan origination process and foreclosure proceedings.
The CFPB has adopted rules that are likely to impact our residential mortgage lending practices, and the residential mortgage market generally including rules that implement the “ability-to-repay” requirement and provide protection from liability for “qualified mortgages,” as required by the Dodd-Frank Act. The ability-to-repay rule, which took effect on January 10, 2014, requires lenders to consider, among other things, income, employment status, assets, payment amounts, and credit history before approving a mortgage, and provides a compliance “safe harbor” for lenders that issue certain “qualified mortgages.” The rules define a “qualified mortgage” to have certain specified characteristics, and generally prohibit loans with negative amortization, interest-only payments, balloon payments, or terms exceeding 30 years from being qualified mortgages. The rule also establishes general underwriting criteria for qualified mortgages, including that monthly payments be calculated based on the highest payment that will apply in the first five years of the loan and that the borrower have a total debt-to-income ratio that is less than or equal to 43%. Although the new “qualified mortgage” rules may provide better definition and more certainty regarding regulatory requirements, the rules may also increase our compliance burden and reduce our lending flexibility and discretion, which could negatively impact our ability to originate new loans and the cost of originating new loans. Any loans that we make outside of the “qualified mortgage” criteria could expose us to an increased risk of liability and reduce or delay our ability to foreclose on the underlying property. Additionally, qualified “higher priced mortgages” only provide a rebuttable presumption of compliance and thus may be more susceptible to challenges from borrowers. It is difficult to predict how the CFPB’s “qualified mortgage” rules will impact us, but any decreases in loan origination volume or increases in compliance and foreclosure costs could negatively affect our business, operating results and financial condition.
The CFPB may reshape consumer financial laws through rulemaking and enforcement of unfair, deceptive or abusive practices, which may directly impact the business operations of depository institutions offering consumer financial products or services including the Bank.
Banking regulatory agencies have increasingly used a general consumer protection statute to address “unethical” or otherwise “bad” business practices that may not necessarily fall directly under the purview of a specific banking or consumer finance law. The law of choice for enforcement against such business practices has been Section 5 of the Federal Trade Commission Act-the primary federal law that prohibits unfair or deceptive acts or practices and unfair methods of competition in or affecting commerce (“UDAP” or “FTC Act”). “Unjustified consumer injury” is the principal focus of the FTC Act. Prior to the Dodd-Frank Act, there was little formal guidance to provide insight to the parameters for compliance with the UDAP law. However, the UDAP provisions were expanded under the Dodd-Frank Act to apply to “unfair, deceptive or abusive acts or practices” (“UDAAP”), which has been delegated to the CFPB for supervision. The CFPB has published its first Supervision and Examination Manual that addresses compliance with and the examination of UDAAP. The potential reach of the CFPB’s broad new rulemaking powers and UDAAP authority on the operations of financial institutions offering consumer financial products or services, including the Bank is currently unknown.
The Federal Reserve has adopted new capital requirements for financial institutions that may require us to retain or raise additional capital and/or reduce dividends.
The Federal Reserve adopted increased regulatory capital requirements that implemented changes required by the Dodd-Frank Act and portions of the Basel III regulatory capital reforms. In the future, the capital requirements for bank holding companies may require us to retain or raise additional capital, restrict our ability to pay dividends and repurchase shares of our common stock, and restrict our ability to provide certain forms of discretionary executive compensation and/or require other changes to our strategic plans. The rules could restrict our ability to grow and implement our future business strategies, which could have an adverse impact on our results of operations.
21
Regulations relating to privacy, information security and data protection could increase our costs, affect or limit how Atlantic Capital collects and uses personal information and adversely affect our business opportunities.
Atlantic Capital is subject to various privacy, information security and data protection laws, including requirements concerning security breach notification, and we could be negatively impacted by them. For example, certain of our business is subject to the Gramm-Leach-Bliley Act (“GLBA”) and implementing regulations and guidance. Among other things, the GLBA:
• | imposes certain limitations on the ability of financial institutions to share consumers’ nonpublic personal information with nonaffiliated third parties; |
• | requires that financial institutions provide certain disclosures to consumers about their information collection, sharing and security practices and affords customers the right to “opt out” of the institution’s disclosure of their personal financial information to nonaffiliated third parties (with certain exceptions); and |
• | requires financial institutions to develop, implement and maintain a written comprehensive information security program containing safeguards that are appropriate to the financial institution’s size and complexity, the nature and scope of the financial institution’s activities, and the sensitivity of customer information processed by the financial institution as well as plans for responding to data security breaches. |
Moreover, various United States federal banking regulatory agencies, states and foreign jurisdictions have enacted data security breach notification requirements with varying levels of individual, consumer, regulatory and/or law enforcement notification in certain circumstances in the event of a security breach. Many of these requirements also apply broadly to businesses that accept our payment. In many countries that have yet to impose data security breach notification requirements, regulators have increasingly used the threat of significant sanctions and penalties by data protection authorities to encourage voluntary notification and discourage data security breaches.
Furthermore, legislators and/or regulators in the United States are increasingly adopting or revising privacy, information security and data protection laws that potentially could have a significant impact on our current and planned privacy, data protection and information security-related practices, our collection, use, sharing, retention and safeguarding of consumer and/or employee information, and some of our current or planned business activities. This could also increase our costs of compliance and business operations and could reduce income from certain business initiatives. This includes increased privacy-related enforcement activity at the federal level, by the Federal Trade Commission, as well as at the state level, such as with regard to mobile applications.
Compliance with current or future privacy, data protection and information security laws (including those regarding security breach notification) affecting customer and/or employee data to which we are subject could result in higher compliance and technology costs and could restrict our ability to provide certain products and services, which could materially and adversely affect our profitability. Our failure to comply with privacy, data protection and information security laws could result in potentially significant regulatory and/or governmental investigations and/or actions, litigation, fines, sanctions, and damage to our reputation and brand.
Anti-money laundering and anti-terrorism financing laws could have significant adverse consequences for the Company.
We maintain an enterprise-wide program designed to enable us to comply with applicable anti-money laundering and anti-terrorism financing laws and regulations, including the Bank Secrecy Act and the USA PATRIOT ACT. This program includes policies, procedures, processes and other internal controls designed to identify, monitor, manage and mitigate the risk of money laundering or terrorist financing posed by our products, services, customers and geographic locale. These controls include procedures and processes to detect and report suspicious transactions, perform customer due diligence, respond to requests from law enforcement, and meet all recordkeeping and reporting requirements related to particular transactions involving currency or monetary.
Risks Related to Ownership of Our Common Stock
An active trading market may not develop for our common stock.
Our common stock began trading on the Nasdaq Global Select Market on November 2, 2015. Prior to such date, there was no public market for our common stock. Since then, there has been limited trading activity. If an active market for our common stock does not develop, it may be difficult for our shareholders to sell their shares at a favorable price or to sell their shares at all. Given the limited trading history of our common stock, there is a risk that an active trading market for our shares will not develop or be sustained in the future, which could adversely affect the market price and liquidity of our common stock. Any negative impact on the price or liquidity of our common stock may impair our ability to raise capital to continue to fund our operations by offering and selling additional shares and our ability to use our common stock as consideration in future acquisitions.
22
We are an emerging growth company and we cannot be certain if the reduced disclosure requirements applicable to emerging growth companies will make our common stock less attractive.
We are an “emerging growth company,” as defined in the Jumpstart Our Business Startups Act of 2012 (the “JOBS Act”), and we may take advantage of certain exemptions from various reporting requirements that are applicable to other public companies that are not emerging growth companies, including, but not limited to, not being required to comply with the auditor attestation requirements of Section 404 of the Sarbanes-Oxley Act, reduced disclosure obligations regarding executive compensation in our periodic reports and proxy statements, and exemptions from the requirements of holding a nonbinding advisory vote on executive compensation and shareholder approval of any golden parachute payments not previously approved. In addition, even if we comply with the greater obligations of public companies that are not emerging growth companies, we may avail ourselves of the reduced requirements applicable to emerging growth companies from time to time in the future, so long as we are an emerging growth company. We will remain an emerging growth company for up to five years, though we may cease to be an emerging growth company earlier under certain circumstances, including if, before the end of such five years, we are deemed to be a large accelerated filer under the rules of the SEC (which depends on, among other things, having a market value of common stock held by non-affiliates in excess of $700 million) or if our total annual gross revenues equal or exceed $1 billion in a fiscal year. We cannot predict if investors will find our common stock less attractive because we will rely on these exemptions. If some investors find our common stock less attractive as a result, there may be a less active trading market for our common stock and our stock price may be more volatile.
Our future operating results may be below securities analysts’ or investors’ expectations, which could cause our stock price to decline.
We may be unable to generate significant revenues or grow at the rate expected by securities analysts or investors. In addition, our costs may be higher than we, securities analysts or investors expect. If we fail to generate sufficient revenues or our costs are higher than we expect, our results of operations will suffer, which in turn could cause our stock price to decline. Our operating results in any particular period may not be a reliable indication of our future performance. In some future quarters, our operating results may be below the expectations of securities analysts or investors. If this occurs, the price of our common stock will likely decline.
Our ability to pay dividends to our shareholders is limited.
Our primary source of cash is dividends we receive from the Bank. Therefore, our ability to pay dividends to our shareholders depends on the Bank’s ability to pay dividends to us. We did not pay dividends in 2015, 2014, 2013, or 2012. Additionally, banks and bank holding companies are subject to significant regulatory restrictions on the payment of cash dividends. In light of regulatory restrictions and our plans to build capital, we currently intend to reinvest the earnings of the Bank and to not pay any dividends for the foreseeable future. Our future dividend policy will depend on our earnings, capital requirements, financial condition, regulatory requirements and other factors that the boards of directors of the Company and the Bank consider relevant.
We may not be able to raise additional capital on terms favorable to us or at all.
In the future, should we need additional capital to support our business, expand our operations or maintain our minimum capital requirements, we may not be able to raise additional funds. Our ability to raise additional capital, if needed, will depend on, among other things, conditions in the capital markets at that time, which are outside of our control, and our financial performance at that time. We cannot provide assurance that such financing will be available to us on acceptable terms or at all. If we borrow money to provide capital to the Bank, we must obtain prior regulatory approvals, and we may not be able to pay this debt and could default. We cannot provide assurance that funds will be available to us on favorable terms or at all.
ITEM 1B. | UNRESOLVED STAFF COMMENTS |
None.
ITEM 2. PROPERTIES
During 2015, we conducted our business primarily through our corporate headquarters located at 3280 Peachtree Road NE, Suite 1600, Atlanta, Fulton County, Georgia as well as our Tennessee headquarters at 531 Broad Street, Chattanooga, Hamilton County, Tennessee. We believe that our banking offices are in good condition, and are suitable to our needs. The following table summarizes pertinent details of our owned or leased branch, loan production and leasing offices.
23
Square | Property | |||
Office Address | Date Opened | Owned/Leased | Footage | Type |
401 South Thornton Avenue Dalton, Whitfield County, Georgia | September 17, 1999 | Owned | 16,438 | Branch |
1237 North Glenwood Avenue Dalton, Whitfield County, Georgia | September 17, 1999 | Owned | 3,300 | Branch |
761 New Highway 68 Sweetwater, Monroe County, Tennessee | June 26, 2000 | Owned | 3,000 | Branch* |
1740 Gunbarrel Road Chattanooga, Hamilton County, Tennessee | July 3, 2000 | Leased | 3,400 | Branch |
4227 Ringgold Road East Ridge, Hamilton County, Tennessee | July 28, 2000 | Leased | 3,400 | Branch |
835 South Congress Parkway Athens, McMinn County, Tennessee | November 6, 2000 | Owned | 3,400 | Branch* |
820 Ridgeway Avenue Signal Mountain, Hamilton County, Tennessee | May 29, 2001 | Owned | 2,500 | Branch |
1301 Cowart Street Chattanooga, Hamilton County, Tennessee | March 28, 2011 | Leased | 1,000 | Branch |
9217 Lee Highway Ooltewah, Hamilton County, Tennessee | July 8, 2002 | Owned | 3,400 | Branch |
2905 Maynardville Highway Maynardville, Union County, Tennessee | July 20, 2002 | Owned | 12,197 | Branch |
2918 East Walnut Avenue Dalton, Whitfield County, Georgia | March 31, 2003 | Owned | 10,337 | Branch |
715 South Thornton Avenue Dalton, Whitfield County, Georgia | March 31, 2003 | Building Owned Land Leased | 4,181 | Branch |
167 West Broadway Boulevard Jefferson City, Jefferson County, Tennessee | October 14, 2003 | Owned | 3,743 | Branch |
705 East Broadway Lenoir City, Loudon County, Tennessee | October 27, 2003 | Owned | 3,610 | Branch* |
215 Warren Street Madisonville, Monroe County, Tennessee | December 4, 2003 | Owned | 8,456 | Branch* |
155 North Campbell Station Road Knoxville, Knox County, Tennessee | March 2, 2004 | Building Owned Land Leased | 3,743 | Branch |
1013 South Highway 92 Dandridge, Jefferson County, Tennessee | April 5, 2004 | Owned | 3,500 | Branch |
1111 Northshore Drive, Suite S600 Knoxville, Knox County, Tennessee | October 1, 2004 | Leased | 9,867 | Loan |
1111 Northshore Drive, Suite P-100 Knoxville, Knox County, Tennessee | July 25, 2005 | Leased | 1,105 | Branch |
307 Hull Avenue Gainesboro, Jackson County, Tennessee | August 31, 2005 | Owned | 9,662 | Branch* |
376 West Jackson Street Cookeville, Putnam County, Tennessee | August 31, 2005 | Owned | 14,780 | Branch* |
3895 Cleveland Road Varnell Whitfield County, Georgia | November 11, 2005 | Owned | 1,860 | Branch |
531 Broad Street Chattanooga, Hamilton County, Tennessee | December 11, 2006 | Owned | 39,700 | Branch |
614 West Main Street Algood, Putnam County, Tennessee | April 10, 2007 | Owned | 1,936 | Branch* |
5188 Highway 153 Hixon, Hamilton County, Tennessee | May 22, 2009 | Owned | 4,194 | Branch |
3200 Keith Street NW Cleveland, Bradley County, Tennessee | June 1, 2015 | Owned | 3,995 | Branch |
24
226 Village Square Drive Loudon, Loudon County, Tennessee | February 1, 2016 | Leased | 941 | Mortgage Office |
75 Executive Drive Carmel, Hamilton County, Indiana | August 1, 2013 | Leased | 1,600 | Loan |
3280 Peachtree Rd Ne Suite 1600 Atlanta, Fulton County, Georgia | April 28, 2007 | Leased | 23,654 | Headquarters |
3280 Peachtree Rd NE Suite 190 Atlanta, Fulton County, Georgia | July 1, 2007 | Leased | 1,975 | Branch |
3525 Piedmont Rd Bldg 7 Suite 510 Atlanta, Fulton County, Georgia | January 1, 2007 | Leased | 13,872 | Loan |
* offices subject to upcoming branch sale | ||||
During 2015, we added 28 facilities located in Tennessee, Georgia, and Indiana through the acquisition of FSGBank. We are not aware of any environmental problems with the properties that we own or lease that would be material, either individually, or in the aggregate, to our operations or financial condition.
ITEM 3. | LEGAL PROCEEDINGS |
Two putative shareholder class action lawsuits were filed in connection with the merger. Knutson v. First Security Group, Inc. et al., filed April 15, 2015 in the Chancery Court for Hamilton County, Tennessee, names First Security, the members of its board of directors, and Atlantic Capital as defendants. Meade v. Kramer, et al., filed April 24, 2015 in the Chancery Court for Hamilton County, Tennessee, names First Security, the members of its board of directors, FSGBank, Atlantic Capital and the Bank as defendants. Each of these complaints alleges, among other things, that the First Security directors breached their fiduciary duties in connection with the negotiation and approval of the merger agreement and that the other named defendants, including Atlantic Capital, aided and abetted those alleged breaches of fiduciary duties. Among other relief, the plaintiffs seeking injunctive relief preventing parties from consummating the merger, rescission of the transactions completed by the merger agreement, an award of attorney’s fees and expenses for plaintiffs and other forms of relief. On June 1, 2015, the Chancery Court entered an order consolidating these two suits under the caption In re First Security Group, Inc. Stockholder Litigation, Case No. 15-0212. On June 25, 2015, the plaintiffs filed an amended and consolidated class action complaint in the Chancery Court for Hamilton County, Chattanooga. The amended complaint repeats many of the same allegations of the original complaints but also makes additional allegations with respect to disclosures contained in the joint proxy statement/prospectus. On July 24, 2015, the defendants filed motions to dismiss the amended complaint.
On August 25, 2015, First Security, Atlantic Capital and the other named defendants and the plaintiffs entered into a Memorandum of Understanding (the “MOU”) regarding the settlement of the above-described lawsuits. The MOU agreed on the terms of a settlement of the lawsuits, including the dismissal with prejudice of the suit captioned In re First Security Group, Inc. Stockholder Litigation and a release of all claims that were made or could have been made therein against all of the defendants. The proposed settlement is conditioned upon, among other things, consummation of the merger, the execution of an appropriate stipulation of settlement, and final approval of the proposed settlement by the Chancery Court for Hamilton County, Tennessee after notice is given to shareholders. In addition, in connection with the settlement and as provided in the MOU, the parties contemplate that plaintiffs’ counsel will seek an award of attorneys’ fees and expenses as part of the settlement. There can be no assurance that the court will approve the settlement and if the court does not approve the proposed settlement, the proposed settlement as contemplated by the MOU would become void. The settlement will not affect the amount of the merger consideration that First Security shareholders received in the merger.
In the ordinary course of business, the Company is involved in routine litigation and various legal proceedings related to the Company’s operations. Currently, there is no pending litigation or proceedings, other than as discussed above, that management believes will have a material adverse effect, either individually or in the aggregate, on the Company’s business, financial condition and results of operations.
ITEM 4. | MINE SAFETY DISCLOSURES |
Not applicable.
25
PART II
ITEM 5. | MARKET FOR COMMON EQUITY, RELATED SHAREHOLDER MATTERS AND ISSUER PURCHASES OF EQUITY SECURITIES |
Market Information
Our common stock has been listed on the Nasdaq Global Select Market (“Nasdaq”) trading under the symbol “ACBI” since November 2, 2015. Prior to that time, there was no public market for our common stock. The following table sets forth for the period indicated the high and low per share sale prices of our common stock on Nasdaq.
Price Per Share | |||||||
Quarter Ended | High | Low | |||||
December 31, 2015 | $ | 15.66 | $ | 14.05 | |||
Holders
At February 29, 2016, there were 362 record shareholders and approximately 772 beneficial shareholders of the Company’s common stock.
Dividend Policy
We did not pay any dividends in fiscal 2015 or fiscal 2014. We have no current plans to pay any dividends on our common stock for the foreseeable future and instead currently intend to retain earnings, if any, for future operations and expansion.
The declaration, amount and payment of any future dividends on shares of our common stock will be at the sole discretion of our Board. Additionally, banks and bank holding companies are subject to significant regulatory restrictions on the payment of cash dividends. Our future dividend policy will depend on our earnings, capital requirements, financial condition, regulatory requirements and other factors that the boards of directors of the Company and the Bank consider relevant. See “Item 1. Business - Supervision and Regulation - Payment of Dividends and Other Restrictions” above for regulatory restrictions which limit our ability to pay dividends.
26
Performance Graph
Set forth below is a line graph, which was prepared by SNL Financial LC (“SNL”) comparing the yearly percentage change in the cumulative total shareholder return on Atlantic Capital’s common stock against the cumulative total return on the Nasdaq Stock Market (U.S. Companies) Index, the Nasdaq Bank Stocks Index, the SNL U.S. Bank Index and the SNL Southeast U.S. Bank Index for the two month period commencing November 2, 2015 (when our shares began trading) and ending on December 31, 2015.
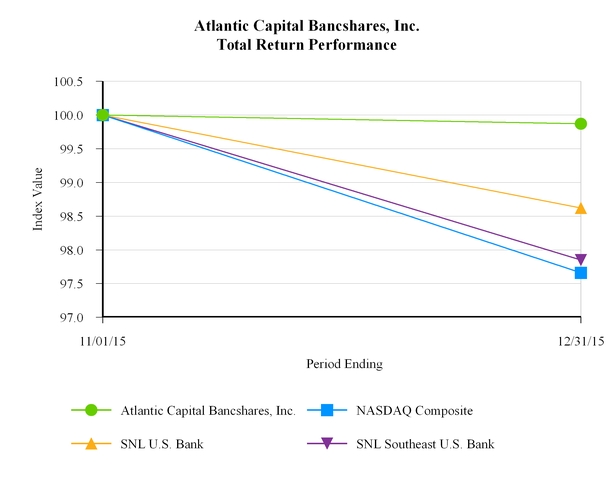
27
ITEM 6. | SELECTED FINANCIAL DATA |
ATLANTIC CAPITAL BANCSHARES, INC. | |||||||||||||||||||||
Table 1 (1) | |||||||||||||||||||||
For the Years Ended December 31, | |||||||||||||||||||||
(in thousands, except per share data) | 2015 | 2014 | 2013 | 2012 | 2011 | ||||||||||||||||
INCOME SUMMARY | |||||||||||||||||||||
Interest income | $ | 48,967 | $ | 36,542 | $ | 32,537 | $ | 30,933 | $ | 29,682 | |||||||||||
Interest expense | 4,923 | 3,449 | 3,615 | 4,196 | 4,991 | ||||||||||||||||
Net interest income | 44,044 | 33,093 | 28,922 | 26,737 | 24,691 | ||||||||||||||||
Provision for loan losses | 8,035 | 488 | 246 | (1,322 | ) | 7,144 | |||||||||||||||
Net interest income after provision for loan losses | 36,009 | 32,605 | 28,676 | 28,059 | 17,547 | ||||||||||||||||
Noninterest income | 9,399 | 5,342 | 3,875 | 2,888 | 2,797 | ||||||||||||||||
Noninterest expense | 45,933 | 26,574 | 24,893 | 21,768 | 17,643 | ||||||||||||||||
Income before income taxes | (525 | ) | 11,373 | 7,658 | 9,179 | 2,701 | |||||||||||||||
Income tax expense (benefit) | 794 | 3,857 | 2,515 | 3,248 | 1,009 | ||||||||||||||||
Net income | $ | (1,319 | ) | $ | 7,516 | $ | 5,143 | $ | 5,931 | $ | 1,692 | ||||||||||
PER SHARE DATA | |||||||||||||||||||||
Basic earnings per share | $ | (0.09 | ) | $ | 0.56 | $ | 0.38 | $ | 0.44 | $ | 0.13 | ||||||||||
Diluted earnings per share | (0.09 | ) | 0.55 | 0.38 | 0.44 | 0.13 | |||||||||||||||
Book value | 11.79 | 10.48 | 9.77 | 9.57 | 9.09 | ||||||||||||||||
PERFORMANCE MEASURES | |||||||||||||||||||||
Return on average equity | (0.77 | ) | % | 5.54 | % | 3.96 | % | 4.79 | % | 1.40 | % | ||||||||||
Return on average assets | (0.08 | ) | 0.61 | 0.46 | 0.58 | 0.20 | |||||||||||||||
Net interest margin | 2.98 | 2.85 | 2.75 | 2.75 | 2.99 | ||||||||||||||||
Efficiency ratio | 85.95 | 69.14 | 75.90 | 73.48 | 64.18 | ||||||||||||||||
Equity to assets | 10.91 | 10.72 | 10.67 | 10.65 | 11.81 | ||||||||||||||||
Dividend payout ratio | — | — | — | — | — | ||||||||||||||||
CAPITAL | |||||||||||||||||||||
Average equity to average assets | 10.79 | % | 11.06 | % | 11.61 | % | 12.04 | % | 14.05 | % | |||||||||||
Tier 1 capital ratio | 9.8 | 11.0 | 12.8 | 12.8 | 10.7 | ||||||||||||||||
Total risk based capital ratio | 12.9 | 11.9 | 13.8 | 13.9 | 11.9 | ||||||||||||||||
Number of common shares outstanding - basic | 24,425,546 | 13,453,820 | 13,426,489 | 13,380,301 | 13,259,357 | ||||||||||||||||
Number of common shares outstanding - diluted | 25,059,823 | 13,650,580 | 13,538,643 | 13,414,391 | 13,259,367 | ||||||||||||||||
ASSET QUALITY | |||||||||||||||||||||
Allowance for loan losses to loans | 1.06 | % | 1.10 | % | 1.32 | % | 1.44 | % | 1.39 | % | |||||||||||
Net charge-offs to average loans | 0.05 | (0.01 | ) | 0.02 | (0.32 | ) | 1.43 | ||||||||||||||
NPAs to total assets | 0.40 | 0.12 | 0.36 | 0.43 | 0.71 | ||||||||||||||||
AVERAGE BALANCES | |||||||||||||||||||||
Loans and loans held for sale | $ | 1,192,103 | $ | 918,959 | $ | 793,505 | $ | 730,129 | $ | 654,603 | |||||||||||
Investment securities | 165,796 | 143,727 | 147,323 | 132,389 | 96,513 | ||||||||||||||||
Total assets | 1,581,687 | 1,227,230 | 1,118,527 | 1,028,155 | 857,619 | ||||||||||||||||
Deposits | 1,296,763 | 983,772 | 935,469 | 859,255 | 709,606 | ||||||||||||||||
Shareholders’ equity | 170,675 | 135,687 | 129,853 | 123,795 | 120,509 | ||||||||||||||||
Number of common shares - basic | 15,283,437 | 13,445,122 | 13,420,599 | 13,375,016 | 13,259,357 | ||||||||||||||||
Number of common shares - diluted | 15,663,865 | 13,641,882 | 13,531,952 | 13,408,443 | 13,259,360 | ||||||||||||||||
(1) First Security’s results are included in Atlantic Capital’s consolidated results beginning on October 31, 2015, the acquisition date. | |||||||||||||||||||||
28
Table 2 | |||||||||||||||||||||||||||||||||
2015 | 2014 | ||||||||||||||||||||||||||||||||
(in thousands, except share and per share data) | Fourth Quarter | Third Quarter | Second Quarter | First Quarter | Fourth Quarter | Third Quarter | Second Quarter | First Quarter | |||||||||||||||||||||||||
INCOME SUMMARY | |||||||||||||||||||||||||||||||||
Interest income | $ | 18,240 | $ | 10,334 | $ | 10,481 | $ | 9,912 | $ | 9,878 | $ | 9,853 | $ | 8,650 | $ | 8,161 | |||||||||||||||||
Interest expense | 2,292 | 840 | 911 | 880 | 891 | 875 | 852 | 831 | |||||||||||||||||||||||||
Net interest income | 15,948 | 9,494 | 9,570 | 9,032 | 8,987 | 8,978 | 7,798 | 7,330 | |||||||||||||||||||||||||
Net interest income after provision for loan losses | 8,325 | 9,631 | 9,385 | 8,668 | 8,968 | 8,340 | 7,226 | 8,071 | |||||||||||||||||||||||||
Noninterest income | 3,460 | 1,729 | 3,028 | 1,182 | 1,502 | 1,321 | 1,249 | 1,270 | |||||||||||||||||||||||||
Noninterest expense | 23,239 | 7,671 | 7,821 | 7,202 | 7,175 | 6,653 | 6,469 | 6,277 | |||||||||||||||||||||||||
Income before income taxes | (11,454 | ) | 3,689 | 4,592 | 2,648 | 3,295 | 3,008 | 2,006 | 3,064 | ||||||||||||||||||||||||
Income tax expense | (3,293 | ) | 1,463 | 1,690 | 934 | 1,144 | 1,022 | 673 | 1,018 | ||||||||||||||||||||||||
Net Income | $ | (8,161 | ) | $ | 2,226 | $ | 2,902 | $ | 1,714 | $ | 2,151 | $ | 1,986 | $ | 1,333 | $ | 2,046 | ||||||||||||||||
Basic Earnings per share | (0.40 | ) | 0.16 | 0.21 | 0.13 | 0.16 | 0.15 | 0.10 | 0.15 | ||||||||||||||||||||||||
Diluted earnings per share | (0.40 | ) | 0.16 | 0.21 | 0.12 | 0.16 | 0.15 | 0.10 | 0.15 | ||||||||||||||||||||||||
Book value per share | 11.76 | 11.05 | 10.80 | 10.67 | 10.48 | 10.24 | 10.11 | 9.97 | |||||||||||||||||||||||||
PERFORMANCE MEASURES | |||||||||||||||||||||||||||||||||
Return on average equity | (13.22 | ) | % | 6.08 | % | 7.99 | % | 4.83 | % | 6.18 | % | 5.91 | % | 3.96 | % | 6.20 | % | ||||||||||||||||
Return on average assets | (1.45 | ) | 0.66 | 0.84 | 0.51 | 0.66 | 0.63 | 0.44 | 0.72 | ||||||||||||||||||||||||
Net interest margin | 3.13 | 2.93 | 2.92 | 2.86 | 2.86 | 3.00 | 2.77 | 2.77 | |||||||||||||||||||||||||
Efficiency ratio | 119.74 | 68.35 | 61.95 | 69.66 | 68.89 | 65.06 | 71.00 | 72.13 | |||||||||||||||||||||||||
Equity to assets | 10.91 | 10.53 | 10.54 | 10.62 | 10.88 | 10.88 | 11.22 | 11.61 | |||||||||||||||||||||||||
CAPITAL | |||||||||||||||||||||||||||||||||
Average equity to average assets | 10.98 | % | 10.85 | % | 10.53 | % | 10.54 | % | 10.62 | % | 10.88 | % | 11.22 | % | 11.61 | % | |||||||||||||||||
Tier 1 capital ratio | 9.8 | 11.00 | 10.40 | 10.10 | 11.00 | 11.14 | 11.46 | 12.52 | |||||||||||||||||||||||||
Total risk based capital ratio | 12.9 | 15.50 | 11.30 | 11.00 | 11.90 | 12.05 | 12.36 | 13.46 | |||||||||||||||||||||||||
Number of common shares outstanding - basic | 24,425,546 | 13,562,125 | 13,562,125 | 13,508,480 | 13,453,820 | 13,453,820 | 13,462,192 | 13,433,164 | |||||||||||||||||||||||||
Number of common shares outstanding - diluted | 25,059,823 | 13,904,395 | 13,904,395 | 13,850,750 | 13,650,580 | 15,457,108 | 15,465,480 | 15,436,452 | |||||||||||||||||||||||||
ASSET QUALITY | |||||||||||||||||||||||||||||||||
Allowance for loan losses to loans | 1.06 | % | 1.13 | % | 1.13 | % | 1.09 | % | 1.10 | % | 1.12 | % | 1.14 | % | 1.23 | % | |||||||||||||||||
Net charge-offs to average loans (1) | 0.15 | (0.01 | ) | — | (0.01 | ) | (0.04 | ) | — | — | (0.01 | ) | |||||||||||||||||||||
NPAs to total assets | 0.40 | — | — | 0.11 | 0.12 | 0.12 | 0.13 | 0.14 | |||||||||||||||||||||||||
AVERAGE BALANCES | |||||||||||||||||||||||||||||||||
Loans | $ | 1,583,280 | $ | 1,052,745 | $ | 1,062,736 | $ | 1,040,638 | $ | 1,012,309 | $ | 968,023 | $ | 870,771 | $ | 822,047 | |||||||||||||||||
Investment securities | 255,312 | 134,016 | 139,707 | 134,638 | 131,769 | 146,575 | 147,837 | 148,882 | |||||||||||||||||||||||||
Total assets | 2,248,614 | 1,349,997 | 1,379,150 | 1,346,437 | 1,311,506 | 1,256,830 | 1,200,128 | 1,137,688 | |||||||||||||||||||||||||
Deposits | 1,886,292 | 1,101,434 | 1,113,333 | 1,085,749 | 1,067,831 | 968,944 | 952,229 | 944,903 | |||||||||||||||||||||||||
Shareholders’ equity | 246,842 | 146,430 | 145,210 | 141,930 | 139,220 | 136,736 | 134,650 | 132,050 | |||||||||||||||||||||||||
Number of common shares - basic | 20,494,895 | 13,562,125 | 13,552,820 | 13,465,579 | 13,453,820 | 13,456,246 | 13,453,569 | 13,416,319 | |||||||||||||||||||||||||
Number of common shares - diluted | 21,004,577 | 13,904,395 | 13,895,090 | 13,798,344 | 13,650,580 | 13,656,574 | 13,653,897 | 13,620,127 | |||||||||||||||||||||||||
(1) Annualized. | |||||||||||||||||||||||||||||||||
29
ITEM 7. | MANAGEMENT’S DISCUSSION AND ANALYSIS OF FINANCIAL CONDITION AND RESULTS OF OPERATIONS |
Management’s discussion and analysis of earnings and related financial data is presented to assist in understanding the financial condition and results of operations of Atlantic Capital Bancshares, Inc. and its subsidiaries. This discussion and analysis should be read in conjunction with the audited consolidated financial statements and related notes included in this annual report on Form 10-K. Intercompany accounts and transactions have been eliminated. Although certain amounts for prior years have been reclassified to conform to statement presentations for 2015, the reclassifications have no material effect on shareholders’ equity or net income as previously reported. Unless otherwise noted, for purposes of this section, “Atlantic Capital” refers to the consolidated financial position and consolidated results of operations for Atlantic Capital Bancshares, Inc.
EXECUTIVE OVERVIEW AND EARNINGS SUMMARY
On October 31, 2015, Atlantic Capital completed the acquisition of First Security and its wholly-owned bank subsidiary FSGBank. The acquired entity’s results are included in Atlantic Capital’s consolidated results beginning on October 31, 2015, the acquisition date.
Atlantic Capital reported a net loss of $1.3 million for the year ended December 31, 2015. This compared to net income of $7.5 million for the year ended December 31, 2014. Diluted loss per common share was $.09 for 2015, compared to diluted income per common share of $.55 for 2014.
The decrease in net income for the twelve months ended December 31, 2015, compared to the same period in 2014, was primarily the result of a $7.8 million increase in the provision for loan losses for the acquired First Security loan portfolio and a $9.2 million increase in expenses related to the merger with First Security. Salary expense also increased by $5.5 million for 2015 compared to the prior year. These expenses were offset by an $11.0 million increase in net interest income and a $4.1 million increase in noninterest income, primarily resulting from the merger with First Security.
Net income for 2013 was $5.1 million, or $.38 per diluted common share. The $2.4 million increase from 2013 to 2014 was primarily due to a $4.2 million increase in net interest income, as well as a $2.2 million increase in SBA lending activities. This was offset by an increase of $1.7 million in noninterest expense.
Net interest income was $44.0 million for the year ended December 31, 2015, compared to $33.1 million for 2014. Net interest margin increased from 2.85% for the twelve months ended December 31, 2014 to 2.98% for the same period in 2015. The increase in the margin was primarily due to the addition of the First Security loan portfolio.
Net interest income increased $4.2 million, or 14.4%, from $28.9 million in 2013 to $33.1 million in 2014. The yield on interest-earning assets increased by six basis points from 3.09% in 2013 to 3.15% in 2014. The higher net interest margin in 2014 was primarily due to higher loan balances and slightly lower deposit costs.
Provision for loan losses for the twelve months ended December 31, 2015 totaled $8.0 million, an increase of $7.5 million from the twelve months ended December 31, 2014. The increase in the provision was primarily due to loan growth, both organic and through the acquisition of First Security. Provision expense increased by $242,000 from $246,000 in 2013 to $488,000 in 2014. The net charge-off ratio improved from .02% in 2013 to (.01)% (net recovery) in 2014 representing a $285,000 decline in net charge-offs.
Noninterest income increased $4.1 million, or 74.9%, to $9.4 million from the twelve months ended December 31, 2014. The increase was primarily due a $1.4 million increase in service charges due to the addition of First Security well as a $1.1 million non-recurring BOLI gain. Two new lines of business resulting from the merger - mortgage banking and trust - contributed $163,000 and $192,000, respectively, during 2015. Noninterest income increased by $1.4 million from $3.9 million in 2013 to $5.3 million in 2014. The most significant components of the increase were a $2.2 million increase in SBA lending activities partially offset by a $500,000 decrease in gains on sales of other assets.
For the year ended December 31, 2015, noninterest expense increased $19.4 million, or 72.8%, compared to the same period of 2014. The increase in expenses was primarily due to the addition of First Security and $9.2 million in merger related charges, which included professional fees, severance, and other expenses required to close the acquisition. Noninterest expense totaled $26.6 million for the twelve months ended December 31, 2014, compared to $24.9 million for the same period of 2013, an increase of $1.7 million, or 6.8%. The most significant component of the increase was a $1.3 million, or 7.4%, increase in salaries and employee benefits.
The audited net income for the twelve months ending December 31, 2015 includes previously unrecorded adjustments that resulted in a decrease in net income of $495,000 from net income previously reported by the Company. These adjustments were primarily the result of a decrease in the provision for loan losses of $248,000 and an increase in merger related expenses of $857,000.
30
The audited balance sheet at December 31, 2015 includes previously unrecorded adjustments associated with the accounting for the pending sale of the seven First Security branches and other balance sheet fair value adjustments. The total adjustments to the previously reported balances resulted in an increase in goodwill and intangible assets of $4.2 million along with a decrease in deposits of $2.8 million and an increase in deposits to be assumed in branch sales of $6.5 million. The branch sales are expected to close during the second quarter of 2016 and will result in a gain from the deposit premium received and a write off of the intangibles associated with the branches.
CRITICAL ACCOUNTING POLICIES
The accounting and reporting policies of Atlantic Capital are in accordance with GAAP and conform to general practices within the banking industry. Atlantic Capital’s financial position and results of operations are affected by management’s application of accounting policies, including judgments made to arrive at the carrying value of assets and liabilities and amounts reported for revenues, expenses and related disclosures. Different assumptions in the application of these policies could result in material changes in Atlantic Capital’s consolidated financial position and/or consolidated results of operations. The more critical accounting and reporting policies include Atlantic Capital’s accounting for the allowance for loan losses, fair value measurements, and income tax related items. Significant accounting policies are discussed in Note 1 of the consolidated financial statements.
The following is a summary of Atlantic Capital’s critical accounting policies that are material to the consolidated financial statements and are highly dependent on estimates and assumptions.
Allowance for loan losses.
The allowance for loan losses (ALL) is management’s estimate of probable credit losses inherent in Atlantic Capital’s loan portfolio at the balance sheet date. Atlantic Capital determines the allowance for loan losses based on an ongoing estimation process. This estimation process is inherently subjective, as it requires material estimates, including the amounts and timing of cash flows expected to be received on impaired loans and losses incurred as of the balance sheet date in Atlantic Capital’s loan portfolio. Those estimates may be susceptible to significant change. Increases to the allowance for loan losses are made by charges to the provision for loan losses. Loans deemed to be uncollectible are charged against the allowance for loan losses. Recoveries of previously charged-off amounts are credited to the allowance for loan losses.
The allowance is the accumulation of various components that are calculated based on an independent estimation process. All components of the allowance for loan losses represent estimates based on data that management believes are most reflective of the underlying credit losses being estimated. This evaluation includes credit quality trends, peer analysis, recent loan loss experience, collateral type, loan volumes, seasoning of the loan portfolio, economic conditions, and the findings of internal credit quality assessments and results from external bank regulatory examinations.
While management uses the best information available to establish the allowance for loan losses, future adjustments may become necessary if conditions differ substantially from the assumptions used in making the estimates. In addition, regulatory examiners may require adjustments to the allowance for loan losses based on their judgments about information available to them at the time of their examination. Such adjustments to original estimates, as necessary, are made and reflected in the financial results in the period in which these factors and other relevant considerations indicate that loss levels may vary from previous estimates.
Management continuously monitors and actively manages the credit quality of the entire loan portfolio and recognizes provision expense to maintain the allowance at an appropriate level. Specific allowances for impaired loans are determined by analyzing estimated cash flows discounted at a loan’s original rate or collateral values in situations where Atlantic Capital believes repayment is dependent on collateral liquidation.
Management considers the established ALL adequate to absorb losses that relate to loans outstanding at December 31, 2015, although future additions may be necessary based on changes in economic conditions, collateral values, erosion of the borrower’s access to liquidity and other factors. If the financial condition of borrowers were to deteriorate, resulting in an impairment of their ability to make payments, Atlantic Capital’s estimates would be updated and additions to the ALL may be required.
Fair value measurements.
Atlantic Capital’s impaired loans and foreclosed assets may be measured and carried at fair value, the determination of which requires management to make assumptions, estimates and judgments. See Note 18 “Fair Value Measurements” in the consolidated financial statements for additional disclosures regarding the fair value of our assets and liabilities.
31
When a loan is considered individually impaired, a specific valuation allowance is allocated, if necessary, so that the loan is reported net, at the present value of estimated future cash flows using the loan’s existing rate or at the fair value of collateral if repayment is expected solely from the collateral. In addition, foreclosed assets are carried at the lower of cost, fair value, less cost to sell, or listed selling price less cost to sell, following foreclosure. Fair value is defined by GAAP as “the price that would be received to sell an asset in an orderly transaction between market participants at the measurement date.” GAAP further defines an “orderly transaction” as “a transaction that assumes exposure to the market for a period prior to the measurement date to allow for marketing activities that are usual and customary for transactions involving such assets. It is not a forced transaction (for example, a forced liquidation or distress sale).” Although management believes its processes for determining the value of impaired loans and foreclosed properties are appropriate and allow Atlantic Capital to arrive at a fair value, the processes require management judgment and assumptions and the value of such assets at the time they are revalued or divested may be significantly different from management’s determination of fair value. In addition, because of subjectivity in fair value determinations, there may be grounds for differences in opinions, which may result in disagreements between management and Atlantic Capital Bank’s regulators, disagreements which could cause Atlantic Capital Bank to change its judgments about fair value.
The fair values for available-for-sale securities are generally based upon quoted market prices or observable market prices for similar instruments. Atlantic Capital utilizes a third-party pricing service to assist with determining the fair value of its securities portfolio. The pricing service uses observable inputs when available including benchmark yields, reported trades, broker-dealer quotes, issuer spreads, benchmark securities, bids and offers. These values take into account recent market activity as well as other market observable data such as interest rate, spread and prepayment information. When market observable data is not available, which generally occurs due to the lack of liquidity for certain securities, the valuation of the security is subjective and may involve substantial judgment by management. Atlantic Capital periodically reviews available-for-sale securities that are in an unrealized loss position to determine whether other-than-temporary impairment exists. An unrealized loss exists when the current fair value of an individual security is less than its amortized cost-basis. The primary factors Atlantic Capital considers in determining whether impairment is other-than-temporary are long term expectations and recent experience regarding principal and interest payments, and Atlantic Capital’s ability and intent to hold the security until the amortized cost basis is recovered.
Atlantic Capital uses derivatives primarily to manage interest rate risk. The fair values of derivative financial instruments are determined based on quoted market prices, dealer quotes and pricing models that are primarily sensitive to market observable data.
Income taxes.
Atlantic Capital recognizes deferred tax assets and liabilities for the expected future tax consequences of temporary differences between the carrying amounts and tax bases of assets and liabilities. Deferred tax assets and liabilities are measured using enacted tax rates expected to apply to taxable income in the years in which those temporary differences are expected to be realized or settled. In assessing the realizability of deferred tax assets, management considers whether it is more likely than not that some portion or all of the deferred tax assets will be realized. The realization of deferred tax assets is dependent upon the generation of future taxable income during the periods in which those temporary differences become deductible. Management considers the scheduled reversal of deferred tax liabilities, projected future taxable income, and tax planning strategies by jurisdiction and entity in making this assessment.
Regulatory risk-based capital rules limit the amount of deferred tax assets that a bank or bank holding company can include in Tier 1 capital. Generally, deferred tax assets that arise from net operating loss and tax credit carryforwards, net of any related valuation allowances and net of deferred tax liabilities, are excluded from CET1 and Tier 1 capital. Deferred tax assets arising from temporary differences that could not be realized through net operating loss carrybacks, net of related valuation allowances and net of deferred tax liabilities, that exceed certain thresholds are excluded from CET1 and Tier 1 capital.
RESULTS OF OPERATIONS
Net Interest Income and Net Interest Margin
Net interest income for 2015 totaled $44.0 million, a $10.9 million, or 33%, increase from 2014. This increase was primarily driven by a $12.4 million, or 34.0%, increase in interest income. The interest income increase primarily resulted from the following:
• | an $11.8 million, or 36.0%, increase to $44.6 million in interest income on loans, resulting from a $273.1 million, or 29.7% higher average balance, due primarily to the addition of the First Security loan portfolio as well as organic loan growth; |
• | a $353,000, increase to $664,000 in interest income on other short-term investments, resulting from a $13.5 million, or 36.6% higher average balance, as well as a 48 basis point increase in the yield earned; and |
32
• | net accretion income on acquired loans totaling $625,000. |
Further contributing to the overall increase in interest income was a $192,000 increase in interest income on investment securities. The increase resulted from a $22.1 million increase in the average balance of securities offset by a 17 basis point decline in the yield.
Interest expense for the twelve months ended December 31, 2015 totaled $4.9 million, a $1.5 million or 42.7% increase from the same period of 2014. The rate paid on interest bearing liabilities increased 5 basis points from 2014 to 2015, driven by an increase in the balance of long-term debt, which was zero in 2014. In addition, premium amortization on acquired time deposits totaled $181,000.
Net interest margin increased to 2.98% from 2.85% for the year ended December 31, 2015 compared to the year ended December 31, 2014. Net interest margin increased to 2.85% compared to 2.75% for the twelve months ended December 31, 2014 compared to the same period in 2013.
The primary reasons for the increase in net interest margin for 2015 compared to 2014, were the increase in loan volume and the higher yield earned on the First Security loan portfolio. Net accretion income on acquired loans also contributed to the increase.
Overall funding costs remained relatively stable from 2014 to 2015, although the long-term debt issued in September of 2015 added a relatively high cost funding source to the balance sheet.
Net interest income increased $4.2 million, or 14% from $28.9 million in 2013 to $33.1 million in 2014. Net interest margin was 2.85% in 2014 compared to 2.75% in 2013, due to higher loan balances and slightly lower deposit costs.
The following table presents information regarding average balances for assets and liabilities, the total dollar amounts of interest income and dividends from average interest-earning assets, the total dollar amounts of interest expense on average interest-bearing liabilities, and the resulting average yields and costs. The yields and costs for the periods indicated are derived by dividing the income or expense by the average balances for assets or liabilities, respectively, for the periods presented. Loan fees are included in interest income on loans.
33
Table 1 - Average Balance Sheets and Net Interest Analysis | |||||||||||||||||||||||||||||||||
(Dollars in thousands) | |||||||||||||||||||||||||||||||||
Twelve months ended December 31, | |||||||||||||||||||||||||||||||||
2015 | 2014 | 2013 | |||||||||||||||||||||||||||||||
Average Balance | Interest Income/Expense | Yield/Rate | Average Balance | Interest Income/Expense | Yield/Rate | Average Balance | Interest Income/Expense | Yield/Rate | |||||||||||||||||||||||||
Assets | |||||||||||||||||||||||||||||||||
Deposits in other banks | $ | 63,785 | $ | 251 | 0.39 | % | $ | 56,328 | $ | 214 | 0.38 | % | $ | 76,192 | $ | 276 | 0.36 | % | |||||||||||||||
Other short-term investments | 50,322 | 664 | 1.32 | % | 36,828 | 311 | 0.84 | % | 33,239 | — | 0.89 | % | |||||||||||||||||||||
Investment securities: | |||||||||||||||||||||||||||||||||
Taxable investment securities | 161,597 | 3,179 | 1.97 | % | 141,627 | 3,035 | 2.14 | % | 145,768 | 3 | 1.96 | % | |||||||||||||||||||||
Non-taxable investment securities | 4,199 | 122 | 2.91 | % | 2,100 | 74 | 3.54 | % | 1,555 | — | 3.47 | % | |||||||||||||||||||||
Total investment securities | 165,796 | 3,301 | 1.99 | % | 143,727 | 3,109 | 2.16 | % | 147,323 | 3 | 1.98 | % | |||||||||||||||||||||
Total loans | 1,192,103 | 44,561 | 3.74 | % | 918,959 | 32,762 | 3.57 | % | 793,505 | 28,971 | 3.65 | % | |||||||||||||||||||||
FHLB stock | 4,338 | 189 | 4.36 | % | 3,917 | 146 | 3.74 | % | 3,082 | 77 | 2.49 | % | |||||||||||||||||||||
Total interest-earning assets | 1,476,344 | 48,966 | 3.32 | % | 1,159,759 | 36,542 | 3.15 | % | 1,053,341 | 32,537 | 3.09 | % | |||||||||||||||||||||
Non-earning assets | 105,343 | 67,471 | 65,186 | ||||||||||||||||||||||||||||||
Total assets | $ | 1,581,687 | $ | 1,227,230 | $ | 1,118,527 | |||||||||||||||||||||||||||
Liabilities | |||||||||||||||||||||||||||||||||
Interest bearing deposits: | |||||||||||||||||||||||||||||||||
NOW, money market, and savings | 745,777 | 2,839 | 0.38 | % | 605,014 | 2,376 | 0.39 | % | 645,689 | 2,675 | 0.41 | % | |||||||||||||||||||||
Time deposits | 58,133 | 150 | 0.26 | % | 16,322 | 69 | 0.42 | % | 18,214 | 90 | 0.50 | % | |||||||||||||||||||||
Internet and brokered deposits | 140,416 | 628 | 0.45 | % | 107,575 | 444 | 0.41 | % | 77,219 | 351 | 0.45 | % | |||||||||||||||||||||
Total interest-bearing deposits | 944,326 | 3,617 | 0.38 | % | 728,911 | 2,889 | 0.40 | % | 741,122 | 3,116 | 0.42 | % | |||||||||||||||||||||
Total borrowings | 84,196 | 447 | 0.53 | % | 100,326 | 560 | 0.56 | % | 46,144 | 499 | 1.08 | % | |||||||||||||||||||||
Total long-term debt | 12,805 | 858 | 6.70 | % | — | — | — | % | — | — | — | % | |||||||||||||||||||||
Total interest-bearing liabilities | 1,041,327 | 4,922 | 0.47 | % | 829,237 | 3,449 | 0.42 | % | 787,266 | 4 | 0.46 | % | |||||||||||||||||||||
Demand deposits | 352,437 | 254,861 | 194,347 | ||||||||||||||||||||||||||||||
Other liabilities | 17,248 | 7,445 | 7,061 | ||||||||||||||||||||||||||||||
Shareholders' equity | 170,675 | 135,687 | 129,853 | ||||||||||||||||||||||||||||||
Total liabilities and shareholders' equity | $ | 1,581,687 | $ | 1,227,230 | $ | 1,118,527 | |||||||||||||||||||||||||||
Net interest spread | 2.85 | % | 2.73 | % | 2.63 | % | |||||||||||||||||||||||||||
Net interest income and net interest margin(1) | $ | 44,044 | 2.98 | % | $ | 33,093 | 2.85 | % | $ | 28,922 | 2.75 | % | |||||||||||||||||||||
(1) Net interest income divided by total interest-earning assets using the appropriate day count convention based on the type of interest-earning asset. | |||||||||||||||||||||||||||||||||
34
The following table shows the relative effect on net interest income for changes in the average outstanding amounts (volume) of interest-earning assets and interest-bearing liabilities and the rates earned and paid on such assets and liabilities (rate). Variances resulting from a combination of changes in rate and volume are allocated in proportion to the absolute dollar amounts of the change in each category.
Table 2 - Changes in Net Interest Income | ||||||||||||||||||||||||
(Dollars in thousands) | ||||||||||||||||||||||||
2015 Compared to 2014 Increase (decrease) Due to Changes in: | 2014 Compared to 2013 Increase (decrease) Due to Changes in: | |||||||||||||||||||||||
Volume | Yield/Rate | Total Change | Volume | Yield/Rate | Total Change | |||||||||||||||||||
Interest earning assets | ||||||||||||||||||||||||
Deposits in other banks | $ | 29 | $ | 8 | $ | 37 | $ | (75 | ) | $ | 14 | $ | (61 | ) | ||||||||||
Other short-term investments | 178 | 175 | 353 | 30 | (16 | ) | 14 | |||||||||||||||||
Investment securities: | ||||||||||||||||||||||||
Taxable investment securities | 393 | (249 | ) | 144 | (78 | ) | 250 | 172 | ||||||||||||||||
Non-taxable investment securities | 61 | (13 | ) | 48 | 19 | 1 | 20 | |||||||||||||||||
Total investment securities | 454 | (262 | ) | 192 | (59 | ) | 251 | 192 | ||||||||||||||||
Total loans | 10,210 | 1,590 | 11,800 | 4,362 | (571 | ) | 3,791 | |||||||||||||||||
FHLB stock | 18 | 25 | 43 | 31 | 38 | 69 | ||||||||||||||||||
Total interest-earning assets | 10,889 | 1,536 | 12,425 | 4,289 | (284 | ) | 4,005 | |||||||||||||||||
Interest bearing liabilities | ||||||||||||||||||||||||
Interest bearing deposits: | ||||||||||||||||||||||||
NOW, money market, and savings | 536 | (73 | ) | 463 | (255 | ) | (44 | ) | (299 | ) | ||||||||||||||
Time deposits | 108 | (27 | ) | 81 | (8 | ) | (14 | ) | (22 | ) | ||||||||||||||
Internet and brokered deposits | 147 | 37 | 184 | 141 | (48 | ) | 93 | |||||||||||||||||
Total interest-bearing deposits | 791 | (63 | ) | 728 | (122 | ) | (106 | ) | (228 | ) | ||||||||||||||
Total borrowings | (86 | ) | (27 | ) | (113 | ) | 271 | (209 | ) | 62 | ||||||||||||||
Total long-term debt | 858 | — | 858 | — | — | — | ||||||||||||||||||
Total interest-bearing liabilities | 1,563 | (90 | ) | 1,473 | 149 | (315 | ) | (166 | ) | |||||||||||||||
Change in net interest income | $ | 9,326 | $ | 1,626 | $ | 10,952 | $ | 4,140 | $ | 31 | $ | 4,171 | ||||||||||||
Provision for Loan Losses
Management considers a number of factors in determining the required level of the allowance for loan losses and the provision required to achieve what is believed to be appropriate reserve level, including historical loss experience, loan growth, credit risk rating trends, nonperforming loan levels, delinquencies, loan portfolio concentrations and economic and market trends. The provision for loan losses represents management’s determination of the amount necessary to be charged against the current period’s earnings to maintain the allowance for loan losses at a level that it considered adequate in relation to the estimated losses inherent in the loan portfolio.
The provision for credit losses was $8.0 million in 2015, compared with $488,000 in 2014, and $246,000 in 2013. In accordance with the accounting guidance for business combinations, there was no allowance for loan losses brought forward on loans acquired from First Security on October 31, 2015. At December 31, 2015, Atlantic Capital included the performing non-impaired loans acquired from First Security in its general allowance calculation in order to reflect the necessary allowance for incurred losses, which accounted for a majority of the increase in the provision expense.
At December 31, 2015, nonperforming loans totaled $8.5 million compared to no nonperforming loans as of December 31, 2014. The increase was attributable to the addition of First Security’s nonperforming loans, which totaled $777,000, as well as the addition of two legacy Atlantic Capital loan relationships totaling approximately $7.7 million. Net loan charge-offs were 0.05%, (0.01)% and 0.02%, respectively, of average loans (annualized) for the twelve months ended December 31, 2015, 2014, and 2013, respectively. The allowance for loan losses to total loans at December 31, 2015 was 1.06%, compared to 1.10% at December 31, 2014.
35
Noninterest Income
Noninterest income was $9.4 million in 2015, compared with $5.3 million in 2014, and $3.9 million in 2013. The following table presents the components of noninterest income.
Table 3 - Noninterest Income | ||||||||||||||||
(Dollars in thousands) | ||||||||||||||||
Twelve months ended December 31, | Change | |||||||||||||||
2015 | 2014 | 2013 | 2015-2014 | |||||||||||||
Service charges | $ | 2,613 | $ | 1,170 | $ | 935 | 1,443 | |||||||||
Securities gains, net | 10 | 59 | 167 | (49 | ) | |||||||||||
Gains on sale of other assets | 189 | — | 500 | 189 | ||||||||||||
Mortgage income | 163 | — | — | 163 | ||||||||||||
Trust income | 192 | — | — | 192 | ||||||||||||
Derivatives income | 304 | 245 | 541 | 59 | ||||||||||||
Bank owned life insurance | 2,159 | 932 | 833 | 1,227 | ||||||||||||
SBA lending activities | 2,910 | 2,264 | 44 | 646 | ||||||||||||
Other noninterest income | 859 | 672 | 855 | 187 | ||||||||||||
Total noninterest income | $ | 9,399 | $ | 5,342 | $ | 3,875 | $ | 4,057 | ||||||||
Service charges of $2.6 million were up $1.4 million from 2014. The increase was primarily due to the addition of First Security deposits as well as an increase in foreign exchange income of $276,000. Mortgage income and trust income were up from 2014 due to these new lines of business acquired from First Security. Bank owned life insurance of $2.2 million was up $1.2 million from the twelve months ended December 31, 2015 to 2014, due to a $1.4 million non-recurring gain.
In addition, SBA lending activities increased $646,000, or 28.5%, compared to 2014, due to a higher level of loan sales. During the 2015 and 2014, guaranteed portions of 42 and 19 SBA loans with principal balances of $52.3 million and $39.0 million, respectively, were sold in the secondary market.
For 2014, noninterest income totaled $5.3 million, compared to $3.9 million for 2013, a $1.4 million, or 37.9%, increase. The most significant components of the increase were a $2.2 million increase in SBA lending activities as well as a $235,000 increase in service charges from the previous year. As the new SBA lending team gained momentum in 2014, the Company sold 19 SBA loans compared to two loans in 2013. These increases in noninterest income were offset by a $296,000, or 54.7%, decrease in derivatives income and a $500,000 decrease in gains on sales of other assets.
Noninterest Expense
The following table presents the components of noninterest expense.
Table 4 - Noninterest Expense | ||||||||||||||||
(Dollars in thousands) | ||||||||||||||||
Twelve months ended December 31, | Change | |||||||||||||||
2015 | 2014 | 2013 | 2015-2014 | |||||||||||||
Salaries and employee benefits | $ | 24,098 | $ | 18,608 | $ | 17,318 | $ | 5,490 | ||||||||
Occupancy | 2,170 | 1,721 | 1,597 | 449 | ||||||||||||
Equipment and software | 1,295 | 921 | 830 | 374 | ||||||||||||
Professional services | 1,610 | 1,055 | 860 | 555 | ||||||||||||
Postage, printing and supplies | 178 | 91 | 98 | 87 | ||||||||||||
Communications and data processing | 1,541 | 1,253 | 1,131 | 288 | ||||||||||||
Marketing and business development | 410 | 323 | 384 | 87 | ||||||||||||
FDIC premiums | 789 | 643 | 589 | 146 | ||||||||||||
Merger expense and conversion costs | 9,154 | — | — | 9,154 | ||||||||||||
Other noninterest expense | 4,688 | 1,959 | 2,086 | 2,729 | ||||||||||||
Total noninterest expense | $ | 45,933 | $ | 26,574 | $ | 24,893 | $ | 19,359 | ||||||||
36
Noninterest expenses were $45.9 million in 2015 as compared to $26.6 million in 2014, and $24.9 million in 2013. The increase from 2014 to 2015 mostly reflects the inclusion of the expenses of First Security from its acquisition date, higher salaries and employee benefits expense resulting from strategic hiring. Merger and conversion costs totaled $9.2 million for the twelve months ended December 31, 2015 and included professional fees, severance and data conversion fees. We expect merger-related charges to decrease in future periods following completing the integration of First Security operations with Atlantic Capital and settlement of certain litigation related to the acquisition.
Salaries and employee benefits expense for 2015 was $24.1 million, an increase of $5.5 million, or 29.5%, from 2014. The increase was due to a number of factors including investments in new talent in key areas as well as additional staff resulting from the First Security acquisition. Full time equivalent headcount totaled 359 at December 31, 2015 compared to 107 at December 31, 2014, an increase of 252 full time equivalent positions, mainly from the First Security acquisition.
Occupancy expense of $2.2 million for 2015 was up $449,000, or 26.1%, compared to 2014, primarily due to an increase in locations due to the acquisition.
Other noninterest expense increased $2.7 million, or 139.3%, compared to the twelve months ended December 31, 2014, primarily due to the addition of First Security expenses, including acquisition intangibles amortization, as well as a $205,000 increase in mortgage warehouse servicing fees resulting from the increase in average mortgage warehouse volume during 2015. In addition, Atlantic Capital recognized $187,000 in reimbursements and settlements related to recovered loan collection costs in 2014, which reduced other noninterest expense in 2014.
Noninterest expense totaled $26.6 million for 2014, a $1.7 million or 6.8% increase from $24.9 million in 2013. The most significant components of the increase were a $1.3 million increase in salaries and employee benefits, and a $195,000 increase in professional services. Salaries and employee benefits increased due to higher average headcount in 2014 as well as increased incentives. Professional fees increased due to higher legal and consulting fees associated with strategic projects.
Income Taxes
Atlantic Capital monitors and evaluates the potential impact of current events on the estimates used to establish income tax expenses and income tax liabilities. On a periodic basis, Atlantic Capital evaluates its income tax positions based on current tax law and positions taken by various tax auditors within the jurisdictions where Atlantic Capital is required to file income tax returns.
Income tax expense was $794,000 in 2015, compared to income tax expense of $3.9 million in 2014 and $2.5 million in 2013. The effective tax rate (as a percentage of pre-tax earnings) for 2015, 2014, and 2013 was (151.3)%, 33.9% and 32.8%, respectively. The change in the effective tax rate for 2015 resulted from the impact of a pre-tax loss as well as an increase in nondeductible merger expenses and certain nondeductible severance costs.
Deferred tax assets and liabilities are recognized for the future tax consequences attributable to differences between the financial statement carrying amounts and their respective tax basis including operating losses and tax credit carryforwards. Net deferred tax assets (deferred tax assets net of deferred tax liabilities and valuation allowance) are reported in the consolidated balance sheet as a component of total assets.
Accounting Standards Codification Topic 740, Income Taxes, requires that companies assess whether a valuation allowance should be established against their deferred tax assets based on the consideration of all available evidence using a “more likely than not” standard. The determination of whether a valuation allowance for deferred tax assets is appropriate is subject to considerable judgment and requires an evaluation of all positive and negative evidence with more weight given to evidence that can be objectively verified. Each quarter, management considers both positive and negative evidence and analyzes changes in near-term market conditions as well as other factors which may impact future operating results.
Based on all evidence considered, as of December 31, 2015 and 2014, management concluded that it was more likely than not that the net deferred tax asset would be realized, except as outlined in the following discussion. At December 31, 2015, Atlantic Capital recorded a deferred tax asset valuation allowance totaling $9.5 million due to the fact that certain tax attributes are subject to an annual limitation as a result of our acquisition of First Security, which constitutes a change of ownership as defined under Internal Revenue Code Section 382.
Management expects to generate higher levels of future taxable income and believes this will allow for full utilization of Atlantic Capital’s net operating loss carryforwards within the statutory carryforward periods.
Additional information regarding income taxes, including a reconciliation of the differences between the recorded income tax provision and the amount of income tax computed by applying the statutory federal income tax rate to income before income taxes, can be found in Note 14 to the consolidated financial statements.
37
FINANCIAL CONDITION
Total assets at December 31, 2015 and December 31, 2014 were $2.6 billion and $1.3 billion, respectively. Average total assets for 2015 were $1.6 billion, compared to $1.2 billion for 2014. The balances acquired from First Security were included in Atlantic Capital’s average balances subsequent to the acquisition date.
Loans
At December 31, 2015, total loans increased $749.6 million, or 71.9%, compared to December 31, 2014, primarily due to the addition of the First Security portfolio. Offsetting this increase was a $32.5 million decrease in mortgage warehouse loans year over year. Details of loans at December 31, 2015, 2014, 2013, 2012, and 2011 are provided in Table 5.
Table 5 - Loans | ||||||||||||||||||||
(dollars in thousands) | ||||||||||||||||||||
December 31, | ||||||||||||||||||||
2015 | 2014 | 2013 | 2012 | 2011 | ||||||||||||||||
Loans held for sale | ||||||||||||||||||||
TriNet loans held for sale | $ | 58,934 | $ | — | $ | — | $ | — | $ | — | ||||||||||
Branch loans held for sale | 35,470 | — | — | — | — | |||||||||||||||
Other loans held for sale | 1,061 | — | — | 64,353 | — | |||||||||||||||
Total loans held for sale | $ | 95,465 | $ | — | $ | — | $ | 64,353 | $ | — | ||||||||||
Loans held for investment | ||||||||||||||||||||
Commercial loans: | ||||||||||||||||||||
Commercial and industrial | $ | 467,083 | $ | 365,447 | $ | 329,651 | $ | 272,373 | $ | 241,301 | ||||||||||
Commercial real estate: | ||||||||||||||||||||
Owner occupied | 320,656 | 193,892 | 188,956 | 156,634 | 144,302 | |||||||||||||||
Non-owner occupied | 525,757 | 245,179 | 207,627 | 236,278 | 238,609 | |||||||||||||||
Construction and land | 166,358 | 82,567 | 49,101 | 39,773 | 34,690 | |||||||||||||||
Mortgage warehouse loans | 84,350 | 116,939 | 8,026 | — | — | |||||||||||||||
Total commercial loans | 1,564,204 | 1,004,024 | 783,361 | 705,058 | 658,902 | |||||||||||||||
Residential: | ||||||||||||||||||||
Residential mortgages | 110,381 | 1,320 | — | 2,575 | 2,778 | |||||||||||||||
Home equity | 80,738 | 28,464 | 27,006 | 32,209 | 33,785 | |||||||||||||||
Total residential loans | 191,119 | 29,784 | 27,006 | 34,784 | 36,563 | |||||||||||||||
Consumer | 30,451 | 9,290 | 8,719 | 8,931 | 7,372 | |||||||||||||||
Other | 6,901 | — | — | — | — | |||||||||||||||
1,792,675 | 1,043,098 | 819,086 | 748,773 | 702,837 | ||||||||||||||||
Less net deferred fees and other unearned income | (2,006 | ) | (3,385 | ) | (2,084 | ) | (2,381 | ) | (2,275 | ) | ||||||||||
Less allowance for loan losses | (18,905 | ) | (11,421 | ) | (10,815 | ) | (10,736 | ) | (9,731 | ) | ||||||||||
Loans held for investment, net | $ | 1,771,764 | $ | 1,028,292 | $ | 806,187 | $ | 735,656 | $ | 690,831 | ||||||||||
The following table sets forth the maturity distribution of loans, including the interest rate sensitivity for loans maturing after one year.
38
Table 6 - Loan Maturity Distribution and Interest Rate Sensitivity | ||||||||||||||||
(Dollars in thousands) | ||||||||||||||||
Within | One to | After | Total | |||||||||||||
One Year | Five Years | Five Years | ||||||||||||||
Loans: | ||||||||||||||||
Commercial and industrial | $ | 175,585 | $ | 227,068 | $ | 64,430 | $ | 467,083 | ||||||||
Commercial real estate | 105,462 | 293,759 | 447,192 | 846,413 | ||||||||||||
Construction and land | 59,164 | 95,802 | 11,392 | 166,358 | ||||||||||||
Mortgage warehouse loans | 84,350 | — | — | 84,350 | ||||||||||||
Residential mortgages | 9,351 | 42,360 | 58,670 | 110,381 | ||||||||||||
Home equity | 12,009 | 44,938 | 23,791 | 80,738 | ||||||||||||
Consumer | 8,276 | 14,260 | 7,915 | 30,451 | ||||||||||||
Other | 4,227 | 1,471 | 1,203 | 6,901 | ||||||||||||
Total loans | $ | 458,424 | $ | 719,658 | $ | 614,593 | $ | 1,792,675 | ||||||||
Loans maturing after one year with: | ||||||||||||||||
Fixed interest rates | 260,387 | 322,737 | 583,124 | |||||||||||||
Floating or adjustable rates | 459,271 | 291,856 | 751,127 | |||||||||||||
Total loans | $ | 719,658 | $ | 614,593 | $ | 1,334,251 | ||||||||||
Nonperforming Assets
Nonperforming assets include nonaccrual loans, accruing loans past due 90 days or more, and other real estate owned. Loans are considered to be past due when payment is not received from the borrower by the contractually specified due date. Interest accruals on loans are discontinued when interest or principal has been in default 90 days or more, unless the loan is secured by collateral that is sufficient to repay the debt in full and the loan is in the process of collection. When a loan is placed on nonaccrual status, interest accrued and not paid in the current accounting period is reversed against current period income. Interest accrued and not paid in prior periods, if significant, is reversed against the allowance for loan losses.
Income on such loans is subsequently recognized on a cash basis as long as the future collection of principal is deemed probable or after all principal payments are received. Commercial loans are placed back on accrual status after sustained performance of timely and current principal and interest payments and it is probable that all remaining amounts due, both principal and interest, are fully collectible according to the terms of the loan agreement. Residential loans and consumer loans are generally placed back on accrual status when they are no longer past due.
At December 31, 2015, Atlantic Capital’s nonperforming assets amounted to $10.5 million, or 0.40% of assets, compared to $1.5 million, or 0.12% of assets, at December 31, 2014. The increase was primarily due to two loan relationships totaling $7.7 million as well as the addition of First Security nonperforming assets.
Nonaccrual loans totaled $7.8 million at December 31, 2015. There were no loans classified as nonaccrual at December 31, 2014. The gross additional interest revenue that would have been earned if the loans classified as nonaccrual had performed in accordance with the original terms in 2015, 2014, and 2013 is immaterial. Table 7 provides details on nonperforming assets and other risk elements at December 31, 2015, 2014, 2013, 2012, and 2011.
39
Table 7 - Nonperforming assets | |||||||||||||||||||||
(Dollars in thousands) | |||||||||||||||||||||
December 31, | |||||||||||||||||||||
2015 | 2014 | 2013 | 2012 | 2011 | |||||||||||||||||
Nonaccrual loans* | $ | 7,772 | $ | — | $ | 2,954 | $ | 3,668 | $ | 5,500 | |||||||||||
Loans past due 90 days and still accruing | 777 | — | — | — | — | ||||||||||||||||
Total nonperforming loans (NPLs) | 8,549 | — | 2,954 | 3,668 | 5,500 | ||||||||||||||||
Other real estate owned | 1,982 | 1,531 | 1,531 | 1,531 | 1,775 | ||||||||||||||||
Total nonperforming assets (NPAs) | $ | 10,531 | $ | 1,531 | $ | 4,485 | $ | 5,199 | $ | 7,275 | |||||||||||
NPLs as a percentage of total loans | 0.45 | % | — | % | 0.36 | % | 0.49 | % | 0.79 | % | |||||||||||
NPAs as a percentage of total assets | 0.40 | 0.12 | 0.36 | 0.43 | 0.71 | ||||||||||||||||
*Nonperforming assets excludes those loans which are purchased credit-impaired loans
Troubled Debt Restructurings
TDRs are selectively made to provide relief to customers experiencing liquidity challenges or other circumstances that could affect their ability to meet their debt obligations. Typical modifications include short-term deferral of interest or modification of payment terms. Nonperforming TDRs are not accruing interest and are included as nonperforming assets within nonaccrual loans. TDRs, which are accruing interest based on the restructured terms, are considered performing. The following table summarizes TDRs:
Table 8 - Troubled Debt Restructurings | ||||||||||||||||||||
(Dollars in thousands) | ||||||||||||||||||||
December 31, | ||||||||||||||||||||
2015 | 2014 | 2013 | 2012 | 2011 | ||||||||||||||||
Accruing TDRs | $ | 4,616 | $ | 6,601 | $ | 6,809 | $ | 1,798 | $ | — | ||||||||||
Nonaccruing TDRs | 4,449 | — | — | — | — | |||||||||||||||
Total TDRs | $ | 9,065 | $ | 6,601 | $ | 6,809 | $ | 1,798 | $ | — | ||||||||||
The gross additional interest income that would have been earned in 2015, 2014, and 2013 had performing TDRs performed in accordance with the original terms is immaterial.
Potential Problem Loans
Management identifies and maintains a list of potential problem loans. These are loans that are internally risk graded special mention or below but which are not included in nonaccrual status and are not past due 90 days or more. A loan is added to the potential problem list when management becomes aware of information about possible credit problems of the borrower which raises serious doubts as to the ability of such borrower to comply with the current loan repayment terms. Potential problem loans totaled $16.8 million and $16.3 million, respectively, as of December 31, 2015 and December 31, 2014. This balance does not include purchase credit impaired loans of $24.3 million which have a remaining purchase discount of $3.8 million. As a number of potential problem loans are real estate secured, management closely tracks the current values of real estate collateral when assessing the collectability of these loans.
Allowance for Loan Losses
At December 31, 2015, the allowance for loan losses totaled $18.9 million, or 1.06% of loans, compared to $11.4 million, or 1.10% of loans, at December 31, 2014. The increase in the allowance primarily related to including First Security’s performing loans in the calculation of the general allowance.
Net charge-offs during 2015 and 2014 were $551,000 and ($118,000), respectively. Table 9 provides details concerning the allowance for loan losses during the past five years.
40
Table 9 - Allowance for Loan Losses (ALL) | ||||||||||||||||||||
(Dollars in thousands) | ||||||||||||||||||||
December 31, | ||||||||||||||||||||
2015 | 2014 | 2013 | 2012 | 2011 | ||||||||||||||||
Allowance for loan losses at beginning of period | $ | 11,421 | $ | 10,815 | $ | 10,736 | $ | 9,731 | $ | 11,929 | ||||||||||
Provision for loan losses | 8,035 | 488 | 246 | (1,322 | ) | 7,144 | ||||||||||||||
Charge-offs: | ||||||||||||||||||||
Commercial and industrial | — | — | 167 | 156 | — | |||||||||||||||
Commercial real estate | 500 | — | — | — | 9,342 | |||||||||||||||
Consumer | 128 | — | — | 85 | — | |||||||||||||||
Total charge-offs | 628 | — | 167 | 241 | 9,342 | |||||||||||||||
Recoveries: | ||||||||||||||||||||
Commercial real estate | — | 81 | — | 2,568 | — | |||||||||||||||
Commercial construction | 29 | 37 | — | — | — | |||||||||||||||
Consumer | 48 | — | — | — | — | |||||||||||||||
Total recoveries | 77 | 118 | — | 2,568 | — | |||||||||||||||
Net charge-offs | 551 | (118 | ) | 167 | (2,327 | ) | 9,342 | |||||||||||||
Allowance for loan losses at end of period | $ | 18,905 | $ | 11,421 | $ | 10,815 | $ | 10,736 | $ | 9,731 | ||||||||||
Average loans | $ | 1,192,103 | $ | 918,959 | $ | 793,505 | $ | 730,129 | $ | 654,603 | ||||||||||
Loans at end of period | 1,790,669 | 1,039,713 | 817,002 | 746,392 | 700,562 | |||||||||||||||
Ratios | ||||||||||||||||||||
Net charge-offs to average loans | 0.05 | % | (0.01 | ) | % | 0.02 | % | (0.32 | ) | % | 1.43 | % | ||||||||
Allowance for loan losses to total loans | 1.06 | 1.10 | 1.32 | 1.44 | 1.39 | |||||||||||||||
Table 10 - Allocation of Allowance for Loan Losses | |||||||||||||||||||||||||||||||
(Dollars in thousands) | |||||||||||||||||||||||||||||||
December 31, | |||||||||||||||||||||||||||||||
2015 | 2014 | 2013 | 2012 | 2011 | |||||||||||||||||||||||||||
Allowance for loan losses | Percent of total loans to total loans | Allowance for loan losses | Percent of total loans to total loans | Allowance for loan losses | Percent of total loans to total loans | Allowance for loan losses | Percent of total loans to total loans | Allowance for loan losses | Percent of total loans to total loans | ||||||||||||||||||||||
Allowance for loan losses allocated to: | |||||||||||||||||||||||||||||||
Commercial and industrial | $ | 6,186 | 26 | % | $ | 4,185 | 35 | % | $ | 4,272 | 40 | % | $ | 3,870 | 34 | % | $ | 3,365 | 34 | % | |||||||||||
Commercial real estate | 8,656 | 47 | 5,837 | 42 | 5,438 | 49 | 5,669 | 48 | 5,262 | 55 | |||||||||||||||||||||
Construction and land | 1,695 | 9 | 945 | 8 | 636 | 6 | 566 | 5 | 484 | 5 | |||||||||||||||||||||
Mortgage warehouse loans | — | 5 | — | 11 | — | 1 | — | 8 | — | — | |||||||||||||||||||||
Residential mortgages | 1,156 | 6 | 15 | — | — | — | 37 | — | 39 | — | |||||||||||||||||||||
Home equity | 825 | 5 | 332 | 3 | 356 | 3 | 466 | 4 | 478 | 5 | |||||||||||||||||||||
Consumer | 387 | 2 | 107 | 1 | 113 | 1 | 128 | 1 | 103 | 1 | |||||||||||||||||||||
Total allowance for loan losses | $ | 18,905 | 100 | % | $ | 11,421 | 100 | % | $ | 10,815 | 100 | % | $ | 10,736 | 100 | % | $ | 9,731 | 100 | % | |||||||||||
41
Investment Securities
Investment securities available-for-sale totaled $346.2 million at December 31, 2015, compared to $133.4 million at December 31, 2014. Available-for-sale securities are reported at their aggregate fair value, and unrealized gains and losses are included as a component of other comprehensive income, net of deferred taxes. As of December 31, 2015, investment securities available-for-sale had a net unrealized loss of $1.0 million, compared to a net unrealized gain of $767,000 as of December 31, 2014. Market changes in interest rates and credit spreads will result in temporary unrealized losses as the market price of securities fluctuate. After evaluating the securities with unrealized losses, management concluded that no other than temporary impairment existed as of December 31, 2015.
Changes in the amount of Atlantic Capital’s investment securities portfolio result primarily from balance sheet trends including loans, deposit balances and short-term borrowings. When inflows arising from deposits and short-term borrowings exceed loan demand, Atlantic Capital invests excess funds in the securities portfolio or in short-term investments. Conversely, when loan demand exceeds growth in deposits and short-term borrowings, Atlantic Capital allows interest-bearing balances with other banks to decline and uses proceeds from maturing securities to fund loan demand. Details of investment securities at December 31, 2015, December 31, 2014, and December 31, 2013 are provided in Table 11.
Table 11 - Investment Securities | ||||||||||||||||||||||||
(Dollars in thousands) | ||||||||||||||||||||||||
December 31, 2015 | December 31, 2014 | December 31, 2013 | ||||||||||||||||||||||
Available for Sale Securities | Amortized Cost | Fair Value | Amortized Cost | Fair Value | Amortized Cost | Fair Value | ||||||||||||||||||
U.S. Treasuries | $ | 4,952 | $ | 4,922 | $ | — | $ | — | — | — | ||||||||||||||
U.S. Government agencies | 65,373 | 64,852 | 15,265 | $ | 15,220 | 25,886 | 24,448 | |||||||||||||||||
U.S. states and political divisions | 27,751 | 27,790 | 2,158 | 2,346 | 1,373 | 1,462 | ||||||||||||||||||
Trust preferred securities | 4,732 | 4,275 | 4,675 | 4,200 | 4,650 | 4,075 | ||||||||||||||||||
Corporate debt securities | 20,653 | 20,517 | 16,150 | 16,328 | 16,502 | 16,787 | ||||||||||||||||||
Residential mortgage-backed securities-agency | 226,142 | 223,865 | 94,422 | 95,343 | 99,358 | 98,971 | ||||||||||||||||||
Total Available for Sale | $ | 349,603 | $ | 346,221 | $ | 132,670 | $ | 133,437 | $ | 147,769 | $ | 145,743 | ||||||||||||
The following table presents the contractual maturity of investment securities by maturity date and average yields based on amortized cost. The composition and maturity / repricing distribution of the securities portfolio is subject to change depending on rate sensitivity, capital and liquidity needs.
42
Table 12 - Investment Securities | |||||||||||||||||||||||||||
(Dollars in thousands) | |||||||||||||||||||||||||||
2015 | 2014 | ||||||||||||||||||||||||||
Amortized cost | Fair Value | Weighted Average Maturity | Weighted Average Yield | Amortized cost | Fair Value | Weighted Average Maturity | Weighted Average Yield | ||||||||||||||||||||
U.S. Treasuries | |||||||||||||||||||||||||||
1 to 5 years | $ | 4,952 | $ | 4,922 | 4.84 | 1.74 | % | $ | — | $ | — | — | — | % | |||||||||||||
4,952 | 4,922 | 4.84 | 1.74 | — | — | — | — | ||||||||||||||||||||
U.S. Government agencies | |||||||||||||||||||||||||||
Within 1 year | 2,000 | 1,998 | 0.59 | 1.00 | 362 | 364 | 0.30 | 2.53 | |||||||||||||||||||
1 to 5 years | 46,894 | 46,289 | 4.05 | 1.69 | 9,931 | 9,953 | 4.08 | 1.67 | |||||||||||||||||||
5 to 10 years | 7,528 | 7,528 | 8.18 | 1.62 | 4,972 | 4,903 | 5.70 | 1.86 | |||||||||||||||||||
More than 10 years | 8,951 | 9,037 | 8.58 | 2.50 | — | — | — | — | |||||||||||||||||||
65,373 | 64,852 | 5.05 | 1.77 | 15,265 | 15,220 | 4.51 | 1.75 | ||||||||||||||||||||
U.S. states and political subdivisions | |||||||||||||||||||||||||||
Within 1 year | 310 | 311 | 0.56 | 3.77 | — | — | — | — | |||||||||||||||||||
1 to 5 years | 5,350 | 5,323 | 4.35 | 2.45 | — | — | — | — | |||||||||||||||||||
5 to 10 years | 14,234 | 14,264 | 8.03 | 2.47 | 1,363 | 1,530 | 8.62 | 3.92 | |||||||||||||||||||
More than 10 years | 7,857 | 7,892 | 1.00 | 2.45 | 795 | 816 | 8.83 | 3.75 | |||||||||||||||||||
27,751 | 27,790 | 8.04 | 2.48 | 2,158 | 2,346 | 8.72 | 3.86 | ||||||||||||||||||||
Trust preferred securities | |||||||||||||||||||||||||||
More than 10 years | 4,732 | 4,275 | 11.17 | 1.59 | 4,675 | 4,200 | 12.34 | 1.36 | |||||||||||||||||||
4,732 | 4,275 | 11.17 | 1.59 | 4,675 | 4,200 | 12.34 | 1.36 | ||||||||||||||||||||
Corporate debt securities | |||||||||||||||||||||||||||
Within 1 year | 3,063 | 3,059 | 0.62 | 2.44 | 7,547 | 7,606 | 0.62 | 2.51 | |||||||||||||||||||
1 to 5 years | 14,595 | 14,464 | 3.91 | 2.43 | 8,603 | 87,222 | 2.19 | 2.23 | |||||||||||||||||||
5 to 10 years | 2,995 | 2,994 | 7.37 | 1.38 | — | — | — | — | |||||||||||||||||||
More than 10 years | — | — | — | — | — | — | |||||||||||||||||||||
20,653 | 20,517 | 3.92 | 2.28 | 16,150 | 16,328 | 1.46 | 2.36 | ||||||||||||||||||||
Residential mortgage-backed securities | 226,142 | 223,865 | 4.41 | 2.10 | 94,422 | 95,343 | 5.03 | 2.21 | |||||||||||||||||||
Total | $ | 349,603 | $ | 346,221 | $ | 132,670 | $ | 133,437 | |||||||||||||||||||
Goodwill and Other Intangible Assets
Atlantic Capital’s core deposit intangible representing the value of the acquired deposit base, is an amortizing intangible asset that is required to be tested for impairment only when events or circumstances indicate that impairment may exist. There were no events or circumstances that led management to believe that any impairment existed at December 31, 2015 in Atlantic Capital’s other intangible assets.
Goodwill represents the premium paid for acquired companies above the fair value of the assets acquired and liabilities assumed, including separately identifiable intangible assets. Atlantic Capital evaluates its goodwill annually, or more frequently if necessary, to determine if any impairment exists.
43
Deposits
At December 31, 2015, total deposits were $2.1 billion, an increase of $945.8 million, or 85.5%, since December 31, 2014. The addition of First Security deposits accounted for approximately $713 million of the increase. The remaining increase was primarily due to the legacy Atlantic Capital payments business. At December 31, 2015, branch deposits to be assumed in a sale totaled $213.4 million and will be sold as part of the divestiture of seven legacy First Security branches during the second quarter of 2016. Table 13 provides the average deposit balances as a percentage of total for December 31, 2015, 2014, and 2013.
Table 13 - Average Deposits | |||||||||||||||||||
(Dollars in thousands) | |||||||||||||||||||
December 31, | |||||||||||||||||||
2015 | % of total | 2014 | % of total | 2013 | % of total | ||||||||||||||
Non-interest bearing demand deposits | $ | 352,437 | 27 | % | $ | 254,861 | 26 | % | $ | 194,347 | 21 | % | |||||||
Interest-bearing demand deposits | 160,452 | 12 | 74,444 | 8 | 59,482 | 6 | |||||||||||||
Savings and money market deposits | 585,325 | 45 | 530,570 | 54 | 586,207 | 63 | |||||||||||||
Time deposits less than $250,000 | 48,832 | 4 | 3,754 | — | 5,646 | 1 | |||||||||||||
Time deposits $250,000 or greater | 9,301 | 1 | 12,568 | 1 | 12,568 | 1 | |||||||||||||
Brokered deposits | 140,416 | 11 | 107,575 | 11 | 77,219 | 8 | |||||||||||||
$ | 1,296,763 | 100 | $ | 983,772 | 100 | $ | 935,469 | 100 | |||||||||||
Branch deposits to be assumed in a sale | $ | 106,705 | $ | — | $ | — | |||||||||||||
The following table sets forth the scheduled maturities of time deposits of $250,000 and greater and brokered time deposits.
Table 14 - Maturities of Time Deposits of $250,000 or More | ||||
(Dollars in thousands) | ||||
Time deposits maturing in: | ||||
Three months or less | $ | 4,253 | ||
Over three through six months | 6,708 | |||
Over six through twelve months | 4,967 | |||
Over twelve months | 12,591 | |||
$ | 28,519 | |||
Short-Term Borrowings
At December 31, 2015 and 2014 we had securities sold under repurchase agreements with commercial checking customers of $11.9 million and $0, respectively. At December 31, 2015 and 2014, we had no Federal funds purchased.
As a member of the Federal Home Loan Bank of Atlanta (“FHLB”), we have the ability to acquire short and long-term advances through a blanket agreement secured by our unencumbered qualifying 1-4 family first mortgage loans and by pledging investment securities or individual, qualified loans, subject to approval of the FHLB. At December 31, 2015 and 2014, we had FHLB advances of $0 million and $56.0 million, respectively.
Long-Term Debt
During the third quarter of 2015, Atlantic Capital issued $50.0 million in 6.25% fixed-to-floating rate subordinated notes due in 2025, all of which was outstanding at December 31, 2015.
44
LIQUIDITY AND CAPITAL RESOURCES
Liquidity Risk Management
Liquidity risk is the risk that an institution will be unable to generate or obtain sufficient funding, at a reasonable cost, to meet operational cash needs and to take advantage of revenue producing opportunities as they arise. Other forms of liquidity risk include market constraints on the ability to convert assets into cash at expected levels, an inability to access funding sources at sufficient levels at a reasonable cost, and changes in economic conditions or exposure to credit, market, operational, legal, and reputation risks that can affect an institution’s liquidity risk profile. Liquidity management involves maintaining Atlantic Capital’s ability to meet the daily cash flow requirements of Atlantic Capital’s customers, both depositors and borrowers.
Atlantic Capital utilizes various measures to monitor and control liquidity risk across three different types of liquidity:
• | tactical liquidity measures the risk of a negative cash flow position whereby cash outflows exceed cash inflows over a short-term horizon; |
• | structural liquidity measures the amount by which illiquid assets are supported by long-term funding; and |
• | contingent liquidity utilizes cash flow stress testing across three crisis scenarios to determine the adequacy of Atlantic Capital’s liquidity. |
Atlantic Capital aims to maintain a diverse mix of existing and potential liquidity sources to support the liquidity management function. At its core is a reliance on the customer deposit book, due to the low cost it offers. Other sources of liquidity include asset-based liquidity in the form of cash and unencumbered securities, as well as access to wholesale funding from external counterparties, primarily advances from the FHLB of Atlanta, Federal Funds lines and other borrowing facilities. Atlantic Capital aims to avoid funding concentrations by diversifying external secured and unsecured funding with respect to maturities, counterparties and nature.
As of December 31, 2015, Atlantic Capital expected to maintain sufficient on-balance sheet liquidity to meet its funding needs.
At December 31, 2015, Atlantic Capital had access to $375.0 million in unsecured borrowings and $351.4 million in secured borrowings through various sources. Atlantic Capital also has the ability to attract more retail deposits by offering aggressively priced rates.
Shareholders’ Equity and Capital Adequacy
Atlantic Capital and the Bank are required to meet minimum requirements imposed by regulatory authorities. Failure to meet certain capital requirements may result in actions by regulatory agencies that could have a material impact on Atlantic Capital’s consolidated financial statements.
Shareholders’ equity at December 31, 2015 was $288.0 million, an increase of $147.1 million from December 31, 2014. Accumulated other comprehensive income, which includes unrealized gains and losses on securities available-for-sale and unrealized gains and losses on derivatives qualifying as cash flow hedges, is excluded in the calculation of regulatory capital ratios. Excluding the change in the accumulated other comprehensive income, shareholders’ equity increased $149.2 million, or 106.3%, from December 31, 2014. The increase resulted primarily from $24.0 million in capital issued to a private investor and $121.3 million from shares issued to former shareholders of First Security.
45
Table 15 - Capital Ratios | |||||||||||||||||||||||||||
(Dollars in thousands) | |||||||||||||||||||||||||||
Consolidated | Bank | Regulatory Guidelines | |||||||||||||||||||||||||
Minimum | Well capitalized | ||||||||||||||||||||||||||
December 31, 2015 | December 31, 2014 | December 31, 2015 | December 31, 2014 | Prior to January 1, 2015 | Beginning January 1, 2015 | Prior to January 1, 2015 | Beginning January 1, 2015 | ||||||||||||||||||||
Risk based ratios: | |||||||||||||||||||||||||||
Common equity tier 1 capital | 9.8 | % | N/A | % | 11.4 | % | N/A | % | N/A | % | 4.5 | % | N/A | % | 6.5 | % | |||||||||||
Tier 1 Capital | 9.8 | 11.0 | 11.4 | 10.8 | 4.0 | 6.0 | 6.0 | 8.0 | |||||||||||||||||||
Total capital | 12.9 | 11.9 | 12.3 | 11.7 | 8.0 | 8.0 | 10.0 | 10.0 | |||||||||||||||||||
Leverage ratio | 9.9 | 10.7 | 11.6 | 10.5 | 4.0 | 4.0 | 5.0 | 5.0 | |||||||||||||||||||
Common equity tier 1 capital | $ | 215,812 | $ N/A | $ | 251,727 | $ N/A | |||||||||||||||||||||
Tier 1 capital | 215,812 | 140,242 | 251,727 | 137,651 | |||||||||||||||||||||||
Total capital | 284,663 | 151,663 | 271,312 | 149,072 | |||||||||||||||||||||||
Risk weighted assets | 2,200,478 | 1,279,023 | 2,200,387 | 1,278,926 | |||||||||||||||||||||||
Quarterly average total assets for leverage ratio | 2,174,918 | 1,311,428 | 2,175,049 | 1,312,534 | |||||||||||||||||||||||
Atlantic Capital continues to exceed minimum capital standards and Atlantic Capital Bank remains “well-capitalized” under regulatory guidelines. See “Item 1. Business - Supervision and Regulation - Capital Adequacy” above for additional information.
In July 2013, bank regulatory agencies approved the Basel III capital guidelines, which are aimed at strengthening existing capital requirements for bank holding companies through a combination of higher minimum capital requirements, new capital conservation buffers and more conservative definitions of capital and balance sheet exposure. Atlantic Capital and Atlantic Capital Bank became subject to the requirements of Basel III effective January 1, 2015, subject to a transition period for several aspects of the rule.
Under the revised rules, Atlantic Capital’s tier 1 common equity ratio was 9.8% at December 31, 2015, compared to the fully phased-in, well-capitalized minimum of 7.0%, which includes the 2.5% minimum conservation buffer. Management continues to monitor Basel III developments and remains committed to managing Atlantic Capital’s capital levels in a prudent manner.
Table 16 - Tier 1 Common Equity Under Basel III | |||||
(Dollars in thousands) | |||||
December 31, 2015 | |||||
Tier 1 capital | $ | 215,812 | |||
Less: restricted core capital | — | ||||
Tier 1 common equity | $ | 215,812 | |||
Risk-weighted assets | $ | 2,200,478 | |||
Tier 1 common equity ratio | 9.8 | % | |||
46
Table 17 discloses the minimum and well-capitalized requirements for the transitional period beginning during 2016 and the fully phased-in requirements that become effective during 2019.
Table 17 - Basel III Capital Requirements | ||||||||||||||||
Basel III minimum requirement 2015 | Basel III well capitalized 2015 | Basel III minimum requirement 2016 | Basel III well capitalized 2016 | Minimum Capital plus capital conservation buffer 2019 | ||||||||||||
Common equity tier I to risk weighted assets | 4.5 | % | 6.5 | % | 4.5 | % | 6.5 | % | 7.0 | % | ||||||
Tier 1 capital to risk weighted assets | 6.0 | 8.0 | 6.0 | 8.0 | 8.5 | |||||||||||
Total capital ratio to risk weighted assets | 8.0 | 10.0 | 8.0 | 10.0 | 10.5 | |||||||||||
Leverage ratio | 4.0 | 5.0 | 4.0 | 5.0 | NA | |||||||||||
Off-Balance Sheet Arrangements
Atlantic Capital makes contractual commitments to extend credit and issues standby letters of credit in the ordinary course of its business activities. These commitments are legally binding agreements to lend money to customers at predetermined interest rates for a specified period of time. In addition to commitments to extend credit, Atlantic Capital also issues standby letters of credit which are assurances to a third party that it will not suffer a loss if the customer fails to meet a contractual obligation to the third party. At December 31, 2015, Atlantic Capital had issued commitments to extend credit of approximately $559.4 million and standby letters of credit of approximately $10.0 million through various types of commercial lending arrangements.
Based on historical experience, many of the commitments and letters of credit will expire unfunded. Through its various sources of liquidity, Atlantic Capital believes it will be able to fund these obligations as they arise. Atlantic Capital evaluates each customer’s credit worthiness on a case-by-case basis. The amount of collateral obtained, if deemed necessary upon extension of credit, is based on Atlantic Capital’s credit evaluation of the borrower. Collateral varies but may include accounts receivable, inventory, property, plant and equipment, and commercial and residential real estate.
Contractual Obligations
There have been no significant changes in our contractual obligations during the three and twelve months ended December 31, 2015 as compared to our fiscal year ended December 31, 2014. The following represents the future cash outflows related to lease obligations at December 31, 2015:
Table 18 - Lease Obligations | |||
(Dollars in thousands) | December 31, 2015 | ||
2016 | $ | 1,890 | |
2017 | 1,590 | ||
2018 | 536 | ||
2019 | 447 | ||
2020 | 462 | ||
Thereafter | 2,326 | ||
Total | $ | 7,250 | |
Rent expense for the years ended December 2015, 2014, and 2013 was $1.4 million, $1.2 million, and $1.1 million respectively, which were included in occupancy expense in the consolidated statements of operations.
RISK MANAGEMENT
Effective risk management is critical to Atlantic Capital’s success. The Dodd-Frank Act requires that bank holding companies with total assets in excess of $10 billion establish an enterprise-wide risk committee consisting of members of its board of directors. Although Atlantic Capital does not have total assets in excess of $10 billion, the Bank’s board of directors has a newly established Audit and Risk Committee that, among other responsibilities, provides oversight of enterprise-wide risk management activities.
47
The Audit and Risk Committee reviews the Bank’s activities in identifying, measuring and mitigating existing and emerging risks (including credit, liquidity, interest-rate, compliance, operational, strategic and reputational risks.) The committee monitors management’s execution of risk management practices in accordance with the risk appetite of the Bank, reviews supervisory examination reports together with management’s response to such examinations and discusses legal matters that may have a material impact on the financial statements or Atlantic Capital’s compliance policies. With guidance from and oversight by the Audit and Risk Committee, management continually refines and enhances its risk management policies and procedures to maintain effective risk management programs and processes.
Credit Risk Management
Credit risk is the risk of not collecting payments pursuant to the contractual terms of loans, leases and investment securities. Atlantic Capital’s independent credit review function conducts risk reviews and analyses of loans to help assure compliance with credit policies and to monitor asset quality trends. The risk reviews include portfolio analysis by geographic location, industry, collateral type and product. Atlantic Capital strives to identify potential problem loans as early as possible, to record charge-offs or write-downs as appropriate and to maintain adequate allowances for loan losses that are inherent in the loan portfolio.
Market Risk
Market risk reflects the risk of economic loss resulting from adverse changes in market price and interest rates. This risk of loss can be reflected in diminished current market values and/or reduced potential net interest income in future periods. Atlantic Capital’s market risk arises primarily from interest rate risk inherent in Atlantic Capital’s lending and deposit-taking activities. The structure of Atlantic Capital’s loan and deposit portfolios is such that a significant decline in interest rates may adversely impact net market values and net interest income. Atlantic Capital does not maintain a trading account nor is Atlantic Capital subject to currency exchange risk or commodity price risk.
Interest Rate Risk Management
Interest rate risk results principally from assets and liabilities maturing or repricing at different points in time, from assets and liabilities repricing at the same point in time but in different amounts and from short-term and long-term interest rates changing in different magnitudes. Market interest rates also have an impact on the interest rate and repricing characteristics of loans that are originated as well as the rate characteristics of interest-bearing liabilities.
Atlantic Capital assesses interest rate risk by forecasting net interest income under various interest rate scenarios and comparing those results to forecasted net interest income assuming stable rates. Atlantic Capital’s rate shock simulation, as of December 31, 2015, indicates that, over a 12-month period, net interest income is estimated to increase by 14.0% with rates rising 200-basis points. The increase in net interest income is primarily due to the short-term repricing characteristics of the loan portfolio, combined with a favorable funding mix. Atlantic Capital’s loan book consists mainly of floating rate loans. Atlantic Capital’s core client deposits are likely to allow Atlantic Capital to lag short term interbank rate indices when pricing deposits. Transaction accounts comprise a significant amount of Atlantic Capital’s total deposits.
Atlantic Capital also utilizes the market value of equity (MVE) as a tool in measuring and managing interest rate risk. As of December 31, 2015, the MVE calculated with a 200-basis point shock up in rates increased by 2.3% from the base case MVE value.
Table 19 provides the impact on net interest income resulting from various interest rate scenarios as of December 31, 2015 and 2014.
Table 19 - Net Interest Income Sensitivity Simulation Analysis | |||||||||
Estimated increase (decrease) in net interest income | |||||||||
Change in interest rate (basis point) | December 31, 2015 | December 31, 2014 | |||||||
+100 | 6.52 | % | 9.49 | % | |||||
+200 | 14.00 | 19.21 | |||||||
+300 | 21.99 | 30.50 | |||||||
48
Long-term interest rate risk exposure is measured using the MVE sensitivity analysis to study the impact of long-term cash flows on capital. Table 20 presents the MVE profile as of December 31, 2015 and December 31, 2014.
Table 20 - Market Value of Equity Modeling Analysis | ||||||||||
Estimated % change in MVE | ||||||||||
Change in interest rate (basis point) | December 31, 2015 | December 31, 2014 | ||||||||
+100 | 2.57 | % | (0.46 | ) | % | |||||
+200 | 2.29 | (0.93 | ) | |||||||
+300 | 2.47 | (1.45 | ) | |||||||
Atlantic Capital may utilize interest rate swaps, floors, collars or other derivative financial instruments in an attempt to manage Atlantic Capital’s overall sensitivity to changes in interest rates.
ITEM 7A. | QUANTITATIVE AND QUALITATIVE DISCLOSURES ABOUT MARKET RISK |
The information required by this item is included in Part II, Item 7 of this report under “Management’s Discussion and Analysis of Financial Condition and Results of Operations-Risk Management.”
49
ITEM 8. | FINANCIAL STATEMENTS AND SUPPLEMENTARY DATA |
Report of Independent Registered Public Accounting Firm |
The Board of Directors and Shareholders of Atlantic Capital Bancshares, Inc. We have audited the accompanying consolidated balance sheets of Atlantic Capital Bancshares, Inc. and its subsidiary (the “Company”) as of December 31, 2015 and 2014, and the related consolidated statements of operations, comprehensive (loss) income, shareholders’ equity and cash flows for each of the three years in the period ended December 31, 2015. These financial statements are the responsibility of the Company’s management. Our responsibility is to express an opinion on these financial statements based on our audits. We conducted our audits in accordance with the standards of the Public Company Accounting Oversight Board (United States). Those standards require that we plan and perform the audit to obtain reasonable assurance about whether the financial statements are free of material misstatement. We were not engaged to perform an audit of the Company’s internal control over financial reporting. Our audits included consideration of internal control over financial reporting as a basis for designing audit procedures that are appropriate in the circumstances, but not for the purpose of expressing an opinion on the effectiveness of the Company’s internal control over financial reporting. Accordingly, we express no such opinion. An audit also includes examining, on a test basis, evidence supporting the amounts and disclosures in the financial statements, assessing the accounting principles used and significant estimates made by management, and evaluating the overall financial statement presentation. We believe that our audits provide a reasonable basis for our opinion. |
In our opinion, the financial statements referred to above present fairly, in all material respects, the consolidated financial position of Atlantic Capital Bancshares, Inc. and its subsidiary at December 31, 2015 and 2014, and the consolidated results of their operations and their cash flows for each of the three years in the period ended December 31, 2015, in conformity with U.S. generally accepted accounting principles. |
/s/ Ernst & Young LLP Atlanta, Georgia March 30, 2016 |
50
Atlantic Capital Bancshares, Inc. and Subsidiary
Consolidated Balance Sheets
(in thousands, except share and per share data) | December 31, 2015 | December 31, 2014 | |||||
ASSETS | |||||||
Cash and due from banks | $ | 58,319 | $ | 36,490 | |||
Interest-bearing deposits in banks | 130,900 | 12,137 | |||||
Other short-term investments | 13,666 | 45,623 | |||||
Cash and cash equivalents | 202,885 | 94,250 | |||||
Securities available-for-sale | 346,221 | 133,437 | |||||
Other investments | 8,034 | 3,653 | |||||
Loans held for sale | 95,465 | — | |||||
Loans | 1,790,669 | 1,039,713 | |||||
Less: Allowance for Loan Losses | (18,905 | ) | (11,421 | ) | |||
Loans, net | 1,771,764 | 1,028,292 | |||||
Branch premises held for sale | 7,200 | — | |||||
Premises and equipment, net | 23,145 | 3,612 | |||||
Bank owned life insurance | 60,608 | 30,571 | |||||
Goodwill and intangible assets, net | 35,232 | 782 | |||||
Other real estate owned | 1,982 | 1,531 | |||||
Other assets | 86,244 | 18,731 | |||||
Total assets | $ | 2,638,780 | $ | 1,314,859 | |||
LIABILITIES AND SHAREHOLDERS’ EQUITY | |||||||
Deposits: | |||||||
Noninterest-bearing demand | $ | 544,561 | $ | 320,346 | |||
Interest-bearing checking | 232,868 | 91,709 | |||||
Savings | 28,922 | 304 | |||||
Money market | 875,441 | 572,658 | |||||
Time | 183,206 | 16,129 | |||||
Brokered deposits | 183,810 | 104,699 | |||||
Total deposits | 2,048,808 | 1,105,845 | |||||
Deposits to be assumed in branch sale | 213,410 | — | |||||
Federal funds purchased and securities sold under agreements to repurchase | 11,931 | — | |||||
Federal Home Loan Bank borrowings | — | 56,517 | |||||
Long-term debt | 49,197 | — | |||||
Other liabilities | 27,442 | 11,568 | |||||
Total liabilities | 2,350,788 | 1,173,930 | |||||
SHAREHOLDERS’ EQUITY | |||||||
Preferred stock, no par value; 10,000,000 shares authorized; no shares issued and outstanding as of December 31, 2015 and 2014 | — | — | |||||
Common stock, no par value; 100,000,000 shares authorized; 24,425,546 and 13,453,820 shares issued and outstanding as of December 31, 2015 and 2014, respectively | 286,367 | 135,860 | |||||
Retained earnings | 3,141 | 4,460 | |||||
Accumulated other comprehensive (loss) income | (1,516 | ) | 609 | ||||
Total shareholders’ equity | 287,992 | 140,929 | |||||
TOTAL LIABILITIES AND SHAREHOLDERS’ EQUITY | $ | 2,638,780 | $ | 1,314,859 | |||
51
Atlantic Capital Bancshares, Inc. and Subsidiary
Consolidated Statements of Operations
Twelve Months Ended | ||||||||||||
December 31, | ||||||||||||
(in thousands, except per share data) | 2015 | 2014 | 2013 | |||||||||
INTEREST INCOME | ||||||||||||
Loans, including fees | $ | 44,562 | $ | 32,762 | $ | 28,971 | ||||||
Investment securities – available for sale | 3,301 | 3,109 | 2,917 | |||||||||
Interest and dividends on other interest-earning assets | 1,104 | 671 | 649 | |||||||||
Total interest income | 48,967 | 36,542 | 32,537 | |||||||||
INTEREST EXPENSE | ||||||||||||
Interest on deposits | 3,618 | 2,889 | 3,116 | |||||||||
Interest on Federal Home Loan Bank advances | 290 | 437 | 467 | |||||||||
Interest on federal funds purchased and securities sold under agreements to repurchase | 79 | 123 | 32 | |||||||||
Interest on long-term debt | 858 | — | — | |||||||||
Other | 78 | — | — | |||||||||
Total interest expense | 4,923 | 3,449 | 3,615 | |||||||||
NET INTEREST INCOME BEFORE PROVISION FOR LOAN LOSSES | 44,044 | 33,093 | 28,922 | |||||||||
Provision for loan losses | 8,035 | 488 | 246 | |||||||||
NET INTEREST INCOME AFTER PROVISION FOR LOAN LOSSES | 36,009 | 32,605 | 28,676 | |||||||||
NONINTEREST INCOME | ||||||||||||
Service charges | 2,613 | 1,170 | 935 | |||||||||
Gain on sales of securities available-for-sale | 10 | 59 | 167 | |||||||||
Gain on sale of other assets | 189 | — | 500 | |||||||||
Mortgage income | 163 | — | — | |||||||||
Trust income | 192 | — | — | |||||||||
Derivatives income | 304 | 245 | 541 | |||||||||
Bank owned life insurance | 2,159 | 932 | 833 | |||||||||
SBA lending activities | 2,910 | 2,264 | 44 | |||||||||
Other noninterest income | 859 | 672 | 855 | |||||||||
Total noninterest income | 9,399 | 5,342 | 3,875 | |||||||||
NONINTEREST EXPENSE | ||||||||||||
Salaries and Employee Benefits | 24,098 | 18,608 | 17,318 | |||||||||
Occupancy | 2,170 | 1,721 | 1,597 | |||||||||
Equipment and software | 1,295 | 921 | 830 | |||||||||
Professional Services | 1,610 | 1,055 | 860 | |||||||||
Postage, printing and supplies | 178 | 91 | 98 | |||||||||
Communications and data processing | 1,541 | 1,253 | 1,131 | |||||||||
Marketing and business development | 410 | 323 | 384 | |||||||||
FDIC premiums | 789 | 643 | 589 | |||||||||
Merger and conversion costs | 9,154 | — | — | |||||||||
Other noninterest expense | 4,688 | 1,959 | 2,086 | |||||||||
Total noninterest expense | 45,933 | 26,574 | 24,893 | |||||||||
INCOME BEFORE PROVISION FOR INCOME TAXES | (525 | ) | 11,373 | 7,658 | ||||||||
Provision for income taxes | 794 | 3,857 | 2,515 | |||||||||
NET (LOSS) INCOME | $ | (1,319 | ) | $ | 7,516 | $ | 5,143 | |||||
NET (LOSS) INCOME PER SHARE: | ||||||||||||
Net (Loss) Income Per Share – Basic | $ | (0.09 | ) | $ | 0.56 | $ | 0.38 | |||||
Net (Loss) Income Per Share – Diluted | $ | (0.09 | ) | $ | 0.55 | $ | 0.38 | |||||
52
Atlantic Capital Bancshares, Inc. and Subsidiary
Consolidated Statements of Comprehensive (Loss) Income
Twelve Months Ended | |||||||||||
December 31, | |||||||||||
(in thousands) | 2015 | 2014 | 2013 | ||||||||
Net (loss) income | $ | (1,319 | ) | $ | 7,516 | $ | 5,143 | ||||
Other comprehensive (loss) income | |||||||||||
Unrealized gains (losses) on available-for-sale securities: | |||||||||||
Unrealized holding gains (losses) arising during the period, net of tax of $(1,578), $1,075 and $(1,646), respectively | (2,548 | ) | 1,777 | (2,712 | ) | ||||||
Reclassification adjustment for gains included in net income net of tax of $4, $22 and $63, respectively | (6 | ) | (37 | ) | (104 | ) | |||||
Unrealized gains (losses) on available-for-sale securities, net of tax | (2,554 | ) | 1,740 | (2,816 | ) | ||||||
Derivatives: | |||||||||||
Net unrealized derivative gains (losses), net of tax of $266, $84 and $0, respectively | 429 | 135 | — | ||||||||
Changes from derivatives | 429 | 135 | — | ||||||||
Other comprehensive (loss) income, net of tax | (2,125 | ) | 1,875 | (2,816 | ) | ||||||
Comprehensive (loss) income | $ | (3,444 | ) | $ | 9,391 | $ | 2,327 | ||||
Atlantic Capital Bancshares, Inc. and Subsidiary
Consolidated Statements of Shareholders’ Equity
Common Stock | Accumulated Other Comprehensive Income (Loss) | |||||||||||||||||||||||
(in thousands, except share data) | Shares | Amount | Retained Earnings/(Accumulated Deficit) | Treasury Stock | Total | |||||||||||||||||||
Balance - December 31, 2012 | 13,383,662 | $ | 134,767 | $ | (8,199 | ) | $ | 1,550 | $ | (34 | ) | $ | 128,084 | |||||||||||
Comprehensive income: | ||||||||||||||||||||||||
Net Income | — | — | 5,143 | — | — | 5,143 | ||||||||||||||||||
Change in unrealized gains (losses) on investment securities available-for-sale, net | — | — | — | (2,816 | ) | — | (2,816 | ) | ||||||||||||||||
Total comprehensive income | 2,327 | |||||||||||||||||||||||
Issuance of restricted stock | 53,843 | — | — | — | — | — | ||||||||||||||||||
Restricted stock activity | — | 676 | — | — | (80 | ) | 596 | |||||||||||||||||
Stock-based compensation | — | 228 | — | — | — | 228 | ||||||||||||||||||
Balance - December 31, 2013 | 13,437,505 | $ | 135,671 | $ | (3,056 | ) | $ | (1,266 | ) | $ | (114 | ) | $ | 131,235 | ||||||||||
Comprehensive income: | ||||||||||||||||||||||||
Net Income | — | — | 7,516 | — | — | 7,516 | ||||||||||||||||||
Change in unrealized gains (losses) on investment securities available-for-sale, net | — | — | — | 1,740 | — | 1,740 | ||||||||||||||||||
Change in unrealized gains (losses) on cash flow hedges | — | — | — | 135 | — | 135 | ||||||||||||||||||
Total comprehensive income | 9,391 | |||||||||||||||||||||||
Acquisition of treasury stock | — | — | — | — | (361 | ) | (361 | ) | ||||||||||||||||
Issuance of restricted stock | 59,613 | — | — | — | — | — | ||||||||||||||||||
Restricted stock activity | — | 607 | — | — | 607 | |||||||||||||||||||
Stock-based compensation | — | 57 | — | — | — | 57 | ||||||||||||||||||
Balance - December 31, 2014 | 13,497,118 | $ | 136,335 | $ | 4,460 | $ | 609 | $ | (475 | ) | $ | 140,929 | ||||||||||||
Comprehensive (loss) income: | ||||||||||||||||||||||||
Net loss | — | — | (1,319 | ) | — | — | (1,319 | ) | ||||||||||||||||
Change in unrealized gains (losses) on investment securities available-for-sale, net | — | — | — | (2,554 | ) | — | (2,554 | ) | ||||||||||||||||
Change in unrealized gains (losses) on cash flow hedges | — | — | — | 429 | — | 429 | ||||||||||||||||||
Total comprehensive (loss) income | (3,444 | ) | ||||||||||||||||||||||
Acquisition of treasury stock | — | — | — | — | (707 | ) | (707 | ) | ||||||||||||||||
Issuance of restricted stock | 151,891 | — | — | — | — | — | ||||||||||||||||||
Cancellation of treasury shares | — | (1,182 | ) | — | — | 1,182 | — | |||||||||||||||||
Issuance of common stock for acquisition of First Security Group | 8,790,193 | 121,305 | — | — | — | 121,305 | ||||||||||||||||||
Issuance of common stock in private placement | 1,984,127 | 24,004 | — | — | — | 24,004 | ||||||||||||||||||
Issuance of common stock for option exercises | 20,707 | 39 | — | — | — | 39 | ||||||||||||||||||
Issuance of common stock for long-term incentive plan | 102,758 | 1,285 | — | — | — | 1,285 | ||||||||||||||||||
Acquisition consideration for acquired awards | — | 2,705 | — | — | — | 2,705 | ||||||||||||||||||
Restricted stock activity | — | 702 | — | — | — | 702 | ||||||||||||||||||
Stock-based compensation | — | 1,174 | — | — | — | 1,174 | ||||||||||||||||||
Balance - December 31, 2015 | 24,546,794 | $ | 286,367 | $ | 3,141 | $ | (1,516 | ) | $ | — | $ | 287,992 | ||||||||||||
53
Atlantic Capital Bancshares, Inc. and Subsidiary
Consolidated Statements of Cash Flows
Twelve Months Ended | |||||||||||
December 31, | |||||||||||
(in thousands) | 2015 | 2014 | 2013 | ||||||||
CASH FLOWS FROM OPERATING ACTIVITIES | |||||||||||
Net (loss) income | $ | (1,319 | ) | $ | 7,516 | $ | 5,143 | ||||
Adjustments to reconcile net income to net cash provided by operating activities | |||||||||||
Provision for loan losses | 8,035 | 488 | 246 | ||||||||
Depreciation, amortization, and accretion | 2,390 | 2,009 | 2,487 | ||||||||
Amortization of restricted stock compensation | 659 | 607 | 596 | ||||||||
Stock option compensation | 1,175 | 57 | 228 | ||||||||
Deferred income tax (benefit)/expense | (680 | ) | (275 | ) | (375 | ) | |||||
Gain on sales of available-for-sale securities | (10 | ) | (59 | ) | (167 | ) | |||||
Gain/loss on sales of premises and equipment, net | 13 | — | — | ||||||||
Net loss (gains) on sales of other real estate owned | (189 | ) | — | — | |||||||
Net increase in cash value of bank owned life insurance | (1,029 | ) | (932 | ) | (833 | ) | |||||
Gain on bank owned life insurance | (1,112 | ) | — | — | |||||||
Changes in operating assets and liabilities - | |||||||||||
Net change in loans held for sale | (15,543 | ) | — | 56,327 | |||||||
Net decrease (increase) in other assets | (3,436 | ) | (1,158 | ) | 4,971 | ||||||
Net (decrease) increase in accrued expenses and other liabilities | 5,081 | 2,401 | (1,826 | ) | |||||||
Net cash (used in) provided by operating activities | (5,965 | ) | 10,654 | 66,797 | |||||||
CASH FLOWS FROM INVESTING ACTIVITIES | |||||||||||
Activity in securities available-for-sale: | |||||||||||
Prepayments | 24,025 | 17,625 | 26,053 | ||||||||
Maturities and calls | 9,734 | 55 | 1,000 | ||||||||
Sales | 23,088 | 18,813 | 16,337 | ||||||||
Purchases | (72,085 | ) | (22,312 | ) | (67,264 | ) | |||||
Net change in loans held for investment | 13,893 | (222,593 | ) | (62,751 | ) | ||||||
Net cash paid for acquisitions | (20,377 | ) | — | — | |||||||
(Purchases)/proceeds of Federal Home Loan Bank Stock, net | 5,966 | (1,857 | ) | 1,432 | |||||||
(Purchases)/proceeds of Federal Reserve Bank Stock, net | (4,061 | ) | — | — | |||||||
(Purchases) of bank owned life insurance | — | (4,000 | ) | (4,000 | ) | ||||||
Proceeds from bank owned life insurance benefits | 1,886 | — | — | ||||||||
Proceeds from sales of other real estate | 2,060 | — | — | ||||||||
Purchases of premises and equipment, net | 191 | (304 | ) | (1,347 | ) | ||||||
Net cash (used in) provided by investing activities | (15,680 | ) | (214,573 | ) | (90,540 | ) | |||||
54
Twelve Months Ended | |||||||||||
December 31, | |||||||||||
(in thousands) | 2015 | 2014 | 2013 | ||||||||
CASH FLOWS FROM FINANCING ACTIVITIES | |||||||||||
Net change in deposits | 186,351 | 24,692 | 55,342 | ||||||||
Proceeds from Federal Home Loan Bank Advances | 638,000 | 605,000 | 221,508 | ||||||||
Repayments of Federal Home Loan Bank Advances | (767,407 | ) | (556,320 | ) | (251,305 | ) | |||||
Issuance of subordinated debentures | 50,000 | — | — | ||||||||
Proceeds from exercise of stock options | 39 | — | — | ||||||||
Net proceeds from issuance of common stock, net of offering costs | 24,004 | — | — | ||||||||
Acquisitions of treasury stock | (707 | ) | (361 | ) | — | ||||||
Net cash provided by financing activities | 130,280 | 73,011 | 25,545 | ||||||||
NET CHANGE IN CASH AND CASH EQUIVALENTS | 108,635 | (130,908 | ) | 1,802 | |||||||
CASH AND CASH EQUIVALENTS – beginning of period | 94,250 | 225,158 | 223,356 | ||||||||
CASH AND CASH EQUIVALENTS – end of period | $ | 202,885 | $ | 94,250 | $ | 225,158 | |||||
Twelve Months Ended | |||||||||||
December 31, | |||||||||||
2015 | 2014 | 2013 | |||||||||
SUPPLEMENTAL SCHEDULE OF CASH FLOWS | |||||||||||
Cash paid during the year for: | |||||||||||
Interest | $ | 3,532 | $ | 3,427 | $ | 3,649 | |||||
Income taxes | $ | 5,927 | $ | 3,163 | $ | 3,093 | |||||
Assets acquired in business combinations | $ | 1,244,541 | $ | — | $ | — | |||||
Liabilities assumed in business combinations | $ | 1,076,138 | $ | — | $ | — | |||||
Issuance of common stock in acquisitions | $ | 121,305 | $ | — | $ | — | |||||
55
ATLANTIC CAPITAL BANCSHARES, INC. AND SUBSIDIARY
NOTES TO CONSOLIDATED FINANCIAL STATEMENTS
NOTE 1 – ACCOUNTING POLICIES AND BASIS OF PRESENTATION
Basis of Presentation
The accounting and financial reporting policies of Atlantic Capital Bancshares, Inc. (“Atlantic Capital”) and its subsidiary conform to accounting principles generally accepted in the United States of America (“GAAP”) and general banking industry practices. All material intercompany balances and transactions have been eliminated. On October 31, 2015, Atlantic Capital completed its acquisition of First Security Group, Inc. and its subsidiary First SecurityBank, N.A. (together, “First Security”). In connection with the acquisition, Atlantic Capital’s subsidiary Atlantic Capital Bank, a Georgia chartered commercial bank merged with and into First SecurityBank, N.A, which subsequently changed its name to Atlantic Capital Bank, National Association. The consolidated financial statements reflect the results of operations of Atlantic Capital and Atlantic Capital Bank (the “Bank”) for the full twelve months of 2015, and include the results of operations of First Security subsequent to the acquisition. In connection with the acquisition, Atlantic Capital issued approximately 8,790,193 shares of common stock as partial consideration to former shareholders of First Security, with the remaining consideration consisting of approximately $47.1 million in cash. See Note 3 to the Audited Financial Statements for additional information.
In management’s opinion, all accounting adjustments necessary to accurately reflect the financial position and results of operations on the accompanying financial statements have been made. These adjustments are normal and recurring accruals considered necessary for a fair and accurate presentation. Certain prior period amounts have been reclassified to conform to the current year presentation.
Significant Accounting Policies
Cash and Cash Equivalents
Cash and cash equivalents include cash and due from banks, interest-bearing deposits in other banks, commercial paper, federal funds sold and reverse repurchase agreements. Generally, cash and cash equivalents have maturities of three months or less and, accordingly, the carrying amount of these instruments is deemed to be a reasonable estimate of fair value. Reverse repurchase agreements are not subject to netting and offset with repurchase agreements.
Investment Securities Available-For-Sale
Investment securities designated as available-for-sale are stated at fair value. Investment securities available-for-sale include securities that may be sold in response to changes in interest rates, changes in prepayment risk, liquidity needs, or for other purposes. Interest income and dividends on securities are recognized in interest income on an accrual basis. Premiums and discounts on debt securities are amortized or accreted over the life of the related security as an adjustment of the yield. Realized gains and losses are included in earnings and the cost of securities sold is derived using the specific identification method. Unrealized gains and losses, net of the related tax effect, are excluded from earnings and are reported as a separate component of shareholders’ equity.
Available-for-sale securities are reviewed for other-than-temporary impairment (“OTTI”). A security is considered to be impaired if the fair value is less than its amortized cost basis at the measurement date. The Company determines whether a decline in fair value below the amortized cost basis is other-than-temporary. The Company determines whether it has the intent to sell the debt security or whether it is more likely than not that it will be required to sell the debt security before the recovery of its amortized cost basis. If either of these conditions is met, the Company must recognize the entire impairment in the Consolidated Statements of Operations and write the debt security down to fair value. For debt securities which the Company does not expect to recover the entire amortized cost basis of the security and which do not meet either condition, an OTTI loss is considered to have occurred. The credit loss portion of impairment is recorded as a realized loss in the Consolidated Statements of Operations and the temporary impairment related to all other factors is recorded in accumulated other comprehensive income, a component of shareholders’ equity.
Federal Home Loan Bank Stock/Federal Reserve Bank Stock
The Company holds stock in the Federal Home Loan Bank of Atlanta (“FHLB”) and Federal Reserve Bank (“FRB”). The Company accounts for the stock based on the industry guidance in ASC 325-942, Investments ‑ Other, which requires the investment be
56
carried at cost and be evaluated for impairment based on the ultimate recoverability of the par value. The Company evaluated its holdings in FHLB and FRB stock at December 31, 2015 and 2014, and believes its holdings in the stock are ultimately recoverable at par.
Acquisition Activities
The Company accounts for business combinations under the acquisition method of accounting. Assets acquired and liabilities assumed are measured and recorded at fair value at the date of acquisition, including identifiable intangible assets. If the consideration paid exceeds the fair value of the net assets acquired, goodwill is recognized at the acquisition date. Fair values are subject to refinement over the measurement period, not to exceed one year after the closing date of an acquisition as information relative to closing date fair values becomes available.
The determination of the fair value of loans acquired takes into account credit quality deterioration and probability of loss; therefore, the related allowance for loan losses is not carried forward.
All identifiable intangible assets that are acquired in a business combination are recognized at fair value on the acquisition date. Identifiable intangible assets are recognized separately if they arise from contractual or other legal rights or if they are separable (i.e., capable of being sold, transferred, licensed, rented, or exchanged separately from the entity).
Loans
Loans Held for Investment
Loans are stated at the amount of unpaid principal, net of the allowance for loan losses, deferred income (net of deferred costs) and other unearned income. Interest income on loans is recognized using the effective yield method on the daily balances of the principal amount outstanding. Loan origination fees, net of direct loan origination costs, commitment fees, premiums and discounts are deferred and amortized as an adjustment to yield over the life of the loan, or over the commitment period, as applicable.
Loans are considered to be past due when payment is not received from the borrower by the contractually specified due date. Interest accruals on loans are discontinued when interest or principal has been in default 90 days or more, unless the loan is secured by collateral that is sufficient to repay the debt in full and the loan is in the process of collection. When a loan is placed on nonaccrual status, interest accrued and not paid in the current accounting period is reversed against current period income. Interest accrued and not paid in prior periods, if significant, is reversed against the allowance for loan losses.
Income on such loans is subsequently recognized on a cash basis as long as the future collection of principal is deemed probable or after all principal payments are received. Commercial loans are placed back on accrual status after sustained performance of timely and current principal and interest payments and it is probable that all remaining amounts due, both principal and interest, are fully collectible according to the terms of the loan agreement. Residential loans and consumer loans are generally placed back on accrual status when they are no longer past due.
A loan is considered to be impaired when, based on current information and events, it is probable that all amounts due according to the contractual terms of the loan agreement will not be collected. A specific allowance is established for individually evaluated impaired loans as needed. Reserves on impaired loans are measured based on the present value of expected future cash flows discounted at the loan’s effective interest rate or the observable market price, or the fair value of the underlying collateral of the loan if the loan is collateral dependent.
The Company evaluates loans in accordance with the provisions within the Financial Accounting Standards Board (“FASB”) Accounting Standard Codification (“ASC”) 310‑40, Troubled Debt Restructurings by Creditors. Troubled debt restructurings (“TDRs”) are loans in which the Company has modified the terms and granted an economic concession to a borrower who is experiencing financial difficulties. These modifications may include interest rate reductions, term extensions and other concessions intended to minimize losses. Typically, loans accruing interest at the time of the modification remain on accrual status and are subject to the Company’s charge-off and nonaccrual policies. Loans on nonaccrual prior to modification remain on nonaccrual. TDRs may be returned to accrual status as outlined above. Interest income recognition on impaired loans is dependent upon nonaccrual status and loan type as discussed above.
During the year ended December 31, 2015, the Company acquired loans through a business combination. Certain loans showed evidence of credit deterioration (see discussion below). A majority of the acquired loans did not show signs of credit deterioration and were accounted for under ASC 310-20. As such, the difference between the fair value and the unpaid principal balance of loans at acquisition is accreted into interest income over the life of the loan.
57
In the third quarter of 2012, the Bank entered into a sub-participation agreement with a commercial bank (the participating bank), whereby pursuant to the sub-participation agreement, the Bank purchases participation interests in single-family mortgage loans from the participating bank that has purchased ownership interests from unaffiliated mortgage originators that seek funding to facilitate the origination of single-family residential mortgage loans for sale in the secondary market. The originators underwrite and close mortgage loans consistent with established standards of approved investors and, once the sales close, the originators and the participating bank deliver the loans to the investors. Typically, the participating bank purchases up to an aggregate of a 99% ownership interest with the originators retaining the remaining 1% interest. The Bank typically purchases a 40% or less interest in the mortgage warehouse loans from the participating bank. These loans are held for short periods, usually less than 30 years. These mortgage warehouse loans are classified as held for investment as of December 31, 2014, and 2015.
Loans Held for Sale
The Company maintains loans held-for-sale in connection with three distinct departments: the mortgage department, the government lending department and the TriNet division. The Company’s mortgage department primarily originates long-term loans held-for-sale and uses various correspondent relationships to sell the loans on the secondary market. Loans held-for-sale are carried at lower of cost or market on an individual loan basis. Held-for-investment loans that have been transferred to held-for-sale are carried at lower of cost or fair value. Fair value is determined from observable current market prices. The credit component of any charge-off upon transfer to held-for-sale is reflected in the allowance for loan losses. The mortgage department also originates certain mortgage loans to be retained, which are classified as loans held-for-investment. From time to time, certain of these loans may be transferred to loans held for sale, marketed and sold in order to manage the Company’s interest rate risk position and concentration limits. The government lending department originates SBA and USDA government guaranteed loans with the primary purpose of selling the guaranteed portion in the secondary market. The Company’s TriNet division originates construction loans for pre-leased “build to suit” projects and provides interim and long-term financing to professional developers and private investors of commercial real estate with or subject to long-term leases to tenants that are investment grade or have investment grade attributes. The Company classifies all TriNet originations as held-for-investment. From time to time, the Company may evaluate a portion of the originated loans to sell in order to manage the Company’s overall interest rate risk and asset-liability sensitivity. The Company transfers the loans to held-for-sale once specific loans are identified and the decision to sell the loan has been made. The loans are carried at lower of cost or market.
Purchased Loans With Evidence of Credit Deterioration
During the year ended December 31, 2015, Atlantic Capital purchased loans through a business combination transaction. Some of those purchased loans showed evidence of credit deterioration since origination and are accounted for pursuant to ASC 310-30, Loans and Debt Securities Acquired with Deteriorated Credit Quality. These purchased credit impaired (“PCI”) loans are recorded at their estimated fair value at date of purchase. After acquisition, further losses evidenced by decreases in expected cash flows are recognized by an increase in the allowance for loan losses.
PCI loans are aggregated into pools of loans based on common risk characteristics such as the type of loan, payment status, or collateral type. Atlantic Capital estimates the amount and timing of expected cash flows for each purchased loan pool and the expected cash flows in excess of the fair value of the loans are recorded as interest income over the remaining life of the pool (accretable yield). The excess of the pool’s contractual principal and interest over expected cash flows is not recorded (nonaccretable difference).
At least quarterly and over the life of the loan pool, expected cash flows continue to be estimated. Increases in estimated cash flows are recognized on a prospective basis as interest income over the remaining life of the loan. Decreases in expected cash flows result in the recognition of a provision for loan loss.
Allowance for Loan Losses
The allowance for loan losses is established through the provision for loan losses charged against earnings and is maintained at a level that management considers adequate to absorb losses inherent in the portfolio. The allowance for loan losses framework has two basic elements: specific allowances for loans individually evaluated for impairment and a general allowance for pools of loans with similar characteristics not individually evaluated. This analysis includes the evaluation of impaired loans as prescribed under the Receivables Topic of the FASB ASC, as well as pooled loans as prescribed under the Contingencies Topic of the FASB ASC. Management’s evaluation of the allowance considers changes in the nature and volume of the portfolio, historic charge-offs, adequacy of collateral, delinquency trends, loan concentrations, economic conditions, changes in policies and procedures, changes in lending management, changes in loan review system and other factors considered necessary to maintain the allowance at an adequate level. Loans are charged against the allowance for loan losses when management believes that the collection of the principal is unlikely and the loss is quantifiable. Subsequent recoveries, if any, are credited to the allowance in the period received.
58
The allowance for loans losses for acquired loans is evaluated at each reporting date subsequent to acquisition. For acquired performing loans, an allowance is determined using a methodology similar to that described above.
Management believes that the allowance for loan losses is adequate. While management uses available information to estimate the inherent losses at each balance sheet date, future changes to the allowance may be necessary based on changes in economic conditions. In addition, various regulatory agencies, as an integral part of their examination process, periodically review the Bank’s allowance for losses on loans.
Premises and Equipment, Net
Premises and equipment are stated at cost, less accumulated depreciation. Depreciation is computed using the straight-line method over the estimated useful lives of the respective assets. Major additions and improvements are charged to the asset accounts while maintenance and repairs that do not improve or extend the useful lives of the assets are charged to expense as incurred. When assets are retired or otherwise disposed of, the cost and related accumulated depreciation are removed from the accounts, and any gain or loss is reflected in the results of operations for the period.
Goodwill and Other Intangible Assets
Goodwill is an asset representing the future economic benefits from other assets acquired that are not individually identified and separately recognized. Goodwill is measured as the excess of the consideration transferred, net of the fair value of identifiable assets acquired and liabilities assumed at the acquisition date. Goodwill is not amortized, but instead is tested for impairment annually or more frequently if events or circumstances exist that indicate a goodwill impairment test should be performed.
Other intangible assets, which are initially recorded at fair value, consist of core deposit intangible assets resulting from Atlantic Capital’s acquisition of First Security. Core deposit intangible assets are amortized on a sum-of-all-months basis over their estimated useful lives. The Company evaluates its other intangible assets for impairment whenever events or changes in circumstances indicate the carrying amount of the asset may not be recoverable.
Other Real Estate Owned
Assets acquired through, or in lieu of, loan foreclosure are held for sale and are initially recorded at the lower of the loan balance or fair value at the date of foreclosure, less estimated costs to sell. Any difference between the initial cost basis and the carrying value of the loan is charged to the allowance for loan losses at the date of the transfer to other real estate owned. Subsequent to foreclosure, any further declines in value of the assets are recorded as adjustments to the asset’s carrying amount and reported in noninterest expense, along with costs related to holding the properties, in the Consolidated Statements of Operations.
Servicing Rights
The Company sells certain loans to third parties. All such transfers are accounted for as sales by the Company. Gains or losses upon sale are recorded in noninterest income. The Company records a separate servicing asset for the loans when the servicing is retained and the expected servicing income is more than adequate compensation for providing the servicing. This asset represents the right or obligation to service the loans and receive a fee in compensation. Servicing assets are initially recorded at their fair value as a component of the sale proceeds. The fair value of the servicing assets is based on an analysis of discounted cash flows that incorporates estimates of (1) market servicing costs, (2) market-based prepayment rates, and (3) market profit margins.
The Company has elected to subsequently measure the servicing assets under the amortization method. The rate of prepayment of loans serviced is the most significant estimate involved in the measurement process. Estimates of prepayment rates are based on market participant’s expectations of future prepayment rates, reflecting the company’s historical rate of loan repayments if consistent with market participant assumptions, industry trends, and other considerations. Actual prepayment rates may differ from those projected by management due to changes in a variety of economic factors, including prevailing interest rates and the availability of alternative financing sources to borrowers. If actual prepayments of the loans being serviced were to occur more quickly than projected, the carrying value of servicing assets may require a write-down through a charge to earnings in the current period. Accordingly, the servicing assets actually realized, could differ from the amounts initially recorded.
59
Bank Owned Life Insurance
The Bank has purchased life insurance policies on certain key personnel. Bank owned life insurance is recorded at the amount that can be realized under the insurance contract at the balance sheet date, which is the cash surrender value adjusted for other charges or other amounts due that are probable at settlement.
Segment Reporting
Atlantic Capital considers its operations to be a single business segment as defined in ASC 280, Segment Reporting. The Company has determined that its lending divisions meet the aggregation criteria of ASC 280 as the products and services, nature of the production processes, types of customers, methods used to distribute products and services and the regulatory environment are sufficiently similar to aggregate their results.
Income Taxes
The provision for income taxes is based on income and expense reported for financial statement purposes after adjustments for permanent differences. Deferred tax assets and liabilities are recorded for the future tax consequences attributable to differences between the financial statement carrying amounts of existing assets and liabilities and their respective tax bases. Future tax benefits, such as net operating loss carryforwards, are recognized to the extent that realization of such benefits is more likely than not. Deferred tax assets and liabilities are measured using enacted tax rates expected to apply to taxable income in the years in which the assets and liabilities are expected to be recovered or settled. The effect on deferred tax assets and liabilities of a change in tax rates is recognized in income tax expense in the period that includes the enactment date.
A valuation allowance is provided when it is deemed more likely than not that some portion, or all, of the deferred tax asset will not be realized. In assessing the ability to realize the deferred tax assets, management considers the four possible sources of taxable income including future reversals of existing taxable temporary differences, future taxable income, taxable income in prior carryback years and tax-planning strategies that would be implemented to utilize the loss carryforwards prior to expiration.
A tax position is recognized as a benefit only if it is more-likely-than-not that the tax position would be sustained in a tax examination, with a tax examination being presumed to occur. The amount recognized is the largest amount of tax benefit that is greater than 50% likely of being realized on examination.
Atlantic Capital files its income tax returns on a consolidated basis. For additional information, see, Note 14, Income Taxes.
Stock-Based Compensation
Atlantic Capital sponsors a stock-based compensation plan, which is described more fully in Note 15, Employee and Director Benefit Plans. Compensation cost is recognized for stock options, warrants and restricted stock awards issued to employees and directors, based on the fair value of these awards at the date of grant. A Black-Scholes model is utilized to estimate the fair value of stock options and warrants, while the price of the Company’s common stock at the date of grant is used for restricted stock awards. The total cost of the Company’s stock-based awards is recognized as expense on a straight-line basis over the vesting periods of the awards.
Earnings Per Share
Basic earnings per share are computed by dividing net income available to common shareholders by the weighted-average number of common shares outstanding during each period. Diluted earnings per share are based on the weighted-average number of common shares outstanding during each period, plus common share equivalents calculated for stock options and warrants outstanding using the treasury stock method. When a net loss is recognized for the period, diluted earnings per share is calculated in the same manner as basic earnings per share.
Off-Balance Sheet Financial Instruments
In the ordinary course of business, the Bank has entered into off-balance sheet financial instruments consisting of commitments to extend credit and letters of credit. Such financial instruments are recorded in the financial statements when they are funded.
60
Fair Value
Certain assets and liabilities are measured at fair value on a recurring basis. Examples of these include available-for-sale securities and derivative instruments. Fair value is used on a nonrecurring basis when assets are evaluated for impairment; the basis for accounting is lower of cost or market or fair value for disclosure purposes. Fair value is defined as the price that would be received to sell an asset or paid to transfer a liability in an orderly transaction between market participants. ASC 820, Fair Value Measurements and Disclosures, defines fair value, establishes a framework for measuring fair value, and expands disclosures about fair value measurements. For additional information, see Note 18, Fair Value.
Derivative Financial Instruments
The Company follows the guidance under ASC 815, Derivatives and Hedging, and records all derivatives on the Consolidated Balance Sheets at fair value. For derivatives designated as qualifying cash flow hedging relationships, the change in fair value of the effective portion is accounted for in other comprehensive income. For all other derivatives not designated as qualifying hedging relationships, changes in market value are recognized directly into earnings.For additional information, see Note 16, Derivative Financial Instruments.
Branch Assets Held for Sale and Liabilities to be Assumed
On December 17, 2015, the Bank entered into two agreements to sell seven branches to First Freedom Bank and Athens Federal Community Bank, N.A. These branches were acquired from First Security and consist of loans, premises and deposits that are considered to be held for sale as of December 31, 2015. They are carried at the lower of cost or fair value. The sale of these branches are scheduled to close in the second quarter of 2016.
NOTE 2 – ACCOUNTING STANDARDS UPDATES AND RECENTLY ADOPTED STANDARDS
In February 2016, the FASB issued Accounting Standards Update (“ASU”) 2016-2, Leases. Under the new guidance, leases classified as operating leases under previous GAAP must be recorded on the balance sheet. A lessee should recognize in the statement of financial position a liability to make lease payments (the lease liability) and a right-of-use asset representing its right to use the underlying asset for the lease term. The standard is effective for public companies for fiscal years, and interim periods within those fiscal years, beginning after December 15, 2018. Early adoption is permitted. The new standard must be adopted using a modified retrospective transition, and provides for certain practical expedients. Atlantic Capital is evaluating the impact of this update and does not believe it will have a significant impact to Atlantic Capital’s financial position or results of operations.
In January 2016, the FASB issued ASU 2016-1, Financial Instruments – Overall (Subtopic 825-10): Recognition and Measurement of Financial Assets and Liabilities. The guidance in this update requires that equity investments (except those accounting for under the equity method of accounting) be measured at fair value with changes in fair value recognized in net income. However, an entity may choose to measure equity investments that do not have readily determinable fair values at cost minus impairment, if any, plus or minus changes resulting from observable price changes in orderly transactions for the identical or a similar investment of the same issuer. The guidance also simplifies the impairment assessment of equity investments without readily determinable fair values by requiring a qualitative assessment to identify impairment. In addition, the guidance addresses various disclosure and presentation issues related to financial instruments. For public entities, this update is effective for fiscal years beginning after December 15, 2017 with early application permitted. The adoption of this update is not expected to have a material impact on Atlantic Capital’s consolidated financial statements.
In September 2015, the FASB issued ASU No. 2015-16, Simplifying the Accounting for Measurement-Period Adjustments. Before this ASU was issued, GAAP required that during the measurement period, the acquirer retrospectively adjust the provisional amounts recognized at the acquisition date with a corresponding adjustment to goodwill. To simplify the accounting for adjustments made to provisional amounts recognized in a business combination, the amendments in this update eliminate the requirement to retrospectively account for those adjustments. Now, an entity must present separately on the face of the income statement or disclose in the notes, the portion of the amount recorded in current-period earnings by line item that would have been recorded in previous reporting periods if the adjustment to the provisional amounts had been recognized as of the acquisition date. This guidance is effective for fiscal years beginning after December 15, 2015, including interim periods within those fiscal years. The amendments in this update should be applied prospectively to adjustments to provisional amounts that occur after the effective date with earlier application permitted for financial statements that have not been issued. Atlantic Capital adopted this standard in 2015 and it did not have a significant impact on the company’s financial position or results of operations.
In June 2015, the FASB issued ASU 2015-10 Technical Corrections and Improvements. The amendments in this standard clarify the guidance, correct references and make minor improvements affecting a variety of topics. The substantive amendments are
61
effective for entities during annual reporting periods beginning after December 15, 2015, and interim periods therein, and other amendments are effective immediately. The adoption of this ASU is not expected to have a significant impact on Atlantic Capital’s financial position or results of operations.
In April 2015, the FASB issued ASU 2015-03, Simplifying the Presentation of Debt Issuance Costs. To simplify presentation of debt issuance costs, the amendments in this ASU require that debt issuance costs related to a recognized debt liability be presented in the balance sheet as a direct deduction from the carrying amount of that debt liability, consistent with debt discounts. The recognition and measurement guidance for debt issuance costs were not affected by this ASU. This guidance is effective for financial statements issued for fiscal years beginning after December 31, 2015, and interim periods within those fiscal years. Early adoption is permitted and Atlantic Capital elected to early adopt this standard as of September 30, 2015. It did not have a material impact on Atlantic Capital’s financial position or results of operations and resulted in an insignificant balance sheet reclassification approximately $800,000 between other liabilities and long-term debt.
In May 2014, the FASB issued ASU 2014-09, Revenue from Contracts with Customers. This update is a joint project with the International Accounting Standards Board initiated to clarify the principles for recognizing revenue and to develop a common revenue standard that is meant to remove inconsistencies and weaknesses in revenue requirements, provide a more robust framework for addressing revenue issues, improve comparability of revenue recognition practices, provide more useful information to users of financial statements and simplify the preparation of financial statements. The guidance in this update supersedes the revenue recognition requirements in Topic 605, “Revenue Recognition” and most industry-specific guidance throughout the Industry Topics of Codification. In August 2015, the FASB deferred the effective date of this ASU by one year. For public companies, it is effective for annual and interim periods beginning after December 15, 2017. Atlantic Capital is continuing to evaluate the impact of this ASU on Atlantic Capital’s financial position and results of operations.
NOTE 3 – ACQUISITIONS AND DIVESTITURES
Acquisition of First Security Group
On October 31, 2015, Atlantic Capital completed the acquisition of First Security and its wholly-owned bank subsidiary, FSG Bank. First Security operated twenty-five branches in Georgia and Tennessee. In connection with the acquisition, Atlantic Capital acquired approximately $801 million of loans and assumed approximately $970 million of deposits.
The deadline for First Security shareholders to elect the form of merger consideration they wished to receive in the merger was October 26, 2015. First Security received 56,146,402 elections for shares exchanged for stock consideration, 6,737,774 elections for cash consideration, and no election was made with respect to 3,913,748 shares.
Pursuant to the terms of and subject to the conditions set forth in the Merger Agreement, at least 20,041,578 (the “Cash Election Minimum Threshold”) shares of First Security common stock were to be exchanged for cash, with the remaining shares to be exchanged for Atlantic Capital common stock. Because the stock election was oversubscribed, and the number of shares not making a stock election was not sufficient to meet the Cash Election Minimum Threshold, shares for which a stock election was made were subject to re-allocation. Accordingly, in aggregate, the merger consideration to be received by First Security shareholders consisted of approximately $47,097,708 in cash and 8,790,193 shares of Atlantic Capital common stock.
First Security shares for which a cash election was made, as well as those for which no election was made, received $2.35 in cash per share. First Security shares for which a stock election was made received approximately $0.39 in cash and approximately 0.157 shares of Atlantic Capital common stock for each share of First Security common stock exchanged in the Merger (and cash in lieu of each fractional share).
62
A summary of assets received and liabilities assumed for First Security, as well as the associated fair value adjustments, are as follows:
First Security Group, Inc. (As Reported) | Fair Value Adjustments | As recorded by Atlantic Capital | ||||||||||
(in thousands) | ||||||||||||
Fair value of assets acquired: | ||||||||||||
Cash and due from banks | $ | 26,721 | $ | — | $ | 26,721 | ||||||
Investment securities | 199,104 | 3,748 | 202,852 | |||||||||
Loans held for sale | 44,452 | — | 44,452 | |||||||||
Loans | 812,196 | (11,059 | ) | 801,137 | ||||||||
Less allowance for loan losses | (9,385 | ) | 9,385 | — | ||||||||
Loans, net | 802,811 | (1,674 | ) | 801,137 | ||||||||
Premises and equipment, net | 29,246 | (1,086 | ) | 28,160 | ||||||||
Other intangible assets (1) | — | 9,544 | 9,544 | |||||||||
Other real estate owned | 2,493 | (438 | ) | 2,055 | ||||||||
Other assets (2) | 47,559 | 58,709 | 106,268 | |||||||||
Total assets acquired | $ | 1,152,386 | $ | 68,803 | $ | 1,221,189 | ||||||
Fair value of liabilities acquired: | ||||||||||||
Deposits: | ||||||||||||
Noninterest bearing demand | $ | 178,174 | $ | — | $ | 178,174 | ||||||
Interest bearing demand | 121,063 | — | 121,063 | |||||||||
Savings and money market | 274,099 | — | 274,099 | |||||||||
Time | 253,673 | 2,233 | 255,906 | |||||||||
Brokered | 140,780 | — | 140,780 | |||||||||
Total deposits | 967,789 | 2,233 | 970,022 | |||||||||
Federal funds purchased and securities sold under agreements to repurchase | 12,739 | — | 12,739 | |||||||||
Federal Home Loan Bank advances | 72,890 | — | 72,890 | |||||||||
Other borrowings | — | — | — | |||||||||
Other liabilities (3) | 10,942 | 6,840 | 17,782 | |||||||||
Total liabilities acquired | 1,064,360 | 9,073 | 1,073,433 | |||||||||
Net assets acquired | $ | 88,026 | $ | 59,730 | $ | 147,756 | ||||||
Total consideration paid to First Security shareholders | 171,108 | |||||||||||
Goodwill | $ | 23,352 | ||||||||||
(1) Reflects core deposit intangible related to acquired deposits. | ||||||||||||
(2) Reflects the recognition of First Security's deferred tax assets totaling approximately $50 million and approximately $9 million in deferred tax assets established as a result of other purchase accounting adjustments. | ||||||||||||
(3) Reflects approximately $5 million in deferred tax liabilities established as a result of purchase accounting adjustments. | ||||||||||||
63
A summary of the consideration paid is as follows:
(in thousands) | Total Purchase Price Consideration | |||
Aggregate Cash Consideration | $ | 47,098 | ||
Aggregate Stock Consideration | 121,305 | |||
Consideration associated with converted stock awards | 2,705 | |||
Total Purchase Price Consideration | $ | 171,108 | ||
With this acquisition, the Company expanded its presence in the I-75 Corridor from Atlanta to Tennessee through the addition of twenty-five branches, a low-cost base of core deposits and an experienced in-market team that enhances the Company’s ability to grow in the Chattanooga/Knoxville market.
In the acquisition, the Company purchased $801.1 million of loans at fair value, net of $11.1 million, or 1.36%, estimated discount to the outstanding principal balance. Of the total loans acquired, management identified $24.7 million that were considered to be credit impaired and are accounted for under ASC 310-30. The table below summarizes the total contractually required principal and interest cash payment, management’s estimate of expected total cash payments and fair value of the loans as of acquisition date for purchased credit impaired loans. Contractually required principal and interest payment have been adjusted for estimated prepayments.
Contractually required principal and interest | $ | 31,856 | ||
Non-accretable difference | (4,550 | ) | ||
Cash flows expected to be collected | 27,306 | |||
Accretable yield | (2,566 | ) | ||
Total purchased credit-impaired loans acquired | $ | 24,740 | ||
At the acquisition date, the contractually required principal and interest of non-PCI loans accounted for under ASC 310-20 was $811.4 million. The fair value of these non-PCI loans at the acquisition date was $776.4 million.
The Company incurred transaction-related costs of $9.2 million during the year ended December 31, 2015 related to this acquisition, which were expensed as incurred as a component of non-interest expense. Transaction-related costs primarily include severance costs, professional services, data processing fees and other non-interest expenses.
The following table presents financial information regarding the former First Security operations included in our Consolidated Statements of Operations from the date of acquisition through December 31, 2015 under the column “Actual from acquisition date through December 31, 2015.” These amounts do not include direct costs as explained above. In addition, the following table presents pro forma information as if the acquisition had occurred on January 1, 2014 under the “Pro forma” columns. This pro forma information gives effect to certain adjustments, including purchase accounting fair value adjustments, amortization of core deposit and other intangibles and related income tax effects and is based on our historical results for the periods presented. Transaction-related costs related to the acquisition are not reflected in the pro forma amounts. The pro forma information does not necessarily reflect the results of operations that would have occurred had the Company acquired First Security at the beginning of 2014. Cost savings are also not reflected in the pro forma amounts for years ended December 31, 2015 and 2014, respectively.
64
Actual from Acquisition Date through December 31, 2015 | Pro Forma for the Year Ended December 31, | |||||||||||
(dollars in thousands) | 2015 | 2014 | ||||||||||
Net interest income | $ | 7,177 | $ | 72,773 | $ | 65,575 | ||||||
Non-interest income | 1,647 | 25,608 | 17,600 | |||||||||
Net (loss)/income | (1,258 | ) | 6,567 | 9,515 | ||||||||
Pro forma earnings per share: | ||||||||||||
Basic | $ | 0.27 | $ | 0.39 | ||||||||
Diluted | $ | 0.26 | $ | 0.38 | ||||||||
Divestiture of Branches
On December 17, 2015, the Bank entered into two separate definitive agreements to sell seven branches in the Bank’s Tennessee market. The agreement with First Freedom Bank includes the sale of three branches located in Algood, Cookeville and Gainesboro, Tennessee for a premium of 2.25%. The agreement with First Freedom Bank includes the sale of four branches in Athens, Lenoir City, Madisonville and Sweetwater, Tennessee for a premium of 3.50%. Both transactions are scheduled to close in the second quarter of 2016.
The following summarizes the branch assets held for sale and liabilities to be assumed as of December 31, 2015.
(dollars in thousands) | Athens Federal | First Freedom | Total | |||||||||
Branch loans held for sale | $ | 10,073 | $ | 25,397 | $ | 35,470 | ||||||
Branch premises held for sale | 3,050 | 4,150 | 7,200 | |||||||||
Branch deposits to be assumed | 102,858 | 110,552 | 213,410 | |||||||||
Number of branches | 4 | 3 | 7 | |||||||||
65
NOTE 4 – BALANCE SHEET OFFSETTING
Atlantic Capital enters into reverse repurchase agreements in order to invest short-term funds. The Company enters into repurchase agreements for short-term financing needs.
The following table presents a summary of amounts outstanding under reverse repurchase agreements and derivative financial instruments including those entered into in connection with the same counterparty under master netting agreements as of December 31, 2015 and 2014.
(in thousands) | Gross Amounts not Offset in the Balance Sheet | |||||||||||||||||||||||
December 31, 2015 | Gross Amounts of Recognized Assets | Gross Amounts Offset on the Balance Sheet | Net Asset Balance | Financial Instruments | Collateral Received | Net Amount | ||||||||||||||||||
Reverse repurchase agreements | $ | 13,666 | $ | — | $ | 13,666 | $ | — | $ | (13,666 | ) | $ | — | |||||||||||
Derivatives | 6,554 | — | 6,554 | — | — | 6,554 | ||||||||||||||||||
Total | $ | 20,220 | — | $ | 20,220 | $ | — | $ | (13,666 | ) | $ | 6,554 | ||||||||||||
Gross Amounts not Offset in the Balance Sheet | ||||||||||||||||||||||||
Gross Amounts of Recognized Liabilities | Gross Amounts Offset on the Balance Sheet | Net Liability Balance | Financial Instruments | Collateral Pledged | Net Amount | |||||||||||||||||||
Repurchase agreements | $ | 11,931 | $ | — | $ | 11,931 | $ | 14,744 | $ | (11,931 | ) | $ | — | |||||||||||
Derivatives | 6,163 | — | 6,163 | — | (13,508 | ) | — | |||||||||||||||||
Total | $ | 18,094 | $ | — | $ | 18,094 | $ | 14,744 | $ | (25,439 | ) | $ | — | |||||||||||
Gross Amounts not Offset in the Balance Sheet | ||||||||||||||||||||||||
December 31, 2014 | Gross Amounts of Recognized Assets | Gross Amounts Offset on the Balance Sheet | Net Asset Balance | Financial Instruments | Collateral Received | Net Amount | ||||||||||||||||||
Reverse repurchase agreements | $ | 45,623 | $ | — | $ | 45,623 | $ | — | $ | (45,623 | ) | $ | — | |||||||||||
Derivatives | 2,038 | — | 2,038 | — | — | 2,038 | ||||||||||||||||||
Total | $ | 47,661 | $ | — | $ | 47,661 | $ | — | $ | (45,623 | ) | $ | 2,038 | |||||||||||
Gross Amounts not Offset in the Balance Sheet | ||||||||||||||||||||||||
Gross Amounts of Recognized Liabilities | Gross Amounts Offset on the Balance Sheet | Net Liability Balance | Financial Instruments | Collateral Pledged | Net Amount | |||||||||||||||||||
Derivatives | $ | 1,888 | $ | — | $ | 1,888 | $ | — | $ | (2,590 | ) | $ | — | |||||||||||
66
NOTE 5 – SECURITIES
The following table presents the amortized cost, unrealized gains and losses, and fair value of securities available-for-sale at December 31, 2015 and December 31, 2014.
Available-for-sale | Amortized Cost | Gross Unrealized Gains | Gross Unrealized Losses | Fair Value | |||||||||||
(in thousands) | |||||||||||||||
December 31, 2015 | |||||||||||||||
Debt securities— | |||||||||||||||
U.S. Treasuries | $ | 4,952 | $ | 3 | $ | (33 | ) | $ | 4,922 | ||||||
U.S. Government agencies | 65,373 | 249 | (770 | ) | 64,852 | ||||||||||
U.S. states and political divisions | 27,751 | 301 | (262 | ) | 27,790 | ||||||||||
Trust preferred securities | 4,732 | — | (457 | ) | 4,275 | ||||||||||
Corporate debt securities | 20,653 | 52 | (188 | ) | 20,517 | ||||||||||
Residential mortgage-backed securities-agency | 226,142 | 1,019 | (3,296 | ) | 223,865 | ||||||||||
Total | $ | 349,603 | $ | 1,624 | $ | (5,006 | ) | $ | 346,221 | ||||||
December 31, 2014 | |||||||||||||||
Debt securities— | |||||||||||||||
U.S. Treasuries | $ | — | $ | — | $ | — | $ | — | |||||||
U.S. Government agencies | 15,265 | 70 | (115 | ) | 15,220 | ||||||||||
U.S. states and political divisions | 2,158 | 188 | — | 2,346 | |||||||||||
Trust preferred securities | 4,675 | — | (475 | ) | 4,200 | ||||||||||
Corporate debt securities | 16,150 | 178 | — | 16,328 | |||||||||||
Residential mortgage-backed securities-agency | 94,422 | 1,537 | (616 | ) | 95,343 | ||||||||||
Total | $ | 132,670 | $ | 1,973 | $ | (1,206 | ) | $ | 133,437 | ||||||
The following table presents the amortized cost and fair value of debt securities by contractual maturity at December 31, 2015. Actual maturities may differ from contractual maturities because borrowers may have the right to call or prepay obligations with or without call or prepayment penalties.
Available-For-Sale | |||||||
Amortized Cost | Fair Value | ||||||
(in thousands) | |||||||
Within 1 year | $ | 5,373 | $ | 5,368 | |||
Over 1 year through 5 years | 71,180 | 70,998 | |||||
5 years to 10 years | 24,571 | 24,786 | |||||
Over 10 years | 22,337 | 21,204 | |||||
123,461 | 122,356 | ||||||
Mortgage-backed residential securities | 226,142 | 223,865 | |||||
Total | $ | 349,603 | $ | 346,221 | |||
67
The following table summarizes available-for-sale securities in an unrealized loss position as of December 31, 2015 and December 31, 2014.
Less than 12 months | 12 months or greater | Totals | |||||||||||||||||||||
Available-For-Sale | Fair Value | Unrealized Losses | Fair Value | Unrealized Losses | Fair Value | Unrealized Losses | |||||||||||||||||
(in thousands) | |||||||||||||||||||||||
December 31, 2015 | |||||||||||||||||||||||
U.S. Treasuries | $ | — | $ | (33 | ) | $ | — | $ | — | $ | — | $ | (33 | ) | |||||||||
U.S. Government agencies | 24,380 | (526 | ) | 22,218 | (244 | ) | 46,598 | (770 | ) | ||||||||||||||
U.S. states and political divisions | 11,280 | (249 | ) | 2,248 | (13 | ) | 13,528 | (262 | ) | ||||||||||||||
Trust preferred securities | — | — | 4,275 | (457 | ) | 4,275 | (457 | ) | |||||||||||||||
Corporate debt securities | 15,168 | (188 | ) | — | — | 15,168 | (188 | ) | |||||||||||||||
Residential mortgage-backed securities | 143,611 | (2,634 | ) | 40,152 | (662 | ) | 183,763 | (3,296 | ) | ||||||||||||||
Totals | $ | 194,439 | $ | (3,630 | ) | $ | 68,893 | $ | (1,376 | ) | $ | 263,332 | $ | (5,006 | ) | ||||||||
December 31, 2014 | |||||||||||||||||||||||
U.S. Treasuries | $ | — | $ | — | $ | — | $ | — | $ | — | $ | — | |||||||||||
U.S. Government agencies | — | — | 4,883 | (115 | ) | 4,883 | (115 | ) | |||||||||||||||
U.S. states and political divisions | — | — | — | — | — | — | |||||||||||||||||
Trust preferred securities | — | — | 4,200 | (475 | ) | 4,200 | (475 | ) | |||||||||||||||
Corporate debt securities | — | — | — | — | — | — | |||||||||||||||||
Residential mortgage-backed securities | 15,429 | (90 | ) | 23,311 | (526 | ) | 38,740 | (616 | ) | ||||||||||||||
Totals | $ | 15,429 | $ | (90 | ) | $ | 32,394 | $ | (1,116 | ) | $ | 47,823 | $ | (1,206 | ) | ||||||||
At December 31, 2015, there were 165 available-for-sale securities that were in an unrealized loss position. Atlantic Capital does not intend to sell nor believes it will be required to sell securities in an unrealized loss position prior to the recovery of their amortized cost basis. Unrealized losses at December 31, 2015 and December 31, 2014 were attributable to changes in market interest rates.
Management evaluates securities for other-than-temporary impairment on a quarterly basis. Consideration is given to the length of time and the extent to which the fair value has been less than cost, the financial condition and near-term prospects of the issuer, among other factors. In analyzing an issuer’s financial condition, management considers whether the securities are issued by the federal government or its agencies, whether downgrades by bond rating agencies have occurred, and industry analysts’ reports. No impairment charges were recognized during the twelve months ended December 31, 2015 or 2014.
Realized gains and losses are derived using the specific identification method for determining the cost of securities sold. The following table summarizes securities sales activity for the years ended December 31, 2015 and 2014.
Twelve Months Ended December 31, | |||||||||
2015 | 2014 | ||||||||
(in thousands) | |||||||||
Proceeds from sales | $ | 23,088 | $ | 18,813 | |||||
Gross realized gains | $ | 10 | $ | 64 | |||||
Gross realized losses | — | (5 | ) | ||||||
Net gains on sales of securities | $ | 10 | $ | 59 | |||||
Investment securities with a carrying value of $39.3 million and $17.1 million were pledged to secure borrowings at December 31, 2015 and December 31, 2014, respectively.
68
NOTE 6 – LOANS AND ALLOWANCE FOR LOAN LOSSES
The composition of the loan portfolio as of December 31, 2015 and December 31, 2014, is summarized below.
December 31, 2015 | December 31, 2014 | ||||||
(in thousands) | |||||||
Loans held for sale | |||||||
TriNet loans held for sale | $ | 58,934 | $ | — | |||
Branch loans held for sale | 35,470 | — | |||||
Other loans held for sale | 1,061 | — | |||||
Total loans held for sale | $ | 95,465 | $ | — | |||
Loans held for investment | |||||||
Commercial loans: | |||||||
Commercial and industrial | $ | 467,083 | $ | 365,447 | |||
Commercial real estate | 846,413 | 439,071 | |||||
Construction and land | 166,358 | 82,567 | |||||
Mortgage warehouse loans | 84,350 | 116,939 | |||||
Total commercial loans | 1,564,204 | 1,004,024 | |||||
Residential: | |||||||
Residential mortgages | 110,381 | 1,320 | |||||
Home equity | 80,738 | 28,464 | |||||
Total residential loans | 191,119 | 29,784 | |||||
Consumer | 30,451 | 9,290 | |||||
Other | 6,901 | — | |||||
Total loans | 1,792,675 | 1,043,098 | |||||
Less net deferred fees and other unearned income | (2,006 | ) | (3,385 | ) | |||
Less allowance for loan losses | (18,905 | ) | (11,421 | ) | |||
Loans held for investment, net | $ | 1,771,764 | $ | 1,028,292 | |||
At December 31, 2015 and December 31, 2014, loans with a carrying value of $168.1 million and $209.1 million, respectively, were pledged as collateral to secure FHLB advances and the Federal Reserve discount window.
At December 31, 2015, the carrying value and outstanding balance of PCI loans accounted for under ASC 310-30 was $24.3 million and $28.3 million, respectively. The following table presents changes in the value of the accretable yield for acquired loans accounted for under ASC 310-30 (in thousands):
Year Ended | ||||
December 31, 2015 | ||||
Balance at beginning of period | $ | — | ||
Additions due to acquisitions | 2,566 | |||
Accretion | (197 | ) | ||
Balance at end of period | $ | 2,369 | ||
In addition to the accretable yield on PCI loans, the fair value adjustments on purchased loans outside the scope of ASC 310-30 are also accreted to interest income over the life of the loans. At December 31, 2015, the remaining accretable fair value discount on loans acquired through a business combination and not accounted for under ASC 310-30 was $6.1 million.
The allowance for loan losses represents management’s estimate of probable incurred losses in the loan portfolio as of the end of the period. It is comprised of specific reserves for impaired loans and a general allowance for pools of loans with similar characteristics not individually evaluated. The allowance is regularly evaluated for loan losses to maintain an adequate level to absorb probable current inherent losses in the loan portfolio. Factors contributing to the determination of the allowance include the credit worthiness of the borrower, changes in the value of pledged collateral, and general economic conditions. All loan commitments rated substandard or worse are specifically reviewed for loss potential. For loans deemed to be impaired, a specific allocation is assigned based on the losses expected to be realized from those loans.
69
The following table presents the balance and activity in the allowance for credit losses by portfolio segment for the years ended December 31, 2015 and 2014.
2015 | 2014 | |||||||||||||||||||||||||||||||
Twelve months ended December 31, | Commercial | Residential | Consumer | Total | Commercial | Residential | Consumer | Total | ||||||||||||||||||||||||
(in thousands) | ||||||||||||||||||||||||||||||||
Allowance for loan losses: | ||||||||||||||||||||||||||||||||
Beginning balance | $ | 10,967 | $ | 347 | $ | 107 | $ | 11,421 | $ | 10,346 | $ | 356 | $ | 113 | $ | 10,815 | ||||||||||||||||
Provision for loan losses | 6,041 | 1,634 | 360 | 8,035 | 503 | (9 | ) | (6 | ) | 488 | ||||||||||||||||||||||
Loans charged-off | (500 | ) | — | (128 | ) | (628 | ) | — | — | — | — | |||||||||||||||||||||
Recoveries | 29 | — | 48 | 77 | 118 | — | — | 118 | ||||||||||||||||||||||||
Total ending allowance balance | $ | 16,537 | $ | 1,981 | $ | 387 | $ | 18,905 | $ | 10,967 | $ | 347 | $ | 107 | $ | 11,421 | ||||||||||||||||
The general component of the allowance for loan losses is based on the incurred losses inherent in the portfolio. The loss factors are determined through the generation of probabilities of default (“PDs”) and losses given default (“LGDs”) for groups of similar loans with similar credit grades where Loss = PD x LGD. The PDs and LGDs for the loan portfolio are calculated based on Atlantic Capital’s loss history as well as available market-based data. The loss factor for each pool of loans is adjusted based on Qualitative and Environmental factors to account for conditions in the current environment which management believes are likely to cause a difference between the calculated loss based on historical performance and the incurred loss in the existing portfolio. These factors include: changes in policies and procedures, changes in the economy, changes in nature, volume of the portfolio and in the terms of loans, changes in lending management, changes in past dues and credit migration, changes in the loan review system, changes in the value of collateral and concentration risk and changes in external factors, such as competition, legal, regulatory, etc. On a quarterly basis, management evaluates these factors in order to determine an adjustment unique to Atlantic Capital and its market.
Charge-offs are recognized when the amount of the loss is quantifiable and timing is known. Collateral based loan charge-offs are measured based on the difference between the loan’s carrying value, including deferred fees, and the estimated net realizable value of the loan. When assessing property value for the purpose of determining a charge-off, a third-party appraisal or an independently derived internal evaluation is generally employed.
A loan is considered to be impaired when, based on current information and events, it is probable that all amounts due according to the contractual terms of the loan agreement will not be collected. Loans for which the terms have been modified resulting in a concession, and for which the borrower is experiencing financial difficulties, are considered TDRs and classified as impaired. Factors considered by management in determining impairment include payment status, collateral value, and the probability of collecting scheduled principal and interest payments when due. Loans that experience insignificant payment delays and payment shortfalls generally are not classified as impaired. Management determines the significance of payment delays and payment shortfalls on a case-by-case basis, taking into consideration all of the circumstances surrounding the loan and the borrower, including the length of the delay, the reasons for the delay, the borrower’s prior payment record, and the amount of the shortfall in relation to the principal and interest owed. A specific allowance is established for individually evaluated impaired loans as needed. Reserves on impaired loans are measured based on the present value of expected future cash flows discounted at the loan’s effective interest rate or the observable market price, or the fair value of the underlying collateral of the loan if the loan is collateral dependent.
Nonaccrual loans include both homogeneous loans that are collectively evaluated for impairment and individually evaluated impaired loans. Atlantic Capital’s policy is to place loans on nonaccrual status, when, in the opinion of management, the principal and interest on a loan is not likely to be repaid in accordance with the loan terms or when the loan becomes 90 days past due and is not well secured and in the process of collection. When a loan is classified on nonaccrual status, interest previously accrued but not collected is reversed against current interest revenue. Principal and interest payments received on a nonaccrual loan are applied to reduce outstanding principal.
PCI Loans are considered past due or delinquent when the contractual principal or interest due in accordance with the terms of the loan agreement remains unpaid after the due date of the scheduled payment. Loans accounted for under ASC 310-30 were not classified as nonaccrual at December 31, 2015 as the carrying value of the respective loan or pool of loans cash flows were considered estimable and probable of collection. Therefore, interest revenue, through accretion of the difference between the carrying value of the loans and the expected cash flows (accretable yield), is being recognized on all acquired loans being accounted for under ASC 310-30.
70
The balance in the allowance for loan losses and the recorded investment in loans by portfolio segment and based on impairment method is presented in the following table as of December 31, 2015 and December 31, 2014.
December 31, 2015 | Commercial | Residential | Consumer | Total | |||||||||||
(in thousands) | |||||||||||||||
Allowance for loan losses: | |||||||||||||||
Ending allowance balance attributable to loans | |||||||||||||||
Individually evaluated for impairment | $ | 1,619 | $ | — | $ | — | $ | 1,619 | |||||||
Collectively evaluated for impairment | 14,918 | 1,981 | 387 | 17,286 | |||||||||||
PCI | — | — | — | — | |||||||||||
Total ending allowance balance | $ | 16,537 | $ | 1,981 | $ | 387 | $ | 18,905 | |||||||
Loans: | |||||||||||||||
Loans individually evaluated for impairment | $ | 12,049 | $ | — | $ | — | $ | 12,049 | |||||||
Loans collectively evaluated for impairment | 1,534,507 | 184,447 | 37,323 | 1,756,277 | |||||||||||
PCI | 17,648 | 6,672 | 29 | 24,349 | |||||||||||
Total ending loans balance | $ | 1,564,204 | $ | 191,119 | $ | 37,352 | $ | 1,792,675 | |||||||
December 31, 2014 | Commercial | Residential | Consumer | Total | |||||||||||
(in thousands) | |||||||||||||||
Allowance for loan losses: | |||||||||||||||
Ending allowance balance attributable to loans | |||||||||||||||
Individually evaluated for impairment | $ | 885 | $ | — | $ | — | $ | 885 | |||||||
Collectively evaluated for impairment | 10,082 | 347 | 107 | 10,536 | |||||||||||
Total ending allowance balance | $ | 10,967 | $ | 347 | $ | 107 | $ | 11,421 | |||||||
Loans: | |||||||||||||||
Loans individually evaluated for impairment | $ | 6,601 | $ | — | $ | — | $ | 6,601 | |||||||
Loans collectively evaluated for impairment | 997,423 | 29,784 | 9,290 | 1,036,497 | |||||||||||
Total ending loans balance | $ | 1,004,024 | $ | 29,784 | $ | 9,290 | $ | 1,043,098 | |||||||
71
The following table presents information on Atlantic Capital’s impaired loans as of December 31, 2015 and December 31, 2014:
As of December 31, 2015 | As of December 31, 2014 | ||||||||||||||||||||||||||||||||||||||
Unpaid Principal Balance | Recorded Investment | Related Allowance | Average Balance of Recorded Investment | Interest Income Recognized | Unpaid Principal Balance | Recorded Investment | Related Allowance | Average Balance of Recorded Investment | Interest Income Recognized | ||||||||||||||||||||||||||||||
(in thousands) | |||||||||||||||||||||||||||||||||||||||
Impaired loans with no related allowance recorded: | |||||||||||||||||||||||||||||||||||||||
Commercial and industrial | $ | 2,706 | $ | 2,706 | $ | — | $ | 2,706 | $ | 265 | $ | — | $ | — | $ | — | $ | — | $ | — | |||||||||||||||||||
Commercial real estate | 1,659 | 1,659 | — | 1,659 | 55 | 1,661 | 1,661 | — | 1,700 | 56 | |||||||||||||||||||||||||||||
Construction and land | — | — | — | — | — | — | — | — | — | — | |||||||||||||||||||||||||||||
Residential mortgages | — | — | — | — | — | — | — | — | — | — | |||||||||||||||||||||||||||||
Home equity | — | — | — | — | — | — | — | — | — | — | |||||||||||||||||||||||||||||
Mortgage warehouse | — | — | — | — | — | — | — | — | — | — | |||||||||||||||||||||||||||||
Consumer | — | — | — | — | — | — | — | — | — | — | |||||||||||||||||||||||||||||
Total | $ | 4,365 | $ | 4,365 | $ | — | $ | 4,365 | $ | 320 | $ | 1,661 | $ | 1,661 | $ | — | $ | 1,700 | $ | 56 | |||||||||||||||||||
Impaired loans with an allowance recorded: | |||||||||||||||||||||||||||||||||||||||
Commercial and industrial | $ | 3,235 | $ | 3,235 | $ | 1,456 | $ | 3,235 | $ | 43 | $ | — | $ | — | $ | — | $ | — | $ | — | |||||||||||||||||||
Commercial real estate | 4,949 | 4,449 | 163 | 4,907 | 135 | 4,940 | 4,940 | 885 | 5,018 | 136 | |||||||||||||||||||||||||||||
Construction and land | — | — | — | — | — | — | — | — | — | — | |||||||||||||||||||||||||||||
Residential mortgages | — | — | — | — | — | — | — | — | — | — | |||||||||||||||||||||||||||||
Home equity | — | — | — | — | — | — | — | — | — | — | |||||||||||||||||||||||||||||
Mortgage warehouse | — | — | — | — | — | — | — | — | — | — | |||||||||||||||||||||||||||||
Consumer | — | — | — | — | — | — | — | — | — | — | |||||||||||||||||||||||||||||
Total | $ | 8,184 | $ | 7,684 | $ | 1,619 | $ | 8,142 | $ | 178 | $ | 4,940 | $ | 4,940 | $ | 885 | $ | 5,018 | $ | 136 | |||||||||||||||||||
Total impaired loans | $ | 12,549 | $ | 12,049 | $ | 1,619 | $ | 12,507 | $ | 498 | $ | 6,601 | $ | 6,601 | $ | 885 | $ | 6,718 | $ | 192 | |||||||||||||||||||
Atlantic Capital evaluates loans in accordance with ASC 310-40, Troubled Debt Restructurings by Creditors. TDRs are loans in which Atlantic Capital has modified the terms and granted an economic concession to a borrower who is experiencing financial difficulties. These modifications may include interest rate reductions, term extensions and other concessions intended to minimize losses.
As of December 31, 2015 and 2014, the Company had a recorded investment in TDRs of $9.1 million and $6.6 million, respectively. During the year ended December 31, 2015, the modification of the terms included an extension of the maturity date at a stated rate of interest lower than the current market rate and a commitment to lend an additional $300,000. The extension was for a period of five and a half months.
72
The Company did not modify any loans as a TDR during the year ended December 31, 2014. Loans, by portfolio class, modified as TDRs during the year ended December 31, 2015, are as follows (in thousands):
Number of Loans | Pre-Modification Outstanding Recorded Investment | Post-Modification Outstanding Recorded Investment | |||
December 31, 2015 | |||||
Commercial and industrial | 1 | $2,706 | $2,706 | ||
Total | 1 | $2,706 | $2,706 | ||
The Company did not forgive any principal on TDRs during the years ended December 31, 2015 and 2014, and there were no subsequent defaults.
The Bank conducts transactions with its directors and executive officers, including companies in which such officers or directors have beneficial interests. The following is a summary of activity with respect to related-party loans in 2015 and 2014 (in thousands).
2015 | 2014 | ||||||
Balance at January 1, | $ | 8,530 | $ | 8,728 | |||
Additions | 6,423 | 6,017 | |||||
Repayments | (7,062 | ) | (6,215 | ) | |||
Transactions due to changes in related party | (4,421 | ) | — | ||||
Balance at December 31, | $ | 3,470 | $ | 8,530 | |||
Atlantic Capital individually rates loans based on internal credit risk ratings using numerous factors, including thorough analysis of historical and expected cash flows, consumer credit risk scores (FICO scores), rating agency information, LTV ratios, collateral, collection experience, and other internal metrics. Atlantic Capital uses a dual rating system. The likelihood of default of a credit transaction is graded in the Obligor Rating. The risk of loss given default is graded in the Facility Rating. The Obligor Rating is determined through thorough credit analysis. Facility Ratings are used to describe the value to the bank that the collateral represents. Facility Ratings are based on the collateral package or market expectations regarding the value or liquidity of the collateral. Ratings are generally reviewed at least annually or more frequently if there is a material change in creditworthiness. Exceptions to this policy may include well collateralized term loans and loans to individuals with limited exposure or complexity.
Atlantic Capital uses the following definitions for risk ratings:
Pass: Loans that are analyzed individually as part of the above described process and that do not meet the criteria of special mention, substandard or doubtful.
Special Mention: Loans classified as special mention have a potential weakness that requires management’s close attention. If left uncorrected, these potential weaknesses may result in deterioration of the repayment prospects for the loan or of the institution’s credit position at some future date.
Substandard: Loans classified as substandard are inadequately protected by the current net worth and paying capacity of the obligor or of the collateral pledged, if any. Loans so classified have a well-defined weakness or weaknesses that jeopardize the liquidation of the debt. They are characterized by the distinct possibility that the institution will sustain some loss if the deficiencies are not corrected.
Doubtful: Loans classified as doubtful have all the weaknesses inherent in those classified as substandard, with the added characteristic that the weaknesses make collection or liquidation in full, on the basis of currently existing facts, conditions, and values, highly questionable and improbable.
73
As of December 31, 2015 and December 31, 2014, and based on the most recent analysis performed, the risk category of loans by class of loans is as follows.
Pass | Special Mention | Substandard Accruing | Substandard Nonaccruing | Doubtful Nonaccruing | Total | ||||||||||||||||||
(in thousands) | |||||||||||||||||||||||
December 31, 2015 | |||||||||||||||||||||||
Commercial and industrial | $ | 450,523 | $ | 2,507 | $ | 2,707 | $ | 3,235 | $ | — | $ | 458,972 | |||||||||||
Commercial real estate | 826,339 | 5,411 | 1,659 | 4,449 | — | 837,858 | |||||||||||||||||
Construction and Land | 161,226 | 4,150 | — | — | — | 165,376 | |||||||||||||||||
Residential mortgages | 105,948 | — | 200 | — | — | 106,148 | |||||||||||||||||
Home equity | 78,189 | — | 110 | — | — | 78,299 | |||||||||||||||||
Mortgage warehouse | 84,350 | — | — | — | — | 84,350 | |||||||||||||||||
Consumer/Other | 37,312 | 11 | — | — | — | 37,323 | |||||||||||||||||
Total loans, excluding PCI loans | $ | 1,743,887 | $ | 12,079 | $ | 4,676 | $ | 7,684 | $ | — | $ | 1,768,326 | |||||||||||
Commercial and industrial | $ | — | $ | 5,142 | $ | 2,786 | $ | 183 | $ | — | $ | 8,111 | |||||||||||
Commercial real estate | 1,063 | 850 | 5,465 | 1,177 | — | 8,555 | |||||||||||||||||
Construction and Land | 27 | 354 | 601 | — | — | 982 | |||||||||||||||||
Residential mortgages | — | 1,929 | 2,053 | 251 | — | 4,233 | |||||||||||||||||
Home equity | — | 1,606 | 492 | 341 | — | 2,439 | |||||||||||||||||
Mortgage warehouse | — | — | — | — | — | — | |||||||||||||||||
Consumer/Other | — | 15 | 13 | 1 | — | 29 | |||||||||||||||||
Total PCI loans | $ | 1,090 | $ | 9,896 | $ | 11,410 | $ | 1,953 | $ | — | $ | 24,349 | |||||||||||
Pass | Special Mention | Substandard Accruing | Substandard Nonaccruing | Doubtful Nonaccruing | Total | ||||||||||||||||||
(in thousands) | |||||||||||||||||||||||
December 31, 2014 | |||||||||||||||||||||||
Commercial and industrial | $ | 351,596 | $ | 10,724 | $ | 3,127 | $ | — | $ | — | $ | 365,447 | |||||||||||
Commercial real estate | 427,200 | 661 | 11,210 | — | — | 439,071 | |||||||||||||||||
Construction and Land | 82,567 | — | — | — | — | 82,567 | |||||||||||||||||
Residential mortgages | 1,120 | — | 200 | — | — | 1,320 | |||||||||||||||||
Home equity | 28,404 | — | 60 | — | — | 28,464 | |||||||||||||||||
Mortgage warehouse | 116,939 | — | — | — | — | 116,939 | |||||||||||||||||
Consumer | 9,290 | — | — | — | — | 9,290 | |||||||||||||||||
Total loans | $ | 1,017,116 | $ | 11,385 | $ | 14,597 | $ | — | $ | — | $ | 1,043,098 | |||||||||||
74
Atlantic Capital monitors loans by past due status. The following table presents the aging of the recorded investment in past due loans as of December 31, 2015 and December 31, 2014 by class of loans.
As of December 31, 2015 | |||||||||||||||||||||||
Accruing Current | 30-89 Days Past Due | Accruing 90+ Days Past Due | Nonaccruing | PCI Loans | Total | ||||||||||||||||||
(in thousands) | |||||||||||||||||||||||
Loans by Classification | |||||||||||||||||||||||
Commercial and industrial | $ | 455,647 | $ | — | $ | 90 | $ | 3,235 | $ | 8,111 | $ | 467,083 | |||||||||||
Commercial real estate | 832,845 | — | 564 | 4,449 | 8,555 | 846,413 | |||||||||||||||||
Construction and land | 165,376 | — | — | — | 982 | 166,358 | |||||||||||||||||
Residential mortgages | 106,042 | 106 | — | — | 4,233 | 110,381 | |||||||||||||||||
Home equity | 78,299 | — | — | — | 2,439 | 80,738 | |||||||||||||||||
Mortgage warehouse | 84,350 | — | — | — | — | 84,350 | |||||||||||||||||
Consumer | 37,082 | 30 | 123 | 88 | 29 | 37,352 | |||||||||||||||||
Total Loans | $ | 1,759,641 | $ | 136 | $ | 777 | $ | 7,772 | $ | 24,349 | $ | 1,792,675 | |||||||||||
As of December 31, 2014 | |||||||||||||||||||||||
Accruing Current | 30-89 Days Past Due | Accruing 90+ Days Past Due | Nonaccruing | PCI Loans | Total | ||||||||||||||||||
(in thousands) | |||||||||||||||||||||||
Loans by Classification | |||||||||||||||||||||||
Commercial and industrial | $ | 365,447 | $ | — | $ | — | $ | — | $ | — | $ | 365,447 | |||||||||||
Commercial real estate | 439,071 | — | — | — | — | 439,071 | |||||||||||||||||
Construction and land | 82,567 | — | — | — | — | 82,567 | |||||||||||||||||
Residential mortgages | 1,320 | — | — | — | — | 1,320 | |||||||||||||||||
Home equity | 28,464 | — | — | — | — | 28,464 | |||||||||||||||||
Mortgage warehouse | 116,939 | — | — | — | — | 116,939 | |||||||||||||||||
Consumer | 9,290 | — | — | — | — | 9,290 | |||||||||||||||||
Total Loans | $ | 1,043,098 | $ | — | $ | — | $ | — | $ | — | $ | 1,043,098 | |||||||||||
NOTE 7 – PREMISES AND EQUIPMENT
Premises and equipment consist of the following:
As of December 31, | |||||||||
Useful Life | 2015 | 2014 | |||||||
(in thousands) | |||||||||
Land and improvements | $ | 4,128 | $ | — | |||||
Buildings and improvements | 40 years | 12,721 | — | ||||||
Leasehold Improvements | 10-11 years | 3,272 | 3,481 | ||||||
Equipment and furniture | 1-10 years | 10,085 | 6,024 | ||||||
Projects in Process | 46 | 79 | |||||||
Premises and equipment-gross | 30,252 | 9,584 | |||||||
Accumulated depreciation | (7,107 | ) | (5,972 | ) | |||||
Premises and equipment-net | $ | 23,145 | $ | 3,612 | |||||
75
Depreciation expense was $1.06 million, $875,000 and $811,000 in 2015, 2014, and 2013, respectively.
Branch premises held for sale totaled $7.2 million, represents the appraised value of seven branches to be divested in the second quarter of 2016.
NOTE 8 – GOODWILL AND INTANGIBLE ASSETS
The carrying amount of goodwill and other intangible assets is summarized below:
December 31, | ||||||||
2015 | 2014 | |||||||
(in thousands) | ||||||||
Core deposit intangible | $ | 9,544 | $ | — | ||||
Less: accumulated amortization | (526 | ) | — | |||||
Core deposit intangible, net | 9,018 | — | ||||||
Servicing assets, net | 2,862 | 782 | ||||||
Total intangibles subject to amortization, net | 11,880 | 782 | ||||||
Goodwill | 23,352 | — | ||||||
Total goodwill and other intangible assets, net | $ | 35,232 | $ | 782 | ||||
The amortization expense for core deposit intangible for 2015, 2014, and 2013 was $526,000, $0, and $0, respectively, which was recognized in operating expenses. The estimated aggregate amortization expense for future periods for the core deposit intangible is as follows:
Year | Core Deposit Intangible Amortization | |||
(in thousands) | ||||
2016 | $ | 2,845 | ||
2017 | 2,307 | |||
2018 | 1,770 | |||
2019 | 1,232 | |||
2020 | 695 | |||
Thereafter | 169 | |||
Total | $ | 9,018 | ||
NOTE 9 – SERVICING RIGHTS
SBA Servicing Rights
SBA servicing rights are initially recorded at fair value. Subsequently, Atlantic Capital accounts for SBA servicing rights using the amortization method and they are included in other assets. As of December 31, 2015 and 2014, the balance of SBA loans sold and serviced by Atlantic Capital totaled $65.9 million and $30.6 million, respectively.
76
Changes in the balance of SBA servicing assets for the years ended December 31, 2015 and 2014 are presented in the following table.
SBA Loan Servicing Rights | Twelve months ended December 31, | |||||||
2015 | 2014 | |||||||
(in thousands) | ||||||||
Beginning carrying value, net | $ | 782 | $ | 36 | ||||
Acquired from First Security | 152 | — | ||||||
Additions | 939 | 799 | ||||||
Amortization | (186 | ) | (46 | ) | ||||
Impairment | — | (7 | ) | |||||
Ending carrying value | $ | 1,687 | $ | 782 | ||||
At December 31, 2015, the sensitivity of the fair value of the SBA loan servicing rights to immediate changes in key economic assumptions are presented in the table below.
Sensitivity of the SBA Servicing Asset | December 31, 2015 | ||||
(dollars in thousands) | |||||
Fair value of retained servicing assets | $ | 1,737 | |||
Weighted average life | 6.97 years | ||||
Prepayment speed: | 7.62 | % | |||
Decline in fair value due to a 10% adverse change | $ | (55 | ) | ||
Decline in fair value due to a 20% adverse change | $ | (100 | ) | ||
Weighted average discount rate | 11.71 | % | |||
Decline in fair value due to a 100 bps adverse change | $ | (63 | ) | ||
Decline in fair value due to a 200 bps adverse change | $ | (116 | ) | ||
The above sensitivities are hypothetical and should be used with caution. As the amounts indicate, changes in fair value based on valuation assumptions generally cannot be extrapolated because the relationship of the change in assumption to the change in fair value may not be linear. Also, the effect of a variation in a particular assumption on the fair value of the retained interest is calculated without changing any other assumption. In reality, changes in one factor may result in changes in another, which might magnify or counteract the sensitivities.
TriNet Servicing Rights
Changes in the balance of TriNet servicing assets for the years ended December 31, 2015 and 2014 are presented in the following table.
TriNet Servicing Rights | Twelve months ended December 31, | |||||||
2015 | 2014 | |||||||
(in thousands) | ||||||||
Beginning carrying value, net | $ | — | $ | — | ||||
Acquired from First Security | 838 | — | ||||||
Additions | 362 | — | ||||||
Amortization | (25 | ) | — | |||||
Ending carrying value | $ | 1,175 | $ | — | ||||
77
NOTE 10 - DEPOSITS
December 31, | |||||||
2015 | 2014 | ||||||
(in thousands) | |||||||
Non-interest bearing demand deposits | $ | 544,561 | $ | 320,346 | |||
Interest-bearing demand deposits | 232,868 | 91,709 | |||||
Savings and money market deposits | 904,363 | 304 | |||||
Time deposits less than $250,000 | 154,687 | 572,658 | |||||
Time deposits $250,000 or greater | 28,519 | 16,129 | |||||
Brokered deposits | 183,810 | 104,699 | |||||
Total Deposits | $ | 2,048,808 | $ | 1,105,845 | |||
Deposits to be assumed in branch sales | $ | 213,410 | $ | — | |||
Deposits to be assumed in branch sales totaled $213.4 million at December 31, 2015, and represent deposits at seven First Security branches scheduled to be sold in the second quarter of 2016.
Brokered certificate of deposits issued in denominations of $100,000 or more are participated out by the deposit brokers in shares of $100,000 or less.
Overdrawn deposits accounts reclassified as loans were $319,000 and $46,000 at December 31, 2015 and 2014, respectively. There were $46.7 million and $11.2 million in investment securities pledged to secure public deposits as of December 31, 2015 and 2014, respectively.
Deposits of certain officers, directors, and their associates totaled $5.3 million and $5.2 million as of December 31, 2015 and 2014, respectively.
The scheduled maturities of time and brokered deposits as of December 31, 2015 are as follows (dollars in thousands):
Time | Brokered | ||||||
2016 | $ | 94,329 | $ | 156,011 | |||
2017 | 38,139 | 12,377 | |||||
2018 | 17,830 | 10,324 | |||||
2019 | 22,103 | 2,527 | |||||
2020 | 9,235 | 2,571 | |||||
Thereafter | 1,570 | — | |||||
Total | $ | 183,206 | $ | 183,810 | |||
78
NOTE 11 – SUBORDINATED DEBT AND OTHER BORROWINGS
Borrowings as of December 31, 2015 and 2014 are as follows:
December 31, 2015 | December 31, 2014 | ||||||||||
Balance | Interest Rate | Balance | Interest Rate | ||||||||
(in thousands) | |||||||||||
FHLB short-term borrowings: | |||||||||||
Fixed rate advance maturing January 2, 2015 | — | — | % | 24,000 | 0.21 | % | |||||
Fixed rate advance maturing January 12, 2015 | — | — | % | 25,000 | 0.21 | % | |||||
Fixed rate advance maturing July 22, 2015 | — | — | % | 7,517 | 4.30 | % | |||||
Total | $ | — | $ | 56,517 | |||||||
Federal Funds purchased and securities sold under agreements to repurchase | |||||||||||
Securities sold under agreements to repurchase | 11,931 | 0.20%-.50% | — | — | % | ||||||
Total Short-Term Borrowings | $ | 11,931 | $ | 56,517 | |||||||
December 31, 2015 | December 31, 2014 | ||||||||||
Subordinated Debt: | (in thousands) | ||||||||||
Floating rate 10 year capital securities, with interest paid semi-annually at an annual fixed rate of 6.25% until September 30, 2020 | $ | 50,000 | $ | — | |||||||
Less: debt issuance costs | 803 | — | |||||||||
Subordinated debt, net | $ | 49,197 | $ | — | |||||||
During 2015, the Company paid off $56 million of short term borrowings maturing in 2015. Interest expense for FHLB borrowings for the years ended December 31, 2015, 2014, and 2013 was $290,000, $437,000, $467,000, respectively.
At December 31, 2015, the Company had available line of credit commitments with the FHLB totaling $228.5 million, of which $0 was advanced. However, based on actual collateral pledged, $72.1 million was available. At December 31, 2015, the Company had an available line of credit based on the collateral available of $114.2 million with the Federal Reserve Bank of Atlanta. Interest expense on federal funds purchased for the years ended December 31, 2015, 2014, and 2013 were $73,000, $123,000, and $32,000, respectively.
Securities sold under agreements to repurchase represent the purchase of interests in securities by commercial checking customers. The Company may also enter into structured repurchase agreements with other financial institutions. Repurchase agreements with commercial checking customers are settled the following business day, while structured repurchase agreements with other financial institutions have varying terms.
At December 31, 2015 and 2014, the Company had securities sold under agreements to repurchase of $11.9 million and $0, respectively, by commercial checking customers. Securities sold under agreements to repurchase are held in safekeeping for the Company and had a carrying value of approximately $14.7 million at December 31, 2015. Interest expense for 2015 relating to these agreements was $6,000.
On September 28, 2015, Atlantic Capital issued subordinated notes (the “Notes”) totaling $50.0 million in aggregate principal amount. The Notes are due September 30, 2025 and bear a fixed rate of interest of 6.25% per year until September 29, 2020. As of the first call date, September 30, 2020, to the maturity date, the interest rate will be a floating rate equal to the three-month LIBOR plus 468 basis points. The Notes were priced at 100% of their par value. The Notes qualify as Tier 2 regulatory capital. Subordinated debentures mature September 30, 2025 and thereby mature after more than five years.
NOTE 12 – OTHER COMPREHENSIVE INCOME (LOSS)
Other comprehensive income (loss) for Atlantic Capital consists of changes in net unrealized gains and losses on investment securities available-for-sale and derivatives. The following tables present a summary of the changes in accumulated other comprehensive income (loss) balances for the applicable periods.
79
For the Twelve Months Ended | |||||||||||||||||||||||
December 31, 2015 | December 31, 2014 | ||||||||||||||||||||||
Pre-Tax Amount | Income Tax (Expense) Benefit | After-Tax Amount | Pre-Tax Amount | Income Tax (Expense) Benefit | After-Tax Amount | ||||||||||||||||||
(in thousands) | |||||||||||||||||||||||
Accumulated other comprehensive income (loss) beginning of period | $ | 986 | $ | (377 | ) | $ | 609 | $ | (2,026 | ) | $ | 760 | $ | (1,266 | ) | ||||||||
Unrealized net (losses) gains on investment securities available-for-sale | (4,126 | ) | 1,578 | (2,548 | ) | 2,852 | (1,075 | ) | 1,777 | ||||||||||||||
Reclassification adjustment for net realized gains on investment securities available-for-sale | (10 | ) | 4 | (6 | ) | (59 | ) | 22 | (37 | ) | |||||||||||||
Unrealized net gains on derivatives | 695 | (266 | ) | 429 | 219 | (84 | ) | 135 | |||||||||||||||
Accumulated other comprehensive (loss) income end of period | $ | (2,455 | ) | $ | 939 | $ | (1,516 | ) | $ | 986 | $ | (377 | ) | $ | 609 | ||||||||
NOTE 13 – EARNINGS PER COMMON SHARE
Basic earnings per share amounts are computed by dividing net income by the weighted average number of shares of common stock outstanding.
Diluted earnings per share amounts are computed by dividing net income by the weighted average number of shares of common stock outstanding and the dilutive effects of the shares awarded under the stock option plan, based on the treasury stock method using an average fair market value of the stock during the respective periods.
The following table represents the earnings per share calculations for the years ended December 31, 2015, 2014, and 2013.
Twelve Months Ended | ||||||||||||
December 31, | ||||||||||||
2015 | 2014 | 2013 | ||||||||||
(in thousands, except per share amounts) | ||||||||||||
Net income available to common shareholders | $ | (1,319 | ) | $ | 7,516 | $ | 5,143 | |||||
Weighted average shares outstanding | ||||||||||||
Basic (1) | 15,283,437 | 13,445,122 | 13,420,599 | |||||||||
Effect of diluted securities: | ||||||||||||
Stock options and warrants | 380,428 | 196,760 | 111,353 | |||||||||
Diluted | 15,663,865 | 13,641,882 | 13,531,952 | |||||||||
Income per common share: | ||||||||||||
Basic | $ | (0.09 | ) | $ | 0.56 | $ | 0.38 | |||||
Diluted | $ | (0.09 | ) | $ | 0.55 | $ | 0.38 | |||||
(1) Unvested restricted shares are participating securities and included in basic share calculations.
There is no dilution from dilutive securities for the year ended December 31, 2015, due to the anti-dilutive effect of the net loss for that period.
The Amended and Restated Articles of Incorporation of Atlantic Capital, which were approved by the Board of Directors on March 24, 2015 and by Atlantic Capital’s shareholders on May 21, 2015, authorized Atlantic Capital to issue 110,000,000 shares of capital stock, of which 10,000,000 shares are designated as preferred stock, no par value per share, and 100,000,000 shares are designated as common stock, no par value per share. Prior periods have been restated to reflect the change in the par value of the common stock from $1 to no par value.
80
The authorized capital stock of Atlantic Capital consists of 100,000,000 shares of common stock, no par value. The Bank had 24,425,546 and 13,453,820 shares of common stock issued and outstanding at December 31, 2015 and 2014, respectively.
The primary source of funds available to Atlantic Capital is payments of dividends from the Bank. The Bank has not paid any dividends to Atlantic Capital in 2015 or 2014. Banking laws and other regulations limit the amount of dividends a bank subsidiary may pay without prior regulatory approval. Until May 2014, the Bank was prohibited from paying any dividends to Atlantic Capital without prior approval from the Georgia Banking Department, due to the Bank’s de novo status. Additionally, Atlantic Capital’s ability to pay dividends to its shareholders will depend on the ability of the Bank to pay dividends to Atlantic Capital. The Bank is subject to regulatory restrictions on the payment of cash dividends, which generally may be paid only from current earnings.
NOTE 14 – INCOME TAXES
The components of income tax expense included in the Consolidated Statements of Operations for the years ended were as follows (in thousands):
(in thousands) | 2015 | 2014 | 2013 | ||||||||
Current income tax expense: | |||||||||||
Federal | $ | 1,204 | $ | 3,677 | $ | 2,828 | |||||
State | 270 | 455 | 80 | ||||||||
Total | 1,474 | 4,132 | 2,908 | ||||||||
Deferred income tax expense (benefit): | |||||||||||
Federal | (504 | ) | (297 | ) | (444 | ) | |||||
State | (176 | ) | 22 | 51 | |||||||
Total | (680 | ) | (275 | ) | (393 | ) | |||||
Total income tax | $ | 794 | $ | 3,857 | $ | 2,515 | |||||
The income tax expense differs from the statutory rate of 35% in 2015 and 2014, and 34% in 2013, as indicated in the following analysis:
(in thousands) | 2015 | 2014 | 2013 | |||||||||
Tax expense based on federal statutory rate | $ | (184 | ) | $ | 3,981 | $ | 2,604 | |||||
State expense taxes, net of federal benefit | (78 | ) | 343 | 262 | ||||||||
Income tax credits | (48 | ) | (101 | ) | (219 | ) | ||||||
Tax-exempt earnings | (791 | ) | (348 | ) | (302 | ) | ||||||
Nondeductible merger related expenses | 1,152 | — | — | |||||||||
Excess parachute payments under Section 280G | 319 | — | — | |||||||||
Nondeductible expenses | 441 | — | — | |||||||||
Federal rate adjustment | (27 | ) | (136 | ) | — | |||||||
Change in uncertain tax positions reserve | 79 | 41 | — | |||||||||
Other | (69 | ) | 77 | 170 | ||||||||
$ | 794 | $ | 3,857 | $ | 2,515 | |||||||
81
Deferred income tax assets and liabilities result from differences between assets and liabilities measured for financial reporting purposes and for income tax return purposes. These assets and liabilities are measured using the enacted tax rates and laws. The net deferred tax asset is included as a component of other assets at December 31, 2015 and 2014, and is comprised of the following:
(in thousands) | 2015 | 2014 | ||||||
Net operating loss carryforward | $ | 50,432 | $ | — | ||||
Federal tax credits | 5,546 | — | ||||||
State credits | 17 | 17 | ||||||
Allowance for loan losses | 7,479 | 4,374 | ||||||
Stock-based compensation | 1,566 | 1,515 | ||||||
Deferred loan fees and costs, net | 1,172 | 1,024 | ||||||
Other real estate owned | 795 | — | ||||||
Goodwill and other intangibles | 308 | — | ||||||
Transaction costs | 1,704 | — | ||||||
Unfunded commitments | 263 | — | ||||||
Organizational costs | 326 | 374 | ||||||
Net unrealized losses on investment securities available‑for‑sale | 397 | — | ||||||
Long term incentive plan | 691 | 644 | ||||||
Other | 921 | 347 | ||||||
Total gross deferred tax assets | 71,617 | 8,295 | ||||||
Less: valuation allowance | (9,454 | ) | — | |||||
Net deferred tax asset | 62,163 | 8,295 | ||||||
Net unrealized gains on investment securities available‑for‑sale | — | 294 | ||||||
Unrealized gains on cash flow hedges | 351 | 84 | ||||||
Depreciation | 1,254 | 683 | ||||||
Other | 630 | 19 | ||||||
Total gross deferred tax liabilities | 2,235 | 1,080 | ||||||
Net deferred tax assets | $ | 59,928 | $ | 7,215 | ||||
In assessing the realizability of deferred tax assets, management considers whether it is more‑likely-than-not that some portion or all of the deferred tax assets will not be realized. A valuation allowance is provided when it is deemed more likely than not that some portion, or all, of the deferred tax asset will not be realized. In assessing the ability to realize the deferred tax assets, management considers the four possible sources of taxable income including future reversals of existing taxable temporary differences, future taxable income, taxable income in prior carryback years and tax-planning strategies that would, if necessary, be implemented. No valuation allowance was deemed necessary as of December 31, 2014 and 2013. At December 31, 2015, as the Company recorded a valuation allowance of $9.5 million. This valuation allowance relates to the portion of net operating losses and credits that the Company will not be able to utilize due to limitations under Section 382 of the Internal Revenue Code.
ASC 740-10-65 prescribes a recognition threshold and a measurement attribute for the financial statement recognition and measurement of a tax position taken or expected to be taken in a tax return. The Company has reviewed and evaluated the relevant technical merits of each of its tax positions in accordance with ASC 740-10-65, and determined that there are no uncertain tax positions that would have a material impact on the financial statements of the Company as of December 31, 2015.
82
A reconciliation of the beginning and ending unrecognized tax benefit related to uncertain tax positions is as follows:
(in thousands) | 2015 | 2014 | ||||||
Balance at beginning of year | $ | 149 | $ | — | ||||
Additions based on tax positions related to the current year | 163 | 149 | ||||||
Balance at end of year | $ | 312 | $ | 149 | ||||
The amount of unrecognized tax positions that would have impacted the effective tax rate if recognized was $121,000. The Company believes that it is reasonably possible that approximately $127,000 of its currently remaining unrecognized tax positions may be recognized by the end of 2016 as a result of the filing of amended returns.
With the adoption of ASC 740-10-65, the Company elected to recognize accrued interest and penalties related to any future unrecognized tax benefits in current income tax expense. No interest or penalties were accrued as of December 31, 2014. Interest in the amount of $7,000 was accrued as of December 31, 2015.
At December 31, 2015, Atlantic Capital has operating loss carryforwards for federal income tax purposes of $126.8 million which are available to offset future federal taxable income, if any, through 2035. Atlantic Capital has operating loss carryforwards for state income tax purposes of $145.7 million, which are available to offset future state taxable income, if any, through 2035 In addition, Atlantic Capital has general business credits of approximately $5.4 million, which are available to reduce future federal income taxes, if any through 2035. Atlantic Capital has alternative minimum tax credit carryforwards of approximately $162,000 available to reduce future federal regular income taxes, if any, over an indefinite period.
The Company’s income tax returns remain subject to examination by both U.S. federal and state jurisdictions for tax years 2012 forward.
NOTE 15 - EMPLOYEE AND DIRECTOR BENEFIT PLANS
Defined Contribution Plan
Atlantic Capital sponsors a 401(k) qualified retirement plan that is qualified pursuant to Section 401 of the Internal Revenue Code. The plan is referred to as a “safe harbor 401(k) plan.” The plan allows eligible employees to defer a portion of their income by making contributions into the plan on a pretax basis. The plan provides for a safe harbor contribution by Atlantic Capital. If the Company elects to make the safe harbor contribution, it will be at least 3% of eligible employees’ compensation that is subject to income tax and paid during the plan year. Eligible employees are not required to participate in the plan in order to receive the safe harbor contribution. The plan also provides that the Board of Directors may authorize matching contributions based on a percentage of the amount contributed by the employee and discretionary profit sharing contributions. Employees of the Company must meet certain requirements concerning minimum age and credited period of service to participate in the plan. During the years ended December 31, 2015, 2014, and 2013, the Company contributed approximately $431,000, $428,000, and $376,000, respectively, to this plan under its safe harbor provision.
Long-Term Incentive Plan
In 2012, Atlantic Capital initiated a long-term incentive plan for certain key employees. Bonuses under the Executive Officers Long Term Incentive Plan (the “LTI Plan”) may be paid in lump sum in cash or in common stock or in any combination of cash and common stock. Awards are granted under the LTI Plan for a bonus period, which means a period of more than one year. Awards are based on individual performance, business unit or division performance or Company-wide performance, or any combination of these performance objectives. Awards granted in 2015, 2014, and 2013 cliff vest over a three year period from the date of the awards. Compensation expense for the LTI Plan was $1,942,000, $1,624,000, and $924,000 for the years ended December 31, 2015, 2014, and 2013, respectively. These awards are accounted for as liabilities and remeasured at each reporting date.
Stock Incentive Plans
Atlantic Capital sponsors a stock incentive plan for the benefit of directors and employees. Under the Company’s 2015 Stock Incentive Plan there were 4,525,000 shares reserved for issuance to directors and employees. The Compensation Committee has the authority to grant the following: an incentive or nonqualified option; a restricted stock award (including a restricted stock award or a restricted unit award); a performance award (including a performance share award or a performance unit award); a phantom stock award; a dividend equivalent award; or any other award granted under the plan.
83
As of December 31, 2015, approximately 500,000 additional awards could be granted under the plan. Through December 31, 2015, incentive stock options, nonqualified stock options, restricted and non-restricted stock awards have been granted under the plan. Stock options are granted at a price which is no less than the fair market value of a share of Atlantic Capital common stock on the grant date. Stock options generally vest over three years and expire after ten years.
As of December 31, 2015, 2014, and 2013, warrants for 588,000 shares were outstanding for the purchase of common stock at a price of $10.00 per warrant. The warrants were issued as of May 14, 2007, the date of issuance of common stock sold in the initial private placement, and are exercisable for a period of ten years years following the issuance.
The Company accounts for stock options and warrants in accordance with FASB ASC 718, Stock Compensation, which requires the Company to recognize the costs of its employee stock option awards and warrants in its Consolidated Statements of Operations. According to ASC 718, the total cost of the Company’s share‑based awards is equal to their grant date fair value and is recognized as expense on a straight-line basis over the vesting period of the awards. Total stock-based compensation expense recognized by the Company during 2015, 2014, and 2013 for stock option grants and warrants was $1.2 million, $27,000, and $228,000, respectively. Unrecognized stock-based compensation expense related to stock option grants and warrants at December 31, 2015, 2014, and 2013 was $2.7 million, $0, and $21,000 respectively. At December 31, 2015, 2014, and 2013, the weighted average period over which this unrecognized expense is expected to be recognized was 4.0 years, 0 years, and 0.2 years, respectively. The weighted average remaining contractual life of options and warrants outstanding at December 31, 2015, was 4.1 years.
The Company estimates the fair value of its options and warrants awards using the Black‑Scholes option pricing model. The Company uses industry data obtained from bank holding companies with similar attributes to estimate option and warrant exercise and termination patterns within the Black-Scholes model. The risk-free rate for periods within the contractual life of the option and warrant is based on the U.S. Treasury yield curve in effect at the time of grant. There were no options or warrants awarded during 2014 and 2013. The table below summarized the assumptions used to calculate the fair value of options granted during 2015:
For the year ended December 31, | |||||||
2015 | 2014 | 2013 | |||||
Risk‑free interest rate | 2.16 | % | N/A | N/A | |||
Expected term in years | 7.73 | N/A | N/A | ||||
Expected stock price volatility | 40.00 | % | N/A | N/A | |||
Dividend yield | — | % | N/A | N/A | |||
84
The following table represents stock option and warrant activity for the twelve months ended December 31, 2015:
Options and Warrants | Shares | Weighted Average Exercise Price | Weighted Average Remaining Contractual Term (in years) | Aggregate Intrinsic Value | |||||||||
Outstanding, December 31, 2014 | 1,663,500 | $ | 10.01 | ||||||||||
Options assumed from First Security | 482,741 | 14.69 | |||||||||||
Granted | 245,000 | 14.34 | |||||||||||
Exercised | (20,707 | ) | 10.00 | ||||||||||
Canceled | (775 | ) | 505.31 | ||||||||||
Outstanding, December 31, 2015 | 2,369,759 | $ | 11.30 | 4.07 | $ | 9,258 | |||||||
Exercisable, December 31, 2015 | 1,925,858 | $ | 10.77 | 2.95 | $ | 8,662 | |||||||
Weighted average fair value of options and warrants granted | $ | 7.00 | |||||||||||
Outstanding, December 31, 2013 | 1,730,166 | $ | 10.01 | ||||||||||
Forfeited | (66,666 | ) | 10.15 | ||||||||||
Outstanding, December 31, 2014 | 1,663,500 | $ | 10.01 | 3.15 | $ | 2,233 | |||||||
Exercisable, December 31, 2014 | 1,663,500 | $ | 10.01 | 3.15 | $ | 2,233 | |||||||
Weighted average fair value of options and warrants granted | $ | — | |||||||||||
Outstanding, December 31, 2012 | 1,738,500 | $ | 10.01 | ||||||||||
Forfeited | (8,334 | ) | 10.00 | ||||||||||
Outstanding, December 31, 2013 | 1,730,166 | $ | 10.01 | 4.00 | $ | 1,189 | |||||||
Exercisable, December 31, 2013 | 1,643,810 | $ | 10.01 | 3.86 | $ | 1,128 | |||||||
Weighted average fair value of options and warrants granted | $ | — | |||||||||||
Atlantic Capital assumed the stock options issued to First Security employees and directors that were outstanding at the acquisition date. The fair value of these options was included in the total consideration issued to acquire First Security.
The total fair value of shares vested during each of the years ended December 31, 2015, 2014, and 2013, was $688,000, $251,000 and $307,000 respectively.
Restricted stock awards generally cliff vest over 1-3 years. The market value at the date of award is amortized by charges to compensation expense over the vesting period. Compensation expense related to these awards during 2015, 2014, and 2013 was $659,000, $518,000, and $596,000 respectively. Unrecognized compensation expense associated with restricted stock was $1.9 million, $567,000, and $498,000 as of December 31, 2015, 2014, and 2013, respectively. At December 31, 2015, 2014, and 2013, the weighted average period over which this unrecognized expense is to be recognized was 3.4 years, 2.0 years, and 1.8 years, respectively. During 2015, 2014, and 2013, respectively, there were 150,516, 59,613, and 53,843 restricted stock awards granted at a weighted average grant price of $14.01, $11.35, and $10.70 per share.
85
The following table represents restricted stock activity for the twelve months ended December 31, 2015, 2014, and 2013:
Shares | Weighted Average Grant-Date Fair Value | |||||
Outstanding, December 31, 2014 | 132,093 | $ | 10.84 | |||
Granted | 150,516 | 14.01 | ||||
Vested | (54,978 | ) | 10.53 | |||
Forfeited | (9,973 | ) | 11.80 | |||
Outstanding, December 31, 2015 | 217,658 | $ | 13.07 | |||
Outstanding, December 31, 2013 | 149,057 | $ | 10.37 | |||
Granted | 59,613 | 11.35 | ||||
Vested | (68,205 | ) | 10.26 | |||
Forfeited | (8,372 | ) | 10.77 | |||
Outstanding, December 31, 2014 | 132,093 | $ | 10.84 | |||
Outstanding, December 31, 2012 | 122,524 | $ | 10.20 | |||
Granted | 53,843 | 10.70 | ||||
Vested | (19,655 | ) | 10.21 | |||
Forfeited | (7,655 | ) | 10.36 | |||
Outstanding, December 31, 2013 | 149,057 | $ | 10.37 | |||
NOTE 16 – DERIVATIVES AND HEDGING
Risk Management
Atlantic Capital’s objectives in using interest rate derivatives are to add stability to net interest revenue and to manage its exposure to interest rate movements. To accomplish this objective, Atlantic Capital primarily uses interest rate swaps as part of its interest rate risk management strategy.
Cash Flow Hedges
At December 31, 2015, Atlantic Capital’s interest rate swaps designated as cash flow hedges involve the payment of floating-rate amounts to a counterparty in exchange for receiving fixed-rate payments over the life of the agreements without exchange of the underlying notional amount. At December 31, 2015 and 2014, Atlantic Capital had interest rate swaps designated as cash flow hedges with an aggregate notional amount of $50.0 million, respectively.
No hedge ineffectiveness gains or losses were recognized on active cash flow hedges in 2015 or 2014. The effective portion of changes in the fair value of derivatives designated and that qualify as cash flow hedges is recorded in accumulated other comprehensive income and is subsequently reclassified into earnings in the period that the hedged forecasted transaction affects earnings. Atlantic Capital expects that approximately $374,000 will be reclassified as an increase to loan interest income over the next twelve months related to these cash flow hedges.
Customer Swaps
Atlantic Capital also enters into derivative contracts, which consist of interest rate swaps, to facilitate the needs of clients desiring to manage interest rate risk. These swaps are not designated as accounting hedges under ASC 815, Derivatives and Hedging. In order to economically hedge the interest rate risk associated with offering this product, Atlantic Capital simultaneously enters into derivative contracts with third parties to offset the customer contracts, such that Atlantic Capital minimizes its net risk exposure resulting from such transactions. The derivative contracts are structured such that the notional amounts reduce over time to generally match the expected amortization of the underlying loans. These derivatives are not speculative and arise from a service provided to clients.
Atlantic Capital’s derivative instruments are recorded at fair value in other assets and accrued interest receivable and other liabilities and accrued interest payable in the Consolidated Balance Sheets. The changes in the fair value of the derivative instruments are
86
recognized in other noninterest income in the Consolidated Statements of Operations. The net change in each of these financial statement line items are recorded in the Consolidated Statements of Cash Flows. At December 31, 2015 and 2014, Atlantic Capital had interest rate swaps related to this program with an aggregate notional amount of $137.1 million and $179.2 million, respectively.
Atlantic Capital acquired a loan level hedging program, which First Security utilized to accommodate clients preferring a fixed rate loan. The loan documents include an addendum with a zero premium collar. The zero premium collar is a cap and a floor at the same interest rate, resulting in a fixed rate to the borrower. To hedge this embedded option the Bank enters into a dealer facing trade exactly mirroring the terms in the loan addendum.
Counterparty Credit Risk
As a result of its derivative contracts, Atlantic Capital is exposed to credit risk. Specifically approved counterparties and exposure limits are defined. On a quarterly basis, the customer derivative contracts and related counterparties are evaluated for credit risk and an adjustment is made to the contract’s fair value. This adjustment is recognized in the Consolidated Statements of Operations.
Derivative contracts with clients are secured by collateral. Additionally, in accordance with the interest rate agreements with third party counterparties, Atlantic Capital may be required to post margin to these counterparties. At December 31, 2015 and 2014, Atlantic Capital had minimum collateral posting thresholds with certain of its derivative counterparties and posted collateral of $13.5 million and $2.6 million, respectively, against its obligations under these agreements. Collateral related to derivative contracts is recorded in other assets in the Consolidated Balance Sheets.
Atlantic Capital has master netting agreements with the derivatives dealers with which it does business, but reflects gross assets and liabilities on the Consolidated Balance Sheets.
In conjunction with the FASB’s fair value measurement guidance, management made an accounting policy election to measure the credit risk of its derivative financial instruments that are subject to master netting arrangements on a net basis.
To accommodate clients, Atlantic Capital occasionally enters into credit risk participation agreements with counterparty banks to accept a portion o the credit risk related to interest rate swaps. This allows clients to execute an interest rate swap with one bank while allowing for distribution of the credit risk among participating members. Credit risk participation agreements arise when Atlantic Capital contracts with other financial institutions, as a guarantor, to share credit risk associated with certain interest rate swaps. These agreements provide for reimbursement of losses resulting from a third party default on the underlying swap. At December 31, 2015 and 2014, Atlantic Capital had credit risk participation agreements with a notional amount of $22.4 million and $17.7 million, respectively.
87
The following table reflects the estimated fair value positions of derivative contracts and credit risk participation agreements as of December 31, 2015 and 2014 (in thousands):
Derivatives designated as hedging instruments under ASC 815 | ||||||||||||||||||
December 31, 2015 | December 31, 2014 | |||||||||||||||||
Interest Rate Products | Balance Sheet Location | Notional Amount | Fair Value | Notional Amount | Fair Value | |||||||||||||
Cash flow hedge of LIBOR based loans | Other assets | $ | 50,000 | $ | 474 | $ | 50,000 | $ | 219 | |||||||||
Derivatives not designated as hedging instruments under ASC 815 | ||||||||||||||||||
December 31, 2015 | December 31, 2014 | |||||||||||||||||
Interest Rate Products | Balance Sheet Location | Notional Amount | Fair Value | Notional Amount | Fair Value | |||||||||||||
Customer swap positions | Other assets | $ | 68,560 | $ | 1,617 | $ | 89,606 | $ | 1,819 | |||||||||
Zero premium collar | Other assets | 101,407 | 4,463 | — | — | |||||||||||||
$ | 169,967 | $ | 6,080 | $ | 89,606 | $ | 1,819 | |||||||||||
Dealer offsets to customer swap positions | Other liabilities | $ | 68,560 | $ | 1,697 | $ | 89,606 | $ | 1,882 | |||||||||
Credit risk participation | Other liabilities | 22,447 | 3 | 17,703 | 6 | |||||||||||||
Dealer offset to zero premium collar | Other liabilities | 101,407 | 4,463 | — | — | |||||||||||||
$ | 192,414 | $ | 6,163 | $ | 107,309 | $ | 1,888 | |||||||||||
The following table reflects the impact to the Consolidated Statements of Operations related to derivative contracts for the years ended December 31, 2015 and 2014 (in thousands):
Derivatives in Cash Flow Hedging Relationships | ||||||||||||||||||
Years ended December 31, | ||||||||||||||||||
Amount of Gain or (Loss) Recognized in OCI on Derivatives (Effective Portion) | Gain or (Loss) Reclassified from Accumulated OCI in Income (Effective Portion) | |||||||||||||||||
2015 | 2014 | Location | 2015 | 2014 | ||||||||||||||
Interest rate swaps | $ | 1,325 | $ | 407 | Interest income | $ | 647 | $ | 188 | |||||||||
NOTE 17 – REGULATORY MATTERS
The Company and the Bank are subject to various regulatory capital requirements administered by the federal banking agencies. Failure to meet minimum capital requirements can initiate certain mandatory and possibly additional discretionary actions by regulators that, if undertaken, could have a direct material effect on the Company’s and the Bank’s financial statements. Under capital adequacy guidelines and the regulatory framework for prompt corrective action, the Company and the Bank must meet specific capital guidelines that involve quantitative measures of the Company’s and the Bank’s assets, liabilities, and certain off-balance sheet items as calculated under regulatory accounting practices. The Company’s and the Bank’s capital amounts and classifications are also subject to qualitative judgments by the regulators about components, risk weightings, and other factors. On January 1, 2015, the Company became subject to Basel III rules, which include transition provisions through January 1, 2019. Under Basel III, total capital consist of two tiers of capital, Tier 1 and Tier 2. Tier 1 capital is further composed of Common Equity Tier 1 Capital and additional Tier 1 capital.
The transition provisions include important differences in determining the composition of regulatory capital between the Basel I Rules and Basel III rules including, changes in capital deductions related to the Company’s deferred tax assets, and the inclusion of unrealized gains and losses on AFS debt and certain marketable equity securities recorded in accumulated other comprehensive income (“AOCI”). These changes are impacted by, among other things, future changes in interest rates, overall earnings performance and company actions. Changes to the composition of regulatory capital under Basel III, as compared to the Basel I rules, are
88
recognized in 20% annual increments, and will be fully recognized as of January 1, 2019. When presented on a fully phased-in basis, capital, risk-weighted assets and the capital ratios assume all regulatory capital adjustments and deductions are fully recognized.
Common Equity Tier 1 Capital primarily includes qualifying common shareholders’ equity, retained earnings, accumulated other comprehensive income and certain minority interests. Goodwill, disallowed intangible assets and certain disallowed deferred tax assets are excluded from Common Equity Tier 1 Capital.
Additional Tier 1 capital primarily includes qualifying non-cumulative preferred stock, trust preferred securities subject to phase-out and certain minority interests. Certain deferred tax assets are also excluded.
Tier 2 capital primarily consists of qualifying subordinated debt, a limited portion of the allowance for loan and lease losses, trust preferred securities subject to phase-out and reserves for unfunded lending commitments. The Company’s total capital is the sum of Tier 1 capital plus Tier 2 capital.
To meet adequately capitalized regulatory requirements, an institution must maintain a Common Equity Tier 1 Capital of 4.5%, a Tier 1 capital ratio of 6.0% and a Total capital ratio of 8.0%. A “well-capitalized” institution must generally maintain capital ratios 200 bps higher than the minimum guidelines. The risk-based capital rules have been further supplemented by a Tier 1 leverage ratio, defined as Tier 1 capital divided by quarterly average total assets, after certain adjustments. The Bank must maintain a Tier 1 leverage ratio of at least 5.0% to be classified as “well capitalized.” Failure to meet the capital requirements established by the joint agencies can lead to certain mandatory and discretionary actions by regulators that could have a material adverse effect on the Company’s consolidated financial statements.
The Basel III rules also introduced a capital conservation buffer which will be phased in over four years beginning on January 1, 2016, with a maximum buffer of 0.625% of risk-weighted assets for 2016, 1.25% for 2017, 1.875% for 2018, and 2.5% for 2019 and thereafter. Failure to maintain the required capital conservation buffer will result in limitations on capital distributions and on discretionary bonuses to executive officers.
The Basel III rules were implemented in the first quarter of 2015. The Company opted out of the AOCI treatment under the new requirements and, as such, unrealized security gains and losses will continue to be excluded from bank regulatory capital.
As of December 31, 2015 and 2014, the Bank was categorized as well capitalized under the regulatory framework for prompt corrective action. Management believes there are no conditions or events since the previous notification that have changed the institution’s categorizations.
89
The Company’s and the Bank’s actual capital amounts and ratios are presented in the table below:
As of December 31, 2015 | |||||||||||||||||
dollars in thousands | Actual | For Capital Adequacy Purposes | To be Well Capitalized Under Prompt Corrective Action Provisions | ||||||||||||||
Common Equity Tier I capital (to risk weighted assets): | Amount | Ratio | Amount | Ratio | Amount | Ratio | |||||||||||
Consolidated | $ | 215,812 | 9.8 | % | $ | 99,022 | 4.5 | % | N/A | N/A | |||||||
Bank | 251,727 | 11.4 | % | 99,017 | 4.5 | % | 143,025 | 6.5 | % | ||||||||
Tier 1 capital (to risk weighted assets): | |||||||||||||||||
Consolidated | $ | 215,812 | 9.8 | % | $ | 132,029 | 6.0 | % | N/A | N/A | |||||||
Bank | 251,727 | 11.4 | % | 132,023 | 6.0 | % | 176,031 | 8.0 | % | ||||||||
Total capital (to risk weighted assets): | |||||||||||||||||
Consolidated | $ | 284,663 | 12.9 | % | $ | 176,038 | 8.0 | % | N/A | N/A | |||||||
Bank | 271,312 | 12.3 | % | 176,031 | 8.0 | % | 220,039 | 10.0 | % | ||||||||
Tier I capital (to average assets): | |||||||||||||||||
Consolidated | $ | 215,812 | 9.9 | % | $ | 86,997 | 4.0 | % | N/A | N/A | |||||||
Bank | 251,727 | 11.6 | % | 87,002 | 4.0 | % | 108,752 | 5.0 | % | ||||||||
As of December 31, 2014 | |||||||||||||||||
Actual | For Capital Adequacy Purposes | To be Well Capitalized Under Prompt Corrective Action Provisions | |||||||||||||||
Tier I capital (to risk weighted assets): | Amount | Ratio | Amount | Ratio | Amount | Ratio | |||||||||||
Consolidated | $ | 140,242 | 11.0 | % | $ | 51,161 | 4.0 | % | N/A | N/A | |||||||
Bank | 137,651 | 10.8 | % | 51,157 | 4.0 | % | 76,736 | 6.0 | % | ||||||||
Total capital (to risk weighted assets): | |||||||||||||||||
Consolidated | $ | 151,663 | 11.9 | % | $ | 102,322 | 8.0 | % | N/A | N/A | |||||||
Bank | 149,072 | 11.7 | % | 102,314 | 8.0 | % | 127,893 | 10.0 | % | ||||||||
Tier I capital (to average assets): | |||||||||||||||||
Consolidated | $ | 140,242 | 10.7 | % | $ | 52,457 | 4.0 | % | N/A | N/A | |||||||
Bank | 137,651 | 10.5 | % | 52,501 | 4.0 | % | 65,627 | 5.0 | % | ||||||||
NOTE 18 – FAIR VALUE MEASUREMENTS
Atlantic Capital follows the guidance pursuant to ASC No. 820-10, Fair Value Measurements and Disclosures. This guidance defines fair value, establishes a framework for measuring fair value and expands disclosures about fair value measurements. This issuance applies to reported balances that are required or permitted to be measured at fair value under existing accounting pronouncements; accordingly, the standard does not require any new fair value measurements of reported balances. Atlantic Capital measures its investment securities and interest rate derivative assets and liabilities at fair value on a recurring basis. Fair value is used on a nonrecurring basis either when assets are evaluated for impairment or for disclosure purposes. Atlantic Capital measures its servicing assets, loans held for sale, impaired loans and other real estate owned at fair value on a nonrecurring basis if necessary. The basis for accounting for other real estate owned is the lower of cost or fair value, less selling costs.
90
The guidance emphasizes that fair value is a market-based measurement, not an entity-specific measurement and defines fair value as the price that could be received to sell an asset or paid to transfer a liability in an orderly transaction between market participants. As a basis for considering market participant assumptions in fair value measurements, this guidance establishes a fair value hierarchy that distinguishes between market participant assumptions based on market data obtained from sources independent of the reporting entity (observable inputs that are classified within Levels 1 and 2 of the hierarchy) and the reporting entity’s own assumptions about market participant assumptions (unobservable inputs classified within Level 3 of the hierarchy).
Atlantic Capital applied the following fair value hierarchy:
Level 1 – Assets or liabilities for which the identical item is traded on an active exchange, such as publicly-traded instruments or futures contracts.
Level 2 – Assets or liabilities valued based on observable market data for similar instruments.
Level 3 – Assets or liabilities for which significant valuation assumptions are not readily observable in the market, instruments valued based on the best available data, some of which is internally-developed, and risk premiums that a market participant would require.
In instances where the determination of the fair value measurement is based on inputs from different levels of the fair value hierarchy, the level in which the entire fair value measurement falls is based on the lowest level input that is significant to the fair value measurement. There were no transfers between Level 1 and Level 2 or Level 2 and Level 3 during 2015 and 2014.
Atlantic Capital records investment securities available-for-sale at fair value on a recurring basis. Investment securities classified as available-for-sale are reported at fair value utilizing Level 2 and Level 3 inputs. For these securities, Atlantic Capital obtains fair value measurements from an independent pricing service. In estimating the fair values for investment securities, Atlantic Capital believes that independent third-party market prices are the best evidence of an exit price. The fair value measurements consider observable data that may include dealer quotes, market spreads, cash flows, the Treasury Department yield curve, trade execution data, market consensus prepayment speeds, credit information and the securities’ terms and conditions, among other things.
Derivative instruments are primarily transacted as over-the-counter trades and priced with observable market assumptions. Ongoing measurements include observable market assumptions with appropriate valuation adjustments for liquidity and for credit risk of counterparties and Atlantic Capital’s own credit. For these instruments, Atlantic Capital obtains fair value measurements from an independent pricing service. The fair value measurements consider factors such as the likelihood of default by Atlantic Capital and its counterparties, total exposure and remaining maturities in determining the appropriate fair value adjustments to record. Generally, the expected loss of each client counterparty is estimated using Atlantic Capital’s internal risk rating system. For financial institution counterparties that are rated by national rating agencies, those ratings are used in determining the credit risk. This approach used to estimate exposures to counterparties is also used by Atlantic Capital to estimate its own credit risk on derivative liability positions.
91
Assets and Liabilities Measured at Fair Value on a Recurring Basis
The following tables present assets and liabilities that were measured at fair value on a recurring basis by level within the fair value hierarchy as reported in the Consolidated Balance Sheets at December 31, 2015 and 2014.
2015 Fair Value Measurement Using | |||||||||||||||
Quoted Prices in Active markets for Identical Securities (Level 1) | Significant Other Observable Inputs (Level 2) | Significant Unobservable Inputs (Level 3) | Total | ||||||||||||
(in thousands) | |||||||||||||||
Securities available-for-sale— | |||||||||||||||
U.S. treasuries | $ | — | $ | 4,922 | $ | — | $ | 4,922 | |||||||
U.S. government agencies | — | 64,852 | — | 64,852 | |||||||||||
U.S. states and political subdivisions | — | 27,790 | — | 27,790 | |||||||||||
Trust preferred securities | — | 4,275 | — | 4,275 | |||||||||||
Corporate debt securities | — | 20,517 | — | 20,517 | |||||||||||
Mortgage-backed securities | — | 221,451 | 2,414 | 223,865 | |||||||||||
Total securities available-for-sale | — | 343,807 | 2,414 | 346,221 | |||||||||||
Interest rate derivative assets | — | 6,554 | — | 6,554 | |||||||||||
Interest rate derivative liabilities | — | 6,163 | — | 6,163 | |||||||||||
2014 Fair Value Measurement Using | |||||||||||||||
Quoted Prices in Active markets for Identical Securities (Level 1) | Significant Other Observable Inputs (Level 2) | Significant Unobservable Inputs (Level 3) | Totals | ||||||||||||
(in thousands) | |||||||||||||||
Securities available-for-sale— | |||||||||||||||
U.S. government agencies | $ | — | $ | 15,220 | $ | — | $ | 15,220 | |||||||
U.S. states and political subdivisions | — | 2,346 | — | 2,346 | |||||||||||
Trust preferred securities | — | 4,200 | — | 4,200 | |||||||||||
Corporate debt securities | — | 16,328 | — | 16,328 | |||||||||||
Mortgage-backed securities | — | 95,343 | — | 95,343 | |||||||||||
Total securities available-for-sale | — | 133,437 | — | 133,437 | |||||||||||
Interest rate derivative assets | — | 2,038 | — | 2,038 | |||||||||||
Interest rate derivative liabilities | — | 1,888 | — | 1,888 | |||||||||||
The following table shows a reconciliation of the beginning and ending balances for assets measured at fair value on a recurring basis using significant unobservable inputs that are classified as Level 3 values (in thousands):
(in thousands) | Securities Available- | |||
for-Sale | ||||
December 31, 2014 | $ | — | ||
Additions due to business combination | 2,414 | |||
December 31, 2015 | $ | 2,414 | ||
For Level 3 securities where quoted prices or market prices of similar securities are not available, fair values are calculated using discounted cash flows or other market indicators.
For the years ended December 31, 2015 and 2014, there was not a change in the methods and significant assumptions used to estimate fair value.
92
Assets and Liabilities Measured at Fair Value on a Non-Recurring Basis
The following table presents the assets that were measured at fair value on a nonrecurring basis by level within the fair value hierarchy as reported in the Consolidated Balance Sheets at December 31, 2015 and December 31, 2014.
December 31, 2015 | Level 1 Fair Value Measurement | Level 2 Fair Value Measurement | Level 3 Fair Value Measurement | Total | ||||||||||||
(in thousands) | ||||||||||||||||
Impaired Loans | $ | — | $ | — | $ | 4,449 | $ | 4,449 | ||||||||
December 31, 2014 | Level 1 Fair Value Measurement | Level 2 Fair Value Measurement | Level 3 Fair Value Measurement | Total | ||||||||||||
(in thousands) | ||||||||||||||||
Impaired Loans | $ | — | $ | — | $ | 4,940 | $ | 4,940 | ||||||||
SBA Servicing asset | — | — | 782 | 782 | ||||||||||||
Totals | $ | — | $ | — | $ | 5,722 | $ | 5,722 | ||||||||
Level 3 loans consist of impaired loans which have been partially charged-off or have specific valuation allowances. The fair value of Level 3 assets is estimated based on the underlying collateral value. For loans which the cash proceeds from the sale of the underlying collateral is the expected source of repayment, the fair value of these loans was derived from internal estimates of the underlying collateral less the estimated cost to sell, incorporating market data, including third party appraisals. Impaired loans are evaluated on at least a quarterly basis and adjusted accordingly.
As part of the normal appraisal process, the appraisers generally provide the appraised value using one of following techniques: the sales comparison approach, the income approach or a combination thereof. Under the sales comparison approach, the appraiser may make certain adjustments from the sold property to the appraised property, including, but not limited to, differences in square footage, lot size, absorption rates or location. Under the income approach, the appraiser may make certain adjustments including, but not limited to, capitalization rates and differences in operating income expectations.
The SBA servicing asset is initially recorded at fair value when loans are sold with servicing retained. This asset is then amortized in proportion to and over the period of estimated net servicing income. On at least a quarterly basis, the SBA servicing asset is assessed for impairment based on fair value. Given the nature of the asset, the key valuation inputs are unobservable and management classifies this asset as Level 3. A rollforward of activity for the SBA servicing asset and a summary of key input assumptions can be found in Note 9 – SBA Servicing Rights. At December 31, 2014, Atlantic Capital’s quarterly impairment review indicated impairment of approximately $7,000 and an impairment charge was recorded. No impairment was recognized for the year ended December 31, 2015.
Assets and Liabilities Not Measured at Fair Value
FASB ASC 825, Financial Instruments, requires disclosure of fair value information about financial instruments, whether or not recognized in the balance sheet, for which it is practicable to estimate that value. Where quoted market prices are not available, fair values are based on estimates using present value or other valuation techniques. Those techniques are significantly affected by the assumptions used, including the discount rate and estimates of future cash flows.
The following disclosure should not be considered a surrogate of the liquidation value of Atlantic Capital or the Bank, but rather a good-faith estimate of the increase or decrease in value of financial instruments held by Atlantic Capital since purchase, origination or issuance.
The following methods and assumptions were used by the Company in estimating its fair values disclosures for financial instruments:
Cash and Cash Equivalents. For cash and due from banks, interest-bearing deposits in other banks, commercial paper, federal funds sold and reverse repurchase agreements the carrying amount is a reasonable estimate of fair value.
Investment Securities Available-for-Sale. Fair values for investment securities available-for-sale are based on quoted market prices.
Federal Home Loan Bank Stock. The Federal Home Loan Bank has historically repurchased their stock at cost. Therefore, the carrying amount is considered a reasonable estimate of its fair value.
93
Loans Held for Investment, Net. The fair value of fixed rate loans is estimated by discounting the future cash flows using current rates at which similar loans would be made to borrowers with similar credit ratings and adjusted for a market liquidity discount. For variable rate loans the carrying amount is a reasonable estimate of fair value, adjusted for a market liquidity discount. Estimating the fair value of the loan portfolio when loan sales and trading markets are illiquid requires significant judgment. Therefore, the estimated fair value can vary significantly depending on a market participant’s ultimate considerations and assumptions.
The Company uses assumptions that are expected to approximate those that a market participant purchasing the loans would use to value the loans in the current environment. The final value yields a market participant’s expected return on investment that is indicative of the current market conditions, but it does not take into consideration the Company’s estimated value from continuing to hold these loans or its lack of willingness to transact at these estimated values.
Derivative Financial Instruments. The estimated fair value of the interest rate swaps and credit risk participations are based on cash flow models supported by market data inputs.
Deposits. The fair value of demand deposits, savings accounts, NOW accounts and money market deposits is the amount payable on demand at the reporting date. The fair value of fixed maturity certificates of deposits is estimated by discounting the future cash flows using rates currently offered for deposits of similar remaining maturities.
Advances from the Federal Home Loan Bank. The fair value of the FHLB fixed rate borrowing is estimated using discounted cash flows, based on the current incremental borrowing rates for similar types of borrowing arrangements. For variable rate FHLB borrowings the carrying amount is a reasonable estimate of fair value.
Off–Balance Sheet Financial Instruments. Because commitments to extend credit and letters of credit are generally short-term and at variable rates, the contract value and estimated fair value associated with these instruments are immaterial
Fair value estimates are made at a specific point in time, based on relevant market information and information about the financial instrument. These estimates do not reflect any premium or discount that could result from offering for sale at one time Atlantic Capital’s entire holdings of a particular financial instrument.
Fair value estimates are based on existing on and off-balance sheet financial instruments without attempting to estimate the value of anticipated future business and the value of assets and liabilities that are not considered financial instruments.
The following table presents the estimated fair values of Atlantic Capital’s financial instruments at December 31, 2015 and December 31, 2014.
2015 Fair Value Measurement Using | |||||||||||||||
Carrying Amount | Quoted Prices in Active markets for Identical Securities (Level 1) | Significant Other Observable Inputs (Level 2) | Significant Unobservable Inputs (Level 3) | ||||||||||||
(in thousands) | |||||||||||||||
Financial assets: | |||||||||||||||
Cash and due from banks | $ | 58,319 | $ | 58,319 | $ | — | $ | — | |||||||
Interest-bearing deposits in other banks | 130,900 | 130,900 | — | — | |||||||||||
Reverse repurchase agreements | 13,666 | 13,666 | — | — | |||||||||||
Total securities available-for-sale | 346,221 | — | 343,807 | 2,414 | |||||||||||
FHLB Stock | 8,034 | — | — | 8,034 | |||||||||||
Loans held for investment, net | 1,771,764 | — | — | 1,752,796 | |||||||||||
Derivative assets | 6,554 | — | 6,554 | — | |||||||||||
Financial liabilities: | |||||||||||||||
Deposits | $ | 2,048,808 | $ | — | $ | 2,018,898 | $ | — | |||||||
Subordinated debt | 49,197 | — | 49,197 | — | |||||||||||
Derivative financial instruments | 6,163 | — | 6,163 | — | |||||||||||
94
2014 Fair Value Measurement Using | |||||||||||||||
Carrying Amount | Quoted Prices in Active markets for Identical Securities (Level 1) | Significant Other Observable Inputs (Level 2) | Significant Unobservable Inputs (Level 3) | ||||||||||||
(in thousands) | |||||||||||||||
Financial assets: | |||||||||||||||
Cash and due from banks | $ | 36,490 | $ | 36,490 | $ | — | $ | — | |||||||
Interest-bearing deposits in other banks | 12,137 | 12,137 | — | — | |||||||||||
Reverse repurchase agreements | 45,623 | 45,623 | — | — | |||||||||||
Investment securities available-for-sale | 133,437 | — | 133,437 | — | |||||||||||
FHLB Stock | 3,653 | — | — | 3,653 | |||||||||||
Loans held for investment, net | 1,028,292 | — | — | 1,018,130 | |||||||||||
Derivative assets | 2,038 | — | 2,038 | — | |||||||||||
Financial liabilities: | |||||||||||||||
Deposits | $ | 1,105,845 | $ | — | $ | 1,092,527 | $ | — | |||||||
Federal Home Loan Bank advances | 56,517 | — | 56,678 | — | |||||||||||
Derivative financial instruments | 1,888 | — | 1,888 | — | |||||||||||
NOTE 19 – COMMITMENTS AND CONTINGENCIES
Atlantic Capital is a party to financial instruments with off-balance sheet risk in the normal course of business to meet the financing needs of its customers. These financial instruments include commitments to extend credit and letters of credit, most of which are standby letters of credit. These instruments involve, to varying degrees, elements of credit risk in excess of the amounts recognized
95
in the Consolidated Balance Sheets. The contract amounts of these instruments reflect the extent of involvement Atlantic Capital has in particular classes of financial instruments.
Standby letters of credit are written conditional commitments issued by Atlantic Capital to guarantee the performance of a customer to a third party. Those guarantees are primarily issued to support public and private borrowing arrangements. Most letters of credit expire in less than one year. The credit risk involved in issuing letters of credit is essentially the same as that involved in extending loan facilities to customers.
Atlantic Capital’s exposure to credit loss in the event of nonperformance by the other party to the financial instrument for commitments to extend credit and standby letters of credit is represented by the contractual amount of those instruments. Atlantic Capital uses the same credit policies in making commitments and conditional obligations as it does for on-balance sheet instruments.
Atlantic Capital’s maximum exposure to credit risk for unfunded loan commitments and standby letters of credit at December 31, 2015 and December 31, 2014 was as follows:
December 31, 2015 | December 31, 2014 | |||||||
(in thousands) | ||||||||
Financial Instruments whose contract amount represents credit risk: | ||||||||
Commitments to extend credit | $ | 559,448 | $ | 389,445 | ||||
Standby letters of credit | 10,502 | 12,316 | ||||||
$ | 569,950 | $ | 401,761 | |||||
Minimum Lease payments | $ | 7,250 | $ | 3,081 | ||||
Atlantic Capital, in the normal course of business, is subject to various pending and threatened lawsuits in which claims for monetary damages are asserted. Although it is not possible to predict the outcome of these lawsuits, or the range of any possible loss, management, after consultation with legal counsel, does not anticipate that the ultimate aggregate liability, if any, arising from these lawsuits will have a material adverse effect on Atlantic Capital’s financial position or results of operations.
NOTE 20 – ATLANTIC CAPITAL BANCSHARES, INC. (PARENT COMPANY ONLY) FINANCIAL INFORMATION
Balance Sheets | ||||||||
(in thousands) | ||||||||
December 31, | ||||||||
2015 | 2014 | |||||||
Assets | ||||||||
Cash | $ | 10,413 | $ | 2,549 | ||||
Investment in subsidiary | 323,908 | 138,338 | ||||||
Other assets | 2,903 | 96 | ||||||
Total assets | $ | 337,224 | $ | 140,983 | ||||
Liabilities and shareholders’ equity | ||||||||
Long-term debt | $ | 49,197 | $ | — | ||||
Other liabilities | 35 | 54 | ||||||
Total liabilities | 49,232 | 54 | ||||||
Shareholders’ equity: | ||||||||
Common stock | 286,367 | 135,860 | ||||||
Retained earnings | 3,141 | 4,460 | ||||||
Accumulated other comprehensive income | (1,516 | ) | 609 | |||||
Total shareholders’ equity | 287,992 | 140,929 | ||||||
Total liabilities and shareholders’ equity | $ | 337,224 | $ | 140,983 | ||||
96
NOTE 20 – ATLANTIC CAPITAL BANCSHARES, INC. (PARENT COMPANY ONLY) FINANCIAL INFORMATION (CONTINUED)
Statements of Operations | ||||||||||||
(in thousands) | ||||||||||||
Year Ended December 31, | ||||||||||||
2015 | 2014 | 2013 | ||||||||||
Income: | ||||||||||||
Interest income | $ | 46 | $ | 13 | $ | 15 | ||||||
Other income | — | — | — | |||||||||
Total income | 46 | 13 | 15 | |||||||||
Expense: | ||||||||||||
Interest on long-term debt | 858 | — | — | |||||||||
Professional fees | 1,582 | 179 | 9 | |||||||||
Other expense | 615 | 190 | 216 | |||||||||
Total expense | 3,055 | 369 | 225 | |||||||||
Loss before income tax expense and equity | ||||||||||||
in undistributed (losses) from subsidiary | (3,009 | ) | (356 | ) | (210 | ) | ||||||
Income tax benefit | (1,126 | ) | (236 | ) | (79 | ) | ||||||
Loss before equity in undistributed losses | ||||||||||||
of subsidiary | (1,883 | ) | (120 | ) | (131 | ) | ||||||
Equity in undistributed earnings of subsidiary | 564 | 7,636 | 5,274 | |||||||||
Net income | $ | (1,319 | ) | $ | 7,516 | $ | 5,143 | |||||
97
NOTE 20 – ATLANTIC CAPITAL BANCSHARES, INC. (PARENT COMPANY ONLY) FINANCIAL INFORMATION (CONTINUED)
Statements of Cash Flows | ||||||||||||
(in thousands) | ||||||||||||
Year Ended December 31, | ||||||||||||
2015 | 2014 | 2013 | ||||||||||
Operating activities | ||||||||||||
Net income (loss) | $ | (1,319 | ) | $ | 7,516 | $ | 5,143 | |||||
Adjustments to reconcile net income | ||||||||||||
to net cash used in (by) operating activities: | ||||||||||||
Equity in undistributed earnings of subsidiary | (564 | ) | (7,636 | ) | (5,274 | ) | ||||||
Decrease (increase) in other assets | (433 | ) | 72 | 36 | ||||||||
(Decrease) increase in other liabilities | (19 | ) | 54 | (17 | ) | |||||||
Net cash used in operating activities | (2,335 | ) | 6 | (112 | ) | |||||||
Investing activities | ||||||||||||
Advances to subsidiaries | (16,000 | ) | — | — | ||||||||
Cash consideration paid for acquisition | (47,098 | ) | — | — | ||||||||
Net cash provided by (used in) investing activities | (63,098 | ) | — | — | ||||||||
Financing activities | ||||||||||||
Proceeds from issuance of long-term debt | 50,000 | — | — | |||||||||
Net proceeds from issuance of common stock | 24,004 | — | — | |||||||||
Acquisition of treasury stock | (707 | ) | (361 | ) | — | |||||||
Net cash (used in) provided by financing activities | 73,297 | (361 | ) | — | ||||||||
Net (decrease) increase in cash and cash equivalents | 7,864 | (355 | ) | (112 | ) | |||||||
Cash equivalents, beginning of year | 2,549 | 2,904 | 3,016 | |||||||||
Cash equivalents, end of year | $ | 10,413 | $ | 2,549 | $ | 2,904 | ||||||
ITEM 9. | CHANGES IN AND DISAGREEMENTS WITH ACCOUNTANTS ON ACCOUNTING AND FINANCIAL DISCLOSURE |
None.
ITEM 9A. | CONTROLS AND PROCEDURES |
Evaluation of Disclosure Controls and Procedures
Our management, with the participation of our chief executive officer and chief financial officer, evaluated the effectiveness of our disclosure controls and procedures as of December 31, 2015. The term “disclosure controls and procedures,” as defined in Rules 13a-15(e) and 15d-15(e) under the Exchange Act, means controls and other procedures of a company that are designed to ensure that information required to be disclosed by a company in the reports that it files or submits under the Exchange Act is recorded, processed, summarized, and reported within the time periods specified in the Securities and Exchange Commission’s rules and forms. Disclosure controls and procedures include, without limitation, controls and procedures designed to ensure that information required to be disclosed by a company in the reports that it files or submits under the Exchange Act is accumulated and communicated to the company’s management, including its principal executive and principal financial officers, as appropriate to allow timely decisions regarding required disclosure.
98
Based on the evaluation of our disclosure controls and procedures as of December 31, 2015, our chief executive officer and chief financial officer concluded that, as of such date, our disclosure controls and procedures were effective. Management recognizes that any controls and procedures, no matter how well designed and operated, can provide only reasonable assurance of achieving their objectives, and management necessarily applies its judgment in evaluating the cost-benefit relationship of possible controls and procedures.
Management’s Report on Internal Control Over Financial Reporting
A report of management’s assessment regarding internal control over financial reporting and an attestation report of Atlantic Capital’s independent registered accounting firm was not included due to a transition period established by rules of the Securities and Exchange Commission for newly public companies.
Changes in Internal Control Over Financial Reporting
There were no changes in our internal control over financial reporting identified in management’s evaluation pursuant to Rules 13a-15(d) or 15d-15(d) of the Exchange Act that occurred during the quarterly period ended December 31, 2015, that have materially affected, or are reasonably likely to materially affect, our internal control over financial reporting.
ITEM 9B. | OTHER INFORMATION |
None.
PART III
ITEM 10. | DIRECTORS, EXECUTIVE OFFICERS AND CORPORATE GOVERNANCE |
The information required under this item is incorporated herein by reference to the information presented under the headings “Proposal One - Election of Directors,” “Directors and Executive Officers,” “Corporate Governance Matters” and “Section 16(a) Beneficial Ownership Reporting Compliance” in the Company’s definitive proxy statement pursuant to Regulation 14A, which proxy statement will be filed with the Securities and Exchange Commission not later than 120 days after the close of the Company’s fiscal year ended December 31, 2015 (the “Proxy Statement”).
ITEM 11. | EXECUTIVE COMPENSATION |
The information required under this item is incorporated herein by reference to the information presented under the headings “Corporate Governance Matters,” “Executive Compensation,” and “Compensation and Other Information Concerning Our Executive Officers and Directors” in the Proxy Statement.
ITEM 12. | SECURITY OWNERSHIP OF CERTAIN BENEFICIAL OWNERS AND MANAGEMENT AND RELATED SHAREHOLDER MATTERS |
The information required under this item is incorporated herein by reference to the information presented under the headings “Security Ownership of Certain Beneficial Owners and Management” and “Compensation and Other Information Concerning Our Executive Officers and Directors” in the Proxy Statement.
ITEM 13. | CERTAIN RELATIONSHIPS AND RELATED TRANSACTIONS, AND DIRECTOR INDEPENDENCE |
The information required under this item is incorporated herein by reference to the information presented under the headings “Certain Relationships and Related Person Transactions” and “Corporate Governance Matters” in the Proxy Statement.
99
ITEM 14. | PRINCIPAL ACCOUNTING FEES AND SERVICES |
The information required under this item is incorporated herein by reference to the information presented under the heading “Proposal Two - Ratification of the Independent Registered Public Accounting Firm for 2016” in the Proxy Statement.
PART IV
ITEM 15. | EXHIBITS, FINANCIAL STATEMENT SCHEDULES |
(a) The following documents are filed as part of this report:
(1) Financial Statements:
(i) Report of Independent Registered Public Accounting Firm
(ii) | Consolidated Balance Sheets at December 31, 2015 and December 31, 2014 |
(iii) | Consolidated Statements of Operations for the Years Ended December 31, 2015, December 31, 2014, and December 31, 2013 |
(iv) | Consolidated Statements of Comprehensive Income for the Years Ended December 31, 2015, December 31, 2014, and December 31, 2013 |
(v) | Consolidated Statements of Shareholders’ Equity for the Years Ended December 31, 2015, December 31, 2014, and December 31, 2013 |
(vi) | Consolidated Statements of Cash Flows for the Years Ended December 31, 2015, December 31, 2014, and December 31, 2013 |
(vii) Notes to Consolidated Financial Statements
(2) | Financial Statement Schedules: None. Financial statement schedules have been omitted since the required information is included in our consolidated financial statements contained elsewhere in this Annual Report on Form 10-K. |
(3) | Exhibits: The exhibits listed in the accompanying Exhibit Index are filed as a part of this Annual Report on Form 10-K. |
(b) | Exhibits: The exhibits listed in the accompanying Exhibit Index are filed as a part of this Annual Report on Form 10-K. |
(c) | Separate Financial Statements and Schedules: None. Financial statement schedules have been omitted since the required information is included in our consolidated financial statements contained elsewhere in this Annual Report on Form 10-K. |
100
SIGNATURES
Pursuant to the requirements of Section 13 or 15(d) of the Securities Exchange Act of 1934, the registrant has duly caused this annual report on Form 10-K to be signed on its behalf by the undersigned, thereunto duly authorized, in the City of Atlanta, State of Georgia, on the 30th day of March, 2016.
ATLANTIC CAPITAL BANCSHARES, INC. | |
/s/ Douglas L. Williams | |
Douglas L. Williams | |
Chief Executive Officer (Principal Executive Officer) | |
/s/ Patrick T. Oakes | |
Patrick T. Oakes | |
Executive Vice President and | |
Chief Financial Officer | |
(Principal Financial and Accounting Officer) | |
Pursuant to the requirements of the Securities and Exchange Act of 1934, the report has been signed by the following persons on behalf of the registrant and in the capacities indicated on March 30, 2016.
101
Signature | Title | |
/s/ Douglas L. Williams | Chief Executive Officer and Director | |
Douglas L. Williams | (Principal Executive Officer) | |
/s/ Patrick T. Oakes | Executive Vice President and Chief Financial Officer | |
Patrick T. Oakes | (Principal Financial and Accounting Officer) | |
/s/ D. Michael Kramer | President and Director | |
D. Michael Kramer | ||
/s/ Walter M. Deriso, Jr. | Chairman of the Board | |
Walter M. Deriso, Jr. | ||
/s/ Henchy R. Enden | Director | |
Henchy R. Enden | ||
/s/ John N. Foy | Director | |
John N. Foy | ||
/s/ Douglas J. Hertz | Director | |
Douglas J. Hertz | ||
/s/ Adam G. Hurwich | Director | |
Adam G. Hurwich | ||
/s/ Brian D. Jones | Director | |
Brian D. Jones | ||
/s/ Stephen Levey | Director | |
Stephen Levey | ||
/s/ Larry D. Mauldin | Director | |
Larry D. Mauldin | ||
/s/ R. Charles Shufeldt | Director | |
R. Charles Shufeldt | ||
/s/ Lizanne Thomas | Director | |
Lizanne Thomas | ||
/s/ Marietta Edmunds Zakas | Director | |
Marietta Edmunds Zakas | ||
102
EXHIBIT INDEX
Exhibit No. | Description |
2.1 | Agreement and Plan of Merger, dated as of March 25, 2015 by and between Atlantic Capital Bancshares, Inc. and First Security Group, Inc., which is incorporated by reference to Exhibit 2.1 to our Registration Statement on Form S-4 (file no. 333-204855), initially filed with the Securities and Exchange Commission on June 10, 2015. |
2.2 | First Amendment to the Agreement and Plan of Merger, dated as of June 8, 2015 by and between Atlantic Capital Bancshares, Inc. and First Security Group, Inc., which is incorporated by reference to Exhibit 2.2 to our Registration Statement on Form S-4 (file no. 333-204855), initially filed with the Securities and Exchange Commission on June 10, 2015. |
3.1 | Amended and Restated Articles of Incorporation of Atlantic Capital Bancshares, Inc., which are incorporated by reference to Exhibit 3.1 to our Registration Statement on Form S-4 (file no. 333-204855), initially filed with the Securities and Exchange Commission on June 10, 2015. |
3.2 | Amended and Restated Bylaws of Atlantic Capital Bancshares, Inc., which are incorporated by reference to Exhibit 3.2 to our Registration Statement on Form S-4 (file no. 333-204855), initially filed with the Securities and Exchange Commission on June 10, 2015. |
4.1 | Form of Stock Certificate of Atlantic Capital Bancshares, Inc., which is incorporated by reference to Exhibit 4.1 to our Registration Statement on Form S-4 (file no. 333-204855), initially filed with the Securities and Exchange Commission on June 10, 2015. |
4.2 | Issuing and Paying Agency Agreement, dated September 14, 2015, between Atlantic Capital Bancshares, Inc. and U.S. Bank National Association, which is incorporated by reference to Exhibit 4.1 to our Current Report on Form 8-K filed with the SEC on September 18, 2015. |
4.3 | Form of 6.25% Fixed-to-Floating Rate Subordinated Note due 2025, which is incorporated by reference to Exhibit 4.2 to our Current Report on Form 8-K filed with the SEC on September 18, 2015. |
10.1 | Securities Purchase Agreement, dated as of March 25, 2015, by and among Atlantic Capital Bancshares, Inc., Trident IV, L.P. and Trident IV Professionals Fund, L.P., which is incorporated by reference to Exhibit 10.1 to our Registration Statement on Form S-4 (file no. 333-204855), initially filed with the Securities and Exchange Commission on June 10, 2015. |
10.2 | Corporate Governance Agreement, dated March 25, 2015, by and among Atlantic Capital Bancshares, Inc., Atlantic Capital Bank, Trident IV, L.P. and Trident IV Professionals Fund, L.P., which is incorporated by reference to Exhibit 10.2 to our Registration Statement on Form S-4 (file no. 333-204855), initially filed with the Securities and Exchange Commission on June 10, 2015. |
10.3 | Corporate Governance Agreement, dated March 25, 2015, by and among Atlantic Capital Bancshares, Inc., Atlantic Capital Bank, and BCP Fund I Southeast Holdings LLC, which is incorporated by reference to Exhibit 10.3 to our Registration Statement on Form S-4 (file no. 333-204855), initially filed with the Securities and Exchange Commission on June 10, 2015. |
10.4* | Employment Agreement, dated January 1, 2015, by and among Atlantic Capital Bancshares, Inc., Atlantic Capital Bank, and Douglas L. Williams, which is incorporated by reference to Exhibit 10.4 to our Registration Statement on Form S-4 (file no. 333-204855), initially filed with the Securities and Exchange Commission on June 10, 2015. |
10.5* | Employment Agreement, dated June 5, 2015, by and among Atlantic Capital Bancshares, Inc., Atlantic Capital Bank, and D. Michael Kramer, which is incorporated by reference to Exhibit 10.5 to our Registration Statement on Form S-4 (file no. 333-204855), initially filed with the Securities and Exchange Commission on June 10, 2015. |
10.6* | Retention Benefits Letter Agreement, dated March 26, 2015, by and between Atlantic Capital Bancshares, Inc. and John R. Haddock, which is incorporated by reference to Exhibit 10.6 to our Registration Statement on Form S-4 (file no. 333-204855), initially filed with the Securities and Exchange Commission on June 10, 2015. |
10.7* | Retention Benefits Letter Agreement, dated March 26, 2015, by and between Atlantic Capital Bancshares, Inc. and Denise M. Cobb, which is incorporated by reference to Exhibit 10.7 to our Registration Statement on Form S-4 (file no. 333-204855), initially filed with the Securities and Exchange Commission on June 10, 2015. |
10.8* | Atlantic Capital Bancshares, Inc. 2006 Stock Incentive Plan, which is incorporated by reference to Exhibit 10.8 to our Registration Statement on Form S-4 (file no. 333-204855), initially filed with the Securities and Exchange Commission on June 10, 2015. |
10.9* | Form of Employee Restricted Stock Award Agreement under the 2006 Stock Incentive Plan (for employees with employment agreements), which is incorporated by reference to Exhibit 10.9 to our Registration Statement on Form S-4 (file no. 333-204855), initially filed with the Securities and Exchange Commission on June 10, 2015. |
10.10* | Form of Employee Restricted Stock Award Agreement under the 2006 Stock Incentive Plan (for employees without employment agreements), which is incorporated by reference to Exhibit 10.10 to our Registration Statement on Form S-4 (file no. 333-204855), initially filed with the Securities and Exchange Commission on June 10, 2015. |
10.11* | Form of Non-Employee Director Restricted Stock Award Agreement under the 2006 Stock Incentive Plan, which is incorporated by reference to Exhibit 10.11 to our Registration Statement on Form S-4 (file no. 333-204855), initially filed with the Securities and Exchange Commission on June 10, 2015. |
10.12* | Form of Employee Stock Option Agreement under the 2006 Stock Incentive Plan, which is incorporated by reference to Exhibit 10.12 to our Registration Statement on Form S-4 (file no. 333-204855), initially filed with the Securities and Exchange Commission on June 10, 2015. |
10.13* | Form of Non-Employee Director Stock Option Agreement under the 2006 Stock Incentive Plan, which is incorporated by reference to Exhibit 10.13 to our Registration Statement on Form S-4 (file no. 333-204855), initially filed with the Securities and Exchange Commission on June 10, 2015. |
10.14* | Atlantic Capital Bancshares, Inc. 2012 Executive Officer Long-Term Incentive Plan, which is incorporated by reference to Exhibit 10.14 to our Registration Statement on Form S-4 (file no. 333-204855), initially filed with the Securities and Exchange Commission on June 10, 2015. |
10.15* | Amendment to Atlantic Capital Bancshares, Inc. 2012 Executive Officer Long-Term Incentive Plan, which is incorporated by reference to Exhibit 10.15 to our Registration Statement on Form S-4 (file no. 333-204855), initially filed with the Securities and Exchange Commission on June 10, 2015. |
10.16* | Form of Officer Award Certificate under the 2012 Executive Long-Term Incentive Plan, which is incorporated by reference to Exhibit 10.16 to our Registration Statement on Form S-4 (file no. 333-204855), initially filed with the Securities and Exchange Commission on June 10, 2015. |
10.17* | Atlantic Capital Bancshares, Inc. Executive Officer Short Term Incentive Plan. |
10.18* | Atlantic Capital Bancshares, Inc. 2015 Stock Incentive Plan, which is incorporated by reference to Exhibit 10.17 to our Registration Statement on Form S-4 (file no. 333-204855), initially filed with the Securities and Exchange Commission on June 10, 2015. |
10.19* | Form of Restricted Stock Award Agreement (Employees - without Employment Agreement) under the 2015 Stock Incentive Plan. |
10.20* | Form of Restricted Stock Award Agreement (Employees - with Employment Agreement) under the 2015 Stock Incentive Plan. |
10.21* | Form of Restricted Stock Award Agreement (Non-Employee Directors) under the 2015 Stock Incentive Plan. |
10.22* | Form of Restricted Stock Unit Agreement (Employees -without Employment Agreement) under the 2015 Stock Incentive Plan. |
10.23* | Form of Restricted Stock Unit Agreement (Employees - with Employment Agreement) under the 2015 Stock Incentive Plan. |
10.24* | Form of Restricted Stock Unit Agreement (Non-Employee Directors) under the 2015 Stock Incentive Plan. |
10.25* | Form of Stock Option Agreement (Employees - without Employment Agreement) under the 2015 Stock Incentive Plan. |
10.26* | Form of Stock Option Agreement (Employees - with Employment Agreement) under the 2015 Stock Incentive Plan. |
10.27* | Form of Stock Option Agreement (Non-Employee Directors) under the 2015 Stock Incentive Plan. |
10.28* | Form of Other Stock-Based Award Agreement (Executive Officer Long Term Incentive Plan (“LTIP”) Award). |
10.29* | First Security Group, Inc. 2012 Long-Term Incentive Plan, as amended and restated , as further amended and assumed by Atlantic Capital Bancshares, Inc., which is incorporated by reference to Exhibit 99.1 to the Post-Effective Amendment No. 1 on Form S-8 to Form S-4 (file no. 333- 204855), filed with the Securities and Exchange Commission on November 2, 2015. |
10.30* | Form of Incentive Stock Option Award under the 2012 Long-Term Incentive Plan, which is incorporated by reference to Exhibit 10.29 to First Security Group, Inc.’s Form 10-K for its fiscal year ended December 31, 2012, filed with the Securities and Exchange Commission on April 15, 2013. |
10.31* | Form of Non-qualified Stock Option Award under the 2012 Long-Term Incentive Plan, which is incorporated by reference to Exhibit 10.30 to First Security Group, Inc.’s Form 10-K for its fiscal year ended December 31, 2012, filed with the Securities and Exchange Commission on April 15, 2013. |
103
10.32* | First Security Group, Inc. 2002 Long-Term Incentive Plan, as amended, as further amended and assumed by Atlantic Capital Bancshares, Inc., which is incorporated by reference to Exhibit 99.2 to the Post-Effective Amendment No. 1 on Form S-8 to Form S-4 (file no. 333- 204855), filed with the Securities and Exchange Commission on November 2, 2015. |
10.33* | Form of Incentive Stock Option Award under the 2002 Long-Term Incentive Plan, which is incorporated by reference to Exhibit 10.5 to First Security Group, Inc.’s Form 10-K for its fiscal year ended December 31, 2004, filed with the Securities and Exchange Commission on March 16, 2005. |
10.34* | Form of Non-qualified Stock Option Award under the 2002 Long-Term Incentive Plan, which is incorporated by reference to Exhibit 10.6 to First Security Group, Inc.’s Form 10-K for its fiscal year ended December 31, 2004, filed with the Securities and Exchange Commission on March 16, 2005. |
10.35 | Form of Stock Purchase Agreement by and between First Security Group, Inc. and each of the investors named therein, which is incorporated by reference to Exhibit 10.18 to our Registration Statement on Form S-4/A (file no. 333-204855), filed with the Securities and Exchange Commission on July 17, 2015. |
10.36* | Retention Benefits Letter Agreement, dated August 25, 2015, by and between Atlantic Capital Bancshares, Inc. and Christopher G. Tietz, which is incorporated by reference to Exhibit 10.19 to our Registration Statement on Form S-4/A (file no. 333-204855), filed with the Securities and Exchange Commission on August 26, 2015. |
10.37* | Letter Agreement, dated October 6, 2015, between Atlantic Capital Bank and Carol H. Tiarsmith, which is incorporated by reference to Exhibit 10.1 to our Current Report on Form 8-K, filed with the Securities and Exchange Commission on October 8, 2015. |
10.38* | Offer Letter, dated September 30, 2015, between Atlantic Capital Bancshares, Inc., and Patrick T. Oakes, which is incorporated by reference to Exhibit 10.2 to our Current Report on Form 8-K, filed with the Securities and Exchange Commission on October 8, 2015. |
10.39 | Purchase and Assumption Agreement between Atlantic Capital Bank, N.A., and First Freedom Bank, dated December 17, 2015. |
10.40 | Amendment to the Purchase and Assumption Agreement between Atlantic Capital Bank, N.A., and First Freedom Bank, dated January 29, 2016. |
10.41 | Purchase and Assumption Agreement between Atlantic Capital Bank, N.A., and Athens Federal Community Bank, N.A., dated December 17, 2015. |
10.42 | Amendment to the Purchase and Assumption Agreement between Atlantic Capital Bank, N.A., and Athens Federal Community Bank, N.A., dated December 17, 2015. |
21 | Subsidiaries of Atlantic Capital Bancshares, Inc. |
23 | Consent of Ernst & Young LLP, independent registered public accounting firm of Atlantic Capital Bancshares, Inc. |
31.1 | Certification of Chief Executive Officer pursuant to Rule 13a-14(a) under the Exchange Act, as adopted pursuant to Section 302 of the Sarbanes-Oxley Act of 2002 |
31.2 | Certification of Chief Financial Officer pursuant to Rule 13a-14(a) under the Exchange Act, as adopted pursuant to Section 302 of the Sarbanes-Oxley Act of 2002 |
32.1 | Certification of Chief Executive Officer pursuant to Rule 13a-14(b) under the Exchange Act, as adopted pursuant to Section 906 of the Sarbanes-Oxley Act of 2002. |
32.2 | Certification of Chief Financial Officer pursuant to Rule 13a-14(b) under the Exchange Act, as adopted pursuant to Section 906 of the Sarbanes-Oxley Act of 2002. |
101 | The following materials from our Annual Report on Form 10-K for the year ended December 31, 2015, formatted in XBRL (eXtensible Business Reporting Language): (i) the Consolidated Balance Sheets as of December 31, 2015 and December 31, 2014; (ii) the Consolidated Statements of Operations for the Years Ended December 31, 2015, December 31, 2014, and December 31, 2013; (iii) the Consolidated Statements of Comprehensive Income Years Ended December 31, 2015, December 31, 2014, and December 31, 2013; (iv) Consolidated Statements of Shareholders’ Equity for the Years Ended December 31, 2015, December 31, 2014, and December 31, 2013; (v) the Consolidated Statement of Cash Flows Years Ended December 31, 2015, December 31, 2014, and December 31, 2013; and (vi) the Notes to the Condensed Financial Statements. |
* Management contract or compensatory plan or arrangement.
104