Attached files
| file | filename |
|---|---|
| 8-K - FORM 8-K - SIMMONS FIRST NATIONAL CORP | f8k_111318.htm |
| EX-99.1 - PRESS RELEASE - SIMMONS FIRST NATIONAL CORP | exh_991.htm |
| EX-10.1 - EXHIBIT 10.1 - SIMMONS FIRST NATIONAL CORP | exh_101.htm |
| EX-2.1 - EXHIBIT 2.1 - SIMMONS FIRST NATIONAL CORP | exh_21.htm |
Exhibit 99.2

November 13, 2018 Nasdaq: SFNC Acquisition of Reliance Bancshares, Inc.
Forward - Looking Statements and Non - GAAP Financial Measures Certain statements contained in this presentation may not be based on historical facts and are “forward - looking statements” within the meaning of Section 27A of the Securities Act of 1933, as amended, and Section 21E of the Securities Exchange Act of 1934, as amended. These forward - looking statements may be identified by reference to a future period(s) or by the use of forward - looking terminology, such as “anticipate,” “estimate,” “expect,” “foresee,” “may,” “might,” “will,” “would,” “could” or “intend,” future or conditional verb tenses, and variations or negatives of such terms. These forward - looking statements include, without limitation, those relating to the Company’s future growth, revenue, assets, asset quality, profitability and customer service, critical accounting policies, net interest margin, non - interest revenue, market conditions related to the Company’s common stock repurchase program, allowance for loan losses, the effect of certain new accounting standards on the Company’s financial statements, income tax deductions, credit quality, the level of credit losses from lending commitments, net interest revenue, interest rate sensitivity, loan loss experience, liquidity, capital resources, market risk, earnings, effect of pending litigation, acquisition strategy, legal and regulatory limitations and compliance and competition. Readers are cautioned not to place undue reliance on the forward - looking statements contained in this presentation in that actual results could differ materially from those indicated in such forward - looking statements, due to a variety of factors. These factors include, but are not limited to, changes in the Company’s operating or expansion strategy, availability of and costs associated with obtaining adequate and timely sources of liquidity, the ability to maintain credit quality, possible adverse rulings, judgments, settlements and other outcomes of pending litigation, the ability of the Company to collect amounts due under loan agreements, changes in consumer preferences, effectiveness of the Company’s interest rate risk management strategies, laws and regulations affecting financial institutions in general or relating to taxes, the effect of pending or future legislation, the ability of the Company to repurchase its common stock on favorable terms, the ability to obtain regulatory approvals and meet other closing conditions to the acquisition, including approval by the shareholders of Reliance Bancshares , Inc. (“ RLBS ”) on the expected terms and schedule, delay in closing the acquisition, difficulties and delays in integrating the RLBS business or fully realizing cost savings and other benefits of the acquisition, business disruption following the acquisition, changes in interest rates and capital markets, inflation, customer acceptance of the Company’s products and services, and other risk factors. Other relevant risk factors may be detailed from time to time in the Company’s press releases and filings with the Securities and Exchange Commission. Any forward - looking statement speaks only as of the date of this Report, and we undertake no obligation to update these forward - looking statements to reflect events or circumstances that occur after the date of this Report. Annualized, pro forma, projected and estimated numbers are used for illustrative purpose s only, are not forecasts and may not reflect actual results. Non - GAAP Financial Measures This document contains financial information determined by methods other than in accordance with generally accepted accountin g p rinciples (GAAP). The company’s management uses these non - GAAP financial measures in their analysis of the company’s performance. These measures typically adjust GAAP performance measures to include the tax benefit associated with revenue items that are tax - exempt, as well as adjust income available to common shareholders for certain significant activities or nonrecurring transactions. Since the presentation of these GAAP performance measures and their impact differ between companies, management believes presentations of these non - GAAP financial measures provide useful supplemental information that is essential to a proper understanding of the operating results of the company’s core businesses. These non - GAAP disclosures should not be viewed as a substitute for operating results determined in accordance with GAAP, nor are they necessarily comparable to non - GAAP performance measures that may be presented by other companies. 2
Important Additional Information and Where to Find It In connection with the proposed merger, Simmons First National Corporation "SFNC" will file with the SEC a Registration Statement on Form S - 4 that will include a proxy statement of RLBS , and a prospectus of SFNC, as well as other relevant documents concerning the proposed transaction. This communication does not constitute an offer to sell or the solicitation of an offer to buy any securities or a solicitation of any vote or approval. SHAREHOLDERS OF RLBS ARE URGED TO READ THE REGISTRATION STATEMENT AND THE PROXY STATEMENT/PROSPECTUS REGARDING THE MERGER WHEN IT BECOMES AVAILABLE AND ANY OTHER RELEVANT DOCUMENTS FILED WITH THE SEC BY SFNC, AS WELL AS ANY AMENDMENTS OR SUPPLEMENTS TO THOSE DOCUMENTS, BECAUSE THEY WILL CONTAIN IMPORTANT INFORMATION. A free copy of the proxy statement/prospectus, as well as other filings containing information about SFNC, may be obtained at the SEC’s Internet site (http://www.sec.gov), when they are filed by SFNC. You will also be able to obtain these documents, when they are filed, free of charge, from SFNC at www.simmonsbank.com under the heading “Investor Relations”. Copies of the proxy statement/prospectus can also be obtained, when it becomes available, free of charge, by directing a request to Simmons First National Corporation, 501 Main Street, Pine Bluff, Arkansas 71601, Attention: Stephen C. Massanelli , Investor Relations Officer, Telephone: (870) 541 - 1000 or to Reliance Bancshares, Inc., 10401 Clayton Road, Frontenac, Missouri 63131, Attention: Allan Ivie , Telephone: (314) 569 - 7209. SFNC, RLBS, and certain of their respective directors, executive officers and other members of their management and employees may be deemed to be participants in the solicitation of proxies in connection with the proposed transaction. Information about the directors and executive officers of SFNC, and their respective ownership of SFNC common stock, is set forth in the proxy statement for SFNC’s 2017 annual meeting of shareholders, as filed with the SEC on Schedule 14A on March 14, 2018. Additional information regarding all of the participants in the solicitation may be obtained by reading the proxy statement/prospectus regarding the proposed merger when it becomes available. Free copies of this document may be obtained as described in the preceding paragraph. 3
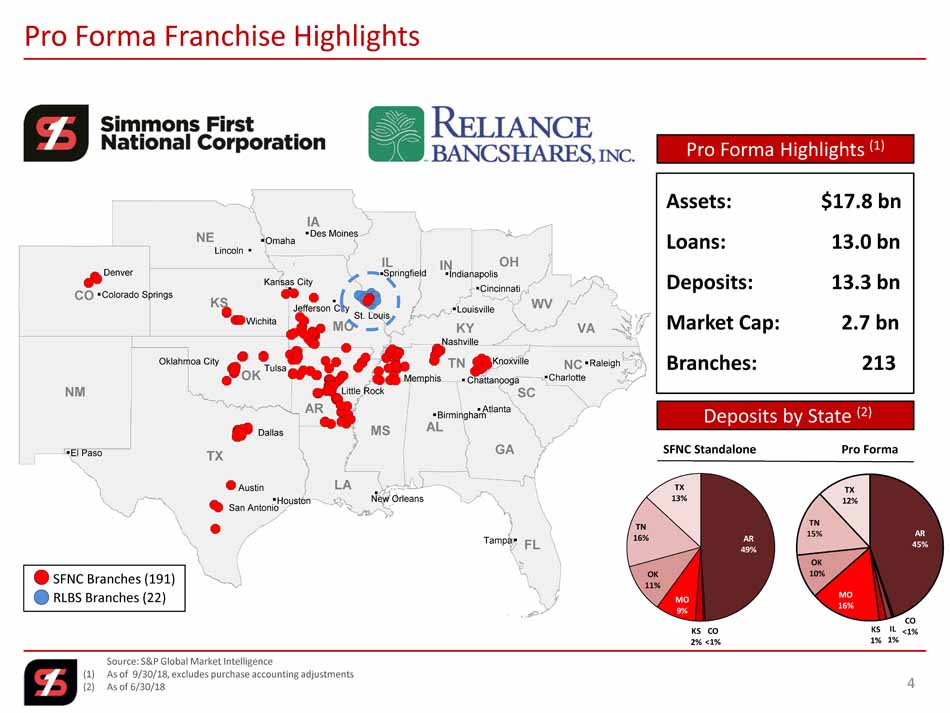
OK SC KY TN MO CO AR Lincoln Kansas City Jefferson City Tulsa Houston San Antonio Austin Tampa Knoxville Chattanooga Nashville Atlanta Memphis St. Louis Springfield Wichita Denver Little Rock Dallas New Orleans Oklahmoa City AL FL GA IL IN IA KS LA MS NE NM NC OH TX VA WV El Paso Charlotte Cincinnati Omaha Colorado Springs Louisville Birmingham Des Moines Indianapolis Raleigh Source: S&P Global Market Intelligence (1) As of 9/30/18, excludes purchase accounting adjustments (2) As of 6/30/18 Pro Forma Franchise Highlights SFNC Branches (191) RLBS Branches (22) AR 45% CO <1% IL 1% KS 1% MO 16% OK 10% TN 15% TX 12% Deposits by State (2) Pro Forma Highlights (1) AR 49% CO <1% KS 2% MO 9% OK 11% TN 16% TX 13% SFNC Standalone Pro Forma 4 Assets: $17.8 bn Loans: 13.0 bn Deposits: 13.3 bn Market Cap: 2.7 bn Branches: 213
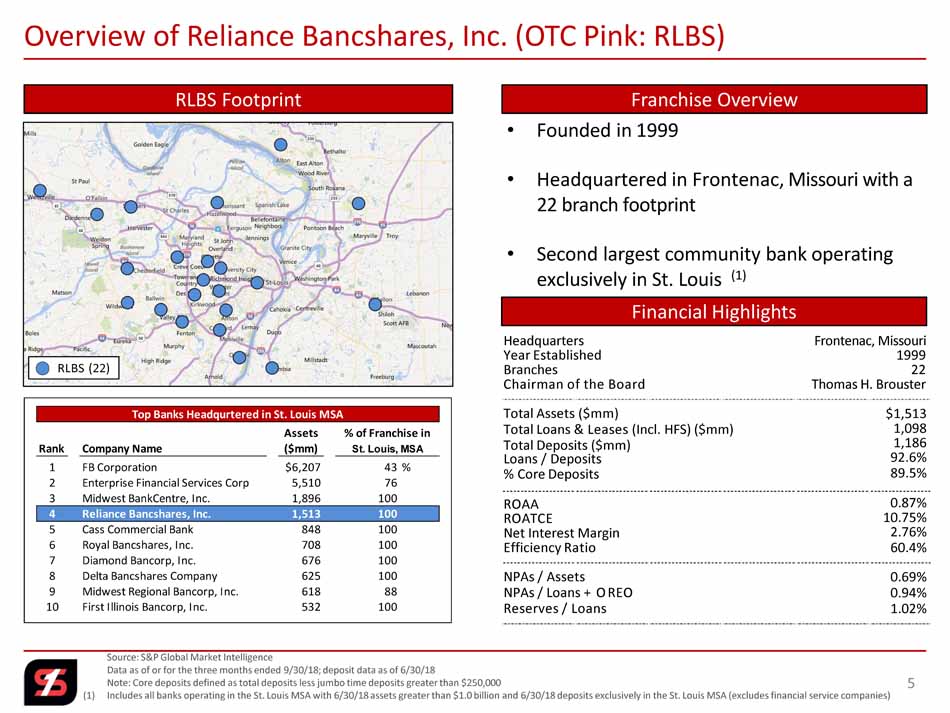
Source: S&P Global Market Intelligence Data as of or for the three months ended 9/30/18; deposit data as of 6/30/18 Note: Core deposits defined as total deposits less jumbo time deposits greater than $250, 000 (1) Includes all banks operating in the St. Louis MSA with 6/30/18 assets greater than $1.0 billion and 6/30/18 deposits exclusi vely in the St. Louis MSA (excludes financial service companies) Overview of Reliance Bancshares, Inc. (OTC Pink: RLBS) RLBS Footprint • Founded in 1999 • Headquartered in Frontenac , Missouri with a 22 branch footprint • Second largest community bank operating exclusively in St. Louis (1) Headquarters Year Established Branches Chairman of the Board Frontenac, Missouri 1999 22 Thomas H. Brouster Total Assets ($mm) Total Loans & Leases (Incl. HFS) ($mm) Total Deposits ($mm) Loans / Deposits % Core Deposits $ 1 , 513 1, 098 1, 186 92.6 % 89.5 % ROAA R O A T C E Net Interest Margin Efficiency Ratio 0.87 % 10.75 % 2 . 76 % 60.4 % NPAs / Assets NPAs / Loans + O REO Reserves / Loans 0. 69 % 0. 94 % 1.02% Franchise Overview Financial Highlights RLBS ( 22 ) Top Banks Headqurtered in St. Louis MSA Assets % of Franchise in Rank Company Name ($mm) St. Louis, MSA 1 FB Corporation $6,207 43% 2 Enterprise Financial Services Corp 5,510 76 3 Midwest BankCentre, Inc. 1,896 100 4 Reliance Bancshares, Inc. 1,513 100 5 Cass Commercial Bank 848 100 6 Royal Bancshares, Inc. 708 100 7 Diamond Bancorp, Inc. 676 100 8 Delta Bancshares Company 625 100 9 Midwest Regional Bancorp, Inc. 618 88 10 First Illinois Bancorp, Inc. 532 100 5
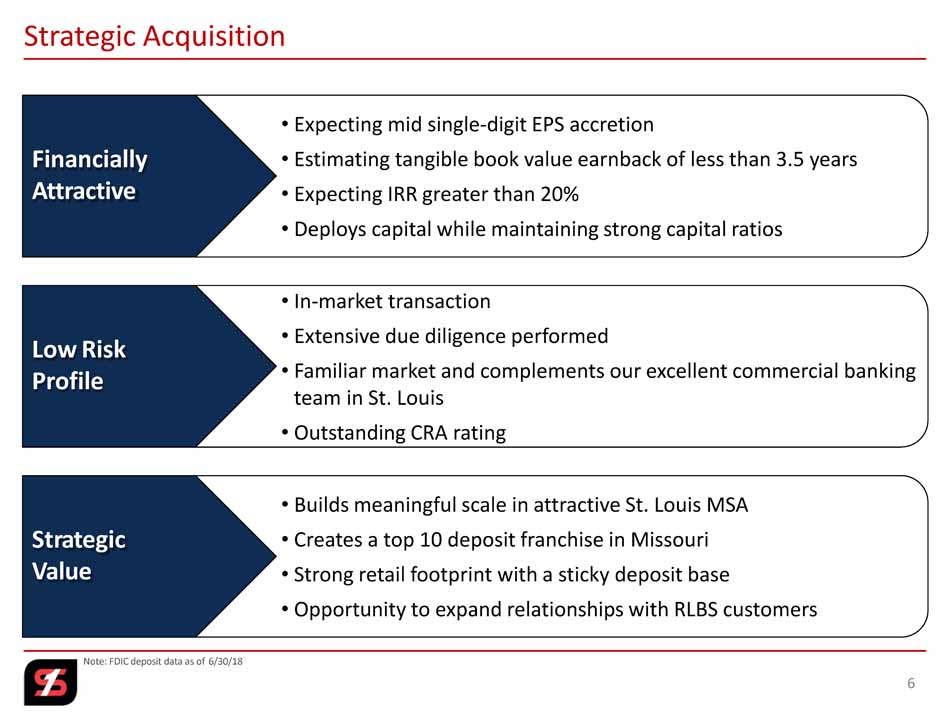
Note: FDIC deposit data as of 6/30/18 Strategic Acquisition Low Risk Profile F i n a nc i a l l y Attractive St r a t egi c Value • Builds meaningful scale in attractive St. Louis MSA • Creates a top 10 deposit franchise in Missouri • Strong retail footprint with a sticky deposit base • Opportunity to expand relationships with RLBS customers • In - market transaction • Extensive due diligence performed • Familiar market and complements our excellent commercial banking team in St. Louis • Outstanding CRA rating • Expecting mid single - digit EPS accretion • Estimating tangible book value earnback of less than 3.5 years • Expecting IRR greater than 20% • Deploys capital while maintaining strong capital ratios 6
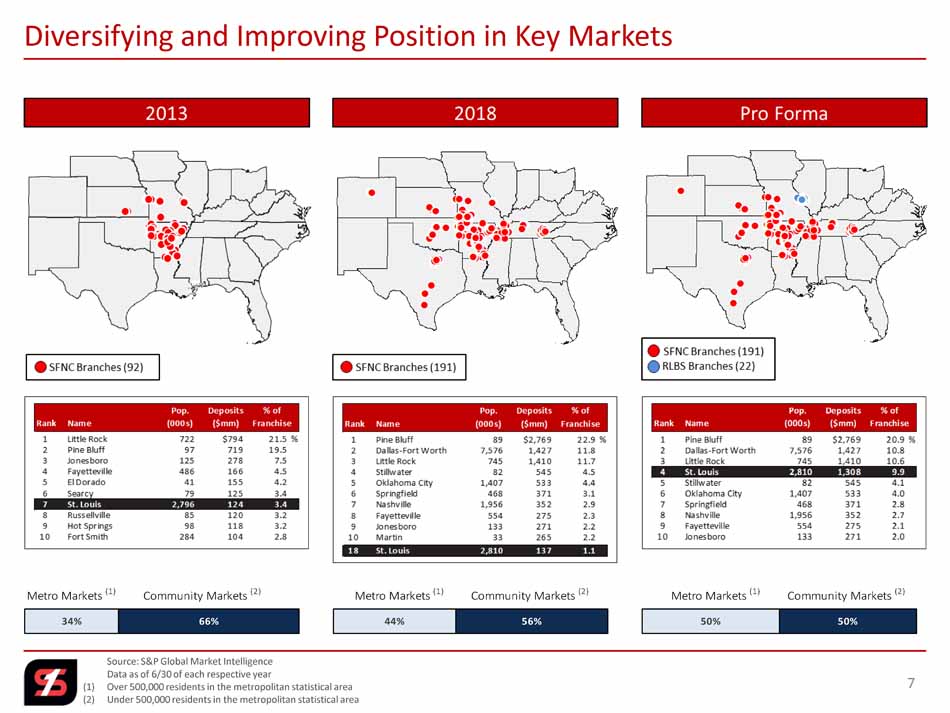
Source: S&P Global Market Intelligence Data as of 6/30 of each respective year (1) Over 500,000 residents in the metropolitan statistical area (2) Under 500,000 residents in the metropolitan statistical area Diversifying and Improving Position in Key Markets 50% 50% 44% 56% 34% 66% Metro Markets (1) Community Markets (2) Metro Markets (1) Community Markets (2) Metro Markets (1) Community Markets (2) 7
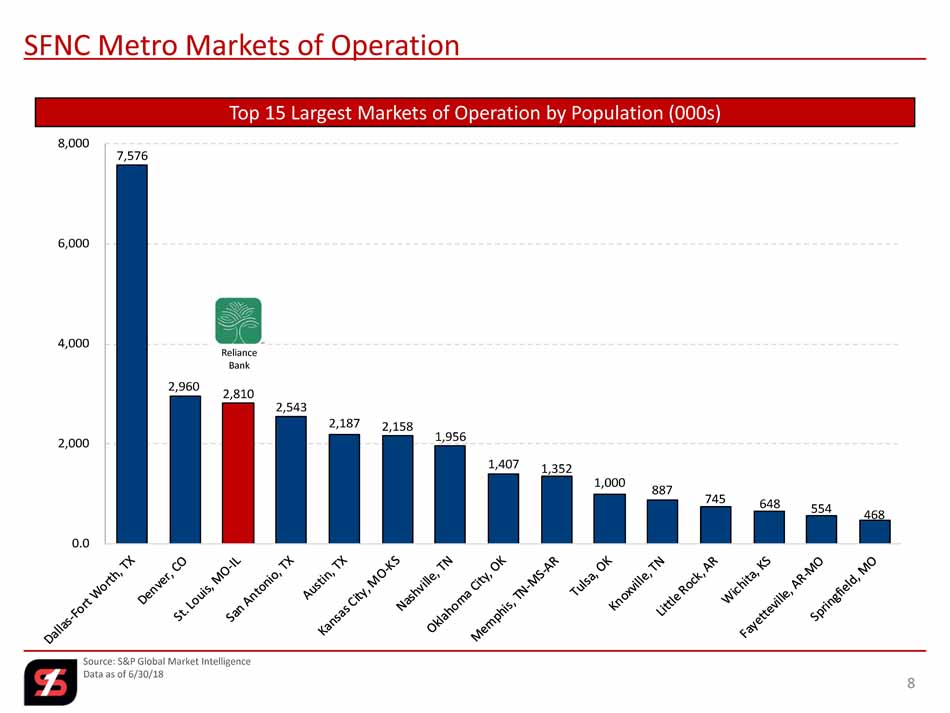
7,576 2,960 2,810 2,543 2,187 2,158 1,956 1,407 1,352 1,000 887 745 648 554 468 0.0 2,000 4,000 6,000 8,000 SFNC Metro Markets of Operation Top 15 Largest Markets of Operation by Population (000s) Source: S&P Global Market Intelligence Data as of 6/30/18 8 Reliance Bank
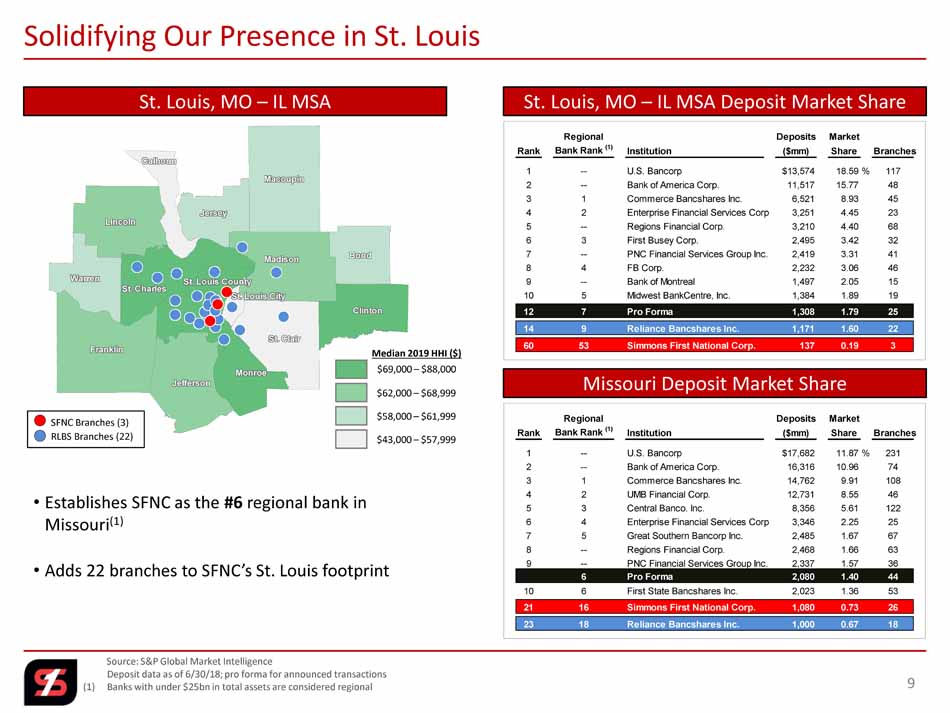
l l l l l l l l l l l l l l l l l l l l l l l l l l l l l l l l l l l l l l l l l l l l l l l l l l l l l l l l l l l l l l l l l l l l l l l l l l l l l l l l l l l l l l l l l l l l l l l l l l l l l l l l l l l l l l l l l l l l l l l l l l l l l l l l l l l l l l l l l l l l l l l l l l l l l l l l l l l l l l l l l l l l l l l l l l l l l l l l l l l l l l l l l l l l l l l l l l l l l l l l l l l l l l l l l l l l l l l l l l l l l l l l l l l l l l l l l l l l l l l l l l l l l l l l l l l l l l l l l l l l l l l l l l l l l l l l l l l l l l l l l l l l l l l l l l l l l l l l l l l l l l l l l l l l l l l l l l l l l l l l l l l l l l l l l l l l l l l l l l l l l l l l l l l l l l l l l l l l l l l l l l l l l l l l l l l l l l l l l l l l l l l l l l l l l l l l l l l l l l l l l l l l l l l l l l l l l l l l l l l l l l l l l l l l l l l l l l l l l l l l l l l l l l l l l l l l l l l l l l l l l l l l l l l l l l l l l l l l l l l l l l l l l l l l l l l l l l l l l l l l l l l l l l l l l l l l l l l l l l l l l l l l l l l l l l l l l l l l l l l l l l l l l l l l l l l l l l l l l l l l l l l l l l l l l l l l l l l l l l l l l l l l l l l l l l l l l l l l l l l l St. Louis City St. Louis City St. Louis City St. Louis City St. Louis City St. Louis City St. Louis City St. Louis City St. Louis City St. Louis City St. Louis City St. Louis City St. Louis City St. Louis City St. Louis City St. Louis City St. Louis City St. Louis City St. Louis City St. Louis City St. Louis City St. Louis City St. Louis City St. Louis City St. Louis City St. Louis City St. Louis City St. Louis City St. Louis City St. Louis City St. Louis City St. Louis City St. Louis City St. Louis City St. Louis City St. Louis City St. Louis City St. Louis City St. Louis City St. Louis City St. Louis City St. Louis City St. Louis City St. Louis City St. Louis City St. Louis City St. Louis City St. Louis City St. Louis City St. Louis County St. Louis County St. Louis County St. Louis County St. Louis County St. Louis County St. Louis County St. Louis County St. Louis County St. Louis County St. Louis County St. Louis County St. Louis County St. Louis County St. Louis County St. Louis County St. Louis County St. Louis County St. Louis County St. Louis County St. Louis County St. Louis County St. Louis County St. Louis County St. Louis County St. Louis County St. Louis County St. Louis County St. Louis County St. Louis County St. Louis County St. Louis County St. Louis County St. Louis County St. Louis County St. Louis County St. Louis County St. Louis County St. Louis County St. Louis County St. Louis County St. Louis County St. Louis County St. Louis County St. Louis County St. Louis County St. Louis County St. Louis County St. Louis County St. Clair St. Clair St. Clair St. Clair St. Clair St. Clair St. Clair St. Clair St. Clair St. Clair St. Clair St. Clair St. Clair St. Clair St. Clair St. Clair St. Clair St. Clair St. Clair St. Clair St. Clair St. Clair St. Clair St. Clair St. Clair St. Clair St. Clair St. Clair St. Clair St. Clair St. Clair St. Clair St. Clair St. Clair St. Clair St. Clair St. Clair St. Clair St. Clair St. Clair St. Clair St. Clair St. Clair St. Clair St. Clair St. Clair St. Clair St. Clair St. Clair Clinton Clinton Clinton Clinton Clinton Clinton Clinton Clinton Clinton Clinton Clinton Clinton Clinton Clinton Clinton Clinton Clinton Clinton Clinton Clinton Clinton Clinton Clinton Clinton Clinton Clinton Clinton Clinton Clinton Clinton Clinton Clinton Clinton Clinton Clinton Clinton Clinton Clinton Clinton Clinton Clinton Clinton Clinton Clinton Clinton Clinton Clinton Clinton Clinton St. Charles St. Charles St. Charles St. Charles St. Charles St. Charles St. Charles St. Charles St. Charles St. Charles St. Charles St. Charles St. Charles St. Charles St. Charles St. Charles St. Charles St. Charles St. Charles St. Charles St. Charles St. Charles St. Charles St. Charles St. Charles St. Charles St. Charles St. Charles St. Charles St. Charles St. Charles St. Charles St. Charles St. Charles St. Charles St. Charles St. Charles St. Charles St. Charles St. Charles St. Charles St. Charles St. Charles St. Charles St. Charles St. Charles St. Charles St. Charles St. Charles Franklin Franklin Franklin Franklin Franklin Franklin Franklin Franklin Franklin Franklin Franklin Franklin Franklin Franklin Franklin Franklin Franklin Franklin Franklin Franklin Franklin Franklin Franklin Franklin Franklin Franklin Franklin Franklin Franklin Franklin Franklin Franklin Franklin Franklin Franklin Franklin Franklin Franklin Franklin Franklin Franklin Franklin Franklin Franklin Franklin Franklin Franklin Franklin Franklin Madison Madison Madison Madison Madison Madison Madison Madison Madison Madison Madison Madison Madison Madison Madison Madison Madison Madison Madison Madison Madison Madison Madison Madison Madison Madison Madison Madison Madison Madison Madison Madison Madison Madison Madison Madison Madison Madison Madison Madison Madison Madison Madison Madison Madison Madison Madison Madison Madison Calhoun Calhoun Calhoun Calhoun Calhoun Calhoun Calhoun Calhoun Calhoun Calhoun Calhoun Calhoun Calhoun Calhoun Calhoun Calhoun Calhoun Calhoun Calhoun Calhoun Calhoun Calhoun Calhoun Calhoun Calhoun Calhoun Calhoun Calhoun Calhoun Calhoun Calhoun Calhoun Calhoun Calhoun Calhoun Calhoun Calhoun Calhoun Calhoun Calhoun Calhoun Calhoun Calhoun Calhoun Calhoun Calhoun Calhoun Calhoun Calhoun Bond Bond Bond Bond Bond Bond Bond Bond Bond Bond Bond Bond Bond Bond Bond Bond Bond Bond Bond Bond Bond Bond Bond Bond Bond Bond Bond Bond Bond Bond Bond Bond Bond Bond Bond Bond Bond Bond Bond Bond Bond Bond Bond Bond Bond Bond Bond Bond Bond Jersey Jersey Jersey Jersey Jersey Jersey Jersey Jersey Jersey Jersey Jersey Jersey Jersey Jersey Jersey Jersey Jersey Jersey Jersey Jersey Jersey Jersey Jersey Jersey Jersey Jersey Jersey Jersey Jersey Jersey Jersey Jersey Jersey Jersey Jersey Jersey Jersey Jersey Jersey Jersey Jersey Jersey Jersey Jersey Jersey Jersey Jersey Jersey Jersey Macoupin Macoupin Macoupin Macoupin Macoupin Macoupin Macoupin Macoupin Macoupin Macoupin Macoupin Macoupin Macoupin Macoupin Macoupin Macoupin Macoupin Macoupin Macoupin Macoupin Macoupin Macoupin Macoupin Macoupin Macoupin Macoupin Macoupin Macoupin Macoupin Macoupin Macoupin Macoupin Macoupin Macoupin Macoupin Macoupin Macoupin Macoupin Macoupin Macoupin Macoupin Macoupin Macoupin Macoupin Macoupin Macoupin Macoupin Macoupin Macoupin Monroe Monroe Monroe Monroe Monroe Monroe Monroe Monroe Monroe Monroe Monroe Monroe Monroe Monroe Monroe Monroe Monroe Monroe Monroe Monroe Monroe Monroe Monroe Monroe Monroe Monroe Monroe Monroe Monroe Monroe Monroe Monroe Monroe Monroe Monroe Monroe Monroe Monroe Monroe Monroe Monroe Monroe Monroe Monroe Monroe Monroe Monroe Monroe Monroe Jefferson Jefferson Jefferson Jefferson Jefferson Jefferson Jefferson Jefferson Jefferson Jefferson Jefferson Jefferson Jefferson Jefferson Jefferson Jefferson Jefferson Jefferson Jefferson Jefferson Jefferson Jefferson Jefferson Jefferson Jefferson Jefferson Jefferson Jefferson Jefferson Jefferson Jefferson Jefferson Jefferson Jefferson Jefferson Jefferson Jefferson Jefferson Jefferson Jefferson Jefferson Jefferson Jefferson Jefferson Jefferson Jefferson Jefferson Jefferson Jefferson Lincoln Lincoln Lincoln Lincoln Lincoln Lincoln Lincoln Lincoln Lincoln Lincoln Lincoln Lincoln Lincoln Lincoln Lincoln Lincoln Lincoln Lincoln Lincoln Lincoln Lincoln Lincoln Lincoln Lincoln Lincoln Lincoln Lincoln Lincoln Lincoln Lincoln Lincoln Lincoln Lincoln Lincoln Lincoln Lincoln Lincoln Lincoln Lincoln Lincoln Lincoln Lincoln Lincoln Lincoln Lincoln Lincoln Lincoln Lincoln Lincoln Warren Warren Warren Warren Warren Warren Warren Warren Warren Warren Warren Warren Warren Warren Warren Warren Warren Warren Warren Warren Warren Warren Warren Warren Warren Warren Warren Warren Warren Warren Warren Warren Warren Warren Warren Warren Warren Warren Warren Warren Warren Warren Warren Warren Warren Warren Warren Warren Warren Regional Deposits Market Rank Bank Rank (1) Institution ($mm) Share Branches 1 -- U.S. Bancorp $17,682 11.87% 231 2 -- Bank of America Corp. 16,316 10.96 74 3 1 Commerce Bancshares Inc. 14,762 9.91 108 4 2 UMB Financial Corp. 12,731 8.55 46 5 3 Central Banco. Inc. 8,356 5.61 122 6 4 Enterprise Financial Services Corp 3,346 2.25 25 7 5 Great Southern Bancorp Inc. 2,485 1.67 67 8 -- Regions Financial Corp. 2,468 1.66 63 9 -- PNC Financial Services Group Inc. 2,337 1.57 36 6 Pro Forma 2,080 1.40 44 10 6 First State Bancshares Inc. 2,023 1.36 53 -- 21 16 Simmons First National Corp. 1,080 0.73 26 -- 23 18 Reliance Bancshares Inc. 1,000 0.67 18 St. Louis, MO – IL MSA Source: S&P Global Market Intelligence Deposit data as of 6/30/18; pro forma for announced transactions (1) Banks with under $25bn in total assets are considered regional Solidifying Our Presence in St. Louis St. Louis, MO – IL MSA Deposit Market Share Missouri Deposit Market Share • Establishes SFNC as the #6 regional bank in Missouri (1) • Adds 22 branches to SFNC’s St. Louis footprint SFNC Branches (3) RLBS Branches (22) Regional Deposits Market Rank Bank Rank (1) Institution ($mm) Share Branches 1 -- U.S. Bancorp $13,574 18.59% 117 2 -- Bank of America Corp. 11,517 15.77 48 3 1 Commerce Bancshares Inc. 6,521 8.93 45 4 2 Enterprise Financial Services Corp 3,251 4.45 23 5 -- Regions Financial Corp. 3,210 4.40 68 6 3 First Busey Corp. 2,495 3.42 32 7 -- PNC Financial Services Group Inc. 2,419 3.31 41 8 4 FB Corp. 2,232 3.06 46 9 -- Bank of Montreal 1,497 2.05 15 10 5 Midwest BankCentre, Inc. 1,384 1.89 19 -- 12 7 Pro Forma 1,308 1.79 25 14 9 Reliance Bancshares Inc. 1,171 1.60 22 60 53 Simmons First National Corp. 137 0.19 3 $69,000 – $88,000 $62,000 – $68,999 $58,000 – $61,999 $43,000 – $57,999 Median 2019 HHI ($) 9
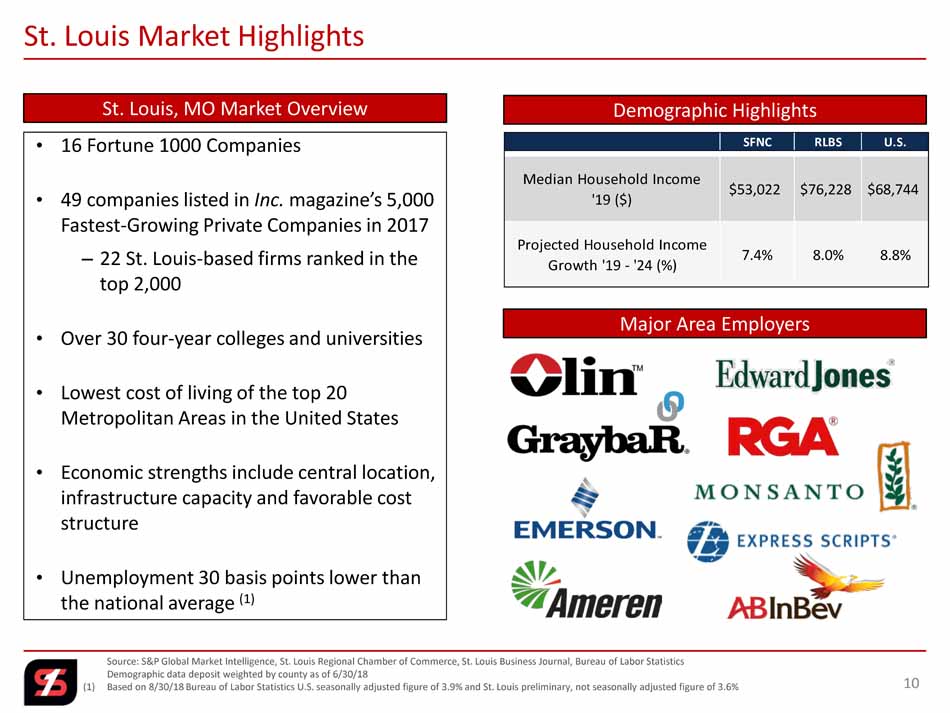
St. Louis, MO Market Overview Source: S&P Global Market Intelligence, St. Louis Regional Chamber of Commerce, St. Louis Business Journal, Bureau of Labor S ta tistics Demographic data deposit weighted by county as of 6/30/18 (1) Based on 8/30/18 Bureau of Labor Statistics U.S. seasonally adjusted figure of 3.9% and St. Louis preliminary, not seasonall y adjusted figure of 3.6% St. Louis Market Highlights Demographic Highlights Major Area Employers • 16 Fortune 1000 Companies • 49 companies listed in Inc. magazine’s 5,000 Fastest - Growing Private Companies in 2017 – 22 St. Louis - based firms ranked in the top 2,000 • Over 30 four - year colleges and universities • Lowest cost of living of the top 20 Metropolitan Areas in the United States • Economic strengths include central location, infrastructure capacity and favorable cost structure • Unemployment 30 basis points lower than the national average (1) SFNC RLBS U.S. Median Household Income '19 ($) $53,022 $76,228 $68,744 Projected Household Income Growth '19 - '24 (%) 7.4% 8.0% 8.8% 10
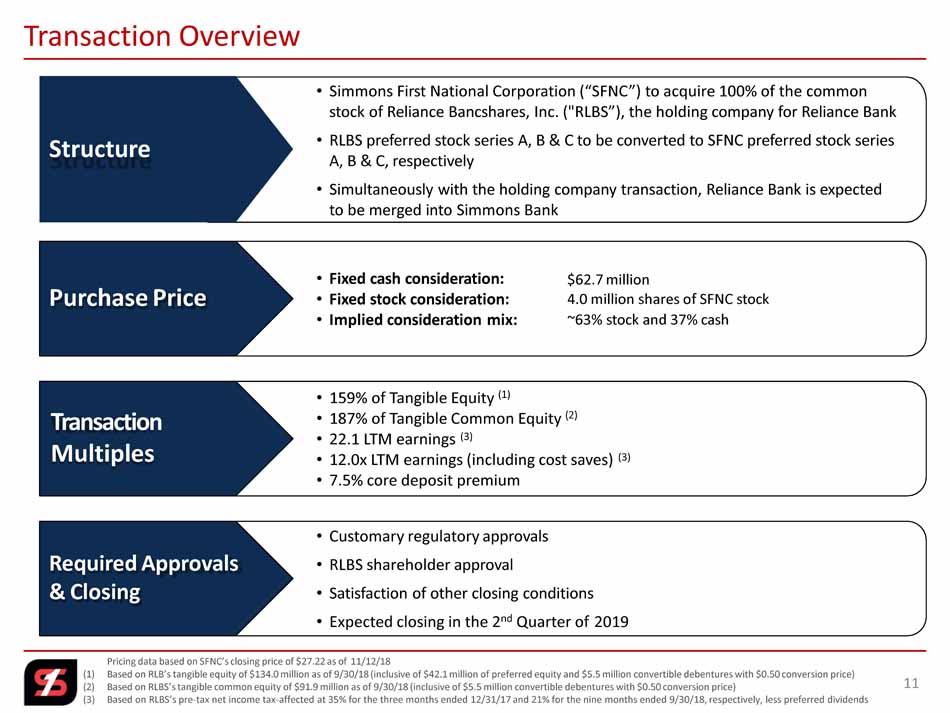
Pricing data based on SFNC’s closing price of $27.22 as of 11/12/18 (1) Based on RLB’s tangible equity of $134.0 million as of 9/30/18 (inclusive of $42.1 million of preferred equity and $5.5 milli on convertible debentures with $0.50 conversion price) (2) Based on RLBS’s tangible common equity of $91.9 million as of 9/30/18 (inclusive of $5.5 million convertible debentures with $0. 50 conversion price) (3) Based on RLBS’s pre - tax net income tax - affected at 35% for the three months ended 12/31/17 and 21% for the nine months ended 9/3 0/18, respectively, less preferred dividends Transaction Overview • 159% of T angible Equity (1) • 187% of Tangible Common Equity (2) • 22.1 LTM earnings ( 3 ) • 12.0 x LTM earnings (including cost saves) ( 3 ) • 7.5% core deposit premium Transaction Mu l t i p les • Simmons First National Corporation (“SFNC”) to acquire 100% of the common stock of Reliance Bancshares , Inc. ( "RLBS” ), the holding company for Reliance Bank • RLBS preferred stock series A, B & C to be converted to SFNC preferred stock series A, B & C, respectively • Simultaneously with the holding company transaction, Reliance Bank is expected to be merged into Simmons Bank Structure • Customary regulatory approval s • RLBS shareholder approval • Satisfaction of other closing conditions • Expected closing in the 2 nd Quarter of 201 9 Required Approvals & Closing • Fixed cash consideration: • Fixed stock consideration: • Implied consideration mix: $ 62.7 million 4.0 million shares of SFNC stock ~ 63 % stock and 37 % cash Purchase Price 11
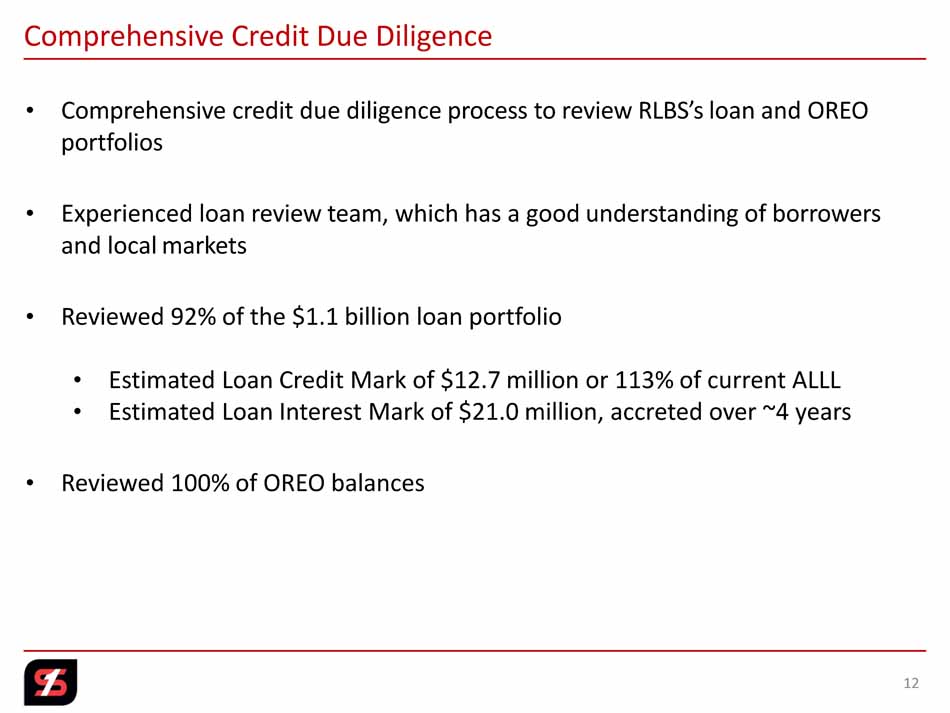
Comprehensive Credit Due Diligence • Comprehensive credit due diligence process to review RLBS ’s loan and OREO portfolios • Experienced loan review team, which has a good understanding of borrowers and local markets • Reviewed 92% of the $1.1 billion loan portfolio • Estimated Loan Credit Mark of $12.7 million or 113% of current ALLL • Estimated Loan Interest Mark of $21.0 million, accreted over ~4 years • Reviewed 100% of OREO balances 12
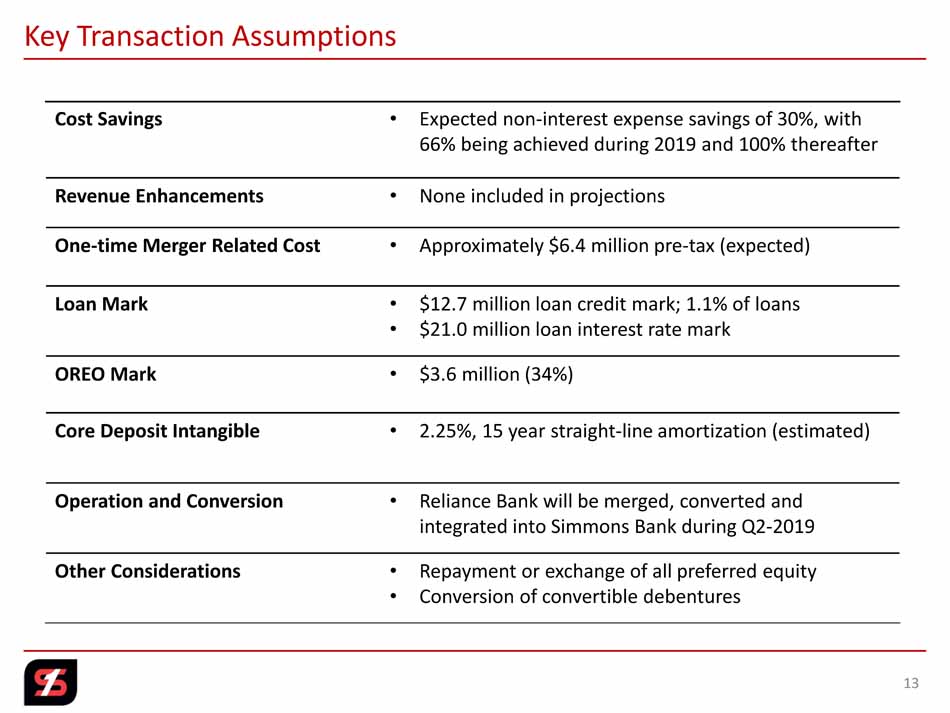
Key Transaction Assumptions Cost Savings • Expected non - interest expense savings of 30%, with 66% being achieved during 2019 and 100% thereafter Revenue Enhancements • None included in projections One - time Merger Related Cost • Approximately $6.4 million pre - tax (expected) Loan Mark • $12.7 million loan credit mark; 1.1% of loans • $21.0 million loan interest rate mark OREO Mark • $3.6 million (34%) Core Deposit Intangible • 2.25%, 15 year straight - line amortization (estimated) Operation and Conversion • Reliance Bank will be merged, converted and integrated into Simmons Bank during Q2 - 2019 Other Considerations • Repayment or exchange of all preferred equity • Conversion of convertible debentures 13
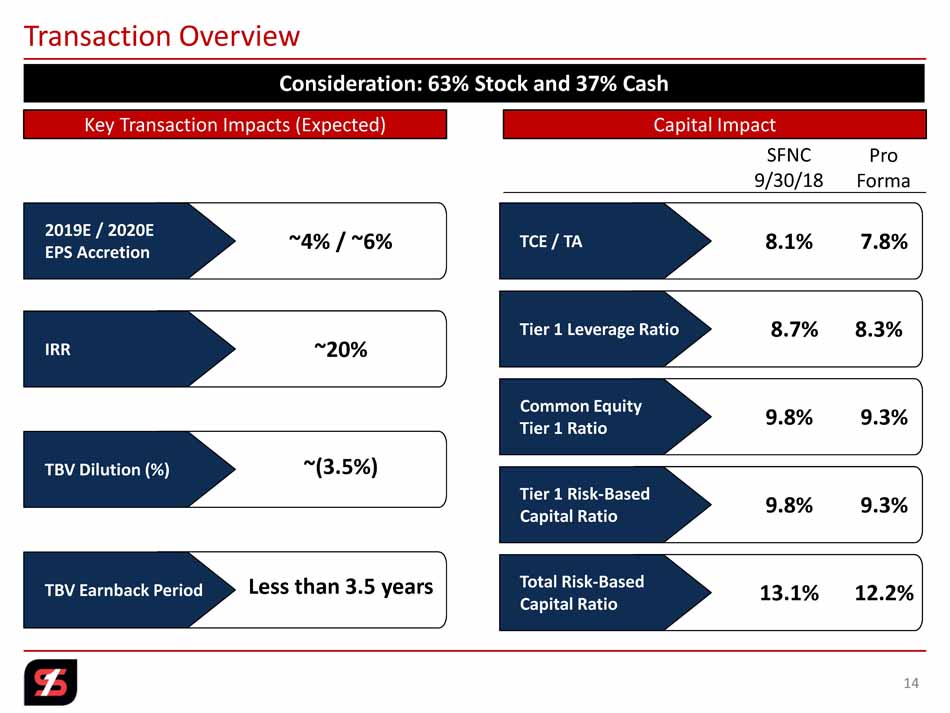
Transaction Overview 14 Key Transaction Impacts (Expected) Capital Impact SFNC 9/30/18 Pro Forma 2019E / 2020E EPS Accretion IRR TBV Dilution (%) TBV Earnback Period TCE / TA Tier 1 Leverage Ratio Common Equity Tier 1 Ratio Tier 1 Risk - Based Capital Ratio Total Risk - Based Capital Ratio ~4% / ~6% ~20% ~(3.5%) Less than 3.5 years 8.1% 7.8% 8.7% 8.3% 9.8% 9.3% 9.8% 9.3% 13.1% 12.2% Consideration: 63% Stock and 37% Cash
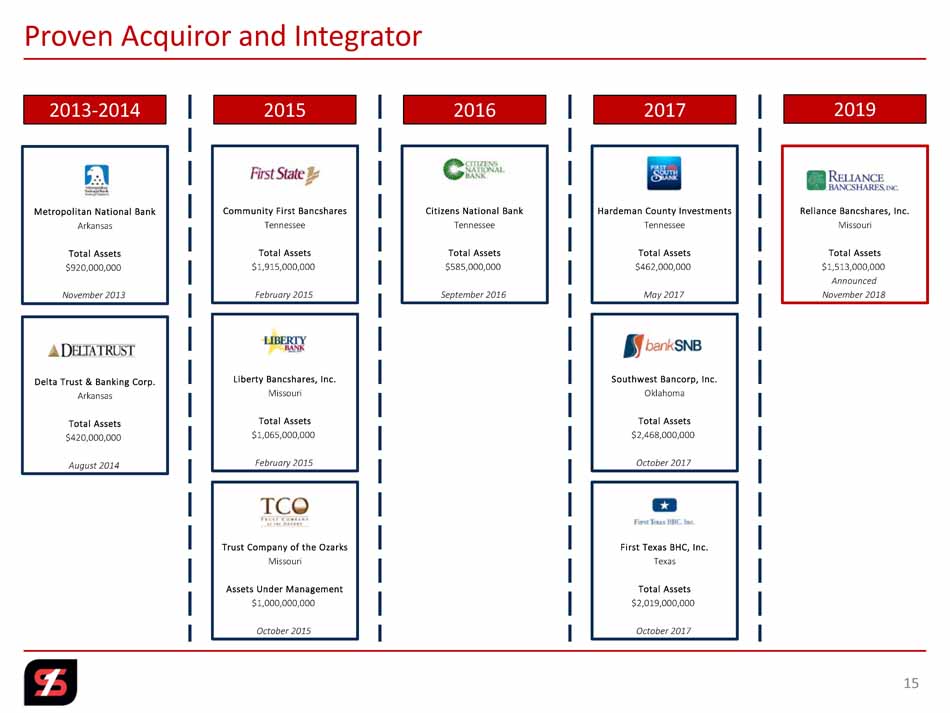
Proven Acquiror and Integrator 2013 - 2014 2016 2017 2015 2019 Metropolitan National Bank Arkansas Total Assets $920,000,000 November 2013 Delta Trust & Banking Corp. Arkansas Total Assets $420,000,000 August 2014 Community First Bancshares Tennessee Total Assets $1,915,000,000 February 2015 Liberty Bancshares, Inc. Missouri Total Assets $1,065,000,000 February 2015 Trust Company of the Ozarks Missouri Assets Under Management $1,000,000,000 October 2015 Citizens National Bank Tennessee Total Assets $585,000,000 September 2016 Hardeman County Investments Tennessee Total Assets $462,000,000 May 2017 Southwest Bancorp, Inc. Oklahoma Total Assets $2,468,000,000 October 2017 First Texas BHC, Inc. Texas Total Assets $2,019,000,000 October 2017 Reliance Bancshares, Inc. Missouri Total Assets $1,513,000,000 Announced November 2018 15
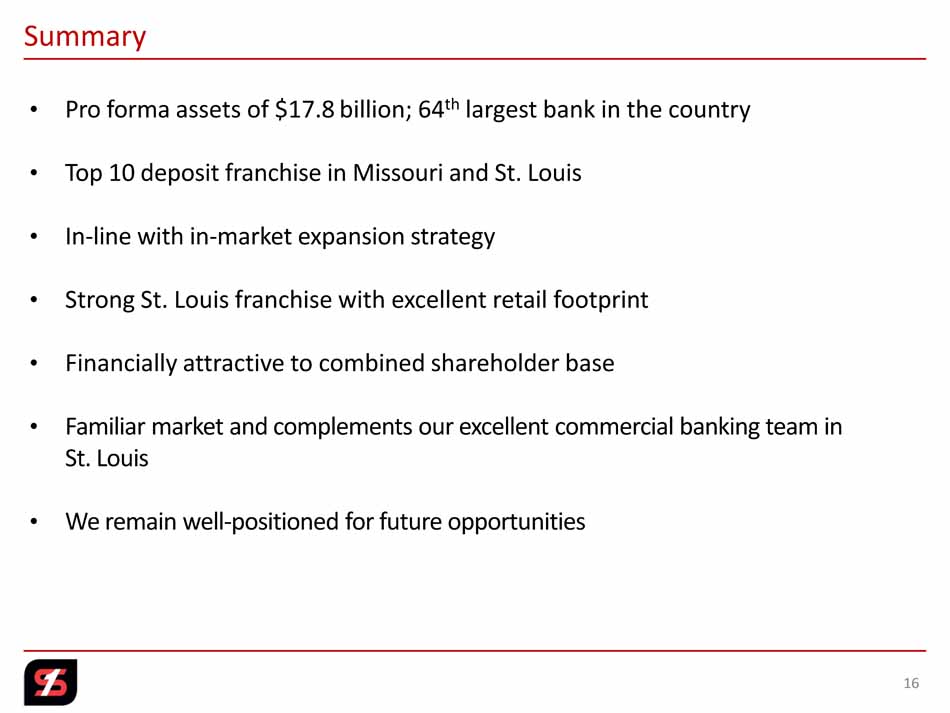
Summary • Pro forma assets of $1 7 . 8 billion ; 64 th largest bank in the country • Top 10 deposit franchise in Missouri and St. Louis • In - line with in - market expansion strategy • Strong St. Louis franchise with excellent retail footprint • Financially attractive to combined shareholder base • Familiar market and complements our excellent commercial banking team in St. Louis • We remain well - positioned for future opportunities 16

Supplemental Information 17
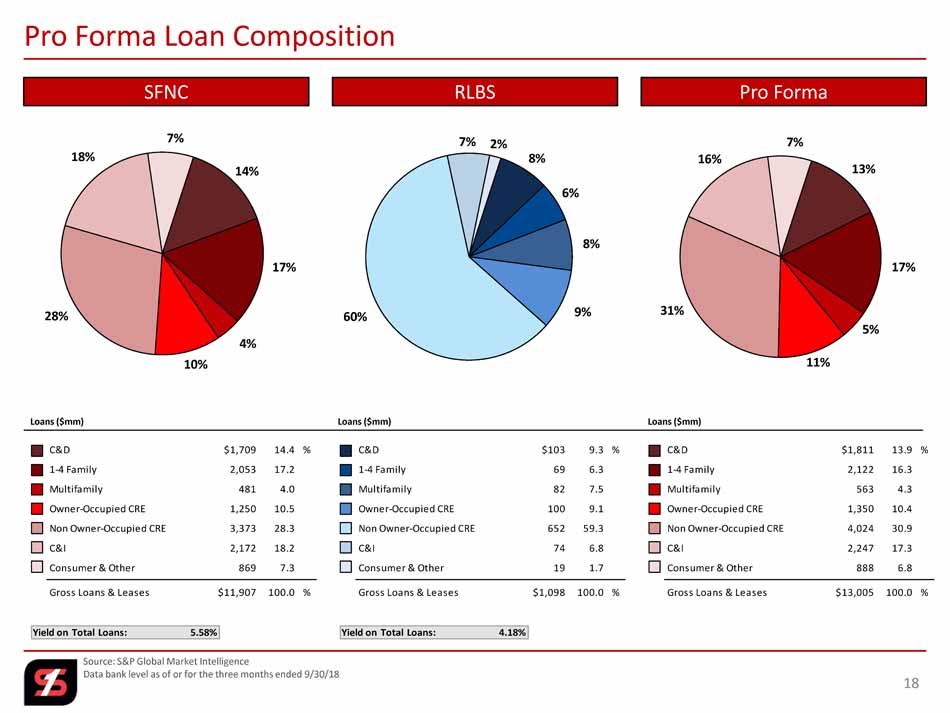
14% 17% 4% 10% 28% 18% 7% 13% 17% 5% 11% 31% 16% 7% 8% 6% 8% 9% 60% 7% 2% Source: S&P Global Market Intelligence Data bank level as of or for the three months ended 9/30/18 Pro Forma Loan Composition 3 % Yield on Total Loans: 5.58 % Yield on Total Loans: 4. 18 % SFNC RLBS Pro Forma Loans ($mm) Loans ($mm) Loans ($mm) C&D $1,709 14.4 % 1-4 Family 2,053 17.2 Multifamily 481 4.0 Owner-Occupied CRE 1,250 10.5 Non Owner-Occupied CRE 3,373 28.3 C&I 2,172 18.2 Consumer & Other 869 7.3 Gross Loans & Leases $11,907 100.0 % C&D $103 9.3 % 1-4 Family 69 6.3 Multifamily 82 7.5 Owner-Occupied CRE 100 9.1 Non Owner-Occupied CRE 652 59.3 C&I 74 6.8 Consumer & Other 19 1.7 Gross Loans & Leases $1,098 100.0 % C&D $1,811 13.9 % 1-4 Family 2,122 16.3 Multifamily 563 4.3 Owner-Occupied CRE 1,350 10.4 Non Owner-Occupied CRE 4,024 30.9 C&I 2,247 17.3 Consumer & Other 888 6.8 Gross Loans & Leases $13,005 100.0 % 18
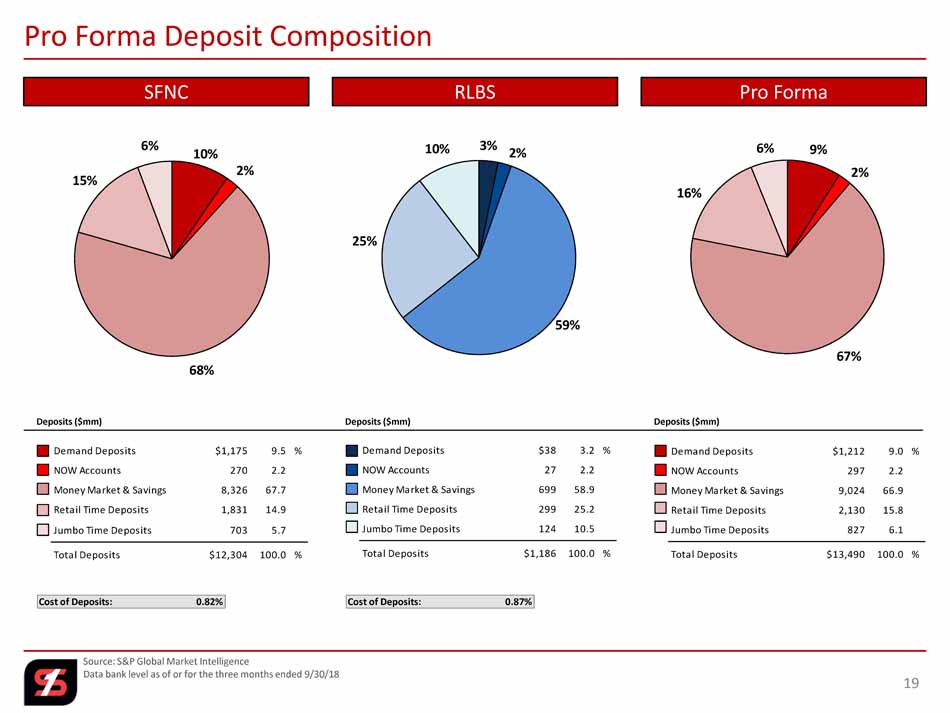
3% 2% 59% 25% 10% 10% 2% 68% 15% 6% Pro Forma Deposit Composition 3 % Cost of Deposits : 0.82 % Cost of Deposits : 0 .87 % SFNC RLBS Pro Forma Deposits ($mm) Deposits ($mm) Deposits ($mm) 9% 2% 67% 16% 6% Source: S&P Global Market Intelligence Data bank level as of or for the three months ended 9/30/18 Demand Deposits $1,175 9.5 % NOW Accounts 270 2.2 Money Market & Savings 8,326 67.7 Retail Time Deposits 1,831 14.9 Jumbo Time Deposits 703 5.7 Total Deposits $12,304 100.0 % Demand Deposits $38 3.2 % NOW Accounts 27 2.2 Money Market & Savings 699 58.9 Retail Time Deposits 299 25.2 Jumbo Time Deposits 124 10.5 Total Deposits $1,186 100.0 % Demand Deposits $1,212 9.0 % NOW Accounts 297 2.2 Money Market & Savings 9,024 66.9 Retail Time Deposits 2,130 15.8 Jumbo Time Deposits 827 6.1 Total Deposits $13,490 100.0 % 19
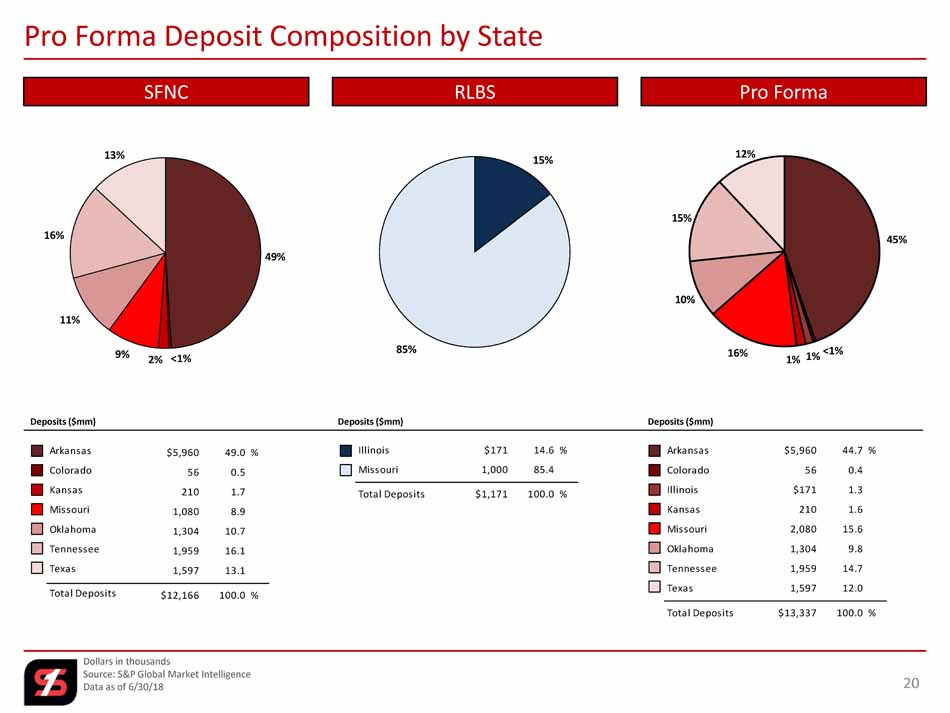
Dollars in thousands Source: S&P Global Market Intelligence Data as of 6/30/18 Pro Forma Deposit Composition by State 3 % SFNC RLBS Pro Forma Deposits ($mm) Deposits ($mm) Deposits ($mm) 15% 85% 49% <1% 2% 9% 11% 16% 13% Arkansas $5,960 49.0% Colorado 56 0.5 Kansas 210 1.7 Missouri 1,080 8.9 Oklahoma 1,304 10.7 Tennessee 1,959 16.1 Texas 1,597 13.1 Total Deposits $12,166 100.0% Arkansas $5,960 44.7% Colorado 56 0.4 Illinois $171 1.3 Kansas 210 1.6 Missouri 2,080 15.6 Oklahoma 1,304 9.8 Tennessee 1,959 14.7 Texas 1,597 12.0 Total Deposits $13,337 100.0% Illinois $171 14.6% Missouri 1,000 85.4 Total Deposits $1,171 100.0% 45% <1% 1% 1% 16% 10% 15% 12% 20
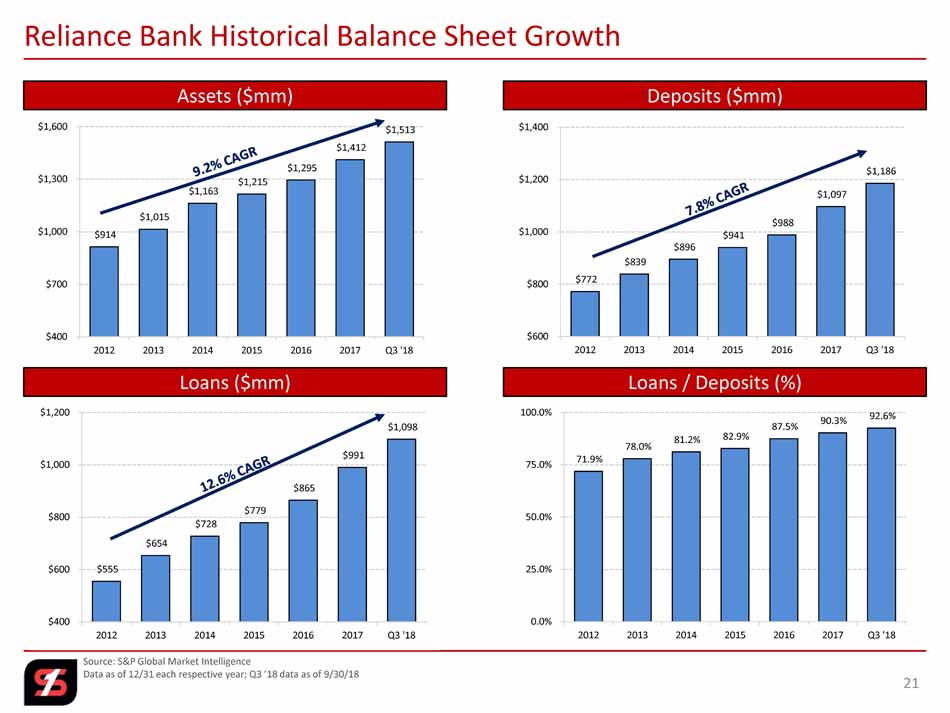
$914 $1,015 $1,163 $1,215 $1,295 $1,412 $1,513 $400 $700 $1,000 $1,300 $1,600 2012 2013 2014 2015 2016 2017 Q3 '18 Source: S&P Global Market Intelligence Data as of 12/31 each respective year; Q3 ’18 data as of 9/30/18 Reliance Bank Historical Balance Sheet Growth Assets ($mm) Deposits ($mm) Loans / Deposits (%) Loans ($mm) 21 $555 $654 $728 $779 $865 $991 $1,098 $400 $600 $800 $1,000 $1,200 2012 2013 2014 2015 2016 2017 Q3 '18 $772 $839 $896 $941 $988 $1,097 $1,186 $600 $800 $1,000 $1,200 $1,400 2012 2013 2014 2015 2016 2017 Q3 '18 71.9% 78.0% 81.2% 82.9% 87.5% 90.3% 92.6% 0.0% 25.0% 50.0% 75.0% 100.0% 2012 2013 2014 2015 2016 2017 Q3 '18

22