Attached files
| file | filename |
|---|---|
| EX-99.1 - EX-99.1 - Charah Solutions, Inc. | d638754dex991.htm |
| 8-K - 8-K - Charah Solutions, Inc. | d638754d8k.htm |
Q3 2018 Financial Results Supplement November 13, 2018 Exhibit 99.2
Forward Looking Statements Forward Looking Statements This presentation and our accompanying comments include “forward-looking statements” within the meaning of the Private Securities Litigation Reform Act of 1995. These forward-looking statements may be identified by words such as “may,” “will,” “expect,” “intend,” “anticipate,” “believe,” “estimate,” “plan,” “project,” “could,” “should,” “would,” “continue,” “seek,” “target,” “guidance,” “outlook,” “if current trends continue,” “optimistic,” “forecast” and other similar words. Such statements include, but are not limited to, statements about future financial and operating results, the Company’s plans, objectives, estimates, expectations, and intentions, estimates and strategies for the future, and other statements that are not historical facts. These forward-looking statements are based on our current objectives, beliefs and expectations, and they are subject to significant risks and uncertainties that may cause actual results and financial position and timing of certain events to differ materially from the information in the forward-looking statements. These risks and uncertainties include, but are not limited to, those set forth in the Company’s Registration Statement on Form S-1 filed on June 4, 2018 with the Securities and Exchange Commission (“SEC”) and in our other reports filed from time to time with the SEC. There may be other factors of which we are not currently aware that may affect matters discussed in the forward-looking statements and may also cause actual results to differ materially from those discussed. We do not assume any obligation to publicly update or supplement any forward-looking statement to reflect actual results, changes in assumptions or changes in other factors affecting these forward-looking statements other than as required by law. Any forward-looking statements speak only as of the date hereof or as of the dates indicated in the statements. Non-GAAP Financial Measures Included in this presentation are certain non-GAAP financial measures designed to complement the financial information presented in accordance with GAAP because management believes such measures are useful to investors. The non-GAAP financial measures are not determined in accordance with GAAP and should not be considered a substitute for performance measures determined in accordance with GAAP. The calculations of the non-GAAP financial measures are subjective, based on management’s belief as to which items should be included or excluded in order to provide the most reasonable and comparable view of the underlying operating performance of the business. We may, from time to time, modify the amounts used to determine our non-GAAP financial measures. When applicable, management’s discussion and analysis includes specific consideration for items that comprise the reconciliations of its non-GAAP financial measures. Reconciliation of non-GAAP financial measures are included in the Supplemental Slides in the Appendix of this presentation. Market & Industry Data This presentation includes industry and trade data, forecasts and information that was prepared based, in part, upon data, forecasts and information obtained from independent trade associations, industry publications and surveys and other independent sources available to the Company. Some data also are based on the Company’s good faith estimates, which are derived from management’s knowledge of the industry and from independent sources. These third-party publications and surveys generally state that the information included therein has been obtained from sources believed to be reliable, but that the publications and surveys can give no assurance as to the accuracy or completeness of such information. The Company has not independently verified any of the data from third-party sources nor has it ascertained the underlying economic assumptions on which such data are based.
Agenda Third Quarter Highlights & Regulatory Update Charles Price, President and CEO Business Operations Update Scott Sewell, COO Financial Review and Outlook Bruce Kramer, CFO and Treasurer
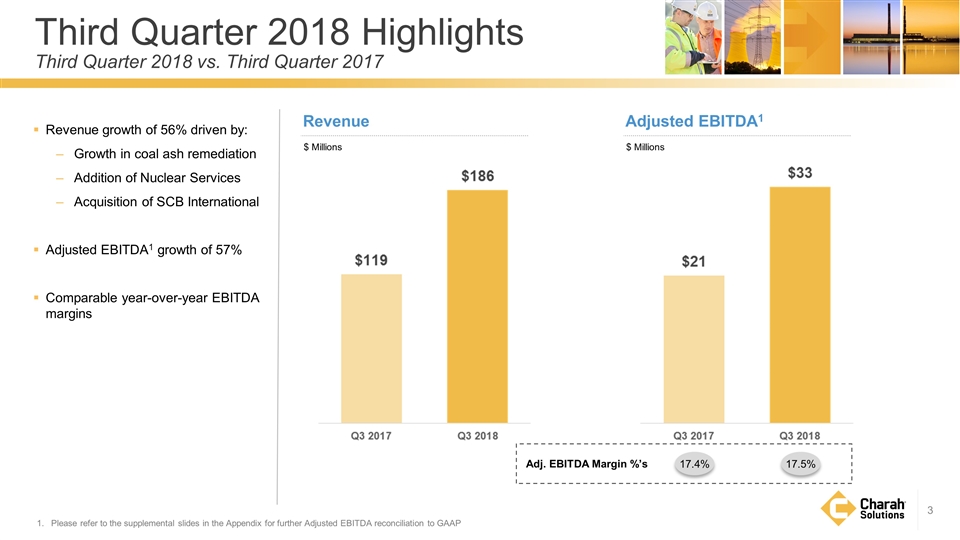
Revenue growth of 56% driven by: Growth in coal ash remediation Addition of Nuclear Services Acquisition of SCB International Adjusted EBITDA1 growth of 57% Comparable year-over-year EBITDA margins Please refer to the supplemental slides in the Appendix for further Adjusted EBITDA reconciliation to GAAP Revenue $ Millions Third Quarter 2018 Highlights Third Quarter 2018 vs. Third Quarter 2017 17.5% 17.4% Adj. EBITDA Margin %’s Adjusted EBITDA1 $ Millions
Third Quarter 2018 Business Developments Significant Milestones Refinancing of long-term debt; results in significant interest savings and improved financial flexibility Deployment of MP618TM fly ash beneficiation technology Near completion of first slag grinding facility utilizing proprietary technology Nuclear Services trend toward shorter outages Expected early completion of Brickhaven contract
Third Quarter 2018 Regulatory Updates U.S. Court of Appeals for the Fourth Circuit Ruled all unlined coal ash ponds must be closed, including clay-lined and legacy inactive ponds, which were previously excluded from the EPA CCR regulations Significantly increases the addressable market and further validates the requirement for remediation EPA CCR Phase 1 Revisions Extends closure deadline to October 2020 for some active ponds with leaks or inadequate separation between bottom of pond and ground water table (estimated to affect less than 15% of total ponds) May shift timeline for some projects or customers
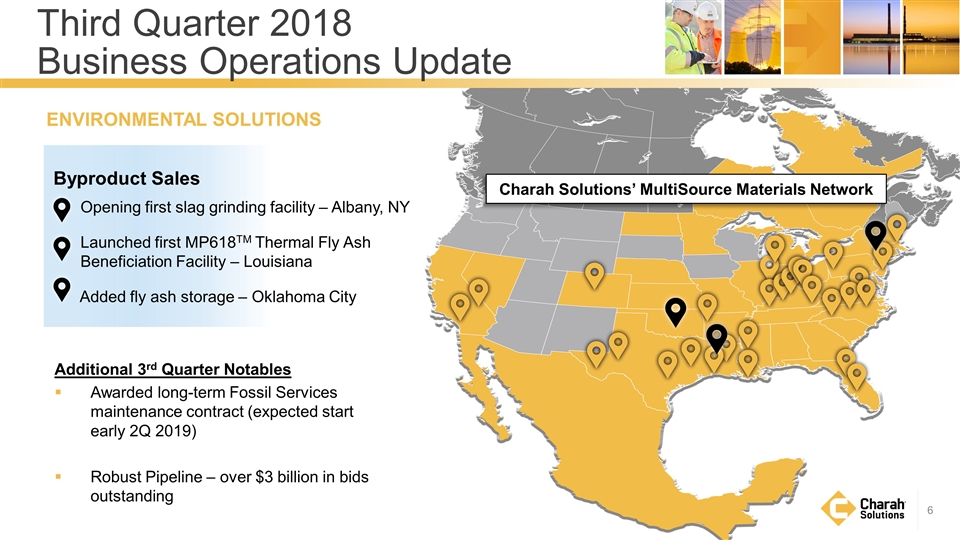
Byproduct Sales Opening first slag grinding facility – Albany, NY Launched first MP618TM Thermal Fly Ash Beneficiation Facility – Louisiana Added fly ash storage – Oklahoma City ENVIRONMENTAL SOLUTIONS Third Quarter 2018 Business Operations Update Charah Solutions’ MultiSource Materials Network Additional 3rd Quarter Notables Awarded long-term Fossil Services maintenance contract (expected start early 2Q 2019) Robust Pipeline – over $3 billion in bids outstanding
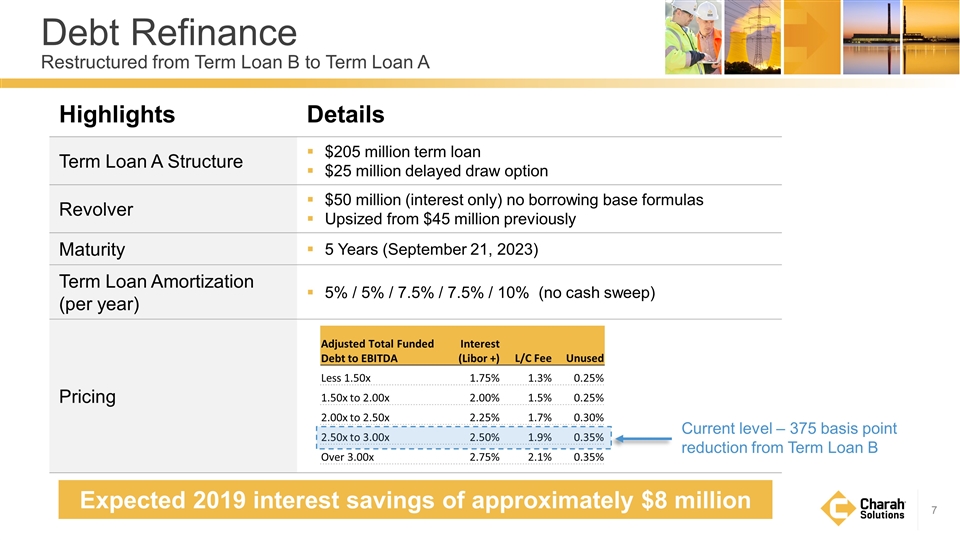
Debt Refinance Restructured from Term Loan B to Term Loan A Highlights Details Term Loan A Structure $205 million term loan $25 million delayed draw option Revolver $50 million (interest only) no borrowing base formulas Upsized from $45 million previously Maturity 5 Years (September 21, 2023) Term Loan Amortization (per year) 5% / 5% / 7.5% / 7.5% / 10% (no cash sweep) Pricing Adjusted Total Funded Debt to EBITDA Interest (Libor +) L/C Fee Unused Less 1.50x 1.75% 1.3% 0.25% 1.50x to 2.00x 2.00% 1.5% 0.25% 2.00x to 2.50x 2.25% 1.7% 0.30% 2.50x to 3.00x 2.50% 1.9% 0.35% Over 3.00x 2.75% 2.1% 0.35% Current level – 375 basis point reduction from Term Loan B Expected 2019 interest savings of approximately $8 million
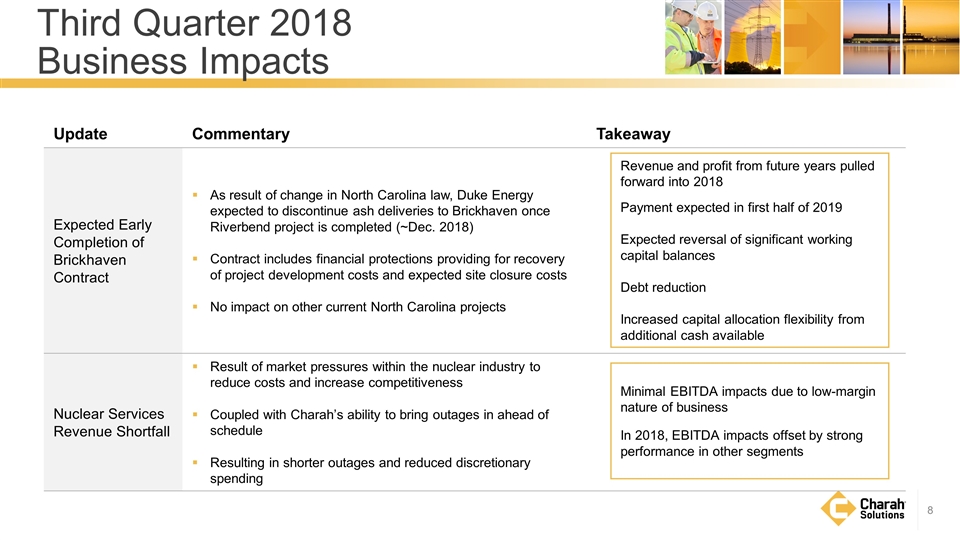
Third Quarter 2018 Business Impacts Update Commentary Takeaway Expected Early Completion of Brickhaven Contract As result of change in North Carolina law, Duke Energy expected to discontinue ash deliveries to Brickhaven once Riverbend project is completed (~Dec. 2018) Contract includes financial protections providing for recovery of project development costs and expected site closure costs No impact on other current North Carolina projects Nuclear Services Revenue Shortfall Result of market pressures within the nuclear industry to reduce costs and increase competitiveness Coupled with Charah’s ability to bring outages in ahead of schedule Resulting in shorter outages and reduced discretionary spending Revenue and profit from future years pulled forward into 2018 Payment expected in first half of 2019 Expected reversal of significant working capital balances Debt reduction Increased capital allocation flexibility from additional cash available Minimal EBITDA impacts due to low-margin nature of business In 2018, EBITDA impacts offset by strong performance in other segments
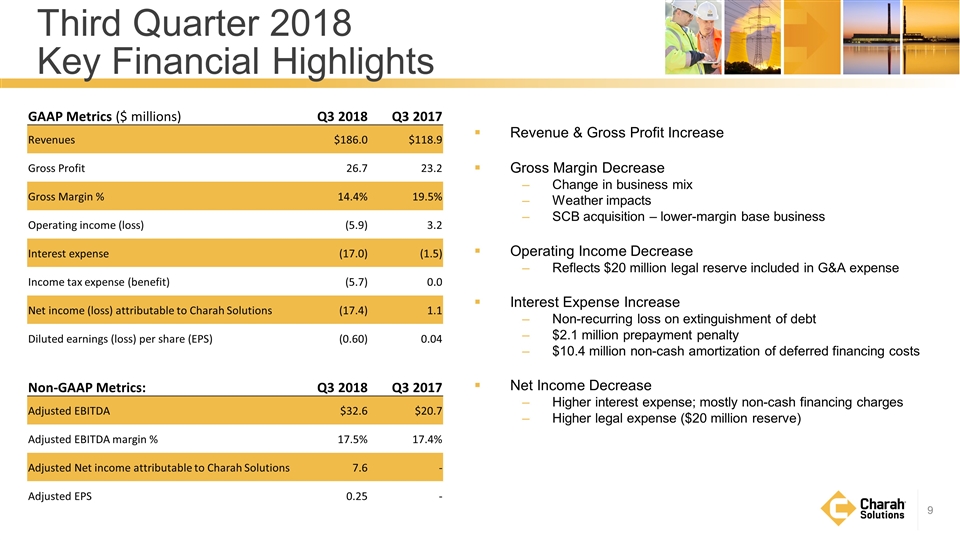
Third Quarter 2018 Key Financial Highlights GAAP Metrics ($ millions) Q3 2018 Q3 2017 Revenues $186.0 $118.9 Gross Profit 26.7 23.2 Gross Margin % 14.4% 19.5% Operating income (loss) (5.9) 3.2 Interest expense (17.0) (1.5) Income tax expense (benefit) (5.7) 0.0 Net income (loss) attributable to Charah Solutions (17.4) 1.1 Diluted earnings (loss) per share (EPS) (0.60) 0.04 Non-GAAP Metrics: Q3 2018 Q3 2017 Adjusted EBITDA $32.6 $20.7 Adjusted EBITDA margin % 17.5% 17.4% Adjusted Net income attributable to Charah Solutions 7.6 - Adjusted EPS 0.25 - Revenue & Gross Profit Increase Gross Margin Decrease Change in business mix Weather impacts SCB acquisition – lower-margin base business Operating Income Decrease Reflects $20 million legal reserve included in G&A expense Interest Expense Increase Non-recurring loss on extinguishment of debt $2.1 million prepayment penalty $10.4 million non-cash amortization of deferred financing costs Net Income Decrease Higher interest expense; mostly non-cash financing charges Higher legal expense ($20 million reserve)
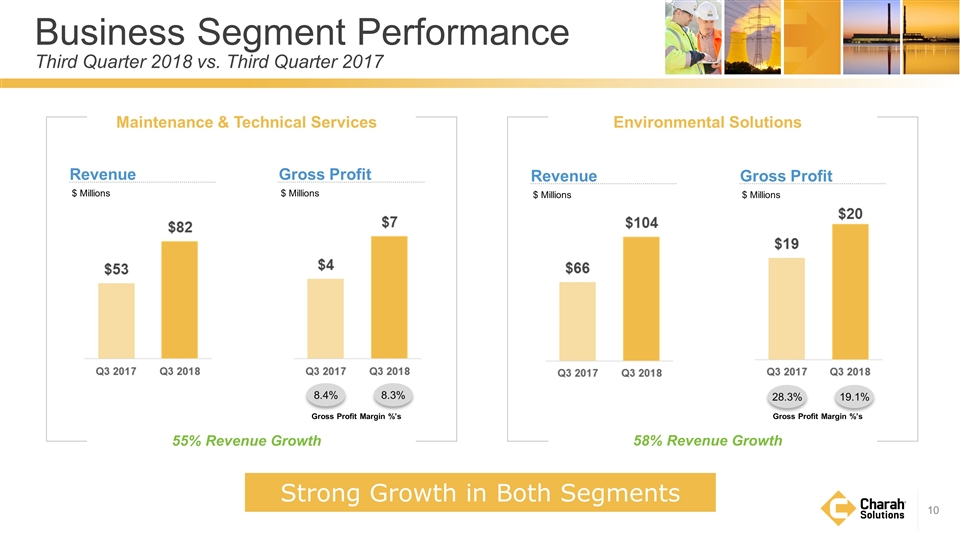
Business Segment Performance Third Quarter 2018 vs. Third Quarter 2017 Revenue $ Millions 19.1% 28.3% Gross Profit Margin %’s Gross Profit $ Millions Revenue $ Millions 8.3% 8.4% Gross Profit Margin %’s Gross Profit $ Millions Maintenance & Technical Services 55% Revenue Growth Environmental Solutions 58% Revenue Growth Strong Growth in Both Segments
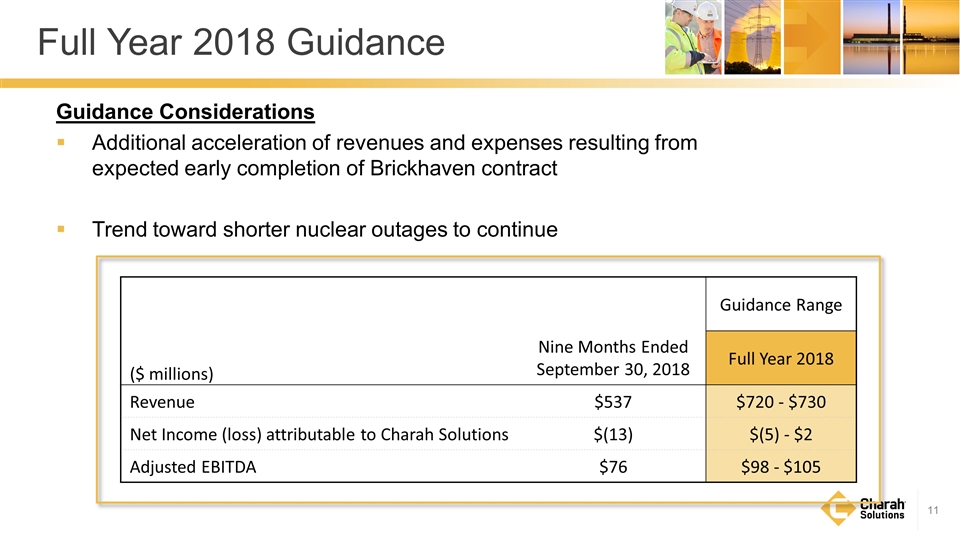
Full Year 2018 Guidance Nine Months Ended September 30, 2018 Guidance Range ($ millions) Full Year 2018 Revenue $537 $720 - $730 Net Income (loss) attributable to Charah Solutions $(13) $(5) - $2 Adjusted EBITDA $76 $98 - $105 Guidance Considerations Additional acceleration of revenues and expenses resulting from expected early completion of Brickhaven contract Trend toward shorter nuclear outages to continue
Poised for Continued Growth Expect to exceed current consensus estimates for 2018 Adjusted EBITDA Strong Pipeline – over $3 billion in bids outstanding Robust Growth Strategy Capitalize on growing needs for environmental remediation Increase market share and expand services Execute on technology deployment Expected to become significantly cash flow positive in first half of 2019
APPENDIX
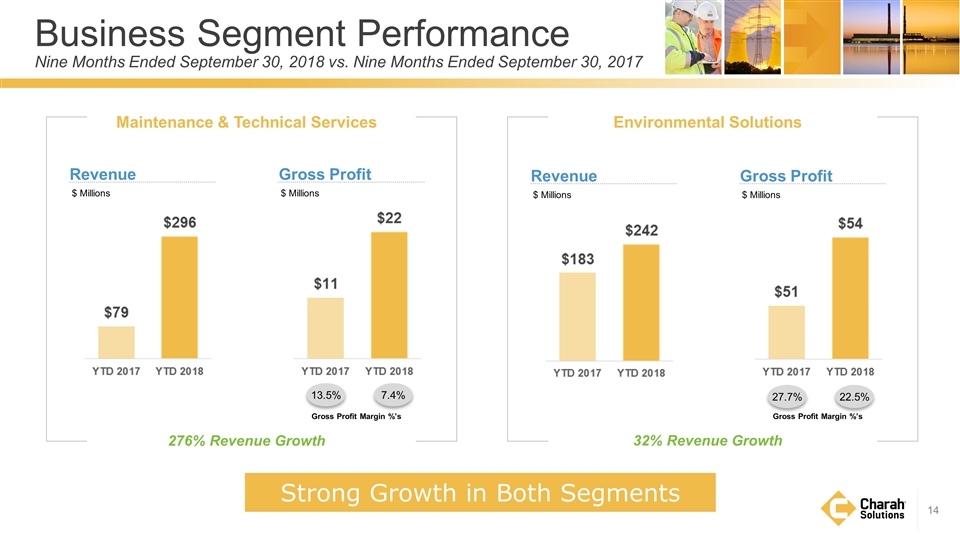
Business Segment Performance Nine Months Ended September 30, 2018 vs. Nine Months Ended September 30, 2017 Revenue $ Millions 22.5% 27.7% Gross Profit Margin %’s Gross Profit $ Millions Revenue $ Millions 7.4% 13.5% Gross Profit Margin %’s Gross Profit $ Millions Maintenance & Technical Services 276% Revenue Growth Environmental Solutions 32% Revenue Growth Strong Growth in Both Segments
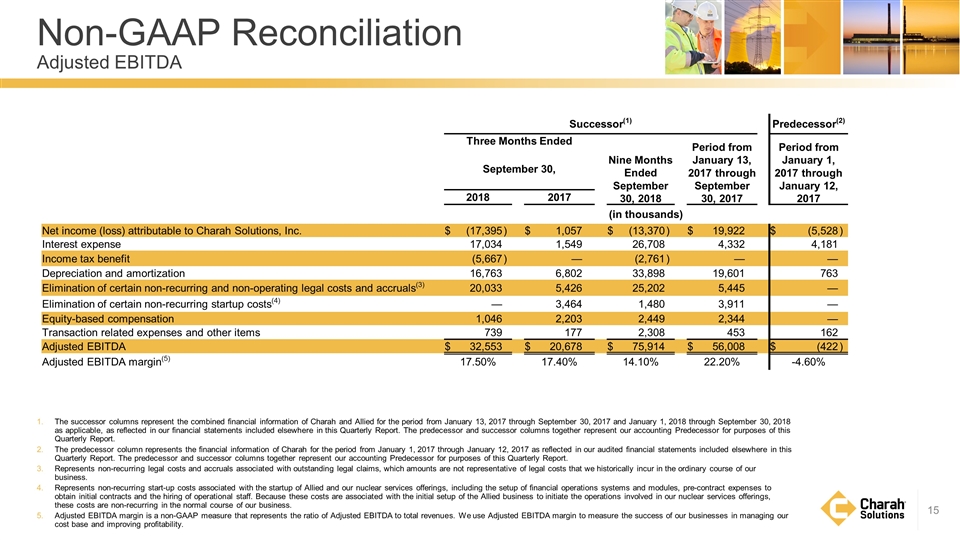
Non-GAAP Reconciliation Adjusted EBITDA The successor columns represent the combined financial information of Charah and Allied for the period from January 13, 2017 through September 30, 2017 and January 1, 2018 through September 30, 2018 as applicable, as reflected in our financial statements included elsewhere in this Quarterly Report. The predecessor and successor columns together represent our accounting Predecessor for purposes of this Quarterly Report. The predecessor column represents the financial information of Charah for the period from January 1, 2017 through January 12, 2017 as reflected in our audited financial statements included elsewhere in this Quarterly Report. The predecessor and successor columns together represent our accounting Predecessor for purposes of this Quarterly Report. Represents non-recurring legal costs and accruals associated with outstanding legal claims, which amounts are not representative of legal costs that we historically incur in the ordinary course of our business. Represents non-recurring start-up costs associated with the startup of Allied and our nuclear services offerings, including the setup of financial operations systems and modules, pre-contract expenses to obtain initial contracts and the hiring of operational staff. Because these costs are associated with the initial setup of the Allied business to initiate the operations involved in our nuclear services offerings, these costs are non-recurring in the normal course of our business. Adjusted EBITDA margin is a non-GAAP measure that represents the ratio of Adjusted EBITDA to total revenues. We use Adjusted EBITDA margin to measure the success of our businesses in managing our cost base and improving profitability. Successor(1) Predecessor(2) Three Months Ended Nine Months Ended September 30, 2018 Period from January 13, 2017 through September 30, 2017 Period from January 1, 2017 through January 12, 2017 September 30, 2018 2017 (in thousands) Net income (loss) attributable to Charah Solutions, Inc. $ (17,395 ) $ 1,057 $ (13,370 ) $ 19,922 $ (5,528 ) Interest expense 17,034 1,549 26,708 4,332 4,181 Income tax benefit (5,667 ) — (2,761 ) — — Depreciation and amortization 16,763 6,802 33,898 19,601 763 Elimination of certain non-recurring and non-operating legal costs and accruals(3) 20,033 5,426 25,202 5,445 — Elimination of certain non-recurring startup costs(4) — 3,464 1,480 3,911 — Equity-based compensation 1,046 2,203 2,449 2,344 — Transaction related expenses and other items 739 177 2,308 453 162 Adjusted EBITDA $ 32,553 $ 20,678 $ 75,914 $ 56,008 $ (422 ) Adjusted EBITDA margin(5) 17.50% 17.40% 14.10% 22.20% -4.60%
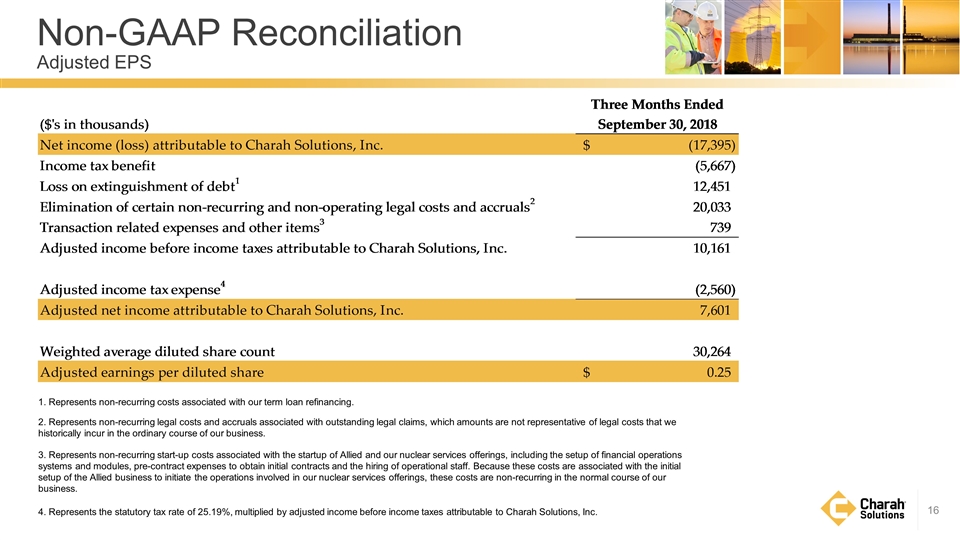
Non-GAAP Reconciliation Adjusted EPS 1. Represents non-recurring costs associated with our term loan refinancing. 2. Represents non-recurring legal costs and accruals associated with outstanding legal claims, which amounts are not representative of legal costs that we historically incur in the ordinary course of our business. 3. Represents non-recurring start-up costs associated with the startup of Allied and our nuclear services offerings, including the setup of financial operations systems and modules, pre-contract expenses to obtain initial contracts and the hiring of operational staff. Because these costs are associated with the initial setup of the Allied business to initiate the operations involved in our nuclear services offerings, these costs are non-recurring in the normal course of our business. 4. Represents the statutory tax rate of 25.19%, multiplied by adjusted income before income taxes attributable to Charah Solutions, Inc.
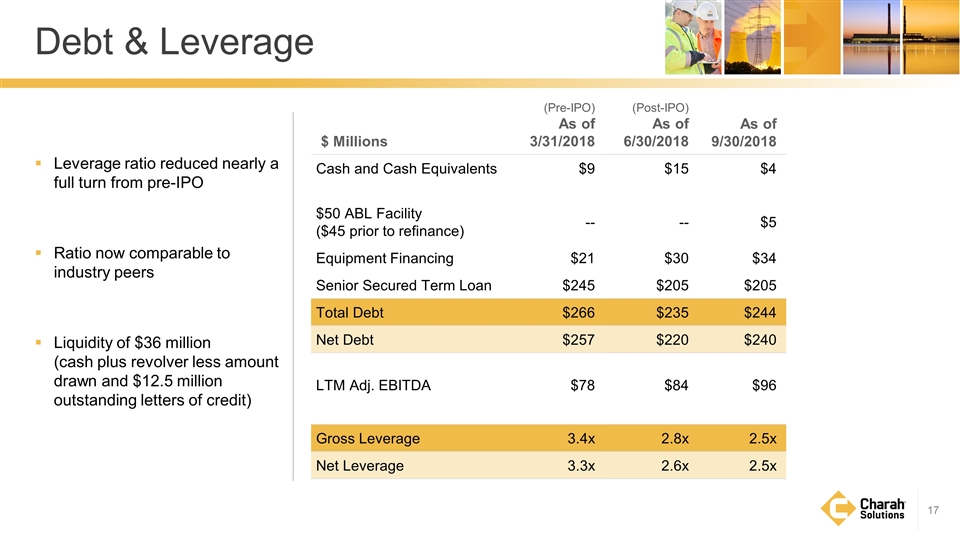
Leverage ratio reduced nearly a full turn from pre-IPO Ratio now comparable to industry peers Liquidity of $36 million (cash plus revolver less amount drawn and $12.5 million outstanding letters of credit) $ Millions (Pre-IPO) As of 3/31/2018 (Post-IPO) As of 6/30/2018 As of 9/30/2018 Cash and Cash Equivalents $9 $15 $4 $50 ABL Facility ($45 prior to refinance) -- -- $5 Equipment Financing $21 $30 $34 Senior Secured Term Loan $245 $205 $205 Total Debt $266 $235 $244 Net Debt $257 $220 $240 LTM Adj. EBITDA $78 $84 $96 Gross Leverage 3.4x 2.8x 2.5x Net Leverage 3.3x 2.6x 2.5x Debt & Leverage
