Attached files
| file | filename |
|---|---|
| EX-99.1 - EXHIBIT 99.1 - Telenav, Inc. | tnavex991fy19q1earningsrel.htm |
| 8-K - 8-K - Telenav, Inc. | tnav930188-k.htm |

November 8, 2018
Fellow Stockholders,
We made notable progress in expanding our penetration into the North American automotive market in the first quarter of fiscal 2019, which ended September 30, 2018. We achieved a key milestone as model expansion and unit growth caused General Motors to become a more significant customer in the quarter, representing 13% of revenue and 17% of billings. This represents more than 150% year over year growth for both metrics. Our software and connected services are being offered in increasing numbers of GM vehicles, including six new models in the quarter. Despite this growth, we are still in the early stage of penetration of GM’s models and geographies and we believe GM will continue to offer Telenav products in a growing number of models, thereby driving additional revenue in the future.
Unit volume with our largest customer, Ford, increased in the quarter on a year-over-year basis, mainly due, we believe, to an improved take rate. The general trend away from sedans toward SUVs and crossover vehicles (CUVs) is a multivariable transition, and we believe that, overall, we will benefit from it mainly due to increased attach rates on higher-end models and equipment packages associated with SUVs and CUVs. As a reminder, Ford’s next generation navigation solution for North America was awarded to us; however, we were not awarded the next generation solution for other geographies for which awards have been made to date. We do not expect the loss of these geographies to impact to our revenue and billings in fiscal years 2019 and 2020.
Worldwide, in the first quarter, 1.2 million vehicles capable of connected services were manufactured/sold with Telenav software and services, bringing our cumulative total to 10.6 million. An important strategic goal for us is to create the world’s largest network of connected vehicles. Our penetration into connected vehicles with such scale is a testament to our positive relationships with our automotive manufacturer customers and to our consumer-friendly technology.
With the increase in General Motors volume, in addition to those connected vehicles using our solution with our largest customer, Ford, we look to the next phase of our development. The global connected car industry is growing rapidly, with an estimated CAGR of 33% for the period of 2015-2022, according to a May 28, 2018, Marketwatch.com article. The key driver of this growth is consumer demand for in-car connected and smart services and for more convenient, useful, safety and entertainment features. The forthcoming change to the transportation industry is revolutionary and, we believe, will disrupt and improve the whole ecosystem - thereby creating opportunities for innovative companies like Telenav.
We adopted ASC 606, Revenue from Contracts with Customers, effective July 1, 2018, utilizing the full retrospective transition method. All prior period amounts and disclosures set forth in this investor letter have been adjusted to comply with ASC 606. Under this accounting methodology, certain automotive royalty amounts earned are bifurcated when there exist various underlying obligations. We recognize revenue upon fulfillment of the underlying obligation. Such obligations related to earned royalties generally can include an onboard navigation component that we recognize as revenue once each unit is delivered and accepted, a connected services component that we recognize as revenue over the applicable service period, and a map update component that we recognize as revenue upon periodic delivery of the applicable map updates.
The adjustments required to transition to ASC 606 resulted in $163.1 million of deferred revenue and $89.1 million of deferred costs of the total originally reported on our balance sheet as of June 30, 2018 being recorded instead as revenue and cost of revenue, respectively, in the applicable prior periods as adjusted. In addition, the adoption of ASC 606 required us to capitalize an additional $4.2 million, net, of deferred development costs on our adjusted June 30, 2018 balance sheet, resulting in a net decrease in deferred costs of $84.9 million. The net impact of our adoption of ASC 606 as of June 30, 2018 was an
adjustment to decrease our accumulated deficit by $78.2 million. All prior period amounts in our financial statements have been adjusted to comply with ASC 606. The following three charts illustrate the impact of ASC 606 in comparison with ASC 605.
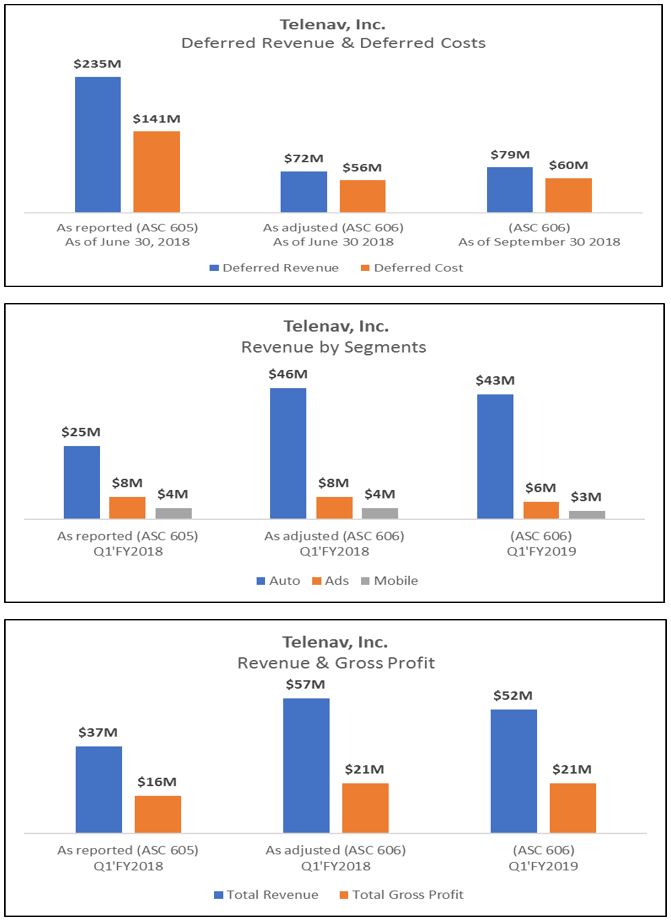
With ASC 606, we believe that our revenue recognition is now more closely aligned with the economic reality of our business, which should facilitate better investor understanding of our business and financial performance. As a reminder, the year over year decline in revenue was due primarily to lower per unit pricing in the company’s automotive business unit resulting from lower third-party content costs, partially offset by higher unit volume on its automotive solutions, and lower advertising and mobile navigation revenue.
The financial results for the first fiscal quarter are summarized in the table below.
Select Financial Data (unaudited) | Fiscal 2018 | Fiscal 2019 | ||||
(in thousands, except gross margin and direct contribution margin and growth) | Q1 | Q1 | ||||
Total Company | ||||||
Revenue | $ | 56,962 | $ | 52,168 | ||
Billings* | $ | 65,788 | $ | 59,041 | ||
Gross profit | $ | 21,139 | $ | 21,064 | ||
Gross margin | 37 | % | 40 | % | ||
Direct contribution from billings* | $ | 24,491 | $ | 23,898 | ||
Direct contribution margin from billings* | 37 | % | 40 | % | ||
Adjusted cash flow from operations* | $ | (4,389 | ) | $ | (2,790 | ) |
Automotive | ||||||
Revenue | $ | 45,608 | $ | 43,451 | ||
Billings* | $ | 54,491 | $ | 50,311 | ||
Gross profit | $ | 14,747 | $ | 16,492 | ||
Gross margin | 32 | % | 38 | % | ||
Direct Contribution from Billings* | $ | 18,156 | $ | 19,313 | ||
Direct Contribution Margin from Billings* | 33 | % | 38 | % | ||
Cumulative Units Deployed to Date** | 14,476 | 19,896 | ||||
Y/Y % Growth | 47 | % | 37 | % | ||
Cumulative Connected Units Deployed to Date** | 6,025 | 10,605 | ||||
Y/Y % Growth | 68 | % | 76 | % | ||
Advertising | ||||||
Revenue | $ | 7,615 | $ | 5,947 | ||
Billings* | $ | 7,615 | $ | 5,947 | ||
Gross Profit | $ | 4,203 | $ | 2,727 | ||
Gross Margin | 55 | % | 46 | % | ||
Mobile Navigation | ||||||
Revenue | $ | 3,739 | $ | 2,770 | ||
Billings* | $ | 3,682 | $ | 2,783 | ||
Gross Profit | $ | 2,189 | $ | 1,845 | ||
Gross Margin | 59 | % | 67 | % | ||
* See "Use of non-GAAP Measures" for definitions and discussion. | ||||||
** Deployment date is defined as the date upon which title has transferred. | ||||||
Automotive Results
Telenav’s technology has now been deployed in approximately 20 million vehicles, including 1.3 million added during the first quarter of fiscal 2019. More than 10 million of these vehicles are capable of connected services, including 1.2 million vehicles added during the first quarter of fiscal 2019.
Automotive revenue for the first quarter of fiscal 2019 was $43.5 million, compared with $45.6 million in the first quarter of fiscal 2018. The decline in revenue in the first quarter of 2019 was due primarily to a reduction in the pricing of certain on-board navigation content that is charged through to our customers, partially offset by an increase in the number of units. Despite the decrease in revenue, gross profit from
the automotive business unit increased to $16.5 million in the first quarter of fiscal 2019, compared with $14.7 million in the first quarter of fiscal 2018.
Total automotive billings in the first quarter of fiscal 2019 decreased to $50.3 million, compared with $54.5 million in the first quarter of fiscal 2018, which was due primarily to lower per unit pricing resulting from lower third-party content pricing and was partially offset by an increased number of units. In the first quarter of fiscal 2019, Ford represented 60% and 54% of our total revenue and billings, respectively, and General Motors represented 13% and 17% of our total revenue and billings, respectively.
Automotive direct contribution from billings in the first quarter of fiscal 2019 was $19.3 million, compared with $18.2 million in the first quarter of fiscal 2018. The first quarter of fiscal 2019’s automotive direct contribution margin from billings was 38%, up 5 percent from 33% in the first quarter of fiscal 2018. The improvement in direct contribution margin from billings was primarily due to the lower third-party content costs on a per unit basis.
Our automotive manufacturer and tier one partners continue to expand the inclusion of Telenav’s navigation solutions in more models. GM launched Telenav’s hybrid navigation solution on additional model year 2019 models, including the GMC Canyon, the Chevrolet Colorado, Camaro, Cruz Hatchback and Volt. Opel launched Telenav’s hybrid navigation solution on the Insignia and the Buick Regal, which Opel builds for GM.
Advertising Results
Advertising revenue, which includes the delivery of location-based advertising impressions, was $5.9 million in the first quarter of fiscal 2019, compared with $7.6 million in the first quarter of fiscal 2018. Gross profit on advertising services decreased to $2.7 million in the first quarter of fiscal 2019, compared with $4.2 million in the first quarter of fiscal 2018, due primarily to lower revenue and higher relative inventory costs as measured on a CPM basis. We continue to believe that our location-based advertising business is a strategic component of our connected car roadmap, especially as it relates to potential new revenue streams from in-car ads.
Mobile Navigation Results
Mobile navigation revenue for the first quarter of fiscal 2019 was $2.8 million, compared with $3.7 million in the first quarter of fiscal 2018. Gross profit was $1.8 million in the first quarter of fiscal 2019, compared with $2.2 million in the first quarter of fiscal 2018.
Total Direct Contribution from Billings and Direct Contribution Margin from Billings
Our direct contribution from billings was $23.9 million in the first quarter of fiscal 2019, compared with $24.5 million in the first quarter of fiscal 2018. Direct contribution margin from billings for the first quarter of fiscal 2019 was 40%, compared with 37% in the first quarter of fiscal 2018.
Total Operating Expenses
Operating expenses in the first quarter of fiscal 2019 were $30.0 million, compared with $31.2 million in the first quarter of fiscal 2018. The decrease in operating expenses was primarily driven by cost optimization, including lower overall employee compensation costs as well as lower contractor costs. In addition, costs decreased as a result of the allocation to cost of service revenue of certain software maintenance services performed by employees that was previously allocated to research and development expenses in prior quarters. Offsetting this decrease is the fact that significantly less development costs were capitalized in the quarter.
Adjusted Cash Flow from Operations
Adjusted cash flow from operations, (formerly referred to adjusted EBITDA on billings) in the first quarter of fiscal 2019 was a loss of $(2.8) million as compared to a loss of $(4.4) million in the first quarter of fiscal 2018.
Free Cash Flow
Free cash flow in the first quarter of fiscal 2019 was a negative $2.4 million, compared with a negative of $6.1 million in the first quarter of fiscal 2018. This change was primarily attributable to a larger loss experienced in the first quarter of fiscal 2018.
Business Outlook
Subject to anticipated volumes, take rates and timing of model expansion under Telenav’s various automotive manufacturer and tier one supplier programs, including the potential impact, if any, from Ford’s transition of its North American passenger car portfolio to trucks, SUVs and CUVs, Telenav anticipates that adjusted cash flow from operations will be positive for the full year fiscal 2019.
The below information concerning guidance represents Telenav’s outlook only as of the date hereof, and is subject to change as a result of amendments to material contracts, other changes in business conditions and other factors. Please refer to the disclosures under “Forward-Looking Statements” below. Telenav undertakes no obligation to update or revise any financial forecast or other forward-looking statements, as a result of new developments, or otherwise.
Guidance | Q2 Fiscal 2019 |
(as of November 8, 2018) | (dollars and shares in millions) |
Revenue | $51 to $55 |
Billings* | $58 to $62 |
Gross margin | 45% |
Direct contribution margin from billings * | 43% |
Operating expenses | $31 to $32 |
Net loss | $(6) to $(8) |
Adjusted EBITDA loss* | $(2.5) to $(4.5) |
Adjusted cash flow from operations* | $0 to $(2) |
Automotive revenue | $41 to $44 |
Advertising revenue | $8 to $9 |
Weighted Average Diluted Shares Outstanding | 45.5 |
* See "Use of non-GAAP Measures" for definitions and discussion. | |
As we look forward to the remainder of fiscal 2019, we expect to see continued growth of billings and revenue, increased deployment within our automotive manufacturer and tier one partners, and inclusion of our products and services on more car models, especially with GM. We continue to maintain the goal of achieving positive adjusted cash flow from operations for fiscal 2019. As a reminder, starting in fiscal 2019, we relabeled this metric from the former adjusted EBITDA on billings.
Q1 Fiscal Year 2019 Financial Results Q&A Conference Call, November 8, 2018 at 5:30 p.m. ET.
Management will host an investor conference call and live webcast at 2:30 p.m. PT (5:30 p.m. ET) on the same day. To access the conference call, dial 855-719-5012 (toll-free, domestic only) or 334-323-0522 (domestic and international toll) and enter pass code 5479609. The webcast will be accessible on Telenav's investor relations website at http://investor.telenav.com.
Use of Non-GAAP Financial Measures
Telenav prepares its financial statements in accordance with generally accepted accounting principles for the United States, or GAAP. The non-GAAP financial measures such as billings, direct contribution from billings, direct contribution margin from billings, change in deferred revenue, change in deferred costs, adjusted EBITDA, adjusted cash flow from operations and free cash flow included in this press release are different from those otherwise presented under GAAP. Telenav has provided these measures in addition to GAAP financial results because management believes these non-GAAP measures help provide a consistent basis for comparison between periods that are not influenced by certain items and, therefore, are helpful in understanding Telenav’s underlying operating results. These non-GAAP measures are some of the primary measures Telenav’s management uses for planning and forecasting. These measures are not in accordance with, or an alternative to, GAAP and these non-GAAP measures may not be comparable to information provided by other companies.
To reconcile the historical GAAP results to non-GAAP financial metrics, please refer to the reconciliations in the financial statements included in this earnings release.
Billings equals GAAP revenue recognized plus the change in deferred revenue from the beginning to the end of the applicable period. Direct contribution from billings reflects GAAP gross profit plus change in deferred revenue less change in deferred costs from the beginning to the end of the applicable period. Direct contribution margin from billings reflects direct contribution from billings divided by billings. Telenav has also provided a breakdown of the calculation of the change in deferred revenue by segment, which is added to revenue in calculating its non-GAAP metric of billings. In connection with its presentation of the change in deferred revenue, Telenav has provided a similar presentation of the change in the related deferred costs. Such deferred costs primarily include costs associated with third party content and certain development costs associated with our customized software solutions whereby customized engineering fees are earned. As the company enters into more hybrid and brought-in navigation programs, deferred revenue and deferred costs become larger components of its operating results, so Telenav believes these metrics are useful in evaluating cash flows.
Telenav considers billings, direct contribution from billings and direct contribution margin from billings to be useful metrics for management and investors because billings drive revenue and deferred revenue, which is an important indicator of its business. Telenav believes direct contribution from billings and direct contribution margin from billings are useful metrics because they reflect the impact of the contribution over time for such billings, exclusive of the incremental costs incurred to deliver any related service obligations. There are a number of limitations related to the use of billings, direct contribution from billings and direct contribution margin from billings versus revenue, gross profit, and gross margin calculated in accordance with GAAP. First, billings, direct contribution from billings and direct contribution margin from billings include amounts that have not yet been recognized as revenue or cost and may require additional services or costs to be provided over contracted service periods. For example, billings related to certain connected solutions cannot be fully recognized as revenue in a given period due to requirements for ongoing map updates and provisioning of services such as hosting, monitoring, customer support and, for certain customers, additional period content and associated technology costs. Accordingly, direct contribution from billings and direct contribution margin from billings do not include all costs associated with billings. Second, Telenav may calculate billings, direct contribution from billings, and direct contribution margin from billings in a manner that is different from peer companies
that report similar financial measures, making comparisons between companies more difficult. When Telenav uses these measures, it attempts to compensate for these limitations by providing specific information regarding billings, direct contribution from billings and direct contribution margin from billings and how they relate to revenue, gross profit and gross margin calculated in accordance with GAAP.
Adjusted EBITDA measures GAAP net loss excluding the impact of stock-based compensation expense, depreciation and amortization, other income (expense) net, provision (benefit) for income taxes, and other applicable items such as legal settlements and contingencies, deferred rent reversal and tenant improvement allowance recognition due to sublease termination, net of tax and goodwill impairment. Stock-based compensation expense relates to equity incentive awards granted to its employees, directors, and consultants. Legal settlements and contingencies represent settlements and offers made to settle litigation in which Telenav is a defendant and royalty disputes. Deferred rent reversal and tenant improvement allowance recognition represent the reversal of Telenav’s deferred rent liability and recognition of Telenav’s deferred tenant improvement allowance, as amortization of these amounts is no longer required due to the termination of our Santa Clara facility sublease and subsequent entry into a new lease agreement with our landlord for this same facility effective September 2017. Goodwill impairment represents the impairment charge related to Telenav’s Mobile Navigation segment.
Adjusted EBITDA and adjusted cash flow from operations are key measures used by Telenav’s management and board of directors to understand and evaluate Telenav’s core operating performance and trends, to prepare and approve our annual budget and to develop short- and long-term operational plans. In particular, Telenav believes that the exclusion of the expenses eliminated in calculating adjusted EBITDA and adjusted cash flow from operations can provide a useful measure for period-to-period comparisons of Telenav’s core business.
Adjusted cash flow from operations measures adjusted EBITDA plus the effect of changes in deferred revenue and deferred costs. Telenav believes adjusted cash flow from operations is a useful measure, especially in light of the impact it continues to expect on reported GAAP revenue for certain value-added offerings the company provides its customers, including map updates and the impact of future deliverables. Adjusted EBITDA and adjusted cash flow from operations, while generally measures of profitability and the generation of cash, can also represent losses and the use of cash, respectively. In addition, adjusted cash flow from operations is a key financial measure used by the compensation committee of Telenav’s board of directors in connection with the development of incentive-based compensation for Telenav’s executive officers and employees. Accordingly, Telenav believes that adjusted cash flow from operations generally provides useful information to investors and others in understanding and evaluating Telenav’s operating results in the same manner as its management and board of directors.
Free cash flow is a non-GAAP financial measure Telenav defines as net cash provided by (used in) operating activities, less purchases of property and equipment. Telenav considers free cash flow to be a liquidity measure that provides useful information to management and investors about the amount of cash (used in) generated by its business after purchases of property and equipment.
In this press release, Telenav has provided guidance for the second quarter of fiscal 2019 on a non-GAAP basis for billings, direct contribution margin from billings, adjusted EBITDA and adjusted cash flow from operations. Telenav does not provide reconciliations of these forward-looking non-GAAP financial measures to the corresponding GAAP measures due to the high variability and difficulty in making accurate forecasts and projections with respect to deferred revenue, deferred costs, stock-based compensation and tax provision (benefit), which are components of these non-GAAP financial measures. In particular, stock-based compensation is impacted by future hiring and retention needs, as well as the future fair market value of Telenav’s common stock, all of which is difficult to predict and subject to constant change. The actual amounts of these items will have a significant impact on Telenav’s GAAP net
loss per diluted share and GAAP tax provision. Accordingly, reconciliations of Telenav’s forward-looking non-GAAP financial measures to the corresponding GAAP measures are not available without unreasonable effort.
Forward Looking Statements
This investor letter contains forward-looking statements that are based on our management’s beliefs and assumptions and on information currently available to our management. Actual events or results may differ materially from those described in this document due to a number of risks and uncertainties. These potential risks and uncertainties include, among others: Our ability to develop and implement products for Ford, GM and Toyota and to support Ford, GM and Toyota and their customers; the impact of Ford’s recent announcement regarding the elimination of various sedans in North America over the near term; the impact of tariffs on sales of automobiles in the United States and other markets; our success in extending our contracts for current and new generation of products with our existing automobile manufacturers and tier ones, particularly Ford; our ability to achieve additional design wins and the delivery dates of automobiles including our products; adoption by vehicle purchasers of Scout GPS Link; our dependence on a limited number of automobile manufacturers and tier ones for a substantial portion of our revenue; reductions in demand for automobiles; potential impacts of automobile manufacturers and tier ones including competitive capabilities in their vehicles such as Apple CarPlay and Android Auto; our advertising business; our ability to develop new advertising products and technology while also achieving cash flow break even and ultimately profitability in the advertising business; our continued reporting of losses and operating expenses in excess of expectations; failure to reach agreement with customers for awards and contracts on products and services in which we have expended resources developing; competition from other market participants who may provide comparable services to subscribers without charge; the timing of new product releases and vehicle production by our automotive customers, including inventory procurement and fulfillment; possible warranty claims, and the impact on consumer perception of its brand; our ability to develop and support products including OpenStreetMap (“OSM”), as well as transition existing navigation products to OSM and any economic benefit anticipated from the use of OSM versus proprietary map products; the potential that we may not be able to realize our deferred tax assets and may have to take a reserve against them; our reliance on our automobile manufacturers for volume and royalty reporting; the impact on revenue recognition and other financial reporting due to the amendment of contracts or changes in accounting standards; and macroeconomic and political conditions in the U.S. and abroad, in particular China. We discuss these risks in greater detail in “Risk Factors” and elsewhere in our Form 10-K for the fiscal year ended June 30, 2018 and other filings with the U.S. Securities and Exchange Commission (“SEC”), which are available at the SEC’s website at www.sec.gov. Given these uncertainties, you should not place undue reliance on these forward-looking statements. Also, forward-looking statements represent management’s beliefs and assumptions only as of the date made. You should review our SEC filings carefully and with the understanding that actual future results may be materially different from what we expect.
About Telenav, Inc.
Telenav is a leading provider of connected car and location-based services, focused on transforming life on the go for people - before, during, and after every drive. Leveraging our location platform, we enable our customers to deliver custom connected car and mobile experiences. Fortune 500 advertisers and local advertisers can now reach millions of users with Telenav’s highly-targeted advertising platform. To learn more about how Telenav’s location platform powers personalized navigation, mapping, big data intelligence, social driving, and location-based advertising, visit www.telenav.com.
Copyright 2018 Telenav, Inc. All Rights Reserved.
“Telenav,” “Scout,” “Thinknear” and the Telenav, Scout and Thinknear logos are registered trademarks of Telenav, Inc. Unless otherwise noted, all other trademarks, service marks, and logos used in this investor letter are the trademarks, service marks or logos of their respective owners.
TNAV-F
TNAV-C
Contacts
Investor Relations:
Bishop IR
Mike Bishop
415-894-9633
IR@telenav.com
Media:
Raphel Finelli
408-667-5970
raphelf@telenav.com
Telenav, Inc. | ||||||||
Condensed Consolidated Balance Sheets | ||||||||
(in thousands, except par value) | ||||||||
(unaudited) | ||||||||
September 30, 2018 | June 30, 2018 As Adjusted(1) | |||||||
Assets | ||||||||
Current assets: | ||||||||
Cash and cash equivalents | $ | 13,596 | $ | 17,117 | ||||
Short-term investments | 67,675 | 67,829 | ||||||
Accounts receivable, net of allowances of $11 and $17 at September 30, 2018 and June 30, 2018, respectively | 46,956 | 46,188 | ||||||
Restricted cash | 2,930 | 2,982 | ||||||
Income taxes receivable | — | |||||||
Deferred costs | 13,842 | 9,906 | ||||||
Prepaid expenses and other current assets | 3,393 | 3,867 | ||||||
Total current assets | 148,392 | 147,889 | ||||||
Property and equipment, net | 6,412 | 6,987 | ||||||
Deferred income taxes, non-current | 550 | 867 | ||||||
Goodwill and intangible assets, net | 30,763 | 31,046 | ||||||
Deferred costs, non-current | 46,466 | 46,363 | ||||||
Other assets | 3,517 | 2,372 | ||||||
Total assets | $ | 236,100 | $ | 235,524 | ||||
Liabilities and stockholders’ equity | ||||||||
Current liabilities: | ||||||||
Trade accounts payable | $ | 16,144 | $ | 13,008 | ||||
Accrued expenses | 36,038 | 38,803 | ||||||
Deferred revenue | 21,892 | 18,195 | ||||||
Income taxes payable | 368 | 221 | ||||||
Total current liabilities | 74,442 | 70,227 | ||||||
Deferred rent, non-current | 1,200 | 1,112 | ||||||
Deferred revenue, non-current | 57,031 | 53,855 | ||||||
Other long-term liabilities | 1,192 | 1,115 | ||||||
Commitments and contingencies | ||||||||
Stockholders’ equity: | ||||||||
Preferred stock, $0.001 par value: 50,000 shares authorized; no shares issued or outstanding | — | — | ||||||
Common stock, $0.001 par value: 600,000 shares authorized; 45,260 and 44,871 shares issued and outstanding at September 30, 2018 and June 30, 2018, respectively | 45 | 45 | ||||||
Additional paid-in capital | 168,984 | 167,895 | ||||||
Accumulated other comprehensive loss | (1,981 | ) | (1,855 | ) | ||||
Accumulated deficit | (64,813 | ) | (56,870 | ) | ||||
Total stockholders' equity | 102,235 | 109,215 | ||||||
Total liabilities and stockholders’ equity | $ | 236,100 | $ | 235,524 | ||||
(1) Certain amounts have been adjusted to reflect the retrospective adoption of ASC 606. | ||||||||
Telenav, Inc. | ||||||||
Condensed Consolidated Statements of Operations | ||||||||
(in thousands, except per share amounts) | ||||||||
(unaudited) | ||||||||
Three Months Ended September 30, | ||||||||
2018 | 2017 As Adjusted(1) | |||||||
Revenue: | ||||||||
Product | $ | 40,471 | $ | 42,659 | ||||
Services | 11,697 | 14,303 | ||||||
Total revenue | 52,168 | 56,962 | ||||||
Cost of revenue: | ||||||||
Product | 23,930 | 29,441 | ||||||
Services | 7,174 | 6,382 | ||||||
Total cost of revenue | 31,104 | 35,823 | ||||||
Gross profit | 21,064 | 21,139 | ||||||
Operating expenses: | ||||||||
Research and development | 20,102 | 20,681 | ||||||
Sales and marketing | 4,415 | 5,064 | ||||||
General and administrative | 5,450 | 5,211 | ||||||
Legal settlement and contingencies | 250 | |||||||
Total operating expenses | 29,967 | 31,206 | ||||||
Loss from operations | (8,903 | ) | (10,067 | ) | ||||
Other income (expense), net | 1,590 | (47 | ) | |||||
Loss before provision for income taxes | (7,313 | ) | (10,114 | ) | ||||
Provision for income taxes | 630 | 255 | ||||||
Net loss | $ | (7,943 | ) | $ | (10,369 | ) | ||
Net loss per share: | ||||||||
Basic and diluted | $ | (0.18 | ) | $ | (0.24 | ) | ||
Weighted average shares used in computing net loss per share: | ||||||||
Basic and diluted | 45,018 | 44,079 | ||||||
(1) Certain amounts have been adjusted to reflect the retrospective adoption of ASC 606. | ||||||||
Telenav, Inc. | ||||||||
Condensed Consolidated Statements of Cash Flows | ||||||||
(in thousands) | ||||||||
(unaudited) | ||||||||
Three Months Ended September 30, | ||||||||
2018 | 2017 As Adjusted(1) | |||||||
Operating activities | ||||||||
Net loss | $ | (7,943 | ) | $ | (10,369 | ) | ||
Adjustments to reconcile net loss to net cash used in operating activities: | ||||||||
Depreciation and amortization | 1,010 | 716 | ||||||
Deferred rent reversal due to lease termination | — | (538 | ) | |||||
Tenant improvement allowance recognition due to lease termination | — | (582 | ) | |||||
Accretion of net premium on short-term investments | 5 | 59 | ||||||
Stock-based compensation expense | 2,269 | 2,480 | ||||||
Unrealized gain on non-marketable equity investments | (1,259 | ) | — | |||||
Loss (gain) on disposal of property and equipment | (1 | ) | 8 | |||||
Bad debt expense | 1 | 38 | ||||||
Changes in operating assets and liabilities: | ||||||||
Accounts receivable | (780 | ) | (2,109 | ) | ||||
Deferred income taxes | 308 | 104 | ||||||
Deferred costs | (4,039 | ) | (5,474 | ) | ||||
Prepaid expenses and other current assets | 470 | (115 | ) | |||||
Other assets | 42 | (326 | ) | |||||
Trade accounts payable | 3,167 | 9,463 | ||||||
Accrued expenses and other liabilities | (2,600 | ) | (6,037 | ) | ||||
Income taxes payable | 149 | (123 | ) | |||||
Deferred rent | 35 | 191 | ||||||
Deferred revenue | 6,873 | 8,826 | ||||||
Net cash used in operating activities | (2,293 | ) | (3,788 | ) | ||||
Investing activities | ||||||||
Purchases of property and equipment | (100 | ) | (2,286 | ) | ||||
Purchases of short-term investments | (10,624 | ) | (13,355 | ) | ||||
Proceeds from sales and maturities of short-term investments | 10,865 | 16,697 | ||||||
Net cash provided by investing activities | 141 | 1,056 | ||||||
Financing activities | ||||||||
Proceeds from exercise of stock options | 24 | 197 | ||||||
Tax withholdings related to net share settlements of restricted stock units | (1,206 | ) | (1,102 | ) | ||||
Net cash used in financing activities | (1,182 | ) | (905 | ) | ||||
Effect of exchange rate changes on cash and cash equivalents | (239 | ) | 345 | |||||
Net decrease in cash, cash equivalents and restricted cash | (3,573 | ) | (3,292 | ) | ||||
Cash, cash equivalents and restricted cash, at beginning of period | 20,099 | 24,158 | ||||||
Cash, cash equivalents and restricted cash, at end of period | $ | 16,526 | $ | 20,866 | ||||
Supplemental disclosure of cash flow information | ||||||||
Income taxes paid, net | $ | 166 | $ | 304 | ||||
Reconciliation of cash, cash equivalents and restricted cash to the condensed consolidated balance sheets | ||||||||
Cash and cash equivalents | $ | 13,596 | $ | 17,463 | ||||
Restricted cash | 2,930 | 3,403 | ||||||
Total cash, cash equivalents and restricted cash | $ | 16,526 | $ | 20,866 | ||||
(1) Certain amounts have been adjusted to reflect the retrospective adoption of ASC 606. | ||||||||
Telenav, Inc. | ||||||||
Condensed Consolidated Segment Summary | ||||||||
(in thousands, except percentages) | ||||||||
(unaudited) | ||||||||
Three Months Ended September 30, | ||||||||
2018 | 2017 As Adjusted(1) | |||||||
Automotive | ||||||||
Revenue | $ | 43,451 | $ | 45,608 | ||||
Cost of revenue | 26,959 | 30,861 | ||||||
Gross profit | $ | 16,492 | $ | 14,747 | ||||
Gross margin | 38 | % | 32 | % | ||||
Advertising | ||||||||
Revenue | $ | 5,947 | $ | 7,615 | ||||
Cost of revenue | 3,220 | 3,412 | ||||||
Gross profit | $ | 2,727 | $ | 4,203 | ||||
Gross margin | 46 | % | 55 | % | ||||
Mobile Navigation | ||||||||
Revenue | $ | 2,770 | $ | 3,739 | ||||
Cost of revenue | 925 | 1,550 | ||||||
Gross profit | $ | 1,845 | $ | 2,189 | ||||
Gross margin | 67 | % | 59 | % | ||||
Total | ||||||||
Revenue | $ | 52,168 | $ | 56,962 | ||||
Cost of revenue | 31,104 | 35,823 | ||||||
Gross profit | $ | 21,064 | $ | 21,139 | ||||
Gross margin | 40 | % | 37 | % | ||||
(1) Certain amounts have been adjusted to reflect the retrospective adoption of ASC 606. | ||||||||
Telenav, Inc. | ||||||||
Unaudited Reconciliation of Non-GAAP Adjustments | ||||||||
(in thousands) | ||||||||
Reconciliation of Revenue to Billings | ||||||||
Three Months Ended September 30, | ||||||||
2018 | 2017 | |||||||
Automotive | ||||||||
Revenue | $ | 43,451 | $ | 45,608 | ||||
Adjustments: | ||||||||
Change in deferred revenue | 6,860 | 8,883 | ||||||
Billings | $ | 50,311 | $ | 54,491 | ||||
Advertising | ||||||||
Revenue | $ | 5,947 | $ | 7,615 | ||||
Adjustments: | ||||||||
Change in deferred revenue | — | — | ||||||
Billings | $ | 5,947 | $ | 7,615 | ||||
Mobile Navigation | ||||||||
Revenue | $ | 2,770 | $ | 3,739 | ||||
Adjustments: | ||||||||
Change in deferred revenue | 13 | (57 | ) | |||||
Billings | $ | 2,783 | $ | 3,682 | ||||
Total | ||||||||
Revenue | $ | 52,168 | $ | 56,962 | ||||
Adjustments: | ||||||||
Change in deferred revenue | 6,873 | 8,826 | ||||||
Billings | $ | 59,041 | $ | 65,788 | ||||
Telenav, Inc. | ||||||||||||||||
Unaudited Reconciliation of Non-GAAP Adjustments | ||||||||||||||||
(in thousands) | ||||||||||||||||
Reconciliation of Deferred Revenue to Change in Deferred Revenue | ||||||||||||||||
Reconciliation of Deferred Costs to Change in Deferred Costs | ||||||||||||||||
Three Months Ended September 30, 2018 | ||||||||||||||||
Automotive | Advertising | Mobile Navigation | Total | |||||||||||||
Deferred revenue, September 30 | $ | 78,373 | $ | — | $ | 550 | $ | 78,923 | ||||||||
Deferred revenue, June 30 | 71,513 | — | 537 | 72,050 | ||||||||||||
Change in deferred revenue | $ | 6,860 | $ | — | $ | 13 | $ | 6,873 | ||||||||
Deferred costs, September 30 | $ | 60,308 | $ | — | $ | — | $ | 60,308 | ||||||||
Deferred costs, June 30 | 56,269 | — | — | 56,269 | ||||||||||||
Change in deferred costs | $ | 4,039 | $ | — | $ | — | $ | 4,039 | ||||||||
Three Months Ended September 30, 2017 | ||||||||||||||||
Automotive | Advertising | Mobile Navigation | Total | |||||||||||||
Deferred revenue, September 30 | $ | 46,407 | $ | — | $ | 827 | $ | 47,234 | ||||||||
Deferred revenue, June 30 | 37,524 | — | 884 | 38,408 | ||||||||||||
Change in deferred revenue | $ | 8,883 | $ | — | $ | (57 | ) | $ | 8,826 | |||||||
Deferred costs, September 30 | $ | 40,227 | $ | — | $ | — | $ | 40,227 | ||||||||
Deferred costs, June 30 | 34,753 | — | — | 34,753 | ||||||||||||
Change in deferred costs | $ | 5,474 | $ | — | $ | — | $ | 5,474 | ||||||||
Telenav, Inc. | ||||||||
Unaudited Reconciliation of Non-GAAP Adjustments | ||||||||
(in thousands, except percentages) | ||||||||
Reconciliation of Gross Profit to Direct Contribution from Billings | ||||||||
Three Months Ended September 30, | ||||||||
2018 | 2017 | |||||||
Automotive | ||||||||
Gross profit | $ | 16,492 | $ | 14,747 | ||||
Gross margin | 38 | % | 32 | % | ||||
Adjustments to gross profit: | ||||||||
Change in deferred revenue | $ | 6,860 | $ | 8,883 | ||||
Change in deferred costs(1) | (4,039 | ) | (5,474 | ) | ||||
Net change | 2,821 | 3,409 | ||||||
Direct contribution from billings(1) | $ | 19,313 | $ | 18,156 | ||||
Direct contribution margin from billings(1) | 38 | % | 33 | % | ||||
Advertising | ||||||||
Gross profit | $ | 2,727 | $ | 4,203 | ||||
Gross margin | 46 | % | 55 | % | ||||
Adjustments to gross profit: | ||||||||
Change in deferred revenue | $ | — | $ | — | ||||
Change in deferred costs | — | — | ||||||
Net change | — | — | ||||||
Direct contribution from billings | $ | 2,727 | $ | 4,203 | ||||
Direct contribution margin from billings | 46 | % | 55 | % | ||||
Mobile Navigation | ||||||||
Gross profit | $ | 1,845 | $ | 2,189 | ||||
Gross margin | 67 | % | 59 | % | ||||
Adjustments to gross profit: | ||||||||
Change in deferred revenue | $ | 13 | $ | (57 | ) | |||
Change in deferred costs | — | — | ||||||
Net change | 13 | (57 | ) | |||||
Direct contribution from billings | $ | 1,858 | $ | 2,132 | ||||
Direct contribution margin from billings | 67 | % | 58 | % | ||||
Total | ||||||||
Gross profit | $ | 21,064 | $ | 21,139 | ||||
Gross margin | 40 | % | 37 | % | ||||
Adjustments to gross profit: | ||||||||
Change in deferred revenue | $ | 6,873 | $ | 8,826 | ||||
Change in deferred costs(1) | (4,039 | ) | (5,474 | ) | ||||
Net change | 2,834 | 3,352 | ||||||
Direct contribution from billings(1) | $ | 23,898 | $ | 24,491 | ||||
Direct contribution margin from billings(1) | 40 | % | 37 | % | ||||
(1) Deferred costs primarily include costs associated with third party content and in connection with certain customized software solutions, the costs incurred to develop those solutions. We expect to incur additional costs in the future due to requirements to provide ongoing provisioning of services such as hosting, monitoring and customer support. Accordingly, direct contribution from billings and direct contribution margin from billings do not reflect all costs associated with billings. | ||||||||
Telenav, Inc. | ||||||||
Unaudited Reconciliation of Non-GAAP Adjustments | ||||||||
(in thousands) | ||||||||
Reconciliation of Net Loss to Adjusted EBITDA and Adjusted Cash Flow from Operations | ||||||||
Three Months Ended September 30, | ||||||||
2018 | 2017 | |||||||
Net loss | $ | (7,943 | ) | $ | (10,369 | ) | ||
Adjustments: | ||||||||
Legal settlement and contingencies | — | 250 | ||||||
Deferred rent reversal due to lease termination | — | (538 | ) | |||||
Tenant improvement allowance recognition due to lease termination | — | (582 | ) | |||||
Stock-based compensation expense | 2,269 | 2,480 | ||||||
Depreciation and amortization expense | 1,010 | 716 | ||||||
Other income (expense), net | (1,590 | ) | 47 | |||||
Provision for income taxes | 630 | 255 | ||||||
Adjusted EBITDA | $ | (5,624 | ) | $ | (7,741 | ) | ||
Change in deferred revenue | 6,873 | 8,826 | ||||||
Change in deferred costs(1) | (4,039 | ) | (5,474 | ) | ||||
Adjusted cash flow from operations(1) | $ | (2,790 | ) | $ | (4,389 | ) | ||
(1) We expect to incur additional costs in the future due to requirements to provide ongoing provisioning of services such as hosting, monitoring and customer support. Accordingly, adjusted EBITDA on billings does not reflect all costs associated with billings. | ||||||||
Telenav, Inc. | ||||||||
Unaudited Reconciliation of Non-GAAP Adjustments | ||||||||
(in thousands) | ||||||||
Reconciliation of Net Loss to Free Cash Flow | ||||||||
Three Months Ended September 30, | ||||||||
2018 | 2017 | |||||||
Net loss | $ | (7,943 | ) | $ | (10,369 | ) | ||
Adjustments to reconcile net loss to net cash used in operating activities: | ||||||||
Change in deferred revenue (1) | 6,873 | 8,826 | ||||||
Change in deferred costs (2) | (4,039 | ) | (5,474 | ) | ||||
Changes in other operating assets and liabilities | 791 | 1,048 | ||||||
Other adjustments (3) | 2,025 | 2,181 | ||||||
Net cash used in operating activities | (2,293 | ) | (3,788 | ) | ||||
Less: Purchases of property and equipment | (100 | ) | (2,286 | ) | ||||
Free cash flow | $ | (2,393 | ) | $ | (6,074 | ) | ||
(1) Consists of product royalties, customized software development fees, service fees and subscription fees. | ||||||||
(2) Consists primarily of third party content costs and customized software development expenses. | ||||||||
(3) Consist primarily of depreciation and amortization, stock-based compensation expense and other non-cash items. | ||||||||
Telenav, Inc. | |||||||||
Summarized Financial Information Depicting the Adoption of ASC 606 | |||||||||
(in thousands, except per share amounts) | |||||||||
(unaudited) | |||||||||
As of June 30, 2018 | |||||||||
As Reported (ASC 605) | Adjustments | As Adjusted (ASC 606) | |||||||
Assets | |||||||||
Deferred costs | 31,888 | (21,982 | ) | 9,906 | |||||
Deferred costs, non-current | 109,269 | (62,906 | ) | 46,363 | |||||
Liabilities and stockholders' equity | |||||||||
Deferred revenue | 52,871 | (34,676 | ) | 18,195 | |||||
Deferred revenue, non-current | 182,236 | (128,381 | ) | 53,855 | |||||
Accumulated deficit | (135,042 | ) | 78,172 | (56,870 | ) | ||||
Three Months Ended September 30, 2017 | ||||||||||||
As Reported (ASC 605) | Adjustments | As Adjusted (ASC 606) | ||||||||||
Revenue | ||||||||||||
Product | $ | 23,964 | $ | 18,695 | $ | 42,659 | ||||||
Services | 12,694 | 1,609 | 14,303 | |||||||||
Total revenue | 36,658 | 20,304 | 56,962 | |||||||||
Cost of revenue | ||||||||||||
Product | 14,674 | 14,767 | 29,441 | |||||||||
Services | 6,173 | 209 | 6,382 | |||||||||
Total cost of revenue | 20,847 | 14,976 | 35,823 | |||||||||
Gross profit | 15,811 | 5,328 | 21,139 | |||||||||
Operating expenses | ||||||||||||
Research and development | 21,082 | (401 | ) | 20,681 | ||||||||
Total operating expenses | 31,607 | (401 | ) | 31,206 | ||||||||
Loss from operations | (15,796 | ) | 5,729 | (10,067 | ) | |||||||
Net loss | (16,098 | ) | 5,729 | (10,369 | ) | |||||||
Net loss per share, basic and diluted | $ | (0.37 | ) | $ | 0.13 | $ | (0.24 | ) | ||||