Attached files
| file | filename |
|---|---|
| 8-K - 8-K - HERITAGE FINANCIAL CORP /WA/ | form8-kxq3x2018investorpre.htm |

Investor Presentation Q3 2018 Brian Vance Chief Executive Officer – Heritage Financial Jeff Deuel Chief Executive Officer – Heritage Bank Bryan McDonald Chief Operating Officer Don Hinson Chief Financial Officer

FORWARD – LOOKING STATEMENT This presentation contains forward-looking statements that are subject to risks and uncertainties, including, but not limited to: • The expected revenues, cost savings, synergies and other benefits from our other merger and acquisition activities might not be realized within the anticipated time frames or at all, and costs or difficulties relating to integration matters, including but not limited to, customer and employee retention, might be greater than expected; • The credit and concentration risks of lending activities; • Changes in general economic conditions, either nationally or in our market areas; • Competitive market pricing factors and interest rate risks; • Market interest rate volatility; • Balance sheet (for example, loan) concentrations; • Fluctuations in demand for loans and other financial services in our market areas; • Changes in legislative or regulatory requirements or the results of regulatory examinations; • The ability to recruit and retain key management and staff; • Risks associated with our ability to implement our expansion strategy and merger integration; • Stability of funding sources and continued availability of borrowings; • Adverse changes in the securities markets; • The inability of key third-party providers to perform their obligations to us; • The expected revenues, cost savings, synergies and other benefits from the Premier Commercial Bancorp merger might not be realized within the expected time frames or at all, and costs or difficulties relating to integration matters, including but not limited to, customer and employee retention might be greater than expected; • Changes in accounting policies and practices and the use of estimates in determining fair value of certain of our assets, which estimates may prove to be incorrect and result in significant declines in valuation; and • These and other risks as may be detailed from time to time in our filings with the Securities and Exchange Commission. Heritage cautions readers not to place undue reliance on any forward-looking statements. Moreover, you should treat these statements as speaking only as of the date they are made and based only on information then actually known to Heritage. Heritage does not undertake and specifically disclaims any obligation to revise any forward-looking statements to reflect the occurrence of anticipated or unanticipated events or circumstances after the date of such statements. These risks could cause our actual results for the fourth quarter of 2018 and beyond to differ materially from those expressed in any forward-looking statements by, or on behalf of, us, and could negatively affect Heritage’s operating and stock price performance. 2
COMPANY OVERVIEW 3

OVERVIEW Overview NASDAQ Symbol HFWA Market Capitalization $1.2 billion Institutional Ownership 82.9% Total Assets $5.28 billion Headquarters Olympia, WA # of Branches 64 Year Established 1927 Note: Totals assets as of 09/30/2018 include pro forma impact of Premier Commercial Bancorp merger and market information as of 10/31/2018 4

MANAGEMENT TEAM Banking HFWA Previous Name Age Position Experience Service Experience Brian Vance 64 Chief Executive Officer of Heritage 46 years 22 years WestOne Financial Corporation Bank/U.S. Bank Jeff Deuel 60 Chief Executive Officer of Heritage Bank 36 years 8 years JPMChase/WAMU, CoreStates Bank Don Hinson 57 EVP and Chief Financial Officer 24 years 13 years Banking Practice of National Accounting Firm Bryan McDonald 47 EVP and Chief Operating Officer 24 years 12 years WBCO, WAMU, WestOne Bank/U.S. Bank Dave Spurling 65 EVP and Chief Credit Officer 26 years 17 years Bank of America Cindy Huntley 55 EVP and Director of Retail Banking 30 years 30 years Lisa Banner 56 EVP and Director of Shared Services 24 years 3 years Zions Bank Tom Henning 56 EVP and Chief Risk Officer 32 years 2 years Bank United (FL), WAMU Bill Glasby 45 EVP and Chief Technology Officer 23 years 1 year JPMChase/WAMU Sabrina Robison 50 SVP and Chief Human Resources Officer 31 years 31 years 5
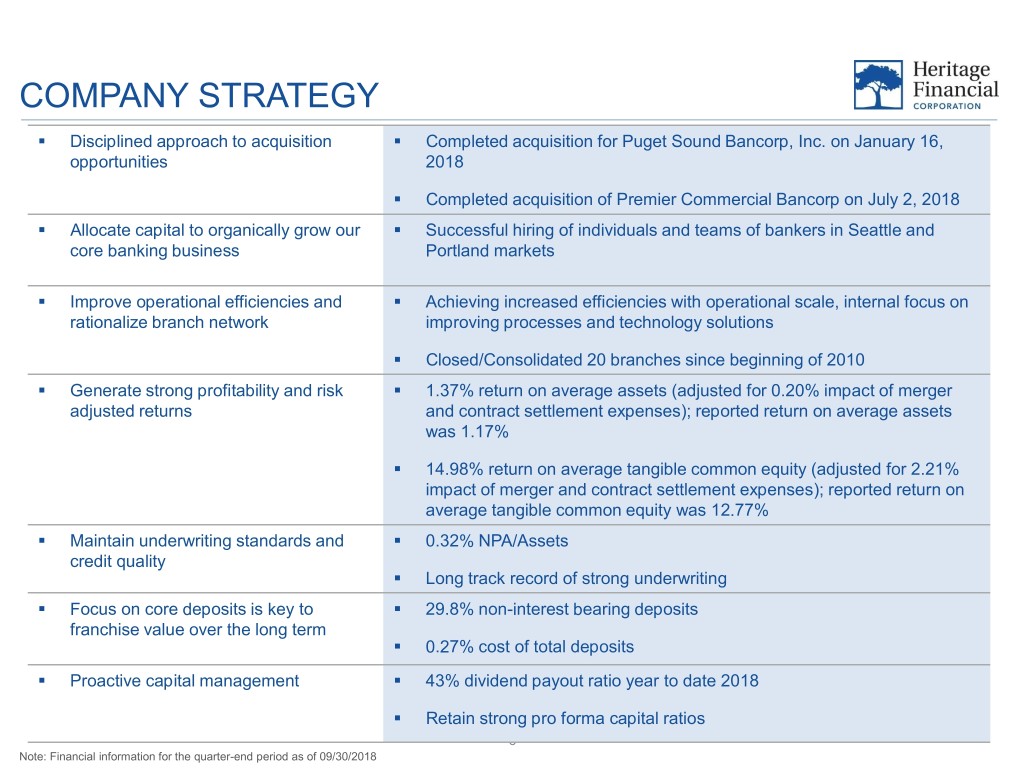
COMPANY STRATEGY . Disciplined approach to acquisition . Completed acquisition for Puget Sound Bancorp, Inc. on January 16, opportunities 2018 . Completed acquisition of Premier Commercial Bancorp on July 2, 2018 . Allocate capital to organically grow our . Successful hiring of individuals and teams of bankers in Seattle and core banking business Portland markets . Improve operational efficiencies and . Achieving increased efficiencies with operational scale, internal focus on rationalize branch network improving processes and technology solutions . Closed/Consolidated 20 branches since beginning of 2010 . Generate strong profitability and risk . 1.37% return on average assets (adjusted for 0.20% impact of merger adjusted returns and contract settlement expenses); reported return on average assets was 1.17% . 14.98% return on average tangible common equity (adjusted for 2.21% impact of merger and contract settlement expenses); reported return on average tangible common equity was 12.77% . Maintain underwriting standards and . 0.32% NPA/Assets credit quality . Long track record of strong underwriting . Focus on core deposits is key to . 29.8% non-interest bearing deposits franchise value over the long term . 0.27% cost of total deposits . Proactive capital management . 43% dividend payout ratio year to date 2018 . Retain strong pro forma capital ratios 6 Note: Financial information for the quarter-end period as of 09/30/2018

TRAJECTORY OF HFWA . HFWA has been the most acquisitive bank in Oregon and Washington since 2012 with 5 acquisitions* Where We’ve Been . 4x growth since 2012 – from $1.3 billion to $5.3 billion of assets (with Premier), annualized growth of 28.4% . Post-WBCO merger – targeted execution by organically building a foothold in Seattle and Portland, and supplementing with strategic acquisitions of Puget Sound and Premier Commercial . HFWA has executed on its growth plan without any major issues . Where We 2nd largest publicly traded, traditional commercial bank which is solely focused in Pacific Northwest** Are Now . Scarcity value from the perspective of an investor, or an acquiror . Strength of currency – $1.2B market cap., and average trading volume of $7MM per day . Strong reputation and credibility in the marketplace – succinct communication and execution of strategic plan . Fortress balance sheet – capital, liquidity, lack of leverage, core deposit base and credit quality . Deep management bench and strong, dedicated culture – team in place to manage HFWA for long-term . Well positioned to create shareholder value Note: Total assets includes the pro forma impact of the Premier Commercial Bancorp merger *For M&A transactions announced since 1/1/2012 for companies headquartered in Oregon or Washington **Excludes UMPQ, WAFD, BANR and HMST, since each company has operations outside of Oregon/Washington/Idaho 7
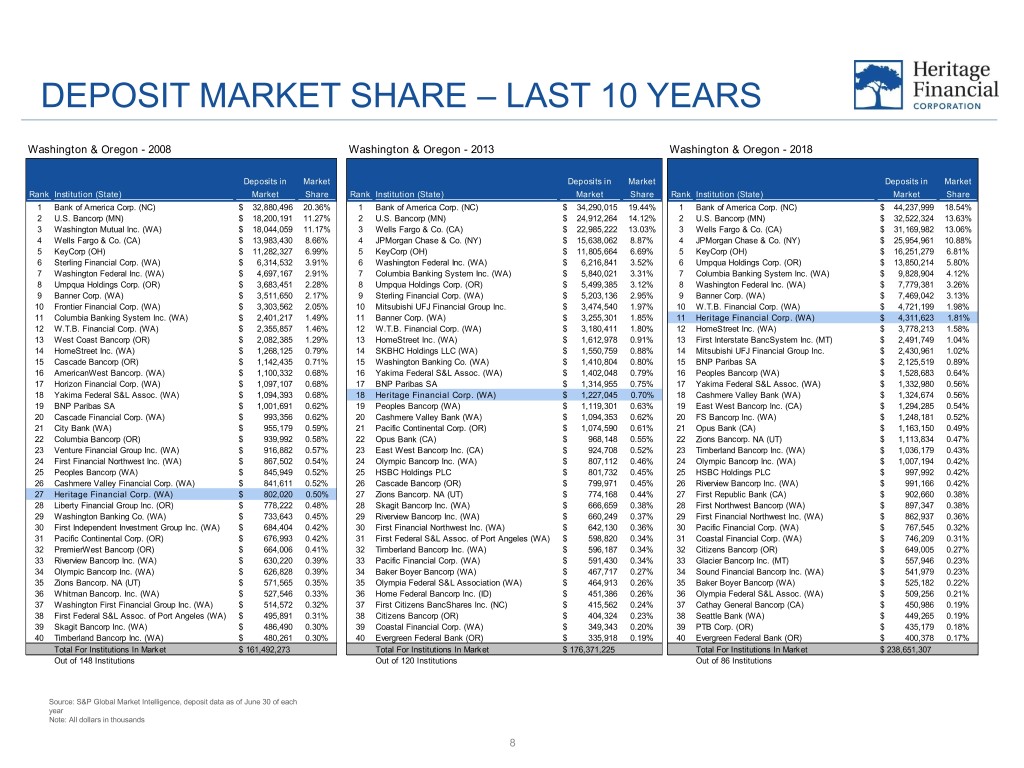
DEPOSIT MARKET SHARE – LAST 10 YEARS Washington & Oregon - 2008 Washington & Oregon - 2013 Washington & Oregon - 2018 Deposits in Market Deposits in Market Deposits in Market Rank Institution (State) Market Share Rank Institution (State) Market Share Rank Institution (State) Market Share 1 Bank of America Corp. (NC) $ 32,880,496 20.36% 1 Bank of America Corp. (NC) $ 34,290,015 19.44% 1 Bank of America Corp. (NC) $ 44,237,999 18.54% 2 U.S. Bancorp (MN) $ 18,200,191 11.27% 2 U.S. Bancorp (MN) $ 24,912,264 14.12% 2 U.S. Bancorp (MN) $ 32,522,324 13.63% 3 Washington Mutual Inc. (WA) $ 18,044,059 11.17% 3 Wells Fargo & Co. (CA) $ 22,985,222 13.03% 3 Wells Fargo & Co. (CA) $ 31,169,982 13.06% 4 Wells Fargo & Co. (CA) $ 13,983,430 8.66% 4 JPMorgan Chase & Co. (NY) $ 15,638,062 8.87% 4 JPMorgan Chase & Co. (NY) $ 25,954,961 10.88% 5 KeyCorp (OH) $ 11,282,327 6.99% 5 KeyCorp (OH) $ 11,805,664 6.69% 5 KeyCorp (OH) $ 16,251,279 6.81% 6 Sterling Financial Corp. (WA) $ 6,314,532 3.91% 6 Washington Federal Inc. (WA) $ 6,216,841 3.52% 6 Umpqua Holdings Corp. (OR) $ 13,850,214 5.80% 7 Washington Federal Inc. (WA) $ 4,697,167 2.91% 7 Columbia Banking System Inc. (WA) $ 5,840,021 3.31% 7 Columbia Banking System Inc. (WA) $ 9,828,904 4.12% 8 Umpqua Holdings Corp. (OR) $ 3,683,451 2.28% 8 Umpqua Holdings Corp. (OR) $ 5,499,385 3.12% 8 Washington Federal Inc. (WA) $ 7,779,381 3.26% 9 Banner Corp. (WA) $ 3,511,650 2.17% 9 Sterling Financial Corp. (WA) $ 5,203,136 2.95% 9 Banner Corp. (WA) $ 7,469,042 3.13% 10 Frontier Financial Corp. (WA) $ 3,303,562 2.05% 10 Mitsubishi UFJ Financial Group Inc. $ 3,474,540 1.97% 10 W.T.B. Financial Corp. (WA) $ 4,721,199 1.98% 11 Columbia Banking System Inc. (WA) $ 2,401,217 1.49% 11 Banner Corp. (WA) $ 3,255,301 1.85% 11 Heritage Financial Corp. (WA) $ 4,311,623 1.81% 12 W.T.B. Financial Corp. (WA) $ 2,355,857 1.46% 12 W.T.B. Financial Corp. (WA) $ 3,180,411 1.80% 12 HomeStreet Inc. (WA) $ 3,778,213 1.58% 13 West Coast Bancorp (OR) $ 2,082,385 1.29% 13 HomeStreet Inc. (WA) $ 1,612,978 0.91% 13 First Interstate BancSystem Inc. (MT) $ 2,491,749 1.04% 14 HomeStreet Inc. (WA) $ 1,268,125 0.79% 14 SKBHC Holdings LLC (WA) $ 1,550,759 0.88% 14 Mitsubishi UFJ Financial Group Inc. $ 2,430,961 1.02% 15 Cascade Bancorp (OR) $ 1,142,435 0.71% 15 Washington Banking Co. (WA) $ 1,410,804 0.80% 15 BNP Paribas SA $ 2,125,519 0.89% 16 AmericanWest Bancorp. (WA) $ 1,100,332 0.68% 16 Yakima Federal S&L Assoc. (WA) $ 1,402,048 0.79% 16 Peoples Bancorp (WA) $ 1,528,683 0.64% 17 Horizon Financial Corp. (WA) $ 1,097,107 0.68% 17 BNP Paribas SA $ 1,314,955 0.75% 17 Yakima Federal S&L Assoc. (WA) $ 1,332,980 0.56% 18 Yakima Federal S&L Assoc. (WA) $ 1,094,393 0.68% 18 Heritage Financial Corp. (WA) $ 1,227,045 0.70% 18 Cashmere Valley Bank (WA) $ 1,324,674 0.56% 19 BNP Paribas SA $ 1,001,691 0.62% 19 Peoples Bancorp (WA) $ 1,119,301 0.63% 19 East West Bancorp Inc. (CA) $ 1,294,285 0.54% 20 Cascade Financial Corp. (WA) $ 993,356 0.62% 20 Cashmere Valley Bank (WA) $ 1,094,353 0.62% 20 FS Bancorp Inc. (WA) $ 1,248,181 0.52% 21 City Bank (WA) $ 955,179 0.59% 21 Pacific Continental Corp. (OR) $ 1,074,590 0.61% 21 Opus Bank (CA) $ 1,163,150 0.49% 22 Columbia Bancorp (OR) $ 939,992 0.58% 22 Opus Bank (CA) $ 968,148 0.55% 22 Zions Bancorp. NA (UT) $ 1,113,834 0.47% 23 Venture Financial Group Inc. (WA) $ 916,882 0.57% 23 East West Bancorp Inc. (CA) $ 924,708 0.52% 23 Timberland Bancorp Inc. (WA) $ 1,036,179 0.43% 24 First Financial Northwest Inc. (WA) $ 867,502 0.54% 24 Olympic Bancorp Inc. (WA) $ 807,112 0.46% 24 Olympic Bancorp Inc. (WA) $ 1,007,194 0.42% 25 Peoples Bancorp (WA) $ 845,949 0.52% 25 HSBC Holdings PLC $ 801,732 0.45% 25 HSBC Holdings PLC $ 997,992 0.42% 26 Cashmere Valley Financial Corp. (WA) $ 841,611 0.52% 26 Cascade Bancorp (OR) $ 799,971 0.45% 26 Riverview Bancorp Inc. (WA) $ 991,166 0.42% 27 Heritage Financial Corp. (WA) $ 802,020 0.50% 27 Zions Bancorp. NA (UT) $ 774,168 0.44% 27 First Republic Bank (CA) $ 902,660 0.38% 28 Liberty Financial Group Inc. (OR) $ 778,222 0.48% 28 Skagit Bancorp Inc. (WA) $ 666,659 0.38% 28 First Northwest Bancorp (WA) $ 897,347 0.38% 29 Washington Banking Co. (WA) $ 733,643 0.45% 29 Riverview Bancorp Inc. (WA) $ 660,249 0.37% 29 First Financial Northwest Inc. (WA) $ 862,937 0.36% 30 First Independent Investment Group Inc. (WA) $ 684,404 0.42% 30 First Financial Northwest Inc. (WA) $ 642,130 0.36% 30 Pacific Financial Corp. (WA) $ 767,545 0.32% 31 Pacific Continental Corp. (OR) $ 676,993 0.42% 31 First Federal S&L Assoc. of Port Angeles (WA) $ 598,820 0.34% 31 Coastal Financial Corp. (WA) $ 746,209 0.31% 32 PremierWest Bancorp (OR) $ 664,006 0.41% 32 Timberland Bancorp Inc. (WA) $ 596,187 0.34% 32 Citizens Bancorp (OR) $ 649,005 0.27% 33 Riverview Bancorp Inc. (WA) $ 630,220 0.39% 33 Pacific Financial Corp. (WA) $ 591,430 0.34% 33 Glacier Bancorp Inc. (MT) $ 557,946 0.23% 34 Olympic Bancorp Inc. (WA) $ 626,828 0.39% 34 Baker Boyer Bancorp (WA) $ 467,717 0.27% 34 Sound Financial Bancorp Inc. (WA) $ 541,979 0.23% 35 Zions Bancorp. NA (UT) $ 571,565 0.35% 35 Olympia Federal S&L Association (WA) $ 464,913 0.26% 35 Baker Boyer Bancorp (WA) $ 525,182 0.22% 36 Whitman Bancorp. Inc. (WA) $ 527,546 0.33% 36 Home Federal Bancorp Inc. (ID) $ 451,386 0.26% 36 Olympia Federal S&L Assoc. (WA) $ 509,256 0.21% 37 Washington First Financial Group Inc. (WA) $ 514,572 0.32% 37 First Citizens BancShares Inc. (NC) $ 415,562 0.24% 37 Cathay General Bancorp (CA) $ 450,986 0.19% 38 First Federal S&L Assoc. of Port Angeles (WA) $ 495,891 0.31% 38 Citizens Bancorp (OR) $ 404,324 0.23% 38 Seattle Bank (WA) $ 449,265 0.19% 39 Skagit Bancorp Inc. (WA) $ 486,490 0.30% 39 Coastal Financial Corp. (WA) $ 349,343 0.20% 39 PTB Corp. (OR) $ 435,179 0.18% 40 Timberland Bancorp Inc. (WA) $ 480,261 0.30% 40 Evergreen Federal Bank (OR) $ 335,918 0.19% 40 Evergreen Federal Bank (OR) $ 400,378 0.17% Total For Institutions In Market $ 161,492,273 Total For Institutions In Market $ 176,371,225 Total For Institutions In Market $ 238,651,307 Out of 148 Institutions Out of 120 Institutions Out of 86 Institutions Source: S&P Global Market Intelligence, deposit data as of June 30 of each year Note: All dollars in thousands 8

STRONG AND DIVERSE ECONOMIC LANDSCAPE . Thriving local economy with job growth in technology and Headquartered in Western Washington aerospace sectors . Washington named “America’s Top State for Business in 2017” by CNBC(1) . Washington state has the country’s largest concentration of STEM workers (science, technology, education and math)(1) . Seattle economy ranks 12th largest in the country by GDP, which increased 5.2% since 2014(2) . Seattle’s population grew 12.1% from 2010 to 2017(3) . Median household income for Seattle and Bellevue is $85,936 and $112,936, respectively, which is 41% and 85% higher than the national average of $61,045 (3) . Fortune 500 companies headquartered in Seattle-Bellevue MSA, Major Operations in Western Washington include: Amazon, Costco, Microsoft, PACCAR, Nordstrom, Weyerhaeuser, Expeditors, Alaska Air, Expedia and Starbucks . King County home prices increased 15.4% from December 2016 to December 2017(4) Note: Information for Seattle MSA, where available (1) www.cnbc.com (2) Bureau of Economic Analysis (3) U.S. Census data 9 (4) www.zillow.com
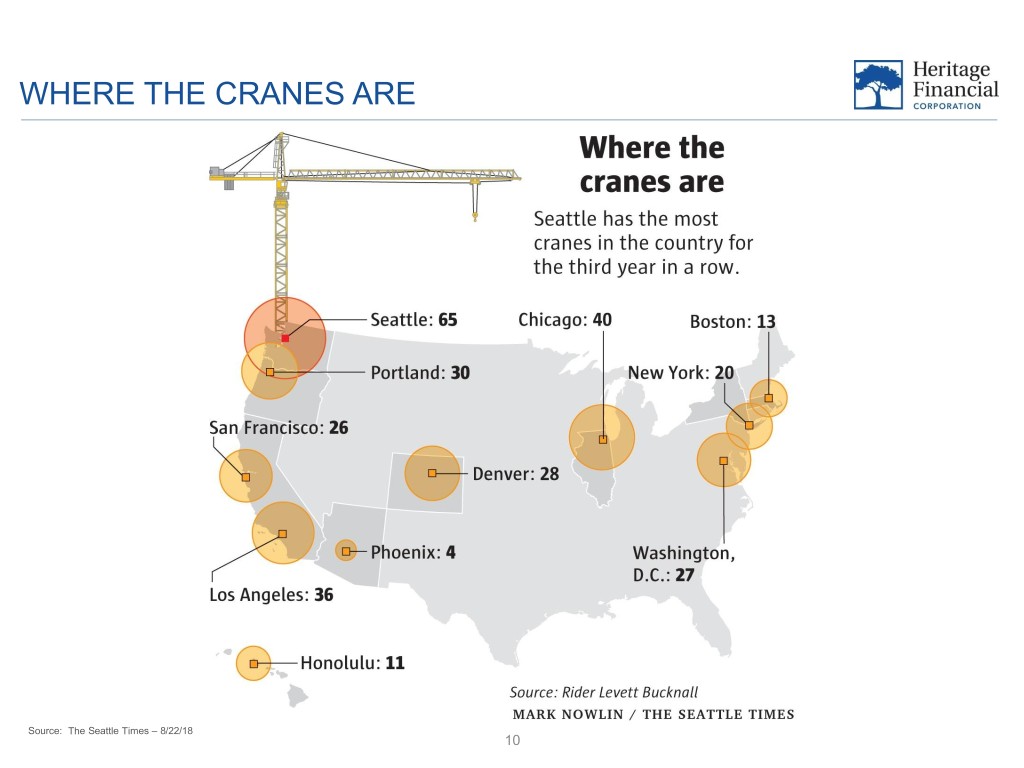
WHERE THE CRANES ARE Source: The Seattle Times – 8/22/18 10

SEATTLE METRO MARKET • Seattle Metro market is one of the fastest growing in the country • Annual population growth exceeded the Top 15 MSAs since 2015, and the Seattle MSA expected to grow at 1.3% CAGR in next five years • Median household income for the Seattle MSA has trended above the Top 15 MSAs and the U.S., and is expected to reach $92k by 2023 Annual Population Growth 3.0% 2.38% 2.5% 2.03% 2.04% 1.89% 2.0% 1.72% 1.79% 1.65% 1.56% 1.5% 1.21% 1.31% 1.00% 1.12% 1.07% 0.90% 0.93% 0.84% 1.0% 0.79% 0.74% 0.71% 0.70% 0.69% 0.57% 0.62% 0.56% 0.56% 0.43% 0.5% -0.13% 0.0% 2011 2012 2013 2014 2015 2016 2017 2018 2018-2023 -0.5% Seattle MSA Top 15 MSAs U.S. Median Household Income $100 $92 $82 $75 $77 $80 $71 $68 $69 $66 $63 $63 $65 $66 $62 $64 $58 $58 $58 $59 $61 $57 $54 $56 $57 $60 $50 $50 $49 $52 $40 $20 $- 2011 2012 2013 2014 2015 2016 2017 2018 2018-2023 Seattle MSA Top 15 MSAs U.S. Source: S&P Global Market Intelligence, Claritas Note: Top 15 MSA data is based on median of the group Note: Date for actuals, estimates and projections is January 1 of the relevant year 11 Note: All dollars in thousands

HISTORICAL GROWTH $1,000 $2,000 $3,000 $4,000 $5,000 $6,000 Note: All dollars in millions; All Note:dollars goodwill adjustments andmillions; in accountingAcquired Assets includepurchase Company Source:as financials, of $- . In In addition to organic growth, HFWA has completed 8 whole bank mergers and 2 FDIC 1998 $74 $401 $74Massets in withBancorporation Pacific AcquiredNorth Inc. $61Mwithassets Inc. in Bancshares Independent AcquiredWashington 1999 $61 $450 2000 $574 2001 9 /30/2018 $610 2002 $595 2003 Organic $641 2004 $697 withassets in $57M BancorpWashington AcquiredWestern 2005 Acquired Assets Acquired – $751 ORGANIC AND ACQUISITIVE 2006 $57 $796 2007 $886 12 2008 Premier Commercial Bancorp Commercial Premier $946 $345M in assets, assets, in respectively$345M acquiringand Bank $211M Commercial Cowlitzand Bank FDIC2Completed deals 2009 $1,015 and $65M in assets, assets, in respectively$65Mand Commercial with Bank NorthwestandInc. Bancshares, AcquiredValleyCommunity 2010 $556 $812 2011 $1,369 Companyassets in $1.7Bwith MergerBanking withWashington - Pierce 2012 - assisted transactions since 1998. $1,346 $ 254M 2013 $319 $1,340 $1,747 2014 $1,712 withassets in $639M BancorpSoundPuget acquisition Completed of 2015 $3,651 with $440M in assets withassets in $440M Premier Commercial Bancorp acquisition Completed of 2016 $3,879 2017 $4,113 2018 YTD $639 $440 $4,197

SEATTLE* METRO MARKET • $1.57 billion in total funds under management in the Seattle/Bellevue markets King County Funds Under Management = Loans + Deposits $1,800 $1,600 $1,570 $1,485 $1,515 $1,400 $660 $1,200 $602 $623 $1,000 $800 $598 $600 $102 $883 $892 $910 $400 $496 $200 $- Q4 2017 Q1 2018 Q2 2018 Q3 2018 HFWA Branch Loans Deposits Source: Company financials as of 09/30/2018 Note: All dollars in millions * Deposits include Seattle and Bellevue branch deposits as well as deposits managed by commercial bankers in these two branches. 13

PORTLAND METRO MARKET • $878 million in total funds under management in the Portland MSA Portland/Vancouver Funds Under Management = Loans + Deposits $1,000 $878 $900 $800 $700 $447 $600 $500 $400 $300 $206 $174 $431 $200 $155 $112 $103 $100 $88 HFWA Branch $67 $71 $94 $- Q4 2017 Q1 2018 Q2 2018 Q3 2018 Loans Deposits Source: Company financials as of 09/30/2018 Note: All dollars in millions * Loans and Deposits include Portland and Vancouver balances. 14

FUTURE GROWTH AND OPPORTUNITIES Pacific Northwest Banking Landscape Expected Consolidation and Future Opportunities • Significant number of banks remaining in HFWA footprint, further consolidation is expected - 12 banks between $200 and $500 million in assets - 5 banks between $500 million and $1.0 billion in assets - 7 banks between $1.0 billion and $2.0 billion in assets • HFWA positioned to be the acquiror of choice in the Pacific Northwest Bank Headquarters Note: Financial information as of the most recent quarter publicly available 15

FINANCIAL UPDATE 16

FINANCIAL UPDATE – Q3 2018 • Diluted earnings per share were $0.42 for the quarter, net of $0.07 per share impact from merger-related expenses and consultant agreement buyout • Return on average assets was 1.17%, return on average equity was 8.26% and return on tangible common equity was 12.77% • Regular dividend declared on October 24, 2018 of $0.17 per share and a special dividend of $0.10 per share • Net interest margin increased to 4.41% for the quarter from 3.86% for the same quarter in 2017 and 4.22% for the linked-quarter ended June 30, 2018 • On July 2, 2018 completed acquisition of Premier Commercial Bancorp, increasing total assets over $5 billion • Excluding the impact of $318.7 million in deposits obtained in the acquisition of Premier Commercial Bancorp, total deposits increased $110.5 million, or 11.1% on an annualized basis during the quarter Source: Company financials, as of 9/30/2018 17

BALANCE SHEET MIX Loan Portfolio (1) Deposit Base Total Asset Mix Cash and 1-4 Family Certificates Cash Consumer Other 2.6% of Deposits Equivalents 10.7% 10.8% Construction Owner- 11.5% Non-Interest 3.2% & Land Occupied Bearing Securities Development CRE Savings Demand 17.5% 6.3% 21.6% Accounts 29.8% 11.8% Commercial Money & Industrial Market Interest Nonowner- 23.6% Accounts Bearing Loans, net* Occupied 17.5% Transaction 68.5% CRE Accounts 35.2% 29.4% • 5.30% loan yield in Q3 2018 • 0.27% cost of total deposits in Q3 2018 • 83.0% loan / deposit ratio • 45.2% of loans are C&I and owner- • 88.5% of deposits are non-maturity • 20.7% of assets are cash and securities occupied CRE • $4.4 billion in total deposits • $3.6 billion in total loans* Source: Company financials, as of 09/30/2018 Note: All dollars in millions (1) As a percentage of gross loans receivable * Includes total loans receivable, net and loans held for sale 18

BALANCE SHEET TRENDS Loans* Deposits $4,000 6.00% $4,600 0.35% $3,651 $4,398 $3,500 $3,285 $3,332 $4,400 $3,000 $2,803 $2,851 $4,200 5.30% $3,969 0.25% 5.00% $4,000 $3,905 0.27% $2,500 5.05% 4.93% 4.91% $2,000 4.72% $3,800 0.23% 0.21% 0.20% 0.20% $1,500 $3,600 4.00% $3,393 0.15% $3,321 $1,000 $3,400 $3,200 $500 $3,000 0.05% $- 3.00% Q3 2017 Q4 2017 Q1 2018 Q2 2018 Q3 2018 Q3 2017 Q4 2017 Q1 2018 Q2 2018 Q3 2018 Total Deposits Cost of Total Deposits Total Loans* Loan Yield Investment Securities FHLB Advances $950 5.00% $140 5.00% $921 $117 $900 $874 $120 4.00% 4.00% $850 $822 $100 $93 $800 $811 3.00% $76 3.00% $800 2.43% 2.53% 2.58% $80 2.24% 2.29% 2.22% 2.04% $750 $60 2.00% 1.53% 1.70% 2.00% 1.38% $700 $40 $31 1.00% 1.00% $650 $20 $0 $600 0.00% $- 0.00% Q3 2017 Q4 2017 Q1 2018 Q2 2018 Q3 2018 Q3 2017 Q4 2017 Q1 2018 Q2 2018 Q3 2018 Total Investment Securities Yield on Securities** Total FHLB Advances Cost of FHLB Advances Source: Company financials, as of 09/30/2018 Note: End of period balance. All dollars in millions *Loans include loans receivable, net and loans held for sale 19 **Includes taxable and tax-exempt securities without adjustment for tax-equivalent basis

NET INTEREST MARGIN • Growing core net interest margin Net Interest Margin (Core vs. Accretion)* 5.00% 4.41% 4.12% 4.22% 4.03% 0.23% 3.85% 3.89% 3.92% 3.86% 4.00% 0.16% 0.19% 0.17% 0.14% 0.17% 0.11% 0.29% 3.00% 2.00% 3.96% 4.03% 4.18% 3.68% 3.75% 3.75% 3.75% 3.74% 1.00% 0.00% Q4 2016 Q1 2017 Q2 2017 Q3 2017 Q4 2017 Q1 2018 Q2 2018 Q3 2018 Core NIM Accretion* Source: Company financials, as of 09/30/2018 *Impact on net interest margin from incremental accretion on purchased loans 20

CORE DEPOSIT FRANCHISE • Low cost of deposits despite increases in Fed Funds Rate Deposit Mix Cost of Deposits vs. Fed Funds Rate • Non-Interest Bearing Demand: 19% CAGR • Total Deposits: 12% CAGR $4,500 2.50% 2.25% $4,000 2.25% 2.00% $3,500 2.00% $3,000 1.75% 1.75% $2,500 1.50% 1.50% $2,000 $1,500 1.25% $1,000 1.00% 0.75% $500 0.75% 0.50% $- 2015 2016 2017 Q1 Q2 Q3 0.50% 0.27% 2018 2018 2018 0.21% 0.23% 0.25% 0.18% 0.16% 0.18% CDs Savings Accounts 0.00% Money Market Accounts 2015 2016 2017 Q1 2018 Q2 2018 Q3 2018 Interest Bearing Demand Cost of Total Deposits Fed Funds Rate Non-Interest Bearing Demand Source: Company financials, as of 09/30/2018 21 Note: All dollars in thousands

PROFITABILITY TRENDS ROAA ROATCE 1.60% 17.50% 1.37% 14.89% 1.40% 15.00% 1.15% 1.18% 1.17% 12.87% 12.77% 1.20% 1.07% 12.34% 1.04% 1.05% 1.01% 12.50% 11.37% 10.85% 11.17% 10.99% 1.00% 0.81% 10.00% 8.70% 0.80% 7.50% 0.60% 0.40% 5.00% 0.20% 2.50% 0.00% 0.00% 2016 2017* Q1 2018* Q2 2018* Q3 2018* 2016 2017* Q1 2018* Q2 2018* Q3 2018* *Adjusted ROAA Reported ROAA *Adjusted ROATCE Reported ROAA Noninterest Expense / Avg. Assets Earnings per Share 3.75% $1.50 $1.41 $1.39 3.27% $1.30 3.25% 3.03% 2.98% 2.84% $1.25 2.80% 2.72% 2.78% 2.77% 2.74% 2.75% 2.64% $1.00 2.25% 1.75% $0.75 $0.49 1.25% $0.50 $0.41 $0.42 $0.38 $0.35 $0.27 0.75% $0.25 0.25% $- -0.25% 2016 2017* Q1 2018* Q2 2018* Q3 2018* 2016 2017* Q1 2018* Q2 2018* Q3 2018* **Adjusted NIE/Average Assets Reported NIE/Average Assets *Adjusted EPS Reported EPS Source: Company financials, as of 09/30/2018 Note: All dollars in thousands, except per share *Adjusted for merger-related expenses, consultant agreement buyout and CDI amortization expense. Refer to the Appendix for non-GAAP measures. **Adjusted for merger-related expenses, consultant agreement buyout and CDI amortization expense. Refer to the Appendix for non-GAAP measures. 22

CREDIT QUALITY TRENDS • Maintaining high standards for credit quality and a low ratio of NPAs / Assets Non-Performing Assets and Allowance for Loan Losses 1.60% 2.50% , , net 1.40% 2.00% 1.81% 1.20% 1.74% 1.68% 1.65% 1.60% 1.54% 1.00% 1.48% 1.40% 1.50% 1.34% 1.31% 0.80% 1.00% 0.60% NPAs NPAs / Assets 0.41% 0.40% 0.34% 0.35% 0.30% 0.30% 0.30% 0.29% 0.32% 0.28% 0.26% 0.50% 0.20% ALLL ALLL + Acquired Discounts / LoansReceivable 0.00% 0.00% Q2 Q3 Q4 Q1 Q2 Q3 Q4 Q1 Q2 Q3 2016 2016 2016 2017 2017 2017 2017 2018 2018 2018 NPAs / Assets ALLL+Discount/Loans Receivable, net Source: Company financials, as of 09/30/2018 Note: All dollars in thousands 23 Merger with Puget Sound Bancorp, Inc. closed during Q1 2018 and Premier Commercial Bancorp closed during Q3 2018
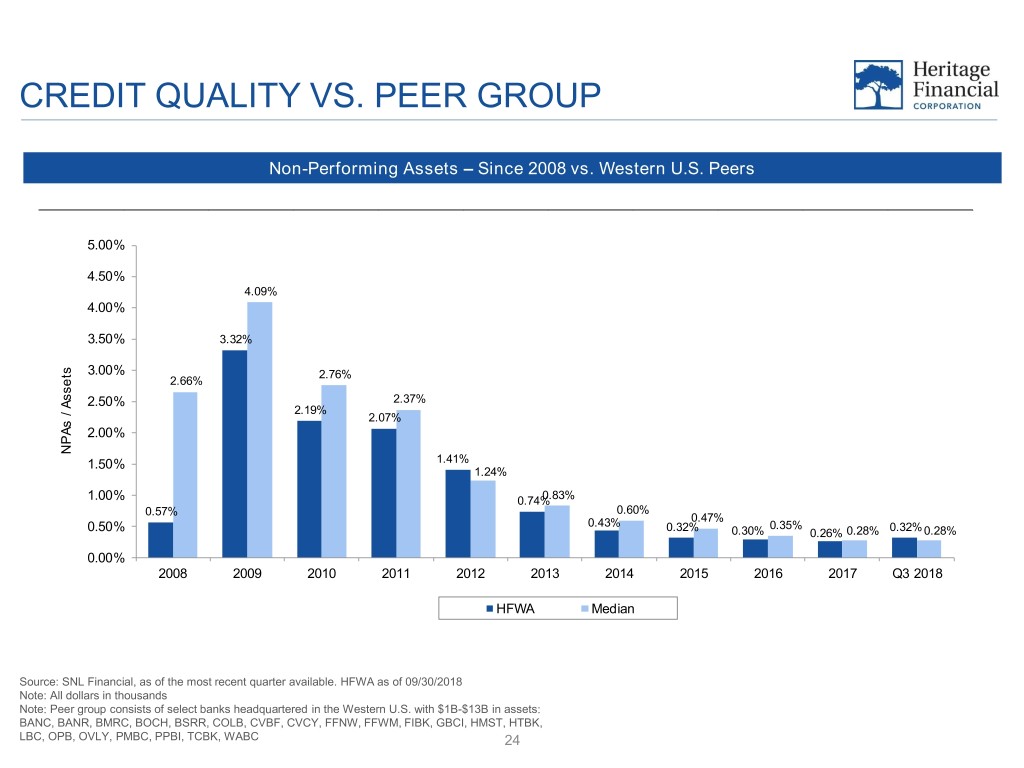
CREDIT QUALITY VS. PEER GROUP Non-Performing Assets – Since 2008 vs. Western U.S. Peers 5.00% 4.50% 4.09% 4.00% 3.50% 3.32% 3.00% 2.76% 2.66% 2.50% 2.37% 2.19% 2.07% 2.00% NPAs Assets / NPAs 1.50% 1.41% 1.24% 1.00% 0.74%0.83% 0.57% 0.60% 0.47% 0.43% 0.32% 0.35% 0.32% 0.50% 0.30% 0.26% 0.28% 0.28% 0.00% 2008 2009 2010 2011 2012 2013 2014 2015 2016 2017 Q3 2018 HFWA Median Source: SNL Financial, as of the most recent quarter available. HFWA as of 09/30/2018 Note: All dollars in thousands Note: Peer group consists of select banks headquartered in the Western U.S. with $1B-$13B in assets: BANC, BANR, BMRC, BOCH, BSRR, COLB, CVBF, CVCY, FFNW, FFWM, FIBK, GBCI, HMST, HTBK, LBC, OPB, OVLY, PMBC, PPBI, TCBK, WABC 24

CAPITAL RATIO TRENDS Tangible Common Equity Ratio Leverage Ratio 16.00% 16.00% 12.00% 12.00% 10.5% 10.4% 10.2% 10.4% 10.4% 10.4% 9.6% 9.7% 9.7% 9.6% 9.6% 9.5% 8.00% 8.00% 4.00% 4.00% 0.00% 0.00% Q2 2017 Q3 2017 Q4 2017 Q1 2018 Q2 2018 Q3 2018 Q2 2017 Q3 2017 Q4 2017 Q1 2018 Q2 2018 Q3 2018 Tier-1 Capital Ratio Risk Based Capital Ratio 20.00% 20.00% 16.00% 16.00% 13.1% 13.0% 12.8% 12.7% 12.6% 12.6% 12.1% 12.0% 11.8% 11.8% 11.7% 11.8% 12.00% 12.00% 8.00% 8.00% 4.00% 4.00% 0.00% 0.00% Q2 2017 Q3 2017 Q4 2017 Q1 2018 Q2 2018 Q3 2018 Q2 2017 Q3 2017 Q4 2017 Q1 2018 Q2 2018 Q3 2018 25 Source: Company financials, as of 09/30/2018

SHAREHOLDER RETURN 26
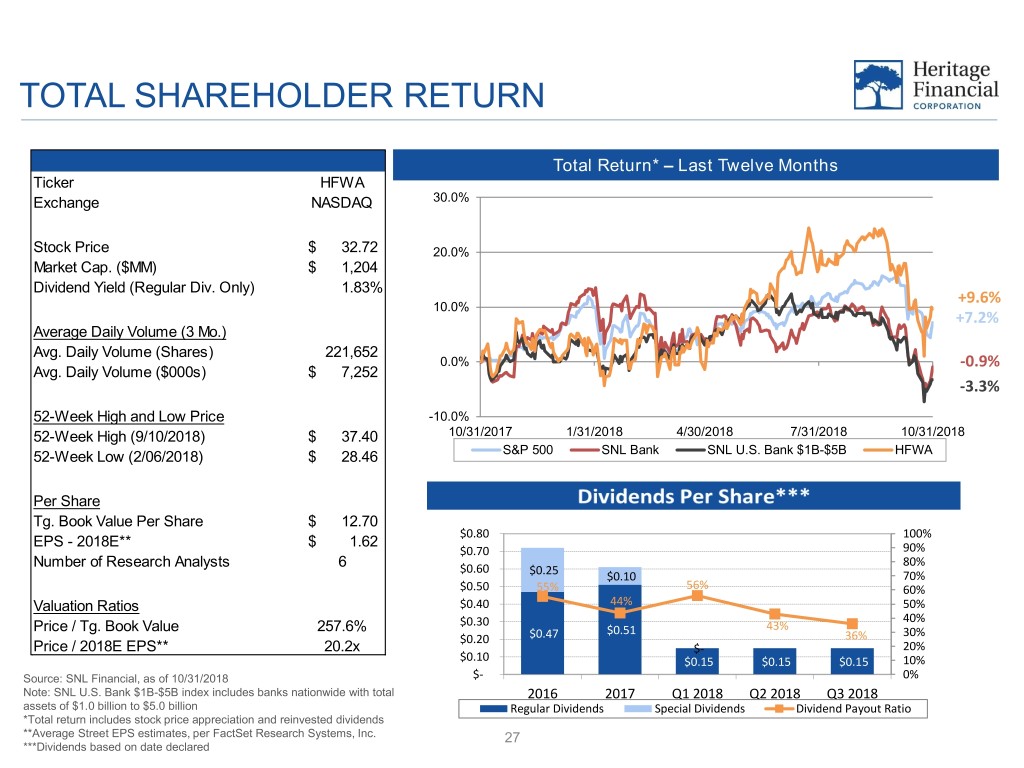
TOTAL SHAREHOLDER RETURN Total Return* – Last Twelve Months Ticker HFWA Exchange NASDAQ 30.0% Stock Price $ 32.72 20.0% Market Cap. ($MM) $ 1,204 Dividend Yield (Regular Div. Only) 1.83% +9.6% 10.0% +7.2% Average Daily Volume (3 Mo.) Avg. Daily Volume (Shares) 221,652 0.0% -0.9% Avg. Daily Volume ($000s) $ 7,252 -3.3% 52-Week High and Low Price -10.0% 52-Week High (9/10/2018) $ 37.40 10/31/2017 1/31/2018 4/30/2018 7/31/2018 10/31/2018 52-Week Low (2/06/2018) $ 28.46 S&P 500 SNL Bank SNL U.S. Bank $1B-$5B HFWA Per Share - - Tg. Book Value Per Share $ 12.70 Dividends Per Share*** $0.80 100% EPS - 2018E** $ 1.62 $0.70 90% 80% Number of Research Analysts 6 $0.60 $0.25 $0.10 70% $0.50 55% 56% 60% Valuation Ratios $0.40 44% 50% $0.30 40% Price / Tg. Book Value 257.6% $0.51 43% 30% $0.20 $0.47 36% Price / 2018E EPS** 20.2x $- 20% $0.10 $0.15 $0.15 $0.15 10% Source: SNL Financial, as of 10/31/2018 $- 0% Note: SNL U.S. Bank $1B-$5B index includes banks nationwide with total 2016 2017 Q1 2018 Q2 2018 Q3 2018 assets of $1.0 billion to $5.0 billion Regular Dividends Special Dividends Dividend Payout Ratio *Total return includes stock price appreciation and reinvested dividends **Average Street EPS estimates, per FactSet Research Systems, Inc. 27 ***Dividends based on date declared

SUPERIOR MARKET PERFORMANCE . Analysis for HFWA’s stock performance since the last 4 acquisitions – in each case, the shareholders of the acquired bank received better returns owning HFWA stock vs. the KBW Regional Bank Index Market Performance Price Performance Total Return* Announce KBW Regional HFWA vs. Acquisitions Date Bank Index HFWA Index HFWA Premier Commercial Bancorp 3/8/2018 -14.7% 5.6% 20.3% 6.5% Puget Sound Bancorp, Inc. 7/26/2017 -4.6% 20.9% 25.6% 24.1% Washington Banking Company 10/23/2013 35.5% 106.6% 71.1% 138.0% Valley Community Bancshares, Inc. 3/12/2013 65.4% 129.9% 64.5% 169.4% Since 2012 12/30/2011 101.1% 161.4% 60.3% 225.8% Premier Commercial Bancorp $40.00 Since Announcement HFWA: 5.6% KBW Reg'l Index: -14.7% $35.00 Stock Price: $31.10 $30.00 Valley Community Bancshares, Inc. $25.00 Since Announcement HFWA: 129.9% KBW Reg'l Index: 65.4% $20.00 Stock Price: $14.28 Puget Sound Bancorp, Inc. Since Announcement $15.00 HFWA: 20.9% Washington Banking Company KBW Reg'l Index: -4.6% Stock Price: $27.15 Since Announcement $10.00 HFWA: 106.6% KBW Reg'l Index: 35.5% Stock Price: $15.89 $5.00 2012 2013 2014 2015 2016 2017 2018 HFWA KBW Regional Bank Indexed to HFWA Source: S&P Global Market Intelligence, market data as of 10/30/2018 *Including dividends **Cash portion of consideration is held constant since announcement 28 ***Stock % of merger consideration at time of announcement

HISTORY OF GROWING DIVIDENDS • Quarterly cash dividend increased 15% year-over-year to $0.15 per share in Q3 2018 – Increased quarterly dividend seven times since 2013 – Paid a special dividend for eight consecutive years - - • Dividend yield of 2.20%* Quarterly Cash Dividends $0.40 $0.35 $0.30 $0.25 $0.25 $0.10 $0.20 $0.16 $0.10 $0.15 $0.10 $0.10 $0.15 $0.15 $0.15 $0.17 $0.12 $0.12 $0.12 $0.12 $0.13 $0.13 $0.13 $0.05 $0.09 $0.10 $0.11 $0.11 $0.11 $0.11 $- Q4 Q1 Q2 Q3 Q4 Q1 Q2 Q3 Q4 Q1 Q2 Q3 Q4 Q1 Q2 Q3 Q4 2014 2015 2015 2015 2015 2016 2016 2016 2016 2017 2017 2017 2017 2018 2018 2018 2018 Regular Dividends Special Dividends Source: SNL Financial, as of 10/31/2018 *Yield represents 2018 regular and special dividends and closing stock price on 10/31/18 of $32.72 29
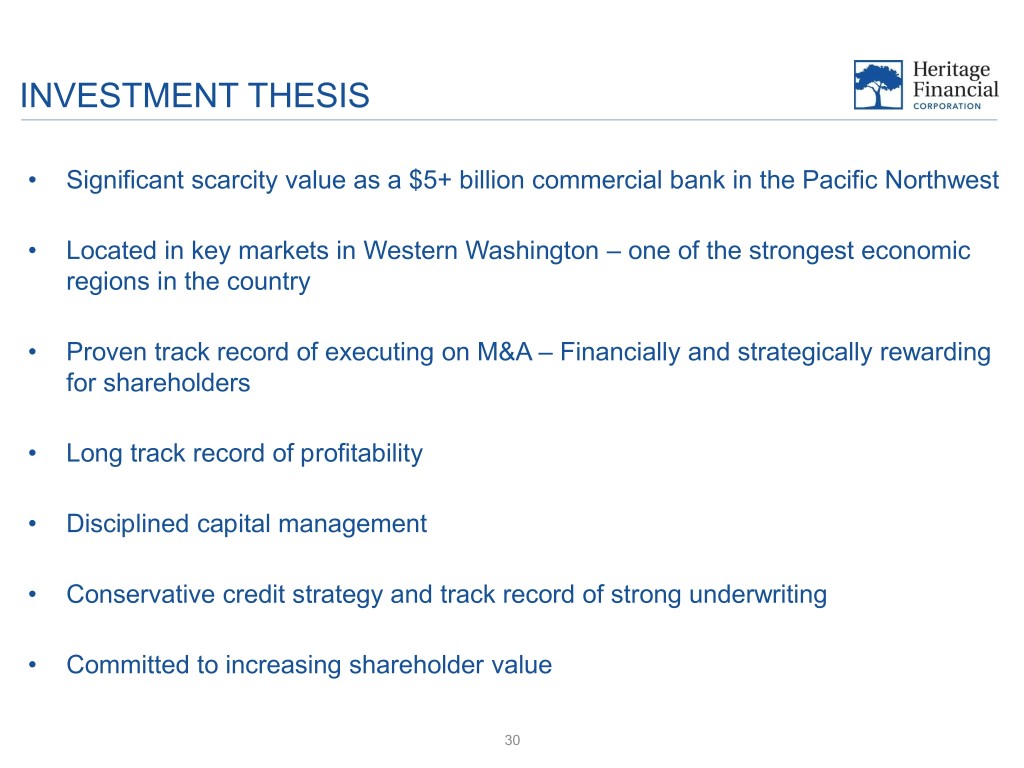
INVESTMENT THESIS • Significant scarcity value as a $5+ billion commercial bank in the Pacific Northwest • Located in key markets in Western Washington – one of the strongest economic regions in the country • Proven track record of executing on M&A – Financially and strategically rewarding for shareholders • Long track record of profitability • Disciplined capital management • Conservative credit strategy and track record of strong underwriting • Committed to increasing shareholder value 30

APPENDIX 31

NON-GAAP FINANCIAL MEASURES Adjusted NIE / Average Assets 2018 $ in thousands, except earnings per share 2016 2017 Q1 Q2 Q3 YTD Noninterest expense $ 106,473 $ 110,575 $ 36,747 $ 35,706 $ 39,597 $ 112,050 - Merger related expenses - (810) (4,808) (880) (3,402) (9,090) - Amortization of intangible assets (1,415) (1,286) (795) (796) (1,114) (2,705) - Consultant agreement buyout - - - (1,693) - (1,693) Adjusted noninterest expense 105,058 108,479 $ 31,144 $ 32,337 $ 35,081 $ 98,562 Average assets 3,745,535 3,981,352 4,553,585 4,726,719 5,278,505 4,855,592 NIE / average assets 2.84% 2.78% 3.27% 3.03% 2.98% 3.09% Adjusted NIE / average assets 2.80% 2.72% 2.77% 2.74% 2.64% 2.71% 32

NON-GAAP FINANCIAL MEASURES Adjusted Profitability Measures 2018 $ in thousands, except earnings per share 2017 Q1 Q2 Q3 YTD Net income $ 41,791 $ 9,087 $ 11,857 $ 15,504 $ 36,448 + Merger related expenses 810 4,808 880 3,402 9,090 + Consultant agreement buyout - 1,693 - 1,693 - Tax effect of adjustments (73) (1,010) (540) (714) (2,264) Adjusted net income 42,528 $ 12,885 $ 13,890 $ 18,192 $ 44,967 - Dividends and undistributed earnings allocated to participating securities (293) (51) (57) (48) (161) Adjusted net income allocated to common shareholders 42,235 12,834 13,833 18,144 44,806 Diluted wtd avg shares outstanding 29,849,331 33,348,102 34,107,292 36,963,244 34,820,602 Diluted earnings per share $ 1.39 $ 0.27 $ 0.35 $ 0.42 $ 1.04 Adjusted diluted earnings per share $ 1.41 $ 0.38 $ 0.41 $ 0.49 $ 1.29 Average assets 3,981,352 4,553,585 4,726,719 5,278,505 4,855,592 Return on average assets 1.05% 0.81% 1.01% 1.17% 1.00% Adjusted return on average assets 1.07% 1.15% 1.18% 1.37% 1.24% Avg shareholders' equity $ 499,776 $ 614,974 $ 636,735 $ 744,388 $ 665,840 - Avg intangibles (125,774) (191,335) (203,838) (262,644) (219,533) Avg tangible common equity 374,002 423,639 432,897 481,744 446,307 Return on avg tang common equity 11.17% 8.70% 10.99% 12.77% 10.92% Adjusted return on avg tang common eq 11.37% 12.34% 12.87% 14.98% 13.47% 33
