Attached files
| file | filename |
|---|---|
| 8-K - FORM 8-K - DENBURY INC | dnr-20181108x3q18earningsp.htm |

3Q18 Earnings Presentation & Penn Virginia Combination Update November 8, 2018 N Y S E : D N R w w w . d e n b u r y . c o m

Agenda ● Introduction — John Mayer, Director of Investor Relations ● Overview and Operational Update — Chris Kendall, President & Chief Executive Officer ● Financial Review — Mark Allen, Executive Vice President & Chief Financial Officer ● Denbury & Penn Virginia Combination Discussion — Chris Kendall, President & Chief Executive Officer N Y S E : D N R 2 w w w . d e n b u r y . c o m

Cautionary Statements No Offer or Solicitation This presentation relates in part to a proposed business combination transaction (the “Transaction”) between Denbury Resources Inc. (“Denbury”) and Penn Virginia Corporation (“Penn Virginia”). This communication is for informational purposes only and does not constitute an offer to sell or the solicitation of an offer to buy any securities or a solicitation of any vote or approval, in any jurisdiction, pursuant to the Transaction or otherwise, nor shall there be any sale, issuance, exchange or transfer of the securities referred to in this document in any jurisdiction in contravention of applicable law. No offer of securities shall be made except by means of a prospectus meeting the requirements of Section 10 of the Securities Act of 1933, as amended. Important Additional Information In connection with the Transaction, Denbury will file with the U.S. Securities and Exchange Commission (“SEC”) a registration statement on Form S-4, that will include a joint proxy statement of Denbury and Penn Virginia and a prospectus of Denbury. The Transaction will be submitted to Denbury’s stockholders and Penn Virginia’s stockholders for their consideration. Denbury and Penn Virginia may also file other documents with the SEC regarding the Transaction. The definitive joint proxy statement/prospectus will be sent to the stockholders of Denbury and shareholders of Penn Virginia. This document is not a substitute for the registration statement and joint proxy statement/prospectus that will be filed with the SEC or any other documents that Denbury or Penn Virginia may file with the SEC or send to stockholders of Denbury or Penn Virginia in connection with the Transaction. INVESTORS AND SECURITY HOLDERS OF DENBURY AND PENN VIRGINIA ARE URGED TO READ THE REGISTRATION STATEMENT AND THE JOINT PROXY STATEMENT/PROSPECTUS REGARDING THE TRANSACTION WHEN IT BECOMES AVAILABLE AND ALL OTHER RELEVANT DOCUMENTS THAT ARE FILED OR WILL BE FILED WITH THE SEC, AS WELL AS ANY AMENDMENTS OR SUPPLEMENTS TO THESE DOCUMENTS, CAREFULLY AND IN THEIR ENTIRETY BECAUSE THEY WILL CONTAIN IMPORTANT INFORMATION ABOUT THE TRANSACTION AND RELATED MATTERS. Investors and security holders will be able to obtain free copies of the registration statement and the joint proxy statement/prospectus (when available) and all other documents filed or that will be filed with the SEC by Denbury or Penn Virginia through the website maintained by the SEC at http://www.sec.gov. Copies of documents filed with the SEC by Denbury will be made available free of charge on Denbury’s website at www.denbury.com or by directing a request to John Mayer, Director of Investor Relations, Denbury Resources Corporation, 5320 Legacy Drive, Plano, TX 75024, Tel. No. (972) 673-2383. Copies of documents filed with the SEC by Penn Virginia will be made available free of charge on Penn Virginia’s website at www.pennvirginia.com, under the heading “SEC Filings,” or by directing a request to Investor Relations, Penn Virginia Corporation, 16285 Park Ten Place, Suite 500, Houston, TX 77084, Tel. No. (713) 722-6540. Participants in the Solicitation Denbury, Penn Virginia and their respective directors and executive officers may be deemed to be participants in the solicitation of proxies in respect to the Transaction. Information regarding Denbury’s directors and executive officers is contained in the proxy statement for Denbury’s 2018 Annual Meeting of Stockholders filed with the SEC on April 12, 2018, and certain of its Current Reports on Form 8-K. You can obtain a free copy of this document at the SEC’s website at http://www.sec.gov or by accessing Denbury’s website at www.denbury.com. Information regarding Penn Virginia’s executive officers and directors is contained in the proxy statement for Penn Virginia’s 2018 Annual Meeting of Stockholders filed with the SEC on March 28, 2018, and its Current Report on Form 8-K filed on September 12, 2018. You can obtain a free copy of this document at the SEC’s website at www.sec.gov or by accessing Penn Virginia’s website at www.pennvirginia.com. Investors may obtain additional information regarding the interests of those persons and other persons who may be deemed participants in the Transaction by reading the joint proxy statement/prospectus regarding the Transaction when it becomes available. You may obtain free copies of this document as described above. N Y S E : D N R 3 w w w . d e n b u r y . c o m

Cautionary Statements (Cont.) Forward-Looking Statements and Cautionary Statements: The following slides contains “forward-looking statements” within the meaning of Section 27A of the Securities Act of 1933 and Section 21E of the Securities Exchange Act of 1934. All statements, other than statements of historical fact, included in this communication that address activities, events or developments that Denbury or Penn Virginia expects, believes or anticipates will or may occur in the future are forward- looking statements. Words such as “estimate,” “project,” “predict,” “believe,” “expect,” “anticipate,” “potential,” “create,” “intend,” “could,” “may,” “foresee,” “plan,” “will,” “guidance,” “look,” “outlook,” “goal,” “future,” “assume,” “forecast,” “build,” “focus,” “work,” “continue” or the negative of such terms or other variations thereof and words and terms of similar substance used in connection with any discussion of future plans, actions, or events identify forward- looking statements. However, the absence of these words does not mean that the statements are not forward-looking. These forward-looking statements include, but are not limited to, statements regarding the advantages of the proposed Transaction, and conducting EOR in the Eagle Ford formations held by Penn Virginia, pro forma descriptions of the combined company and its operations, integration and transition plans, synergies, opportunities and anticipated future performance including Future years’ combined production levels, operating cash flow and development capital, the EOR potential in the Eagle Ford for recoverable reserve, EUR increases, EOR well capex and projected performance of EOR wells. There are a number of risks and uncertainties that could cause actual results to differ materially from the forward-looking statements included in this communication. These include the expected timing and likelihood of completion of the Transaction, including the timing, receipt and terms and conditions of any required governmental and regulatory approvals of the Transaction that could reduce anticipated benefits or cause the parties to abandon the Transaction, the ability to successfully integrate the businesses, the occurrence of any event, change or other circumstances that could give rise to the termination of the merger agreement, the possibility that stockholders of Denbury may not approve the issuance of new shares of common stock in the Transaction or the amendment of Denbury’s charter or that shareholders of Penn Virginia may not approve the merger agreement, the risk that the parties may not be able to satisfy the conditions to the Transaction in a timely manner or at all, the risk that any announcements relating to the Transaction could have adverse effects on the market price of Denbury’s common stock or Penn Virginia’s common stock, the risk that the Transaction and its announcement could have an adverse effect on Denbury’s and Penn Virginia’s operating results and businesses generally, or cause them to incur substantial costs, the risk that problems may arise in successfully integrating the businesses of the companies, which may result in the combined company not operating as effectively and efficiently as expected, the risk that the combined company may be unable to achieve synergies or it may take longer than expected to achieve those synergies and other important factors that could cause actual results to differ materially from those projected. All such factors are difficult to predict and are beyond Denbury’s or Penn Virginia’s control, including those detailed in Denbury’s annual reports on Form 10-K, quarterly reports on Form 10-Q and current reports on Form 8-K that are available on its website at www.denbury.com and on the SEC’s website at http://www.sec.gov, and those detailed in Penn Virginia’s annual reports on Form 10-K, quarterly reports on Form 10-Q and current reports on Form 8-K that are available on Penn Virginia’s website at www.pennvirginia.com and on the SEC’s website at http://www.sec.gov. All forward-looking statements are based on assumptions that Denbury or Penn Virginia believe to be reasonable but that may not prove to be accurate. Any forward-looking statement speaks only as of the date on which such statement is made, and Denbury and Penn Virginia undertake no obligation to correct or update any forward-looking statement, whether as a result of new information, future events or otherwise, except as required by applicable law. Readers are cautioned not to place undue reliance on these forward-looking statements that speak only as of the date hereof. Statement Regarding Non-GAAP Financial Measures: This presentation also contains certain non-GAAP financial measures including adjusted cash flows from operations and adjusted EBITDAX. Any non-GAAP measure included herein is accompanied by a reconciliation to the most directly comparable U.S. GAAP measure along with a statement on why the Company believes the measure is beneficial to investors, which statements are included at the end of this presentation. Note to U.S. Investors: Current SEC rules regarding oil and gas reserves information allow oil and gas companies to disclose in filings with the SEC not only proved reserves, but also probable and possible reserves that meet the SEC’s definitions of such terms. We disclose only proved reserves in our filings with the SEC. Denbury’s proved reserves as of December 31, 2016 and December 31, 2017 were estimated by DeGolyer and MacNaughton, an independent petroleum engineering firm. In this presentation, we may make reference to probable and possible reserves, some of which have been estimated by our independent engineers and some of which have been estimated by Denbury’s internal staff of engineers. In this presentation, we also may refer to estimates of original oil in place, resource or reserves “potential,” barrels recoverable, “risked” and “unrisked” resource potential, estimated ultimate recovery (EUR) or other descriptions of volumes potentially recoverable, which in addition to reserves generally classifiable as probable and possible (2P and 3P reserves), include estimates of resources that do not rise to the standards for possible reserves, and which SEC guidelines strictly prohibit us from including in filings with the SEC. These estimates, as well as the estimates of probable and possible reserves, are by their nature more speculative than estimates of proved reserves and are subject to greater uncertainties, and accordingly the likelihood of recovering those reserves is subject to substantially greater risk. N Y S E : D N R 4 w w w . d e n b u r y . c o m

Overview & Operational Update Chris Kendall N Y S E : D N R 5 w w w . d e n b u r y . c o m

Operating Margin Improvement 88% of oil price change contributed to higher Operating Margin $69.73 $66.57 Revenue per BOE(1) $46.67 $39.04 $40.76 Operating Margin per BOE(2) $20.38 Marketing, Transportation and Taxes $5.07 $6.19 $6.47 Lifting Cost per BOE $22.50 $21.22 $21.34 3Q17 2Q18 3Q18 Revenue per BOE(1) $46.67 $66.57 $69.73 Lifting Cost per BOE $21.22 $21.34 $22.50 Marketing, Transportation and Taxes per BOE $5.07 $6.19 $6.47 Operating Margin per BOE(2) $20.38 $39.04 $40.76 1) Revenues exclude gain/loss on derivative settlements. 2) Operating margin calculated as revenues less lifting cost, marketing, transportation and taxes. N Y S E : D N R 6 w w w . d e n b u r y . c o m
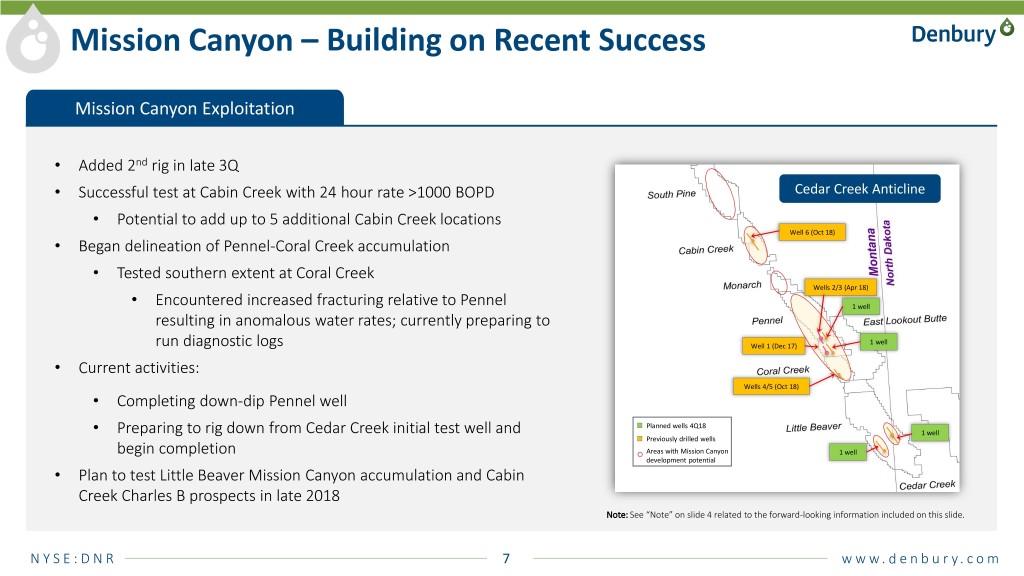
Mission Canyon – Building on Recent Success Mission Canyon Exploitation • Added 2nd rig in late 3Q • Successful test at Cabin Creek with 24 hour rate >1000 BOPD Cedar Creek Anticline • Potential to add up to 5 additional Cabin Creek locations Well 6 (Oct 18) • Began delineation of Pennel-Coral Creek accumulation • Tested southern extent at Coral Creek Wells 2/3 (Apr 18) • Encountered increased fracturing relative to Pennel 1 well resulting in anomalous water rates; currently preparing to 1 well run diagnostic logs Well 1 (Dec 17) • Current activities: Wells 4/5 (Oct 18) • Completing down-dip Pennel well Planned wells 4Q18 • Preparing to rig down from Cedar Creek initial test well and 1 well Previously drilled wells begin completion Areas with Mission Canyon 1 well development potential • Plan to test Little Beaver Mission Canyon accumulation and Cabin Creek Charles B prospects in late 2018 Note: See “Note” on slide 4 related to the forward-looking information included on this slide. N Y S E : D N R 7 w w w . d e n b u r y . c o m

Production by Area & 2018 Guidance Average Daily Production (BOE/d) 2018 Production Guidance (BOE/d) Field 3Q18 2Q18 3Q17 YTD 2018 Delhi 4,383 4,391 4,619 4,315 Hastings 5,486 5,716 4,867 5,634 Heidelberg 4,376 4,330 4,927 4,384 60,100 - 60,600 Oyster Bayou 4,578 4,961 4,870 4,863 59,181 Tinsley 5,294 5,755 6,506 5,698 Bell Creek 3,970 4,010 3,406 4,010 Salt Creek 2,274 2,049 2,228 2,109 Other tertiary 246 142 19 149 Mature area(1) 6,612 6,725 6,893 6,687 Total tertiary production 37,219 38,079 38,335 37,849 Gulf Coast non-tertiary 5,992 6,236 5,394 5,975 Cedar Creek Anticline 14,208 15,742 14,535 14,795 Other Rockies non-tertiary 1,409 1,490 1,514 1,461 Total non-tertiary production 21,609 23,468 21,443 22,231 Total continuing production 58,828 61,547 59,778 60,080 Property divestiture(2) 353 447 550 420 3Q18 2018E Total production 59,181 61,994 60,328 60,500 1) Mature area includes Brookhaven, Cranfield, Eucutta, Little Creek, Mallalieu, Martinville, McComb, and Soso fields. 2) Includes tertiary and non-tertiary production from Lockhart Crossing Field, which closed in the third quarter of 2018. N Y S E : D N R 8 w w w . d e n b u r y . c o m

Analysis of Total Operating Costs Total Operating Costs $ per BOE 3Q18 2Q18 3Q17 YTD 2018 ($MM) ($/BOE) ($MM) ($/BOE) ($MM) ($/BOE) ($MM) ($/BOE) CO2 Costs $14 $2.63 $16 $2.92 $18 $3.22 $48 $2.88 Power & Fuel 34 6.31 35 6.19 34 6.18 106 6.39 Labor & Overhead 38 6.99 37 6.47 35 6.24 109 6.61 Repairs & Maintenance 6 1.09 5 0.91 4 0.76 15 0.93 Chemicals 6 1.17 6 1.05 6 1.01 18 1.07 Workovers 17 3.20 12 2.21 13 2.26 45 2.74 Other 8 1.11 9 1.59 5 1.07 20 1.25 Total Normalized LOE $123 $22.50 $120 $21.34 $115 $20.74 $361 $21.87 Special or Unusual Items(1) — — — — 3 0.48 — — Total LOE $123 $22.50 $120 $21.34 $118 $21.22 $361 $21.87 1) Special or unusual items consist of cleanup and repair costs associated with Hurricane Harvey ($3MM) in 3Q17. N Y S E : D N R 9 w w w . d e n b u r y . c o m
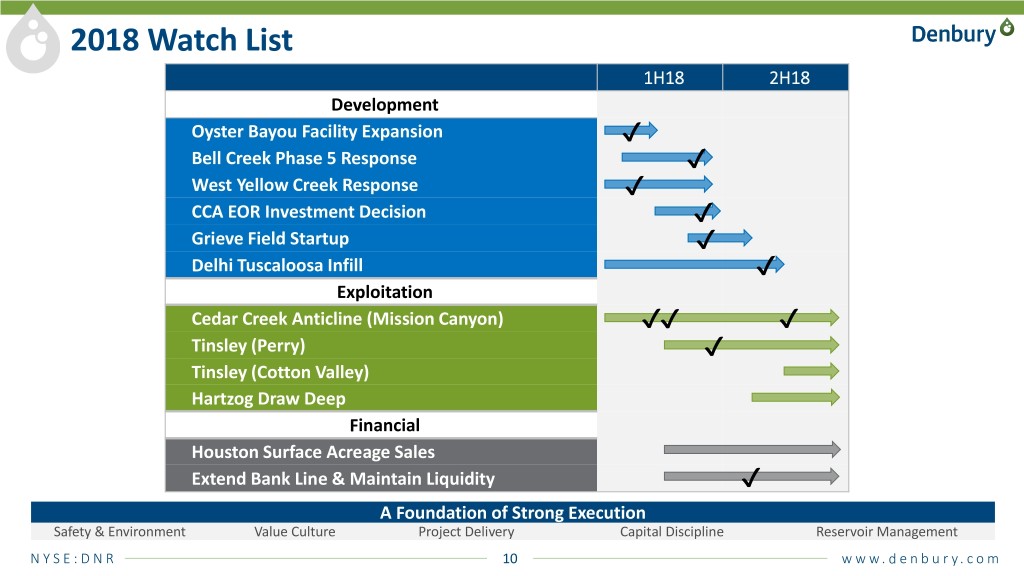
2018 Watch List 1H18 2H18 Development Oyster Bayou Facility Expansion ✔ Bell Creek Phase 5 Response ✔ West Yellow Creek Response ✔ CCA EOR Investment Decision ✔ Grieve Field Startup ✔ Delhi Tuscaloosa Infill ✔ Exploitation Cedar Creek Anticline (Mission Canyon) ✔✔ ✔ Tinsley (Perry) ✔ Tinsley (Cotton Valley) Hartzog Draw Deep Financial Houston Surface Acreage Sales Extend Bank Line & Maintain Liquidity ✔ A Foundation of Strong Execution Safety & Environment Value Culture Project Delivery Capital Discipline Reservoir Management N Y S E : D N R 10 w w w . d e n b u r y . c o m

Financial Review Mark Allen N Y S E : D N R 11 w w w . d e n b u r y . c o m

Recent Debt Transactions Further Improve Leverage Profile Net Debt Principal Reduction Since 12/31/14 9/30/18 Debt Maturity Profile (In millions) RECENT TRANSACTIONS (In millions) Over $1 Billion Net Debt Reduction » Amended and Extended Bank Credit $553 million of bank line Facility to Dec. 2021 availability at 9/30/18 after LOCs $3,548 » Issued $450 million of New 7½% Sr. $395 Secured 2nd Lien Notes; Proceeds Used to Fully Repay Credit Facility $324 $2,514 $2,475 $204 $194 ACCOMPLISHMENTS $415 $315 $202 » Extended Credit Facility Maturity to Dec. 2021 and Streamlined Bank $1,521 Group $2,852 $1,071 » Extended Overall Debt Maturity $615 Profile $456 $450 $308 $826 $826 » Maintained Same Access to $(23) $- $(67) Liquidity, $615 Million Undrawn Credit Facility 12/31/14 6/30/18 9/30/18 2018 2019 2020 2021 2022 2023 2024 Sr. Secured Bank Credit Facility Cash & Cash Equivalents Pipeline / Capital Lease Debt Sr. Subordinated Notes Sr. Secured 2nd Lien Notes N Y S E : D N R 12 w w w . d e n b u r y . c o m
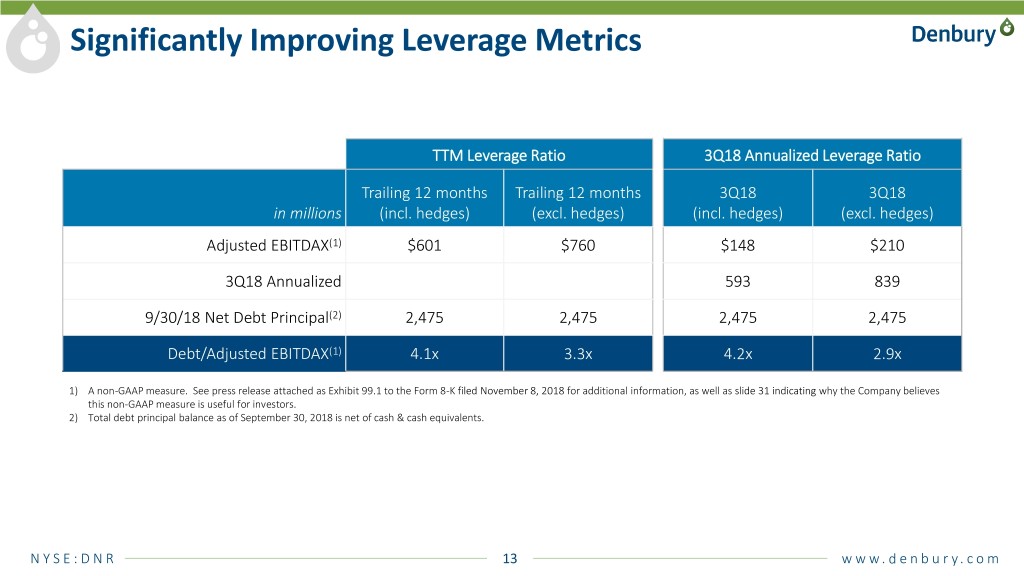
Significantly Improving Leverage Metrics TTM Leverage Ratio 3Q18 Annualized Leverage Ratio Trailing 12 months Trailing 12 months 3Q18 3Q18 in millions (incl. hedges) (excl. hedges) (incl. hedges) (excl. hedges) Adjusted EBITDAX(1) $601 $760 $148 $210 3Q18 Annualized 593 839 9/30/18 Net Debt Principal(2) 2,475 2,475 2,475 2,475 Debt/Adjusted EBITDAX(1) 4.1x 3.3x 4.2x 2.9x 1) A non-GAAP measure. See press release attached as Exhibit 99.1 to the Form 8-K filed November 8, 2018 for additional information, as well as slide 31 indicating why the Company believes this non-GAAP measure is useful for investors. 2) Total debt principal balance as of September 30, 2018 is net of cash & cash equivalents. N Y S E : D N R 13 w w w . d e n b u r y . c o m

NYMEX Oil Differential Summary Another quarter of company-wide positive differential to NYMEX NYMEX Oil Differentials $ per barrel 2Q17 3Q17 4Q17 1Q18 2Q18 3Q18 Tertiary oil fields $(1.07) $(0.21) $2.27 $1.61 $0.54 $2.37 Gulf Coast region (1.01) (0.10) 2.84 1.87 0.85 3.01 Rocky Mountain region (1.75) (0.83) (1.09) 0.22 (1.10) (0.86) Cedar Creek Anticline (1.93) (0.96) (0.57) (0.11) (0.67) (0.31) Denbury totals $(1.16) $(0.34) $1.70 $1.29 $0.39 $1.84 During 3Q18, ~60% of our crude oil was based on, or partially tied to, the LLS index price N Y S E : D N R 14 w w w . d e n b u r y . c o m

Hedge Positions – as of November 7, 2018 2018 2019 2020 Detail as of November 7, 2018 2H 1H 2H 1H 2H Volumes Hedged (Bbls/d) 15,500 ─ ─ ─ ─ (1) WTI Swap Price $50.13 ─ ─ ─ ─ NYMEX Volumes Hedged (Bbls/d) 5,000 3,500 ─ ─ ─ Swap Price(1) $56.54 $59.05 ─ ─ ─ Volumes Hedged (Bbls/d) 5,000 4,000 4,000 ─ ─ Fixed Price Swaps Price Fixed Argus LLS Swap Price(1) $60.18 $71.40 $71.40 ─ ─ Volumes Hedged (Bbls/d) 15,000 8,500 12,000 ─ ─ (1)(2) WTI Sold Put Price/Floor Price/Ceiling Price $36.50/$46.50/$53.88 $47/$55/$66.71 $47/$55/$66.23 ─ ─ NYMEX Volumes Hedged (Bbls/d) ─ 10,000 10,000 1,000 1,000 Sold Put Price/Floor Price/Ceiling Price(1)(2) ─ $50.40/$58.40/$72.69 $50.40/$58.40/$72.69 $50/$60/$82.50 $50/$60/$82.50 Volumes Hedged (Bbls/d) ─ 3,000 3,000 Way Collars Way - 3 (1)(2) Argus Sold Put Price/Floor Price/Ceiling Price ─ $54/$62/$78.50 $54/$62/$78.50 LLS Volumes Hedged (Bbls/d) ─ 2,500 2,500 1,000 1,000 Sold Put Price/Floor Price/Ceiling Price(1)(2) ─ $55.60/$64.40/$81.65 $55.60/$64.40/$81.65 $55/$65/$86.80 $55/$65/$86.80 Total Volumes Hedged 40,500 31,500 31,500 2,000 2,000 1) Averages are volume weighted. 2) If oil prices were to average less than the sold put price, receipts on settlement would be limited to the difference between the floor price and sold put price. N Y S E : D N R 15 w w w . d e n b u r y . c o m
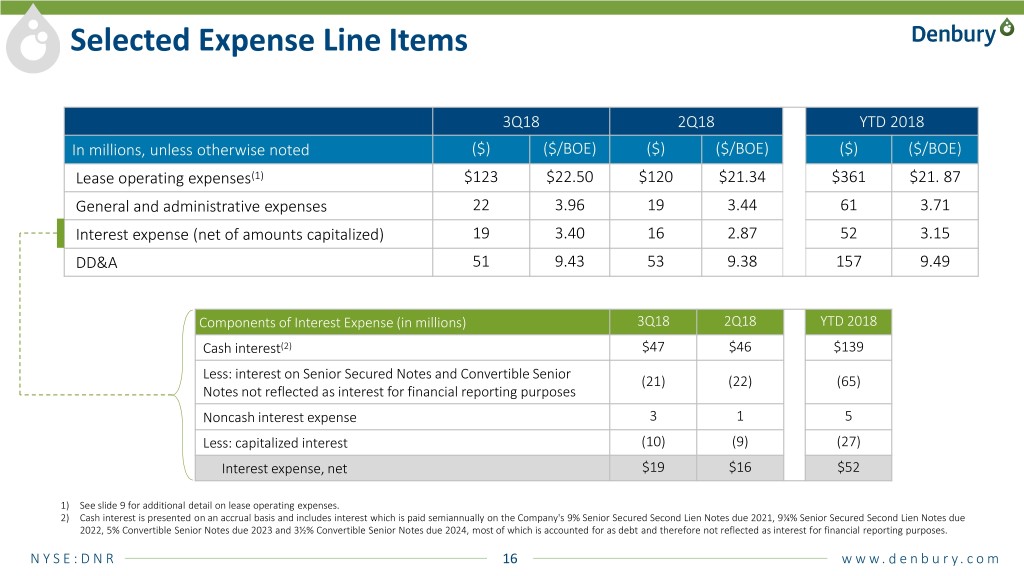
Selected Expense Line Items 3Q18 2Q18 YTD 2018 In millions, unless otherwise noted ($) ($/BOE) ($) ($/BOE) ($) ($/BOE) Lease operating expenses(1) $123 $22.50 $120 $21.34 $361 $21. 87 General and administrative expenses 22 3.96 19 3.44 61 3.71 Interest expense (net of amounts capitalized) 19 3.40 16 2.87 52 3.15 DD&A 51 9.43 53 9.38 157 9.49 Components of Interest Expense (in millions) 3Q18 2Q18 YTD 2018 Cash interest(2) $47 $46 $139 Less: interest on Senior Secured Notes and Convertible Senior (21) (22) (65) Notes not reflected as interest for financial reporting purposes Noncash interest expense 3 1 5 Less: capitalized interest (10) (9) (27) Interest expense, net $19 $16 $52 1) See slide 9 for additional detail on lease operating expenses. 2) Cash interest is presented on an accrual basis and includes interest which is paid semiannually on the Company's 9% Senior Secured Second Lien Notes due 2021, 9¼% Senior Secured Second Lien Notes due 2022, 5% Convertible Senior Notes due 2023 and 3½% Convertible Senior Notes due 2024, most of which is accounted for as debt and therefore not reflected as interest for financial reporting purposes. N Y S E : D N R 16 w w w . d e n b u r y . c o m

Denbury & Penn Virginia Combination Discussion Chris Kendall N Y S E : D N R 17 w w w . d e n b u r y . c o m

The Combination of Denbury & Penn Virginia Rocky Mountain A Unique Energy Business Region • Meaningful production growth while generating significant Combined Pro Forma free cash flow Highlights • Balanced blend of enhanced oil recovery (EOR), conventional 3Q18 Production and oil rich shale assets 82 MBOE/d • Industry leader in EOR 91% Oil Sustained Growth with Upside YE17 Proved O&G Reserves • Large inventory of short-cycle Eagle Ford locations 343 MMBOE • Significant EOR potential, including opportunity to expand Gulf Coast EOR platform to Eagle Ford Region Plano HQ Enhanced Financial Strength Penn Virginia • Top tier operating margins Acreage • Decreased leverage reduces long-term cost of capital • Free cash flow profile provides capital utilization optionality Denbury Owned Fields Current Pipelines CO2 Sources Planned Pipelines N Y S E : D N R 18 w w w . d e n b u r y . c o m

Up to 140 MMBO EOR Potential on PVAC Acreage Significantly de-risked through more than 25 projects covering ~200 wells Gonzales County EOR focus with 12 projects • Successful peer projects immediately offsetting PVA acreage, focused on oil window EOR Projects • Projected EUR increases of 30% – 70+% over primary recovery • Potential 60 MMBO to 140 MMBO recoverable through EOR on PVAC acreage Currently estimated $1-1.5MM aggregated EOR capex per well EOR process proven to be commercial, optimization opportunities still abundant N Y S E : D N R 19 w w w . d e n b u r y . c o m

Applying Leading EOR Capabilities to the Eagle Ford Gonzales County Pilot Primary and EOR Oil Production 14,000 EOR Production The EOR Process EOR Forecast 12,000 Primary Production • Primary forecast Rich hydrocarbon gas or CO2 is injected into a producing well and is 10,000 allowed to soak for a period before the well is returned to production 8,000 • While all projects to date have used rich hydrocarbon gas, 6,000 simulation work indicates that CO2 should provide greater recovery 4,000 • Planning to conduct both CO and rich hydrocarbon gas pilots bopd Wells), (9 Rate Oil Gross 2 2,000 • For example, a 1-2 month injection period could be followed by several - weeks of soaking and then a 2-4 month producing period 2012 2014 2016 2018 2020 2022 2024 2026 2028 Gonzales County EOR Pilot • The cycle is repeated over multiple years until incremental recovery Primary and EOR Recovery reaches an economic limit 9,000 8,000 7,000 Oil production in enhanced through several processes 3.3 MMBO 6,000 66% incremental • Injected gas provides lift energy to depleted wells 5,000 MBbls 4,000 • The gas is miscible with oil, reducing viscosity and swelling the oil 3,000 • Gas will adsorb onto the shale that it contacts, expelling oil from the 2,000 shale 1,000 - 2010 2012 2014 2016 2018 2020 2022 2024 2026 2028 N Y S E : D N R 20 w w w . d e n b u r y . c o m

Eagle Ford is Ideally Suited for EOR Penn Virginia’s Drivers of EOR Niobrara Bakken Permian Eagle Ford ✓ ✓ Completion Complexity & Contact Area for Miscible Gas 2,500 lb/ft fracs 1,200 lb/ft fracs 1,500 lb/ft fracs 2,000 lb/ft fracs ✓ Geology Homogenous Fractured Sandstone Heterogenous ✓ Horizontal Gas Containment Low Permeability Medium High Permeability Medium/High Permeability Permeability Vertical Gas Containment ✓ Play Maturity ✓ ✓ Industry EOR Development ✓ N Y S E : D N R 21 w w w . d e n b u r y . c o m
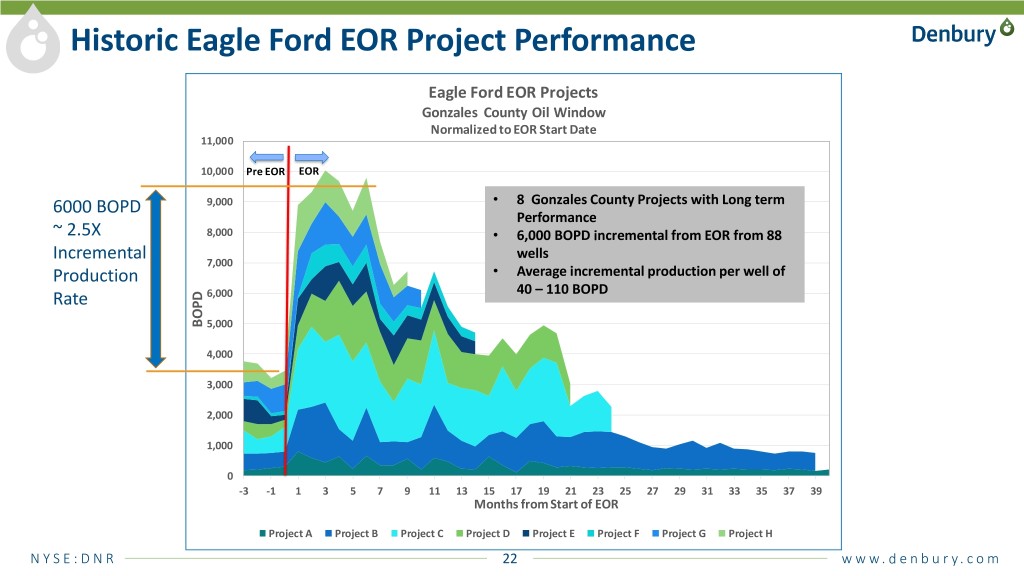
Historic Eagle Ford EOR Project Performance Eagle Ford EOR Projects Gonzales County Oil Window Normalized to EOR Start Date 11,000 10,000 Pre EOR EOR 6000 BOPD 9,000 • 8 Gonzales County Projects with Long term Performance ~ 2.5X 8,000 • 6,000 BOPD incremental from EOR from 88 Incremental wells 7,000 Production • Average incremental production per well of 40 – 110 BOPD Rate 6,000 BOPD 5,000 4,000 3,000 2,000 1,000 0 -3 -1 1 3 5 7 9 11 13 15 17 19 21 23 25 27 29 31 33 35 37 39 Months from Start of EOR Project A Project B Project C Project D Project E Project F Project G Project H N Y S E : D N R 22 w w w . d e n b u r y . c o m
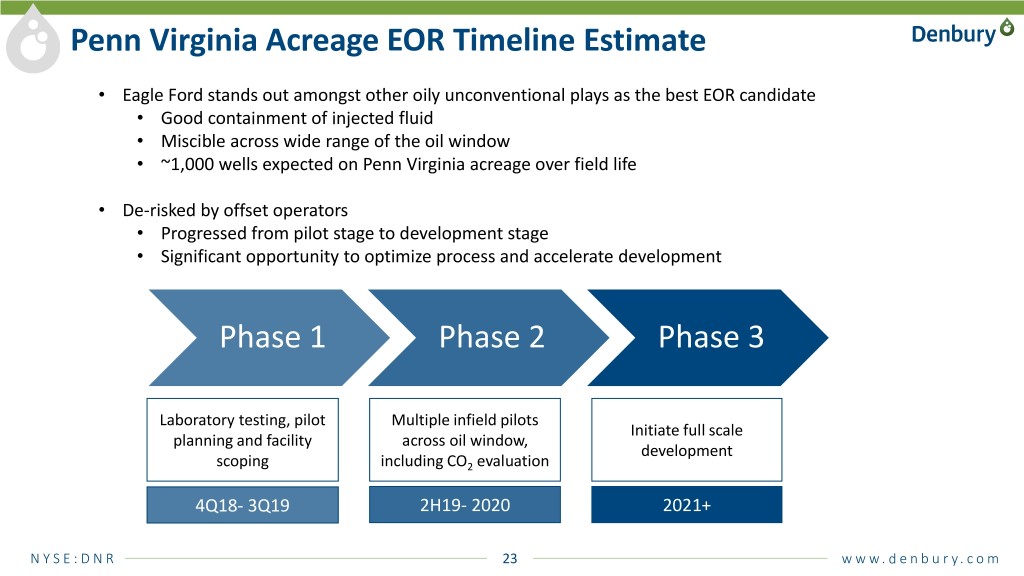
Penn Virginia Acreage EOR Timeline Estimate • Eagle Ford stands out amongst other oily unconventional plays as the best EOR candidate • Good containment of injected fluid • Miscible across wide range of the oil window • ~1,000 wells expected on Penn Virginia acreage over field life • De-risked by offset operators • Progressed from pilot stage to development stage • Significant opportunity to optimize process and accelerate development Phase 1 Phase 2 Phase 3 Laboratory testing, pilot Multiple infield pilots Initiate full scale planning and facility across oil window, development scoping including CO2 evaluation 4Q18- 3Q19 2H19- 2020 2021+ N Y S E : D N R 23 w w w . d e n b u r y . c o m

Preliminary Combined Pro Forma Estimates Average Daily Production (BOE/d) 104,000 – 112,000 Estimates thru 2020 assuming $60 – $70 WTI oil price 92,000 – 100,000 82,600 – 83,600 • >10% annual production growth • 85% – 90% oil production mix Estimated 2018 Estimated 2019 Estimated 2020 • Top-tier operating margins Operating Cash Flow(1) (in billions) • Significant free cash flow generation $1.0 – $1.4 $0.9 – $1.2 • Targeting ~2.0x or lower Debt / EBITDAX by end of 2020 ~$0.7 • 2019 capital assumes ~$150 MM for CCA pipeline Estimated 2018 Estimated 2019 Estimated 2020 1) Cash flow before working capital, net of ~$85 million interest treated as debt in Denbury’s financial statements, and excluding (2) transaction costs. Development Capital 2) Excludes capitalized interest and acquisitions/divestitures. (in billions) Note: The preliminary combined pro forma estimates are estimates based on assumptions that Denbury deems $0.9 – $1.0 reasonable as of the date of this presentation. However, such assumptions are inherently uncertain and difficult or $0.7 – $0.8 impossible to predict or estimate and many of them are beyond Denbury’s control. The preliminary combined pro ~$0.7 forma estimates also reflect assumptions regarding the continuing nature of certain business decisions that, in reality, would be subject to change. Future results of Denbury or Penn Virginia may differ, possibly materially, from the preliminary combined pro forma estimates. Estimated 2018 Estimated 2019 Estimated 2020 N Y S E : D N R 24 w w w . d e n b u r y . c o m

Uncommon Company, Extraordinary Potential ✓ – Enhanced with Penn Virginia Combination » Industry Leading Oil Weighting ✓ Extreme Oil Gearing » Favorable Crude Quality & High Exposure to LLS Pricing » Top Tier Operating Margin & Significant Free Cash Flow » Blend of EOR, Conventional and Oil-rich Shale Assets ✓ Operating Advantages » Broad EOR experience base and technical strength » Vertically Integrated CO2 Supply and Infrastructure » Operating Outside Constrained Basins Significant Organic » Meaningful Production Growth ✓ » Large Inventory of Short-Cycle Eagle Ford Locations Growth Potential » Significant EOR Development Potential » Strong Liquidity ✓ Rapidly De-Levering » Enhanced Credit Profile » No Near-Term Debt Maturities N Y S E : D N R 25 w w w . d e n b u r y . c o m

Q&A N Y S E : D N R 26 w w w . d e n b u r y . c o m

Appendix N Y S E : D N R 27 w w w . d e n b u r y . c o m

Reconciliation of Adjusted Net Income Reconciliation of Net Income (GAAP Measure) to Adjusted Net Income (Non-GAAP Measure)(1) 3Q18 2Q18 YTD 2018 Per Diluted Per Diluted Per Diluted In millions, except per-share data Amount Amount Amount Share Share Share Net income (GAAP measure) $78 $0.17 $30 $0.07 $148 $0.33 Adjustments to reconcile to adjusted net income (non-GAAP measure) Noncash fair value adjustments on commodity derivatives (17) (0.04) 41 0.09 40 0.09 Other adjustments 1 0.00 0 0.00 4 0.01 Estimated income taxes on above adjustments to net income and other discrete tax items (3) 0.00 (10) (0.03) (18) (0.05) Adjusted net income (non-GAAP measure)(1) $59 $0.13 $61 $0.13 $174 $0.38 Weighted-average shares outstanding Basic 451.3 433.5 426.0 Diluted 458.5 457.2 455.9 1) See press release attached as exhibit 99.1 to the Form 8-K filed November 8, 2018 for additional information indicating why the Company believes this non-GAAP measure is useful for investors. N Y S E : D N R 28 w w w . d e n b u r y . c o m

3Q18 Selected Financial Highlights In millions 3Q18 2Q18 YTD 2018 Reconciliation of Cash Flows from Operations (GAAP Measure) to Adjusted Cash Flows from Operations (Non-GAAP Measure)(1) Cash flows from operations (GAAP measure) $148 $154 $394 Net change in assets and liabilities relating to operations (13) (20) 0 Adjusted cash flows from operations (non-GAAP measure)(1) $135 $134 394 Interest payments treated as debt reduction (22) (21) (65) Adjusted cash flows from operations less interest treated as debt reduction (non-GAAP measure)(1) $113 $113 $329 Revenues and Commodity Derivative Settlements Revenues $388 $382 $1,118 Payment on settlements of commodity derivatives (62) (55) (150) Revenues and commodity derivative settlements combined $326 $327 $968 Realized Oil Prices Average realized oil price per barrel (excluding derivative settlements) $71.44 $68.24 $67.99 Average realized oil price per barrel (including derivative settlements) $59.78 $58.23 $58.63 1) A non-GAAP measure. See press release attached as exhibit 99.1 to the Form 8-K filed November 8, 2018 for additional information indicating why the Company believes this non-GAAP measure is useful for investors. N Y S E : D N R 29 w w w . d e n b u r y . c o m
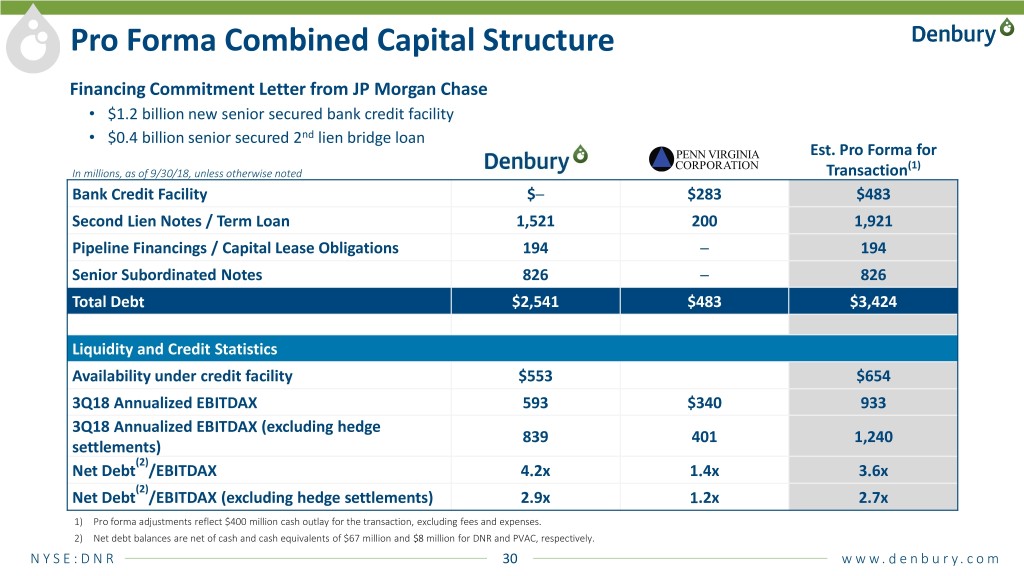
Pro Forma Combined Capital Structure Financing Commitment Letter from JP Morgan Chase • $1.2 billion new senior secured bank credit facility • $0.4 billion senior secured 2nd lien bridge loan Est. Pro Forma for (1) In millions, as of 9/30/18, unless otherwise noted Transaction Bank Credit Facility $─ $283 $483 Second Lien Notes / Term Loan 1,521 200 1,921 Pipeline Financings / Capital Lease Obligations 194 ─ 194 Senior Subordinated Notes 826 ─ 826 Total Debt $2,541 $483 $3,424 Liquidity and Credit Statistics Availability under credit facility $553 $654 3Q18 Annualized EBITDAX 593 $340 933 3Q18 Annualized EBITDAX (excluding hedge 839 401 1,240 settlements) (2) Net Debt /EBITDAX 4.2x 1.4x 3.6x (2) Net Debt /EBITDAX (excluding hedge settlements) 2.9x 1.2x 2.7x 1) Pro forma adjustments reflect $400 million cash outlay for the transaction, excluding fees and expenses. 2) Net debt balances are net of cash and cash equivalents of $67 million and $8 million for DNR and PVAC, respectively. N Y S E : D N R 30 w w w . d e n b u r y . c o m

Non-GAAP Measures Reconciliation of net income (GAAP measure) to adjusted EBITDAX (non-GAAP measure) 2017 2018 In millions Q4 FY Q1 Q2 Q3 TTM Net income (GAAP measure) $127 $163 $40 $30 $78 $275 Adjustments to reconcile to Adjusted EBITDAX Interest expense 23 99 17 16 19 75 Income tax expense (benefit) (134) (117) 14 9 16 (95) Depletion, depreciation, and amortization 53 207 52 53 51 209 Noncash fair value adjustments on commodity derivatives 78 29 15 41 (17) 117 Stock-based compensation 3 15 3 3 4 13 Noncash, non-recurring and other(1) 7 25 1 1 (3) 6 Adjusted EBITDAX (non-GAAP measure) $157 $421 $142 $153 $148 $600 1) Excludes proforma adjustments related to qualified acquisitions or dispositions under the Company’s senior secured bank credit facility. Adjusted EBITDAX is a non-GAAP financial measure which management uses and is calculated based upon (but not identical to) a financial covenant related to “Consolidated EBITDAX” in the Company’s senior secured bank credit facility, which excludes certain items that are included in net income, the most directly comparable GAAP financial measure. Items excluded include interest, income taxes, depletion, depreciation, and amortization, and items that the Company believes affect the comparability of operating results such as items whose timing and/or amount cannot be reasonably estimated or are non-recurring. Management believes Adjusted EBITDAX may be helpful to investors in order to assess the Company’s operating performance as compared to that of other companies in its industry, without regard to financing methods, capital structure or historical costs basis. It is also commonly used by third parties to assess leverage and the Company’s ability to incur and service debt and fund capital expenditures. Adjusted EBITDAX should not be considered in isolation, as a substitute for, or more meaningful than, net income, cash flow from operations, or any other measure reported in accordance with GAAP. Adjusted EBITDAX may not be comparable to similarly titled measures of another company because all companies may not calculate Adjusted EBITDAX, EBITDAX or EBITDA in the same manner. N Y S E : D N R 31 w w w . d e n b u r y . c o m

Non-GAAP Measures (Cont.) Reconciliation of net income (GAAP measure) to adjusted cash flows from operations (non-GAAP measure) to cash flows from operations (GAAP measure) 2017 2018 In millions Q1 Q2 Q3 Q4 FY Q1 Q2 Q3 Net income (GAAP measure) $22 $14 $0 $127 $163 $40 $30 $78 Adjustments to reconcile to adjusted cash flows from operations Depletion, depreciation, and amortization 51 51 52 53 208 52 53 51 Deferred income taxes 35 16 (15) (132) (96) 15 10 18 Stock-based compensation 4 5 3 3 15 3 3 4 Noncash fair value adjustments on commodity derivatives (52) (22) 25 78 30 15 41 (17) Other 2 1 3 5 9 0 (3) 1 Adjusted cash flows from operations (non-GAAP measure) $62 $65 $68 $134 $329 $125 $134 $135 Net change in assets and liabilities relating to operations (38) (12) (2) (10) (62) (33) 20 13 Cash flows from operations (GAAP measure) $24 $53 $66 $124 $267 $92 $154 $148 Adjusted cash flows from operations is a non-GAAP measure that represents cash flows provided by operations before changes in assets and liabilities, as summarized from the Company’s Consolidated Statements of Cash Flows. Adjusted cash flows from operations measures the cash flows earned or incurred from operating activities without regard to the collection or payment of associated receivables or payables. Management believes that it is important to consider this additional measure, along with cash flows from operations, as it believes the non-GAAP measure can often be a better way to discuss changes in operating trends in its business caused by changes in production, prices, operating costs and related factors, without regard to whether the earned or incurred item was collected or paid during that period. N Y S E : D N R 32 w w w . d e n b u r y . c o m
