Attached files
| file | filename |
|---|---|
| EX-32 - EXHIBIT 32 CERTIFICATIONS UNDER SECTION 906 - DENBURY INC | dnr-20151231xex32.htm |
| EX-31.A - EXHIBIT 31(A) CEO CERTIFICATION UNDER SECTION 302 - DENBURY INC | dnr-20151231xex31a.htm |
| 10-K - PDF OF FORM 10-K - DENBURY INC | dnr-20151231x10k.pdf |
| EX-10.I - EXHIBIT 10(I) DIRECTOR DEFERRED COMPENSATION PLAN - DENBURY INC | dnr-20151231xex10i.htm |
| EX-21 - EXHIBIT 21 LIST OF SUBSIDIARIES - DENBURY INC | dnr-20151231xex21.htm |
| EX-23.A - EXHIBIT 23(A) CONSENT OF INDEPENDENT REGISTERED PUBLIC ACCOUNTING FIRM - DENBURY INC | dnr-20151231xex23a.htm |
| EX-23.B - EXHIBIT 23(B) CONSENT OF DEGOLYER AND MACNAUGHTON - DENBURY INC | dnr-20151231xex23b.htm |
| EX-31.B - EXHIBIT 31(B) CFO CERTIFICATION UNDER SECTION 302 - DENBURY INC | dnr-20151231xex31b.htm |
| EX-99 - EXHIBIT 99 REPORT OF DEGOLYER AND MACNAUGHTON - DENBURY INC | dnr-20151231xex99.htm |
UNITED STATES SECURITIES AND EXCHANGE COMMISSION
Washington, D.C. 20549
2015 FORM 10-K
(Mark One)
þ Annual report pursuant to Section 13 or 15(d) of the Securities Exchange Act of 1934
For the fiscal year ended December 31, 2015
OR
o Transition report pursuant to Section 13 or 15(d) of the Securities Exchange Act of 1934
For the transition period from _________ to________
Commission file number 1-12935
DENBURY RESOURCES INC.
(Exact name of Registrant as specified in its charter)
Delaware | 20-0467835 | |
(State or other jurisdiction of incorporation or organization) | (I.R.S. Employer Identification No.) | |
5320 Legacy Drive, Plano, TX | 75024 | |
(Address of principal executive offices) | (Zip Code) | |
Registrant’s telephone number, including area code: | (972) 673-2000 | |
Securities registered pursuant to Section 12(b) of the Act:
Title of Each Class: | Name of Each Exchange on Which Registered: |
Common Stock $.001 Par Value | New York Stock Exchange |
Securities registered pursuant to Section 12(g) of the Act: None
Indicate by check mark if the registrant is a well-known seasoned issuer, as defined in Rule 405 of the Securities Act. Yes þ No o
Indicate by check mark if the registrant is not required to file reports pursuant to Section 13 or Section 15(d) of the Act. Yes o No þ
Indicate by check mark whether the registrant (1) has filed all reports required to be filed by Section 13 or 15(d) of the Securities Exchange Act of 1934 during the preceding 12 months (or for such shorter period that the registrant was required to file such reports), and (2) has been subject to such filing requirements for the past 90 days. Yes þ No o
Indicate by check mark whether the registrant has submitted electronically and posted on its corporate Web site, if any, every Interactive Data File required to be submitted and posted pursuant to Rule 405 of Regulation S-T during the preceding 12 months (or for such shorter period that the registrant was required to submit and post such files). Yes þ No o
Indicate by check mark if disclosure of delinquent filers pursuant to Item 405 of Regulation S-K is not contained herein, and will not be contained, to the best of registrant’s knowledge, in definitive proxy or information statements incorporated by reference in Part III of this Form 10-K or any amendment to this Form 10-K. þ
Indicate by check mark whether the registrant is a large accelerated filer, an accelerated filer, a non-accelerated filer, or a small reporting company. See the definitions of “large accelerated filer”, “accelerated filer”, and “small reporting company” in Rule 12-b2 of the Exchange Act.
Large accelerated filer þ Accelerated filer o Non-accelerated filer o Smaller reporting company o
Indicate by check mark whether the registrant is a shell company (as defined in Rule 12b-2 of the Act). Yes o No þ
The aggregate market value of the registrant’s common stock held by non-affiliates, based on the closing price of the registrant’s common stock as of the last business day of the registrant’s most recently completed second fiscal quarter was $2,242,674,743.
The number of shares outstanding of the registrant’s Common Stock as of January 31, 2016, was 350,812,556.
DOCUMENTS INCORPORATED BY REFERENCE
Document: | Incorporated as to: | |
1. Notice and Proxy Statement for the Annual Meeting of Stockholders to be held May 24, 2016. | 1. Part III, Items 10, 11, 12, 13, 14 | |
Denbury Resources Inc.
2015 Annual Report on Form 10-K
Table of Contents
Page | |||
2
Denbury Resources Inc.
Glossary and Selected Abbreviations
Bbl | One stock tank barrel, of 42 U.S. gallons liquid volume, used herein in reference to crude oil or other liquid hydrocarbons. |
Bbls/d | Barrels of oil or other liquid hydrocarbons produced per day. |
Bcf | One billion cubic feet of natural gas, CO2 or helium. |
BOE | One barrel of oil equivalent, using the ratio of one barrel of crude oil, condensate or natural gas liquids to 6 Mcf of natural gas. |
BOE/d | BOEs produced per day. |
Btu | British thermal unit, which is the heat required to raise the temperature of a one-pound mass of water from 58.5 to 59.5 degrees Fahrenheit (°F). |
CO2 | Carbon dioxide. |
EOR | Enhanced oil recovery. In the context of our oil and natural gas production, EOR is also referred to as tertiary recovery. |
Finding and development costs | The average cost per BOE to find and develop proved reserves during a given period. It is calculated by dividing (a) costs, which include the sum of (i) the total acquisition, exploration and development costs incurred during the period plus (ii) future development and abandonment costs related to the specified property or group of properties, by (b) the sum of (i) the change in total proved reserves during the period plus (ii) total production during that period. |
GAAP | Accounting principles generally accepted in the United States of America. |
MBbls | One thousand barrels of crude oil or other liquid hydrocarbons. |
MBOE | One thousand BOEs. |
Mcf | One thousand cubic feet of natural gas, CO2 or helium at a temperature base of 60 degrees Fahrenheit (°F) and at the legal pressure base (14.65 to 15.025 pounds per square inch absolute) of the state or area in which the reserves are located or sales are made. |
Mcf/d | One thousand cubic feet of natural gas, CO2 or helium produced per day. |
MMBbls | One million barrels of crude oil or other liquid hydrocarbons. |
MMBOE | One million BOEs. |
MMBtu | One million Btus. |
MMcf | One million cubic feet of natural gas, CO2 or helium. |
MMcf/d | One million cubic feet of natural gas, CO2 or helium per day. |
Noncash fair value adjustments on commodity derivatives | The net change during the period in the fair market value of commodity derivative positions. Noncash fair value adjustments on commodity derivatives is a non-GAAP measure and makes up only a portion of “Derivatives expense (income)” in the Consolidated Statements of Operations, which also includes the impact of settlements on commodity derivatives during the period. Its use is further discussed in Management’s Discussion and Analysis of Financial Condition and Results of Operations – Results of Operations – Operating Results Table. |
NYMEX | The New York Mercantile Exchange. In the context of our oil and natural gas sales, NYMEX pricing represents the West Texas Intermediate benchmark price for crude oil and Henry Hub benchmark price for natural gas. |
Probable Reserves* | Reserves that are less certain to be recovered than proved reserves but which, together with proved reserves, are as likely as not to be recovered. |
Proved Developed Reserves* | Reserves that can be expected to be recovered through existing wells with existing equipment and operating methods. |
3
Denbury Resources Inc.
Proved Reserves* | Reserves that geological and engineering data demonstrate with reasonable certainty to be recoverable in future years from known reservoirs under existing economic and operating conditions. |
Proved Undeveloped Reserves* | Reserves that are expected to be recovered from new wells on undrilled acreage or from existing wells, in each case where a relatively major expenditure is required. |
PV-10 Value | The estimated future gross revenue to be generated from the production of proved reserves, net of estimated future production, development and abandonment costs, and before income taxes, discounted to a present value using an annual discount rate of 10%. PV-10 Values were prepared using average hydrocarbon prices equal to the unweighted arithmetic average of hydrocarbon prices on the first day of each month within the 12-month period preceding the reporting date. PV-10 Value is a non-GAAP measure and does not purport to represent the fair value of our oil and natural gas reserves; its use is further discussed in footnote 3 to the table included in Item 1, Estimated Net Quantities of Proved Oil and Natural Gas Reserves and Present Value of Estimated Future Net Revenues – Oil and Natural Gas Reserve Estimates. |
Tcf | One trillion cubic feet of natural gas, CO2 or helium. |
Tertiary Recovery | A term used to represent techniques for extracting incremental oil out of existing oil fields (as opposed to primary and secondary recovery or “non-tertiary” recovery). In the context of our oil and natural gas production, tertiary recovery is also referred to as EOR. |
* This definition is an abbreviated version of the complete definition set forth in Rule 4-10(a) of Regulation S-X. For the complete definition see:
http://www.ecfr.gov/cgi-bin/text-idx?SID=2d916841db86d079fa060fa63b08d34e&mc=true&node=se17.3.210_14_610&rgn=div8.
4
PART I
Item 1. Business and Properties
GENERAL
Denbury Resources Inc., a Delaware corporation, is an independent oil and natural gas company with 288.6 MMBOE of estimated proved oil and natural gas reserves as of December 31, 2015, of which 98% is oil. Our operations are focused in two key operating areas: the Gulf Coast and Rocky Mountain regions. Our goal is to increase the value of our properties through a combination of exploitation, drilling and proven engineering extraction practices, with the most significant emphasis relating to CO2 enhanced oil recovery operations.
As part of our corporate strategy, we are committed to strong financial discipline, efficient operations and creating long-term value for our shareholders through the following key principles:
• | target specific regions where we either have, or believe we can create, a competitive advantage as a result of our ownership or use of CO2 reserves, oil fields and CO2 infrastructure; |
• | secure properties where we believe additional value can be created through tertiary recovery operations and a combination of other exploitation, development, exploration and marketing techniques; |
• | acquire properties that give us a majority working interest and operational control or where we believe we can ultimately obtain it; |
• | maximize the value and cash flow generated from our operations by increasing production and reserves while controlling costs; |
• | optimize the timing and allocation of capital among our investment opportunities to maximize the rates of return on our investments; |
• | exercise financial discipline by attempting to balance our development capital expenditures with our cash flows from operations; and |
• | attract and maintain a highly competitive team of experienced and incentivized personnel. |
Denbury has been publicly traded on the New York Stock Exchange since 1997. Our corporate headquarters is located at 5320 Legacy Drive, Plano, Texas 75024, and our phone number is 972-673-2000. At December 31, 2015, we had 1,356 employees, 743 of whom were employed in field operations or at our field offices. We make our annual report on Form 10-K, quarterly reports on Form 10-Q, current reports on Form 8-K, and amendments to those reports, filed or furnished pursuant to section 13(a) or 15(d) of the Securities Exchange Act of 1934, available free of charge on or through our website, www.denbury.com, as soon as reasonably practicable after we electronically file such material with, or furnish it to, the SEC. The public may read and copy any materials we file with the SEC at the SEC’s Public Reference Room at 100 F Street, NE, Washington, DC 20549. The public may obtain information on the operation of the Public Reference Room by calling the SEC at 1-800-SEC-0330. The SEC also maintains a website, http://www.sec.gov, which contains reports, proxy and information statements and other information filed by Denbury. Throughout this Annual Report on Form 10-K (“Form 10-K”) we use the terms “Denbury,” “Company,” “we,” “our” and “us” to refer to Denbury Resources Inc. and, as the context may require, its subsidiaries.
2015 BUSINESS DEVELOPMENTS
Oil prices generally constitute the single largest variable in our operating results. Oil prices have historically been volatile, with NYMEX oil prices ranging from $35 to $111 per Bbl over the last three calendar years, and prices have declined dramatically since the fourth quarter of 2014 to less than $27 per Bbl in January 2016, the lowest level in over 13 years. In response to the decline in oil prices, we made adjustments to our business to preserve financial strength and flexibility. These adjustments included reducing our 2015 development capital spending levels, reducing costs, identifying new innovation and improvement ideas for our fields and suspending our quarterly cash dividend. Our 2015 business developments included the following:
• | Generated $864.3 million of cash flow from operations (which amount includes $511.7 million of receipts on settlements of commodity derivatives) in 2015, which was $391.7 million higher than the total of our incurred development capital expenditures ($407.2 million) and dividends ($65.4 million). |
5
• | Utilized excess cash flow from operations to pay down borrowings on our bank credit facility, with a total reduction of $220.0 million from the level outstanding as of December 31, 2014. As a result of the reduction in our average debt outstanding, cash interest expense also decreased $11.4 million between 2014 and 2015. |
• | Increased our average tertiary oil production to 41,602 Bbls/d in 2015, a 1% increase from average tertiary oil production in 2014. |
• | Reduced our 2015 development capital spending to approximately 39% of 2014 levels. |
• | Generated average total production of 72,861 BOE/d in 2015, a 2% decrease from 2014 production, despite the significant reduction in our 2015 development capital spending. |
• | Reduced our operating costs and identified new innovation and improvement ideas for our fields, which has resulted in meaningful decreases to most categories of our lease operating expenses and general and administrative expenses, and cost savings on capital projects. |
• | Modified certain of our bank covenants applicable to the 2016, 2017 and 2018 periods to help mitigate concern around our ability to access our bank credit line if oil prices remain low for an extended period of time. |
• | On September 21, 2015, in light of the continuing low oil price environment and our desire to maintain our financial strength and flexibility, the Company’s Board of Directors suspended our quarterly cash dividend effective after payment of our third quarter dividend on September 29, 2015. |
2016 BUSINESS OUTLOOK
With the further decline in early 2016 in already depressed oil and natural gas prices, as well as our reduced hedging levels in 2016 and uncertainty around future prices, we are continuing to make adjustments to our business to preserve financial strength and flexibility. To accommodate our lower projected cash flow from operations, our 2016 capital spending has been budgeted at approximately $200 million, excluding capitalized interest and acquisitions, which is less than half of 2015 levels, and is not adequate to maintain current production levels. Therefore, we currently anticipate production declines in 2016 in the range of approximately seven to twelve percent from average 2015 levels, approximately 60% of which relates to natural production declines, with the remainder related to wells that are uneconomic to either produce or repair in the current price environment. We currently expect oil prices would need to average within a per-barrel range in the upper $30’s during 2016 for cash flow from operations to balance with our anticipated $200 million development capital budget, based upon our current production forecast and hedges currently in place. We currently intend to fund any potential shortfall with incremental borrowings on our bank credit facility, and as of December 31, 2015, we had ample availability on our bank credit facility to cover any foreseeable cash flow shortfall. In light of our current 2016 capital budget, we have deferred certain development projects that are uneconomic at current prices and slowed the development pace of many fields, anticipating that we have the ability to increase our capital spending when commodity prices return to higher levels that provide an acceptable rate of return. In late 2015 and early 2016, we shut-in certain wells that have become uneconomic to either produce or repair in the current price environment.
During this period of reduced capital spending, we have continued to evaluate our assets with a goal of increasing the value of both existing assets and future projects by optimizing field operational and development plans, reducing CO2 injection volumes due to increased efficiency and reducing costs. These initiatives aim to increase the profitability of our assets, making them more resilient to lower oil prices, and we will continue to evaluate the timing of development of our inventory of fields and related pipelines and facilities. Therefore, planned development activities presented in the discussions that follow may be delayed or modified during the course of 2016 depending primarily upon oil prices and our level of cash flow to fund such development, as well as the availability of CO2. Our capital spending during 2016 will focus on the continued development of our current tertiary floods, with less focus on the development of unproved reserves. Together, we believe these initiatives will help us manage through this low oil price environment and provide us with liquidity for the foreseeable future.
OIL AND NATURAL GAS OPERATIONS
Summary. Our oil and natural gas properties are concentrated in the Gulf Coast and Rocky Mountain regions of the United States. Currently our properties with proved and producing reserves in the Gulf Coast region are situated in Mississippi, Texas, Louisiana and Alabama, and in the Rocky Mountain region are situated in Montana, North Dakota and Wyoming. Our primary
6
focus is using CO2 in EOR, and our current portfolio of CO2 EOR projects provides us significant oil production and reserve growth potential in the future, assuming crude oil prices are at levels that support the development of those projects.
We have been conducting and expanding EOR operations on our assets in the Gulf Coast region since 1999, and as a result, we currently have many more CO2 EOR projects in this region than in the Rocky Mountain region. In the Gulf Coast region, we own what is, to our knowledge, the region’s only significant naturally occurring source of CO2, and these large volumes of naturally occurring CO2 give us a significant competitive advantage in this area. In addition to the sources of CO2 we currently own, we purchase and use CO2 captured from industrial sources which could otherwise be released into the atmosphere (sometimes referred to as anthropogenic, man-made or industrial-source CO2) in our tertiary operations. These industrial sources of CO2 help us recover additional oil from mature oil fields and, we believe, also provide an economical way to reduce atmospheric CO2 emissions through the concurrent underground storage of CO2 which occurs as part of our oil-producing EOR operations.
We began operations in the Rocky Mountain region in 2010 in connection with, and following, our merger with Encore Acquisition Company (“Encore”). We completed construction of the first section of the 20-inch Greencore Pipeline (our first CO2 pipeline in the Rocky Mountain region) in late 2012. During 2013, we received our first CO2 deliveries from the ConocoPhillips-operated Lost Cabin gas plant in central Wyoming, started CO2 injection at our Bell Creek Field in Montana, and commenced tertiary oil production from this field. In addition to our current tertiary flood in the Rocky Mountain region, we currently have long-term plans to flood Hartzog Draw Field, Grieve Field, and the Cedar Creek Anticline (“CCA”) with CO2. CCA is a geological structure over 126 miles in length consisting of 14 different operating areas. Our Riley Ridge Field acquisition (completed in two stages) in 2010 and 2011, the acquisition of an interest in CO2 reserves in LaBarge Field from Exxon Mobil Corporation (“ExxonMobil”) in 2012, and the previously mentioned deliveries from the ConocoPhillips-operated Lost Cabin gas plant are expected to provide us the CO2 necessary for our current inventory of CO2 EOR projects in the Rocky Mountain region.
Field Summary Table. The following table provides a summary by field and region of selected proved oil and natural gas reserve information, including total proved reserve quantities and the associated PV-10 Value of those reserves as of December 31, 2015, and average daily production for 2015, all based on Denbury’s net revenue interest (“NRI”). The reserve estimates presented were prepared by DeGolyer and MacNaughton (“D&M”), independent petroleum engineers located in Dallas, Texas. We serve as operator of virtually all of our significant properties, in which we also own most of the interests, although typically less than a 100% working interest, and a lesser NRI due to royalties and other burdens.
Proved oil and natural gas reserve quantities and PV-10 Values presented in the table reflect the significant decline in commodity prices between December 31, 2015 and 2014, whereby the average first-day-of-the-month NYMEX oil price used in estimating our proved reserves declined from $94.99 per Bbl at December 31, 2014, to $50.28 per Bbl at December 31, 2015, and for natural gas declined from $4.30 per MMBtu at December 31, 2014, to $2.63 per MMBtu at December 31, 2015. These commodity price changes resulted in a decline of approximately 126 MMBOE (29%) in our proved reserves from December 31, 2014, through December 31, 2015, a significant portion of which was attributable to natural gas reserves at Riley Ridge that were reclassified and are no longer considered proved reserves, and which reserves totaled approximately 368 Bcf (61 MMBOE) as of December 31, 2014, or approximately 81% of our total proved natural gas reserves at that date. Reserve quantities and PV-10 Values presented in the table do not reflect the continued oil price declines in late 2015 and early 2016. Sustained prices at these recent or lower levels would result in additional decreases in the PV-10 Values, and to a lesser degree, additional reductions in our proved reserve volumes. Conversely, a sustained increase in commodity prices could lead to higher PV-10 Values and recovery of volumes lost due to lower prices. For additional oil and natural gas reserves information, see Estimated Net Quantities of Proved Oil and Natural Gas Reserves and Present Value of Estimated Future Net Revenues below and Supplemental Oil and Natural Gas Disclosures (Unaudited) to the Consolidated Financial Statements.
7
Proved Reserves as of December 31, 2015 (1) | 2015 Average Daily Production | |||||||||||||||||||||||
Oil (MBbls) | Natural Gas (MMcf) | MBOEs | % of Company Total MBOEs | PV-10 Value (2)(000’s) | Oil (Bbls/d) | Natural Gas (Mcf/d) | Average 2015 NRI | |||||||||||||||||
Tertiary oil and gas properties | ||||||||||||||||||||||||
Gulf Coast region | ||||||||||||||||||||||||
Mature properties (3) | 24,868 | — | 24,868 | 8.6 | % | 165,395 | 10,830 | — | 77.1 | % | ||||||||||||||
Delhi | 25,870 | — | 25,870 | 8.9 | % | 216,478 | 3,688 | — | 57.3 | % | ||||||||||||||
Hastings | 36,859 | — | 36,859 | 12.8 | % | 254,450 | 5,061 | — | 79.8 | % | ||||||||||||||
Heidelberg | 19,053 | — | 19,053 | 6.6 | % | 189,459 | 5,785 | — | 80.8 | % | ||||||||||||||
Oyster Bayou | 16,390 | — | 16,390 | 5.7 | % | 285,442 | 5,898 | — | 87.0 | % | ||||||||||||||
Tinsley | 20,981 | — | 20,981 | 7.3 | % | 252,352 | 8,119 | — | 81.6 | % | ||||||||||||||
Total Gulf Coast region | 144,021 | — | 144,021 | 49.9 | % | 1,363,576 | 39,381 | — | 77.6 | % | ||||||||||||||
Rocky Mountain region | ||||||||||||||||||||||||
Bell Creek | 20,799 | — | 20,799 | 7.2 | % | 90,889 | 2,221 | — | 85.6 | % | ||||||||||||||
Total Rocky Mountain region | 20,799 | — | 20,799 | 7.2 | % | 90,889 | 2,221 | — | 85.6 | % | ||||||||||||||
Total tertiary properties | 164,820 | — | 164,820 | 57.1 | % | 1,454,465 | 41,602 | — | 78.0 | % | ||||||||||||||
Non-tertiary oil and gas properties | ||||||||||||||||||||||||
Gulf Coast region | ||||||||||||||||||||||||
Texas | 16,178 | 9,829 | 17,816 | 6.2 | % | 139,358 | 5,233 | 7,258 | 69.3 | % | ||||||||||||||
Mississippi and other | 5,034 | 12,241 | 7,074 | 2.4 | % | 33,177 | 1,368 | 6,954 | 23.4 | % | ||||||||||||||
Total Gulf Coast region | 21,212 | 22,070 | 24,890 | 8.6 | % | 172,535 | 6,601 | 14,212 | 47.7 | % | ||||||||||||||
Rocky Mountain region | ||||||||||||||||||||||||
Cedar Creek Anticline (4) | 89,536 | 4,197 | 90,236 | 31.3 | % | 647,379 | 17,661 | 2,018 | 82.9 | % | ||||||||||||||
Other | 6,682 | 12,038 | 8,688 | 3.0 | % | 44,176 | 3,301 | 5,942 | 27.2 | % | ||||||||||||||
Total Rocky Mountain region | 96,218 | 16,235 | 98,924 | 34.3 | % | 691,555 | 20,962 | 7,960 | 62.8 | % | ||||||||||||||
Total non-tertiary properties | 117,430 | 38,305 | 123,814 | 42.9 | % | 864,090 | 27,563 | 22,172 | 57.8 | % | ||||||||||||||
Company Total | 282,250 | 38,305 | 288,634 | 100.0 | % | $ | 2,318,555 | 69,165 | 22,172 | 68.7 | % | |||||||||||||
(1) | The above reserve estimates were prepared in accordance with Financial Accounting Standards Board Codification (“FASC”) Topic 932, Extractive Industries – Oil and Gas, using the arithmetic averages of the first-day-of-the-month NYMEX commodity price for each month during 2015, which were $50.28 per Bbl for crude oil and $2.63 per MMBtu for natural gas, both of which were adjusted for market differentials by field. |
(2) | PV-10 Value is a non-GAAP measure and is different from the GAAP measure, the Standardized Measure of Discounted Future Net Cash Flows (“Standardized Measure”), in that PV-10 Value is a pre-tax number and the Standardized Measure is an after-tax number. The Standardized Measure was $1.9 billion at December 31, 2015. A comparison of PV-10 Value to the Standardized Measure is included in the reserves table in Estimated Net Quantities of Proved Oil and Natural Gas Reserves and Present Value of Estimated Future Net Revenues below. The information used to calculate the PV-10 Value is derived directly from data determined in accordance with FASC Topic 932. See the definition of PV-10 Value in the Glossary and Selected Abbreviations. |
(3) | Mature properties include Brookhaven, Cranfield, Eucutta, Little Creek, Mallalieu, Martinville, McComb and Soso fields in Mississippi and Lockhart Crossing Field in Louisiana. |
(4) | The Cedar Creek Anticline consists of a series of 14 different operating areas. |
Enhanced Oil Recovery Overview. CO2 used in EOR is one of the most efficient tertiary recovery mechanisms for producing crude oil. When injected under pressure into underground, oil-bearing rock formations, CO2 acts somewhat like a solvent as it travels through the reservoir rock, mixing with and modifying the characteristics of the oil so it can be produced and sold. The terms “tertiary flood,” “CO2 flood” and “CO2 EOR” are used interchangeably throughout this document.
8
While enhanced oil recovery projects utilizing CO2 have been successfully performed by numerous oil and gas companies in a wide range of oil-bearing reservoirs in different oil-producing basins, we believe our investments, experience and acquired knowledge give us a strategic and competitive advantage in the areas in which we operate. We apply what we have learned and developed over the years to improve and increase sweep efficiency within the CO2 EOR projects we operate.
We began our CO2 operations in August 1999, when we acquired Little Creek Field, followed by our acquisition of Jackson Dome CO2 reserves and the NEJD pipeline in 2001. Based upon our success at Little Creek and the ownership of the CO2 reserves, we began to transition our capital spending and acquisition efforts to focus more heavily on CO2 EOR and, over time, transformed our strategy to focus primarily on owning and operating oil fields that are well suited for CO2 EOR projects. Prior to tertiary flooding, we strive to maximize the currently sizeable primary and secondary production from our prospective tertiary fields and from fields in which tertiary floods have commenced but still contain significant non-tertiary production. Our asset base today almost entirely consists of, or otherwise relates to, oil fields that we are currently flooding with CO2 or plan to flood with CO2 in the future, or assets that produce CO2.
Our tertiary operations have grown so that (1) 57% of our proved reserves at December 31, 2015 are proved tertiary oil reserves; (2) 57% of our 2015 production was related to tertiary oil operations (on a BOE basis); and (3) 70% of our 2015 capital expenditures (excluding acquisitions) were related to our tertiary oil operations. At year-end 2015, the proved oil reserves in our tertiary recovery oil fields had an estimated PV-10 Value of approximately $1.5 billion, or 63% of our total PV-10 Value. In addition, there are significant probable and possible reserves at several other fields for which tertiary operations are underway or planned.
Although the up-front cost of tertiary production infrastructure and time to construct pipelines and production facilities is greater than in primary oil recovery in most circumstances, we believe tertiary recovery has several favorable, offsetting and unique attributes, including (1) a lower exploration risk, as we are operating oil fields that have significant historical production and reservoir and geological data, (2) an industry-competitive rate of return, depending on the specific field and area, (3) limited competition for this recovery method in our geographic regions, (4) our EOR operations are generally less disruptive to new habitats in comparison to other oil and natural gas development because we further develop existing (as opposed to new) oil fields, and (5) through our oil-producing EOR operations, we concurrently store CO2 captured from industrial sources in the same underground formations that previously trapped and stored oil and natural gas.
Tertiary Oil Properties
Gulf Coast Region
CO2 Sources and Pipelines
Jackson Dome. Our primary Gulf Coast CO2 source, Jackson Dome, located near Jackson, Mississippi, was discovered during the 1970s by oil and gas companies that were exploring for hydrocarbons. This large and relatively pure source of naturally occurring CO2 (98% CO2) is, to our knowledge, the only significant underground deposit of CO2 in the United States east of the Mississippi River. Together with the related CO2 pipeline infrastructure, Jackson Dome provides us a significant strategic advantage in the acquisition of properties in Mississippi, Louisiana and southeastern Texas that are well suited for CO2 EOR.
We acquired Jackson Dome in February 2001 in a purchase that also gave us ownership and control of the NEJD CO2 pipeline and provided us with a reliable supply of CO2 at a reasonable and predictable cost for our Gulf Coast CO2 tertiary recovery operations. Since February 2001, we have acquired and drilled numerous CO2-producing wells, significantly increasing our estimated proved Gulf Coast CO2 reserves from approximately 800 Bcf at the time of acquisition of Jackson Dome to approximately 5.5 Tcf as of December 31, 2015. The proved CO2 reserve estimates are based on a gross (8/8ths) basis, of which our net revenue interest is approximately 4.4 Tcf, and is included in the evaluation of proved CO2 reserves prepared by D&M, an independent petroleum engineering consulting firm. In discussing our available CO2 reserves, we make reference to the gross amount of proved and probable reserves, as this is the amount that is available both for our own tertiary recovery programs and for industrial users who are customers of Denbury and others, as we are responsible for distributing the entire CO2 production stream.
In addition to our proved reserves, we estimate that we have 1.3 Tcf of probable CO2 reserves at Jackson Dome. While the majority of these probable reserves are located in structures that have been drilled and tested, such reserves are still considered probable reserves because (1) the original well is plugged; (2) they are located in fault blocks that are immediately adjacent to fault blocks with proved reserves; or (3) they are reserves associated with increasing the ultimate recovery factor from our existing
9
reservoirs with proved reserves. In addition, a significant portion of these probable reserves at Jackson Dome are located in undrilled structures where we have sufficient subsurface and seismic data indicating geophysical attributes that, coupled with our historically high drilling success rate, provide a reasonably high degree of certainty that CO2 is present.
Although our current proved CO2 reserves are sizeable, in order to continue our tertiary development of oil fields in the Gulf Coast region, incremental deliverability of CO2 is required. In order to obtain additional CO2 deliverability, we have conducted several 3D seismic surveys in the Jackson Dome area over the past several years.
In addition to our drilling at Jackson Dome, we continue to expand our processing and dehydration capacities, and we continue to install pipelines and/or pumping stations necessary to transport the CO2 through our controlled pipeline network. As part of our innovation and improvement initiative, we have identified fields where we have been able to reduce CO2 injections without significantly impacting production. As such, we have been able to reduce injected CO2 volumes in the Gulf Coast region by 30% when comparing injection levels in the fourth quarter of 2015 to those in the prior year fourth quarter. We expect our current proved reserves of CO2, coupled with a risked drilling program at Jackson Dome and CO2 expected to be captured from industrial sources, to provide sufficient quantities of CO2 for us to develop our proved and probable EOR reserves in the Gulf Coast region. In the future, we believe that once a CO2 flood in a field reaches its productive economic limit, we could recycle a portion of the CO2 that remains in that field’s reservoir and utilize it for oil production in another field’s tertiary flood.
In the Gulf Coast region, approximately 88% of our average daily CO2 produced from Jackson Dome or captured from industrial sources in 2015 and 91% in 2014 and 2013 was used in our tertiary recovery operations, with the balance delivered to third-party industrial users. During 2015, we used an average of 684 MMcf/d of CO2 (including CO2 captured from industrial sources) for our tertiary activities.
Gulf Coast CO2 Captured from Industrial Sources. In addition to our natural source of CO2, we are currently party to three long-term contracts to purchase CO2 from industrial plants. We have purchased CO2 from an industrial facility in Port Arthur, Texas since 2012 and from an industrial facility in Geismar, Louisiana since 2013, which currently supply approximately 60 MMcf/d of CO2 to our EOR operations. Additionally, we are in ongoing discussions with other parties who have plans to construct plants near the Green Pipeline. The expansion of industrial sources of CO2 from which we could capture CO2 for use in our tertiary recovery projects has developed more slowly than we previously expected. Several projects remain in the development stage, although we continue to anticipate completion and startup of Mississippi Power’s Kemper County Energy Facility for which we have contracted, which could more than double the amount of CO2 we currently utilize from industrial sources. In October 2015, the Environmental Protection Agency (“EPA”) finalized a rule – Carbon Pollution Emission Guidelines for Existing Stationary Sources: Electric Utility Generating Units (also known or commonly referred to as the “Clean Power Plan”) – that would impose limits on greenhouse gas emissions from new and existing U.S. electric generation units. The Clean Power Plan in its current form contains requirements which will likely impact our ability to purchase power plant CO2 for our EOR operations due to a number of operational and legal issues. The Clean Power Plan has been challenged by various states, trade associations, companies, including Denbury, and environmental groups. On February 9, 2016, the U.S. Supreme Court stayed the implementation of the Clean Power Plan pending resolution of various challenges to the rule.
In addition to the potential CO2 sources discussed above, we continue to have ongoing discussions with owners of existing plants of various types that emit CO2 that we may be able to purchase and/or transport. In order to capture such volumes, we (or the plant owner) would need to install additional equipment, which includes, at a minimum, compression and dehydration facilities. Most of these existing plants emit relatively small volumes of CO2, generally less than our contracted sources, but such volumes may still be attractive if the source is located near CO2 pipelines. The capture of CO2 could also be influenced by potential federal legislation, which could impose economic penalties for atmospheric CO2 emissions. We believe that we are a likely purchaser of CO2 captured in our areas of operation because of the scale of our tertiary operations and our CO2 pipeline infrastructure.
Gulf Coast CO2 Pipelines. We acquired the 183-mile NEJD CO2 pipeline that runs from Jackson Dome to near Donaldsonville, Louisiana, as part of the 2001 acquisition of our Jackson Dome CO2 source. Since 2001, we have acquired or constructed over 750 miles of CO2 pipelines, and as of December 31, 2015, we have access to nearly 950 miles of CO2 pipelines, which gives us the ability to deliver CO2 throughout the Gulf Coast region. In addition to the NEJD CO2 pipeline, the major pipelines in the Gulf Coast region are the Free State Pipeline (90 miles), the Delta Pipeline (110 miles), the Green Pipeline Texas (120 miles), and the Green Pipeline Louisiana (200 miles).
Completion of the Green Pipeline allowed for the first CO2 injection into Hastings Field, located near Houston, Texas, in 2010, and gives us the ability to deliver CO2 to oil fields all along the Gulf Coast from Baton Rouge, Louisiana, to Alvin, Texas. At
10
the present time, most of the CO2 flowing in the Green Pipeline is delivered from the Jackson Dome area, but we began receiving CO2 from an industrial facility in Port Arthur, Texas in 2012, and are currently transporting a third party’s CO2 for a fee to the sales point at Hastings Field. In addition, we began receiving CO2 from an industrial facility in Geismar, Louisiana in 2013. We expect the volume of CO2 transported through the Green Pipeline to increase in future years as we develop our inventory of CO2 EOR projects in this area.
Tertiary Properties with Tertiary Production and Proved Tertiary Reserves at December 31, 2015
Mature properties. Mature properties include our longest-producing properties which are generally located along our NEJD CO2 pipeline in southwest Mississippi and Louisiana and our Free State Pipeline in east Mississippi. This group of properties includes our initial CO2 field, Little Creek, as well as several other fields (Brookhaven, Cranfield, Eucutta, Lockhart Crossing, Mallalieu, Martinville, McComb and Soso fields). These fields accounted for 26% of our total 2015 CO2 EOR production and approximately 15% of our year-end proved tertiary reserves. These fields have been producing for some time, and their production is generally declining. Many of these fields contain multiple reservoirs that are amenable to CO2 EOR.
Delhi Field. Delhi Field is located east of Monroe, Louisiana. In May 2006, we purchased our initial interest in Delhi for $50 million. We began well and facility development in 2008 and began delivering CO2 to the field in the fourth quarter of 2009 via the Delta Pipeline, which runs from Tinsley Field to Delhi Field.
First tertiary production occurred at Delhi Field in the first quarter of 2010. Production from Delhi Field in the fourth quarter of 2015 averaged 3,898 Bbls/d, up from 3,743 Bbls/d in the fourth quarter of 2014. Beginning November 1, 2014, average daily production amounts reflect the contractual reversionary assignment of approximately 25% of our interest to the seller of the field, the effectiveness, timing, and scope of which are subject to ongoing litigation, the ultimate outcome of which cannot be predicted.
Additionally, our development of Delhi Field has been impacted by a release of well fluids within an area of Delhi Field occurring in the second quarter of 2013 and our subsequent remediation of such release. During the years ended December 31, 2014 and 2013, we recorded $16.8 million and $114.0 million, respectively, of lease operating expenses related to this release and its remediation in our Consolidated Statements of Operations, bringing our total cost estimate with respect to these expenses to $130.8 million. We have received a total of $29.5 million ($27.1 million net to Denbury) in insurance reimbursements related to the Delhi Field release and remediation. These insurance reimbursements were recognized as a reduction to lease operating expenses for the years ended December 31, 2014 and 2015. See Item 7, Management’s Discussion and Analysis of Financial Condition and Results of Operations – Capital Resources and Liquidity – Insurance Recoveries to Cover Costs of 2013 Delhi Field Release and Note 10, Commitments and Contingencies to the Consolidated Financial Statements for further discussion of these matters. Our development capital budget includes investing approximately $55 million in this field during 2016, primarily related to a natural gas liquids extraction plant, which we currently anticipate will be placed into service in late 2016. This plant will provide us with the ability to sell natural gas liquids from the produced stream, improve the efficiency of the flood, and utilize extracted methane to power the plant and reduce field operating expenses.
Hastings Field. Hastings Field is located south of Houston, Texas. We acquired a majority interest in this field in February 2009 for $247 million. We initiated CO2 injection in the West Hastings Unit during the fourth quarter of 2010 upon completion of the construction of the Green Pipeline. Due to the large vertical oil column that exists in the field, we are developing the Frio reservoir using dedicated CO2 injection and producing wells for each of the major sand intervals. We began producing oil from our EOR operations at Hastings Field in the first quarter of 2012, and we booked initial proved tertiary reserves for the West Hastings Unit in 2012. During the fourth quarter of 2015, tertiary production from Hastings Field averaged 5,082 Bbls/d, compared to 4,811 Bbls/d in the fourth quarter of 2014. Our future plans for Hastings Field include additional phased development opportunities.
Heidelberg Field. Heidelberg Field is located in Mississippi and consists of an East Unit and a West Unit. Construction of the CO2 facility, connecting pipeline and well work commenced on the West Heidelberg Unit during 2008, with our first CO2 injections into the Eutaw zone in the fourth quarter of 2008. Our first tertiary oil production occurred in the second quarter of 2009, and we began flooding the Christmas and Tuscaloosa zones in 2013 and 2014, respectively. During the fourth quarter of 2015, tertiary production at Heidelberg Field averaged 5,635 Bbls/d, compared to 6,164 Bbls/d in the fourth quarter of 2014. The decrease in proved reserves at Heidelberg Field between December 31, 2015 and 2014 was primarily related to the reclassification of approximately 11 MMBbls of proved undeveloped reserves to the unproved reserves category pursuant to the five-year development rule established by the SEC due to changes in our development plans. Our future plans for Heidelberg Field include continued development of the East and West Heidelberg Units, including an expansion of our Tuscaloosa development and
11
Christmas zone and adjustments to our CO2 floods of existing zones to better direct the CO2 through the zones and optimize oil recovery from the field, the ultimate timing of which will depend upon future oil prices or revised development plans.
Oyster Bayou Field. We acquired a majority interest in Oyster Bayou Field in 2007. The field is located in southeast Texas, east of Galveston Bay, and is somewhat unique when compared to our other CO2 EOR projects because the field covers a relatively small area of 3,912 acres. We began CO2 injections into Oyster Bayou Field in the second quarter of 2010, commenced tertiary production in the fourth quarter of 2011 from the Frio A-1 zone, and booked initial proved tertiary reserves for the field in 2012. In 2014, we completed development of the Frio A-2 zone. During the fourth quarter of 2015, tertiary production at Oyster Bayou Field averaged 5,831 Bbls/d, compared to 5,638 Bbls/d in the fourth quarter of 2014. Production from Oyster Bayou Field is believed to have peaked in 2015, with production from the field in 2016 currently expected to be relatively flat or slightly reduced from 2015 levels. As of December 31, 2015, proved reserves at Oyster Bayou Field reflect positive performance revisions during 2015 of approximately 7 MMBOE as a result of increased recovery factors at the field, partially offset by a decrease in volumes of approximately 2 MMBOE due to a decline in the average first-day-of-the-month NYMEX oil price used in estimating our proved reserves.
Tinsley Field. We acquired Tinsley Field in 2006. This Mississippi field was discovered and first developed in the 1930s and is separated by different fault blocks. As is the case with the majority of fields in Mississippi, Tinsley Field produces from multiple reservoirs. Our CO2 enhanced oil recovery operations at Tinsley Field have thus far targeted the Woodruff formation, although there is additional potential in the Perry sandstone and other smaller reservoirs. We commenced tertiary oil production from Tinsley Field in the second quarter of 2008 and substantially completed development of the Woodruff formation during 2014. During the fourth quarter of 2015, average tertiary oil production from the field was 7,522 Bbls/d, compared to 8,767 Bbls/d in the fourth quarter of 2014. Although production from Tinsley Field is believed to have peaked in 2015, with a modest production decline currently expected in 2016, we continue to evaluate future potential investment opportunities in this field. As of December 31, 2015, proved reserves at Tinsley Field reflect positive performance revisions during 2015 of approximately 7 MMBOE as a result of increased recovery factors at the field, partially offset by a decrease in volumes of approximately 6 MMBOE due to a decline in the average first-day-of-the-month NYMEX oil price used in estimating our proved reserves.
Future Tertiary Properties with No Tertiary Production or Proved Tertiary Reserves at December 31, 2015
Webster Field. We acquired our interest in Webster Field in the fourth quarter of 2012 as part of the sale and exchange transaction with ExxonMobil under which we sold to ExxonMobil our Bakken area assets in North Dakota and Montana in exchange for (1) $1.3 billion in cash, (2) operating interests in Hartzog Draw and Webster fields in Wyoming and Texas, respectively, and (3) an overriding royalty interest equivalent to an approximate one-third ownership interest in ExxonMobil’s CO2 reserves in LaBarge Field in Wyoming (the “Bakken Exchange Transaction”). The field is located in Texas, approximately eight miles northeast of our Hastings Field which we are currently flooding with CO2. At December 31, 2015, Webster Field had estimated proved non-tertiary reserves of approximately 2.2 MMBOE, net to our interest. During the fourth quarter of 2015, non-tertiary production at Webster Field averaged 1,001 BOE/d, compared to 1,121 BOE/d in the fourth quarter of 2014. Webster Field is geologically similar to our Hastings Field, producing oil from the Frio zone at similar depths; as a result, we believe it is well suited for CO2 EOR. In 2014, we completed a nine-mile lateral between the Green Pipeline and Webster Field, which will eventually deliver CO2 to the field. We currently anticipate completing our plans for optimization of tertiary development of Webster Field during 2016, at which point we will determine the tertiary development schedule for the field, the timing of which could be delayed depending on future oil prices or revised development plans.
Conroe Field. Conroe Field, our largest potential tertiary flood in the Gulf Coast region, is located north of Houston, Texas. We acquired a majority interest in this field in 2009 for $271 million in cash and 11.6 million shares of Denbury common stock, for a total aggregate value of $439 million. Conroe Field had estimated proved non-tertiary reserves of approximately 5.3 MMBOE at December 31, 2015, net to our interest, all of which are proved developed. During the fourth quarter of 2015, production at Conroe Field averaged 2,889 BOE/d, compared to 3,386 BOE/d in the fourth quarter of 2014.
A pipeline must be constructed so that CO2 can be delivered to Conroe Field. This pipeline, which is planned as an extension of our Green Pipeline, is preliminarily estimated to cover approximately 90 miles at a cost of approximately $220 million. We currently expect that over the next few years we will begin construction of this pipeline and prepare to commence CO2 injections at Conroe Field, the timing of which may change depending on future oil prices.
Thompson Field. We acquired our interest in Thompson Field in June 2012 for $366 million. The field is located in Texas, approximately 18 miles west of our Hastings Field. Thompson Field had estimated proved non-tertiary reserves of approximately
12
8.4 MMBOE at December 31, 2015, net to our interest, of which approximately 82% is proved developed. During the fourth quarter of 2015, non-tertiary production at Thompson Field averaged 1,508 BOE/d net to our interest, compared to 1,556 BOE/d in the fourth quarter of 2014. Thompson Field is geologically similar to Hastings Field, producing oil from the Frio zone at similar depths, and we therefore believe it has CO2 EOR potential. Under the terms of the Thompson Field acquisition agreement, after the initiation of CO2 injection, the seller will retain approximately a 5% gross revenue interest (less severance taxes) once average monthly oil production exceeds 3,000 Bbls/d. The timing of CO2 injections at Thompson Field is currently scheduled several years in the future, the ultimate timing of which is primarily dependent upon future oil prices.
Rocky Mountain Region
CO2 Sources and Pipelines
LaBarge Field. We acquired an overriding royalty interest equivalent to an approximate one-third ownership interest in ExxonMobil’s CO2 reserves in LaBarge Field in the fourth quarter of 2012 as part of the Bakken Exchange Transaction. Our interest at Riley Ridge (discussed below) is also produced from the LaBarge Field. LaBarge Field is located in southwestern Wyoming.
During 2015, we received an average of approximately 70 MMcf/d of CO2 from ExxonMobil’s Shute Creek gas processing plant at LaBarge Field. Based on current capacity, and subject to availability of CO2, we currently expect that we could receive up to 115 MMcf/d of CO2 by 2021 from such plant. We pay ExxonMobil a fee to process and deliver the CO2, which we use in our Rocky Mountain region CO2 floods. As of December 31, 2015, our interest in LaBarge Field consisted of approximately 1.2 Tcf of proved CO2 reserves.
Riley Ridge. The Riley Ridge Federal Unit is also located in southwestern Wyoming and produces gas from the same LaBarge Field. In a series of two acquisitions in 2010 and 2011, we acquired 100% of the operating interests in Riley Ridge, as well as a gas processing facility that was under construction at the time of purchase, for $347 million. The gas processing facility separates helium and natural gas from the gas stream. During construction of the gas processing facility, we encountered issues related to contractor performance and design failure that resulted in significant delays and incremental costs to complete the facility. We placed the gas processing facility into service during the fourth quarter of 2013 and were successful in running the facility for part of 2014, but encountered additional issues in 2014, which kept the facility from running at optimum levels, as well as additional problems associated with sulfur build-up in the gas supply wells. We are currently working to correct and remedy these issues; however, we currently expect natural gas production at Riley Ridge will remain shut-in for some time due to such issues.
As of December 31, 2015, Riley Ridge natural gas, CO2 and helium reserves were reclassified and are no longer considered proved reserves primarily as a result of the decline in average first-day-of-the-month natural gas prices utilized in preparing our December 31, 2015 reserve report. Proved natural gas, CO2 and helium reserves at Riley Ridge previously totaled approximately 368 Bcf, 1.8 Tcf and 13 Bcf, respectively, as of December 31, 2014. As of December 31, 2015, our interest in Riley Ridge and minor surrounding acreage contained probable reserves of 2.8 Tcf of CO2, which reserve estimates are based upon the gross (8/8ths) basis of the CO2 reserves, and in which our net revenue interest is approximately 2.2 Tcf. As of December 31, 2015, we estimated that Riley Ridge contained probable helium reserves of approximately 12 Bcf, which volume estimate is reduced to reflect related fees we will remit to the U.S. government. We also believe there is significant CO2 reserve potential in other acreage surrounding Riley Ridge in which we also own an interest.
Initially, the gas processing facility at Riley Ridge was designed to separate for sale the natural gas and helium from the full well stream, with the remaining gases, principally CO2, re-injected into the producing formation or a deeper formation. Ultimately, our primary purpose for acquiring Riley Ridge was to gain a source of CO2 to utilize in flooding our fields in the Rocky Mountain region. We intend to construct a CO2 capture facility and will start to use CO2 from Riley Ridge following completion of the capture facility and planned CO2 pipeline connecting Riley Ridge to our existing Greencore Pipeline, the timing of which is largely dependent upon future oil prices.
Other Rocky Mountain CO2 Sources. We began purchasing and receiving CO2 from the ConocoPhillips-operated Lost Cabin gas plant in central Wyoming in the first quarter of 2013, under a contract that provides us as much as 50 MMcf/d of CO2 for use in our Rocky Mountain region CO2 floods. Our volumes received from the plant averaged approximately 40 MMcf/d in 2015.
13
Greencore Pipeline. The 20-inch Greencore Pipeline in Wyoming is the first CO2 pipeline we constructed in the Rocky Mountain region. We plan to use the pipeline as our trunk line in the Rocky Mountain region, eventually connecting our various Rocky Mountain region CO2 sources (see Rocky Mountain Region CO2 Sources and Pipelines above) to the Cedar Creek Anticline in eastern Montana and western North Dakota. The initial 232-mile section of the Greencore Pipeline begins at the ConocoPhillips-operated Lost Cabin gas plant in Wyoming and terminates at Bell Creek Field in Montana. We completed construction of this section of the pipeline in the fourth quarter of 2012 and received our first CO2 deliveries from the ConocoPhillips-operated Lost Cabin gas plant during the first quarter of 2013. During the first quarter of 2014, we completed construction of an interconnect between our Greencore Pipeline and an existing third-party CO2 pipeline in Wyoming, which enables us to transport CO2 from LaBarge Field to our Bell Creek Field.
Tertiary Properties with Tertiary Production and Proved Tertiary Reserves at December 31, 2015
Bell Creek Field. Bell Creek Field is located in southeast Montana, and we acquired our interest in this field as part of the Encore merger in 2010. The oil-producing reservoir in Bell Creek Field is a sandstone reservoir with characteristics similar to those we have successfully flooded with CO2 in the Gulf Coast region. During 2013, we began first CO2 injections into Bell Creek Field, recorded our first tertiary oil production, and booked initial proved tertiary reserves. Tertiary production, net to our interest, during the fourth quarter of 2015 averaged 2,806 Bbls/d of oil, compared to 1,659 Bbls/d in the fourth quarter of 2014, as production has steadily grown from the initial production response in the third quarter of 2013. We expect production from this field will continue to increase during 2016; however, such growth may be at a slower rate in the future due to our slowed development pace as a result of the decline in oil prices.
Future Tertiary Properties with No Tertiary Production or Proved Tertiary Reserves at December 31, 2015
Cedar Creek Anticline. CCA is the largest potential EOR property that we own and currently our largest producing property, contributing approximately 25% of our 2015 total production. The field is primarily located in Montana but covers such a large area (approximately 126 miles) that it also extends into North Dakota. CCA is a series of 14 different operating areas, each of which could be considered a field by itself. We acquired our initial interest in CCA as part of the Encore merger in 2010 and acquired additional interests (the “CCA Acquisition”) from a wholly-owned subsidiary of ConocoPhillips in the first quarter of 2013 for $1.0 billion, adding 42.2 MMBOE of incremental proved reserves at that date. Production from CCA, net to our interest, averaged 17,875 BOE/d during the fourth quarter of 2015, compared to production during the fourth quarter of 2014 of 18,553 BOE/d. This decline in production includes approximately 250 BOE/d of production that, as of December 31, 2015, we estimated to be attributable to wells shut-in as uneconomic to either produce or repair due to commodity prices at this time. The non-tertiary proved reserves associated with CCA were 90.2 MMBOE, net to our interest, as of December 31, 2015.
CCA is located approximately 110 miles north of Bell Creek Field, and we currently expect to ultimately connect this field to our Greencore Pipeline. In the future, we plan to install an injection facility and perform minor conformance work at the field to minimize production declines, the timing of which will depend on future oil prices. Our current plan for initiating a CO2 flood at CCA is scheduled several years from now, the timing of which may change depending on future oil prices, pipeline permitting and operations at the Riley Ridge gas processing facility.
Hartzog Draw Field. We acquired our interest in Hartzog Draw Field in the fourth quarter of 2012 as part of the Bakken Exchange Transaction. The field is located in the Powder River Basin of northeastern Wyoming, approximately 12 miles from our Greencore Pipeline. Hartzog Draw Field had estimated proved reserves of approximately 4.3 MMBOE at December 31, 2015, net to our interest, 1.7 MMBOE of which relate to the natural gas producing Big George coal zone. During the fourth quarter of 2015, non-tertiary production averaged 2,212 BOE/d, compared to 2,639 BOE/d in the fourth quarter of 2014. This decline in production includes approximately 300 BOE/d that, as of December 31, 2015, we estimated to be attributable to wells shut-in as uneconomic to either produce or repair due to commodity prices at this time. We successfully completed 5 wells in Hartzog Draw Field in 2014; however, we have temporarily suspended the non-tertiary development of Hartzog Draw Field in light of the recent oil price environment. We believe the oil reservoir characteristics of Hartzog Draw Field make it well suited for CO2 EOR in the future. We currently plan to commence CO2 injections at Hartzog Draw within five years from now, the timing of which is dependent on future oil prices.
Other Non-Tertiary Oil Properties
Despite the majority of our oil and natural gas properties discussed above consisting of either existing or planned future tertiary floods, we do also produce oil and natural gas either from fields in both our Gulf Coast and Rocky Mountain regions that are not
14
amenable to EOR or from specific reservoirs (within an existing tertiary field) that are not amenable to EOR. For example, at Heidelberg Field, we produce natural gas from the Selma Chalk reservoir, which is separate from the Christmas and Eutaw reservoirs currently being flooded with CO2. Production from these other non-tertiary properties totaled 5,340 BOE/d during the fourth quarter of 2015, compared to 5,747 BOE/d during the fourth quarter of 2014. In addition to these properties, we acquired two minor fields with future CO2 EOR potential during 2015 for a total of approximately $22 million.
OIL AND GAS ACREAGE, PRODUCTIVE WELLS AND DRILLING ACTIVITY
In the data below, “gross” represents the total acres or wells in which we own a working interest and “net” represents the gross acres or wells multiplied by our working interest percentage. For the wells that produce both oil and gas, the well is typically classified as an oil or natural gas well based on the ratio of oil to natural gas production.
Oil and Gas Acreage
The following table sets forth our acreage position at December 31, 2015:
Developed | Undeveloped | Total | |||||||||||||||
Gross | Net | Gross | Net | Gross | Net | ||||||||||||
Gulf Coast region | 248,466 | 201,902 | 285,830 | 17,100 | 534,296 | 219,002 | |||||||||||
Rocky Mountain region | 381,890 | 331,698 | 218,204 | 100,284 | 600,094 | 431,982 | |||||||||||
Total | 630,356 | 533,600 | 504,034 | 117,384 | 1,134,390 | 650,984 | |||||||||||
The percentage of our net undeveloped acreage that is subject to expiration over the next three years, if not renewed, is approximately 7% in 2016, 11% in 2017 and 12% in 2018.
Productive Wells
The following table sets forth our gross and net productive oil and natural gas wells as of December 31, 2015:
Producing Oil Wells | Producing Natural Gas Wells | Total | |||||||||||||||
Gross | Net | Gross | Net | Gross | Net | ||||||||||||
Operated wells | |||||||||||||||||
Gulf Coast region | 1,318 | 1,224 | 210 | 193 | 1,528 | 1,417 | |||||||||||
Rocky Mountain region | 1,091 | 987 | 290 | 148 | 1,381 | 1,135 | |||||||||||
Total | 2,409 | 2,211 | 500 | 341 | 2,909 | 2,552 | |||||||||||
Non-operated wells | |||||||||||||||||
Gulf Coast region | 99 | 29 | 39 | 16 | 138 | 45 | |||||||||||
Rocky Mountain region | 106 | 19 | 3 | 1 | 109 | 20 | |||||||||||
Total | 205 | 48 | 42 | 17 | 247 | 65 | |||||||||||
Total wells | |||||||||||||||||
Gulf Coast region | 1,417 | 1,253 | 249 | 209 | 1,666 | 1,462 | |||||||||||
Rocky Mountain region | 1,197 | 1,006 | 293 | 149 | 1,490 | 1,155 | |||||||||||
Total | 2,614 | 2,259 | 542 | 358 | 3,156 | 2,617 | |||||||||||
15
Drilling Activity
The following table sets forth the results of our drilling activities over the last three years. As of December 31, 2015, we had 1 well in progress.
Year Ended December 31, | |||||||||||||||||
2015 | 2014 | 2013 | |||||||||||||||
Gross | Net | Gross | Net | Gross | Net | ||||||||||||
Exploratory wells (1) | |||||||||||||||||
Productive (2) | — | — | — | — | — | — | |||||||||||
Non-productive (3) | — | — | — | — | — | — | |||||||||||
Development wells (1) | |||||||||||||||||
Productive (2) | 16 | 15 | 59 | 56 | 49 | 44 | |||||||||||
Non-productive (3)(4) | — | — | — | — | 1 | 1 | |||||||||||
Total | 16 | 15 | 59 | 56 | 50 | 45 | |||||||||||
(1) | An exploratory well is a well drilled to find a new field or to find a new reservoir in a field previously found to be productive of oil or natural gas in another reservoir. Generally, an exploratory well is any well that is not a development well, an extension well, a service well or a stratigraphic test well. A development well is a well drilled within the proved area of an oil or gas reservoir to the depth of a stratigraphic horizon known to be productive. |
(2) | A productive well is an exploratory or development well found to be capable of producing either oil or natural gas in sufficient quantities to justify completion as an oil or natural gas well. |
(3) | A non-productive well is an exploratory or development well that is not a productive well. |
(4) | During 2015, 2014 and 2013, an additional 6, 43 and 43 wells, respectively, were drilled for water or CO2 injection purposes. |
16
The following table summarizes sales volumes, sales prices and production cost information for our net oil and natural gas production for the years ended December 31, 2015, 2014 and 2013:
Year Ended December 31, | |||||||||||
2015 | 2014 | 2013 | |||||||||
Net sales volume | |||||||||||
Gulf Coast region | |||||||||||
Oil (MBbls) | 16,783 | 17,259 | 16,858 | ||||||||
Natural gas (MMcf) | 5,187 | 4,855 | 5,620 | ||||||||
Total Gulf Coast region (MBOE) | 17,648 | 18,068 | 17,795 | ||||||||
Rocky Mountain region | |||||||||||
Oil (MBbls) | 8,462 | 8,513 | 7,336 | ||||||||
Natural gas (MMcf) | 2,906 | 3,524 | 3,046 | ||||||||
Total Rocky Mountain region (MBOE) | 8,946 | 9,100 | 7,844 | ||||||||
Total Company (MBOE) | 26,594 | 27,168 | 25,639 | ||||||||
Average sales prices – excluding impact of derivative settlements | |||||||||||
Gulf Coast region | |||||||||||
Oil (per Bbl) | $ | 49.34 | $ | 94.67 | $ | 105.34 | |||||
Natural gas (per Mcf) | 2.48 | 4.31 | 3.74 | ||||||||
Rocky Mountain region | |||||||||||
Oil (per Bbl) | $ | 43.25 | $ | 82.75 | $ | 89.95 | |||||
Natural gas (per Mcf) | 2.11 | 3.73 | 3.15 | ||||||||
Total Company | |||||||||||
Oil (per Bbl) | $ | 47.30 | $ | 90.74 | $ | 100.67 | |||||
Natural gas (per Mcf) | 2.35 | 4.07 | 3.53 | ||||||||
Average production cost (per BOE sold) (1) | |||||||||||
Gulf Coast region (2) | $ | 19.51 | $ | 24.92 | $ | 32.34 | |||||
Rocky Mountain region | 19.07 | 21.69 | 19.78 | ||||||||
Total Company (2) | 19.37 | 23.84 | 28.50 | ||||||||
(1) | Excludes oil and natural gas ad valorem and production taxes. |
(2) | Production costs include certain special items, comprised of (1) lease operating expenses and related insurance recoveries recorded to remediate an area of Delhi Field, (2) a reimbursement for a retroactive utility rate adjustment, and (3) other insurance recoveries. If these amounts were excluded, average production costs per BOE for the Gulf Coast region would have totaled $20.29, $25.31 and $25.93 for the years ended December 31, 2015, 2014 and 2013, respectively, and average production costs per BOE for the Company as a whole would have totaled $19.88, $24.10 and $24.05 for the years ended December 31, 2015, 2014 and 2013, respectively. |
PRODUCTION AND UNIT PRICES
Further information regarding average production rates, unit sales prices and unit costs per BOE are set forth under Item 7, Management’s Discussion and Analysis of Financial Condition and Results of Operations – Results of Operations – Operating Results Table, included herein.
17
TITLE TO PROPERTIES
As is customary in the oil and natural gas industry, Denbury conducts a limited title examination at the time of its acquisition of properties or leasehold interests targeted for enhanced recovery, and curative work is performed with respect to significant defects on higher-value properties of the greatest significance. We believe that title to our oil and natural gas properties is good and defensible, subject only to such exceptions that we believe do not materially interfere with the use of such properties, including encumbrances, easements, restrictions and royalty, overriding royalty and other similar interests.
SIGNIFICANT OIL AND GAS PURCHASERS AND PRODUCT MARKETING
Oil and natural gas sales are made on a day-to-day basis or under short-term contracts at the current area market price. We would not expect the loss of any single purchaser to have a material adverse effect upon our operations; however, the loss of a large single purchaser could potentially reduce the competition for our oil and natural gas production, which in turn could negatively impact the prices we receive. For the year ended December 31, 2015, two purchasers accounted for 10% or more of our oil and natural gas revenues: Marathon Petroleum Company (28%) and Plains Marketing LP (15%). For the year ended December 31, 2014, three purchasers accounted for 10% or more of our oil and natural gas revenues: Marathon Petroleum Company (31%), Plains Marketing LP (13%), and ConocoPhillips (12%). For the year ended December 31, 2013, three purchasers accounted for 10% or more of our oil and natural gas revenues: Marathon Petroleum Company (33%), Plains Marketing LP (15%), and Eighty-Eight Oil LLC (10%).
Our ability to market oil and natural gas depends on many factors beyond our control, including the extent of domestic production and imports of oil and natural gas, the proximity of our oil and natural gas production to pipelines and corresponding markets, the available capacity in such pipelines, the demand for oil and natural gas, the effects of weather, and the effects of state and federal regulation. As of December 31, 2015, we have not experienced significant difficulty in finding a market for all of our production as it becomes available or in transporting our production to those markets; however, there is no assurance that we will always be able to market all of our production or obtain favorable prices.
On December 18, 2015, Congress passed, and the President signed, legislation repealing the ban on the export of crude oil from the United States. Proponents of the legislation believe that repealing the ban should improve the market for domestic oil production by giving U.S. producers access to higher-priced international markets. Given the legislation’s recent passage, it is premature to predict the nature and extent of its impact, although oil markets are subject to many variables, including global economic conditions, exchange rates, and worldwide oil production levels.
Oil Marketing
Prices received in a regional market fluctuate frequently and can differ from NYMEX pricing due to a variety of reasons, including supply and/or demand factors, crude oil quality and location differentials. The oil differentials we received in the Gulf Coast and Rocky Mountain regions are discussed in further detail below.
Crude oil prices in the Gulf Coast region are impacted significantly by the changes in prices received for our crude oil sold under Light Louisiana Sweet (“LLS”) index prices relative to the change in NYMEX prices. Overall, during 2015, we sold approximately 62% of our crude oil at prices based on, or partially tied to, the LLS index price, and the balance at prices based on various other indexes tied to NYMEX prices, primarily in the Rocky Mountain region. The average LLS-to-NYMEX differential (on a trade-month basis) was a positive $3.72 per Bbl during 2015, compared to a positive $3.88 per Bbl during 2014 and a positive $11.10 per Bbl in 2013. During 2015, our light sweet crude oil production in the Gulf Coast region, on average, sold for $0.56 per Bbl over NYMEX compared to $1.80 per Bbl over NYMEX in 2014 and $7.44 per Bbl over NYMEX in 2013. Our current markets at various sales points along the Gulf Coast have sufficient demand to accommodate our production, but there can be no assurance of future demand. We are, therefore, monitoring the marketplace for opportunities to strategically enter into long-term marketing arrangements.
The marketing of our Rocky Mountain region oil production is dependent on transportation through local pipelines to market centers in Guernsey, Wyoming; Clearbrook, Minnesota; Wood River, Illinois; and most recently Cushing, Oklahoma. Shipments on some of the pipelines are at or near capacity and may be subject to apportionment. We currently have access to, or have contracted for, sufficient pipeline capacity to move our oil production; however, there can be no assurance that we will be allocated sufficient pipeline capacity to move all of our oil production in the future. Because local demand for production is small in comparison to current production levels, much of the production in the Rocky Mountain region is transported to markets outside
18
of the region. Therefore, prices in the Rocky Mountain region are further influenced by fluctuations in prices (primarily Brent and LLS) in coastal markets and by available pipeline capacity in the Midwest and Cushing markets. For the year ended December 31, 2015, the discount for our oil production in the Rocky Mountain region averaged $5.60 per Bbl, compared to $10.19 per Bbl during 2014 and $8.10 per Bbl during 2013.
Natural Gas Marketing
Virtually all of our natural gas production in the Gulf Coast region is close to existing pipelines; consequently, we generally have a variety of options to market our natural gas. However, our natural gas production in the Rocky Mountain region, like our oil production, is dependent on, among other factors, limited transportation options that can affect our ability to find markets for it. We sell the majority of our natural gas on one-year contracts, with prices fluctuating month to month based on published pipeline indices and with slight premiums or discounts to the index.
COMPETITION AND MARKETS
We face competition from other oil and natural gas companies in all aspects of our business, including acquisition of producing properties, oil and gas leases, drilling rights, and CO2 properties; marketing of oil and natural gas; and obtaining and maintaining goods, services and labor. Many of our competitors have substantially larger financial and other resources. Factors that affect our ability to acquire producing properties include available liquidity, available information about prospective properties and our expectations for earning a minimum projected return on our investments. Because of the primary nature of our core assets (our tertiary operations) and our ownership of relatively uncommon significant natural sources of CO2 in the Gulf Coast and Rocky Mountain regions, we believe that we are effective in competing in the market and have less competition than our peers in certain aspects of our business.
The demand for qualified and experienced field personnel to drill wells and conduct field operations and for geologists, geophysicists, engineers and other professionals in the oil and gas industry can fluctuate significantly, often in correlation with commodity prices, causing periodic shortages in such personnel. In recent years, the competition for qualified technical personnel has been extensive, and our personnel costs have been escalating. There have also been periods with shortages of drilling rigs and other equipment, as demand for rigs and equipment has increased along with the number of wells being drilled. These factors also cause significant increases in costs for equipment, services and personnel. We cannot be certain when we will experience these issues, and these types of shortages or price increases could significantly decrease our profit margin, cash flow and operating results, and cause significant delays in our development operations.
FEDERAL AND STATE REGULATIONS
Numerous federal, state and local laws and regulations govern the oil and gas industry. Additions or changes to these laws and regulations are often made in response to the current political or economic environment. Compliance with the evolving regulatory landscape is often difficult, and substantial penalties may be incurred for noncompliance. Additionally, the future annual cost of complying with all laws and regulations applicable to our operations is uncertain and will be ultimately determined by several factors, including future changes to legal and regulatory requirements. Management believes that continued compliance with existing laws and regulations applicable to our operations and future compliance therewith will not have a materially adverse effect on our consolidated financial position, results of operations or cash flows, although such laws and regulations, and compliance therewith, could cause significant delays or otherwise impede operations, which may, among other things, cause our expected production rates and cash flows to be less than anticipated.
The following sections describe some specific laws and regulations that may affect us. We cannot predict the cost or impact of these or other future legislative or regulatory initiatives.
Regulation of Natural Gas and Oil Exploration and Production
Our operations are subject to various types of regulation at the federal, state and local levels. Such regulation includes requiring permits for drilling wells; maintaining bonding requirements in order to drill or operate wells and regulating the location of wells; the method of drilling and casing wells; the surface use and restoration of properties upon which wells are drilled; the plugging and abandoning of wells; and the composition or disposal of chemicals and fluids used in connection with operations. Our operations are also subject to various conservation laws and regulations. These include regulation of the size of drilling, spacing or proration units and the density of wells that may be drilled in those units, and the unitization or pooling of oil and gas properties. In addition,
19
state conservation laws, which establish maximum rates of production from oil and gas wells, generally prohibit or restrict the venting or flaring of natural gas and impose certain requirements regarding the ratability of production. The effect of these laws and regulations may limit the amount of oil and natural gas we can produce from our wells and may limit the number of wells or the locations at which we can drill. Regulatory requirements and compliance relative to the oil and gas industry increase our costs of doing business and, consequently, affect our profitability.
Federal Regulation of Sales Prices and Transportation
The transportation of, and certain sales with respect to, natural gas in interstate commerce are heavily regulated by agencies of the U.S. federal government and are affected by, among other things, the availability, terms and cost of transportation. Notably, the price and terms of access to pipeline transportation are subject to extensive U.S. federal and state regulation. The Federal Energy Regulatory Commission (“FERC”) is continually proposing and implementing new and/or modified rules and regulations affecting the natural gas industry, some of which may adversely affect the availability and reliability of interruptible transportation service on interstate pipelines. While our sales of crude oil, condensate and natural gas liquids are not currently subject to FERC regulation, our ability to transport and sell such products is dependent on certain pipelines whose rates, terms and conditions of service are subject to FERC regulation. Additional proposals and proceedings that might affect the natural gas industry are considered from time to time by Congress, FERC, state regulatory bodies and the courts, and we cannot predict when or if any such proposals or proceedings might become effective and their effect or impact, if any, on our operations.
Federal Energy and Climate Change Legislation and Regulation
In early 2012, the President signed the Pipeline Safety, Regulatory Certainty and Job Creation Act of 2011. This act, among other things, updates federal pipeline safety standards, increases penalties for violations of such standards, gives the Department of Transportation’s Pipeline and Hazardous Materials Safety Administration (the “PHMSA”) authority for new damage prevention and incident notification, and directs the PHMSA to prescribe new minimum safety standards for CO2 pipelines, which safety standards could affect our operations and the costs thereof. While the PHMSA has adopted or proposed to adopt a number of new regulations to implement this act, no new minimum safety standards have been proposed or adopted for CO2 pipelines. In the future, Congress may create new incentives for alternative energy sources and may also consider legislation to reduce emissions of CO2 or other greenhouse gases. This legislation, if enacted, could (1) impose a tax or other economic penalty on the production of fossil fuels that, when used, ultimately release CO2, (2) reduce the demand for, and uses of, oil, gas and other minerals, and/or (3) increase the costs incurred by us in our exploration and production activities. The EPA has promulgated regulations requiring permitting for certain sources of greenhouse gas emissions, and in August 2015, proposed regulations to reduce methane and volatile organic compound emissions from the oil and gas sector. The proposed rule, which the EPA expects to finalize in 2016, would impose additional costs related to compliance with new emission limits, as well as inspections and maintenance of several types of equipment used in our operations. At the same time, legislation or regulation to reduce the emissions of CO2 or other greenhouse gases could also create economic incentives for technologies and practices that reduce or avoid such emissions, including processes that recognize the associated storage of CO2 in oil and gas reservoirs through CO2 EOR operations.
Natural Gas Gathering Regulations
State and federal regulation of natural gas gathering facilities generally includes various safety, environmental and, in some circumstances, nondiscriminatory-take requirements. With the increase in construction and operation of natural gas gathering lines in various states, natural gas gathering is receiving greater regulatory scrutiny from state and federal regulatory agencies, which is likely to continue in the future.
Federal, State or Indian Leases
Our operations on federal, state or Indian oil and gas leases, especially those in the Rocky Mountain region, are subject to numerous restrictions, including nondiscrimination statutes. Such operations must be conducted pursuant to certain on-site security regulations and other permits and authorizations issued by the Bureau of Land Management, the Bureau of Ocean Energy Management, the Bureau of Safety and Environmental Enforcement, the Bureau of Indian Affairs, and other federal and state stakeholder agencies. In 2015, the Department of Interior issued new regulations governing hydraulic fracturing on public and tribal lands, which regulations are currently enjoined pursuant to a court order and are subject to ongoing litigation, thus creating uncertainty regarding the future costs of hydraulic fracturing operations. However, our current hydraulic fracturing activity is limited.
20
Environmental Regulations
Our oil and natural gas production, saltwater disposal operations, injection of CO2, and the processing, handling and disposal of materials such as hydrocarbons and naturally occurring radioactive materials (“NORM”) are subject to stringent regulation. We could incur significant costs, including cleanup costs resulting from a release of product, third-party claims for property damage and personal injuries, or penalties and other sanctions as a result of any violations or liabilities under environmental laws and regulations or other laws and regulations applicable to our operations. Changes in, or more stringent enforcement of, environmental laws and other laws applicable to our operations could also result in delays or additional operating costs and capital expenditures.
Various federal, state and local laws and regulations controlling the discharge of materials into the environment, or otherwise relating to the protection of the environment and human health, directly impact our oil and gas exploration, development and production operations. These include, among others, (1) regulations adopted by the EPA and various state agencies regarding approved methods of disposal for certain hazardous and nonhazardous wastes; (2) the Comprehensive Environmental Response, Compensation, and Liability Act and analogous state laws that regulate the removal or remediation of previously disposed wastes (including wastes disposed of or released by prior owners or operators), property contamination (including groundwater contamination), and remedial plugging operations to prevent future contamination; (3) the Clean Air Act and comparable state and local requirements already applicable to our operations and new restrictions on air emissions from our operations, including greenhouse gas emissions and those that could discourage the production of fossil fuels that, when used, ultimately release CO2; (4) the Oil Pollution Act of 1990, which contains numerous requirements relating to the prevention of, and response to, oil spills into waters of the United States; (5) the Resource Conservation and Recovery Act, which is the principal federal statute governing the treatment, storage and disposal of hazardous wastes; (6) the Endangered Species Act and counterpart state legislation, which protects certain species (and their related habitats), including certain species that could be present on our leases, as threatened or endangered; and (7) state regulations and statutes governing the handling, treatment, storage and disposal of NORM and other wastes.
Management believes that we are currently in substantial compliance with existing applicable environmental laws and regulations, and does not currently anticipate that future compliance will have a materially adverse effect on our consolidated financial position, results of operations or cash flows, although such laws and regulations, and compliance therewith, could cause significant delays or otherwise impede operations, which may, among other things, cause our expected production rates and cash flows to be less than anticipated.
Hydraulic Fracturing
During 2015, we fracture stimulated five existing wells at Hartzog Draw Field and one water source well at Tinsley Field utilizing water-based fluids with no diesel fuel component. We currently have plans to hydraulically fracture one additional water source well at Tinsley Field during 2016. We are familiar with the laws and regulations applicable to hydraulic fracturing operations and take steps to ensure compliance with these requirements.
ESTIMATED NET QUANTITIES OF PROVED OIL AND NATURAL GAS RESERVES AND PRESENT VALUE OF ESTIMATED FUTURE NET REVENUES
Internal Controls Over Reserve Estimates
Reserve information in this report is based on estimates prepared by D&M, an independent petroleum engineering consulting firm located in Dallas, Texas, utilizing data provided by our internal reservoir engineering team and is the responsibility of management. We rely on D&M’s expertise to ensure that our reserve estimates are prepared in compliance with SEC rules and regulations and that appropriate geologic, petroleum engineering, and evaluation principles and techniques are applied in accordance with practices generally recognized by the petroleum industry as presented in the publication of the Society of Petroleum Engineers entitled “Standards Pertaining to the Estimating and Auditing of Oil and Gas Reserves Information (Revision as of February 19, 2007)”. The person responsible for the preparation of the reserve report is a Senior Vice President at D&M; he is a Registered Professional Engineer in the State of Texas. He received a Bachelor of Science degree in Petroleum Engineering at Texas A&M University in 1974, and he has in excess of 41 years of experience in oil and gas reservoir studies and evaluations. Our Chief Operating Officer is primarily responsible for overseeing the independent petroleum engineering firm during the process. Our Chief Operating Officer has a Bachelor of Science degree in Engineering, Civil Specialty, from the Colorado School of Mines and over 26 years of industry experience working with petroleum reserve estimates. D&M relies on various data provided by our internal reservoir engineering team in preparing its reserve estimates, including such items as oil and natural gas prices, ownership
21
interests, production information, operating costs, planned capital expenditures and other technical data. Our internal reservoir engineering team consists of qualified petroleum engineers who maintain the Company’s internal evaluation of reserves and compare the Company’s information to the reserves prepared by D&M. Management is responsible for designing the internal control procedures used in the preparation of our oil and gas reserves, which include verification of data input into reserve forecasting and economics evaluation software, as well as multi-discipline management reviews. The internal reservoir engineering team reports directly to our Chief Operating Officer. In addition, our Board of Directors’ Reserves and Health, Safety and Environmental (“HSE”) Committee, on behalf of the Board of Directors, oversees the qualifications, independence, performance and hiring of our independent petroleum engineering firm and reviews the final report and subsequent reporting of our oil and natural gas reserve estimates. The Chairman of the Reserves and HSE Committee holds a Ph.D. in Chemical Engineering from the Massachusetts Institute of Technology and bachelor’s degrees in Chemistry and Mathematics from Capital University in Ohio. He has more than 35 years of industry experience, with responsibilities including reserves preparation and approval.
Oil and Natural Gas Reserve Estimates
D&M prepared estimates of our net proved oil and natural gas reserves as of December 31, 2015, 2014 and 2013. See the summary of D&M’s report as of December 31, 2015, included as an exhibit to this Form 10-K. These estimates of reserves were prepared using an average price equal to the unweighted arithmetic average of hydrocarbon prices on the first day of each month within the 12-month period in accordance with rules and regulations of the SEC. These oil and natural gas reserve estimates do not include any value for probable or possible reserves that may exist, nor do they include any value for undeveloped acreage. The reserve estimates represent our net revenue interest in our properties. During 2015, we provided oil and natural gas reserve estimates for 2014 to the United States Energy Information Agency that were substantially the same as the reserve estimates included in our Form 10-K for the year ended December 31, 2014.
Our proved non-producing reserves primarily relate to reserves that are to be recovered from productive zones that currently require a response to performance modifications before they can be classified as proved developed producing. Since a majority of our properties are in areas with multiple pay zones, these properties may have both proved producing and proved non-producing reserves.
As of December 31, 2015, our estimated proved undeveloped reserves totaled approximately 59.2 MMBOE, or approximately 21% of our estimated total proved reserves, a decline of 39.7 MMBOE from December 31, 2014 levels for these reserves, which changes are discussed below. Approximately 85% (50 MMBOE) of our proved undeveloped oil reserves relate to our CO2 tertiary operations. We generally consider the CO2 tertiary proved undeveloped reserves to be lower risk than other proved undeveloped reserves that require drilling at locations offsetting existing production, because all of these proved undeveloped reserves are associated with tertiary recovery operations in fields and reservoirs that historically produced substantial volumes of oil under primary production.
During 2015, we spent approximately $65 million to convert 10.7 MMBOE of proved undeveloped reserves to proved developed reserves, primarily related to continued tertiary development activities at Bell Creek, Heidelberg, and Brookhaven fields, as well as non-tertiary development at CCA. Other changes during 2015 included adding 2.2 MMBOE of proved undeveloped reserves primarily related to our non-tertiary operations at CCA; reclassifying 15.4 MMBOE of proved undeveloped reserves to unproved reserves pursuant to the five-year development rule established by the SEC primarily due to changes in our development plans; and recognizing other net downward proved undeveloped reserve revisions of 15.8 MMBOE, primarily the result of reserves that were determined to be uneconomic based on 2015 average oil and natural gas prices used in estimating our proved reserves, including approximately 35 Bcf (6 MMBOE) of Riley Ridge natural gas reserves. Included in the net downward revisions are positive performance revisions partially offsetting the decline in proved undeveloped reserves, primarily related to increased recovery factors at Tinsley and Oyster Bayou fields.
As of December 31, 2015, 30.0 MMBOE of our total proved undeveloped reserves are not scheduled to be developed within five years of initial booking, nearly all of which are part of CO2 EOR projects. We believe these reserves satisfy the conditions to be included as proved reserves because (1) we have established and continue to follow the previously adopted development plan for each of these projects; (2) we have significant ongoing development activities in each of these CO2 EOR projects and (3) we have a historical record of completing the development of comparable long-term projects.
22
The following table provides certain estimated proved reserve information in total and by category, as well as related pricing information as of December 31, 2015, 2014 and 2013. There are numerous uncertainties inherent in estimating quantities of proved oil and natural gas reserves and their values, including many factors beyond our control. Proved oil and natural gas reserve quantities and values presented in the table reflect the significant decline in commodity prices between December 31, 2015 and 2014, whereby the average first-day-of-the-month NYMEX oil price used in estimating our proved reserves declined from $94.99 per Bbl at December 31, 2014, to $50.28 per Bbl at December 31, 2015, and for natural gas declined from $4.30 per MMBtu at December 31, 2014, to $2.63 per MMBtu at December 31, 2015. These commodity price changes resulted in a decline of approximately 126 MMBOE (29%) in our proved reserves from December 31, 2014, through December 31, 2015, approximately half of which was attributable to natural gas reserves at Riley Ridge that were reclassified and are no longer considered proved reserves. See also Oil and Natural Gas Operations – Field Summary Table, Item 1A, Risk Factors – Estimating our reserves, production and future net cash flows is difficult to do with any certainty, and Supplemental Oil and Natural Gas Disclosures (Unaudited) to the Consolidated Financial Statements for further discussion of reserve inputs and changes between periods.
December 31, | |||||||||||
2015 | 2014 | 2013 | |||||||||
Estimated proved reserves | |||||||||||
Oil (MBbls) | 282,250 | 362,335 | 386,659 | ||||||||
Natural gas (MMcf) | 38,305 | 452,402 | 489,954 | ||||||||
Oil equivalent (MBOE) | 288,634 | 437,735 | 468,318 | ||||||||
Reserve volumes categories | |||||||||||
Proved developed producing | |||||||||||
Oil (MBbls) | 190,422 | 240,004 | 245,722 | ||||||||
Natural gas (MMcf) | 36,150 | 72,799 | 68,976 | ||||||||
Oil equivalent (MBOE) | 196,447 | 252,137 | 257,218 | ||||||||
Proved developed non-producing | |||||||||||
Oil (MBbls) | 32,638 | 29,373 | 30,670 | ||||||||
Natural gas (MMcf) | 1,801 | 343,622 | 3,119 | ||||||||
Oil equivalent (MBOE) | 32,938 | 86,643 | 31,190 | ||||||||
Proved undeveloped | |||||||||||
Oil (MBbls) | 59,190 | 92,958 | 110,267 | ||||||||
Natural gas (MMcf) | 354 | 35,981 | 417,859 | ||||||||
Oil equivalent (MBOE) | 59,249 | 98,955 | 179,910 | ||||||||
Percentage of total MBOE | |||||||||||
Proved developed producing | 68 | % | 57 | % | 55 | % | |||||
Proved developed non-producing | 11 | % | 20 | % | 7 | % | |||||
Proved undeveloped | 21 | % | 23 | % | 38 | % | |||||
Representative oil and natural gas prices (1) | |||||||||||
Oil – NYMEX | $ | 50.28 | $ | 94.99 | $ | 96.94 | |||||
Natural gas – Henry Hub | 2.63 | 4.30 | 3.67 | ||||||||
Present values (in thousands) (2) | |||||||||||
Discounted estimated future net cash flows before income taxes (PV-10 Value) (3) | $ | 2,318,555 | $ | 8,748,069 | $ | 10,633,783 | |||||
Standardized measure of discounted estimated future net cash flows after income taxes (“Standardized Measure”) | $ | 1,890,124 | $ | 5,908,128 | $ | 7,128,744 | |||||
(1) | The reference prices were based on the arithmetic average of the first-day-of-the-month NYMEX commodity prices for each month during the respective year. These prices do not reflect adjustments for market differentials by field that are utilized in the preparation of our reserve report to arrive at the appropriate net price we receive, and also do not reflect the continued oil price declines in late 2015 and early 2016. In response to these price decreases, we have deferred our development spending for certain projects in 2016, which has been reflected in our December 31, 2015 reserve report. See Item 7, Management’s |
23
Discussion and Analysis of Financial Condition and Results of Operations – Results of Operations – Operating Results Table for details of oil and natural gas prices received, both including and excluding the impact of derivative settlements.
(2) | Determined based on the average first-day-of-the-month prices for each month, adjusted to prices received by field in accordance with standards set forth in the FASC. PV-10 Values and the Standardized Measure are significantly impacted by the oil prices we receive relative to NYMEX oil prices (our NYMEX oil price differential). The weighted-average oil price differentials utilized were $2.17 per Bbl below representative NYMEX oil prices as of December 31, 2015, compared to $3.10 per Bbl below NYMEX oil prices as of December 31, 2014, and $3.41 per Bbl above NYMEX oil prices as of December 31, 2013. |
(3) | PV-10 Value is a non-GAAP measure and is different from the Standardized Measure in that PV-10 Value is a pre-tax number and the Standardized Measure is an after-tax number. The information used to calculate PV-10 Value is derived directly from data determined in accordance with FASC Topic 932. The difference between these two amounts, the discounted estimated future income tax, was $428.4 million at December 31, 2015; $2.84 billion at December 31, 2014; and $3.51 billion at December 31, 2013. We believe that PV-10 Value is a useful supplemental disclosure to the Standardized Measure because the Standardized Measure can be impacted by a company’s unique tax situation, and it is not practical to calculate the Standardized Measure on a property-by-property basis. Because of this, PV-10 Value is a widely used measure within the industry and is commonly used by securities analysts, banks and credit rating agencies to evaluate the estimated future net cash flows from proved reserves on a comparative basis across companies or specific properties. PV-10 Value is commonly used by us and others in our industry to evaluate properties that are bought and sold and to assess the potential return on investment in our oil and natural gas properties. PV-10 Value is not a measure of financial or operating performance under GAAP, nor should it be considered in isolation or as a substitute for the Standardized Measure. Our PV-10 Value and the Standardized Measure do not purport to represent the fair value of our oil and natural gas reserves. See Glossary and Selected Abbreviations for the definition of “PV-10 Value” and see Supplemental Oil and Natural Gas Disclosures (Unaudited) to the Consolidated Financial Statements for additional disclosures about the Standardized Measure. |
Item 1A. Risk Factors
Oil and natural gas prices are volatile. A sustained period of oil prices at their current low levels or their further deterioration is likely to adversely affect our future financial condition, results of operations, cash flows and the carrying value of our oil and natural gas properties.
Oil prices have historically been volatile, with NYMEX oil prices ranging from $35 to $111 per Bbl over the last three calendar years, and prices have declined dramatically since the fourth quarter of 2014 to less than $27 per Bbl in January 2016, the lowest level in over 13 years. Even if oil prices recover for a period of time, volatility will remain, and prices could move downward or upward on a rapid or repeated basis, which can make transactions, valuations and business strategies difficult. Our cash flow from operations is highly dependent on the prices that we receive for oil. Oil prices currently affect us more than natural gas prices because oil comprised approximately 95% of our 2015 production and approximately 98% of our proved reserves at December 31, 2015. The prices for oil and natural gas are subject to a variety of factors that are beyond our control. These factors include the supply of, and demand for, these commodities, which fluctuate with changes in market and economic conditions and other factors, including:
• | the level of worldwide consumer demand for oil and natural gas and the domestic and foreign supply of oil and natural gas and levels of domestic oil and gas storage; |
• | the degree to which members of the Organization of Petroleum Exporting Countries maintain oil price and production controls; |
• | the degree to which domestic oil and natural gas production decreases U.S. imports of crude oil; |
• | worldwide political events and conditions, including actions taken by foreign oil and natural gas producing nations; and |
• | worldwide economic conditions. |
Due to the sustained period of low oil prices, the PV-10 Value of our estimated proved reserves was less than our outstanding indebtedness as of December 31, 2015. If oil prices remain at current levels or decline further for an extended period of time, we could be harmed in a number of ways, including:
•lower cash flows from operations may require continued or further reduced levels of capital expenditures;
24
• | reduced levels of capital expenditures in turn could lower our present and future production levels, and lower the quantities and value of our oil and gas reserves, which constitute our major asset; |
• | our lenders could further reduce our borrowing base, and we may not be able to raise capital at attractive rates in the public markets; |
• | we could be forced to increase our level of indebtedness, issue additional equity, or sell assets; |
• | we could have difficulty repaying or refinancing our indebtedness; |
• | we could be required to impair various assets, including a further write-down of our oil and natural gas assets or the value of other tangible or intangible assets; |
• | construction of plants that produce CO2 as a byproduct that we can purchase could be delayed or cancelled, thus limiting the amount of industrial-source CO2 available for use in our tertiary operations; and/or |
• | our potential cash flows from our commodity derivative contracts that include sold puts could be limited to the extent that oil prices are below the prices of those sold puts. |
If oil prices remain low, some or all of our tertiary projects could become uneconomical. We may further decide to suspend future expansion projects, and if prices were to drop below our operating cash break-even points for an extended period of time, we may further decide to shut-in existing production, both of which could have a material adverse effect on our operations, financial condition and reduce our production.
A financial downturn in one or more of the world’s major markets could negatively affect our liquidity, business and financial condition.
Liquidity is essential to our business. Our liquidity could be substantially negatively affected by an inability to obtain capital in the long-term or short-term debt capital markets or equity capital markets or an inability to access bank financing. A prolonged credit crisis, further drops in economic growth rates in China, a severe economic contraction in Europe or turmoil in the global financial system, could materially affect our liquidity, business and financial condition. In the past, such conditions have adversely impacted financial markets and have created substantial volatility and uncertainty with the related negative impact on global economic activity. Negative credit market conditions could inhibit our lenders from fully funding our bank credit facility or cause them to make the terms of our bank credit facility more costly and more restrictive. Negative economic conditions could also adversely affect the collectability of our trade receivables or performance by our suppliers or cause our commodity hedging arrangements to be ineffective if our counterparties are unable to perform their obligations or otherwise seek bankruptcy protection.
If we cannot meet the New York Stock Exchange’s (“NYSE”) “price criteria” continued listing standard, the NYSE may delist our common shares, which could have an adverse impact on the trading volume, liquidity and market price of our common shares.
If we do not maintain an average closing price of $1.00 or more for our common stock over any consecutive 30 trading-day period, the NYSE may delist our common shares for a failure to maintain compliance with the price criteria continued listing standard. As of February 18, 2016, the average closing price of our common shares over the immediately preceding consecutive 30 trading-day period was $1.32. The NYSE Listed Company Manual sets out rules and processes to cure non-compliance with this standard. For instance, upon approval from the NYSE, an issuer generally has six months to cure the listing standard related to stock price (such as a reverse-stock split), during which time the issuer’s common stock would continue to be traded on the NYSE, subject to compliance with the other continued listing standards. A delisting of our common shares from the NYSE could negatively impact us because it could: (1) reduce the liquidity and market price of our common shares; (2) reduce the number of investors willing to hold or acquire our common shares, which could negatively impact our ability to raise equity financing; (3) limit our ability to use a registration statement to offer and sell freely tradable securities, thereby preventing us from accessing the public capital markets, and/or (4) affect our ability to provide equity incentives to our employees.
Our level of indebtedness may adversely affect operations and limit our growth.
As of December 31, 2015, our outstanding senior indebtedness consisted of $2.9 billion principal amount of subordinated notes, virtually all of which have maturity dates between 2021 and 2023 at interest rates ranging from 4.625% to 6.375% per annum at a weighted average interest rate of 5.26% per annum, and $175.0 million principal amount outstanding under our bank credit facility. As of February 19, 2016, we have a borrowing base of $2.6 billion and aggregate lender commitments of $1.5 billion under our bank credit facility and availability with respect to such commitments of $1.3 billion. Our bank borrowing base is adjusted semi-annually in May and November of each year, and upon requested unscheduled special redeterminations, in each case at the banks’ discretion, and the amount is established and based, in part, upon certain external factors, such as commodity
25
prices. We do not know, nor can we control, the results of such redeterminations or the effect of then-current oil and natural gas prices on any such redetermination. A future redetermination lowering our borrowing base could limit availability under our bank credit facility. If the outstanding debt under our bank credit facility were to ever exceed the borrowing base, we would be required to repay the excess amount over a period not to exceed six months.
The level of our indebtedness could have important consequences, including but not limited to the following:
• | increasing our vulnerability to general adverse economic and industry conditions; |
• | impairing our ability to obtain additional financing in the future for working capital, capital expenditures, acquisitions, development activities or general corporate and other purposes; |
• | potentially restricting us from making acquisitions or exploiting business opportunities; |
• | lowering our available cash flow if market interest rates increase or if the level of our indebtedness significantly increases; |
• | requiring dedication of a substantial portion of our cash flows from operations to servicing our indebtedness (so that such cash flows would not be available for capital expenditures or other purposes); |
• | limiting our ability to borrow additional funds, dispose of assets, pay dividends, fund share repurchases and make certain investments; and/or |
• | placing us at a competitive disadvantage as compared to our competitors that have less debt. |
The debt covenants contained in the agreements governing our outstanding indebtedness may also affect our flexibility in reacting to changes in the economy and in our industry. For example, as our cash flow from operations is highly dependent on the prices that we receive for oil and natural gas, if oil and natural gas prices continue to remain at current levels for an extended period of time, our degree of leverage could increase significantly or our leverage metrics could deteriorate, potentially causing us to not be in compliance with our bank credit facility’s covenants (see Item 7, Management’s Discussion and Analysis of Financial Condition and Results of Operations – Capital Resources and Liquidity – Bank Credit Facility).
Any failure to meet our debt obligations or comply with the debt covenants contained in the agreements governing our outstanding indebtedness could harm our business, financial condition and results of operations.
We expect our cash flows to vary significantly from year to year due to the cyclical nature of our business. A sustained period of low oil prices or their further deterioration may cause us to be unable to make required payments on our indebtedness. If we are unable to generate sufficient cash flows or otherwise obtain funds necessary to make required payments on our indebtedness, or if we otherwise fail to comply with the various covenants, specified financial ratios and financial condition tests related to such indebtedness, including covenants in our bank credit facility, we would be in default under our debt instruments. Any such default, if not cured or waived, could permit the holders of such indebtedness to accelerate the maturity of such indebtedness and could cause defaults under other indebtedness, which could have a material adverse effect on us. In addition, any failure to make scheduled payments of interest and principal on our outstanding indebtedness would likely result in a reduction of our credit rating, which could harm our ability to incur additional indebtedness on acceptable terms. Our ability to meet our obligations under our debt instruments will depend, in part, upon our future performance, which will be subject to prevailing economic conditions, commodity prices, and financial, business and other factors, including factors beyond our control.
A cyber incident could occur and result in information theft, data corruption, operational disruption, and/or financial loss.
Our business has become increasingly dependent on digital technologies to conduct day-to-day operations, including certain of our exploration, development and production activities. We depend on digital technology, among other things, to estimate quantities of oil and natural gas reserves; process and record financial and operating data; analyze seismic and drilling information; process wire transfers and store our banking information; monitor and control pipeline and plant equipment; process and store personally identifiable information of our employees and royalty owners; and communicate with employees, stakeholders and business associates. Our technologies, systems and networks may become the target of cyber attacks or information security breaches that could result in the disruption of our business operations and/or financial loss. For example, unauthorized access to our seismic data, reserves information or other proprietary information could lead to data corruption, communication interruption, or other operational disruptions in our drilling or production operations.
Although we utilize various procedures and controls to monitor and protect against these threats and to mitigate our exposure to such threats, there can be no assurance that these procedures and controls will be sufficient in preventing security threats from materializing and causing us to suffer such losses in the future. As cyber threats continue to evolve, we may be required to expend
26
significant additional resources to continue to modify or enhance our procedures and controls or to investigate and remediate any cyber vulnerabilities.
Oil and natural gas development and producing operations involve various risks.
Our operations are subject to all the risks normally incident and inherent to the operation and development of oil and natural gas properties and the drilling of oil and natural gas wells, including, without limitation, well blowouts; cratering and explosions; pipe failure; fires; formations with abnormal pressures; uncontrollable flows of oil, natural gas, brine or well fluids; release of contaminants into the environment and other environmental hazards and risks. In addition, our operations are sometimes near populated commercial or residential areas, which add additional risks. The nature of these risks is such that some liabilities could exceed our insurance policy limits or otherwise be excluded from, or limited by, our insurance coverage, as in the case of environmental fines and penalties, for example, which are excluded from coverage as they cannot be insured.
We could incur significant costs related to these risks that could have a material adverse effect on our results of operations, financial condition and cash flows. If these costs were to increase significantly, it could have an adverse effect upon the profitability of these operations. Additionally, a portion of our production activities involves CO2 injections into fields with wells plugged and abandoned by prior operators. However, it is often difficult (or impracticable) to determine whether a well has been properly plugged prior to commencing injections and pressuring the oil reservoirs. We may incur significant costs in connection with remedial plugging operations to prevent environmental contamination and to otherwise comply with federal, state and local regulations relative to the plugging and abandoning of our oil, natural gas and CO2 wells. In addition to the increased costs, if wells have not been properly plugged, modification to those wells may delay our operations and reduce our production.
While mitigated somewhat by our significant emphasis on tertiary recovery operations in fields and reservoirs that have historically produced substantial volumes of oil under primary production, development activities are subject to many risks, including the risk that we will not recover all or any portion of our investment in such wells. Drilling for oil and natural gas may involve unprofitable efforts, not only from dry wells, but also from wells that are productive but do not produce sufficient net reserves to return a profit after deducting drilling, operating and other costs. The cost of drilling, completing and operating a well is often uncertain, and cost factors can adversely affect the economics of a project. Further, our drilling operations may be curtailed, delayed or canceled as a result of numerous factors, including:
• | unexpected drilling conditions; |
• | title problems; |
• | pressure or irregularities in formations; |
• | equipment failures or accidents; |
• | adverse weather conditions, including hurricanes and tropical storms in and around the Gulf of Mexico that can damage oil and natural gas facilities and delivery systems and disrupt operations, and winter conditions and forest fires in the Rocky Mountain region that can delay or impede operations; |
• | compliance with environmental and other governmental requirements; and |
• | the cost of, or shortages or delays in the availability of, drilling rigs, equipment, pipelines and services. |
Estimating our reserves, production and future net cash flows is difficult to do with any certainty.
Estimating quantities of proved oil and natural gas reserves is a complex process. It requires interpretations of available technical data and various assumptions, including assumptions relating to economic factors such as future commodity prices, production costs, severance and excise taxes, capital expenditures and workover and remedial costs, and the assumed effect of governmental rules and regulations. There are numerous uncertainties about when a property may have proved reserves as compared to potential or probable reserves, particularly relating to our tertiary recovery operations. Forecasting the amount of oil reserves recoverable from tertiary operations, and the production rates anticipated therefrom, requires estimates, one of the most significant being the oil recovery factor. Actual results most likely will vary from our estimates. Also, the use of a 10% discount factor for reporting purposes, as prescribed by the SEC, may not necessarily represent the most appropriate discount factor, given actual interest rates and risks to which our business, and the oil and natural gas industry in general, are subject. Any significant inaccuracies in these interpretations or assumptions, or changes of conditions, could result in a revision of the quantities and net present value of our reserves.
The reserves data included in documents incorporated by reference represent estimates only. Quantities of proved reserves are estimated based on economic conditions, including first-day-of-the-month average oil and natural gas prices for the 12-month
27
period preceding the date of the assessment. The representative oil and natural gas prices used in estimating our December 31, 2015 reserves were $50.28 per Bbl for crude oil and $2.63 per MMBtu for natural gas, both of which were adjusted for market differentials by field. Rapid crude oil price declines beginning in late 2014 have resulted in a significant decrease in our proved reserve value, and to a lesser degree, a reduction in our proved reserve volumes, which has caused us to record write-downs due to the full cost ceiling test in 2015. As discussed in greater detail below, further declines in oil prices could result in additional write-downs. Our reserves and future cash flows may be subject to revisions based upon changes in economic conditions, including oil and natural gas prices, as well as due to production results, results of future development, operating and development costs, and other factors. Downward revisions of our reserves could have an adverse effect on our financial condition and operating results. Actual future prices and costs may be materially higher or lower than the prices and costs used in our estimates.
As of December 31, 2015, approximately 21% of our estimated proved reserves were undeveloped. Recovery of undeveloped reserves requires significant capital expenditures and may require successful drilling operations. The reserves data assumes that we can and will make these expenditures and conduct these operations successfully, but these assumptions may not be accurate, and these expenditures and operations may not occur.
Our planned tertiary operations and the related construction of necessary CO2 pipelines could be delayed by difficulties in obtaining pipeline rights-of-way and/or permits, and/or by the listing of certain species as threatened or endangered.
The production of crude oil from our planned tertiary operations is dependent upon having access to pipelines to transport available CO2 to our oil fields at a cost that is economically viable. Our current and future construction of CO2 pipelines will require us to obtain rights-of-way from private landowners, state and local governments and the federal government in certain areas. Certain states where we operate have considered or may again consider the adoption of laws or regulations that could limit or eliminate the ability of a pipeline owner or of a state, state’s legislature or its administrative agencies to exercise eminent domain over private property, in addition to possible judicially imposed constraints on, and additional requirements for, the exercise of eminent domain. We also conduct operations on federal and other oil and natural gas leases inhabited by species that could be listed as threatened or endangered under the Endangered Species Act, which listing could lead to tighter restrictions as to federal land use and other land use where federal approvals are required. These laws and regulations, together with any other changes in law related to the use of eminent domain or the listing of certain species as threatened or endangered, could inhibit or eliminate our ability to secure rights-of-way or otherwise access land for current or future pipeline construction projects. As a result, obtaining rights-of-way or other means of access may require additional regulatory and environmental compliance, and increased costs in connection therewith, which could delay our CO2 pipeline construction schedule and initiation of our pipeline operations, and/or increase the costs of constructing our pipelines.
Our future performance depends upon our ability to effectively develop our existing oil and natural gas reserves and find or acquire additional oil and natural gas reserves that are economically recoverable.
Unless we can successfully develop our existing reserves and/or replace the reserves that we produce, our reserves will decline, resulting eventually in a decrease in oil and natural gas production and lower revenues and cash flows from operations. We have historically replaced reserves through both acquisitions and internal organic growth activities. For internal organic growth activities, the magnitude of proved reserves that we can book in any given year depends on our progress with new floods and the timing of the production response. In the future, we may not be able to continue to replace reserves at acceptable costs. The business of exploring for, developing or acquiring reserves is capital intensive. We may not be able to make the necessary capital investment to maintain or expand our oil and natural gas reserves if our cash flows from operations continue to be reduced, whether due to current oil or natural gas prices or otherwise, or if external sources of capital become limited or unavailable. Further, the process of using CO2 for tertiary recovery, and the related infrastructure, requires significant capital investment prior to any resulting and associated production and cash flows from these projects, heightening potential capital constraints. If capital expenditures remain at reduced levels, or if outside capital resources become limited, we will not be able to maintain our current production levels.
During the last few years, we have acquired several fields at a substantial cost because we believe that they have significant additional production potential through tertiary flooding, and we may have the opportunity to acquire other oil fields that we believe are tertiary flood candidates, some of which may require significant amounts of capital. If we are unable to successfully develop and produce the potential oil in any acquired fields, it would negatively affect our return on investment relative to these acquisitions and could significantly reduce our ability to obtain additional capital for the future or fund future acquisitions, and also negatively affect our financial results to a significant degree.
28
Commodity derivative contracts may expose us to potential financial loss.
To reduce our exposure to fluctuations in the prices of oil and natural gas, we enter into commodity derivative contracts in order to economically hedge a portion of our forecasted oil and natural gas production. As of February 18, 2016, we have oil derivative contracts in place covering 36,000 Bbls/d for the first quarter of 2016, 34,000 Bbls/d for the second quarter of 2016, 24,000 Bbls/d for the third quarter of 2016, and 30,000 Bbls/d for the fourth quarter of 2016, with minimal hedges currently in place in early 2017. Such derivative contracts expose us to risk of financial loss in some circumstances, including when there is a change in the expected differential between the underlying price in the hedging agreement and actual prices received, when the cash benefit from hedges including a sold put is limited to the extent oil prices fall below the price of our sold puts, or when the counterparty to the derivative contract is financially constrained and defaults on its contractual obligations. In addition, these derivative contracts may limit the benefit we would otherwise receive from increases in the prices for oil and natural gas.
Shortages of oil field equipment, services and qualified personnel could reduce our cash flow and adversely affect results of operations.
The demand for qualified and experienced field personnel, geologists, geophysicists, engineers and other professionals in the oil and natural gas industry can fluctuate significantly, often in correlation with oil and natural gas prices, causing periodic shortages in such personnel. In the past, during periods of high oil and natural gas prices, we have experienced shortages of oil field and other necessary equipment, including drilling rigs, along with increased prices for such equipment, services and associated personnel. These types of shortages or price increases could significantly decrease our profit margin, cash flow and operating results and/or restrict or delay our ability to drill wells and conduct our operations, possibly causing us to miss our forecasts and projections.
The marketability of our production is dependent upon transportation lines and other facilities, certain of which we do not control. When these facilities are unavailable, our operations can be interrupted and our revenues reduced.
The marketability of our oil and natural gas production depends, in part, upon the availability, proximity and capacity of transportation lines owned by third parties. In general, we do not control these transportation facilities, and our access to them may be limited or denied. A significant disruption in the availability of, and access to, these transportation lines or other production facilities could adversely impact our ability to deliver to market or produce our oil and thereby cause a significant interruption in our operations.
Our production will decline if our access to sufficient amounts of carbon dioxide is limited.
Our long-term strategy is primarily focused on our CO2 tertiary recovery operations. The crude oil production from our tertiary recovery projects depends, in large part, on having access to sufficient amounts of naturally occurring and industrial-sourced CO2. Our ability to produce oil from these projects would be hindered if our supply of CO2 was limited due to, among other things, problems with our current CO2 producing wells and facilities, including compression equipment, catastrophic pipeline failure or our ability to economically purchase CO2 from industrial sources. This could have a material adverse effect on our financial condition, results of operations and cash flows. Our anticipated future crude oil production from tertiary operations is also dependent on the timing, volumes and location of CO2 injections and, in particular, on our ability to increase our combined purchased and produced volumes of CO2 and inject adequate amounts of CO2 into the proper formation and area within each of our tertiary oil fields.
The development of our naturally occurring CO2 sources involves the drilling of wells to increase and extend the CO2 reserves available for use in our tertiary fields. These drilling activities are subject to many of the same drilling and geological risks of drilling and producing oil and gas wells (see Oil and natural gas development and producing operations involve various risks above). Furthermore, recent market conditions may cause the delay or cancellation of construction of plants that produce industrial-source CO2 as a byproduct that we can purchase, thus limiting the amount of industrial-source CO2 available for our use in our tertiary operations.
We may lose executive officers, key management personnel or other talented employees, which could endanger the future success of our operations.
Our success depends to a significant degree upon the continued contributions of our executive officers and other key management personnel. Our employees, including our executive officers, are employed at will and do not have employment
29
agreements. If one or more members of our management team dies, becomes disabled or voluntarily terminates employment with us, there is no assurance that we will find a suitable or comparable substitute. We believe that our future success depends, in large part, upon our ability to hire and retain highly skilled managerial personnel. Historically, a significant portion of the compensation paid to our executive officers and key management personnel has been through long-term grants of Company stock under our 2004 Omnibus Stock and Incentive Plan (the “2004 Plan”). If the shares reserved under the 2004 Plan are depleted, we may be forced to eliminate long-term equity grants, which would have a negative effect on our ability to attract and retain highly skilled managerial personnel. Replacing long-term equity grants with cash compensation would reduce the cash available to fund capital expenditures. Additionally, in a low oil price environment, we could be susceptible to losing talented non-industry professionals (e.g., accountants, attorneys, human resources personnel). Competition for persons with these skills is intense, and we cannot assure that we will be successful in attracting and retaining such skilled and talented personnel.
Governmental laws and regulations relating to environmental protection are costly and stringent.
Our exploration, production, and marketing operations are subject to complex and stringent federal, state, and local laws and regulations governing, among other things, the discharge of substances into the environment or otherwise relating to the protection of human health and the environment, including the protection of endangered species. These laws and regulations and related public policy considerations affect the costs, manner, and feasibility of our operations and require us to make significant expenditures in order to comply. Failure to comply with these laws and regulations may result in the assessment of administrative, civil, and criminal penalties, the imposition of investigatory and remedial obligations, and the issuance of injunctions that could limit or prohibit our operations. In addition, some of these laws and regulations may impose joint and several, strict liability for contamination resulting from spills, discharges, and releases of substances, including petroleum hydrocarbons and other wastes, without regard to fault, or the legality of the original conduct. Under such laws and regulations, we could be required to remove or remediate previously disposed substances and property contamination, including wastes disposed or released by prior owners or operators. Changes in, or additions to, environmental laws and regulations occur frequently, and any changes or additions that result in more stringent and costly waste handling, storage, transport, disposal, cleanup or other environmental protection requirements could have a material adverse effect on our operations and financial position.
Enactment of executive, legislative or regulatory proposals under consideration could negatively affect our business.
Numerous executive, legislative and regulatory proposals affecting the oil and gas industry have been introduced, are anticipated to be introduced, or are otherwise under consideration, by the President, Congress, state legislatures and various federal and state agencies. Among these proposals are: (1) climate change/carbon tax legislation introduced in Congress, and EPA regulations to reduce greenhouse gas emissions; (2) Presidential proposals, along with legislation introduced in Congress (none of which have passed), to impose new fees or taxes on, or repeal various tax deductions available to, oil and gas producers, such as the current tax deductions for intangible drilling and development costs and qualified tertiary injectant expenses which deductions, if eliminated, could raise the cost of energy production, reduce energy investment and affect the economics of oil and gas exploration and production activities; (3) legislation previously considered by Congress (but not adopted) that would subject the process of hydraulic fracturing to federal regulation under the Safe Drinking Water Act, and new, proposed or anticipated Department of Interior and EPA regulations to impose new and more stringent regulatory requirements on hydraulic fracturing activities, particularly those performed on federal lands, and to require disclosure of the chemicals used in the fracturing process; and (4) the Pipeline Safety, Regulatory Certainty, and Job Creation Act enacted in 2011, which increases penalties, grants new authority to impose damage prevention and incident notification requirements, and directs the PHMSA to prescribe minimum safety standards for CO2 pipelines.
In recent years, legislation has been proposed that would, if enacted into law, make significant changes to U.S. federal income tax laws, including the elimination of certain U.S. federal income tax benefits and deductions currently available to oil and gas companies. Such changes include, but are not limited to, (1) the repeal of the percentage depletion allowance for oil and gas properties, (2) the increase of the amortization period of geological and geophysical expenses, (3) the elimination of current deductions for intangible drilling and development costs and qualified tertiary injectant expenses, and (4) the elimination of the deduction for certain U.S. production activities. It is currently unclear whether any such proposals will be enacted into law and, if so, what form such laws might possibly take or impact they may have; however, the passage of such legislation or any other similar change in U.S. federal income tax law could eliminate, reduce or postpone certain tax deductions that are currently available to us or otherwise increase our taxes, and any such legislation or change could negatively affect the after-tax returns generated on our oil and gas investments and our financial condition and results of operations.
30
Any of the foregoing described proposals, including other applicable proposals, could affect our operations and the costs thereof. The trend toward stricter standards, increased oversight and regulation and more extensive permit requirements, along with any future laws and regulations, could result in increased costs or additional operating restrictions that could have an effect on demand for oil and natural gas or prices at which it can be sold. However, until such legislation or regulations are enacted or adopted into law and thereafter implemented, it is not possible to gauge their impact on our future operations or our results of operations and financial condition.
The derivatives market regulations promulgated under the Dodd-Frank Act could have an adverse effect on our ability to hedge risks associated with our business.
The Dodd-Frank Act requires the Commodities Futures Trading Commission (“CFTC”) and the SEC to promulgate rules and regulations establishing federal oversight and regulation of the over-the-counter derivatives market and entities that participate in that market, including swap clearing and trade execution requirements. Our derivative transactions are not currently subject to such swap clearing and trade execution requirements; however, in the event our derivative transactions potentially become subject to such requirements, we believe that our derivative transactions would qualify for the “end-user” exception. New or modified rules, regulations or requirements may increase the cost to our counterparties of their hedging and swap positions that they can provide or lower their availability. In addition, for uncleared swaps, the CFTC or federal banking regulators may require end-users to enter into credit support documentation or post margin collateral. Any changes in the regulations of swaps may result in certain market participants deciding to curtail or cease their derivative activities.
While many rules and regulations have been promulgated and are already in effect, other rules and regulations remain to be finalized or effectuated; therefore, the impact of those rules and regulations on us is uncertain at this time. The Dodd-Frank Act, and the rules promulgated thereunder, could (1) significantly increase the cost, or decrease the liquidity, of energy-related derivatives available to us to hedge against commodity price fluctuations (including through requirements to post collateral), (2) materially alter the terms of derivative contracts, (3) reduce the availability of derivatives to protect against risks we encounter, and (4) increase our exposure to less creditworthy counterparties. If we reduce our use of derivatives as a result of the Dodd-Frank Act and applicable rules and regulations, our cash flows may become more volatile and less predictable, which could adversely affect our ability to plan for and fund capital expenditures.
The loss of one or more of our large oil and natural gas purchasers could have an adverse effect on our operations.
For the year ended December 31, 2015, two purchasers individually accounted for 10% or more of our oil and natural gas revenues and, in the aggregate, for 43% of such revenues. The loss of a large single purchaser could adversely impact the prices we receive or the transportation costs we incur.
Certain of our operations may be limited during certain periods due to severe weather conditions and other regulations.
Certain of our operations in North Dakota, Montana and Wyoming, including the construction of CO2 pipelines, the drilling of new wells and production from existing wells, are conducted in areas subject to extreme weather conditions, including severe cold, snow and rain, which conditions may cause such operations to be hindered or delayed, or otherwise require that they be conducted only during non-winter months, and depending on the severity of the weather, could have a negative effect on our results of operations in these areas. Further, certain of our operations in these areas are confined to certain time periods due to environmental regulations, federal restrictions on when drilling can take place on federal lands, and lease stipulations designed to protect certain wildlife, which regulations, restrictions and limitations could slow down our operations, cause delays, increase costs and have a negative effect on our results of operations. Our operations in the coastal areas of the Gulf Coast region may be subjected to adverse weather conditions such as hurricanes and tropical storms in and around the Gulf of Mexico that can damage oil and natural gas facilities and delivery systems and disrupt operations, which can also increase costs and have a negative effect on our results of operations.
We expect to continue to write down the carrying value of our oil and natural gas properties in 2016 if commodity prices continue to decline or remain at low levels.
Under full cost accounting rules related to our oil and natural gas properties, we are required each quarter to perform a ceiling test calculation, with the net capitalized costs of our oil and natural gas properties limited to the lower of unamortized cost or the cost center ceiling. The present value of estimated future net revenues from proved oil and natural gas reserves included in the cost center ceiling is based on the average first-day-of-the-month oil and natural gas price for each month during a 12-month
31
rolling period prior to the end of a particular reporting period. During 2015, we recorded full cost pool ceiling test write-downs of our oil and natural gas properties totaling $4.9 billion ($3.1 billion net of tax) (see Item 7, Management’s Discussion and Analysis of Financial Condition and Results of Operations – Results of Operations – Write-Down of Oil and Natural Gas Properties and Critical Accounting Policies and Estimates – Full Cost Method of Accounting, Depletion and Depreciation and Oil and Natural Gas Properties). During 2015, NYMEX oil prices declined significantly, from $53.27 per Bbl as of December 31, 2014, to $37.04 per Bbl as of December 31, 2015, and continued to decline further in early 2016. We currently expect that we will record an additional write-down in the first quarter of 2016 in excess of $400 million if oil and natural gas prices remain at or near late-February 2016 levels, as the 12-month average prices used in determining the full cost ceiling value would reflect lower prices in the first quarter of 2016 than in the first quarter of 2015. Any such write-down would also be affected, in part, by changes in proved oil and natural gas reserve volumes, future capital expenditures and operating costs.
As of December 31, 2015, our net property and equipment balance totaled $5.4 billion, representing approximately 91% of our total assets. Future material write-downs of our oil and natural gas properties, as well as future impairment of other long-lived assets, could significantly reduce earnings during the period in which such write-down and/or impairment occurs and would result in a corresponding reduction to long-lived assets and equity. See Item 7, Management’s Discussion and Analysis of Financial Condition and Results of Operations – Critical Accounting Policies and Estimates.
Item 1B. Unresolved Staff Comments
There are no unresolved written SEC staff comments regarding our periodic or current reports under the Securities Exchange Act of 1934 received 180 days or more before the end of the fiscal year to which this annual report on Form 10-K relates.
Item 2. Properties
Information regarding the Company’s properties called for by this item is included in Item 1, Business and Properties – Oil and Natural Gas Operations. We also have various operating leases for rental of office space, office and field equipment, and vehicles. See Item 7, Management’s Discussion and Analysis of Financial Condition and Results of Operations – Capital Resources and Liquidity – Off-Balance Sheet Arrangements, and Note 10, Commitments and Contingencies, to the Consolidated Financial Statements for the future minimum rental payments. Such information is incorporated herein by reference.
Item 3. Legal Proceedings
We are involved in various lawsuits, claims and regulatory proceedings incidental to our businesses. While we currently believe that the ultimate outcome of these proceedings, individually and in the aggregate, will not have a material adverse effect on our business or finances, litigation is subject to inherent uncertainties. Although a single or multiple adverse rulings or settlements could possibly have a material adverse effect on our business or finances, we only accrue for losses from litigation and claims if we determine that a loss is probable and the amount can be reasonably estimated.
In mid-2006, Denbury Onshore, LLC (“Denbury Onshore”), a subsidiary of Denbury Resources Inc., purchased its original interest in the Delhi Field in northeastern Louisiana from NGS Sub Corp. (“NGS”), a subsidiary of Evolution Petroleum Corporation (together with its subsidiaries, “Evolution”). Under the purchase documents, Denbury Onshore committed to develop the enhanced production of the Holt Bryant Unit (the “Unit”), which is a specific portion of Delhi Field, and after Denbury Onshore’s receipt of a defined level of net cash flow from the Unit (as defined in the agreements, “payout”), to assign a reversionary interest in the Unit back to NGS. After several years of dispute regarding payout calculations and related contractual terms, in December 2013, Evolution filed suit against Denbury Onshore in the 133rd Judicial District Court in Houston, Harris County, Texas for unspecified damages. Evolution’s most recent amended petition alleges breach of contract, and requests a declaratory judgment as to various provisions of the purchase documents and accompanying oil and gas conveyancing instruments, including as to the method of calculation and timing of payout, the sharing of various costs, and the timing and extent of post-payout assignments from Denbury Onshore to NGS. Evolution also brings claims for negligence and gross negligence in connection with the June-2013 Delhi Field release of well fluids. Evolution states in its amended petition that it is seeking over $200 million in damages in addition to unspecified punitive damages and attorneys’ fees. In Denbury Onshore’s answer and counterclaim, we have denied Evolution’s claims, alleged breach of contract by Evolution for failing to convey the full interest for which we paid and for violating our preferential purchase rights, and asked for a declaratory judgment as to various purchase document terms, including those pertaining to the determination of payout, the assignment provisions of the documents, and cost sharing.
32
Discovery in the case is ongoing. The case is currently set for trial in April 2016, although the parties have filed a motion to move the trial setting to July 2016. We believe that Evolution’s claims in this matter are without merit and intend to vigorously defend against them and pursue our rights under the purchase documents.
Item 4. Mine Safety Disclosures
Not applicable.
33
PART II
Item 5. Market for Registrant’s Common Equity, Related Stockholder Matters and Issuer Purchases of Equity Securities
Common Stock Trading Summary
The following table summarizes the high and low reported sales prices on days in which there were trades of Denbury’s common stock on the New York Stock Exchange (“NYSE”) for each quarterly period for the last two fiscal years, as well as dividends declared within those periods. Prior to 2014, we had not historically declared or paid dividends on our common stock. As of January 31, 2016, based on information from the Company’s transfer agent, American Stock Transfer and Trust Company, the number of holders of record of Denbury’s common stock was 1,769. On February 25, 2016, the last reported sale price of Denbury’s common stock, as reported on the NYSE, was $1.07 per share.
2015 | 2014 | ||||||||||||||||||||||
High | Low | Dividends Declared Per Share | High | Low | Dividends Declared Per Share | ||||||||||||||||||
First Quarter | $ | 8.78 | $ | 6.26 | $ | 0.0625 | $ | 16.44 | $ | 15.33 | $ | 0.0625 | |||||||||||
Second Quarter | 9.20 | 6.16 | 0.0625 | 18.31 | 16.14 | 0.0625 | |||||||||||||||||
Third Quarter | 5.74 | 2.44 | 0.0625 | 18.12 | 14.93 | 0.0625 | |||||||||||||||||
Fourth Quarter | 4.24 | 1.89 | — | 14.41 | 6.34 | 0.0625 | |||||||||||||||||
In all four quarters of 2014 and in each of the first three quarters of 2015, the Company’s Board of Directors declared quarterly cash dividends of $0.0625 per common share. On September 21, 2015, in light of the continuing low oil price environment and our desire to maintain our financial strength and flexibility, the Company’s Board of Directors suspended our quarterly cash dividend effective after payment of our third quarter dividend on September 29, 2015. For further discussion, see Note 6, Stockholders’ Equity, to the Consolidated Financial Statements. No unregistered securities were sold by the Company during 2015.
Purchases of Equity Securities by the Issuer and Affiliated Purchasers
Month | Total Number of Shares Purchased (1) | Average Price Paid per Share | Total Number of Shares Purchased as Part of Publicly Announced Plans or Programs | Approximate Dollar Value of Shares that May Yet Be Purchased Under the Plans or Programs (in millions) (2) | ||||||||||
October 2015 | 1,744,764 | $ | 2.78 | 1,734,691 | $ | 210.1 | ||||||||
November 2015 | 940 | 3.64 | — | 210.1 | ||||||||||
December 2015 | 5,406 | 2.50 | — | 210.1 | ||||||||||
Total | 1,751,110 | 1,734,691 | ||||||||||||
(1) | Stock repurchases during the fourth quarter of 2015 other than those under our common stock repurchase program were made in connection with delivery by our employees of shares to us to satisfy their tax withholding requirements related to the vesting of restricted shares. |
(2) | In October 2011, we commenced a common share repurchase program, which has been approved for up to an aggregate of $1.162 billion of Denbury common shares by the Company’s Board of Directors. The program has no pre-established ending date and may be suspended or discontinued at any time. In September 2015, the Company’s Board of Directors reinstated the ability to repurchase shares under our share repurchase program, which authorization was suspended in November of 2014. We are not obligated to repurchase any dollar amount or specific number of shares of our common stock under the program. |
Between early October 2011, when we announced the commencement of a common share repurchase program, and December 31, 2015, we repurchased 64.4 million shares of Denbury common stock (approximately 16.0% of our outstanding shares of common stock at September 30, 2011) for $951.8 million, with an additional $210.1 million remaining authorized for purchases of common stock under this repurchase program.
34
Share Performance Graph
The following Performance Graph and related information shall not be deemed “soliciting material” or to be “filed” with the SEC, nor shall such information be incorporated by reference into any future filings under the Securities Act of 1933 or Securities Exchange Act of 1934, each as amended, except to the extent that the Company specifically incorporates it by reference into such filings.
The following graph illustrates changes over the five-year period ended December 31, 2015, in cumulative total stockholder return on our common stock as measured against the cumulative total return of the S&P 500 Index and the Dow Jones U.S. Exploration and Production Index. The graph tracks the performance of a $100 investment in our common stock and in each index (with the reinvestment of all dividends for the index securities) from December 31, 2010, to December 31, 2015.
COMPARISON OF 5-YEAR CUMULATIVE TOTAL RETURN
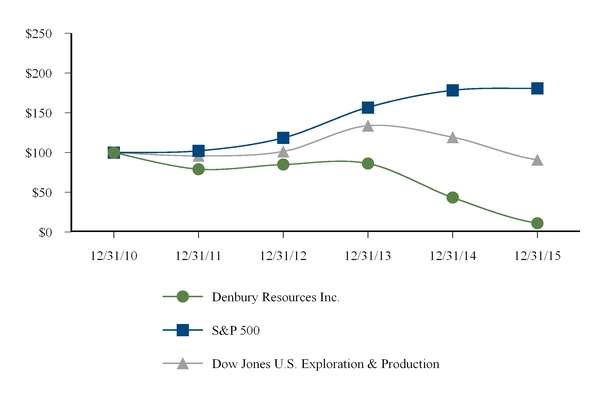
December 31, | |||||||||||||||||||||||
2010 | 2011 | 2012 | 2013 | 2014 | 2015 | ||||||||||||||||||
Denbury Resources Inc. | $ | 100 | $ | 79 | $ | 85 | $ | 86 | $ | 43 | $ | 11 | |||||||||||
S&P 500 | 100 | 102 | 118 | 157 | 178 | 181 | |||||||||||||||||
Dow Jones U.S. Exploration & Production | 100 | 96 | 101 | 134 | 119 | 91 | |||||||||||||||||
35
Item 6. Selected Financial Data
Year Ended December 31, | ||||||||||||||||||||
In thousands, except per-share data or otherwise noted | 2015 | 2014 | 2013 | 2012 | 2011 | |||||||||||||||
Consolidated Statements of Operations data | ||||||||||||||||||||
Revenues and other income | ||||||||||||||||||||
Oil, natural gas, and related product sales | $ | 1,213,026 | $ | 2,372,473 | $ | 2,466,234 | $ | 2,409,867 | $ | 2,269,151 | ||||||||||
Other | 44,534 | 62,732 | 50,893 | 46,605 | 40,173 | |||||||||||||||
Total revenues and other income | $ | 1,257,560 | $ | 2,435,205 | $ | 2,517,127 | $ | 2,456,472 | $ | 2,309,324 | ||||||||||
Net income (loss) (1) | (4,385,448 | ) | 635,491 | 409,597 | 525,360 | 573,333 | ||||||||||||||
Net income (loss) per common share | ||||||||||||||||||||
Basic (1) | (12.57 | ) | 1.82 | 1.12 | 1.36 | 1.45 | ||||||||||||||
Diluted (1) | (12.57 | ) | 1.81 | 1.11 | 1.35 | 1.43 | ||||||||||||||
Dividends declared per common share (2) | 0.1875 | 0.25 | — | — | — | |||||||||||||||
Weighted average number of common shares outstanding | ||||||||||||||||||||
Basic | 348,802 | 348,962 | 366,659 | 385,205 | 396,023 | |||||||||||||||
Diluted | 348,802 | 351,167 | 369,877 | 388,938 | 400,958 | |||||||||||||||
Consolidated Statements of Cash Flows data | ||||||||||||||||||||
Cash provided by (used in) | ||||||||||||||||||||
Operating activities | $ | 864,304 | $ | 1,222,825 | $ | 1,361,195 | $ | 1,410,891 | $ | 1,204,814 | ||||||||||
Investing activities | (550,185 | ) | (1,076,755 | ) | (1,275,309 | ) | (1,376,841 | ) | (1,605,958 | ) | ||||||||||
Financing activities | (334,460 | ) | (135,104 | ) | (172,210 | ) | 45,768 | 37,968 | ||||||||||||
Production (average daily) | ||||||||||||||||||||
Oil (Bbls) | 69,165 | 70,606 | 66,286 | 66,837 | 60,736 | |||||||||||||||
Natural gas (Mcf) | 22,172 | 22,955 | 23,742 | 29,109 | 29,542 | |||||||||||||||
BOE (6:1) | 72,861 | 74,432 | 70,243 | 71,689 | 65,660 | |||||||||||||||
Unit sales prices – excluding impact of derivative settlements | ||||||||||||||||||||
Oil (per Bbl) | $ | 47.30 | $ | 90.74 | $ | 100.67 | $ | 97.18 | $ | 100.03 | ||||||||||
Natural gas (per Mcf) | 2.35 | 4.07 | 3.53 | 3.05 | 4.79 | |||||||||||||||
Unit sales prices – including impact of derivative settlements | ||||||||||||||||||||
Oil (per Bbl) | $ | 67.41 | $ | 90.82 | $ | 100.64 | $ | 96.77 | $ | 98.90 | ||||||||||
Natural gas (per Mcf) | 2.83 | 3.99 | 3.53 | 5.67 | 7.34 | |||||||||||||||
Costs per BOE | ||||||||||||||||||||
Lease operating expenses (3) | $ | 19.37 | $ | 23.84 | $ | 28.50 | $ | 20.29 | $ | 21.17 | ||||||||||
Taxes other than income | 4.13 | 6.25 | 6.87 | 6.10 | 6.16 | |||||||||||||||
General and administrative expenses | 5.44 | 5.83 | 5.66 | 5.49 | 5.24 | |||||||||||||||
Depletion, depreciation, and amortization | 19.99 | 21.83 | 19.89 | 19.34 | 17.07 | |||||||||||||||
Proved oil and natural gas reserves (4) | ||||||||||||||||||||
Oil (MBbls) | 282,250 | 362,335 | 386,659 | 329,124 | 357,733 | |||||||||||||||
Natural gas (MMcf) | 38,305 | 452,402 | 489,954 | 481,641 | 625,208 | |||||||||||||||
MBOE (6:1) | 288,634 | 437,735 | 468,318 | 409,398 | 461,934 | |||||||||||||||
Proved carbon dioxide reserves | ||||||||||||||||||||
Gulf Coast region (MMcf) (5) | 5,501,175 | 5,697,642 | 6,070,619 | 6,073,175 | 6,685,412 | |||||||||||||||
Rocky Mountain region (MMcf) (6) | 1,237,603 | 3,035,286 | 3,272,428 | 3,495,534 | 2,195,534 | |||||||||||||||
Proved helium reserves associated with Denbury’s production rights (7) | ||||||||||||||||||||
Rocky Mountain region (MMcf) | — | 13,231 | 13,251 | 12,712 | 12,004 | |||||||||||||||
Consolidated Balance Sheets data | ||||||||||||||||||||
Total assets | $ | 5,919,824 | $ | 12,727,802 | $ | 11,788,737 | $ | 11,139,342 | $ | 10,184,424 | ||||||||||
Total long-term liabilities | 4,297,897 | 6,383,821 | 5,812,132 | 5,408,032 | 4,716,659 | |||||||||||||||
Stockholders’ equity | 1,248,912 | 5,703,856 | 5,301,406 | 5,114,889 | 4,806,498 | |||||||||||||||
36
(1) | Includes pre-tax full cost pool ceiling test write-downs of $4.9 billion and an impairment of goodwill charge of $1.3 billion for the year ended December 31, 2015. |
(2) | On September 21, 2015, in light of the continuing low oil price environment and our desire to maintain our financial strength and flexibility, the Company’s Board of Directors suspended our quarterly cash dividend effective after payment of our third quarter dividend on September 29, 2015. |
(3) | If lease operating expenses were adjusted to exclude certain costs to remediate an area of Delhi Field due to a 2013 release, related insurance recoveries and other reimbursements recorded in 2015, 2014 and 2013, lease operating expenses would have totaled $528.8 million, $654.7 million and $616.6 million for the years ended December 31, 2015, 2014 and 2013, respectively, and lease operating expenses per BOE would have averaged $19.88, $24.10 and $24.05 for the years ended December 31, 2015, 2014 and 2013, respectively (see Management’s Discussion and Analysis of Financial Condition and Results of Operations – Capital Resources and Liquidity – Insurance Recoveries to Cover Costs of 2013 Delhi Field Release). |
(4) | Estimated proved reserves as of December 31, 2012, reflect the disposition of reserves associated with our Bakken area assets sold in late 2012 (approximately 109 MMBOE), but do not include then-estimated reserves of approximately 42.2 MMBOE related to the CCA acquisition from ConocoPhillips, which closed during the first quarter of 2013. Estimated proved reserves as of December 31, 2015, reflect negative reserve revisions of approximately 126 MMBOE (29%) in 2015 due to declines in the average first-day-of-the-month NYMEX oil price used to estimate reserves from $94.99 per Bbl at December 31, 2014, to $50.28 per Bbl at December 31, 2015, and average first-day-of-the-month NYMEX natural gas price used to estimate reserves from $4.30 per MMBtu at December 31, 2014, to $2.63 per MMBtu at December 31, 2015. |
(5) | Proved CO2 reserves in the Gulf Coast region consist of reserves from our reservoirs at Jackson Dome and are presented on a gross or 8/8ths working interest basis, of which our net revenue interest was approximately 4.4 Tcf, 4.5 Tcf, 4.8 Tcf, 4.8 Tcf and 5.3 Tcf at December 31, 2015, 2014, 2013, 2012 and 2011, respectively, and include reserves dedicated to volumetric production payments of 25.3 Bcf, 9.3 Bcf, 28.9 Bcf, 57.1 Bcf and 84.7 Bcf at December 31, 2015, 2014, 2013, 2012 and 2011, respectively (see Supplemental CO2 and Helium Disclosures (Unaudited) to the Consolidated Financial Statements). |
(6) | Proved CO2 reserves in the Rocky Mountain region consist of our reserves at Riley Ridge (presented on a gross (8/8ths) basis) and our overriding royalty interest in LaBarge Field, of which our net revenue interest was approximately 1.2 Tcf, 2.6 Tcf, 2.9 Tcf, 2.9 Tcf and 1.6 Tcf at December 31, 2015, 2014, 2013, 2012 and 2011, respectively. As of December 31, 2015, Riley Ridge CO2 reserves were reclassified and are no longer considered proved reserves primarily as a result of the decline in average first-day-of-the-month natural gas prices utilized in preparing our December 31, 2015 reserve report. |
(7) | Reserves associated with helium production rights include helium reserves located in the acreage in the Rocky Mountain region for which we have the contractual right to extract the helium on behalf of the U.S. government, which owns the helium. Our extraction agreement with the U.S. government gives us the ability to produce the helium on behalf of the U.S. government in exchange for a fee, which amount fluctuates based upon the realized sales proceeds we receive for the helium. The estimate of helium reserves is reduced to reflect the estimated fee we will remit to the U.S. government. Our extraction agreement with the U.S. government has a minimum term extending 20 years from first production and continuing thereafter until either party terminates the contract. Reserve volumes presented herein assume that the term of this helium extraction agreement continues beyond 20 years, given the benefit to both parties to the agreement. As of December 31, 2015, there was no helium production at Riley Ridge, as the Riley Ridge gas processing facility was and continues to be shut-in. As of December 31, 2015, Riley Ridge helium reserves were reclassified and are no longer considered proved reserves primarily as a result of the decline in average first-day-of-the-month natural gas prices utilized in preparing our December 31, 2015 reserve report. |
37
Denbury Resources Inc.
Management’s Discussion and Analysis of Financial Condition and Results of Operations
Item 7. Management’s Discussion and Analysis of Financial Condition and Results of Operations
The following discussion and analysis should be read in conjunction with our Consolidated Financial Statements and Notes thereto included in Item 8, Financial Statements and Supplementary Information. Our discussion and analysis includes forward-looking information that involves risks and uncertainties and should be read in conjunction with Risk Factors under Item 1A of this Form 10-K, along with Forward-Looking Information at the end of this section for information on the risks and uncertainties that could cause our actual results to be materially different from our forward-looking statements.
OVERVIEW
Denbury is an independent oil and natural gas company with operations focused in two key operating areas: the Gulf Coast and Rocky Mountain regions. Our goal is to increase the value of our properties through a combination of exploitation, drilling and proven engineering extraction practices, with the most significant emphasis relating to CO2 enhanced oil recovery operations.
Oil Price Decline and Impact on Our Business. Oil prices generally constitute the single largest variable in our operating results. Oil prices have historically been volatile, with NYMEX oil prices ranging from $35 to $111 per Bbl over the last three calendar years, and prices have declined dramatically since the fourth quarter of 2014 to less than $27 per Bbl in January 2016, the lowest level in over 13 years. The following charts illustrate the fluctuations in our realized oil and natural gas prices, excluding the impact of commodity derivative settlements, during 2013, 2014 and 2015.
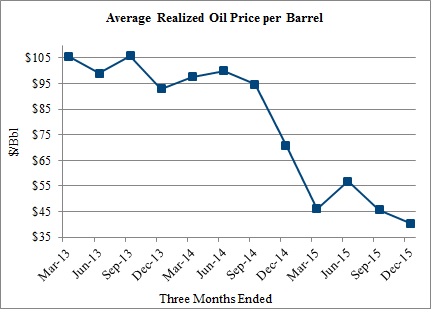
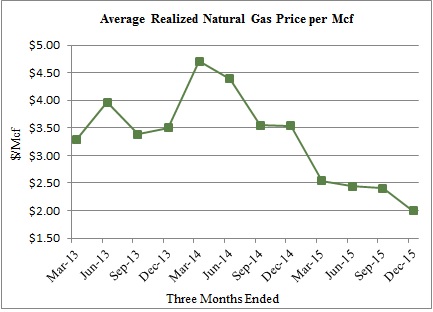
Oil price per Bbl | Natural gas price per Mcf | |||||||||||||||||||||||
Average realized prices | 2013 | 2014 | 2015 | 2013 | 2014 | 2015 | ||||||||||||||||||
First quarter | $ | 105.59 | $ | 97.69 | $ | 46.02 | $ | 3.28 | $ | 4.71 | $ | 2.54 | ||||||||||||
Second quarter | 98.92 | 100.04 | 56.92 | 3.96 | 4.39 | 2.44 | ||||||||||||||||||
Third quarter | 105.91 | 94.78 | 45.74 | 3.38 | 3.55 | 2.40 | ||||||||||||||||||
Fourth quarter | 93.00 | 70.80 | 40.41 | 3.50 | 3.54 | 2.00 | ||||||||||||||||||
In response to the decline in oil prices, we made adjustments during 2015 to our business to preserve our financial strength and flexibility. These adjustments included: (1) reducing our 2015 development capital spending to approximately 39% of 2014 levels, and $457.1 million less than our 2015 cash flow from operations, (2) reducing our operating costs and identifying new innovation and improvement ideas for our fields, which has resulted in meaningful decreases to most categories of our lease operating expenses and general and administrative expenses, and cost savings on capital projects, (3) modifying certain of our bank covenants applicable to the 2016, 2017 and 2018 periods to mitigate concern around our ability to access our bank credit line if oil prices remain low for an extended period of time, (4) shutting-in wells that have become uneconomic to either produce or repair in the current price environment, and (5) suspending our quarterly cash dividend effective after payment of our third quarter dividend on September 29, 2015 (see Capital Resources and Liquidity – Dividends below for further discussion). As a result of these adjustments and the commodity hedges we had in place for 2015, our cash flow from operations in 2015 exceeded the total of our development capital expenditures and dividends by $391.7 million, with which we were able to reduce our credit facility borrowings from $395.0 million at December 31, 2014, to $175.0 million at December 31, 2015.
38
Denbury Resources Inc.
Management’s Discussion and Analysis of Financial Condition and Results of Operations
With the further decline in early 2016 in already depressed oil and natural gas prices, as well as our reduced hedging levels in 2016 and uncertainty around future prices, we are continuing to make adjustments to our business to preserve financial strength and flexibility. To accommodate our lower projected cash flow from operations, our 2016 capital spending has been budgeted at approximately $200 million, excluding capitalized interest and acquisitions, which is less than half of 2015 levels, and is not adequate to maintain current production levels. Therefore, we currently anticipate production declines in 2016 in the range of approximately seven to twelve percent from average 2015 levels, approximately 60% of which relates to natural production declines, with the remainder related to wells that are uneconomic to either produce or repair in the current price environment.
As more fully discussed under Capital Resources and Liquidity below, our liquidity remains high with nearly $1.3 billion of undrawn bank line availability as of February 19, 2016. Our focus is on preserving our cash and minimizing our spending as we anticipate that our bank line availability is likely to be reduced in the future as bank price decks continue to decrease, reducing the ultimate collateral value of our assets, along with tightening regulatory constraints. We have also obtained further relief on our bank covenants to avoid covenant compliance issues in the last half of 2016 after our higher valued hedges expire. Lastly, we have recently entered into oil swaps for the second half of 2016 to further protect our liquidity, so we now have hedges covering an average of 27,000 Bbls/d in the third and fourth quarters at a weighted-average price of approximately $41 per barrel, locking in prices that at least cover our total cash costs, which were within a per-barrel range in the low-to-mid $30’s in the fourth quarter of 2015, including corporate overhead and interest. As a result of these and other steps outlined above, we anticipate having sufficient liquidity to continue operations until oil prices improve, which we currently anticipate will likely be sometime during the next twelve to eighteen months.
During this period of reduced capital spending, we continue to evaluate our assets with a goal of increasing the value of both existing assets and future projects by optimizing field operational and development plans, reducing CO2 injection volumes due to increased efficiency and reducing costs. These initiatives aim to increase the profitability of our assets, making them more resilient to lower oil prices. We will continue to evaluate the timing of development of our inventory of fields and related pipelines and facilities, which will be largely dependent upon commodity prices.
2015 Operating Highlights. Our financial results have been significantly impacted by the decrease in realized oil prices as highlighted above, which decreased from an average of $90.74 per Bbl during 2014 to $47.30 per Bbl during 2015. During 2015, we recognized a net loss of $4.4 billion, or $12.57 per diluted common share, compared to net income of $635.5 million, or $1.81 per diluted common share, during 2014. This decrease in net income between the comparative periods was principally due to a full cost pool ceiling test write-down of our oil and natural gas properties totaling $4.9 billion ($3.1 billion net of tax) (see Write-Down of Oil and Natural Gas Properties below) and a goodwill impairment charge totaling $1.3 billion ($1.2 billion net of tax) (see Impairment of Goodwill below). Other significant changes between 2015 and 2014 were a $1.2 billion decrease in oil and natural gas revenues between the periods, which was primarily oil-price related, and a $407.3 million decrease in commodity derivatives income, offset in part by a $132.5 million (20%) reduction in lease operating expenses, a $61.3 million (10%) decrease in depletion, depreciation, and amortization, a $59.7 million (35%) decrease in taxes other than income, a $23.7 million (13%) decrease in net interest expense (partially comprised of a $7.9 million increase in capitalized interest), and a $13.8 million (9%) decrease in general and administrative expenses, as well as the 2014 period including a $113.9 million loss on early extinguishment of debt. The $407.3 million decrease in commodity derivatives income between the two periods was due to a $917.6 million loss associated with noncash fair value commodity adjustments due primarily to the expiration of contracts, offset in part by a $510.3 million increase in income from settlements of derivative contracts.
We generated $864.3 million of cash flow from operating activities during 2015, compared to $1.2 billion during 2014. Despite annual declines in oil prices which contributed to a $1.2 billion decrease in oil and natural gas revenues, our cash flows from operations decreased by only $358.5 million between the two periods, the largest reason for which related to $511.7 million in commodity derivative settlements, as well as reductions in lease operating expenses, taxes other than income, interest expense, and general and administrative expenses.
During 2015, our oil and natural gas production, which was 95% oil, averaged 72,861 BOE/d, compared to an average of 74,432 BOE/d produced during 2014. This 2% decrease in production was primarily due to production declines at our mature tertiary properties in the Gulf Coast region and Mississippi non-tertiary properties, a decline at Cedar Creek Anticline Field, and a late-2014 contractual reversionary interest assignment at Delhi Field, offset in part by production increases at Oyster Bayou Field and Bell Creek Field. The production declines mentioned above and in other fields include an estimated decrease in average
39
Denbury Resources Inc.
Management’s Discussion and Analysis of Financial Condition and Results of Operations
2015 production of just over 1,000 BOE/d due to production that has been shut-in as uneconomic to produce or repair at current commodity prices.
Our average realized oil price per barrel, excluding the impact of commodity derivative contracts, was $47.30 per Bbl during 2015, a decrease of 48% compared to $90.74 per Bbl realized during 2014. The oil price we realized relative to NYMEX oil prices (our NYMEX oil price differential) was $1.55 per Bbl below NYMEX prices during 2015, a $0.66 per Bbl improvement compared to realized prices of $2.21 per Bbl below NYMEX in 2014, primarily due to improvement in the Rocky Mountain region discount in 2015 relative to NYMEX oil prices.
One of our primary focuses in 2014 and 2015 has been to reduce costs throughout the organization, through a number of internal initiatives. Our efforts have proven successful, and our lease operating expenses in 2015, normalized to exclude insurance and other special reimbursements (see Results of Operations – Production Expenses for further discussion), were less than $20.00 per BOE, a decrease of 18% when compared to per-BOE levels in 2014. In addition, our recurring lease operating expenses per BOE decreased each sequential quarter in 2014 and 2015 and decreased a total of 26% between the fourth quarter of 2013 and the fourth quarter of 2015, with decreases realized in most categories of lease operating expenses, the most significant of which included workover costs, power costs, CO2 costs, and certain third-party contractor and vendor costs.
Write-Down of Oil and Natural Gas Properties. Due to a continued decline in the first-day-of-the-month average oil and natural gas price for each quarterly 12-month rolling period in 2015, we recognized full cost pool ceiling test write-downs totaling $4.9 billion during the year ending December 31, 2015. See Note 1, Significant Accounting Policies – Write-Down of Oil and Natural Gas Properties, to the Consolidated Financial Statements, Results of Operations – Write-Down of Oil and Natural Gas Properties, and Critical Accounting Policies and Estimates – Full Cost Method of Accounting, Depletion and Depreciation and Oil and Natural Gas Properties for additional information regarding the ceiling test.
Impairment of Goodwill. Based on the results of our goodwill impairment test performed during the third quarter of 2015, we recorded a goodwill impairment charge of $1.3 billion to fully impair the carrying value of our goodwill. Approximately $1.0 billion of the $1.3 billion goodwill balance was associated with the March-2010 merger with Encore Acquisition Company. See Note 1, Significant Accounting Policies – Goodwill and Other Intangible Assets, to the Consolidated Financial Statements, Results of Operations – Impairment of Goodwill below, and Critical Accounting Policies and Estimates – Impairment Assessment of Goodwill for additional information regarding the goodwill impairment test.
Impact of Commodity Price Decline on Proved Oil and Natural Gas Reserve Quantities. Declines in commodity prices often materially impact estimated quantities of proved reserves, as certain reserves may reach the point at which they become uneconomic to produce earlier than they would otherwise. The SEC requires proved reserves to be determined based on average first-day-of-the-month oil and natural gas prices for the trailing 12-month period. Using these prices, our total proved reserves at December 31, 2015, were 288.6 MMBOE, of which 98% was oil and 2% was natural gas. During 2015, the average first-day-of-the-month NYMEX oil price used in estimating our proved reserves declined from $94.99 per Bbl at December 31, 2014, to $50.28 per Bbl at December 31, 2015, and for natural gas declined from $4.30 per MMBtu at December 31, 2014, to $2.63 per MMBtu at December 31, 2015. These oil and natural gas price changes resulted in a decline of approximately 126 MMBOE (29%) in our proved reserves from December 31, 2014, through December 31, 2015 (approximately 84% of the total net reduction in our proved reserves), approximately half of which was attributable to natural gas reserves at Riley Ridge. The estimated reserve volumes and related PV-10 Value of proved natural gas reserves at Riley Ridge previously totaled approximately 61 MMBOE and $27.6 million, respectively, as of December 31, 2014. The representative prices used in estimating our proved reserves do not reflect the continued oil price declines in late 2015 and early 2016, in which prices declined to below $27 per Bbl in January 2016. Based on these additional price declines, it is reasonably likely that we could experience further negative revisions in our proved oil and natural gas reserves due to price declines during 2016, and we currently expect such negative reserve revisions during the first quarter of 2016 to be less than 10% of our proved reserve quantities as of December 31, 2015. The actual first quarter reserve revision could vary from the estimated range for several reasons, including differences in actual commodity prices from commodity futures prices and changes in oil and natural gas price differentials, forecasted production rates, forecasted operating and capital costs, changes in development plans, and other key assumptions included within the estimate of proved oil and natural gas reserves. For additional information, see Item 1, Estimated Net Quantities of Proved Oil and Natural Gas Reserves and Present Value of Estimated Future Net Revenues and Supplemental Oil and Natural Gas Disclosures (Unaudited) to the Consolidated Financial Statements.
40
Denbury Resources Inc.
Management’s Discussion and Analysis of Financial Condition and Results of Operations
CAPITAL RESOURCES AND LIQUIDITY
Overview. Our primary sources of capital and liquidity are our cash flows from operations and availability of borrowing capacity under our bank credit facility. As a result of the significant reduction in oil prices discussed above, our cash flow from operations has significantly decreased. Further, while we were substantially hedged in 2015, our hedges in place for 2016 are at much lower prices and cover fewer barrels of oil, further lowering our anticipated cash flow. During 2015, we generated excess cash flow (cash flow in excess of our capital expenditures and dividends), used to reduce our bank and other debt. For 2016, while we have further reduced our capital spending to less than half of 2015 levels, we currently expect oil prices would need to average within a per-barrel range in the upper $30’s during 2016 for cash flow from operations to balance with our anticipated $200 million development capital budget, based upon our current production forecast and hedges currently in place.
The culmination of these factors places a significant priority on the preservation of cash and liquidity until oil prices improve. We have taken and will continue to take steps to lower our costs in all categories of our business, and we have made significant progress in that regard. As of February 19, 2016, we owed our banks $205 million and have aggregate lender commitments of $1.5 billion, leaving us nearly $1.3 billion of current liquidity. Nonetheless, we anticipate that our borrowing base and commitment level could likely be reduced at the next redetermination in May 2016 as banks have continued over time to lower their forecasted oil prices in conjunction with the current market, thereby reducing the value of our collateral. While still uncertain, we currently anticipate that we will retain a substantial amount of availability on our bank line after the next bank redetermination. This liquidity, coupled with our other cost saving and liquidity measures, should be sufficient to supplement our cash flow as needed until oil prices improve, which we believe will be in the next twelve to eighteen months. However, if oil prices should remain low or further decline, it is likely that our bank line would be further reduced and cash resources and liquidity could be significantly reduced or eliminated.
To protect our liquidity, we have recently entered into additional oil swaps for the second half of 2016, such that we now have approximately half of our estimated oil production for 2016 hedged. While these prices are not sufficient to provide enough cash flow to grow our production, they do at least cover our most recent total cash costs which were in a per-barrel range in the low-to-mid $30’s in the fourth quarter of 2015, including corporate overhead and interest, thereby minimizing the amount that would be required for day-to-day operations from our bank line. One advantage we have in this environment is that our oil assets have relatively low decline rates, and therefore we anticipate that our production will decline by less than 8% in 2016 (excluding production shut-in for economic reasons), even though our capital spending is reduced to approximately $200 million. As part of our cash conservation measures, we are also continually reviewing each oil field and making adjustments as needed to increase our cash flow, which often requires that we shut-in higher cost wells or portions of the field. These conservation measures could cause our oil production to decline at a faster rate, particularly if oil prices were to decline further.
Since we do not expect oil prices to recover to recent historical highs, we must adjust our business to compete in an oil price environment that is likely not as robust as it was a few years ago. Therefore, we realize that over time we must reduce our overall debt levels to adjust to this anticipated lower price environment. Our subordinated debt has traded down to historically low levels, providing conditions under which we may opportunistically reduce total debt at a substantial discount. We plan to review our options to reduce such debt which may include purchases of our subordinated debt in the open market, cash tenders for such debt, and longer-term, potentially issuances of equity, asset sales and other cash-generating activities. We may utilize a portion of our bank line for such repurchases and may also consider other forms of capital such as second lien notes or other senior notes. Such activities will depend on the availability and cost of such capital and relevant market conditions, including oil prices and market trading levels of our subordinated notes. Any purchases of debt may be made in the open market, in privately-negotiated transactions, through tender or exchange offers or otherwise.
2016 Capital Spending. We anticipate that our 2016 capital budget, excluding capitalized interest and acquisitions, will be approximately $200 million, which includes approximately $55 million in capitalized internal acquisition, exploration and development costs and pre-production tertiary startup costs. This combined 2016 capital budget amount, excluding capitalized interest and acquisitions, compares to combined 2015 development capital spending of $407.2 million (see Capital Expenditure Summary below for a summary of actual 2015 expenditures). The 2016 capital budget is comprised of the following:
• | $100 million allocated for tertiary oil field expenditures, $20 million of which was previously budgeted to be spent in 2015 related to the Delhi natural gas liquids extraction plant; |
• | $35 million allocated for other areas, primarily non-tertiary oil field expenditures; |
• | $10 million to be spent on CO2 sources and pipeline construction; and |
41
Denbury Resources Inc.
Management’s Discussion and Analysis of Financial Condition and Results of Operations
• | $55 million for other capital items such as capitalized internal acquisition, exploration and development costs and pre-production tertiary startup costs. |
Based upon our currently forecasted levels of production and costs, commodity hedges in place, and current oil commodity futures prices, we intend to fund our development capital spending primarily with cash flow from operations, with any potential shortfall funded with incremental borrowings under our bank credit facility, and as of December 31, 2015, we had ample availability on our bank credit facility to cover any foreseeable cash flow shortfall. If prices were to decrease further or changes in operating results were to cause us to have a reduction in anticipated 2016 cash flows below our currently forecasted operating cash flows, we could potentially make minor additional reductions in our capital expenditures, as further reductions in our capital spending are limited to some degree by existing prior commitments and capitalized items. If we further reduce our capital spending due to lower cash flows, any sizeable reduction could further lower our anticipated production levels in future years.
Capital Expenditure Summary. The following table summarizes our 2015, 2014 and 2013 incurred capital expenditures (including accrued capital) by project area:
Year Ended December 31, | ||||||||||||
In thousands | 2015 | 2014 | 2013 | |||||||||
Capital expenditures by project | ||||||||||||
Tertiary oil fields | $ | 199,923 | $ | 629,790 | $ | 534,878 | ||||||
Non-tertiary fields | 101,667 | 240,187 | 224,556 | |||||||||
Capitalized internal costs (1) | 66,308 | 67,908 | 72,855 | |||||||||
Oil and natural gas capital expenditures | 367,898 | 937,885 | 832,289 | |||||||||
CO2 pipelines | 14,444 | 45,672 | 57,136 | |||||||||
CO2 sources (2) | 23,643 | 56,460 | 163,710 | |||||||||
Other | 1,177 | 1,853 | 11,110 | |||||||||
Capital expenditures, before acquisitions and capitalized interest | 407,162 | 1,041,870 | 1,064,245 | |||||||||
Acquisitions of oil and natural gas properties (3) | 25,765 | 8,773 | 1,032,218 | |||||||||
Capital expenditures, before capitalized interest | 432,927 | 1,050,643 | 2,096,463 | |||||||||
Capitalized interest | 32,146 | 24,202 | 79,253 | |||||||||
Capital expenditures, total | $ | 465,073 | $ | 1,074,845 | $ | 2,175,716 | ||||||
(1) | Includes capitalized internal acquisition, exploration and development costs and pre-production tertiary startup costs. |
(2) | Includes capital expenditures related to the Riley Ridge gas processing facility. |
(3) | Property acquisitions during the year ended December 31, 2013, include capital expenditures of approximately $1.0 billion related to acquisitions during the period that are not reflected as an Investing Activity on our Consolidated Statements of Cash Flows due to the movement of proceeds through a qualified intermediary to facilitate like-kind-exchange treatment under federal income tax rules. |
Our 2015 and 2014 capital expenditures and property acquisitions were fully funded with cash flows from operations of $864.3 million and $1.2 billion, respectively. Our 2013 capital expenditures, other than those for property acquisitions, were funded with $1.4 billion of cash flow from operations, and those for property acquisitions were funded with proceeds from the Bakken exchange transaction.
Bank Credit Facility. As of December 31, 2015, we had $175.0 million of debt outstanding and $14.8 million in letters of credit on the bank credit facility. In order to provide more flexibility in managing our balance sheet, the credit extended by our lenders, and continuing compliance with maintenance financial covenants in this low oil price environment, we entered into the Second Amendment to the Bank Credit Agreement on February 17, 2016 (the “Second Amendment”). Specifically, the Second Amendment modifies certain maintenance financial covenants through December 31, 2017 as follows:
42
Denbury Resources Inc.
Management’s Discussion and Analysis of Financial Condition and Results of Operations
• | Increases our permitted ratio of senior secured debt to consolidated EBITDAX to a ratio of 3.0 to 1.0 (from a previous ratio of 2.5 to 1.0). |
• | Decreases our permitted ratio of consolidated EBITDAX to consolidated interest charges to a ratio of 1.25 to 1.0 (from a previous ratio of 2.25 to 1.0). |
Additionally, the Second Amendment provides for the following changes: (1) reduces our aggregate lender commitments from $1.6 billion to $1.5 billion, (2) increases the applicable margin for ABR Loans and LIBOR Loans by 75 basis points such that the margin for ABR Loans now ranges from 1% to 2% per annum and the margin for LIBOR Loans now ranges from 2% to 3% per annum, (3) increases the commitment fee rate to 0.50%, (4) provides for semi-annual scheduled redeterminations of the borrowing base in May and November of each year, (5) limits unrestricted cash and cash equivalents to $225 million if more than $250 million of borrowings are outstanding under the Bank Credit Agreement, and (6) limits repurchases of our senior subordinated notes to a cash amount of $225 million. The next borrowing base redetermination under our Bank Credit Agreement is scheduled for May 2016. If our outstanding debt under the Bank Credit Agreement were to ever exceed the borrowing base, we would be required to repay the excess amount over a period not to exceed six months.
For 2015, our Bank Credit Agreement contained two principal financial performance covenants to maintain (1) a ratio of consolidated total net debt to consolidated EBITDAX of not more than 4.25 to 1.0 and (2) a ratio of consolidated current assets to consolidated current liabilities (“current ratio”) not less than 1.0. For these financial performance covenant calculations as of December 31, 2015, our ratio of consolidated total net debt to consolidated EBITDAX was 3.37 to 1.0, and our current ratio was 4.73. For 2016, 2017 and 2018, pursuant to a first amendment to the Bank Credit Agreement executed in May 2015 (the “First Amendment”) and the Second Amendment discussed above, the first of these financial covenants was modified, a second covenant was added, and the current ratio covenant remained unchanged. A summary of these covenant changes are as follows:
• | For 2016 and 2017, the maximum permitted ratio of consolidated total net debt to consolidated EBITDAX covenant has been suspended and replaced by a maximum permitted ratio of consolidated senior secured debt to consolidated EBITDAX covenant of 3.0 to 1.0. Currently, only debt under our Bank Credit Agreement is considered consolidated senior secured debt for purposes of this ratio. If this covenant had been in place as of December 31, 2015, our ratio of senior secured debt to consolidated EBITDAX would have been 0.18 to 1.0 as of that date. Beginning in the first quarter of 2018, the ratio of consolidated total net debt to consolidated EBITDAX covenant is to be reinstated, utilizing an annualized EBITDAX amount for the first quarter of 2018 and building to a trailing four quarters by the end of 2018, with the maximum permitted ratios being 6.0 to 1.0 for the first quarter ended March 31, 2018, 5.5 to 1.0 for the second quarter ended June 30, 2018, and 5.0 to 1.0 for the third and fourth quarters ended September 30 and December 31, 2018, and returning to 4.25 to 1.0 for the first quarter ended March 31, 2019. |
• | For 2016 and 2017, a new covenant has been added to require a minimum permitted ratio of consolidated EBITDAX to consolidated interest charges of 1.25 to 1.0. If this covenant had been in place as of December 31, 2015, our ratio of consolidated EBITDAX to consolidated interest charges would have been 5.12 to 1.0 as of that date. |
Based upon our current forecasted levels of production and costs, hedges in place as of February 24, 2016, and current oil commodity futures prices, we currently anticipate continuing to be in compliance with our bank covenants during 2016. The above description of our Bank Credit Agreement financial covenants and the changes provided for within the First Amendment and Second Amendment are qualified by the express language and defined terms contained in the Bank Credit Agreement, the First Amendment and Second Amendment, which are filed as exhibits to our periodic reports filed with the SEC.
Dividends. In all four quarters of 2014 and in each of the first three quarters of 2015, the Company’s Board of Directors declared quarterly cash dividends of $0.0625 per common share. On September 21, 2015, in light of the continuing low oil price environment and our desire to maintain our financial strength and flexibility, the Company’s Board of Directors suspended our quarterly cash dividend effective after payment of our third quarter dividend on September 29, 2015. Dividends totaling $65.4 million and $87.0 million were paid to stockholders during the years ended December 31, 2015 and 2014, respectively.
Stock Repurchase Program. On September 21, 2015, the Company’s Board of Directors reinstated the ability to repurchase shares under our share repurchase program, which authorization was suspended in November of 2014. During 2015, we repurchased 4.4 million shares of Denbury common stock for $11.8 million. We have spent a total of $951.8 million to repurchase 64.4 million shares of our common stock under this program between October 2011 and December 31, 2015 (approximately 16.0% of our outstanding shares at September 30, 2011), leaving us with $210.1 million available for future purchases. Our share repurchases are based on various parameters including, but not limited to, the price of our common stock, oil prices, free cash flow, our leverage
43
Denbury Resources Inc.
Management’s Discussion and Analysis of Financial Condition and Results of Operations
or other funding sources available to us. There is no requirement that the remaining balance under the program be utilized, and there is no set expiration date for the repurchase program. See Note 6, Stockholders’ Equity, to the Consolidated Financial Statements for further discussion.
Insurance Recoveries to Cover Costs of 2013 Delhi Field Release. Our remediation efforts related to the 2013 release of well fluids at the Denbury-operated Delhi Field were completed during the fourth quarter of 2013, and as of December 31, 2015, virtually all of our total recorded cost of $130.8 million had been incurred. We maintain insurance policies to cover certain costs, damages and claims related to releases of well fluids and remediation. We have received a total of $29.5 million ($27.1 million net to Denbury) in insurance reimbursements related to the Delhi Field release and remediation. We have not reached any agreement with our remaining carriers as to further reimbursements, but given our belief that under our policies we are entitled to reimbursement of between approximately one-third and two-thirds of our total costs, we have filed suit to pursue further reimbursements, the ultimate outcome of which cannot be predicted.
Commitments and Obligations. A summary of our obligations at December 31, 2015, is presented in the following table:
Payments Due by Period | ||||||||||||||||||||
In thousands | 2016 | 2017 and 2018 | 2019 and 2020 | Thereafter | Total | |||||||||||||||
Contractual obligations | ||||||||||||||||||||
Bank Credit Agreement | $ | — | $ | — | $ | 175,000 | $ | — | $ | 175,000 | ||||||||||
Estimated interest payments on Bank Credit Facility and subordinated debt | 158,084 | 315,991 | 307,178 | 248,667 | 1,029,920 | |||||||||||||||
Subordinated debt | — | 2,250 | — | 2,850,000 | 2,852,250 | |||||||||||||||
Operating lease obligations | 12,639 | 21,759 | 19,349 | 47,380 | 101,127 | |||||||||||||||
Pipeline and capital lease obligations | 54,106 | 102,917 | 70,050 | 211,255 | 438,328 | |||||||||||||||
Other obligations (1) | 103,145 | 182,369 | 173,518 | 575,150 | 1,034,182 | |||||||||||||||
Asset retirement obligations (2) | 6,785 | 3,344 | 20,733 | 792,006 | 822,868 | |||||||||||||||
Total contractual obligations | $ | 334,759 | $ | 628,630 | $ | 765,828 | $ | 4,724,458 | $ | 6,453,675 | ||||||||||
(1) | Represents future cash commitments under contracts in place as of December 31, 2015, primarily for purchase contracts for CO2 captured from industrial sources, drilling rig services and well-related costs. As is common in our industry, we commit to make certain expenditures on a regular basis as part of our ongoing development and exploration program. These commitments generally relate to projects that occur during the subsequent several months and are usually part of our normal operating expenses or part of our capital budget (see 2016 Capital Spending above). We also have recurring expenditures for such things as accounting, engineering and legal fees; software maintenance; subscriptions; and other overhead-type items. Normally these expenditures do not change materially on an aggregate basis from year to year and are part of our general and administrative expenses. We have not attempted to estimate the amounts of these types of recurring expenditures in this table, as most could be quickly canceled with regard to any specific vendor, even though the expense itself may be required for our ongoing normal operations. For further discussion of our long-term commitments to purchase CO2, see Note 10, Commitments and Contingencies, to the Consolidated Financial Statements. |
(2) | Represents the estimated future asset retirement obligations on an undiscounted basis. The present value of the discounted asset retirement obligation is $145.7 million, as determined under the Asset Retirement and Environmental Obligations topic of the Financial Accounting Standards Board Codification (“FASC”), and is further discussed in Note 2, Asset Retirement Obligations, to the Consolidated Financial Statements. |
Off-Balance Sheet Arrangements. We have several operating leases relating to office space and other minor equipment leases. At December 31, 2015, we had a total of $14.8 million of letters of credit outstanding under our bank credit facility. See also Market Risk Management – Debt for a discussion of additional letters of credit to be issued subsequent to December 31, 2015. Additionally, we have obligations that are not currently recorded on our balance sheet relating to various obligations for development and exploratory expenditures that arise from our normal capital expenditure program or from other transactions common to our industry. These obligations are further described in Commitments and Obligations above. In addition, in order to recover our undeveloped proved reserves, we must also fund the associated future development costs estimated in our proved reserve reports, which are only included in the table above to the extent we have firm contracts. For a further discussion of our future development costs, see Supplemental Oil and Natural Gas Disclosures (Unaudited) to the Consolidated Financial Statements.
44
Denbury Resources Inc.
Management’s Discussion and Analysis of Financial Condition and Results of Operations
FINANCIAL OVERVIEW OF TERTIARY OPERATIONS
As discussed in Item 1, Business and Properties – Oil and Natural Gas Operations – Enhanced Oil Recovery Overview above, our tertiary operations represent a significant portion of our overall operations and have become our primary strategic focus. The economics of a tertiary field and the related impact on our financial statements differ from a conventional oil and gas play and are explained further below.
While it is difficult to accurately forecast future production, we believe our tertiary recovery operations provide significant long-term production growth potential at reasonable rates of return, with relatively low risk, assuming crude oil prices are at levels that support the development of those projects. Our rate of return from our tertiary operations has generally been higher than our rate of return on traditional oil and gas operations. Generally, finding and development costs are lower and operating costs are higher than traditional oil and gas operations. We have been developing tertiary oil properties for over 16 years, and the financial impact of such operations is reflected in our historical financial statements. The summary below highlights our observations regarding how tertiary operations have impacted our financial statements.
Finding and Development Costs. We currently expect finding and development costs (including future development and abandonment costs but excluding CO2 pipeline infrastructure capital expenditures) over the life of each field to be competitive or lower than the industry average costs for other oil properties. See the definition of finding and development costs in the Glossary and Selected Abbreviations.
Timing of Capital Costs. There is a significant delay between the initial capital expenditures on tertiary oil fields and the resulting production increases. We must build facilities, and often a CO2 pipeline to the field, before CO2 flooding can commence, and it usually takes six to twelve months before the field responds to the injection of CO2 (i.e., oil production commences). Further, we may spend significant amounts of capital before we can recognize any proved reserves from fields we flood and, even after a field has proved reserves, significant amounts of additional capital will usually be required to fully develop the field.
Recognition of Proved Reserves. In order to recognize proved tertiary oil reserves, we must either demonstrate production resulting from the tertiary process or the field must be analogous to an existing tertiary flood. The magnitude of proved reserves that we can book in any given year will depend on our progress with new floods, the timing of the production response from new floods and the performance of our existing floods. Typically, a high percentage of the potential reserves for a tertiary field are recognized when a production response is initially observed, and generally only modest increases are made thereafter.
Production Rates. The production rate at a tertiary flood can vary from quarter to quarter, as a tertiary field’s production may increase rapidly when wells respond to the CO2, plateau temporarily, and then resume growth as additional areas of the field are developed. During a tertiary flood life cycle, facility capacity is increased from time to time, which occasionally requires temporary shutdowns during installation, thereby causing temporary declines in production. We also find it difficult to precisely predict when any given well will respond to the injected CO2, as the CO2 seldom travels through the rock consistently due to heterogeneity in the oil-bearing formations. We find all of these fluctuations to be normal, and generally expect oil production at a tertiary field to increase over time until the field is fully developed, albeit sometimes in inconsistent patterns.
Operating Costs. Tertiary projects may be more expensive to operate than traditional industry operations because of the cost of injecting and recycling the CO2 (primarily due to the cost of the CO2 and the significant energy requirements to re-compress the CO2 back into a near-liquid state for re-injection purposes). The costs of our CO2 and the electricity required to recycle and inject this CO2 comprise over half of our typical tertiary operating expenses. Since these costs vary along with commodity and commercial electricity prices, they are highly variable and will increase in a high-commodity-price environment and decrease in a low-price environment. Most of our CO2 operating costs are allocated to our tertiary oil fields and recorded as lease operating expenses (following the commencement of tertiary oil production) at the time the CO2 is injected. These costs have historically represented approximately 20% to 25% of the total operating costs for our tertiary operations. Since we expense all of the operating costs to produce and inject our CO2 (following the commencement of tertiary oil production), operating costs per barrel for a new flood will be higher at the inception of CO2 injection projects because of minimal related oil production at that time.
45
Denbury Resources Inc.
Management’s Discussion and Analysis of Financial Condition and Results of Operations
RESULTS OF OPERATIONS
Operating Results Table
Certain of our operating results and statistics for each of the last three years are included in the following table.
Year Ended December 31, | ||||||||||||
In thousands, except per share and unit data | 2015 | 2014 | 2013 | |||||||||
Operating results | ||||||||||||
Net income (loss) (1) | $ | (4,385,448 | ) | $ | 635,491 | $ | 409,597 | |||||
Net income (loss) per common share – basic (1) | (12.57 | ) | 1.82 | 1.12 | ||||||||
Net income (loss) per common share – diluted (1) | (12.57 | ) | 1.81 | 1.11 | ||||||||
Dividends declared per common share (2) | 0.1875 | 0.2500 | — | |||||||||
Net cash provided by operating activities | 864,304 | 1,222,825 | 1,361,195 | |||||||||
Average daily production volumes | ||||||||||||
Bbls/d | 69,165 | 70,606 | 66,286 | |||||||||
Mcf/d | 22,172 | 22,955 | 23,742 | |||||||||
BOE/d | 72,861 | 74,432 | 70,243 | |||||||||
Operating revenues | ||||||||||||
Oil sales | $ | 1,194,038 | $ | 2,338,367 | $ | 2,435,625 | ||||||
Natural gas sales | 18,988 | 34,106 | 30,609 | |||||||||
Total oil and natural gas sales | $ | 1,213,026 | $ | 2,372,473 | $ | 2,466,234 | ||||||
Commodity derivative contracts (3) | ||||||||||||
Receipt (payment) on settlements of commodity derivatives | $ | 511,699 | $ | 1,421 | $ | (662 | ) | |||||
Noncash fair value adjustments on commodity derivatives (4) | (363,700 | ) | 553,834 | (40,362 | ) | |||||||
Commodity derivatives income (expense) | $ | 147,999 | $ | 555,255 | $ | (41,024 | ) | |||||
Unit prices – excluding impact of derivative settlements | ||||||||||||
Oil price per Bbl | $ | 47.30 | $ | 90.74 | $ | 100.67 | ||||||
Natural gas price per Mcf | 2.35 | 4.07 | 3.53 | |||||||||
Unit prices – including impact of derivative settlements (3) | ||||||||||||
Oil price per Bbl | $ | 67.41 | $ | 90.82 | $ | 100.64 | ||||||
Natural gas price per Mcf | 2.83 | 3.99 | 3.53 | |||||||||
Oil and natural gas operating expenses | ||||||||||||
Lease operating expenses (5) | $ | 515,043 | $ | 647,559 | $ | 730,574 | ||||||
Marketing expenses, net of third-party purchases, and plant operating expenses | 48,319 | 47,965 | 37,754 | |||||||||
Production and ad valorem taxes | 95,687 | 155,495 | 162,791 | |||||||||
Oil and natural gas operating revenues and expenses per BOE | ||||||||||||
Oil and natural gas revenues | $ | 45.61 | $ | 87.33 | $ | 96.19 | ||||||
Lease operating expenses (5) | 19.37 | 23.84 | 28.50 | |||||||||
Marketing expenses, net of third-party purchases, and plant operating expenses | 1.82 | 1.76 | 1.47 | |||||||||
Production and ad valorem taxes | 3.60 | 5.72 | 6.35 | |||||||||
CO2 sources and helium – revenues and expenses | ||||||||||||
CO2 and helium sales and transportation fees | $ | 30,626 | $ | 44,643 | $ | 27,950 | ||||||
CO2 and helium discovery and operating expenses | (4,557 | ) | (25,222 | ) | (16,916 | ) | ||||||
CO2 and helium revenue and expenses, net | $ | 26,069 | $ | 19,421 | $ | 11,034 | ||||||
(1) | Includes pre-tax full cost pool ceiling test write-downs of $4.9 billion and an impairment of goodwill charge of $1.3 billion for the year ended December 31, 2015. |
46
Denbury Resources Inc.
Management’s Discussion and Analysis of Financial Condition and Results of Operations
(2) | On September 21, 2015, in light of the continuing low oil price environment and our desire to maintain our financial strength and flexibility, the Company’s Board of Directors suspended our quarterly cash dividend effective after payment of our third quarter dividend on September 29, 2015. |
(3) | See also Commodity Derivative Contracts below and Market Risk Management for information concerning our commodity derivative transactions. |
(4) | Noncash fair value adjustments on commodity derivatives is a non-GAAP measure and is different from “Commodity derivatives expense (income)” in the Consolidated Statements of Operations in that the noncash fair value adjustments on commodity derivatives represent only the net change between periods of the fair market values of commodity derivative positions, and exclude the impact of settlements on commodity derivatives during the period, which were receipts (payments) on settlements of $511.7 million, $1.4 million and ($0.7 million) for the years ended December 31, 2015, 2014 and 2013, respectively. We believe that noncash fair value adjustments on commodity derivatives is a useful supplemental disclosure to “Commodity derivatives expense (income)” in order to differentiate noncash fair market value adjustments from settlements on commodity derivatives during the period. This supplemental disclosure is widely used within the industry and by securities analysts, banks and credit rating agencies in calculating EBITDA and in adjusting net income (loss) to present those measures on a comparative basis across companies, as well as to assess compliance with certain debt covenants. Noncash fair value adjustments on commodity derivatives is not a measure of financial or operating performance under GAAP, nor should it be considered in isolation or as a substitute for “Commodity derivatives expense (income)” in the Consolidated Statements of Operations. See also the Glossary and Selected Abbreviations for the definition of noncash fair value adjustments on commodity derivatives. |
(5) | Lease operating expenses reported in this table include certain special items, comprised of (1) lease operating expenses and related insurance recoveries recorded to remediate an area of Delhi Field (see Capital Resources and Liquidity – Insurance Recoveries to Cover Costs of 2013 Delhi Field Release above), (2) a reimbursement for a retroactive utility rate adjustment, and (3) other insurance recoveries. If these amounts were excluded, lease operating expenses would have totaled $528.8 million, $654.7 million and $616.6 million for the years ended December 31, 2015, 2014 and 2013, respectively, and lease operating expense per BOE would have averaged $19.88, $24.10 and $24.05 for the years ended December 31, 2015, 2014 and 2013, respectively. |
47
Denbury Resources Inc.
Management’s Discussion and Analysis of Financial Condition and Results of Operations
Production
Average daily production by area for 2015, 2014 and 2013, and for each of the quarters of 2015, is shown below:
Average Daily Production (BOE/d) | |||||||||||||||||
2015 Quarters | Year Ended December 31, | ||||||||||||||||
Operating Area | First Quarter | Second Quarter | Third Quarter | Fourth Quarter | 2015 | 2014 | 2013 | ||||||||||
Tertiary oil production | |||||||||||||||||
Gulf Coast region | |||||||||||||||||
Mature properties | |||||||||||||||||
Brookhaven | 1,612 | 1,691 | 1,712 | 1,671 | 1,672 | 1,759 | 2,223 | ||||||||||
Eucutta | 1,905 | 2,054 | 1,922 | 1,825 | 1,926 | 2,137 | 2,514 | ||||||||||
Mallalieu | 1,574 | 1,537 | 1,427 | 1,268 | 1,451 | 1,799 | 2,050 | ||||||||||
Other mature properties (1) | 5,710 | 5,888 | 5,885 | 5,639 | 5,781 | 6,122 | 7,016 | ||||||||||
Total mature properties | 10,801 | 11,170 | 10,946 | 10,403 | 10,830 | 11,817 | 13,803 | ||||||||||
Delhi (2) | 3,551 | 3,623 | 3,676 | 3,898 | 3,688 | 4,340 | 5,149 | ||||||||||
Hastings | 4,694 | 5,350 | 5,114 | 5,082 | 5,061 | 4,777 | 3,984 | ||||||||||
Heidelberg | 6,027 | 5,885 | 5,600 | 5,635 | 5,785 | 5,707 | 4,466 | ||||||||||
Oyster Bayou | 5,861 | 5,936 | 5,962 | 5,831 | 5,898 | 4,683 | 2,968 | ||||||||||
Tinsley | 8,928 | 8,740 | 7,311 | 7,522 | 8,119 | 8,507 | 8,051 | ||||||||||
Total Gulf Coast region | 39,862 | 40,704 | 38,609 | 38,371 | 39,381 | 39,831 | 38,421 | ||||||||||
Rocky Mountain region | |||||||||||||||||
Bell Creek | 1,965 | 1,880 | 2,225 | 2,806 | 2,221 | 1,248 | 56 | ||||||||||
Total Rocky Mountain region | 1,965 | 1,880 | 2,225 | 2,806 | 2,221 | 1,248 | 56 | ||||||||||
Total tertiary oil production | 41,827 | 42,584 | 40,834 | 41,177 | 41,602 | 41,079 | 38,477 | ||||||||||
Non-tertiary oil and gas production | |||||||||||||||||
Gulf Coast region | |||||||||||||||||
Mississippi | 1,761 | 1,400 | 1,592 | 1,800 | 1,638 | 2,318 | 2,695 | ||||||||||
Texas | 6,490 | 6,304 | 6,508 | 6,470 | 6,443 | 6,290 | 6,540 | ||||||||||
Other | 1,006 | 906 | 846 | 800 | 889 | 1,061 | 1,097 | ||||||||||
Total Gulf Coast region | 9,257 | 8,610 | 8,946 | 9,070 | 8,970 | 9,669 | 10,332 | ||||||||||
Rocky Mountain region | |||||||||||||||||
Cedar Creek Anticline (3) | 18,522 | 18,089 | 17,515 | 17,875 | 17,997 | 18,834 | 16,572 | ||||||||||
Other | 4,750 | 4,433 | 4,115 | 3,880 | 4,292 | 4,850 | 4,862 | ||||||||||
Total Rocky Mountain region | 23,272 | 22,522 | 21,630 | 21,755 | 22,289 | 23,684 | 21,434 | ||||||||||
Total non-tertiary production | 32,529 | 31,132 | 30,576 | 30,825 | 31,259 | 33,353 | 31,766 | ||||||||||
Total production | 74,356 | 73,716 | 71,410 | 72,002 | 72,861 | 74,432 | 70,243 | ||||||||||
(1) | Other mature properties include Cranfield, Little Creek, Lockhart Crossing, Martinville, McComb and Soso fields. |
(2) | Beginning in late 2014, the average daily Delhi Field production amounts reflect the reversionary assignment of approximately 25% of our interest in that field. The effectiveness, timing, and scope of the reversionary assignment are subject to ongoing litigation, the ultimate outcome of which cannot be predicted. |
(3) | Beginning March 27, 2013, amounts include production from our purchase of additional interests in the Cedar Creek Anticline (“CCA”) on that date. |
Total Production
Total production during 2015 averaged 72,861 BOE/d, a decrease of 1,571 BOE/d (2%) compared to 2014 levels, due primarily to production declines at our mature tertiary properties in the Gulf Coast region, Mississippi non-tertiary properties and CCA in
48
Denbury Resources Inc.
Management’s Discussion and Analysis of Financial Condition and Results of Operations
the Rocky Mountain region, as well as a production decline at Tinsley Field and a contractual reversionary interest assignment at Delhi Field, each of which is discussed in further detail below. The production declines mentioned above and in other fields include approximately 1,650 BOE/d of production (excluding Riley Ridge) that, as of December 31, 2015, we estimated to be attributable to wells shut-in as uneconomic to either produce or repair due to commodity prices at this time. These shut-in wells resulted in an average decrease in 2015 production of just over 1,000 BOE/d. These negative impacts upon production were partially offset by increases in production at our newer tertiary floods. We currently anticipate production declines in 2016 in the range of approximately seven to twelve percent from average 2015 levels, approximately 60% of which relates to natural production declines, with the remainder related to wells that are uneconomic to either produce or repair in the current price environment.
Total production during 2014 averaged 74,432 BOE/d, an increase of 4,189 BOE/d (6%) compared to 2013 levels, due primarily to a 2,602 Bbls/d (7%) production increase from our tertiary oil fields in 2014 and our receiving only nine months of production in 2013 from the purchase of additional interests in CCA in late-March 2013, partially offset by a decrease of 663 BOE/d in our Gulf Coast non-tertiary production.
Our production mix between oil and natural gas has remained relatively constant over the last three years, with oil representing 95% of our production during 2015 and 2014 and 94% for 2013.
Tertiary Production
Oil production from our tertiary operations reached an annual record during 2015, averaging 41,602 Bbls/d, a 1% increase over our 2014 tertiary production level of 41,079 Bbls/d, primarily due to production growth in response to continued field development and expansion of facilities in our tertiary floods at Hastings and Oyster Bayou fields in our Gulf Coast region and Bell Creek Field in our Rocky Mountain region. Partially offsetting these 2015 production gains were natural production declines at our mature properties in the Gulf Coast region, as well as our ownership interest at Delhi Field decreasing as of November 1, 2014, due to a contractual reversionary assignment of approximately 25% of our interest to the seller of the field, the effectiveness, timing, and scope of which are subject to ongoing litigation, and which reduced our 2015 production by approximately 1,200 Bbls/d. We also experienced a production decline at Tinsley Field due to facility processing constraints and impacts of warmer temperatures restricting CO2 injection and recycling, which caused us to shut-in certain wells during the third quarter of 2015. Production from Tinsley Field increased in the fourth quarter of 2015, but is believed to have peaked in 2015, with a modest production decline currently expected in 2016.
Oil production from our tertiary operations during 2014 averaged 41,079 Bbls/d, a 7% increase over our 2013 tertiary production level of 38,477 Bbls/d, primarily due to production growth in 2014 in response to continued field development and expansion of facilities in our tertiary floods at Hastings, Heidelberg, Oyster Bayou and Tinsley fields in our Gulf Coast region and Bell Creek Field in our Rocky Mountain region. Partially offsetting these 2014 production gains were production declines in our mature tertiary fields, as well as declines at Delhi Field due to the mid-2013 incident and the contractual reversionary assignment of approximately 25% of our interest to the seller of the field.
Non-Tertiary Production
Production from our non-tertiary operations averaged 31,259 BOE/d during 2015, a decrease of 2,094 BOE/d (6%) compared to 2014 levels. The non-tertiary production decrease was due primarily to natural production declines at our Mississippi non-tertiary properties, CCA and our other non-tertiary Rocky Mountain properties, as well as shutting in certain wells that are uneconomic to either produce or repair at this time due to commodity prices. As of December 31, 2015, we estimated approximately 1,500 BOE/d of non-tertiary production (excluding Riley Ridge) to be attributable to wells shut-in as uneconomic to either produce or repair due to commodity prices at this time. When comparing 2014 to 2013, production from our non-tertiary operations increased to an average of 33,353 BOE/d, an increase of 1,587 BOE/d (5%) from 2013 production levels. The non-tertiary production increase was primarily due to the additional three months of production in 2014 from the purchase of additional interests in the CCA in late-March 2013. With the exception of the impact of the production added from fields acquired during 2013, production from our other non-tertiary properties is generally on decline. In addition, the decline is pronounced in some instances when non-tertiary wells are shut-in as part of an initiation or expansion of our tertiary floods in a field or an area of a field.
49
Denbury Resources Inc.
Management’s Discussion and Analysis of Financial Condition and Results of Operations
Oil and Natural Gas Revenues
Oil and natural gas revenues decreased 49% between 2015 and 2014 and decreased 4% between 2014 and 2013. The changes in our oil and natural gas revenues are due to changes in production quantities and commodity prices (excluding any impact of our commodity derivative contracts) as reflected in the following table:
Year Ended December 31, 2015 vs. 2014 | Year Ended December 31, 2014 vs. 2013 | |||||||||||||
In thousands | Decrease in Revenues | Percentage Decrease in Revenues | Increase (Decrease) in Revenues | Percentage Increase (Decrease) in Revenues | ||||||||||
Change in oil and natural gas revenues due to: | ||||||||||||||
Increase (decrease) in production | $ | (50,093 | ) | (2 | )% | $ | 147,093 | 6 | % | |||||
Decrease in commodity prices | (1,109,354 | ) | (47 | )% | (240,854 | ) | (10 | )% | ||||||
Total decrease in oil and natural gas revenues | $ | (1,159,447 | ) | (49 | )% | $ | (93,761 | ) | (4 | )% | ||||
Excluding any impact of our commodity derivative contracts, our average net realized commodity prices and NYMEX differentials were as follows during 2015, 2014 and 2013:
Year Ended December 31, | |||||||||||
2015 | 2014 | 2013 | |||||||||
Average net realized prices | |||||||||||
Oil price per Bbl | $ | 47.30 | $ | 90.74 | $ | 100.67 | |||||
Natural gas price per Mcf | 2.35 | 4.07 | 3.53 | ||||||||
Price per BOE | 45.61 | 87.33 | 96.19 | ||||||||
Average NYMEX differentials | |||||||||||
Oil per Bbl | $ | (1.55 | ) | $ | (2.21 | ) | $ | 2.62 | |||
Natural gas per Mcf | (0.28 | ) | (0.20 | ) | (0.19 | ) | |||||
As reflected in the table above, our average net realized oil price, excluding the impact of commodity derivative contracts, decreased 48% during 2015 from the average price received during 2014. Company-wide average oil price differentials were $1.55 per Bbl below NYMEX in 2015, compared to an average differential of $2.21 per Bbl below NYMEX in 2014 and $2.62 per Bbl above NYMEX in 2013. Prices received in a regional market fluctuate frequently and can differ from NYMEX pricing due to a variety of reasons, including supply and/or demand factors, crude oil quality, and location differentials. The oil differentials we received in the Gulf Coast and Rocky Mountain regions are discussed in further detail below.
Our average NYMEX oil differential in the Gulf Coast region was a positive $0.49 per Bbl, $1.73 per Bbl and $7.29 per Bbl during 2015, 2014 and 2013, respectively. These differentials are impacted significantly by the changes in prices received for our crude oil sold under LLS index prices relative to the change in NYMEX prices, as well as various other price adjustments such as those noted above. The LLS-to-NYMEX differential (on a trade-month basis) averaged a positive $3.72 per Bbl, $3.88 per Bbl and $11.10 per Bbl during 2015, 2014 and 2013, respectively. During 2015, we sold approximately 62% of our crude oil at prices based on, or partially tied to, the LLS index price, and the balance at prices based on various other indexes tied to NYMEX prices, primarily in the Rocky Mountain region.
NYMEX oil differentials in the Rocky Mountain region averaged $5.60 per Bbl below NYMEX during 2015 compared to an average differential of $10.19 per Bbl below NYMEX in 2014 and $8.10 per Bbl below NYMEX in 2013. Differentials in the Rocky Mountain region can fluctuate significantly on a month-to-month basis due to weather, refinery or transportation issues, and Canadian and U.S. crude oil price index volatility.
50
Denbury Resources Inc.
Management’s Discussion and Analysis of Financial Condition and Results of Operations
Commodity Derivative Contracts
From time to time, we enter into oil and natural gas derivative contracts to provide an economic hedge of our exposure to commodity price risk associated with anticipated future oil and natural gas production and to provide more certainty to our future cash flows. These contracts have historically consisted of price floors, collars, three-way collars, fixed-price swaps, and fixed-price swaps enhanced with a sold put. The following table summarizes the impact our oil and natural gas derivative contracts had on our operating results for 2015, 2014 and 2013:
Noncash Fair Value Gain/(Loss) (1) | Receipt/(Payment) on Settlements | |||||||||||||||||||||||
In thousands | 2015 | 2014 | 2013 | 2015 | 2014 | 2013 | ||||||||||||||||||
Crude oil derivative contracts | ||||||||||||||||||||||||
First quarter | $ | (65,122 | ) | $ | (48,854 | ) | $ | (11,929 | ) | $ | 147,716 | $ | (26,559 | ) | $ | — | ||||||||
Second quarter | (172,022 | ) | (124,865 | ) | 45,501 | 123,183 | (49,895 | ) | — | |||||||||||||||
Third quarter | (68,054 | ) | 276,240 | (79,784 | ) | 159,770 | (25,016 | ) | (662 | ) | ||||||||||||||
Fourth quarter | (55,559 | ) | 448,365 | 5,854 | 77,142 | 103,555 | — | |||||||||||||||||
Full Year | $ | (360,757 | ) | $ | 550,886 | $ | (40,358 | ) | $ | 507,811 | $ | 2,085 | $ | (662 | ) | |||||||||
Natural gas derivative contracts | ||||||||||||||||||||||||
First quarter | $ | (267 | ) | $ | (646 | ) | $ | — | $ | 749 | $ | (610 | ) | $ | — | |||||||||
Second quarter | (1,055 | ) | 266 | — | 968 | (277 | ) | — | ||||||||||||||||
Third quarter | (595 | ) | 939 | — | 907 | 102 | — | |||||||||||||||||
Fourth quarter | (1,026 | ) | 2,389 | (4 | ) | 1,264 | 121 | — | ||||||||||||||||
Full Year | $ | (2,943 | ) | $ | 2,948 | $ | (4 | ) | $ | 3,888 | $ | (664 | ) | $ | — | |||||||||
Total commodity derivative contracts | ||||||||||||||||||||||||
First quarter | $ | (65,389 | ) | $ | (49,500 | ) | $ | (11,929 | ) | $ | 148,465 | $ | (27,169 | ) | $ | — | ||||||||
Second quarter | (173,077 | ) | (124,599 | ) | 45,501 | 124,151 | (50,172 | ) | — | |||||||||||||||
Third quarter | (68,649 | ) | 277,179 | (79,784 | ) | 160,677 | (24,914 | ) | (662 | ) | ||||||||||||||
Fourth quarter | (56,585 | ) | 450,754 | 5,850 | 78,406 | 103,676 | — | |||||||||||||||||
Full Year | $ | (363,700 | ) | $ | 553,834 | $ | (40,362 | ) | $ | 511,699 | $ | 1,421 | $ | (662 | ) | |||||||||
(1) | Noncash fair value adjustments on commodity derivatives is a non-GAAP measure. See Operating Results Table above for a discussion of the reconciliation between noncash fair value adjustments on commodity derivatives to “Commodity derivatives expense (income)” in the Consolidated Statements of Operations. See also the Glossary and Selected Abbreviations for the definition of noncash fair value adjustments on commodity derivatives. |
We previously deferred entering into new derivative contracts due to the significant and rapid decline in oil prices. However, we have recently begun hedging limited production levels in the second half of 2016 to provide more certainty and protect our cash costs. As of February 18, 2016, we have entered into a combination of collars, three-way collars, fixed-price swaps, and fixed-price swaps enhanced with a sold put covering a total of 36,000 Bbls/d for the first quarter of 2016, 34,000 Bbls/d for the second quarter of 2016, 24,000 Bbls/d for the third quarter of 2016, and 30,000 Bbls/d for the fourth quarter of 2016, with minimal hedges currently in place in early 2017. On average, roughly one-third of these 2016 derivative contracts are three-way collars or enhanced swaps, which include sold puts that have a weighted average price of approximately $68 per Bbl, limiting the benefit that our hedges provide us to the extent oil prices remain below the price of these sold puts. We anticipate that we may use more fixed-price swaps in the future or a combination of fixed-price swaps and collars as we look to provide more certainty around our future cash flows.
Changes in commodity prices and the expiration of contracts cause fluctuations in the estimated fair value of our oil and natural gas derivative contracts. Because we do not utilize hedge accounting for our commodity derivative contracts, the period-to-period changes in the fair value of these contracts, as outlined above, are recognized in our statements of operations. The details
51
Denbury Resources Inc.
Management’s Discussion and Analysis of Financial Condition and Results of Operations
of our outstanding commodity derivative contracts at December 31, 2015, are included in Note 8, Commodity Derivative Contracts, to the Consolidated Financial Statements. Also, see Market Risk Management below for additional discussion on our commodity derivative contracts.
Production Expenses
Lease operating expense
Year Ended December 31, | ||||||||||||
In thousands, except per-BOE data | 2015 | 2014 | 2013 | |||||||||
Lease operating expense | ||||||||||||
Tertiary | $ | 315,422 | $ | 385,080 | $ | 358,281 | ||||||
Non-tertiary | 213,336 | 269,613 | 258,293 | |||||||||
Total recurring lease operating expense | 528,758 | 654,693 | 616,574 | |||||||||
Tertiary – special items (1) | (13,715 | ) | (7,134 | ) | 114,000 | |||||||
Total lease operating expense | $ | 515,043 | $ | 647,559 | $ | 730,574 | ||||||
Lease operating expense per BOE | ||||||||||||
Tertiary | $ | 20.77 | $ | 25.68 | $ | 25.51 | ||||||
Non-tertiary | 18.70 | 22.15 | 22.28 | |||||||||
Total recurring lease operating expense per BOE | 19.88 | 24.10 | 24.05 | |||||||||
Tertiary – special items (1) | (0.90 | ) | (0.47 | ) | 8.12 | |||||||
Total lease operating expense per BOE | 19.37 | 23.84 | 28.50 | |||||||||
(1) | Tertiary lease operating expenses during 2015 included special items related to insurance and other reimbursements totaling $13.7 million, or $0.90 per Bbl, comprised of a reimbursement for a retroactive utility rate adjustment ($9.6 million) and an insurance reimbursement for previous well control costs ($4.1 million). Tertiary lease operating expenses during 2014 included special items consisting of lease operating expenses and related insurance recoveries to remediate an area of Delhi Field due to a 2013 release, for a net reimbursement of $7.1 million, or $0.47 per Bbl. Tertiary lease operating expenses during 2013 included special items consisting of Delhi remediation charges of $114.0 million, or $8.12 per Bbl (see Capital Resources and Liquidity – Insurance Recoveries to Cover Costs of 2013 Delhi Field Release above). |
Our lease operating costs have declined as a result of our cost reduction efforts throughout 2014 and 2015, as well as general market decreases in the prices of many of the components of these costs, and our total recurring normalized lease operating expenses in the fourth quarter of 2015 were less than $19.50 per BOE. Our recurring lease operating expenses per BOE decreased in each of our last eight sequential quarters and decreased a total of 26% between the fourth quarter of 2013 and the fourth quarter of 2015. Total lease operating expenses, excluding special items, decreased $125.9 million (19%) on an absolute-dollar basis, or $4.22 (18%) on a per-BOE basis in 2015 compared to 2014. The decrease was due to cost decreases in most categories of lease operating expenses, the most significant of which included (1) a decrease in workover costs, (2) lower CO2 expense resulting from a decrease in CO2 injection volumes (14%) and a decrease in the cost of CO2, which correlates with oil prices, (3) lower power costs due to lower usage, and (4) lower third-party contractor and vendor expenses such as contract labor and chemical costs. Total lease operating expenses during 2014, excluding special items, increased $38.1 million (6%) on an absolute-dollar basis, or $0.05 on a per-BOE basis compared to 2013, due primarily to (1) costs associated with expansion of tertiary floods, including a full year of lease operating expense at Bell Creek Field, which increased our operating expenses by approximately $19 million from 2013, (2) a full year of operating expenses associated with our acquisition of additional interests in CCA in late-March 2013 as compared to only approximately nine months of expenses associated with our additional interests in CCA in 2013, which increased operating expense by approximately $10 million, (3) higher power costs in 2014 due in part to higher natural gas prices, and (4) the impact of a large unplanned well workover at Riley Ridge, which increased operating expenses by approximately $12 million in 2014. Offsetting some of these increases were savings associated with our more efficient utilization of CO2, which allowed us to reduce injections at some of our fields and lower workover costs across many of our fields, which was a primary focus for us in 2014.
52
Denbury Resources Inc.
Management’s Discussion and Analysis of Financial Condition and Results of Operations
Tertiary lease operating expenses, excluding special items detailed above, decreased $69.7 million (18%) on an absolute-dollar basis, or $4.91 (19%) on a per-barrel basis during 2015 compared to 2014, primarily due to the same reasons noted above. As part of our cost reduction efforts, we have identified fields where we have been able to reduce CO2 injections without impacting oil production. As such, we have been able to reduce injected CO2 volumes in the Gulf Coast region by 18% when compared to those in 2014. In addition, our operating costs on a per-barrel basis at our newer tertiary floods such as Oyster Bayou and Bell Creek fields have improved from those in 2014 due to production increases. Tertiary lease operating expenses during 2014, excluding special items, increased $26.8 million (7%) on an absolute-dollar basis, or $0.17 on a per-barrel basis compared to 2013 levels, due primarily to additional costs associated with our newest tertiary flood at Bell Creek Field, which had initial production and operating expense in the third quarter of 2013, as well as its production being low relative to operating costs because production was still ramping up, resulting in high per-barrel operating costs, which is typical when we startup a new tertiary flood. The increase between periods for our tertiary oil fields was further impacted by higher power costs due to higher rates and usage during 2014. One of our most substantial costs in our tertiary operations is our cost for fuel and utilities, averaging $6.09 per Bbl in 2015, $7.46 per Bbl in 2014 and $6.64 per Bbl in 2013, which has decreased on a per-barrel basis during 2015 due to the lower usage due to efficiencies.
Currently, our CO2 expense comprises approximately 22% of our typical tertiary lease operating expenses, and for the CO2 reserves we already own, consists of CO2 production expenses, and for the CO2 reserves we do not own, consists of our purchase of CO2 from royalty and working interest owners and industrial sources. During the year ended December 31, 2015, approximately 59% of the CO2 utilized in our CO2 floods consisted of CO2 owned and produced by us (our net revenue interest). The price we pay others for CO2 varies by source and is generally indexed to oil prices. When combining the production cost of the CO2 we own with what we pay third parties for CO2, our average cost of CO2 during 2015 was approximately $0.32 per Mcf, including taxes paid on CO2 production but excluding depletion and depreciation of capital. This rate during 2015 was lower than the $0.37 per Mcf comparable measure during 2014 and $0.36 per Mcf during 2013, primarily due to reductions in the price of CO2 due to the significant decline in oil prices (though the decline is somewhat limited by certain contracts in place with price floors), partially offset by higher utilization of industrial-source CO2, which has a higher average cost than our naturally occurring CO2 sources. Including the cost of depreciation and amortization of capital expended at our CO2 source fields and industrial sources, but excluding depreciation of our CO2 pipelines, our cost of CO2 was $0.43 per Mcf in 2015, $0.48 per Mcf in 2014 and $0.44 per Mcf in 2013.
Non-tertiary lease operating expenses decreased $56.3 million (21%) on an absolute-dollar basis during 2015 compared to 2014, primarily due to lower workover costs, repairs and maintenance costs, and lower third-party contractor and vendor expenses such as contract labor and chemical costs during 2015. Non-tertiary lease operating expenses increased $11.3 million (4%) on an absolute-dollar basis between 2014 and 2013, primarily due to workover costs at Riley Ridge of approximately $12 million, as well as our late-March 2013 purchase of additional interests in CCA, which caused an increase in costs, but which properties generally have a lower operating cost on a per-BOE basis than our other non-tertiary properties.
Marketing and plant operating expenses
Marketing and plant operating expenses primarily consist of amounts incurred related to the marketing, processing, and transportation of oil and natural gas production, as well as expenses related to our Riley Ridge gas processing facility. Marketing and plant operating expenses decreased $8.6 million between 2015 and 2014 and increased $15.1 million between 2014 and 2013. The decrease during 2015 was primarily due to reductions in marketing, compression, and plant processing fees, as well as reductions related to the Riley Ridge gas processing facility, which was shut-in during 2015, and will remain shut-in during 2016. The increase during 2014 was primarily related to the Riley Ridge gas processing facility, which was placed into service in the fourth quarter of 2013, slightly offset by other decreases.
Taxes other than income
Taxes other than income includes production, ad valorem and franchise taxes. Taxes other than income decreased $59.7 million between 2015 and 2014 and decreased $6.5 million between 2014 and 2013. The levels of taxes other than income during most periods are generally aligned with fluctuations in oil and natural gas revenues. The decrease during 2014 was also impacted by cumulative reductions in severance taxes during 2014 at Hastings Field ($7.5 million) and Oyster Bayou Field ($7.4 million) for state-approved enhanced oil recovery project exemptions, which will also reduce severance taxes for those fields for approximately the next seven years, but to a much lesser degree on an annual basis, as these state-approved exemptions were carried back to certain prior years, with the full impact recorded in 2014. The change was further impacted by the change in the mix of properties subject to production and ad valorem taxes as a result of the CCA acquisition in March 2013. Based upon the
53
Denbury Resources Inc.
Management’s Discussion and Analysis of Financial Condition and Results of Operations
significant reduction in commodity prices during 2015 and the related impact upon the value of our oil and natural gas properties and equipment, we currently expect our ad valorem tax rates to decrease during 2016, the ultimate impact of which cannot yet be determined.
General and Administrative Expenses (“G&A”)
Year Ended December 31, | ||||||||||||
In thousands, except per-BOE data and employees | 2015 | 2014 | 2013 | |||||||||
Gross cash compensation and administrative costs | $ | 328,802 | $ | 352,651 | $ | 324,580 | ||||||
Gross stock-based compensation | 39,285 | 39,532 | 42,091 | |||||||||
Operator labor and overhead recovery charges | (161,182 | ) | (171,661 | ) | (166,012 | ) | ||||||
Capitalized exploration and development costs | (62,341 | ) | (62,179 | ) | (55,448 | ) | ||||||
Net G&A expense | $ | 144,564 | $ | 158,343 | $ | 145,211 | ||||||
G&A per BOE | ||||||||||||
Net administrative costs | $ | 4.39 | $ | 4.81 | $ | 4.47 | ||||||
Net stock-based compensation | 1.05 | 1.02 | 1.19 | |||||||||
Net G&A expense | $ | 5.44 | $ | 5.83 | $ | 5.66 | ||||||
Employees as of December 31 | 1,356 | 1,523 | 1,501 | |||||||||
Gross cash compensation and administrative costs on an absolute-dollar basis decreased $23.8 million (7%) between 2015 and 2014. As part of our efforts to reduce overhead and operating costs in response to the significant decline in oil prices, we reduced our employee headcount in mid-2015 through an involuntary workforce reduction, which contributed to an overall headcount reduction of approximately 11% between January 1, 2015 and December 31, 2015. The severance payments associated with the workforce reduction were not material to the annual financial results. The decrease in gross cash compensation and administrative costs during the year ended December 31, 2015, compared to 2014, was primarily due to (1) lower employee-related costs such as salaries, bonus accruals and long-term incentives resulting from reductions in employee headcount and annual bonus payout percentages during 2015, (2) a reduction in costs associated with our stock purchase plan following its termination at the end of the first quarter of 2015 and (3) a reduction in professional services during 2015, partially offset by severance payments associated with the workforce reduction and higher employee-related insurance costs. Gross cash compensation and administrative costs on an absolute-dollar basis increased $28.1 million (9%) between 2014 and 2013. The increase was due primarily to higher compensation-related costs from increases in headcount and wages, insurance, and professional services. The increase during 2014 was further impacted by the 2013 period including a $1.9 million insurance reimbursement.
Net G&A expense on a per-BOE basis decreased 7% between 2015 and 2014 and increased 3% between 2014 and 2013. The decrease between 2015 and 2014 was primarily based on the changes noted in gross cash compensation and administrative costs, partially offset by lower operator and overhead recovery charges and lower production volumes. The increase between 2014 and 2013 was primarily due to higher compensation-related costs, partially offset by an increase in operator labor and overhead recovery charges and capitalized exploration and development costs. The 2014 period was further impacted by an increase in production in 2014 and the 2013 period including a $1.9 million insurance reimbursement. In addition to our reduction in employee headcount in mid-2015, as a result of the continuing efforts to reduce overhead and operating costs in response to the continued decline in oil prices, we further reduced our employee headcount in February 2016 through an involuntary workforce reduction, which contributed to an overall headcount reduction of approximately 20% from our December 31, 2015 levels. The severance payments associated with the 2016 workforce reduction are expected to be slightly less than $10 million, with the reduction in total compensation estimated to be in the range of $30 million to $40 million on an annualized basis (including stock-based compensation) and is allocated across general and administrative expense, lease operating expense and capitalized costs.
Gross stock-based compensation decreased in 2014 compared to 2013 due to a shift in the mix of long-term incentive compensation for employees. Stock-based compensation, net of amounts capitalized or reclassified to field operations, was $28.0 million, $27.8 million and $30.4 million during the years ended December 31, 2015, 2014 and 2013, respectively.
54
Denbury Resources Inc.
Management’s Discussion and Analysis of Financial Condition and Results of Operations
Our well operating agreements allow us, when we are the operator, to charge a well with a specified overhead rate during the drilling phase and also to charge a monthly fixed overhead rate for each producing well. In addition, salaries associated with field personnel are initially recorded as gross cash compensation and administrative costs and subsequently reclassified to lease operating expenses or capitalized to field development costs to the extent those individuals are dedicated to oil and natural gas production, exploration, and development activities.
Interest and Financing Expenses
Year Ended December 31, | ||||||||||||
In thousands, except per-BOE data and interest rates | 2015 | 2014 | 2013 | |||||||||
Cash interest expense | $ | 182,293 | $ | 193,729 | $ | 205,938 | ||||||
Noncash interest expense | 9,121 | 13,476 | 14,024 | |||||||||
Less: capitalized interest | (32,146 | ) | (24,202 | ) | (79,253 | ) | ||||||
Interest expense, net | $ | 159,268 | $ | 183,003 | $ | 140,709 | ||||||
Interest expense, net per BOE | $ | 5.99 | $ | 6.74 | $ | 5.49 | ||||||
Average debt outstanding | $ | 3,481,192 | $ | 3,597,646 | $ | 3,257,686 | ||||||
Average interest rate (1) | 5.2 | % | 5.4 | % | 6.3 | % | ||||||
(1) | Includes commitment fees but excludes debt issue costs and amortization of discount or premium. |
As reflected in the table above, our average interest rate decreased each year in the period between 2013 and 2015. Our average interest rate during 2015 reflects a full-year impact of our April 2014 long-term debt refinancing, whereby we issued $1.25 billion of 5½% Senior Subordinated Notes due 2022 to replace our $996.3 million of 8¼% Senior Subordinated Notes due 2020. The average interest rate during 2014 reflects a full-year impact of our refinancing in February 2013 of certain senior subordinated notes, which had interest rates of 9½% and 9¾%, with our 4⅝% Senior Subordinated Notes due 2023.
Cash interest expense during 2015 decreased $11.4 million compared to 2014 as the result of a decrease in average debt outstanding and a decrease in the average interest rate. Capitalized interest increased $7.9 million during 2015, primarily due to incremental capitalized interest on projects that qualify for interest capitalization, contributing to a decrease in net interest expense of $23.7 million (13%) between 2015 and 2014.
Cash interest expense during 2014 decreased $12.2 million compared to 2013 as the result of a decrease in the average interest rate, partially offset by an increase in average debt outstanding. Capitalized interest decreased $55.1 million during 2014 as a result of completing major projects on which we had been previously capitalizing interest, specifically the Riley Ridge gas processing facility, Greencore Pipeline and the tertiary flood at Bell Creek Field, contributing to an increase in net interest expense of $42.3 million (30%) between 2014 and 2013.
55
Denbury Resources Inc.
Management’s Discussion and Analysis of Financial Condition and Results of Operations
Depletion, Depreciation, and Amortization (“DD&A”)
Year Ended December 31, | ||||||||||||
In thousands, except per-BOE data | 2015 | 2014 | 2013 | |||||||||
Depletion and depreciation of oil and natural gas properties | $ | 403,340 | $ | 460,726 | $ | 392,603 | ||||||
Depletion and depreciation of CO2 properties | 26,996 | 30,986 | 27,783 | |||||||||
Amortization of asset retirement obligations | 9,649 | 8,870 | 8,450 | |||||||||
Depreciation of pipelines, plants and other property and equipment | 91,675 | 92,390 | 81,107 | |||||||||
Total DD&A | $ | 531,660 | $ | 592,972 | $ | 509,943 | ||||||
DD&A per BOE | ||||||||||||
Oil and natural gas properties | $ | 15.53 | $ | 17.29 | $ | 15.64 | ||||||
CO2, pipelines, plants and other property and equipment | 4.46 | 4.54 | 4.25 | |||||||||
Total DD&A per BOE | $ | 19.99 | $ | 21.83 | $ | 19.89 | ||||||
Write-down of oil and natural gas properties | $ | 4,939,600 | $ | — | $ | — | ||||||
We adjust our DD&A rate each quarter for significant changes in our estimates of oil and natural gas reserves and costs. In addition, under full cost accounting rules, the divestiture of oil and natural gas properties generally does not result in gain or loss recognition; instead, the proceeds of the disposition reduce the full cost pool. As such, our DD&A rate has changed significantly over time, and it may continue to change in the future. DD&A of oil and natural gas properties and asset retirement obligations decreased 12% on an absolute-dollar basis and 10% on a per-BOE basis between 2015 and 2014, primarily due to a reduction in depletable costs associated with our reserves base resulting from the full cost pool ceiling test write-downs recognized during the first nine months of 2015 and an overall reduction in future development costs, partially offset by reductions in proved oil and natural gas reserve quantities. The per-BOE decrease was also partially offset by a decrease in production volumes during 2015 when compared to 2014. Due to these factors, our depletion and depreciation rate of oil and natural gas properties decreased to $12.59 per BOE during the fourth quarter of 2015, and we currently expect our rate to decrease further in 2016 given the additional full cost pool ceiling test write-down recognized during the fourth quarter of 2015, the impact of which will also be impacted by potential changes in reserve volumes, production, and future capital expenditure estimates, among other factors.
DD&A of oil and natural gas properties and asset retirement obligations increased 17% on an absolute-dollar basis and 11% on a per-BOE basis between 2014 and 2013. The increase on an absolute-dollar basis was due to both higher production volumes and a higher depletion rate per BOE compared to 2013. The increase on a per-BOE basis was primarily due to the recognition in late 2013 of proved reserves at Bell Creek Field and the related reclassification of costs from unevaluated to evaluated, and higher average forecasted future development costs throughout the year.
Depletion and depreciation of our CO2, pipelines, plants and other property and equipment decreased on an absolute-dollar and per-BOE basis during 2015 from 2014 levels, primarily due to a decrease in CO2 production during the period, as we have been able to reduce the level of CO2 production and injections with only a slight impact to our oil production, partially offset by a decrease in CO2 reserve quantities. Depletion and depreciation of our CO2, pipelines, plants and other property and equipment increased on an absolute-dollar and per-BOE basis during 2014 compared to 2013, primarily due to the startup of the Riley Ridge gas processing facility in late 2013 and additional pipelines and CO2 properties placed in service.
Write-Down of Oil and Natural Gas Properties
Under full cost accounting rules, we are required each quarter to perform a ceiling test calculation. Under these rules, the full cost ceiling value is calculated using the average first-day-of-the-month oil and natural gas price for each month during a 12-month rolling period ended as of each quarterly reporting period. As a result of the precipitous and continuing decline in NYMEX oil prices since the fourth quarter of 2014, the rolling first-day-of-the-month average oil price for the preceding 12 months, after adjustments for market differentials by field, has fallen throughout 2015, from $79.55 per Bbl for the first quarter of 2015, to $68.48 per Bbl for the second quarter of 2015, $56.74 per Bbl for the third quarter of 2015, and $48.11 per Bbl for the fourth quarter of 2015. In addition, the first-day-of-the-month average natural gas price for the preceding 12 months, after adjustments
56
Denbury Resources Inc.
Management’s Discussion and Analysis of Financial Condition and Results of Operations
for market differentials by field, was $3.95 per Mcf for the first quarter of 2015, $3.74 per Mcf for the second quarter of 2015, $3.64 per Mcf for the third quarter of 2015, and $2.45 per Mcf for the fourth quarter of 2015. The prices in the fourth quarter of 2015 represent a decrease of 48% for crude oil and 43% for natural gas prices compared to adjusted prices used to calculate the December 31, 2014, full cost ceiling value. These falling prices have led to our recognizing full cost pool ceiling test write-downs of $1.3 billion, $1.8 billion, $1.7 billion and $0.2 billion during the three months ended December 31, 2015, September 30, 2015, June 30, 2015, and March 31, 2015, respectively. We currently expect that we will record an additional write-down in the first quarter of 2016 in excess of $400 million if oil and natural gas prices remain at or near late-February 2016 levels, as the 12-month average prices used in determining the full cost ceiling value would reflect lower prices in the first quarter of 2016 than in the first quarter of 2015. Any such write-down would also be affected, in part, by changes in proved oil and natural gas reserve volumes, future capital expenditures and operating costs.
See Item 1A, Risk Factors, and Critical Accounting Policies and Estimates – Full Cost Method of Accounting, Depletion and Depreciation and Oil and Natural Gas Properties for further discussion.
Impairment of Goodwill
We test goodwill for impairment annually during the fourth quarter, or between annual tests if an event occurs or circumstances change that would more likely than not reduce the fair value of a reporting unit below its carrying amount. Our enterprise value (combined market capitalization plus a control premium of 10% and the fair value of our long-term debt) declined by approximately $2.5 billion between June 30 and September 30, 2015; therefore, we concluded that a goodwill impairment test was required to be performed in the third quarter of 2015.
For the goodwill impairment test, we compared the fair value of the reporting unit (enterprise value) to the fair value of its assets and liabilities. Oil and natural gas reserves, which represent the most significant assets requiring valuation, were estimated using the expected present value of future net cash flows method based on September 30, 2015, NYMEX oil and natural gas futures prices for the next five years, which ranged from approximately $47 per Bbl to $58 per Bbl for oil and approximately $3 per MMBtu for natural gas, adjusted for then-current price differentials. In addition to future oil and natural gas pricing, the most significant assumptions impacting the projections of future net cash flows include projections of future rates of production, timing and amount of future development and operating costs, projected availability and cost of CO2, risk adjustment factors applied to probable and possible oil and natural gas reserve cash flows, projected recovery factors of oil and natural gas reserves, and a weighted average cost of capital discount rate of 9% per annum applied to all net cash flows. Because the fair value of the reporting unit (enterprise value) did not exceed the fair value of assets and liabilities, we recorded a goodwill impairment charge of $1.3 billion during the three months ended September 30, 2015, to fully impair the carrying value of our goodwill. Approximately $1.0 billion of the $1.3 billion goodwill balance was associated with the March-2010 merger with Encore Acquisition Company. The fair value of our reporting unit (enterprise value) declining at a rate greater than the decline in NYMEX oil futures prices and resulting value of our oil and natural gas reserves between June 30 and September 30, 2015, was a primary cause of the impairment.
See Critical Accounting Policies and Estimates – Impairment Assessment of Goodwill for a complete discussion of the goodwill impairment test, including a discussion of relevant inputs.
Income Taxes
Year Ended December 31, | ||||||||||||
In thousands, except per-BOE amounts and tax rates | 2015 | 2014 | 2013 | |||||||||
Current income tax expense (benefit) | $ | (8,355 | ) | $ | (42,907 | ) | $ | 10,257 | ||||
Deferred income tax expense (benefit) | (1,932,179 | ) | 429,973 | 222,526 | ||||||||
Total income tax expense (benefit) | $ | (1,940,534 | ) | $ | 387,066 | $ | 232,783 | |||||
Average income tax expense (benefit) per BOE | $ | (72.97 | ) | $ | 14.25 | $ | 9.08 | |||||
Effective tax rate | 30.7 | % | 37.9 | % | 36.2 | % | ||||||
Total net deferred tax liability | $ | 852,089 | $ | 2,776,569 | $ | 2,346,540 | ||||||
Our income tax provisions for 2015, 2014 and 2013 were based on an estimated statutory rate of approximately 38%. Our effective tax rate was consistent with our estimated statutory rate in 2014, while our 2015 and 2013 effective tax rates were lower
57
Denbury Resources Inc.
Management’s Discussion and Analysis of Financial Condition and Results of Operations
than the statutory rate. Our effective tax rate for 2015 was lower than our estimated statutory rate, as a significant portion of the book value of our goodwill impaired during the third quarter of 2015 had no related tax basis. Therefore, no corresponding deferred tax benefit was recognized related to that portion of the goodwill impairment. Our effective tax rate for 2015 was further impacted by a $33.6 million tax valuation allowance, which also reduced the net deferred tax benefit recognized. As of December 31, 2015, we had $34.5 million of deferred tax assets associated with State of Louisiana net operating losses. As the result of falling commodity prices, combined with a new tax law enacted in the State of Louisiana effective June 30, 2015, which limits a company’s utilization of certain deductions, including our net operating loss carryforwards, we recognized tax valuation allowances totaling $33.6 million during 2015 to reduce the carrying value of our deferred tax assets. The valuation allowances will remain until the realization of future deferred tax benefits are more likely than not to become utilized. Our 2013 effective tax rate was lower than our statutory rate due to the revaluation of our deferred taxes as a result of the lower overall statutory rate, as well as the inclusion of differences between our 2012 tax provision and our 2012 filed tax returns.
As of December 31, 2015, we had an unrecognized tax benefit of $5.4 million. The unrecognized tax benefit was recorded during 2015 as a direct reduction of the associated deferred tax asset and, if recognized, would not materially affect our annual effective tax rate. The tax benefit from an uncertain tax position will only be recognized if it is more likely than not that the tax position will be sustained upon examination by the taxing authorities, based upon the technical merits of the position. We currently do not expect a material change to the uncertain tax position within the next 12 months. Our policy is to recognize penalties and interest related to uncertain tax positions in income tax expense; however, no such amounts were accrued related to the uncertain tax position as of December 31, 2015. There were no unrecognized tax benefits as of December 31, 2014.
We recorded current income tax benefits in 2015 and 2014 in recognition of reinstated bonus depreciation becoming available in December 2015 and 2014, along with an increase in certain tax preference items. We currently expect to carryforward the 2015 benefit to offset taxable income in future periods. The 2014 benefit was carried back to our filed tax returns in prior years. Current income tax expense during 2013 is primarily related to state income taxes.
As of December 31, 2015, we had an estimated $48.9 million of enhanced oil recovery credits to carry forward related to our tertiary operations, research and development credits of $21.6 million, and $34.8 million of alternative minimum tax credits that can be utilized to reduce our current income taxes during 2016 or future years. These enhanced oil recovery credits and research and development credits do not begin to expire until 2023 and 2031, respectively. We do not currently expect to earn additional enhanced oil recovery credits during 2015.
58
Denbury Resources Inc.
Management’s Discussion and Analysis of Financial Condition and Results of Operations
Per-BOE Data
The following table summarizes our cash flow and results of operations on a per-BOE basis for the comparative periods. Each of the individual components is discussed above.
Year Ended December 31, | ||||||||||||
Per-BOE data | 2015 | 2014 | 2013 | |||||||||
Oil and natural gas revenues | $ | 45.61 | $ | 87.33 | $ | 96.19 | ||||||
Receipt (payment) on settlements of commodity derivatives | 19.24 | 0.05 | (0.03 | ) | ||||||||
Lease operating expenses – excluding special items | (19.88 | ) | (24.10 | ) | (24.05 | ) | ||||||
Lease operating expenses – special items | 0.51 | 0.26 | (4.45 | ) | ||||||||
Production and ad valorem taxes | (3.60 | ) | (5.72 | ) | (6.35 | ) | ||||||
Marketing expenses, net of third-party purchases, and plant operating expenses | (1.82 | ) | (1.76 | ) | (1.47 | ) | ||||||
Production netback | 40.06 | 56.06 | 59.84 | |||||||||
CO2 and helium sales, net of operating and exploration expenses | 0.98 | 0.71 | 0.43 | |||||||||
General and administrative expenses | (5.44 | ) | (5.83 | ) | (5.66 | ) | ||||||
Interest expense, net | (5.99 | ) | (6.74 | ) | (5.49 | ) | ||||||
Other | 1.18 | 2.50 | 0.48 | |||||||||
Changes in assets and liabilities relating to operations | 1.71 | (1.69 | ) | 3.49 | ||||||||
Cash flows from operations | 32.50 | 45.01 | 53.09 | |||||||||
DD&A | (19.99 | ) | (21.83 | ) | (19.89 | ) | ||||||
Write-down of oil and natural gas properties | (185.74 | ) | — | — | ||||||||
Impairment of goodwill | (47.44 | ) | — | — | ||||||||
Deferred income taxes | 72.65 | (15.83 | ) | (8.68 | ) | |||||||
Loss on early extinguishment of debt | — | (4.19 | ) | (1.74 | ) | |||||||
Noncash fair value adjustments on commodity derivatives (1) | (13.67 | ) | 20.39 | (1.57 | ) | |||||||
Other noncash items | (3.21 | ) | (0.16 | ) | (5.23 | ) | ||||||
Net income (loss) | $ | (164.90 | ) | $ | 23.39 | $ | 15.98 | |||||
(1) | Noncash fair value adjustments on commodity derivatives is a non-GAAP measure. See Operating Results Table above for a discussion of the reconciliation between noncash fair value adjustments on commodity derivatives to “Commodity derivatives expense (income)” in the Consolidated Statements of Operations. See also the Glossary and Selected Abbreviations for the definition of noncash fair value adjustments on commodity derivatives. |
59
Denbury Resources Inc.
Management’s Discussion and Analysis of Financial Condition and Results of Operations
MARKET RISK MANAGEMENT
Debt
We finance some of our acquisitions and other expenditures with fixed and variable rate debt. These debt agreements expose us to market risk related to changes in interest rates. At December 31, 2015, we had $175.0 million of debt outstanding on our bank credit facility. None of our existing debt has any triggers or covenants regarding our debt ratings with rating agencies, although under the NEJD financing lease, in the event of significant downgrades of our corporate credit rating by the rating agencies, certain credit enhancements can be required from us, and possibly other remedies made available under the lease. In light of recent credit downgrades in February 2016, we are required to provide a $41.3 million letter of credit to the lessor under the terms of the NEJD financing lease, which we plan to provide no later than March 4, 2016. The letter of credit may be drawn upon in the event Denbury Onshore or Denbury fail to make a payment due under the pipeline financing lease agreement or upon other specified defaults set out in the pipeline financing lease agreement (filed as Exhibit 99.1 to the Form 8-K filed with the SEC on June 5, 2008). The fair value of our senior subordinated debt is based on quoted market prices. The following table presents the principal cash flows and fair values of our outstanding debt at December 31, 2015:
In thousands | 2017 | 2019 | 2021 | 2022 | 2023 | Total | Fair Value | |||||||||||||||||||||
Variable rate debt | ||||||||||||||||||||||||||||
Bank Credit Facility (weighted average interest rate of 2.3% at December 31, 2015) | $ | — | $ | 175,000 | $ | — | $ | — | $ | — | $ | 175,000 | $ | 175,000 | ||||||||||||||
Fixed rate debt | ||||||||||||||||||||||||||||
6⅜% Senior Subordinated Notes due 2021 | — | — | 400,000 | — | — | 400,000 | 143,000 | |||||||||||||||||||||
5½% Senior Subordinated Notes due 2022 | — | — | — | 1,250,000 | — | 1,250,000 | 412,500 | |||||||||||||||||||||
4⅝% Senior Subordinated Notes due 2023 | — | — | — | — | 1,200,000 | 1,200,000 | 386,280 | |||||||||||||||||||||
Other Subordinated Notes | 2,250 | — | — | — | — | 2,250 | 2,250 | |||||||||||||||||||||
Oil and Natural Gas Derivative Contracts
Historically, we have entered into oil and natural gas derivative contracts to provide an economic hedge of our exposure to commodity price risk associated with anticipated future oil and natural gas production and to provide more certainty to our future cash flows. We do not hold or issue derivative financial instruments for trading purposes. Generally, these contracts have consisted of various combinations of price floors, collars, three-way collars, fixed-price swaps, and fixed-price swaps enhanced with a sold put. The production that we hedge has varied from year to year depending on our levels of debt, financial strength, and expectation of future commodity prices. As of February 18, 2016, we have entered into a combination of collars, three-way collars, fixed-price swaps, and fixed-price swaps enhanced with a sold put covering a total of 36,000 Bbls/d for the first quarter of 2016, 34,000 Bbls/d for the second quarter of 2016, 24,000 Bbls/d for the third quarter of 2016, and 30,000 Bbls/d for the fourth quarter of 2016, with minimal hedges currently in place in early 2017. On average, roughly one-third of these 2016 derivative contracts are three-way collars or enhanced swaps, which include sold puts that have a weighted average price of approximately $68 per Bbl, limiting the benefit that our hedges provide us to the extent oil prices remain below the price of these sold puts. We anticipate that we may use more fixed-price swaps in the future or a combination of fixed-price swaps and collars as we look to provide more certainty around our future cash flows. See Note 8, Commodity Derivative Contracts, and Note 9, Fair Value Measurements, to the Consolidated Financial Statements for additional information regarding our commodity derivative contracts.
All of the mark-to-market valuations used for our oil and natural gas derivatives are provided by external sources. We manage and control market and counterparty credit risk through established internal control procedures that are reviewed on an ongoing basis. We attempt to minimize credit risk exposure to counterparties through formal credit policies, monitoring procedures and diversification. All of our commodity derivative contracts are with parties that are lenders under our bank credit facility (or affiliates of such lenders). We have included an estimate of nonperformance risk in the fair value measurement of our oil and natural gas derivative contracts, which we have measured for nonperformance risk based upon credit default swaps or credit spreads.
For accounting purposes, we do not apply hedge accounting to our oil and natural gas derivative contracts. This means that any changes in the fair value of these commodity derivative contracts will be charged to earnings on a quarterly basis instead of charging the effective portion to other comprehensive income and the ineffective portion to earnings.
60
Denbury Resources Inc.
Management’s Discussion and Analysis of Financial Condition and Results of Operations
At December 31, 2015, our commodity derivative contracts were recorded at their fair value, which was a net asset of $142.8 million, a $363.7 million decrease from the $506.5 million net asset recorded at December 31, 2014. This change is primarily related to the expiration of commodity derivative contracts during 2015, new commodity derivative contracts entered into during 2015 for future periods, and the changes in oil and natural gas futures prices between December 31, 2014 and 2015.
Commodity Derivative Sensitivity Analysis
Based on NYMEX and LLS crude oil futures prices as of December 31, 2015, and assuming both a 10% increase and decrease thereon, we would expect to receive payments on our crude oil derivative contracts as shown in the following table:
In thousands | Receipt | |||
Based on: | ||||
Futures prices as of December 31, 2015 | $ | 143,517 | ||
10% increase in prices | 132,349 | |||
10% decrease in prices | 154,685 | |||
Our commodity derivative contracts are used as an economic hedge of our exposure to commodity price risk associated with anticipated future production. As a result, changes in receipts or payments of our commodity derivative contracts due to changes in commodity prices as reflected in the above table would be mostly offset by a corresponding increase or decrease in the cash receipts on sales of our oil and natural gas production to which those commodity derivative contracts relate.
CRITICAL ACCOUNTING POLICIES AND ESTIMATES
The preparation of financial statements in accordance with generally accepted accounting principles requires that we select certain accounting policies and make certain estimates and judgments regarding the application of those policies. Our significant accounting policies are included in Note 1, Significant Accounting Policies, to the Consolidated Financial Statements. These policies, along with the underlying assumptions and judgments by our management in their application, have a significant impact on our consolidated financial statements. Following is a discussion of our most critical accounting estimates, judgments and uncertainties that are inherent in the preparation of our financial statements.
Full Cost Method of Accounting, Depletion and Depreciation and Oil and Natural Gas Properties
Businesses involved in the production of oil and natural gas are required to follow accounting rules that are unique to the oil and gas industry. We apply the full cost method of accounting for our oil and natural gas properties. Another acceptable method of accounting for oil and natural gas production activities is the successful efforts method of accounting. In general, the primary differences between the two methods are related to the capitalization of costs and the evaluation for asset impairment. Under the full cost method, all geological and geophysical costs, exploratory dry holes and delay rentals are capitalized to the full cost pool, whereas under the successful efforts method such costs are expensed as incurred. In the assessment of impairment of oil and natural gas properties, the successful efforts method follows the Accounting for the Impairment or Disposal of Long-Lived Assets topic of the FASC, under which the net book value of assets is measured for impairment against the undiscounted future cash flows using commodity prices consistent with management expectations. Under the full cost method, the full cost pool (net book value of oil and natural gas properties) is measured against future cash flows discounted at 10% using the average first-day-of-the-month oil and natural gas price for each month during a 12-month rolling period ended as of each quarterly reporting period. The financial results for a given period could be substantially different depending on the method of accounting that an oil and gas entity applies. Further, we do not designate our oil and natural gas derivative contracts as hedge instruments for accounting purposes under the Derivatives and Hedging topic of the FASC (see below), and as a result, these contracts are not considered in the full cost ceiling test.
We make significant estimates at the end of each period related to accruals for oil and natural gas revenues, production, capitalized costs and operating expenses. We calculate these estimates with our best available data, which includes, among other things, production reports, price posting, information compiled from daily drilling reports and other internal tracking devices, and analysis of historical results and trends. While management is not aware of any required revisions to its estimates, there will likely be future adjustments resulting from such things as revisions in estimated oil and natural gas volumes, changes in ownership interests, payouts, joint venture audits, re-allocations by the purchasers or pipelines, or other corrections and adjustments common
61
Denbury Resources Inc.
Management’s Discussion and Analysis of Financial Condition and Results of Operations
in the oil and gas industry, many of which will require retroactive application. These types of adjustments cannot be currently estimated or determined and will be recorded in the period during which the adjustment occurs.
Under full cost accounting, the estimated quantities of proved oil and natural gas reserves used to compute depletion and the related present value of estimated future net cash flows therefrom used to perform the full cost ceiling test have a significant impact on the underlying financial statements. The process of estimating oil and natural gas reserves is very complex, requiring significant decisions in the evaluation of all available geological, geophysical, engineering and economic data. The data for a given field may also change substantially over time as a result of numerous factors, including additional development activity, evolving production history and continued reassessment of the viability of production under varying economic conditions. As a result, material revisions to existing reserve estimates may occur from time to time. Although every reasonable effort is made to ensure that the reported reserve estimates represent the most accurate assessments possible, including the hiring of independent engineers to prepare reported estimates, the subjective decisions and variances in available data for various fields make these estimates generally less precise than other estimates included in our financial statement disclosures. Over the last four years, annual revisions to our reserve estimates, excluding any revisions related to changes in commodity prices, have averaged approximately 1.1% of the previous year’s estimates and have been both positive and negative.
Changes in commodity prices also affect our reserve quantities. Between 2015 and 2014, oil and natural gas prices used to calculate reserve quantities in our year-end proved reserve report decreased significantly, resulting in a decrease in our proved reserves of 125.6 MMBOE. Between 2014 and 2013, oil and natural gas prices used to calculate year-end proved reserves also decreased, resulting in a decrease in our proved reserves of 0.7 MMBOE. These changes in quantities affect our DD&A rate, and the combined effect of changes in quantities and commodity prices impacts our full cost ceiling test calculation. For example, we estimate that a 5% increase in our estimate of proved reserve quantities would have lowered our fourth quarter 2015 DD&A rate from $12.59 per BOE to approximately $12.02 per BOE, and a 5% decrease in our proved reserve quantities would have increased our DD&A rate to approximately $13.22 per BOE. Also, reserve quantities and their ultimate values, determined solely by our lenders, are the primary factors in determining the maximum borrowing base under our bank credit facility, particularly quantities and values of our proved developed producing reserves.
Under full cost accounting rules, we are required each quarter to perform a ceiling test calculation. The net capitalized costs of oil and natural gas properties are limited to the lower of unamortized cost or the cost center ceiling. The cost center ceiling is defined as (1) the present value of estimated future net revenues from proved oil and natural gas reserves before future abandonment costs (discounted at 10%), based on the average first-day-of-the-month oil and natural gas price for each month during a 12-month rolling period prior to the end of a particular reporting period; plus (2) the cost of properties not being amortized; plus (3) the lower of cost or estimated fair value of unproved properties included in the costs being amortized, if any; less (4) related income tax effects. Our future net revenues from proved oil and natural gas reserves are not reduced for development costs related to the cost of drilling for and developing CO2 reserves nor those related to the cost of constructing CO2 pipelines, as those costs have previously been incurred by the Company. Therefore, we include in the ceiling test, as a reduction of future net revenues, that portion of our capitalized CO2 costs related to CO2 reserves and CO2 pipelines that we estimate will be consumed in the process of producing our proved oil and natural gas reserves. The fair value of our oil and natural gas derivative contracts is not included in the ceiling test, as we do not designate these contracts as hedge instruments for accounting purposes. The cost center ceiling test is prepared quarterly.
As a result of the precipitous and continuing decline in NYMEX oil prices since the fourth quarter of 2014, the rolling first-day-of-the-month average oil price for the preceding 12 months, after adjustments for market differentials by field, has fallen throughout 2015, from $79.55 per Bbl for the first quarter of 2015, to $68.48 per Bbl for the second quarter of 2015, $56.74 per Bbl for the third quarter of 2015, and $48.11 per Bbl for the fourth quarter of 2015. In addition, the first-day-of-the-month average natural gas price for the preceding 12 months, after adjustments for market differentials by field, was $3.95 per Mcf for the first quarter of 2015, $3.74 per Mcf for the second quarter of 2015, $3.64 per Mcf for the third quarter of 2015, and $2.45 per Mcf for the fourth quarter of 2015. The prices used for the fourth quarter of 2015 represent a decrease of 48% for crude oil and 43% for natural gas prices compared to adjusted prices used to calculate the December 31, 2014, full cost ceiling value. These falling prices have led to our recognizing full cost pool ceiling test write-downs of $1.3 billion, $1.8 billion, $1.7 billion and $0.2 billion during the three months ended December 31, 2015, September 30, 2015, June 30, 2015, and March 31, 2015, respectively. We currently expect that we will record an additional write-down in the first quarter of 2016 in excess of $400 million if oil and natural gas prices remain at or near late-February 2016 levels, as the 12-month average prices used in determining the full cost ceiling value would reflect lower prices in the first quarter of 2016 than in the first quarter of 2015. Any such write-down would also be
62
Denbury Resources Inc.
Management’s Discussion and Analysis of Financial Condition and Results of Operations
affected, in part, by changes in proved oil and natural gas reserve volumes, future capital expenditures and operating costs. We had no ceiling test write-downs during the years ended December 31, 2014 or 2013.
We exclude certain unevaluated costs from the amortization base and full cost ceiling test pending the determination of whether proved reserves can be assigned to such properties. These costs are transferred to the full cost amortization base in the course of these properties being developed, tested and evaluated. At least annually, we test these assets for impairment based on an evaluation of management’s expectations of future pricing, evaluation of lease expiration terms, and planned project development activities. As a result of this analysis, we recognized impairments of $17.9 million of our unevaluated costs during the year ended December 31, 2015, whereby these costs were transferred to the full cost amortization base. We did not have an impairment of our unevaluated costs for the years ended December 31, 2014 or 2013.
Tertiary Injection Costs
Our tertiary operations are conducted in reservoirs that have already produced significant amounts of oil over many years; however, in accordance with the rules for recording proved reserves, we cannot recognize proved reserves associated with enhanced recovery techniques such as CO2 injection until we can demonstrate production resulting from the tertiary process or unless the field is analogous to an existing flood. Our costs associated with the CO2 we produce (or acquire) and inject are principally our cash out-of-pocket costs of production, transportation and acquisition, and to pay royalties.
We capitalize, as a development cost, injection costs in fields that are in their development stage, which means we have not yet seen incremental oil production due to the CO2 injections (i.e., a production response). These capitalized development costs will be included in our unevaluated property costs if there are not already proved tertiary reserves in that field. After we see a production response to the CO2 injections (i.e., the production stage), injection costs will be expensed as incurred, and any previously deferred unevaluated development costs will become subject to depletion upon recognition of proved tertiary reserves. During 2015, 2014 and 2013, we capitalized $19.4 million, $20.7 million and $38.7 million, respectively, of tertiary injection costs associated with our tertiary projects.
Income Taxes
We make certain estimates and judgments in determining our income tax expense for financial reporting purposes. These estimates and judgments occur in the calculation of certain tax assets and liabilities that arise from differences in the timing and recognition of revenue and expense for tax and financial reporting purposes. Our federal and state income tax returns are generally not prepared or filed before the consolidated financial statements are prepared; therefore, we estimate the tax basis of our assets and liabilities at the end of each period as well as the effects of tax rate changes, tax credits and net operating loss carryforwards. Adjustments related to these estimates are recorded in our tax provision in the period in which we finalize our income tax returns. Further, we must assess the likelihood that we will be able to recover or utilize our deferred tax assets (primarily our enhanced oil recovery credits and state loss carryforwards). If recovery is not likely, we must record a valuation allowance against such deferred tax assets for the amount we would not expect to recover, which would result in an increase to our income tax expense. As the result of falling commodity prices, combined with a new tax law enacted in the State of Louisiana effective June 30, 2015, which limits a company’s utilization of certain deductions, including our net operating loss carryforwards, we recognized tax valuation allowances totaling $33.6 million during 2015 to reduce the carrying value of our deferred tax assets. The valuation allowances will remain until the realization of future deferred tax benefits are more likely than not to become utilized. A 1% increase in our effective tax rate would have increased our calculated income tax expense (benefit) by approximately ($63.3 million), $10.2 million and $6.4 million for the years ended December 31, 2015, 2014 and 2013, respectively. See Note 5, Income Taxes, to the Consolidated Financial Statements and Results of Operations – Income Taxes above for further information concerning our income taxes.
Fair Value Estimates
The FASC defines fair value, establishes a framework for measuring fair value and expands disclosures about fair value measurements. It does not require us to make any new fair value measurements, but rather establishes a fair value hierarchy that prioritizes the inputs to the valuation techniques used to measure fair value. Level 1 inputs are given the highest priority in the fair value hierarchy, as they represent observable inputs that reflect unadjusted quoted prices for identical assets or liabilities in active markets as of the reporting date, while Level 3 inputs are given the lowest priority, as they represent unobservable inputs that are not corroborated by market data. Valuation techniques that maximize the use of observable inputs are favored. See Note
63
Denbury Resources Inc.
Management’s Discussion and Analysis of Financial Condition and Results of Operations
9, Fair Value Measurements, to the Consolidated Financial Statements for disclosures regarding our recurring fair value measurements.
Significant uses of fair value measurements include:
• | assessment of impairment of long-lived assets; |
• | assessment of impairment of goodwill; and |
• | recorded value of commodity derivative instruments. |
Impairment Assessment of Goodwill
We test goodwill for impairment annually during the fourth quarter, or between annual tests if an event occurs or circumstances change that would more likely than not reduce the fair value of a reporting unit below its carrying amount. The need to test for impairment can be based on several indicators, including a significant reduction in prices of oil or natural gas, a full-cost ceiling write-down of oil and natural gas properties, unfavorable adjustments to reserves, significant changes in the expected timing of production, other changes to contracts or changes in the regulatory environment.
Goodwill is tested for impairment at the reporting unit level. Denbury applies SEC full cost accounting rules, under which the acquisition cost of oil and natural gas properties is recognized on a cost center basis (country), of which Denbury has only one cost center (United States). Goodwill is assigned to this single reporting unit.
In each period that a goodwill impairment test is performed, we have the option to assess qualitative factors to determine if it is more likely than not that our reporting unit’s fair value is less than its carrying amount. Our enterprise value (combined market capitalization plus a control premium of 10% and the fair value of our long-term debt) declined by approximately $2.5 billion between June 30 and September 30, 2015; therefore, we concluded that a goodwill impairment test was required to be performed in the third quarter of 2015. For the goodwill impairment test, we compared the fair value of the reporting unit (enterprise value) to the fair value of its assets and liabilities. We based our fair value estimates on projected financial information that we believe to be reasonable. However, actual results may differ from those projections. Oil and natural gas reserves, which represent the most significant assets requiring valuation, were estimated using the expected present value of future net cash flows method based on September 30, 2015, NYMEX oil and natural gas futures prices for the next five years, which ranged from approximately $47 per Bbl to $58 per Bbl for oil and approximately $3 per MMBtu for natural gas, adjusted for then-current price differentials. Projections of future cash flows were based on non-pricing assumptions used in our third quarter 2015 reserves process, adjusted where applicable for the September 30, 2015, oil and natural gas futures prices used in the goodwill impairment assessment and the inclusion of cash flows associated with probable and possible oil and natural gas reserves. More specifically, projections of estimated quantities of oil and natural gas reserves, projections of future rates of production, timing and amount of future development and operating costs, projected CO2 availability (including current and potential future industrial sources of CO2) and cost of CO2 (adjusted for changes in oil prices for those contracts tied to oil prices), risk adjustment factors applied to probable and possible oil and natural gas reserve cash flows, projected recovery factors of oil and natural gas reserves, and a weighted-average cost of capital rate of 9% per annum applied to all net cash flows are key assumptions impacting our estimate of future net cash flows. Consistent with a market participant view, we did not assign a separate value to CO2 properties and pipelines from the value assigned to oil and natural gas properties other than CO2 reserves associated with existing third-party sales contracts, because CO2 properties and pipelines are expected to be dedicated to the tertiary flood operations and the lower cost of utilizing our owned assets is reflected in the tertiary oil reserve net cash flows.
Because the fair value of the reporting unit (enterprise value) did not exceed the fair value of assets and liabilities, we recorded a goodwill impairment charge of $1.3 billion during the three months ended September 30, 2015, to fully impair the carrying value of our goodwill. Approximately $1.0 billion of the $1.3 billion goodwill balance was associated with the March-2010 merger with Encore Acquisition Company. The fair value of our reporting unit (enterprise value) declining at a rate greater than the decline in NYMEX oil futures prices and resulting value of our oil and natural gas reserves between June 30 and September 30, 2015, was a primary cause of the impairment.
Impairment Assessment of Long-Lived Assets
We test long-lived assets for impairment that are not subject to our quarterly full cost pool ceiling test, including a portion of our capitalized CO2 properties and pipelines, the Riley Ridge gas processing facility and our related intangible assets, whenever
64
Denbury Resources Inc.
Management’s Discussion and Analysis of Financial Condition and Results of Operations
events or changes in circumstances indicate that the carrying value may not be recoverable. The factors we assess to determine if a long-lived asset impairment test is necessary include, among other factors, a significant adverse change in the business climate that could affect the value of a long-lived asset, a significant decrease in the market price of an asset group, a significant adverse change in the extent or manner in which a long-lived asset (asset group) is being used or in its physical condition, or a current-period operating or cash flow loss combined with a history of operating or cash flow losses or a projection or forecast that demonstrates continuing losses associated with the use of a long-lived asset (asset group).
We perform our long-lived asset impairment test by comparing the net carrying costs of our two long-lived asset groups ((1) Gulf Coast region and (2) Rocky Mountain region) to the respective expected future undiscounted net cash flows that are supported by these long-lived assets, which include (1) the production of our probable and possible oil and natural gas reserves and (2) the sale of non-hydrocarbons (CO2 and helium) to third parties. If the undiscounted net cash flows are below the net carrying costs for an asset group, the Company must record an impairment loss by the amount, if any, that net carrying costs exceed the fair value of the long-lived asset group.
Management assumptions impacting expected future undiscounted net cash flows include market estimates of future oil and natural gas prices, projections of estimated quantities of oil and natural gas reserves, projections of future rates of production, timing and amount of future development and operating costs, projected availability and cost of CO2, projected recovery factors of tertiary reserves and risk-adjustment factors applied to the net cash flows. Given the significant decline in oil prices in 2015, we performed step one of the long-lived asset impairment test for both asset groups. The undiscounted net cash flows for our asset groups exceeded the net carrying costs; thus, step two of the impairment test was not required and no impairment was recorded. Changes in the assumptions noted above or changes in management’s intended use of assets or asset groups could cause step two of the long-lived asset impairment test to be performed, which could result in the recording of long-lived asset impairments.
Oil and Natural Gas Derivative Contracts
Historically, we have entered into oil and natural gas derivative contracts to provide an economic hedge of our exposure to commodity price risk associated with future oil and natural gas production and to provide more certainty to our future cash flows. Generally, these contracts have historically consisted of various combinations of price floors, collars, three-way collars, fixed-price swaps and fixed-price swaps enhanced with a sold put. Our derivative financial instruments are recorded on the balance sheet as either an asset or liability measured at fair value. The valuation methods used to measure the fair values of these assets and liabilities require considerable management judgment and estimates to derive the inputs necessary to determine fair value estimates, such as forward prices for commodities, interest rates, volatility factors and credit worthiness, as well as other relevant economic measures. We do not apply hedge accounting to our commodity derivative contracts under the FASC Derivatives and Hedging topic; accordingly, changes in the fair value of these instruments are recognized in earnings on a quarterly basis instead of charging the effective portion to other comprehensive income and the balance to earnings. While we may experience more volatility in our net income (loss) than if we were to apply hedge accounting treatment as permitted by the FASC Derivatives and Hedging topic, we believe that for us, the benefits associated with applying hedge accounting do not outweigh the cost, time and effort to comply with hedge accounting.
Environmental and Litigation Contingencies
The Company makes judgments and estimates in recording liabilities for contingencies such as environmental remediation or ongoing litigation. Liabilities are recorded when it is both probable that a loss has been incurred and such loss is reasonably estimable. Assessments of liabilities are based on information obtained from independent and in-house experts, loss experience in similar situations, actual costs incurred, and other case-by-case factors. Actual costs can vary from such estimates for a variety of reasons. The costs of environmental remediation or litigation can vary from estimates due to new developments regarding the facts and circumstances of each event, including in the case of environmental remediation, the timing of remediation, our understanding of the environmental impact, remediation methods available, and regulatory requirements, and in the case of litigation, differing interpretations of laws and facts and assessments of damages asserted and/or incurred.
Use of Estimates
See Note 1, Significant Accounting Policies, to the Consolidated Financial Statements for a discussion of our use of estimates.
65
Denbury Resources Inc.
Management’s Discussion and Analysis of Financial Condition and Results of Operations
Recent Accounting Pronouncements
See Note 1, Significant Accounting Policies, to the Consolidated Financial Statements for a discussion of recent accounting pronouncements.
FORWARD-LOOKING INFORMATION
The statements contained in this Annual Report on Form 10-K that are not historical facts, including, but not limited to, statements found in the sections entitled “Business and Properties” and “Management’s Discussion and Analysis of Financial Condition and Results of Operations,” are forward-looking statements, as that term is defined in Section 21E of the Securities and Exchange Act of 1934, as amended, that involve a number of risks and uncertainties. Such forward-looking statements may be or may concern, among other things, future hydrocarbon prices, the length or severity of the current commodity price downturn, current or future liquidity sources or their adequacy to support our anticipated future activities, possible future write-downs of oil and natural gas reserves, together with assumptions based on current and projected oil and gas costs, current or future expectations or estimations of our cash flows, availability of capital, borrowing capacity, availability of advantageous commodity derivative contracts or the predicted cash flow benefits therefrom, forecasted capital expenditures, drilling activity or methods, including the timing and location thereof, estimated timing of commencement of CO2 flooding of particular fields or areas, or the timing of pipeline construction or completion or the cost thereof, dates of completion of to-be-constructed industrial plants and the initial date of capture of CO2 from such plants, timing of CO2 injections and initial production responses in tertiary flooding projects, acquisition plans and proposals and dispositions, development activities, finding costs, anticipated future cost savings, capital budgets, production rates and volumes or forecasts thereof, hydrocarbon reserve quantities and values, CO2 reserves and their availability, helium reserves, potential reserves, percentages of recoverable original oil in place, the impact of regulatory rulings or changes, anticipated outcomes of pending litigation, prospective legislation affecting the oil and gas industry, mark-to-market values, competition, long-term forecasts of production, finding costs, rates of return, estimated costs, estimates of the range of potential insurance recoveries, changes in costs, future capital expenditures and overall economics, worldwide economic conditions and other variables surrounding our operations and future plans. Such forward-looking statements generally are accompanied by words such as “plan,” “estimate,” “expect,” “predict,” “to our knowledge,” “anticipate,” “projected,” “preliminary,” “should,” “assume,” “believe,” “may” or other words that convey, or are intended to convey, the uncertainty of future events or outcomes. Such forward-looking information is based upon management’s current plans, expectations, estimates, and assumptions and is subject to a number of risks and uncertainties that could significantly and adversely affect current plans, anticipated actions, the timing of such actions and our financial condition and results of operations. As a consequence, actual results may differ materially from expectations, estimates or assumptions expressed in or implied by any forward-looking statements made by us or on our behalf. Among the factors that could cause actual results to differ materially are fluctuations in worldwide oil prices or in U.S. oil prices and consequently in the prices received or demand for our oil and natural gas; decisions as to production levels and/or pricing by OPEC in future periods; levels of future capital expenditures; effects of our indebtedness; success of our risk management techniques; inaccurate cost estimates; availability of and fluctuations in the prices of goods and services; the uncertainty of drilling results and reserve estimates; operating hazards and remediation costs; disruption of operations and damages from well incidents, hurricanes, tropical storms, or forest fires; acquisition risks; requirements for capital or its availability; conditions in the worldwide financial and credit markets; general economic conditions; competition; government regulations, including tax and environmental; and unexpected delays, as well as the risks and uncertainties inherent in oil and gas drilling and production activities or that are otherwise discussed in this annual report, including, without limitation, the portions referenced above, and the uncertainties set forth from time to time in our other public reports, filings and public statements.
66
Item 7A. Quantitative and Qualitative Disclosures About Market Risk
The information required by Item 7A is set forth under Market Risk Management in Item 7, Management’s Discussion and Analysis of Financial Condition and Results of Operations.
Item 8. Financial Statements and Supplementary Information
Page | |||
1. | |||
2. | |||
3. | |||
4. | |||
5. | |||
6. | |||
7. | |||
8. | |||
9. | |||
10. | |||
11. | |||
12. | |||
67
REPORT OF INDEPENDENT REGISTERED PUBLIC ACCOUNTING FIRM
To the Board of Directors and Stockholders of Denbury Resources Inc.:
In our opinion, the consolidated financial statements listed in the accompanying index present fairly, in all material respects, the financial position of Denbury Resources Inc. and its subsidiaries at December 31, 2015 and 2014, and the results of their operations and their cash flows for each of the three years in the period ended December 31, 2015 in conformity with accounting principles generally accepted in the United States of America. Also in our opinion, the Company maintained, in all material respects, effective internal control over financial reporting as of December 31, 2015, based on criteria established in Internal Control – Integrated Framework (2013) issued by the Committee of Sponsoring Organizations of the Treadway Commission (COSO). The Company’s management is responsible for these financial statements, for maintaining effective internal control over financial reporting and for its assessment of the effectiveness of internal control over financial reporting, included in Management’s Report on Internal Control over Financial Reporting appearing under Item 9A. Our responsibility is to express opinions on these financial statements and on the Company’s internal control over financial reporting based on our integrated audits. We conducted our audits in accordance with the standards of the Public Company Accounting Oversight Board (United States). Those standards require that we plan and perform the audits to obtain reasonable assurance about whether the financial statements are free of material misstatement and whether effective internal control over financial reporting was maintained in all material respects. Our audits of the financial statements included examining, on a test basis, evidence supporting the amounts and disclosures in the financial statements, assessing the accounting principles used and significant estimates made by management, and evaluating the overall financial statement presentation. Our audit of internal control over financial reporting included obtaining an understanding of internal control over financial reporting, assessing the risk that a material weakness exists, and testing and evaluating the design and operating effectiveness of internal control based on the assessed risk. Our audits also included performing such other procedures as we considered necessary in the circumstances. We believe that our audits provide a reasonable basis for our opinions.
A company’s internal control over financial reporting is a process designed to provide reasonable assurance regarding the reliability of financial reporting and the preparation of financial statements for external purposes in accordance with generally accepted accounting principles. A company’s internal control over financial reporting includes those policies and procedures that (i) pertain to the maintenance of records that, in reasonable detail, accurately and fairly reflect the transactions and dispositions of the assets of the company; (ii) provide reasonable assurance that transactions are recorded as necessary to permit preparation of financial statements in accordance with generally accepted accounting principles, and that receipts and expenditures of the company are being made only in accordance with authorizations of management and directors of the company; and (iii) provide reasonable assurance regarding prevention or timely detection of unauthorized acquisition, use, or disposition of the company’s assets that could have a material effect on the financial statements.
Because of its inherent limitations, internal control over financial reporting may not prevent or detect misstatements. Also, projections of any evaluation of effectiveness to future periods are subject to the risk that controls may become inadequate because of changes in conditions, or that the degree of compliance with the policies or procedures may deteriorate.
/s/ PricewaterhouseCoopers LLP
PricewaterhouseCoopers LLP
Dallas, Texas
February 26, 2016
68
Denbury Resources Inc.
Consolidated Balance Sheets
(In thousands, except par value and share data)
December 31, | |||||||
2015 | 2014 | ||||||
Assets | |||||||
Current assets | |||||||
Cash and cash equivalents | $ | 2,812 | $ | 23,153 | |||
Accrued production receivable | 100,413 | 181,761 | |||||
Trade and other receivables, net | 87,093 | 156,955 | |||||
Derivative assets | 142,846 | 440,359 | |||||
Deferred tax assets, net | 1,539 | — | |||||
Other current assets | 10,005 | 10,452 | |||||
Total current assets | 344,708 | 812,680 | |||||
Property and equipment | |||||||
Oil and natural gas properties (using full cost accounting) | |||||||
Proved properties | 10,245,195 | 9,782,337 | |||||
Unevaluated properties | 894,948 | 918,406 | |||||
CO2 properties | 1,187,458 | 1,162,538 | |||||
Pipelines and plants | 2,293,219 | 2,269,564 | |||||
Other property and equipment | 408,194 | 468,051 | |||||
Less accumulated depletion, depreciation, amortization and impairment | (9,653,205 | ) | (4,248,652 | ) | |||
Net property and equipment | 5,375,809 | 10,352,244 | |||||
Derivative assets | — | 66,187 | |||||
Goodwill | — | 1,283,590 | |||||
Other assets | 199,307 | 213,101 | |||||
Total assets | $ | 5,919,824 | $ | 12,727,802 | |||
Liabilities and Stockholders’ Equity | |||||||
Current liabilities | |||||||
Accounts payable and accrued liabilities | $ | 253,197 | $ | 394,758 | |||
Oil and gas production payable | 87,337 | 128,170 | |||||
Deferred tax liabilities | — | 81,727 | |||||
Current maturities of long-term debt | 32,481 | 35,470 | |||||
Total current liabilities | 373,015 | 640,125 | |||||
Long-term liabilities | |||||||
Long-term debt, net of current portion | 3,277,866 | 3,535,900 | |||||
Asset retirement obligations | 138,919 | 126,411 | |||||
Deferred tax liabilities, net | 853,628 | 2,694,842 | |||||
Other liabilities | 27,484 | 26,668 | |||||
Total long-term liabilities | 4,297,897 | 6,383,821 | |||||
Commitments and contingencies (Note 10) | |||||||
Stockholders’ equity | |||||||
Preferred stock, $.001 par value, 25,000,000 shares authorized, none issued and outstanding | — | — | |||||
Common stock, $.001 par value, 600,000,000 shares authorized; 354,541,626 and 411,779,911 shares issued, respectively | 355 | 412 | |||||
Paid-in capital in excess of par | 2,353,549 | 3,230,418 | |||||
Retained earnings (accumulated deficit) | (1,058,954 | ) | 3,392,465 | ||||
Accumulated other comprehensive loss | — | (209 | ) | ||||
Treasury stock, at cost, 3,124,311 and 58,415,507 shares, respectively | (46,038 | ) | (919,230 | ) | |||
Total stockholders’ equity | 1,248,912 | 5,703,856 | |||||
Total liabilities and stockholders’ equity | $ | 5,919,824 | $ | 12,727,802 | |||
See accompanying Notes to Consolidated Financial Statements.
69
Denbury Resources Inc.
Consolidated Statements of Operations
(In thousands, except per share data)
Year Ended December 31, | |||||||||||
2015 | 2014 | 2013 | |||||||||
Revenues and other income | |||||||||||
Oil, natural gas, and related product sales | $ | 1,213,026 | $ | 2,372,473 | $ | 2,466,234 | |||||
CO2 and helium sales and transportation fees | 30,626 | 44,643 | 27,950 | ||||||||
Interest income and other income | 13,908 | 18,089 | 22,943 | ||||||||
Total revenues and other income | 1,257,560 | 2,435,205 | 2,517,127 | ||||||||
Expenses | |||||||||||
Lease operating expenses | 515,043 | 647,559 | 730,574 | ||||||||
Marketing and plant operating expenses | 55,746 | 64,379 | 49,246 | ||||||||
CO2 and helium discovery and operating expenses | 4,557 | 25,222 | 16,916 | ||||||||
Taxes other than income | 109,992 | 169,701 | 176,231 | ||||||||
General and administrative expenses | 144,564 | 158,343 | 145,211 | ||||||||
Interest, net of amounts capitalized of $32,146, $24,202 and $79,253, respectively | 159,268 | 183,003 | 140,709 | ||||||||
Depletion, depreciation, and amortization | 531,660 | 592,972 | 509,943 | ||||||||
Commodity derivatives expense (income) | (147,999 | ) | (555,255 | ) | 41,024 | ||||||
Loss on early extinguishment of debt | — | 113,908 | 44,651 | ||||||||
Write-down of oil and natural gas properties | 4,939,600 | — | — | ||||||||
Impairment of goodwill | 1,261,512 | — | — | ||||||||
Other expenses | 9,599 | 12,816 | 20,242 | ||||||||
Total expenses | 7,583,542 | 1,412,648 | 1,874,747 | ||||||||
Income (loss) before income taxes | (6,325,982 | ) | 1,022,557 | 642,380 | |||||||
Income tax provision (benefit) | (1,940,534 | ) | 387,066 | 232,783 | |||||||
Net income (loss) | $ | (4,385,448 | ) | $ | 635,491 | $ | 409,597 | ||||
Net income (loss) per common share | |||||||||||
Basic | $ | (12.57 | ) | $ | 1.82 | $ | 1.12 | ||||
Diluted | $ | (12.57 | ) | $ | 1.81 | $ | 1.11 | ||||
Dividends declared per common share | $ | 0.1875 | $ | 0.2500 | $ | — | |||||
Weighted average common shares outstanding | |||||||||||
Basic | 348,802 | 348,962 | 366,659 | ||||||||
Diluted | 348,802 | 351,167 | 369,877 | ||||||||
See accompanying Notes to Consolidated Financial Statements.
70
Denbury Resources Inc.
Consolidated Statements of Comprehensive Operations
(In thousands)
Year Ended December 31, | |||||||||||
2015 | 2014 | 2013 | |||||||||
Net income (loss) | $ | (4,385,448 | ) | $ | 635,491 | $ | 409,597 | ||||
Other comprehensive income, net of income tax | |||||||||||
Interest rate lock derivative contracts reclassified to income, net of tax of $128, $45 and $40, respectively | 209 | 67 | 72 | ||||||||
Total other comprehensive income | 209 | 67 | 72 | ||||||||
Comprehensive income (loss) | $ | (4,385,239 | ) | $ | 635,558 | $ | 409,669 | ||||
See accompanying Notes to Consolidated Financial Statements.
71
Year Ended December 31, | |||||||||||
2015 | 2014 | 2013 | |||||||||
Cash flows from operating activities | |||||||||||
Net income (loss) | $ | (4,385,448 | ) | $ | 635,491 | $ | 409,597 | ||||
Adjustments to reconcile net income (loss) to cash flows from operating activities | |||||||||||
Depletion, depreciation, and amortization | 531,660 | 592,972 | 509,943 | ||||||||
Write-down of oil and natural gas properties | 4,939,600 | — | — | ||||||||
Impairment of goodwill | 1,261,512 | — | — | ||||||||
Deferred income taxes | (1,932,179 | ) | 429,973 | 222,526 | |||||||
Stock-based compensation | 30,604 | 30,513 | 33,003 | ||||||||
Commodity derivatives expense (income) | (147,999 | ) | (555,255 | ) | 41,024 | ||||||
Receipt (payment) on settlements of commodity derivatives | 511,699 | 1,421 | (662 | ) | |||||||
Loss on early extinguishment of debt | — | 113,908 | 44,651 | ||||||||
Amortization of debt issuance costs and discounts | 9,121 | 13,476 | 14,023 | ||||||||
Other, net | 343 | 6,311 | (2,318 | ) | |||||||
Changes in assets and liabilities, net of effects from acquisitions | |||||||||||
Accrued production receivable | 81,213 | 80,285 | (15,085 | ) | |||||||
Trade and other receivables | 67,047 | (78,469 | ) | 4,981 | |||||||
Other current and long-term assets | 241 | 3,174 | 10,462 | ||||||||
Accounts payable and accrued liabilities | (55,234 | ) | 501 | 91,816 | |||||||
Oil and natural gas production payable | (40,833 | ) | (46,506 | ) | 12,731 | ||||||
Other liabilities | (7,043 | ) | (4,970 | ) | (15,497 | ) | |||||
Net cash provided by operating activities | 864,304 | 1,222,825 | 1,361,195 | ||||||||
Cash flows from investing activities | |||||||||||
Oil and natural gas capital expenditures | (476,398 | ) | (946,846 | ) | (900,221 | ) | |||||
Acquisitions of oil and natural gas properties | (21,876 | ) | (8,773 | ) | (9,243 | ) | |||||
CO2 capital expenditures | (26,301 | ) | (48,134 | ) | (93,744 | ) | |||||
Pipelines and plants capital expenditures | (31,728 | ) | (72,151 | ) | (184,286 | ) | |||||
Purchases of other assets | (5,492 | ) | (3,197 | ) | (65,987 | ) | |||||
Net proceeds from sales of oil and natural gas properties and equipment | 563 | 3,453 | 8,037 | ||||||||
Other | 11,047 | (1,107 | ) | (29,865 | ) | ||||||
Net cash used in investing activities | (550,185 | ) | (1,076,755 | ) | (1,275,309 | ) | |||||
Cash flows from financing activities | |||||||||||
Bank repayments | (1,862,000 | ) | (2,609,000 | ) | (1,550,000 | ) | |||||
Bank borrowings | 1,642,000 | 2,664,000 | 1,190,000 | ||||||||
Repayment of senior subordinated notes | (485 | ) | (997,345 | ) | (651,270 | ) | |||||
Premium paid on repayment of senior subordinated notes | — | (101,342 | ) | (36,475 | ) | ||||||
Proceeds from issuance of senior subordinated notes | — | 1,250,000 | 1,200,000 | ||||||||
Costs of debt financing | (1,668 | ) | (24,407 | ) | (20,161 | ) | |||||
Common stock repurchase program | (11,759 | ) | (211,356 | ) | (281,958 | ) | |||||
Cash dividends paid | (65,426 | ) | (87,044 | ) | — | ||||||
Other | (35,122 | ) | (18,610 | ) | (22,346 | ) | |||||
Net cash used in financing activities | (334,460 | ) | (135,104 | ) | (172,210 | ) | |||||
Net increase (decrease) in cash and cash equivalents | (20,341 | ) | 10,966 | (86,324 | ) | ||||||
Cash and cash equivalents at beginning of year | 23,153 | 12,187 | 98,511 | ||||||||
Cash and cash equivalents at end of year | $ | 2,812 | $ | 23,153 | $ | 12,187 | |||||
See accompanying Notes to Consolidated Financial Statements.
72
Denbury Resources Inc.
Consolidated Statements of Changes in Stockholders’ Equity
(Dollar amounts in thousands)
Common Stock ($.001 Par Value) | Paid-In Capital in Excess of Par | Retained Earnings (Accumulated Deficit) | Accumulated Other Comprehensive Income (Loss) | Treasury Stock (at cost) | Total Equity | |||||||||||||||||||||||||
Shares | Amount | Shares | Amount | |||||||||||||||||||||||||||
Balance – December 31, 2012 | 406,163,194 | $ | 406 | $ | 3,136,461 | $ | 2,434,835 | $ | (348 | ) | 30,601,262 | $ | (456,465 | ) | $ | 5,114,889 | ||||||||||||||
Stock Repurchase Program | — | — | — | — | — | 16,468,648 | (277,768 | ) | (277,768 | ) | ||||||||||||||||||||
Issued or purchased pursuant to employee stock compensation plans | 3,038,767 | 3 | 5,486 | — | — | — | — | 5,489 | ||||||||||||||||||||||
Issued pursuant to employee stock purchase plan | — | — | 1,844 | — | — | (860,901 | ) | 13,260 | 15,104 | |||||||||||||||||||||
Issued pursuant to directors’ compensation plan | 13,612 | — | 344 | — | — | — | — | 344 | ||||||||||||||||||||||
Stock-based compensation | — | — | 42,091 | — | — | — | — | 42,091 | ||||||||||||||||||||||
Income tax benefit from equity awards | — | — | 488 | — | — | — | — | 488 | ||||||||||||||||||||||
Tax withholding – stock compensation | — | — | — | — | — | 501,887 | (8,900 | ) | (8,900 | ) | ||||||||||||||||||||
Derivative contracts, net | — | — | — | — | 72 | — | — | 72 | ||||||||||||||||||||||
Net income | — | — | — | 409,597 | — | — | — | 409,597 | ||||||||||||||||||||||
Balance – December 31, 2013 | 409,215,573 | 409 | 3,186,714 | 2,844,432 | (276 | ) | 46,710,896 | (729,873 | ) | 5,301,406 | ||||||||||||||||||||
Stock Repurchase Program | — | — | — | — | — | 12,398,017 | (200,369 | ) | (200,369 | ) | ||||||||||||||||||||
Issued or purchased pursuant to employee stock compensation plans | 2,541,809 | 3 | 7,020 | — | — | — | — | 7,023 | ||||||||||||||||||||||
Issued pursuant to employee stock purchase plan | — | — | (3,272 | ) | — | — | (1,247,156 | ) | 19,630 | 16,358 | ||||||||||||||||||||
Issued pursuant to directors’ compensation plan | 22,529 | — | 412 | — | — | — | — | 412 | ||||||||||||||||||||||
Stock-based compensation | — | — | 39,532 | — | — | — | — | 39,532 | ||||||||||||||||||||||
Income tax benefit from equity awards | — | — | 12 | — | — | — | — | 12 | ||||||||||||||||||||||
Tax withholding – stock compensation | — | — | — | — | — | 553,750 | (8,618 | ) | (8,618 | ) | ||||||||||||||||||||
Derivative contracts, net | — | — | — | — | 67 | — | — | 67 | ||||||||||||||||||||||
Cash dividends declared ($0.25 per common share) | — | — | — | (87,458 | ) | — | — | — | (87,458 | ) | ||||||||||||||||||||
Net income | — | — | — | 635,491 | — | — | — | 635,491 | ||||||||||||||||||||||
Balance – December 31, 2014 | 411,779,911 | 412 | 3,230,418 | 3,392,465 | (209 | ) | 58,415,507 | (919,230 | ) | 5,703,856 | ||||||||||||||||||||
Stock Repurchase Program | — | — | — | — | — | 4,424,702 | (11,759 | ) | (11,759 | ) | ||||||||||||||||||||
Issued or purchased pursuant to employee stock compensation plans | 3,900,127 | 5 | 562 | — | — | — | 567 | |||||||||||||||||||||||
Issued pursuant to employee stock purchase plan | — | (2,867 | ) | — | — | (353,480 | ) | 5,534 | 2,667 | |||||||||||||||||||||
Issued pursuant to directors’ compensation plan | 292,407 | — | 398 | — | — | — | — | 398 | ||||||||||||||||||||||
Share correction (Note 6) | (1,430,819 | ) | (2 | ) | (22,076 | ) | — | — | — | — | (22,078 | ) | ||||||||||||||||||
Stock-based compensation | — | — | 39,285 | — | — | — | — | 39,285 | ||||||||||||||||||||||
Income tax shortfall from equity awards | — | — | (8,102 | ) | — | — | — | — | (8,102 | ) | ||||||||||||||||||||
Tax withholding – stock compensation | — | — | — | — | — | 637,582 | (4,712 | ) | (4,712 | ) | ||||||||||||||||||||
Derivative contracts, net | — | — | — | — | 209 | — | — | 209 | ||||||||||||||||||||||
Cash dividends declared ($0.1875 per common share) | — | — | — | (65,971 | ) | — | — | — | (65,971 | ) | ||||||||||||||||||||
Retirement of treasury stock | (60,000,000 | ) | (60 | ) | (884,069 | ) | — | — | (60,000,000 | ) | 884,129 | — | ||||||||||||||||||
Net loss | — | — | — | (4,385,448 | ) | — | — | — | (4,385,448 | ) | ||||||||||||||||||||
Balance – December 31, 2015 | 354,541,626 | $ | 355 | $ | 2,353,549 | $ | (1,058,954 | ) | $ | — | 3,124,311 | $ | (46,038 | ) | $ | 1,248,912 | ||||||||||||||
See accompanying Notes to Consolidated Financial Statements.
73
Note 1. Significant Accounting Policies
Organization and Nature of Operations
Denbury Resources Inc., a Delaware corporation, is an independent oil and natural gas company with operations focused in two key operating areas: the Gulf Coast and Rocky Mountain regions. Our goal is to increase the value of our properties through a combination of exploitation, drilling and proven engineering extraction practices, with the most significant emphasis relating to CO2 enhanced oil recovery operations.
Principles of Reporting and Consolidation
The consolidated financial statements herein have been prepared in accordance with accounting principles generally accepted in the United States (“GAAP”) and include the accounts of Denbury and entities in which we hold a controlling financial interest. Undivided interests in oil and gas joint ventures are consolidated on a proportionate basis. All intercompany balances and transactions have been eliminated.
Use of Estimates
The preparation of financial statements in conformity with GAAP requires management to make estimates and assumptions that affect the reported amount of certain assets and liabilities, disclosure of contingent assets and liabilities at the date of the financial statements, and the reported amounts of revenues and expenses during each reporting period. Management believes its estimates and assumptions are reasonable; however, such estimates and assumptions are subject to a number of risks and uncertainties that may cause actual results to differ materially from such estimates. Significant estimates underlying these financial statements include (1) the fair value of financial derivative instruments; (2) the estimated quantities of proved oil and natural gas reserves used to compute depletion of oil and natural gas properties, the related present value of estimated future net cash flows therefrom and the ceiling test; (3) future net cash flow estimates used in the impairment assessment of goodwill and long-lived assets; (4) the estimated quantities of proved and probable CO2 reserves used to compute depletion of CO2 properties; (5) accruals related to oil and natural gas sales volumes and revenues, capital expenditures and lease operating expenses; (6) the estimated costs and timing of future asset retirement obligations; (7) estimates made in the calculation of income taxes; and (8) estimates made in determining the fair values for purchase price allocations, including goodwill. While management is not aware of any significant revisions to any of its estimates, there will likely be future revisions to its estimates resulting from matters such as revisions in estimated oil and natural gas volumes, changes in ownership interests, payouts, joint venture audits, re-allocations by purchasers or pipelines, or other corrections and adjustments common in the oil and natural gas industry, many of which require retroactive application. These types of adjustments cannot be currently estimated and will be recorded in the period in which the adjustment occurs.
Reclassifications
Certain prior period amounts have been reclassified to conform to the current year presentation. Such reclassifications had no impact on our reported net income, current assets, total assets, current liabilities, total liabilities or stockholders’ equity.
Cash Equivalents
We consider all highly liquid investments to be cash equivalents if they have maturities of three months or less at the date of purchase.
Oil and Natural Gas Properties
Capitalized Costs. We follow the full cost method of accounting for oil and natural gas properties. Under this method, all costs related to the acquisition, exploration and development of oil and natural gas reserves are capitalized and accumulated in a single cost center representing our activities, which are undertaken exclusively in the United States. Such costs include lease acquisition costs, geological and geophysical expenditures, lease rentals on undeveloped properties, costs of drilling both productive and nonproductive wells, capitalized interest on qualifying projects, and general and administrative expenses directly related to exploration and development activities, and do not include any costs related to production, general corporate overhead or similar
74
activities. We assign the purchase price of oil and natural gas properties we acquire to proved and unevaluated properties based on the estimated fair values as defined in the Financial Accounting Standards Board Codification (“FASC”) Fair Value Measurement topic. Proceeds received from disposals are credited against accumulated costs except when the sale represents a significant disposal of reserves, in which case a gain or loss would be recognized. A disposal of 25% or more of our proved reserves would be considered significant.
Depletion and Depreciation. The costs capitalized, including production equipment and future development costs, are depleted or depreciated using the unit-of-production method, based on proved oil and natural gas reserves as determined by independent petroleum engineers. Oil and natural gas reserves are converted to equivalent units on a basis of 6,000 cubic feet of natural gas to one barrel of crude oil.
Under full cost accounting, we may exclude certain unevaluated costs from the amortization base pending determination of whether proved reserves can be assigned to such properties. The costs classified as unevaluated are transferred to the full cost amortization base as the properties are developed, tested and evaluated. At least annually, we test these assets for impairment based on an evaluation of management’s expectations of future pricing, evaluation of lease expiration terms, and planned project development activities. As a result of this analysis, we recognized impairments of $17.9 million of our unevaluated costs during the year ended December 31, 2015, whereby these costs were transferred to the full cost amortization base. We did not have an impairment of our unevaluated costs for the years ended December 31, 2014 or 2013.
Write-Down of Oil and Natural Gas Properties. The net capitalized costs of oil and natural gas properties are limited to the lower of unamortized cost or the cost center ceiling. The cost center ceiling is defined as (1) the present value of estimated future net revenues from proved oil and natural gas reserves before future abandonment costs (discounted at 10%), based on the average first-day-of-the-month oil and natural gas price for each month during a 12-month rolling period prior to the end of a particular reporting period; plus (2) the cost of properties not being amortized; plus (3) the lower of cost or estimated fair value of unproved properties included in the costs being amortized, if any; less (4) related income tax effects. Our future net revenues from proved oil and natural gas reserves are not reduced for development costs related to the cost of drilling for and developing CO2 reserves nor those related to the cost of constructing CO2 pipelines, as those costs have previously been incurred by the Company. Therefore, we include in the ceiling test, as a reduction of future net revenues, that portion of our capitalized CO2 costs related to CO2 reserves and CO2 pipelines that we estimate will be consumed in the process of producing our proved oil and natural gas reserves. The fair value of our oil and natural gas derivative contracts is not included in the ceiling test, as we do not designate these contracts as hedge instruments for accounting purposes. The cost center ceiling test is prepared quarterly.
As a result of the precipitous and continuing decline in NYMEX oil prices since the fourth quarter of 2014, the rolling first-day-of-the-month average oil price for the preceding 12 months, after adjustments for market differentials by field, has fallen throughout 2015, from $79.55 per Bbl for the first quarter of 2015, to $68.48 per Bbl for the second quarter of 2015, $56.74 per Bbl for the third quarter of 2015, and $48.11 per Bbl for the fourth quarter of 2015. In addition, the first-day-of-the-month average natural gas price for the preceding 12 months, after adjustments for market differentials by field, was $3.95 per Mcf for the first quarter of 2015, $3.74 per Mcf for the second quarter of 2015, $3.64 per Mcf for the third quarter of 2015, and $2.45 per Mcf for the fourth quarter of 2015. These falling prices have led to our recognizing full cost pool ceiling test write-downs totaling $4.9 billion during 2015. We had no ceiling test write-downs during the years ended December 31, 2014 or 2013.
Joint Interest Operations. Substantially all of our oil and natural gas exploration and production activities are conducted jointly with others. These financial statements reflect only our proportionate interest in such activities, and any amounts due from other partners are included in trade receivables.
Tertiary Injection Costs. Our tertiary operations are conducted in reservoirs that have already produced significant amounts of oil over many years; however, in accordance with the SEC rules and regulations for recording proved reserves, we cannot recognize proved reserves associated with enhanced recovery techniques, such as CO2 injection, until we can demonstrate production resulting from the tertiary process or unless the field is analogous to an existing flood.
We capitalize, as a development cost, injection costs in fields that are in their development stage, which means we have not yet seen incremental oil production due to the CO2 injections (i.e., a production response). These capitalized development costs are included in our unevaluated property costs if there are not already proved tertiary reserves in that field. After we see a production response to the CO2 injections (i.e., the production stage), injection costs are expensed as incurred, and once proved reserves are recognized, previously deferred unevaluated development costs become subject to depletion.
75
CO2 Properties
We own and produce CO2 reserves, a non-hydrocarbon resource, that are used in our tertiary oil recovery operations on our own behalf and on behalf of other interest owners in enhanced recovery fields, with a portion sold to third-party industrial users. We record revenue from our sales of CO2 to third parties when it is produced and sold. Expenses related to the production of CO2 are allocated between volumes sold to third parties and volumes consumed internally that are directly related to our tertiary production. The expenses related to third-party sales are recorded in “CO2 and helium discovery and operating expenses,” and the expenses related to internal use are recorded in “Lease operating expenses” in the Consolidated Statements of Operations or are capitalized as oil and gas properties in our Consolidated Balance Sheets, depending on the stage of the tertiary flood that is receiving the CO2 (see Tertiary Injection Costs above for further discussion).
Costs incurred to search for CO2 are expensed as incurred until proved or probable reserves are established. Once proved or probable reserves are established, costs incurred to obtain those reserves are capitalized and classified as “CO2 properties” on our Consolidated Balance Sheets. Capitalized CO2 costs are aggregated by geologic formation and depleted on a unit-of-production basis over proved and probable reserves.
We own certain interests in the Riley Ridge Federal Unit in Wyoming (“Riley Ridge”), which contains helium and CO2 (non-hydrocarbon resources) as well as natural gas (a hydrocarbon resource). It is not possible to separately identify the capitalized costs related to the development of each product in the commingled gas stream; thus, these costs are allocated to each product based on the relative future revenue value of each product line and classified accordingly on the Consolidated Balance Sheets.
Pipelines and Plants
CO2 used in our tertiary floods is transported to our fields through CO2 pipelines. Costs of CO2 pipelines under construction are not depreciated until the pipelines are placed into service. Pipelines are depreciated on a straight-line basis over their estimated useful lives, which range from 15 to 50 years.
Pipelines and plants include the Riley Ridge gas processing facility in southwestern Wyoming. Individual components of the Riley Ridge gas processing facility are depreciated on a straight-line basis over their estimated useful lives, which range from 20 to 50 years.
Property and Equipment – Other
Other property and equipment, which includes furniture and fixtures, vehicles, computer equipment and software, and capitalized leases, is depreciated principally on a straight-line basis over each asset’s estimated useful life. Vehicles and furniture and fixtures are generally depreciated over a useful life of five to ten years, and computer equipment and software are generally depreciated over a useful life of three to five years. Leasehold improvements are amortized over the shorter of the estimated useful life or the remaining lease term.
Leased property meeting certain capital lease criteria is capitalized, and the present value of the related lease payments is recorded as a liability. Amortization of capitalized leased assets is computed using the straight-line method over the shorter of the estimated useful life or the initial lease term.
Maintenance and repair costs that do not extend the useful life of the property or equipment are charged to expense as incurred.
Goodwill and Other Intangible Assets
Goodwill represents the excess of the purchase price over the estimated fair value of the net assets acquired in the acquisition of a business. Goodwill is not amortized; rather, it is tested for impairment annually during the fourth quarter or when events or changes in circumstances indicate that it is more likely than not the fair value of a reporting unit with goodwill has been reduced below its carrying value. The impairment test requires allocating goodwill and other assets and liabilities to reporting units. However, we have only one reporting unit. To assess impairment, we have the option to qualitatively assess if it is more likely than not that the fair value of the reporting unit is less than the carrying value. Absent a qualitative assessment, or, through the qualitative assessment, if we determine it is more likely than not that the fair value of the reporting unit is less than the carrying
76
value, a quantitative assessment is prepared to calculate the fair market value of the reporting unit. If it is determined that the fair value of the reporting unit is less than the carrying value, the recorded goodwill is impaired to its implied fair value with a charge to operating expense. Our enterprise value (combined market capitalization plus a control premium of 10% and the fair value of our long-term debt) declined by approximately $2.5 billion between June 30 and September 30, 2015; therefore, we concluded that a goodwill impairment test was required to be performed in the third quarter of 2015.
For the goodwill impairment test, we compared the fair value of the reporting unit (enterprise value) to the fair value of its assets and liabilities. Oil and natural gas reserves, which represent the most significant assets requiring valuation, were estimated using the expected present value of future net cash flows method based on September 30, 2015, NYMEX oil and natural gas futures prices for the next five years, adjusted for current price differentials. In addition to future oil and natural gas pricing, the most significant assumptions impacting the projections of future net cash flows include projections of future rates of production, timing and amount of future development and operating costs, projected availability and cost of CO2, risk adjustment factors applied to probable and possible oil and natural gas reserve cash flows, projected recovery factors of oil and natural gas reserves, and a weighted average cost of capital discount rate applied to all net cash flows. Because the fair value of the reporting unit (enterprise value) did not exceed the fair value of assets and liabilities, we recorded a goodwill impairment charge of $1.3 billion during the third quarter of 2015, to fully impair the carrying value of our goodwill. Approximately $1.0 billion of the $1.3 billion goodwill balance was associated with the March-2010 merger with Encore Acquisition Company (“Encore”).
Our intangible assets subject to amortization primarily consist of amounts assigned in purchase accounting to helium production rights at Riley Ridge and a CO2 purchase contract with ConocoPhillips to offtake CO2 from the Lost Cabin gas plant in Wyoming and are included in our Consolidated Balance Sheets under the caption “Other assets.” We amortize our helium production rights on a unit-of-production basis over the life of the estimated helium reserves and amortize the CO2 contract intangible asset on a straight-line basis over the contract term. Total amortization expense related to these assets was $2.3 million and $3.6 million during the years ended December 31, 2015 and 2014, respectively. The following table summarizes the carrying values of our intangible assets as of December 31, 2015 and 2014:
In thousands | Helium Production Rights | CO2 Purchase Contract | Total | |||||||||
December 31, 2015 | ||||||||||||
Intangible asset value | $ | 55,266 | $ | 34,341 | $ | 89,607 | ||||||
Accumulated amortization | (15 | ) | (5,915 | ) | (5,930 | ) | ||||||
Net book value as of December 31, 2015 | $ | 55,251 | $ | 28,426 | $ | 83,677 | ||||||
December 31, 2014 | ||||||||||||
Intangible asset value | $ | 55,266 | $ | 34,341 | $ | 89,607 | ||||||
Accumulated amortization | (15 | ) | (3,625 | ) | (3,640 | ) | ||||||
Net book value as of December 31, 2014 | $ | 55,251 | $ | 30,716 | $ | 85,967 | ||||||
As of December 31, 2015, our estimated amortization expense for our intangible assets subject to amortization over the next five years is as follows:
In thousands | ||||
2016 | $ | 2,289 | ||
2017 | 2,488 | |||
2018 | 2,788 | |||
2019 | 2,858 | |||
2020 | 2,834 | |||
77
Impairment Assessment of Long-Lived Assets
The portion of our capitalized CO2 costs related to CO2 reserves, CO2 pipelines, and the Riley Ridge gas processing facility that we estimate will be consumed in the process of producing our proved oil and natural gas reserves is included in the full cost pool ceiling test as a reduction to future net revenues. The remaining net capitalized costs that are not included in the full cost pool ceiling test, and related intangible assets, are subject to long-lived asset impairment testing whenever events or changes in circumstances indicate that the carrying value may not be recoverable.
We perform our long-lived asset impairment test by comparing the net carrying costs of our two long-lived asset groups ((1) Gulf Coast region and (2) Rocky Mountain region) to the respective expected future undiscounted net cash flows that are supported by these long-lived assets which include (1) the production of our probable and possible oil and natural gas reserves and (2) the sale of non-hydrocarbons (CO2 and helium) to third parties. If the undiscounted net cash flows are below the net carrying costs for an asset group, we must record an impairment loss by the amount, if any, that net carrying costs exceed the fair value of the long-lived asset group.
Given the significant decline in oil prices through the fourth quarter of 2015, we performed a long-lived asset impairment test for both asset groups. Significant assumptions impacting expected future undiscounted net cash flows include projections of future oil and natural gas prices, projections of estimated quantities of oil and natural gas reserves, projections of future rates of production, timing and amount of future development and operating costs, projected availability and cost of CO2, projected recovery factors of tertiary reserves and risk-adjustment factors applied to the cash flows. The undiscounted net cash flows for our asset groups exceeded the net carrying costs; thus, step two of the impairment test was not required and no impairment was recorded.
Asset Retirement Obligations
In general, our future asset retirement obligations relate to future costs associated with plugging and abandoning our oil, natural gas and CO2 wells, removing equipment and facilities from leased acreage, and returning land to its original condition. The fair value of a liability for an asset retirement obligation is recorded in the period in which it is incurred, discounted to its present value using our credit-adjusted-risk-free interest rate, and a corresponding amount capitalized by increasing the carrying amount of the related long-lived asset. The liability is accreted each period, and the capitalized cost is depreciated over the useful life of the related asset. Revisions to estimated retirement obligations will result in an adjustment to the related capitalized asset and corresponding liability. If the liability for an oil or natural gas well is settled for an amount other than the recorded amount, the difference is recorded to the full cost pool, unless significant.
Asset retirement obligations are estimated at the present value of expected future net cash flows. We utilize unobservable inputs in the estimation of asset retirement obligations that include, but are not limited to, costs of labor and materials, profits on costs of labor and materials, the effect of inflation on estimated costs, and the discount rate. Accordingly, asset retirement obligations are considered a Level 3 measurement under the FASC Fair Value Measurement topic.
Commodity Derivative Contracts
We utilize oil and natural gas derivative contracts to mitigate our exposure to commodity price risk associated with our future oil and natural gas production. These derivative contracts have historically consisted of options, in the form of price floors, collars or three-way collars, fixed-price swaps and fixed-price swaps enhanced with a sold put. Our derivative financial instruments are recorded on the balance sheet as either an asset or a liability measured at fair value. We do not apply hedge accounting to our commodity derivative contracts; accordingly, changes in the fair value of these instruments are recognized in our Consolidated Statements of Operations in the period of change.
Concentrations of Credit Risk
Our financial instruments that are exposed to concentrations of credit risk consist primarily of cash equivalents, trade and accrued production receivables, and the derivative instruments discussed above. Our cash equivalents represent high-quality securities placed with various investment-grade institutions. This investment practice limits our exposure to concentrations of credit risk. Our trade and accrued production receivables are dispersed among various customers and purchasers; therefore, concentrations of credit risk are limited. We evaluate the credit ratings of our purchasers, and if customers are considered a credit risk, letters of credit are the primary security obtained to support lines of credit. We attempt to minimize our credit risk exposure
78
to the counterparties of our oil and natural gas derivative contracts through formal credit policies, monitoring procedures and diversification. All of our derivative contracts are with parties that are lenders under our bank credit facility (or affiliates of such lenders). There are no margin requirements with the counterparties of our derivative contracts.
Oil and natural gas sales are made on a day-to-day basis or under short-term contracts at the current area market price. We would not expect the loss of any purchaser to have a material adverse effect upon our operations. For the year ended December 31, 2015, two purchasers accounted for 10% or more of our oil and natural gas revenues: Marathon Petroleum Company (28%) and Plains Marketing LP (15%). For the year ended December 31, 2014, three purchasers accounted for 10% or more of our oil and natural gas revenues: Marathon Petroleum Company (31%), Plains Marketing LP (13%), and ConocoPhillips (12%). For the year ended December 31, 2013, three purchasers accounted for 10% or more of our oil and natural gas revenues: Marathon Petroleum Company (33%), Plains Marketing LP (15%), and Eighty-Eight Oil LLC (10%).
Revenue Recognition
Revenue Recognition. Revenue is recognized at the time oil and natural gas is produced and sold. Any amounts due from purchasers of oil and natural gas are included in accrued production receivable.
We follow the sales method of accounting for our oil and natural gas revenue, whereby we recognize revenue on oil or natural gas sold to our purchasers regardless of whether the sales are proportionate to our ownership in the property. A receivable or liability is recognized only to the extent that we have an imbalance on a specific property greater than the expected remaining proved reserves. As of December 31, 2015 and 2014, our aggregate oil and natural gas imbalances were not material to our consolidated financial statements.
We recognize revenue and expenses of purchased producing properties at the time we assume effective control, commencing from either the closing or purchase agreement date, depending on the underlying terms and agreements. We follow the same methodology in reverse when we sell properties by recognizing revenue and expenses of the sold properties until the closing date.
Income Taxes
Income taxes are accounted for using the asset and liability method, under which deferred income taxes are recognized for the future tax effects of temporary differences between the financial statement carrying amounts and the tax basis of existing assets and liabilities using the enacted statutory tax rates in effect at year end. The effect on deferred taxes for a change in tax rates is recognized in income in the period that includes the enactment date. A valuation allowance for deferred tax assets is recorded when it is more likely than not that the benefit from the deferred tax asset will not be realized.
We recognize the tax benefit from an uncertain tax position only if it is more likely than not that the tax position will be sustained upon examination by the taxing authorities, based on the technical merits of the position. The tax benefits recognized in the financial statements from such a position are measured based on the largest benefit that has a greater than 50% likelihood of being realized upon ultimate settlement.
Net Income (Loss) Per Common Share
Basic net income (loss) per common share is computed by dividing the net income (loss) attributable to common stockholders by the weighted average number of shares of common stock outstanding during the period. Diluted net income (loss) per common share is calculated in the same manner, but includes the impact of potentially dilutive securities. Potentially dilutive securities consist of stock options, stock appreciation rights (“SARs”), nonvested restricted stock and nonvested performance-based equity awards. For each of the three years in the period ended December 31, 2015, there were no adjustments to net income (loss) for purposes of calculating basic and diluted net income (loss) per common share.
79
The following is a reconciliation of the weighted average shares used in the basic and diluted net income (loss) per common share calculations for the periods indicated:
Year Ended December 31, | |||||||||
In thousands | 2015 | 2014 | 2013 | ||||||
Basic weighted average common shares outstanding | 348,802 | 348,962 | 366,659 | ||||||
Potentially dilutive securities | |||||||||
Restricted stock, stock options, SARs and performance-based equity awards | — | 2,205 | 3,218 | ||||||
Diluted weighted average common shares outstanding | 348,802 | 351,167 | 369,877 | ||||||
Basic weighted average common shares exclude shares of nonvested restricted stock. As these restricted shares vest, they will be included in the shares outstanding used to calculate basic net income (loss) per common share (although all non-performance-based restricted stock is issued and outstanding upon grant). For purposes of calculating diluted weighted average common shares during the years ended December 31, 2014 and 2013, the nonvested restricted stock, stock options, SARs, and performance-based equity awards are included in the computation using the treasury stock method, with the deemed proceeds equal to the average unrecognized compensation during the period, the purchase price that the grantee will pay in the future for stock options, and any estimated future tax consequences recognized directly in equity.
The following securities could potentially dilute earnings per share in the future, but were excluded from the computation of diluted net income (loss) per share, as their effect would have been antidilutive:
Year Ended December 31, | |||||||||
In thousands | 2015 | 2014 | 2013 | ||||||
Stock options and SARs | 9,619 | 4,775 | 3,598 | ||||||
Restricted stock and performance-based equity awards | 3,867 | 417 | 365 | ||||||
Environmental and Litigation Contingencies
The Company makes judgments and estimates in recording liabilities for contingencies such as environmental remediation or ongoing litigation. Liabilities are recorded when it is both probable that a loss has been incurred and such loss is reasonably estimable. Assessments of liabilities are based on information obtained from independent and in-house experts, loss experience in similar situations, actual costs incurred, and other case-by-case factors. Any related insurance recoveries are recognized in our financial statements during the period received or at the time receipt is determined to be virtually certain.
Recent Accounting Pronouncements
Income Taxes. In November 2015, the Financial Accounting Standards Board (“FASB”) issued Accounting Standards Update (“ASU”) 2015-17, Income Taxes (“ASU 2015-17”). ASU 2015-17 simplifies the presentation of deferred income taxes and requires deferred tax assets and liabilities be classified as noncurrent in the balance sheet. The amendments in this ASU are effective for fiscal years beginning after December 15, 2016, and interim periods within those fiscal years, and early adoption is permitted. Entities can transition to the standard either retrospectively to each period presented or prospectively. We currently plan to adopt ASU 2015-17 during the first quarter of 2016, the adoption of which is currently not expected to have a material effect on our consolidated financial statements, other than balance sheet reclassifications.
Debt Issuance Costs. In April 2015, the FASB issued ASU 2015-03, Interest – Imputation of Interest: Simplifying the Presentation of Debt Issuance Costs (“ASU 2015-03”). ASU 2015-03 requires debt issuance costs related to a recognized debt liability to be presented as a direct reduction of the carrying amount of that debt in the balance sheet, consistent with the presentation of debt discounts. The amendments in this ASU are effective for fiscal years beginning after December 15, 2015, and interim periods within those fiscal years, and early adoption is permitted. Entities will be required to apply the guidance on a retrospective basis to each period presented as a change in accounting principle. In August 2015, the FASB issued ASU 2015-15, Interest – Imputation of Interest: Simplifying the Presentation of Debt Issuance Costs (“ASU 2015-15”) which amends ASU 2015-03 to clarify the presentation and subsequent measurement of debt issuance costs associated with line of credit arrangements, such that entities may continue to apply current practice. We will adopt ASU 2015-03 and 2015-15 during the first quarter of 2016, the
80
adoption of which are currently not expected to have a material effect on our consolidated financial statements, other than balance sheet reclassifications.
Revenue Recognition. In May 2014, the FASB issued ASU 2014-09, Revenue from Contracts with Customers (“ASU 2014-09”). ASU 2014-09 amends the guidance for revenue recognition to replace numerous, industry-specific requirements. The core principle of the ASU is that an entity should recognize revenue for the transfer of goods or services equal to the amount that it expects to be entitled to receive for those goods or services. The ASU implements a five-step process for customer contract revenue recognition that focuses on transfer of control, as opposed to transfer of risk and rewards. The amendment also requires enhanced disclosures regarding the nature, amount, timing and uncertainty of revenues and cash flows arising from contracts with customers. In August 2015, the FASB issued ASU 2015-14, Revenue from Contracts with Customers (“ASU 2015-14”) which amends ASU 2014-09 and delays the effective date for public companies, such that the amendments in the ASU are effective for reporting periods beginning after December 15, 2017, and early adoption will be permitted for periods beginning after December 15, 2016. Entities can transition to the standard either retrospectively to each period presented or as a cumulative-effect adjustment as of the date of adoption. Management is currently assessing the impact the adoption of ASU 2014-09 will have on our consolidated financial statements.
Note 2. Asset Retirement Obligations
The following table summarizes the changes in our asset retirement obligations for the years ended December 31, 2015 and 2014:
Year Ended December 31, | ||||||||
In thousands | 2015 | 2014 | ||||||
Beginning asset retirement obligations | $ | 128,095 | $ | 126,301 | ||||
Liabilities incurred and assumed during period | 9,628 | 7,798 | ||||||
Revisions in estimated retirement obligations | 5,238 | (1,298 | ) | |||||
Liabilities settled and sold during period | (6,914 | ) | (13,576 | ) | ||||
Accretion expense | 9,649 | 8,870 | ||||||
Ending asset retirement obligations | 145,696 | 128,095 | ||||||
Less: current asset retirement obligations (1) | (6,777 | ) | (1,684 | ) | ||||
Long-term asset retirement obligations | $ | 138,919 | $ | 126,411 | ||||
(1) | Included in “Accounts payable and accrued liabilities” in our Consolidated Balance Sheets. |
Liabilities assumed during 2015 relate to current year minor acquisitions, with liabilities incurred and assumed during 2015 and 2014 generally relating to wells and facilities.
We have escrow accounts that are legally restricted for certain of our asset retirement obligations. The balances of these escrow accounts were $38.2 million and $37.1 million at December 31, 2015 and 2014, respectively. These balances are primarily invested in U.S. Treasury bonds, are recorded at amortized cost and are included in “Other assets” in our Consolidated Balance Sheets. The carrying value of these investments approximates their estimated fair market value at December 31, 2015 and 2014.
81
Note 3. Property and Equipment
The following table presents a summary of our net property and equipment balances as of December 31, 2015 and 2014:
December 31, | ||||||||
In thousands | 2015 | 2014 | ||||||
Oil and natural gas properties | ||||||||
Proved properties | $ | 10,245,195 | $ | 9,782,337 | ||||
Unevaluated properties | 894,948 | 918,406 | ||||||
Total | 11,140,143 | 10,700,743 | ||||||
Accumulated depletion, depreciation and impairment | (9,022,823 | ) | (3,679,883 | ) | ||||
Net oil and natural gas properties | 2,117,320 | 7,020,860 | ||||||
CO2 properties | ||||||||
CO2 properties | 1,187,458 | 1,162,538 | ||||||
Accumulated depletion and depreciation | (213,106 | ) | (183,646 | ) | ||||
Net CO2 properties | 974,352 | 978,892 | ||||||
Pipelines and plants | ||||||||
CO2 pipelines (1) | 1,749,538 | 1,733,562 | ||||||
Plants | 543,681 | 536,002 | ||||||
Total | 2,293,219 | 2,269,564 | ||||||
Accumulated depletion and depreciation | (230,297 | ) | (182,385 | ) | ||||
Net plants and pipelines | 2,062,922 | 2,087,179 | ||||||
Other property and equipment | ||||||||
Other property and equipment | 408,194 | 468,051 | ||||||
Accumulated depletion and depreciation | (186,979 | ) | (202,738 | ) | ||||
Net other property and equipment | 221,215 | 265,313 | ||||||
Net property and equipment | $ | 5,375,809 | $ | 10,352,244 | ||||
(1) | Amount includes $114.3 million of CO2 pipelines at December 31, 2015, that were under construction and not subject to depreciation during 2015. |
A summary of the unevaluated property costs excluded from oil and natural gas properties being amortized at December 31, 2015, and the year in which the costs were incurred follows:
December 31, 2015 | ||||||||||||||||||||
Costs Incurred During: | ||||||||||||||||||||
In thousands | 2015 | 2014 | 2013 | 2012 and Prior | Total | |||||||||||||||
Property acquisition costs | $ | — | $ | 6,500 | $ | 215,660 | $ | 395,752 | $ | 617,912 | ||||||||||
Exploration and development | 24,814 | 95,397 | 40,090 | 30,206 | 190,507 | |||||||||||||||
Capitalized interest | 28,302 | 21,179 | 22,916 | 14,132 | 86,529 | |||||||||||||||
Total | $ | 53,116 | $ | 123,076 | $ | 278,666 | $ | 440,090 | $ | 894,948 | ||||||||||
Our 2013 property acquisition costs were primarily related to the fair value allocated to the purchase of additional interests in the Cedar Creek Anticline (“CCA”). Property acquisition costs for 2012 and prior were primarily related to the fair value allocated to our Hartzog Draw and Thompson Fields, CO2 tertiary potential at our CCA properties, acquired as part of the merger with Encore, as well as CO2 tertiary potential at Conroe Field. Exploration and development costs shown as unevaluated properties are primarily associated with our tertiary oil fields that are under development but did not have proved reserves at December 31, 2015. The most significant development costs incurred during 2015, 2014 and 2013 relate to development in preparation for the
82
CO2 floods at Webster and Grieve fields, with the more significant development costs incurred during 2012 and prior relating to development in preparation for the CO2 flood at Grieve Field. We have not yet recognized proved tertiary reserves in these fields.
Costs are transferred into the amortization base on an ongoing basis as projects are evaluated and proved reserves established or impairment determined. We review the excluded properties for impairment at least annually. We currently estimate that evaluation of the majority of these properties and the inclusion of their costs in the amortization base is expected to be completed within five to ten years. Until we are able to determine whether there are any proved reserves attributable to the above costs, we are not able to assess the future impact on the amortization rate of the full cost pool.
Note 4. Long-Term Debt
The following long-term debt and capital lease obligations were outstanding as of December 31, 2015 and 2014:
December 31, | ||||||||
In thousands | 2015 | 2014 | ||||||
Bank Credit Agreement | $ | 175,000 | $ | 395,000 | ||||
6⅜% Senior Subordinated Notes due 2021 | 400,000 | 400,000 | ||||||
5½% Senior Subordinated Notes due 2022 | 1,250,000 | 1,250,000 | ||||||
4⅝% Senior Subordinated Notes due 2023 | 1,200,000 | 1,200,000 | ||||||
Other Senior Subordinated Notes, including premium of $7 and $11, respectively | 2,257 | 2,746 | ||||||
Pipeline financings | 211,766 | 220,583 | ||||||
Capital lease obligations | 71,324 | 103,041 | ||||||
Total | 3,310,347 | 3,571,370 | ||||||
Less: current obligations | (32,481 | ) | (35,470 | ) | ||||
Long-term debt and capital lease obligations | $ | 3,277,866 | $ | 3,535,900 | ||||
The ultimate parent company in our corporate structure, Denbury Resources Inc. (“DRI”), is the sole issuer of all of our outstanding senior subordinated notes. DRI has no independent assets or operations. Each of the subsidiary guarantors of such notes is 100% owned, directly or indirectly, by DRI, and the guarantees of the notes are full and unconditional and joint and several; any subsidiaries of DRI that are not subsidiary guarantors of such notes are minor subsidiaries.
Liquidity
Our primary sources of capital and liquidity are our cash flows from operations and availability of borrowing capacity under our bank credit facility, and as of February 24, 2016, our bank credit facility availability was approximately $1.3 billion, based on a $1.5 billion commitment level from our banks. The borrowing base on our bank credit facility is scheduled to be redetermined in May and November of 2016, and while still uncertain, we currently anticipate that we will retain a substantial amount of availability on our bank line after the next bank redetermination. Due to this low oil price environment, we have, among other things, (1) reduced our budgeted development capital spending to less than half of 2015 levels, which we intend to primarily fund with cash flow from operations, (2) continued to focus on reducing our operating and overhead costs, (3) modified certain of our bank covenants as discussed in further detail below, and (4) since year-end 2015, entered into additional oil swaps for the second half of 2016, such that we now have an average of 31,000 Bbls/d of our oil production for 2016 hedged. As the ability to fund our 2016 development capital budget with cash flow from operations is dependent in part upon future commodity pricing, which cannot be predicted, any potential shortfall will be funded with incremental borrowings on our bank credit facility.
Our bank credit facility and the indentures related to our senior subordinated notes are subject to certain covenants, and our bank credit facility includes certain maintenance financial covenants. Throughout 2015 and as of December 31, 2015, we were in compliance with all covenants under the bank credit facility, including maintenance financial covenants, as well as the debt covenants with respect to the indentures related to our senior subordinated notes. In order to provide more flexibility in managing our balance sheet and the credit extended by our lenders, as well as our continuing compliance with maintenance financial covenants during 2016 in this low oil price environment, we entered into the second amendment to the bank credit facility on February 17, 2016, which, among other things, modifies certain maintenance financial covenants, which are further described below.
83
Based upon our currently forecasted levels of production and costs, hedges in place as of February 24, 2016, and current oil commodity futures prices, we anticipate that the changes made to our bank credit facility financial maintenance covenants will allow us to continue to be in compliance with these covenants throughout 2016.
Bank Credit Facility
In December 2014, we entered into an Amended and Restated Credit Agreement with JPMorgan Chase Bank, N.A., as administrative agent, and other lenders party thereto (the “Bank Credit Agreement”). The Bank Credit Agreement is a senior secured revolving credit facility with a maturity date of December 9, 2019. Under the Bank Credit Agreement, letters of credit are available in an aggregate amount not to exceed $50 million, which may be increased at the sole discretion of the administrative agent, and short-term swingline loans are available in an aggregate amount not to exceed $25 million, each subject to the available commitments under the Bank Credit Agreement. The Bank Credit Agreement is guaranteed jointly and severally by each subsidiary of DRI that is 100% owned, directly or indirectly, by DRI and is secured by (1) a significant portion of our proved oil and natural gas properties held through DRI’s restricted subsidiaries; (2) the pledge of equity interests of such subsidiaries; (3) a pledge of commodity derivative agreements of DRI and such subsidiaries (as applicable); and (4) a pledge of deposit accounts, securities accounts and commodity accounts of DRI and such subsidiaries (as applicable). The Bank Credit Agreement limits our ability to, among other things, incur indebtedness; grant liens; engage in certain mergers, consolidations, liquidations and dissolutions; engage in sales of assets; make acquisitions and investments; make distributions and dividends; and enter into commodity derivative agreements, in each case subject to customary exceptions.
As of December 31, 2015, the borrowing base of the revolving credit facility was $2.6 billion and the aggregate lender commitments were $1.6 billion, and scheduled redeterminations of the borrowing base were to occur annually, with the next such redetermination being scheduled for May 2016. As of December 31, 2015, (1) loans under the Bank Credit Agreement were subject to varying rates of interest based on either (a) for ABR Loans, a base rate determined under the Bank Credit Agreement (the “ABR”) plus an applicable margin ranging from 0.25% to 1.25% per annum, or (b) for LIBOR Loans, the LIBOR rate plus an applicable margin ranging from 1.25% to 2.25% per annum (capitalized terms as defined in the Bank Credit Agreement) and (2) the undrawn portion of the aggregate lender commitments under the Bank Credit Agreement was subject to a commitment fee ranging from 0.3% to 0.375% per annum. The weighted average interest rate on borrowings outstanding under the Bank Credit Agreement was 2.3% and 1.9% as of December 31, 2015 and 2014, respectively. If our outstanding debt under the Bank Credit Agreement were to ever exceed the borrowing base, we would be required to repay the excess amount over a period not to exceed six months.
In order to provide more flexibility in managing our balance sheet, the credit extended by our lenders, and continuing compliance with maintenance financial covenants in this low oil price environment, we entered into the Second Amendment to the Bank Credit Agreement on February 17, 2016 (the “Second Amendment”). Specifically, the Second Amendment modifies certain maintenance financial covenants through December 31, 2017 as follows:
• | Increases our permitted ratio of senior secured debt to consolidated EBITDAX to a ratio of 3.0 to 1.0 (from a previous ratio of 2.5 to 1.0). |
• | Decreases our permitted ratio of consolidated EBITDAX to consolidated interest charges to a ratio of 1.25 to 1.0 (from a previous ratio of 2.25 to 1.0). |
Additionally, the Second Amendment provides for the following changes: (1) reduces our aggregate lender commitments from $1.6 billion to $1.5 billion, (2) increases the applicable margin for ABR Loans and LIBOR Loans by 75 basis points such that the margin for ABR Loans now ranges from 1% to 2% per annum and the margin for LIBOR Loans now ranges from 2% to 3% per annum, (3) increases the commitment fee rate to 0.50%, (4) provides for semi-annual scheduled redeterminations of the borrowing base in May and November of each year, (5) limits unrestricted cash and cash equivalents to $225 million if more than $250 million of borrowings are outstanding under the Bank Credit Agreement, and (6) limits repurchases of our senior subordinated notes to a cash amount of $225 million.
Throughout 2015 and as of December 31, 2015, we were in compliance with all debt covenants under the Bank Credit Agreement, including the following maintenance financial covenants:
• | a requirement to maintain a maximum permitted ratio of consolidated total net debt to consolidated EBITDAX (as defined in the Bank Credit Agreement) of DRI and its wholly-owned subsidiaries of not more than 4.25 to 1.0; and |
• | a requirement to maintain a current ratio, as determined under the Bank Credit Agreement, of not less than 1.0 to 1.0. |
84
For 2016, 2017 and 2018, pursuant to a first amendment to the Bank Credit Agreement executed in May 2015 (the “First Amendment”) and the Second Amendment discussed above, the first of these above financial covenants was modified, a second covenant was added, and the current ratio covenant remained unchanged. A summary of these covenant changes are as follows:
• | For 2016 and 2017, the maximum permitted ratio of consolidated total net debt to consolidated EBITDAX covenant has been suspended and replaced by a maximum permitted ratio of consolidated senior secured debt to consolidated EBITDAX covenant of 3.0 to 1.0. Currently, only debt under our Bank Credit Agreement is considered consolidated senior secured debt for purposes of this ratio. Beginning in the first quarter of 2018, the ratio of consolidated total net debt to consolidated EBITDAX covenant will be reinstated, utilizing an annualized EBITDAX amount for the first quarter of 2018 and building to a trailing four quarters by the end of 2018, with the maximum permitted ratios being 6.0 to 1.0 for the first quarter ended March 31, 2018, 5.5 to 1.0 for the second quarter ended June 30, 2018, and 5.0 to 1.0 for the third and fourth quarters ended September 30 and December 31, 2018, and returning to 4.25 to 1.0 for the first quarter ended March 31, 2019. |
• | For 2016 and 2017, a new covenant has been added to require a minimum permitted ratio of consolidated EBITDAX to consolidated interest charges of 1.25 to 1.0. |
The above description of our Bank Credit Agreement financial covenants and the changes provided for within the First Amendment and Second Amendment are qualified by the express language and defined terms contained in the Bank Credit Agreement, the First Amendment and Second Amendment, which are filed as exhibits to our periodic reports filed with the SEC.
Senior Subordinated Notes
6⅜% Senior Subordinated Notes due 2021. In February 2011, we issued $400 million of 6⅜% Notes. The 6⅜% Notes, which bear interest at a rate of 6.375% per annum, were sold at par. The 6⅜% Notes mature on August 15, 2021, and interest is payable on February 15 and August 15 of each year. We may redeem the 6⅜% Notes in whole or in part at our option beginning August 15, 2016, at a redemption price of 103.188% of the principal amount, and at declining redemption prices thereafter, as specified in the indenture. Prior to August 15, 2016, we may redeem 100% of the principal amount of the 6⅜% Notes at a price equal to 100% of the principal amount plus a “make-whole” premium and accrued and unpaid interest. The 6⅜% Notes are not subject to any sinking fund requirements.
5½% Senior Subordinated Notes due 2022. In April 2014, we issued $1.25 billion of 5½% Notes. The 5½% Notes, which bear interest at a rate of 5.5% per annum, were sold at par. The net proceeds, after issuance costs, of $1.23 billion were used to repurchase or redeem our outstanding 8¼% Senior Subordinated Notes due 2020 (the “8¼% Notes”), which were issued in 2010 (see 2014 Repurchase and Redemption of 8¼% Senior Subordinated Notes due 2020 below), and to pay down a portion of outstanding borrowings under our previous Bank Credit Agreement.
The 5½% Notes mature on May 1, 2022, and interest is payable on May 1 and November 1 of each year. We may redeem the 5½% Notes in whole or in part at our option beginning May 1, 2017, at a redemption price of 104.125% of the principal amount, and at declining redemption prices thereafter, as specified in the indenture. Prior to May 1, 2017, we may at our option redeem up to an aggregate of 35% of the principal amount of the 5½% Notes at a price of 105.5% of par with the proceeds of certain equity offerings. In addition, at any time prior to May 1, 2017, we may redeem 100% of the principal amount of the 5½% Notes at a price equal to 100% of the principal amounts plus a “make-whole” premium and accrued and unpaid interest. The 5½% Notes are not subject to any sinking fund requirements.
4⅝% Senior Subordinated Notes due 2023. In February 2013, we issued $1.2 billion of 4⅝% Notes. The 4⅝% Notes, which bear interest at a rate of 4.625% per annum, were sold at par. The net proceeds, after issuance costs, of $1.18 billion were used to repurchase or redeem our 9½% Senior Subordinated Notes due 2016 (the “9½% Notes”) and 9¾% Senior Subordinated Notes due 2016 (the “9¾% Notes”) (see 2013 Repurchase and Redemption of 9½% Notes and 9¾% Notes below) and to pay down a portion of outstanding borrowings under our previous Bank Credit Agreement.
The 4⅝% Notes mature on July 15, 2023, and interest is payable on January 15 and July 15 of each year. We may redeem the 4⅝% Notes in whole or in part at our option beginning January 15, 2018, at a redemption price of 102.313% of the principal amount, and at declining redemption prices thereafter, as specified in the indenture. In addition, at any time prior to January 15,
85
2018, we may redeem 100% of the principal amount of the 4⅝% Notes at a redemption price equal to 100% of the principal amount plus a “make-whole” premium and accrued and unpaid interest. The 4⅝% Notes are not subject to any sinking fund requirements.
Restrictive Covenants in Indentures for Senior Subordinated Notes. Each of the indentures for the 6⅜% Notes, 5½% Notes and 4⅝% Notes contains certain covenants that are generally consistent and that restrict our ability and the ability of our restricted subsidiaries to take or permit certain actions, including restrictions on our ability and the ability of our restricted subsidiaries to (1) incur additional debt; (2) make investments; (3) create liens on our assets or the assets of our restricted subsidiaries; (4) create restrictions on the ability of our restricted subsidiaries to pay dividends or make other payments to DRI or other restricted subsidiaries; (5) engage in transactions with our affiliates; (6) transfer or sell assets or subsidiary stock; (7) consolidate, merge or transfer all or substantially all of our assets and the assets of our restricted subsidiaries; and (8) make restricted payments (which includes paying dividends on our common stock or redeeming, repurchasing or retiring such stock or subordinated debt), provided that the restricted payments covenant in the indentures for the 5½% and 4⅝% Notes (the “5½% and 4⅝% Indentures”) permits us in certain circumstances to make unlimited restricted payments so long as we maintain a ratio of total debt to EBITDA (both as defined in the 5½% and 4⅝% Indentures) not to exceed 2.5 to 1.0 (both before and after giving effect to any restricted payment), although we will not be able to realize the practical benefit of the restricted payment covenant flexibility in the 5½% and 4⅝% Indentures until the 6⅜% Notes have been redeemed or retired. As of December 31, 2015, we were in compliance with all debt covenants under the indentures related to our senior subordinated notes.
2014 Repurchase and Redemption of 8¼% Senior Subordinated Notes due 2020. Pursuant to a cash tender, during 2014, we repurchased $996.3 million in principal of our 8¼% Notes. We recognized a $113.9 million loss associated with the debt repurchases during the second quarter of 2014, which loss consists of both premium payments made to repurchase or redeem the 8¼% Notes and the elimination of unamortized debt issuance costs related to these notes. The loss is included in our Consolidated Statements of Operations under the caption “Loss on early extinguishment of debt,” and premium payments made to repurchase the notes are classified as a financing cash outflow on our Consolidated Statements of Cash Flows under the caption “Premium paid on repayment of senior subordinated notes.”
2013 Repurchase and Redemption of 9½% Notes and 9¾% Notes. Pursuant to cash tender offers, during 2013, we repurchased $426.4 million in principal of our 9¾% Notes and $224.9 million in principal of our 9½% Notes. We recognized a $44.7 million loss during the year ended December 31, 2013, associated with the debt repurchases, consisting of both premium payments made to repurchase or redeem the 9½% Notes and 9¾% Notes and the elimination of unamortized debt issuance costs, discounts and premiums related to these notes. The loss is included in our Consolidated Statements of Operations under the caption “Loss on early extinguishment of debt,” and premium payments made to repurchase the notes are classified as a financing cash outflow on our Consolidated Statements of Cash Flows under the caption “Premium paid on repayment of senior subordinated notes.”
Pipeline Financings
In May 2008, we closed two transactions with Genesis Energy, L.P. (“Genesis”) involving two of our pipelines. The NEJD Pipeline system included a 20-year financing lease, and the Free State Pipeline included a long-term transportation service agreement. These transactions are both accounted for as financing leases.
Debt Issuance Costs
In connection with the issuance of our outstanding long-term debt, we have incurred debt issuance costs, which are being amortized to interest expense using the straight line or effective interest method over the term of each related facility or borrowing. Remaining unamortized debt issuance costs were $49.8 million and $57.3 million at December 31, 2015 and 2014, respectively. These balances are included in “Other assets” in our Consolidated Balance Sheets.
86
Indebtedness Repayment Schedule
At December 31, 2015, our indebtedness, including our capital and financing lease obligations but excluding the discount and premium on our senior subordinated debt, is payable over the next five years and thereafter as follows:
In thousands | ||||
2016 | $ | 32,481 | ||
2017 | 36,347 | |||
2018 | 32,074 | |||
2019 | 199,243 | |||
2020 | 15,051 | |||
Thereafter | 2,995,144 | |||
Total indebtedness | $ | 3,310,340 | ||
Note 5. Income Taxes
Our income tax provision (benefit) is as follows:
Year Ended December 31, | ||||||||||||
In thousands | 2015 | 2014 | 2013 | |||||||||
Current income tax expense (benefit) | ||||||||||||
Federal | $ | (8,515 | ) | $ | (42,500 | ) | $ | 393 | ||||
State | 160 | (407 | ) | 9,864 | ||||||||
Total current income tax expense (benefit) | (8,355 | ) | (42,907 | ) | 10,257 | |||||||
Deferred income tax expense (benefit) | ||||||||||||
Federal | (1,853,517 | ) | 400,544 | 222,559 | ||||||||
State | (78,662 | ) | 29,429 | (33 | ) | |||||||
Total deferred income tax expense (benefit) | (1,932,179 | ) | 429,973 | 222,526 | ||||||||
Total income tax expense (benefit) | $ | (1,940,534 | ) | $ | 387,066 | $ | 232,783 | |||||
At December 31, 2015, we had tax-effected federal net operating loss carryforwards (“NOLs”) totaling $52.6 million, state NOLs totaling $37.2 million, an estimated $48.9 million of enhanced oil recovery credits to carry forward related to our tertiary operations, an estimated $21.6 million of research and development credits, and $34.8 million of alternative minimum tax credits. Our state NOLs expire in various years, starting in 2020, although most do not begin to expire until 2033. Our enhanced oil recovery credits and research and development credits will begin to expire in 2023 and 2031, respectively.
At December 31, 2015, we had $15.7 million of excess tax benefits related to stock-based compensation that were not recorded as an increase to additional paid-in capital in the period that the stock award vested and/or was exercised. At the time these excess tax benefits reduce current taxes payable and, thus, are deemed to be realized by the Company, a corresponding increase to additional paid-in capital will be recognized.
Deferred income taxes reflect the available tax carryforwards and the temporary differences based on tax laws and statutory rates in effect at the December 31, 2015 and 2014 balance sheet dates. As of December 31, 2015, we had $34.5 million of deferred tax assets associated with State of Louisiana net operating losses. As the result of falling commodity prices, combined with a new tax law enacted in the State of Louisiana effective June 30, 2015, which limits a company’s utilization of certain deductions, including our net operating loss carryforwards, we recognized tax valuation allowances totaling $33.6 million during 2015 to reduce the carrying value of our deferred tax assets. The valuation allowances will remain until the realization of future deferred tax benefits are more likely than not to become utilized.
87
As of December 31, 2015, we had an unrecognized tax benefit of $5.4 million. The unrecognized tax benefit was recorded during 2015 as a direct reduction of the associated deferred tax asset and, if recognized, would not materially affect our annual effective tax rate. The tax benefit from an uncertain tax position will only be recognized if it is more likely than not that the tax position will be sustained upon examination by the taxing authorities, based upon the technical merits of the position. We currently do not expect a material change to the uncertain tax position within the next 12 months. Our policy is to recognize penalties and interest related to uncertain tax positions in income tax expense; however, no such amounts were accrued related to the uncertain tax position as of December 31, 2015. There were no unrecognized tax benefits as of December 31, 2014.
Significant components of our deferred tax assets and liabilities as of December 31, 2015 and 2014 are as follows:
December 31, | ||||||||
In thousands | 2015 | 2014 | ||||||
Deferred tax assets | ||||||||
Loss carryforwards – federal | $ | 52,580 | $ | 44,076 | ||||
Loss carryforwards – state | 37,175 | 43,270 | ||||||
Tax credit carryover | 34,837 | 34,837 | ||||||
Business credit carryforwards | 70,452 | 42,817 | ||||||
Stock-based compensation | 23,468 | 29,994 | ||||||
Other | 34,236 | 32,656 | ||||||
Valuation allowance | (33,600 | ) | — | |||||
Total deferred tax assets | 219,148 | 227,650 | ||||||
Deferred tax liabilities | ||||||||
Property and equipment | (1,004,330 | ) | (2,806,850 | ) | ||||
Derivative contracts | (50,081 | ) | (185,385 | ) | ||||
Other | (16,826 | ) | (11,984 | ) | ||||
Total deferred tax liabilities | (1,071,237 | ) | (3,004,219 | ) | ||||
Total net deferred tax liability | $ | (852,089 | ) | $ | (2,776,569 | ) | ||
Our reconciliation of income tax expense computed by applying the U.S. federal statutory rate and the reported effective tax rate on income from continuing operations is as follows:
Year Ended December 31, | ||||||||||||
In thousands | 2015 | 2014 | 2013 | |||||||||
Income tax provision (benefit) calculated using the federal statutory income tax rate | $ | (2,214,094 | ) | $ | 357,895 | $ | 224,833 | |||||
State income taxes, net of federal income tax benefit | (117,624 | ) | 25,368 | 13,518 | ||||||||
Impairment of goodwill with no related tax basis | 363,666 | — | — | |||||||||
Valuation allowance | 33,600 | — | — | |||||||||
Other | (6,082 | ) | 3,803 | (5,568 | ) | |||||||
Total income tax expense (benefit) | $ | (1,940,534 | ) | $ | 387,066 | $ | 232,783 | |||||
We file consolidated and separate income tax returns in the U.S. federal jurisdiction and in many state jurisdictions. The statutes of limitation for our income tax returns for tax years ending prior to 2011 have lapsed and therefore are not available for examination by respective taxing authorities. We have not paid any significant interest or penalties associated with our income taxes.
88
Note 6. Stockholders’ Equity
During the second quarter of 2015, we reduced the number of shares of our common stock reported as outstanding by 1,430,819 shares (approximately 0.4% of our outstanding shares at March 31, 2015). This reduction was the result of a correction to properly reflect the number of shares actually issued in the merger with Encore in March 2010. The stock and cash consideration originally issued and paid in the Encore merger was valued at $3.0 billion, which would have been reduced by $22.1 million for this share correction. As a result, we recorded adjustments to our Consolidated Balance Sheet to reflect a decrease in consideration paid in the Encore merger through a reduction of “Goodwill” ($22.1 million), offset by a reduction in an equal amount of the Company’s stockholders’ equity ($22.1 million). We determined that this correction in outstanding shares (1) had no impact on our results of operations for the year ending December 31, 2015, or for any prior period, and (2) was not material to our consolidated balance sheet, statement of cash flows, or basic or diluted earnings per common share for 2015, or for any prior period, and therefore we recorded the cumulative effect of correcting these items during 2015.
Dividends
In all four quarters of 2014 and in each of the first three quarters of 2015, the Company’s Board of Directors declared quarterly cash dividends of $0.0625 per common share. On September 21, 2015, in light of the continuing low oil price environment and our desire to maintain our financial strength and flexibility, the Company’s Board of Directors suspended our quarterly cash dividend effective after payment of our third quarter dividend on September 29, 2015. By suspending the dividend, we will free up cash which can be directed to other uses. Dividends totaling $65.4 million and $87.0 million were paid to stockholders during the years ending December 2015 and 2014, respectively.
Stock Repurchase Program
In October 2011, we commenced a common share repurchase program, which has been approved for up to an aggregate of $1.162 billion of Denbury common shares by the Company’s Board of Directors. The program has no pre-established ending date and may be suspended or discontinued at any time. In September 2015, the Company’s Board of Directors reinstated the ability to repurchase shares under our share repurchase program, which authorization was suspended in November of 2014. Our share repurchases are based on various parameters including, but not limited to, the price of our common stock, oil prices, free cash flow, our leverage or other funding sources available to us. We are not obligated to repurchase any dollar amount or specific number of shares of our common stock under the program.
The following table presents a summary of repurchases under our share repurchase program:
Total Repurchases Since Inception | Year Ended December 31, | |||||||||||||||
In thousands, except per-share data | 2015 | 2014 | 2013 | |||||||||||||
Total amount repurchased | $ | 951,780 | $ | 11,759 | $ | 200,369 | $ | 277,768 | ||||||||
Weighted average price per share | $ | 14.78 | $ | 2.66 | $ | 16.16 | $ | 16.87 | ||||||||
Denbury common stock repurchased (shares) | 64,382 | 4,425 | 12,398 | 16,469 | ||||||||||||
As of December 31, 2015, an additional $210.1 million remains authorized for purchases of common stock under this repurchase program. We account for treasury stock using the cost method and include treasury stock as a component of stockholders’ equity.
Retirement of Treasury Stock
During the year ended December 31, 2015, we retired 60.0 million shares of existing treasury stock, with a carrying value of $884.1 million, acquired principally through our stock repurchase program. These retired shares are now included in the pool of authorized but unissued shares. Our accounting policy upon the retirement of treasury stock is to deduct its par value from common stock and reduce additional paid-in capital by the excess amount of treasury stock retired.
Employee Stock Purchase Plan
We previously provided for an Employee Stock Purchase Plan (the “Plan”) in which eligible employees could contribute up to 10% of their base salary, and we matched 75% of their contribution. The combined funds were used to purchase previously
89
unissued Denbury common stock or treasury stock that we purchased in the open market for that purpose, in either case, based on the market value of our common stock at the end of each quarter. The Plan was terminated, effective at the end of the offering period ended on March 31, 2015, as all of the previously authorized shares reserved for issuance under the Plan had been issued. We recognize compensation expense for the Company match portion, which totaled $1.1 million, $7.0 million and $6.5 million for the years ended December 31, 2015, 2014 and 2013, respectively. This plan was administered by the Compensation Committee of our Board of Directors.
401(k) Plan
We offer a 401(k) plan to which employees may contribute tax-deferred earnings subject to IRS limitations. We match 100% of an employee’s contribution, up to 6% of compensation, as defined by the plan, which is vested immediately. During 2015, 2014 and 2013, our matching contributions to the 401(k) plan were approximately $10.1 million, $9.9 million and $9.0 million, respectively.
Note 7. Stock Compensation
The Amended and Restated 2004 Omnibus Stock and Incentive Plan, amended and restated as of May 19, 2015 (the “2004 Plan”), is an incentive plan that provides for the issuance of incentive and non-qualified stock options, restricted stock awards, restricted stock units, SARs settled in stock, and performance-based awards to officers, employees, directors and consultants. Awards covering a total of 37.5 million shares of common stock have been authorized for issuance pursuant to the 2004 Plan. The 2004 Plan was last approved by our stockholders in May 2015 and will expire in May 2025. As of December 31, 2015, 7.3 million shares were available under the 2004 Plan for future issuance of awards, all of which could be issued in the form of restricted stock or performance-based awards. Our incentive compensation program is administered by the Compensation Committee of our Board of Directors.
Stock-based compensation expense associated with our field employees is included in “Lease operating expenses,” while such expense associated with non-field employees is included in “General and administrative expenses” in the Consolidated Statements of Operations. Stock-based compensation associated with our employees involved in exploration and drilling activities is capitalized as part of “Oil and natural gas properties” in the Consolidated Balance Sheets.
Stock-based compensation costs for the years ended December 31, 2015, 2014 and 2013, are as follows:
Year Ended December 31, | ||||||||||||
In thousands | 2015 | 2014 | 2013 | |||||||||
Stock-based compensation expensed | ||||||||||||
General and administrative expenses | $ | 27,995 | $ | 27,789 | $ | 30,429 | ||||||
Lease operating expenses | 2,609 | 2,724 | 2,574 | |||||||||
Total stock-based compensation expensed | 30,604 | 30,513 | 33,003 | |||||||||
Stock-based compensation capitalized | 8,681 | 9,019 | 9,088 | |||||||||
Total cost of stock-based compensation arrangements | $ | 39,285 | $ | 39,532 | $ | 42,091 | ||||||
Income tax benefit recognized for stock-based compensation arrangements | $ | 11,630 | $ | 11,595 | $ | 12,541 | ||||||
Stock Options and SARs
Prior to January 1, 2006, we granted incentive and non-qualified stock options to our employees. Effective January 1, 2006, we completely replaced the use of stock options for employees with SARs settled in stock, as SARs are less dilutive to our stockholders while providing an employee with essentially the same economic benefits as stock options. As of December 31, 2015, we also discontinued the issuance of SARs.
The stock options and SARs generally become exercisable over a three- or four-year vesting period, with the specific terms of vesting determined at the time of grant based on guidelines established by the Compensation Committee of the Board of
90
Directors. The stock options and SARs expire over terms not to exceed 10 years from the date of grant, 90 days after termination of employment, 90 days or one year after permanent disability, depending on the plan, or one year after the death of the optionee. As of December 31, 2015, all outstanding options had expired. The stock options and SARs were granted with a strike price equal to the fair market value at the time of grant, which is defined in the 2004 Plan as the closing price on the NYSE on the date of grant.
The fair value of each SAR award is estimated on the date of grant using the Black-Scholes option pricing model with the assumptions noted in the following table. The risk-free rate for periods within the contractual life of the SAR is based on the U.S. Treasury yield curve in effect at the time of grant. The expected life of SARs granted was derived from examination of our historical SAR grants and subsequent exercises. The contractual terms (cliff vesting and graded vesting) are evaluated separately for the expected life, as the exercise behavior for each is different. Expected volatilities are based on the historical volatility of our common stock.
Year Ended December 31, | ||||||||||||
2015 | 2014 | 2013 | ||||||||||
Weighted average fair value of SARs granted | $ | 1.77 | $ | 3.55 | $ | 6.72 | ||||||
Risk-free interest rate | 1.29 | % | 1.31 | % | 0.67 | % | ||||||
Expected life | 4.0 years | 3.8 to 4.0 years | 3.6 to 4.8 years | |||||||||
Expected volatility | 39.4 | % | 38.0 | % | 50.4 | % | ||||||
Dividend yield | 3.42 | % | 3.10 | % | — | % | ||||||
The following is a summary of our stock option and SAR activity:
Number of Awards | Weighted Average Exercise Price | Weighted Average Remaining Contractual Life (in years) | Aggregate Intrinsic Value (in thousands) | ||||||||||
Outstanding at December 31, 2014 | 7,468,733 | $ | 16.90 | ||||||||||
Granted | 3,509,159 | 7.30 | |||||||||||
Exercised | (74,660 | ) | 7.58 | ||||||||||
Forfeited | (599,256 | ) | 9.74 | ||||||||||
Expired | (1,400,462 | ) | 16.37 | ||||||||||
Outstanding at December 31, 2015 | 8,903,514 | 13.76 | 3.3 | $ | — | ||||||||
Exercisable at end of period | 5,214,820 | $ | 17.40 | 1.5 | $ | — | |||||||
The following is a summary of the total intrinsic value of stock options and SARs exercised and grant-date fair value of stock options and SARs vested:
Year Ended December 31, | ||||||||||||
In thousands | 2015 | 2014 | 2013 | |||||||||
Intrinsic value of stock options and SARs exercised | $ | 60 | $ | 7,985 | $ | 17,287 | ||||||
Grant-date fair value of stock options and SARs vested | 6,534 | 9,998 | 12,852 | |||||||||
91
As of December 31, 2015, there was $3.8 million of total compensation cost to be recognized in future periods related to nonvested share-based SAR compensation arrangements. The cost is expected to be recognized over a weighted-average period of 1.9 years. The following is a summary of cash received from stock option exercises under share-based payment arrangements and tax benefits realized from the exercises of stock options and SARs:
Year Ended December 31, | ||||||||||||
In thousands | 2015 | 2014 | 2013 | |||||||||
Cash received from stock option exercises | $ | 562 | $ | 7,022 | $ | 5,487 | ||||||
Tax benefit realized for the exercises of stock options and SARs | — | 212 | 437 | |||||||||
Restricted Stock
We grant non-performance-based restricted stock to new employees during the year as part of their new hire compensation packages, and annually we grant restricted stock awards to employees and directors as part of our long-term compensation program. Holders of non-performance-based restricted stock awards have the rights and privileges of owning the shares (including voting rights) except that the holders are not entitled to delivery of a portion thereof until certain requirements are met. Beginning in 2014, non-performance-based restricted stock awards granted by the Company provide the holders with forfeitable dividend rights until the award vests. Non-performance-based restricted stock awards vest over three- to four-year vesting periods, with the specific terms of vesting determined at the time of grant.
As of December 31, 2015, there was $22.3 million of unrecognized compensation expense related to nonvested non-performance-based restricted stock grants. This unrecognized compensation cost is expected to be recognized over a weighted-average period of 1.9 years. The following is a summary of the total vesting date fair value of non-performance-based restricted stock:
Year Ended December 31, | ||||||||||||
In thousands | 2015 | 2014 | 2013 | |||||||||
Fair value of restricted stock vested | $ | 12,549 | $ | 24,780 | $ | 21,529 | ||||||
A summary of the status of our nonvested non-performance-based restricted stock grants issued, and the changes during the year ended December 31, 2015, is presented below:
Number of Shares | Weighted Average Grant-Date Fair Value | ||||||
Nonvested at December 31, 2014 | 3,739,034 | $ | 16.17 | ||||
Granted | 4,441,936 | 6.73 | |||||
Vested | (1,718,669 | ) | 16.67 | ||||
Forfeited | (872,614 | ) | 11.30 | ||||
Nonvested at December 31, 2015 | 5,589,687 | 9.27 | |||||
Performance-Based Equity Awards
Annually, the Compensation Committee of the Board of Directors grants performance-based equity awards to officers of Denbury. These performance-based awards generally vest over 1.25 to 3.25 years, and the number of performance-based shares earned (and eligible to vest) during the performance period will depend upon two sets of factors: (1) our level of success in achieving specifically identified performance targets (“Performance-Based Operational Awards”) and (2) performance of our stock relative to that of a designated peer group (“Performance-Based TSR Awards”). Generally, one-half of the maximum number of shares that could be earned under the performance-based awards will be earned for performance at the designated target levels (100% target vesting levels) or upon any earlier change of control, and twice the target number of shares will be earned if the maximum target levels are met. If performance is below the designated minimum levels for all performance targets, no performance-based shares will be earned. Performance-Based Operational Awards are valued using the fair market value of Denbury stock on the grant date, and Performance-Based TSR Awards are valued using a Monte Carlo simulation.
92
During 2015 and 2014, we granted Performance-Based Operational Awards and Performance-Based TSR Awards to our officers. As of December 31, 2015, there was $5.1 million of unrecognized compensation expense related to nonvested performance-based equity awards. This unrecognized compensation cost is expected to be recognized over a weighted-average period of 1.3 years. The range of assumptions used in the Monte Carlo simulation valuation approach for Performance-Based TSR Awards (presented at the target level) are as follows:
Year Ended December 31, | ||||||||||||
2015 | 2014 | 2013 | ||||||||||
Weighted average fair value of Performance-Based TSR Awards granted | $ | 7.59 | $ | 19.81 | $ | 20.08 | ||||||
Risk-free interest rate | 0.96 | % | 0.80 | % | 0.41 | % | ||||||
Expected life | 3.0 years | 3.0 years | 3.0 years | |||||||||
Expected volatility | 33.6 | % | 39.4 | % | 42.3 | % | ||||||
Dividend yield | 3.42 | % | 2.50 | % | — | % | ||||||
A summary of the status of the nonvested performance-based equity awards (presented at the target level) during the year ended December 31, 2015, is as follows:
Performance-Based Operational Awards | Performance-Based TSR Awards | |||||||||||||
Number of Awards | Weighted Average Grant-Date Fair Value | Number of Awards | Weighted Average Grant-Date Fair Value | |||||||||||
Nonvested at December 31, 2014 | 451,398 | $ | 16.65 | 533,611 | $ | 20.66 | ||||||||
Granted (1) | 519,279 | 7.31 | 519,279 | 7.59 | ||||||||||
Vested (2) | (280,575 | ) | 7.73 | (82,213 | ) | 7.29 | ||||||||
Forfeited | (130,842 | ) | 10.79 | (202,122 | ) | 14.98 | ||||||||
Nonvested at December 31, 2015 | 559,260 | 13.82 | 768,555 | 14.75 | ||||||||||
(1) | Amounts granted reflect the number of performance units granted. The actual payout of the shares may be between 0% and 200% of the performance units granted. |
(2) | During 2015, the service period lapsed on these performance unit awards. The lapsed units earned a weighted average of 135% and 50% of target for each vested performance-based operational and TSR award, respectively, representing 413,232 aggregate shares of common stock issued. |
The following is a summary of the total vesting date fair value of performance-based equity awards:
Year Ended December 31, | ||||||||||||
In thousands | 2015 | 2014 | 2013 | |||||||||
Vesting date fair value of Performance-Based Operational Awards | $ | 2,861 | $ | — | $ | 2,541 | ||||||
Vesting date fair value of Performance-Based TSR Awards | 300 | — | — | |||||||||
Note 8. Commodity Derivative Contracts
We do not apply hedge accounting treatment to our oil and natural gas derivative contracts; therefore, the changes in the fair values of these instruments are recognized in income in the period of change. These fair value changes, along with the settlements of expired contracts, are shown under “Commodity derivatives expense (income)” in our Consolidated Statements of Operations.
Historically, we have entered into various oil and natural gas derivative contracts to provide an economic hedge of our exposure to commodity price risk associated with anticipated future oil and natural gas production and to provide more certainty to our future cash flows. We do not hold or issue derivative financial instruments for trading purposes. Generally, these contracts have consisted of various combinations of price floors, collars, three-way collars, fixed-price swaps and fixed-price swaps enhanced
93
with a sold put. The production that we hedge has varied from year to year depending on our levels of debt, financial strength and expectation of future commodity prices. Prior to 2015, we have generally hedged a substantial portion of our forecasted production over an approximately 18 month to two year future period, as we believed it was beneficial to protect our future cash flows at then-projected oil prices for those future periods. We previously deferred entering into new derivative contracts due to the significant and rapid decline in oil prices. However, we have recently begun hedging limited production levels in the second half of 2016 to provide more certainty and protect our cash costs.
We manage and control market and counterparty credit risk through established internal control procedures that are reviewed on an ongoing basis. We attempt to minimize credit risk exposure to counterparties through formal credit policies, monitoring procedures and diversification, and all of our commodity derivative contracts are with parties that are lenders under our Bank Credit Agreement (or affiliates of such lenders). As of December 31, 2015, all of our outstanding derivative contracts were subject to enforceable master netting arrangements whereby payables on those contracts can be offset against receivables from separate derivative contracts with the same counterparty. It is our policy to classify derivative assets and liabilities on a gross basis on our balance sheets, even if the contracts are subject to enforceable master netting arrangements.
The following table summarizes our commodity derivative contracts as of December 31, 2015, none of which are classified as hedging instruments in accordance with the FASC Derivatives and Hedging topic:
Months | Index Price | Volume (Barrels per day) | Contract Prices ($/Bbl) | ||||||||||||||||||||||||
Range (1) | Weighted Average Price | ||||||||||||||||||||||||||
Swap | Sold Put | Floor | Ceiling | ||||||||||||||||||||||||
Oil Contracts: | |||||||||||||||||||||||||||
2016 Enhanced Swaps (2) | |||||||||||||||||||||||||||
Jan – Mar | NYMEX | 12,000 | $ | 90.65 | – | 93.35 | $ | 92.43 | $ | 68.00 | $ | — | $ | — | |||||||||||||
Jan – Mar | LLS | 8,000 | 93.70 | – | 95.45 | 94.81 | 68.50 | — | — | ||||||||||||||||||
Apr – June | NYMEX | 2,000 | 90.35 | – | 90.35 | 90.35 | 68.00 | — | — | ||||||||||||||||||
Apr – June | LLS | 6,000 | 93.30 | – | 93.50 | 93.38 | 70.00 | — | — | ||||||||||||||||||
2016 Fixed Price Swaps | |||||||||||||||||||||||||||
Apr – June | NYMEX | 11,500 | $ | 60.30 | – | 63.75 | $ | 61.84 | $ | — | $ | — | $ | — | |||||||||||||
Apr – June | LLS | 3,500 | 64.20 | – | 66.15 | 64.99 | — | — | — | ||||||||||||||||||
2016 Three-Way Collars (3) | |||||||||||||||||||||||||||
Jan – Mar | NYMEX | 10,000 | $ | 85.00 | – | 101.25 | $ | — | $ | 68.00 | $ | 85.00 | $ | 99.85 | |||||||||||||
Jan – Mar | LLS | 6,000 | 88.00 | – | 103.15 | — | 68.00 | 88.00 | 102.10 | ||||||||||||||||||
Apr – June | NYMEX | 2,000 | 85.00 | – | 95.50 | — | 68.00 | 85.00 | 95.50 | ||||||||||||||||||
Apr – June | LLS | 2,000 | 88.00 | – | 98.25 | — | 70.00 | 88.00 | 98.25 | ||||||||||||||||||
2016 Collars | |||||||||||||||||||||||||||
Apr – June | NYMEX | 5,000 | $ | 55.00 | – | 72.25 | $ | — | $ | — | $ | 55.00 | $ | 71.01 | |||||||||||||
Apr – June | LLS | 2,000 | 58.00 | – | 73.00 | — | — | 58.00 | 73.00 | ||||||||||||||||||
July – Sept | NYMEX | 4,500 | 55.00 | – | 72.65 | — | — | 55.00 | 71.22 | ||||||||||||||||||
July – Sept | LLS | 3,000 | 58.00 | – | 74.30 | — | — | 58.00 | 73.85 | ||||||||||||||||||
(1) | Ranges presented for fixed-price swaps and enhanced swaps represent the lowest and highest fixed prices of all open contracts for the period presented. For collars and three-way collars, ranges represent the lowest floor price and highest ceiling price for all open contracts for the period presented. |
(2) | An enhanced swap is a fixed-price swap contract combined with a sold put feature (at a lower price) with the same counterparty. The value associated with the sold put is used to increase or enhance the fixed price of the swap. At the contract settlement date, (1) if the index price is higher than the swap price, we pay the counterparty the difference between the index price and swap price for the contracted volumes, (2) if the index price is lower than the swap price but at or above the sold put price, the counterparty pays us the difference between the index price and the swap price for the contracted volumes, and (3) if the |
94
index price is lower than the sold put price, the counterparty pays us the difference between the swap price and the sold put price for the contracted volumes.
(3) | A three-way collar is a costless collar contract combined with a sold put feature (at a lower price) with the same counterparty. The value received for the sold put is used to enhance the contracted floor and ceiling price of the related collar. At the contract settlement date, (1) if the index price is higher than the ceiling price, we pay the counterparty the difference between the index price and ceiling price for the contracted volumes, (2) if the index price is between the floor and ceiling price, no settlements occur, (3) if the index price is lower than the floor price but at or above the sold put price, the counterparty pays us the difference between the index price and the floor price for the contracted volumes and (4) if the index price is lower than the sold put price, the counterparty pays us the difference between the floor price and the sold put price for the contracted volumes. |
Note 9. Fair Value Measurements
The FASC Fair Value Measurement topic defines fair value as the price that would be received to sell an asset or paid to transfer a liability in an orderly transaction between market participants at the measurement date (often referred to as the “exit price”). We utilize market data or assumptions that market participants would use in pricing the asset or liability, including assumptions about risk and the risks inherent in the inputs to the valuation technique. These inputs can be readily observable, market corroborated or generally unobservable. We primarily apply the income approach for recurring fair value measurements and endeavor to utilize the best available information. Accordingly, we utilize valuation techniques that maximize the use of observable inputs and minimize the use of unobservable inputs. We are able to classify fair value balances based on the observability of those inputs. The FASC establishes a fair value hierarchy that prioritizes the inputs used to measure fair value. The hierarchy gives the highest priority to unadjusted quoted prices in active markets for identical assets or liabilities (Level 1 measurement) and the lowest priority to unobservable inputs (Level 3 measurement). The three levels of the fair value hierarchy are as follows:
• | Level 1 – Quoted prices in active markets for identical assets or liabilities as of the reporting date. |
• | Level 2 – Pricing inputs are other than quoted prices in active markets included in Level 1, which are either directly or indirectly observable as of the reported date. Level 2 includes those financial instruments that are valued using models or other valuation methodologies. Instruments in this category include non-exchange-traded oil and natural gas derivatives that are based on NYMEX pricing and fixed-price swaps that are based on regional pricing other than NYMEX (e.g., Light Louisiana Sweet). The fixed-price swap features of our enhanced swaps are valued using a discounted cash flow model based upon forward commodity price curves. Our costless collars and the sold put features of our enhanced oil swaps and three-way collars are valued using the Black-Scholes model, an industry standard option valuation model that takes into account inputs such as contractual prices for the underlying instruments, maturity, quoted forward prices for commodities, interest rates, volatility factors and credit worthiness, as well as other relevant economic measures. Substantially all of these assumptions are observable in the marketplace throughout the full term of the instrument, can be derived from observable data or are supported by observable levels at which transactions are executed in the marketplace. |
• | Level 3 – Pricing inputs include significant inputs that are generally less observable. These inputs may be used with internally developed methodologies that result in management’s best estimate of fair value. At December 31, 2015, instruments in this category include non-exchange-traded enhanced swaps, costless collars and three-way collars that are based on regional pricing other than NYMEX (e.g., Light Louisiana Sweet). The valuation models utilized for enhanced swaps, costless collars and three-way collars are consistent with the methodologies described above; however, the implied volatilities utilized in the valuation of Level 3 instruments are developed using a benchmark, which is considered a significant unobservable input. An increase or decrease of 100 basis points in the implied volatility inputs utilized in our fair value measurement would result in a change of approximately $12 thousand in the fair value of these instruments as of December 31, 2015. |
We adjust the valuations from the valuation model for nonperformance risk, using our estimate of the counterparty’s credit quality for asset positions and our credit quality for liability positions. We use multiple sources of third-party credit data in determining counterparty nonperformance risk, including credit default swaps.
95
The following table sets forth by level within the fair value hierarchy our financial assets and liabilities that were accounted for at fair value on a recurring basis as of December 31, 2015 and 2014:
Fair Value Measurements Using: | ||||||||||||||||
Quoted Prices in Active Markets | Significant Other Observable Inputs | Significant Unobservable Inputs | ||||||||||||||
In thousands | (Level 1) | (Level 2) | (Level 3) | Total | ||||||||||||
December 31, 2015 | ||||||||||||||||
Assets | ||||||||||||||||
Oil derivative contracts – current | $ | — | $ | 90,012 | $ | 52,834 | $ | 142,846 | ||||||||
Total Assets | $ | — | $ | 90,012 | $ | 52,834 | $ | 142,846 | ||||||||
December 31, 2014 | ||||||||||||||||
Assets | ||||||||||||||||
Oil and natural gas derivative contracts – current | $ | — | $ | 283,238 | $ | 157,121 | $ | 440,359 | ||||||||
Oil and natural gas derivative contracts – long-term | — | 34,862 | 31,325 | 66,187 | ||||||||||||
Total Assets | $ | — | $ | 318,100 | $ | 188,446 | $ | 506,546 | ||||||||
Since we do not apply hedge accounting for our commodity derivative contracts, any gains and losses on our assets and liabilities are included in “Commodity derivatives expense (income)” in the accompanying Consolidated Statements of Operations.
Level 3 Fair Value Measurements
The following table summarizes the changes in the fair value of our Level 3 assets and liabilities for the years ended December 31, 2015 and 2014:
Year Ended December 31, | ||||||||
In thousands | 2015 | 2014 | ||||||
Fair value of Level 3 instruments, beginning of year | $ | 188,446 | $ | 6,709 | ||||
Fair value adjustments on commodity derivatives | 43,378 | 181,737 | ||||||
Receipt on settlements of commodity derivatives | (178,990 | ) | — | |||||
Fair value of Level 3 instruments, end of year | $ | 52,834 | $ | 188,446 | ||||
The amount of total gains for the period included in earnings attributable to the change in unrealized gains relating to assets still held at the reporting date | $ | 21,509 | $ | 181,737 | ||||
We utilize an income approach to value our Level 3 enhanced swaps, costless collars and three-way collars. We obtain and ensure the appropriateness of the significant inputs to the calculation, including contractual prices for the underlying instruments, maturity, forward prices for commodities, interest rates, volatility factors and credit worthiness, and the fair value estimate is prepared and reviewed on a quarterly basis. The following table details fair value inputs related to implied volatilities utilized in the valuation of our Level 3 oil derivative contracts:
Fair Value at 12/31/2015 (in thousands) | Valuation Technique | Unobservable Input | Range | |||||||
Oil derivative contracts | $ | 52,834 | Discounted cash flow / Black-Scholes | Volatility of Light Louisiana Sweet for settlement periods beginning after December 31, 2015 | 33.0% – 43.4% | |||||
96
Assets and Liabilities Measured at Fair Value on a Nonrecurring Basis
During the third quarter of 2015, we recorded a goodwill impairment charge of $1.3 billion to fully impair the carrying value of our goodwill. Refer to Note 1, Significant Accounting Policies – Goodwill and Other Intangible Assets for further information.
Other Fair Value Measurements
The carrying value of our loans under our Bank Credit Agreement approximate fair value, as they are subject to short-term floating interest rates that approximate the rates available to us for those periods. We use a market approach to determine fair value of our fixed-rate long-term debt using observable market data. The fair values of our senior subordinated notes are based on quoted market prices. The estimated fair value of our debt as of December 31, 2015 and 2014, excluding pipeline financing and capital lease obligations, was $1,119.0 million and $2,938.6 million, respectively. We have other financial instruments consisting primarily of cash, cash equivalents, short-term receivables and payables that approximate fair value due to the nature of the instrument and the relatively short maturities.
Note 10. Commitments and Contingencies
Leases
We lease office space, equipment and vehicles that have non-cancelable lease terms. Currently, our outstanding leases have terms up to 10 years. We have subleased part of the office space included in our operating leases for which we received rental payments. The following table summarizes operating lease payments paid and sublease rentals received during the periods indicated:
Year Ended December 31, | ||||||||||||
In thousands | 2015 | 2014 | 2013 | |||||||||
Operating lease payments | $ | 29,403 | $ | 43,333 | $ | 37,211 | ||||||
Sublease rental receipts | 3,698 | 2,347 | 2,237 | |||||||||
The following tables summarize by year the remaining non-cancelable future payments under our leases as of December 31, 2015:
In thousands | Pipeline and Capital Leases | |||
2016 | $ | 54,106 | ||
2017 | 53,322 | |||
2018 | 49,595 | |||
2019 | 40,229 | |||
2020 | 29,821 | |||
Thereafter | 211,255 | |||
Total minimum lease payments | 438,328 | |||
Less: Amount representing interest | (155,238 | ) | ||
Present value of minimum lease payments | $ | 283,090 | ||
97
In thousands | Operating Leases | |||
2016 | $ | 12,639 | ||
2017 | 10,914 | |||
2018 | 10,845 | |||
2019 | 10,099 | |||
2020 | 9,250 | |||
Thereafter | 47,380 | |||
Total minimum lease payments | $ | 101,127 | ||
In addition, we expect to receive approximately $8.8 million for 2016 through 2019 under our sublease agreements.
Commitments
We have entered into long-term commitments to purchase CO2 that are either non-cancelable or cancelable only upon the occurrence of specified future events. The commitments continue for up to 16 years. The price we will pay for CO2 generally varies depending on the amount of CO2 delivered and the price of oil. Once all commitments have commenced (currently expected in 2016), our annual commitment under these contracts could range from $38 million to $56 million per year, assuming a $50 per Bbl NYMEX oil price.
We are party to long-term contracts that require us to deliver CO2 to our industrial CO2 customers at various contracted prices, plus we have a CO2 delivery obligation to Genesis related to two CO2 volumetric production payments (“VPPs”). Based upon the maximum amounts deliverable as stated in the industrial contracts and the VPPs, we estimate that we may be obligated to deliver up to 121 Bcf of CO2 to these customers over the next 8 years. The maximum volume required in any given year is approximately 106 MMcf/d, which we judge to be minor given the size of our Jackson Dome proved CO2 reserves at December 31, 2015, our current production capabilities and our projected levels of CO2 usage for our own tertiary flooding program.
In conjunction with the August 2011 Riley Ridge acquisition, we assumed the 20-year helium supply contract under which the original participants in Riley Ridge agreed to supply helium to a third-party purchaser. After the commencement date, the contract provides for the delivery of a minimum contracted quantity of helium, subject to adjustment after startup of the Riley Ridge gas processing facility, which, if not supplied in accordance with the terms of the contract, may obligate us to compensate the third-party helium purchaser for the amount of the shortfall in an amount not to exceed $8.0 million per year, or $46.0 million over the term of the contract.
Litigation
We are involved in various lawsuits, claims and regulatory proceedings incidental to our businesses. While we currently believe that the ultimate outcome of these proceedings, individually and in the aggregate, will not have a material adverse effect on our financial position, results of operations or cash flows, litigation is subject to inherent uncertainties. Although a single or multiple adverse rulings or settlements could possibly have a material adverse effect on our finances, we only accrue for losses from litigation and claims if we determine that a loss is probable and the amount can be reasonably estimated.
Delhi Field Release
In June 2013, a release of well fluids, consisting of a mixture of carbon dioxide, saltwater, natural gas and oil, was discovered (and reported) within an area of the Denbury-operated Delhi Field located in northern Louisiana. Our remediation efforts with respect to such release were completed during the fourth quarter of 2013; however, we continue to monitor the impacted area to confirm the effectiveness of the remediation efforts. Virtually all of our total recorded cost of $130.8 million has been incurred.
We maintain insurance policies to cover certain costs, damages and claims related to releases of well fluids and remediation. We received a $25.0 million cost reimbursement in October 2014 related to the Delhi Field release and remediation from our insurance carrier providing the first layer of our excess liability insurance coverage, and an additional $4.5 million cost
98
reimbursement in August 2015 from our insurance carrier providing well control coverage. The insurance reimbursements were recognized as a reduction to lease operating expenses in our Consolidated Statements of Operations for the years ended December 31, 2015 and 2014. We have not reached any agreement with our remaining carriers as to further reimbursements, but given our belief that under our policies we are entitled to reimbursement of between approximately one-third and two-thirds of our total costs, we have filed suit to pursue further reimbursements, the ultimate outcome of which cannot be predicted.
In March 2015, Evolution Petroleum Company (“Evolution”), the parent of the entity which sold Denbury Onshore, LLC (“Denbury Onshore”) its original interest in Delhi Field, filed an amended petition in a lawsuit which has been pending in the Texas district court in Houston since December 2013. Originally, that lawsuit involved ongoing disputes between Denbury Onshore and Evolution regarding the terms of the purchase documents under which Denbury Onshore bought its original Delhi Field interest, including disputes regarding allocation of costs in determining “payout” as defined in the agreements, and the extent and terms of assignment of reversionary interests in the unit back to Evolution following payout, along with related contractual terms. The amended petition added allegations of negligence and gross negligence against Denbury Onshore in connection with the June 2013 Delhi Field release, and for the first time estimated its damages attributable to its allegations in the case as exceeding $200 million. The amended petition also adds a claim for unspecified punitive damages. There has only been limited discovery in the case to date, and Evolution has not specified the basis for the amount of its claimed damages estimate. The case is currently set for trial in April 2016. We believe Evolution’s claims with respect to this matter are without merit and intend to vigorously defend against them and pursue our rights under the purchase documents.
Other Contingencies
We are subject to audits for various taxes (income, sales and use, and severance) in the various states in which we operate, and from time to time receive assessments for potential taxes that we may owe. In the past, settlement of these matters has not had a material adverse financial impact on us, and currently we have no material assessments for potential taxes.
We are subject to various possible contingencies that arise primarily from interpretation of federal and state laws and regulations affecting the oil and natural gas industry. Such contingencies include differing interpretations as to the prices at which oil and natural gas sales may be made, the prices at which royalty owners may be paid for production from their leases, environmental issues and other matters. Although we believe that we have complied with the various laws and regulations, administrative rulings and interpretations thereof, adjustments could be required as new interpretations and regulations are issued. In addition, production rates, marketing and environmental matters are subject to regulation by various federal and state agencies.
Note 11. Additional Balance Sheet Details
Trade and Other Receivables, Net
December 31, | ||||||||
In thousands | 2015 | 2014 | ||||||
Trade accounts receivable, net | $ | 40,146 | $ | 45,407 | ||||
Commodity derivatives settlement receivables | 25,994 | 59,755 | ||||||
Federal income tax receivable, net | — | 37,652 | ||||||
Other receivables | 20,953 | 14,141 | ||||||
Total | $ | 87,093 | $ | 156,955 | ||||
Allowance for Doubtful Accounts
We record an allowance for doubtful accounts for receivables that we estimate to be uncollectible. The allowance for doubtful accounts, which is netted against “Trade and other receivables” on the Consolidated Balance Sheets, was $0.3 million and $0.4 million at December 31, 2015 and 2014, respectively.
99
Accounts Payable and Accrued Liabilities
December 31, | ||||||||
In thousands | 2015 | 2014 | ||||||
Accrued interest | $ | 48,908 | $ | 48,255 | ||||
Accrued compensation | 46,780 | 62,513 | ||||||
Accrued lease operating expenses | 37,549 | 56,798 | ||||||
Taxes payable | 32,438 | 39,816 | ||||||
Accounts payable | 30,477 | 64,604 | ||||||
Accrued exploration and development costs | 20,892 | 90,939 | ||||||
Other | 36,153 | 31,833 | ||||||
Total | $ | 253,197 | $ | 394,758 | ||||
Note 12. Supplemental Cash Flow Information
Supplemental Cash Flow Information
Year Ended December 31, | ||||||||||||
In thousands | 2015 | 2014 | 2013 | |||||||||
Supplemental cash flow information | ||||||||||||
Cash paid for interest, expensed | $ | 146,560 | $ | 185,140 | $ | 117,442 | ||||||
Cash paid for interest, capitalized | 32,146 | 24,202 | 79,253 | |||||||||
Cash paid for income taxes | 6,340 | 5,033 | 28,895 | |||||||||
Cash received from income tax refunds | (50,163 | ) | (13,193 | ) | (17,087 | ) | ||||||
Noncash investing and financing activities | ||||||||||||
Increase in asset retirement obligations | 14,866 | 6,500 | 26,946 | |||||||||
Increase (decrease) in liabilities for capital expenditures | (97,278 | ) | 215 | (18,321 | ) | |||||||
Decrease in restricted cash (1) | — | — | 1,050,328 | |||||||||
Retirement of treasury stock | 884,129 | — | — | |||||||||
(1) | During 2013, proceeds from the sales of our oil and natural gas property dispositions in 2012, which were held by a qualified intermediary, were released primarily to fund a portion of the CCA acquisition. |
100
SUPPLEMENTAL OIL AND NATURAL GAS DISCLOSURES (UNAUDITED)
Costs Incurred
The following table summarizes costs incurred and capitalized in oil and natural gas property acquisition, exploration and development activities. Property acquisition costs are those costs incurred to purchase, lease or otherwise acquire property, including both undeveloped leasehold and the purchase of reserves in place. Exploration costs include costs of identifying areas that may warrant examination and examining specific areas that are considered to have prospects containing oil and natural gas reserves, including costs of drilling exploratory wells, geological and geophysical costs, and carrying costs on undeveloped properties. Development costs are incurred to obtain access to proved reserves, including the cost of drilling development wells, and to provide facilities for extracting, treating, gathering and storing the oil and natural gas, and the cost of improved recovery systems.
We capitalize interest on unevaluated oil and natural gas properties that have ongoing development activities. Included in costs incurred in the table below is capitalized interest of $28.3 million in 2015, $21.8 million in 2014 and $41.3 million in 2013. Costs incurred also include new asset retirement obligations established, as well as changes to asset retirement obligations resulting from revisions in cost estimates or abandonment dates. Asset retirement obligations included in the table below were $5.5 million, $4.9 million and $17.1 million in 2015, 2014 and 2013, respectively. See Note 2, Asset Retirement Obligations, for additional information.
Costs incurred in oil and natural gas activities were as follows:
Year Ended December 31, | ||||||||||||
In thousands | 2015 | 2014 | 2013 | |||||||||
Property acquisitions | ||||||||||||
Proved | $ | 28,224 | $ | 3,801 | $ | 803,837 | ||||||
Unevaluated | — | 8,028 | 221,173 | |||||||||
Exploration | 720 | 5,493 | 2,103 | |||||||||
Development | 407,021 | 964,726 | 913,093 | |||||||||
Total costs incurred (1) | $ | 435,965 | $ | 982,048 | $ | 1,940,206 | ||||||
(1) | Capitalized general and administrative costs that directly relate to exploration and development activities were $62.3 million, $62.2 million and $55.4 million for the years ended December 31, 2015, 2014 and 2013, respectively. |
101
Oil and Natural Gas Operating Results
Results of operations from oil and natural gas producing activities, excluding corporate overhead and interest costs, were as follows:
Year Ended December 31, | ||||||||||||
In thousands, except per BOE data | 2015 | 2014 | 2013 | |||||||||
Oil, natural gas, and related product sales | $ | 1,213,026 | $ | 2,372,473 | $ | 2,466,234 | ||||||
Lease operating expenses | 515,043 | 647,559 | 730,574 | |||||||||
Marketing expenses, net of third-party purchases, and plant operating expenses | 48,319 | 47,965 | 37,754 | |||||||||
Production and ad valorem taxes | 95,687 | 155,495 | 162,791 | |||||||||
Depletion, depreciation, and amortization | 436,167 | 494,402 | 426,668 | |||||||||
CO2 properties and pipelines depletion and depreciation (1) | 55,929 | 58,759 | 52,932 | |||||||||
Write-down of oil and natural gas properties | 4,939,600 | — | — | |||||||||
Commodity derivatives expense (income) | (147,999 | ) | (555,255 | ) | 41,024 | |||||||
Net operating income (loss) | (4,729,720 | ) | 1,523,548 | 1,014,491 | ||||||||
Income tax provision (benefit) | (1,797,294 | ) | 578,948 | 385,507 | ||||||||
Results of operations from oil and natural gas producing activities | $ | (2,932,426 | ) | $ | 944,600 | $ | 628,984 | |||||
Depletion, depreciation, and amortization per BOE | $ | 18.50 | $ | 20.36 | $ | 18.71 | ||||||
(1) | Represents an allocation of the depletion and depreciation of our CO2 properties and pipelines associated with our tertiary oil producing activities. |
Oil and Natural Gas Reserves
Net proved oil and natural gas reserve estimates for all years presented were prepared by DeGolyer and MacNaughton, independent petroleum engineers located in Dallas, Texas. These oil and natural gas reserve estimates do not include any value for probable or possible reserves that may exist, nor do they include any value for undeveloped acreage. The reserve estimates represent our net revenue interest in our properties. See Standardized Measure of Discounted Future Net Cash Flows and Changes Therein Relating to Proved Oil and Natural Gas Reserves below for a discussion of the effect of the different prices on reserve quantities and values. Operating costs, production and ad valorem taxes, and future development costs were based on current costs as of December 31, 2015.
There are numerous uncertainties inherent in estimating quantities of proved reserves and in projecting the future rates of production and timing of development expenditures. The following reserve data represents estimates only and should not be construed as being exact. Moreover, the present values should not be construed as the current market value of our oil and natural gas reserves or the costs that would be incurred to obtain equivalent reserves. Estimates of reserves as of year-end 2015, 2014 and 2013 were prepared using an average price equal to the unweighted arithmetic average of hydrocarbon prices received on a field-by-field basis on the first day of each month within the applicable fiscal 12-month period. All of our reserves are located in the United States.
102
Estimated Quantities of Proved Reserves
Year Ended December 31, | |||||||||||||||||||||||||||
2015 | 2014 | 2013 | |||||||||||||||||||||||||
Oil (MBbl) | Gas (MMcf) | Total (MBOE) | Oil (MBbl) | Gas (MMcf) | Total (MBOE) | Oil (MBbl) | Gas (MMcf) | Total (MBOE) | |||||||||||||||||||
Balance at beginning of year | 362,335 | 452,402 | 437,735 | 386,659 | 489,954 | 468,318 | 329,124 | 481,641 | 409,398 | ||||||||||||||||||
Revisions of previous estimates | 4,117 | (16,963 | ) | 1,290 | 2,132 | (36,796 | ) | (4,000 | ) | 4,704 | 60 | 4,714 | |||||||||||||||
Revisions due to change in sales prices | (60,699 | ) | (389,161 | ) | (125,559 | ) | (1,971 | ) | 7,789 | (673 | ) | 665 | 14,100 | 3,015 | |||||||||||||
Extensions and discoveries | — | — | — | — | — | — | 118 | — | 118 | ||||||||||||||||||
Improved recovery (1) | 357 | — | 357 | 1,468 | — | 1,468 | 34,015 | — | 34,015 | ||||||||||||||||||
Production | (25,245 | ) | (8,093 | ) | (26,594 | ) | (25,771 | ) | (8,379 | ) | (27,168 | ) | (24,194 | ) | (8,666 | ) | (25,639 | ) | |||||||||
Acquisition of minerals in place | 1,385 | 120 | 1,405 | — | — | — | 42,227 | 2,819 | 42,697 | ||||||||||||||||||
Sales of minerals in place | — | — | — | (182 | ) | (166 | ) | (210 | ) | — | — | — | |||||||||||||||
Balance at end of year | 282,250 | 38,305 | 288,634 | 362,335 | 452,402 | 437,735 | 386,659 | 489,954 | 468,318 | ||||||||||||||||||
Proved Developed Reserves | |||||||||||||||||||||||||||
Balance at beginning of year | 269,377 | 416,421 | 338,780 | 276,392 | 72,095 | 288,408 | 236,009 | 64,191 | 246,708 | ||||||||||||||||||
Balance at end of year | 223,060 | 37,951 | 229,385 | 269,377 | 416,421 | 338,780 | 276,392 | 72,095 | 288,408 | ||||||||||||||||||
(1) | Improved recovery reflects reserve additions that result from the application of secondary recovery methods such as water flooding, or tertiary recovery methods such as CO2 flooding. In order to recognize proved tertiary oil reserves, we must either have an oil production response to CO2 injections or the field must be analogous to an existing tertiary flood. The magnitude of proved reserves that we can book in any given year will depend on our progress with new floods and the timing of the production response. |
Revisions due to change in sales prices during 2015 reflect the significant decline in commodity prices between December 31, 2015 and 2014, whereby the average first-day-of-the-month NYMEX oil price used in estimating our proved reserves declined from $94.99 per Bbl at December 31, 2014, to $50.28 per Bbl at December 31, 2015, and for natural gas declined from $4.30 per MMBtu at December 31, 2014, to $2.63 per MMBtu at December 31, 2015. These revisions include the elimination of approximately 368 Bcf (61 MMBOE) of proved natural gas reserves at Riley Ridge, which reserves were reclassified and are no longer considered proved reserves primarily as a result of the decline in average first-day-of-the-month natural gas prices utilized in preparing our December 31, 2015 reserve report.
There were no significant additions to our oil and natural gas reserves in 2015 or 2014, as the magnitude of proved reserves that we can book in any given year depends on our progress with new floods and the timing of the production response, and we initiated no new floods in 2015 or 2014. Revisions of previous estimates in 2014 primarily relate to natural gas reserves at Riley Ridge and Delhi fields previously classified as proved, which were revised to be consumed as fuel.
Acquisitions of minerals in place during 2013 were primarily related to the acquisition of additional interests in certain of our existing operated fields in CCA, as well as operating interests in other CCA fields. Reserves added as a result of improved recovery represent initial proved tertiary oil reserves at Bell Creek Field.
103
Standardized Measure of Discounted Future Net Cash Flows and Changes Therein Relating to Proved Oil and Natural Gas Reserves
The Standardized Measure of Discounted Future Net Cash Flows and Changes Therein Relating to Proved Oil and Natural Gas Reserves (“Standardized Measure”) does not purport to present the fair market value of our oil and natural gas properties. An estimate of such value should consider, among other factors, anticipated future prices of oil and natural gas, the probability of recoveries in excess of existing proved reserves, the value of probable reserves and acreage prospects, and perhaps different discount rates. It should be noted that estimates of reserve quantities, especially from new discoveries, are inherently imprecise and subject to substantial revision.
Under the Standardized Measure, future cash inflows were estimated by applying a first-day-of-the-month 12-month average price to the estimated future production of year-end proved reserves. The product prices used to calculate these reserves have varied widely during the three-year period. These prices have a significant impact on both the quantities and value of the proved reserves, as reductions in oil and natural gas prices can cause wells to reach the end of their economic life much sooner and can make certain proved undeveloped locations uneconomical, both of which reduce the reserves. The following representative oil and natural gas prices were used in the Standardized Measure. These prices were adjusted by field to arrive at the appropriate corporate net price.
December 31, | ||||||||||||
2015 | 2014 | 2013 | ||||||||||
Oil (NYMEX price per Bbl) | $ | 50.28 | $ | 94.99 | $ | 96.94 | ||||||
Natural Gas (Henry Hub price per MMBtu) | 2.63 | 4.30 | 3.67 | |||||||||
The representative oil prices in the table above are not reflective of the continued oil price declines in late 2015 and early 2016, in which prices declined to below $27 per Bbl in January 2016. In response to these price decreases, we have deferred our development spending for certain projects in 2016, which has been reflected in our December 31, 2015 reserve report. Sustained prices at these recent or lower levels would result in additional decreases in the future cash inflows associated with our proved reserve value, and to a lesser degree, additional reductions in proved reserve volumes. The decreases in the Standardized Measure of discounted future net cash flows during 2015 in the tables that follow were significantly impacted by the decline in first-day-of-the-month average NYMEX oil prices between 2014 and 2015. The weighted-average oil prices we receive relative to NYMEX oil prices (our NYMEX oil price differential) utilized were $2.17 per Bbl below representative NYMEX oil prices as of December 31, 2015, compared to $3.10 per Bbl below representative NYMEX oil prices as of December 31, 2014, and $3.41 per Bbl above representative NYMEX oil prices as of December 31, 2013.
Future cash inflows were reduced by estimated future production, development and abandonment costs based on current cost, with no escalation to determine pre-tax cash inflows. Our future net inflows do not include a reduction for cash previously expended on our capitalized CO2 assets that will be consumed in the production of proved tertiary reserves. Future income taxes were computed by applying the statutory tax rate to the excess of net cash inflows over our tax basis in the associated proved oil and natural gas properties. Tax credits and net operating loss carryforwards were also considered in the future income tax calculation. Future net cash inflows after income taxes were discounted using a 10% annual discount rate to arrive at the Standardized Measure.
December 31, | ||||||||||||
In thousands | 2015 | 2014 | 2013 | |||||||||
Future cash inflows | $ | 13,413,758 | $ | 34,761,067 | $ | 40,065,019 | ||||||
Future production costs | (7,649,757 | ) | (14,563,782 | ) | (16,053,734 | ) | ||||||
Future development costs | (1,712,693 | ) | (2,319,727 | ) | (2,552,194 | ) | ||||||
Future income taxes | (657,560 | ) | (5,711,897 | ) | (6,937,773 | ) | ||||||
Future net cash flows | 3,393,748 | 12,165,661 | 14,521,318 | |||||||||
10% annual discount for estimated timing of cash flows | (1,503,624 | ) | (6,257,533 | ) | (7,392,574 | ) | ||||||
Standardized measure of discounted future net cash flows | $ | 1,890,124 | $ | 5,908,128 | $ | 7,128,744 | ||||||
104
The following table sets forth an analysis of changes in the Standardized Measure of Discounted Future Net Cash Flows from proved oil and natural gas reserves:
Year Ended December 31, | ||||||||||||
In thousands | 2015 | 2014 | 2013 | |||||||||
Beginning of year | $ | 5,908,128 | $ | 7,128,744 | $ | 6,414,380 | ||||||
Sales of oil and natural gas produced, net of production costs (1) | (553,978 | ) | (1,521,529 | ) | (1,649,113 | ) | ||||||
Net changes in prices and production costs | (7,341,451 | ) | (1,415,154 | ) | (170,571 | ) | ||||||
Extensions and discoveries, less applicable future development and production costs | — | — | 4,902 | |||||||||
Improved recovery (2) | 6,299 | 51,793 | 739,019 | |||||||||
Previously estimated development costs incurred | 172,146 | 472,154 | 393,537 | |||||||||
Change in future development costs | (206,194 | ) | (289,622 | ) | (301,162 | ) | ||||||
Revisions due to timing and other | 660,335 | (205,912 | ) | (446,586 | ) | |||||||
Accretion of discount | 806,630 | 1,020,008 | 1,072,113 | |||||||||
Acquisition of minerals in place | 26,698 | — | 1,082,050 | |||||||||
Sales of minerals in place | — | 2,549 | — | |||||||||
Net change in income taxes | 2,411,511 | 665,097 | (9,825 | ) | ||||||||
End of year | $ | 1,890,124 | $ | 5,908,128 | $ | 7,128,744 | ||||||
(1) | Production costs exclude net reductions of $13.7 million and $7.1 million in lease operating expenses recorded during the years ended December 31, 2015 and 2014, respectively, related to the Delhi Field release, and a charge of $114.0 million of lease operating expenses recorded during the year ended December 31, 2013, related to that release. |
(2) | Improved recovery additions result from the application of secondary recovery methods such as water flooding or tertiary recovery methods such as CO2 flooding. |
SUPPLEMENTAL CO2 AND HELIUM DISCLOSURES (UNAUDITED)
Based on engineering reports prepared by DeGolyer and MacNaughton, proved CO2 reserves, and helium reserves associated with our helium production rights, were estimated as follows (in MMcf):
Year Ended December 31, | |||||||||
2015 | 2014 | 2013 | |||||||
CO2 reserves | |||||||||
Gulf Coast region (1) | 5,501,175 | 5,697,642 | 6,070,619 | ||||||
Rocky Mountain region (2) | 1,237,603 | 3,035,286 | 3,272,428 | ||||||
Helium reserves associated with Denbury’s production rights | |||||||||
Rocky Mountain region (3) | — | 13,231 | 13,251 | ||||||
(1) | Proved CO2 reserves in the Gulf Coast region consist of reserves from our reservoirs at Jackson Dome and are presented on a gross (8/8ths) basis, of which our net revenue interest was approximately 4.4 Tcf, 4.5 Tcf and 4.8 Tcf at December 31, 2015, 2014 and 2013, respectively, and include reserves dedicated to volumetric production payments of 25.3 Bcf, 9.3 Bcf and 28.9 Bcf at December 31, 2015, 2014 and 2013, respectively. |
(2) | Proved CO2 reserves in the Rocky Mountain region consist of our reserves at Riley Ridge (presented on a gross (8/8ths) basis) and our overriding royalty interest in LaBarge Field, of which our net revenue interest was approximately 1.2 Tcf, 2.6 Tcf and 2.9 Tcf at December 31, 2015, 2014 and 2013, respectively. As of December 31, 2015, Riley Ridge CO2 reserves were |
105
reclassified and are no longer considered proved reserves primarily as a result of the decline in average first-day-of-the-month natural gas prices utilized in preparing our December 31, 2015 reserve report.
(3) | Reserves associated with helium production rights include helium reserves located in acreage in the Rocky Mountain region for which we have the contractual right to extract the helium on behalf of the U.S. government, which owns the helium. Our extraction agreement with the U.S. government gives us the ability to produce the helium on behalf of the U.S. government in exchange for a fee, which amount fluctuates based upon the realized sales proceeds we receive for the helium. The estimate of helium reserves is reduced to reflect the estimated fee we will remit to the U.S. government. Our extraction agreement with the U.S. government has a minimum term extending 20 years from first production and continuing thereafter until either party terminates the contract. Reserve volumes presented herein assume that the term of this helium extraction agreement continues beyond 20 years, given the benefit to both parties to the agreement. As of December 31, 2015, Riley Ridge helium reserves were reclassified and are no longer considered proved reserves primarily as a result of the decline in average first-day-of-the-month natural gas prices utilized in preparing our December 31, 2015 reserve report. |
UNAUDITED QUARTERLY INFORMATION
In thousands, except per-share data | March 31 | June 30 | September 30 | December 31 | ||||||||||||
2015 | ||||||||||||||||
Revenues and other income | $ | 307,649 | $ | 376,694 | $ | 303,600 | $ | 269,617 | ||||||||
Commodity derivatives expense (income) | (83,076 | ) | 48,926 | (92,028 | ) | (21,821 | ) | |||||||||
Write-down of oil and natural gas properties | 146,200 | 1,705,800 | 1,760,600 | 1,327,000 | ||||||||||||
Impairment of goodwill | — | — | 1,261,512 | — | ||||||||||||
Other expenses (1) | 416,732 | 406,635 | 348,522 | 358,540 | ||||||||||||
Net loss | (107,746 | ) | (1,148,499 | ) | (2,244,126 | ) | (885,077 | ) | ||||||||
Net loss per common share: | ||||||||||||||||
Basic | (0.31 | ) | (3.28 | ) | (6.41 | ) | (2.56 | ) | ||||||||
Diluted | (0.31 | ) | (3.28 | ) | (6.41 | ) | (2.56 | ) | ||||||||
Dividends declared per common share (2) | 0.0625 | 0.0625 | 0.0625 | — | ||||||||||||
Cash flow provided by operating activities | 137,764 | 288,957 | 272,676 | 164,907 | ||||||||||||
Cash flow used in investing activities | (192,578 | ) | (143,934 | ) | (91,028 | ) | (122,645 | ) | ||||||||
Cash flow provided by (used in) financing activities | 37,682 | (146,631 | ) | (173,849 | ) | (51,662 | ) | |||||||||
2014 | ||||||||||||||||
Revenues and other income | $ | 641,744 | $ | 672,120 | $ | 637,657 | $ | 483,684 | ||||||||
Commodity derivatives expense (income) | 76,669 | 174,771 | (252,265 | ) | (554,430 | ) | ||||||||||
Loss on early extinguishment of debt | — | 113,908 | — | — | ||||||||||||
Other expenses (1) | 471,972 | 471,505 | 453,604 | 456,914 | ||||||||||||
Net income (loss) | 58,310 | (55,200 | ) | 268,748 | 363,633 | |||||||||||
Net income (loss) per common share: | ||||||||||||||||
Basic | 0.17 | (0.16 | ) | 0.77 | 1.04 | |||||||||||
Diluted | 0.17 | (0.16 | ) | 0.77 | 1.04 | |||||||||||
Dividends declared per common share | 0.0625 | 0.0625 | 0.0625 | 0.0625 | ||||||||||||
Cash flow provided by operating activities | 214,858 | 329,847 | 340,392 | 337,728 | ||||||||||||
Cash flow used in investing activities | (236,754 | ) | (280,148 | ) | (272,021 | ) | (287,832 | ) | ||||||||
Cash flow provided by (used in) financing activities | 17,601 | (45,545 | ) | (60,981 | ) | (46,179 | ) | |||||||||
106
(1) | Includes ($13.7 million), $2.8 million and ($9.9 million) related to Delhi remediation charges, net of insurance and other reimbursements during the three months ended September 30, 2015, December 31, 2014, and September 30, 2014, respectively. |
(2) | On September 21, 2015, in light of the continuing low oil price environment and our desire to maintain our financial strength and flexibility, the Company’s Board of Directors suspended our quarterly cash dividend effective after payment of our third quarter dividend on September 29, 2015. |
107
Item 9. Changes in and Disagreements with Accountants on Accounting and Financial Disclosure
None.
Item 9A. Controls and Procedures
Evaluation of Disclosure Controls and Procedures
As of the end of the period covered by this report, an evaluation of the effectiveness of the design and operation of our disclosure controls and procedures (as defined in Rule 13a-15(e) under the Exchange Act) was performed under the supervision and with the participation of management, including our Chief Executive Officer and our Chief Financial Officer. Based on that evaluation, our Chief Executive Officer and Chief Financial Officer concluded that our disclosure controls and procedures were effective as of December 31, 2015, to ensure that information that is required to be disclosed in the reports the Company files and submits under the Securities Exchange Act of 1934 is recorded; that it is processed, summarized and reported within the time periods specified in the SEC’s rules and forms; and that information that is required to be disclosed under the Exchange Act is accumulated and communicated to management, including our Chief Executive Officer and our Chief Financial Officer, as appropriate to allow timely decisions regarding required disclosure.
Evaluation of Changes in Internal Control over Financial Reporting
Under the supervision and with the participation of our management, including our Chief Executive Officer and our Chief Financial Officer, we have determined that, during the fourth quarter of fiscal 2015, there were no changes in our internal control over financial reporting that have materially affected, or are reasonably likely to materially affect, our internal control over financial reporting.
Management’s Report on Internal Control over Financial Reporting
Our management is responsible for establishing and maintaining adequate internal control over financial reporting as defined in Rules 13a-15(f) and 15d-15(f) of the Securities Exchange Act of 1934, as amended. Under the supervision and with the participation of our management, including our Chief Executive Officer and our Chief Financial Officer, we assessed the effectiveness of our internal control over financial reporting as of the end of the period covered by this report based on the framework in “Internal Control – Integrated Framework” (2013) issued by the Committee of Sponsoring Organizations of the Treadway Commission. Based on that assessment, our Chief Executive Officer and our Chief Financial Officer concluded that our internal control over financial reporting was effective to provide reasonable assurance regarding the reliability of our financial reporting and the preparation of our financial statements for external purposes in accordance with U.S. generally accepted accounting principles.
The effectiveness of our internal control over financial reporting as of December 31, 2015, has been audited by PricewaterhouseCoopers LLP, an independent registered public accounting firm, as stated in the report that appears herein.
Important Considerations
The effectiveness of our disclosure controls and procedures and our internal control over financial reporting is subject to various inherent limitations, including cost limitations, judgments used in decision making, assumptions about the likelihood of future events, the soundness of our systems, the possibility of human error, and the risk of fraud. Moreover, projections of any evaluation of effectiveness to future periods are subject to the risk that controls may become inadequate because of changes in conditions and the risk that the degree of compliance with policies or procedures may deteriorate over time. Because of these limitations, there can be no assurance that any system of disclosure controls and procedures or internal control over financial reporting will be successful in preventing all errors or fraud or in making all material information known in a timely manner to the appropriate levels of management.
Item 9B. Other Information
None.
108
PART III
Item 10. Directors, Executive Officers and Corporate Governance
Except as disclosed below, information as to Item 10 will be set forth in the Proxy Statement (“Proxy Statement”) for the 2016 Annual Meeting of Shareholders (“Annual Meeting”) and is incorporated herein by reference.
Code of Ethics
We have adopted a Code of Ethics for Senior Financial Officers. This Code of Ethics, including any amendments or waivers, is posted on our website at www.denbury.com.
Item 11. Executive Compensation
Information as to Item 11 will be set forth in the Proxy Statement for the Annual Meeting and is incorporated herein by reference.
Item 12. Security Ownership of Certain Beneficial Owners and Management and Related Stockholder Matters
Information as to Item 12 will be set forth in the Proxy Statement for the Annual Meeting and is incorporated herein by reference.
Item 13. Certain Relationships and Related Transactions, and Director Independence
Information as to Item 13 will be set forth in the Proxy Statement for the Annual Meeting and is incorporated herein by reference.
Item 14. Principal Accountant Fees and Services
Information as to Item 14 will be set forth in the Proxy Statement for the Annual Meeting and is incorporated herein by reference.
109
PART IV
Item 15. Exhibits and Financial Statement Schedules
Financial Statements and Schedules. Financial statements and schedules filed as a part of this report are presented on page 67. All financial statement schedules have been omitted because they are not applicable, or the required information is presented in the financial statements or the notes to consolidated financial statements. |
Exhibits. The following exhibits are included as part of this report.
Exhibit No. | Exhibit | |
2(a) | Exchange Agreement, dated as of September 19, 2012, by and among Denbury Onshore, LLC, XTO Energy Inc., and Exxon Mobil Corporation (incorporated by reference to Exhibit 2.1 of Form 8-K filed by the Company on September 25, 2012, File No. 001-12935). | |
2(b) | Closing Agreement and Amendment, dated as of November 30, 2012, by and among Denbury Onshore, LLC, XTO Energy Inc., and Exxon Mobil Corporation (incorporated by reference to Exhibit 2.2 of Form 8-K filed by the Company on December 6, 2012, File No. 001-12935). | |
2(c) | Second Closing Agreement and Amendment, dated as of December 21, 2012, by and among Denbury Onshore, LLC, XTO Energy Inc., and Exxon Mobil Corporation (incorporated by reference to Exhibit 2.1 of Form 8-K filed by the Company on December 26, 2012, File No. 001-12935). | |
2(d) | Purchase and Sale Agreement, dated as of January 14, 2013, by and between Burlington Resources Oil & Gas Company LP and Denbury Onshore, LLC (incorporated by reference to Exhibit 2.1 of Form 8-K filed by the Company on January 15, 2013, File No. 001-12935). | |
3(a) | Second Restated Certificate of Incorporation of Denbury Resources Inc. filed with the Delaware Secretary of State on October 30, 2014 (incorporated by reference to Exhibit 3(a) of Form 10-Q filed by the Company on November 7, 2014, File No. 001-12935). | |
3(b) | Second Amended and Restated Bylaws of Denbury Resources Inc. as of November 4, 2014 (incorporated by reference to Exhibit 3(b) of Form 10-Q filed by the Company on November 7, 2014, File No. 001-12935). | |
4(a) | Indenture for 6.0% Senior Subordinated Notes due 2015, dated as of July 13, 2005, by and among Encore Acquisition Company, certain of its subsidiaries, and Wells Fargo Bank, National Association, as Trustee (incorporated by reference to Exhibit 4.2.1 of Form 8-K filed by the Company on March 12, 2010, File No. 001-12935). | |
4(b) | First Supplemental Indenture for 6.0% Senior Subordinated Notes due 2015, dated as of January 2, 2008, by and among Encore Acquisition Company, certain of its subsidiaries, and Wells Fargo Bank, National Association, as Trustee (incorporated by reference to Exhibit 4.2.2 of Form 8-K filed by the Company on March 12, 2010, File No. 001-12935). | |
4(c) | Second Supplemental Indenture for 6.0% Senior Subordinated Notes due 2015, dated as of January 27, 2010, by and among Encore Acquisition Company, certain of its subsidiaries, and Wells Fargo Bank, National Association, as Trustee (incorporated by reference to Exhibit 4.2.3 of Form 8-K filed by the Company on March 12, 2010, File No. 001-12935). | |
4(d) | Third Supplemental Indenture for 6.0% Senior Subordinated Notes due 2015, dated as of March 10, 2010, by and among Denbury Resources Inc., certain of its subsidiaries, and Wells Fargo Bank, National Association, as Trustee (incorporated by reference to Exhibit 4.2.4 of Form 8-K filed by the Company on March 12, 2010, File No. 001-12935). | |
4(e) | Fourth Supplemental Indenture for 6.0% Senior Subordinated Notes due 2015, dated as of February 3, 2011, by and among Denbury Resources Inc., certain of its subsidiaries, and Wells Fargo Bank, National Association, as Trustee (incorporated by reference to Exhibit 4(cc) of Form 10-K filed by the Company on March 1, 2011, File No. 001-12935). | |
110
Exhibit No. | Exhibit | |
4(f) | Indenture for Subordinated Debt Securities, dated as of November 16, 2005, by and among Encore Acquisition Company, certain of its subsidiaries, and Wells Fargo Bank, National Association, as Trustee (incorporated by reference to Exhibit 4.3.1 of Form 8-K filed by the Company on March 12, 2010, File No. 001-12935). | |
4(g) | First Supplemental Indenture for 7.25% Senior Subordinated Notes due 2017, dated as of November 23, 2005, by and among Encore Acquisition Company, certain of its subsidiaries, and Wells Fargo Bank, National Association, as Trustee (incorporated by reference to Exhibit 4.3.2 of Form 8-K filed by the Company on March 12, 2010, File No. 001-12935). | |
4(h) | Second Supplemental Indenture for 7.25% Senior Subordinated Notes due 2017, dated as of January 2, 2008, by and among Encore Acquisition Company, certain of its subsidiaries, and Wells Fargo Bank, National Association, as Trustee (incorporated by reference to Exhibit 4.3.3 of Form 8-K filed by the Company on March 12, 2010, File No. 001-12935). | |
4(i) | Third Supplemental Indenture for 9.5% Senior Subordinated Notes due 2016, dated as of April 27, 2009, by and among Encore Acquisition Company, certain of its subsidiaries, and Wells Fargo Bank, National Association, as Trustee (incorporated by reference to Exhibit 4.3.4 of Form 8-K filed by the Company on March 12, 2010, File No. 001-12935). | |
4(j) | Fourth Supplemental Indenture for Senior Subordinated Notes, dated as of January 27, 2010, by and among Encore Acquisition Company, certain of its subsidiaries, and Wells Fargo Bank, National Association, as Trustee (incorporated by reference to Exhibit 4.3.5 of Form 8-K filed by the Company on March 12, 2010, File No. 001-12935). | |
4(k) | Fifth Supplemental Indenture for Senior Subordinated Notes, dated as of March 10, 2010, by and among Denbury Resources Inc., certain of its subsidiaries, and Wells Fargo Bank, National Association, as Trustee (incorporated by reference to Exhibit 4.3.6 of Form 8-K filed by the Company on March 12, 2010, File No. 001-12935). | |
4(l) | Sixth Supplemental Indenture for Senior Subordinated Notes, dated as of February 3, 2011, by and among Denbury Resources Inc., certain of its subsidiaries, and Wells Fargo Bank, National Association, as Trustee (incorporated by reference to Exhibit 4(jj) of Form 10-K filed by the Company on March 1, 2011, File No. 001-12935). | |
4(m) | Seventh Supplemental Indenture for Senior Subordinated Notes, dated as of February 5, 2013, by and among Denbury Resources Inc., certain of its subsidiaries, and Wells Fargo Bank, National Association, as Trustee (incorporated by reference to Exhibit 4.2 of Form 8-K filed by the Company on February 5, 2013, File No. 001-12935). | |
4(n) | Indenture for 6⅜% Senior Subordinated Notes due 2021, dated as of February 17, 2011, by and among Denbury Resources Inc., certain of its subsidiaries, and Wells Fargo Bank, National Association, as Trustee (incorporated by reference to Exhibit 4.1 of Form 8-K filed by the Company on February 22, 2011, File No. 001-12935). | |
4(o) | First Supplemental Indenture for 6⅜% Senior Subordinated Notes due 2021, dated as of December 31, 2014, by and among Denbury Resources Inc., certain of its subsidiaries, and Wells Fargo Bank, National Association, as Trustee (incorporated by reference to Exhibit 4(x) of Form 10-K filed by the Company on February 27, 2015, File No. 001-12935). | |
4(p) | Indenture for 4⅝% Senior Subordinated Notes due 2023, dated as of February 5, 2013, by and among Denbury Resources Inc., certain of its subsidiaries, and Wells Fargo Bank, National Association, as Trustee (incorporated by reference to Exhibit 4.1 of Form 8-K filed by the Company on February 5, 2013, File No. 001-12935). | |
4(q) | First Supplemental Indenture for 4⅝% Senior Subordinated Notes due 2023, dated as of December 31, 2014, by and among Denbury Resources Inc., certain of its subsidiaries, and Wells Fargo Bank, National Association, as Trustee (incorporated by reference to Exhibit 4(z) of Form 10-K filed by the Company on February 27, 2015, File No. 001-12935). | |
111
Exhibit No. | Exhibit | |
4(r) | Indenture for 5½% Senior Subordinated Notes due 2022, dated as of April 30, 2014, by and among Denbury Resources Inc., certain of its subsidiaries, and Wells Fargo Bank, National Association, as Trustee (incorporated by reference to Exhibit 4.1 of Form 8-K filed by the Company on May 1, 2014, File No. 001-12935). | |
4(s) | First Supplemental Indenture for 5½% Senior Subordinated Notes due 2022, dated as of December 31, 2014, by and among Denbury Resources Inc., certain of its subsidiaries, and Wells Fargo Bank, National Association, as Trustee (incorporated by reference to Exhibit 4(bb) of Form 10-K filed by the Company on February 27, 2015, File No. 001-12935). | |
10(a) | Amended and Restated Credit Agreement, dated as of December 9, 2014, by and among Denbury Resources Inc., as Borrower, JPMorgan Chase Bank, N.A., as Administrative Agent, and the lending institutions party thereto (incorporated by reference to Exhibit 10.1 of Form 8-K filed by the Company on December 15, 2014, File No. 001-12935). | |
10(b) | First Amendment to Amended and Restated Credit Agreement, dated as of May 4, 2015, by and among Denbury Resources Inc., as Borrower, JPMorgan Chase Bank, N.A., as Administrative Agent, and the financial institutions party thereto (incorporated by reference to Exhibit 10(a) of Form 10-Q filed by the Company on May 6, 2015, File No. 001-12935). | |
10(c) | Second Amendment to Amended and Restated Credit Agreement, dated as of February 17, 2016, by and among Denbury Resources Inc., as Borrower, JPMorgan Chase Bank, N.A., as Administrative Agent, and the financial institutions party thereto (incorporated by reference to Exhibit 10.1 of Form 8-K filed by the Company on February 23, 2016, File No. 001-12935). | |
10(d) | Pipeline Financing Lease Agreement, dated as of May 30, 2008, by and between Genesis NEJD Pipeline, LLC, as Lessor, and Denbury Onshore, LLC, as Lessee (incorporated by reference to Exhibit 99.1 of Form 8-K filed by the Company on June 5, 2008, File No. 001-12935). | |
10(e) | Transportation Services Agreement, dated as of May 30, 2008, by and between Genesis Free State Pipeline, LLC and Denbury Onshore, LLC (incorporated by reference to Exhibit 99.2 of Form 8-K filed by the Company on June 5, 2008, File No. 001-12935). | |
10(f)** | Denbury Resources Inc. Amended and Restated Stock Option Plan, effective as of December 5, 2007 (incorporated by reference to Exhibit 99.2 of Form 8-K filed by the Company on December 11, 2007, File No. 001-12935). | |
10(g)** | Denbury Resources Inc. Amended and Restated Employee Stock Purchase Plan, effective as of May 22, 2013 (incorporated by reference to Exhibit 10.1 of Form 8-K filed by the Company on May 28, 2013, File No. 001-12935). | |
10(h)** | Form of Indemnification Agreement, dated as of July 28, 1999, by and between Denbury Resources Inc. and its officers and directors (incorporated by reference to Exhibit 10 of Form 10-Q filed by the Company on August 11, 1999, File No. 001-12935). | |
10(i)* ** | Denbury Resources Inc. Director Deferred Compensation Plan, as amended and restated effective as of December 16, 2015. | |
10(j)** | Denbury Resources Inc. Severance Protection Plan, as amended and restated effective as of May 6, 2015 (incorporated by reference to Exhibit 10(c) of Form 10-Q filed by the Company on May 6, 2015, File No. 001-12935). | |
10(k)** | Denbury Resources Inc. 2004 Omnibus Stock and Incentive Plan, as amended and restated effective as of May 19, 2015 (incorporated by reference to Exhibit 10.1 of Form 8-K filed by the Company on May 22, 2015, File No. 001-12935). | |
10(l)** | 2004 Form of Restricted Stock Award that vests on retirement for grants to officers pursuant to the 2004 Omnibus Stock and Incentive Plan for Denbury Resources Inc. (incorporated by reference to Exhibit 10(l) of Form 10-K filed by the Company on March 15, 2005, File No. 001-12935). | |
112
Exhibit No. | Exhibit | |
10(m)** | 2012 Form of Performance Stock Award pursuant to the 2004 Omnibus Stock and Incentive Plan (incorporated by reference to Exhibit 10(a) of Form 10-Q filed by the Company on May 10, 2012, File No. 001-12935). | |
10(n)** | 2012 Form of Performance Cash Award pursuant to the 2004 Omnibus Stock and Incentive Plan (incorporated by reference to Exhibit 10(b) of Form 10-Q filed by the Company on May 10, 2012, File No. 001-12935). | |
10(o)** | 2012 Form of TSR Performance Award pursuant to the 2004 Omnibus Stock and Incentive Plan (incorporated by reference to Exhibit 10(c) of Form 10-Q filed by the Company on May 10, 2012, File No. 001-12935). | |
10(p)** | 2013 Form of Performance Share Award pursuant to the 2004 Omnibus Stock and Incentive Plan (incorporated by reference to Exhibit 10(a) of Form 10-Q filed by the Company on May 10, 2013, File No. 001-12935). | |
10(q)** | 2013 Form of Performance Cash Award pursuant to the 2004 Omnibus Stock and Incentive Plan (incorporated by reference to Exhibit 10(b) of Form 10-Q filed by the Company on May 10, 2013, File No. 001-12935). | |
10(r)** | 2013 Form of TSR Performance Award pursuant to the 2004 Omnibus Stock and Incentive Plan (incorporated by reference to Exhibit 10(c) of Form 10-Q filed by the Company on May 10, 2013, File No. 001-12935). | |
10(s)** | 2013 Form of Stock Appreciation Rights Agreement pursuant to the 2004 Omnibus Stock and Incentive Plan (incorporated by reference to Exhibit 10(e) of Form 10-Q filed by the Company on May 10, 2013, File No. 001-12935). | |
10(t)** | 2013 Form of Restricted Share Award to officers pursuant to the 2004 Omnibus Stock and Incentive Plan (incorporated by reference to Exhibit 10(d) of Form 10-Q filed by the Company on May 10, 2013, File No. 001-12935). | |
10(u)** | 2013 Form of Restricted Share Award to non-employee directors pursuant to the 2004 Omnibus Stock and Incentive Plan (incorporated by reference to Exhibit 10(c) of Form 10-Q filed by the Company on August 6, 2013, File No. 001-12935). | |
10(v)** | 2013 Form of Deferred Stock Unit Award pursuant to the Director Deferred Compensation Plan (with respect to deferred long-term incentive awards) (incorporated by reference to Exhibit 10(d) of Form 10-Q filed by the Company on August 6, 2013, File No. 001-12935). | |
10(w)** | 2013 Form of Deferred Stock Unit Agreement pursuant to the Director Deferred Compensation Plan (with respect to deferred director fees) (incorporated by reference to Exhibit 10(e) of Form 10-Q filed by the Company on August 6, 2013, File No. 001-12935). | |
10(x)** | Officer Resignation Agreement, effective as of December 31, 2013, by and between Denbury Resources Inc. and Robert L. Cornelius (incorporated by reference to Exhibit 10(z) of Form 10-K filed by the Company on February 28, 2014, File No. 001-12935). | |
10(y)** | 2014 Form of Performance Cash Award under the 2004 Omnibus Stock and Incentive Plan for Denbury Resources Inc. (incorporated by reference to Exhibit 10(a) of Form 10-Q filed by the Company on May 12, 2014, File No. 001-12935). | |
10(z)** | 2014 Form of TSR Performance Award under the 2004 Omnibus Stock and Incentive Plan for Denbury Resources Inc. (incorporated by reference to Exhibit 10(b) of Form 10-Q filed by the Company on May 12, 2014, File No. 001-12935). | |
10(aa)** | 2014 Form of Performance Capital Efficiency Share Award under the 2004 Omnibus Stock and Incentive Plan for Denbury Resources Inc. (incorporated by reference to Exhibit 10(c) of Form 10-Q filed by the Company on May 12, 2014, File No. 001-12935). | |
10(bb)** | 2014 Form of Growth and Income Performance Share Award under the 2004 Omnibus Stock and Incentive Plan for Denbury Resources Inc. (incorporated by reference to Exhibit 10(d) of Form 10-Q filed by the Company on May 12, 2014, File No. 001-12935). | |
113
Exhibit No. | Exhibit | |
10(cc)** | 2014 Form of Restricted Share Award Cliff Vesting Awards under the 2004 Omnibus Stock and Incentive Plan for Denbury Resources Inc. (incorporated by reference to Exhibit 10(e) of Form 10-Q filed by the Company on May 12, 2014, File No. 001-12935). | |
10(dd)** | Officer Resignation Agreement, effective as of November 14, 2014, by and between Denbury Resources Inc. and K. Craig McPherson (incorporated by reference to Exhibit 10(oo) of Form 10-K filed by the Company on February 27, 2015, File No. 001-12935). | |
10(ee)** | Officer Resignation Agreement, effective as of November 14, 2014, by and between Denbury Resources Inc. and Charles E. Gibson (incorporated by reference to Exhibit 10(pp) of Form 10-K filed by the Company on February 27, 2015, File No. 001-12935). | |
10(ff)** | 2015 Form of Restricted Share Award to officers under the 2004 Omnibus Stock and Incentive Plan for Denbury Resources Inc. (incorporated by reference to Exhibit 10(d) of Form 10-Q filed by the Company on May 6, 2015, File No. 001-12935). | |
10(gg)** | 2015 Form of TSR Performance Award under the 2004 Omnibus Stock and Incentive Plan for Denbury Resources Inc. (incorporated by reference to Exhibit 10(e) of Form 10-Q filed by the Company on May 6, 2015, File No. 001-12935). | |
10(hh)** | 2015 Form of TSR Performance Award for Phil Rykhoek under the 2004 Omnibus Stock and Incentive Plan for Denbury Resources Inc. (incorporated by reference to Exhibit 10(f) of Form 10-Q filed by the Company on May 6, 2015, File No. 001-12935). | |
10(ii)** | 2015 Form of Capital Efficiency Performance Share Award under the 2004 Omnibus Stock and Incentive Plan for Denbury Resources Inc. (incorporated by reference to Exhibit 10(g) of Form 10-Q filed by the Company on May 6, 2015, File No. 001-12935). | |
10(jj)** | 2015 Form of Capital Efficiency Performance Share Award for Phil Rykhoek under the 2004 Omnibus Stock and Incentive Plan for Denbury Resources Inc. (incorporated by reference to Exhibit 10(h) of Form 10-Q filed by the Company on May 6, 2015, File No. 001-12935). | |
10(kk)** | 2015 Form of Growth and Income Performance Share Award under the 2004 Omnibus Stock and Incentive Plan for Denbury Resources Inc. (incorporated by reference to Exhibit 10(i) of Form 10-Q filed by the Company on May 6, 2015, File No. 001-12935). | |
10(ll)** | 2015 Form of Growth and Income Performance Share Award for Phil Rykhoek under the 2004 Omnibus Stock and Incentive Plan for Denbury Resources Inc. (incorporated by reference to Exhibit 10(j) of Form 10-Q filed by the Company on May 6, 2015, File No. 001-12935). | |
10(mm)** | Officer Resignation Agreement and General Release, effective as of September 21, 2015, by and between Denbury Resources Inc. and Bradford M. Kerr (incorporated by reference to Exhibit 10(a) of Form 10-Q filed by the Company on November 6, 2015, File No. 001-12935). | |
10(nn)** | Standalone Restricted Share New Hire Inducement Award Agreement between Denbury Resources Inc. and Christian S. Kendall, dated September 8, 2015 (incorporated by reference to Exhibit 10.1 of Form 8-K filed by the Company on September 8, 2015, File No. 001-12935). | |
21* | List of subsidiaries of Denbury Resources Inc. | |
23(a)* | Consent of PricewaterhouseCoopers LLP. | |
23(b)* | Consent of DeGolyer and MacNaughton. | |
31(a)* | Certification of Chief Executive Officer Pursuant to Section 302 of Sarbanes-Oxley Act of 2002. | |
114
Exhibit No. | Exhibit | |
31(b)* | Certification of Chief Financial Officer Pursuant to Section 302 of Sarbanes-Oxley Act of 2002. | |
32* | Certification of Chief Executive Officer and Chief Financial Officer Pursuant to Section 906 of the Sarbanes-Oxley Act of 2002. | |
99* | The summary of DeGolyer and MacNaughton’s Report as of December 31, 2015, on oil and gas reserves (SEC Case) dated January 25, 2016. | |
* Included herewith.
** Compensation arrangements.
115
SIGNATURES
Pursuant to the requirements of Section 13 or 15(d) of the Securities Exchange Act of 1934, Denbury Resources Inc. has duly caused this report to be signed on its behalf by the undersigned, thereunto duly authorized.
DENBURY RESOURCES INC. | ||
February 26, 2016 | /s/ Mark C. Allen | |
Mark C. Allen Sr. Vice President and Chief Financial Officer | ||
February 26, 2016 | /s/ Alan Rhoades | |
Alan Rhoades Vice President and Chief Accounting Officer | ||
Pursuant to the requirements of the Securities Exchange Act of 1934, this report has been signed below by the following persons on behalf of Denbury Resources Inc. and in the capacities and on the dates indicated.
February 26, 2016 | /s/ Phil Rykhoek | |
Phil Rykhoek Director, President and Chief Executive Officer (Principal Executive Officer) | ||
February 26, 2016 | /s/ Mark C. Allen | |
Mark C. Allen Sr. Vice President and Chief Financial Officer (Principal Financial Officer) | ||
February 26, 2016 | /s/ Alan Rhoades | |
Alan Rhoades Vice President and Chief Accounting Officer (Principal Accounting Officer) | ||
February 26, 2016 | /s/ Wieland F. Wettstein | |
Wieland F. Wettstein Director | ||
February 26, 2016 | /s/ Michael B. Decker | |
Michael B. Decker Director | ||
February 26, 2016 | /s/ John P. Dielwart | |
John P. Dielwart Director | ||
February 26, 2016 | /s/ Gregory L. McMichael | |
Gregory L. McMichael Director | ||
February 26, 2016 | /s/ Kevin O. Meyers | |
Kevin O. Meyers Director | ||
February 26, 2016 | /s/ Randy Stein | |
Randy Stein Director | ||
February 26, 2016 | /s/ Laura A. Sugg | |
Laura A. Sugg Director | ||
116
INDEX TO EXHIBITS
Exhibit No. | Exhibit | |
10(i) | Denbury Resources Inc. Director Deferred Compensation Plan, as amended and restated effective as of December 16, 2015. | |
21 | List of subsidiaries of Denbury Resources Inc. | |
23(a) | Consent of PricewaterhouseCoopers LLP. | |
23(b) | Consent of DeGolyer and MacNaughton. | |
31(a) | Certification of Chief Executive Officer Pursuant to Section 302 of Sarbanes-Oxley Act of 2002. | |
31(b) | Certification of Chief Financial Officer Pursuant to Section 302 of Sarbanes-Oxley Act of 2002. | |
32 | Certification of Chief Executive Officer and Chief Financial Officer Pursuant to Section 906 of the Sarbanes-Oxley Act of 2002. | |
99 | The summary of DeGolyer and MacNaughton’s Report as of December 31, 2015, on oil and gas reserves (SEC Case) dated January 25, 2016. | |
117