Attached files
| file | filename |
|---|---|
| EX-99.3 - EXHIBIT 99.3 - REDWOOD TRUST INC | q42018dividendpr.htm |
| EX-99.1 - EXHIBIT 99.1 - REDWOOD TRUST INC | q32018earningsrelease.htm |
| 8-K - 8-K - REDWOOD TRUST INC | q32018form8-kpr.htm |
Exhibit 99.2

T A B L E O F C O N T E N T S |
Introduction | |
Shareholder Letter | |
Quarterly Overview | |
Ñ Third Quarter Highlights | |
Ñ Quarterly Earnings and Analysis | |
Ñ Book Value | |
Ñ Capital Allocations | |
Ñ 2018 Financial Outlook | |
Financial Insights | |
Ñ Balance Sheet Analysis | |
Financial Tables | |
Appendix | |
Ñ Dividend Policy | |
Ñ Non-GAAP Measurements | |
Ñ Forward-Looking Statements | |
THE REDWOOD REVIEW I 3RD QUARTER 2018 |
1 |
C A U T I O N A R Y S T A T E M E N T |
This Redwood Review contains forward-looking statements within the meaning of the safe harbor provisions of the Private Securities Litigation Reform Act of 1995. Forward-looking statements involve numerous risks and uncertainties. Our actual results may differ from our expectations, estimates, and projections and, consequently, you should not rely on these forward-looking statements as predictions of future events. Forward-looking statements are not historical in nature and can be identified by words such as “anticipate,” “estimate,” “will,” “should,” “expect,” “believe,” “intend,” “seek,” “plan,” and similar expressions or their negative forms, or by references to strategy, plans, goals, or intentions. These forward-looking statements are subject to risks and uncertainties, including, among other things, those described in our Annual Report on Form 10-K under the caption “Risk Factors.” Other risks, uncertainties, and factors that could cause actual results to differ materially from those projected are described below and may be described from time to time in reports we file with the Securities and Exchange Commission, including reports on Forms 10-K, 10-Q, and 8-K. We undertake no obligation to update or revise forward-looking statements, whether as a result of new information, future events, or otherwise.
Statements regarding the following subjects, among others, are forward-looking by their nature: statements we make regarding Redwood’s business strategy and strategic focus, statements related to our financial outlook and expectations for 2018, statements regarding our available capital and sourcing additional capital both internally and from the capital markets, and other statements regarding pending business activities and expectations and estimates relating to our business and financial results. Additional detail regarding the forward-looking statements in this Redwood Review and the important factors that may affect our actual results in 2018 are described in the Appendix of this Redwood Review under the heading “Forward-Looking Statements.”
THE REDWOOD REVIEW I 3RD QUARTER 2018 |
2 |
I N T R O D U C T I O N |
Note to Readers:
We file annual reports (on Form 10-K) and quarterly reports (on Form 10-Q) with the Securities and Exchange Commission. These filings and our earnings press releases provide information about Redwood and our financial results in accordance with generally accepted accounting principles (GAAP). These documents, as well as information about our business and a glossary of terms we use in this and other publications, are available through our website, www.redwoodtrust.com. We encourage you to review these documents.
References herein to “Redwood,” the “company,” “we,” “us,” and “our” include Redwood Trust, Inc. and its consolidated subsidiaries. Note that because we round numbers in the tables to millions, except per share amounts, some numbers may not foot due to rounding. References to the “third quarter” refer to the quarter ended September 30, 2018, and references to the “second quarter” refer to the quarter ended June 30, 2018, unless otherwise specified.
We hope you find this Review helpful to your understanding of our business. We thank you for your input and suggestions, which have resulted in our changing the form and content of The Redwood Review over time.
Selected Financial Highlights | |||||||||||||
Quarter:Year | GAAP Income per Share | REIT Taxable Income per Share (1) | Annualized GAAP Return on Equity | GAAP Book Value per Share | Dividends per Share | Economic Return on Book Value (2) | |||||||
Q318 | $0.42 | $0.27 | 12% | $16.42 | $0.30 | 3.0% | |||||||
Q218 | $0.38 | $0.35 | 11% | $16.23 | $0.30 | 2.5% | |||||||
Q118 | $0.50 | $0.44 | 15% | $16.12 | $0.28 | 3.6% | |||||||
Q417 | $0.35 | $0.44 | 10% | $15.83 | $0.28 | 2.8% | |||||||
Q317 | $0.41 | $0.26 | 12% | $15.67 | $0.28 | 4.3% | |||||||
Q217 | $0.43 | $0.25 | 12% | $15.29 | $0.28 | 2.9% | |||||||
Q117 | $0.43 | $0.22 | 13% | $15.13 | $0.28 | 3.0% | |||||||
Q416 | $0.31 | $0.34 | 9% | $14.96 | $0.28 | 3.4% | |||||||
Q316 | $0.58 | $0.34 | 19% | $14.74 | $0.28 | 5.8% | |||||||
(1) | REIT taxable income per share for 2018 is an estimate until we file our tax return. |
(2) | Economic return on book value is based on the periodic change in GAAP book value per common share plus dividends declared per common share during the period. |
THE REDWOOD REVIEW I 3RD QUARTER 2018 |
3 |
S H A R E H O L D E R L E T T E R |
Dear Fellow Shareholders:
With a full quarter in the books as a management team, we’d be remiss not to convey our sincere appreciation for the support we’ve received from our long-term shareholders. Our game plan in the third quarter was a bit unconventional - we ran an up-tempo offense, squarely in the face of mortgage market headwinds. But the payoff has been tangible - third quarter earnings comfortably exceeded our recently increased quarterly dividend, book value rose for the 10th consecutive quarter, and we deployed $281 million of capital into new investments, the most for any quarter in Redwood’s 24-year history. Successfully deploying our capital where it is most impactful to the housing market and accretive for shareholders remains our top priority going forward.
Generating positive results in today’s market has proven challenging for many industry participants. Interest rates rose precipitously during the third quarter, further straining home affordability while sending refinance activity to 14-year lows. This environment has, for the first time in years, caused potential borrowers to question whether it’s still a good time to purchase a home. While these challenges have our foremost attention, they have not, in our opinion, significantly altered the credit quality of the housing sector - a typical concern as production channels become strained. Loans remain well underwritten and suitable for applicants, with very few exceptions. And many high-quality borrowers - both owner-occupants and housing investors - remain underserved. Highlighted by our Redwood Choice program and single-family rental initiative, we believe our product suite has plenty of room to run, and is responsive to trends that drive the flow of capital in housing.
Chief among these trends are constraints on the supply of homes and attendant changes in demand. As millennials age, the composition of new household formation (i.e., renting versus owning) is an open question, one driven by a variety of factors including personal choice and financial feasibility. So, while a recent uptick in homeownership may well prove sustainable, we aren’t betting on an eventual return to pre-crisis levels. As such, much of our R&D efforts are geared towards programs and financing solutions to serve both owner-occupants and housing investors.
THE REDWOOD REVIEW I 3RD QUARTER 2018 |
4 |
S H A R E H O L D E R L E T T E R |
For Redwood, the relative strength of mortgage credit spreads during an otherwise volatile period has underscored the inherent value of our business model, which allows us to create our own investments and more directly control production quality. We are further complementing this competency by deepening relationships that give us access to opportunities unavailable to others. Almost two-thirds of the quarter’s investments were in proprietary opportunities sourced either internally or through strategic partnerships that we continue to nurture and grow. And they spanned several areas of housing, including multifamily securities, business purpose mortgage loans, and securities backed by re-performing mortgage loans, highlighting the versatility of our approach. We also made significant progress on several meaningful initiatives that should bear fruit in the fourth quarter and early 2019. While our recent investments will contribute immediately to revenue and earnings growth, they also drive the scaling of our overall platform, a key strategic goal and a topic we’ve touched on a lot recently. Unlocking this operating leverage should result in significant additional earnings growth over time as we expand our assets under management.
The momentum we built in the third quarter allowed us to put the proceeds from our late-July equity offering to work in short order. As we look to the future and the opportunities before us, our perspective on raising common stock is unchanged. We only look to raise equity when we think it’s in the best interest of shareholders. This approach implies profitable growth (i.e., increased earnings per share and book value per share) that also embodies the risk posture we have employed throughout our history with respect to recourse debt. As our focus evolves toward larger and more repeatable investment opportunities, we should be able to attract dedicated forms of capital to finance them, further enabling us to achieve earnings growth for existing shareholders.
Balancing an expanding asset mix is our residential mortgage banking platform, which reprices risk daily and distributes it through the securitization and whole loan markets. This facet of our risk framework continues to serve us well, given the ripple effects of declining industry originations and a swath of mortgage lenders vying for their own share of a smaller origination pool. Adjusting to the reality of a declining origination market, we expect our full year jumbo loan purchases to be near the low end of our original $7 to $8 billion range for 2018. We’d note that, even at the low end of that range, loan purchases in 2018 continue to trend toward a record year - with full-year mortgage banking volumes currently expected to be about 20% higher than in 2017. We also expect full-year earnings for our mortgage banking business to be at the higher end of our originally forecasted range - an important testament to the long-term durability of our platform.
THE REDWOOD REVIEW I 3RD QUARTER 2018 |
5 |
S H A R E H O L D E R L E T T E R |
We are also keeping a watchful eye on Washington amid the outcome of the recent mid-term elections. With the Democrats retaking control of the U.S. House of Representatives, all signs now point towards housing finance developments occurring through Administration-based regulatory reforms, as the prospect of bipartisan legislation diminishes. Before our next Shareholder Letter is published, there may very well be a new head of the FHFA - the regulatory agency that oversees the two housing-related Government Sponsored Enterprises, Fannie Mae and Freddie Mac. This change could have widespread downstream effects related to GSE reform and increased private sector participation in the mortgage finance markets - which should be positive for private market credit-focused investors such as Redwood. In fact, we have already begun to see the FHFA sunset recent GSE initiatives in the single-family rental sector, and the resumption of one GSE distributing more subordinate credit risk on securities backed by conforming loans. We have not factored GSE reform efforts into our forecasting, as there is a wide range of possible outcomes. But we continue to stay close to policymakers in Washington and expect to be a major part of any private capital solutions that may arise.
All told, it’s an exciting time for Redwood as we work to reoptimize our role in housing finance. Though the current environment is challenging and fluid, it’s one in which our strongest competitive advantage shines through. The quality of our people drives our workflows and analytics, and cultivates the partnerships critical to our business plan. These reinforce the quality of our earnings, as measured by their durability and diversification for shareholders.
We appreciate your partnership on this journey.
 |  | |
Christopher J. Abate | Dashiell I. Robinson | |
Chief Executive Officer | President | |
THE REDWOOD REVIEW I 3RD QUARTER 2018 |
6 |
Q U A R T E R L Y O V E R V I E W |
Third Quarter Highlights
Key Earnings and Financial Metrics | ||||||||
Three Months Ended | ||||||||
9/30/2018 | 6/30/2018 | |||||||
GAAP Earnings per Share | $ | 0.42 | $ | 0.38 | ||||
Non-GAAP Core Earnings per Share (1) | $ | 0.39 | $ | 0.41 | ||||
Book Value per Share | $ | 16.42 | $ | 16.23 | ||||
Economic Return on Book Value (2) | 3.0 | % | 2.5 | % | ||||
Recourse leverage (3) | 3.1x | 3.4x | ||||||
Ñ | Increased capital deployment and improved asset pricing in our investment portfolio, coupled with solid mortgage banking results, drove strong earnings and book value growth, leading to a 3.0% total economic return for the quarter. |
Ñ | We deployed a record $281 million of capital into new investments in the third quarter of 2018, bringing year-to-date deployment to $575 million through the end of September 2018. |
Ñ | Through our partnership with 5 Arches, we began acquiring single-family rental loans and made an initial investment in a portfolio of fix-and-flip loans. |
Ñ | Residential jumbo loan purchase commitments were $1.5 billion, and we purchased $1.8 billion of jumbo loans during the third quarter of 2018. |
Ñ | We closed three Sequoia securitizations of residential jumbo loans, totaling $1.1 billion, during the third quarter, including our 50th post-crisis securitization, and sold $0.8 billion of jumbo whole loans to third parties. |
Ñ | In July, we raised $117 million of equity capital in our first follow-on offering of common stock since 2009. |
_____________________
(1) For details on GAAP and non-GAAP core earnings, see the Quarterly Earnings and Analysis section that follows on page 8 and the Non-GAAP Measurements section of the Appendix.
(2) Economic return on book value is based on the periodic change in GAAP book value per common share plus dividends declared per common share during the period.
(3) | Recourse debt excludes $3.4 billion of consolidated debt (ABS issued) that is non-recourse to Redwood. |
THE REDWOOD REVIEW I 3RD QUARTER 2018 |
7 |
Q U A R T E R L Y O V E R V I E W |
Quarterly Earnings and Analysis
Below we present GAAP net income and non-GAAP core earnings for the third and second quarters of 2018.
GAAP Net Income | ||||||||
($ in millions, except per share data) | ||||||||
Three Months Ended | ||||||||
9/30/2018 | 6/30/2018 | |||||||
Interest income | $ | 99 | $ | 83 | ||||
Interest expense | (64 | ) | (48 | ) | ||||
Net interest income | 35 | 35 | ||||||
Non-interest income | ||||||||
Mortgage banking activities, net | 11 | 11 | ||||||
Investment fair value changes, net | 10 | 1 | ||||||
Other income, net | 3 | 3 | ||||||
Realized gains, net | 7 | 5 | ||||||
Total non-interest income, net | 32 | 20 | ||||||
Operating expenses | (21 | ) | (19 | ) | ||||
Provision for income taxes | (5 | ) | (3 | ) | ||||
GAAP net income | $ | 41 | $ | 33 | ||||
GAAP net income per diluted common share | $ | 0.42 | $ | 0.38 | ||||
Non-GAAP Core Earnings (1) | ||||||||
($ in millions, except per share data) | ||||||||
Three Months Ended | ||||||||
9/30/2018 | 6/30/2018 | |||||||
Economic net interest income (1) | $ | 33 | $ | 32 | ||||
Non-interest income | ||||||||
Mortgage banking activities, net | 11 | 11 | ||||||
Core other fair value changes, net (1) | — | — | ||||||
Other income, net | 3 | 3 | ||||||
Core realized gains, net (1) | 15 | 12 | ||||||
Total non-interest income, net | 30 | 26 | ||||||
Operating expenses | (21 | ) | (19 | ) | ||||
Core provision for income taxes (1) | (5 | ) | (2 | ) | ||||
Core earnings (1) | $ | 37 | $ | 36 | ||||
Core EPS (2) | $ | 0.39 | $ | 0.41 | ||||
(1) | Additional information on Redwood's non-GAAP measures, including: economic net interest income; core other fair value changes, net; core realized gains, net; core provision for income taxes; and core earnings as well as reconciliations to associated GAAP measures, is included in the Non-GAAP Measurements section of the Appendix. |
(2) | Additional information on the calculation of non-GAAP core EPS can be found in Table 2 in the Financial Tables section of this Redwood Review. |
THE REDWOOD REVIEW I 3RD QUARTER 2018 |
8 |
Q U A R T E R L Y O V E R V I E W |
Ñ | Economic net interest income (which represents GAAP net interest income adjusted to include i) the change in basis for fair value investments, and ii) net interest received or paid on hedges associated with fair value investments) increased to $33 million for the third quarter of 2018, from $32 million for the second quarter of 2018. The increase was primarily due to the benefit of continued net capital deployment at our investment portfolio, partially offset by higher interest expense on the convertible debt we issued late in the second quarter. Gross interest income and interest expense increased meaningfully from the second quarter to the third quarter of 2018, primarily due to the consolidation of two Choice securitizations and two Agency multifamily securitizations we invested in during the third quarter of 2018. |
Ñ | Mortgage banking activities, net, was $11 million for the third quarter of 2018, consistent with the second quarter of 2018. Improving securitization and whole loan execution in the third quarter generated higher gross margins, which was partially offset by a decline in loan purchase commitments during the third quarter. |
Ñ | GAAP investment fair value changes, net increased to $10 million for the third quarter of 2018, from $1 million for the second quarter of 2018, primarily due to spread tightening on our securities portfolio in the third quarter. On a non-GAAP core earnings basis, we eliminate the mark-to-market changes on long-term investments (and associated derivatives), and allocate the remaining portion of mark-to-market adjustments associated with the changes in basis and hedge expense on fair value instruments to economic net interest income. |
Ñ | Realized gains in the third quarter were $7 million on a GAAP basis and $15 million on a non-GAAP core basis, resulting from the sale of $114 million of securities, which freed up $106 million of capital for reinvestment after the repayment of associated debt. |
Ñ | Operating expenses increased to $21 million in the third quarter of 2018 from $19 million in the second quarter of 2018, primarily resulting from higher variable compensation expense commensurate with higher earnings in the third quarter. |
Ñ | The increase in the tax provision to $5 million during the third quarter of 2018, from $3 million for the second quarter of 2018, was primarily due to higher realized gains from security sales and spread tightening during the third quarter on securities held at our taxable subsidiary. A reconciliation of GAAP and taxable income is set forth in Table 6 in the Financial Tables section of this Redwood Review. |
Ñ | Additional details on our earnings are included in the Segment Results section that follows. |
THE REDWOOD REVIEW I 3RD QUARTER 2018 |
9 |
Q U A R T E R L Y O V E R V I E W |
Segment Results *
Investment Portfolio
The following table presents segment contribution from our investment portfolio for the third and second quarters of 2018.
Investment Portfolio Segment Contribution | ||||||||
($ in millions) | ||||||||
Three Months Ended | ||||||||
9/30/2018 | 6/30/2018 | |||||||
GAAP net interest income | $ | 39 | $ | 38 | ||||
Change in basis and hedge expense | (2 | ) | (2 | ) | ||||
Economic net interest income (1) | 37 | 35 | ||||||
Other fair value changes, net (1) | 12 | 4 | ||||||
Other income, net | 3 | 3 | ||||||
Realized gains, net | 7 | 5 | ||||||
Operating expenses | (3 | ) | (2 | ) | ||||
Provision for income taxes | (3 | ) | (1 | ) | ||||
Segment contribution | $ | 54 | $ | 44 | ||||
Core earnings adjustments (2) | ||||||||
Eliminate mark-to-market changes on long-term investments and associated derivatives | (12 | ) | (4 | ) | ||||
Include cumulative gain (loss) on long-term investments sold, net | 8 | 7 | ||||||
Income taxes associated with core earnings adjustments | — | — | ||||||
Non-GAAP core segment contribution | $ | 50 | $ | 47 | ||||
(1) | Consistent with management's definition of economic net interest income and other fair value changes, net set forth in the Non-GAAP Measurements section of the Appendix, these measures, as presented above, are calculated in the same manner, inclusive only of amounts allocable to this segment. |
(2) | Consistent with management's definition of core earnings set forth on page 36, non-GAAP core segment contribution reflects GAAP segment contribution adjusted to reflect the portion of core earnings adjustments allocable to this segment. |
Ñ | Segment contribution from our investment portfolio improved during the third quarter, as higher net capital deployment drove increased net interest income, continued portfolio optimization resulted in elevated gains, and spread tightening in our securities portfolio benefited valuations. |
Ñ | Credit fundamentals in our investment portfolio remain strong, benefiting from continued strength in the general economy and in housing. |
_____________________
* | We report on our business using two distinct segments: Investment Portfolio and Mortgage Banking. Table 3 in the Financial Tables section of this Redwood Review includes a comprehensive presentation of our segment results reconciled to net income. |
THE REDWOOD REVIEW I 3RD QUARTER 2018 |
10 |
Q U A R T E R L Y O V E R V I E W |
Investment Portfolio Capital Deployment
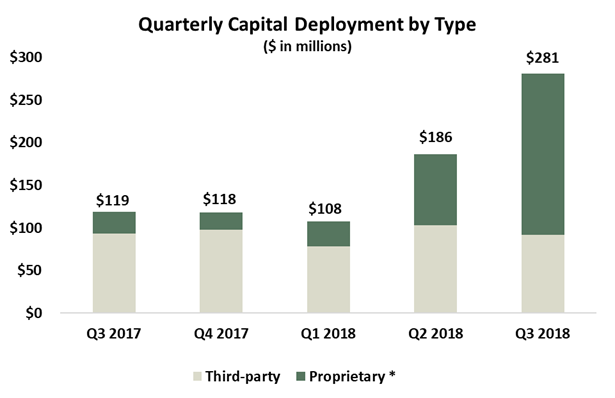
Ñ | We deployed $189 million of capital into proprietary investments in the third quarter, including $30 million into Sequoia RMBS, $47 million into fix-and-flip loans originated and asset-managed by 5 Arches, $55 million into multifamily b-pieces, and a $58 million deposit towards a re-performing loan pool investment that will settle in full during the fourth quarter of 2018. |
Ñ | We deployed $92 million into third-party investments in the third quarter, including $12 million of residential securities, $71 million of Agency CRT securities, and $9 million of Agency multifamily securities. |
Ñ | Our investment in these multifamily b-pieces required us to consolidate $942 million of Agency multifamily loans, and $876 million of non-recourse Agency-issued ABS debt. In addition to the first-loss b-pieces, we hold second-loss securities in one of these consolidated Agency securitizations. |
Ñ | In association with the $58 million deposit we made in the third quarter, we expect to deploy an additional $75 million of capital in the fourth quarter of 2018 to close our re-performing loan pool investment. Ultimately, our investment in this re-performing loan pool will consist of subordinate securities issued in an Agency securitization collateralized by these re-performing residential mortgage loans. |
_____________________
* Proprietary investments include investments sourced either internally or through strategic relationships.
THE REDWOOD REVIEW I 3RD QUARTER 2018 |
11 |
Q U A R T E R L Y O V E R V I E W |
Mortgage Banking
Mortgage Banking Segment Contribution | ||||||||
($ in millions) | ||||||||
Three Months Ended | ||||||||
9/30/2018 | 6/30/2018 | |||||||
Net interest income | $ | 7 | $ | 5 | ||||
Mortgage banking activities, net | 11 | 11 | ||||||
Operating expenses | (7 | ) | (6 | ) | ||||
Provision for income taxes | (2 | ) | (1 | ) | ||||
Segment contribution | $ | 9 | $ | 9 | ||||
Loan purchase commitments | $ | 1,457 | $ | 2,011 | ||||
Ñ | Segment contribution from our mortgage banking business remained consistent during the third quarter of 2018 as a benefit from higher gross margins relative to the second quarter of 2018 was partially offset by lower jumbo residential loan purchase commitments. We define gross margins for this segment as net interest income plus mortgage banking activities, net, divided by loan purchase commitments. |
Ñ | Jumbo residential loan purchase volumes in the third quarter of 2018, as presented below, decreased 8% from the prior quarter and increased 23% from the same quarter last year. At September 30, 2018, our pipeline of jumbo residential loans identified for purchase was $0.8 billion. |
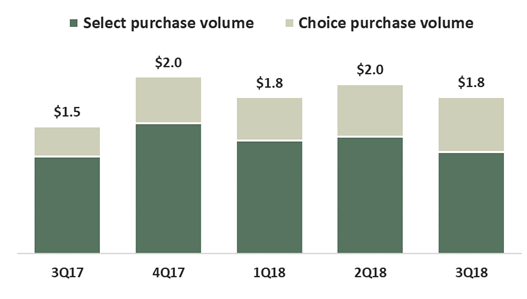
Ñ | During the third quarter of 2018, we completed $1.9 billion of jumbo residential loan sales, including one Select securitization, two Choice securitizations, and $0.8 billion of whole loan sales to third parties. |
THE REDWOOD REVIEW I 3RD QUARTER 2018 |
12 |
Q U A R T E R L Y O V E R V I E W |
Book Value
Consistent earnings and a credit-focused investment strategy that is less sensitive to interest rate changes have allowed us to grow book value for 10 consecutive quarters. The following chart presents our quarter-end book values over the last year.
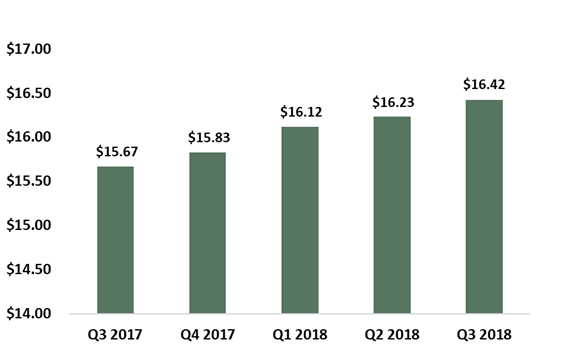
Ñ | Our GAAP book value increased $0.19 per share to $16.42 per share during the third quarter of 2018. This increase was driven primarily by earnings exceeding the dividend and an increase in the value of derivatives hedging our long-term debt.(1) |
Ñ | Our economic return on book value(2) was 3.0% during the third quarter of 2018, and represented our 10th consecutive quarter of positive economic returns. |
Ñ | As housing credit investors, we employ hedging strategies that seek to minimize our exposure to interest rates, and our book value is most sensitive to changes in actual and perceived credit performance and the outlook for economic growth. While rates have risen over the past several quarters, we have also seen strong economic growth and improved housing credit performance, which has supported strong book value growth for Redwood during that time. |
_____________________
(1) A detailed rollforward of book value per share is included in Table 5 in the Financial Tables section of this Redwood Review.
(2) | Economic return on book value is based on the periodic change in GAAP book value per common share plus dividends declared per common share during the period. |
THE REDWOOD REVIEW I 3RD QUARTER 2018 |
13 |
Q U A R T E R L Y O V E R V I E W |
Capital Allocations
We use a combination of equity and corporate debt (which we collectively refer to as “capital”) to fund our business.
Capital Allocation: By Source and By Business Use
(as of September 30, 2018)
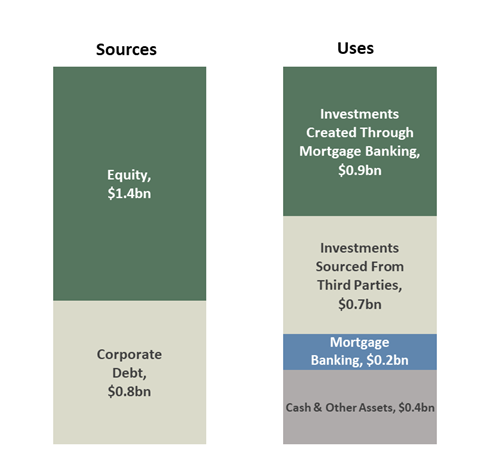
Ñ | Our total capital of $2.1 billion at September 30, 2018 included $1.4 billion of equity capital and $0.8 billion of the total $2.8 billion of long-term debt on our consolidated balance sheet. This $0.8 billion portion of debt includes $201 million of exchangeable debt due in 2019, $245 million of convertible debt due in 2023, $200 million of convertible debt due in 2024, and $140 million of trust-preferred securities due in 2037 and has a weighted average cost of approximately 6.1%. |
Ñ | We also utilize various forms of short-term and long-term collateralized debt to finance certain investments and to warehouse our inventory of certain residential loans held-for-sale. We do not consider this collateralized debt as "capital" and, therefore, exclude it from our capital allocation analysis. |
Ñ | The Balance Sheet Analysis portion of the Financial Insights section that follows describes our long-term and short-term borrowings in further detail. |
THE REDWOOD REVIEW I 3RD QUARTER 2018 |
14 |
Q U A R T E R L Y O V E R V I E W |
Capital Allocation Detail | ||||||||||||||
By Investment Type | ||||||||||||||
September 30, 2018 | ||||||||||||||
($ in millions) | ||||||||||||||
GAAP Fair Value | Collateralized Debt | Allocated Capital | % of Total Capital | |||||||||||
Residential loans (1) | $ | 2,430 | $ | (2,000 | ) | $ | 430 | 20% | ||||||
Securities portfolio | ||||||||||||||
Third party residential securities | 758 | (256 | ) | 502 | 24% | |||||||||
Sequoia residential securities (2) | 489 | (180 | ) | 309 | 14% | |||||||||
Multifamily securities | 484 | (344 | ) | 139 | 7% | |||||||||
Total securities portfolio | 1,731 | (781 | ) | 951 | 45% | |||||||||
Business purpose loans | 96 | (49 | ) | 46 | 2% | |||||||||
Other investments | 141 | — | 141 | 7% | ||||||||||
Other assets/(liabilities) | 159 | (38 | ) | 121 | 6% | |||||||||
Cash and liquidity capital | 234 | N/A | ||||||||||||
Total Investments | $ | 4,557 | $ | (2,868 | ) | $ | 1,922 | 90% | ||||||
Mortgage banking | $ | 210 | 10% | |||||||||||
Total | $ | 2,132 | 100% | |||||||||||
(1) | Includes $43 million of FHLB stock, $42 million of cash and cash equivalents, and $25 million of restricted cash. |
(2) | In addition to our $1.5 billion of securities on our GAAP balance sheet, securities presented above also include $195 million and $67 million of securities retained from Sequoia Choice and Freddie Mac K-Series securitizations, respectively. For GAAP purposes, we consolidate these securitizations. |
Ñ | In July of 2018, we issued $117 million of common equity. |
Ñ | Additionally, during the third quarter of 2018, we continued to optimize our portfolio by selling appreciated, lower-yielding securities and deploying capital into higher-yielding alternatives, including into new initiatives. (See Tables 8 and 9 in the Financial Tables section for additional detail on asset activity and balances.) |
Ñ | As of September 30, 2018, our cash and liquidity capital included $150 million of available capital. We may seek to raise additional capital to make long-term investments or for other purposes. To the extent we seek additional capital to fund our operations and investment activities, our approach to raising capital will continue to be based on what we believe to be in the best interest of our shareholders. |
THE REDWOOD REVIEW I 3RD QUARTER 2018 |
15 |
Q U A R T E R L Y O V E R V I E W |
2018 Financial Outlook(1)
Our results through the first nine months of 2018 have already exceeded our expected full year dividend payments of $1.18 per share, and we are on track to achieve our key operating metrics for 2018 that we provided in our fourth quarter 2017 Redwood Review. Below we provide an update on these metrics:
Mortgage Banking
Our mortgage banking business had solid performance in the first nine months of 2018. Gross margins were above our long-term expected range of 75 to 100 basis points and annualized returns-to-date on allocated capital(2) were also above our target range of 10% to 20%. For the full year of 2018 we expect margins and returns on allocated capital to be at the higher-end of our expected range. Our year-to-date purchase volume of $5.6 billion (including $1.8 billion of Redwood Choice loans) puts us on track to meet our full-year target, albeit at the lower-end of our expected $7 to $8 billion range.
Investment Portfolio
Our investment portfolio performed well in the first nine months of 2018, generating annualized returns on allocated capital(3) in-line with our expectations of 9% to 11%. For the full year of 2018, we continue to expect portfolio returns to be in line with our 2018 return expectations. This assumes additional realized gains from portfolio optimization and a benefit from higher yields as we redeploy capital into new opportunities.
Corporate
Total operating expenses were $64 million in the first nine months of 2018, and included $21 million of mortgage banking expenses and $7 million of portfolio expenses (each of which are included in the segment returns provided above), as well as $36 million of corporate expenses. We currently expect full-year corporate operating expenses of between $45 and $50 million, with variable compensation commensurate with company performance.
_____________________
(1) | As with all forward-looking statements, our forward-looking statements relating to our 2018 financial outlook are subject to risks and uncertainties, including, among other things, those described in our Annual Report on Form 10-K under the caption “Risk Factors” and other risks, uncertainties, and factors that could cause actual results to differ materially from those described above and under the heading "Forward-Looking Statements" in the Appendix to this Redwood Review, including those described in the “Cautionary Statement” at the beginning of this Redwood Review. Although we may update our 2018 financial outlook subsequently in 2018, as a general matter we undertake no obligation to update or revise forward-looking statements, whether as a result of new information, future events, or otherwise. |
(2) | Includes net interest income, mortgage banking activities, direct operating expenses, and taxes. Excludes corporate operating expenses. Returns are calculated based on average capital allocated during the period. |
(3) | Includes net interest income, changes in fair value of the investments and their associated hedges that flow through GAAP earnings, realized gains, direct operating expenses, taxes, and other income. Excludes unrealized gains and losses on our AFS securities portfolio, and corporate operating expenses. Returns are calculated based on average capital allocated during the period. |
THE REDWOOD REVIEW I 3RD QUARTER 2018 |
16 |
F I N A N C I A L I N S I G H T S |
Balance Sheet Analysis
The following table presents our consolidated balance sheets at September 30, 2018 and June 30, 2018.
Consolidated Balance Sheets (1) | ||||||||
($ in millions) | ||||||||
9/30/2018 | 6/30/2018 | |||||||
Residential loans | $ | 5,922 | $ | 5,491 | ||||
Business purpose loans | 116 | — | ||||||
Multifamily loans | 942 | — | ||||||
Real estate securities | 1,470 | 1,454 | ||||||
Cash and cash equivalents | 174 | 185 | ||||||
Other assets | 516 | 383 | ||||||
Total assets | $ | 9,140 | $ | 7,513 | ||||
Short-term debt | ||||||||
Mortgage loan warehouse debt | $ | 578 | $ | 719 | ||||
Security repurchase facilities | 781 | 707 | ||||||
Business purpose loan warehouse facilities | 65 | — | ||||||
Other liabilities | 176 | 157 | ||||||
Asset-backed securities issued | 3,407 | 1,930 | ||||||
Long-term debt, net | 2,771 | 2,770 | ||||||
Total liabilities | 7,778 | 6,284 | ||||||
Stockholders’ equity | 1,361 | 1,229 | ||||||
Total liabilities and equity | $ | 9,140 | $ | 7,513 | ||||
(1) | Our consolidated balance sheets include assets of consolidated variable interest entities (“VIEs”) that can only be used to settle obligations of these VIEs and liabilities of consolidated VIEs for which creditors do not have recourse to the primary beneficiary (Redwood Trust, Inc.). At September 30, 2018 and June 30, 2018, assets of consolidated VIEs totaled $3.7 billion and $2.1 billion, respectively, and liabilities of consolidated VIEs totaled $3.4 billion and $1.9 billion, respectively. See Table 10 in the Financial Tables section of this Redwood Review for additional detail on consolidated VIEs. |
Ñ | During the third quarter of 2018, we invested in the subordinate bonds of two Agency multifamily securitizations and were required to consolidate the securitizations under GAAP. See Table 9 in the Financial Tables section of this Redwood Review for additional information on these securitizations. |
THE REDWOOD REVIEW I 3RD QUARTER 2018 |
17 |
F I N A N C I A L I N S I G H T S |
Recourse Financing
We finance our business with a diversified mix of long-term and short-term recourse debt. The following charts present the composition of our recourse debt and its characteristics at the end of the third quarter:
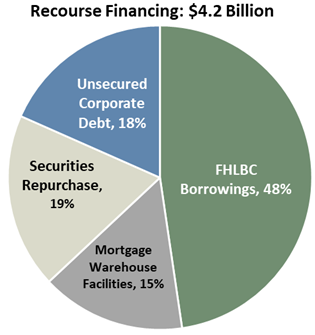 | |||
Borrowing Type | Average Cost of Funds | Average Remaining Term (yrs.) | |
FHLBC Borrowings | 2.2% | 7 | |
Unsecured Corporate Debt | 6.1% | 7 | |
Mortgage Warehouse | 3.9% | <1 | |
Securities Repurchase | 3.3% | <1 | |
Weighted Average Cost of Funds | 3.4% | ||
Ñ | Our long-term unsecured corporate debt is comprised of $200 million of 5.625% convertible notes due in 2024, $245 million of 4.75% convertible notes due in 2023, $201 million of 5.625% exchangeable notes due in 2019, and $140 million of trust-preferred securities due in 2037 (that we hedge to yield approximately 6.9%). |
Ñ | Our FHLBC borrowings and securities repurchase debt are used to finance our whole loan and securities investments, respectively, and we utilize mortgage warehouse facilities to finance our mortgage banking activities. These are discussed in further detail in the following sections. |
Ñ | Our recourse debt to equity leverage ratio was 3.1x at the end of the third quarter of 2018, a reduction from 3.4x at the end of the second quarter. We expect our leverage to increase as our available capital is fully deployed. |
Ñ | In addition to our recourse financing, we have ABS debt issued by securitization entities that we consolidate that is non-recourse to us. |
THE REDWOOD REVIEW I 3RD QUARTER 2018 |
18 |
F I N A N C I A L I N S I G H T S |
Residential Loan Investments
Ñ | At September 30, 2018, we had $2.3 billion of residential loans held-for-investment. These loans are prime-quality, first lien jumbo loans, most of which were originated between 2013 and 2018. At September 30, 2018, 87% of these loans were fixed-rate and the remainder hybrid, and in aggregate, had a weighted average coupon of 4.09%. |
Ñ | At September 30, 2018, the weighted average FICO score of borrowers backing these loans was 769 (at origination) and the weighted average loan-to-value ("LTV") ratio of these loans was 66% (at origination). At September 30, 2018, 0.01% of these loans (by unpaid principal balance) were more than 90 days delinquent. |
Ñ | We finance our residential loan investments with $2.0 billion of FHLB debt through our FHLB-member subsidiary. The interest cost for these borrowings resets every 13 weeks, and we seek to effectively fix the interest cost of this debt over its weighted average maturity by using a combination of swaps, TBAs, and other derivative instruments. |
Ñ | In connection with these borrowings, our FHLB-member subsidiary is required to hold $43 million of FHLB stock. |
Business Purpose Loan Investments
Ñ | At September 30, 2018, our $96 million of business purpose loans held-for-investment were comprised of short-term, fix-and-flip loans, most of which were originated in 2018. At September 30, 2018, the weighted average coupon on these loans was 9.14%, and the LTV ratio was 76% (at origination). |
Ñ | We finance our business purpose loan investments with $49 million of short-term warehouse debt. |
Other Investments
Ñ | At September 30, 2018, we had $141 million of other investments, including $64 million of MSRs retained from our Sequoia securitizations, $39 million of investments in customized financing for our jumbo loan sellers, our $11 million investment in 5 Arches, and $28 million related to our net investment in GSE risk share transactions completed in 2015 and 2016. |
THE REDWOOD REVIEW I 3RD QUARTER 2018 |
19 |
F I N A N C I A L I N S I G H T S |
Securities Portfolio
At September 30, 2018, we had $1.7 billion invested in real estate securities. We categorize these securities by (i) whether they were issued through our Sequoia platform, by third parties, or by an Agency in a CRT, and (ii) by priority of cash flow (senior, mezzanine, and subordinate). The following table presents the fair value of our real estate securities at September 30, 2018.
Securities Portfolio - By Source and Security Type | |||||||||||||||||||||||
September 30, 2018 | |||||||||||||||||||||||
($ in millions) | |||||||||||||||||||||||
Interest-Only Securities | Senior | Mezzanine | Subordinate | Total | % of Total Securities | ||||||||||||||||||
Sequoia (1) | $ | 82 | $ | — | $ | 232 | $ | 175 | $ | 489 | 27 | % | |||||||||||
Third Party New Issue (2) | 34 | 77 | 122 | 158 | 390 | 23 | % | ||||||||||||||||
Third Party Legacy (2) | 2 | 115 | — | 16 | 133 | 8 | % | ||||||||||||||||
Agency CRT (3) | — | — | — | 236 | 236 | 14 | % | ||||||||||||||||
Total residential securities | $ | 117 | $ | 192 | $ | 354 | $ | 585 | $ | 1,248 | 72 | % | |||||||||||
Multifamily securities (3)(4) | — | — | 429 | 55 | 484 | 28 | % | ||||||||||||||||
Total securities portfolio | $ | 117 | $ | 192 | $ | 783 | $ | 640 | $ | 1,731 | 100 | % | |||||||||||
(1) | Presents securities retained from our Sequoia securitizations that were issued from 2012 through 2018. These securities included $19 million of interest-only securities, $133 million of mezzanine securities, and $43 million of subordinate securities retained from our Sequoia Choice securitizations, which were consolidated for GAAP purposes. |
(2) | Presents RMBS issued by third parties after 2012 as New Issue and prior to 2008 as Legacy. |
(3) | Agency CRT and Multifamily securities were issued after 2012. |
(4) | Multifamily securities include $12 million of mezzanine securities and $55 million of subordinate securities issued from Agency multifamily securitizations that are consolidated for GAAP purposes. |
At September 30, 2018, our securities consisted of fixed-rate assets (75%), adjustable-rate assets (19%), hybrid assets that reset within the next year (5%), and hybrid assets that reset between 12 and 36 months (1%). For the portions of our securities portfolio that are sensitive to changes in interest rates, we seek to minimize this interest rate risk by using various derivative instruments.
We finance our holdings of real estate securities with a combination of capital and collateralized debt in the form of repurchase (or “repo”) financing. At September 30, 2018, we had short-term debt incurred through repurchase facilities of $781 million, which was secured by $918 million of real estate securities. The remaining $813 million of securities were financed with capital.
THE REDWOOD REVIEW I 3RD QUARTER 2018 |
20 |
F I N A N C I A L I N S I G H T S |
The following table presents the fair value of our real estate securities that are financed with repurchase debt, at September 30, 2018.
Real Estate Securities Financed with Repurchase Debt | |||||||||||||||||||
September 30, 2018 | |||||||||||||||||||
($ in millions, except weighted average price) | |||||||||||||||||||
Real Estate Securities | Repurchase Debt | Allocated Capital | Weighted Average Price (1) | Financing Haircut (2) | |||||||||||||||
Residential securities | |||||||||||||||||||
Senior | $ | 174 | $ | (160 | ) | $ | 15 | $ | 98 | 9 | % | ||||||||
Mezzanine | 319 | (277 | ) | 42 | $ | 96 | 13 | % | |||||||||||
Total residential securities | 493 | (437 | ) | 57 | |||||||||||||||
Multifamily securities | 425 | (344 | ) | 81 | $ | 97 | 19 | % | |||||||||||
Total | $ | 918 | $ | (781 | ) | $ | 138 | $ | 95 | 15 | % | ||||||||
(1) | GAAP fair value per $100 of principal. |
(2) | Allocated capital divided by GAAP fair value. |
Ñ | In addition to the allocated capital listed in the table above that directly supports our repurchase facilities (i.e., “the haircut”), we continue to hold a designated amount of supplemental risk capital available for potential margin calls or future obligations relating to these facilities. |
Ñ | At September 30, 2018, we had securities repurchase facilities with eight different counterparties. |
Ñ | Additional information on the residential securities we own is set forth in Table 9 in the Financial Tables section of this Redwood Review. |
THE REDWOOD REVIEW I 3RD QUARTER 2018 |
21 |
F I N A N C I A L I N S I G H T S |
Residential Loans Held-for-Sale
Ñ | At September 30, 2018, we had $866 million of residential mortgages held-for-sale financed with $578 million of warehouse debt. These loans included $720 million of Select loans, and $147 million of expanded-prime Choice loans. |
Ñ | Our warehouse capacity at September 30, 2018 totaled $1.4 billion across four separate counterparties. |
Ñ | At September 30, 2018, our pipeline of jumbo residential loans identified for purchase was $0.8 billion. |
Ñ | We seek to minimize the exposure we have to interest rates on our loan pipeline (for loans both on balance sheet and identified for purchase) by using a combination of TBAs, interest rate swaps, and other derivative instruments. |
Ñ | At September 30, 2018, we had 492 loan sellers, which included 188 jumbo sellers and 304 MPF Direct sellers from various FHLB districts. |
Business Purpose Loans Held-for-Sale
Ñ | At September 30, 2018, we had $20 million of business purpose loans held-for-sale, collateralized by single-family rental properties. |
Ñ | At September 30, 2018, the weighted average coupon on these loans was 5.71% and the LTV was 65% (at origination). |
Ñ | We financed these loans with $16 million of short-term warehouse debt. |
THE REDWOOD REVIEW I 3RD QUARTER 2018 |
22 |
G L O S S A R Y |

THE REDWOOD REVIEW I 3RD QUARTER 2018 |
23 |
 | Table 1: GAAP Earnings (in thousands, except per share data) | |||||||||||||||||||||||||||||||||||||||||||||
2018 Q3 | 2018 Q2 | 2018 Q1 | 2017 Q4 | 2017 Q3 | 2017 Q2 | 2017 Q1 | 2016 Q4 | 2016 Q3 | Nine Months 2018 | Nine Months 2017 | ||||||||||||||||||||||||||||||||||||
Interest income | $ | 96,074 | $ | 79,128 | $ | 72,559 | $ | 67,370 | $ | 58,106 | $ | 54,419 | $ | 49,367 | $ | 50,612 | $ | 54,781 | $ | 247,761 | $ | 161,892 | ||||||||||||||||||||||||
Discount amortization on securities, net | 3,323 | 3,848 | 4,060 | 4,098 | 4,631 | 4,805 | 5,261 | 5,722 | 6,125 | 11,231 | 14,697 | |||||||||||||||||||||||||||||||||||
Total interest income | 99,397 | 82,976 | 76,619 | 71,468 | 62,737 | 59,224 | 54,628 | 56,334 | 60,906 | 258,992 | 176,589 | |||||||||||||||||||||||||||||||||||
Interest expense on short-term debt | (14,146 | ) | (12,666 | ) | (10,424 | ) | (9,841 | ) | (7,158 | ) | (6,563 | ) | (4,453 | ) | (4,848 | ) | (5,405 | ) | (37,236 | ) | (18,174 | ) | ||||||||||||||||||||||||
Interest expense on short-term convertible notes (1) | — | (509 | ) | (3,011 | ) | (3,025 | ) | (3,024 | ) | (2,787 | ) | — | — | — | (3,520 | ) | (5,811 | ) | ||||||||||||||||||||||||||||
Interest expense on ABS issued from consolidated trusts | (27,421 | ) | (16,349 | ) | (11,401 | ) | (7,917 | ) | (3,956 | ) | (3,705 | ) | (3,530 | ) | (3,278 | ) | (3,193 | ) | (55,171 | ) | (11,191 | ) | ||||||||||||||||||||||||
Interest expense on long-term debt | (22,784 | ) | (18,689 | ) | (16,678 | ) | (15,325 | ) | (13,305 | ) | (11,179 | ) | (13,048 | ) | (12,411 | ) | (12,999 | ) | (58,151 | ) | (37,532 | ) | ||||||||||||||||||||||||
Total interest expense | (64,351 | ) | (48,213 | ) | (41,514 | ) | (36,108 | ) | (27,443 | ) | (24,234 | ) | (21,031 | ) | (20,537 | ) | (21,597 | ) | (154,078 | ) | (72,708 | ) | ||||||||||||||||||||||||
Net interest income | 35,046 | 34,763 | 35,105 | 35,360 | 35,294 | 34,990 | 33,597 | 35,797 | 39,309 | 104,914 | 103,881 | |||||||||||||||||||||||||||||||||||
Reversal of provision for loan losses – Commercial | — | — | — | — | — | — | — | — | 859 | — | — | |||||||||||||||||||||||||||||||||||
Net interest income after provision | 35,046 | 34,763 | 35,105 | 35,360 | 35,294 | 34,990 | 33,597 | 35,797 | 40,168 | 104,914 | 103,881 | |||||||||||||||||||||||||||||||||||
Non-interest income | ||||||||||||||||||||||||||||||||||||||||||||||
Mortgage banking activities, net | 11,224 | 10,596 | 26,576 | 3,058 | 21,200 | 12,046 | 17,604 | 13,979 | 9,766 | 48,396 | 50,850 | |||||||||||||||||||||||||||||||||||
Investment fair value changes, net | 10,332 | 889 | 1,609 | 384 | 324 | 8,115 | 1,551 | (9,888 | ) | 11,918 | 12,830 | 9,990 | ||||||||||||||||||||||||||||||||||
Realized gains, net | 7,275 | 4,714 | 9,363 | 4,546 | 1,734 | 1,372 | 5,703 | 1,972 | 6,615 | 21,352 | 8,809 | |||||||||||||||||||||||||||||||||||
Other income | 3,453 | 3,322 | 2,118 | 2,963 | 2,812 | 3,764 | 2,897 | 3,700 | 5,413 | 8,893 | 9,473 | |||||||||||||||||||||||||||||||||||
Total non-interest income (loss), net | 32,284 | 19,521 | 39,666 | 10,951 | 26,070 | 25,297 | 27,755 | 9,763 | 33,712 | 91,471 | 79,122 | |||||||||||||||||||||||||||||||||||
Fixed compensation expense | (5,922 | ) | (5,775 | ) | (6,439 | ) | (5,555 | ) | (5,233 | ) | (5,321 | ) | (6,002 | ) | (5,310 | ) | (5,253 | ) | (18,136 | ) | (16,556 | ) | ||||||||||||||||||||||||
Variable compensation expense | (4,923 | ) | (1,825 | ) | (6,907 | ) | (5,861 | ) | (6,467 | ) | (4,313 | ) | (3,933 | ) | (4,757 | ) | (5,802 | ) | (13,655 | ) | (14,713 | ) | ||||||||||||||||||||||||
Equity compensation expense | (3,033 | ) | (3,835 | ) | (2,697 | ) | (2,507 | ) | (2,337 | ) | (3,121 | ) | (2,176 | ) | (1,976 | ) | (2,031 | ) | (9,565 | ) | (7,634 | ) | ||||||||||||||||||||||||
Loan acquisition costs | (1,887 | ) | (2,155 | ) | (1,818 | ) | (1,625 | ) | (1,187 | ) | (1,005 | ) | (1,205 | ) | (1,064 | ) | (1,393 | ) | (5,860 | ) | (3,397 | ) | ||||||||||||||||||||||||
Other operating expense | (5,725 | ) | (5,419 | ) | (5,169 | ) | (4,819 | ) | (4,698 | ) | (4,881 | ) | (4,910 | ) | (4,717 | ) | (5,876 | ) | (16,313 | ) | (14,489 | ) | ||||||||||||||||||||||||
Total operating expenses | (21,490 | ) | (19,009 | ) | (23,030 | ) | (20,367 | ) | (19,922 | ) | (18,641 | ) | (18,226 | ) | (17,824 | ) | (20,355 | ) | (63,529 | ) | (56,789 | ) | ||||||||||||||||||||||||
(Provision for) benefit from income taxes | (4,919 | ) | (2,528 | ) | (4,896 | ) | 4,989 | (5,262 | ) | (5,322 | ) | (6,157 | ) | (2,381 | ) | (972 | ) | (12,343 | ) | (16,741 | ) | |||||||||||||||||||||||||
Net income | $ | 40,921 | $ | 32,747 | $ | 46,845 | $ | 30,933 | $ | 36,180 | $ | 36,324 | $ | 36,969 | $ | 25,355 | $ | 52,553 | $ | 120,513 | $ | 109,473 | ||||||||||||||||||||||||
Diluted average shares (2) | 114,683 | 100,432 | 108,195 | 109,621 | 102,703 | 97,494 | 97,946 | 85,838 | 97,832 | 107,792 | 99,398 | |||||||||||||||||||||||||||||||||||
Diluted earnings per common share | $ | 0.42 | $ | 0.38 | $ | 0.50 | $ | 0.35 | $ | 0.41 | $ | 0.43 | $ | 0.43 | $ | 0.31 | $ | 0.58 | $ | 1.30 | $ | 1.26 | ||||||||||||||||||||||||
(1) | Represents interest expense on $250 million of convertible notes that were reclassified from Long-term debt to Short-term debt as the maturity of the notes was less than one year as of April 2017. These convertible notes were repaid in April 2018. |
(2) | Diluted average shares includes shares from the assumed conversion of our convertible and/or exchangeable debt in certain periods, in accordance with GAAP diluted EPS provisions. See Table 2 that follows for details of this calculation for the current and prior quarter and our respective Quarterly Reports on Form 10-Q and Annual Reports on Form 10-K for prior periods. |
THE REDWOOD REVIEW I 3RD QUARTER 2018 | Table 1: GAAP Earnings 24 | |
| Table 2: GAAP and Non-GAAP Core Basic and Diluted Earnings (1) per Common Share (in thousands, except per share data) | ||||||||
2018 Q3 | 2018 Q2 | ||||||||
GAAP Earnings per Common Share ("EPS"): | |||||||||
Net income attributable to Redwood | $ | 40,921 | $ | 32,747 | |||||
Less: Dividends and undistributed earnings allocated to participating securities | (1,231 | ) | (1,074 | ) | |||||
Net income allocated to common shareholders for GAAP basic EPS | 39,690 | 31,673 | |||||||
Incremental adjustment to dividends and undistributed earnings allocated to participating securities | (53 | ) | (82 | ) | |||||
Add back: Interest expense on convertible notes for the period, net of tax (2) | 8,666 | 6,335 | |||||||
Net income allocated to common shareholders for GAAP diluted EPS | $ | 48,303 | $ | 37,926 | |||||
Basic weighted average common shares outstanding | 80,797 | 75,381 | |||||||
Net effect of dilutive equity awards | 443 | 278 | |||||||
Net effect of assumed convertible notes conversion to common shares (2) | 33,443 | 24,773 | |||||||
Diluted weighted average common shares outstanding | 114,683 | 100,432 | |||||||
GAAP Basic Earnings per Common Share | $ | 0.49 | $ | 0.42 | |||||
GAAP Diluted Earnings per Common Share | $ | 0.42 | $ | 0.38 | |||||
Non-GAAP Core Earnings per Common Share: | |||||||||
Non-GAAP core earnings | $ | 36,691 | $ | 36,330 | |||||
Less: Dividends and undistributed earnings allocated to participating securities | (1,101 | ) | (1,191 | ) | |||||
Non-GAAP core earnings allocated to common shareholders for core basic EPS | 35,590 | 35,139 | |||||||
Incremental adjustment to dividends and undistributed earnings allocated to participating securities | (91 | ) | (53 | ) | |||||
Add back: Interest expense on convertible notes for the period, net of tax (2) | 8,666 | 6,335 | |||||||
Non-GAAP core earnings allocated to common shareholders for core diluted EPS | $ | 44,165 | $ | 41,421 | |||||
Basic weighted average common shares outstanding | 80,797 | 75,381 | |||||||
Net effect of dilutive equity awards | 443 | 278 | |||||||
Net effect of assumed convertible notes conversion to common shares (2) | 33,443 | 24,773 | |||||||
Diluted weighted average common shares outstanding | 114,683 | 100,432 | |||||||
Non-GAAP Core Basic Earnings per Common Share | $ | 0.44 | $ | 0.47 | |||||
Non-GAAP Core Diluted Earnings per Common Share | $ | 0.39 | $ | 0.41 | |||||
(1) | A reconciliation of GAAP net income to non-GAAP core earnings is included in the Quarterly Earnings and Analysis section that starts on page 8 and a definition of core earnings is included in the Non-GAAP Measurements section of the Appendix. |
(2) | Certain convertible notes were determined to be dilutive in the periods presented and were included in the calculations of diluted EPS under the "if-converted" method. Under this method, the periodic interest expense (net of applicable taxes) for dilutive notes is added back to the numerator and the number of shares that the notes are entitled to (if converted, regardless of whether they are in or out of the money) are included in the denominator. |
THE REDWOOD REVIEW I 3RD QUARTER 2018 | Table 2: GAAP and Non-GAAP Core Earnings per Basic and Diluted Common Share 25 | |
| Table 3: Segment Results ($ in thousands) | ||||||||||||||||||||||||||||||||||||||||||||
2018 Q3 | 2018 Q2 | 2018 Q1 | 2017 Q4 | 2017 Q3 | 2017 Q2 | 2017 Q1 | 2016 Q4 | 2016 Q3 | Nine Months 2018 | Nine Months 2017 | |||||||||||||||||||||||||||||||||||
Investment Portfolio | |||||||||||||||||||||||||||||||||||||||||||||
Net interest income | |||||||||||||||||||||||||||||||||||||||||||||
Residential loans | |||||||||||||||||||||||||||||||||||||||||||||
At Redwood | $ | 12,478 | $ | 13,842 | $ | 15,842 | $ | 16,032 | $ | 16,916 | $ | 18,461 | $ | 18,448 | $ | 18,676 | $ | 19,069 | $ | 42,162 | $ | 53,825 | |||||||||||||||||||||||
At consolidated Sequoia Choice entities | 2,880 | 2,002 | 1,386 | 836 | 22 | — | — | — | — | 6,268 | 22 | ||||||||||||||||||||||||||||||||||
Business purpose loans | 974 | — | — | — | — | — | — | — | — | 974 | — | ||||||||||||||||||||||||||||||||||
Residential securities | 19,412 | 19,700 | 19,778 | 20,287 | 19,342 | 18,163 | 17,081 | 16,368 | 16,441 | 58,890 | 54,586 | ||||||||||||||||||||||||||||||||||
Multifamily and commercial investments | 2,209 | 1,860 | 1,888 | 1,749 | 1,298 | 1,978 | 1,457 | 2,853 | 6,653 | 5,957 | 4,733 | ||||||||||||||||||||||||||||||||||
Other investments | 751 | 161 | — | — | — | — | — | — | — | 912 | — | ||||||||||||||||||||||||||||||||||
Total net interest income | 38,704 | 37,565 | 38,894 | 38,904 | 37,578 | 38,602 | 36,986 | 37,897 | 42,163 | 115,163 | 113,166 | ||||||||||||||||||||||||||||||||||
Reversal of provision for loan losses | — | — | — | — | — | — | — | — | 859 | — | — | ||||||||||||||||||||||||||||||||||
Non-interest income | |||||||||||||||||||||||||||||||||||||||||||||
Investment fair value changes, net | 10,566 | 1,600 | 1,590 | 4,568 | 1,372 | 9,115 | 3,359 | (7,862 | ) | 12,176 | 13,756 | 13,846 | |||||||||||||||||||||||||||||||||
Other income | 3,334 | 3,322 | 2,118 | 2,963 | 2,812 | 3,764 | 2,897 | 3,700 | 5,413 | 8,774 | 9,473 | ||||||||||||||||||||||||||||||||||
Realized gains | 7,275 | 4,714 | 9,363 | 4,546 | 1,734 | 2,124 | 5,703 | 1,972 | 6,615 | 21,352 | 9,561 | ||||||||||||||||||||||||||||||||||
Total non-interest income, net | 21,175 | 9,636 | 13,071 | 12,077 | 5,918 | 15,003 | 11,959 | (2,190 | ) | 24,204 | 43,882 | 32,880 | |||||||||||||||||||||||||||||||||
Operating expenses | (2,659 | ) | (1,858 | ) | (2,007 | ) | (1,657 | ) | (1,324 | ) | (1,454 | ) | (1,593 | ) | (2,732 | ) | (2,751 | ) | (6,524 | ) | (4,371 | ) | |||||||||||||||||||||||
Provision for income taxes | (2,840 | ) | (1,130 | ) | (888 | ) | (838 | ) | (433 | ) | (2,320 | ) | (1,737 | ) | (761 | ) | (732 | ) | (4,858 | ) | (4,490 | ) | |||||||||||||||||||||||
Segment contribution | $ | 54,380 | $ | 44,213 | $ | 49,070 | $ | 48,486 | $ | 41,739 | $ | 49,831 | $ | 45,615 | $ | 32,214 | $ | 63,743 | $ | 147,663 | $ | 137,185 | |||||||||||||||||||||||
Mortgage Banking | |||||||||||||||||||||||||||||||||||||||||||||
Net interest income | $ | 6,890 | $ | 5,455 | $ | 6,760 | $ | 6,887 | $ | 6,491 | $ | 4,012 | $ | 4,550 | $ | 5,579 | $ | 5,005 | $ | 19,105 | $ | 15,053 | |||||||||||||||||||||||
Non-interest income | |||||||||||||||||||||||||||||||||||||||||||||
Mortgage banking activities | 11,224 | 10,596 | 26,576 | 3,058 | 21,200 | 12,046 | 17,604 | 13,979 | 9,766 | 48,396 | 50,850 | ||||||||||||||||||||||||||||||||||
Operating expenses | (6,570 | ) | (5,739 | ) | (8,632 | ) | (7,104 | ) | (6,107 | ) | (6,021 | ) | (5,881 | ) | (6,077 | ) | (5,807 | ) | (20,941 | ) | (18,009 | ) | |||||||||||||||||||||||
(Provision for) benefit from income taxes | (2,079 | ) | (1,398 | ) | (4,008 | ) | 5,827 | (4,829 | ) | (3,002 | ) | (4,420 | ) | (1,620 | ) | (240 | ) | (7,485 | ) | (12,251 | ) | ||||||||||||||||||||||||
Segment contribution | $ | 9,465 | $ | 8,914 | $ | 20,696 | $ | 8,668 | $ | 16,755 | $ | 7,035 | $ | 11,853 | $ | 11,861 | $ | 8,724 | $ | 39,075 | $ | 35,643 | |||||||||||||||||||||||
Corporate/other | (22,924 | ) | (20,380 | ) | (22,921 | ) | (26,221 | ) | (22,314 | ) | (20,542 | ) | (20,499 | ) | (18,720 | ) | (19,914 | ) | (66,225 | ) | (63,355 | ) | |||||||||||||||||||||||
GAAP net income | $ | 40,921 | $ | 32,747 | $ | 46,845 | $ | 30,933 | $ | 36,180 | $ | 36,324 | $ | 36,969 | $ | 25,355 | $ | 52,553 | $ | 120,513 | $ | 109,473 | |||||||||||||||||||||||
THE REDWOOD REVIEW I 3RD QUARTER 2018 | Table 3: Segment Results 26 | |
| Table 4: Segment Assets and Liabilities ($ in thousands) | ||||||||||||||||||||||||||||||||||
September 30, 2018 | June 30, 2018 | ||||||||||||||||||||||||||||||||||
Investment Portfolio | Mortgage Banking | Corporate/ Other | Total | Investment Portfolio | Mortgage Banking | Corporate/ Other | Total | ||||||||||||||||||||||||||||
Residential loans | |||||||||||||||||||||||||||||||||||
At Redwood | $ | 2,320,662 | $ | 866,444 | $ | — | $ | 3,187,106 | $ | 2,313,336 | $ | 1,104,660 | $ | — | $ | 3,417,996 | |||||||||||||||||||
At consolidated Sequoia entities | 2,181,195 | — | 553,958 | 2,735,153 | 1,481,145 | — | 592,029 | 2,073,174 | |||||||||||||||||||||||||||
Business purpose loans | 95,515 | 20,105 | — | 115,620 | — | — | — | — | |||||||||||||||||||||||||||
Multifamily loans | 942,165 | — | — | 942,165 | — | — | — | — | |||||||||||||||||||||||||||
Real estate securities | 1,470,084 | — | — | 1,470,084 | 1,453,936 | — | — | 1,453,936 | |||||||||||||||||||||||||||
Cash and cash equivalents | 44,179 | 3,735 | 125,602 | 173,516 | 40,654 | — | 144,125 | 184,779 | |||||||||||||||||||||||||||
Other assets | 382,874 | 19,642 | 113,475 | 515,991 | 302,707 | 19,640 | 60,319 | 382,666 | |||||||||||||||||||||||||||
Total assets | $ | 7,436,674 | $ | 909,926 | $ | 793,035 | $ | 9,139,635 | $ | 5,591,778 | $ | 1,124,300 | $ | 796,473 | $ | 7,512,551 | |||||||||||||||||||
Short-term debt | |||||||||||||||||||||||||||||||||||
Mortgage loan warehouse debt | $ | — | $ | 578,157 | $ | — | $ | 578,157 | $ | — | $ | 719,394 | $ | — | $ | 719,394 | |||||||||||||||||||
Security repurchase facilities | 780,818 | — | — | 780,818 | 706,894 | — | — | 706,894 | |||||||||||||||||||||||||||
Business purpose loan warehouse facilities | 49,441 | 15,859 | — | 65,300 | — | — | — | — | |||||||||||||||||||||||||||
Other liabilities | 55,590 | 15,580 | 104,908 | 176,078 | 56,450 | 18,414 | 82,561 | 157,425 | |||||||||||||||||||||||||||
ABS issued | 2,862,062 | — | 544,923 | 3,406,985 | 1,347,427 | — | 582,235 | 1,929,662 | |||||||||||||||||||||||||||
Long-term debt, net | 1,999,999 | — | 770,971 | 2,770,970 | 1,999,999 | — | 770,222 | 2,770,221 | |||||||||||||||||||||||||||
Total liabilities | $ | 5,747,910 | $ | 609,596 | $ | 1,420,802 | $ | 7,778,308 | $ | 4,110,770 | $ | 737,808 | $ | 1,435,018 | $ | 6,283,596 | |||||||||||||||||||
THE REDWOOD REVIEW I 3RD QUARTER 2018 | Table 4: Segment Assets and Liabilities 27 | |
| Table 5: Changes in Book Value per Share ($ in per share) | ||||||||||||||||||||||||||||||||||||||||||||
2018 Q3 | 2018 Q2 | 2018 Q1 | 2017 Q4 | 2017 Q3 | 2017 Q2 | 2017 Q1 | 2016 Q4 | 2016 Q3 | Nine Months 2018 | Nine Months 2017 | |||||||||||||||||||||||||||||||||||
Beginning book value per share | $ | 16.23 | $ | 16.12 | $ | 15.83 | $ | 15.67 | $ | 15.29 | $ | 15.13 | $ | 14.96 | $ | 14.74 | $ | 14.20 | $ | 15.83 | $ | 14.96 | |||||||||||||||||||||||
Earnings | 0.42 | 0.38 | 0.50 | 0.35 | 0.41 | 0.43 | 0.43 | 0.31 | 0.58 | 1.30 | 1.26 | ||||||||||||||||||||||||||||||||||
Changes in unrealized gains on securities, net, from: | |||||||||||||||||||||||||||||||||||||||||||||
Realized gains recognized in earnings | (0.05 | ) | (0.05 | ) | (0.09 | ) | (0.03 | ) | (0.03 | ) | (0.02 | ) | (0.04 | ) | (0.01 | ) | (0.01 | ) | (0.18 | ) | (0.09 | ) | |||||||||||||||||||||||
Amortization income recognized in earnings | (0.03 | ) | (0.04 | ) | (0.04 | ) | (0.04 | ) | (0.05 | ) | (0.05 | ) | (0.05 | ) | (0.07 | ) | (0.06 | ) | (0.10 | ) | (0.15 | ) | |||||||||||||||||||||||
Mark-to-market adjustments, net | 0.01 | 0.01 | — | 0.12 | 0.27 | 0.09 | 0.11 | (0.02 | ) | 0.20 | 0.02 | 0.47 | |||||||||||||||||||||||||||||||||
Total change in unrealized gains on securities, net | (0.07 | ) | (0.08 | ) | (0.13 | ) | 0.05 | 0.19 | 0.02 | 0.02 | (0.10 | ) | 0.13 | (0.26 | ) | 0.23 | |||||||||||||||||||||||||||||
Dividends | (0.30 | ) | (0.30 | ) | (0.28 | ) | (0.28 | ) | (0.28 | ) | (0.28 | ) | (0.28 | ) | (0.28 | ) | (0.28 | ) | (0.88 | ) | (0.84 | ) | |||||||||||||||||||||||
Issuance of common stock | 0.01 | — | — | — | — | — | — | — | — | 0.01 | |||||||||||||||||||||||||||||||||||
Share repurchases | — | — | 0.01 | — | — | — | — | — | — | 0.01 | |||||||||||||||||||||||||||||||||||
Equity compensation, net | 0.03 | 0.03 | 0.03 | (0.02 | ) | 0.02 | — | (0.01 | ) | (0.05 | ) | 0.02 | 0.09 | 0.01 | |||||||||||||||||||||||||||||||
Changes in unrealized losses on derivatives hedging long-term debt | 0.06 | 0.05 | 0.11 | 0.02 | — | (0.03 | ) | 0.02 | 0.34 | 0.01 | 0.21 | (0.01 | ) | ||||||||||||||||||||||||||||||||
Other, net | 0.04 | 0.03 | 0.05 | 0.04 | 0.04 | 0.02 | (0.01 | ) | — | 0.08 | 0.11 | 0.06 | |||||||||||||||||||||||||||||||||
Ending book value per share | $ | 16.42 | $ | 16.23 | $ | 16.12 | $ | 15.83 | $ | 15.67 | $ | 15.29 | $ | 15.13 | $ | 14.96 | $ | 14.74 | $ | 16.42 | $ | 15.67 | |||||||||||||||||||||||
Economic return on book value (1) | 3.0 | % | 2.5 | % | 3.6 | % | 2.8 | % | 4.3 | % | 2.9 | % | 3.0 | % | 3.4 | % | 5.8 | % | 9.3 | % | 10.4 | % | |||||||||||||||||||||||
(1) | Economic return on book value is based on the periodic change in GAAP book value per common share plus dividends declared per common share during the period. |
THE REDWOOD REVIEW I 3RD QUARTER 2018 | Table 5: Changes in Book Value per Share 28 | |
| Table 6: Taxable and GAAP Income (1) Differences and Dividends (In thousands, except for per share data) | ||||||||||||||||||||||||||||||||||||
Estimated Nine Months 2018 (2) | Actual Twelve Months 2017 (2) | Actual Twelve Months 2016 (2) | |||||||||||||||||||||||||||||||||||
Taxable Income | GAAP Income | Differences | Taxable Income | GAAP Income | Differences | Taxable Income | GAAP Income | Differences | |||||||||||||||||||||||||||||
Taxable and GAAP Income Differences | |||||||||||||||||||||||||||||||||||||
Interest income | $ | 193,090 | $ | 258,992 | $ | (65,902 | ) | $ | 225,079 | $ | 248,057 | $ | (22,978 | ) | $ | 233,258 | $ | 246,355 | $ | (13,097 | ) | ||||||||||||||||
Interest expense | (99,035 | ) | (154,078 | ) | 55,043 | (89,662 | ) | (108,816 | ) | 19,154 | (76,396 | ) | (88,528 | ) | 12,132 | ||||||||||||||||||||||
Net interest income | 94,055 | 104,914 | (10,859 | ) | 135,417 | 139,241 | (3,824 | ) | 156,862 | 157,827 | (965 | ) | |||||||||||||||||||||||||
Reversal of provision for loan losses | — | — | — | — | — | — | — | 7,102 | (7,102 | ) | |||||||||||||||||||||||||||
Realized credit losses | (1,430 | ) | — | (1,430 | ) | (3,442 | ) | — | (3,442 | ) | (7,989 | ) | — | (7,989 | ) | ||||||||||||||||||||||
Mortgage banking activities, net | 47,120 | 48,396 | (1,276 | ) | 44,143 | 53,908 | (9,765 | ) | 26,477 | 38,691 | (12,214 | ) | |||||||||||||||||||||||||
Investment fair value changes, net | 1,396 | 12,830 | (11,434 | ) | (11,191 | ) | 10,374 | (21,565 | ) | (10,410 | ) | (28,574 | ) | 18,164 | |||||||||||||||||||||||
Operating expenses | (57,707 | ) | (63,529 | ) | 5,822 | (73,203 | ) | (77,156 | ) | 3,953 | (88,416 | ) | (88,786 | ) | 370 | ||||||||||||||||||||||
Other income (expense), net | 12,710 | 8,893 | 3,817 | 31,325 | 12,436 | 18,889 | 89,715 | 20,691 | 69,024 | ||||||||||||||||||||||||||||
Realized gains, net | 40,357 | 21,352 | 19,005 | (736 | ) | 13,355 | (14,091 | ) | 284 | 28,009 | (27,725 | ) | |||||||||||||||||||||||||
(Provision for) benefit from income taxes | (386 | ) | (12,343 | ) | 11,957 | (516 | ) | (11,752 | ) | 11,236 | (155 | ) | (3,708 | ) | 3,553 | ||||||||||||||||||||||
Income | $ | 136,115 | $ | 120,513 | $ | 15,602 | $ | 121,797 | $ | 140,406 | $ | (18,609 | ) | $ | 166,368 | $ | 131,252 | $ | 35,116 | ||||||||||||||||||
REIT taxable income | $ | 82,912 | $ | 90,122 | $ | 97,576 | |||||||||||||||||||||||||||||||
Taxable income at taxable subsidiaries | 53,203 | 31,675 | 68,792 | ||||||||||||||||||||||||||||||||||
Taxable income | $ | 136,115 | $ | 121,797 | $ | 166,368 | |||||||||||||||||||||||||||||||
Shares used for taxable EPS calculation | 82,930 | 76,600 | 76,835 | ||||||||||||||||||||||||||||||||||
REIT taxable income per share | $ | 1.06 | $ | 1.17 | $ | 1.27 | |||||||||||||||||||||||||||||||
Taxable income (loss) per share at taxable subsidiaries | $ | 0.69 | $ | 0.42 | $ | 0.90 | |||||||||||||||||||||||||||||||
Taxable income per share (3) | $ | 1.75 | $ | 1.59 | $ | 2.17 | |||||||||||||||||||||||||||||||
Dividends | |||||||||||||||||||||||||||||||||||||
Dividends declared | $ | 68,792 | $ | 86,271 | $ | 86,240 | |||||||||||||||||||||||||||||||
Dividends per share (4) | $ | 0.88 | $ | 1.12 | $ | 1.12 | |||||||||||||||||||||||||||||||
(1) | Taxable income for 2018 is an estimate until we file our tax returns for this year. To the extent we expect to pay tax at the corporate level (generally as a result of activity at our taxable REIT subsidiaries), we are required to record a tax provision for GAAP reporting purposes. Any tax provision (or benefit) is not necessarily the actual amount of tax currently due (or receivable as a refund) as a portion of our provision (or benefit) is deferred in nature. It is our intention to retain any excess inclusion income generated in 2018 at our TRS and not pass it through to our shareholders. |
(2) | Reconciliation of GAAP income to taxable income (loss) for prior quarters is provided in the respective Redwood Reviews for those quarters. |
(3) | Taxable income (loss) per share is based on the number of shares outstanding at the end of each quarter. The annual and year-to-date taxable income (loss) per share is the sum of the quarterly per share estimates. |
(4) | Dividends in 2017 were characterized as 71% ordinary dividend income (or $61 million) and 29% qualified dividend income (or $25 million). Dividends in 2016 were characterized as 100% ordinary income (or $86 million). |
THE REDWOOD REVIEW I 3RD QUARTER 2018 | Table 6: Taxable and GAAP Income Differences and Dividends 29 | |
| Table 7: Financial Ratios and Book Value ($ in thousands, except per share data) | ||||||||||||||||||||||||||||||||||||||||||||
2018 Q3 | 2018 Q2 | 2018 Q1 | 2017 Q4 | 2017 Q3 | 2017 Q2 | 2017 Q1 | 2016 Q4 | 2016 Q3 | Nine Months 2018 | Nine Months 2017 | |||||||||||||||||||||||||||||||||||
Financial performance ratios | |||||||||||||||||||||||||||||||||||||||||||||
Net interest income | $ | 35,046 | $ | 34,763 | $ | 35,105 | $ | 35,360 | $ | 35,294 | $ | 34,990 | $ | 33,597 | $ | 35,797 | $ | 39,309 | $ | 104,914 | $ | 103,881 | |||||||||||||||||||||||
Operating expenses | $ | (21,490 | ) | $ | (19,009 | ) | $ | (23,030 | ) | $ | (20,367 | ) | $ | (19,922 | ) | $ | (18,641 | ) | $ | (18,226 | ) | $ | (17,824 | ) | $ | (20,355 | ) | $ | (63,529 | ) | $ | (56,789 | ) | ||||||||||||
GAAP net income | $ | 40,921 | $ | 32,747 | $ | 46,845 | $ | 30,933 | $ | 36,180 | $ | 36,324 | $ | 36,969 | $ | 25,355 | $ | 52,553 | $ | 120,513 | $ | 109,473 | |||||||||||||||||||||||
Average total assets | $ | 8,483,995 | $ | 7,134,026 | $ | 6,922,611 | $ | 6,652,937 | $ | 5,851,133 | $ | 5,685,460 | $ | 5,471,154 | $ | 5,613,048 | $ | 5,880,281 | $ | 7,519,264 | $ | 5,670,666 | |||||||||||||||||||||||
Average total equity | $ | 1,331,497 | $ | 1,226,735 | $ | 1,218,015 | $ | 1,207,879 | $ | 1,189,540 | $ | 1,167,438 | $ | 1,158,732 | $ | 1,137,948 | $ | 1,111,507 | $ | 1,259,165 | $ | 1,172,021 | |||||||||||||||||||||||
Operating expenses / average total assets | 1.01 | % | 1.07 | % | 1.33 | % | 1.22 | % | 1.36 | % | 1.31 | % | 1.33 | % | 1.27 | % | 1.38 | % | 1.13 | % | 1.34 | % | |||||||||||||||||||||||
Operating expenses / total capital | 4.03 | % | 3.80 | % | 5.13 | % | 4.56 | % | 4.47 | % | 4.22 | % | 4.08 | % | 4.03 | % | 4.65 | % | 3.97 | % | 4.25 | % | |||||||||||||||||||||||
Operating expenses / average total equity | 6.46 | % | 6.20 | % | 7.56 | % | 6.74 | % | 6.70 | % | 6.39 | % | 6.29 | % | 6.27 | % | 7.33 | % | 6.73 | % | 6.46 | % | |||||||||||||||||||||||
GAAP net income / average total assets | 1.93 | % | 1.84 | % | 2.71 | % | 1.86 | % | 2.47 | % | 2.56 | % | 2.70 | % | 1.81 | % | 3.57 | % | 2.14 | % | 2.57 | % | |||||||||||||||||||||||
GAAP net income / average equity (GAAP ROE) | 12.29 | % | 10.68 | % | 15.38 | % | 10.24 | % | 12.17 | % | 12.45 | % | 12.76 | % | 8.91 | % | 18.91 | % | 12.76 | % | 12.45 | % | |||||||||||||||||||||||
Leverage ratios and book value per share | |||||||||||||||||||||||||||||||||||||||||||||
Short-term debt | $ | 1,424,275 | $ | 1,426,288 | $ | 1,504,460 | $ | 1,938,682 | $ | 1,238,196 | $ | 1,294,807 | $ | 563,773 | $ | 791,539 | $ | 1,117,405 | |||||||||||||||||||||||||||
Long-term debt – Other (1) | 2,785,264 | 2,785,264 | 2,585,264 | 2,585,264 | 2,585,264 | 2,340,264 | 2,627,764 | 2,627,764 | 2,627,764 | ||||||||||||||||||||||||||||||||||||
Total debt at Redwood | $ | 4,209,539 | $ | 4,211,552 | $ | 4,089,724 | $ | 4,523,946 | $ | 3,823,460 | $ | 3,635,071 | $ | 3,191,537 | $ | 3,419,303 | $ | 3,745,169 | |||||||||||||||||||||||||||
ABS issued at consolidated entities | |||||||||||||||||||||||||||||||||||||||||||||
Legacy Sequoia entities ABS issued | $ | 544,923 | $ | 582,235 | $ | 615,849 | $ | 622,445 | $ | 657,960 | $ | 692,606 | $ | 728,391 | $ | 773,462 | $ | 819,868 | |||||||||||||||||||||||||||
Sequoia Choice entities ABS issued | 1,986,456 | 1,347,427 | 926,238 | 542,140 | 286,328 | — | — | — | — | ||||||||||||||||||||||||||||||||||||
Freddie Mac K-Series entities ABS Issued | 875,606 | — | — | — | — | — | — | — | — | ||||||||||||||||||||||||||||||||||||
Total ABS issued (1) | $ | 3,406,985 | $ | 1,929,662 | $ | 1,542,087 | $ | 1,164,585 | $ | 944,288 | $ | 692,606 | $ | 728,391 | $ | 773,462 | $ | 819,868 | |||||||||||||||||||||||||||
Consolidated debt | $ | 7,616,524 | $ | 6,141,214 | $ | 5,631,811 | $ | 5,688,531 | $ | 4,767,748 | $ | 4,327,677 | $ | 3,919,928 | $ | 4,192,765 | $ | 4,565,037 | |||||||||||||||||||||||||||
Stockholders' equity | $ | 1,361,327 | $ | 1,228,955 | $ | 1,219,983 | $ | 1,212,287 | $ | 1,208,640 | $ | 1,179,424 | $ | 1,165,771 | $ | 1,149,428 | $ | 1,130,130 | |||||||||||||||||||||||||||
Total capital (2) | $ | 2,132,298 | $ | 1,999,177 | $ | 1,795,572 | $ | 1,787,701 | $ | 1,783,301 | $ | 1,765,784 | $ | 1,787,266 | $ | 1,770,074 | $ | 1,750,000 | |||||||||||||||||||||||||||
Recourse debt at Redwood to stockholders' equity (3) | 3.1x | 3.4x | 3.4x | 3.7x | 3.2x | 3.1x | 2.7x | 3.0x | 3.3x | ||||||||||||||||||||||||||||||||||||
Consolidated debt to stockholders' equity | 5.6x | 5.0x | 4.6x | 4.7x | 3.9x | 3.7x | 3.4x | 3.6x | 4.0x | ||||||||||||||||||||||||||||||||||||
Shares outstanding at period end (in thousands) | 82,930 | 75,743 | 75,703 | 76,600 | 77,123 | 77,117 | 77,039 | 76,835 | 76,682 | ||||||||||||||||||||||||||||||||||||
Book value per share | $ | 16.42 | $ | 16.23 | $ | 16.12 | $ | 15.83 | $ | 15.67 | $ | 15.29 | $ | 15.13 | $ | 14.96 | $ | 14.74 | |||||||||||||||||||||||||||
(1) | Long-term debt - other and ABS issued presented above do not include deferred securities issuance costs. |
(2) | Our total capital of $2.1 billion at September 30, 2018 included $1.4 billion of equity capital and $0.8 billion of the total $2.8 billion of long-term debt on our consolidated balance sheet. |
(3) | Excludes ABS issued at consolidated entities and commercial secured borrowings associated with commercial A-notes that were sold, but treated as secured borrowings under GAAP. |
THE REDWOOD REVIEW I 3RD QUARTER 2018 | Table 7: Financial Ratios and Book Value 30 | |
| Table 8: Loans and Securities Activity ($ in thousands) | ||||||||||||||||||||||||||||||||||||
2018 Q3 | 2018 Q2 | 2018 Q1 | 2017 Q4 | 2017 Q3 | 2017 Q2 | 2017 Q1 | Nine Months 2018 | Nine Months 2017 | |||||||||||||||||||||||||||||
Residential Loans, Held-for-Sale | |||||||||||||||||||||||||||||||||||||
Beginning carrying value | $ | 1,104,660 | $ | 1,130,185 | $ | 1,427,945 | $ | 925,681 | $ | 837,371 | $ | 376,607 | $ | 835,399 | $ | 1,427,945 | $ | 835,399 | |||||||||||||||||||
Acquisitions | 1,804,125 | 1,951,566 | 1,815,294 | 1,950,180 | 1,462,116 | 1,221,051 | 1,108,304 | 5,570,985 | 3,791,472 | ||||||||||||||||||||||||||||
Sales | (1,133,078 | ) | (1,408,358 | ) | (1,594,531 | ) | (834,977 | ) | (1,393,323 | ) | (694,875 | ) | (1,377,637 | ) | (4,135,967 | ) | (3,465,836 | ) | |||||||||||||||||||
Principal repayments | (21,198 | ) | (14,612 | ) | (17,017 | ) | (14,771 | ) | (16,436 | ) | (9,273 | ) | (12,995 | ) | (52,827 | ) | (38,703 | ) | |||||||||||||||||||
Transfers between portfolios | (896,129 | ) | (561,710 | ) | (507,616 | ) | (601,554 | ) | 20,025 | (61,922 | ) | (184,996 | ) | (1,965,455 | ) | (226,893 | ) | ||||||||||||||||||||
Changes in fair value, net | 8,064 | 7,589 | 6,110 | 3,386 | 15,928 | 5,783 | 8,532 | 21,763 | 30,242 | ||||||||||||||||||||||||||||
Ending fair value | $ | 866,444 | $ | 1,104,660 | $ | 1,130,185 | $ | 1,427,945 | $ | 925,681 | $ | 837,371 | $ | 376,607 | $ | 866,444 | $ | 925,681 | |||||||||||||||||||
Residential Loans, Held-for-Investment at Redwood | |||||||||||||||||||||||||||||||||||||
Beginning carrying value | $ | 2,313,336 | $ | 2,375,785 | $ | 2,434,386 | $ | 2,268,802 | $ | 2,360,234 | $ | 2,350,013 | $ | 2,261,016 | $ | 2,434,386 | $ | 2,261,016 | |||||||||||||||||||
Principal repayments | (76,144 | ) | (79,375 | ) | (74,954 | ) | (93,916 | ) | (74,530 | ) | (60,055 | ) | (93,666 | ) | (230,473 | ) | (228,251 | ) | |||||||||||||||||||
Transfers between portfolios | 100,533 | 31,936 | 55,775 | 273,994 | (20,045 | ) | 61,922 | 184,996 | 188,244 | 226,873 | |||||||||||||||||||||||||||
Changes in fair value, net | (17,063 | ) | (15,010 | ) | (39,422 | ) | (14,494 | ) | 3,143 | 8,354 | (2,333 | ) | (71,495 | ) | 9,164 | ||||||||||||||||||||||
Ending fair value | $ | 2,320,662 | $ | 2,313,336 | $ | 2,375,785 | $ | 2,434,386 | $ | 2,268,802 | $ | 2,360,234 | $ | 2,350,013 | $ | 2,320,662 | $ | 2,268,802 | |||||||||||||||||||
Securities | |||||||||||||||||||||||||||||||||||||
Beginning fair value | 1,453,936 | 1,357,720 | $ | 1,476,510 | $ | 1,356,272 | $ | 1,218,503 | $ | 1,165,940 | $ | 1,018,439 | $ | 1,476,510 | $ | 1,018,439 | |||||||||||||||||||||
Acquisitions | 161,534 | 223,022 | 144,465 | 204,733 | 188,138 | 116,860 | 170,729 | 529,021 | 475,727 | ||||||||||||||||||||||||||||
Sales | (106,972 | ) | (103,685 | ) | (234,509 | ) | (75,887 | ) | (47,076 | ) | (69,676 | ) | (21,760 | ) | (445,166 | ) | (138,512 | ) | |||||||||||||||||||
Effect of principal payments | (26,571 | ) | (17,022 | ) | (15,707 | ) | (21,503 | ) | (19,497 | ) | (15,854 | ) | (14,911 | ) | (59,300 | ) | (50,262 | ) | |||||||||||||||||||
Transfers between portfolios | (11,091 | ) | — | — | — | — | — | — | (11,091 | ) | — | ||||||||||||||||||||||||||
Change in fair value, net | (752 | ) | (6,099 | ) | (13,039 | ) | 12,895 | 16,204 | 21,233 | 13,443 | (19,890 | ) | 50,880 | ||||||||||||||||||||||||
Ending fair value | $ | 1,470,084 | $ | 1,453,936 | $ | 1,357,720 | $ | 1,476,510 | $ | 1,356,272 | $ | 1,218,503 | $ | 1,165,940 | $ | 1,470,084 | $ | 1,356,272 | |||||||||||||||||||
THE REDWOOD REVIEW I 3RD QUARTER 2018 | Table 8: Loans and Securities Activity 31 | |
| Table 9: Investment Portfolio Detailed Balances ($ in thousands) | ||||||||||||||||||||||||||||||||||||
2018 Q3 | 2018 Q2 | 2018 Q1 | 2017 Q4 | 2017 Q3 | 2017 Q2 | 2017 Q1 | 2016 Q4 | 2016 Q3 | |||||||||||||||||||||||||||||
Residential Loans Held-for-Investment at Redwood | $ | 2,320,662 | $ | 2,313,336 | $ | 2,375,785 | $ | 2,434,386 | $ | 2,268,802 | $ | 2,360,234 | $ | 2,350,013 | $ | 2,261,016 | $ | 2,282,674 | |||||||||||||||||||
Business Purpose Loans (Fix-and-Flip) Held-for-Investment | 95,515 | — | — | — | — | — | — | — | — | ||||||||||||||||||||||||||||
Securities with Sub-Categories | |||||||||||||||||||||||||||||||||||||
Residential | |||||||||||||||||||||||||||||||||||||
Senior - New Issue | 76,950 | 49,099 | — | — | — | — | — | — | — | ||||||||||||||||||||||||||||
Senior - Legacy | 97,374 | 113,799 | 127,240 | 140,988 | 153,232 | 128,330 | 137,210 | 136,547 | 71,290 | ||||||||||||||||||||||||||||
Senior - IO | 86,072 | 89,230 | 82,062 | 69,975 | 62,767 | 48,632 | 38,889 | 37,066 | 24,492 | ||||||||||||||||||||||||||||
Senior - Re-REMIC | 17,254 | 33,691 | 38,370 | 38,875 | 39,033 | 73,337 | 73,730 | 85,479 | 161,234 | ||||||||||||||||||||||||||||
Mezzanine - New issue | 221,358 | 239,107 | 228,114 | 331,451 | 334,915 | 343,013 | 368,919 | 315,397 | 283,561 | ||||||||||||||||||||||||||||
Subordinate - New issue | 301,847 | 272,508 | 239,565 | 247,897 | 209,554 | 195,039 | 191,321 | 177,760 | 165,721 | ||||||||||||||||||||||||||||
Subordinate - Agency CRT | 235,720 | 239,767 | 245,654 | 300,713 | 286,780 | 229,510 | 198,197 | 152,126 | 134,460 | ||||||||||||||||||||||||||||
Subordinate - Legacy | 16,255 | 17,950 | 19,707 | 22,586 | 26,920 | 30,333 | 18,993 | 22,294 | 23,542 | ||||||||||||||||||||||||||||
Multifamily (mezzanine) | 417,254 | 398,785 | 377,008 | 324,025 | 243,071 | 170,309 | 138,681 | 91,770 | 72,610 | ||||||||||||||||||||||||||||
Total Securities on Balance Sheet | 1,470,084 | 1,453,936 | 1,357,720 | 1,476,510 | 1,356,272 | 1,218,503 | 1,165,940 | 1,018,439 | 936,910 | ||||||||||||||||||||||||||||
Sequoia Choice Securities (1) | 194,739 | 133,718 | 87,381 | 77,922 | 30,975 | — | — | — | — | ||||||||||||||||||||||||||||
Freddie Mac K-Series Securities (1) | 66,559 | — | — | — | — | — | — | — | — | ||||||||||||||||||||||||||||
Adjusted Total Securities | 1,731,382 | 1,587,654 | 1,445,101 | 1,554,432 | 1,387,247 | 1,218,503 | 1,165,940 | 1,018,439 | 936,910 | ||||||||||||||||||||||||||||
Other Investments | |||||||||||||||||||||||||||||||||||||
Mortgage Servicing Rights | 63,785 | 64,674 | 66,496 | 63,598 | 62,928 | 63,770 | 111,013 | 118,526 | 106,009 | ||||||||||||||||||||||||||||
Investment in 5 Arches | 10,772 | 10,973 | — | — | — | — | — | — | — | ||||||||||||||||||||||||||||
Participation in Loan Warehouse Facility | 39,219 | 41,658 | — | — | — | — | — | — | — | ||||||||||||||||||||||||||||
Total earning assets | $ | 4,261,335 | $ | 4,018,295 | $ | 3,887,382 | $ | 4,052,416 | $ | 3,718,977 | $ | 3,642,507 | $ | 3,626,966 | $ | 3,397,981 | $ | 3,325,593 | |||||||||||||||||||
Supplemental Information | |||||||||||||||||||||||||||||||||||||
Residential Loans at Consolidated Sequoia Choice Entities (2) | $ | 2,181,195 | $ | 1,481,145 | $ | 1,013,619 | $ | 620,062 | $ | 317,303 | $ | — | $ | — | $ | — | $ | — | |||||||||||||||||||
Multifamily Loans at Consolidated Freddie Mac K-Series Entities (3) | $ | 942,165 | $ | — | $ | — | $ | — | $ | — | $ | — | $ | — | $ | — | $ | — | |||||||||||||||||||
(1) | Represents securities retained from our consolidated Sequoia Choice securitizations and securities owned in consolidated Freddie Mac K-Series securitizations. |
(2) | Represents the gross assets of securitizations consolidated on our balance sheet in accordance with GAAP. |
THE REDWOOD REVIEW I 3RD QUARTER 2018 | Table 9: Investment Portfolio Detailed Balances 32 | |
| Table 10: Consolidating Balance Sheet ($ in thousands) | ||||||||||||||||||||||||||||||||||||||||
September 30, 2018 | June 30, 2018 | ||||||||||||||||||||||||||||||||||||||||
Consolidated VIEs (1) | Consolidated VIEs (1) | ||||||||||||||||||||||||||||||||||||||||
At Redwood (1) | Legacy Sequoia | Sequoia Choice | Freddie Mac K-Series | Redwood Consolidated | At Redwood (1) | Legacy Sequoia | Sequoia Choice | Freddie Mac K-Series | Redwood Consolidated | ||||||||||||||||||||||||||||||||
Residential loans | $ | 3,187,106 | $ | 553,958 | $ | 2,181,195 | $ | — | $ | 5,922,259 | $ | 3,417,996 | $ | 592,029 | $ | 1,481,145 | $ | — | $ | 5,491,170 | |||||||||||||||||||||
Business purpose loans | 115,620 | — | — | — | 115,620 | — | — | — | — | — | |||||||||||||||||||||||||||||||
Multifamily loans | — | — | — | 942,165 | 942,165 | — | — | — | — | — | |||||||||||||||||||||||||||||||
Real estate securities | 1,470,084 | — | — | — | 1,470,084 | 1,453,936 | — | — | — | 1,453,936 | |||||||||||||||||||||||||||||||
Cash and cash equivalents | 173,516 | — | — | — | 173,516 | 184,779 | — | — | — | 184,779 | |||||||||||||||||||||||||||||||
Other assets (2) | 500,169 | 3,922 | 9,057 | 2,843 | 515,991 | 373,069 | 3,631 | 5,966 | — | 382,666 | |||||||||||||||||||||||||||||||
Total assets | $ | 5,446,495 | $ | 557,880 | $ | 2,190,252 | $ | 945,008 | $ | 9,139,635 | $ | 5,429,780 | $ | 595,660 | $ | 1,487,111 | $ | — | $ | 7,512,551 | |||||||||||||||||||||
Short-term debt | $ | 1,424,275 | $ | — | $ | — | $ | — | $ | 1,424,275 | $ | 1,426,288 | $ | — | $ | — | $ | — | $ | 1,426,288 | |||||||||||||||||||||
Other liabilities | 165,228 | 590 | 7,654 | 2,606 | 176,078 | 151,788 | 589 | 5,048 | — | 157,425 | |||||||||||||||||||||||||||||||
ABS issued | — | 544,923 | 1,986,456 | 875,606 | 3,406,985 | — | 582,235 | 1,347,427 | — | 1,929,662 | |||||||||||||||||||||||||||||||
Long-term debt, net | 2,770,970 | — | — | — | 2,770,970 | 2,770,221 | — | — | — | 2,770,221 | |||||||||||||||||||||||||||||||
Total liabilities | 4,360,473 | 545,513 | 1,994,110 | 878,212 | 7,778,308 | 4,348,297 | 582,824 | 1,352,475 | — | 6,283,596 | |||||||||||||||||||||||||||||||
Equity | 1,086,022 | 12,367 | 196,142 | 66,796 | 1,361,327 | 1,081,483 | 12,836 | 134,636 | — | 1,228,955 | |||||||||||||||||||||||||||||||
Total liabilities and equity | $ | 5,446,495 | $ | 557,880 | $ | 2,190,252 | $ | 945,008 | $ | 9,139,635 | $ | 5,429,780 | $ | 595,660 | $ | 1,487,111 | $ | — | $ | 7,512,551 | |||||||||||||||||||||
(1) | The format of this consolidating balance sheet is provided to more clearly delineate between the assets belonging to consolidated Sequoia and Freddie Mac K-Series securitization entities that we are required to consolidate on our balance sheet in accordance with GAAP, but which are not legally ours, and the liabilities of these consolidated entities, which are payable only from the cash flows generated by their assets and are, therefore, nonrecourse to us, and the assets that are legally ours and the liabilities of ours for which there is recourse to us. |
(2) | At both September 30, 2018 and June 30, 2018, other assets at Redwood included a total of $42 million of assets held by third-party custodians and pledged as collateral to the GSEs in connection with credit risk-sharing arrangements relating to conforming residential loans. These pledged assets can only be used to settle obligations to the GSEs under these risk-sharing arrangements. |
THE REDWOOD REVIEW I 3RD QUARTER 2018 | Table 10: Consolidating Balance Sheet 33 | |

D I V I D E N D P O L I C Y |
Dividend Policy
Summary
As a REIT, Redwood is required to distribute to shareholders at least 90% of its REIT taxable income, excluding net capital gains. To the extent Redwood retains REIT taxable income, including net capital gains, it is taxed at corporate tax rates. Redwood also earns taxable income at its taxable REIT subsidiaries (TRS), which it is not required to distribute.
Dividend Policy Overview
In recent years, our Board of Directors has maintained a policy of paying regular quarterly dividends in excess of the amount required to comply with the provisions of the Internal Revenue Code applicable to REITs. In December 2017, the Board of Directors announced its intention to pay a regular dividend of $0.28 per share per quarter in 2018. During the first quarter of 2018, the Board of Directors declared and paid a regular quarterly dividend of $0.28 per share. In May 2018, the Board of Directors declared an increase in the regular dividend and subsequently paid regular quarterly dividends of $0.30 per share for the second and third quarters of 2018. In November 2018, the Board of Directors declared a regular dividend of $0.30 per share for the fourth quarter of 2018, which is payable on December 28, 2018 to shareholders of record on December 14, 2018.
Dividend Distribution Requirement
Our estimated REIT taxable income was $23 million, or $0.27 per share, for the third quarter of 2018 and $27 million, or $0.35 per share, for the second quarter of 2018. Under normal circumstances, our minimum REIT dividend requirement would be 90% of our annual REIT taxable income. However, we currently maintain a $55 million federal net operating loss carry forward (NOL) at the REIT that affords us the option of retaining REIT taxable income up to the NOL amount, tax free, rather than distributing it as dividends. Federal income tax rules require the dividends paid deduction to be applied to reduce REIT taxable income before the applicability of NOLs is considered. It is possible that our estimated REIT taxable income will exceed our dividend distributions in 2018; therefore, we may utilize a portion of our NOL in 2018 and any remaining amount will carry forward into 2019.
Income Tax Characterization of Dividend for Shareholders
We currently expect all of the distributions to shareholders in 2018 will be taxable as dividend income. Additionally, a portion of our 2018 dividend distributions are expected to be characterized as long-term capital gains for federal income tax purposes.
Beginning in 2018, the Tax Cuts and Jobs Act provides that individual taxpayers may deduct 20% of their ordinary REIT dividends from taxable income. This results in a maximum federal effective tax rate of 29.6% on an individual taxpayer's ordinary REIT dividends, compared to the highest marginal rate of 37%. This deduction does not apply to REIT dividends classified as qualified dividends or long-term capital gains dividends, as those dividends are taxed at a maximum rate of 20% for individuals.
THE REDWOOD REVIEW I 3RD QUARTER 2018 |
35 |
N O N - G A A P M E A S U R E M E N T S |
Core Earnings
Core earnings is a non-GAAP measure of Redwood’s earnings and results of operations. Specifically, management has defined core earnings as: GAAP net income adjusted to (i) eliminate the impact of quarterly mark-to-market changes on the fair value of long-term investments (and associated derivatives) related to changes in benchmark interest rates and credit spreads, (ii) include the cumulative net gains or losses on long-term investments accounted for as trading securities under GAAP that were sold during the period presented, net of any gains or losses from derivatives associated with the investments sold, and (iii) include the hypothetical income taxes associated with core earnings adjustments.
Management utilizes this core earnings measure internally as one way of analyzing Redwood’s performance over multiple periods, as it believes it provides useful comparative results absent the impact of certain quarterly mark-to-market changes on investments held through the end of the period presented and inclusive of all realized gains and losses from securities sales.
Specifically, the quarterly mark-to-market changes in the value of our long-term investments in loans, trading securities, and other investments, as well as the associated derivatives, resulting from changes in benchmark interest rates and credit spreads may not be reflective of the total return management would expect to earn from them over the longer-term.
Additionally, the adjustment to include cumulative net gains or losses from the sale of trading securities is to ensure that core earnings presents consistently the impact of the sales of investments regardless of whether they are accounted for as (i) trading securities or (ii) available-for-sale securities, in each case under GAAP, as outlined below.
• | Under GAAP, available-for-sale securities are reported at their fair value with periodic changes in fair value recognized through the balance sheet in Shareholders’ equity. When an available-for-sale security is sold, the cumulative gain or loss since purchase is recognized through the income statement, in Realized gains, net, in the period the sale occurred. As a result, any such cumulative gains or losses are reflected in core earnings in the period the sale occurred. |
• | Under GAAP, trading securities are reported at their fair value with periodic changes in fair value recognized through the income statement in Investment fair value changes, net. Certain of these periodic changes in fair value (as described above) are excluded from core earnings. Core earnings includes an adjustment to include the cumulative net gains or losses (from purchase through the sale of the investment) for sold trading securities in the period they are sold. The result is to consistently present within core earnings the cumulative gains or losses from the sale of long-term investments, regardless of how they are accounted for under GAAP. |
THE REDWOOD REVIEW I 3RD QUARTER 2018 |
36 |
N O N - G A A P M E A S U R E M E N T S |
Core earnings also includes adjustments to show the hypothetical tax provision or benefit that would be associated with the core earnings adjustments made to net income. As a REIT, we are subject to income taxes on earnings generated at our taxable REIT subsidiaries (TRS) and generally not subject to income taxes on earnings generated at the REIT (to the extent we distribute our REIT taxable income as dividends). In order to present the hypothetical income taxes associated with core earnings adjustments made to net income, estimated effective tax rates are applied to the core earnings adjustments occurring within our TRS.
The following table presents a reconciliation of GAAP net income to non-GAAP core earnings.
Reconciliation of Non-GAAP Core Earnings | ||||||||||||
($ in millions) | ||||||||||||
Three Months Ended September 30, 2018 | ||||||||||||
GAAP | Adjustments | Non-GAAP | ||||||||||
Net interest income | $ | 35 | $ | — | $ | 35 | ||||||
Non-interest income | ||||||||||||
Mortgage banking activities, net | 11 | — | 11 | |||||||||
Investment fair value changes, net (1) | 10 | (12 | ) | (2 | ) | |||||||
Other income, net | 3 | — | 3 | |||||||||
Realized gains, net (2) | 7 | 8 | 15 | |||||||||
Total non-interest income, net | 32 | (5 | ) | 28 | ||||||||
Operating expenses | (21 | ) | — | (21 | ) | |||||||
Provision for income taxes (3) | (5 | ) | — | (5 | ) | |||||||
GAAP Net Income/Non-GAAP Core Earnings | $ | 41 | $ | (4 | ) | $ | 37 | |||||
Three Months Ended June 30, 2018 | ||||||||||||
GAAP | Adjustments | Non-GAAP | ||||||||||
Net interest income | $ | 35 | $ | — | $ | 35 | ||||||
Non-interest income | ||||||||||||
Mortgage banking activities, net | 11 | — | 11 | |||||||||
Investment fair value changes, net (1) | 1 | (3 | ) | (2 | ) | |||||||
Other income, net | 3 | — | 3 | |||||||||
Realized gains, net (2) | 5 | 7 | 12 | |||||||||
Total non-interest income, net | 20 | 4 | 24 | |||||||||
Operating expenses | (19 | ) | — | (19 | ) | |||||||
Provision for income taxes (3) | (3 | ) | — | (3 | ) | |||||||
GAAP Net Income/Non-GAAP Core Earnings | $ | 33 | $ | 4 | $ | 36 | ||||||
(1) | References in this Redwood Review to core investment fair value changes, net refer to GAAP investment fair value changes, net as adjusted by the amount described in the "Adjustments" column, as further described above under the heading "Core Earnings." |
(2) | References in this Redwood Review to core realized gains, net refer to GAAP realized gains, net as adjusted by the amount described in the "Adjustments" column, as further described above under the heading "Core Earnings." |
(3) | References in this Redwood Review to core provision for income taxes refer to GAAP provision for income taxes as adjusted by the amount described in the "Adjustments" column, as further described above under the heading "Core Earnings." |
THE REDWOOD REVIEW I 3RD QUARTER 2018 |
37 |
N O N - G A A P M E A S U R E M E N T S |
Additionally, we use core earnings as described above to calculate basic and diluted core earnings per share. To calculate these measures, we follow the same methodology for calculating basic and diluted earnings per share for GAAP, but substitute core earnings for GAAP earnings in the calculation. A detailed presentation of these calculations is presented in Table 2 of the Financial Tables section of this document.
The following table presents the components of investment fair value changes, net, of our Investment Portfolio segment that are included and excluded from core earnings, by investment type, for the third and second quarters of 2018.
Components of Investment Portfolio Fair Value Changes, Net by Investment Type | ||||||||
($ in millions) | ||||||||
Three Months Ended | ||||||||
9/30/2018 | 6/30/2018 | |||||||
Market valuation changes on: | ||||||||
Residential loans held-for-investment at fair value | ||||||||
Change in fair value from the reduction in basis (1) | $ | — | $ | — | ||||
Other fair value changes (2) | (17 | ) | (15 | ) | ||||
Total change in fair value of residential loans held-for-investment | (17 | ) | (15 | ) | ||||
Real estate securities classified as trading | ||||||||
Change in fair value from the reduction in basis (1) | (3 | ) | (3 | ) | ||||
Other fair value changes (2) | 9 | 3 | ||||||
Total change in fair value of real estate securities | 6 | — | ||||||
Risk management derivatives | ||||||||
Interest component of hedges (3) | 1 | — | ||||||
Other fair value changes (4) | 21 | 17 | ||||||
Total change in fair value of risk management derivatives | 22 | 17 | ||||||
Total investment portfolio fair value changes, net | $ | 11 | $ | 2 | ||||
(1) | Reflects the change in fair value due to principal changes, which is calculated as the change in principal on a given investment during the period, multiplied by the amount that the prior quarter ending price or acquisition price for that investment is above or below par in percentage terms. |
(2) | Reflects changes in prepayment assumptions and credit spreads on our residential loans, trading securities and conforming risk-sharing investments primarily due to changes in benchmark interest rates. This item is excluded from management's definition of core earnings. |
(3) | Reflects the net interest paid or received on hedges associated with fair value investments. |
(4) | Reflects the change in fair value of our risk management derivatives that are associated with changes in benchmark interest rates during the period. This item is excluded from management's definition of core earnings. |
We caution that core earnings, core realized gains, core provision for income taxes, core segment contribution, and core earnings per share should not be utilized in isolation, nor should they be considered as alternatives to GAAP net income, GAAP realized gains, GAAP provision for income taxes, GAAP net income per share, or other measurements of results of operations computed in accordance with GAAP.
THE REDWOOD REVIEW I 3RD QUARTER 2018 |
38 |
N O N - G A A P M E A S U R E M E N T S |
Economic Net Interest Income and Measures of Fair Value Changes
Economic net interest income is a non-GAAP measure of Redwood’s net interest income. Management has defined economic net interest income as GAAP net interest income adjusted to include: i) the change in basis for fair value investments (loans held-for-investment at fair value and real estate securities classified as trading), and ii) net interest received or paid on hedges associated with fair value investments. Management utilizes economic net interest income internally as an additional metric to analyze the performance of its investments, as it believes it presents a more comprehensive view of an investment’s current return, by including the impact of hedges it uses to manage interest rate risk on an investment and also including the change in basis of an investment that factors into its economic yield.
Specifically, many of our investments pay a fixed-rate of interest and are financed with floating rate debt. As interest rates rise, net interest income for these investments decreases. However, if these investments are hedged with swaps or other derivative instruments, there is an offsetting change in the net interest received or paid on the associated hedge. By including the net interest of associated hedges in economic net interest income, it allows us to better assess our hedge-adjusted returns for investments we hedge.
Additionally, for loans or securities that are carried at a fair value above or below their par value, any receipt of principal (or associated underlying notional principal) during the period results in a realization of the premium or discount to par (the “change in basis”) that affects yield. We include this amount in economic net interest income as we view it similarly to discount accretion or premium amortization on an available-for-sale security, which is incorporated into interest income when calculating an effective yield.
The following table reconciles GAAP net interest income to non-GAAP economic net interest income.
Reconciliation to Non-GAAP Economic Net Interest Income | ||||||||
($ in millions) | ||||||||
Three Months Ended | ||||||||
9/30/2018 | 6/30/2018 | |||||||
Net interest income | $ | 35 | $ | 35 | ||||
Adjustments | ||||||||
Change in basis of fair value investments | (2 | ) | (2 | ) | ||||
Interest component of hedges | 1 | — | ||||||
Non-GAAP economic net interest income | $ | 33 | $ | 32 | ||||
We also calculate economic net interest income for our Investment Portfolio segment, which is shown and reconciled to GAAP net interest income for our Investment Portfolio segment on page 10. We caution that economic net interest income should not be utilized in isolation, nor should it be considered as an alternative to GAAP net interest income.
THE REDWOOD REVIEW I 3RD QUARTER 2018 |
39 |
N O N - G A A P M E A S U R E M E N T S |
Other fair value changes, net and core other fair value changes, net are non-GAAP measures of Redwood’s investment fair value changes.
• | Other fair value changes, net represents GAAP investment fair value changes, net, adjusted to exclude the same adjustments that are included in economic net interest income, as described above. Effectively, these adjustment amounts are excluded from investment fair value changes, net and included with net interest income to calculate economic net interest income. |
• | Core other fair value changes, net represents non-GAAP other fair value changes, net, adjusted to exclude the component of mark-to-market changes on long-term investments and associated derivatives that were not otherwise included in the adjustment to arrive at Other fair value changes, net. |
The following table presents a reconciliation of GAAP investment fair value changes, net to non-GAAP other fair value changes, net and non-GAAP core other fair value changes, net.
Reconciliation to Non-GAAP Other Fair Value Changes, Net and Non-GAAP Core Other Fair Value Changes, Net | ||||||||
($ in millions) | ||||||||
Three Months Ended | ||||||||
9/30/2018 | 6/30/2018 | |||||||
Investment fair value changes, net | $ | 10 | $ | 1 | ||||
Adjustments | ||||||||
Change in basis of fair value investments | 2 | 2 | ||||||
Interest component of hedges | (1 | ) | — | |||||
Non-GAAP Other Fair Value Changes, Net | $ | 12 | $ | 3 | ||||
Core adjustments | ||||||||
Eliminate mark-to-market changes on long-term investments and associated derivatives | (12 | ) | (3 | ) | ||||
Non-GAAP Core Other Fair Value Changes, Net | $ | — | $ | — | ||||
We caution that neither other fair value changes, net nor core other fair value changes, net should be utilized in isolation, nor should either of them be considered as an alternative to GAAP investment fair value changes, net.
THE REDWOOD REVIEW I 3RD QUARTER 2018 |
40 |
F O R W A R D - L O O K I N G S T A T E M E N T S |
As noted above under the heading “Cautionary Statement,” this Redwood Review contains forward-looking statements within the meaning of the safe harbor provisions of the Private Securities Litigation Reform Act of 1995. Forward-looking statements involve numerous risks and uncertainties. Our actual results may differ from our expectations, estimates, and projections and, consequently, you should not rely on these forward-looking statements as predictions of future events. Forward-looking statements are not historical in nature and can be identified by words such as “anticipate,” “estimate,” “will,” “should,” “expect,” “believe,” “intend,” “seek,” “plan,” and similar expressions or their negative forms, or by references to strategy, plans, goals, or intentions. These forward-looking statements are subject to risks and uncertainties, including, among other things, those described in our Annual Report on Form 10-K under the caption “Risk Factors.” Other risks, uncertainties, and factors that could cause actual results to differ materially from those projected are described below and may be described from time to time in reports we file with the Securities and Exchange Commission, including reports on Forms 10-K, 10-Q, and 8-K. We undertake no obligation to update or revise forward-looking statements, whether as a result of new information, future events, or otherwise.
Statements regarding the following subjects, among others, are forward-looking by their nature: (i) statements we make regarding Redwood’s business strategy and strategic focus, including statements relating to our overall market position, strategy and long-term prospects (including trends driving the flow of capital in the housing finance market, our strategic initiatives designed to capitalize on those trends, our ability to attract capital to finance those initiatives, our approach to raising capital,` and the prospects for federal housing finance reform); (ii) statements related to our financial outlook and expectations for 2018, including with respect to: 2018 GAAP earnings, mortgage banking activities (including target returns on allocated capital, loan acquisition volume, and gross margins), our investment portfolio (including target returns on allocated capital), and corporate operating expenses; (iii) statements related to our mortgage banking activities, including our expectation that full year jumbo loan purchases will be near the low end of our original $7 to $8 billion range for 2018, and that full year mortgage banking volumes are expected to be about 20% higher than in 2017; (iv) statements related to our investment portfolio and investment opportunities, including that we expect to deploy an additional $75 million of capital in the fourth quarter of 2018 to close our re-performing loan pool investment; (v) statements relating to acquiring residential mortgage loans in the future that we have identified for purchase or plan to purchase, including the amount of such loans that we identified for purchase during the third quarter of 2018 and at September 30, 2018, and expected fallout and the corresponding volume of residential mortgage loans expected to be available for purchase; (vi) statements relating to our estimate of our available capital (including that we estimate our available capital at September 30, 2018 was approximately $150 million), and expectations relating to sourcing additional capital from continued optimization of our investment portfolio and from capital markets; (vii) statements we make regarding our dividend policy, including with respect to our regular quarterly dividends in 2018; and (viii) statements regarding our expectations and estimates relating to the characterization for income tax purposes of our dividend distributions, our expectations and
THE REDWOOD REVIEW I 3RD QUARTER 2018 |
41 |
F O R W A R D - L O O K I N G S T A T E M E N T S |
estimates relating to tax accounting, tax liabilities and tax savings, and GAAP tax provisions, and our estimates of REIT taxable income and TRS taxable income.
Important factors, among others, that may affect our actual results include:
• | the pace at which we redeploy our available capital into new investments and initiatives; |
• | our ability to scale our platform and systems, particularly with respect to our new initiatives; |
• | interest rate volatility, changes in credit spreads, and changes in liquidity in the market for real estate securities and loans; |
• | changes in the demand from investors for residential mortgages and investments, and our ability to distribute residential mortgages through our whole-loan distribution channel; |
• | our ability to finance our investments in securities and our acquisition of residential mortgages with short-term debt; |
• | changes in the values of assets we own; |
• | general economic trends, the performance of the housing, real estate, mortgage, credit, and broader financial markets, and their effects on the prices of earning assets and the credit status of borrowers; |
• | federal and state legislative and regulatory developments, and the actions of governmental authorities, including the new U.S. presidential administration, and in particular those affecting the mortgage industry or our business (including, but not limited to, the Federal Housing Finance Agency’s rules relating to FHLB membership requirements and the implications for our captive insurance subsidiary’s membership in the FHLB); |
• | strategic business and capital deployment decisions we make; |
• | developments related to the fixed income and mortgage finance markets and the Federal Reserve’s statements regarding its future open market activity and monetary policy; |
• | our exposure to credit risk and the timing of credit losses within our portfolio; |
• | the concentration of the credit risks we are exposed to, including due to the structure of assets we hold and the geographical concentration of real estate underlying assets we own; |
• | our exposure to adjustable-rate mortgage loans; |
• | the efficacy and expense of our efforts to manage or hedge credit risk, interest rate risk, and other financial and operational risks; |
• | changes in credit ratings on assets we own and changes in the rating agencies’ credit rating methodologies; |
• | changes in interest rates; |
• | changes in mortgage prepayment rates; |
• | changes in liquidity in the market for real estate securities and loans; |
• | our ability to finance the acquisition of real estate-related assets with short-term debt; |
• | the ability of counterparties to satisfy their obligations to us; |
• | our involvement in securitization transactions, the profitability of those transactions, and the risks we are exposed to in engaging in securitization transactions; |
THE REDWOOD REVIEW I 3RD QUARTER 2018 |
42 |
F O R W A R D - L O O K I N G S T A T E M E N T S |
• | exposure to claims and litigation, including litigation arising from our involvement in securitization transactions; |
• | ongoing litigation against various trustees of RMBS transactions; |
• | whether we have sufficient liquid assets to meet short-term needs; |
• | our ability to successfully compete and retain or attract key personnel; |
• | our ability to adapt our business model and strategies to changing circumstances; |
• | changes in our investment, financing, and hedging strategies and new risks we may be exposed to if we expand our business activities; |
• | our exposure to a disruption or breach of the security of our technology infrastructure and systems; |
• | exposure to environmental liabilities; |
• | our failure to comply with applicable laws and regulations; |
• | our failure to maintain appropriate internal controls over financial reporting and disclosure controls and procedures; |
• | the impact on our reputation that could result from our actions or omissions or from those of others; changes in accounting principles and tax rules; |
• | our ability to maintain our status as a REIT for tax purposes; |
• | limitations imposed on our business due to our REIT status and our status as exempt from registration under the Investment Company Act of 1940; |
• | decisions about raising, managing, and distributing capital; and |
• | other factors not presently identified. |
THE REDWOOD REVIEW I 3RD QUARTER 2018 |
43 |